| | | | | | | | | | | | | | | | | | | | | | | | | |
| |
| |
| | Twelve Months Ended
December 31, 2013 | |
| |
| | Number of | |
|---|
Type of Property | | Gross
Investments | | Percentage of
Investments | | Rental
Income(1) | | Interest
Income(2)(1) | | Percentage
of
Revenues(3)(2) | | Number
of
Properties(4)(3) | | SNF
Beds(5)(4) | | ALF
Units(5) | | ILF
Units(5)(4) | |
|---|
Assisted LivingSkilled Nursing(5)
| | $ | 308,757611,160 | | | 39.655.3 | % | $ | 33,17250,046 | | $ | 2,5964,881 | | | 42.652.6 | % | | 102100 | | | — | | | 4,36512,217 | | | — | |
Skilled NursingAssisted Living
| | | 389,458412,024 | | | 50.037.3 | % | | 35,57941,641 | | | 3,4471,103 | | | 46.440.9 | % | | 89 | | | 10,347106 | | | — | | | —4,852 | |
Other Senior HousingRange of Care
| | | 46,509 | | | 4.2 | % | | 4,904 | | | 314 | | | 5.0 | % | | 9 | | | 733 | | | 348 | |
Under Development(6) | | | 67,73221,432 | | | 8.7 | % | | 7,543 | | | 368 | | | 9.4 | % | | 14 | | | 913 | | | 330 | | | 423 | |
Schools
| | | 12,192 | | | 1.6 | % | | 1,349 | | | — | | | 1.6 | % | | 2 | | | — | | | — | | | — | |
Under Development(7)
| | | 894 | | | 0.12.0 | % | | — | | | — | | | 0.0 | % | | — | | | — | | | — | |
Other(7) | | | 13,607 | | | 1.2 | % | | 1,575 | | | — | | | 1.5 | % | | 2 | | | — | | | — | |
| | | | | | | | | | | | | | | | | | |
| | | | | | | | | | | | | | | | | | | | | | ��� | | | | |
Totals | | $ | 779,0331,104,732 | | | 100.0 | % | $ | 77,64398,166 | | $ | 6,4116,298 | | | 100.0 | % | | 207217 | | | 11,26012,950 | | | 4,695 | | | 4235,200 | |
| | | | | | | | | | | | | | | | | | |
| | | | | | | | | | | | | | | | | | | | | | | | | | |
| | | | | | | | | | | | | | | | | | | | | | | | | | |
| | | | | | | | | | | | | | | | | | |
- (1)
Includes rental income from properties classified as held-for-sale.
(2)- Includes interest income from mortgage loans.
(3)(2)- Includes rental income and interest income from mortgage loans.
(4)(3)- We have investments in 30 states leased or mortgaged to
4140 different operators.
(5)(4)- SeeItem 2. Properties for discussion of bed/unit count.
(6)(5)Other senior housing properties consist of independent living propertiesIncludes a mortgage and properties providing any combination ofconstruction loan secured by a currently operating skilled nursing assisted living and/or independent living services.
(7)During 2011, we acquired a vacantproperty and parcel of land in Texasupon which a 106-bed replacement property is being constructed.- (6)
- Includes three MC developments with a total of 168 units, a combination ALF and
entered intoMC development with 81 units, and a commitment to fund the constructionSNF development with 143 beds. - (7)
- Includes two school properties and four parcels of
a skilled nursing property with 120 beds which will replace an existing 90-bed skilled nursing property.land held-for-use.
As of December 31, 20112013 we had $599.9$884.4 million in carrying value of net real estate investment, consisting of $546.8$718.9 million or 91.1%81.3% invested in owned and leased properties and $53.1$165.4 million or 8.9%18.7% invested in mortgage loans secured by first mortgages.
In addition to the information below, seeItem 2. Properties for more information about our portfolio.
Owned Properties. The following table summarizes our investment in owned properties at December 31, 20112013 (dollar(dollar amounts in thousands):
|
| |
| |
| |
| | Number of | |
| | |
| |
| |
| | Number of | |
| |
|---|
Type of Property | | Gross
Investments | | Percentage of
Investments | | Number
of
Properties(1) | | SNF
Beds(2) | | ALF
Units(2) | | ILF
Units(2) | | Investment
per
Bed/Unit | | | Gross
Investments | | Percentage of
Investments | | Number of
Properties(1) | | SNF
Beds(2) | | ALF
Units(2) | | Investment
per
Bed/Unit | |
|---|
Skilled Nursing | | | $ | 458,759 | | 48.9 | % | | 68 | | 8,264 | | — | | $ | 55.51 | |
Assisted Living | | $ | 285,981 | | 39.4 | % | | 88 | | — | | 3,941 | | — | | $ | 72.57 | | | 399,912 | | 42.7 | % | | 98 | | — | | 4,641 | | $ | 86.17 | |
Skilled Nursing | | 361,326 | | 49.9 | % | | 68 | | 8,021 | | — | | — | | $ | 45.05 | | |
Other Senior Housing(3) | | 64,638 | | 8.9 | % | | 13 | | 814 | | 256 | | 423 | | $ | 43.29 | | |
Schools | | 12,192 | | 1.7 | % | | 2 | | — | | — | | — | | N/A | | |
Under Development(4) | | 894 | | 0.1 | % | | — | | — | | — | | — | | N/A | | |
Range of Care | | | 43,907 | | 4.7 | % | | 8 | | 634 | | 274 | | $ | 48.36 | |
Under Development(3) | | | 21,432 | | 2.3 | % | | — | | — | | — | | — | |
Other(4) | | | 13,607 | | 1.4 | % | | 2 | | — | | — | | — | |
| | | | | | | | | | | | | | | | | | | | | | | | | | | | | |
| | | | | | | | | | | | | | | |
Totals | | $ | 725,031 | | 100.0 | % | | 171 | | 8,835 | | 4,197 | | 423 | | | | | $ | 937,617 | | 100.0 | % | | 176 | | 8,898 | | 4,915 | | | |
| | | | | | | | | | | | | | | | | | | | | | | | | | | | | |
| | | | | | | | | | | | | | | |
| | | | | | | | | | | | | | | |
| | | | | | | | | | | | | | | |
- (1)
- We have investments in
2527 states leased to 3033 different operators.
- (2)
- SeeItem 2. Properties for discussion of bed/unit count.
- (3)
Other senior housing properties consistIncludes three MC developments with a total of independent living168 units, a combination ALF and MC development with 81 units, and a SNF development with 143 beds.- (4)
- Includes two school properties and
properties providing any combination of skilled nursing, assisted living and/or independent living services.
(4)During 2011, we acquired a vacant parcelfour parcels of land in Texas and entered into a commitment to fund the construction of a skilled nursing property with 120 beds which will replace an existing 90-bed skilled nursing property.held-for-use.
Owned properties are leased pursuant to non-cancelable operating leases generally with an initial term of 10 to 15 years. Many of the leases contain renewal options and one contains limited period options that permit the operator to purchase the property.options. The leases provide for fixed minimum base rent during the initial and renewal periods. The majority of our leases contain provisions for specified annual increases over the rents of the prior year and that increase is generally computed in one of four ways depending on specific provisions of each lease:
- (i)
- a specified percentage increase over the prior year's rent, generally between 2.0% and 3.0%;
- (ii)
- a calculation based on the Consumer Price Index;
- (iii)
- as a percentage of facility net patient revenues in excess of base amounts or
- (iv)
- specific dollar increases.
Each lease is a triple net lease which requires the lessee to pay all taxes, insurance, maintenance and repairs, capital and non-capital expenditures and other costs necessary in the operations of the facilities. Generally our leases provide for one or more of the following: security deposits, property tax impounds, and credit enhancements such as corporate or personal guarantees or letters of credit. In
addition, our leases are typically structured as master leases and multiple master leases with one operator are generally cross defaulted. SeeItem 8. FINANCIAL STATEMENTS—NOTE 6. Real Estate Investments for further descriptions.
The following table summarizes our top ten operators accounted for more than 10%2013 and percentage of our 2011rental revenue for those operators for 2013 and 2010 rental income revenues:2012:
|
| | Percent of Rental Revenue | | | Percent of
Rental Revenue | |
|---|
Lessee | | 2011 | | 2010 | | | 2013 | | 2012 | |
|---|
Extendicare REIT and Assisted Living Concepts, Inc. | | 14.1 | % | | 16.9 | % | |
Senior Care Centers, LLC | | | 12.0 | % | | 12.5 | % |
Extendicare, Inc. and Assisted Living Concepts, Inc. | | | 11.2 | % | | 12.7 | % |
Brookdale Senior Living Communities, Inc. | | 13.6 | % | | 15.9 | % | | 11.2 | % | | 12.5 | % |
Preferred Care, Inc. | | 12.6 | % | | 14.6 | % | | 10.1 | % | | 11.6 | % |
Juniper Communities, LLC | | | 6.8 | % | | 0.3 | % |
Traditions Senior Mgmt, Inc. | | | 5.6 | % | | 6.1 | % |
Carespring Healthcare Management, LLC | | | 5.5 | % | | 2.6 | % |
Sunrise Senior Living | | | 4.7 | % | | 5.4 | % |
Skilled Healthcare Group, Inc. | | | 4.6 | % | | 5.2 | % |
Fundamental Long Term Care Company | | | 3.4 | % | | 3.4 | % |
Mortgage Loans. As part of our strategy of making long term investments in properties used in the provision of long term health care services, we provide mortgage financing on such properties based on our established investment underwriting criteria. We have also provided construction loans that by their terms converted into purchase/lease transactions or permanent financing mortgage loans upon completion of construction.
The following table summarizes our investments in mortgage loans secured by first mortgages at December 31, 20112013(dollar amounts in thousands):
|
| |
| |
| |
| |
| | Number of | |
| | |
| |
| |
| |
| | Number of | |
| |
|---|
| |
| |
| |
| |
| | Average
Investment
per
Bed/Unit | | |
| |
| |
| |
| | Average
Investment
per
Bed/Unit | |
|---|
Type of Property | | Gross
Investments | | Percentage
of
Investments | | Number
of Loans | | Number of Properties(1) | | SNF
Beds(2) | | ALF
Units(2) | | | Gross
Investments | | Percentage
of
Investments | | Number
of Loans | | Number of
Properties(1) | | SNF
Beds(2) | | ALF
Units(2) | |
|---|
Skilled Nursing(3) | | | $ | 152,401 | | 91.2 | % | | 16 | | 32 | | 3,953 | | — | | $ | 38.55 | |
Assisted Living | | $ | 22,776 | | 42.2 | % | | 9 | | 14 | | — | | 424 | | $ | 53.72 | | | 12,112 | | 7.2 | % | | 3 | | 8 | | — | | 211 | | $ | 57.40 | |
Skilled Nursing | | 28,132 | | 52.1 | % | | 20 | | 21 | | 2,326 | | — | | $ | 12.09 | | |
Other Senior Housing(3) | | 3,094 | | 5.7 | % | | 1 | | 1 | | 99 | | 74 | | $ | 17.88 | | |
Range of Care | | | 2,602 | | 1.6 | % | | 1 | | 1 | | 99 | | 74 | | $ | 15.04 | |
| | | | | | | | | | | | | | | | | | | | | | | | | | | | | | | |
| | | | | | | | | | | | | | | | | |
Totals | | $ | 54,002 | | 100.0 | % | | 30 | | 36 | | 2,425 | | 498 | | | | | $ | 167,115 | | 100.0 | % | | 20 | | 41 | | 4,052 | | 285 | | | |
| | | | | | | | | | | | | | | | | | | | | | | | | | | | | | | |
| | | | | | | | | | | | | | | | | |
| | | | | | | | | | | | | | | | | |
| | | | | | | | | | | | | | | | | |
- (1)
- We have investments in
129 states that include mortgages to 1412 different operators.
- (2)
- SeeItem 2. Properties for discussion of bed/unit count.
- (3)
Other senior housing properties consist of independent living propertiesIncludes a mortgage and properties providing any combination ofconstruction loan secured by a currently operating skilled nursing assisted living and/or independent living services.property and parcel of land upon which a 106-bed replacement property is being constructed.
In general, with the exception of a mortgage loan secured by 15 skilled nursing properties in Michigan, the mortgage loans may not be prepaid except in the event of the sale of the collateral property to a third party that is not affiliated with the borrower, although partial prepayments (including the prepayment premium) are often permitted where a mortgage loan is secured by more than one property upon a sale of one or more, but not all, of the collateral properties to a third party which is not an affiliate of the borrower. The terms of the mortgage loans generally impose a premium
upon prepayment of the loans depending upon the period in which the prepayment occurs, whether such prepayment was permitted or required, and certain other conditions such as upon the sale of the property under a pre-existing purchase option, destruction or condemnation, or other circumstances as approved by us. On certain loans, such prepayment amount is based upon a percentage of the then outstanding balance of the loan, usually declining ratably each year. For other loans, the prepayment premium is based on a yield maintenance formula. The mortgage loan secured by 15 skilled nursing properties in Michigan has a one-time option between November 2015 and October 2025 to prepay up to 50% of the then outstanding loan balance without penalty. Exclusively for the purposes of this option, the properties collateralizing the loan have been separated by us into two pools of assets. If and when the option is exercised, we will identify which of the two pools we will release for prepayment and removal from the portfolio of properties securing the loan. In addition to a lien on the mortgaged property, the loans are generally secured by certain non-real estate assets of the properties and contain certain other security provisions in the form of letters of credit, pledged collateral accounts, security deposits, cross-default and cross-collateralization features and certain guarantees. SeeItem 8. FINANCIAL STATEMENTS—Note 6. Real Estate Investments for further description.
Investment and Other Policies
Objectives and Policies. Our investment policy is to invest primarily in income-producing senior housing and long term care properties. Over the past three years (2009(2011 through 2011)2013), we invested approximately $1.9 million in mortgage loans and we acquired skilled nursing, properties, assisted living, properties, independent living, memory care properties and combinations thereof, plus a parceltwelve parcels of vacant land for a total of approximately $213.4$291.9 million. We also invested approximately $137.1 million in mortgage loans over the past three years. We believe our liquidity and various sources of available capital are sufficient to fund operations and development commitments, meet debt service obligations (both principal and interest), make dividend distributions and finance some future investments should we determine such future investments are financially feasible. The timing, source and amount of cash flows provided by financing activities and used in investing activities are sensitive to the capital markets environment, especially to changes in interest rates. We continuously evaluate the availability of cost-effective capital and believe we have sufficient liquidity for additional capital investments in 2012.2014.
Our primary marketing and development focus is to increase the awareness of our presence at the state and localregional levels through participation in various healthcare associations and trade shows.health care associations. We believe that this targeted marketing effort has increased deal flow and continues to provide opportunities for new investments in 2012.2014. Since the competition from buyers infor large transactions consisting of multiple property portfolios generally results in pricing that does not meet our investment criteria, our marketing efforts primarily focus on single property transactions or smallsmaller multiple property portfolios that complement our historic investments and are priced with yields that are accretive to our stockholders.
Historically our investments have consisted of:
- •
- fee ownership of senior housing and long term care properties that are leased to providers;
- •
- mortgage loans secured by senior housing and long term care properties; or
- •
- participation in such investments indirectly through investments in real estate partnerships or other entities that themselves make direct investments in such loans or properties.
In evaluating potential investments, we consider factors such as:
- •
- type of property;
- •
- the location;
- •
- construction quality, condition and design of the property;
- •
- the property's current and anticipated cash flow and its adequacy to meet operational needs and lease obligations or debt service obligations;
- •
- the experience, reputation and solvency of the licensee providing services;
- •
- the payor mix of private, Medicare and Medicaid patients;
- •
- the growth, tax and regulatory environments of the communities in which the properties are located;
- •
- the occupancy and demand for similar properties in the area surrounding the property; and
- •
- the Medicaid reimbursement policies and plans of the state in which the property is located.
Prior to every investment, we conduct a property site review to assess the general physical condition of the property and the potential of additional services. In addition, we review the environmental reports, site surveys and financial statements of the property before the investment is made.
We believe skilled nursing facilities are the lowest cost provider for certain levels of acuity; therefore, such facilities play a vital role in our nation's health care delivery system. Our investments include direct ownership, development and mortgages secured by skilled nursing properties. We prefer to invest in a property that has a significant market presence in its community and where state certificate of need and/or licensing procedures limit the entry of competing properties.
We believe that assisted living, and independent living and memory care facilities are an important sector in the long term care market and our investments include direct ownership, development and mortgages secured by assisted living, and/or independent living and/or memory care properties. For assisted living and independent living investments weWe have attempted to diversify our portfolio both geographically and across product levels. Thus, we believe that although the majority of our investments are in affordably priced units, our portfolio also includes upscale units in appropriate markets with certain operators.
Borrowing Policies. We may incur additional indebtedness when, in the opinion of our Board of Directors, it is advisable. We may incur such indebtedness to make investments in additional senior housing and long term care properties or to meet the distribution requirements imposed upon REITs under the Internal Revenue Code of 1986, as amended. For other short-term purposes, we may, from time to time, negotiate lines of credit, or arrange for other short-term borrowings from banks or otherwise. We may also arrange for long termlong-term borrowings through public or private offerings or from institutional investors.
In addition, we may incur mortgage indebtedness on real estate which we have acquired through purchase, foreclosure or otherwise. We may also obtain mortgage financing for unleveraged or underleveraged properties in which we have invested or may refinance properties acquired on a leveraged basis. There is no limitation on the number or amount of mortgages that may be placed on any one property, and we have no policy with respect to limitations on borrowing, whether secured or unsecured.
Prohibited Investments and Activities. Our policies, which are subject to change by our Board of Directors without stockholder approval, impose certain prohibitions and restrictions on our investment practices or activities including prohibitions against:
- •
- investing in any junior mortgage loan unless by appraisal or other method, our Board of Directors determine that
- (a)
- the capital invested in any such loan is adequately secured on the basis of the equity of the borrower in the property underlying such investment and the ability of the borrower to repay the mortgage loan; or
- (b)
- such loan is a financing device we enter into to establish the priority of our capital investment over the capital invested by others investing with us in a real estate project;
- •
- investing in commodities or commodity futures contracts (other than interest rate futures, when used solely for hedging purposes);
- •
- investing more than 1% of our total assets in contracts for the sale of real estate unless such contracts are recordable in the chain of title;
- •
- holding equity investments in unimproved, non-income producing real property, except such properties as are currently undergoing development or are presently intended to be developed within one year, together with mortgage loans on such property (other than first mortgage development loans), aggregating to more than 10% of our assets.
Competition
In the health care industry, we compete for real property investments with health care providers, other health care related REITs, real estate partnerships, banks, private equity funds, venture capital funds and other investors. Many of our competitors are significantly larger and have greater financial resources and lower cost of capital than we have available to us. Our ability to compete successfully for real property investments will be determined by numerous factors, including our ability to identify suitable acquisition targets, our ability to negotiate acceptable terms for any such acquisition and the availability and our cost of capital.
The lessees and borrowers of our properties compete on a local, regional and, in some instances, national basis with other health care providers. The ability of the lessee or borrower to compete successfully for patients or residents at our properties depends upon several factors, including the levels of care and services provided by the lessees or borrowers, the reputation of the providers, physician referral patterns, physical appearances of the properties, family preferences, financial condition of the operator and other competitive systems of health care delivery within the community, population and demographics.
Government Regulation
The health care industry is heavily regulated by the government. Our borrowers and lessees who operate health care facilities are subject to extensive regulation by federal, state and local governments. These laws and regulations are subject to frequent and substantial changes resulting from legislation, adoption of rules and regulations, and administrative and judicial interpretations of existing law. These changes may have a dramatic effect on the definition of permissible or impermissible activities, the relative costs associated with doing business and the amount of reimbursement by both government and other third-party payors. These changes may be applied retroactively. The ultimate timing or effect of these changes cannot be predicted. The failure of any borrower of funds from us or lessee of any of our properties to comply with such laws, requirements and regulations could result in sanctions or remedies such as denials of payment for new Medicare and Medicaid admissions, civil monetary penalties, state oversight and loss of Medicare and Medicaid participation or licensure. Such action could affect our borrower's or lessee's ability to operate its facility or facilities and could adversely affect such borrower's or lessee's ability to make debt or lease payments to us.
The properties owned by us and the manner in which they are operated are affected by changes in the reimbursement, licensing and certification policies of federal, state and local governments. Properties may also be affected by changes in accreditation standards or procedures of accrediting agencies. In addition, expansion (including the addition of new beds or services or acquisition of medical equipment) and occasionally the discontinuation of services of health care facilities are, in some states, subjected to state and regulatory approval through "certificate of need" laws and regulations.
The ability of our borrowers and lessees to generate revenue and profit determines the underlying value of that property to us. Revenues of our borrowers and lessees of skilled nursing properties are generally derived from payments for patient care. Sources of such payments for skilled nursing facilities include the federal Medicare program, state Medicaid programs, private insurance carriers, healthmanaged care service plans, health maintenance organizations, preferred provider arrangements, and self-insured employers, as well as the patients themselves.
A significant portion of the revenue of our skilled nursing property borrowers and lessees is derived from governmentally-funded reimbursement programs, such as Medicare and Medicaid. Because of significant health care costs paid by such government programs, both federal and state governments have adopted and continue to consider various health care reform proposals to control health care costs. Over the years there have been fundamental changes in the Medicare program that resulted in reduced levels of payment for a substantial portion of health care services, including skilled nursing facility services.costs.. In many instances, revenues from Medicaid programs are already insufficient to cover the actual costs incurred in providing care to thoseMedicaid patients. The American Recovery and Reinvestment Act of 2009 temporarily increased federal Medicaid payments by approximately $87 billion to help support state Medicaid programs facing budget shortfalls. An additional $16.1 billion in temporary enhanced federal Medicaid assistance was included in the Education Jobs and Medicaid Assistance Act, which President Obama signed into law in August 2010. However, enhanced funding under this federal legislation expired in June 2011. Moreover, the Kaiser Commission on Medicaid and the Uninsured reported in October 20112013 that nearly every state implementedthe majority of states (39) reported enacting new Medicaid rate restrictions for at least one new Medicaid
policy to control spendingprovider type in fiscal years 2011year 2013, while 34 states plan rate restrictions for fiscal year 2014. On the other hand, the Kaiser Commission notes that due to improving state finances, more states are enhancing rates than restricting rates overall in 2013 and 2012, with 392014. With regard to nursing home rates in particular, 34 states increased rates in fiscal year 2013 and 38 have adopted rate increases for fiscal year 2014, compared to nursing home rate restrictions being adopted in 17 states in fiscal year 2011 implementing provider rate cuts or freezes,2013 and 4612 states planning to do so in fiscal year 2012. Thirty states restricted nursing home rates in fiscal year 2011 (24 rate freezes and 6 cuts), while 17 states plan to freeze rates and 14 states plan to cut rates in fiscal year 2012. On the other hand, 21 states increased nursing home rates in fiscal year 2011 and 20 plan to do so in fiscal year 2012.2014. In addition, many states have been making changes to their long term care delivery systems that emphasize home and community-based long term care services, in some cases coupled with cost controls for institutional providers. According to the Kaiser Commission, 32 states in FY 2011 and 33 states in FY 2012 expanded long term care services (primarily expandingfiscal year 2013 and 35 states in fiscal year 2014 took action to expand the number of individuals serviced in home and community-based service), while 14 states in FY 2011 and 11 states in FY 2012 acted to restrict long term care services.service programs. The federal government also has adopted policies to promote community-based alternatives to institutional services. Most recently, on January 16, 2014, the Centers for Medicare & Medicaid Services (or CMS) published a rule that provides states with new flexibility to offer home and community based-services as an optional Medicaid benefit and to draw federal matching funds. As states and the federal government continue to respond to budget pressures, future reduction in Medicaid and/or Medicare payments for skilled nursing facility services could have an adverse effect on the financial condition of our borrowers and lessees which could, in turn, adversely impact the timing or level of their payments to us.
Over the years there also have been fundamental changes in the Medicare program that resulted in reduced levels of payment for a substantial portion of health care services, including skilled nursing facility services. CMS annually updates Medicare skilled nursing facility prospective payment system rates and other policies. On August 6, 2013, CMS published its final Medicare skilled nursing facility payment rate update for fiscal year 2014, which began on October 1, 2013. CMS estimates that the final rule will increase aggregate Medicare skilled nursing facility payments by $470 million, or 1.3%, compared to fiscal year 2013 levels. Specifically, under the final rule, Medicare rates are updated to reflect a 2.3% market basket increase that is reduced by a 0.5 percentage point "multifactor productivity adjustment" mandated by the Affordable Care Act, and that is further reduced by a 0.5 percentage point forecast error correction. CMS also rebased the skilled nursing facility market basket to reflect fiscal year 2010 data and made other policy changes. There can be no assurance that any future reductions in Medicare skilled nursing facility payment rates or other policy changes would not have an adverse effect on the financial condition of our borrowers and lessees which could, in turn, adversely impact the timing or level of their payments to us.
Moreover, health care facilities continue to experience pressures from private payors attempting to control health care costs, and reimbursement from private payors has in many cases effectively been reduced to levels approaching those of government payors.
The Centers for Medicare & Medicaid Services (or CMS) annually updates Medicare skilled nursing facility prospective payment system rates and other policies. On July 29, 2011, CMS issued its final rule updating Medicare skilled nursing facility rates for fiscal year 2012, which began on October 1, 2011. Under the final rule, average rates have been reduced by 11.1%, or $3.87 billion, compared to fiscal year 2011 levels. CMS has stated that the rate reduction is needed to recalibrate skilled nursing facility payment rates to correct what CMS characterizes as an "unintended spike" in payments in fiscal year 2011, when CMS implemented the Resource Utilization Groups, version four (or RUG-IV) patient classification system. Although CMS intended implementation of RUG-IV to be budget-neutral, CMS has taken the position that claims under the updated system show a significant increase in Medicare expenditures, in part because the proportion of patients grouped in the highest-paying RUG therapy categories greatly exceeded CMS expectations. CMS is applying a 12.6% recalibration reduction, which is partially offset by a 1.7% standard rate update (which represents a 2.7% market basket update reduced by a 1.0% percentage point "multifactor productivity adjustment" mandated by the Affordable Care Act). There can be no assurance that this rule or any future reductions in Medicare skilled nursing facility payment rates would not have an adverse effect on the financial condition of our borrowers and lessees which could, in turn, adversely impact the timing or level of their payments to us.
Governmental and public concern regarding health care costs may result in significant reductions in payment to health care facilities, and there can
be no assurance that future payment rates for either governmental or private payors will be sufficient to cover cost increases in providing services to patients. Any changes in reimbursement policies which reduce reimbursement to levels that are insufficient to cover the cost of providing patient care could adversely affect revenues of our skilled nursing property borrowers and lessees and to a much lesser extent our assisted living property borrowers and lessees and thereby adversely affect those borrowers' and lessees' abilities to make their debt or lease payments to us. Failure of the borrowers or lessees to make their debt or lease payments would have a direct and material adverse impact on us.
Various federal and state laws govern financial and other arrangements between health care providers that participate in, receive payments from, or make or receive referrals for work in connection with government funded health care programs, including Medicare and Medicaid. These laws, known as the fraud and abuse laws, include the federal anti-kickback statute, which prohibits, among other things, knowingly and willfully soliciting, receiving, offering or paying any remuneration directly or indirectly in return for, or to induce, the referral, or arrange for the referral, of an individual to a person for the
furnishing of an item or service for which payment may be made under federal health care programs. In addition, the federal physician self-referral law, commonly known as Stark II (or the Stark Law),Law, prohibits physicians and certain other types of practitioners from making referrals for certain designated health services paid in whole or in part by Medicare and Medicaid to entities with which the practitioner or a member of the practitioner's immediate family has a financial relationship, unless the financial relationship fits within an applicable exception to the Stark Law. The Stark Law also prohibits the entity receiving the referral from seeking payment under the Medicare and Medicaid programsprogram for services rendered pursuant to a prohibited referral. If an entity is paid for services rendered pursuant to a prohibited referral, it may incur civil penalties of up to $15,000 per prohibited claim and may be excluded from participating in the Medicare and Medicaid programs. Many states have enacted similar fraud and abuse laws which are not necessarily limited to items and services for which payment is made by federal health care programs. Violations of these laws may result in fines, imprisonment, denial of payment for services, and exclusion from federal and/or other state-funded programs. Other federal and state laws authorize the imposition of penalties, including criminal and civil fines and exclusion from participation in federal healthcarehealth care programs for submitting false claims, improper billing and other offenses. Federal and state government agencies have continued rigorous enforcement of criminal and civil fraud and abuse laws in the health care arena. Our borrowers and lessees are subject to many of these laws, and some of them could in the future become the subject of a governmental enforcement action.
Health Care Reform and Other Legislative Developments
Congress and the state legislatures regularly consider, and in some cases adopt, legislation impacting health care providers, including long term care providers. For instance, the Balanced Budget Act of 1997 enacted significant changes to the Medicare and Medicaid programs designed to modernize payment and health care delivery systems while achieving substantial budgetary savings. Among other things, the law established the Medicare prospective payment system for skilled nursing facility services to replace the cost-based reimbursement system, which resulted in significant reductions in Medicare payments to skilled nursing facilities. Over the years, Congress adopted legislation to somewhat mitigate the impact of the new payment system, including a temporary payment add-on for high-acuity patients, which subsequently expired, and a temporary payment add-on for residents with AIDS that still is in effect through fiscal year 2012.2014. Other legislation enacted by Congress in recent years has reduced certain Medicare skilled nursing facility bad debt payments, strengthened Medicaid asset transfer restrictions for persons seeking to qualify for Medicaid long term care coverage, reduced Medicaid provider taxes that are used by many states to finance state health programs, and given states greater flexibility to expand access to home and community based services.
In March 2010, the President signed into law the Patient Protection and Affordable Care Act, which subsequently was amended by the Health Care and Education and Reconciliation Act of 2010 (collectively referred to as the "Affordable Care Act"). The Affordable Care Act is designed to expand access to affordable health insurance, contain health care costs, and institute a variety of health policy reforms. The provisions of the sweeping law may affect us directly, as well as impact our lessees and borrowers. While certain provisions, such as expanding the insured population, may positively impact the revenues of our lessees and borrowers, other provisions, particularly those intended to reduce federal health care spending, could have a negative impact on our lessees and borrowers. Among other things, the Affordable Care Act: reduces Medicare skilled nursing facility reimbursement by a so-called "productivity adjustment" based on economy-wide productivity gains beginning in fiscal year 2012;gains; requires the development of a value-based purchasing program for Medicare skilled nursing facility services; establishes a national voluntary pilot program to bundle Medicare payments for hospital and post-acute services that could lead to changes in the delivery of post-acute services; and provides incentives to state Medicaid programs to promote community-based care as an alternative to institutional long term care services. The Affordable Care Act also includes provisions intended to
expand public disclosure about nursing home ownership and operations, institute mandatory compliance and quality assurance programs, increase penalties for noncompliance, and expand fraud and abuse enforcement and penalty provisions that could impact our operators. In addition, the Affordable Care Act impacts both us and our lessees and borrowers as employers, including new requirements related to the health insurance we offer to our respective employees. Many aspects of the Affordable Care Act are being implemented through new regulations and subregulatory guidance. We cannot predict at this time what effect, if any, the various provisions of the Affordable Care Act will have on our lessees and borrowers or our business.business when fully implemented. There can be no assurances, however, that the Affordable Care Act will not adversely impact the operations, cash flows or financial condition of our lessees and borrowers, which subsequently could materially adversely impact our revenue and operations.
On August 2, 2011, President Obama signed into lawUnder the terms of the Budget Control Act of 2011, which increased the nation's debt ceiling while taking steps to reduce the federal deficit. Under this law, a bipartisan Joint Select Committee on Deficit Reduction was responsible for identifying $1.5 trillion in deficit reduction, which could include cuts in Medicare, Medicaid, and other federal spending and/or revenue increases. The Committee failed to achieve consensus on deficit reduction measures. As a result, because no legislation was adopted to achieve deficit reduction targetsas modified by the statutory deadline, absent additionalAmerican Taxpayer Relief Act, President Obama issued a sequestration order on March 1, 2013 that mandates a 2% cut to Medicare payments to providers and health plans. The cuts generally apply to Medicare fee-for-service claims with dates-of-service or dates-of-discharge on or after April 1, 2013. On December 26, 2013, President Obama signed into law H.J. Res. 59, the Bipartisan Budget Act of 2013, which among other things, extended the Medicare sequestration cuts for another two years, through 2023, although Congress and the Administration could enact legislation an enforcement mechanism known asto end or modify sequestration will trigger a total of $1.2 trillion in spending reductions in January 2013, divided between domestic and defense spending.at any time, including through alternative budget legislation that includes alternative Medicare provider payments will also be subject to sequestration, although the reductions will be capped at 2%.or Medicaid savings. There can be no assurances that federal spending reductions resulting from the Budget Control Actenacted or otherfuture budget control mechanisms will not have an adverse impact on the financial condition of our borrowers and lessees, and borrowers, which subsequently could materially adversely impact our company.
In addition, comprehensive reforms affecting the payment for and availability of health care services have been proposed at the state level and adopted by certain states. Congress and state legislatures can be expected to continue to review and assess alternative health care delivery systems and payment methodologies.methodologies, including potential changes in Medicare payment policy for skilled nursing facility services and other types of post-acute care. Changes in the law, new interpretations of existing laws, or changes in payment methodologies may have a dramatic effect on the definition of permissible or impermissible activities, the relative costs associated with doing business and the amount of reimbursement by the government and other third party payors.
Environmental Matters
Under various federal, state and local environmental laws, ordinances and regulations, an owner of real property or a secured lender (such as us) may be liable for the costs of removal or remediation of hazardous or toxic substances at, under or disposed of in connection with such property, as well as
other potential costs relating to hazardous or toxic substances (including government fines and damages for injuries to persons and adjacent property). Such laws often impose such liability without regard to whether the owner or secured lender knew of, or was responsible for, the presence or disposal of such substances and may be imposed on the owner or secured lender in connection with the activities of an operator of the property. The cost of any required remediation, removal, fines or personal or property damages and the owner's or secured lender's liability therefore could exceed the value of the property, and/or the assets of the owner or secured lender. In addition, the presence of such substances, or the failure to properly dispose of or remediate such substances, may adversely affect the owner's ability to sell or rent such property or to borrow using such property as collateral which, in turn, would reduce our revenues.
Although the mortgage loans that we provide and leases covering our properties require the borrower and the lessee to indemnify us for certain environmental liabilities, the scope of such obligations may be limited and we cannot assure that any such borrower or lessee would be able to fulfill its indemnification obligations.
Insurance
It is our current policy, and we intend to continue this policy, that all borrowers of funds from us and lessees of any of our properties secure adequate comprehensive property and general and professional liability insurance that covers us as well as the borrower and/or lessee. Even though that is our policy, certain borrowers and lessees have been unable to obtain general and professional liability insurance in the specific amounts required by our leases or mortgages because the cost of such insurance and some insurers have stopped offering such insurance for long term care facilities. Additionally, in the past, insurance companies have filed for bankruptcy protection leaving certain of our borrowers and/or lessees without coverage for periods that were believed to be covered prior to such bankruptcies. The unavailability and associated exposure as well as increased cost of such insurance could have a material adverse effect on the lessees and borrowers, including their ability to make lease or mortgage payments. Although we contend that as a non-possessory landlord we are not generally responsible for what takes place on real estate we do not possess, claims including general and professional liability claims, may still be asserted against us which may result in costs and exposure for which insurance is not available. Certain risks may be uninsurable, not economically insurable or insurance may not be available and there can be no assurance that we, a borrower or lessee will have adequate funds to cover all contingencies. If an uninsured loss or a loss in excess of insured limits occurs with respect to one or more of our properties, we could be subject to an adverse claim including claims for general or professional liability, could lose the capital that we have invested in the properties, as well as the anticipated future revenue for the properties and, in the case of debt which is with recourse to us, we would remain obligated for any mortgage debt or other financial obligations related to the properties. Certain losses, such as losses due to floods or seismic activity if insurance is available, may be insured subject to certain limitations including large deductibles or co-payments and policy limits.
Employees
At December 31, 2011,2013, we employed 1718 people. Our employees are not members of any labor union, and we consider our relations with our employees to be excellent.
Taxation of our Company
We have elected to be taxed as a REIT under Sections 856 through 860 of the Internal Revenue Code (or the Code). We believe that we have been organized and have operated in such a manner as to qualify for taxation as a REIT under the Code commencing with our taxable year ending
December 31, 1992. We intend to continue to operate in such a manner, but there is no assurance that we have operated or will continue to operate in a manner so as to qualify or remain qualified.
If we continue to qualify for taxation as a REIT, we generally will not be subject to federal corporate income taxes on our net income that is currently distributed to our stockholders. This treatment substantially eliminates the "double taxation" (once at the corporate level when earned and once at stockholder level when distributed) that generally results from investment in a non-REIT corporation.
However, we will be subject to federal income tax as follows:
First, we will be taxed at regular corporate rates on any undistributed taxable income, including undistributed net capital gains.
Second, under certain circumstances, we may be subject to the alternative minimum tax, if our dividend distributions are less than our alternative minimum taxable income.
Third, if we have (i) net income from the sale or other disposition of foreclosure property which is held primarily for sale to customers in the ordinary course of business or (ii) other non-qualifying income from foreclosure property, we may elect to be subject to tax at the highest corporate rate on such income, if necessary to maintain our REIT status.
Fourth, if we have net income from "prohibited transactions" (as defined below), such income will be subject to a 100% tax.
Fifth, if we fail to satisfy the 75% gross income test or the 95% gross income test (as discussed below), but nonetheless maintain our qualification as a REIT because certain other requirements have been met, we will be subject to a 100% tax on an amount equal to (a) the gross income attributable to the greater of the amount by which we fail the 75% or 95% test multiplied by (b) a fraction intended to reflect our profitability.
Sixth, if we fail to distribute during each calendar year at least the sum of (i) 85% of our ordinary income for such year, (ii) 95% of our REIT capital gain net income for such year, and (iii) any undistributed taxable income from prior periods, we will be subject to a 4% excise tax on the excess of such required distribution over the amounts actually distributed.
Seventh, if we acquire an asset which meets the definition of a built-in gain asset from a corporation which is or has been a C corporation (i.e., generally a corporation subject to full corporate-level tax) in certain transactions in which the basis of the built-in gain asset in our hands is determined by reference to the basis of the asset in the hands of the C corporation, and if we subsequently recognize gain on the disposition of such asset during the ten-year period, called the recognition period, beginning on the date on which we acquired the asset, then, to the extent of the built-in gain (i.e., the excess of (a) the fair market value of such asset over (b) our adjusted basis in such asset, both determined as of the beginning of the recognition period), such gain will be subject to tax at the highest regular corporate tax rate, pursuant to IRS regulations.
Eighth, if we have taxable REIT subsidiaries and they are required to be reported on a consolidated basis, we would be subject to corporate tax on the taxable income of the taxable REIT subsidiaries. In addition, we will also be subject to a tax of 100% on the amount of any rents from real property, deductions or excess interest paid to us by any of our taxable REIT subsidiaries that would be reduced through reapportionment under certain federal income tax principles in order to more clearly reflect income for the taxable REIT subsidiary.
Ninth, if we fail to satisfy any of the REIT asset tests, as described below, by more than a de minimus amount, due to reasonable cause and we nonetheless maintain our REIT qualification because of specified cure provisions, we will be required to pay a tax equal to the greater of $50,000 or the
highest corporate tax rate multiplied by the net income generated by the non-qualifying assets that caused us to fail such test.
Tenth, if we fail to satisfy any provision of the Code that would result in our failure to qualify as a REIT (other than a violation of the REIT gross income tests or certain violations of the asset tests described below) and the violation is due to reasonable cause, we may retain our REIT qualification but we will be required to pay a penalty of $50,000 for each such failure.
Finally, if we own a residual interest in a real estate mortgage investment conduit (or REMIC), we will be taxed at the highest corporate rate on the portion of any excess inclusion income that we derive from the REMIC residual interests equal to the percentage of our shares that is held in record name by "disqualified organization." A "disqualified organization" includes the United States, any state or political subdivision thereof, any foreign government or international organization, any agency or instrumentality of any of the foregoing, any rural electrical or telephone cooperative and any tax-exempt organization (other than a farmer's cooperative described in Section 521 of the Code) that is exempt from income taxation and from the unrelated business taxable income provisions of the
Code. However, to the extent that we own a REMIC residual interest through a taxable REIT subsidiary, we will not be subject to this tax.
Requirements for Qualification. The Code defines a REIT as a corporation, trust or association:
- (1)
- which is managed by one or more trustees or directors;
- (2)
- the beneficial ownership of which is evidenced by transferable shares, or by transferable certificates of beneficial interest;
- (3)
- which would be taxable, but for Sections 856 through 860 of the Code, as a domestic corporation;
- (4)
- which is neither a financial institution nor an insurance company subject to certain provisions of the Code;
- (5)
- the beneficial ownership of which is held by 100 or more persons;
- (6)
- during the last half of each taxable year not more than 50% in value of the outstanding stock of which is owned, actually or constructively, by five or fewer individuals (including specified entities);
- (7)
- which meets certain other tests, described below, regarding the amount of its distributions and the nature of its income and assets;
- (8)
- that elects to be a REIT, or has made such election for a previous year, and satisfies the applicable filing and administrative requirements to maintain qualifications as a REIT; and
- (9)
- that adopts a calendar year accounting period.
The Code provides that conditions (1) to (4), inclusive, must be met during the entire taxable year and that condition (5) must be met during at least 335 days of a taxable year of 12 months, or during a proportionate part of a taxable year of less than 12 months. Conditions (5) and (6) do not apply until after the first taxable year for which an election is made to be taxed as a REIT. For purposes of condition (6), pension funds and certain other entities are treated as individuals, subject to a "look-through" exception.
Pursuant to the Code and applicable Treasury Regulations, in order to be able to elect to be taxed as a REIT, we must maintain certain records and request certain information from our stockholders designed to disclose the actual ownership of our stock. Based on publicly available information, we believe we have satisfied the share ownership requirements set forth in conditions (5) and (6). In addition, Sections 9.2 and 9.3 of our Charter provide for restrictions regarding the transfer and ownership of shares. These restrictions are intended to assist us in continuing to satisfy the share ownership requirements described in conditions (5) and (6). These restrictions, however, may not ensure that we will, in all cases, be able to satisfy the share ownership requirements described in conditions (5) and (6).
We have complied with, and will continue to comply with, regulatory rules to send annual letters to certain of our stockholders requesting information regarding the actual ownership of our stock. If despite sending the annual letters, we do not know, or after exercising reasonable diligence would not have known, whether we failed to satisfy the ownership requirement set forth in condition (6) above, we will be treated as having satisfied such condition. If we fail to comply with these regulatory rules, we will be subject to a monetary penalty. If our failure to comply was due to intentional disregard of the requirement, the penalty would be increased. However, if our failure to comply was due to reasonable cause and not willful neglect, no penalty would be imposed.
Income Tests. There presently are two gross income requirements that we must satisfy to qualify as a REIT:
- •
- First, at least 75% of our gross income (excluding gross income from "prohibited transactions," as defined below) for each taxable year must be derived directly or indirectly from investments relating to real property or mortgages on real property, including rents from real property, or from certain types of temporary investment income.
- •
- Second, at least 95% of our gross income for each taxable year must be directly or indirectly derived from income that qualifies under the 75% test, and from dividends (including dividends from taxable REIT subsidiaries), interest and gain from the sale or other disposition of stock or securities.
Cancellation of indebtedness income generated by us is not taken into account in applying the 75% and 95% income tests discussed above. A "prohibited transaction" is a sale or other disposition of property (other than foreclosure property) held for sale to customers in the ordinary course of business. Any gain realized from a prohibited transaction is subject to a 100% penalty tax.
Rents received by us will qualify as "rents from real property" for purposes of satisfying the gross income tests for a REIT only if several conditions are met:
- •
- The amount of rent must not be based in whole or in part on the income or profits of any person, although rents generally will not be excluded merely because they are based on a fixed percentage or percentages of receipts or sales.
- •
- Rents received from a tenant will not qualify as rents from real property if the REIT, or an owner of 10% or more of the REIT, also directly or constructively owns 10% or more of the tenant, unless the tenant is our taxable REIT subsidiary and certain other requirements are met with respect to the real property being rented.
- •
- If rent attributable to personal property leased in connection with a lease of real property is greater than 15% of the total rent received under the lease, then the portion of rent attributable to the personal property will not qualify as rents from real property.
- •
- We generally must not furnish or render services to tenants, other than through a taxable REIT subsidiary or an "independent contractor" from whom we derive no income, except that we may directly provide services that are "usually or customarily rendered" in the geographic area in
For taxable years beginning after August 5, 1997, a REIT has been permitted to render a de minimus amount of impermissible services to tenants and still treat amounts received with respect to that property as rents from real property. The amount received or accrued by the REIT during the taxable year for the impermissible services with respect to a property may not exceed 1% of all amounts received or accrued by the REIT directly or indirectly from the property. If the amount received or accrued by the REIT during the taxable year for impermissible services with respect to a property exceeds 1% of the total amounts received or accrued with respect to such property, then none of the rents received or accrued from such property shall be treated as rents from real property. The amount received for any service or management operation for this purpose shall be deemed to be not less than 150% of the direct cost of the REIT in furnishing or rendering the service or providing the management or operation. Furthermore, impermissible services may be furnished to tenants by a taxable REIT subsidiary subject to certain conditions, and we may still treat rents received with respect to the property as rent from real property.
The term "interest" generally does not include any amount if the determination of the amount depends in whole or in part on the income or profits of any person, although an amount generally will
not be excluded from the term "interest" solely by reason of being based on a fixed percentage of receipts or sales.
If we fail to satisfy one or both of the 75% or 95% gross income tests for any taxable year, we may nevertheless qualify as a REIT for the year if we are eligible for relief. These relief provisions will be generally available if our failure to meet the tests was due to reasonable cause and not due to wilful neglect and following the identification of the failure to satisfy one or both income tests, a description of each item of gross income is filed in accordance with IRS regulations.
It is not now possible to determine the circumstances under which we may be entitled to the benefit of these relief provisions. If these relief provisions apply, a 100% tax is imposed on an amount equal to (a) the gross income attributable to the greater of the amount by which we failed the 75% or 95% test, multiplied by (b) a fraction intended to reflect our profitability.
Asset Tests. At the close of each quarter of our taxable year, we must also satisfy several tests relating to the nature and diversification of our assets. At least 75% of the value of our total assets must be represented by real estate assets, cash, cash items (including receivables arising in the ordinary course of our operations), and government securities and qualified temporary investments. Although the remaining 25% of our assets generally may be invested without restriction, we are prohibited from owning securities representing more than 10% of either the vote or value of the outstanding securities of any issuer other than a qualified REIT subsidiary, another REIT or a taxable REIT subsidiary (the "10% vote and value test"). Further, no more than 25% of our total assets may be represented by securities of one or more taxable REIT subsidiaries (for tax years beginning prior to July 30, 2008, 20% of the total value of our assets) and no more than 5% of the value of our total assets may be represented by securities of any non-governmental issuer other than a qualified REIT subsidiary, another REIT or a taxable REIT subsidiary (or TRS). Each of the 10% vote and value test and the 25% and 5% asset tests must be satisfied at the end of any quarter. There are special rules which provide relief if the value related tests are not satisfied due to changes in the value of the assets of a REIT.
Investments in Taxable REIT Subsidiaries. For taxable years beginning after December 1, 2000, REITs may own more than 10% of the voting and value of securities in a TRS. A TRS is a corporation other than a REIT in which a REIT directly or indirectly holds stock, and that has made a joint election with the REIT to be treated as a TRS. A TRS also includes any corporation other than a REIT with respect to which a TRS owns securities possessing more that 35% of the total voting power
or value of the outstanding securities of such corporation. Other than some activities relating to lodging and health care facilities, a TRS may generally engage in any business, including the provision of customary or non-customary services to tenants of its parent REIT. A TRS is subject to income tax as a regular C corporation. In addition, a TRS may be prevented from deducting interest on debt funded directly or indirectly by its parent REIT if certain tests regarding the TRS's debt to equity ratio and interest expense are not satisfied. A REIT's ownership of a TRS will not be subject to the 10% or 5% asset tests described above, and its operations will be subject to the provisions described above. At this time, we do not have any taxable REIT subsidiaries.
REMIC. A regular or residual interest in a REMIC will be treated as a real estate asset for purposes of the REIT asset tests, and income derived with respect to such interest will be treated as interest on an obligation secured by a mortgage on real property, assuming that at least 95% of the assets of the REMIC are real estate assets. If less than 95% of the assets of the REMIC are real estate assets, only a proportionate share of the assets of and income derived from the REMIC will be treated as qualifying under the REIT asset and income tests. All of our historical REMIC certificates were secured by real estate assets, therefore we believe that our historic REMIC interests fully qualified for purposes of the REIT income and asset tests.
Ownership of Interests in Partnerships, Limited Liability Companies and Qualified REIT Subsidiaries. We own interests in various partnerships and limited liabilities companies. In the case of a REIT which is a partner in a partnership, or a member in a limited liability company treated as a partnership for federal income tax purposes, Treasury Regulations provide that the REIT will be deemed to own its proportionate share of the assets of the partnership or limited liability company, based on its interest in partnership capital, subject to special rules relating to the 10% REIT asset test described above. Also, the REIT will be deemed to be entitled to its proportionate share of income of that entity. The assets and items of gross income of the partnership or limited liability company retain the same character in the hands of the REIT for purposes of Section 856 of the Code, including satisfying the gross income tests and the asset tests. Thus, our proportionate share of the assets and items of income of partnerships and limited liability companies taxed as partnerships, in which we are, directly or indirectly through other partnerships or limited liability companies taxed as partnerships, a partner or member, are treated as our assets and items of income for purposes of applying the REIT qualification requirements described in this Annual Report on Form 10-K (including the income and asset tests previously described).
We also own interests in a number of subsidiaries which are intended to be treated as qualified REIT subsidiaries. The Code provides that such subsidiaries will be ignored for federal income tax purposes and that all assets, liabilities and items of income, deduction and credit of such subsidiaries will be treated as assets, liabilities and such items of our company. If any partnership or qualified real estate investment trust subsidiary in which we own an interest were treated as a regular corporation (and not as a partnership or qualified real estate investment trust subsidiary) for federal income tax purposes, we would likely fail to satisfy the REIT asset test prohibiting a REIT from owning greater than 10% of the voting power of the stock or value of securities of any issuer, as described above, and would therefore fail to qualify as a REIT. We believe that each of the partnerships and subsidiaries in which we own an interest will be treated for tax purposes as a partnership or qualified REIT subsidiary, respectively, although no assurance can be given that the IRS will not successfully challenge the status of any such entity.
Annual Distribution Requirements. In order to qualify as a REIT, we are required to distribute dividends (other than capital gain dividends) to our stockholders annually in an amount at least equal to:
- (1)
- the sum of:
- (a)
- 90% of our "real estate investment trust taxable income" (computed without regard to the dividends paid deduction and our net capital gain); and
- (b)
- 90% of the net income, if any (after tax), from foreclosure property; minus
- (2)
- the excess of certain items of non-cash income over 5% of our real estate investment trust taxable income.
In addition, if we dispose of any asset we acquired from a corporation which is or has been a C corporation in a transaction in which our basis in the asset is determined by reference to the basis of the asset in the hands of that C corporation, within the ten-year period following our acquisition of such asset, we would be required to distribute at least 90% of the after-tax gain, if any, we recognized on the disposition of the asset, to the extent that gain does not exceed the excess of (a) the fair market value of the asset on the date we acquired the asset over (b) our adjusted basis in the asset on the date we acquired the asset.
We must pay these annual distributions (1) in the taxable year to which they relate or (2) in the following year if (i) we pay these distributions during January to stockholders of record in either October, November, or December of the prior year or (ii) we elect to declare the dividend before the
due date of the tax return (including extensions) and pay on or before the first regular dividend payment date after such declaration.
Amounts distributed must not be preferential; that is, every stockholder of the class of stock with respect to which a distribution is made must be treated the same as every other stockholder of that class, and no class of stock may be treated otherwise than in accordance with its dividend rights as a class.
To the extent that we do not distribute all of our net long term capital gain or distribute at least 90% but less than 100%, of our "real estate investment trust taxable income," as adjusted, we will be subject to tax on such amounts at regular corporate tax rates. Furthermore, if we should fail to distribute during each calendar year (or, in the case of distributions with declaration and record dates in the last three months of the calendar year, by the end of the following January) at least the sum of:
- (1)
- 85% of our real estate investment trust ordinary income for such year,
- (2)
- 95% of our real estate investment trust capital gain net income for such year, and
- (3)
- 100% of taxable income from prior periods less 100% of distributions from prior periods
We would be subject to a 4% excise tax on the excess of such required distributions over the amounts actually distributed. Any real estate investment trust taxable income and net capital gain on which this excise tax is imposed for any year is treated as an amount distributed during that year for purposes of calculating such tax.
We intend to make timely distributions sufficient to satisfy these annual distribution requirements and to avoid the imposition of the 4% excise tax.
Failure to Qualify. If we fail to qualify for taxation as a REIT in any taxable year, and certain relief provisions do not apply, we will be subject to tax (including any applicable alternative minimum tax) on our taxable income at regular corporate rates. Distributions to stockholders in any year in which we fail to qualify as a REIT will not be deductible by us, nor will any distributions be required to be made. Unless entitled to relief under specific statutory provisions, we will also be disqualified from
re-electing our REIT status for the four taxable years following the year during which qualification was lost. It is not possible to state whether we would be entitled to the statutory relief in all circumstances. Failure to qualify as a REIT for even one year could substantially reduce distributions to stockholders and could result in our incurring substantial indebtedness (to the extent borrowings are feasible) or liquidating substantial investments in order to pay the resulting taxes.
State and local taxation. We may be subject to state or local taxation in various state or local jurisdictions, including those in which we transact business or reside. The state and local tax treatment of our Company may not conform to the federal income tax consequences discussed above.
Investor Information
We make available to the public free of charge through our internet website our Annual Report on Form 10-K, Quarterly Reports on Form 10-Q, Current Reports on Form 8-K, and amendments to those reports filed or furnished pursuant to Section 13(a) or 15(d) of the Securities Exchange Act of 1934, as amended, as soon as reasonably practicable after we electronically file such reports with, or furnish such reports to, the Securities and Exchange Commission (or SEC). Our internet website address iswww.LTCProperties.comwww.LTCProperties.com.. We are not including the information contained on our website as part of, or incorporating it by reference into, this Annual Report on Form 10-K.
Posted on our websitewww.LTCProperties.com under the "Corporate Governance" heading are our Audit Committee, Compensation Committee and Nominating and Corporate Governance Committee Charters, our Corporate Governance Policies, and a Code of Business Conduct Ethics and Corporate
GovernanceEthics governing our directors, officers and employees. Within the time period required by the SEC and the New York Stock Exchange (or NYSE), we will post on our website any amendment to the Code of Business Conduct Ethics and Corporate GovernanceEthics and any waiver applicable to our Principal Executive Officer, Principal Financial Officer, Principal Accounting Officer or Directors. In addition, our website under the heading "SEC Filings" includes information concerning purchases and sales of our equity securities by our executive officers and directors.
You may read and copy materials that we file with the SEC at the SEC's Public Reference Room at 100 F Street, N.E., Washington D.C. 20549.20549, on official business days during the hours of 10:00 am to 3:00 pm Eastern Standard Time. Information on the operation of the Public Reference Room is available by calling the SEC at 1-800-SEC-0330. The SEC maintains an Internet site that contains reports, proxy statements and other information we file. The address of the SEC website iswww.sec.gov.
You also may contact our Investor Relations Department at:
LTC Properties, Inc.
2829 Townsgate Road, Suite 350
Westlake Village, California 91361
Attn: Investor Relations
(805) 981-8655
Item 1A. RISK FACTORS
The following discussion of risk factors contains "forward-looking statements" as discussed above under the heading "Cautionary Statement." These risk factors may be important to understanding any statement in this Annual Report on Form 10-K or elsewhere. The following information should be read in conjunction with Management's Discussion and Analysis, and the consolidated financial statements and related notes in this Annual Report on Form 10-K.
A Failure to Maintain or Increase our Dividend Could Reduce the Market Price of Our Stock. In January 2012, we declared a $0.145 per share monthly dividend for the first quarter of calendar 2012 which is a 3.6% increase from the previous $0.14 per share per month dividend. The ability to maintain or raise our common dividend is dependent, to a large part, on growth of funds
available for distribution. This growth in turn depends upon increased revenues from additional investments and loans, rental increases and mortgage rate increases.
At Times, We May Have Limited Access to Capital Which Will Slow Our Growth. A REIT is required to make dividend distributions and retains little cash flow for growth. As a result, growth for a REIT is generally through the steady investment of new capital in real estate assets. There may be times when we will have limited access to capital from the equity and/or debt markets. During such periods, virtually all of our available capital would be required to meet existing commitments and to reduce existing debt. We may not be able, during such periods, to obtain additional equity and/or debt capital or dispose of assets on favorable terms, if at all, at the time we require additional capital to acquire health care properties on a competitive basis or meet our obligations. We believe that our $4.4 million cash balance atAt December 31, 2011, our low debt levels, $154.02013, we had $6.8 million of cash on hand, $219.0 million available under our $210.0 million Unsecured Credit Agreementunsecured revolving line of credit, and $100.0$30.0 million available under the uncommitted private shelf agreement for our senior unsecured notes. Subsequent to December 31, 2013, we borrowed $11.5 million and, ourtherefore, have $207.5 million available under or unsecured revolving line of credit. We also have the potential ability to access the capital markets through the issuance of $64.6 million of common stock under our Amended Equity Distribution Agreement and through the issuance of debt and/or equity securities under our $167.6$800.0 million effective shelf registration, will enable usregistration. As a result, we believe our liquidity and various sources of available capital are sufficient to fund operations and development commitments, meet ourdebt service obligations (both principal and continue tointerest), make investments.dividend distributions and finance some future investments should we determine such future investments are financially feasible.
Income and Returns from Health Care Facilities Can be Volatile. The possibility that the health care properties in which we invest will not generate income sufficient to meet operating expenses, will generate income and capital appreciation, if any, at rates lower than those anticipated or will yield
returns lower than those available through investments in comparable real estate or other investments are additional risks of investing in health care related real estate. Income from properties and yields from investments in such properties may be affected by many factors, including changes in governmental regulation (such as zoning laws and government payment), general or local economic conditions (such as fluctuations in interest rates and employment conditions), the available local supply of and demand for improved real estate, a reduction in rental income as the result of an inability to maintain occupancy levels, natural disasters (such as hurricanes, earthquakes and floods) or similar factors.
We Depend on Lease Income and Mortgage Payments from Real Property. Approximately 99%99.5% of our revenue for the year ended December 31, 2011,2013, was derived from lease income and mortgage payments from real property. Our revenue would be adversely affected if a significant number of our borrowers or lessees were unable to meet their obligations to us or if we were unable to lease our properties or make mortgage loans on economically favorable terms. There can be no assurance that any lessee will exercise its option to renew its lease upon the expiration of the initial term orterm. There can be no assurance that if such failure to renew were to occur, or if we did not re-lease a property to a current lessee, we could lease the property to others on favorable terms.terms, at the same rent as the current rent, or on a timely basis.
We Rely on a Few Majorour Operators. Extendicare REIT and Assisted Living Concepts, Inc. (or ALC), collectively lease 37 assisted living properties with a total of 1,427 units owned by us representing approximately 8.6%, or $55.5 million,Substantially all of our total assets at December 31, 2011. Brookdale Senior Living Communities, Inc., (or Brookdale Communities), a whollyrevenues and sources of cash flows from operations are derived from operating lease rentals and interest earned on outstanding loans receivable. Our investments in mortgage loans and owned subsidiaryproperties represent our primary source of Brookdale Senior Living, Inc., leases 35 assisted living properties with a totalliquidity to fund distributions and are dependent upon the performance of 1,416 units owned by us representing approximately 8.6%, or $55.5 million, of our total assets at December 31, 2011. Preferred Care, Inc. (or Preferred Care), through various wholly owned subsidiaries, operates 30 skilled nursing propertiesthe operators on their lease and two other senior housing properties that we own or on which we hold mortgages secured by first trust deeds. These properties consist of a total of 3,861 skilled nursing bedsloan obligations and 49 assisted living units. This represents approximately 8.8% or $57.0 million of our total assets at December 31, 2011.the rates earned thereon. Our financial position and ability to make distributions may be adversely affected by financial difficulties experienced by any of our other lessees andor borrowers, including bankruptcies, inability to emerge from bankruptcy, insolvency or general downturn in business of any such operator, or in the event any such operator does not renew and/or extend its relationship with us or our borrowers when it expires.
Our Borrowers and Lessees Face Competition in the Health Care Industry. The long term care industry is highly competitive and we expect that it may become more competitive in the future. Our borrowers and lessees are competing with numerous other companies providing similar long term care services or alternatives such as home health agencies, hospices, life care at home, community-based service programs, retirement communities and convalescent centers. There can be no assurance that our borrowers and lessees will not encounter increased competition in the future which could limit their ability to attract residents or expand their businesses and therefore affect their ability to make their debt or lease payments to us.
The Health Care Industry is Heavily Regulated by the Government. Our borrowers and lessees who operate health care facilities are subject to extensive regulation by federal, state and local governments. These laws and regulations are subject to frequent and substantial changes resulting from legislation, adoption of rules and regulations, and administrative and judicial interpretations of existing law. These changes may have a dramatic effect on the definition of permissible or impermissible activities, the relative costs associated with doing business and the amount of reimbursement by both government and other third-party payors. These changes may be applied retroactively. The ultimate timing or effect of these changes cannot be predicted. The failure of any borrower of funds from us or lessee of any of our properties to comply with such laws, requirements and regulations could affect its ability to operate
its facility or facilities and could adversely affect such borrower's or lessee's ability to make debt or lease payments to us.
In March 2010, the President signed into law the Patient Protection and Affordable Care Act, which subsequently was amended by the Health Care and Education and Reconciliation Act of 2010 (collectively referred to as the "Affordable Care Act"). The Affordable Care Act is designed to expand access to affordable health insurance, contain health care costs, and institute a variety of health policy reforms. The provisions of the sweeping law may affect us directly, as well as impact our lessees and borrowers. While certain provisions, such as expanding the insured population, may positively impact the revenues of our lessees and borrowers, other provisions, particularly those intended to reduce federal health care spending, could have a negative impact on our lessees and borrowers. Among other things, the Affordable Care Act: reduces Medicare skilled nursing facility reimbursement by a so-called "productivity adjustment" based on economy-wide productivity gains beginning in fiscal year 2012; requires the development of a value-based purchasing program for Medicare skilled nursing facility services; establishes a national voluntary pilot program to bundle Medicare payments for hospital and post-acute services that could lead to changes in the delivery of post-acute services; and provides incentives to state Medicaid programs to promote community-based care as an alternative to institutional long term care services. The Affordable Care Act also includes provisions intended to expand public disclosure about nursing home ownership and operations, institute mandatory compliance and quality assurance programs, increase penalties for noncompliance, and expand fraud and abuse enforcement and penalty provisions that could impact our operators. In addition, the Affordable Care Act impacts both us and our lessees and borrowers as employers, including new requirements related to the health insurance we offer to our respective employees. Many aspects of the Affordable Care Act are being implemented through new regulations and subregulatory guidance. We cannot predict at this time what effect, if any, the various provisions of the Affordable Care Act will have on our lessees and borrowers or our business. There can be no assurances, however, that the Affordable Care Act will not adversely impact the operations, cash flows or financial condition of our lessees and borrowers, which subsequently could materially adversely impact our revenue and operations.
In addition, comprehensiveAdditional reforms affecting the payment for and availability of health care services have been proposed at the state level and adopted by certain states. Congress and state legislatures can be expected to continue to review and assess alternative health care delivery systems and payment methodologies. In particular, absent new legislation,methodologies along with other cost-control measures. For instance, under the federalterms of the Budget Control Act of 2011, as modified by the American Taxpayer Relief Act, President Obama issued a
sequestration order on March 1, 2013 that mandates a 2% cut to Medicare payments to providers and health plans. The cuts generally apply to Medicare fee-for-service claims with dates-of-service or dates-of-discharge on or after April 1, 2013. Under current law, as amended by the Bipartisan Budget Act of 2013, sequestration will trigger a total of $1.2 trillion in spending reductions in January 2013, divided between domesticlast through fiscal year 2023, although Congress and defense spending. Medicare provider payments will be subject to sequestration, although the reductions will be cappedAdministration could enact alternative budget legislation at 2%. Changesany time that would end or modify sequestration. These and other changes in the law, new interpretations of existing laws, or changes in payment methodologies may have a dramatic effect on the definition of permissible or impermissible activities, the relative costs associated with doing business and the amount of reimbursement by the government and other third party payors.
Federal and State Health Care Cost Containment Measures Including Reductions in Reimbursement From Third Party Payors Such as Medicare and Medicaid Could Adversely Affect Us and The Ability of Our Tenants to Make Payments to Us. The ability of our borrowers and lessees to generate revenue and profit determines the underlying value of that property to us. Revenues of our borrowers and skilled nursing property lessees are generally derived from payments for patient care. Sources of such payments include the federal Medicare program, state Medicaid programs, private insurance carriers, health care service plans, health maintenance organizations, preferred provider arrangements, self-insured employers, as well as the patients themselves.
The health care industry continues to face increased government and private payor pressure on health care providers to control costs. Certain of these initiatives have had the result of limiting Medicare and Medicaid reimbursement for nursing facility services. In particular, the establishment of a Medicare prospective payment system for skilled nursing facility services to replace the cost-based
reimbursement system significantly reduced Medicare reimbursement to skilled nursing facility providers. While Congress subsequently took steps to mitigate the impact of the prospective payment system on skilled nursing facilities, other federal legislative and regulatory policies have been adopted and may continue to be proposed that would reduce Medicare and/or Medicaid payments to nursing facilities. Moreover, states are facing increasing budget pressures in light of the current economic conditions, prompting consideration and in some cases adoption of cuts in state Medicaid payments to providers. No assurances can be given that any additional Medicare or Medicaid legislation or regulatory policies adopted by the federal government or the states would not reduce Medicare or Medicaid reimbursement to nursing facilities or result in additional costs for operators of nursing facilities.
Congress also has given states greater flexibility to expand access to home and community based services as an alternative to nursing facility services. These provisions could further increase state funding for home and community based services, while prompting states to cut funding for nursing facilities and homes for persons with disabilities. In light of continuing state Medicaid program reforms, budget cuts, and regulatory initiatives, no assurance can be given that the implementation of such regulations and reforms will not have a material adverse effect on the financial condition or results of operations of our lessees and/or borrowers which, in turn, could affect their ability to meet their contractual obligations to us.
We Could Incur More Debt. We operate with a policy of incurring debt when, in the opinion of our Board of Directors, it is advisable. We may incur additional debt by borrowing under our Unsecured Credit Agreementunsecured revolving line of credit or the uncommitted private shelf agreement, mortgaging properties we own and/or issuing debt securities in a public offering or in a private transaction. Accordingly, we could become more highly leveraged. The degree of leverage could have important consequences to stockholders, including affecting our ability to obtain, in the future, additional financing for working capital, capital expenditures, acquisitions, development or other general corporate purposes and making us more vulnerable to a downturn in business or the economy generally.
We Could Fail to Collect Amounts Due Under Our Straight-line Rent Receivable Asset. Straight-line accounting requires us to calculate the total rent we will receive as a fixed amount over the life of the
lease and recognize that revenue evenly over that life. In a situation where a lease calls for fixed rental increases during the life of the lease, rental income recorded in the early years of a lease is higher than the actual cash rent received which creates an asset on the consolidated balance sheet called straight-line rent receivable. At some point during the lease, depending on the rent levels and terms, this reverses and the cash rent payments received during the later years of the lease are higher than the rental income recognized which reduces the straight-line rent receivable balance to zero by the end of the lease. We periodically assess the collectability of the straight-line rent receivable. If during our assessment we determined that we were unlikely to collect a portion or the entire straight-line rent receivable asset, we may provide a reserve against the previously recognized straight-line rent receivable asset for a portion or up to its full value that we estimate may not be recoverable.
Our Assets May be Subject to Impairment Charges. We periodically but not less than quarterly evaluate our real estate investments and other assets for impairment indicators. The judgment regarding the existence of impairment indicators is based on factors such as market conditions, operator performance and legal structure. If we determine that a significant impairment has occurred, we would be required to make an adjustment to the net carrying value of the asset which could have a material adverse affect on our results of operations and a non-cash impact on funds from operations in the period in which the write-off occurs.
A Failure to Reinvest Cash Available to Us Could Adversely Affect Our Future Revenues and Our Ability to Increase Dividends to Stockholders; There is Considerable Competition in Our Market for Attractive Investments. From time to time, we will have cash available from (1) proceeds of sales of
shares of securities, (2) proceeds from new debt issuances, (3) principal payments on our mortgages and other investments, (4) sale of properties, and (5) funds from operations. We may reinvest this cash in health care investments and in accordance with our investment policies, repay outstanding debt or invest in qualified short term or long term investments. We compete for real estate investments with a broad variety of potential investors. The competition for attractive investments negatively affects our ability to make timely investments on acceptable terms. Delays in acquiring properties or making loans will negatively impact revenues and perhaps our ability to increase distributions to our stockholders.
Our Failure to Qualify as a REIT Would Have Serious Adverse Consequences to Our Stockholders. We intend to operate so as to qualify as a REIT under the Code. We believe that we have been organized and have operated in a manner which would allow us to qualify as a REIT under the Code beginning with our taxable year ended December 31, 1992. However, it is possible that we have been organized or have operated in a manner which would not allow us to qualify as a REIT, or that our future operations could cause us to fail to qualify. Qualification as a REIT requires us to satisfy numerous requirements (some on an annual and quarterly basis) established under highly technical and complex Code provisions for which there are only limited judicial and administrative interpretations, and involves the determination of various factual matters and circumstances not entirely within our control. For example, in order to qualify as a REIT, at least 95% of our gross income in any year must be derived from qualifying sources, and we must pay dividends to stockholders aggregating annually at least 90% (95% for taxable years ending prior to January 1, 2001) of our REIT taxable income (determined without regard to the dividends paid deduction and by excluding capital gains). Legislation, new regulations, administrative interpretations or court decisions could significantly change the tax laws with respect to qualification as a REIT or the federal income tax consequences of such qualification.
If we fail to qualify as a REIT in any taxable year, we will be subject to federal income tax (including any applicable alternative minimum tax) on our taxable income at regular corporate rates. Unless we are entitled to relief under statutory provisions, we would be disqualified from treatment as a REIT for the four taxable years following the year during which we lost qualification. If we lose our REIT status, our net earnings available for investment or distribution to stockholders would be
significantly reduced for each of the years involved. In addition, we would no longer be required to make distributions to stockholders.
Provisions in Our Articles of Incorporation May Limit Ownership of Shares of Our Capital Stock. In order for us to qualify as a REIT, no more than 50% in value of the outstanding shares of our stock may be beneficially owned, directly or indirectly, by five or fewer individuals at any time during the last half of each taxable year. To ensure qualification under this test, our Articles of Incorporation provide that, subject to exceptions, no person may beneficially own more than 9.8% of outstanding shares of any class or series of our stock, including our common stock. Our Board of Directors may exempt a person from the 9.8% ownership limit upon such conditions as the Board of Directors may direct. However, our Board of Directors may not grant an exemption from the 9.8% ownership limit if it would result in the termination of our status as a REIT. Shares of capital stock in excess of the 9.8% ownership limitation that lack an applicable exemption may lose rights to dividends and voting, and may be subject to redemption. As a result of the limitations on ownership set forth in our Articles of Incorporation, acquisition of any shares of capital stock that would result in our disqualification as a REIT may be limited or void. The 9.8% ownership limitation also may have the effect of delaying, deferring, or preventing a change in control of us, including an extraordinary transaction (such as a merger, tender offer or sale of all or substantially all of our assets) that might provide a premium price for holders of our capital stock.
Our Real Estate Investments are Relatively Illiquid. Real estate investments are relatively illiquid and, therefore, tend to limit our ability to vary our portfolio promptly in response to changes in
economic or other conditions. All of our properties are "special purpose" properties that cannot be readily converted to general residential, retail or office use. Health care facilities that participate in Medicare or Medicaid must meet extensive program requirements, including physical plant and operational requirements, which are revised from time to time. Such requirements may include a duty to admit Medicare and Medicaid patients, limiting the ability of the facility to increase its private pay census beyond certain limits. Medicare and Medicaid facilities are regularly inspected to determine compliance, and may be excluded from the programs—in some cases without a prior hearing—for failure to meet program requirements. Transfers of operations of nursing homes and other healthcare-relatedhealth care-related facilities are subject to regulatory approvals not required for transfers of other types of commercial operations and other types of real estate. Thus, if the operation of any of our properties becomes unprofitable due to competition, age of improvements or other factors such that our lessee or borrower becomes unable to meet its obligations on the lease or mortgage loan, the liquidation value of the property may be substantially less than the net book value or the amount owing on any related mortgage loan, than would be the case if the property were readily adaptable to other uses. The receipt of liquidation proceeds or the replacement of an operator that has defaulted on its lease or loan could be delayed by the approval process of any federal, state or local agency necessary for the transfer of the property or the replacement of the operator with a new operator licensed to manage the facility. In addition, certain significant expenditures associated with real estate investment, such as real estate taxes and maintenance costs, are generally not reduced when circumstances cause a reduction in income from the investment. Should such events occur, our income and cash flows from operations would be adversely affected.
Our Remedies May Be Limited When Mortgage Loans Default. To the extent we invest in mortgage loans, such mortgage loans may or may not be recourse obligations of the borrower and generally will not be insured or guaranteed by governmental agencies or otherwise. In the event of a default under such obligations, we may have to foreclose on the property underlying the mortgage or protect our interest by acquiring title to a property and thereafter make substantial improvements or repairs in order to maximize the property's investment potential. Borrowers may contest enforcement of foreclosure or other remedies, seek bankruptcy protection against such enforcement and/or bring claims for lender liability in response to actions to enforce mortgage obligations. If a borrower seeks bankruptcy protection, the Bankruptcy Court may impose an automatic stay that would preclude us
from enforcing foreclosure or other remedies against the borrower. Declines in the value of the property may prevent us from realizing an amount equal to our mortgage loan upon foreclosure.
We are Subject to Risks and Liabilities in Connection with Properties Owned Through Limited Liability Companies and Partnerships. We haveIn prior years, we had ownership interests in a limited liability partnership.companies and partnerships. We may make additional investments through these ventures in the future. Partnership or limited liability company investments may involve risks such as the following:
- •
- our partners or co-members might become bankrupt (in which event we and any other remaining general partners or members would generally remain liable for the liabilities of the partnership or limited liability company);
- •
- our partners or co-members might at any time have economic or other business interests or goals which are inconsistent with our business interests or goals;
- •
- our partners or co-members may be in a position to take action contrary to our instructions, requests, policies or objectives, including our policy with respect to maintaining our qualification as a REIT; and
- •
- agreements governing limited liability companies and partnerships often contain restrictions on the transfer of a member's or partner's interest or "buy-sell" or other provisions which may result in a purchase or sale of the interest at a disadvantageous time or on disadvantageous terms.
We will, however, generally seek to maintain sufficient control of our partnerships and limited liability companies to permit us to achieve our business objectives. Our organizational documents do not limit the amount of available funds that we may invest in partnerships or limited liability companies. The occurrence of one or more of the events described above could have a direct and adverse impact on us.
Risks Associated with Property Development that Can Render a Project Less Profitable or Not Profitable, and, Under Certain Circumstances, Prevent Completion of Development Activities Undertaken. Our business includes development of senior housing and long term care properties. We currently have six parcels of land under development. Ground up development presents additional risk, including but not limited to the following:
- •
- a development opportunity may be abandoned after expending significant resources resulting in the loss of deposits or failure to recover expenses already incurred;
- •
- the development and construction costs of a project may exceed original estimates due to increased interest rates and higher materials, transportation, labor, leasing or other costs, which could make completion of the development project less profitable;
- •
- construction and/or permanent financing may not be available on favorable terms or at all;
- •
- the project may not be completed on schedule, which can result in increases in construction costs and debt service expenses as a result of a variety of factors that are beyond our control, including natural disasters, labor conditions, material shortages, regulatory hurdles, civil unrest and acts of war; and
- •
- occupancy rates and rents at a newly completed property may not meet expected levels and could be insufficient to make the property profitable.
These risks could result in substantial unanticipated delays or expenses and, under certain circumstances, could prevent completion of development activities once undertaken, any of which could have a material adverse effect on our business, results of operations and financial condition.
Item 1B. UNRESOLVED STAFF COMMENTS
None.
Item 2. PROPERTIES
Here and throughout this Form 10-K wherever we provide details of our properties' bed/unit count, the number of beds/units applies to skilled nursing, assisted living, and independent living and memory care properties only. This number is based upon unit/bed counts shown on operating licenses provided to us by lessees/borrowers or units/beds as stipulated by lease/mortgage documents. We have found during the years that these numbers often differ, usually not materially, from units/beds in operation at any point in time. The differences are caused by such things as operators converting a patient/resident room for alternative uses, such as offices or storage, or converting a multi-patient room/unit into a single patient room/unit. We monitor our properties on a routine basis through site visits and reviews of current licenses. In an instance where such change would cause a de-licensing of beds or in our opinion impact the value of the property, we would take action against the lessee/borrower to preserve the value of the property/collateral.
Owned Properties. The following table sets forth certain information regarding our owned properties as of December 31, 20112013 (dollars amounts in thousands):
| Location | | No. of
SNFs | | No. of
ALFs | | No. of
Others(4) | | No. of
Schools | | No. of
Beds/Units | | Encumbrances | | Remaining
Lease
Term(1) | | Gross
Investment | | | No. of
SNFs | | No. of
ALFs | | No. of
ROCs | | No. of
UDPs | | No. of
Others | | No. of
Beds/Units | | Encumbrances | | Remaining
Lease
Term(1) | | Gross
Investment | |
|---|
Alabama | | 2 | | — | | 2 | | — | | 459 | | $ | — | | 49 | | $ | 18,622 | | | 2 | | — | | 2 | | — | | — | | 459 | | $ | — | | 31 | | $ | 18,622 | |
Arizona | | 5 | | 2 | | — | | — | | 1,029 | | — | | 75 | | 41,212 | | | 5 | | 2 | | — | | — | | — | | 983 | | — | | 61 | | 41,212 | |
California | | 2 | | 2 | | — | | — | | 499 | | — | | 79 | | 48,719 | | | 2 | | 2 | | — | | — | | — | | 508 | | — | | 83 | | 48,720 | |
Colorado | | 3 | | 6 | | 1 | | — | | 582 | | — | | 108 | | 27,816 | | | 2 | | 9 | | 1 | | — | (2) | | — | | 705 | | — | | 110 | | 67,416 | |
Florida | | 2 | | 8 | | 3 | | — | | 1,058 | | — | | 108 | | 60,567 | | | 5 | | 9 | | — | | — | | — | | 1,061 | | — | | 99 | | 74,969 | |
Georgia | | 2 | | — | | 1 | | — | | 300 | | — | | 38 | | 6,600 | | | 2 | | 1 | | — | | — | | — | | 301 | | — | | 14 | | 6,600 | |
Idaho | | — | | 4 | | — | | — | | 148 | | — | | 36 | | 9,756 | | | — | | 4 | | — | | — | | — | | 148 | | — | | 12 | | 9,756 | |
Indiana | | — | | 3 | | — | | — | | 140 | | — | | 64 | | 9,856 | | | — | | 3 | | — | | — | | — | | 140 | | — | | 52 | | 9,856 | |
Iowa | | 6 | | 1 | | 1 | | — | | 616 | | — | | 110 | | 17,422 | | | 6 | | 1 | | 1 | | — | | — | | 579 | | — | | 83 | | 17,422 | |
Kansas | | 3 | | 4 | | — | | — | | 398 | | — | | 113 | | 20,844 | | | 3 | | 5 | | — | | — | | — | | 461 | | — | | 100 | | 30,706 | |
Kentucky | | | — | | — | | — | | — | (3) | | — | | — | | — | | — | | 10,631 | |
Michigan | | | — | | — | | — | | — | | — | (5) | | — | | — | | — | | 1,163 | |
Minnesota | | — | | — | | — | | 1 | | — | | — | | 8 | | 2,922 | | | — | | — | | — | | — | | 1 | | — | | — | | 20 | | 3,174 | |
Mississippi | | — | | 1 | | — | | — | | 62 | | — | | 106 | | 9,400 | | | — | | 1 | | — | | — | | — | | 62 | | — | | 96 | | 9,400 | |
Nebraska | | — | | 4 | | — | | — | | 156 | | — | | 36 | | 9,332 | | | — | | 4 | | — | | — | | — | | 158 | | — | | 12 | | 9,332 | |
New Jersey | | — | | 1 | | — | | 1 | | 39 | | — | | 51 | | 12,195 | | | — | | 4 | | — | | — | | 1 | | 205 | | — | | 145 | | 70,667 | |
New Mexico | | 7 | | — | | — | | — | | 860 | | — | | 81 | | 48,876 | | | 7 | | — | | — | | — | | — | | 843 | | — | | 78 | | 50,303 | |
N. Carolina | | — | | 5 | | — | | — | | 210 | | — | | 108 | | 13,096 | | | — | | 5 | | — | | — | | — | | 210 | | — | | 84 | | 13,096 | |
Ohio | | 6 | | 11 | | — | | — | | 737 | | — | | 51 | | 56,804 | | | 2 | | 11 | | — | | — | | — | | 772 | | — | | 108 | | 98,647 | |
Oklahoma | | — | | 6 | | — | | — | | 221 | | — | | 108 | | 12,315 | | | — | | 6 | | — | | — | | — | | 219 | | — | | 84 | | 12,315 | |
Oregon | | 1 | | 3 | | — | | — | | 218 | | — | | 41 | | 11,927 | | | 1 | | 3 | | — | | — | | — | | 218 | | — | | 19 | | 11,927 | |
Pennsylvania | | — | | 3 | | — | | — | | 199 | | — | | 105 | | 18,040 | | | — | | 3 | | — | | — | | — | | 199 | | — | | 75 | | 18,040 | |
S. Carolina | | — | | 3 | | 2 | | — | | 339 | | — | | 109 | | 19,734 | | | — | | 3 | | 2 | | — | | — | | 339 | | — | | 85 | | 19,800 | |
Tennessee | | 2 | | — | | — | | — | | 142 | | — | | 82 | | 3,075 | | | 2 | | — | | — | | — | | — | | 141 | | — | | 120 | | 4,080 | |
Texas | | 23 | | 13 | | 2 | | — | | 4,044 | | — | | 111 | | 189,745 | | | 25 | | 14 | | 1 | | — | (4) | | — | | 4,171 | | — | | 114 | | 223,607 | |
Virginia | | 3 | | — | | 1 | | — | | 568 | | — | | 123 | | 29,052 | | | 3 | | — | | 1 | | — | | — | | 500 | | — | | 113 | | 29,052 | |
Washington | | 1 | | 8 | | — | | — | | 431 | | 3,200 | | 38 | | 27,104 | | | 1 | | 8 | | — | | — | | — | | 431 | | 2,035 | | 18 | | 27,104 | |
| | | | | | | | | | | | | | | | | | | | | | | | | | | | | | | | | | | | | |
| | | | | | | | | | | | | | | | | | | | | |
TOTAL | | 68 | | 88 | | 13 | | 2 | | 13,455 | | $ | 3,200 | (2) | | 87 | | $ | 725,031 | (3) | | 68 | | 98 | | 8 | | — | | 2 | | 13,813 | | $ | 2,035 | (6) | | 94 | | $ | 937,617 | |
| | | | | | | | | | | | | | | | | | | | | | | | | | | | | | | | | | | | | |
| | | | | | | | | | | | | | | | | | | | | |
| | | | | | | | | | | | | | | | | | | | | |
| | | | | | | | | | | | | | | | | | | | | |
- (1)
- Weighted average remaining months in lease term as of December 31,
2011.
2013. - (2)
- Includes three MC developments with a total 168 units.
- (3)
- Includes a SNF development with 143 beds.
- (4)
- Includes a combination ALF and MC development with 81 units.
- (5)
- Includes four parcels of land held-for-use.
- (6)
- Consists of
$3,200$2,035 of tax-exempt bonds secured by five assisted living properties in Washington with 188 units. As of December 31, 20112013 our gross investment in properties encumbered by these bonds was $11,280.
The following table sets forth certain information regarding our lease expirations for our owned properties as of December 31, 2013 (dollars amounts in thousands):
| | | | | | | | | | | | | | | | | | | | | | | | | |
Year | | No. of
SNFs | | No. of
ALFs | | No. of
ROCs | | No. of
Others | | No. of
Beds/Units | | No. of
Operators | | Annualized
Rental
Income(1) | | % of Annualized
Rental Income
Expiring | |
|---|
2014 | | | 2 | | | 37 | | | 2 | | | — | | | 1,861 | | | 2 | | | 13,924 | | | 14.1 | % |
2015 | | | — | | | 2 | | | — | | | 1 | | | 144 | | | 2 | | | 1,184 | | | 1.2 | % |
2016 | | | 4 | | | — | | | — | | | — | | | 434 | | | 3 | | | 2,644 | | | 2.7 | % |
2017 | | | 1 | | | — | | | — | | | 1 | | | 60 | | | 2 | | | 1,638 | | | 1.7 | % |
2018 | | | 4 | | | 9 | | | 1 | | | — | | | 1,296 | | | 5 | | | 10,872 | | | 11.0 | % |
2019 | | | 3 | | | — | | | — | | | — | | | 613 | | | 1 | | | 1,621 | | | 1.6 | % |
2020 | | | 1 | | | 35 | | | — | | | — | | | 1,580 | | | 2 | | | 11,818 | | | 11.9 | % |
2021 | | | 31 | | | 7 | | | 4 | | | — | | | 4,425 | | | 5 | | | 22,211 | | | 22.4 | % |
2022 | | | 1 | | | — | | | — | | | — | | | 121 | | | 1 | | | 572 | | | 0.6 | % |
2023 | | | 8 | | | 3 | | | 1 | | | — | | | 1,300 | | | 5 | | | 10,547 | | | 10.6 | % |
Thereafter | | | 13 | | | 5 | | | — | | | — | | | 1,979 | | | 4 | | | 21,960 | | | 22.2 | % |
| | | | | | | | | | | | | | | | | | | |
| | | | | | | | | | | | | | | | | | | | | | | | | | |
TOTAL | | | 68 | | | 98 | | | 8 | | | 2 | | | 13,813 | | | 32 | (2) | $ | 98,991 | | | 100.0 | % |
| | | | | | | | | | | | | | | | | | | |
| | | | | | | | | | | | | | | | | | | | | | | | | | |
| | | | | | | | | | | | | | | | | | | | | | | | | | |
| | | | | | | | | | | | | | | | | | | |
(3)(1)OfAnnualized rental income is the total $285,981 relates to investmentsrent over the life of the lease recognized evenly over that life for leases in assisted living properties, $361,326 relates to investments in skilled nursing properties, $64,638 relates to investments in other senior housing properties, $12,192 relates to investments in two schools and $894 relates toplace as of December 31, 2013, excluding amortization of lease inducement costs.- (2)
- Does not include one operator of a property under development
project in Texas to construct a skilled nursing property with 120 beds whichas the term of the lease will replace an existing 90-bed skilled nursing property.
(4)Other represents other senior housing properties consistingbe set upon completion of independent living properties and properties providing any combination of skilled nursing, assisted living and/or independent living services.the project.
Mortgage Loans. The following table sets forth certain information regarding our mortgage loans as of December 31, 20112013 (dollars amounts in thousands):
| Location | | No. of
SNFs | | No. of
ALFs | | No. of
Other(1) | | No. of
Beds/
Units | | Interest
Rate | | Average
Months to
Maturity | | Original
Face Amount of
Mortgage Loans | | Current
Carrying
Amount of
Mortgage Loans | | Current
Annual Debt
Service(2) | | | No. of
SNFs | | No. of
ALFs | | No. of
ROCs | | No. of
Beds/ Units | | Interest
Rate | | Average
Months to
Maturity | | Original
Face Amount
of Mortgage Loans | | Gross
Investment | | Current
Annual Debt
Service(1) | |
|---|
California | | 1 | | — | | 1 | | 297 | | 11.25%-11.30% | | 24 | | $ | 6,800 | | $ | 3,317 | | $ | 852 | | | — | | — | | 1 | | 173 | | 11.50% | | 15 | | $ | 4,700 | | $ | 2,602 | | $ | 580 | |
Florida | | 4 | | 1 | | — | | 387 | | 10.88%-14.63% | | 15 | | 11,360 | | 9,650 | | 1,472 | | | 3 | | 1 | | — | | 310 | | 11.13%-11.90% | | 11 | | 7,850 | | 7,111 | | 983 | |
Iowa | | — | | 1 | | — | | 44 | | 11.44% | | 22 | | 2,400 | | 2,074 | | 276 | | |
Michigan | | | 15 | | — | | — | | 2,092 | | 9.53% | | 358 | | 124,387 | | 124,387 | | 11,854 | |
Missouri | | 2 | | — | | — | | 190 | | 10.51%-10.98% | | 75 | | 3,000 | | 3,838 | | 646 | | | 2 | | — | | — | | 190 | | 10.76%-11.23% | | 49 | | 3,000 | | 3,343 | | 653 | |
Montana | | — | | 1 | | — | | 34 | | 14.23% | | 22 | | 2,346 | | 2,115 | | 331 | | |
Nebraska | | — | | 4 | | — | | 163 | | 11.44%-11.67% | | 22 | | 10,911 | | 9,211 | | 1,239 | | |
Oklahoma | | — | | — | | — | | — | | — | | — | | 1,300 | | 385 | (3) | | — | | |
S. Dakota | | — | | 1 | | — | | 34 | | 11.44% | | 22 | | 2,346 | | 2,028 | | 269 | | |
Pennsylvania | | | — | | 1 | | — | | 70 | | 7.00% | | 12 | | 5,100 | | 5,100 | | 362 | |
Texas | | 11 | | 6 | | — | | 1,471 | | 9.95%-13.32% | | 41 | | 26,865 | | 18,015 | | 3,206 | | | 9 | | 6 | | — | | 1,208 | | 10.25%-13.57% | | 48 | | 23,815 | | 15,144 | | 2,851 | |
Utah | | 1 | | — | | — | | 84 | | 10.30% | | 95 | | 1,400 | | 1,330 | | 166 | | | 1 | | — | | — | | 84 | | 10.60% | | 71 | | 1,400 | | 1,271 | | 169 | |
Washington | | 1 | | — | | — | | 104 | | 13.38% | | 58 | | 1,700 | | 847 | | 236 | | | 1 | | — | | — | | 104 | | 13.63% | | 34 | | 1,700 | | 567 | | 237 | |
Wisconsin | | 1 | | — | | — | | 115 | | 11.00% | | 62 | | 2,200 | | 1,192 | | 272 | | | 1 | | — | | — | | 106 | | 10.10% | | 107 | | 2,619 | | 7,590 | | 755 | |
| | | | | | | | | | | | | | | | | | | | | | | | | | | | | | | | | | | | | |
| | | | | | | | | | | | | | | | | | | | | |
TOTAL | | 21 | | 14 | | 1 | | 2,923 | | | | 37 | | $ | 72,628 | | $ | 54,002 | (4) | $ | 8,965 | | | 32 | | 8 | | 1 | | 4,337 | | | | 279 | | $ | 174,571 | | $ | 167,115 | | $ | 18,444 | |
| | | | | | | | | | | | | | | | | | | | | | | | | | | | | | | | | | | | | |
| | | | | | | | | | | | | | | | | | | | | |
| | | | | | | | | | | | | | | | | | | | | |
| | | | | | | | | | | | | | | | | | | | | |
- (1)
Other represents other senior housing properties consisting of independent living properties and properties providing any combination of skilled nursing, assisted living and/or independent living services.
(2)- Includes principal and interest payments.
(3)Represents a mortgage loan secured by land which was fully reserved during 2010.
(4)Of the total current principal balance, $28,132 relates to investments in skilled nursing properties, $22,776 relates to investments in assisted living properties and $3,094 relates to an investment in other senior housing properties. This balance is gross of a loan loss reserve of $921 and includes discounts and premiums related to loans acquired in prior years totaling $30.
Item 3. LEGAL PROCEEDINGS
We are from time to time a party to various general and professional liability claims and lawsuits asserted against the lessees or borrowers of our properties, which in our opinion are not singularly or in the aggregate material to our results of operations or financial condition. These types of claims and lawsuits may include matters involving general or professional liability, which we believe under applicable legal principles are not our responsibility as a non-possessory landlord or mortgage holder. We believe that these matters are the responsibility of our lessees and borrowers pursuant to general legal principles and pursuant to insurance and indemnification provisions in the applicable leases or mortgages. We intend to continue to vigorously defend such claims.
Item 4. MINE SAFETY DISCLOSURES
Not applicable
PART II
Item 5. MARKET FOR THE REGISTRANT'S COMMON EQUITY, RELATED STOCKHOLDER MATTERS AND ISSUER PURCHASES OF EQUITY SECURITIES
Market Information
Our common stock is listed on the NYSE under the symbol "LTC". Set forth below are the high and low reported sale prices for our common stock as reported on the NYSE for each of the periods indicated.
| | | | | | | | | | | | | |
| | 2011 | | 2010 | |
|---|
| | High | | Low | | High | | Low | |
|---|
First Quarter | | $ | 29.48 | | $ | 27.01 | | $ | 28.10 | | $ | 24.52 | |
Second Quarter | | $ | 30.14 | | $ | 26.51 | | $ | 28.76 | | $ | 23.13 | |
Third Quarter | | $ | 28.85 | | $ | 20.41 | | $ | 26.06 | | $ | 22.91 | |
Fourth Quarter | | $ | 31.38 | | $ | 23.75 | | $ | 28.66 | | $ | 25.37 | |
| | | | | | | | | | | | | |
| | 2013 | | 2012 | |
|---|
| | High | | Low | | High | | Low | |
|---|
First quarter | | $ | 40.80 | | $ | 35.58 | | $ | 32.82 | | $ | 30.13 | |
Second quarter | | $ | 48.69 | | $ | 36.12 | | $ | 36.42 | | $ | 30.96 | |
Third quarter | | $ | 41.84 | | $ | 34.30 | | $ | 37.93 | | $ | 31.65 | |
Fourth quarter | | $ | 40.68 | | $ | 34.88 | | $ | 35.32 | | $ | 30.48 | |
Holders of Record
As of December 31, 20112013 we had approximately 321281 stockholders of record of our common stock.
Dividend Information
We declared and paid total cash distributions on common stock as set forth below:
| | | | | | | | | | | | | |
| | Declared | | Paid | |
|---|
| | 2011 | | 2010 | | 2011 | | 2010 | |
|---|
First Quarter | | $ | 0.42 | | $ | 0.39 | | $ | 0.42 | | $ | 0.39 | |
Second Quarter | | $ | 0.42 | | $ | 0.39 | | $ | 0.42 | | $ | 0.39 | |
Third Quarter | | $ | 0.42 | | $ | 0.39 | | $ | 0.42 | | $ | 0.39 | |
Fourth Quarter | | $ | 0.42 | | $ | 0.41 | | $ | 0.42 | | $ | 0.41 | |
| | | | | | | | | | |
| | $ | 1.68 | | $ | 1.58 | | $ | 1.68 | | $ | 1.58 | |
| | | | | | | | | | |
| | | | | | | | | | | | | |
| | Declared | | Paid | |
|---|
| | 2013 | | 2012 | | 2013 | | 2012 | |
|---|
First quarter | | $ | 0.465 | | $ | 0.435 | | $ | 0.465 | | $ | 0.435 | |
Second quarter | | $ | 0.465 | | $ | 0.435 | | $ | 0.465 | | $ | 0.435 | |
Third quarter | | $ | 0.465 | | $ | 0.455 | | $ | 0.465 | | $ | 0.455 | |
Fourth quarter | | $ | 0.510 | | $ | 0.465 | | $ | 0.510 | | $ | 0.465 | |
| | | | | | | | | | |
| | | | | | | | | | | | | | |
| | $ | 1.905 | | $ | 1.790 | | $ | 1.905 | | $ | 1.790 | |
| | | | | | | | | | |
| | | | | | | | | | | | | | |
| | | | | | | | | | | | | | |
| | | | | | | | | | |
We intend to distribute to our stockholders an amount at least sufficient to satisfy the distribution requirements of a REIT. Cash flows from operating activities available for distribution to stockholders will be derived primarily from interest and rental payments from our real estate investments. All distributions will be made subject to approval of our Board of Directors and will depend on our earnings, our financial condition and such other factors as our Board of Directors deem relevant. In order to qualify for the beneficial tax treatment accorded to REITs by Sections 856 through 860 of the Internal Revenue Code, we are required to make distributions to holders of our shares equal to at least 90% of our REIT taxable income. (See "Annual Distribution Requirements" beginning on page 17..)
Issuer Purchases of Equity Securities
Our BoardThe number of Directors authorized a share repurchase program enabling us to repurchase up to 5,000,000 shares of our equity securities, including commonCommon Stock purchased and preferred stock on the open market. This authorization does not expire until 5,000,000 shares of our equity securities have been repurchased oraverage prices paid per share for each month in the Board of Directors terminates its authorization. During the fourth quarter ended December 31, 2011,2013 are as follows:
| | | | | | | | | | | | | |
Period | | Total Number
of Shares
Purchased(1) | | Average
Price
Paid per
Share | | Total Number
of Shares
Purchased as
Part of
Publicly
Announced
Plan(2) | | Maximum
Number of
Shares that May
Yet Be
Purchased
Under the Plan | |
|---|
October 1 - October 31, 2013 | | | — | | $ | — | | | — | | | — | |
November 1 - November 30, 2013 | | | — | | $ | — | | | — | | | — | |
December 1 - December 31, 2013 | | | 6,325 | | $ | 36.13 | | | — | | | — | |
| | | | | | | | | | | | |
| | | | | | | | | | | | | | |
Total | | | 6,325 | | | | | | — | | | | |
| | | | | | | | | | | | |
| | | | | | | | | | | | | | |
- (1)
- During the three months ended December 31, 2013, we
did not repurchase anyacquired shares of our outstanding common stock held by employees who tendered owned shares to satisfy tax withholding obligations. - (2)
- No shares were purchased as part of publicly announced plans or
preferred securities. Since inception of our existing share repurchase program through December 31, 2011, we have repurchased on the open market (i) 893,979 shares of our common stock at an average cost of $21.01 per share, including fees and costs, for an aggregate purchase price including fees and costs paid of
programs.
$18.8 million and (ii) 745,784 shares of our Series F preferred stock at an average cost of $21.83 per share, including fees and costs, for an aggregate purchase price including fees and costs paid of $16.3 million. We continue to have authorization to purchase on the open market an additional 3,360,237 shares of our equity securities.
Stock Performance Graph
The National Association of Real Estate Investment Trusts (or NAREIT), an organization representing U.S. REITs and publicly traded real estate companies, classifies a company with 75% or more of assets directly or indirectly in the equity ownership of real estate as an equity REIT. In 2011,2013, our equity ownership of real estate assets was more than 75%.
This graph compares the cumulative total stockholder return on our common stock from December 31, 20062008 to December 31, 20112013 with the cumulative stockholder total return of (1) the Standard & Poor's 500 Stock Index and (2) the NAREIT Equity REIT Index. The comparison assumes $100 was invested on December 31, 20062008 in our common stock and in each of the foregoing indices and assumes the reinvestment of dividends.
Total Return Performance
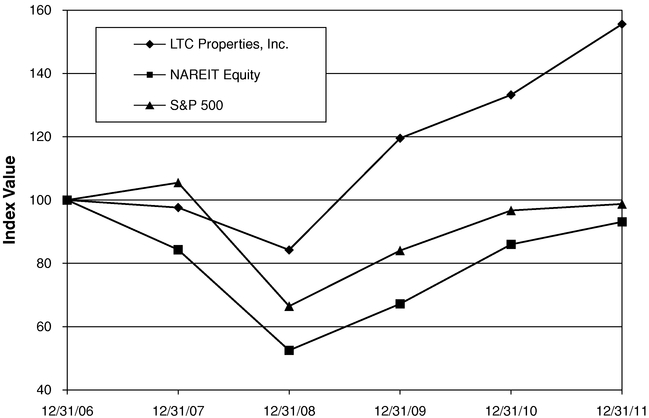
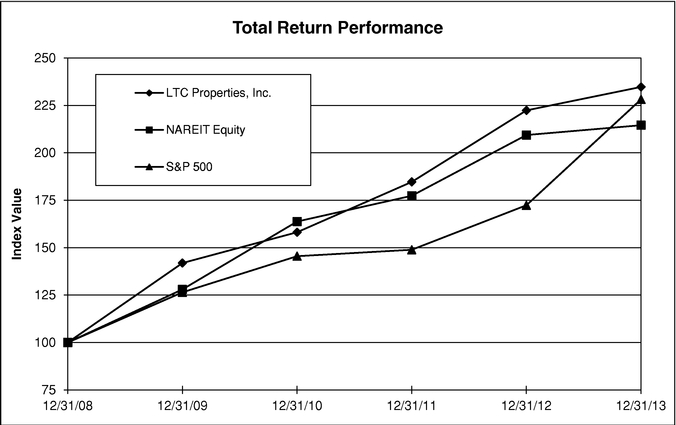
|
| | Period Ending | | | Period Ending | |
|---|
Index | | 12/31/06 | | 12/31/07 | | 12/31/08 | | 12/31/09 | | 12/31/10 | | 12/31/11 | | | 12/31/08 | | 12/31/09 | | 12/31/10 | | 12/31/11 | | 12/31/12 | | 12/31/13 | |
|---|
LTC Properties, Inc. | | 100.00 | | 97.62 | | 84.24 | | 119.54 | | 133.23 | | 155.58 | | | 100.00 | | 141.90 | | 158.14 | | 184.67 | | 222.38 | | 234.75 | |
NAREIT Equity | | 100.00 | | 84.31 | | 52.50 | | 67.20 | | 85.98 | | 93.11 | | | 100.00 | | 127.99 | | 163.78 | | 177.36 | | 209.39 | | 214.56 | |
S&P 500 | | 100.00 | | 105.49 | | 66.46 | | 84.05 | | 96.71 | | 98.76 | | | 100.00 | | 126.46 | | 145.51 | | 148.59 | | 172.37 | | 228.19 | |
The stock performance depicted in the above graph is not necessarily indicative of future performance.
The stock performance graph shall not be deemed incorporated by reference into any filing by us under the Securities Act of 1933 or the Securities Exchange Act of 1934 except to the extent that we specifically incorporate such information by reference, and shall not otherwise be deemed filed under such Acts.
Item 6. SELECTED FINANCIAL DATA
The following table of selected financial information should be read in conjunction with our financial statements and related notes thereto included elsewhere in this Annual Report on Form 10-K.
|
| | 2011 | | 2010 | | 2009 | | 2008 | | 2007 | | | 2013 | | 2012 | | 2011 | | 2010 | | 2009 | |
|---|
| | (In thousands, except per share amounts)
| | | (In thousands, except per share amounts)
| |
|---|
Operating Information: | | |
Operating information: | | | | | | | | | | | | |
Total revenues | | $ | 85,160 | | $ | 73,696 | | $ | 68,794 | | $ | 68,839 | | $ | 74,304 | | | $ | 104,974 | | $ | 92,482 | | $ | 83,618 | | $ | 72,740 | | $ | 67,808 | |
Income from continuing operations | | 49,673 | | 45,860 | | 44,473 | | 43,056 | | 47,803 | | | 55,405 | | 50,306 | | 48,620 | | 44,851 | | 43,538 | |
Income allocated to non-controlling interests | | 191 | | 191 | | 296 | | 307 | | 343 | | | — | | 37 | | 191 | | 191 | | 296 | |
Income allocated to participating securities | | 342 | | 230 | | 139 | | 159 | | 219 | | | 383 | | 377 | | 342 | | 230 | | 139 | |
Income allocated to preferred stockholders(5)(2) | | 9,078 | | 16,045 | | 14,515 | | 14,401 | | 16,923 | | | 3,273 | | 3,273 | | 9,078 | | 16,045 | | 14,515 | |
Net income allocable to common stockholders | | 39,832 | | 29,587 | | 29,410 | | 28,417 | | 30,613 | | |
Per share Information: | | |
Net Income per Common Share from Continuing Operations Allocable to Common Stockholders: | | |
Net income available to common stockholders | | | 54,159 | | 47,640 | | 39,832 | | 29,587 | | 29,410 | |
Per share information: | | |
| |
| |
| |
| |
| |
Net income per common share from continuing operations available to common stockholders: | | | | | | | | | | | | |
Basic | | $ | 1.37 | | $ | 1.20 | | $ | 1.28 | | $ | 1.23 | | $ | 1.31 | | | $ | 1.56 | | $ | 1.54 | | $ | 1.34 | | $ | 1.16 | | $ | 1.24 | |
| | | | | | | | | | | | | |
| | | | | | | | | | | | | |
| | | | | | | | | | | | | |
| | | | | | | | | | | | | | | | | | | | | | | |
Diluted | | $ | 1.37 | | $ | 1.20 | | $ | 1.28 | | $ | 1.23 | | $ | 1.29 | | | $ | 1.56 | | $ | 1.54 | | $ | 1.33 | | $ | 1.16 | | $ | 1.24 | |
| | | | | | | | | | | | | | | | | | | | | | | |
Net Income Per Common Share Allocable to Common Stockholders: | | |
| | | | | | | | | | | | | |
| | | | | | | | | | | | | |
| | | | | | | | | | | | | |
Net income per common share available to common stockholders: | | | | | | | | | | | | |
Basic | | $ | 1.36 | | $ | 1.21 | | $ | 1.27 | | $ | 1.24 | | $ | 1.32 | | | $ | 1.64 | | $ | 1.58 | | $ | 1.36 | | $ | 1.21 | | $ | 1.27 | |
| | | | | | | | | | | | | |
| | | | | | | | | | | | | |
| | | | | | | | | | | | | |
| | | | | | | | | | | | | | | | | | | | | | | |
Diluted | | $ | 1.36 | | $ | 1.21 | | $ | 1.27 | | $ | 1.24 | | $ | 1.31 | | | $ | 1.63 | | $ | 1.57 | | $ | 1.36 | | $ | 1.21 | | $ | 1.27 | |
| | | | | | | | | | | | | | | | | | | | | | | |
Common Stock Distributions declared | | $ | 1.68 | | $ | 1.58 | | $ | 1.56 | | $ | 1.56 | | $ | 1.50 | | |
| | | | | | | | | | | | | |
| | | | | | | | | | | | | |
| | | | | | | | | | | | | | | | | | | | | | | |
Common Stock Distributions paid | | $ | 1.68 | | $ | 1.58 | | $ | 1.56 | | $ | 1.56 | | $ | 1.50 | | |
Common stock distributions declared | | | $ | 1.91 | | $ | 1.79 | | $ | 1.68 | | $ | 1.58 | | $ | 1.56 | |
| | | | | | | | | | | | | | | | | | | | | | | |
Balance Sheet Information: | | |
| | | | | | | | | | | | | |
| | | | | | | | | | | | | |
| | | | | | | | | | | | | |
Common stock distributions paid | | | $ | 1.91 | | $ | 1.79 | | $ | 1.68 | | $ | 1.58 | | $ | 1.56 | |
| | | | | | | | | | | | | |
| | | | | | | | | | | | | |
| | | | | | | | | | | | | |
| | | | | | | | | | | | | |
Balance sheet information: | | | | | | | | | | | | |
Total assets | | $ | 647,097 | | $ | 561,264 | | $ | 490,593 | | $ | 506,053 | | $ | 544,105 | | | $ | 931,410 | | $ | 789,592 | | $ | 647,097 | | $ | 561,264 | | $ | 490,593 | |
Total debt(1) | | 159,200 | (4) | | 91,430 | (4) | | 25,410 | (3) | | 36,753 | (2) | | 52,295 | | |
Total debt(3) | | | 278,835 | (4) | | 303,935 | (5) | | 159,200 | (5) | | 91,430 | (5) | | 25,410 | |
- (1)
Includes bank borrowings, senior unsecured notes, mortgage loans payable and bonds payable.
(2)LowerDecrease due to the pay off during 2008conversion of a mortgage loan112,588 partnership units and 67,294 partnership units in the amount of $14.2 million secured by four assisted living properties.
2012 and 2009, respectively. During 2011 and 2010, there were no partnership conversions. During 2013, we had no limited partners.(3)Lower due to the pay off during 2009 of three mortgage loans totaling $23.9 million secured by 11 assisted living properties partially offset by outstanding bank borrowings of $13.5 million.
(4)Increase due to the sale of the senior unsecured term notes and additional bank borrowing to fund real estate acquisitions.
(5)(2)- Income allocated to preferred stockholders includes the following(dollar amounts in thousands):
| | | | | | | | | | | | | | | | |
| | 2011 | | 2010 | | 2009 | | 2008 | | 2007 | |
|---|
Preferred stock dividends | | $ | 5,512 | | $ | 13,662 | | $ | 15,141 | | $ | 15,390 | | $ | 16,923 | |
Preferred stock redemption charge | | | 3,566 | | | 2,383 | | | — | | | — | | | — | |
Allocation of income from preferred stock buyback | | | — | | | — | | | (626 | ) | | (989 | ) | | — | |
| | | | | | | | | | | | |
Total income allocated to preferred stockholders | | $ | 9,078 | | $ | 16,045 | | $ | 14,515 | | $ | 14,401 | | $ | 16,923 | |
| | | | | | | | | | | | |
| | | | | | | | | | | | | | | | | |
| |
| | 2013 | | 2012 | | 2011 | | 2010 | | 2009 | |
|---|
| | Preferred stock dividends | | $ | 3,273 | | $ | 3,273 | | $ | 5,512 | | $ | 13,662 | | $ | 15,141 | |
| | Preferred stock redemption charge | | | — | | | — | | | 3,566 | | | 2,383 | | | — | |
| | Allocation of income from preferred stock buyback | | | — | | | — | | | — | | | — | | | (626 | ) |
| | | | | | | | | | | | | |
| | | | | | | | | | | | | | | | | | |
| | Total income allocated to preferred stockholders | | $ | 3,273 | | $ | 3,273 | | $ | 9,078 | | $ | 16,045 | | $ | 14,515 | |
| | | | | | | | | | | | | |
| | | | | | | | | | | | | | | | | | |
| | | | | | | | | | | | | | | | | | |
| | | | | | | | | | | | | |
- (3)
- Includes bank borrowings, senior unsecured notes, mortgage loans payable and bonds payable.
- (4)
- Decrease due to the sale of 4,025,000 shares of common stock resulting in net proceeds of $171,365 that were used to pay down debt, fund acquisitions, development and general corporate purposes.
- (5)
- Increase due to the sale of senior unsecured term notes and additional bank borrowing to fund real estate acquisitions.
Item 7. MANAGEMENT'S DISCUSSION AND ANALYSIS OF FINANCIAL CONDITION AND RESULTS OF OPERATIONS
Executive Overview
Business
We are a self-administered health care real estate investment trust (or REIT) that invests primarily in senior housing and long term care properties through acquisitions, development, mortgage loans property lease transactions and other investments. We conduct and manage our business as one operating segment, rather than multiple operating segments, for internal reporting and internal decision making purposes. In 2011,2013, senior housing and long term care properties, which include skilled nursing properties, assisted living properties, independent living properties, memory care properties and combinations thereof comprised approximately 98%98.8% of our investment portfolio. The following table summarizes our real estate investment portfolio as of December 31, 20112013(dollar amounts in thousands):
| | | | | | | | | | | | | | | | | | | | | | | | | | | | |
| |
| |
| | Twelve Months Ended
December 31, 2011 | |
| |
| | Number of | |
|---|
Type of Property | | Gross
Investments | | Percentage of
Investments | | Rental
Income(1) | | Interest
Income(2) | | Percentage
of
Revenues(3) | | Number
of
Properties(4) | | SNF
Beds(5) | | ALF
Units(5) | | ILF
Units(5) | |
|---|
Assisted Living | | $ | 308,757 | | | 39.6 | % | $ | 33,172 | | $ | 2,596 | | | 42.6 | % | | 102 | | | — | | | 4,365 | | | — | |
Skilled Nursing | | | 389,458 | | | 50.0 | % | | 35,579 | | | 3,447 | | | 46.4 | % | | 89 | | | 10,347 | | | — | | | — | |
Other Senior Housing(6) | | | 67,732 | | | 8.7 | % | | 7,543 | | | 368 | | | 9.4 | % | | 14 | | | 913 | | | 330 | | | 423 | |
Schools | | | 12,192 | | | 1.6 | % | | 1,349 | | | — | | | 1.6 | % | | 2 | | | — | | | — | | | — | |
Under Development(7) | | | 894 | | | 0.1 | % | | — | | | — | | | 0.00 | % | | — | | | — | | | — | | | — | |
| | | | | | | | | | | | | | | | | | | | |
Totals | | $ | 779,033 | | | 100.0 | % | $ | 77,643 | | $ | 6,411 | | | 100.0 | % | | 207 | | | 11,260 | | | 4,695 | | | 423 | |
| | | | | | | | | | | | | | | | | | | | |
| | | | | | | | | | | | | | | | | | | | | | | | | |
| |
| |
| | Twelve Months
Ended
December 31, 2013 | |
| |
| | Number of | |
|---|
Type of Property | | Gross
Investments | | Percentage of
Investments | | Rental
Income | | Interest
Income(1) | | Percentage
of
Revenues(2) | | Number
of
Properties(3) | | SNF
Beds(4) | | ALF
Units(4) | |
|---|
Skilled Nursing(5) | | $ | 611,160 | | | 55.3 | % | $ | 50,046 | | $ | 4,881 | | | 52.6 | % | | 100 | | | 12,217 | | | — | |
Assisted Living | | | 412,024 | | | 37.3 | % | | 41,641 | | | 1,103 | | | 40.9 | % | | 106 | | | — | | | 4,852 | |
Range of Care | | | 46,509 | | | 4.2 | % | | 4,904 | | | 314 | | | 5.0 | % | | 9 | | | 733 | | | 348 | |
Under Development(6) | | | 21,432 | | | 2.0 | % | | — | | | — | | | 0.0 | % | | — | | | — | | | — | |
Other(7) | | | 13,607 | | | 1.2 | % | | 1,575 | | | — | | | 1.5 | % | | 2 | | | — | | | — | |
| | | | | | | | | | | | | | | | | | |
| | | | | | | | | | | | | | | | | | | | | | | | | | |
Totals | | $ | 1,104,732 | | | 100.0 | % | $ | 98,166 | | $ | 6,298 | | | 100.0 | % | | 217 | | | 12,950 | | | 5,200 | |
| | | | | | | | | | | | | | | | | | |
| | | | | | | | | | | | | | | | | | | | | | | | | | |
| | | | | | | | | | | | | | | | | | | | | | | | | | |
| | | | | | | | | | | | | | | | | | |
- (1)
Includes rental income from properties classified as held-for-sale.
(2)- Includes interest income from mortgage loans.
(3)(2)- Includes rental income and interest income from mortgage loans.
(4)(3)- We have investments in 30 states leased or mortgaged to
4140 different operators.
(5)(4)- SeeItem 2. Properties for discussion of bed/unit count.
(6)(5)Other senior housing properties consist of independent living propertiesIncludes a mortgage and properties providing any combination ofconstruction loan secured by a currently operating skilled nursing assisted living and/or independent living services.
(7)During 2011, we acquired a vacantproperty and parcel of land in Texasupon which a 106-bed replacement property is being constructed.- (6)
- Includes three MC developments with a total of 168 units, a combination ALF and
entered intoMC development with 81 units, and a commitment to fund the constructionSNF development with 143 beds. - (7)
- Includes two school properties and four parcels of
a skilled nursing property with 120 beds which will replace an existing 90-bed skilled nursing property.land held-for-use.
As of December 31, 20112013 we had $599.9$884.4 million in carrying value of net real estate investment, consisting of $546.8$718.9 million or 91.1%81.3% invested in owned and leased properties and $53.1$165.4 million or 8.9%18.7% invested in mortgage loans secured by first mortgages.
For the year ended December 31, 2011,2013, rental income and interest income from mortgage loans excluding discontinued operations represented 91.2%93.5% and 7.5%6.0%, respectively, of total gross revenues. In most instances, our lease structure contains fixed or estimable annual rental escalations, which are generally recognized on a straight-line basis over the minimum lease period. Certain leases have annual rental escalations that are contingent upon changes in the Consumer Price Index and/or changes in the gross operating revenues of the property. This revenue is not recognized until the appropriate contingencies have been resolved. This lease structure initially generates lower revenues and net income but enables us to generate additional growth and minimize non-cash straight-line rent over time. For the years ended December 31, 2011, 20102013, 2012 and 20092011 we recorded $4.0 million, $3.3 million and $3.7 million, $3.8 million, and $4.2 million,
respectively, in straight-line rental income. Also during 2011, 20102013, 2012 and 20092011 we recorded $46,000, $0.8 million$37,000, $38,000 and $0.8 million,$46,000, respectively, of straight-line rent receivable reserve. Straight-line rental income forDuring the fourth quarter of 2013, we wrote-off a $0.9 million straight-line rent receivable balance related to the transition of four assisted living properties to a new lessee. For the remaining leases in place at December 31, 2011 are projected to decrease from $3.7 million in 2011 to $2.4 million in 2012 assuming no new leased investments with fixed annual rental escalations are added to our portfolio. Conversely, our cash rental income is projected to increase from $74.6 million in 2011 to $81.1 million in 20122013, assuming no modification or replacement of existing leases and no new leased investments are added to our portfolio.portfolio, we currently expect that straight-line rental income will decrease from $3.9 million in 2013 to $2.2 million for projected annual 2014 and, conversely, our cash
rental income is projected to increase from $96.0 million in 2013 to $97.5 million for projected annual 2014. During the year ended December 31, 2011,2013, we received $74.6$96.0 million of cash rental revenue and recorded $0.7 million of lease inducement costs. At December 31, 20112013 and 2010,2012, the straight-line rent receivable balance, net of reserves, for continuing and discontinued operations on the consolidated balance sheet was $23.8$29.8 million and $20.1$26.8 million, respectively. Many of our existing leases contain renewal options that could, in the future, renew above or below current rent rates. For the year ended December 31, 2013, we renewed five leases at rates similar to existing rates by either i) amending the lease to extend the term and assign the lease to a new operator, ii) combining individual leases into a master lease with no change to the term, iii) combing an individual lease into a master lease and extending the term, iv) amending a lease to extend the term or v) combining two master leases into one master lease with no change to the term.
Our primary objectives are to create, sustain and enhance stockholder equity value and provide current income for distribution to stockholders through real estate investments in senior housing and long term care properties managed by experienced operators. To meet these objectives, we attempt to invest in properties that provide opportunity for additional value and current returns to our stockholders and diversify our investment portfolio by geographic location, operator, property type and form of investment. We opportunistically consider investments in health care propertiesfacilities in related businesses where the business model is similar to our existing model and the opportunity provides an attractive expected return. Consistent with this strategy, we pursue, from time to time, opportunities for potential acquisitions and investments, with due diligence and negotiations often at different stages of development at any particular time.
- •
- With respect to skilled nursing properties, we attempt to invest in properties that do not have to rely on a high percentage of private-pay patients. We
seek to invest primarily in properties that are located in communities with viable and sustainable economic and demographic trends whether located in primary, secondary or tertiary markets. We prefer to invest in a property that has significant market presence in its community and where state certificate of need and/or licensing procedures limit the entry of competing properties.
- •
- For assisted living and independent living investments we have attempted to diversify our portfolio both geographically and across product levels.
Thus, we believe
- •
- Memory care facilities offer specialized options for seniors with Alzheimer's disease and other forms of dementia. Purpose built, free-standing memory care facilities offer an attractive alternative for private-pay residents affected by memory loss in comparison to other accommodations that
althoughtypically have been provided within a secured unit of an assisted living or skilled nursing facility. These facilities offer dedicated care and specialized programming for various conditions relating to memory loss in a secured environment that is typically smaller in scale and more residential in nature than traditional assisted living facilities. Residents require a higher level of care and more assistance with activities of daily living than in assisted living facilities. Therefore, these facilities have staff available 24 hours a day to respond to the majorityunique needs of our investments are in affordably priced units, our portfolio also includes a significant number of upscale units in appropriate markets with certain operators.their residents.
Substantially all of our revenues and sources of cash flows from operations are derived from operating lease rentals and interest earned on outstanding loans receivable. Our investments in owned properties and mortgage loans and owned properties represent our primary source of liquidity to fund distributions and are dependent upon the performance of the operators on their lease and loan obligations and the rates earned thereon. To the extent that the operators experience operating difficulties and are unable to generate sufficient cash to make payments to us, there could be a material adverse impact on our consolidated results of operations, liquidity and/or financial condition. To mitigate this risk, we monitor our investments through a variety of methods determined by the type of health care facility and operator. Our monitoring process includes periodic review of financial statements for each facility, periodic review of operator credit, scheduled property inspections and review of lease or loan covenant compliance relating to real estate taxes and insurance.compliance.
In addition to our monitoring and research efforts, we also structure our investments to help mitigate payment risk. Prior to 2008 we might have financed up to 90 percent of the stabilized market value of a property. Due to recent market uncertainties we most likely will finance at a lower percentage. Some operating leases and loans are credit enhanced by guaranties and/or letters of credit. In addition, operating leases are typically structured as master leases and loans are generally cross-
defaultedcross-defaulted and cross-collateralized with other loans, operating leases or agreements between us and the operator and its affiliates.
Depending upon the availability and cost of external capital, we anticipate making additional investments in health care related properties. New investments are generally initially funded from cash on hand, and temporary borrowings under our unsecured revolving line of credit and internally generated cash flows. Our investments generate internal cash from rent and interest receipts and principal payments on mortgage loans receivable. Permanent financing for future investments, which replaces funds drawn under our unsecured revolving line of credit, is expected to be provided through a combination of public and private offerings of debt and equity securities and secured and unsecured debt financing. The timing, source and amount of cash flows provided by financing activities and used in investing activities are sensitive to the capital markets environment, especially to changes in interest rates. Changes in the capital marketsmarkets' environment may impact the availability of cost-effective capital. We believe our liquidity and various sources of available capital are sufficient to fund operations, meet debt service obligations (both principal and interest), make dividend distributions and finance future investments.
We believe our business model has enabled and will continue to enable us to maintain the integrity of our property investments, including in response to financial difficulties that may be experienced by operators. Traditionally, we have taken a conservative approach to managing our business, choosing to maintain liquidity and exercise patience until favorable investment opportunities arise.
At December 31, 2011,2013, we had $4.4$6.8 million of cash on hand, $154.0$219.0 million available onunder our $210.0$240.0 million Unsecured Credit Agreement,unsecured revolving line of credit, and $100.0$30.0 million available under the uncommitted private shelf agreement. Also, ourSubsequent to December 31, 2013, we borrowed $11.5 million and, therefore, have $207.5 million available under or unsecured revolving line of credit. We also have the potential ability to access the capital markets through the issuance of $64.6 million of common stock under our Amended Equity Distribution Agreement and through the issuance of debt and/or equity securities under our $167.6$800.0 million effective shelf registration. As a result, we believe our liquidity and various sources of available capital are sufficient to fund operations and development commitments, meet debt service obligations (both principal and interest), make dividend distributions and finance some future investments should we determine such future investments are financially feasible.
Key Transactions
Owned Properties. The following table summarizes our acquisitions during 2011 (dollars amounts in thousands):
| | | | | | | | | | | | | | | | | | | | | | |
| |
| |
| |
| |
| | Number of | |
|---|
Type of Property | | Purchase
Price | | Transaction
Costs | | Total
Acquisition
Costs | | Number
of
Properties | | SNF
Beds | | ALF
Units | | ILF
Units | |
|---|
Skilled Nursing(2)(3)(4)(5) | | $ | 93,841 | | $ | 330 | | $ | 94,171 | | | 7 | | | 1,016 | | | — | | | — | |
Other Senior Housing(1)(6) | | | 11,450 | | | 34 | | | 11,484 | | | 2 | | | 118 | | | 40 | | | 53 | |
Land(2) | | | 844 | | | 11 | | | 855 | | | — | | | — | | | — | | | — | |
| | | | | | | | | | | | | | | | |
Totals | | $ | 106,135 | | $ | 375 | | $ | 106,510 | | | 9 | | | 1,134 | | | 40 | | | 53 | |
| | | | | | | | | | | | | | | | |
(1)Other senior housing properties consist of independent living properties and properties providing any combination of skilled nursing, assisted living and/or independent living services.
(2)We acquired a 196-bed skilled nursing property and a vacant parcel of land in Texas for a purchase price of $15,500 and $844, respectively. Simultaneous with the purchases,During 2013, we entered into a commitment, in an amount not to exceed $8,250, to fund the construction ofpurchased a 120-bed skilled nursing property onin Florida for $14.4 million. The property was included in a master lease at an incremental initial cash yield of 8.75%. The operator previously leased four properties with a total of 596 beds/units from us. The new master lease contains all five properties with a total of 716 beds/units and has a GAAP yield of 10.7%. The initial lease term is 10 years with two 5-year renewal options and annual rent escalations of 2.2%. During 2013, we completed the acquired parcelconstruction and opened of land which will replace a 90-bed60-unit memory care property in Colorado, a 120-bed skilled nursing property in Texas and a 77-unit combination assisted living and memory care property in Kansas. The new 120-bed skilled nursing property replaces a skilled nursing property in our existing portfolio. Upon completion During 2013, we entered into development commitments totaling $19.6 million with an existing operator to fund the purchase of theland and construction the lessee intends to relocate the residents to the newly constructed property. Theseof two free-standing memory care properties are leased to an operator within our existing portfolio pursuant towith a 10-year master lease agreement at a GAAP
yieldtotal of 11.0%. The master lease contains annual escalations108 units in Colorado. In conjunction with such commitments, we closed on two parcels of 2.5% and has two 5-year renewal options.
(3)We purchased a 140-bed skilled nursing property located in Texasland for an aggregate purchase price of $10,000. Simultaneous with$2.1 million which were simultaneously added to the purchase, we added the property to an existing master lease agreement with a third party operatorthe operator. Rent at an incremental GAAP yieldinitial annual rate of 10.5%.
(4)We purchased four skilled nursing properties with 524 beds in Texas for $50,841 which consists of $41,000 in cash at closing with the remainder in the form of contingent earn-out payments. The contingent earn-out payment arrangements require us to pay two earn-out payments totalling up to $11,0009.25% will commence upon the properties achieving a sustainable stipulated rent coverage ratio. During 2011, we paid $4,000 related torespective project's completion date (but in no event later than December 31, 2014) and be calculated based on the first contingent earn-out payment. We estimatedland purchase price and construction costs funded for each property plus 9.0% compounded on the fair value ofland purchase price and each amount funded under the contingent earn-out payments using a discounted cash flow analysis.
(5)We purchased a 156-bed skilled nursing property located in California for $17,500 and entered into a 12-year lease with an unrelated third party. The lease has a GAAP yield of 10.3%, contains annual escalations of 2.0% and has two 10-year renewal options.
(6)We purchased two senior housing properties located in South Carolina with 118 skilled nursing beds, 40 assisted living units and 53 independent living units for $11,450. The lease has a GAAP yield of 10.1%, contains annual escalations of 2.5% and has three 5-year renewal options.
Bank Borrowings. During 2011,commitments. Also, during 2013, we entered into a new $210.0pipeline agreement with this same operator whereby we have the opportunity
to finance any senior housing development projects or acquisitions originated by the operator through May 2018 (unless earlier terminated as provided for therein) with provisions limiting, among other things, to five the number of development projects the operator may have under construction at any time. Any such projects or opportunities financed by us pursuant to the agreement will be added to the parties' master lease with the then remaining term extended by 10 years at initial lease rates estimated to range from 9.0% to 10.5% with annual escalations of 2.5%.
Mortgage Loans. During 2013, we funded a $124.4 million Unsecured Credit Agreement which provides for the opportunity to increase the credit amount up tomortgage loan with a third-party operator, Prestige Healthcare, secured by 15 properties with a total of $250.02,092 skilled nursing beds in Michigan. The loan is for a term of 30 years and bears interest at 9.53% for five years, escalating annually thereafter by 2.25%. Payments are interest-only for three years, after which the borrower will make interest payments along with annual principal payments of $1.0 million. The new Unsecured Credit Agreementloan agreement provides a revolving linefor additional forward commitments of credit with no scheduled maturities other than$12.0 million for capital improvements at 9.41% for the maturity date of April 18, 2015,first twelve months. The loan agreement also provides, under certain conditions and allows us to borrow at the same interest rates applicable to borrowings under our prior agreement, 150 basis points over LIBOR based on current leverage ratios. Financial covenants contained incertain operating metrics and valuation thresholds achieved and sustained within the new Unsecured Credit Agreement, which are measured quarterly, require us to maintain, among other things:
(i)a ratio of total indebtedness to total asset value not greater than 0.5 to 1.0;
(ii)a ratio of secured debt to total asset value not greater than 0.35 to 1.0;
(iii)a ratio of unsecured debt to the valuefirst twelve years of the unencumbered asset pool not greater than 0.6term, for additional loan proceeds of up to 1.0;$40.0 million with such proceeds limited to $10.0 million per twelve months. The borrower has a one-time option between the third and
(iv)- twelfth years to prepay up to 50% of the then outstanding loan balance without penalty. Exclusively for the purposes of this option, the properties collateralizing the loan have been separated by us into two pools of assets. If and when the option is exercised, we will identify which of the two pools we will release for prepayment and removal from portfolio of properties securing the loan. If the prepayment option is exercised and timely concluded, the borrower forfeits its opportunity to access any additional loan proceeds. Additionally, under certain circumstances, including a
ratio of EBITDA, as calculatedchange in regulatory environment, we have the new Unsecured Credit Agreement,option to fixed charges not less than 1.50 to 1.0.
purchase the properties. Senior Unsecured Notes. During 2011,2013, we sold $50.0$70.0 million aggregate principal amount of 4.8%3.99% senior unsecured notes fully amortizing to maturity on Julydue November 20, 2021 to affiliates and managed accounts of Prudential Investment Management, Inc. (individually and collectively, "Prudential"). The notes bear interest at an annual fixed rate of 3.99% and mature in 8 years with interest-only payments in the first two years and annual principal amortization thereafter. We also entered into an Amended and Restated Note Purchase and Private Shelf Agreement with Prudential which provides forused a portion of the possible issuanceproceeds to pay down our unsecured revolving line of up to an additional $100.0 million of senior unsecured fixed-rate term notes during a three-year issuance period.credit.
Common Stock.Equity. During 2011,2013, we sold 3,990,0004,025,000 shares of common stock in an underwritten public offering at a price of $27.25$44.50 per share, before fees and costs of $5.1$7.7 million, forin a public offering. The net proceeds of $103.6 million. The net proceeds$171.4 million were used to redeem all of our 8.0% Series F Cumulative Preferred Stock (or Series F preferred stock), as discussed below, and the remaining net proceeds were used to partially repaypay down amounts outstanding under our Unsecured Credit Agreement.
Preferred Stock. We redeemed 3,536,530 sharesunsecured revolving line of credit, to fund acquisitions and our Series F preferred stock, representing all of the outstanding shares. The redemption price was $25.1333 per share, including accruedcurrent development commitments and unpaid dividends up to the redemption date. Accordingly, we recognized the $3.6 million of original issue costsgeneral corporate purposes.
related to the Series F preferred stock as a preferred stock redemption charge in the consolidated income statement line item income allocated to preferred stockholders.
Key Performance Indicators, Trends and Uncertainties
We utilize several key performance indicators to evaluate the various aspects of our business. These indicators are discussed below and relate to concentration risk and credit strength. Management uses these key performance indicators to facilitate internal and external comparisons to our historical operating results in making operating decisions and for budget planning purposes.
Concentration Risk. We evaluate by gross investment our concentration risk in terms of asset mix, investment mix, operator mix and geographic mix. Concentration risk is valuable to understand what portion of our investments could be at risk if certain sectors were to experience downturns. Asset mix measures the portion of our investments that are real property or mortgage loans. In order to qualify as an equity REIT, at least 75 percent of our total assets must be represented by real estate assets, cash, cash items and government securities. Investment mix measures the portion of our investments that relate to our various property types. Operator mix measures the portion of our investments that relate to our top threefive operators. Geographic mix measures the portion of our investment that relate to our top five states.
The following table reflects our recent historical trends of concentration risk(gross investment, in thousands):
|
| | Period Ended | | | Period Ended | |
|---|
| | 12/31/11 | | 9/30/11 | | 6/30/11 | | 3/31/11 | | 12/31/10 | | | 12/31/13 | | 9/30/13 | | 6/30/13 | | 3/31/13 | | 12/31/12 | |
|---|
Asset mix: | | | | | | | | | | | | |
Real property | | $ | 725,031 | | $ | 690,458 | | $ | 679,806 | | $ | 679,616 | | $ | 615,666 | | | $ | 937,617 | | $ | 911,096 | | $ | 913,042 | | $ | 906,582 | | $ | 900,095 | |
Loans receivable | | 54,002 | | 54,987 | | 56,355 | | 58,018 | | 60,007 | | | 167,115 | | 41,079 | | 39,668 | | 40,142 | | 40,081 | |
Investment asset mix: | | |
Investment mix: | | |
| |
| |
| |
| |
| |
Skilled nursing properties | | $ | 389,458 | | $ | 357,271 | | $ | 348,195 | | $ | 349,700 | | $ | 298,734 | | | $ | 611,160 | | $ | 470,008 | | $ | 478,751 | | $ | 478,311 | | $ | 475,873 | |
Assisted living properties | | 308,757 | | 308,680 | | 308,785 | | 308,702 | | 309,129 | | | 412,024 | | 409,285 | | 406,785 | | 402,913 | | 399,391 | |
Other senior housing properties(1) | | 67,732 | | 67,302 | | 67,011 | | 67,062 | | 55,640 | | |
Schools | | 12,192 | | 12,192 | | 12,170 | | 12,170 | | 12,170 | | |
Under Development(2) | | 894 | | — | | — | | — | | — | | |
Operator asset mix: | | |
Extendicare (ALC) | | $ | 88,034 | | $ | 88,034 | | $ | 88,034 | | $ | 88,034 | | $ | 88,034 | | |
Preferred Care, Inc.(3) | | 88,309 | | 88,471 | | 88,324 | | 88,489 | | 87,685 | | |
Range of care properties | | | 46,509 | | 46,577 | | 46,643 | | 46,707 | | 46,769 | |
Under development(1) | | | 21,432 | | 13,861 | | 8,087 | | 6,349 | | 5,817 | |
Other(2)(5) | | | 13,607 | | 12,444 | | 12,444 | | 12,444 | | 12,326 | |
Operator mix: | | |
| |
| |
| |
| |
| |
Prestige Healthcare(3)(5) | | | $ | 137,739 | | $ | — | | $ | — | | $ | — | | $ | — | |
Senior Care Centers, LLC(4) | | | 114,539 | | 114,539 | | 114,539 | | 114,539 | | 114,539 | |
Extendicare & ALC | | | 88,034 | | 88,034 | | 88,034 | | 88,034 | | 88,034 | |
Juniper Communities, LLC | | | 87,088 | | 87,088 | | 87,088 | | 87,088 | | 87,088 | |
Brookdale Communities | | 84,210 | | 84,210 | | 84,210 | | 84,210 | | 84,210 | | | 84,219 | | 84,216 | | 84,212 | | 84,211 | | 84,210 | |
Remaining operators | | 518,480 | | 484,730 | | 475,593 | | 476,901 | | 415,744 | | | 593,113 | | 578,298 | | 578,837 | | 572,852 | | 566,305 | |
Geographic mix: | | |
| |
| |
| |
| |
| |
Texas | | $ | 207,760 | | $ | 191,965 | | $ | 182,317 | | $ | 183,600 | | $ | 134,366 | | | $ | 238,750 | | $ | 238,036 | | $ | 236,100 | | $ | 233,865 | | $ | 232,106 | |
Michigan(3)(5) | | | 125,550 | | — | | — | | — | | — | |
Ohio | | | 98,647 | | 98,647 | (6) | | 110,804 | | 110,804 | | 110,804 | |
Florida | | 70,217 | | 70,282 | | 70,345 | | 70,406 | | 70,466 | | | 82,079 | (7) | | 67,710 | | 67,742 | | 67,772 | | 67,802 | |
Ohio | | 56,804 | | 56,804 | | 56,804 | | 56,804 | | 56,804 | | |
California | | 52,036 | | 34,653 | | 34,767 | | 34,878 | | 34,605 | | |
New Mexico | | 48,876 | | 48,876 | | 48,876 | | 48,876 | | 48,876 | | |
New Jersey | | | 70,668 | | 70,667 | | 70,667 | | 70,667 | | 70,667 | |
Remaining states | | 343,340 | | 342,865 | | 343,052 | | 343,070 | | 330,556 | | | 489,038 | | 477,115 | | 467,397 | | 463,616 | | 458,797 | |
- (1)
Other senior housing properties consist of independent living properties and properties providing any combination of skilled nursing, assisted living and/or independent living services.
(2)- During
2011,2013, we acquired a vacant parcel of land in Texas and entered into a commitment to fundcompleted the construction of a 60-unit memory care property, a 120-bed skilled nursing property and a combination assisted living and memory care property with 120 beds which will replace an existing 90-bed77 units. Accordingly, these properties were reclassified from "Under development" to either "Skilled nursing property" or "Assisted living property," depending on the property type, for all periods presented. - (2)
- Includes two school properties and four parcels of land held-for-use.
- (3)
- During the three months ended December 31, 2013, we funded a $124,387 mortgage loan with Prestige Healthcare secured by 15 skilled nursing
property.
properties with a total of 2,092 beds in Michigan. (3)(4)PreferredDuring 2013, we entered into an amended and restated master lease agreement with Senior Care Inc. leases 23Centers, LLC (or Senior Care) to include four skilled nursing properties which were previously operated by and two other senior housing properties under two master leases and onesubleased to Senior Care but was not included in Senior Care's operator mix. Accordingly, the four skilled nursing property under a separate lease agreement. In addition, they operateproperties were reclassified from "Remaining operators" to "Senior Care Center, LLC" operator mix for all periods presented.- (5)
- During the three months ended December 31, 2013, we purchased four parcels of land located in Michigan. These parcels of land are located adjacent to properties securing the Prestige Healthcare mortgage loan and are managed by Prestige Healthcare.
- (6)
- Decrease due to the sale of six skilled nursing properties
securing five mortgage loans receivablewith a total of 230 beds. - (7)
- During the fourth quarter of December 31, 2013, we purchased a 120-bed skilled nursing property in Florida for $14,402.
In January 2014, we announced that we havewill not be renewing leases that will expire on December 31, 2014 with unrelated third partiesExtendicare and oneALC covering 37 assisted living properties. For the twelve months ended December 31, 2013, this portfolio totaled approximately $11.0 million or 10.5% of our combined rental revenue and interest income from mortgage loan receivableloans. There can be no assurance that we have with Preferred Care. They also operate one skilled nursing facility underwill be able to re-lease these communities on a sub-lease with another lessee we have which is not included intimely basis, if at all, or that the Preferred Care operator mix.new rents will be the same as the current rents.
Credit Strength. We measure our credit strength both in terms of leverage ratios and coverage ratios. Our leverage ratios include debt to book capitalizationgross asset value and debt to market capitalization. The leverage ratios indicate how much of our consolidated balance sheet capitalization is related to long term obligations. Our coverage ratios include interest coverage ratio and fixed charge coverage ratio. The coverage ratios indicate our ability to service interest and fixed charges (interest plus preferred dividends). The coverage ratios are based on adjusted earnings before gain on sale of real estate, interest, taxes, depreciation and amortization.amortization (or Adjusted EBITDA). Leverage ratios and coverage ratios are widely used by investors, analysts and rating agencies in the valuation, comparison, rating and investment recommendations of companies. The following table reflects the recent historical trends for our credit strength measures:
Balance Sheet Metrics
| | | | | | | | | | | | | | | | | | | |
| | Year to Date | | Quarter Ended | |
|---|
| | 12/31/11 | | 12/31/11 | | 9/30/11 | | 6/30/11 | | 3/31/11 | | 12/31/10 | |
|---|
Debt to book capitalization ratio | | | 25.4 | % | | 25.3% | (1) | | 21.9% | (1) | | 20.8% | (1) | | 10.1% | (6) | | 16.7 | % |
Debt & Preferred Stock to book capitalization ratio | | | 31.5 | % | | 31.5% | (1) | | 28.3% | (1) | | 27.3% | (1) | | 17.5% | (7) | | 39.8 | % |
Debt to market capitalization ratio | | | 14.0 | % | | 14.0 | % | | 14.0% | (2) | | 12.2% | (1) | | 5.6% | (6) | | 9.5 | % |
Debt & Preferred Stock to market capitalization ratio | | | 17.4 | % | | 17.4% | (3) | | 18.1% | (2) | | 16.0% | (1) | | 9.6% | (7) | | 23.0 | % |
Interest coverage ratio(9) | | | 11.7 | x | | 9.9 | x(4) | | 10.7 | x(4) | | 12.2 | x(4) | | 16.1 | x(8) | | 17.5 | x |
Fixed charge coverage ratio(9) | | | 6.3 | x | | 7.0 | x(4) | | 7.3 | x(4) | | 8.0 | x(5) | | 4.3 | x | | 4.8 | x |
| | | | | | | | | | | | | | | | | | | |
| | Year Ended | | Quarter Ended | |
|---|
| | 12/31/13 | | 12/31/13 | | 9/30/13 | | 6/30/13 | | 3/31/13 | | 12/31/12 | |
|---|
Debt to gross asset value | | | 24.2 | % | | 24.2% | (1) | | 17.8 | % | | 17.8% | (6) | | 30.6% | (9) | | 30.8 | % |
Debt & preferred stock to gross asset value | | | 27.6 | % | | 27.6% | (1) | | 21.5 | % | | 21.4% | (6) | | 34.5% | (9) | | 34.7 | % |
Debt to market capitalization ratio | | | 18.0 | % | | 18.0% | (2) | | 12.1% | (4) | | 11.9% | (7) | | 19.1% | (10) | | 21.4 | % |
Debt & preferred stock to market capitalization ratio | | | 20.5 | % | | 20.5% | (2) | | 14.6% | (4) | | 14.3% | (7) | | 21.6% | (10) | | 24.2 | % |
Interest coverage ratio(12) | | | 8.1 | x | | 8.3 | x(3) | | 9.1 | x(5) | | 8.2 | x(8) | | 7.1 | x(11) | | 7.4 | x |
Fixed charge coverage ratio(12) | | | 6.3 | x | | 6.5 | x(3) | | 6.9 | x(5) | | 6.3 | x(8) | | 5.6 | x(11) | | 5.7 | x |
- (1)
- Increase primarily due to the increase in
bank borrowing.
(2)Increase primarilyoutstanding debt due to the increase in bank borrowing and by the decrease in market capitalization.
(3)Decrease primarily duesale of senior unsecured notes to the increase in market capitalization,fund investments partially offset by the increase in bank borrowing.
gross asset value from acquisitions, additional development and capital improvement funding.(4)(2)- Increase due to the increase in outstanding debt due to the sale of senior unsecured notes to fund investments.
- (3)
- Decrease primarily due to the increase in interest expense
due to increased bank borrowing andresulting from the $50.0 millionsale of 4.80% senior unsecured term notes, the increase in debt issue costs related to the new $210.0 million Unsecured Credit Agreement and the non-cash interest related to the contingent earn-out liabilities.
notes. (5)(4)- Increase due to decrease in market capitalization.
- (5)
- Increase primarily due to the increased income due to rental income from completed construction projects and the decrease in
preferred dividendsinterest expense resulting from the redemption of all of our Series F preferred stock, partially offset by the increase in interest expense, as discussed in explanation (4) above.
lower outstanding debt. - (6)
- Decrease primarily due to the
payoff ofdecrease in outstanding debt and the outstanding bank borrowing.
increase in gross asset value from additional development and capital improvement funding. - (7)
- Decrease primarily due to the
payoff of thedecrease in outstanding bank borrowingdebt and the redemptionincrease in market capitalization resulting from the sale of all4,025,000 shares of our Series F preferred stock.common stock in a public offering.
- (8)
- Increase primarily due to the decrease in interest expense due to the decrease in outstanding debt.
- (9)
- Decrease primarily due to increase in gross asset value from additional development and capital improvement funding.
- (10)
- Decrease primarily due to the increase in market capitalization.
- (11)
- Decrease primarily due to increase in interest expense
related to higher average outstanding bank borrowing.
resulting from increased pricing levels under our unsecured revolving line of credit. (9)(12)- In calculating our interest coverage and fixed charge coverage ratios above, we use Adjusted EBITDA, which is a financial measure not derived in accordance with U.S. generally accepted accounting principles (non-GAAP financial measure). Adjusted EBITDA is not an alternative to net income, operating income, income from continuing operations or cash flows from operating activities as calculated and presented in accordance with U.S. GAAP. You should not rely on Adjusted EBITDA as a substitute for any such U.S. GAAP financial measures or consider it in isolation, for the purpose of analyzing our financial performance, financial position or cash flows. Net income is the most directly comparable GAAP measure to Adjusted EBITDA.
Below are a reconciliation of net income to EBITDA and the calculation of the interest coverage and fixed charge coverage ratios disclosed above.
|
| | Year to Date | | Quarter Ended | | | Year Ended | | Quarter Ended | |
|---|
| | 12/31/11 | | 12/31/11 | | 9/30/11 | | 6/30/11 | | 3/31/11 | | 12/31/10 | | | 12/31/13 | | 12/31/13 | | 9/30/13 | | 6/30/13 | | 3/31/13 | | 12/31/12 | |
|---|
Net income | | $ | 49,443 | | $ | 12,604 | | $ | 12,423 | | $ | 12,262 | | $ | 12,154 | | $ | 12,291 | | | $ | 57,815 | | $ | 14,650 | | $ | 17,286 | | $ | 12,903 | | $ | 12,976 | | $ | 12,778 | |
Less: Gain on sale | | — | | — | | — | | — | | — | | (310 | ) | |
Add: Interest Expense | | 6,434 | | 1,993 | | 1,794 | | 1,543 | | 1,104 | | 981 | | |
(Less) Add: (Gain) loss on sale | | | (1,605 | ) | | — | | (2,619 | ) | | 1,014 | | — | | — | |
Add: Interest expense | | | 11,364 | | 2,852 | | 2,581 | | 2,798 | | 3,133 | | 2,907 | |
Add: Depreciation and amortization—continuing & discontinued operations | | 19,623 | | 5,141 | | 4,974 | | 4,987 | | 4,521 | | 4,162 | | | 24,706 | | 6,237 | | 6,202 | | 6,131 | | 6,136 | | 5,692 | |
| | | | | | | | | | | | | | | | | | | | | | | | | | | |
Total EBITDA | | $ | 75,500 | | $ | 19,738 | | $ | 19,191 | | $ | 18,792 | | $ | 17,779 | | $ | 17,124 | | |
| | | | | | | | | | | | | | | |
Total adjusted EBITDA | | | $ | 92,280 | | $ | 23,739 | | $ | 23,450 | | $ | 22,846 | | $ | 22,245 | | $ | 21,377 | |
| | | | | | | | | | | | | | | |
| | | | | | | | | | | | | | | |
| | | | | | | | | | | | | | | |
| | | | | | | | | | | | | | | | | | | | | | | | | | | |
Interest expense | | $ | 6,434 | | $ | 1,993 | | $ | 1,794 | | $ | 1,543 | | $ | 1,104 | | $ | 981 | | | $ | 11,364 | | $ | 2,852 | | $ | 2,581 | | $ | 2,798 | | $ | 3,133 | | $ | 2,907 | |
Interest coverage ratio | | 11.7 | x | | 9.9 | x | | 10.7 | x | | 12.2 | x | | 16.1 | x | | 17.5 | x | | 8.1 | x | | 8.3 | x | | 9.1 | x | | 8.2 | x | | 7.1 | x | | 7.4 | x |
Interest expense | | $ | 6,434 | | $ | 1,993 | | $ | 1,794 | | $ | 1,543 | | $ | 1,104 | | $ | 981 | | | $ | 11,364 | | $ | 2,852 | | $ | 2,581 | | $ | 2,798 | | $ | 3,133 | | $ | 2,907 | |
Preferred stock dividends (excludes preferred stock redemption charge) | | 5,512 | | 818 | | 818 | | 818 | | 3,058 | | 2,586 | | | 3,273 | | 819 | | 818 | | 818 | | 818 | | 819 | |
| | | | | | | | | | | | | | | | | | | | | | | | | | | |
| | | | | | | | | | | | | | | |
Total fixed charges | | $ | 11,946 | | $ | 2,811 | | $ | 2,612 | | $ | 2,361 | | $ | 4,162 | | $ | 3,567 | | | $ | 14,637 | | $ | 3,671 | | $ | 3,399 | | $ | 3,616 | | $ | 3,951 | | $ | 3,726 | |
| | | | | | | | | | | | | | | | | | | | | | | | | | | |
| | | | | | | | | | | | | | | |
| | | | | | | | | | | | | | | |
| | | | | | | | | | | | | | | |
Fixed charge coverage ratio | | 6.3 | x | | 7.0 | x | | 7.3 | x | | 8.0 | x | | 4.3 | x | | 4.8 | x | | 6.3 | x | | 6.5 | x | | 6.9 | x | | 6.3 | x | | 5.6 | x | | 5.7 | x |
We evaluate our key performance indicators in conjunction with current expectations to determine if historical trends are indicative of future results. Our expected results may not be achieved and actual results may differ materially from our expectations. This may be a result of various factors, including, but not limited to
- •
- The status of the economy;
- •
- The status of capital markets, including prevailing interest rates;
- •
- Compliance with and changes to regulations and payment policies within the health care industry;
- •
- Changes in financing terms;
- •
- Competition within the health care and senior housing industries; and
- •
- Changes in federal, state and local legislation.
Management regularly monitors the economic and other factors listed above. We develop strategic and tactical plans designed to improve performance and maximize our competitive position. Our ability
to achieve our financial objectives is dependent upon our ability to effectively execute these plans and to appropriately respond to emerging economic and company-specific trends.
Operating Results
Year ended December 31, 20112013 compared to year ended December 31, 20102012 (in thousands)
Revenues
| | | | | | | | | | |
| | Years ended December 31, | |
| |
|---|
| | 2013 | | 2012 | | Difference | |
|---|
Revenues: | | | | | | | | | | |
Rental income | | $ | 98,166 | | $ | 86,022 | | $ | 12,144 | (1) |
Interest income from mortgage loans | | | 6,298 | | | 5,496 | | | 802 | (2) |
Interest and other income | | | 510 | | | 964 | | | (454) | (3) |
| | | | | | | | |
| | | | | | | | | | | |
Total revenues | | | 104,974 | | | 92,482 | | | 12,492 | |
| | | | | | | | |
| | | | | | | | | | | |
Expenses: | | | | | | | | | | |
Interest expense | | | 11,364 | | | 9,932 | | | 1,432 | (4) |
Depreciation and amortization | | | 24,389 | | | 21,613 | | | 2,776 | (5) |
Provision (recovery) for doubtful accounts | | | 2,180 | | | (101 | ) | | 2,281 | (2) |
General and administrative expenses | | | 11,636 | | | 10,732 | | | 904 | (6) |
| | | | | | | | |
| | | | | | | | | | | |
Total expenses | | | 49,569 | | | 42,176 | | | 7,393 | |
| | | | | | | | |
| | | | | | | | | | | |
Income from continuing operations | | | 55,405 | | | 50,306 | | | 5,099 | |
Discontinued operations: | | | | | | | | | | |
Income from discontinued operations | | | 805 | | | 1,005 | | | (200) | (7) |
Gain on sale of assets, net | | | 1,605 | | | 16 | | | 1,589 | (8) |
| | | | | | | | |
| | | | | | | | | | | |
Net income from discontinued operations | | | 2,410 | | | 1,021 | | | 1,389 | |
| | | | | | | | |
| | | | | | | | | | | |
Net income | | | 57,815 | | | 51,327 | | | 6,488 | |
Income allocated to non-controlling interests | | | — | | | (37 | ) | | 37 | (9) |
| | | | | | | | |
| | | | | | | | | | | |
Net income attributable to LTC Properties, Inc. | | | 57,815 | | | 51,290 | | | 6,525 | |
| | | | | | | | |
| | | | | | | | | | | |
Income allocated to participating securities | | | (383 | ) | | (377 | ) | | (6 | ) |
Income allocated to preferred stockholders | | | (3,273 | ) | | (3,273 | ) | | — | |
| | | | | | | | |
| | | | | | | | | | | |
Net income available to common stockholders | | $ | 54,159 | | $ | 47,640 | | $ | 6,519 | |
| | | | | | | | |
| | | | | | | | | | | |
| | | | | | | | | | | |
| | | | | | | | |
- (1)
- Increased due to acquisitions and completed development projects.
- (2)
- Increased primarily due to origination of a $124,387 mortgage loan and $4,971 funding under a mortgage and construction loan partially offset by normal amortization of existing mortgage loans.
- (3)
- Decreased primarily due to the redemption of the Skilled Healthcare Group Senior Subordinated Notes and a lower bankruptcy settlement distribution from Sunwest in 2013 than in 2012.
- (4)
- Increased primarily due to the sale of senior unsecured notes to fund investments.
- (5)
- Increased due to acquisitions, developments and capital improvement investments.
- (6)
- Increased primarily due to the one-time severance and accelerated restricted stock vesting charges related to the retirement of our former Senior Vice President, Marketing and Strategic Planning and higher salaries and benefits reflective of increased staffing levels.
- (7)
- Includes the financial results from properties sold during 2013 and 2012.
- (8)
- During 2013, we sold seven skilled nursing properties with a total of 277 beds for $11,001. During 2012, we sold a 140-bed skilled nursing property for $1,248.
- (9)
- Decreased due to the conversion of all 112,588 limited partnership units during 2012.
Year ended December 31, 2012 compared to year ended December 31, 2011 increased(in thousands)
| | | | | | | | | | |
| | Years ended December 31, | |
| |
|---|
| | 2012 | | 2011 | | Difference | |
|---|
Revenues: | | | | | | | | | | |
Rental income | | $ | 86,022 | | $ | 76,096 | | $ | 9,926 | (1) |
Interest income from mortgage loans | | | 5,496 | | | 6,411 | | | (915 | )(2) |
Interest and other income | | | 964 | | | 1,111 | | | (147 | )(3) |
| | | | | | | | |
| | | | | | | | | | | |
Total revenues | | | 92,482 | | | 83,618 | | | 8,864 | |
| | | | | | | | |
| | | | | | | | | | | |
Expenses: | | | | | | | | | | |
Interest expense | | | 9,932 | | | 6,434 | | | 3,498 | (4) |
Depreciation and amortization | | | 21,613 | | | 18,911 | | | 2,702 | (5) |
Recovery for doubtful accounts | | | (101 | ) | | (13 | ) | | (88) | (2) |
General and administrative expenses | | | 10,732 | | | 9,666 | | | 1,066 | (6) |
| | | | | | | | |
| | | | | | | | | | | |
Total expenses | | | 42,176 | | | 34,998 | | | 7,178 | |
| | | | | | | | |
| | | | | | | | | | | |
Income from continuing operations | | | 50,306 | | | 48,620 | | | 1,686 | |
Discontinued operations: | | | | | | | | | | |
Loss from discontinued operations | | | 1,005 | | | 823 | | | 182 | (7) |
Gain on sale of assets, net | | | 16 | | | — | | | 16 | (8) |
| | | | | | | | |
| | | | | | | | | | | |
Net (loss) income from discontinued operations | | | 1,021 | | | 823 | | | 198 | |
| | | | | | | | |
| | | | | | | | | | | |
Net income | | | 51,327 | | | 49,443 | | | 1,884 | |
Income allocated to non-controlling interests | | | (37 | ) | | (191 | ) | | 154 | (9) |
| | | | | | | | |
| | | | | | | | | | | |
Net income attributable to LTC Properties, Inc. | | | 51,290 | | | 49,252 | | | 2,038 | |
| | | | | | | | |
| | | | | | | | | | | |
Income allocated to participating securities | | | (377 | ) | | (342 | ) | | (35) | (10) |
Income allocated to preferred stockholders | | | (3,273 | ) | | (9,078 | ) | | 5,805 | (11) |
| | | | | | | | |
| | | | | | | | | | | |
Net income available to common stockholders | | $ | 47,640 | | $ | 39,832 | | $ | 7,808 | |
| | | | | | | | |
| | | | | | | | | | | |
| | | | | | | | | | | |
| | | | | | | | |
- (1)
- Increased due to
$85.2 million from $73.7 million for the same period in 2010acquisitions. - (2)
- Decreased primarily due to
increases in rental income partially offset by decreases in interest income from mortgage loanspayoffs and interest and other income, as discussed below. Rental income for the year ended December 31, 2011 increased $13.3 million from the same period in 2010 primarily due to increases resulting from acquisitions in 2011 and 2010. Interest income from mortgage loans for the year ended December 31, 2011 decreased $1.1 million from the same period in 2010 primarily due to payoffs, normal amortization of existing mortgage loans and the conversionpartially offset by origination of atwo mortgage loan to an owned property. During 2010, we acquired the school property via deed-in-lieu of foreclosure as a result of the borrower filing for Chapter 7 bankruptcy. During 2011, we leased the school to a non-for-profit corporation that provides therapeutic support and intensive home, school and center-based behavioral therapy for children, youth and families affected by Autism Spectrum Disorders.
Interest and other income for the year ended December 31, 2011 decreased $0.8 million from the same period in 2010loans totaling $7,719.
- (3)
- Decreased primarily due to
a $0.8 million bankruptcy settlement distribution received in 2010 related to a former operator. Interest expense for the year ended December 31, 2011 was $3.8 million higher thanredemption of the same period in 2010Skilled Healthcare Group Senior Subordinated Notes.
- (4)
- Increased primarily due to an increase in
borrowingsbank borrowing and the sale of senior unsecured notes to fund acquisitions in 2011 and 2010, and the non-cash interest expense related to earn-out liabilities which represents the accretion of the difference between the current fair value and estimated payment of the contingent earn-out liabilities. Depreciation and amortization expense for the year ended December 31, 2011 increased $3.8 million from the same period in 2010 primarilyinvestments.
- (5)
- Increased due to acquisitions,
in 2011developments and 2010. Provisions for doubtful accounts for the year ended December 31, 2011 decreased $1.4 million from the same period in 2010 primarily due to a provision for doubtful accounts charge in 2010 relating to two mortgage loans (one secured by a private school property located in Minnesota and one secured by land in Oklahoma).
Acquisition costs for the year ended December 31, 2011 were comparable to the same period in 2010.
Operating and other expenses for the year ended December 31, 2011 increased $1.5 million from the same period in 2010capital improvement investments.
- (6)
- Increased primarily due to higher expense related to vesting of restricted stock granted,
in 2010, increased salaries and benefits reflective of increasingincreased staffing levels, and higher consulting and marketing expenses. Forbonuses related to the year ended December 31, 2011 and 2010, net income from discontinued operations includedincreased volume of transactions completed during 2012.
- (7)
- Includes the financial results from properties sold during 2013 and
properties classified as held-for-sale and a gain2012. - (8)
- Gain on sale of
properties sold. Properties classified as held-for-sale include a 140-unit independent living140-bed skilled nursing property located in Texas that we acquired via foreclosure in 2008. This reclassification was made in accordance with accounting guidance which requires thatfor $1,248. - (9)
- Decreased due to the
financial resultsconversion of properties meeting certain criteria be reported on a separate line item called "Discontinued Operations." Net income allocable toall 112,588 limited partnership units during 2012.
- (10)
- Increased due the grant of 90,500 shares of restricted common
stockholders for the year ended December 31, 2011 increased $10.2 million from the same period in 2010 primarilystock during 2012. - (11)
- Decreased due to the redemption of all of our Series
E and Series F preferred stockstock.
Funds From Operations
Funds from Operations (or FFO) available to common stockholders, basic FFO available to common stockholders per share and diluted FFO available to common stockholders per share are supplemental measures of a REIT's financial performance that are not defined by U.S. GAAP. Real estate values historically rise and fall with market conditions, but cost accounting for real estate assets in accordance with U.S. GAAP assumes that the changes previously described above.value of real estate assets diminishes predictably over time. We believe that by excluding the effect of historical cost depreciation, which may be of limited
Year ended December 31, 2010 compared to year ended December 31, 2009relevance in evaluating current performance, FFO facilitates comparisons of operating performance between periods.
Revenues for the year ended December 31, 2010 increased to $73.7 million from $68.8 million for the same period in 2009 primarily due to increases in rental income and in interest and other income partially offset by decreases in interest income from mortgage loans, as discussed below. Rental income for the year ended December 31, 2010 increased $5.4 million from the same period in 2009 primarily from acquisitions.
Interest income from mortgage loans for the year ended December 31, 2010 decreased $1.1 million from the same period in 2009 primarily due to payoffs, normal amortization of existing mortgage loans and the conversion of a mortgage loan to an owned property. During 2010, we acquired the school property via deed-in-lieu of foreclosureWe use FFO as a result of the borrower filing for Chapter 7 bankruptcy. During 2011, we leased the school to a non-for-profit corporation that provides therapeutic support and intensive home, school and center-based behavioral therapy for children, youth and families affected by Autism Spectrum Disorders.
Interest and other income for the year ended December 31, 2010 increased $0.5 million from the same period in 2009 primarily due to a $0.8 million bankruptcy settlement distribution related to a former operator partially offset by lower interest income resulting from payoffs and the normal amortizationsupplemental performance measurement of our notes receivable.cash flow generated by operations. FFO does not represent cash generated from operating activities in accordance with U.S. GAAP, and is not necessarily indicative of cash available to fund cash needs and should not be considered an alternative to net income available to common stockholders.
Interest expense forWe calculate and report FFO in accordance with the year ended December 31, 2010 was $0.2 million higher thandefinition and interpretive guidelines issued by the same periodNational Association of Real Estate Investment Trusts (or NAREIT). FFO, as defined by NAREIT, means net income available to common stockholders (computed in 2009 due to increase in bank borrowings outstanding during 2010 andaccordance with U.S. GAAP) excluding gains or losses on the sale of $50.0 million aggregate principalreal estate and impairment write-downs of senior unsecured notes partially offset by a decrease in mortgage loans payable outstanding during the period resulting from the repayment of mortgage loans and the normal amortization of existing mortgage loans.
Depreciationdepreciable real estate plus real estate depreciation and amortization, expenseand after adjustments for unconsolidated partnerships and joint ventures. Our calculation of FFO may not be comparable to FFO reported by other REITs that do not define the year ended December 31, 2010 increased $1.4 million from the same period in 2009 primarily due to acquisitions.
Provisions for doubtful accounts for the year ended December 31, 2010 increased $1.2 million from the same period in 2009 primarily due to a provision for doubtful accounts charge related to two mortgage loans (one secured by a private school property located in Minnesota and one secured by land in Oklahoma).
Acquisition costs for the year ended December 31, 2010 increased $0.2 million as compared to same period in 2009 due to higher transaction volume in 2010.
Operating and other expenses for the year ended December 31, 2010 increased $0.5 million from the same period in 2009 primarily due to an increase in legal and other expenses related to the shelf registration and the Series E and Series F preferred stock redemption.
For the year ended December 31, 2010 and 2009, net income from discontinued operations included the financial results from properties sold and properties classified as held-for-sale and a gain on sale of properties sold. During 2010, we sold a 195-bed skilled nursing property in Virginia and recognized a gain of $0.3 million. Properties classified as held-for-sale include a 140-unit independent living property located in Texas that we acquired via foreclosure in 2008. This reclassification was madeterm in accordance with accounting guidance which requiresthe current NAREIT definition or that have a different interpretation of the financial resultscurrent NAREIT definition from us; therefore, caution should be exercised when comparing our FFO to that of properties meeting certain criteria be reported on a separate line item called "Discontinued Operations."other REITs.
Net The following table reconciles net income allocableavailable to common stockholders for the year ended December 31, 2010 increased $0.2 million from the same periodto FFO available to common stockholders (unaudited, amounts in 2009 primarily due to the changes previously described above and the redemption of all of our Series E and 40% of our Series F preferred stock in 2010 partially offset by the repurchase of our Series F preferred stock for less than liquidation value in 2009.thousands, except per share amounts):
| | | | | | | | | | |
| | For the year ended December 31, | |
|---|
| | 2013 | | 2012 | | 2011 | |
|---|
Net income available to common stockholders | | $ | 54,159 | | $ | 47,640 | | $ | 39,832 | |
Add: Depreciation and amortization (including continuing and discontinued operations) | | | 24,706 | | | 22,153 | | | 19,623 | |
Less: Gain on sale of real estate, net | | | (1,605 | ) | | (16 | ) | | — | |
| | | | | | | | |
| | | | | | | | | | | |
FFO available to common stockholders | | $ | 77,260 | | $ | 69,777 | | $ | 59,455 | |
| | | | | | | | |
| | | | | | | | | | | |
| | | | | | | | | | | |
| | | | | | | | |
FFO available to common stockholders per share: | | | | | | | | | | |
Basic | | $ | 2.33 | | $ | 2.31 | | $ | 2.04 | |
| | | | | | | | |
| | | | | | | | | | | |
| | | | | | | | | | | |
| | | | | | | | |
Diluted | | $ | 2.29 | | $ | 2.26 | | $ | 2.01 | |
| | | | | | | | |
| | | | | | | | | | | |
| | | | | | | | | | | |
| | | | | | | | |
Weighted average shares used to calculate FFO per share: | | | | | | | | | | |
Basic | | | 33,111 | | | 30,238 | | | 29,194 | |
| | | | | | | | |
| | | | | | | | | | | |
| | | | | | | | | | | |
| | | | | | | | |
Diluted | | | 35,342 | | | 32,508 | | | 31,539 | |
| | | | | | | | |
| | | | | | | | | | | |
| | | | | | | | | | | |
| | | | | | | | |
Critical Accounting Policies
Preparation of the consolidated financial statements in conformity with U.S. generally accepted accounting principles (U.S. GAAP) requires management to make estimates and assumptions that affect the amounts reported in the consolidated financial statements and accompanying notes. Actual results could differ from those estimates. SeeItem 8. FINANCIAL STATEMENTS—Note 2. Summary of Significant Accounting Policies for a description of the significant accounting policies we followed in preparing the consolidated financial statements for all periods presented. We have identified the following significant accounting policies as critical accounting policies in that they require significant judgment and estimates and have the most impact on financial reporting.
Impairments. Impairment losses are recorded when events or changes in circumstances indicate the asset is impaired and the estimated undiscounted cash flows to be generated by the asset are less than its carrying amount. Management assesses the impairment of properties individually and impairment losses are calculated as the excess of the carrying amount over the fair value of assets to be
held and used, and carrying amount over the fair value less cost to sell in instances where management has determined that we will dispose of the property. In determining fair value, we use current appraisals or other third party opinions of value and other estimates of fair value such as estimated discounted future cash flows.
Also, we evaluate the carrying values of mortgage loans receivable on an individual basis. Management periodically evaluates the realizability of future cash flows from the mortgage loan receivable when events or circumstances, such as the non-receipt of principal and interest payments and/or significant deterioration of the financial condition of the borrower, indicate that the carrying amount of the mortgage loan receivable may not be recoverable. An impairment charge is recognized in current period earnings and is calculated as the difference between the carrying amount of the mortgage loan receivable and the discounted cash flows expected to be received, or if foreclosure is probable, the fair value of the collateral securing the mortgage.
Accounting Standards Codification No. 320,Investments—Debt and Equity Securities (or ASC 320), requires an entity to assess whether it intends to sell, or it is more likely than not that it will be required to sell, a debt security in an unrealized loss position before recovery of its amortized cost basis. If either of these criteria is met, the entire difference between fair value and amortized cost is recognized as impairment through earnings. For securities that do not meet the aforementioned criteria, the amount of impairment is split into two components as follows: 1) other-than-temporary impairment (or OTTI) related to other factors such as an entity's ability to make scheduled interest or principal payments on the debt securities, which is recognized in other comprehensive income and 2) OTTI related to credit loss, which must be recognized in the income statement. The credit loss is determined as the difference between the present value of the cash flows expected to be collected and the amortized cost basis.
Owned Properties. We make estimates as part of our allocation of the purchase price of acquisitions to the various components of the acquisition based upon the relative fair value of each component. In determining fair value, we use current appraisals or other third party opinions of value. The most significant components of our allocations are typically the allocation of fair value to land and buildings and, for certain of our acquisitions, in-place leases and other intangible assets. In the case of the fair value of buildings and the allocation of value to land and other intangibles, the estimates of the values of these components will affect the amount of depreciation and amortization we record over the estimated useful life of the property acquired or the remaining lease term. In the case of the value of in-place leases, the appraisers make best estimates based on the evaluation of the specific characteristics of each tenant's lease. Factors considered include estimates of carrying costs during hypothetical expected lease-up periods, market conditions and costs to execute similar leases. These assumptions affect the amount of future revenue that we will recognize over the remaining lease term for the acquired in-place leases. We evaluate each purchase transaction to determine whether the acquired assets meet the definition of a business. Transaction costs related to acquisitions that are not deemed to be businesses are included in the cost basis of the acquired assets, while transaction costs related to acquisitions that are deemed to be businesses are expensed as incurred.
Mortgage Loans Receivable. Mortgage loans receivable we originate are recorded on an amortized cost basis. Mortgage loans we acquire are recorded at fair value at the time of purchase net of any related premium or discount which is amortized as a yield adjustment to interest income over the life of the loan. We maintain a valuation allowance based upon the expected collectability of our mortgage loans receivable. Changes in the valuation allowance are included in current period earnings.
Revenue Recognition. Interest income on mortgage loans is recognized using the effective interest method. We follow a policy related to mortgage interest whereby we consider a loan to be non-performing after 60 days of non-payment of amounts due and do not recognize unpaid mortgage interest income from that loan until the past due amounts have been received.
Rental income from operating leases is generally recognized on a straight-line basis over the terms of the leases. Substantially all of our leases contain provisions for specified annual increases over the
rents of the prior year and are generally computed in one of four methods depending on specific provisions of each lease as follows:
- (i)
- a specified annual increase over the prior year's rent, generally between 2.0% and 3.0%;
- (ii)
- a calculation based on the Consumer Price Index;
- (iii)
- as a percentage of facility net patient revenues in excess of base amounts or
- (iv)
- specific dollar increases.
The FASB does not provide for the recognition of contingent revenue until all possible contingencies have been eliminated. We consider the operating history of the lessee and the general condition of the industry when evaluating whether all possible contingencies have been eliminated and have historically, and expect in the future, to not include contingent rents as income until received. We follow a policy related to rental income whereby we consider a lease to be non-performing after 60 days of non-payment of past due amounts and do not recognize unpaid rental income from that lease until the amounts have been received.
Rental revenues relating to non-contingent leases that contain specified rental increases over the life of the lease are recognized on the straight-line basis. Recognizing income on a straight-line basis requires us to calculate the total non-contingent rent containing specified rental increases over the life of the lease and to recognize the revenue evenly over that life. This method results in rental income in the early years of a lease being higher than actual cash received, creating a straight-line rent receivable asset included in our consolidated balance sheet. At some point during the lease, depending on its terms, the cash rent payments eventually exceed the straight-line rent which results in the straight-line rent receivable asset decreasing to zero over the remainder of the lease term. We assess the collectability of straight-line rent in accordance with the applicable accounting standards and our reserve policy. If the lessee becomes delinquent in rent owed under the terms of the lease, we may provide a reserve against the recognized straight-line rent receivable asset for a portion, up to its full value, that we estimate may not be recoverable.
Net loan fee income and commitment fee income are amortized over the life of the related loan. Costs associated with leases are deferred and allocated over the lease term in proportion to the recognition of rental income.
Liquidity and Capital Resources
Operating Activities:
At December 31, 2011,2013, our real estate investment portfolio (before accumulated depreciation and amortization) consisted of $725.0$937.6 million invested primarily in owned long term healthcarehealth care properties and mortgage loans of approximately $54.0$167.1 million (prior to deducting a $0.9$1.7 million reserve). Our portfolio consists of investments in 89100 skilled nursing properties, 102106 assisted living properties, 14 other senior housing9 range of care properties, two schools, and a parcelsix parcels of land under development.development and four parcels of land held-for-use. These properties are located in 30 states. Other senior housingAssisted living properties include assisted living, independent living and memory care properties. Range of care properties consist of independent living properties and properties providing skilled nursing and any combination of skilled nursing, assisted living, independent living and/or independent livingmemory care services. For the year ended December 31, 2011,2013, we had net cash provided by operating activities of $70.8$86.2 million.
For the year ended December 31, 20112013 we recorded $3.7$4.0 million in straight-line rental income and $46,000$37,000 in straight-line rent receivable reserve. We currently expect thatDuring the fourth quarter of 2013, we wrote-off a $0.9 million straight-line rental income forrent receivable balance related to the transition of four assisted living
properties to a new lessee. For the remaining leases in place at December 31, 2011 will decrease from $3.7 million in 2011 to $2.4 million in 20122013, assuming no modification or replacement of existing leases and no new leased investments are added to our portfolio. Conversely,portfolio, we currently expect that straight-line rental income will decrease from $3.9 million in 2013 to $2.2 million for projected annual 2014 and, conversely, our cash rental income is projected to increase from $74.6$96.0 million in 20112013 to $81.1$97.5 million in 2012 assuming no modification or replacement of existing leases and no new leased
investments are added to our portfolio.for projected annual 2014. During the year ended December 31, 20112013, we received $74.6$96.0 million of cash rental revenue and recorded $0.7 million of amortized lease inducement cost.
Investing Activities:
For the year ended December 31, 2011,2013, we used $97.4$164.0 million of cash for investing activities. The following table summarizes our acquisitions during 20112013(dollar amounts in thousands):
|
| |
| |
| |
| |
| | Number of | | | | | | | | | | | | | | | | | |
|---|
Type of Property | | Purchase
Price | | Transaction
Costs | | Total
Acquisition
Costs | | Number
of
Properties | | SNF
Beds | | ALF
Units | | ILF
Units | | | Purchase
Price | | Transaction
Costs | | Total
Acquisition
Costs | | Number
of
Properties | | Number
of
Beds/Units | |
|---|
Skilled Nursing(2)(3)(4)(5) | | $ | 93,841 | | $ | 330 | | $ | 94,171 | | 7 | | 1,016 | | — | | — | | |
Other Senior Housing(1)(6) | | 11,450 | | 34 | | 11,484 | | 2 | | 118 | | 40 | | 53 | | |
Skilled Nursing(1) | | | $ | 14,402 | | $ | 58 | | $ | 14,460 | | 1 | | 120 | |
Land(2) | | 844 | | 11 | | 855 | | — | | — | | — | | — | | | 4,638 | | — | | 4,638 | | — | | — | |
| | | | | | | | | | | | | | | | | | | | | | | | | | | |
| | | | | | | | | | | | | |
Totals | | $ | 106,135 | | $ | 375 | | $ | 106,510 | | 9 | | 1,134 | | 40 | | 53 | | | $ | 19,040 | | $ | 58 | | $ | 19,098 | | 1 | | 120 | |
| | | | | | | | | | | | | | | | | | | | | | | | | | | |
| | | | | | | | | | | | | |
| | | | | | | | | | | | | |
| | | | | | | | | | | | | |
- (1)
OtherA skilled nursing property located in Florida which was added to a master lease at an incremental initial cash yield of 8.75%.- (2)
- We purchased three vacant parcels of land in Colorado for a total of $3,475 under a pipeline agreement whereby we have the opportunity to finance any senior housing development project or acquisition originated by an operator through May 2018 (unless earlier terminated as provided for therein). The land was added to an existing master lease and we entered into development commitments in an amount not to exceed $30,256 to fund the construction of three memory care properties,
consisttwo with 60 units and the other with 48 units. We also purchased four parcels of independent living propertiesland held-for-use in Michigan for $1,163.
As part of an acquisition in 2011, we committed to provide a contingent payment if certain operational thresholds were met. The contingent payment was recorded at fair value, which was estimated using a discounted cash flow analysis, and properties providing any combinationwe accreted the contingent liability to the settlement amount as of the payment date. The fair value of such contingent liability was re-evaluated on a quarterly basis based on changes in estimates of future operating results and changes in market discount rates. During 2013, we paid $7.0 million related to the contingent liability. Accordingly, we have no remaining contingent liability as of December 31, 2013.
During the twelve months ended December 31, 2013, a lessee exercised its option to purchase six skilled nursing assisted living and/or independent living services.properties located in Ohio with a total of 230 beds for an all cash purchase price of $11.0 million. As a result, we recorded a $2.6 million gain on sale. Also, during 2013, we sold a 47-bed skilled nursing property in Colorado for $1,000 and recognized a loss of $1.0 million on the sale.
During the twelve months ended December 31, 2013, we completed the following construction projects:
| | | | | | | | | | | | | | | | | |
Completed Date | | Type of Property | | Number
of
Beds/Units | | State | | Completed Date | | 2013 Funding | | Total Funding | |
|---|
Jul 2013 | | Assisted Living(1) | | | 60 | | Colorado | | | Jul 2013 | | $ | 4,316 | | $ | 9,850 | |
Jul 2013 | | Skilled Nursing(2) | | | 120 | | Texas | | | Jul 2013 | | | 5,065 | | | 8,635 | |
Oct 2013 | | Assisted Living(3) | | | 77 | | Kansas | | | Oct 2013 | | | 8,081 | | | 9,675 | |
| | | | | | | | | | | | | | | |
| | | | | | | | | | | | | | | | | | |
| | Totals | | | 257 | | | | | | | $ | 17,462 | | $ | 28,160 | |
| | | | | | | | | | | | | | | |
| | | | | | | | | | | | | | | | | | |
| | | | | | | | | | | | | | | | | | |
| | | | | | | | | | | | | | | |
- (1)
- This new property is a Memory Care property. The funded amount includes acquired land of $1,882.
- (2)
- This new property replaces a skilled nursing property in our existing portfolio.
(2)(3)WeThe funded amount includes acquired land of $730.
During the year ended December 31, 2013, we received $1.9 million in regularly scheduled principal payments from our mortgage loans. Additionally, we funded a 196-bed$124.4 million mortgage loan with a third-party operator, Prestige Healthcare, secured by 15 skilled nursing properties with a total of 2,092 beds in Michigan. The loan is for a term of 30 years and bears interest at 9.53% for five years, escalating annually thereafter by 2.25%. Payments are interest-only for three years, after which the borrower will make interest payments along with annual principal payments of $1.0 million. The loan agreement provides for additional forward commitments of $12.0 million for capital improvements at 9.41% for the first twelve months. The loan agreement also provides, under certain conditions and based on certain operating metrics and valuation thresholds achieved and sustained within the first twelve years of the term, for additional loan proceeds of up to $40.0 million with such proceeds limited to $10.0 million per twelve months.
The borrower has a one-time option between the third and twelfth years to prepay up to 50% of the then outstanding loan balance without penalty. Exclusively for the purposes of this option, the properties collateralizing the loan have been separated by us into two pools of assets. If and when the option is exercised, we will identify which of the two pools we will release for prepayment and removal from portfolio of properties securing the loan. If the prepayment option is exercised and timely concluded, the borrower forfeits its opportunity to access any additional loan proceeds. Additionally, under certain circumstances, including a change in regulatory environment, we have the option to purchase the properties.
During the twelve months ended December 31, 2013, we funded $5.0 million under a $10.6 million mortgage and construction loan. This loan is secured by a currently operating skilled nursing property and a vacant parcel of land in Texasupon which a 106-bed replacement facility is being constructed. As of December 31, 2013, we have a remaining commitment of $3.0 million under this loan.
During 2013, we received $3.0 million for a purchase pricethe early repayment of $15,500 and $844, respectively. Simultaneoustwo loans with the purchases, we entered into a commitment, in an amount notinterest ranging from 8.5% to exceed $8,250, to fund the construction of a 120-bed skilled nursing property on the acquired parcel of land which will replace a 90-bed skilled nursing property in our existing portfolio. Upon completion of the construction, the lessee intends to relocate the residents to the newly constructed property. These properties are leased to an operator within our existing portfolio pursuant to a 10-year master lease agreement at a GAAP yield of 11.0%9.0%. The master lease contains annual escalations of 2.5% and has two 5-year renewal options.
(3)We purchased a 140-bed skilled nursing property located in Texas for an aggregate purchase price of $10,000. Simultaneous with the purchase, we added the property to an existing master lease with a third party operator at an incremental GAAP yield of 10.5%.
(4)We purchased four skilled nursing properties with 524-beds in Texas for $50,841 which consists of $41,000 in cash at closing with the remainder in the form of contingent earn-out payments. The contingent earn-out payment arrangements require us to pay two earn-out payments totalling up to $11,000 upon the properties achieving a sustainable stipulated rent coverage ratio. During 2011, we paid $4,000 related to the first contingent earn-out payment. We estimated the fair value of the contingent earn-out payments using a discounted cash flow analysis.
(5)We purchased a 156-bed skilled nursing property located in California for $17,500 and entered into a 12-year lease with an unrelated third party. The lease has a GAAP yield of 10.3%, contains annual escalations of 2.0% and has two 10-year renewal options.
(6)We purchased two senior housing properties located in South Carolina with 118 skilled nursing beds, 40 assisted living units and 53 independent living units for $11,450. The lease has a GAAP yield of 10.1%, contains annual escalations of 2.5% and has three 5-year renewal options. Also during 2011, we invested $3.1 million, at an average yield of 9.7%, under agreements to expand and renovate 11 existing properties operated by seven different operators and we invested $42,000 in capital improvements to existing properties under various lease agreements whose rental rates already reflected this investment.
In January 2012, we entered into an agreement to sell a 140-bed skilled nursing property located in Texas for $1.2 million. This property is leased under a master lease and the economic terms of this master lease will not change as a result of this sale. This sale is scheduled to close on February 29, 2012 and will result in a $16,000 gain recognized in 2012.
During 2011, we received $2.8 million plus accrued interest related to the payoff of four mortgage loans secured by one assisted living property and seven skilled nursing properties. Additionally, we received $3.1 million in regularly scheduled principal payments on mortgage loans.
During the year ended December 31, 2011, we funded $0.2 million on an 8.5% construction and term loan in which2013, we committed to providefund three loans up to $2.5$0.4 million each with interest at 12%. Two of these loans mature in September 2017 and one matures in December 2017. We also committed to fund three pre-development loans of $0.3 million each to facilitate the site selection and pre-construction services for capital improvements at two senior housing properties we own and leasethe future development of three memory care properties. The initial rate of each of these pre-development loans is 12%, increasing by 25 basis points per year. Each of these pre-development loans matured due to the borrower. Upon the earlieracquisition of the full fundingland and the outstanding balance of $0.5 million was capitalized under the $2.5 million ordevelopment projects.
As of December 31, 2012, construction distribution under this loan will cease and this loan will fully amortize to maturity in November 2017. Additionally,2013, we received $0.7 million in principal payments on varioushave seven loans and linesline of credit with certain operators. At December 31, 2011, we had six such notes receivable outstandingagreements with a carrying valuetotal commitment of $0.8$2.4 million atand a weightedremaining commitment balance of $1.8 million. The average interest rate of 10.0%these loans is 11.5%. During 2013, we received principal payments, including loan payoffs, of $3.1 million and we advanced principal of $1.0 million.
Financing Activities:
For the year ended December 31, 2011,2013, we had net cash provided by financing activities of $24.1$77.3 million. During 2011,2013, we paid $0.5$0.6 million in scheduled principal payments on bonds payable.
During 2011, we entered into a new $210.0 million Unsecured Credit Agreement which provides for the opportunity to increase the credit amount up to a total of $250.0 million. The new Unsecured Credit Agreement provides a revolving line of credit with no scheduled maturities other than the maturity date of April 18, 2015, and allows us to borrow at the same interest rates applicable to borrowings under our prior agreement, 150 basis points over LIBOR based on current leverage ratios. Financial covenants contained in the new Unsecured Credit Agreement, which are measured quarterly, require us to maintain, among other things:
(i)a ratio of total indebtedness to total asset value not greater than 0.5 to 1.0;
(ii)a ratio of secured debt to total asset value not greater than 0.35 to 1.0;
(iii)a ratio of unsecured debt to the value of the unencumbered asset pool not greater than 0.6 to 1.0; and
(iv)a ratio of EBITDA, as calculated in the new Unsecured Credit Agreement, to fixed charges not less than 1.50 to 1.0.
During the year ended December 31, 2011,2013, we borrowed $167.6$93.0 million and repaid $149.3$187.5 million under our Unsecured Credit Agreement.unsecured revolving line of credit. At December 31, 2011,2013, we had $56.0$21.0 million outstanding at an interest rate of LIBOR plus 1.50%1.25% and $154.0$219.0 million available for borrowing. During January 2012,Subsequent to December 31, 2013, we borrowed $4.0 million. After this borrowing,$11.5 million at an interest rate of LIBOR plus 1.25%. Accordingly, we had $60.0$32.5 million outstanding and $150.0$207.5 million available for borrowing. At December 31, 2011,2013, we were in compliance with all our covenants.
During the year endedAt December 31, 2011,2013, we had $255.8 million outstanding under our Senior Unsecured Notes with a weighted average interest rate of 4.85%. During 2013, we sold to affiliates and managed accounts of Prudential Investment Management, Inc. (individually(or individually and collectively "Prudential") $50.0Prudential) $70.0 million aggregate principal amount of 4.8%3.99% senior unsecured term notes fully amortizing to maturity on JulyNovember 20, 2021. Additionally,We used the proceeds to pay down our unsecured revolving line of credit.
On October 30, 2013, we entered into an Amendedamended and Restated Note Purchaserestated note purchase and Private Shelf Agreementprivate shelf agreement with Prudential. The shelf agreement with Prudential, which provides foras amended, conforms the possible issuance of up to an additional $100.0 million ofdefinitions and financial covenants contained therein and previously issued senior unsecured fixed-rate termpromissory notes during a three-year issuance period. Financialoutstanding to Prudential and certain of its affiliates and managed accounts to those contained in our unsecured credit facility and to covenants contained in the Amendedsenior unsecured notes sold in July 2012. Any notes sold by us to Prudential under the shelf agreement will be in amounts at fixed interest rates and Restated Note Purchasehave maturity dates (each note to have a final maturity not greater than 12 years and Private Shelfan average life not greater than 10 years from the date of issuance) subject to further agreement by us and Prudential.
The shelf agreement with Prudential contains standard covenants including requirements to maintain financial ratios such as debt to asset value ratios. Under the shelf agreement, maximum total indebtedness shall not exceed 50% of total asset value as defined in the shelf agreement, as amended. Borrowings under the shelf agreement are substantiallylimited by reference to the same asvalue of unencumbered assets. Under the financial covenants contained in our Unsecured Credit Agreement. At December 31, 2011, we were in compliance with all our covenants.
During 2011, we redeemed 3,536,530 shares of our Series F preferred stock, representing allshelf agreement, maximum unsecured debt shall not exceed 60% of the outstanding shares. The Series F preferred stock had a liquidation value of $25.00 per share. The redemption price was $25.1333 per share, including accrued and unpaid dividends up to the redemption date. Accordingly, we recognized the $3.6 million of original issue costs related to the Series F preferred stockunencumbered asset pool as a preferred stock redemption chargedefined in the consolidated income statement line item income allocated to preferred stockholders.shelf agreement.
During 2011,2013, we sold 3,990,0004,025,000 shares of common stock at a price of $27.25$44.50 per share, before fees and costs of $5.1$7.7 million, in an underwrittena public offering. The net proceeds of $103.6$171.4 million were used to redeem all of our Series F preferred stock outstanding, as previously discussed, and the remaining net proceeds were used to partially repaypay down amounts outstanding under our Unsecured Credit Agreement.unsecured revolving line of credit, to fund acquisitions and our current development commitments and general corporate purposes. During the twelve months ended December 31, 2013, we acquired 6,925 shares of common stock held by employees who tendered owned shares to satisfy tax withholding obligations.
We haveDuring 2013, we terminated an equity distribution agreement which allowsallowed us to issue and sell, from time to time, up to $85.7 million in aggregate offering price of our common shares. Sales of common shares arewere made by means of ordinary brokers' transactions at market prices, in block transactions, or as otherwise agreed between us and our sales agents. During the year ended December 31, 2011,2013, we did not sellsold 126,742 shares of common stock for $4.9 million in net proceeds under our equity distribution agreement. At December 31, 2011In conjunction with the sale of common stock, we had $64.6reclassified $0.7 million available under this agreement.
Our Board of Directors authorized a share repurchase program enabling usaccumulated costs associated with the equity distribution agreement to repurchase up to 5,000,000 shares of our equity securities, including common and preferred securities. During 2011, we did not purchase shares of our equity securities. We continue to have an open Board authorization to purchase an additional 3,360,237 sharespaid in total of our equity securities.capital.
We paid cash dividends on our 8.5% Series C and Series F preferred stockCumulative Convertible Preferred Stock totaling $3.3 million and $4.0 million, respectively.million. Additionally, we declared and paid cash dividends on our common stock totaling $49.3$63.6 million. In January 2012,2014, we declared a monthly cash dividend of $0.145$0.17 per share on our common stock for the months of January, February and March 2012, which is a 3.6% increase from the previous $0.14 per share per month dividend. The monthly cash dividends are2014 payable on January 31, February 2928 and March 30, 2012,28, 2014, respectively, to stockholders of record on January 23, February 2120 and March 22, 2012,21, 2014, respectively.
At December 31, 2013, we had a 2008 Equity Participation Plan, under which 600,000 shares of common stock have been reserved for awards, including nonqualified stock option grants and restricted stock grants to officers, employees, non-employee directors and consultants. The terms of the awards
granted under the 2008 Equity Participation Plan are set by our compensation committee at its discretion. During 2011,2013, we granted 6,00034,400 shares of restricted common stock as follows:
| | | | | | |
No. of Shares | | Price per
Share | | Vesting Period |
|---|
| | 8,400 | | $ | 46.54 | | ratably over 3 years |
| | 6,000 | | $ | 41.83 | | ratably over 3 years |
| | 20,000 | | $ | 36.26 | | June 1, 2016 |
| | | | | | |
| | | | | | | |
| | 34,400 | | | | | |
| | | | | | |
| | | | | | | |
| | | | | | | |
| | | | | | |
Also during the twelve months ended December 31, 2013, the vesting of 18,180 shares of restricted common stock were accelerated due to the retirement of our former Senior Vice President, Marketing and Strategic Planning. Subsequent to December 31, 2014, we granted 59,000 shares of restricted common stock at $28.70$36.81 per share. These shares vest ratably over a three-year period from the grant date. We did not grant stock options during 2011. Also, during 2011,During the year ended December 31, 2013, a total of 5,00022,000 stock options were exercised at a total option value of $0.1$0.5 million and a total market value on the date of exercise of $0.2$0.9 million. In January 2012, weNo stock options were granted 14,000 sharesduring 2013 and all stock options outstanding are vested as of restricted common stock at $31.77 per share. These shares vest ratably over a five-year period from the grant date. Additionally, we granted 30,000 shares of restricted common stock at $31.77 per share. These shares all vest on June 15, 2015. We also granted 12,200 shares of restricted common stock at $31.77 per share in January 2012. These shares all vest on January 10, 2016.
We have one limited partnership. The limited partnership agreement allows the limited partners to convert, on a one-for-one basis, their limited partnership units into shares of common stock or the cash equivalent, at our option. At December 31, 2011, we have reserved 112,588 shares of our common stock under this partnership agreement. Since we exercise control, we consolidate the limited partnership and we carry the non-controlling interests at cost. During 2011, none of our limited partners exercised their conversion rights. At December 31, 2011, the carrying value and market value of the partnership conversion rights was $2.0 million and $3.5 million, respectively.
In January 2012, two of our limited partners exercised their conversion rights. One limited partner exchanged all of its 67,294 partnership units and the other limited partner exchanged 22,000 partnership units in the limited partnership. Upon receipt of the redemption notification of 89,294 limited partnership units, we elected to satisfy the redemption in cash. We paid the limited partners
$2.8 million, which represents the closing price of our common stock on the redemption date plus $0.05 per share multiplied by the number of limited partnership units redeemed. The amount we paid upon redemption exceeded the book value of the limited partnership interest redeemed by $1.2 million. In accordance with FASB accounting guidance, we account for this exchange as an equity transaction because there was no change in control requiring consolidation or deconsolidation and remeasurement. Accordingly, the $1.2 million excess book value of the limited partners' interest in the partnership was reclassified to stockholders' equity. Subsequent to these conversions, we have reserved 23,294 shares of our common stock under this partnership agreement.2013.
Available Shelf Registrations:Registration:
During 2010,On July 19, 2013, we filed a Form S-3S-3ASR "shelf" registration statement which became effective June 16, 2010, to replace our prior shelf registration statement. Our current shelf registration statement provides us with the capacity to offer up to $400.0$800.0 million in common stock, preferred stock, warrants, debt, depositary shares, or units. We may from time to time raise capital under our current shelf registration in amounts, at prices, and on terms to be announced when and if the securities are offered. The specifics of any future offerings, along with the use of proceeds of any securities offered, will be described in detail in a prospectus supplement, or other offering materials, at the time of the offering. At December 31, 2011, we had availability of $167.6 million under our effective shelf registration.
Commitments:
During 2011, we purchased four skilled nursing properties with 524-beds in Texas. As part of the purchase agreement,an acquisition in 2011, we paid cash at closing and committed to provide a contingent earn-out paymentspayment if certain operational thresholds arewere met. The contingent earn-out payment arrangements require us to pay two earn-out payments totalling up to $11.0 million upon the properties achieving a sustainable stipulated rent coverage ratio. We estimated thewas recorded at fair value, of the contingent earn-out paymentswhich was estimated using a discounted cash flow analysis.analysis, and we accreted the contingent liability to the settlement amount as of the payment date. The fair value of such contingent earn-out payments were recorded at the dateliability was re-evaluated on a quarterly basis based on changes in estimates of acquisitionfuture operating results and changes in the amount of $9.8market discount rates. During 2013, we paid $7.0 million and were included on the consolidated balance sheet line item "earn-out liabilities." During 2011, we recorded non-cash interest expense of $0.5 million$256,000 related to the earn-out liabilities which represent the accretion of the difference between the current fair value and estimated payment of the contingent earn-out liabilities. During 2011,liability. Accordingly, we paid $4.0 million related to the first contingent earn-out payment. At December 31, 2011, thehave no remaining contingent earn-out payments had a fair value of $6.3 million.
The following table summarizes our capital improvement commitmentsliability as of December 31, 2011(dollar amounts in thousands):2013.
| | | | | | | | | | | | | | | | | | | | |
Commitment | | Expiration
Date | | Used
Commitment
at 12/31/11 | | Open
Commitment
at 12/31/11 | | Estimated
Yield | | Property
Type | | Properties | | Major Operator |
|---|
| $ | 100 | | | 8/1/12 | | $ | — | | $ | 100 | | | | (2) | SNF | | | 1 | | N/A |
| | 730 | | | 8/31/13 | | | 674 | | | 56 | (7) | | 9.00 | %(3) | Other | (1) | | 2 | | N/A |
| | 8,250 | | | 10/11/13 | | | 50 | | | 8,200 | | | 9.00 | %(4) | SNF | (8) | | — | | N/A |
| | 5,000 | (6) | | 12/31/14 | | | — | | | 5,000 | | | | (5) | ALF | | | 37 | | ALC |
| | | | | | | | | | | | | | | | | | |
| $ | 14,080 | | | | | $ | 724 | | $ | 13,356 | | | | | | | | | | |
| | | | | | | | | | | | | | | | | | |
(1)Other senior housing As of December 31, 2013, we have a commitment to provide, under certain conditions, up to $5.0 million per year through December 2014 to an existing operator for expansion of the 37 properties consistthey lease from us. The estimated yield of independent living properties and properties providing any combination of skilled nursing, assisted living and/or independent living services.
(2)The yieldthis commitment is included in the initial lease rate.
(3)Minimum rent will increase on the 1st of each month by the amount advanced in the previous month multiplied by the estimated yield.
(4)Minimum rent will increase upon final funding and project completion or in some cases, the improvement deadline as defined in each lease agreement.
(5)- 9.5% plus the positive difference, if any, between the average yields on the U.S. Treasury 10-year note for the five days prior to funding, minus 420 basis
points (expressed as a percentage).
(6)$5,000points. As of December 31, 2013, no funds have been requested under this commitment. Excluding the $5.0 million per year forcommitment, the life of the lease.
(7)In January 2012, we funded this $56 commitment.
(8)During 2011, we acquired a vacant parcel of land in Texas and entered into a commitment to fund the construction of a skilled nursing property with 120 beds which will replace an existing 90-bed skilled nursing property.
The following table summarizes our loan investment
commitments as of December 31, 2011 (2013 and year to date funding on our ongoing development, redevelopment, renovation(excludes capitalized interest, dollar amounts in thousands):
| | | | | | | | | | | | | | | | | | | | |
Commitment | | Expiration
Date | | Used
Commitment
at 12/31/11 | | Open
Commitment
at 12/31/11 | | Yield | | Property
Type(1) | | Properties | | Major
Operator |
|---|
| $ | 50 | | | 3/31/12 | | $ | 20 | | $ | 30 | | | 10.00 | % | Other | | | 1 | | N/A |
| | 2,500 | (2) | | 12/31/12 | | | 232 | | | 2,268 | | | 8.50 | % | Other | | | 2 | | N/A |
| | | | | | | | | | | | | | | | | | |
| $ | 2,550 | | | | | $ | 252 | | $ | 2,298 | | | | | | | | | | |
| | | | | | | | | | | | | | | | | | |
| | | | | | | | | | | | | | | | | | | |
Type of Property | | Investment
Commitment | | 2013
Funding(2) | | Commitment
Funded | | Remaining
Commitment | | Number of
Properties | | Number of
Beds/Units | |
|---|
Skilled Nursing | | $ | 29,650 | | $ | 7,221 | | $ | 12,757 | | $ | 16,893 | | | 6 | | | 640 | |
Assisted Living(1) | | | 50,656 | | | 9,614 | | | 10,661 | | | 39,995 | | | 7 | | | 385 | |
| | | | | | | | | | | | | | |
| | | | | | | | | | | | | | | | | | | | |
Totals | | $ | 80,306 | | $ | 16,835 | (3) | $ | 23,418 | | $ | 56,888 | (3) | | 13 | | | 1,025 | |
| | | | | | | | | | | | | | |
| | | | | | | | | | | | | | | | | | | | |
| | | | | | | | | | | | | | | | | | | | |
| | | | | | | | | | | | | | |
- (1)
Other senior housingIncludes the development of three memory care properties consistfor a total of independent$30,256, one assisted living and memory care combination property for a total of $5,800, and the expansion of three assisted living properties for a total $14,600.- (2)
- Excludes funding for completed construction projects shown above and
properties providing any combination$260 of capital improvement on three completed projects with no remaining commitments. It also includes $6 funded under the commitment as marketing expense, $3,475 of land acquired for development and the reclass of three pre-development loans with a total balance of $479. SeeInvesting Activities above for further discussion on the pre-development loans. - (3)
- Subsequent to December 31, 2013, we funded $8,828 under investment commitments. Accordingly, we have a remaining commitment of $48,060.
We committed to fund a $10.6 million mortgage and construction loan secured by an operational skilled nursing assisted living and/or independent living services.
(2)Representsproperty and a vacant parcel of land upon which a 106-bed replacement facility will be constructed. Interest on the loan is paid monthly in arrears at a rate of 9.0% increasing 25 basis points annually. The term of the loan is 10 years. The agreement gives us the right to purchase the replacement facility for $13.5 million during an 18 month period beginning on the first anniversary of the issuance of the certificate of occupancy. If the purchase option is exercised, the replacement facility will be added to an existing master lease at a lease rate equivalent to the interest rate in effect on the loan at the time the purchase option is exercised. As of December 31, 2013, we funded $7.6 million of loan proceeds and we have a remaining commitment of $3.0 million on this mortgage and construction and term loanloan. We committed to provide a borrower an additional $12.0 million for capital improvements at two senior housing properties we own and, lease tounder certain operating metrics and valuation thresholds achieved and sustained within the borrower. Upon the earlierfirst twelve years of the full fundingterm, additional proceeds of the commitment orup to $40.0 million. As of December 31, 2012, construction distribution2013, there has been no funding under thiseither of these commitments. At December 31, 2013, we had outstanding commitments of $2.4 million in loans and line of credit agreements to certain operators. As of December 31, 2013, we had funded $0.6 million under these commitments and had a remaining commitment of $1.8 million. These loan will ceasecommitments have interest rates ranging from 10.0% to 12.25% and this loan will fully amortizematurities ranging from 2014 to maturity in November 2017.
Contractual Obligations:
We monitor our contractual obligations and commitments detailed above to ensure funds are available to meet obligations when due. The following table represents our long termlong-term contractual obligations (scheduled principal payments and amounts due at maturity) as of December 31, 2011,2013, and excludes the effects of interest (in thousands):
|
| | Total | | 2012 | | 2013 | | 2014 | | 2015 | | 2016 | | Thereafter | | | Total | | 2014 | | 2015 | | 2016 | | 2017 | | 2018 | | Thereafter | |
|---|
Bank borrowings | | $ | 56,000 | (1) | $ | — | | $ | — | | $ | — | | $ | 56,000 | | $ | — | | $ | — | | | $ | 21,000 | (1) | $ | — | | $ | — | | $ | 21,000 | | $ | — | | $ | — | | $ | — | |
Senior unsecured notes | | 100,000 | | — | | — | | 4,167 | | 29,166 | | 16,667 | | 50,000 | | | 255,800 | | 4,167 | | 29,166 | | 26,667 | | 26,167 | | 28,167 | | 141,466 | |
Bonds payable | | 3,200 | | 565 | | 600 | | 635 | | 1,400 | | — | | — | | | 2,035 | | 635 | | 1,400 | | — | | — | | — | | — | |
| | | | | | | | | | | | | | | | | | | | | | | | | | | | | | | |
| | | | | | | | | | | | | | | | | |
| | $ | 159,200 | | $ | 565 | | $ | 600 | | $ | 4,802 | | $ | 86,566 | | $ | 16,667 | | $ | 50,000 | | | $ | 278,835 | | $ | 4,802 | | $ | 30,566 | | $ | 47,667 | | $ | 26,167 | | $ | 28,167 | | $ | 141,466 | |
| | | | | | | | | | | | | | | | | | | | | | | | | | | | | | | |
| | | | | | | | | | | | | | | | | |
| | | | | | | | | | | | | | | | | |
| | | | | | | | | | | | | | | | | |
- (1)
- At December 31,
20112013 we had $154,000$219,000 available for borrowing under our Unsecured Credit Agreement. During January 2012,unsecured revolving line of credit. Subsequent to December 31, 2013, we borrowed $4,000. After this borrowing,$11,500. Accordingly, we had $60,000$32,500 outstanding and $150,000$207,500 available for borrowing.
Assuming no additional borrowing under our unsecured revolving line of credit, no change in the variable interest rate under our bond payable, and principal payments are paid as scheduled under our senior unsecured notes and bond payables, the following table represents our projected interest expense as of December 31, 2013 (in thousands):
| | | | | | | | | | | | | | | | | | | | | | |
| | Total | | 2014 | | 2015 | | 2016 | | 2017 | | 2018 | | Thereafter | |
|---|
Bank borrowings | | $ | 5,133 | | $ | 2,124 | | $ | 2,124 | | $ | 885 | | $ | — | | $ | — | | $ | — | |
Senior unsecured notes | | | 68,596 | | | 12,028 | | | 11,179 | | | 9,952 | | | 8,757 | | | 7,552 | | | 19,128 | |
Bonds payable | | | 60 | | | 41 | | | 19 | | | — | | | — | | | — | | | — | |
| | | | | | | | | | | | | | | | |
| | | | | | | | | | | | | | | | | | | | | | | |
| | $ | 73,789 | | $ | 14,193 | | $ | 13,322 | | $ | 10,837 | | $ | 8,757 | | $ | 7,552 | | $ | 19,128 | |
| | | | | | | | | | | | | | | | |
| | | | | | | | | | | | | | | | | | | | | | | |
| | | | | | | | | | | | | | | | | | | | | | | |
| | | | | | | | | | | | | | | | |
Off-Balance Sheet Arrangements:
We had no off-balance sheet arrangements as of December 31, 2011.2013.
Liquidity:
We have an Unsecured Credit Agreement in the amount of $210.0$240.0 million and it provides forwith the opportunity to increase the credit amount up to a total of $250.0$350.0 million. The Unsecured Credit Agreement provides a revolving line of credit with no scheduled maturities other than the maturity date of April 18, 2015.May 25, 2016. Based on our current maximum total indebtedness to total asset value ratio as calculated in the Unsecured Credit Agreement, our current pricing under the Unsecured Credit Agreement is either Prime Rate plus 0.50%0.25% or LIBOR plus 1.50%1.25% depending on our borrowing election. At the time of borrowing, we may elect the 1, 2, 3 or 6 month LIBOR rate.
At December 31, 2011,2013, we had $4.4$6.8 million of cash on hand, $154.0$219.0 million available on our $210.0 million Unsecured Credit Agreement,unsecured revolving line of credit, and $100.0$30.0 million available under the uncommitted private shelf agreement. Subsequent to December 31, 2013, we borrowed $11.5 million and, therefore, have $207.5 million available under or unsecured revolving line of credit. Also, our potential ability to access the capital markets through the issuance of $64.6 million of common stock under our equity distribution agreement and through the issuance of debt and/or equity securities under our $167.6$800.0 million effective shelf registration. As a result, we believe our liquidity and various sources of available capital are sufficient to provide for payment of our current operating costs, debt obligations (both principal and interest) and capital commitments to our lessees and borrowers and to provide funds for distribution to the holders of our preferred stock and pay common dividends at least sufficient to maintain our REIT status. The timing, source and amount of cash flows provided by financing activities and used in investing activities are sensitive to the capital markets environment, especially to changes in interest rates.
Item 7A. QUANTITATIVE AND QUALITATIVE DISCLOSURES ABOUT MARKET RISK
You are cautioned that statements contained in this section are forward looking and should be read in conjunction with the disclosure under the heading "Cautionary Statements" and the "Risk Factors" set forth above.
We are exposed to market risks associated with changes in interest rates as they relate to our mortgage loans receivable and debt. Interest rate risk is sensitive to many factors, including governmental monetary and tax policies, domestic and international economic and political considerations and other factors that are beyond our control.
We do not utilize interest rate swaps, forward or option contracts or foreign currencies or commodities, or other types of derivative financial instruments nor do we engage in "off-balance sheet" transactions. The purpose of the following disclosure is to provide a framework to understand our sensitivity to hypothetical changes in interest rates as of December 31, 2011.2013.
Our future earnings, cash flows and estimated fair values relating to financial instruments are dependent upon prevalent market rates of interest, such as LIBOR or term rates of U.S. Treasury Notes. Changes in interest rates generally impact the fair value, but not future earnings or cash flows, of mortgage loans receivable and fixed rate debt. Our mortgage loans receivable and debt, such as our senior unsecured notes, are primarily fixed-rate instruments. For variable rate debt, such as our revolving line of credit, changes in interest rates generally do not impact the fair value, but do affect future earnings and cash flows.
At December 31, 2011,2013, the fair value of our mortgage loans receivable using a 6.0%an 8.4% discount rate was approximately $61.8$200.2 million. A 1% increase in such rates would decrease the estimated fair value of our mortgage loans by approximately $1.8$16.5 million while a 1% decrease in such rates would increase their estimated fair value by approximately $1.8$19.6 million. At December 31, 2011,2013, the fair value of our senior unsecured notes using a 4.8%3.95% discount rate for those maturing before year 2020 and 4.25% discount rate for those maturing beyond year 2020 was approximately $101.2$262.4 million. A 1% increase in such rates would decrease the estimated fair value of our senior unsecured notes by approximately
$4.5 $12.3 million while a 1% decrease in such rates would increase their estimated fair value by approximately $4.8$13.1 million. These discount rates were measured based upon management's estimates of rates currently prevailing for comparable loans available to us and instruments of comparable maturities.
The estimated impact of changes in interest rates discussed above are determined by considering the impact of the hypothetical interest rates on our borrowing costs, lending rates and current U.S. Treasury rates from which our financial instruments may be priced. We do not believe that future market rate risks related to our financial instruments will be material to our financial position or results of operations. These analyses do not consider the effects of industry specific events, changes in the real estate markets, or other overall economic activities that could increase or decrease the fair value of our financial instruments. If such events or changes were to occur, we would consider taking actions to mitigate and/or reduce any negative exposure to such changes. However, due to the uncertainty of the specific actions that would be taken and their possible effects, the sensitivity analysis assumes no changes in our capital structure.
Item 8. FINANCIAL STATEMENTS
Index to Consolidated Financial Statements
and Financial Statement Schedules
| | |
| | Page |
|---|
Report of Independent Registered Public Accounting Firm | | 5153 |
Consolidated Balance Sheets as of December 31, 20112013 and 20102012 | |
5254 |
Consolidated Statements of Income for the years ended December 31, 2013, 2012 and 2011 | |
55 |
Consolidated Statements of Comprehensive Income for the years ended December 31, 2011, 20102013, 2012 and 20092011 | |
5356 |
Consolidated Statements of Equity for the years ended December 31, 2011, 20102013, 2012 and 20092011 | |
5457 |
Consolidated Statements of Cash Flows for the years ended December 31, 2011, 20102013, 2012 and 20092011 | |
5558 |
Notes to Consolidated Financial Statements | |
5659 |
Consolidated Financial Statement Schedules | |
|
Schedule II—Valuation and Qualifying Accounts | |
8386 |
Schedule III—Real Estate and Accumulated Depreciation | |
8487 |
Schedule IV—Mortgage Loans on Real Estate | |
8992 |
Management Report on Internal Control over Financial Reporting | |
9295 |
Report of Independent Registered Public Accounting Firm | |
9396 |
REPORT OF INDEPENDENT REGISTERED PUBLIC ACCOUNTING FIRM
To the Board of Directors and Stockholders of LTC Properties, Inc.
We have audited the accompanying consolidated balance sheets of LTC Properties, Inc. (the "Company") as of December 31, 20112013 and 2010,2012, and the related consolidated statements of income, and comprehensive income, equity, and cash flows for each of the three years in the period ended December 31, 2011.2013. Our audits also included the financial statement schedules listed in the Index at Item 15. These financial statements and schedules are the responsibility of the Company's management. Our responsibility is to express an opinion on these financial statements and schedules based on our audits.
We conducted our audits in accordance with the standards of the Public Company Accounting Oversight Board (United States). Those standards require that we plan and perform the audit to obtain reasonable assurance about whether the financial statements are free of material misstatement. An audit includes examining, on a test basis, evidence supporting the amounts and disclosures in the financial statements. An audit also includes assessing the accounting principles used and significant estimates made by management, as well as evaluating the overall financial statement presentation. We believe that our audits provide a reasonable basis for our opinion.
In our opinion, the financial statements referred to above present fairly, in all material respects, the consolidated financial position of LTC Properties, Inc. at December 31, 20112013 and 2010,2012, and the consolidated results of its operations and its cash flows for each of the three years in the period ended December 31, 2011,2013, in conformity with U.S. generally accepted accounting principles. Also, in our opinion, the related financial statement schedules, when considered in relation to the basic financial statements taken as a whole, present fairly in all material respects, the information set forth therein.
We also have audited, in accordance with the standards of the Public Company Accounting Oversight Board (United States), LTC Properties, Inc.'s internal control over financial reporting as of December 31, 2011,2013, based on criteria established in Internal Control—Integrated Framework issued by the Committee of Sponsoring Organizations of the Treadway Commission (1992 framework) and our report dated February 27, 201220, 2014 expressed an unqualified opinion thereon.
| | |
| | | /s/ ErnstERNST & YoungYOUNG LLP |
Los Angeles, California
February 27, 201220, 2014
LTC PROPERTIES, INC.
CONSOLIDATED BALANCE SHEETS
(In thousands)
| | | | | | | |
| | December 31,
2013 | | December 31,
2012 | |
|---|
ASSETS | | | | | | | |
Real estate investments: | | | | | | | |
Land | | $ | 80,993 | | $ | 74,702 | |
Buildings and improvements | | | 856,624 | | | 811,867 | |
Accumulated depreciation and amortization | | | (218,700 | ) | | (194,448 | ) |
| | | | | | |
| | | | | | | | |
Net operating real estate property | | | 718,917 | | | 692,121 | |
Properties held-for-sale, net of accumulated depreciation and amortization: 2013—$0; 2012—$4,100 | | | — | | | 9,426 | |
| | | | | | |
| | | | | | | | |
Net real estate property | | | 718,917 | | | 701,547 | |
Mortgage loans receivable, net of allowance for doubtful accounts: 2013—$1,671; 2012—$782 | | | 165,444 | | | 39,299 | |
| | | | | | |
| | | | | | | | |
Real estate investments, net | | | 884,361 | | | 740,846 | |
Other assets: | | |
| | |
| |
Cash and cash equivalents | | | 6,778 | | | 7,191 | |
Debt issue costs, net | | | 2,458 | | | 3,040 | |
Interest receivable | | | 702 | | | 789 | |
Straight-line rent receivable,(1) net of allowance for doubtful accounts: 2013—$1,541; 2012—$1,513 | | | 29,760 | | | 26,766 | |
Prepaid expenses and other assets | | | 6,756 | | | 7,542 | |
Notes receivable | | | 595 | | | 3,180 | |
Straight-line rent receivable and other assets related to properties held-for-sale, net of allowance for doubtful accounts: 2013—$0; 2012—$44 | | | — | | | 238 | |
| | | | | | |
| | | | | | | | |
Total assets | | $ | 931,410 | | $ | 789,592 | |
| | | | | | |
| | | | | | | | |
| | | | | | | | |
| | | | | | |
LIABILITIES | | | | | | | |
Bank borrowings | | $ | 21,000 | | $ | 115,500 | |
Senior unsecured notes | | | 255,800 | | | 185,800 | |
Bonds payable | | | 2,035 | | | 2,635 | |
Accrued interest | | | 3,424 | | | 3,279 | |
Earn-out liabilities | | | — | | | 6,744 | |
Accrued expenses and other liabilities | | | 16,713 | | | 12,165 | |
Accrued expenses and other liabilities related to properties held-for-sale | | | — | | | 361 | |
| | | | | | |
| | | | | | | | |
Total liabilities | | | 298,972 | | | 326,484 | |
EQUITY | | |
| | |
| |
Stockholders' equity: | | | | | | | |
Preferred stock $0.01 par value; 15,000 shares authorized; shares issued and outstanding: 2013—2,000; 2012—2,000 | | | 38,500 | | | 38,500 | |
Common stock: $0.01 par value; 60,000 shares authorized; shares issued and outstanding: 2013—34,746; 2012—30,544 | | | 347 | | | 305 | |
Capital in excess of par value | | | 688,654 | | | 510,236 | |
Cumulative net income | | | 781,848 | | | 724,033 | |
Accumulated other comprehensive income | | | 117 | | | 152 | |
Cumulative distributions | | | (877,028 | ) | | (810,125 | ) |
| | | | | | |
| | | | | | | | |
Total LTC Properties, Inc. stockholders' equity | | | 632,438 | | | 463,101 | |
Non-controlling interests | | |
— | | |
7 | |
| | | | | | |
| | | | | | | | |
Total equity | | | 632,438 | | | 463,108 | |
| | | | | | |
| | | | | | | | |
Total liabilities and equity | | $ | 931,410 | | $ | 789,592 | |
| | | | | | |
| | | | | | | | |
| | | | | | | | |
| | | | | | |
| | | | | | | |
| | December 31, | |
|---|
| | 2011 | | 2010 | |
|---|
ASSETS | | | | | | | |
Real Estate Investments: | | | | | | | |
Land | | $ | 57,093 | | $ | 43,031 | |
Buildings and improvements | | | 662,300 | | | 567,017 | |
Accumulated depreciation and amortization | | | (177,583 | ) | | (158,204 | ) |
| | | | | | |
Net operating real estate property | | | 541,810 | | | 451,844 | |
Properties held-for-sale, net of accumulated depreciation and amortization: 2011—$613; 2010—$505 | | | 5,025 | | | 5,113 | |
| | | | | | |
Net real estate property | | | 546,835 | | | 456,957 | |
Mortgage loans receivable, net of allowance for doubtful accounts: 2011—$921; 2010—$981 | | | 53,081 | | | 59,026 | |
| | | | | | |
Real estate investments, net | | | 599,916 | | | 515,983 | |
Other Assets: | | | | | | | |
Cash and cash equivalents | | | 4,408 | | | 6,903 | |
Debt issue costs, net | | | 2,301 | | | 743 | |
Interest receivable | | | 1,494 | | | 1,571 | |
Straight-line rent receivable,(1) net of allowance for doubtful accounts: 2011—$680; 2010—$634 | | | 23,772 | | | 20,090 | |
Prepaid expenses and other assets | | | 7,852 | | | 8,162 | |
Other assets related to properties held-for-sale, net of allowance for doubtful accounts: 2011—$839; 2010—$839 | | | 52 | | | 51 | |
Notes receivable | | | 817 | | | 1,283 | |
Marketable securities(2) | | | 6,485 | | | 6,478 | |
| | | | | | |
Total assets | | $ | 647,097 | | $ | 561,264 | |
| | | | | | |
LIABILITIES | | | | | | | |
Bank borrowings | | $ | 56,000 | | $ | 37,700 | |
Senior unsecured notes | | | 100,000 | | | 50,000 | |
Bonds payable | | | 3,200 | | | 3,730 | |
Accrued interest | | | 1,356 | | | 675 | |
Earn-out liabilities | | | 6,305 | | | — | |
Accrued expenses and other liabilities | | | 11,400 | | | 9,737 | |
Accrued expenses and other liabilities related to properties held-for-sale | | | 126 | | | 132 | |
Distributions payable | | | — | | | 1,768 | |
| | | | | | |
Total liabilities | | | 178,387 | | | 103,742 | |
EQUITY | | | | | | | |
Stockholders' equity: | | | | | | | |
Preferred stock $0.01 par value: 15,000 shares authorized; shares issued | | | | | | | |
and outstanding: 2011—2,000; 2010—5,536 | | | 38,500 | | | 126,913 | |
Common stock: $0.01 par value; 45,000 shares authorized; shares issued and outstanding: 2011—30,346; 2010—26,345 | | | 303 | | | 263 | |
Capital in excess of par value | | | 507,343 | | | 398,599 | |
Cumulative net income | | | 672,743 | | | 623,491 | |
Other | | | 199 | | | 264 | |
Cumulative distributions | | | (752,340 | ) | | (693,970 | ) |
| | | | | | |
Total LTC Properties, Inc. stockholders' equity | | | 466,748 | | | 455,560 | |
Non-controlling interests | | | 1,962 | | | 1,962 | |
| | | | | | |
Total equity | | | 468,710 | | | 457,522 | |
| | | | | | |
Total liabilities and equity | | $ | 647,097 | | $ | 561,264 | |
| | | | | | |
- (1)
- On December 31,
20112013 and 2010,2012, we had $3,060$3,213 and $2,822,$3,191 respectively, in straight-line rent receivable from a lessee that qualifies as a related party because the lessee's Chief Executive Officer is on our Board of Directors. SeeNote 12. Transactions with Related Party for further discussion.
(2)At December 31, 2011 and 2010, we had a $6,500 face value investment in marketable securities issued by an entity that qualifies as a related party because the entity'sformer Chief Executive Officer is on our Board of Directors. SeeNote 12. Transactions with Related Party for further discussion.
See accompanying notes.
LTC PROPERTIES, INC.
CONSOLIDATED STATEMENTS OF INCOME AND COMPREHENSIVE INCOME
(In thousands, except per share amounts)
| | | | | | | | | | |
| | Years ended December 31, | |
|---|
| | 2013 | | 2012 | | 2011 | |
|---|
Revenues: | | | | | | | | | | |
Rental income(1) | | $ | 98,166 | | $ | 86,022 | | $ | 76,096 | |
Interest income from mortgage loans | | | 6,298 | | | 5,496 | | | 6,411 | |
Interest and other income(2) | | | 510 | | | 964 | | | 1,111 | |
| | | | | | | | |
| | | | | | | | | | | |
Total revenues | | | 104,974 | | | 92,482 | | | 83,618 | |
| | | | | | | | |
| | | | | | | | | | | |
Expenses: | | | | | | | | | | |
Interest expense | | | 11,364 | | | 9,932 | | | 6,434 | |
Depreciation and amortization | | | 24,389 | | | 21,613 | | | 18,911 | |
Provision (recovery) for doubtful accounts | | | 2,180 | | | (101 | ) | | (13 | ) |
General and administrative expenses | | | 11,636 | | | 10,732 | | | 9,666 | |
| | | | | | | | |
| | | | | | | | | | | |
Total expenses | | | 49,569 | | | 42,176 | | | 34,998 | |
| | | | | | | | |
| | | | | | | | | | | |
Income from continuing operations | | | 55,405 | | | 50,306 | | | 48,620 | |
Discontinued operations: | | | | | | | | | | |
Income from discontinued operations | | | 805 | | | 1,005 | | | 823 | |
Gain on sale of assets, net | | | 1,605 | | | 16 | | | — | |
| | | | | | | | |
| | | | | | | | | | | |
Net income (loss) from discontinued operations | | | 2,410 | | | 1,021 | | | 823 | |
| | | | | | | | |
| | | | | | | | | | | |
Net income | | | 57,815 | | | 51,327 | | | 49,443 | |
Income allocated to non-controlling interests | | | — | | | (37 | ) | | (191 | ) |
| | | | | | | | |
| | | | | | | | | | | |
Net income attributable to LTC Properties, Inc. | | | 57,815 | | | 51,290 | | | 49,252 | |
| | | | | | | | |
| | | | | | | | | | | |
Income allocated to participating securities | | | (383 | ) | | (377 | ) | | (342 | ) |
Income allocated to preferred stockholders | | | (3,273 | ) | | (3,273 | ) | | (9,078 | ) |
| | | | | | | | |
| | | | | | | | | | | |
Net income available to common stockholders | | $ | 54,159 | | $ | 47,640 | | $ | 39,832 | |
| | | | | | | | |
| | | | | | | | | | | |
| | | | | | | | | | | |
| | | | | | | | |
Basic earnings per common share: | | | | | | | | | | |
Continuing operations | | $ | 1.56 | | $ | 1.54 | | $ | 1.34 | |
Discontinued operations | | $ | 0.07 | | $ | 0.03 | | $ | 0.03 | |
| | | | | | | | |
| | | | | | | | | | | |
Net income available to common stockholders | | $ | 1.64 | | $ | 1.58 | | $ | 1.36 | |
| | | | | | | | |
| | | | | | | | | | | |
| | | | | | | | | | | |
| | | | | | | | |
Diluted earnings per common share: | | | | | | | | | | |
Continuing operations | | $ | 1.56 | | $ | 1.54 | | $ | 1.33 | |
Discontinued operations | | $ | 0.07 | | $ | 0.03 | | $ | 0.02 | |
| | | | | | | | |
| | | | | | | | | | | |
Net income available to common stockholders | | $ | 1.63 | | $ | 1.57 | | $ | 1.36 | |
| | | | | | | | |
| | | | | | | | | | | |
| | | | | | | | | | | |
| | | | | | | | |
Weighted average shares used to calculate earnings per common share: | | | | | | | | | | |
Basic | | | 33,111 | | | 30,238 | | | 29,194 | |
Diluted | | | 33,142 | | | 30,278 | | | 29,222 | |
| | | | | | | | | | |
| | Years ended December 31, | |
|---|
| | 2011 | | 2010 | | 2009 | |
|---|
Revenues: | | | | | | | | | | |
Rental income(1) | | $ | 77,643 | | $ | 64,351 | | $ | 58,908 | |
Interest income from mortgage loans | | | 6,411 | | | 7,482 | | | 8,558 | |
Interest and other income(2) | | | 1,106 | | | 1,863 | | | 1,328 | |
| | | | | | | | |
Total revenues | | | 85,160 | | | 73,696 | | | 68,794 | |
| | | | | | | | |
Expenses: | | | | | | | | | | |
Interest expense | | | 6,434 | | | 2,653 | | | 2,418 | |
Depreciation and amortization | | | 19,515 | | | 15,717 | | | 14,320 | |
Provisions for doubtful accounts | | | (13 | ) | | 1,409 | | | 196 | |
Acquisition costs | | | 393 | | | 370 | | | 180 | |
Operating and other expenses | | | 9,158 | | | 7,687 | | | 7,207 | |
| | | | | | | | |
Total expenses | | | 35,487 | | | 27,836 | | | 24,321 | |
| | | | | | | | |
Income from continuing operations | | | 49,673 | | | 45,860 | | | 44,473 | |
Discontinued operations: | | | | | | | | | | |
Loss from discontinued operations | | | (230 | ) | | (117 | ) | | (113 | ) |
Gain on sale of assets, net | | | — | | | 310 | | | — | |
| | | | | | | | |
Net (loss) income from discontinued operations | | | (230 | ) | | 193 | | | (113 | ) |
| | | | | | | | |
Net income | | | 49,443 | | | 46,053 | | | 44,360 | |
Income allocated to non-controlling interests | | | (191 | ) | | (191 | ) | | (296 | ) |
| | | | | | | | |
Net income attributable to LTC Properties, Inc. | | | 49,252 | | | 45,862 | | | 44,064 | |
| | | | | | | | |
Income allocated to participating securities | | | (342 | ) | | (230 | ) | | (139 | ) |
Income allocated to preferred stockholders | | | (9,078 | ) | | (16,045 | ) | | (14,515 | ) |
| | | | | | | | |
Net income available to common stockholders | | $ | 39,832 | | $ | 29,587 | | $ | 29,410 | |
| | | | | | | | |
Net income | |
$ |
49,443 | |
$ |
46,053 | |
$ |
44,360 | |
Reclassification adjustment | | | (65 | ) | | (126 | ) | | (345 | ) |
| | | | | | | | |
Comprehensive income | | | 49,378 | | | 45,927 | | | 44,015 | |
Comprehensive income allocated to non-controlling interests | | | (191 | ) | | (191 | ) | | (296 | ) |
| | | | | | | | |
Comprehensive income attributed to LTC Properties, Inc. | | $ | 49,187 | | $ | 45,736 | | $ | 43,719 | |
| | | | | | | | |
Basic earnings per common share (See Note 14): | | | | | | | | | | |
Continuing operations | | $ | 1.37 | | $ | 1.20 | | $ | 1.28 | |
Discontinued operations | | $ | (0.01 | ) | $ | 0.01 | | $ | (0.00 | ) |
| | | | | | | | |
Net income available to common stockholders | | $ | 1.36 | | $ | 1.21 | | $ | 1.27 | |
| | | | | | | | |
Diluted earnings per common share (See Note 14): | | | | | | | | | | |
Continuing operations | | $ | 1.37 | | $ | 1.20 | | $ | 1.28 | |
Discontinued operations | | $ | (0.01 | ) | $ | 0.01 | | $ | (0.00 | ) |
| | | | | | | | |
Net income available to common stockholders | | $ | 1.36 | | $ | 1.21 | | $ | 1.27 | |
| | | | | | | | |
Weighted average shares used to calculate earnings per common share: | | | | | | | | | | |
Basic | | | 29,194 | | | 24,495 | | | 23,099 | |
Diluted | | | 29,222 | | | 24,568 | | | 23,182 | |
- (1)
- During
2011, 20102013, 2012 and 2009,2011, we received $4,264, $4,160,$4,479, $4,370, and $4,058,$4,264, respectively, in rental income and recorded $238, $342$22, $131 and $443,$238, respectively, in straight-line rental income from a lessee that qualifies as a related party because the lessee's Chief Executive Officer is on our Board of Directors. SeeNote 12. Transactions with Related Party for further discussion.
(2)During 2011, 2010 and 2009 we recognized $721, $720, and $720, respectively, of interest income from an entity that qualifies as a related party because the entity'sformer Chief Executive Officer is on our Board of Directors. SeeNote 12. Transactions with Related Party for further discussion.- (2)
- During 2013, we did not recognize any interest income from related parties. During 2012 and 2011 we recognized $235, and $721, respectively, of interest income from an entity that qualifies as a related party because the entity's former Chief Executive Officer is on our Board of Directors. SeeNote 12. Transactions with Related Party for further discussion.
NOTE: Computations of per share amounts from continuing operations, discontinued operations and net income are made independently. Therefore, the sum of per share amounts from continuing operations and discontinued operations may not agree with the per share amounts from net income available to common stockholders.
See accompanying notes.
LTC PROPERTIES, INC.
CONSOLIDATED STATEMENTS OF EQUITYCOMPREHENSIVE INCOME
(In thousands, except per share amounts)
| | | | | | | | | | |
| | Years ended December 31, | |
|---|
| | 2013 | | 2012 | | 2011 | |
|---|
Net income | | $ | 57,815 | | $ | 51,327 | | $ | 49,443 | |
Reclassification adjustment | | | (35 | ) | | (47 | ) | | (65 | ) |
| | | | | | | | |
| | | | | | | | | | | |
Comprehensive income | | | 57,780 | | | 51,280 | | | 49,378 | |
Comprehensive income allocated to non-controlling interests | | | — | | | (37 | ) | | (191 | ) |
| | | | | | | | |
| | | | | | | | | | | |
Comprehensive income attributable to LTC Properties, Inc. | | $ | 57,780 | | $ | 51,243 | | $ | 49,187 | |
| | | | | | | | |
| | | | | | | | | | | |
| | | | | | | | | | | |
| | | | | | | | |
See accompanying notes.
LTC PROPERTIES, INC.
CONSOLIDATED STATEMENTS OF EQUITY
(In thousands)
|
| | Shares | |
| |
| |
| |
| |
| |
| |
| |
| |
| | | Shares | |
| |
| |
| |
| |
| |
| |
| |
| |
| |
|---|
| | Preferred
Stock | | Common
Stock | | Preferred
Stock | | Common
Stock | | Capital in
Excess of
Par Value | | Cumulative
Net
Income | | Other | | Cumulative
Distributions | | Total
Stockholders'
Equity | | Non-
controlling
Interests | | Total
Equity | | | Preferred
Stock | | Common
Stock | | Preferred
Stock | | Common
Stock | | Capital in
Excess of
Par Value | | Cumulative
Net
Income | | Accumulated
OCI | | Cumulative
Distributions | | Total
Stockholders'
Equity | | Non-
controlling
Interests | | Total
Equity | |
|---|
Balance—December 31, 2008 | | 8,042 | | 23,136 | | $ | 189,560 | | $ | 231 | | $ | 321,979 | | $ | 533,565 | | $ | 735 | | $ | (588,192 | ) | $ | 457,878 | | $ | 3,134 | | $ | 461,012 | | |
Conversion of 8.5% Series E Preferred Stock | |
(1 |
) | |
2 | |
(22 |
) | |
— | |
22 | |
— | |
— | |
— | |
— | |
— | |
— | | |
Reclassification adjustment | | — | | — | | — | | — | | — | | — | | (345 | ) | | — | | (345 | ) | | — | | (345 | ) | |
Stock option exercises | | — | | 35 | | — | | — | | 770 | | — | | — | | — | | 770 | | — | | 770 | | |
Repurchase of stock | | (109 | ) | | (1 | ) | | (2,737 | ) | | — | | 95 | | — | | — | | 626 | | (2,016 | ) | | — | | (2,016 | ) | |
Issue common stock | | — | | 30 | | — | | — | | 766 | | — | | — | | — | | 766 | | — | | 766 | | |
Issue restricted stock | | — | | 43 | | — | | 1 | | (1 | ) | | — | | — | | — | | — | | — | | — | | |
Net income | | — | | — | | — | | — | | — | | 44,064 | | — | | — | | 44,064 | | 296 | | 44,360 | | |
Vested stock options | | — | | — | | — | | — | | 147 | | — | | — | | — | | 147 | | — | | 147 | | |
Vested restricted stock | | — | | — | | — | | — | | 1,242 | | — | | — | | — | | 1,242 | | — | | 1,242 | | |
Non-controlling interests conversion | | — | | 67 | | — | | 1 | | 1,143 | | — | | — | | — | | 1,144 | | (1,144 | ) | | — | | |
Non-controlling interests preferred return | | — | | — | | — | | — | | — | | — | | — | | — | | — | | (305 | ) | | (305 | ) | |
Preferred stock dividends | | — | | — | | — | | — | | — | | — | | — | | (15,141 | ) | | (15,141 | ) | | — | | (15,141 | ) | |
Common stock cash distributions ($1.56 per share) | | — | | — | | — | | — | | — | | — | | — | | (36,177 | ) | | (36,177 | ) | | — | | (36,177 | ) | |
| | | | | | | | | | | | | | | | | | | | | | | | | |
Balance—December 31, 2009 | | 7,932 | | 23,312 | | 186,801 | | 233 | | 326,163 | | 577,629 | | 390 | | (638,884 | ) | | 452,332 | | 1,981 | | 454,313 | | |
| | | | | | | | | | | | | | | | | | | | | | | | | |
Conversion of 8.5% Series E Preferred Stock | | (33 | ) | | 66 | | (823 | ) | | 1 | | 822 | | — | | — | | — | | — | | — | | — | | |
8.5% Series E Preferred Stock full redemption | | (5 | ) | | — | | (123 | ) | | — | | 6 | | — | | — | | (6 | ) | | (123 | ) | | — | | (123 | ) | |
8.0% Series F Preferred Stock partial redemption | | (2,358 | ) | | — | | (58,942 | ) | | — | | 2,377 | | — | | — | | (2,377 | ) | | (58,942 | ) | | — | | (58,942 | ) | |
Reclassification adjustment | | — | | — | | — | | — | | — | | — | | (126 | ) | | — | | (126 | ) | | | | (126 | ) | |
Stock option exercises | | — | | 12 | | — | | — | | 182 | | — | | — | | — | | 182 | | — | | 182 | | |
Issue common stock | | — | | 2,746 | | — | | 27 | | 67,766 | | — | | — | | — | | 67,793 | | — | | 67,793 | | |
Issue restricted stock | | — | | 209 | | — | | 2 | | (2 | ) | | — | | — | | — | | — | | — | | — | | |
Net income | | — | | — | | — | | — | | — | | 45,862 | | — | | — | | 45,862 | | 191 | | 46,053 | | |
Vested stock options | | — | | — | | — | | — | | 75 | | — | | — | | — | | 75 | | — | | 75 | | |
Vested restricted stock | | — | | — | | — | | — | | 1,210 | | — | | — | | — | | 1,210 | | — | | 1,210 | | |
Non-controlling interests preferred return | | — | | — | | — | | — | | — | | — | | — | | — | | — | | (210 | ) | | (210 | ) | |
Preferred stock dividends | | — | | — | | — | | — | | — | | — | | — | | (13,662 | ) | | (13,662 | ) | | — | | (13,662 | ) | |
Common stock cash distributions ($1.58 per share) | | — | | — | | — | | — | | — | | — | | — | | (39,041 | ) | | (39,041 | ) | | — | | (39,041 | ) | |
| | | | | | | | | | | | | | | | | | | | | | | | | |
Balance—December 31, 2010 | | 5,536 | | 26,345 | | 126,913 | | 263 | | 398,599 | | 623,491 | | 264 | | (693,970 | ) | | 455,560 | | 1,962 | | 457,522 | | | 5,536 | | 26,345 | | $ | 126,913 | | $ | 263 | | $ | 398,599 | | $ | 623,491 | | $ | 264 | | $ | (693,970 | ) | $ | 455,560 | | $ | 1,962 | | $ | 457,522 | |
| | | | | | | | | | | | | | | | | | | | | | | | | |
8.0% Series F Preferred Stock full redemption | | (3,536 | ) | | — | | (88,413 | ) | | — | | 3,566 | | — | | — | | (3,566 | ) | | (88,413 | ) | | — | | (88,413 | ) | |
(3,536 |
) | |
— | |
(88,413 |
) | |
— | |
3,566 | |
— | |
— | |
(3,566 |
) | |
(88,413 |
) | |
— | |
(88,413 |
) |
Reclassification adjustment | | — | | — | | — | | — | | — | | — | | (65 | ) | | — | | (65 | ) | | — | | (65 | ) | | — | | — | | — | | — | | — | | — | | (65 | ) | | — | | (65 | ) | | — | | (65 | ) |
Stock option exercises | | — | | 5 | | — | | — | | 120 | | — | | — | | — | | 120 | | — | | 120 | | | — | | 5 | | — | | — | | 120 | | — | | — | | — | | 120 | | — | | 120 | |
Issue common stock | | — | | 3,990 | | — | | 40 | | 103,591 | | — | | — | | — | | 103,631 | | — | | 103,631 | | | — | | 3,990 | | — | | 40 | | 103,591 | | — | | — | | — | | 103,631 | | — | | 103,631 | |
Issue restricted stock | | — | | 6 | | — | | — | | — | | — | | — | | — | | — | | — | | — | | | — | | 6 | | — | | — | | — | | — | | — | | — | | — | | — | | — | |
Net income | | — | | — | | — | | — | | — | | 49,252 | | — | | — | | 49,252 | | 191 | | 49,443 | | | — | | — | | — | | — | | — | | 49,252 | | — | | — | | 49,252 | | 191 | | 49,443 | |
Vested stock options | | — | | — | | — | | — | | 17 | | — | | — | | — | | 17 | | — | | 17 | | | — | | — | | — | | — | | 17 | | — | | — | | — | | 17 | | — | | 17 | |
Vested restricted stock | | — | | — | | — | | — | | 1,450 | | — | | — | | — | | 1,450 | | — | | 1,450 | | | — | | — | | — | | — | | 1,450 | | — | | — | | — | | 1,450 | | — | | 1,450 | |
Non-controlling interests preferred return | | — | | — | | — | | — | | — | | — | | — | | — | | — | | (191 | ) | | (191 | ) | | — | | — | | — | | — | | — | | — | | — | | — | | — | | (191 | ) | | (191 | ) |
Preferred stock dividends | | — | | — | | — | | — | | — | | — | | — | | (5,512 | ) | | (5,512 | ) | | — | | (5,512 | ) | | — | | — | | — | | — | | — | | — | | — | | (5,512 | ) | | (5,512 | ) | | — | | (5,512 | ) |
Common stock cash distributions ($1.68 per share) | | — | | — | | — | | — | | — | | — | | — | | (49,292 | ) | | (49,292 | ) | | — | | (49,292 | ) | | — | | — | | — | | — | | — | | — | | — | | (49,292 | ) | | (49,292 | ) | | — | | (49,292 | ) |
| | | | | | | | | | | | | | | | | | | | | | | | | | | | | | | | | | | | | | | | | | | | | | | |
| | | | | | | | | | | | | | | | | | | | | | | | | |
Balance—December 31, 2011 | | 2,000 | | 30,346 | | $ | 38,500 | | $ | 303 | | $ | 507,343 | | $ | 672,743 | | $ | 199 | | $ | (752,340 | ) | $ | 466,748 | | $ | 1,962 | | $ | 468,710 | | | 2,000 | | 30,346 | | 38,500 | | 303 | | 507,343 | | 672,743 | | 199 | | (752,340 | ) | | 466,748 | | 1,962 | | 468,710 | |
| | | | | | | | | | | | | | | | | | | | | | | | | | | | | | | | | | | | | | | | | | | | | | | |
| | | | | | | | | | | | | | | | | | | | | | | | | |
Reclassification adjustment | | | — | | — | | — | | — | | — | | — | | (47 | ) | | — | | (47 | ) | | — | | (47 | ) |
Stock option exercises | | | — | | 85 | | — | | 1 | | 1,925 | | — | | — | | — | | 1,926 | | — | | 1,926 | |
Issue restricted stock | | | — | | 90 | | — | | 1 | | (1 | ) | | — | | — | | — | | — | | — | | — | |
Net income | | | — | | — | | — | | — | | — | | 51,290 | | — | | — | | 51,290 | | 37 | | 51,327 | |
Vested stock options | | | — | | — | | — | | — | | 10 | | — | | — | | — | | 10 | | — | | 10 | |
Vested restricted stock | | | — | | — | | — | | — | | 1,809 | | — | | — | | — | | 1,809 | | — | | 1,809 | |
Non-controlling interests conversion | | | — | | 23 | | — | | — | | (850 | ) | | — | | — | | — | | (850 | ) | | (1,914 | ) | | (2,764 | ) |
Non-controlling interests preferred return | | | — | | — | | — | | — | | — | | — | | — | | — | | — | | (78 | ) | | (78 | ) |
Preferred stock dividends | | | — | | — | | — | | — | | — | | — | | — | | (3,273 | ) | | (3,273 | ) | | — | | (3,273 | ) |
Common stock cash distributions ($1.79 per share) | | | — | | — | | — | | — | | — | | — | | — | | (54,512 | ) | | (54,512 | ) | | — | | (54,512 | ) |
| | | | | | | | | | | | | | | | | | | | | | | | | |
| | | | | | | | | | | | | | | | | | | | | | | | | |
Balance—December 31, 2012 | | | 2,000 | | 30,544 | | 38,500 | | 305 | | 510,236 | | 724,033 | | 152 | | (810,125 | ) | | 463,101 | | 7 | | 463,108 | |
| | | | | | | | | | | | | | | | | | | | | | | | | |
| | | | | | | | | | | | | | | | | | | | | | | | | |
Reclassification adjustment | | | — | | — | | — | | — | | — | | — | | (35 | ) | | — | | (35 | ) | | — | | (35 | ) |
Issuance of common stock | | | — | | 4,152 | | — | | 42 | | 175,556 | | — | | — | | — | | 175,598 | | — | | 175,598 | |
Issued restricted stock | | | — | | 35 | | — | | — | | — | | — | | — | | — | | — | | — | | — | |
Net income | | | — | | — | | — | | — | | — | | 57,815 | | — | | — | | 57,815 | | — | | 57,815 | |
Vested restricted stock | | | — | | — | | — | | — | | 2,591 | | — | | — | | — | | 2,591 | | — | | 2,591 | |
Stock option exercises | | | — | | 22 | | — | | — | | 523 | | — | | — | | — | | 523 | | — | | 523 | |
Non-controlling interests preferred return | | | — | | — | | — | | — | | — | | — | | — | | — | | — | | (7 | ) | | (7 | ) |
Preferred stock dividends | | | — | | — | | — | | — | | — | | — | | — | | (3,272 | ) | | (3,272 | ) | | — | | (3,272 | ) |
Common stock cash distributions ($1.91 per share) | | | — | | — | | — | | — | | — | | — | | — | | (63,631 | ) | | (63,631 | ) | | — | | (63,631 | ) |
Other | | | — | | (7 | ) | | — | | — | | (252 | ) | | — | | — | | — | | (252 | ) | | — | | (252 | ) |
| | | | | | | | | | | | | | | | | | | | | | | | | |
| | | | | | | | | | | | | | | | | | | | | | | | | |
Balance—December 31, 2013 | | | 2,000 | | 34,746 | | $ | 38,500 | | $ | 347 | | $ | 688,654 | | $ | 781,848 | | $ | 117 | | $ | (877,028 | ) | $ | 632,438 | | $ | — | | $ | 632,438 | |
| | | | | | | | | | | | | | | | | | | | | | | | | |
| | | | | | | | | | | | | | | | | | | | | | | | | |
| | | | | | | | | | | | | | | | | | | | | | | | | |
| | | | | | | | | | | | | | | | | | | | | | | | | |
See accompanying notes.
LTC PROPERTIES, INC.
CONSOLIDATED STATEMENTS OF CASH FLOWS
(In thousands)
| | | | | | | | | | |
| | Year ended December 31, | |
|---|
| | 2013 | | 2012 | | 2011 | |
|---|
OPERATING ACTIVITIES: | | | | | | | | | | |
Net income | | $ | 57,815 | | $ | 51,327 | | $ | 49,443 | |
Adjustments to reconcile net income to net cash provided by operating activities: | | | | | | | | | | |
Depreciation and amortization—continuing and discontinued operations | | | 24,706 | | | 22,153 | | | 19,623 | |
Stock-based compensation expense | | | 2,591 | | | 1,819 | | | 1,467 | |
Gain on sale of assets, net | | | (1,605 | ) | | (16 | ) | | — | |
Straight-line rental income—continuing and discontinued operations(1) | | | (3,955 | ) | | (3,264 | ) | | (3,728 | ) |
Provision (recovery) for doubtful accounts | | | 2,180 | | | (101 | ) | | (13 | ) |
Non-cash interest related to earn-out liabilities | | | 256 | | | 439 | | | 464 | |
Capitalized interest | | | (932 | ) | | (130 | ) | | (45 | ) |
Other non-cash items, net | | | 1,441 | | | 1,460 | | | 1,344 | |
Decrease in interest receivable | | | 32 | | | 535 | | | 56 | |
Increase in accrued interest payable | | | 145 | | | 1,923 | | | 681 | |
Net change in other assets and liabilities | | | 3,519 | | | 545 | | | 1,167 | |
| | | | | | | | |
| | | | | | | | | | | |
Net cash provided by operating activities | | | 86,193 | | | 76,690 | | | 70,459 | |
| | | | | | | | |
| | | | | | | | | | | |
INVESTING ACTIVITIES: | | | | | | | | | | |
Investment in real estate properties, net | | | (19,040 | ) | | (166,750 | ) | | (96,294 | ) |
Investment in real estate developments, net | | | (23,605 | ) | | (9,957 | ) | | (50 | ) |
Investment in real estate capital improvements, net | | | (6,992 | ) | | (1,132 | ) | | (3,135 | ) |
Proceeds from sale of real estate investments, net | | | 11,001 | | | 1,271 | | | — | |
Investment in real estate mortgages | | | (129,358 | ) | | (7,719 | ) | | — | |
Principal payments received on mortgage loans receivable | | | 1,933 | | | 21,633 | | | 5,967 | |
Proceeds from redemption of marketable securities | | | — | | | 6,500 | | | — | |
Advances under notes receivable | | | (1,004 | ) | | (2,930 | ) | | (232 | ) |
Principal payments received on notes receivable | | | 3,110 | | | 569 | | | 731 | |
| | | | | | | | |
| | | | | | | | | | | |
Net cash used in investing activities | | | (163,955 | ) | | (158,515 | ) | | (93,013 | ) |
| | | | | | | | |
| | | | | | | | | | | |
FINANCING ACTIVITIES: | | | | | | | | | | |
Bank borrowings | | | 93,000 | | | 153,500 | | | 167,600 | |
Repayment of bank borrowings | | | (187,500 | ) | | (94,000 | ) | | (149,300 | ) |
Proceeds from issuance of senior unsecured notes | | | 70,000 | | | 85,800 | | | 50,000 | |
Principal payments on mortgage loan payable and bonds payable | | | (600 | ) | | (565 | ) | | (530 | ) |
Payment of earn-out liabilities | | | (7,000 | ) | | — | | | (4,000 | ) |
Proceeds from common stock offering | | | 176,260 | | | — | | | 103,631 | |
Stock option exercises | | | 523 | | | 1,926 | | | 120 | |
Distributions paid to stockholders | | | (66,904 | ) | | (57,785 | ) | | (56,572 | ) |
Redemption of preferred stock | | | — | | | — | | | (88,413 | ) |
Redemption of non-controlling interests | | | — | | | (2,764 | ) | | — | |
Distributions paid to non-controlling interests | | | (7 | ) | | (78 | ) | | (191 | ) |
Financing costs paid | | | (171 | ) | | (1,426 | ) | | (2,286 | ) |
Other | | | (252 | ) | | — | | | — | |
| | | | | | | | |
| | | | | | | | | | | |
Net cash provided by financing activities | | | 77,349 | | | 84,608 | | | 20,059 | |
| | | | | | | | |
| | | | | | | | | | | |
(Decrease) increase in cash and cash equivalents | | | (413 | ) | | 2,783 | | | (2,495 | ) |
Cash and cash equivalents, beginning of year | | | 7,191 | | | 4,408 | | | 6,903 | |
| | | | | | | | |
| | | | | | | | | | | |
Cash and cash equivalents, end of year | | $ | 6,778 | | $ | 7,191 | | $ | 4,408 | |
| | | | | | | | |
| | | | | | | | | | | |
| | | | | | | | | | | |
| | | | | | | | |
Supplemental disclosure of cash flow information: | | | | | | | | | | |
Interest paid | | $ | 11,398 | | $ | 7,452 | | $ | 5,070 | |
Non-cash investing and financing transactions: | | | | | | | | | | |
SeeNote 4: Supplemental Cash Flow Information for further discussion. | | | | | | | | | | |
| | | | | | | | | | |
| | Year ended December 31, | |
|---|
| | 2011 | | 2010 | | 2009 | |
|---|
OPERATING ACTIVITIES: | | | | | | | | | | |
Net income | | $ | 49,443 | | $ | 46,053 | | $ | 44,360 | |
Adjustments to reconcile net income to net cash provided by operating activities: | | | | | | | | | | |
Depreciation and amortization—continuing and discontinued operations | | | 19,623 | | | 16,109 | | | 14,822 | |
Stock-based compensation expense | | | 1,467 | | | 1,285 | | | 1,389 | |
Gain on sale of assets, net | | | — | | | (310 | ) | | — | |
Straight-line rental income—continuing and discontinued operations(1) | | | (3,728 | ) | | (3,822 | ) | | (4,241 | ) |
Provisions for doubtful accounts—continuing and discontinued operations | | | (13 | ) | | 2,010 | | | 775 | |
Non-cash interest related to earn-out liabilities | | | 464 | | | — | | | — | |
Other non-cash items, net | | | 1,675 | | | 1,231 | | | 851 | |
Decrease in interest receivable | | | 56 | | | 95 | | | 91 | |
Increase in prepaid, other assets and allowance | | | (490 | ) | | (310 | ) | | (285 | ) |
Increase (decrease) in accrued interest payable | | | 681 | | | 573 | | | (149 | ) |
Increase in accrued expenses and other liabilities | | | 1,657 | | | 2,411 | | | 2,727 | |
| | | | | | | | |
Net cash provided by operating activities | | | 70,835 | | | 65,325 | | | 60,340 | |
INVESTING ACTIVITIES: | | | | | | | | | | |
Investment in real estate properties and capital improvements, net | | | (103,855 | ) | | (100,424 | ) | | (16,984 | ) |
Proceeds from sale of real estate investments, net | | | — | | | 4,864 | | | — | |
Investment in real estate mortgages | | | — | | | (1,694 | ) | | (221 | ) |
Principal payments received on mortgage loans receivable | | | 5,967 | | | 8,403 | | | 7,843 | |
Advances under notes receivable | | | (232 | ) | | (100 | ) | | (375 | ) |
Principal payments received on notes receivable | | | 731 | | | 1,573 | | | 671 | |
| | | | | | | | |
Net cash used in investing activities | | | (97,389 | ) | | (87,378 | ) | | (9,066 | ) |
FINANCING ACTIVITIES: | | | | | | | | | | |
Bank borrowings | | | 167,600 | | | 83,700 | | | 19,000 | |
Repayment of bank borrowings | | | (149,300 | ) | | (59,500 | ) | | (5,500 | ) |
Proceeds from issuance of senior unsecured notes | | | 50,000 | | | 50,000 | | | — | |
Principal payments on mortgage loan payable and bonds payable | | | (530 | ) | | (8,180 | ) | | (24,843 | ) |
Proceeds from common stock offering | | | 103,631 | | | 67,793 | | | 766 | |
Repurchase of common stock | | | — | | | — | | | (16 | ) |
Repurchase of preferred stock | | | — | | | — | | | (2,000 | ) |
Redemption of preferred stock | | | (88,413 | ) | | (59,065 | ) | | — | |
Distributions paid to stockholders | | | (56,572 | ) | | (53,902 | ) | | (51,373 | ) |
Distributions paid to non-controlling interests | | | (191 | ) | | (210 | ) | | (305 | ) |
Debt issue costs | | | (2,286 | ) | | (718 | ) | | (35 | ) |
Stock option exercises | | | 120 | | | 182 | | | 770 | |
| | | | | | | | |
Net cash provided by (used in) financing activities | | | 24,059 | | | 20,100 | | | (63,536 | ) |
| | | | | | | | |
Decrease in cash and cash equivalents | | | (2,495 | ) | | (1,953 | ) | | (12,262 | ) |
Cash and cash equivalents, beginning of year | | | 6,903 | | | 8,856 | | | 21,118 | |
| | | | | | | | |
Cash and cash equivalents, end of year | | $ | 4,408 | | $ | 6,903 | | $ | 8,856 | |
| | | | | | | | |
Supplemental disclosure of cash flow information: | | | | | | | | | | |
Interest paid | | $ | 5,025 | | $ | 1,628 | | $ | 2,177 | |
Non-cash investing and financing transactions: | | | | | | | | | | |
SeeNote 4: Supplemental Cash Flow Information for further discussion. | | | | | | | | | | |
- (1)
- During
2011, 20102013, 2012 and 2009,2011, we recorded $238, $342,$22, $131, and $443,$238, respectively, in straight-line rental income from a lessee that qualifies as a related party because the lessee's former Chief Executive Officer is on our Board of Directors. SeeNote 12. Transactions with Related Party for further discussion.
See accompanying notes.
LTC PROPERTIES, INC.
NOTES TO CONSOLIDATED FINANCIAL STATEMENTS
1. The Company
LTC Properties, Inc. (or LTC), a Maryland corporation, commenced operations on August 25, 1992. LTC is a real estate investment trust (or REIT) that invests primarily in senior housing and long term care properties through mortgage loans, property lease transactions, mortgage loans and other investments.
2. Summary of Significant Accounting Policies
Basis of Presentation. The accompanying consolidated financial statements include the accounts of LTC, our wholly-owned subsidiaries and our controlled partnership.partnership, prior to its liquidation in 2013. All intercompany investments, accounts and transactions have been eliminated. Control over the partnership iswas based on the provisions of the partnership agreement that providesprovided us with a controlling financial interest in the partnership. Under the terms of the partnership agreement, we, as the general partner, arewere responsible for the management of the partnership's assets, business and affairs. Our rights and duties in management of the partnership includeincluded making all operating decisions, setting the capital budget, executing all contracts, making all employment decisions, and handling the purchase and disposition of assets, among others. We, as the general partner, arewere responsible for the ongoing, major, and central operations of the partnership and makemade all management decisions. In addition, we, as the general partner, assumeassumed the risk for all operating losses, capital losses, and arewere entitled to substantially all capital gains (appreciation).
The Financial Accounting Standard Board (or FASB) created a framework for evaluating whether a general partner or a group of general partners controls a limited partnership or a managing member or a group of managing members controls a limited liability company and therefore should consolidate the entity. The guidance states that the presumption of general partner or managing member control would be overcome only when the limited partners or non-managing members have certain specific rights as described in the guidance. The limited partners havehad virtually no rights and arewere precluded from taking part in the operation, management or control of the partnership. The limited partners arewere also precluded from transferring their partnership interests without the expressed permission of the general partner. However, we cancould transfer our interest without consultation or permission of the limited partners. We consolidate our partnershipsconsolidated the partnership in accordance with the guidance.
The FASB requires the classification of non-controlling interests (formerly minority interests) as a component of consolidated equity in the consolidated balance sheet subject to the provisions of the rules governing classification and measurement of redeemable securities. The guidance requires consolidated net income to be reported at the amounts attributable to both the controlling and non-controlling interests. The calculation of earnings per share will be based on income amounts attributable to the controlling interest. Also, this guidance addresses accounting and reporting for a change in control of a subsidiary.
Certain reclassifications have been made to the prior period consolidated financial statements to conform to the current period presentation, including changes as a result of the application of accounting guidance for properties disposed or classified as held-for-sale. During the year ended December 31, 2013, we sold a 47-bed skilled nursing property located in Colorado for $1,000. Additionally, we sold six skilled nursing properties with a total of 230 beds for $11,000,000. During the year ended December 31, 2012, we sold a 140-bed skilled nursing property located in Texas for $1,248,000 and we also reclassified a 140-unit independent living property located in Texas from held-for-sale to held-for-use. Depreciation expense, which was not recognized during the held-for-sale period, was recognized at the date of reclassification. Due to the market conditions, the timing of the ultimate disposal of this property is uncertain. These adjustments are normal and recurring in nature. SeeNote 6. Real Estate Investments for further discussion of our property sales.
LTC PROPERTIES, INC.
NOTES TO CONSOLIDATED FINANCIAL STATEMENTS (Continued)
The FASB addresses when a company should include in its financial statements the assets, liabilities and activities of another entity. The guidance requires that we consolidate a "variable interest entity" if we are determined to be the primary beneficiary of the equity. The guidance also requires disclosure about "variable interest entities" that we are not required to consolidate but in which we have a significant variable interest. We believe that as of December 31, 2011,2013, we do not have investments in any entities that meet the definition of a "variable interest entity."
LTC PROPERTIES, INC.
NOTES TO CONSOLIDATED FINANCIAL STATEMENTS (Continued)
Impact of New Accounting Pronouncement.
In May 2011, the FASB issued Accounting Standards Update (or ASU) No. 2011-04,Fair Value Measurement (ASC Topic 820):Amendments to Achieve Common Fair Value Measurement and Disclosure Requirements in U.S. GAAP and International Financial Reporting Standards ("IFRS"). The pronouncement was issued to provide a uniform framework for fair value measurements and related disclosures between U.S. GAAP and IFRS. ASU No. 2011-04 changes certain fair value measurement principles and enhances the disclosure requirements particularly for Level 3 fair value measurements. The revised guidance is effective for interim and annual periods beginning after December 15, 2011 and early application by public entities is prohibited. The adoption of this guidance is not expected to have a significant impact on our consolidated financial statements.
In June 2011, the FASB issued ASU No. 2011-05,Comprehensive Income. ASU No. 2011-05 amends Topic 220 of the ASC and provides that an entity has the option to present the total of comprehensive income, the components of net income, and the components of other comprehensive income either in a single continuous statement of comprehensive income or in two separate but consecutive statements. In both instances, an entity is required to present each component of net income along with total net income, each component of other comprehensive income along with a total for other comprehensive income, and a total amount for comprehensive income. The provisions of ASU No. 2011-05 will be applied retrospectively and are effective for fiscal years, and interim periods within those years, beginning after December 15, 2011. The adoption of this guidance concerns disclosure only and will not have an impact on our consolidated financial position or results of operations.
Use of Estimates. Preparation of the consolidated financial statements in conformity with U.S. generally accepted accounting principles (or GAAP)requires management to make estimates and assumptions that affect the amounts reported in the consolidated financial statements and accompanying notes. Actual results could differ from those estimates.
Cash Equivalents. Cash equivalents consist of highly liquid investments with a maturity of three months or less when purchased and are stated at cost which approximates market.
Owned Properties. Accounting forWe make estimates as part of our allocation of the purchase price of acquisitions to the various components of the acquisition based upon the relative fair value of senior housing and long term care properties as a purchase transaction requires an allocation of purchase price to land, buildings, improvements, acquired lease intangibles and equipments are recorded at their respective fair values on the acquisition date. Further, the FASB accounting guidance requires the acquiring entity to measure any non-controlling interests at their fair values on the acquisition date.each component. In determining fair value, we use current appraisals or other third party opinions of value. This guidance also requiresThe most significant components of our allocations are typically the allocation of fair value to land and buildings and, for certain of our acquisitions, in-place leases and other intangible assets. In the case of the fair value of buildings and the allocation of value to land and other intangibles, the estimates of the values of these components will affect the amount of depreciation and amortization we record over the estimated useful life of the property acquired or the remaining lease term. In the case of the value of in-place leases, the appraisers make best estimates based on the evaluation of the specific characteristics of each tenant's lease. Factors considered include estimates of carrying costs during hypothetical expected lease-up periods, market conditions and costs to execute similar leases. These assumptions affect the amount of future revenue that acquisition-relatedwe will recognize over the remaining lease term for the acquired in-place leases. We evaluate each purchase transaction to determine whether the acquired assets meet the definition of a business. Transaction costs related to acquisitions that are not deemed to be businesses are included in the cost basis of the acquired assets, while transaction costs related to acquisitions that are deemed to be businesses are expensed as incurred and acquired researchincurred.
We capitalize direct construction and development value be capitalized. In addition, acquisition-related restructuring costs, including predevelopment costs, interest, property taxes, insurance and other costs directly related and essential to the acquisition, development or construction of a real estate asset. We capitalize construction and development costs while substantive activities are ongoing to beprepare an asset for its intended use. We consider a construction project as substantially complete and held available for occupancy upon the issuance of the certificate of occupancy. Costs incurred after a project is substantially complete and ready for its intended use, or after development activities have ceased, are expensed as incurred. For redevelopment, renovation and expansion of existing operating properties, we capitalize the cost for the construction and improvement incurred in connection with the redevelopment, renovation and expansion. Costs previously capitalized only if they meet certain criteria.related to abandoned acquisitions or developments are charged to earnings. Expenditures for repairs and maintenance are expensed as incurred.
Depreciation is computed principally by the straight-line method for financial reporting purposes over the estimated useful lives of the assets, which generally range from 3 to 5 years for computers, 75 to 1015 years for equipments,furniture and equipment, 35 to 4045 years for buildings, 10 to 20 years for building improvements and the respective lease term for acquired lease intangibles. Improvements made to the real estate properties subsequent to its acquisition are capitalized.
LTC PROPERTIES, INC.
NOTES TO CONSOLIDATED FINANCIAL STATEMENTS (Continued)
Mortgage Loans Receivable. Mortgage loans receivable we originate are recorded on an amortized cost basis. Mortgage loans we acquire are recorded at fair value at the time of purchase net of any
LTC PROPERTIES, INC.
NOTES TO CONSOLIDATED FINANCIAL STATEMENTS (Continued)
related premium or discount which is amortized as a yield adjustment to interest income over the life of the loan.
Allowance for Doubtful Accounts. We maintain an allowance for doubtful accounts. The allowance for doubtful accounts is based upon the expected collectability of our receivables and is maintained at a level believed adequate to absorb potential losses in our receivables. In determining the allowance we perform a quarterly evaluation of all receivables. If this evaluation indicates that there is a greater risk of receivable charge-offs, additional allowances are recorded in current period earnings. During the fourth quarter of 2013, we wrote-off an $878,000 straight-line rent receivable balance related to the transition of four assisted living properties to a new lessee.
Impairments. Impairment lossesAssets that are recordedclassified as held for use are periodically evaluated for impairment when events or changes in circumstances indicate that the asset ismay be impaired andor the estimatedcarrying amount of the asset may not be recoverable through future undiscounted cash flows to be generated by the asset are less than its carrying amount.flows. Management assesses the impairment of properties individually and impairment losses are calculated as the excess of the carrying amount over the estimated fair value of assets to be held and used, and carrying amount over the fair value less cost to sell in instances where management has determined that we will disposeas of the property.measurement date. In determining fair value, we use current appraisals or other third party opinions of value and other estimates of fair value such as estimated discounted future cash flows.
Also, we evaluate the carrying values of mortgage loans receivable on an individual basis. Management periodically evaluates the realizability of future cash flows from the mortgage loan receivable when events or circumstances, such as the non-receipt of principal and interest payments and/or significant deterioration of the financial condition of the borrower, indicate that the carrying amount of the mortgage loan receivable may not be recoverable. An impairment charge is recognized in current period earnings and is calculated as the difference between the carrying amount of the mortgage loan receivable and the discounted cash flows expected to be received, or if foreclosure is probable, the fair value of the collateral securing the mortgage.
ASC No. 320,Investments—Debt and Equity Securities, requires an entity to assess whether it intends to sell, or it is more likely than not that it will be required to sell, a debt security in an unrealized loss position before recovery of its amortized cost basis. If either of these criteria is met, the entire difference between fair value and amortized cost is recognized as impairment through earnings. For securities that do not meet the aforementioned criteria, the amount of impairment is split into two components as follows: 1) other-than-temporary impairment (or OTTI) related to other factors such as an entity's ability to make scheduled interest or principal payments on the debt securities, which is recognized in other comprehensive income and 2) OTTI related to credit loss, which must be recognized in the income statement. The credit loss is determined as the difference between the present value of the cash flows expected to be collected and the amortized cost basis.
Fair Value of Financial Instruments. The FASB requires the disclosure of fair value information about financial instruments for which it is practicable to estimate that value. In cases where quoted market prices are not available, fair values are based on estimates using present value or other valuation techniques. Those techniques are significantly affected by the assumptions used, including the discount rate and estimates of future cash flows. In that regard, the derived fair value estimates cannot be substantiated by comparison to independent markets and, in many cases, could not be realized in immediate settlement of the instrument. Accordingly, the aggregate fair market value amounts presented in the notes to these consolidated financial statements do not represent our underlying carrying value in financial instruments.
The FASB provides guidance for using fair value to measure assets and liabilities, the information used to measure fair value, and the effect of fair value measurements on earnings. The FASB
LTC PROPERTIES, INC.
NOTES TO CONSOLIDATED FINANCIAL STATEMENTS (Continued)
emphasizes that fair value is a market-based measurement, not an entity-specific measurement. Therefore, a fair value measurement should be determined based on the assumptions that market participants would use in pricing the asset or liability. As a basis for considering market participant assumptions in fair value measurements, the FASB establishes a fair value hierarchy that distinguishes between market participant assumptions based on market data obtained from sources independent of the reporting entity (observable inputs that are classified within Levels 1 and 2 of the hierarchy) and the reporting entity's own assumptions about market participant assumptions (unobservable inputs classified within Level 3 of the hierarchy). Level 1 inputs utilize quoted prices (unadjusted) in active
LTC PROPERTIES, INC.
NOTES TO CONSOLIDATED FINANCIAL STATEMENTS (Continued)
markets for identical assets or liabilities that we have the ability to access. Level 2 inputs are inputs other than quoted prices included in Level 1 that are observable for the asset or liability, either directly or indirectly. Level 2 inputs may include quoted prices for similar assets and liabilities in active markets, as well as inputs that are observable for the asset or liability (other than quoted prices).
The fair value guidance issued by the FASB excludes accounting pronouncements that address fair value measurements for purposes of lease classification or measurement. However, this scope exception does not apply to assets acquired and liabilities assumed in a business combination that are required to be measured at fair value, regardless of whether those assets and liabilities are related to leases.
In accordance with the accounting guidance regarding the fair value option for financial assets and financial liabilities, entities are permitted to choose to measure certain financial assets and liabilities at fair value, with the change in unrealized gains and losses on items for which the fair value option has been elected reported in earnings. We didhave not adoptelected the elective fair market value option infor any of our consolidated financial statements.assets or liabilities.
The FASB requires disclosures about fair value of financial instruments for interim reporting periods of publicly traded companies as well as in annual financial statements. SeeNote 16. Fair Value Measurements for the disclosure about fair value of our financial instruments.
Investments. Investments in marketable debt and equity securities are categorized as trading, available-for-sale or held-to-maturity. Available-for-sale securities are stated at fair value, with the unrealized gains and losses, reported in other comprehensive income until realized. Realized gains and losses and declines in value judged to be other-than-temporary on available-for-sale securities are included in net income. The cost of securities sold is based on the specific identification method. Interest and dividends on securities classified as available-for-sale are included in interest and other income. Our investment in marketable debt securities is classified as held-to-maturity because we have the positive intent and ability to hold the securities to maturity. Held-to-maturity securities are stated at amortized cost, adjusted for amortization of premiums and accretion of discounts to maturity.
ASC No. 320,Investments—Debt and Equity Securities, requires an entity to assess whether it intends to sell, or it is more likely than not that it will be required to sell, a debt security in an unrealized loss position before recovery of its amortized cost basis. If either of these criteria is met, the entire difference between fair value and amortized cost is recognized as impairment through earnings. For securities that do not meet the aforementioned criteria, the amount of impairment is split into two components as follows: 1) other-than-temporary impairment (or OTTI) related to other factors such as an entity's ability to make scheduled interest or principal payments on the debt securities, which is recognized in other comprehensive income and 2) OTTI related to credit loss, which must be recognized in the income statement. The credit loss is determined as the difference between the present value of the cash flows expected to be collected and the amortized cost basis.
Revenue Recognition. Interest income on mortgage loans is recognized using the effective interest method. We follow a policy related to mortgage interest whereby we consider a loan to be non-performing after 60 days of non-payment of amounts due and do not recognize unpaid mortgage interest income from that loan until the past due amounts have been received.
Rental income from operating leases is generally recognized on a straight-line basis over the terms of the leases. Substantially all of our leases contain provisions for specified annual increases over the
LTC PROPERTIES, INC.
NOTES TO CONSOLIDATED FINANCIAL STATEMENTS (Continued)
rents of the prior year and are generally computed in one of four methods depending on specific provisions of each lease as follows:
- (i)
- a specified annual increase over the prior year's rent, generally between 2.0% and 3.0%;
- (ii)
- a calculation based on the Consumer Price Index;
LTC PROPERTIES, INC.
NOTES TO CONSOLIDATED FINANCIAL STATEMENTS (Continued)
- (iii)
- as a percentage of facility net patient revenues in excess of base amounts or
- (iv)
- specific dollar increases.
The FASB does not provide for the recognition of contingent revenue until all possible contingencies have been eliminated. We consider the operating history of the lessee and the general condition of the industry when evaluating whether all possible contingencies have been eliminated and have historically, and expect in the future, to not include contingent rents as income until received. We follow a policy related to rental income whereby we consider a lease to be non-performing after 60 days of non-payment of past due amounts and do not recognize unpaid rental income from that lease until the amounts have been received.
Rental revenues relating to non-contingent leases that contain specified rental increases over the life of the lease are recognized on the straight-line basis. Recognizing income on a straight-line basis requires us to calculate the total non-contingent rent containing specified rental increases over the life of the lease and to recognize the revenue evenly over that life. This method results in rental income in the early years of a lease being higher than actual cash received, creating a straight-line rent receivable asset included in our consolidated balance sheet. At some point during the lease, depending on its terms, the cash rent payments eventually exceed the straight-line rent which results in the straight-line rent receivable asset decreasing to zero over the remainder of the lease term. We assess the collectability of straight-line rent in accordance with the applicable accounting standards and our reserve policy. If the lessee becomes delinquent in rent owed under the terms of the lease, we may provide a reserve against the recognized straight-line rent receivable asset for a portion, up to its full value, that we estimate may not be recoverable.
Net loan fee income and commitment fee income are amortized over the life of the related loan. Costs associated with leases are deferred and allocated over the lease term in proportion to the recognition of rental income.
Federal Income Taxes. LTC qualifies as a REIT under the Internal Revenue Code of 1986, as amended, and as such, no provision for Federal income taxes has been made. A REIT is required to distribute at least 90% of its taxable income to its stockholders and a REIT may deduct dividends in computing taxable income. If a REIT distributes 100% of its taxable income and complies with other Internal Revenue Code requirements, it will generally not be subject to Federal income taxation.
For Federal tax purposes, depreciation is generally calculated using the straight-line method over a period of 27.5 years. Earnings and profits, which determine the taxability of distributions to stockholders, use the straight-line method over 40 years. Both Federal taxable income and earnings and profits differ from net income for financial statement purposes principally due to the treatment of certain interest income, rental income, other expense items, impairment charges and the depreciable lives and basis of assts.assets. At December 31, 2011,2013, the booktax basis of our net depreciable assets exceeds our taxbook basis by approximately $85,100,000$22,680,000 (unaudited), primarily due to additional depreciation takenan investment recorded as an acquisition for tax purposes.and a mortgage loan for GAAP.
LTC PROPERTIES, INC.
NOTES TO CONSOLIDATED FINANCIAL STATEMENTS (Continued)
The FASB clarified the accounting for income taxes by prescribing the minimum recognition threshold a tax position is required to meet before being recognized in the financial statements. The guidance utilizes a two-step approach for evaluating tax positions. Recognition (step one) occurs when a company concludes that a tax position, based solely on its technical merits, is more likely than not to be sustained upon examination. Measurement (step two) is only addressed if step one has been satisfied (i.e., the position is more likely than not to be sustained). Under step two, the tax benefit is measured as the largest amount of benefit (determined on a cumulative probability basis) that is more
LTC PROPERTIES, INC.
NOTES TO CONSOLIDATED FINANCIAL STATEMENTS (Continued)
likely than not to be realized upon ultimate settlement. We currently do not have any uncertain tax positions that would not be sustained on its technical merits on a more-likely than not basis.
We may from time to time be assessed interest or penalties by certain tax jurisdictions. In the event we have received an assessment for interest and/or penalties, it has been classified in our consolidated financial statements as operatingGeneral and otheradministrative expenses.
Concentrations of Credit Risks. Financial instruments which potentially subject us to concentrations of credit risk consist primarily of cash and cash equivalents, mortgage loans receivable, marketable debt securities and operating leases on owned properties. Our financial instruments, mortgage loans receivable and operating leases, are subject to the possibility of loss of carrying value as a result of the failure of other parties to perform according to their contractual obligations or changes in market prices which may make the instrument less valuable. We obtain various collateral and other protective rights, and continually monitor these rights, in order to reduce such possibilities of loss. In addition, we provide reserves for potential losses based upon management's periodic review of our portfolio. SeeNote 5.3. Major Operators for further discussion of concentrations of credit risk from our tenants.
Discontinued Operations. Properties classified as held-for-sale on the consolidated balance sheet includesinclude only those properties available for immediate sale in their present condition and for which management believes that it is probable that a sale of the property will be completed within one year. Accordingly, we record reclassification adjustments to reflect properties sold subsequent to the respective consolidated balance sheet date as held-for-sale in the prior period consolidated balance sheet. Properties held-for-sale are carried at the lower of cost or fair value less estimated selling costs. No depreciation expense is recognized on properties held-for-sale once they have been classified as such. The operating results of real estate assets designated as held-for-sale are included in discontinued operations in the consolidated statement of income. In addition, all gains and losses from real estate sold are also included in discontinued operations. For comparative purposes, as required by the FASB accounting guidance, the prior year'syears' operating results of sold and held-for-sale real estate assets have been reclassified to discontinued operations in the consolidated income statement for the prior years. SeeNote 6. Real Estate Investments, for a detail of the property classified as held for sale during 2011 and the related components of the net income from discontinued operations.
Net Income Per Share. Basic earnings per share is calculated using the weighted-average shares of common stock outstanding during the period excluding common stock equivalents. Diluted earnings per share includes the effect of all dilutive common stock equivalents.
In accordance with the accounting guidance regarding the determination of whether instruments granted in share-based payments transactions are participationparticipating securities, we have applied the two-class method of computing basic earnings per share. This guidance clarifies that outstanding unvested share-based payment awards that contain rights to non-forfeitable dividends participate in undistributed earnings with common stockholders and are considered participating securities.
Stock-Based Compensation. The FASB requires all share-based payments to employees, including grants of employee stock options, to be recognized in the income statement based on their fair values.
LTC PROPERTIES, INC.
NOTES TO CONSOLIDATED FINANCIAL STATEMENTS (Continued)
We use the Black-Scholes-Merton formula to estimate the value of stock options granted to employees. This model requires management to make certain estimates including stock volatility, expected dividend yield and the expected term. If management incorrectly estimates these variables, the results of operations could be affected. The FASB also requires the benefits of tax deductions in excess of recognized compensation cost to be reported as a financing cash flow. Because we qualify as a REIT
LTC PROPERTIES, INC.
NOTES TO CONSOLIDATED FINANCIAL STATEMENTS (Continued)
under the Internal Revenue Code of 1986, as amended, we are generally not subject to Federal income taxation. Therefore, this reporting requirement does not have an impact on our statement of cash flows.
Segment Disclosures. The FASB accounting guidance regarding disclosures about segments of an enterprise and related information establishes standards for the manner in which public business enterprises report information about operating segments. Our investment decisions in senior housing and long term care healthcare properties, including mortgage loans, property lease transactiontransactions and other investments, are made and resulting investments are managed as a single operating segment for internal reporting and for internal decision-making purposes. Therefore, we have concluded that we operate as a single segment.
Impact of New Accounting Pronouncement.
In February 2013, the FASB issued Accounting Standards Update No. 2013-02,Reporting of Amounts Reclassified Out of Accumulated Other Comprehensive Income (or ASU 2013-02). This update requires an entity to provide information about the amounts reclassified out of accumulated other comprehensive income by component. In addition, an entity is required to present, either on the face of the statement where net income is presented or in the notes, significant amounts reclassified out of accumulated other comprehensive income by the respective line items of net income. The adoption of ASU 2013-02 on January 1, 2013 did not have a material impact on our consolidated financial position or results of operations.
3. Major Operators
We have threefour operators from each of which we derive over 10% of our combined rental revenue and interest income from mortgage loans. Additionally, we have one operator from which we would have derived over 10% of our combined rental revenue and interest income from mortgage loans if we had a full year of interest income from a mortgage loan we originated during the fourth quarter of 2013.
Senior Care Centers, LLC (or Senior Care) is a privately held company. During 2013, we entered into an amended and restated master lease agreement with Senior Care to include four skilled nursing properties which were previously operated by and subleased to Senior Care. Under the new amended and restated master lease agreement, Senior Care leases nine skilled nursing properties with a total of 1,190 beds owned by us representing approximately 11.3%, or $104,984,000, of our total assets at December 31, 2013 and 11.3% of our combined rental revenue and interest income from mortgage loans recognized for the year ended December 31, 2013.
In 2006, Extendicare Services, Inc. (or EHSI), one of our major operators, effected a reorganization whereby it completed a spin-off of Assisted Living Concepts, Inc. (or ALC). ALC is now a NYSE traded public company operating assisted living centers. The remaining EHSI assets and operations were converted into a Canadian REIT (or Extendicare(Extendicare REIT) listed on the Toronto Stock Exchange (or TSX). During 2012, Extendicare REIT converted from an income trust structure to a corporate structure under a corporation named Extendicare, Inc. (or Extendicare). Both Extendicare REIT and ALC continue to be parties to the leases with us. On July 11, 2013,
LTC PROPERTIES, INC.
NOTES TO CONSOLIDATED FINANCIAL STATEMENTS (Continued)
ALC merged with Aid Holdings, LLC, a Delaware limited liability company (or Aid Holdings), and Aid Merger Sub, LLC, a Delaware limited liability company and a wholly owned subsidiary of Aid Holdings (or Aid Merger Sub). Aid Holdings and Aid Merger Sub are affiliates of TPG Capital, L.P.
Extendicare and ALC collectively lease 37 assisted living properties with a total of 1,430 units owned by us representing approximately 5.5%, or $51,299,000, of our total assets at December 31, 2013 and 10.5% of our combined rental revenue and interest income from mortgage loans recognized for the year ended December 31, 2013. The Extendicare and ALC master lease expires on December 31, 2014. In January 2014, we retained CS Capital Advisors, LLC, as our advisors, to assist in the marketing and re-leasing process of these properties.
Brookdale Senior Living Communities, Inc. (or Brookdale Communities) is a wholly owned subsidiary of a publicly traded company, Brookdale Senior Living, Inc. (or Brookdale).
The following table summarizes Extendicare REIT's, ALC's and Brookdale's financial information as of and for the nine months ended September 30, 2011 per the operators' public filings (in thousands, unaudited). Our other operator is privately owned and thus no public financial information is available:
| | | | | | | | | | |
| | Extendicare REIT(1) | | ALC | | Brookdale | |
|---|
Current assets | | $ | 522,144 | | $ | 20,427 | | $ | 273,291 | |
Non-current assets | | | 1,443,363 | | | 445,435 | | | 4,165,150 | |
Current liabilities | | | 705,036 | | | 38,383 | | | 607,187 | |
Non-current liabilities | | | 1,195,498 | | | 125,206 | | | 2,781,868 | |
Stockholders' equity | | | 64,973 | | | 302,273 | | | 1,049,386 | |
Gross revenue | | |
1,571,223 | | |
175,589 | | |
1,785,947 | |
Operating expenses | | | 1,345,373 | | | 144,187 | | | 1,715,579 | |
(Loss) income from continuing operations | | | (12,499 | ) | | 17,050 | | | (53,300 | ) |
Net (loss) income | | | (12,499 | ) | | 17,050 | | | (53,300 | ) |
Cash provided by operations | | |
98,587 | | |
41,290 | | |
212,002 | |
Cash used in investing activities | | | (47,044 | ) | | (7,961 | ) | | (122,210 | ) |
Cash used in financing activities | | | (62,573 | ) | | (44,094 | ) | | (132,424 | ) |
(1)The numbers shown for Extendicare REIT are in Canadian dollars and are prepared in accordance with Canadian GAAP.
*The financial information contained in the foregoing table for Extendicare REIT, ALC and Brookdale is based on information we obtained from such companies' available public filing and, therefore, we have not independently verified the accuracy of such information.
LTC PROPERTIES, INC.
NOTES TO CONSOLIDATED FINANCIAL STATEMENTS (Continued)
Extendicare REIT and ALC, collectively lease 37Communities leases 35 assisted living properties with a total of 1,4271,414 units owned by us representing approximately 8.6%5.5%, or $55,507,000,$51,581,000, of our total assets at December 31, 20112013 and 13.0%10.5% of our combined rental revenue and interest income from mortgage loans recognized duringfor the year ended December 31, 2011.
Brookdale Communities, a wholly owned subsidiary of Brookdale, leases 35 assisted living properties with a total of 1,416 units owned by us representing approximately 8.6%, or $55,477,000, of our total assets at December 31, 2011 and 12.5% of rental revenue and interest income from mortgage loans recognized during the year ended December 31, 2011.2013.
Preferred Care, Inc. (or Preferred Care), through various wholly owned subsidiaries, operates 3027 skilled nursing properties and two other senior housingrange of care properties that we own or on which we hold mortgages secured by first trust deeds. These properties consist of a total of 3,8613,354 skilled nursing beds and 49 assisted living units. This represents approximately 8.8%5.4%, or $57,024,000,$50,132,000, of our total assets at December 31, 20112013 and 12.8%10.2% of our combined rental revenue and interest income from mortgage loans recognized duringfor the year ended December 31, 2011.2013. They also operate one skilled nursing property under a sub-lease with another lessee we have which is not included in the Preferred Care rental revenue and interest income from mortgage loans.
Prestige Healthcare is a privately held company. In October 2013, we funded a $124,387,000 mortgage loan with Prestige Healthcare secured by 15 skilled nursing properties with a total of 2,092 beds. They also lease two range of care properties with a total of 118 skilled nursing beds and 93 assisted living units owned by us with an asset value of $10,967,000. Additionally, they manage four parcels of land that we own with an asset value of $1,163,000. These assets represent 14.7% or $136,517,000 of our total assets at December 31, 2013 and generated 3.1% of our combined rental revenue and interest income from mortgage loans recognized for the year ended December 31, 2013 (or 11.5% of our combined rental revenue and interest income from mortgage loans for the year ended December 31, 2013 assuming we held the mortgage for the full year of 2013).
Our financial position and ability to make distributions may be adversely affected by financial difficulties experienced by Extendicare, ALC, Brookdale Communities, Extendicare REIT & ALC, Preferred Care, Senior Care, Prestige Healthcare, or any of our lessees and borrowers, including any bankruptcies, inability to emerge from bankruptcy, insolvency or general downturn in business of any such operator, or in the event any such operator does not renew and/or extend its relationship with us or our borrowers when it expires.
LTC PROPERTIES, INC.
NOTES TO CONSOLIDATED FINANCIAL STATEMENTS (Continued)
4. Supplemental Cash Flow Information
| | | | | | | | | | |
| | For the year ended
December 31, | |
|---|
| | 2013 | | 2012 | | 2011 | |
|---|
| | (in thousands)
| |
|---|
Non-cash investing and financing transactions: | | | | | | | | | | |
Acquisition of real estate investments | | $ | — | | $ | — | | $ | 5,975 | (1) |
Capitalized interest | | | 932 | | | 130 | | | 45 | |
Redemption of non-controlling interest | | | — | | | 396 | | | — | |
Restricted stock issued, net of cancellations | | | — | | | 1 | | | — | |
| | | | | | | | | | |
| | For the year ended December 31, | |
|---|
| | 2011 | | 2010 | | 2009 | |
|---|
| | (in thousands)
| |
|---|
Non-cash investing and financing transactions: | | | | | | | | | | |
Conversion of mortgage loans to owned properties | | $ | — | | $ | 2,900 | | $ | — | |
Acquisition of real estate investments(1) | | | 5,975 | | | — | | | — | |
Conversion of preferred stock to common stock | | | — | | | 823 | | | 22 | |
Redemption of non-controlling interest | | | — | | | — | | | 1,144 | |
Restricted stock issued, net of cancellations | | | — | | | 2 | | | 1 | |
- (1)
- We purchased four skilled nursing properties with 524-beds in Texas for $50,841 which consists of $41,000 in cash at closing with the remainder in the form of contingent
earn-out payments. The contingent earn-out payment arrangements require us to pay two earn-out payments totalling up to $11,000 upon the properties achieving a sustainable stipulated rent coverage ratio.if certain operational thresholds are met. During 2013 and 2011, we paid $7,000 and $4,000, respectively, related to the first contingent earn-out paymentpayments which hashave been included in the line itemInvestment in real estate properties and capital improvements, netPayment of earn-out liabilities on our consolidated statement of cash flows. We estimated the fair value of the contingent earn-out payments using a discounted cash flow analysis. This fair value measurement is based on significant input not observable in the marketSeeNote 11. Commitments and thus represents a Level 3 measurement.Contingencies for further discussion.
LTC PROPERTIES, INC.
NOTES TO CONSOLIDATED FINANCIAL STATEMENTS (Continued)
5. Impairment Charge
No impairment charges on our real estate investments held and used and on our mortgage loans receivable were recorded during 2011, 20102013, 2012 or 2009. We have evaluated our marketable securities and concluded that our marketable securities were not other-than-temporary impaired.2011. However in past years, the long term care industry experienced significant adverse changes which resulted in operating losses by certain of our lessees and borrowers and in some instances the filing by certain lessees and borrowers for bankruptcy protection. Thus, we cannot predict what, if any, impairment chargecharges may be needed in the future.
6. Real Estate Investments
Any reference to the number of properties, number of schools, number of units, number of beds, and yield on investments in real estate are unaudited and outside the scope of our independent registered public accounting firm's audit of our consolidated financial statements in accordance with the standards of the Public Company Accounting Oversight Board.
Mortgage Loans. Owned Properties.The following table summarizes our investmentsinvestment in mortgage loans secured by first mortgagesowned properties at December 31, 20112013 (dollar amounts in thousands):
| | | | | | | | | | | | | | | | | | | |
| |
| |
| |
| | Number of | |
| |
|---|
| |
| |
| |
| | Average
Investment
per
Bed/Unit | |
|---|
Type of Property | | Gross
Investments | | Percentage
of
Investments | | Number
of
Properties(1) | | SNF
Beds | | ALF
Units | |
|---|
Skilled Nursing | | $ | 458,759 | | | 48.9 | % | | 68 | | | 8,264 | | | — | | $ | 55.51 | |
Assisted Living | | | 399,912 | | | 42.7 | % | | 98 | | | — | | | 4,641 | | $ | 86.17 | |
Range of Care | | | 43,907 | | | 4.7 | % | | 8 | | | 634 | | | 274 | | $ | 48.36 | |
Under Development(2) | | | 21,432 | | | 2.3 | % | | — | | | — | | | — | | | — | |
Other(3) | | | 13,607 | | | 1.4 | % | | 2 | | | — | | | — | | | — | |
| | | | | | | | | | | | | | | |
| | | | | | | | | | | | | | | | | | | | |
Totals | | $ | 937,617 | | | 100.0 | % | | 176 | | | 8,898 | | | 4,915 | | | | |
| | | | | | | | | | | | | | | |
| | | | | | | | | | | | | | | | | | | | |
| | | | | | | | | | | | | | | | | | | | |
| | | | | | | | | | | | | | | |
| | | | | | | | | | | | | | | | | | | | | | |
| |
| |
| | (Unaudited) | |
|---|
| |
| |
| |
| |
| | Number of | |
| |
|---|
Type of Property | | Gross
Investments | | Percentage
of
Investments | | Number
of Loans | | Number
of
Properties(1) | | SNF
Beds | | ALF
Units | | Investment
per
Bed/Unit | |
|---|
Assisted Living | | $ | 22,776 | | | 42.2 | % | | 9 | | | 14 | | | — | | | 424 | | $ | 53.72 | |
Skilled Nursing | | | 28,132 | | | 52.1 | % | | 20 | | | 21 | | | 2,326 | | | — | | $ | 12.09 | |
Other Senior Housing(2) | | | 3,094 | | | 5.7 | % | | 1 | | | 1 | | | 99 | | | 74 | | $ | 17.88 | |
| | | | | | | | | | | | | | | | | |
Totals | | $ | 54,002 | | | 100.0 | % | | 30 | | | 36 | | | 2,425 | | | 498 | | | | |
| | | | | | | | | | | | | | | | | |
- (1)
- We have investments in
1227 states that include mortgagesleased to 1433 different operators.
- (2)
Other senior housing properties consistIncludes three MC developments with a total of independent living168 units, a combination ALF and MC development with a total of 81 units, and a SNF development with 143 beds.- (3)
- Includes two schools properties and
properties providing any combinationfour parcels of skilled nursing, assisted living and/or independent living services.land held-for-use.
At December 31, 2011, the mortgage loans had interest rates ranging from 9.95% to 14.63% and maturities ranging from 2012 to 2019. In addition, the loans contain certain guarantees, provide for certain facility fees and generally have 25-year amortization schedules. The majority of the mortgage loans provide for annual increases in the interest rate based upon a specified increase of 10 to 25 basis points. At December 31, 2011 and 2010, the carrying values of the mortgage loans were $53,081,000 and $59,026,000, respectively. Scheduled principal payments on mortgage loans are $5,013,000; $17,673,000; $9,327,000; $4,477,000; $2,424,000; and $15,088,000 in 2012, 2013, 2014, 2015, 2016 and thereafter, respectively.
During the year ended December 31, 2011, we received $3,136,000 in regularly scheduled principal payments and we received $2,831,000 plus accrued interest related to the payoff of four mortgage loans secured by one assisted living property and seven skilled nursing properties.
During the year ended December 31, 2010, we received $3,904,000 plus accrued interest related to the payoff of five mortgage loans secured by five skilled nursing properties. We invested $72,000 in a mortgage loan for capital improvements and $1,622,000 in a mortgage loan secured by a skilled nursing property to finance an expansion of the property and extend the loan maturity for an additional five years. We received $4,499,000 in regularly scheduled principal payments
Also, during the year ended December 31, 2010, we recorded a $1,235,000 provision for doubtful accounts charge for two mortgage loans (one secured by a private school property in Minnesota and
LTC PROPERTIES, INC.
NOTES TO CONSOLIDATED FINANCIAL STATEMENTS (Continued)
one secured by land in Oklahoma). We acquired the school property via deed-in-lieu of foreclosure as a result of the borrower filing for Chapter 7 bankruptcy. During 2011, we leased the school to a non-for-profit corporation providing therapeutic support and intensive home, school and center-based behavioral therapy for children, youth and families affected by Autism Spectrum Disorders.
During the year ended December 31, 2009, we received $3,716,000 plus accrued interest related to the payoff of three mortgage loans secured by three skilled nursing properties. Additionally, we invested $221,000 under one mortgage loan for capital improvements. We received $4,127,000 in regularly scheduled principal payments.
Owned Properties.The following table summarizes our investment in owned properties at December 31, 2011 (dollar amounts in thousands):
| | | | | | | | | | | | | | | | | | | | | | |
| |
| |
| |
| | Number of | |
| |
|---|
Type of Property | | Gross
Investments | | Percentage
of
Investments | | Number
of
Properties(1) | | SNF
Beds | | ALF
Units | | ILF
Units | | Investment
per
Bed/Unit | |
|---|
Assisted Living | | $ | 285,981 | | | 39.4 | % | | 88 | | | — | | | 3,941 | | | — | | $ | 72.57 | |
Skilled Nursing | | | 361,326 | | | 49.9 | % | | 68 | | | 8,021 | | | — | | | — | | $ | 45.05 | |
Other Senior Housing(2) | | | 64,638 | | | 8.9 | % | | 13 | | | 814 | | | 256 | | | 423 | | $ | 43.29 | |
Schools | | | 12,192 | | | 1.7 | % | | 2 | | | — | | | — | | | — | | | N/A | |
Under Development(3) | | | 894 | | | 0.1 | % | | — | | | — | | | — | | | — | | | N/A | |
| | | | | | | | | | | | | | | | | |
Totals | | $ | 725,031 | | | 100.0 | % | | 171 | | | 8,835 | | | 4,197 | | | 423 | | | | |
| | | | | | | | | | | | | | | | | |
(1)We have investments in 25 states leased to 30 different operators.
(2)Other senior housing properties consist of independent living properties and properties providing any combination of skilled nursing, assisted living and/or independent living services.
(3)During 2011, we acquired a vacant parcel of land in Texas and entered into a commitment to fund the construction of a skilled nursing property with 120 beds which will replace an existing 90-bed skilled nursing property.
Owned properties are leased pursuant to non-cancelable operating leases generally with an initial term of 10 to 15 years. Each lease is a triple net lease which requires the lessee to pay all taxes, insurance, maintenance and repairs, capital and non-capital expenditures and other costs necessary in the operations of the facilities. Many of the leases contain renewal options and one contains limited period options that permit the operator to purchase the property.options. The leases provide for fixed minimum base rent during the initial and renewal periods. The majority of our leases contain provisions for specified annual increases over the rents of the prior year that are generally computed in one of four ways depending on specific provisions of each lease:
- (i)
- a specified annual increase over the prior year's rent, generally between 2.0% and 3.0%;
- (ii)
- a calculation based on the Consumer Price Index;
- (iii)
- as a percentage of facility net patient revenues in excess of base amounts or
- (iv)
- specific dollar increases.
We received no contingent rent income for the year ended December 31, 2013. Contingent rent income for the years ended December 31, 2011, 20102012 and 20092011 was not significant in relation to contractual base rent income.
The following table summarizes our acquisitions during 2013(dollar amounts in thousands):
| | | | | | | | | | | | | | | | |
Type of Property | | Purchase
Price | | Transaction
Costs | | Total
Acquisition
Costs | | Number
of
Properties | | Number
of
Beds/Units | |
|---|
Skilled Nursing(1) | | $ | 14,402 | | $ | 58 | | $ | 14,460 | | | 1 | | | 120 | |
Land(2) | | | 4,638 | | | — | | | 4,638 | | | — | | | — | |
| | | | | | | | | | | | |
| | | | | | | | | | | | | | | | | |
Totals | | $ | 19,040 | | $ | 58 | | $ | 19,098 | | | 1 | | | 120 | |
| | | | | | | | | | | | |
| | | | | | | | | | | | | | | | | |
| | | | | | | | | | | | | | | | | |
| | | | | | | | | | | | |
- (1)
- A skilled nursing property located in Florida which was added to a master lease at an incremental initial cash yield of 8.75%.
- (2)
- We purchased three vacant parcels of land in Colorado for a total of $3,475 under a pipeline agreement whereby we have the opportunity to finance any senior housing development project or acquisition originated by an operator through May 2018 (unless earlier terminated as provided for therein). The land was added to an existing master lease and we entered into development commitments in an amount not to exceed $30,256 to fund the construction of three memory care properties, two with 60 units and the other with 48 units. We also purchased four parcels of land held-for-use in Michigan for $1,163.
During the twelve months ended December 31, 2013, one of our lessees exercised its option to purchase six skilled nursing properties located in Ohio with a total of 230 beds for an all cash purchase price of $11,000,000. As a result, we recorded a $2,619,000 gain on sale. Also, during 2013, we sold a 47-bed skilled nursing property in Colorado for $1,000 and recognized a loss of $1,014,000 on the sale.
LTC PROPERTIES, INC.
NOTES TO CONSOLIDATED FINANCIAL STATEMENTS (Continued)
During the twelve months ended December 31, 2013, we completed the following construction projects:
| | | | | | | | | | | | | | | | | | |
Completed
Date | | Type of Property | | Number
of
Beds/Units | | State | | Completed Date | | 2013 Funding | | Total Funding | |
|---|
Jul 2013 | | Assisted Living(1) | | | 60 | | | Colorado | | | Jul 2013 | | $ | 4,316 | | $ | 9,850 | |
Jul 2013 | | Skilled Nursing(2) | | | 120 | | | Texas | | | Jul 2013 | | | 5,065 | | | 8,635 | |
Oct 2013 | | Assisted Living(3) | | | 77 | | | Kansas | | | Oct 2013 | | | 8,081 | | | 9,675 | (3) |
| | | | | | | | | | | | | | | | |
| | | | | | | | | | | | | | | | | | | |
| | Totals | | | 257 | | | | | | | | $ | 17,462 | | $ | 28,160 | |
| | | | | | | | | | | | | | | | |
| | | | | | | | | | | | | | | | | | | |
| | | | | | | | | | | | | | | | | | | |
| | | | | | | | | | | | | | | | |
- (1)
- This new property is a Memory Care property. The funded amount includes acquired land of $1,882.
- (2)
- This new property replaces a skilled nursing property in our existing portfolio.
- (3)
- The funded amount includes acquired land of $730.
We have a commitment to provide, under certain conditions, up to $5,000,000 per year through December 2014 to an existing operator for expansion of the 37 properties they lease from us. The estimated yield of this commitment is 9.5% plus the positive difference, if any, between the average yields on the U.S. Treasury 10-year note for the five days prior to funding, minus 420 basis points. As of December 31, 2013, no funds have been requested under this commitment.
Excluding the $5,000,000 per year commitment above, the following table summarizes our investment commitments as of December 31, 2013 and year to date funding on our development, redevelopment, renovation, and expansion projects(excludes capitalized interest, dollar amounts in thousands):
| | | | | | | | | | | | | | | | | | | |
Type of Property | | Investment
Commitment | | 2013
Funding(2) | | Commitment
Funded | | Remaining
Commitment | | Number
of
Properties | | Number
of
Beds/Units | |
|---|
Skilled Nursing | | $ | 29,650 | | $ | 7,221 | | $ | 12,757 | | $ | 16,893 | | | 6 | | | 640 | |
Assisted Living(1) | | | 50,656 | | | 9,614 | | | 10,661 | | | 39,995 | | | 7 | | | 385 | |
| | | | | | | | | | | | | | |
| | | | | | | | | | | | | | | | | | | | |
Totals | | $ | 80,306 | | $ | 16,835 | (3) | $ | 23,418 | | $ | 56,888 | (3) | | 13 | | | 1,025 | |
| | | | | | | | | | | | | | |
| | | | | | | | | | | | | | | | | | | | |
| | | | | | | | | | | | | | | | | | | | |
| | | | | | | | | | | | | | |
- (1)
- Includes the development of three memory care properties for a total of $30,256, one assisted living and memory care combination property for a total of $5,800, and the expansion of three assisted living properties for a total $14,600.
- (2)
- Excludes funding for completed construction projects shown above and $260 of capital improvement on three completed projects with no remaining commitments. It also includes $6 funded under the commitment as marketing expense, $3,475 of land acquired for development and the reclass of three pre-development loans with a total balance of $479. See Item 7. Notes Receivable for further discussion of the pre-development loans.
- (3)
- In January 2014, we funded $8,828 under investment commitments. Accordingly, we have a remaining commitment of $48,060.
LTC PROPERTIES, INC.
NOTES TO CONSOLIDATED FINANCIAL STATEMENTS (Continued)
Our construction in progress (or CIP) activity during the year ended December 31, 2013 for our development, redevelopment, renovation, and expansion projects is as follows(dollar amounts in thousands):
| | | | | | | | | | | | | | | | | | | |
Properties | | Projects | | CIP
Balance at
12/31/2012 | | Funded(1) | | Capitalized
Interest | | Conversions
out of CIP | | CIP
Balance at
12/31/2013 | |
|---|
Development projects: | | | | | | | | | | | | | | | | | | | |
Assisted living | | | 6 | | $ | 4,669 | | $ | 18,584 | | $ | 510 | | $ | (17,429 | ) | $ | 6,334 | |
Skilled nursing | | | 1 | | | 31 | | | 5,551 | | | 311 | | | — | | | 5,893 | |
| | | | | | | | | | | | | | |
| | | | | | | | | | | | | | | | | | | | |
Subtotal | | | 7 | | | 4,700 | | | 24,135 | | | 821 | | | (17,429 | ) | | 12,227 | |
Redevelopment, renovation and expansion projects: | | | | | | | | | | | | | | | | | | | |
Other | | | 1 | | | 6 | | | 117 | | | — | | | (123 | ) | | — | |
Assisted living | | | 4 | | | 66 | | | 21 | | | — | | | (79 | ) | | 8 | |
Skilled nursing | | | 5 | | | 3,516 | | | 6,730 | | | 111 | | | (7,924 | ) | | 2,433 | |
| | | | | | | | | | | | | | |
| | | | | | | | | | | | | | | | | | | | |
Subtotal | | | 10 | | | 3,588 | | | 6,868 | | | 111 | | | (8,126 | ) | | 2,441 | |
| | | | | | | | | | | | | | |
| | | | | | | | | | | | | | | | | | | | |
Total | | | 17 | | $ | 8,288 | | $ | 31,003 | | $ | 932 | | $ | (25,555 | ) | $ | 14,668 | |
| | | | | | | | | | | | | | |
| | | | | | | | | | | | | | | | | | | | |
| | | | | | | | | | | | | | | | | | | | |
| | | | | | | | | | | | | | |
- (1)
- Excludes $73 of capital improvement commitment funding which was capitalized directly into building and improvements and includes the reclass of three pre-development loans with a total balance of $479. See Item 7. Notes Receivable for further discussion of the pre-development loans.
The following table summarizes our acquisitions during 2012(dollar amounts in thousands):
| | | | | | | | | | | | | | | | |
Type of Property | | Purchase
Price | | Transaction
Costs | | Total
Acquisition
Costs | | Number
of
Properties | | Number
of
Beds/Units | |
|---|
Skilled Nursing(1) | | $ | 79,100 | | $ | 275 | | $ | 79,375 | | | 4 | | | 522 | |
Assisted Living(2) | | | 81,987 | | | 285 | | | 82,272 | | | 5 | | | 266 | |
Land(3) | | | 5,663 | | | 207 | | | 5,870 | | | — | | | — | |
| | | | | | | | | | | | |
| | | | | | | | | | | | | | | | | |
Totals | | $ | 166,750 | | $ | 767 | | $ | 167,517 | | | 9 | | | 788 | |
| | | | | | | | | | | | |
| | | | | | | | | | | | | | | | | |
| | | | | | | | | | | | | | | | | |
| | | | | | | | | | | | |
- (1)
- Includes two skilled nursing properties with a total of 234 beds located in Texas and two skilled nursing properties with a total of 288 beds located in Ohio.
- (2)
- Includes two properties with a total of 100 units located in Colorado and three properties with a total of 166 units located in New Jersey.
- (3)
- We purchased four vacant parcels of land in the following states: Colorado, Kansas, Kentucky and Texas. Simultaneous with the purchase, we entered into lease agreements and development commitments in an amount not to exceed $49,702 to fund the construction of a memory care property with 60 units and two assisted living properties with a total of 158 units and one skilled nursing property with 143 beds.
During the year ended December 31, 2012, we sold a 140-bed skilled nursing property located in Texas for $1,248,000 and recognized a gain, net of selling expenses, of $16,000. This property was leased under a master lease and the economic terms of this master lease did not change as a result of this sale.
LTC PROPERTIES, INC.
NOTES TO CONSOLIDATED FINANCIAL STATEMENTS (Continued)
The following table summarizes our acquisitions during 2011(dollar amounts in thousands):
| | | | | | | | | | | | | | | | |
Type of Property | | Purchase
Price | | Transaction
Costs | | Total
Acquisition
Costs | | Number
of
Properties | | Number
of
Beds/Units | |
|---|
Skilled Nursing(1)(2) | | $ | 93,841 | | $ | 330 | | $ | 94,171 | | | 7 | | | 1,016 | |
Range of Care(3) | | | 11,450 | | | 34 | | | 11,484 | | | 2 | | | 211 | |
Land(4) | | | 844 | | | 11 | | | 855 | | | — | | | — | |
| | | | | | | | | | | | |
| | | | | | | | | | | | | | | | | |
Totals | | $ | 106,135 | | $ | 375 | | $ | 106,510 | | | 9 | | | 1,227 | |
| | | | | | | | | | | | |
| | | | | | | | | | | | | | | | | |
| | | | | | | | | | | | | | | | | |
| | | | | | | | | | | | |
| | | | | | | | | | | | | | | | | | | | | | |
| |
| |
| |
| | (Unaudited) | |
|---|
| |
| |
| |
| |
| | Number of | |
|---|
Type of Property | | Purchase
Price | | Transaction
Costs | | Total
Acquisition Costs | | Number
of
Properties | | SNF
Beds | | ALF
Units | | ILF
Units | |
|---|
Skilled Nursing(2)(3)(4)(5) | | $ | 93,841 | | $ | 330 | | $ | 94,171 | | | 7 | | | 1,016 | | | — | | | — | |
Other Senior Housing(1)(6) | | | 11,450 | | | 34 | | | 11,484 | | | 2 | | | 118 | | | 40 | | | 53 | |
Land(2) | | | 844 | | | 11 | | | 855 | | | — | | | — | | | — | | | — | |
| | | | | | | | | | | | | | | | |
Totals | | $ | 106,135 | | $ | 375 | | $ | 106,510 | | | 9 | | | 1,134 | | | 40 | | | 53 | |
| | | | | | | | | | | | | | | | |
- (1)
Other senior housing properties consist of independent living properties and properties providing any combination ofIncludes two skilled nursing assisted living and/or independent living services.
(2)We acquiredproperties with a 196-bed skilled nursing property and a vacant parceltotal of land336 beds located in Texas for $25,500 and a purchase price of $15,500 and $844, respectively. Simultaneous with the purchases, we entered into a commitment, in an amount not to exceed $8,250, to fund the construction of a 120-bed skilled nursing property on the acquired parcel of land which will replace a 90-bed skilled nursing property in our existing portfolio. Upon completion of the construction, the lessee intends to relocate the residents to the newly constructed property. These properties are leased to an operator within our existing portfolio pursuant to a 10-year master lease agreement at a GAAP yield of 11.0%. The master lease contains annual escalations of 2.5% and has two 5-year renewal options.
(3)We purchased a 140-bed156-bed skilled nursing property located in TexasCalifornia for an aggregate purchase price of $10,000. Simultaneous with the purchase, we added the property to an existing master lease with a third party operator at an incremental GAAP yield of 10.5%.
$17,500.(4)(2)- We purchased four skilled nursing properties with 524-beds in Texas for $50,841 which consists of $41,000 in cash at closing with the remainder in the form of contingent earn-out payments. The contingent earn-out payment arrangements require us to pay two earn-out payments
totallingtotaling up to $11,000 upon the properties achieving a sustainable stipulated rent coverage ratio. During 2013 and 2011, we paid $7,000 and $4,000, respectively, related to the first contingent earn-out payment. We estimated the fair value ofSeeNote 11. Commitments and Contingencies for further discussion on the contingent earn-out payments using a discounted cash flow analysis.
earn-out. (5)We purchased a 156-bed skilled nursing property located in California for $17,500 and entered into a 12-year lease with an unrelated third party. The lease has a GAAP yield of 10.3%, contains annual escalations of 2.0% and has two 10-year renewal options.
(6)(3)- We purchased two senior housing properties located in South Carolina with 118 skilled nursing beds, 40 assisted living units and 53 independent living units for $11,450.
- (4)
- We acquired a vacant parcel of land in Texas for the purpose of building a replacement skilled nursing property for a purchase price of $844.
Depreciation expense on buildings and improvements, including properties classified as held-for-sale, was $24,568,000, $22,002,000, and $19,487,000 for the years ended December 31, 2013, 2012 and 2011, respectively.
Future minimum base rents receivable under the remaining non-cancelable terms of operating leases excluding the four assisted living properties being transitioned to a new lessee, as previously discussed inNote 2. Summary of Significant Accounting Policies, and assuming the Extendicare and ALC master leases are not re-leased at maturity in December 2014, as previously discussed inNote 3. Major Operators, and excluding the effects of straight-line rent and extension options are as follows (in thousands):
| | | | |
| | Annual Cash
Rent | |
|---|
2014 | | $ | 97,132 | |
2015 | | | 85,132 | |
2016 | | | 85,393 | |
2017 | | | 84,688 | |
2018 | | | 81,028 | |
Thereafter | | | 374,524 | |
LTC PROPERTIES, INC.
NOTES TO CONSOLIDATED FINANCIAL STATEMENTS (Continued)
Set forth in the table below are the components of the income from discontinued operations (in thousands):
| | | | | | | | | | |
| | For the year ended
December 31, | |
|---|
| | 2013 | | 2012 | | 2011 | |
|---|
Rental income | | $ | 1,123 | | $ | 1,551 | | $ | 1,547 | |
| | | | | | | | |
| | | | | | | | | | | |
Total revenues | | | 1,123 | | | 1,551 | | | 1,547 | |
Depreciation and amortization | | |
(317 |
) | |
(540 |
) | |
(712 |
) |
General and administrative expenses | | | (1 | ) | | (6 | ) | | (12 | ) |
| | | | | | | | |
| | | | | | | | | | | |
Total expenses | | | (318 | ) | | (546 | ) | | (724 | ) |
| | | | | | | | |
| | | | | | | | | | | |
Income from discontinued operations | | $ | 805 | | $ | 1,005 | | $ | 823 | |
| | | | | | | | |
| | | | | | | | | | | |
| | | | | | | | | | | |
| | | | | | | | |
Mortgage Loans. The lease hasfollowing table summarizes our investments in mortgage loans secured by first mortgages at December 31, 2013 (dollar amounts in thousands):
| | | | | | | | | | | | | | | | | | | | | | |
| |
| |
| |
| |
| | Number of | |
| |
|---|
Type of Property | | Gross
Investments | | Percentage
of
Investments | | Number
of
Loans | | Number
of
Properties(1) | | SNF
Beds | | ALF
Units | | Investment
per
Bed/Unit | |
|---|
Skilled Nursing(2) | | $ | 152,401 | | | 91.2 | % | | 16 | | | 32 | | | 3,953 | | | — | | $ | 38.55 | |
Assisted Living | | | 12,112 | | | 7.2 | % | | 3 | | | 8 | | | — | | | 211 | | $ | 57.40 | |
Range of Care | | | 2,602 | | | 1.6 | % | | 1 | | | 1 | | | 99 | | | 74 | | $ | 15.04 | |
| | | | | | | | | | | | | | | | | |
| | | | | | | | | | | | | | | | | | | | | | | |
Totals | | $ | 167,115 | | | 100.0 | % | | 20 | | | 41 | | | 4,052 | | | 285 | | | | |
| | | | | | | | | | | | | | | | | |
| | | | | | | | | | | | | | | | | | | | | | | |
| | | | | | | | | | | | | | | | | | | | | | | |
| | | | | | | | | | | | | | | | | |
- (1)
- We have investments in 9 states that include mortgages to 12 different operators.
- (2)
- Includes a
GAAP yieldmortgage and construction loan secured by a currently operating skilled nursing property and parcel of 10.1%, containsland upon which a 106-bed replacement property is being constructed.
At December 31, 2013, the mortgage loans had interest rates ranging from 7.0% to 13.6% and maturities ranging from 2014 to 2043. In addition, some loans contain certain guarantees, provide for certain facility fees and generally have 20-year to 30-year amortization schedules. The majority of the mortgage loans provide for annual increases in the interest rate based upon a specified increase of 10 to 25 basis points.
During the year ended December 31, 2013, we funded a $124,387,000 mortgage loan with a third-party operator, Prestige Healthcare, secured by 15 skilled nursing properties with a total of 2,092 beds in Michigan. The loan is for a term of 30 years and bears interest at 9.53% for five years, escalating annually thereafter by 2.25%. Payments are interest-only for three years, after which the borrower will make interest payments along with annual principal payments of $1,000,000. The loan agreement provides for additional forward commitments of $12,000,000 for capital improvements at 9.41% for the first twelve months. Beginning in the thirteenth month, the interest will be the greater of 7.25% plus the positive difference, if any, between the average yields on the U.S. Treasury 10-year note for the twenty days prior to funding or 9.0% with annual escalations of 2.5%2.25%. The loan agreement also provides, under certain conditions and has three 5-year renewal options.based on certain operating metrics and valuation thresholds achieved and sustained within the first twelve years of the term, for additional loan proceeds of up to $40,000,000 with such proceeds limited to $10,000,000 per twelve months. The term for the additional loan proceeds will be at the greater of 7.25% plus the positive difference, if any, between the average
LTC PROPERTIES, INC.
NOTES TO CONSOLIDATED FINANCIAL STATEMENTS (Continued)
The following unaudited pro forma consolidated results of operationsyields on the U.S. Treasury 10-year note for the twenty days prior to funding or 9.0% with annual escalations of 2.25%.
The borrower has a one-time option between the third and twelfth years to prepay up to 50% of the then outstanding loan balance without penalty. Exclusively for the purposes of this option, the properties collateralizing the loan have been separated by us into two pools of assets. If and when the option is exercised, we will identify which of the two pools we will release for prepayment and removal from portfolio of properties securing the loan. If the prepayment option is exercised and timely concluded, the borrower forfeits its opportunity to access any additional loan proceeds. Additionally, under certain circumstances, including a change in regulatory environment, we have the option to purchase the properties.
During the twelve months ended December 31, 20112013 and 2010 assume that the 2011 acquisitions of the above properties were completed as of January 1, 2010 as shown below (in thousands):
| | | | | | | |
| | For the year ended December 31, | |
|---|
| | 2011 | | 2010 | |
|---|
Revenues | | $ | 91,916 | | $ | 86,257 | |
Net Income | | $ | 53,636 | | $ | 52,590 | |
Pro forma data may not be indicative of the results that would have been obtained had the acquisition actually occurred as of January 1, 2010, nor does it intend to be a projection of future results.
Also, during the year ended December 31, 2011, we invested $3,144,000 at an average yield of 9.7% under agreements to expand and renovate 11 properties operated by seven different operators and we invested $42,000 in capital improvements to existing properties under various lease agreements whose rental rates already reflected this investment. SeeNote 11. Commitments and Contingencies for further discussion about our commitment agreements.
In January 2012, we entered into an agreement to sellfunded $4,971,000 and $2,619,000, respectively, under a 140-bed$10,600,000 mortgage and construction loan that originated during 2012. This loan is secured by a currently operating skilled nursing property located in Texasand a vacant parcel of land upon which a 106-bed replacement facility is being constructed. The term is 10 years and the interest rate is the greater of 7.25% plus the positive difference, if any, between the average yields on the U.S. Treasury 10-year note for $1,248,000. This propertythe twenty days prior to funding, but no less than 9.25% with annual escalations of 0.25%.The agreement gives us the right to purchase the replacement facility for $13,500,000 during an 18 month period beginning on the first anniversary of the issuance of the certificate of occupancy. If the purchase option is leased under aexercised, the replacement facility will be added to an existing master lease andat a lease rate equivalent to the economic termsinterest rate in effect on the loan at the time the purchase option is exercised. As of December 31, 2013, we have a remaining commitment of $3,010,000 under this master lease will not change as a result of this sale. This sale is scheduled to close on February 29, 2012 and will result in a $16,000 gain recognized in 2012.
loan. During the year ended 2012, we also originated a $5,100,000 two-year interest-only bridge loan. The loan is secured by a 70-unit assisted living property in Pennsylvania and bears interest at 7.0% increasing annually by 1.5%.
At December 31, 2010, we sold a 195-bed skilled nursing property located in Virginia to2013 and 2012 the lessee under a purchase option for $4,935,000. As a result, we received net cash proceedscarrying values of $4,864,000the mortgage loans were $165,444,000 and recognized a gain net of selling expenses of $310,000.
The following table summarizes our acquisitions during 2010$39,299,000, respectively. Scheduled principal payments on mortgage loan receivables are as follows(dollar amounts in thousands):
| | | | | | | | | | | | | | | | | | | | | | |
| |
| |
| |
| | (Unaudited) | |
|---|
| |
| |
| |
| |
| | Number of | |
|---|
Type of Property | | Purchase
Price | | Transaction
Costs | | Total
Acquisition
Costs | | Number
of
Properties | | SNF
Beds | | ALF
Units | | ILF
Units | |
|---|
Assisted Living | | $ | 26,900 | | $ | 210 | (3) | $ | 27,110 | | | 4 | | | — | | | 241 | | | — | |
Skilled Nursing | | | 54,011 | (2) | | 140 | | | 54,151 | | | 5 | | | 668 | | | — | | | — | |
Other Senior Housing(1) | | | 13,339 | | | — | (4) | | 13,339 | | | 1 | | | 137 | | | 46 | | | 47 | |
| | | | | | | | | | | | | | | | |
Totals | | $ | 94,250 | | $ | 350 | | $ | 94,600 | | | 10 | | | 805 | | | 287 | | | 47 | |
| | | | | | | | | | | | | | | | |
| | | | |
| | Scheduled
Principal | |
|---|
2014 | | $ | 14,244 | |
2015 | | | 4,272 | |
2016 | | | 2,695 | |
2017 | | | 7,118 | |
2018 | | | 8,233 | |
Thereafter | | | 130,553 | |
| | | | |
| | | | | |
Total | | $ | 167,115 | |
| | | | |
| | | | | |
| | | | | |
| | | | |
(1)Other senior housing properties consist of independent living properties and properties providing any combination of skilled nursing, assisted living and/or independent living services.
(2)We purchased a 166-skilled nursing property in Texas and leased During the property to a third party operator, who previously operated the property under a lease with the seller. We paid this operator $125 as a lease inducement which is amortized as a yield adjustment over the life of the lease.
(3)We purchased four assisted living properties with a total of 241 units for $26,900 and incurred $210 in transaction costs. Included in the transaction costs is a $106 charge which represents half of the seller's prepayment penalty on its loan
LTC PROPERTIES, INC.
NOTES TO CONSOLIDATED FINANCIAL STATEMENTS (Continued)
(4)We purchased the other senior housing property along with a 90-bed skilled nursing property for $22,000 and incurred $7 in transaction costs. The transaction costs for this acquisition are included in the skilled nursing property transaction costs above. These properties were leased to a third party operator under a 12-year master lease with two 10-year renewal options and the annualized rental income is $2,420(unaudited) which is included in the annualized rental income for skilled nursing properties above. We do not allocate rental income among properties in a master lease.
Also, during the yeartwelve months ended December 31, 2010,2013, 2012 and 2011, we invested $4,593,000 at an average yield of 9.7% under agreements to expandreceived $1,933,000, $2,572,000, and renovate 11 properties operated by seven different operators and we invested $1,231,000$3,136,000, respectively in capital improvements to existing properties under various lease agreements whose rental rates already reflected this investment.
regularly scheduled principal payments. During the year ended December 31, 2009,2012, we acquired threereceived $19,061,000 plus accrued interest related to the early payoff of eleven mortgage loans secured by four skilled nursing properties and seven assisted living properties with a total of 192 units for $13,000,000 and incurred $181,000 in transaction costs. We also invested $3,170,000 at an average yield of 10.6% under agreements to expand and renovate eight properties operated by six different operators and we invested $633,000 in capital improvements to existing properties under various lease agreements whose rental rates already reflected this investment.
Depreciation expense on buildings and improvements, including properties classified as held-for-sale, was $19,487,000, $16,016,000, and $14,705,000 forproperties. During the yearsyear ended December 31, 2011, 2010 and 2009.
Future minimum base rents receivable under the remaining non-cancelable terms of operating leases excluding the effects of straight-line rent and extension options are: $81,021,000; $81,344,000; $81,774,000; $68,533,000; $68,106,000 and $343,828,000 for the years ending December 31, 2012, 2013, 2014, 2015, 2016 and thereafter.
Set forth in the table below are the components of the loss from discontinued operations (in thousands):
| | | | | | | | | | |
| | For the year ended
December 31, | |
|---|
| | 2011 | | 2010 | | 2009 | |
|---|
Rental income | | $ | — | | $ | 1,005 | | $ | 1,097 | |
Interest and other income | | | 5 | | | 5 | | | 3 | |
| | | | | | | | |
Total revenues | | | 5 | | | 1,010 | | | 1,100 | |
Depreciation and amortization | | | (108 | ) | | (392 | ) | | (502 | ) |
Provisions for doubtful accounts | | | — | | | (601 | ) | | (579 | ) |
Operating and other expenses | | | (127 | ) | | (134 | ) | | (132 | ) |
| | | | | | | | |
Total expenses | | | (235 | ) | | (1,127 | ) | | (1,213 | ) |
| | | | | | | | |
Loss from discontinued operations | | $ | (230 | ) | $ | (117 | ) | $ | (113 | ) |
| | | | | | | | |
Any referencewe received $2,831,000 plus accrued interest related to the numberpayoff of properties, number of schools, number of units, number of beds,four mortgage loans secured by one assisted living property and yield on investments in real estate are unaudited and outside the scope of our independent registered public accounting firm's audit of our consolidated financial statements in accordance with the standards of the Public Company Accounting Oversight Board.
7. Notes Receivable
Our notes receivable consists of various loans and line of credit agreements with certain operators. During 2011, we funded $232,000 on an 8.5% construction and term loan in which we committed toseven skilled nursing properties.
LTC PROPERTIES, INC.
NOTES TO CONSOLIDATED FINANCIAL STATEMENTS (Continued)
provide7. Notes Receivable
During 2013, we received $3,035,000 for the early repayment of two loans with interest rates ranging from 8.5% to 9.0%. Also during 2013, we committed to fund three loans up to $2,500,000$400,000 each with interest at 12%. Two of these loans mature in September 2017 and one matures in December 2017. We also committed to fund three pre-development loans of $325,000 each to facilitate the site selection and pre-construction services for capital improvements at two senior housing properties we own and leasethe future development of three memory care properties. The initial rate of each of these pre-development loans is 12%, increasing by 25 basis points per year. Each of these pre-development loans matured due to the borrower. Upon the earlieracquisition of the full fundingland and the outstanding balance of the $2,500,000 or$479,000 was reclassified to real estate under development during 2013.
As of December 31, 2012, construction distribution under this loan will cease2013, we have seven loans and this loan will fully amortize to maturity in November 2017. SeeNote 11. Commitmentsline of credit agreements with a total commitment of $2,425,000 and Contingencies for further discussion.
a remaining commitment balance of $1,830,000. The following table summarizes the number of loans outstanding, the weighted average interest rate of these loans is 11.5%. During 2013, 2012, and the carrying value as of December 31, 2011, 2010, and 2009 and notes receivablewe received principal payments, receivedincluding loan payoffs, of $3,110,000, $569,000, and $731,000, respectively, and we advanced for the years 2011, 2010,principal of $1,004,000, $2,930,000, and 2009(dollar amounts in thousands):$232,000, respectively.
| | | | | | | | | | | | | | | | |
| | Number of Loans | | Weighted Average Interest Rate | | Carrying Value | | Principal Payments Received | | Principal Advanced | |
|---|
2011 | | | 6 | | | 10.0 | % | $ | 817 | | $ | 731 | | $ | (232 | ) |
2010 | | | 5 | | | 11.9 | % | | 1,283 | | | 1,573 | | | (100 | ) |
2009 | | | 7 | | | 11.5 | % | | 2,689 | | | 671 | | | (375 | ) |
8. Marketable Securities
At December 31, 2011 and 2010, we had an investment in $6,500,000 face value ofDuring 2012, Skilled Healthcare Group, Inc.'s (or SHG) redeemed all of their outstanding Senior Subordinated Notes withat par value plus accrued and unpaid interest up to the redemption date. The SHG Senior Subordinated Notes had a face rate of 11.0% and an effective yield of 11.1%. Interest on the notes is payable semi-annuallyDuring 2012, we recognized $235,000 of interest income from our $6,500,000 investment in arrears and the notes mature on January 15, 2014.SHG Senior Subordinated Notes. One of our board members iswas the chief executive officer of SHG.SHG until his retirement on November 20, 2013. SeeNote 12. Transactions with Related Party for further discussion.
9. Debt Obligations
Bank Borrowings. During 2011,2012, we entered into a new $210,000,000amended our Unsecured Credit Agreement which provides forincreasing the commitment to $240,000,000 with the opportunity to increase the credit amount up to a total of $250,000,000. The new Unsecured Credit Agreement provides a revolving line of credit with no scheduled maturities other than$350,000,000. Additionally, the drawn pricing was decreased by 25 basis points, the undrawn pricing was decreased by 10 basis points and the maturity date of April 18, 2015, and allows usthe facility was extended for one additional year to borrowMay 25, 2016. The amendment also provides for a one-year extension option at our discretion, subject to customary conditions. Based on our leverage ratios at December 31, 2013, the sameamended facility provides for interest rates applicable to borrowings under our prior agreement, 150annually at LIBOR plus 125 basis points over LIBOR based on current leverage ratios.and the unused commitment fee was 25 basis points.
Financial covenants contained in the new Unsecured Credit Agreement, which are measured quarterly, require us to maintain, among other things:
- (i)
- a ratio of total indebtedness to total asset value not greater than 0.5 to 1.0;
- (ii)
- a ratio of secured debt to total asset value not greater than 0.35 to 1.0;
- (iii)
- a ratio of unsecured debt to the value of the unencumbered asset pool not greater than 0.6 to 1.0; and
- (iv)
- a ratio of EBITDA, as calculated in the
new Unsecured Credit Agreement, to fixed charges not less than 1.50 to 1.0.
During 20112013 we borrowed $167,600,000$93,000,000 and repaid $149,300,000$187,500,000 under our Unsecured Credit Agreement. At December 31, 2011,2013, we had $56,000,000$21,000,000 outstanding at an interest rate of LIBOR plus 1.50%1.25% and $154,000,000$219,000,000 available for borrowing. DuringIn January 2012,2014, we borrowed $4,000,000. After this borrowing, we had $60,000,000 outstanding and $150,000,000 available for borrowing. At December 31, 2011 and 2010, we were in compliance with all covenants.
Senior Unsecured Notes. During 2011, we sold to affiliates and managed accounts of Prudential Investment Management, Inc. (individually and collectively "Prudential") $50,000,000 aggregate$11,500,000 at an
LTC PROPERTIES, INC.
NOTES TO CONSOLIDATED FINANCIAL STATEMENTS (Continued)
interest rate of LIBOR plus 1.25% under our unsecured revolving line of credit. Accordingly, we have $32,500,000 outstanding and $207,500,000 available for borrowing. At December 31, 2013 and 2012, we were in compliance with all covenants.
Senior Unsecured Notes. At December 31, 2013, we had $255,800,000 outstanding under our Senior Unsecured Notes with a weighted average interest rate of 4.85%. During 2013, we sold to affiliates and managed accounts of Prudential Investment Management, Inc. (or individually and collectively Prudential) $70,000,000 aggregate principal amount of 3.99% senior unsecured term notes fully amortizing to maturity on November 20, 2021. We used the proceeds to pay down our unsecured revolving line of credit.
On October 30, 2013, we entered into an amended and restated note purchase and private shelf agreement with Prudential. The shelf agreement with Prudential, as amended, conforms the definitions and financial covenants contained therein and previously issued senior unsecured promissory notes outstanding to Prudential and certain of its affiliates and managed accounts to those contained in our unsecured credit facility and to covenants contained in the senior unsecured notes sold in July 2012. Any notes sold by us to Prudential under the shelf agreement will be in amounts at fixed interest rates and have maturity dates (each note to have a final maturity not greater than 12 years and an average life not greater than 10 years from the date of issuance) subject to further agreement by us and Prudential.
The shelf agreement with Prudential contains standard covenants including requirements to maintain financial ratios such as debt to asset value ratios. Under the shelf agreement, maximum total indebtedness shall not exceed 50% of total asset value as defined in the shelf agreement, as amended. Borrowings under the shelf agreement are limited by reference to the value of unencumbered assets. Under the shelf agreement, maximum unsecured debt shall not exceed 60% of the value of the unencumbered asset pool as defined in the shelf agreement.
During 2012, we sold 12-year senior unsecured notes in the aggregate amount of $85,800,000 to a group of institutional investors in a private placement transaction. The notes bear interest at 5.0%, mature on July 19, 2024 and have scheduled annual principal pay downs in years 8 through 12. During 2011, we sold to Prudential $50,000,000 aggregate principal amount of 4.80% senior unsecured term notes fully amortizing to maturity on July 20, 2021. Additionally, we entered into an Amended and Restated Note Purchase and Private Shelf agreement with Prudential which provides for the possible issuance of up to an additional $100,000,000 of senior unsecured fixed-rate term notes during a three-year issuance period. Financial covenants contained in the Amended and Restated Note Purchase and Private Shelf agreement are substantially the same as the financial covenants contained in our Unsecured Credit Agreement. During 2010, we sold to Prudential $25,000,000 aggregate principal amount of 5.26% senior unsecured term notes due July 14, 2015 and $25,000,000 aggregate principal amount of 5.74% senior unsecured term notes fully amortizing to maturity on January 14, 2019.
Mortgage Loans Payable. At December 31, 2011 and 2010, we had no mortgage loans payable outstanding. During 2010, we paid off a $7,626,000 mortgage loan secured by an assisted living property located in California. The retired debt had an interest rate of 8.69%. Also, during 2010, we paid $59,000 in regularly scheduled principal payments.
Bonds Payable. At December 31, 20112013 and 20102012 we had outstanding principal of $3,200,000$2,035,000 and $3,730,000,$2,635,000, respectively, on multifamily tax-exempt revenue bonds that are secured by five assisted living properties in Washington. These bonds bear interest at a variable rate that is reset weekly and mature during 2015. For the year ended December 31, 2011,2013, the weighted average interest rate, including letter of credit fees, on the outstanding bonds was 2.10%2.9%. During 20112013 and 20102012 we paid $530,000$600,000 and $495,000,$565,000, respectively, in regularly scheduled principal payments. At December 31, 20112013 and 2010,2012, the aggregate carrying value of real estate properties securing our bonds payable was $6,915,000$6,386,000 and $7,179,000,$6,650,000, respectively.
LTC PROPERTIES, INC.
NOTES TO CONSOLIDATED FINANCIAL STATEMENTS (Continued)
Scheduled Principal Payments. The following table represents our long term contractual obligations (scheduled principal payments and amounts due at maturity) as of December 31, 2011,2013, and excludes the effects of interest (in thousands):
|
| | Total | | 2012 | | 2013 | | 2014 | | 2015 | | 2016 | | Thereafter | | | Total | | 2014 | | 2015 | | 2016 | | 2017 | | 2018 | | Thereafter | |
|---|
Bank borrowings | | $ | 56,000 | (1) | $ | — | | $ | — | | $ | — | | $ | 56,000 | | $ | — | | $ | — | | | $ | 21,000 | | $ | — | | $ | — | | $ | 21,000 | | $ | — | | $ | — | | $ | — | |
Senior unsecured notes | | 100,000 | | — | | — | | 4,167 | | 29,166 | | 16,667 | | 50,000 | | | 255,800 | | 4,167 | | 29,166 | | 26,667 | | 26,167 | | 28,167 | | 141,466 | |
Bonds payable | | 3,200 | | 565 | | 600 | | 635 | | 1,400 | | — | | — | | | 2,035 | | 635 | | 1,400 | | — | | — | | — | | — | |
| | | | | | | | | | | | | | | | | | | | | | | | | | | | | | | |
| | | | | | | | | | | | | | | | | |
| | $ | 159,200 | | $ | 565 | | $ | 600 | | $ | 4,802 | | $ | 86,566 | | $ | 16,667 | | $ | 50,000 | | | $ | 278,835 | | $ | 4,802 | | $ | 30,566 | | $ | 47,667 | | $ | 26,167 | | $ | 28,167 | | $ | 141,466 | |
| | | | | | | | | | | | | | | | | | | | | | | | | | | | | | | |
| | | | | | | | | | | | | | | | | |
| | | | | | | | | | | | | | | | | |
| | | | | | | | | | | | | | | | | |
(1)At December 31, 2011 we had $154,000 available for borrowing under our Unsecured Credit Agreement. During January 2012, we borrowed $4,000 under our Unsecured Credit Agreement. After this borrowing, we had $60,000 outstanding and $150,000 available for borrowing.
10. Equity
Preferred Stock. Preferred Stock is comprisedAt December 31, 2013 and 2012, we had 2,000,000 shares of the series summarized as follows:
| | | | | | | | | | | | | | | | | | | |
| | Shares outstanding at
December 31, | |
| |
| | Carrying Value at
December 31, | |
|---|
| | Liquidation
Value
Per share | | Dividend
Rate | |
|---|
Issuance | | 2011 | | 2010 | | 2011 | | 2010 | |
|---|
Series C Cumulative Convertible Preferred Stock | | | 2,000,000 | | | 2,000,000 | | $ | 19.25 | | | 8.5 | % | $ | 18.80 | | $ | 18.80 | |
Series F Cumulative Preferred Stock | | | — | | | 3,536,530 | | $ | 25.00 | | | 8.0 | % | $ | — | | $ | 23.99 | |
| | | | | | | | | | | | | | | | | | |
Total Cumulative Preferred Stock | | | 2,000,000 | | | 5,536,530 | | | | | | | | | | | | | |
| | | | | | | | | | | | | | | | | | |
LTC PROPERTIES, INC.
NOTES TO CONSOLIDATED FINANCIAL STATEMENTS (Continued)
Ourour 8.5% Series C Cumulative Convertible Preferred Stock (or Series C preferred stock) outstanding. Our Series C preferred stock is convertible into 2,000,000 shares of our common stock. Dividendsstock and dividends are payable quarterly. Total shares reserved for issuance of common stock related to the conversion of Series C preferred stock were 2,000,000 shares at December 31, 20112013 and 2010.
At December 31, 2011 and 2010, we had no shares of our 8.5% Series E Cumulative Convertible Preferred Stock (or Series E preferred stock) outstanding. Our Series E preferred stock was convertible at any time into shares of our common stock at a conversion price of $12.50 per share of common stock. During 2010, holders of 32,895 shares of Series E preferred stock elected to convert such shares into 65,790 shares of common stock. During 2010, we redeemed the remaining 4,921 shares of outstanding Series E preferred stock at a redemption price of $25.4191 per share, including accrued and unpaid dividends up to and including the redemption date. Accordingly, we recognized the $6,000 of original issue costs related to the Series E preferred stock as a preferred stock redemption charge which is included in the income statement line item "Income allocated to preferred stockholders."
Our 8.0% Series F Cumulative Stock (or Series F preferred stock) were redeemable by us, at our option, in whole or from time to time in part, for $25.00 per Series F Preferred Stock in cash plus any accrued and unpaid dividends up to the date of redemption. The dividend rate was 8.0% and the liquidation value was $25.00 per share. Dividends were cumulative from the date of original issue and were payable quarterly to stockholders of record on the first day of each quarter. During 2011, we redeemed 3,536,530 shares of our Series F preferred stock, representing all of our remaining outstanding shares. The redemption price was $25.1333 per share, including accrued and unpaid dividends. During 2010, we redeemed 2,357,686 shares of our Series F preferred stock, representing 40% of our outstanding shares, at a redemption price of $25.3889 per share, including accrued and unpaid dividends. Accordingly, we recognized the $3,566,000 and $2,377,000 in 2011 and 2010, respectively, of original issue costs related to the Series F preferred stock as a preferred stock redemption charge which is included in the income statement line item "Income allocated to preferred stockholders." During 2009, we invested $2,000,000 to repurchase a total of 109,484 shares of our Series F Preferred Stock at an average cost including fees and costs of $18.27 per share. In accordance with the accounting guidance regarding the effect on the calculation of earnings per share for the redemption or induced conversion of preferred stock, the discounted purchase price on these shares, which is equal to the liquidation value over the redemption value, netted with the original issuance costs has been added to net income in calculating net income allocable to common stockholders.
While outstanding, the liquidation preferences of each share of preferred stock arepari passu with one another. None have any voting rights, any stated maturity, nor are they subject to any sinking fund or mandatory redemption.2012.
Common Stock. During 2011,2013, we sold 3,990,0004,025,000 shares of common stock in a public offering at a price of $27.25$44.50 per share, before fees and costs of $5,096,000, in an underwritten public offering.$7,748,000. The net proceeds of $103,631,000$171,365,000 were used to redeem all of our Series F preferred stock outstanding, as previously discussed, and the remaining net proceeds were used to partially repaypay down amounts outstanding under our Unsecured Credit Agreement.
During 2010,unsecured revolving line of credit, to fund acquisitions and our current development commitments and general corporate purposes. Also, during 2013, we sold 1,970,000acquired 6,925 shares of common stock at a price of $24.70 per share, before fees and costs of $703,000, in a registered direct placementheld by employees who tendered owned shares to certain institutional investors. We raised $47,956,000 in net proceeds from the offering. The net proceeds were used to redeem all of our Series E preferred stock and 40% of our Series F preferred stock outstanding, as previously discussed.
LTC PROPERTIES, INC.
NOTES TO CONSOLIDATED FINANCIAL STATEMENTS (Continued)satisfy tax withholding obligations.
We have anDuring 2013, we terminated the equity distribution agreement which allowsallowed us to issue and sell, from time to time, up to $85,686,000 in aggregate offering price of our common shares. Sales of common shares are made by means of ordinary brokers' transactions at market prices, in block transactions, or as otherwise agreed between us and our sales agents. During 2011,the twelve months ended December 31, 2013, we sold 126,742 shares of common stock for $4,895,000 in net proceeds under our equity distribution agreement. In conjunction with the sale of common stock, we reclassified $662,000 of accumulated costs associated with the equity distribution agreement to additional paid in capital. During 2012, we did not sell shares of our common stock under our equity distribution agreement.
During 2010,2012, we sold 776,400amended our charter to increase the number of authorized shares of common stock from 45,000,000 to 60,000,000 shares. The charter amendment was approved by our stockholders at a weighted average price, including fees and costs,the 2012 annual meeting of $25.55 per share, resulting in net proceeds of $19,838,000 after $492,000 of fees and costs. During 2009, we sold 30,000 shares of common stock at a weighted average price, including fees and costs, of $25.54 per share, resulting in net proceeds of $766,000 after $18,000 of fees and costs. At December 31, 2011, we had $64,573,000 available under this equity distribution agreement.
Our Board of Directors authorized a share repurchase program enabling us to repurchase up to 5,000,000 shares of our equity securities, including common and preferred stock in the open market. This authorization does not expire until 5,000,000 shares of our equity securities have been repurchased or the Board of Directors terminates its authorization. During 2011 and 2010, we did not purchase shares of our equity securities. At December 31, 2011, we continue to have an open Board authorization to purchase an additional 3,360,237 shares in total of equity securities.
Non-controlling Interests. We have one limited partnership. The limited partnership agreement allows the limited partners to convert,stockholders held on a one-for-one basis, their limited partnership units into shares of common stock or the cash equivalent, at our option. At December 31, 2011, we have reserved 112,588 shares of our common stock under this partnership agreement. Since we exercise control, we consolidate the limited partnership and we carry the non-controlling interests at cost. At December 31, 2011, the carrying value and market value of the partnership conversion rights was $1,962,000 and $3,522,000, respectively.May 22, 2012.
In January 2012, two of our limited partners exercised their conversion rights. One limited partner exchanged all of its 67,294 partnership units and the other limited partner exchanged 22,000 partnership units in the limited partnership. Upon receipt of the redemption notification of 89,294 limited partnership units, we elected to satisfy the redemption in cash. We paid the limited partners $2,764,000, which represents the closing price of our common stock on the redemption date plus $0.05 per share multiplied by the number of limited partnership units redeemed. The amount we paid upon redemption exceeded the book value of the limited partnership interest redeemed by $1,246,000. In accordance with FASB accounting guidance, we account for this exchange as an equity transaction because there was no change in control requiring consolidation or deconsolidation and remeasurement. Accordingly, the $1,246,000 excess book value of the limited partners' interest in the partnership was reclassified to stockholders' equity. Subsequent to these conversions, we have reserved 23,294 shares of our common stock under this partnership agreement.
During 2011 and 2010, none of our limited partners exercised their conversion rights. During 2009, one of our limited partners exercised its conversion rights and exchanged all of its interest in the limited partnership. Upon receipt of the redemption notification of 67,294 limited partnership units, we elected to convert its partnership units into 67,294 shares of our common stock. In accordance with FASB accounting guidance, we account for this exchange as an equity transaction because there was no change in control requiring consolidation or deconsolidation and remeasurement. Accordingly, the $1,144,000 carrying amount of the limited partner's interest in the partnership was reclassified to
LTC PROPERTIES, INC.
NOTES TO CONSOLIDATED FINANCIAL STATEMENTS (Continued)
stockholders' equity. The following table represents the change from net income attributable to us and transfers from non-controlling interest (in thousands):
| | | | | | | | | | |
| | Years Ended December 31, | |
|---|
| | 2011 | | 2010 | | 2009 | |
|---|
Net income attributable to LTC Properties, Inc. | | $ | 49,252 | | $ | 45,862 | | $ | 44,064 | |
Transfers from the non-controlling interest | | | | | | | | | | |
Increase in paid-in capital for limited partners conversion | | | — | | | — | | | 1,144 | |
| | | | | | | | |
Change from net income attributable to LTC Properties, Inc. and transfers from non-controlling interest | | $ | 49,252 | | $ | 45,862 | | $ | 45,208 | |
| | | | | | | | |
Available Shelf Registrations.Registration. During 2010,On July 19, 2013, we filed a Form S-3S-3ASR "shelf" registration statement which became effective June 16, 2010 to replace our prior shelf registration statement. OurThis current shelf registration statement provides us with the capacity to offer up to $400,000,000$800,000,000 in common stock, preferred stock, warrants, debt, depositary shares, or units. We may from time to time raise capital under ourthis current shelf registration in amounts, at prices, and on terms to be announced when and if the securities are offered. The specifics of any future offerings, along with the use of proceeds of any securities offered, will be described in detail in a prospectus supplement, or other offering materials, at the time of the offering. At December 31, 2011,2013 we had availability of $167,614,000$800,000,000 under our effective shelf registration.
Dividend Distributions. Non-controlling Interests.We declared and paidcurrently have no limited partners. During 2012, we had one limited partnership. The limited partnership agreement allowed the following cash dividendslimited partners to convert, on our common and preferred stock (in thousands):a
| | | | | | | | | | | | | |
| | Year Ended
December 31, 2011 | | Year ended
December 31, 2010 | |
|---|
| | Declared | | Paid | | Declared | | Paid | |
|---|
Preferred Stock | | | | | | | | | | | | | |
Series C | | $ | 3,272 | | $ | 3,272 | | $ | 3,272 | | $ | 3,272 | |
Series E(1) | | | — | | | — | | | 42 | | | 62 | |
Series F(2) | | | 2,240 | (3) | | 4,008 | | | 10,348 | (3) | | 11,527 | |
| | | | | | | | | | |
Total Preferred | | | 5,512 | | | 7,280 | | | 13,662 | | | 14,861 | |
Common Stock(4) | | | 49,292 | | | 49,292 | | | 39,041 | | | 39,041 | |
| | | | | | | | | | |
Total(5) | | $ | 54,804 | | $ | 56,572 | | $ | 52,703 | | $ | 53,902 | |
| | | | | | | | | | |
(1)During 2010, we redeemed all of our Series E preferred stock.
(2)During 2010, we redeemed 40% of our Series F preferred stock. During 2011, we redeemed all of our remaining Series F preferred stock.
(3)Includes the accrued and unpaid dividends on the series F preferred stock up to the redemption date.
(4)Represents $0.14 per share per month for 2011. For 2010, represents $0.13 per share per month for January through October and $0.14 per share per month for November and December.
(5)The difference between declared and paid is the change in distributions payable on the balance sheet at December 31.
LTC PROPERTIES, INC.
NOTES TO CONSOLIDATED FINANCIAL STATEMENTS (Continued)
one-for-one basis, their limited partnership units into shares of common stock or the cash equivalent, at our option. Since we exercised control, we consolidated the limited partnership and we carried the non-controlling interests at cost.
During 2012, two of our limited partners exercised their conversion rights to exchange all of their 112,588 partnership units. At our discretion, we converted 23,294 partnership units into an equal number of our common shares. The partnership conversion price was $17.00 per partnership unit. At our discretion, we elected to satisfy the conversion of 89,294 limited partnership units with cash. We paid the limited partners $2,764,000, which represents the closing price of our common stock on the redemption date plus $0.05 per share multiplied by the number of limited partnership units redeemed. The amount we paid upon redemption exceeded the book value of the limited partnership interest redeemed by $1,246,000. Accordingly, the $1,246,000 excess book value of the limited partners' interest in the partnership was reclassified to stockholders' equity. We accounted for these conversions as an equity transaction because there was no change in control requiring consolidation or deconsolidation and remeasurement. Subsequent to these partnership conversions, the assets held by the limited partnership were transferred to other subsidiaries of the Company and the limited partnership was terminated. At December 31, 2012 and 2013, we had no shares of our common stock reserved under any partnership agreements.
The following table represents the effect of changes in our ownership interest in the limited partnership on equity attributable to LTC Properties, Inc.(in thousands):
| | | | | | | | | | |
| | Years Ended December 31, | |
|---|
| | 2013 | | 2012 | | 2011 | |
|---|
Net income attributable to LTC Properties, Inc. | | $ | 57,815 | | $ | 51,290 | | $ | 49,252 | |
Transfers from the non-controlling interest | | | | | | | | | | |
Increase in paid-in capital for limited partners conversion | | | — | | | 396 | | | — | |
Decrease in paid-in capital for limited partners conversion | | | — | | | (1,246 | ) | | — | |
| | | | | | | | |
| | | | | | | | | | | |
Change from net income attributable to LTC Properties, Inc. and transfers from non-controlling interest | | $ | 57,815 | | $ | 50,440 | | $ | 49,252 | |
| | | | | | | | |
| | | | | | | | | | | |
| | | | | | | | | | | |
| | | | | | | | |
Distributions. We declared and paid the following cash dividends (in thousands):
| | | | | | | | | | | | | |
| | Year Ended
December 31, 2013 | | Year ended
December 31, 2012 | |
|---|
| | Declared | | Paid | | Declared | | Paid | |
|---|
Preferred Stock Series C | | $ | 3,273 | | $ | 3,273 | | $ | 3,273 | | $ | 3,273 | |
Common Stock | | | 63,631 | (1) | | 63,631 | (1) | | 54,512 | (2) | | 54,512 | (2) |
| | | | | | | | | | |
| | | | | | | | | | | | | | |
Total | | $ | 66,904 | | $ | 66,904 | | $ | 57,785 | | $ | 57,785 | |
| | | | | | | | | | |
| | | | | | | | | | | | | | |
| | | | | | | | | | | | | | |
| | | | | | | | | | |
- (1)
- Represents $0.155 per share per month for January through September 2013 and $0.17 per share per month for October through December 2013
- (2)
- Represents $0.145 per share per month for January through July of 2012 and $0.155 per share per month for August through December of 2012.
LTC PROPERTIES, INC.
NOTES TO CONSOLIDATED FINANCIAL STATEMENTS (Continued)
In January 2012,2014, we declared a monthly cash dividend of $0.145$0.17 per share on our common stock for the months of January, February and March 2012, which is a 3.6% increase from the previous $0.14 per share per month dividend. The monthly cash dividends are2014 payable on January 31, February 2928 and March 30, 2012,31, 2014, respectively, to stockholders of record on January 23, February 2120 and March 22, 2012,21, 2014, respectively.
Accumulated Other Equity.Comprehensive Income. During the years we had investments in Real Estate Mortgage Investment Conduit (or REMIC) Certificates, we retained the non-investment grade certificates issued in the securitizations. During 2005, a loan was paid off in the last remaining REMIC pool which caused the last third party REMIC Certificate holders entitled to any principal payments to be paid off in full. After this transaction, we became the sole holder of the remaining REMIC Certificates and are therefore entitled to the entire principal outstanding of the loan pool underlying the remaining REMIC Certificates. Under the FASB accounting guidance relating to accounting for changes that result in a transferor regaining control of financial assets sold, a Special Purpose Entity (or SPE) may become non-qualified or tainted which generally results in the "repurchase" by the transferor of all the assets sold to and still held by the SPE. Since we were the sole REMIC Certificate holder entitled to principal from the underlying loan pool, we had all the risks and were entitled to all the rewards from the underlying loan pool. As required by the accounting guidance, the repurchase for the transferred assets was accounted for at fair value. The accumulated other comprehensive income balance represents the fair market value adjustment offset by any previously adjusted impairment charge which is amortized to increase interest income over the remaining life of the loans that we repurchased from the REMIC pool. At December 31, 20112013 and 2010, Other Equity2012, other equity consisted of $199,000$117,000 and $264,000,$152,000, respectively, of accumulated other comprehensive income.
Stock Based Compensation Plans. During 2008 we adopted and our shareholders approved the 2008 Equity Participation Plan under which 600,000 shares of common stock have been reserved for awards, including nonqualified stock option grants and restricted stock grants to officers, employees, non-employee directors and consultants. The terms of the awards granted under the 2008 Equity Participation Plan are set by our compensation committee at its discretion.
Restricted Stock. During 20112013 and 2012, we granted 6,00034,400 and 90,500 shares of restricted common stock, respectively, as follows:
| | | | | | | | |
Year | | No. of Shares | | Price per
Share | | Vesting Period |
|---|
2013: | | | | | | | | |
| | | 8,400 | | $ | 46.54 | | ratably over 3 years |
| | | 6,000 | | $ | 41.83 | | ratably over 3 years |
| | | 20,000 | | $ | 36.26 | | June 1, 2016 |
| | | | | | | | |
| | | | | | | | | |
| | | 34,400 | | | | | |
| | | | | | | | |
| | | | | | | | | |
| | | | | | | | | |
| | | | | | | | |
2012: | | | | | | | | |
| | | 14,000 | | $ | 31.77 | | ratably over 5 years |
| | | 12,200 | | $ | 31.77 | | January 10, 2016 |
| | | 30,000 | | $ | 31.77 | | June 15, 2015 |
| | | 8,000 | | $ | 31.87 | | ratably over 3 years |
| | | 6,300 | | $ | 34.90 | | ratably over 5 years |
| | | 20,000 | | $ | 34.90 | | December 20, 2015 |
| | | | | | | | |
| | | | | | | | | |
| | | 90,500 | | | | | |
| | | | | | | | |
| | | | | | | | | |
| | | | | | | | | |
| | | | | | | | |
LTC PROPERTIES, INC.
NOTES TO CONSOLIDATED FINANCIAL STATEMENTS (Continued)
Also during the twelve months ended December 31, 2013, the vesting of 18,180 shares of restricted common stock were accelerated due to the retirement of our former Senior Vice President, Marketing and Strategic Planning. In February 2014, we granted 59,000 shares of restricted common stock at $28.70$36.81 per share. These shares vest ratably over a three-year period from the grant date. In January 2012, we granted 14,000 shares of restricted common stock at $31.77 per share. These shares vest ratably over a five-year period from the grant date. Additionally, we granted 30,000 shares of restricted common stock at $31.77 per share. These shares all vest on June 15, 2015. We also granted 12,200 shares of restricted common stock at $31.77 per share in January 2012. These shares all vest on January 10, 2016.
During 2010, we granted 4,000 shares of restricted stock at $25.95 per share, 1,000 shares of restricted stock at $25.04 per share and 11,030 shares of restricted stock at $26.53 per share. These shares vest ratably over a three-year period from the grant date. Additionally, during 2010, we granted 92,900 shares of restricted stock at $26.59 per share. These shares vest ratably over a five-year period from the grant date. We also granted 99,661 shares of restricted stock at $26.53 per share during 2010. These shares vest ratably over a five-year period with the first date of vesting beginning in December 31, 2010.
LTC PROPERTIES, INC.
NOTES TO CONSOLIDATED FINANCIAL STATEMENTS (Continued)
Dividends are payable on the restricted shares to the extent and on the same date as dividends are paid on all of our common stock. Restricted stock activity for the years ended December 31, 20112013 and 20102012 was as follows:
|
| | 2011 | | 2010 | | | 2013 | | 2012 | |
|---|
Outstanding, January 1 | | 217,317 | | 84,866 | | | 195,449 | | 165,134 | |
Granted | | 6,000 | | 208,591 | | | 34,400 | | 90,500 | |
Vested | | (58,183 | ) | | (76,140 | ) | | (64,700 | ) | | (60,185 | ) |
Canceled | | — | | — | | | — | | — | |
| | | | | | | | | | | |
| | | | | | | |
Outstanding, December 31 | | 165,134 | | 217,317 | | | 165,149 | | 195,449 | |
| | | | | | | |
| | | | | | | |
| | | | | | | |
| | | | | | | | | | | |
Compensation expense for the year(1) | | $ | 1,450,000 | | $ | 1,210,000 | | | $ | 2,591,000 | | $ | 1,809,000 | |
| | | | | | | | | | | |
| | | | | | | |
| | | | | | | |
| | | | | | | |
- (1)
- During 2013, we recorded $457,000 of compensation expense related to the accelerated vesting of 18,180 shares of restricted common stock due to the retirement of our former Senior Vice President, Marketing and Strategic Planning. At December 31,
2011,2013, the total compensation cost related to unvested restricted stock granted is $3,892,000,$3,818,000, which will be recognized ratably over the remaining vesting period.
Stock Options. No stock options were issued during 20112013 and 2010.2012. Nonqualified stock option activity for the years ended December 31, 20112013 and 2010,2012, was as follows:
| | | | | | | | | | | | | |
| | Shares | | Weighted Average
Price | |
|---|
| | 2013 | | 2012 | | 2013 | | 2012 | |
|---|
Outstanding, January 1 | | | 95,334 | | | 180,334 | | $ | 23.93 | | $ | 23.33 | |
Granted | | | — | | | — | | $ | — | | $ | — | |
Exercised | | | (22,000 | ) | | (85,000 | ) | $ | 23.79 | | $ | 22.66 | |
Canceled | | | — | | | — | | $ | — | | $ | — | |
| | | | | | | | | | | | |
| | | | | | | | | | | | | | |
Outstanding, December 31 | | | 73,334 | | | 95,334 | | $ | 23.97 | | $ | 23.93 | |
| | | | | | | | | | | | |
| | | | | | | | | | | | | | |
| | | | | | | | | | | | | | |
| | | | | | | | | | | | |
Exercisable, December 31(1) | | | 73,334 | | | 95,334 | | $ | 23.97 | | $ | 23.93 | |
| | | | | | | | | | | | |
| | | | | | | | | | | | | | |
| | | | | | | | | | | | | | |
| | | | | | | | | | | | |
| | | | | | | | | | | | | |
| | Shares | | Weighted Average Price | |
|---|
| | 2011 | | 2010 | | 2011 | | 2010 | |
|---|
Outstanding, January 1 | | | 185,334 | | | 197,000 | | $ | 23.34 | | $ | 22.88 | |
Granted | | | — | | | — | | $ | — | | $ | — | |
Exercised | | | (5,000 | ) | | (11,666 | ) | $ | 23.79 | | $ | 15.62 | |
Canceled | | | — | | | — | | $ | — | | $ | — | |
| | | | | | | | | | | | |
Outstanding, December 31 | | | 180,334 | | | 185,334 | | $ | 23.33 | | $ | 23.34 | |
| | | | | | | | | | | | |
Exercisable, December 31(1) | | | 175,334 | | | 175,334 | | $ | 23.29 | | $ | 23.27 | |
| | | | | | | | | | | | |
- (1)
- The aggregate intrinsic value of exercisable options at December 31,
2011,2013, based upon the closing price of our common shares at December 30, 2011,31, 2013 the last trading day of 2013, amounted to approximately $1,327,000.$838,000. Options exercisable at December 31, 20112013 have a weighted average remaining contractual life of approximately 3.53 years.
The options exercised during 20112013 and 20102012 were as follows:
| | | | | | | | | | | | | |
| | Options
Exercised | | Weighted
Average
Exercise
Price | | Option
Value | | Market
Value(1) | |
|---|
2013 | | | 22,000 | | $ | 23.79 | | $ | 523,000 | | $ | 865,000 | |
2012 | | | 85,000 | | $ | 22.66 | | $ | 1,926,000 | | $ | 2,761,000 | |
| | | | | | | | | | | | | |
| | Options
Exercised | | Weighted
Average
Exercise
Price | | Option
Value | | Market
Value(1) | |
|---|
2011 | | | 5,000 | | $ | 23.79 | | $ | 119,000 | | $ | 152,000 | |
2010 | | | 11,666 | | $ | 15.62 | | $ | 182,000 | | $ | 315,000 | |
- (1)
- As of the exercise dates.
LTC PROPERTIES, INC.
NOTES TO CONSOLIDATED FINANCIAL STATEMENTS (Continued)
We use the Black-Scholes-Merton formula to estimate the value of stock options granted to employees. This model requires management to make certain estimates including stock volatility,
LTC PROPERTIES, INC.
NOTES TO CONSOLIDATED FINANCIAL STATEMENTS (Continued)
expected dividend yield and the expected term. If management incorrectly estimates these variables, the results of operations could be affected.
The weighted average exercise share price of the options was $23.33$23.97 and $23.34 and the weighted average remaining contractual life was 0.0 and 0.1 years$23.93 as of December 31, 20112013 and 2010,2012, respectively. At December 31, 2011, the total compensation cost related to unvested2013, all stock options granted was $10,000, which will be recognized over the remaining vesting period.are exercisable and no shares are scheduled to vest beyond December 31, 2013.
11. Commitments and Contingencies
During 2011, we purchased four skilled nursing properties with 524-beds in Texas as described inNote 6. Real Estate Investments. As part of the purchase agreement,an acquisition in 2011, we paid cash at closing and committed to provide a contingent earn-out paymentspayment if certain operational thresholds arewere met. The contingent earn-out payment arrangements require us to pay two earn-out payments totalling up to $11,000,000 upon the properties achieving a sustainable stipulated rent coverage ratio. We estimated thewas recorded at fair value, of the contingent earn-out paymentswhich was estimated using a discounted cash flow analysis. Thisanalysis, and we accreted the contingent liability to the settlement amount as of the payment date. The fair value measurement isof such contingent liability was re-evaluated on a quarterly basis based on significant input not observablechanges in estimates of future operating results and changes in market discount rates. During 2013, we paid $7,000,000 related to the marketcontingent liability. Accordingly, we have no remaining contingent liability as of December 31, 2013. During 2013 and thus represents a Level 3 measurement. The contingent earn-out payments were recorded at the date of acquisition in the amount of $9,841,000 and were included on the consolidated balance sheet line item "earn-out liabilities." During 2011,2012, we recorded non-cash interest expense of $464,000$256,000 and $439,000, respectively, related to the earn-out liabilities which represents the accretion of the difference between the current fair value and estimated payment of the contingent earn-out liabilities. Also during 2011, we paid $4,000,000 related to the first contingent earn-out payment.liability. At December 31, 2011,2012, the remaining contingent earn-out paymentsliability had a faircarrying value of $6,305,000.$6,744,000.
The following table summarizes our capital improvementAt December 31, 2013, we had outstanding commitments astotaling $80,306,000 to develop, re-develop, renovate or expand senior housing and long term care properties. As of December 31, 2011(dollar amounts in thousands):
| | | | | | | | | | | | | | | | | | | | |
Commitment | | Expiration
Date | | Used
Commitment
at 12/31/11 | | Open
Commitment
at 12/31/11 | | Estimated
Yield | | Property
Type | | Properties | | Major
Operator |
|---|
| $ | 100 | | | 8/1/12 | | $ | — | | $ | 100 | | | | (2) | SNF | | | 1 | | N/A |
| | 730 | | | 8/31/13 | | | 674 | | | 56 | (7) | | 9.00% | (3) | Other(1) | | | 2 | | N/A |
| | 8,250 | | | 10/11/13 | | | 50 | | | 8,200 | | | 9.00% | (4) | SNF(8) | | | — | | N/A |
| | 5,000 | (6) | | 12/31/14 | | | — | | | 5,000 | | | | (5) | ALF | | | 37 | | ALC |
| | | | | | | | | | | | | | | | | | |
| $ | 14,080 | | | | | $ | 724 | | $ | 13,356 | | | | | | | | | | |
| | | | | | | | | | | | | | | | | | |
(1)Other senior housing properties consist2013, we have funded $23,418,000 under these commitments and we have a remaining commitment of independent living properties and properties providing any combination of skilled nursing, assisted living and/or independent living services.
(2)The yield is included in the initial lease rate.
(3)Minimum rent will increase on the 1st of each month by the amount advanced in the previous month multiplied by the estimated yield.
(4)Minimum rent will increase upon final funding and project completion or in some cases, the improvement deadline as defined in each lease agreement.
(5)9.5% plus the positive difference, if any, between the average yields on the U.S. Treasury 10-year note for the five days prior to funding, minus 420 basis points (expressed as a percentage).
LTC PROPERTIES, INC.
NOTES TO CONSOLIDATED FINANCIAL STATEMENTS (Continued)
(6)$5,000 per year for the life of the lease.
(7)- $56,888,000. In January
2012,2014, we funded this $56 commitment.
(8)During 2011,$8,828,000 under investment commitments. Accordingly, we acquiredhave a vacant parcelremaining commitment of land in Texas and entered into$48,060,000. We also have a commitment to fund the construction of a skilled nursing property with 120 beds which will replaceprovide, under certain conditions, up to $5,000,000 per year through December 2014 to an existing 90-bed skilled nursing property.
operator for expansion of the 37 properties they lease from us. SeeNote 6. Real Estate Investments for further discussion of these commitments. The following table summarizes our loan commitments asAdditionally at December 31, 2013, we had a $10,600,000 mortgage and construction commitment. As of December 31, 2011 (dollar amounts in thousands):
| | | | | | | | | | | | | | | | | | | | |
Commitment | | Expiration
Date | | Used
Commitment
at 12/31/11 | | Open
Commitment
at 12/31/11 | | Yield | | Property
Type(1) | | Properties | | Major
Operator |
|---|
| $ | 50 | | | 3/31/12 | | $ | 20 | | $ | 30 | | | 10.00 | % | Other | | | 1 | | N/A |
| | 2,500 | (2) | | 12/31/12 | | | 232 | | | 2,268 | | | 8.50 | % | Other | | | 2 | | N/A |
| | | | | | | | | | | | | | | | | | |
| $ | 2,550 | | | | | $ | 252 | | $ | 2,298 | | | | | | | | | | |
| | | | | | | | | | | | | | | | | | |
(1)Other senior housing properties consist2013, we funded $7,590,000 under this commitment and we have a remaining commitment of independent living properties$3,010,000. In 2013, we funded a $124,387,000 mortgage loan and properties providing any combination of skilled nursing, assisted living and/or independent living services.
(2)Represents a construction and term loancommitted to provide an additional $12,000,000 for capital improvements at two senior housing properties we own and, lease tounder certain conditions and based on certain operating metrics and valuation thresholds achieved and sustained within the borrower. Upon the earlierfirst twelve years of the full fundingterm, additional loan proceeds of the commitment orup to $40,000,000. As of December 31, 2012, construction distribution2013, there has been no funding under this loan will ceaseeither of these commitments. SeeNote 6. Real Estate Investments for further discussion of these mortgage loans. At December 31, 2013, we committed to provide $2,425,000 in loans and this loan will fully amortize to maturity in November 2017.
line of credit agreements. As of December 31, 2013, we had funded $595,000 under these commitments and we have a remaining commitment of $1,830,000. SeeNote 7. Notes Receivables for further discussion of these commitments.12. Transactions with Related Party
We have directly entered into transactionsone transaction with Skilled Healthcare Group, Inc. (or SHG). One of our directors, Boyd W. Hendrickson, servesserved as Chief Executive Officer of SHG.SHG until his retirement on November 20, 2013.
In December 2005, we purchased, on the open market, $10,000,000 face value of SHG Senior Subordinated Notes with a face rate of 11.0% and an effective yield of 11.1%. One of our directors, Boyd W. Hendrickson, serves as Chief Executive Officer of SHG. Our Board of Directors, with Mr. Hendrickson abstaining, ratified the purchase of SHG Senior Subordinated Notes. As a result
LTC PROPERTIES, INC.
NOTES TO CONSOLIDATED FINANCIAL STATEMENTS (Continued)
of an early redemption by SHG in 2007, we havehad a remaining investment in $6,500,000 face value of SHG Senior Subordinated Notes at December 31, 20112011. During 2012, SHG redeemed all of their outstanding Senior Subordinated Notes at par value plus accrued and 2010.unpaid interest up to the redemption date. During 2011, 20102012 and 2009,2011, we recognized $721,000, $720,000$235,000 and $720,000$721,000 of interest income related to the SHG Senior Subordinated Notes. Interest on the notes is payable semi-annually in arrears and the notes mature on January 15, 2014.
In addition, during September 2007 SHG purchased the assets of Laurel Healthcare (or Laurel). We were not a direct party to this transaction. One of the assets SHG purchased was Laurel's leasehold interests in the skilled nursing properties in New Mexico Laurel leased from us under a 15-year master lease agreement dated in February 2006. Our Board of Directors, with Mr. Hendrickson abstaining, ratified our consent to the assignment of Laurel's master lease to subsidiaries of SHG. The economic terms of the master lease agreement did not change as a result of our assignment of the master lease to subsidiaries of SHG. During 2011, 20102013, 2012 and 2009,2011, we received $4,264,000, $4,160,000$4,479,000, $4,370,000 and $4,058,000,$4,264,000, respectively, in rental income and recorded $238,000, $342,000$22,000, $131,000 and $443,000,$238,000, respectively, in straight-line rental income from subsidiaries of SHG. At December 31, 20112013 and 2010,2012, the straight-line rent receivable from subsidiaries of SHG was $3,060,000$3,213,000 and $2,822,000,$3,191,000, respectively.
LTC PROPERTIES, INC.
NOTES TO CONSOLIDATED FINANCIAL STATEMENTS (Continued)
13. Distributions
We must distribute at least 90% of our taxable income in order to continue to qualify as a REIT. This distribution requirement can be satisfied by current year distributions or, to a certain extent, by distributions in the following year.
For federal tax purposes, distributions to stockholders are treated as ordinary income, capital gains, return of capital or a combination thereof. Distributions for 2011, 20102013, 2012 and 20092011 were cash distributions. The federal income tax classification of the per share common stock distributions are as follows (unaudited):
|
| | Year Ended December 31, | | | Year Ended December 31, | |
|---|
| | 2011 | | 2010 | | 2009 | | | 2013 | | 2012 | | 2011 | |
|---|
Ordinary taxable distribution | | $ | 1.370 | | $ | 1.200 | | $ | 1.549 | | | $ | 1.534 | | $ | 1.539 | | $ | 1.370 | |
Return of capital | | 0.295 | | 0.334 | | — | | | 0.313 | | 0.242 | | 0.295 | |
Unrecaptured Section 1250 gain | | — | | 0.034 | | — | | | 0.058 | | 0.004 | | — | |
Long term capital gain | | 0.015 | | 0.012 | | 0.011 | | | — | | 0.005 | | 0.015 | |
| | | | | | | | | | | | | | | |
| | | | | | | | | |
Total | | 1.680 | | $ | 1.580 | | $ | 1.560 | | | $ | 1.905 | | $ | 1.790 | | $ | 1.680 | |
| | | | | | | | | | | | | | | |
| | | | | | | | | |
| | | | | | | | | |
| | | | | | | | | |
LTC PROPERTIES, INC.
NOTES TO CONSOLIDATED FINANCIAL STATEMENTS (Continued)
14. Net Income Per Common Share
Basic and diluted net income per share werewas as follows(in thousands except per share amounts):
| | | | | | | | | | |
| | For the year ended December 31, | |
|---|
| | 2013 | | 2012 | | 2011 | |
|---|
Income from continuing operations | | $ | 55,405 | | $ | 50,306 | | $ | 48,620 | |
Less net income allocated to non-controlling interests | | | — | | | (37 | ) | | (191 | ) |
Less net income allocated to participating securities: | | | | | | | | | | |
Non-forfeitable dividends on participating securities | | | (381 | ) | | (377 | ) | | (342 | ) |
Income allocated to participating securities | | | (2 | ) | | — | | | — | |
| | | | | | | | |
| | | | | | | | | | | |
Total net income allocated to participating securities | | | (383 | ) | | (377 | ) | | (342 | ) |
Less net income allocated to preferred stockholders: | | | | | | | | | | |
Preferred stock dividends | | | (3,273 | ) | | (3,273 | ) | | (5,512 | ) |
Preferred stock redemption charge | | | — | | | — | | | (3,566 | ) |
| | | | | | | | |
| | | | | | | | | | | |
Total net income allocated to preferred stockholders | | | (3,273 | ) | | (3,273 | ) | | (9,078 | ) |
| | | | | | | | |
| | | | | | | | | | | |
Income from continuing operations available to common stockholders | | | 51,749 | | | 46,619 | | | 39,009 | |
Discontinued operations: | | | | | | | | | | |
Income from discontinued operations | | | 805 | | | 1,005 | | | 823 | |
Gain on sale of assets, net | | | 1,605 | | | 16 | | | — | |
| | | | | | | | |
| | | | | | | | | | | |
Total net income from discontinued operations | | | 2,410 | | | 1,021 | | | 823 | |
| | | | | | | | |
| | | | | | | | | | | |
Net income available to common stockholders | | | 54,159 | | | 47,640 | | | 39,832 | |
Effect of dilutive securities: | | | | | | | | | | |
Convertible preferred securities | | | — | | | — | | | — | |
| | | | | | | | |
| | | | | | | | | | | |
Total effect of dilutive securities | | | — | | | — | | | — | |
| | | | | | | | |
| | | | | | | | | | | |
Net income for diluted net income per share | | $ | 54,159 | | $ | 47,640 | | $ | 39,832 | |
| | | | | | | | |
| | | | | | | | | | | |
| | | | | | | | | | | |
| | | | | | | | |
Shares for basic net income per share | | | 33,111 | | | 30,238 | | | 29,194 | |
Effect of dilutive securities: | | | | | | | | | | |
Stock options | | | 31 | | | 40 | | | 28 | |
Convertible preferred securities | | | — | | | — | | | — | |
| | | | | | | | |
| | | | | | | | | | | |
Total effect of dilutive securities | | | 31 | | | 40 | | | 28 | |
| | | | | | | | |
| | | | | | | | | | | |
Shares for diluted net income per share | | | 33,142 | | | 30,278 | | | 29,222 | |
| | | | | | | | |
| | | | | | | | | | | |
| | | | | | | | | | | |
| | | | | | | | |
Basic net income per share | | $ | 1.64 | | $ | 1.58 | | $ | 1.36 | |
| | | | | | | | |
| | | | | | | | | | | |
| | | | | | | | | | | |
| | | | | | | | |
Diluted net income per share(1) | | $ | 1.63 | | $ | 1.57 | | $ | 1.36 | |
| | | | | | | | |
| | | | | | | | | | | |
| | | | | | | | | | | |
| | | | | | | | |
| | | | | | | | | | |
| | For the year ended December 31, | |
|---|
| | 2011 | | 2010 | | 2009 | |
|---|
Income from continuing operations | | $ | 49,673 | | $ | 45,860 | | $ | 44,473 | |
Less income allocated to non-controlling interests | | | (191 | ) | | (191 | ) | | (296 | ) |
Less income allocated to participating securities Non-forfeitable dividends on participating securities | | | (342 | ) | | (230 | ) | | (139 | ) |
| | | | | | | | |
Total income allocated to participating securities | | | (342 | ) | | (230 | ) | | (139 | ) |
Less income allocated to preferred stockholders: | | | | | | | | | | |
Preferred stock dividends | | | (5,512 | ) | | (13,662 | ) | | (15,141 | ) |
Preferred stock redemption charge | | | (3,566 | ) | | (2,383 | ) | | — | |
Allocation of income from preferred stock buyback | | | — | | | — | | | 626 | |
| | | | | | | | |
Total income allocated to preferred stockholders | | | (9,078 | ) | | (16,045 | ) | | (14,515 | ) |
| | | | | | | | |
Income from continuing operations allocable to common stockholders | | | 40,062 | | | 29,394 | | | 29,523 | |
Add net income from discontinued operations: | | | | | | | | | | |
Loss from discontinued operations | | | (230 | ) | | (117 | ) | | (113 | ) |
Gain on sale of assets, net | | | — | | | 310 | | | — | |
| | | | | | | | |
Total net income from discontinued operations | | | (230 | ) | | 193 | | | (113 | ) |
| | | | | | | | |
Total net income allocable to common stockholders | | | 39,832 | | | 29,587 | | | 29,410 | |
Effect of dilutive securities: | | | | | | | | | | |
Convertible preferred securities | | | — | | | 40 | | | 80 | |
| | | | | | | | |
Total effect of dilutive securities | | | — | | | 40 | | | 80 | |
| | | | | | | | |
Net income for diluted net income per share | | $ | 39,832 | | $ | 29,627 | | $ | 29,490 | |
| | | | | | | | |
Shares for basic net income per share | | | 29,194 | | | 24,495 | | | 23,099 | |
Effect of dilutive securities: | | | | | | | | | | |
Stock options | | | 28 | | | 23 | | | 8 | |
Convertible preferred securities | | | — | | | 50 | | | 75 | |
| | | | | | | | |
| | | 28 | | | 73 | | | 83 | |
| | | | | | | | |
Shares for diluted net income per share | | | 29,222 | | | 24,568 | | | 23,182 | |
| | | | | | | | |
Basic net income per common share | | $ | 1.36 | | $ | 1.21 | | $ | 1.27 | |
| | | | | | | | |
Diluted net income per common share(1) | | $ | 1.36 | | $ | 1.21 | | $ | 1.27 | |
| | | | | | | | |
- (1)
- For each year, the Series C Cumulative Convertible Preferred Stock, the participating securities and the convertible non-controlling interests have been excluded from the computation of diluted net income per share as such inclusion would be anti-dilutive.
LTC PROPERTIES, INC.
NOTES TO CONSOLIDATED FINANCIAL STATEMENTS (Continued)
15. Quarterly Financial Information
| | | | | | | | | | | | | |
| | For the quarter ended | |
|---|
| | March 31, | | June 30, | | September 30, | | December 31, | |
|---|
| | (unaudited, in thousands except per share amounts)
| |
|---|
2013 | | | | | | | | | | | | | |
Revenues | | $ | 25,277 | | $ | 25,279 | | $ | 25,825 | | $ | 28,593 | |
Net income (loss) from discontinued operations | | | 254 | | | (701 | ) | | 2,857 | | | — | |
Net income available to common stockholders | | | 12,060 | | | 11,994 | | | 16,373 | | | 13,732 | |
Net income per common share from continuing operations available to common stockholders: | | | | | | | | | | | | | |
Basic | | $ | 0.39 | | $ | 0.39 | | $ | 0.39 | | $ | 0.40 | |
Diluted | | $ | 0.39 | | $ | 0.39 | | $ | 0.39 | | $ | 0.40 | |
Net income (loss) per common share from discontinued operations: | | | | | | | | | | | | | |
Basic | | $ | 0.01 | | $ | (0.02 | ) | $ | 0.08 | | $ | 0.00 | |
Diluted | | $ | 0.01 | | $ | (0.02 | ) | $ | 0.08 | | $ | 0.00 | |
Net income per common share available to common stockholders: | | | | | | | | | | | | | |
Basic | | $ | 0.40 | | $ | 0.36 | | $ | 0.47 | | $ | 0.40 | |
Diluted | | $ | 0.40 | | $ | 0.36 | | $ | 0.47 | | $ | 0.40 | |
Dividends per share declared | | $ | 0.465 | | $ | 0.465 | | $ | 0.465 | | $ | 0.510 | |
Dividend per share paid | | $ | 0.465 | | $ | 0.465 | | $ | 0.465 | | $ | 0.510 | |
2012 | | |
| | |
| | |
| | |
| |
Revenues | | $ | 22,251 | | $ | 22,704 | | $ | 23,402 | | $ | 24,125 | |
Net income from discontinued operations | | | 263 | | | 251 | | | 253 | | | 254 | |
Net income available to common stockholders | | | 12,009 | | | 12,194 | | | 11,583 | | | 11,854 | |
Net income per common share from continuing operations available to common stockholders: | | | | | | | | | | | | | |
Basic | | $ | 0.39 | | $ | 0.40 | | $ | 0.37 | | $ | 0.38 | |
Diluted | | $ | 0.39 | | $ | 0.39 | | $ | 0.37 | | $ | 0.38 | |
Net income per common share from discontinued operations: | | | | | | | | | | | | | |
Basic | | $ | 0.01 | | $ | 0.01 | | $ | 0.01 | | $ | 0.01 | |
Diluted | | $ | 0.01 | | $ | 0.01 | | $ | 0.01 | | $ | 0.01 | |
Net income per common share available to common stockholders: | | | | | | | | | | | | | |
Basic | | $ | 0.40 | | $ | 0.40 | | $ | 0.38 | | $ | 0.39 | |
Diluted | | $ | 0.40 | | $ | 0.40 | | $ | 0.38 | | $ | 0.39 | |
Dividends per share declared | | $ | 0.435 | | $ | 0.435 | | $ | 0.455 | | $ | 0.465 | |
Dividend per share paid | | $ | 0.435 | | $ | 0.435 | | $ | 0.455 | | $ | 0.465 | |
| | | | | | | | | | | | | |
| | For the quarter ended | |
|---|
| | March 31, | | June 30, | | September 30, | | December 31, | |
|---|
| | (unaudited, in thousands except per share amounts)
| |
|---|
2011 | | | | | | | | | | | | | |
Revenues | | $ | 20,253 | | $ | 21,180 | | $ | 21,429 | | $ | 22,298 | |
Net loss from discontinued operations | | | (94 | ) | | (74 | ) | | (30 | ) | | (32 | ) |
Net income available to common stockholders | | | 5,393 | | | 11,311 | | | 11,472 | | | 11,656 | |
Net income per common share from continuing operations allocable to common stockholders: | | | | | | | | | | | | | |
Basic | | $ | 0.21 | | $ | 0.38 | | $ | 0.38 | | $ | 0.39 | |
Diluted | | $ | 0.21 | | $ | 0.38 | | $ | 0.38 | | $ | 0.39 | |
Net loss per common share from discontinued operations: | | | | | | | | | | | | | |
Basic | | $ | (0.00 | ) | $ | (0.00 | ) | $ | (0.00 | ) | $ | (0.00 | ) |
Diluted | | $ | (0.01 | ) | $ | (0.00 | ) | $ | (0.00 | ) | $ | (0.00 | ) |
Net income per common share available to common stockholders: | | | | | | | | | | | | | |
Basic | | $ | 0.20 | | $ | 0.38 | | $ | 0.38 | | $ | 0.39 | |
Diluted | | $ | 0.20 | | $ | 0.37 | | $ | 0.38 | | $ | 0.39 | |
Dividends per share declared | | $ | 0.42 | | $ | 0.42 | | $ | 0.42 | | $ | 0.42 | |
Dividend per share paid | | $ | 0.42 | | $ | 0.42 | | $ | 0.42 | | $ | 0.42 | |
2010 | | | | | | | | | | | | | |
Revenues | | $ | 17,592 | | $ | 17,925 | | $ | 18,359 | | $ | 19,820 | |
Net (loss) income from discontinued operations | | | (45 | ) | | (43 | ) | | 25 | | | 256 | |
Net income available to common stockholders | | | 6,694 | | | 7,739 | | | 5,571 | | | 9,583 | |
Net income per common share from continuing operations allocable to common stockholders: | | | | | | | | | | | | | |
Basic | | $ | 0.29 | | $ | 0.33 | | $ | 0.22 | | $ | 0.36 | |
Diluted | | $ | 0.29 | | $ | 0.33 | | $ | 0.22 | | $ | 0.36 | |
Net (loss) income per common share from discontinued operations: | | | | | | | | | | | | | |
Basic | | $ | (0.00 | ) | $ | (0.00 | ) | $ | 0.00 | | $ | 0.01 | |
Diluted | | $ | (0.00 | ) | $ | (0.00 | ) | $ | 0.00 | | $ | 0.01 | |
Net income per common share available to common stockholders: | | | | | | | | | | | | | |
Basic | | $ | 0.29 | | $ | 0.33 | | $ | 0.22 | | $ | 0.37 | |
Diluted | | $ | 0.29 | | $ | 0.33 | | $ | 0.22 | | $ | 0.37 | |
Dividends per share declared | | $ | 0.39 | | $ | 0.39 | | $ | 0.39 | | $ | 0.41 | |
Dividend per share paid | | $ | 0.39 | | $ | 0.39 | | $ | 0.39 | | $ | 0.41 | |
- NOTE:
- Quarterly and year-to-date computations of per share amounts are made independently. Therefore, the sum of per share amounts for the quarters may not agree with the per share amounts for the year. Computations of per share amounts from continuing operations, discontinued operations and net income (loss) are made independently. Therefore, the sum of per share amounts from continuing operations and discontinued operations may not agree with the per share amounts from net income (loss) available to common stockholders.
LTC PROPERTIES, INC.
NOTES TO CONSOLIDATED FINANCIAL STATEMENTS (Continued)
16. Fair Value Measurements
In accordance with the accounting guidance regarding the fair value option for financial assets and financial liabilities, entities are permitted to choose to measure certain financial assets and liabilities at fair value, with the change in unrealized gains and losses on items for which the fair value option has
LTC PROPERTIES, INC.
NOTES TO CONSOLIDATED FINANCIAL STATEMENTS (Continued)
been elected reported in earnings. We did not adopt the elective fair market value option infor our financial statements.assets and financial liabilities.
The carrying amount of cash and cash equivalents approximates fair value because of the short-term maturity of these instruments. We do not invest our cash in auction rate securities. The carrying value and fair value of our financial instruments as of December 31, 20112013 and 20102012 assuming election of fair value for our financial assets and financial liabilities were as follows ((in thousands)thousands):
|
| | At December 31, 2011 | | At December 31, 2010 | | | At December 31, 2013 | | At December 31, 2012 | |
|---|
| | Carrying Value | | Fair Value | | Carrying Value | | Fair Value | | | Carrying
Value | | Fair Value | | Carrying
Value | | Fair Value | |
|---|
Mortgage loans receivable | | $ | 53,081 | | $ | 61,844 | (1) | $ | 59,026 | | $ | 67,697 | (1) | | $ | 165,444 | | $ | 200,248 | (1) | $ | 39,299 | | $ | 44,939 | (1) |
Marketable debt securities | | 6,485 | | 6,500 | (2) | | 6,478 | | 6,695 | (2) | |
Bonds payable | | 3,200 | | 3,200 | (3) | | 3,730 | | 3,730 | (3) | | 2,035 | | 2,035 | (2) | | 2,635 | | 2,635 | (2) |
Bank borrowings | | 56,000 | | 56,000 | (3) | | 37,700 | | 37,700 | (3) | | 21,000 | | 21,000 | (2) | | 115,500 | | 115,500 | (2) |
Senior unsecured notes | | 100,000 | | 101,223 | (4) | | 50,000 | | 49,943 | (4) | | 255,800 | | 262,351 | (3) | | 185,800 | | 194,838 | (3) |
Contingent liabilities | | | — | | — | | 6,744 | | 6,744 | (4) |
- (1)
- Our investment in mortgage loans receivable is classified as Level 3. The fair value is determined using a widely accepted valuation technique, discounted cash flow analysis on the expected cash flows. The discount rate is determined using our assumption on market conditions adjusted for market and credit risk and current returns on our investments. The discount rate used to value our future cash inflows of the mortgage loans receivable at December 31,
20112013 and 20102012 was 6.0%8.4% and 7.5%6.0%, respectively.
- (2)
Our investment in marketable debt securities is classified as Level 2. The fair value is measured using quoted market rates based on most recent transactions from an independent third party source. The pricing of our marketable debt securities as of December 31, 2011 and 2010 was 100.0% and 103.0%, respectively.
(3)- Our bonds payable and bank borrowings are at a variable interest rate. The estimated fair value of our bonds payable and bank borrowings approximated their carrying values at December 31,
20112013 and 20102012 based upon prevailing market interest rates for similar debt arrangements. At December 31, 2011, we had $56,000 outstanding under our Unsecured Credit Agreement and $154,000 was available for borrowing. In January 2012, we borrowed $4,000. After this borrowing we had $60,000 outstanding and $150,000 available for borrowing.
(4)(3)- Our obligation under our senior unsecured notes is classified as Level 3 and thus the fair value is determined using a widely accepted valuation technique, discounted cash flow analysis on the expected cash flows. The discount rate is measured based upon management's estimates of rates currently prevailing for comparable loans available to us, and instruments of comparable maturities. At December 31,
2011 and 2010,2013, the discount rate used to value our future cash outflow of our senior unsecured notes was 4.8%3.95% for those maturing before year 2020 and 5.5%, respectively.4.25% for those maturing beyond year 2020. At December 31, 2012, the discount rate used to value our future cash outflow of our senior unsecured notes was 3.8% for those maturing before year 2020 and 4.3% for those maturing beyond year 2020. - (4)
- Our contingent obligation under the earn-out liabilities is classified as Level 3. We estimated the fair value of the contingent earn-out payments using a discounted cash flow analysis. The discount rate that we use consists of a risk-free U.S. Treasury rate plus a company specific credit spread which we believe is acceptable by willing market participants. At December 31, 2012, the discount rate used to value our future cash outflow of the earn-out liability was 6.6%.
17. Subsequent Events
We had the following events occur subsequent to the balance sheet date.
Real Estate—Owned Properties: We funded $8,828,000 under ongoing real estate investment commitments. Accordingly, we have a remaining commitment of $48,060,000. SeeNote 6. Real Estate Investments for further discussion on the remaining balance of $56,000 undercommitments.
Major Operator: We will not be renewing the leases expiring on December 31, 2014 with Extendicare and ALC. We have begun a $730,000 capital improvement commitment on two senior housing properties providing a combination offormal process to re-lease the 37 assisted living independent living andproperties they lease from us. SeeNote 3. Major Operator for further discussion.
LTC PROPERTIES, INC.
NOTES TO CONSOLIDATED FINANCIAL STATEMENTS (Continued)
skilled nursing services. Minimum rental income will increase by this capital funding multiplied by 9.0%.
Debt: In January 2012,2014, we entered into an agreement to sell a 140-bed skilled nursing property located in Texas for $1,248,000. This property is leased under a master lease and the economic terms of this master lease will not change as a result of this sale. This sale is scheduled to close on February 29, 2012 and will result in a $16,000 gain recognized in 2012.
We borrowed $4,000,000$11,500,000 under our Unsecured Credit Agreement. After this borrowing,unsecured revolving line of credit. Accordingly, we had $60,000,000 outstanding and $150,000,000have $207,500,000 available for borrowing.
Equity: We declared a monthly cash dividend of $0.145$0.17 per share on our common stock for the months of January, February and March 2012, which is a 3.6% increase from the previous $0.14 per share per month dividend. The monthly cash dividends are2014, payable on January 31, February 2928, and March 30, 2012,31, 2014, respectively, to stockholders of record on January 23, February 2120, and March 22, 2012,21, 2014, respectively.
We Additionally, we granted 14,00059,000 shares of restricted common stock at $31.77$36.81 per share. These shares vest ratably over a five-yearthree-year period from the grant date. Additionally, we granted 30,000 shares of restricted common stock at $31.77 per share. These shares all vest on June 15, 2015. We also granted 12,200 shares of restricted common stock at $31.77 per share. These shares all vest on January 10, 2016.
Two of our limited partners exercised their conversion rights. One limited partner exchanged all of its 67,294 partnership units and the other limited partner exchanged 22,000 partnership units in the limited partnership. Upon receipt of the redemption notification of 89,294 limited partnership units, we elected to satisfy the redemption in cash. We paid the limited partners $2,764,000, which represents the closing price of our common stock on the redemption date plus $0.05 per share multiplied by the number of limited partnership units redeemed. The amount we paid upon redemption exceeded the book value of the limited partnership interest redeemed by $1,246,000. In accordance with FASB accounting guidance, we account for this exchange as an equity transaction because there was no change in control requiring consolidation or deconsolidation and remeasurement. Accordingly, the $1,246,000 excess book value of the limited partners' interest in the partnership was reclassified to stockholders' equity.
LTC PROPERTIES, INC.
SCHEDULE II
VALUATION AND QUALIFYING ACCOUNTS
(in thousands)
|
| |
| | Additions | |
| |
| | |
| | Additions | |
| |
| |
|---|
Account Description | | Balance at
beginning of
period(2) | | (Recovered)
charged to
costs and
expenses | | Charged to
other accounts | | Deductions(1) | | Balance at end
of period(2) | | | Balance at
beginning of
period(2) | | (Recovered)
charged to
costs and
expenses | | Charged to
other accounts | | Deductions(1) | | Balance at end
of period(2) | |
|---|
Year ended December 31, 2009 | | |
Allowance for doubtful accounts and other receivables | | $ | 760 | | $ | (56 | ) | $ | — | | $ | — | | $ | 704 | | |
Straight-line rent receivable allowance | | 140 | | 831 | | — | | (342 | ) | | 629 | | |
| | | | | | | | | | | | | |
| | $ | 900 | | $ | 775 | | $ | — | | $ | (342 | ) | $ | 1,333 | | |
| | | | | | | | | | | | | |
Year ended December 31, 2010 | | |
Allowance for doubtful accounts and other receivables | | $ | 704 | | $ | 1,166 | | $ | — | | $ | (889 | ) | $ | 981 | | |
Straight-line rent receivable allowance | | 629 | | 844 | | — | | — | | 1,473 | | |
| | | | | | | | | | | | | |
| | $ | 1,333 | | $ | 2,010 | | $ | — | | $ | (889 | ) | $ | 2,454 | | |
| | | | | | | | | | | | | |
Year ended December 31, 2011 | | | | | | | | | | | | |
Allowance for doubtful accounts and other receivables | | $ | 981 | | $ | (60 | ) | $ | — | | $ | — | | $ | 921 | | | $ | 981 | | $ | (60 | ) | $ | — | | $ | — | | $ | 921 | |
Straight-line rent receivable allowance | | 1,473 | | 46 | | — | | — | | 1,519 | | | 1,473 | | 46 | | — | | — | | 1,519 | |
| | | | | | | | | | | | | | | | | | | | | | | |
| | | | | | | | | | | | | |
| | $ | 2,454 | | $ | (14 | ) | $ | — | | $ | — | | $ | 2,440 | | | $ | 2,454 | | $ | (14 | ) | $ | — | | $ | — | | $ | 2,440 | |
| | | | | | | | | | | | | | | | | | | | | | | |
| | | | | | | | | | | | | |
| | | | | | | | | | | | | |
| | | | | | | | | | | | | |
Year ended December 31, 2012 | | |
| |
| |
| |
| |
| |
Allowance for doubtful accounts and other receivables | | | $ | 921 | | $ | (139 | ) | $ | — | | $ | — | | $ | 782 | |
Straight-line rent receivable allowance | | | 1,519 | | 38 | | — | | — | | 1,557 | |
| | | | | | | | | | | | | |
| | | | | | | | | | | | | |
| | | $ | 2,440 | | $ | (101 | ) | $ | — | | $ | — | | $ | 2,339 | |
| | | | | | | | | | | | | |
| | | | | | | | | | | | | |
| | | | | | | | | | | | | |
| | | | | | | | | | | | | |
Year ended December 31, 2013 | | |
| |
| |
| |
| |
| |
Allowance for doubtful accounts and other receivables | | | $ | 782 | | $ | 1,274 | | $ | — | | $ | (385 | ) | $ | 1,671 | |
Straight-line rent receivable allowance | | | 1,557 | | 906 | (3) | | — | | (922 | )(3) | | 1,541 | |
| | | | | | | | | | | | | |
| | | | | | | | | | | | | |
| | | $ | 2,339 | | $ | 2,180 | | $ | — | | $ | (1,307 | ) | $ | 3,212 | |
| | | | | | | | | | | | | |
| | | | | | | | | | | | | |
| | | | | | | | | | | | | |
| | | | | | | | | | | | | |
- (1)
- Deductions represent uncollectible accounts written off.
- (2)
- Includes straight-line rent receivable allowance for properties classified as held-for-sale.
- (3)
- Includes the write-off of an $878 straight-line rent receivable balance related to the transition of four assisted living properties to a new lessee.
LTC PROPERTIES, INC.
SCHEDULE III
REAL ESTATE AND ACCUMULATED DEPRECIATION
(in thousands)
|
| |
| |
| |
| |
| | Gross amount at which carried at
December 31, 2011 | |
| |
| |
| | |
| |
| |
| |
| | Gross amount at which carried at
December 31, 2013 | |
| |
| |
| |
|---|
| |
| | Initial cost to company | | Costs
capitalized
subsequent
to
acquisition | |
| |
| |
| | |
| | Initial cost to company | | Costs
capitalized
subsequent
to
acquisition | |
| |
| |
| |
|---|
| | Encumbrances | | Land | | Building and
improvements | | Land | | Building and
improvements | | Total(2) | | Accum
deprec. | | Construction/
renovation date | | Acquisition
date | | | Encumbrances | | Land | | Building and
improvements | | Land | | Building and
improvements | | Total(1) | | Accum
deprec. | | Construction/
renovation date | | Acquisition
date | |
|---|
Skilled Nursing Properties: | | Skilled Nursing Properties: | | | | | | | | | | | | | | | | | | | |
134 Alamogordo, NM | | — | | 210 | | 2,590 | | 3 | | 210 | | 2,593 | | 2,803 | | 687 | | 1985 | | 2001 | | | $ | — | | $ | 210 | | $ | 2,593 | | $ | 371 | | $ | 210 | | $ | 2,964 | | $ | 3,174 | | $ | 814 | | 1985 | | 2001 | |
218 Albuquerque, NM | | — | | 1,696 | | 3,891 | | 530 | | 1,696 | | 4,421 | | 6,117 | | 1,008 | | 2008 | | 2005 | | | — | | 1,696 | | 3,891 | | 530 | | 1,696 | | 4,421 | | 6,117 | | 1,277 | | 2008 | | 2005 | |
219 Albuquerque, NM | | — | | 1,950 | | 8,910 | | 207 | | 1,950 | | 9,117 | | 11,067 | | 2,111 | | 1982 | | 2005 | | | — | | 1,950 | | 8,910 | | 207 | | 1,950 | | 9,117 | | 11,067 | | 2,617 | | 1982 | | 2005 | |
220 Albuquerque, NM | | — | | 2,463 | | 7,647 | | 9 | | 2,463 | | 7,656 | | 10,119 | | 1,783 | | 1970 | | 2005 | | | — | | 2,463 | | 7,647 | | 9 | | 2,463 | | 7,656 | | 10,119 | | 2,201 | | 1970 | | 2005 | |
042 Altoona, IA | | — | | 105 | | 2,309 | | 444 | | 105 | | 2,753 | | 2,858 | | 1,422 | | 1973 | | 1996 | | | — | | 105 | | 2,309 | | 444 | | 105 | | 2,753 | | 2,858 | | 1,580 | | 1973 | | 1996 | |
252 Amarillo, TX | | | — | | 844 | | — | | 7,925 | | 844 | | 7,925 | | 8,769 | | 186 | | 2013 | | 2011 | |
214 Aransas Pass, TX | | — | | 154 | | 1,276 | | 589 | | 154 | | 1,865 | | 2,019 | | 442 | | 2008 | | 2004 | | | — | | 154 | | 1,276 | | 589 | | 154 | | 1,865 | | 2,019 | | 601 | | 2008 | | 2004 | |
247 Arlington, TX | | — | | 1,022 | | 13,636 | | — | | 1,022 | | 13,636 | | 14,658 | | 409 | | 2007 | | 2011 | | | — | | 1,016 | | 13,649 | | — | | 1,016 | | 13,649 | | 14,665 | | 1,427 | | 2007 | | 2011 | |
171 Atlanta, GA | | — | | 175 | | 1,282 | | 3 | | 175 | | 1,285 | | 1,460 | | 587 | | 1968 | | 1999 | | | — | | 175 | | 1,282 | | 3 | | 175 | | 1,285 | | 1,460 | | 648 | | 1968 | | 1999 | |
040 Atmore, AL | | — | | 131 | | 2,877 | | 196 | | 131 | | 3,073 | | 3,204 | | 1,427 | | 1974 | | 1996 | | | — | | 131 | | 2,877 | | 196 | | 131 | | 3,073 | | 3,204 | | 1,594 | | 1974 | | 1996 | |
221 Beaumont, TX | | — | | 370 | | 1,141 | | 93 | | 370 | | 1,234 | | 1,604 | | 329 | | 1950 | | 2005 | | | — | | 370 | | 1,141 | | 93 | | 370 | | 1,234 | | 1,604 | | 410 | | 1950 | | 2005 | |
213 Beeville, TX | | — | | 186 | | 1,197 | | 70 | | 186 | | 1,267 | | 1,453 | | 265 | | 1974 | | 2004 | | | — | | 186 | | 1,197 | | 70 | | 186 | | 1,267 | | 1,453 | | 340 | | 1974 | | 2004 | |
215 Benbrook, TX | | — | | 503 | | 2,121 | | 102 | | 503 | | 2,223 | | 2,726 | | 600 | | 1976 | | 2005 | | | — | | 480 | | 2,121 | | 102 | | 480 | | 2,223 | | 2,703 | | 700 | | 1976 | | 2005 | |
189 Canyon, TX(3) | | — | | 196 | | 506 | | 211 | | 196 | | 717 | | 913 | | 384 | | 1986 | | 2000 | | |
007 Bradenton, FL | | | — | | 330 | | 2,720 | | 160 | | 330 | | 2,880 | | 3,210 | | 1,723 | | 2002 | | 1993 | |
256 Brownwood, TX | | | — | | 164 | | 6,336 | | — | | 164 | | 6,336 | | 6,500 | | 312 | | 2011 | | 2012 | |
189 Canyon, TX | | | — | (2) | | 196 | | 507 | | 211 | | 196 | | 718 | | 914 | | 718 | | 1986 | | 2000 | |
043 Carroll, IA | | — | | 47 | | 1,033 | | 213 | | 47 | | 1,246 | | 1,293 | | 642 | | 1969 | | 1996 | | | — | | 47 | | 1,033 | | 213 | | 47 | | 1,246 | | 1,293 | | 714 | | 1969 | | 1996 | |
177 Chesapeake, VA | | — | | 388 | | 3,469 | | 1,097 | | 388 | | 4,566 | | 4,954 | | 2,309 | | 2007 | | 1995 | | | — | | 388 | | 3,469 | | 1,097 | | 388 | | 4,566 | | 4,954 | | 2,638 | | 2007 | | 1995 | |
257 Cincinnati, OH | | | — | | 1,890 | | 25,110 | | — | | 1,890 | | 25,110 | | 27,000 | | 816 | | 2009 | | 2012 | |
125 Clovis, NM | | — | | 561 | | 5,539 | | 307 | | 561 | | 5,846 | | 6,407 | | 1,597 | | 2006 | | 2001 | | | — | | 561 | | 5,539 | | 307 | | 561 | | 5,846 | | 6,407 | | 1,880 | | 2006 | | 2001 | |
129 Clovis, NM | | — | | 598 | | 5,902 | | 59 | | 598 | | 5,961 | | 6,559 | | 1,658 | | 1995 | | 2001 | | | — | | 598 | | 5,902 | | 59 | | 598 | | 5,961 | | 6,559 | | 1,945 | | 1995 | | 2001 | |
253 Colton, CA | | — | | 2,342 | | 15,158 | | — | | 2,342 | | 15,158 | | 17,500 | | 71 | | 1990 | | 2011 | | | — | | 2,342 | | 15,158 | | — | | 2,342 | | 15,158 | | 17,500 | | 931 | | 1990 | | 2011 | |
211 Commerce City, CO | | — | | 236 | | 3,217 | | 167 | | 236 | | 3,384 | | 3,620 | | 961 | | 1964 | | 2004 | | | — | | 236 | | 3,217 | | 167 | | 236 | | 3,384 | | 3,620 | | 1,137 | | 1964 | | 2004 | |
212 Commerce City, CO | | — | | 161 | | 2,160 | | 95 | | 161 | | 2,255 | | 2,416 | | 625 | | 1967 | | 2004 | | | — | | 161 | | 2,160 | | 95 | | 161 | | 2,255 | | 2,416 | | 736 | | 1967 | | 2004 | |
246 Crowley, TX | | — | | 2,137 | | 14,366 | | — | | 2,137 | | 14,366 | | 16,503 | | 342 | | 2007 | | 2011 | | | — | | 2,247 | | 14,276 | | — | | 2,247 | | 14,276 | | 16,523 | | 1,380 | | 2007 | | 2011 | |
235 Daleville, VA | | — | | 279 | | 8,382 | | — | | 279 | | 8,382 | | 8,661 | | 480 | | 2005 | | 2010 | | | — | | 279 | | 8,382 | | — | | 279 | | 8,382 | | 8,661 | | 1,086 | | 2005 | | 2010 | |
217 Del Norte, CO | | — | | 103 | | 930 | | 336 | | 103 | | 1,266 | | 1,369 | | 290 | | 2006 | | 2005 | | |
258 Dayton, OH | | | — | | 373 | | 26,627 | | — | | 373 | | 26,627 | | 27,000 | | 871 | | 2010 | | 2012 | |
196 Dresden, TN | | — | | 31 | | 1,529 | | 123 | | 31 | | 1,652 | | 1,683 | | 581 | | 2002 | | 2000 | | | — | | 31 | | 1,529 | | 875 | | 31 | | 2,404 | | 2,435 | | 655 | | 2002 | | 2000 | |
185 Gardner, KS | | — | | 896 | | 4,478 | | 4,150 | | 896 | | 8,628 | | 9,524 | | 2,188 | | 2011 | | 1999 | | | — | | 896 | | 4,478 | | 4,150 | | 896 | | 8,628 | | 9,524 | | 2,676 | | 2011 | | 1999 | |
248 Granbury, TX | | — | | 878 | | 6,708 | | — | | 878 | | 6,708 | | 7,586 | | 359 | | 2008 | | 2011 | | | — | | 836 | | 6,693 | | — | | 836 | | 6,693 | | 7,529 | | 1,001 | | 2008 | | 2011 | |
044 Granger, IA | | — | | 62 | | 1,356 | | 221 | | 62 | | 1,577 | | 1,639 | | 767 | | 1979 | | 1996 | | | — | | 62 | | 1,356 | | 221 | | 62 | | 1,577 | | 1,639 | | 862 | | 1979 | | 1996 | |
205 Grapevine, TX | | — | | 431 | | 1,449 | | 188 | | 431 | | 1,637 | | 2,068 | | 676 | | 1974 | | 2002 | | | — | | 431 | | 1,449 | | 188 | | 431 | | 1,637 | | 2,068 | | 752 | | 1974 | | 2002 | |
172 Griffin, GA | | — | | 500 | | 2,900 | | — | | 500 | | 2,900 | | 3,400 | | 1,182 | | 1969 | | 1999 | | | — | | 500 | | 2,900 | | — | | 500 | | 2,900 | | 3,400 | | 1,333 | | 1969 | | 1999 | |
250 Hewitt, TX | | — | | 1,780 | | 8,220 | | — | | 1,780 | | 8,220 | | 10,000 | | 98 | | 2008 | | 2011 | | | — | | 1,780 | | 8,220 | | 99 | | 1,780 | | 8,319 | | 10,099 | | 587 | | 2008 | | 2011 | |
054 Houston, TX | | — | | 202 | | 4,458 | | 1,426 | | 202 | | 5,884 | | 6,086 | | 2,863 | | 2007 | | 1996 | | | — | | 202 | | 4,458 | | 1,426 | | 202 | | 5,884 | | 6,086 | | 3,218 | | 2007 | | 1996 | |
051 Houston, TX | | — | | 365 | | 3,769 | | 1,598 | | 365 | | 5,367 | | 5,732 | | 2,596 | | 1968 | | 1996 | | | — | | 365 | | 3,769 | | 1,598 | | 365 | | 5,367 | | 5,732 | | 2,874 | | 1968 | | 1996 | |
055 Houston, TX | | — | | 202 | | 4,458 | | 1,359 | | 202 | | 5,817 | | 6,019 | | 2,770 | | 2008 | | 1996 | | | — | | 202 | | 4,458 | | 1,359 | | 202 | | 5,817 | | 6,019 | | 3,118 | | 2008 | | 1996 | |
208 Jacksonville, FL | | — | | 486 | | 1,981 | | 30 | | 486 | | 2,011 | | 2,497 | | 676 | | 1987 | | 2002 | | | — | | 486 | | 1,981 | | 30 | | 486 | | 2,011 | | 2,497 | | 764 | | 1987 | | 2002 | |
045 Jefferson, IA | | — | | 86 | | 1,883 | | 296 | | 86 | | 2,179 | | 2,265 | | 1,042 | | 1972 | | 1996 | | | — | | 86 | | 1,883 | | 296 | | 86 | | 2,179 | | 2,265 | | 1,169 | | 1972 | | 1996 | |
216 Marion, OH | | — | | 119 | | 1,156 | | 1,142 | | 119 | | 2,298 | | 2,417 | | 554 | | 2007 | | 2005 | | |
222 Marion, OH | | — | | 48 | | 2,466 | | — | | 48 | | 2,466 | | 2,514 | | 507 | | 1997 | | 2006 | | |
227 Marion, OH | | — | | 210 | | 804 | | — | | 210 | | 804 | | 1,014 | | 804 | | 1959 | | 2008 | | |
008 Lecanto, FL | | | — | | 351 | | 2,665 | | 2,737 | | 351 | | 5,402 | | 5,753 | | 3,040 | | 2006 | | 1993 | |
053 Mesa, AZ | | — | | 305 | | 6,909 | | 1,876 | | 305 | | 8,785 | | 9,090 | | 3,919 | | 1996 | | 1996 | | | — | | 305 | | 6,909 | | 1,876 | | 305 | | 8,785 | | 9,090 | | 4,408 | | 1996 | | 1996 | |
226 Mesa, AZ | | — | | 1,095 | | 2,330 | | — | | 1,095 | | 2,330 | | 3,425 | | 476 | | 1979 | | 2006 | | | — | | 1,095 | | 2,330 | | — | | 1,095 | | 2,330 | | 3,425 | | 637 | | 1979 | | 2006 | |
050 Midland, TX | | — | | 33 | | 2,285 | | 26 | | 33 | | 2,311 | | 2,344 | | 1,133 | | 1973 | | 1996 | | | — | | 33 | | 2,285 | | 26 | | 33 | | 2,311 | | 2,344 | | 1,256 | | 1973 | | 1996 | |
242 Mission, TX | | — | | 1,111 | | 16,602 | | — | | 1,111 | | 16,602 | | 17,713 | | 448 | | 2004 | | 2010 | | | — | | 1,111 | | 16,602 | | — | | 1,111 | | 16,602 | | 17,713 | | 1,497 | | 2004 | | 2010 | |
041 Montgomery, AL | | — | | 242 | | 5,327 | | 115 | | 242 | | 5,442 | | 5,684 | | 2,592 | | 1974 | | 1996 | | | — | | 242 | | 5,327 | | 115 | | 242 | | 5,442 | | 5,684 | | 2,888 | | 1974 | | 1996 | |
115 Nacogdoches, TX | | — | | 100 | | 1,738 | | 168 | | 100 | | 1,906 | | 2,006 | | 862 | | 1973 | | 1997 | | | — | | 100 | | 1,738 | | 168 | | 100 | | 1,906 | | 2,006 | | 960 | | 1973 | | 1997 | |
233 Nacogdoches, TX | | — | | 394 | | 7,456 | | 168 | | 394 | | 7,624 | | 8,018 | | 463 | | 1991 | | 2010 | | | — | | 394 | | 7,456 | | 268 | | 394 | | 7,724 | | 8,118 | | 950 | | 1991 | | 2010 | |
249 Nacogdoches, TX | | — | | 1,084 | | 11,012 | | — | | 1,084 | | 11,012 | | 12,096 | | 389 | | 2007 | | 2011 | | | — | | 1,015 | | 11,109 | | — | | 1,015 | | 11,109 | | 12,124 | | 1,307 | | 2007 | | 2011 | |
046 Norwalk, IA | | — | | 47 | | 1,033 | | 239 | | 47 | | 1,272 | | 1,319 | | 627 | | 1975 | | 1996 | | | — | | 47 | | 1,033 | | 239 | | 47 | | 1,272 | | 1,319 | | 710 | | 1975 | | 1996 | |
176 Olathe, KS | | — | | 520 | | 1,872 | | 313 | | 520 | | 2,185 | | 2,705 | | 938 | | 1968 | | 1999 | | | — | | 520 | | 1,872 | | 313 | | 520 | | 2,185 | | 2,705 | | 1,089 | | 1968 | | 1999 | |
224 Orrville, OH | | — | | 107 | | 1,946 | | 108 | | 107 | | 2,054 | | 2,161 | | 469 | | 1956 | | 2006 | | |
251 Pasadena, TX | | — | | 1,155 | | 14,345 | | — | | 1,155 | | 14,345 | | 15,500 | | 94 | | 2005 | | 2011 | | | — | | 1,155 | | 14,345 | | — | | 1,155 | | 14,345 | | 15,500 | | 861 | | 2005 | | 2011 | |
210 Phoenix, AZ | | — | | 334 | | 3,383 | | 456 | | 334 | | 3,839 | | 4,173 | | 1,211 | | 1982 | | 2004 | | | — | | 334 | | 3,383 | | 456 | | 334 | | 3,839 | | 4,173 | | 1,431 | | 1982 | | 2004 | |
193 Phoenix, AZ | | — | | 300 | | 9,703 | | 92 | | 300 | | 9,795 | | 10,095 | | 3,838 | | 1985 | | 2000 | | | — | | 300 | | 9,703 | | 92 | | 300 | | 9,795 | | 10,095 | | 4,342 | | 1985 | | 2000 | |
047 Polk City, IA | | — | | 63 | | 1,376 | | 153 | | 63 | | 1,529 | | 1,592 | | 758 | | 1976 | | 1996 | | | — | | 63 | | 1,376 | | 153 | | 63 | | 1,529 | | 1,592 | | 845 | | 1976 | | 1996 | |
094 Portland, OR | | — | | 100 | | 1,925 | | 2,652 | | 100 | | 4,577 | | 4,677 | | 1,703 | | 2007 | | 1997 | | | — | | 100 | | 1,925 | | 2,652 | | 100 | | 4,577 | | 4,677 | | 2,134 | | 2007 | | 1997 | |
254 Red Oak, TX | | | — | | 1,427 | | 17,173 | | — | | 1,427 | | 17,173 | | 18,600 | | 902 | | 2002 | | 2012 | |
124 Richland Hills, TX | | — | | 144 | | 1,656 | | 427 | | 144 | | 2,083 | | 2,227 | | 818 | | 1976 | | 2001 | | | — | | 144 | | 1,656 | | 427 | | 144 | | 2,083 | | 2,227 | | 931 | | 1976 | | 2001 | |
197 Ripley, TN | | — | | 20 | | 985 | | 387 | | 20 | | 1,372 | | 1,392 | | 481 | | 2007 | | 2000 | | | — | | 20 | | 985 | | 641 | | 20 | | 1,626 | | 1,646 | | 554 | | 2007 | | 2000 | |
133 Roswell, NM | | — | | 568 | | 5,232 | | 3 | | 568 | | 5,235 | | 5,803 | | 1,387 | | 1975 | | 2001 | | |
LTC PROPERTIES, INC.
SCHEDULE III
REAL ESTATE AND ACCUMULATED DEPRECIATION (Continued)
(in thousands)
|
| |
| |
| |
| |
| | Gross amount at which carried at
December 31, 2011 | |
| |
| |
| | |
| |
| |
| |
| | Gross amount at which carried at
December 31, 2013 | |
| |
| |
| |
|---|
| |
| | Initial cost to company | | Costs
capitalized
subsequent
to
acquisition | |
| |
| |
| | |
| | Initial cost to company | | Costs
capitalized
subsequent
to
acquisition | |
| |
| |
| |
|---|
| | Encumbrances | | Land | | Building and
improvements | | Land | | Building and
improvements | | Total(2) | | Accum
deprec. | | Construction/
renovation date | | Acquisition
date | | | Encumbrances | | Land | | Building and
improvements | | Land | | Building and
improvements | | Total(1) | | Accum
deprec. | | Construction/
renovation date | | Acquisition
date | |
|---|
070 Rusk, TX | | — | | 34 | | 2,399 | | 448 | | 34 | | 2,847 | | 2,881 | | 1,650 | | 1969 | | 1994 | | |
133 Roswell, NM | | | — | | 568 | | 5,235 | | 1,056 | | 568 | | 6,291 | | 6,859 | | 1,644 | | 1975 | | 2001 | |
081 Sacramento, CA | | — | | 220 | | 2,929 | | — | | 220 | | 2,929 | | 3,149 | | 1,387 | | 1968 | | 1997 | | | — | | 220 | | 2,929 | | — | | 220 | | 2,929 | | 3,149 | | 1,541 | | 1968 | | 1997 | |
085 Salina, KS(3) | | — | | 100 | | 1,153 | | 628 | | 100 | | 1,781 | | 1,881 | | 885 | | 1985 | | 1997 | | | — | (2) | | 100 | | 1,153 | | 628 | | 100 | | 1,781 | | 1,881 | | 981 | | 1985 | | 1997 | |
243 Stephenville TX | | — | | 670 | | 10,117 | | — | | 670 | | 10,117 | | 10,787 | | 569 | | 2009 | | 2010 | | | — | | 670 | | 10,117 | | — | | 670 | | 10,117 | | 10,787 | | 1,142 | | 2009 | | 2010 | |
234 St. Petersburg, FL | | — | | 1,070 | | 7,930 | | — | | 1,070 | | 7,930 | | 9,000 | | 441 | | 1988 | | 2010 | | | — | | 1,070 | | 7,930 | | — | | 1,070 | | 7,930 | | 9,000 | | 923 | | 1988 | | 2010 | |
225 Tacoma, WA | | — | | 723 | | 6,401 | | 901 | | 723 | | 7,302 | | 8,025 | | 1,425 | | 2009 | | 2006 | | | — | | 723 | | 6,401 | | 901 | | 723 | | 7,302 | | 8,025 | | 2,037 | | 2009 | | 2006 | |
178 Tappahannock, VA(3) | | — | | 375 | | 1,327 | | 397 | | 375 | | 1,724 | | 2,099 | | 1,256 | | 1978 | | 1995 | | | — | (2) | | 375 | | 1,327 | | 397 | | 375 | | 1,724 | | 2,099 | | 1,342 | | 1978 | | 1995 | |
270 Trinity, FL | | | — | | 1,653 | | 12,748 | | — | | 1,653 | | 12,748 | | 14,401 | | 69 | | N/A | | 2013 | |
192 Tucson, AZ | | — | | 276 | | 8,924 | | 112 | | 276 | | 9,036 | | 9,312 | | 3,536 | | 1992 | | 2000 | | | — | | 276 | | 8,924 | | 112 | | 276 | | 9,036 | | 9,312 | | 4,000 | | 1992 | | 2000 | |
209 Tyler, TX | | — | | 300 | | 3,071 | | 22 | | 300 | | 3,093 | | 3,393 | | 740 | | 1974 | | 2004 | | | — | | 300 | | 3,071 | | 22 | | 300 | | 3,093 | | 3,393 | | 887 | | 1974 | | 2004 | |
223 Wooster, OH | | — | | 118 | | 1,711 | | 2,223 | | 118 | | 3,934 | | 4,052 | | 936 | | 2008 | | 2006 | | |
| | | | | | | | | | | | | | | | | | | | | | | | | | | | | | | | | | | | | | | | | |
| | | | | | | | | | | | | | | | | | | | | | | |
Skilled Nursing Properties | | — | | 33,917 | | 300,231 | | 27,178 | | 33,917 | | 327,409 | | 361,326 | | 73,523 | | | | | | | — | | 40,180 | | 382,210 | | 36,369 | | 40,180 | | 418,579 | | 458,759 | | 95,599 | | | | | |
| | | | | | | | | | | | | | | | | | | | | | | | | | | | | | | | | | | | | | | | | |
| | | | | | | | | | | | | | | | | | | | | | | |
Assisted Living Properties: | | Assisted Living Properties: | | | | | | | | | | | | | | | | | | | |
077 Ada, OK | | — | | 100 | | 1,650 | | — | | 100 | | 1,650 | | 1,750 | | 644 | | 1996 | | 1996 | | | — | | 100 | | 1,650 | | — | | 100 | | 1,650 | | 1,750 | | 725 | | 1996 | | 1996 | |
136 Arlington, OH | | — | | 629 | | 6,973 | | — | | 629 | | 6,973 | | 7,602 | | 1,839 | | 1993 | | 2001 | | | — | | 629 | | 6,973 | | — | | 629 | | 6,973 | | 7,602 | | 2,182 | | 1993 | | 2001 | |
105 Arvada, CO | | — | | 100 | | 2,810 | | 276 | | 100 | | 3,086 | | 3,186 | | 1,130 | | 1997 | | 1997 | | | — | | 100 | | 2,810 | | 280 | | 100 | | 3,090 | | 3,190 | | 1,282 | | 1997 | | 1997 | |
063 Athens, TX | | — | | 96 | | 1,510 | | 1 | | 96 | | 1,511 | | 1,607 | | 624 | | 1995 | | 1996 | | | — | | 96 | | 1,510 | | 1 | | 96 | | 1,511 | | 1,607 | | 699 | | 1995 | | 1996 | |
260 Aurora, CO | | | — | | 831 | | 10,071 | | — | | 831 | | 10,071 | | 10,902 | | 303 | | 1999 | | 2012 | |
203 Bakersfield, CA | | — | | 834 | | 11,986 | | 812 | | 834 | | 12,798 | | 13,632 | | 3,569 | | 2002 | | 2001 | | | — | | 834 | | 11,986 | | 812 | | 834 | | 12,798 | | 13,632 | | 4,367 | | 2002 | | 2001 | |
072 Battleground, WA | | — | | 100 | | 2,500 | | — | | 100 | | 2,500 | | 2,600 | | 968 | | 1996 | | 1996 | | | — | | 100 | | 2,500 | | — | | 100 | | 2,500 | | 2,600 | | 1,091 | | 1996 | | 1996 | |
117 Beatrice, NE | | — | | 100 | | 2,173 | | — | | 100 | | 2,173 | | 2,273 | | 800 | | 1997 | | 1997 | | | — | | 100 | | 2,173 | | — | | 100 | | 2,173 | | 2,273 | | 907 | | 1997 | | 1997 | |
137 Bexley, OH | | — | | 306 | | 4,196 | | — | | 306 | | 4,196 | | 4,502 | | 1,108 | | 1992 | | 2001 | | | — | | 306 | | 4,196 | | — | | 306 | | 4,196 | | 4,502 | | 1,314 | | 1992 | | 2001 | |
106 Bullhead City, AZ | | — | | 100 | | 2,500 | | — | | 100 | | 2,500 | | 2,600 | | 922 | | 1997 | | 1997 | | | — | | 100 | | 2,500 | | — | | 100 | | 2,500 | | 2,600 | | 1,045 | | 1997 | | 1997 | |
111 Burley, ID | | — | | 100 | | 2,200 | | — | | 100 | | 2,200 | | 2,300 | | 815 | | 1997 | | 1997 | | | — | | 100 | | 2,200 | | — | | 100 | | 2,200 | | 2,300 | | 922 | | 1997 | | 1997 | |
112 Caldwell, ID | | — | | 100 | | 2,200 | | — | | 100 | | 2,200 | | 2,300 | | 815 | | 1997 | | 1997 | | | — | | 100 | | 2,200 | | — | | 100 | | 2,200 | | 2,300 | | 922 | | 1997 | | 1997 | |
024 Camas, WA | | — | (1) | | 100 | | 2,175 | | — | | 100 | | 2,175 | | 2,275 | | 872 | | 1996 | | 1996 | | | — | (3) | | 100 | | 2,175 | | — | | 100 | | 2,175 | | 2,275 | | 979 | | 1996 | | 1996 | |
160 Central, SC | | — | | 100 | | 2,321 | | — | | 100 | | 2,321 | | 2,421 | | 695 | | 1998 | | 1999 | | | — | | 100 | | 2,321 | | — | | 100 | | 2,321 | | 2,421 | | 797 | | 1998 | | 1999 | |
263 Chatham, NJ | | | — | | 5,365 | | 36,399 | | — | | 5,365 | | 36,399 | | 41,764 | | 1,050 | | 2002 | | 2012 | |
191 Cordele, GA | | | — | | 153 | | 1,455 | | 132 | | 153 | | 1,587 | | 1,740 | | 701 | | 2002 | | 2000 | |
240 Daytona Beach, FL | | — | | 900 | | 3,400 | | — | | 900 | | 3,400 | | 4,300 | | 123 | | 1996 | | 2010 | | | — | | 900 | | 3,400 | | — | | 900 | | 3,400 | | 4,300 | | 334 | | 1996 | | 2010 | |
156 Denison, IA | | — | | 100 | | 2,713 | | — | | 100 | | 2,713 | | 2,813 | | 942 | | 1998 | | 1998 | | | — | | 100 | | 2,713 | | — | | 100 | | 2,713 | | 2,813 | | 1,076 | | 1998 | | 1998 | |
057 Dodge City, KS | | — | | 84 | | 1,666 | | 4 | | 84 | | 1,670 | | 1,754 | | 714 | | 1995 | | 1995 | | | — | | 84 | | 1,666 | | 4 | | 84 | | 1,670 | | 1,754 | | 794 | | 1995 | | 1995 | |
083 Durant, OK | | — | | 100 | | 1,769 | | — | | 100 | | 1,769 | | 1,869 | | 674 | | 1997 | | 1997 | | | — | | 100 | | 1,769 | | — | | 100 | | 1,769 | | 1,869 | | 761 | | 1997 | | 1997 | |
107 Edmond, OK | | — | | 100 | | 1,365 | | 526 | | 100 | | 1,891 | | 1,991 | | 699 | | 1996 | | 1997 | | | — | | 100 | | 1,365 | | 526 | | 100 | | 1,891 | | 1,991 | | 792 | | 1996 | | 1997 | |
122 Elkhart, IN | | — | | 100 | | 2,435 | | — | | 100 | | 2,435 | | 2,535 | | 879 | | 1997 | | 1997 | | | — | | 100 | | 2,435 | | — | | 100 | | 2,435 | | 2,535 | | 999 | | 1997 | | 1997 | |
155 Erie, PA | | — | | 850 | | 7,477 | | — | | 850 | | 7,477 | | 8,327 | | 2,663 | | 1998 | | 1999 | | | — | | 850 | | 7,477 | | — | | 850 | | 7,477 | | 8,327 | | 3,010 | | 1998 | | 1999 | |
113 Eugene, OR | | — | | 100 | | 2,600 | | — | | 100 | | 2,600 | | 2,700 | | 958 | | 1997 | | 1997 | | | — | | 100 | | 2,600 | | — | | 100 | | 2,600 | | 2,700 | | 1,086 | | 1997 | | 1997 | |
100 Fremont ,OH | | — | | 100 | | 2,435 | | — | | 100 | | 2,435 | | 2,535 | | 904 | | 1997 | | 1997 | | | — | | 100 | | 2,435 | | — | | 100 | | 2,435 | | 2,535 | | 1,023 | | 1997 | | 1997 | |
163 Ft. Collins, CO | | — | | 100 | | 2,961 | | — | | 100 | | 2,961 | | 3,061 | | 967 | | 1998 | | 1999 | | | — | | 100 | | 2,961 | | 2 | | 100 | | 2,963 | | 3,063 | | 1,109 | | 1998 | | 1999 | |
170 Ft. Collins, CO | | — | | 100 | | 3,400 | | — | | 100 | | 3,400 | | 3,500 | | 1,084 | | 1999 | | 1999 | | | — | | 100 | | 3,400 | | 2 | | 100 | | 3,402 | | 3,502 | | 1,252 | | 1999 | | 1999 | |
132 Ft. Meyers, FL | | — | | 100 | | 2,728 | | 9 | | 100 | | 2,737 | | 2,837 | | 968 | | 1998 | | 1998 | | | — | | 100 | | 2,728 | | 9 | | 100 | | 2,737 | | 2,837 | | 1,103 | | 1998 | | 1998 | |
230 Ft. Wayne, IN | | — | | 594 | | 3,461 | | 731 | | 594 | | 4,192 | | 4,786 | | 249 | | 1996 | | 2009 | | | — | | 594 | | 3,461 | | 731 | | 594 | | 4,192 | | 4,786 | | 594 | | 1996 | | 2009 | |
229 Ft. Worth, TX | | | — | | 333 | | 4,385 | | 1,028 | | 333 | | 5,413 | | 5,746 | | 1,280 | | 2009 | | 2008 | |
167 Goldsboro, NC | | — | | 100 | | 2,385 | | 1 | | 100 | | 2,386 | | 2,486 | | 664 | | 1998 | | 1999 | | | — | | 100 | | 2,385 | | 1 | | 100 | | 2,386 | | 2,486 | | 762 | | 1998 | | 1999 | |
022 Grandview, WA | | — | (1) | | 100 | | 1,940 | | — | | 100 | | 1,940 | | 2,040 | | 793 | | 1996 | | 1996 | | | — | (3) | | 100 | | 1,940 | | — | | 100 | | 1,940 | | 2,040 | | 888 | | 1996 | | 1996 | |
056 Great Bend, KS | | — | | 80 | | 1,570 | | 21 | | 80 | | 1,591 | | 1,671 | | 737 | | 1995 | | 1995 | | | — | | 80 | | 1,570 | | 21 | | 80 | | 1,591 | | 1,671 | | 827 | | 1995 | | 1995 | |
102 Greeley, CO | | — | | 100 | | 2,310 | | 270 | | 100 | | 2,580 | | 2,680 | | 951 | | 1997 | | 1997 | | | — | | 100 | | 2,310 | | 270 | | 100 | | 2,580 | | 2,680 | | 1,078 | | 1997 | | 1997 | |
164 Greenville, NC | | — | | 100 | | 2,478 | | 2 | | 100 | | 2,480 | | 2,580 | | 778 | | 1998 | | 1999 | | | — | | 100 | | 2,478 | | 2 | | 100 | | 2,480 | | 2,580 | | 891 | | 1998 | | 1999 | |
062 Greenville, TX | | — | | 42 | | 1,565 | | — | | 42 | | 1,565 | | 1,607 | | 647 | | 1995 | | 1996 | | | — | | 42 | | 1,565 | | — | | 42 | | 1,565 | | 1,607 | | 723 | | 1995 | | 1996 | |
161 Greenwood, SC | | — | | 100 | | 2,638 | | — | | 100 | | 2,638 | | 2,738 | | 845 | | 1998 | | 1999 | | | — | | 100 | | 2,638 | | — | | 100 | | 2,638 | | 2,738 | | 968 | | 1998 | | 1999 | |
241 Gulf Breeze, FL | | — | | 720 | | 3,780 | | — | | 720 | | 3,780 | | 4,500 | | 149 | | 2000 | | 2010 | | | — | | 720 | | 3,780 | | — | | 720 | | 3,780 | | 4,500 | | 402 | | 2000 | | 2010 | |
079 Hayden, ID | | — | | 100 | | 2,450 | | 243 | | 100 | | 2,693 | | 2,793 | | 1,035 | | 1996 | | 1996 | | | — | | 100 | | 2,450 | | 243 | | 100 | | 2,693 | | 2,793 | | 1,168 | | 1996 | | 1996 | |
097 Hoquiam, WA | | — | | 100 | | 2,500 | | — | | 100 | | 2,500 | | 2,600 | | 927 | | 1997 | | 1997 | | | — | | 100 | | 2,500 | | — | | 100 | | 2,500 | | 2,600 | | 1,050 | | 1997 | | 1997 | |
066 Jacksonville, TX | | — | | 100 | | 1,900 | | — | | 100 | | 1,900 | | 2,000 | | 779 | | 1996 | | 1996 | | | — | | 100 | | 1,900 | | — | | 100 | | 1,900 | | 2,000 | | 872 | | 1996 | | 1996 | |
071 Kelso, WA | | — | | 100 | | 2,500 | | — | | 100 | | 2,500 | | 2,600 | | 1,024 | | 1996 | | 1996 | | | — | | 100 | | 2,500 | | — | | 100 | | 2,500 | | 2,600 | | 1,147 | | 1996 | | 1996 | |
021 Kennewick. WA | | — | (1) | | 100 | | 1,940 | | — | | 100 | | 1,940 | | 2,040 | | 797 | | 1996 | | 1996 | | | — | (3) | | 100 | | 1,940 | | — | | 100 | | 1,940 | | 2,040 | | 892 | | 1996 | | 1996 | |
073 Klamath Falls, OR | | — | | 100 | | 2,300 | | — | | 100 | | 2,300 | | 2,400 | | 888 | | 1996 | | 1996 | | | — | | 100 | | 2,300 | | — | | 100 | | 2,300 | | 2,400 | | 1,001 | | 1996 | | 1996 | |
101 Lake Havasu, AZ | | — | | 100 | | 2,420 | | — | | 100 | | 2,420 | | 2,520 | | 898 | | 1997 | | 1997 | | | — | | 100 | | 2,420 | | — | | 100 | | 2,420 | | 2,520 | | 1,017 | | 1997 | | 1997 | |
148 Longmont, CO | | — | | 100 | | 2,640 | | — | | 100 | | 2,640 | | 2,740 | | 923 | | 1998 | | 1998 | | |
060 Longview, TX | | — | | 38 | | 1,568 | | 1 | | 38 | | 1,569 | | 1,607 | | 654 | | 1995 | | 1995 | | |
114 Loveland, CO | | — | | 100 | | 2,865 | | 270 | | 100 | | 3,135 | | 3,235 | | 1,138 | | 1997 | | 1997 | | |
068 Lufkin, TX | | — | | 100 | | 1,950 | | — | | 100 | | 1,950 | | 2,050 | | 793 | | 1996 | | 1996 | | |
119 Madison, IN | | — | | 100 | | 2,435 | | — | | 100 | | 2,435 | | 2,535 | | 894 | | 1997 | | 1997 | | |
190 Lakeland, FL | | | — | | 519 | | 2,312 | | 1,626 | | 519 | | 3,938 | | 4,457 | | 1,648 | | 2009 | | 2000 | |
LTC PROPERTIES, INC.
SCHEDULE III
REAL ESTATE AND ACCUMULATED DEPRECIATION (Continued)
(in thousands)
|
| |
| |
| |
| |
| | Gross amount at which carried at
December 31, 2011 | |
| |
| |
| | |
| |
| |
| |
| | Gross amount at which carried at
December 31, 2013 | |
| |
| |
| |
|---|
| |
| | Initial cost to company | | Costs
capitalized
subsequent
to
acquisition | |
| |
| |
| | |
| | Initial cost to company | | Costs
capitalized
subsequent
to
acquisition | |
| |
| |
| |
|---|
| | Encumbrances | | Land | | Building and
improvements | | Land | | Building and
improvements | | Total(2) | | Accum
deprec. | | Construction/
renovation date | | Acquisition
date | | | Encumbrances | | Land | | Building and
improvements | | Land | | Building and
improvements | | Total(1) | | Accum
deprec. | | Construction/
renovation date | | Acquisition
date | |
|---|
255 Littleton, CO | | | — | | 1,882 | | — | | 8,249 | | 1,882 | | 8,249 | | 10,131 | | 147 | | 2013 | | 2012 | |
148 Longmont, CO | | | — | | 100 | | 2,640 | | — | | 100 | | 2,640 | | 2,740 | | 1,053 | | 1998 | | 1998 | |
060 Longview, TX | | | — | | 38 | | 1,568 | | 1 | | 38 | | 1,569 | | 1,607 | | 731 | | 1995 | | 1995 | |
221 Louisville, CO | | | — | | 911 | | 11,703 | | — | | 911 | | 11,703 | | 12,614 | | 345 | | 2000 | | 2012 | |
114 Loveland, CO | | | — | | 100 | | 2,865 | | 270 | | 100 | | 3,135 | | 3,235 | | 1,294 | | 1997 | | 1997 | |
068 Lufkin, TX | | | — | | 100 | | 1,950 | | — | | 100 | | 1,950 | | 2,050 | | 888 | | 1996 | | 1996 | |
119 Madison, IN | | | — | | 100 | | 2,435 | | — | | 100 | | 2,435 | | 2,535 | | 1,013 | | 1997 | | 1997 | |
061 Marshall, TX | | — | | 38 | | 1,568 | | 451 | | 38 | | 2,019 | | 2,057 | | 843 | | 1995 | | 1995 | | | — | | 38 | | 1,568 | | 451 | | 38 | | 2,019 | | 2,057 | | 945 | | 1995 | | 1995 | |
058 McPherson, KS | | — | | 79 | | 1,571 | | 4 | | 79 | | 1,575 | | 1,654 | | 730 | | 1994 | | 1995 | | | — | | 79 | | 1,571 | | 4 | | 79 | | 1,575 | | 1,654 | | 819 | | 1994 | | 1995 | |
239 Merritt Island, FL | | — | | 550 | | 8,150 | | — | | 550 | | 8,150 | | 8,700 | | 300 | | 2004 | | 2010 | | | — | | 550 | | 8,150 | | — | | 550 | | 8,150 | | 8,700 | | 818 | | 2004 | | 2010 | |
104 Millville, NJ | | — | | 100 | | 2,825 | | — | | 100 | | 2,825 | | 2,925 | | 1,044 | | 1997 | | 1997 | | | — | | 100 | | 2,825 | | — | | 100 | | 2,825 | | 2,925 | | 1,183 | | 1997 | | 1997 | |
231 Monroeville, PA | | — | | 526 | | 5,334 | | 435 | | 526 | | 5,769 | | 6,295 | | 337 | | 1997 | | 2009 | | | — | | 526 | | 5,334 | | 435 | | 526 | | 5,769 | | 6,295 | | 743 | | 1997 | | 2009 | |
082 Nampa, ID | | — | | 100 | | 2,240 | | 23 | | 100 | | 2,263 | | 2,363 | | 874 | | 1997 | | 1997 | | | — | | 100 | | 2,240 | | 23 | | 100 | | 2,263 | | 2,363 | | 985 | | 1997 | | 1997 | |
166 New Bern, NC | | — | | 100 | | 2,427 | | 1 | | 100 | | 2,428 | | 2,528 | | 688 | | 1998 | | 1999 | | | — | | 100 | | 2,427 | | 1 | | 100 | | 2,428 | | 2,528 | | 790 | | 1998 | | 1999 | |
118 Newark, OH | | — | | 100 | | 2,435 | | — | | 100 | | 2,435 | | 2,535 | | 894 | | 1997 | | 1997 | | | — | | 100 | | 2,435 | | — | | 100 | | 2,435 | | 2,535 | | 1,013 | | 1997 | | 1997 | |
123 Newport Richey, FL | | — | | 100 | | 5,845 | | 664 | | 100 | | 6,509 | | 6,609 | | 2,609 | | 1995 | | 1998 | | | — | | 100 | | 5,845 | | 664 | | 100 | | 6,509 | | 6,609 | | 2,994 | | 1995 | | 1998 | |
074 Newport, OR | | — | | 100 | | 2,050 | | — | | 100 | | 2,050 | | 2,150 | | 989 | | 1996 | | 1996 | | | — | | 100 | | 2,050 | | — | | 100 | | 2,050 | | 2,150 | | 1,140 | | 1996 | | 1996 | |
143 Niceville, FL | | — | | 100 | | 2,680 | | — | | 100 | | 2,680 | | 2,780 | | 937 | | 1998 | | 1998 | | | — | | 100 | | 2,680 | | — | | 100 | | 2,680 | | 2,780 | | 1,069 | | 1998 | | 1998 | |
095 Norfolk, NE | | — | | 100 | | 2,123 | | — | | 100 | | 2,123 | | 2,223 | | 796 | | 1997 | | 1997 | | | — | | 100 | | 2,123 | | — | | 100 | | 2,123 | | 2,223 | | 900 | | 1997 | | 1997 | |
232 Pittsburgh, PA | | — | | 470 | | 2,615 | | 333 | | 470 | | 2,948 | | 3,418 | | 176 | | 1994 | | 2009 | | | — | | 470 | | 2,615 | | 333 | | 470 | | 2,948 | | 3,418 | | 411 | | 1994 | | 2009 | |
165 Rocky Mount, NC | | — | | 100 | | 2,494 | | 1 | | 100 | | 2,495 | | 2,595 | | 730 | | 1998 | | 1999 | | | — | | 100 | | 2,494 | | 1 | | 100 | | 2,495 | | 2,595 | | 837 | | 1998 | | 1999 | |
141 Rocky River, OH | | — | | 760 | | 6,963 | | — | | 760 | | 6,963 | | 7,723 | | 2,424 | | 1998 | | 1999 | | | — | | 760 | | 6,963 | | — | | 760 | | 6,963 | | 7,723 | | 2,751 | | 1998 | | 1999 | |
059 Salina, KS | | — | | 79 | | 1,571 | | 4 | | 79 | | 1,575 | | 1,654 | | 730 | | 1994 | | 1995 | | | — | | 79 | | 1,571 | | 4 | | 79 | | 1,575 | | 1,654 | | 819 | | 1994 | | 1995 | |
084 San Antonio, TX | | — | | 100 | | 1,900 | | — | | 100 | | 1,900 | | 2,000 | | 723 | | 1997 | | 1997 | | | — | | 100 | | 1,900 | | — | | 100 | | 1,900 | | 2,000 | | 815 | | 1997 | | 1997 | |
092 San Antonio, TX | | — | | 100 | | 2,055 | | — | | 100 | | 2,055 | | 2,155 | | 775 | | 1997 | | 1997 | | | — | | 100 | | 2,055 | | — | | 100 | | 2,055 | | 2,155 | | 876 | | 1997 | | 1997 | |
149 Shelby, NC | | — | | 100 | | 2,805 | | 2 | | 100 | | 2,807 | | 2,907 | | 979 | | 1998 | | 1998 | | | — | | 100 | | 2,805 | | 2 | | 100 | | 2,807 | | 2,907 | | 1,118 | | 1998 | | 1998 | |
150 Spring Hill, FL | | — | | 100 | | 2,650 | | — | | 100 | | 2,650 | | 2,750 | | 927 | | 1998 | | 1998 | | | — | | 100 | | 2,650 | | — | | 100 | | 2,650 | | 2,750 | | 1,057 | | 1998 | | 1998 | |
103 Springfield, OH | | — | | 100 | | 2,035 | | 270 | | 100 | | 2,305 | | 2,405 | | 848 | | 1997 | | 1997 | | | — | | 100 | | 2,035 | | 270 | | 100 | | 2,305 | | 2,405 | | 961 | | 1997 | | 1997 | |
162 Sumter, SC | | — | | 100 | | 2,351 | | — | | 100 | | 2,351 | | 2,451 | | 723 | | 1998 | | 1999 | | | — | | 100 | | 2,351 | | — | | 100 | | 2,351 | | 2,451 | | 828 | | 1998 | | 1999 | |
140 Tallahassee, FL | | — | | 100 | | 3,075 | | — | | 100 | | 3,075 | | 3,175 | | 1,077 | | 1998 | | 1998 | | | — | | 100 | | 3,075 | | — | | 100 | | 3,075 | | 3,175 | | 1,229 | | 1998 | | 1998 | |
098 Tiffin, OH | | — | | 100 | | 2,435 | | — | | 100 | | 2,435 | | 2,535 | | 904 | | 1997 | | 1997 | | | — | | 100 | | 2,435 | | — | | 100 | | 2,435 | | 2,535 | | 1,023 | | 1997 | | 1997 | |
088 Troy, OH | | — | | 100 | | 2,435 | | 306 | | 100 | | 2,741 | | 2,841 | | 1,022 | | 1997 | | 1997 | | | — | | 100 | | 2,435 | | 306 | | 100 | | 2,741 | | 2,841 | | 1,157 | | 1997 | | 1997 | |
080 Tulsa, OK | | — | | 200 | | 1,650 | | — | | 200 | | 1,650 | | 1,850 | | 638 | | 1997 | | 1997 | | | — | | 200 | | 1,650 | | — | | 200 | | 1,650 | | 1,850 | | 718 | | 1997 | | 1997 | |
093 Tulsa, OK | | — | | 100 | | 2,395 | | — | | 100 | | 2,395 | | 2,495 | | 899 | | 1997 | | 1997 | | | — | | 100 | | 2,395 | | — | | 100 | | 2,395 | | 2,495 | | 1,017 | | 1997 | | 1997 | |
238 Tupelo, MS | | — | | 1,170 | | 8,230 | | — | | 1,170 | | 8,230 | | 9,400 | | 321 | | 2000 | | 2010 | | | — | | 1,170 | | 8,230 | | — | | 1,170 | | 8,230 | | 9,400 | | 870 | | 2000 | | 2010 | |
075 Tyler, TX | | — | | 100 | | 1,800 | | — | | 100 | | 1,800 | | 1,900 | | 701 | | 1996 | | 1996 | | | — | | 100 | | 1,800 | | — | | 100 | | 1,800 | | 1,900 | | 788 | | 1996 | | 1996 | |
202 Vacaville, CA | | — | | 1,662 | | 11,634 | | 1,141 | | 1,662 | | 12,775 | | 14,437 | | 3,504 | | 2002 | | 2001 | | | — | | 1,662 | | 11,634 | | 1,141 | | 1,662 | | 12,775 | | 14,437 | | 4,300 | | 2002 | | 2001 | |
025 Vancouver, WA | | — | (1) | | 100 | | 2,785 | | — | | 100 | | 2,785 | | 2,885 | | 1,115 | | 1996 | | 1996 | | | — | (3) | | 100 | | 2,785 | | — | | 100 | | 2,785 | | 2,885 | | 1,252 | | 1996 | | 1996 | |
091 Waco, TX | | — | | 100 | | 2,235 | | — | | 100 | | 2,235 | | 2,335 | | 841 | | 1997 | | 1997 | | | — | | 100 | | 2,235 | | — | | 100 | | 2,235 | | 2,335 | | 950 | | 1997 | | 1997 | |
096 Wahoo, NE | | — | | 100 | | 2,318 | | — | | 100 | | 2,318 | | 2,418 | | 862 | | 1997 | | 1997 | | | — | | 100 | | 2,318 | | — | | 100 | | 2,318 | | 2,418 | | 975 | | 1997 | | 1997 | |
023 Walla Walla, WA | | 3,200 | (1) | | 100 | | 1,940 | | — | | 100 | | 1,940 | | 2,040 | | 789 | | 1996 | | 1996 | | | 2,035 | (3) | | 100 | | 1,940 | | — | | 100 | | 1,940 | | 2,040 | | 884 | | 1996 | | 1996 | |
108 Watauga, TX | | — | | 100 | | 1,668 | | — | | 100 | | 1,668 | | 1,768 | | 624 | | 1996 | | 1997 | | | — | | 100 | | 1,668 | | — | | 100 | | 1,668 | | 1,768 | | 705 | | 1996 | | 1997 | |
109 Weatherford, OK | | — | | 100 | | 1,669 | | 592 | | 100 | | 2,261 | | 2,361 | | 832 | | 1996 | | 1997 | | | — | | 100 | | 1,669 | | 592 | | 100 | | 2,261 | | 2,361 | | 943 | | 1996 | | 1997 | |
110 Wheelersburg, OH | | — | | 29 | | 2,435 | | — | | 29 | | 2,435 | | 2,464 | | 894 | | 1997 | | 1997 | | | — | | 29 | | 2,435 | | — | | 29 | | 2,435 | | 2,464 | | 1,013 | | 1997 | | 1997 | |
259 Wichita, KS | | | — | | 730 | | — | | 9,131 | | 730 | | 9,131 | | 9,861 | | 64 | | 2013 | | 2012 | |
076 Wichita Falls, TX | | — | | 100 | | 1,850 | | — | | 100 | | 1,850 | | 1,950 | | 719 | | 1996 | | 1996 | | | — | | 100 | | 1,850 | | — | | 100 | | 1,850 | | 1,950 | | 810 | | 1996 | | 1996 | |
120 Wichita Falls,TX | | — | | 100 | | 2,750 | | — | | 100 | | 2,750 | | 2,850 | | 1,012 | | 1997 | | 1997 | | |
120 Wichita Falls, TX | | | — | | 100 | | 2,750 | | — | | 100 | | 2,750 | | 2,850 | | 1,147 | | 1997 | | 1997 | |
264 Williamstown, NJ | | | — | | 711 | | 8,649 | | — | | 711 | | 8,649 | | 9,360 | | 253 | | 2000 | | 2012 | |
265 Williamstown, NJ | | | — | | 711 | | 6,637 | | — | | 711 | | 6,637 | | 7,348 | | 215 | | 2000 | | 2012 | |
138 Worthington, OH | | — | | — | | 6,102 | | — | | — | | 6,102 | | 6,102 | | 3,509 | | 1993 | | 2001 | | | — | | — | | 6,102 | | — | | — | | 6,102 | | 6,102 | | 4,398 | | 1993 | | 2001 | |
139 Worthington, OH | | — | | — | | 3,402 | | — | | — | | 3,402 | | 3,402 | | 1,991 | | 1995 | | 2001 | | | — | | — | | 3,402 | | — | | — | | 3,402 | | 3,402 | | 2,475 | | 1995 | | 2001 | |
099 York, NE | | — | | 100 | | 2,318 | | — | | 100 | | 2,318 | | 2,418 | | 862 | | 1997 | | 1997 | | | — | | 100 | | 2,318 | | — | | 100 | | 2,318 | | 2,418 | | 975 | | 1997 | | 1997 | |
| | | | | | | | | | | | | | | | | | | | | | | | | | | | | | | | | | | | | | | | | |
| | | | | | | | | | | | | | | | | | | | | | | |
Assisted Living Properties | | 3,200 | | 17,036 | | 261,551 | | 7,394 | | 17,036 | | 268,945 | | 285,981 | | 86,131 | | | | | | | 2,035 | | 29,182 | | 343,162 | | 27,568 | | 29,182 | | 370,730 | | 399,912 | | 107,337 | | | | | |
| | | | | | | | | | | | | | | | | | | | | | | | | | | | | | | | | | | | | | | | | |
Other Senior Housing: | | |
007 Bradenton, FL | | — | | 330 | | 2,720 | | 160 | | 330 | | 2,880 | | 3,210 | | 1,556 | | 2002 | | 1993 | | |
| | | | | | | | | | | | | | | | | | | | | | | |
Range of Care Properties: | | Range of Care Properties: | | | | | | | | | | | | | | | | | | | |
199 Brownsville, TX | | — | | 302 | | 1,856 | | 835 | | 302 | | 2,691 | | 2,993 | | 592 | | 2009 | | 2004 | | | — | | 302 | | 1,856 | | 835 | | 302 | | 2,691 | | 2,993 | | 783 | | 2009 | | 2004 | |
191 Cordele, GA | | — | | 153 | | 1,455 | | 132 | | 153 | | 1,587 | | 1,740 | | 616 | | 2002 | | 2000 | | |
168 Des Moines, IA(3) | | — | | 115 | | 2,096 | | 1,433 | | 115 | | 3,529 | | 3,644 | | 1,536 | | 1972 | | 1999 | | |
229 Ft. Worth, TX | | — | | 333 | | 4,385 | | 919 | | 333 | | 5,304 | | 5,637 | | 613 | | 2009 | | 2008 | | |
168 Des Moines, IA(2) | | | — | | 115 | | 2,096 | | 1,433 | | 115 | | 3,529 | | 3,644 | | 1,710 | | 1972 | | 1999 | |
26A Gardendale, AL | | — | | 84 | | 6,316 | | 2,084 | | 84 | | 8,400 | | 8,484 | | 2,980 | | 2009 | | 1996 | | | — | | 84 | | 6,316 | | 2,084 | | 84 | | 8,400 | | 8,484 | | 3,574 | | 2009 | | 1996 | |
26B Gardendale, AL | | — | | 16 | | 1,234 | | — | | 16 | | 1,234 | | 1,250 | | 576 | | 1988 | | 1996 | | | — | | 16 | | 1,234 | | — | | 16 | | 1,234 | | 1,250 | | 644 | | 1988 | | 1996 | |
194 Holyoke, CO | | — | | 211 | | 1,513 | | 283 | | 211 | | 1,796 | | 2,007 | | 847 | | 1963 | | 2000 | | |
190 Lakeland, FL | | — | | 519 | | 2,313 | | 1,626 | | 519 | | 3,939 | | 4,458 | | 1,309 | | 2009 | | 2000 | | |
008 Lecanto, FL | | — | | 351 | | 2,665 | | 2,737 | | 351 | | 5,402 | | 5,753 | | 2,718 | | 2006 | | 1993 | | |
245 Newberry, SC | | — | | 439 | | 4,638 | | 562 | | 439 | | 5,200 | | 5,639 | | 141 | | 1995 | | 2011 | | |
244 Newberry, SC | | — | | 919 | | 5,453 | | 112 | | 919 | | 5,565 | | 6,484 | | 171 | | 2001 | | 2011 | | |
236 Wytheville, VA | | — | | 647 | | 12,692 | | — | | 647 | | 12,692 | | 13,339 | | 900 | | 1996 | | 2010 | | |
| | | | | | | | | | | | | | | | | | | | | |
LTC PROPERTIES, INC.
SCHEDULE III
REAL ESTATE AND ACCUMULATED DEPRECIATION (Continued)
(in thousands)
|
| |
| |
| |
| |
| | Gross amount at which carried at
December 31, 2011 | |
| |
| |
| | |
| |
| |
| |
| | Gross amount at which carried at
December 31, 2013 | |
| |
| |
| |
|---|
| |
| | Initial cost to company | | Costs
capitalized
subsequent
to
acquisition | |
| |
| |
| | |
| | Initial cost to company | | Costs
capitalized
subsequent
to
acquisition | |
| |
| |
| |
|---|
| | Encumbrances | | Land | | Building and
improvements | | Land | | Building and
improvements | | Total(2) | | Accum
deprec. | | Construction/
renovation date | | Acquisition
date | | | Encumbrances | | Land | | Building and
improvements | | Land | | Building and
improvements | | Total(1) | | Accum
deprec. | | Construction/
renovation date | | Acquisition
date | |
|---|
Other Senior Housing | | — | | 4,419 | | 49,336 | | 10,883 | | 4,419 | | 60,219 | | 64,638 | | 14,555 | | | | | | |
194 Holyoke, CO | | | — | | 211 | | 1,513 | | 283 | | 211 | | 1,796 | | 2,007 | | 919 | | 1963 | | 2000 | |
245 Newberry, SC | | | — | | 439 | | 4,639 | | 608 | | 439 | | 5,247 | | 5,686 | | 621 | | 1995 | | 2011 | |
244 Newberry, SC | | | — | | 919 | | 5,454 | | 131 | | 919 | | 5,585 | | 6,504 | | 601 | | 2001 | | 2011 | |
236 Wytheville, VA | | | — | | 647 | | 12,692 | | — | | 647 | | 12,692 | | 13,339 | | 2,037 | | 1996 | | 2010 | |
| | | | | | | | | | | | | | | | | | | | | | | | | | | | | | | | | | | | | | | | | |
School: | | |
| | | | | | | | | | | | | | | | | | | | | | | |
Range of Care Properties | | | — | | 2,733 | | 35,800 | | 5,374 | | 2,733 | | 41,174 | | 43,907 | | 10,889 | | | | | |
| | | | | | | | | | | | | | | | | | | | | | | |
| | | | | | | | | | | | | | | | | | | | | | | |
Other: | | Other: | | | | | | | | | | | | | | | | | | | |
Schools: | | Schools: | | | | | | | | | | | | | | | | | | | |
237 Eagan, MN | | — | | 1,110 | | 1,790 | | 22 | | 1,110 | | 1,812 | | 2,922 | | 115 | | 1994 | | 2010 | | | — | | 1,110 | | 1,789 | | 275 | | 1,110 | | 2,064 | | 3,174 | | 392 | | 1994 | | 2010 | |
159 Trenton, NJ | | — | | 100 | | 6,000 | | 3,170 | | 100 | | 9,170 | | 9,270 | | 3,872 | | 1998 | | 1998 | | | — | | 100 | | 6,000 | | 3,170 | | 100 | | 9,170 | | 9,270 | | 4,483 | | 1998 | | 1998 | |
| | | | | | | | | | | | | | | | | | | | | | | | | | | | | | | | | | | | | | | | | |
School | | — | | 1,210 | | 7,790 | | 3,192 | | 1,210 | | 10,982 | | 12,192 | | 3,987 | | | | | | |
| | | | | | | | | | | | | | | | | | | | | | | |
Schools | | | — | | 1,210 | | 7,789 | | 3,445 | | 1,210 | | 11,234 | | 12,444 | | 4,875 | | | | | |
| | | | | | | | | | | | | | | | | | | | | | | | | | | | | | | | | | | | | | | | | |
| | | | | | | | | | | | | | | | | | | | | | | |
Land: | | Land: | | | | | | | | | | | | | | | | | | | |
271 Howell, MI | | | — | | 420 | | — | | — | | 420 | | — | | 420 | | — | | N/A | | 2013 | |
273 Richmond, MI | | | — | | 380 | | — | | — | | 380 | | — | | 380 | | — | | N/A | | 2013 | |
274 Rochester Hills, MI | | | — | | 290 | | — | | — | | 290 | | — | | 290 | | — | | N/A | | 2013 | |
275 Yale, MI | | | — | | 73 | | — | | — | | 73 | | — | | 73 | | — | | N/A | | 2013 | |
| | | | | | | | | | | | | | | | | | | | | | | |
| | | | | | | | | | | | | | | | | | | | | | | |
Land | | | — | | 1,163 | | — | | — | | 1,163 | | — | | 1,163 | | — | | | | | |
| | | | | | | | | | | | | | | | | | | | | | | |
| | | | | | | | | | | | | | | | | | | | | | | |
Other | | | — | | 2,373 | | 7,789 | | 3,445 | | 2,373 | | 11,234 | | 13,607 | | 4,875 | | | | | |
| | | | | | | | | | | | | | | | | | | | | | | |
| | | | | | | | | | | | | | | | | | | | | | | |
Properties Under Development: | | | | | | | | | | | | | | | | | | | | | | |
252 Amarillo, TX | | — | | 844 | | — | | 50 | | 844 | | 50 | | 894 | | — | | N/A | | 2011 | | |
268 Littleton, CO | | | — | | 1,200 | | — | | 2,170 | | 1,200 | | 2,170 | | 3,370 | | — | | N/A | | 2013 | |
269 Aurora, CO | | | — | | 850 | | — | | 655 | | 850 | | 655 | | 1,505 | | — | | N/A | | 2013 | |
276 Westminster, CO | | | — | | 1,425 | | — | | 1,015 | | 1,425 | | 1,015 | | 2,440 | | — | | N/A | | 2013 | |
268 Coldspring, KY | | | — | | 2,050 | | 2,688 | | 5,893 | | 2,050 | | 8,581 | | 10,631 | | — | | N/A | | 2012 | |
267 Frisco, TX | | | — | | 1,000 | | — | | 2,486 | | 1,000 | | 2,486 | | 3,486 | | — | | N/A | | 2012 | |
| | | | | | | | | | | | | | | | | | | | | | | | | | | | | | | | | | | | | | | | | |
| | | | | | | | | | | | | | | | | | | | | | | |
Properties Under Development | | — | | 844 | | — | | 50 | | 844 | | 50 | | 894 | | — | | | | | | | — | | 6,525 | | 2,688 | | 12,219 | | 6,525 | | 14,907 | | 21,432 | | — | | | | | |
| | | | | | | | | | | | | | | | | | | | | | | | | | | | | | | | | | | | | | | | | |
| | | | | | | | | | | | | | | | | | | | | | | |
| | $ | 3,200 | | $ | 57,426 | | $ | 618,908 | | $ | 48,697 | | $ | 57,426 | | $ | 667,605 | | $ | 725,031 | | $ | 178,196 | | | | | | | $ | 2,035 | | $ | 80,993 | | $ | 771,649 | | $ | 84,975 | | $ | 80,993 | | $ | 856,624 | | $ | 937,617 | (4) | $ | 218,700 | | | | | |
| | | | | | | | | | | | | | | | | | | | | | | | | | | | | | | | | | | | | | | | | |
| | | | | | | | | | | | | | | | | | | | | | | |
| | | | | | | | | | | | | | | | | | | | | | | |
| | | | | | | | | | | | | | | | | | | | | | | |
- (1)
Single note backed by five facilities in Washington.
(2)- Depreciation is computed principally by the straight-line method for financial reporting purposes which generally range of a life from
75 to 1015 years for furniture and equipment, 35 to 4045 years for buildings, 10 to 20 years for building improvements and the respective lease term for acquired lease intangibles.
(3)(2)- An impairment charge totaling $4,190 was taken against 4 facilities based on the Company's estimate of the excess carrying value over the fair value of assets to be held and used, and the carrying value over the fair value less cost to sell in instances where management has determined that the company will dispose of the property.
- (3)
- Single note backed by five facilities in Washington.
- (4)
- As of December 31, 2013, our aggregate cost for Federal income tax purposes was $954,795.
LTC PROPERTIES, INC.
SCHEDULE III
REAL ESTATE AND ACCUMULATED DEPRECIATION (Continued)
(in thousands)
Activity for the years ended December 31, 2011, 20102013, 2012 and 20092011 is as follows:
|
| | For the Year Ended December 31, | | | For the Year Ended December 31, | |
|---|
| | 2011 | | 2010 | | 2009 | | | 2013 | | 2012 | | 2011 | |
|---|
Reconciliation of real estate: | | | | | | | | |
Carrying cost: | | | | | | | | |
Balance at beginning of period | | $ | 615,666 | | $ | 519,460 | | $ | 502,617 | | | $ | 900,095 | | $ | 725,031 | | $ | 615,666 | |
Acquisitions | | 106,135 | | 94,250 | | 13,000 | | | 19,040 | | 166,750 | | 106,135 | |
Improvements | | 3,230 | | 5,941 | | 3,843 | | | 32,008 | | 11,219 | | 3,230 | |
Conversion of mortgage loans into owned properties | | — | | 2,900 | | — | | | — | | — | | — | |
Impairment charges | | — | | — | | — | | | — | | — | | — | |
Cost of real estate sold | | — | | (6,885 | ) | | — | | | (13,526 | ) | | (2,905 | ) | | — | |
| | | | | | | | | | | | | | | |
| | | | | | | | | |
Ending balance | | $ | 725,031 | | $ | 615,666 | | $ | 519,460 | | | $ | 937,617 | | $ | 900,095 | | $ | 725,031 | |
| | | | | | | | | |
| | | | | | | | | |
| | | | | | | | | |
| | | | | | | | | | | | | | | |
Accumulated depreciation: | | | | | | | | |
Balance at beginning of period | | $ | 158,709 | | $ | 145,180 | | $ | 130,475 | | | $ | 198,548 | | $ | 178,196 | | $ | 158,709 | |
Depreciation Expense | | 19,487 | | 16,016 | | 14,705 | | | 24,568 | | 22,002 | | 19,487 | |
Conversion of mortgage loans into owned properties | | — | | — | | — | | | — | | — | | — | |
Impairment charges | | — | | — | | — | | | — | | — | | — | |
Cost of real estate sold | | — | | (2,487 | ) | | — | | | (4,416 | ) | | (1,650 | ) | | — | |
| | | | | | | | | | | | | | | |
| | | | | | | | | |
Ending balance | | $ | 178,196 | | $ | 158,709 | | $ | 145,180 | | | $ | 218,700 | | $ | 198,548 | | $ | 178,196 | |
| | | | | | | | | | | | | | | |
| | | | | | | | | |
| | | | | | | | | |
| | | | | | | | | |
LTC PROPERTIES, INC.
SCHEDULE IV
MORTGAGE LOANS ON REAL ESTATE
(in thousands)
| | | | | | | | | | | | | | | | | | | | | | | | | | |
| |
| |
| |
| |
| |
| |
| |
| |
| | Principal
Amount of
Loans
Subject to
Delinquent
Principal or
Interest | |
|---|
| | (Unaudited)
Number of | |
| |
| |
| |
| |
| | Carrying
Amount of
Mortgages
December 31,
2011 | |
|---|
| |
| |
| |
| | Current
Monthly
Debt
Service | |
| |
|---|
| |
| | Final
Maturity Date | | Balloon
Amount(2) | | Face
Amount of
Mortgages | |
|---|
State | | Properties | | Units/Beds(3) | | Interest Rate(1) | |
|---|
TX | | | 6 | | | 108 | | 9.95% | | 2018 | | $ | 5,095 | | $ | 66 | | $ | 6,800 | | $ | 6,380 | | $ | — | |
FL | | | 3 | | | 256 | | 11.70% | | 2014 | | | 6,061 | | | 71 | | | 6,850 | | | 6,377 | | | — | |
TX | | | 1 | | | 230 | | 10.35% | | 2017 | | | 2,972 | | | 39 | | | 4,000 | | | 3,683 | | | — | |
CA | | | 1 | | | 173 | | 11.25% | | 2015 | | | 2,232 | | | 48 | | | 4,700 | | | 3,094 | | | — | |
MO | | | 1 | | | 100 | | 10.98% | | 2018 | | | 1,869 | | | 39 | | | 1,500 | | | 3,019 | | | — | |
NE | | | 1 | | | 47 | | 11.44% | | 2013 | | | 2,716 | | | 31 | | | 3,243 | | | 2,823 | | | — | |
NE | | | 1 | | | 44 | | 11.44% | | 2013 | | | 2,537 | | | 29 | | | 3,036 | | | 2,637 | | | — | |
FL | | | 1 | | | 90 | | 14.63% | | 2012 | | | 2,221 | | | 42 | | | 3,510 | | | 2,305 | | | — | |
MT | | | 1 | | | 34 | | 14.23% | | 2013 | | | 2,053 | | | 28 | | | 2,346 | | | 2,115 | | | — | |
NE | | | 1 | | | 44 | | 11.67% | | 2013 | | | 2,005 | | | 24 | | | 2,700 | | | 2,093 | | | — | |
IA | | | 1 | | | 44 | | 11.44% | | 2013 | | | 1,998 | | | 23 | | | 2,400 | | | 2,074 | | | — | |
TX | | | 1 | | | 117 | | 10.35% | | 2017 | | | 1,634 | | | 22 | | | 2,200 | | | 2,025 | | | — | |
SD | | | 1 | | | 34 | | 11.44% | | 2013 | | | 1,954 | | | 22 | | | 2,346 | | | 2,028 | | | — | |
Various | | | 16 | | | 1,602 | | 10.05%-13.38% | | 2012-2019 | | | 4,207 | | | 263 | | | 25,897 | | | 12,428 | | | — | |
| | | | | | | | | | | | | | | | | | | | |
| | | 36 | (4) | | 2,923 | | | | | | $ | 39,554 | | $ | 747 | | $ | 71,528 | | $ | 53,081 | | $ | — | |
| | | | | | | | | | | | | | | | | | | | |
| | | | | | | | | | | | | | | | | | | | | | | | | | |
| |
| |
| |
| |
| |
| |
| |
| |
| | Principal
Amount of
Loans
Subject to
Delinquent
Principal or
Interest | |
|---|
| | (Unaudited)
Number of | |
| |
| |
| |
| |
| | Carrying
Amount of
Mortgages
December 31,
2013 | |
|---|
| |
| |
| |
| | Current
Monthly
Debt
Service | |
| |
|---|
| |
| | Final
Maturity Date | | Balloon
Amount(2) | | Face
Amount of
Mortgages | |
|---|
State | | Properties | | Units/Beds(3) | | Interest Rate(1) | |
|---|
FL | | | 3 | | | 269 | | 11.90% | | 2014 | | $ | 6,061 | | $ | 72 | | $ | 6,850 | | $ | 6,166 | | $ | — | |
MI | | | 15 | | | 2,092 | | 9.53% | | 2043 | | | 97,387 | | | 988 | | | 124,387 | | | 124,387 | | | — | |
TX | | | 6 | | | 100 | | 10.25% | | 2018 | | | 5,095 | | | 67 | | | 6,800 | | | 6,067 | | | — | |
PA | | | 1 | | | 70 | | 7.00% | | 2014 | | | 5,100 | | | 30 | | | 5,100 | | | 5,100 | | | — | |
WI | | | 1 | | | 106 | | 10.10% | | 2022 | | | — | | | 63 | | | 2,619 | | | 7,590 | | | — | |
Various | | | 15 | | | 1,700 | | 10.60%-13.63% | | 2014-2019 | | | 10,648 | | | 317 | | | 27,715 | | | 16,134 | | | — | |
| | | | | | | | | | | | | | | | | | | | |
| | | | | | | | | | | | | | | | | | | | | | | | | | | |
| | | 41 | (4) | | 4,337 | | | | | | $ | 124,291 | | $ | 1,537 | | $ | 173,471 | | $ | 165,444 | | $ | — | |
| | | | | | | | | | | | | | | | | | | | |
| | | | | | | | | | | | | | | | | | | | | | | | | | | |
| | | | | | | | | | | | | | | | | | | | | | | | | | | |
| | | | | | | | | | | | | | | | | | | | |
- (1)
- Represents current stated interest rate. Generally, the loans have 25-year amortization with principal and interest payable at varying amounts over the life to maturity with annual interest adjustments through specified fixed rate increases effective either on the first anniversary or calendar year of the loan.
- (2)
- Balloon payment is due upon maturity.
- (3)
- This number is based upon unit/bed counts shown on operating licenses provided to us by lessees/borrowers or units/beds as stipulated by lease/mortgage documents. We have found during the years that these numbers often differ, usually not materially, from units/beds in operation at any point in time. The differences are caused by such things as operators converting a patient/resident room for alternative uses, such as offices or storage, or converting a multi-patient room/unit into a single patient room/unit. We monitor our properties on a routine basis through site visits and reviews of current licenses. In an instance where such change would cause a de-licensing of beds or in our opinion impact the value of the property, we would take action against the lessee/borrower to preserve the value of the property/collateral.
- (4)
- Includes
3020 first-lien mortgage loans as follows:
| | |
Number of Loans | | Original loan amounts |
|---|
1612
| | $ 500 - $ 2,000$2,000 |
72
| | $2,001 - $ 3,000$3,000 |
41
| | $3,001 - $ 4,000$4,000 |
1 | | $4,001 - $ 5,000$5,000 |
01
| | $5,001 - $ 6,000$6,000 |
2 | | $6,001 - $ 7,000$7,000 |
01
| | $7,001 - $10,000+ |
LTC PROPERTIES, INC.
SCHEDULE IV
MORTGAGE LOANS ON REAL ESTATE (Continued)
(in thousands)
Activity for the years ended December 31, 2011, 20102013, 2012 and 20092011 is as follows:
| | | | |
Balance—December 31, 2008 | | $ | 77,541 | |
New Mortgage Loans | | | — | |
Other Additions | | | 280 | |
Amortization of mortgage premium | | | (151 | ) |
Collections of principal | | | (7,843 | ) |
Foreclosures | | | — | |
Loan Loss Reserve | | | 56 | |
Other Deductions | | | — | |
| | | | |
Balance—December 31, 2009 | | | 69,883 | |
New Mortgage Loans | | | 1,622 | |
Other Additions | | | 72 | |
Amortization of mortgage premium | | | (121 | ) |
Collections of principal | | | (8,403 | ) |
Foreclosures | | | (2,900 | ) |
Loan Loss Reserve | | | 108 | |
Other Deductions | | | (1,235 | ) |
| | | | |
Balance—December 31, 2010 | | | 59,026 | |
New Mortgage Loans | | | — | |
Other Additions | | | — | |
Amortization of mortgage premium | | | (38 | ) |
Collections of principal | | | (5,967 | ) |
Foreclosures | | | — | |
Loan Loss Reserve | | | 60 | |
Other Deductions | | | — | |
| | | | |
Balance—December 31, 2011 | | $ | 53,081 | |
| | | | |
| | | | |
Balance—December 31, 2010 | | $ | 59,026 | |
New mortgage loans | | | — | |
Other additions | | | — | |
Amortization of mortgage premium | | | (38 | ) |
Collections of principal | | | (5,967 | ) |
Foreclosures | | | — | |
Loan loss reserve | | | 60 | |
Other deductions | | | — | |
| | | | |
| | | | | |
Balance—December 31, 2011 | | | 53,081 | |
New mortgage loans | | | 7,719 | |
Other additions | | | — | |
Amortization of mortgage premium | | | (7 | ) |
Collections of principal | | | (21,633 | ) |
Foreclosures | | | — | |
Loan loss reserve | | | 139 | |
Other deductions | | | — | |
| | | | |
| | | | | |
Balance—December 31, 2012 | | | 39,299 | |
New mortgage loans | | | 124,387 | |
Other additions | | | 4,971 | |
Amortization of mortgage premium | | | (6 | ) |
Collections of principal | | | (1,933 | ) |
Foreclosures | | | — | |
Loan loss reserve | | | (1,274 | ) |
Other deductions | | | — | |
| | | | |
| | | | | |
Balance—December 31, 2013 | | $ | 165,444 | |
| | | | |
| | | | | |
| | | | | |
| | | | |
Item 9. CHANGES IN AND DISAGREEMENTS WITH ACCOUNTANTS ON ACCOUNTING AND FINANCIAL DISCLOSURE
None.
Item 9A. CONTROLS AND PROCEDURES
Disclosure Controls and Procedures.
Our management, with the participation of our Chief Executive Officer and Chief Financial Officer, evaluated the effectiveness of our disclosure controls and procedures (as such term is defined in Rules 13a-15(e) and 15d-15(e) under the Securities and Exchange Act of 1934, as amended) as of the end of the period covered by this report. Based on such evaluation our Chief Executive Officer and Chief Financial Officer concluded that, as of the end of the period covered by this report our disclosure controls and procedures were effective.
Internal Control over Financial Reporting.
The Management Report on Internal Control over Financial Reporting and the Report of Independent Registered Public Accounting Firm thereon are set forth on pages 92 and 93, respectively.the following pages.
There has been no change in our internal control over financial reporting during the period covered by this report that has materially affected, or is reasonably likely to materially affect, our internal control over financial reporting.
Item 9B. OTHER INFORMATION
None.
MANAGEMENT REPORT ON INTERNAL CONTROL OVER FINANCIAL REPORTING
Our management is responsible for establishing and maintaining adequate internal control over financial reporting. Internal control over financial reporting is defined in Rule 13a-15(f) or 15d-15(f) promulgated under the Securities Exchange Act of 1934, as amended, as a process designed by, or under the supervision of, the issuer's principal executive and principal financial officers and effected by the issuer's board of directors, management and other personnel, to provide reasonable assurance regarding the reliability of financial reporting and the preparation of financial statements for external purposes in accordance with generally accepted accounting principles and includes those policies and procedures that:
- •
- Pertain to the maintenance of records that in reasonable detail accurately and fairly reflect the transactions and dispositions of the assets of the issuer;
- •
- Provide reasonable assurance that transactions are recorded as necessary to permit preparation of financial statements in accordance with generally accepted accounting principles, and that receipts and expenditures of the issuer are being made only in accordance with authorizations of management and directors of the issuer; and
- •
- Provide reasonable assurance regarding prevention or timely detection of unauthorized acquisition, use or disposition of the issuer's assets that could have a material effect on the financial statements.
Because of its inherent limitations, internal control over financial reporting may not prevent or detect material misstatements on a timely basis. Projections of any evaluation of effectiveness to future periods are subject to the risk that controls may become inadequate because of changes in conditions, or that the degree of compliance with the policies or procedures may deteriorate.
Our management, with the participation of our Chief Executive Officer and Chief Financial Officer, evaluated the effectiveness of our internal control over financial reporting as of December 31, 2011.2013. In making this assessment, management used the criteria set forth by the Committee of Sponsoring Organizations of the Treadway Commission (or COSO) in Internal Control-IntegratedControl—Integrated Framework. Based on this assessment, our management concluded that, as of the end of the fiscal year ended December 31, 2011,2012, our internal control over financial reporting was effective.
The effectiveness of our internal control over financial reporting as of December 31, 2011,2013, has been audited by Ernst &Young LLP, independent registered public accounting firm. Ernst & Young LLP's report on our internal control over financial reporting appears on page 93.the following page.
Report of Independent Registered Public Accounting Firm
To the Board of Directors and Stockholders of LTC Properties, Inc.
We have audited LTC Properties, Inc.'s (the "Company") internal control over financial reporting as of December 31, 2011,2013, based on criteria established in Internal Control—Integrated Framework issued by the Committee of Sponsoring Organizations of the Treadway Commission (1992 framework) (the COSO criteria). LTC Properties, Inc.'sThe Company's management is responsible for maintaining effective internal control over financial reporting, and for its assessment of the effectiveness of internal control over financial reporting included in the accompanying Management'sManagement Report on Internal Control over Financial Reporting. Our responsibility is to express an opinion on the company'sCompany's internal control over financial reporting based on our audit.
We conducted our audit in accordance with the standards of the Public Company Accounting Oversight Board (United States). Those standards require that we plan and perform the audit to obtain reasonable assurance about whether effective internal control over financial reporting was maintained in all material respects. Our audit included obtaining an understanding of internal control over financial reporting, assessing the risk that a material weakness exists, testing and evaluating the design and operating effectiveness of internal control based on the assessed risk, and performing such other procedures as we considered necessary in the circumstances. We believe that our audit provides a reasonable basis for our opinion.
A company's internal control over financial reporting is a process designed to provide reasonable assurance regarding the reliability of financial reporting and the preparation of financial statements for external purposes in accordance with generally accepted accounting principles. A company's internal control over financial reporting includes those policies and procedures that (1) pertain to the maintenance of records that, in reasonable detail, accurately and fairly reflect the transactions and dispositions of the assets of the company; (2) provide reasonable assurance that transactions are recorded as necessary to permit preparation of financial statements in accordance with generally accepted accounting principles, and that receipts and expenditures of the company are being made only in accordance with authorizations of management and directors of the company; and (3) provide reasonable assurance regarding prevention or timely detection of unauthorized acquisition, use or disposition of the company's assets that could have a material effect on the financial statements.
Because of its inherent limitations, internal control over financial reporting may not prevent or detect misstatements. Also, projections of any evaluation of effectiveness to future periods are subject to the risk that controls may become inadequate because of changes in conditions, or that the degree of compliance with the policies or procedures may deteriorate.
In our opinion, LTC Properties, Inc. maintained, in all material respects, effective internal control over financial reporting as of December 31, 2011,2013, based on the COSO criteria.
We also have audited, in accordance with the standards of the Public Company Accounting Oversight Board (United States), the consolidated balance sheets of LTC Properties, Inc. as of December 31, 20112013 and 2010,2012, and the related consolidated statements of income, and comprehensive income, equity, and cash flows for each of the three years in the period ended December 31, 20112013 of LTC Properties, Inc. and our report dated February 27, 201220, 2014 expressed an unqualified opinion thereon.
| | |
|
|
/s/ Ernst & Young LLP |
Los Angeles, California
February 27, 201220, 2014 |
|
|
PART III
Item 10. DIRECTORS, EXECUTIVE OFFICERS AND CORPORATE GOVERNANCE
The information required by this item is incorporated by reference to our definitive proxy statement for the 20122014 Annual Meeting of Stockholders (to be filed with the Securities and Exchange Commission within 120 days of our December 31, 20112013 fiscal year end) under the headings "Proposal 1 Election of Directors," "Corporate Governance Principles and Board Matters," and "Executive Officers."
Item 11. EXECUTIVE COMPENSATION
The information required by this item is incorporated by reference to our definitive proxy statement for the 20122014 Annual Meeting of Stockholders (to be filed with the Securities and Exchange Commission within 120 days of our December 31, 20112013 fiscal year end) under the headings "Executive Compensation Discussion and Analysis," "Summary Compensation Table," "Director Compensation," and "Compensation Committee Report."
Item 12. SECURITY OWNERSHIP OF CERTAIN BENEFICIAL OWNERS AND MANAGEMENT AND RELATED STOCKHOLDER MATTERS
The information required by this item is incorporated by reference to our definitive proxy statement for the 20122014 Annual Meeting of Stockholders (to be filed with the Securities and Exchange Commission within 120 days of our December 31, 20112013 fiscal year end) under the heading "Security Ownership of Certain Beneficial Owners and Management and Related Stockholder Matters."
Item 13. CERTAIN RELATIONSHIPS AND RELATED TRANSACTIONS, AND DIRECTOR INDEPENDENCE
The information required by this item is incorporated by reference to our definitive proxy statement for the 20122014 Annual Meeting of Stockholders (to be filed with the Securities and Exchange Commission within 120 days of our December 31, 20112013 fiscal year end) under the heading "Certain Relationships and Related Transactions, and Director Independence."
Item 14. PRINCIPAL ACCOUNTANT FEES AND SERVICES
The information required by this item is incorporated by reference to our definitive proxy statement for the 20122014 Annual Meeting of Stockholders (to be filed with the Securities and Exchange Commission within 120 days of our December 31, 20112013 fiscal year end) under the heading "Independent Registered Public Accounting Firm Fees and Services."
PART IV
Item 15. EXHIBITS AND FINANCIAL STATEMENT SCHEDULES
The following documents are filed as a part of this report:
Financial Statements
| | | | | |
| |
| | Page |
|---|
Financial Statements | | |
Report of Independent Registered Public Accounting Firm
| | 51
53 |
| Consolidated Balance Sheets as of December 31, 20112013 and 2010
2012 | | 52
54 |
| Consolidated Statements of Income for the years ended December 31, 2013, 2012 and 2011 | |
55 |
Consolidated Statements of Comprehensive Income for the years ended December 31, 2011, 20102013, 2012 and 2009
2011 | | 53
56 |
| Consolidated Statements of Equity for the years ended December 31, 2011, 20102013, 2012 and 2009
2011 | | 54
57 |
| Consolidated Statements of Cash Flows for the years ended December 31, 2011, 20102013, 2012 and 2009
2011 | | 55
58 |
| Notes to Consolidated Financial Statements
| | 56
59 |
| Financial Statement Schedules | |
|
| II. | | Valuation and Qualifying Accounts | |
8386 |
| III. | | Real Estate and Accumulated Depreciation | | 84
87 |
| IV. | | Mortgage Loans on Real Estate | | 89
92 |
All other schedules are omitted because they are not applicable or not present in amounts sufficient to require submission of the schedule or the required information is shown in the Consolidated Financial Statements and the Notes thereto.
Exhibits
The exhibits required by Item 601 of Regulation S-K are set forth in the index to exhibits on page 96 of this annual report.
LTC PROPERTIES, INC.
INDEX TO EXHIBITS
| | |
Exhibit
Number | | Description |
|---|
| 3.1 | | LTC Properties, Inc. Articles of Restatement (incorporated by reference to Exhibit 3.13.2 to LTC Properties Inc.'s Current Report on Form 10-Q for the quarter ended June 30, 2009)8-K (File No. 1-11314) dated September 14, 2012) |
3.2 |
|
Bylaws of LTC Properties, Inc., as amended and restated August 3, 2009 (incorporated by reference to Exhibit 3.2 to LTC Properties Inc.'s Form 10-Q (File No. 1-11314) for the quarter ended June 30, 2009) |
4.1 |
|
Amended and Restated Agreement of Limited Partnership of LTC Partners IX, L.P. and Exchange Rights Agreement dated February 11, 1998 (incorporated by reference to Exhibit 4.8 to LTC Properties, Inc.'s Registration Statement on Form S-3 (File No. 333-115991) filed on May 28, 2004) |
4.2 |
|
Notice Of Redemption To the Holders of LTC Properties, Inc. 8.0% Series F Cumulative Preferred Stock (incorporated by reference to Exhibit 99.2 to LTC Properties Inc.'s Current Report on Form 8-K dated March 24, 2011) |
10.1 |
|
Second Amended and Restated Credit Agreement dated July 17, 2008 among LTC Properties, Inc. and Bank of Montreal, Chicago Branch is the Administrative Agent, BMO Capital Markets, as Co-Lead Arranger and Book Manager, Key Bank National Association as Co-Lead Arranger and Syndication Agent (incorporated by reference to Exhibit 10.1 to LTC Properties, Inc.'s Current Report on Form 8-K filed July 18, 2008) |
10.2 |
|
Commitment Amount Increase Request dated as of March 15, 2010 (incorporated by reference to Exhibit 10.2 to LTC Properties, Inc.'s Current Report on Form 8-K filed March 17, 2010) |
10.3 |
|
First Amendment to the Second Amended and Restated Credit Agreement, dated October 29, 2010 (incorporated by reference to Exhibit 10.1 to LTC Properties Inc.'s Current Report on Form 8-K dated November 1, 2010) |
10.4 |
|
Credit Agreement dated as of April 18, 2011 among LTC Properties, Inc. and Bank of Montreal, Chicago Branch as Administrative Agent, BMO Capital Markets, as Co-Lead Arranger and Joint Book Runner, and Key Bank National Association, as Syndication Agent, and KeyBanc Capital Markets, Inc., as Co-Lead Arranger and Joint Book Runner (incorporated by reference to Exhibit 10.1 to LTC Properties Inc.'s Current Report on Form 8-K (File No. 1-11314) dated April 19, 2011) |
10.510.2 |
|
Amended and Restated Equity DistributionFirst Amendment to Credit Agreement dated October 26, 2010, betweenas of May 25, 2012 among LTC Properties, Inc. and the Guarantors party thereto and Bank of Montreal, Chicago Branch as Administrative Agent, BMO Capital Markets, as Co-Lead Arranger and Joint Book Runner, and Key Bank National Association, as Syndication Agent, and KeyBanc Capital Markets, Inc., as Co-Lead Arranger and Joint Book Runner (incorporated by reference to Exhibit 1.110.1 to LTC Properties Inc.'s Current Report on Form 8-K dated October 26, 2010)(File No. 1-11314) May 30, 2012) |
10.610.3 |
|
Equity Distribution Agreement, dated October 26, 2010, between LTC Properties, Inc.Second Amended and BMO Capital Markets Corp. (incorporated by reference to Exhibit 1.2 to LTC Properties Inc.'s Current Report on Form 8-K dated October 26, 2010) |
10.7 |
|
Restated Note Purchase and Private Shelf Agreement between LTC Properties, Inc. and Prudential Investment Management, Inc. dated July 14, 2010October 30, 2013 (incorporated by reference to Exhibit 10.1 to LTC Properties Inc.'s Quarterly Report on Form 10-Q for the quarter ended JuneSeptember 30, 2010)2013) |
| | |
Exhibit
Number | | Description |
|---|
10.8 | | Amendment and Modification to Note Purchase and Private Shelf Agreement dated May 5, 2011 (incorporated by reference to Exhibit 10.1 to LTC Properties Inc.'s Current Report on Form 8-K dated May 5, 2011) |
10.910.4 |
|
Amendment and Modification to Note Purchase and Private Shelf Agreement dated July 8, 2011 between LTC Properties, Inc. and Prudential Investment Management, Inc. dated July 8, 201119, 2012 (incorporated by reference to Exhibit 10.3 to LTC Properties, Inc.'s Quarterly Report on Form 10-Q (File No. 1-11314) for the quarter ended June 30, 2011)2012) |
10.10 |
|
Amended and Restated Note Purchase and Private Shelf Agreement dated October 19, 2011 (incorporated by reference to Exhibit 10.1 to LTC Properties Inc.'s Current Report on Form 8-K dated October 19, 2011) |
10.11+ |
|
Second Amendment to 2007 Amended and Restated Employment Agreement of Andre Dimitriadis, dated July 1, 2007 (incorporated by reference to Exhibit 10.3 to LTC Properties, Inc.'s Quarterly Report on Form 10-Q for the quarter ended June 30, 2007) |
10.12+10.5+ |
|
Third Amendment to the 2007 Amended and Restated Employment Agreement of Wendy Simpson dated December 4, 2007 (incorporated by reference to Exhibit 10.1 to LTC Properties, Inc.'s Current Report on Form 8-K (File No. 1-11314) dated December 5, 2007) |
10.13+10.6+ |
|
Third Amended and Restated Employment Agreement of Pamela Kessler, effective as of December 4, 2007 (incorporated by reference to Exhibit 10.13 to LTC Properties, Inc.'s Annual Report on Form 10-K (File No. 1-11314) for the year ended December 31, 2007) |
10.14+10.7+ |
|
Second Amended and Restated Employment Agreement of Clint Malin, effective as of December 4, 2007 (incorporated by reference to Exhibit 10.15 to LTC Properties, Inc.'s Annual Report on Form 10-K (File No. 1-11314) for the year ended December 31, 2007) |
10.15+10.8+ |
|
Amended and Restated Employment Agreement of T. Andrew Stokes, effective as of December 4, 2007 (incorporated by reference to Exhibit 10.16 to LTC Properties, Inc.'s Annual Report on Form 10-K (File No. 1-11314) for the year ended December 31, 2007) |
10.1610.9+ |
|
Employment Agreement of Caroline L. (Wong) Chikhale, effective as of June 10, 2008 |
10.10+ |
|
Second Amended and Restated Employment Agreement of Peter G. Lyew, effective as of December 4, 2007 |
10.11 |
|
The 2008 Equity Participation Plan (incorporated by reference to Exhibit 10.8 to LTC Properties, Inc.'s Annual Report on Form 10-K (File No. 1-11314) for the year ended December 31, 2009) |
10.17 |
| |
Exhibit
Number | | Description |
|---|
| 10.12 | | Form of Stock Option Agreement under the 2008 Equity Participation Plan (incorporated by reference to Exhibit 10.9 to LTC Properties, Inc.'s Annual Report on Form 10-K (File No. 1-11314) for the year ended December 31, 2009) |
10.1810.13 |
|
Form of Restricted Stock Agreement under the 2008 Equity Participation Plan (incorporated by reference to Exhibit 10.1010.1 to LTC Properties, Inc.'s AnnualQuarterly Report on Form 10-K10-Q (File No. 1-11314) for the yearquarter ended December 31, 2009)June 30, 2013) |
10.1910.14 |
|
Form of Indemnity Agreement dated as of July 30, 2009 between LTC Properties, Inc. and its Directors and Officers (incorporated by reference to Exhibit 10.1 to LTC Properties, Inc.'s Quarterly Report on Form 10-Q (File No. 1-11314) for the quarter ended June 30, 2009) |
12 |
|
Ratio of Earnings to Fixed Charges |
21 |
|
List of Subsidiaries |
23.1 |
|
Consent of Independent Registered Accounting Firm |
31.1 |
|
Certification of the Chief Executive Officer pursuant to Section 302 of the Sarbanes-Oxley Act of 2002 |
31.2 |
| |
Exhibit
Number | | Description |
|---|
31.2 | | Certification of the Chief Financial Officer pursuant to Section 302 of the Sarbanes-Oxley Act of 2002 |
32 |
|
Certifications pursuant to 18 U.S.C. Section 1350, as adopted pursuant to Section 906 of the Sarbanes-Oxley Act of 2002 |
101 |
|
The following materials from LTC Properties, Inc.'s Form Annual Report on 10-K for the fiscal year ended December 31, 2011,2013, formatted in eXtensible Business Reporting Language (XBRL): (i) Consolidated Balance Sheets; (ii) Consolidated Statements of Income and Comprehensive Income; (iii) Consolidated Statements of Equity; (iv) Consolidated Statements of Cash Flows; and (v) Notes to Consolidated Financial Statements*Statements |
- +
- Management contract or compensatory plan or arrangement in which an executive officer or director of the Company
participates.
*Pursuant to Rule 406T of Regulation S-T, the Interactive Data Files on Exhibit 101 hereto are deemed not filed or part of a registration statement or prospectus for purposes of Sections 11 or 12 of the Securities Act of 1933, as amended, are deemed not filed for purposes of Section 18 of the Securities and Exchange Act of 1934, as amended, and otherwise are not subject to liability under those sectionsparticipates
LTC PROPERTIES, INC.
SIGNATURES
Pursuant to the requirements of Section 13 or 15(d) of the Securities Exchange Act of 1934, the Registrant has duly caused this report to be signed on its behalf by the undersigned, thereunto duly authorized.
| | | | |
| | | LTC PROPERTIES, INC.
Registrant |
Dated: February 27, 201220, 2014 |
|
|
|
|
| | | By: | | /s/ PAMELA SHELLEY-KESSLER
Pamela Shelley-Kessler |
| | | | PAMELA SHELLEY-KESSLER
Executive Vice President, Chief Financial
Officer
and Corporate Secretary
(Principal Financial Officer) |
POWER OF ATTORNEY
Pursuant to the requirements of the Securities Exchange Act of 1934, this report has been signed below by the following persons on behalf of the Registrant and in the capacities and on the dates indicated.
| | | | | | |
/s/ WENDY L. SIMPSON
WendyWENDY L. SimpsonSIMPSON | | Chairman, Chief Executive Officer,
President and Director
(Principal Executive Officer) | | | February 27, 2012 | 20, 2014 |
/s/ PAMELA SHELLEY-KESSLER
Pamela Shelley-KesslerPAMELA SHELLEY-KESSLER |
|
Executive Vice President,
Chief Financial
Officer
and Corporate Secretary
(Principal Financial Officer and Principal
Accounting Officer) |
|
|
February 27, 201220, 2014 |
|
/s/ ANDRE C. DIMITRIADIS
Andre C. Dimitriadis |
|
Executive Chairman of the Board and Director |
|
|
February 27, 2012 |
|
/s/ BOYD HENDRICKSON
Boyd HendricksonBOYD HENDRICKSON |
|
Director |
|
|
February 27, 201220, 2014 |
|
/s/ DEVRA G. SHAPIRO
DevraDEVRA G. ShapiroSHAPIRO |
|
Director |
|
|
February 27, 201220, 2014 |
|
/s/ EDMUND C. KING
EdmundEDMUND C. KingKING |
|
Director |
|
|
February 27, 201220, 2014 |
|
/s/ TIMOTHY J. TRICHE
Timothy TricheTIMOTHY TRICHE |
|
Director |
|
|
February 27, 201220, 2014 |
|