| [X] | Annual Report Pursuant to Section 13 or 15(d) of the Securities Exchange Act of 1934 | |||
| For the fiscal year-endedDecember 31, | ||||
| or | ||||
| [ ] | Transition report pursuant to Section 13 or 15(d) of the Securities Exchange Act of 1934 | |||
For the transition period fromto | ||||
Act. $1,226,970,577. First Midwest Bancorp, Inc. (the In the normal course of business, the Company is signed and publicly announced. The Company's ability to engage in certain merger or acquisition transactions, whether or not any regulatory approval is required, will depend on the bank regulators' views at the time as to the capital levels, quality of management, and overall condition of the Company, in addition to their assessment of a variety of other factors. subsidiaries: Total assets Total deposits Banking offices Full-time equivalent employees 2014. Company guarantees payments of distributions on the trust-preferred securities and payments on redemption of the trust-preferred securities on a limited basis. assessing performance. Our Business activities. at December 31, 2014. The 1934, as amended (the "Exchange Act"). holding company to file an annual report of its operations and such additional information as the Federal Reserve may require. A bank holding company and its subsidiaries are subject to examination by the Federal Reserve. reputational consequences, including causing applicable bank regulatory authorities not to approve merger or acquisition transactions when regulatory approval is required or to prohibit such transactions even if approval is not required. consequences for the institution, including causing applicable bank regulatory authorities not to approve merger or acquisition transactions when regulatory approval is required or to prohibit such transactions even if approval is not required. Company or Bank reaches that size. the Company. The Bank is Act, and applicable state laws. prohibit such transactions even if approval is not required. product. Requirements Capital is classified in one of the following Tier 1 capital to risk-weighted assets Total capital to risk-weighted assets CET1 to risk-weighted assets Tier 1 capital to risk-weighted assets Total capital to risk-weighted assets Leverage ratio adequately capitalized. The Basel III its subsidiaries. anywhere in the country, subject to restrictions imposed on those other banks and thrifts, certain safety and soundness considerations, and prior notification to the IDFPR and the FDIC. Due to the current financial and economic environment, the Federal Reserve indicated that bank holding companies should carefully review their dividend policy and discourage payment ratios that are at maximum allowable levels unless both asset quality and capital are very strong. Employee Incentive Compensation soundness principles. Under these rules, financial organizations must review their compensation programs to and Regulation by e-mail at Company and other actions. business, financial condition, and results of operations. The Company's lending activities are subject to strict regulations. financial obligations is a function of its balance sheet structure, its ability to liquidate assets, and its access to alternative sources of funds. The Company seeks to ensure its funding needs are met by maintaining Standard & Poor's Rating Group, a division of the McGraw-Hill Companies, Inc. Moody's Investor Services, Inc. Fitch, Inc. Operational Risks discussion. relationship management, general ledger, deposit, loan, or other value hierarchies. Third-party sources also use assumptions, judgments, and estimates in determining securities values, and different third parties use different methodologies or provide different prices for similar securities. In addition, the nature of the business of the third party source that is valuing the securities at any given time could impact the valuation of the securities. The Company's ability to compete successfully depends on a number of factors, including: that the Company will not experience an adverse effect, which may be material, on its ability to access capital and on the Company's business, financial condition, and results of operations. environmental review before initiating any foreclosure action on real property, these reviews may not be sufficient to detect all potential environmental hazards. The remediation costs and any other financial liabilities associated with an environmental hazard could have a material adverse effect on the Company's business, financial condition, results of operations, and liquidity. Changes to statutes, regulations, Act, including the Volcker Rule. adjustment" to the interchange fee is available to those issuers that comply with certain standards outlined by the Federal Reserve. The Company and its subsidiaries may not be able to realize the benefit of deferred tax assets. Currently, there are certain For a detailed discussion on current legal proceedings, see Item 3, "Legal Proceedings," and Note 21 of "Notes to the Consolidated Financial Statements" in Item 8 of this Form 10-K. In addition, from time to time, banking regulators may restrict the Company from making acquisitions. See "History" and "Supervision and Regulation" in Item 1, "Business," of this Form 10-K for additional detail and further discussion of these matters. Failure to comply with the terms of loss share agreements with the FDIC may result in The FDIC Agreements have specific and detailed compliance, servicing, notification, and reporting requirements. be inaccurate. The Company's Restated Certificate of Incorporation, Amended and Restated By-laws, and Amended and Restated Rights Agreement, as well as certain banking laws, may have an anti-takeover effect. Market price of Common Stock High Low Quarter-end Cash dividends declared per common share Dividend yield at quarter-end (1) Book value per common share at quarter-end First Midwest S&P 500 S&P SmallCap 600 Banks October 1 – October 31, 2011 November 1 – November 30, 2011 December 1 – December 31, 2011 Total Operating Results (Amounts in thousands, except per share data) Operating Results (Amounts in thousands, except per share data) Net income (loss) Net income (loss) applicable to common shares Per Common Share Data Basic earnings (loss) per common share Diluted earnings (loss) per common share Common dividends declared Book value at year end Market price at year end Performance Ratios Return on average common equity Return on average assets Net interest margin — tax-equivalent Dividend payout ratio Average equity to average assets ratio Balance Sheet Highlights (Amounts in thousands) Balance Sheet Highlights (Amounts in thousands) Total assets Total loans, excluding covered loans Total loans, including covered loans Deposits Senior and subordinated debt Long-term portion of Federal Home Loan Bank advances Stockholders' equity Financial Ratios Allowance for credit losses as a percent of loans, excluding covered loans Total capital to risk-weighted assets Tier 1 capital to risk-weighted assets Tier 1 leverage to average assets Tangible common equity to tangible assets Operating Results Interest income Interest expense Net interest income Fee-based revenues Other noninterest income Noninterest expense, excluding losses realized on OREO, integration costs associated with FDIC-assisted transactions, severance-related costs, and an FDIC special assessment (1) Pre-tax, pre-provision operating earnings (2) Provision for loan losses Gains on securities sales, net Securities impairment losses Gains on FDIC-assisted transactions Gains on early extinguishment of debt Gain on acquisition of deposits Write-downs of OREO (1) Losses on sales of OREO, net (1) Integration costs associated with FDIC-assisted transactions (1) Severance-related costs (1) FDIC special deposit insurance assessment (1) Income (loss) before income tax (expense) benefit Income tax (expense) benefit Net income (loss) Preferred dividends and accretion on preferred stock Net (income) loss applicable to non-vested restricted shares Net income (loss) applicable to common shares Diluted earnings (loss) per common share Performance Ratios Return on average common equity Return on average assets Net interest margin – tax equivalent Efficiency ratio Balance Sheet Highlights Total assets Total loans, excluding covered loans Total loans, including covered loans Total deposits Transactional deposits Loans, excluding covered loans, to deposits ratio Transactional deposits to total deposits Asset Quality Highlights (1) Non-accrual loans 90 days or more past due loans (still accruing interest) Total non-performing loans Troubled debt restructurings ("TDRs") (still accruing interest) Other real estate owned Total non-performing assets 30-89 days past due loans Allowance for credit losses Allowance for credit losses as a percent of loans thousands, except per share data) 2013 non-deductible write-down of the cash surrender values ("CSV") of certain BOLI policies. Excluding these transactions, 2013 earnings per share was $0.90. Performance Overview for 2012 2012. Assets: Federal funds sold and other short-term investments Securities: Trading - taxable Investment securities - taxable Investment securities - nontaxable(1) Total securities FHLB and Federal Reserve Bank stock Loans, excluding covered loans(1)(2) Covered loans(3) Total loans Total interest-earning assets(1)(2) Cash and due from banks Allowance for credit losses Other assets Total assets Liabilities and Stockholders' Equity: Savings deposits NOW accounts Money market deposits Total interest-bearing transactional deposits Time deposits Total interest-bearing deposits Borrowed funds Senior and subordinated debt Total interest-bearing liabilities Demand deposits Other liabilities Stockholders' equity - common Stockholders' equity - preferred Total liabilities and stockholders' equity Net interest income/margin(1) Net interest income (GAAP) Tax-equivalent adjustment Tax equivalent net interest income Table 3 Federal funds sold and other short-term investments Securities: Trading – taxable Investment securities – taxable Investment securities – nontaxable (2) Total securities FHLB and Federal Reserve Bank stock Loans, excluding covered loans (2) Covered loans Total loans Total interest income (2) Savings deposits NOW accounts Money market deposits Total interest-bearing transactional deposits Time deposits Total interest-bearing deposits Borrowed funds Senior and subordinated debt Total interest expense Net interest income (2) Service charges on deposit accounts Wealth management fees Other service charges, commissions, and fees Card-based fees(1) Total fee-based revenues BOLI income(2) Other income(3) Total operating revenues Trading (losses) gains, net(4) Gains on securities sales, net(5) Securities impairment losses(5) Gains on FDIC-assisted Gains on early extinguishment of debt Gain on acquisition of deposits Total noninterest income 2013 2014. Compensation expense: Salaries and wages Retirement and other employee benefits Total compensation expense OREO expense: Write-downs of OREO Losses on the sales of OREO, net OREO operating expense, net (1) Total OREO expense Loan remediation costs Other professional services Total professional services FDIC premiums: FDIC special assessment FDIC insurance premiums Total FDIC premiums Net occupancy expense Equipment expense Technology and related costs Advertising and promotions Merchant card expense Other expenses Total noninterest expense Average full-time equivalent employees Efficiency ratio(2) implemented in the first half of 2015. net OREO expense OREO. Income (loss) before income tax expense (benefit) Income tax expense (benefit): Federal income tax expense (benefit) State income tax expense (benefit) Total income tax expense (benefit) Effective income tax rate year ended December 31, 2012. The decrease in income tax income subject to tax at statutory rates and a non-deductible BOLI modification loss recorded in the third quarter of 2013. value with unrealized gains and losses, net of related deferred income taxes, recorded in stockholders' equity as a separate component of accumulated other comprehensive loss. portfolio for the three years ended December 31, 2014. Available-for-Sale U.S. agency securities CMOs Other mortgage-backed securities Municipal securities CDOs Corporate debt securities Equity securities Total available-for- sale Held-to-Maturity Municipal securities Total securities Available-for-Sale U.S. agency securities CMOs Other mortgage-backed securities Municipal securities CDOs Other securities Total available-for-sale Held-to-Maturity Municipal securities Total securities Portfolio Composition securities portfolio. bonds. CMO portfolio totaled $4.7 million at December 31, 2014 compared to $15.2 million at December 31, 2013. CMOs Available-for-Sale U.S. agency securities CMOs (2) Other mortgage-backed securities (2) Municipal securities (3) CDOs Other securities (4) Total available-for-sale Held-to-Maturity Municipal securities (3) Total securities Commercial and industrial Agricultural Commercial real estate: Office Retail Industrial Multi-family Residential construction Commercial construction Other commercial real estate Total commercial real estate Total corporate loans Home equity 1-4 family mortgages Installment loans Total consumer loans Total loans, excluding covered loans Covered loans(1) Total loans portfolio. Total loans, excluding covered loans, as of December 31, 2011 were stable compared to December 31, 2010. Commercial and industrial Small business Tax-exempt loans(1) Overdrawn demand deposits Loan payment control and other(2) Total commercial and industrial Agricultural – operating Agricultural – farmland Total agricultural Total commercial, industrial, and agricultural loans Commercial, industrial, and agricultural loans as a percent of loans, excluding covered loans Commercial Real Estate Loans As of December 31, 2011 Raw land Developed land Construction Substantially completed structures Mixed and other Total Weighted-average maturity (in years) Construction loans as a percent of loans, excluding covered loans Construction loans as a percent of commercial real estate loans As of December 31, 2010 Raw land Developed land Construction Substantially completed structures Mixed and other Total Weighted-average maturity (in years) Construction loans as a percent of loans, excluding covered loans Construction loans as a percent of commercial real estate loans Service stations and truck stops Investor-owned rental properties Warehouses and storage Hotels Restaurants Automobile dealers Medical Religious Mobile home parks Recreational Other(1) Total other commercial real estate Commercial, industrial, and agricultural Commercial real estate Total Loans maturing after one year: Predetermined (fixed) interest rates Floating interest rates Total 2014. Consumer loans are centrally underwritten Home equity 1-4 family mortgages Installment loans Total consumer loans Home equity loans 1-4 family mortgages The home equity category consists mainly of revolving lines of credit secured by junior liens on owner-occupied real estate. Loan-to-value ratios on home equity loans and 1-4 family mortgages are based on the A discussion of our accounting policies for non-accrual loans, TDRs, and loans 90 days or more past due can be found in Note 1 of "Notes to the Consolidated Financial Statements" in Item 8 of this Form 10-K. As of December 31, 2011 Commercial and industrial Agricultural Commercial real estate: Office Retail Industrial Multi-family Residential construction Commercial construction Other commercial real estate Total commercial real estate Total corporate loans Home equity 1-4 family mortgages Installment loans Total consumer loans Total loans, excluding covered loans Covered loans Total loans As of December 31, 2010 Commercial and industrial Agricultural Commercial real estate: Office Retail Industrial Multi-family Residential construction Commercial construction Other commercial real estate Total commercial real estate Total corporate loans Home equity 1-4 family mortgages Installment loans Total consumer loans Total loans, excluding covered loans Covered loans Total loans to prior periods. Non-performing assets, excluding covered loans and covered OREO Non-accrual loans 90 days or more past due loans Total non-performing loans TDRs (still accruing interest) Other real estate owned Total non-performing assets 30-89 days past due loans Non-accrual loans to total loans Non-performing loans to total loans Non-performing assets to loans plus OREO Covered loans and covered OREO (1) Non-accrual loans 90 days or more past due loans Total non-performing loans TDRs (still accruing interest) Other real estate owned Total non-performing assets 30-89 days past due loans Non-performing assets, including covered loans and covered OREO Non-accrual loans 90 days or more past due loans Total non-performing loans TDRs (still accruing interest) Other real estate owned Total non-performing assets 30-89 days past due loans Non-accrual loans to total loans Non-performing loans to total loans Non-performing assets to loans plus OREO The effect of non-accrual loans on interest income for 2011 is presented below: Interest which would have been included at the contract rates Less: Interest included in income during the year Interest income not recognized in the financial statements loans. Non-performing assets, excluding acquired and covered loans and covered OREO, represented 2012. The continued improvement in non-performing assets and the related credit metrics reflects management's ongoing commitment to credit remediation. sales. Residential construction Commercial construction Total construction loans Non-accrual loans 90 days or more past due loans Total non-performing loans Commercial and industrial Agricultural Commercial real estate: Office Retail Industrial Multi-family Residential construction Commercial construction Other commercial real estate Total commercial real estate Home equity loans 1-4 family mortgages Installment loan Total consumer Total TDRs TDRs, still accruing interest TDRs included in non-accrual Total TDRs Year-to-date charge-offs on restructured loans Valuation allowance related to restructured loans time, and these restructures remain classified as TDRs for the remaining terms of the loans. A discussion of our accounting policies for TDRs can be found in Note 1 of "Notes to the Consolidated Financial Statements" in Item 8 of this Form 10-K. Special mention loans (1) Substandard loans (2) Total potential problem loans $2.3 million. Single-family homes Land parcels: Raw land Farm land Commercial lots Single-family lots Total land parcels Multi-family units Commercial properties Total OREO properties Covered OREO Total OREO properties Loans sold or identified as held-for-sale in 2011 Commercial and industrial Commercial real estate: Office retail, and, industrial Residential construction Commercial construction Other commercial real estate Total commercial real estate Total loans sold or transferred to held-for-sale Partial sales and paydowns Total loans sold, paid off, or transferred to held-for-sale in 2011 Loans sold in 2010 Bulk sale of non-accrual loans (1) Sale of potential problem loans (2) Total loans sold in 2010 OREO sales Proceeds from sales Less: Basis of properties sold Losses on sales of OREO, net OREO transfers and write-downs OREO transferred to premises, furniture, and equipment (at fair value) OREO write-downs trends. 2014. Change in allowance for credit losses: Balance at beginning of year Loans charged-off: Commercial and industrial Agricultural Office, retail, and industrial Multi-family Residential construction Commercial construction Other commercial real estate Consumer 1-4 family mortgages Total loans charged-off Recoveries on loans previously charged-off: Commercial and industrial Agricultural Office, retail, and industrial Multi-family Residential construction Commercial construction Other commercial real estate Consumer 1-4 family mortgages Total recoveries on loans previously charged-off Net loans charged-off, excluding covered loans and covered OREO Net charge-offs on covered loans Net loans charged-off Provision charged to operating expense: Provision, excluding provision for covered loans Provision for covered loans Less: expected reimbursement from the FDIC Net provision for covered loans Total provision charged to operating expense Balance at end of year Allowance for loan losses Reserve for unfunded commitments Total allowance for credit losses Average loans, excluding covered loans Net loans charged-off to average loans, excluding covered loans Allowance for credit losses at end of period as a percent of: Total loans, excluding covered loans Non-performing loans, excluding covered loans Average loans, including covered loans Net loans charged-off to average loans Allowance for credit losses at end of period as a percent of: Total loans Non-performing loans 2013. 2014. The Commercial, industrial, and agricultural Commercial real estate: Office, retail, and industrial Multi-family Residential construction Other commercial real estate(2) Total commercial real estate Consumer Total, excluding allowance for covered loans Covered loans Total Total loans, excluding covered loans Total loans Allowance for credit losses as a percent of: Loans: Commercial, industrial, and agricultural Commercial real estate: Office, retail, and industrial Multi-family Residential construction Other commercial real estate Total commercial real estate Consumer Total, excluding covered loans expected future cash flows of the covered impaired loans. $206.5 million, which includes $10.4 million acquired in the Great Lakes transaction. Deferred tax assets Valuation allowance required as of December 31, 2014. carryforwards. Total deposits and borrowed funds as of December 31, Demand deposits Savings deposits NOW accounts Money market accounts Transactional deposits Time deposits Brokered deposits Total time deposits Total deposits Securities sold under agreements to repurchase Federal funds purchased and other borrowed funds Total borrowed funds Senior and subordinated debt Total funding sources repurchase agreements, FHLB advances, and federal funds purchased to supplement deposits. Securities sold under agreements to repurchase At year-end: Securities sold under agreements to repurchase Federal funds purchased FHLB advances Federal term auction facilities Total borrowed funds Average for the year: Securities sold under agreements to repurchase Federal funds purchased FHLB advances Federal term auction facilities Total borrowed funds Maximum amount outstanding at any day during the year: Securities sold under agreements to repurchase Federal funds purchased FHLB advances Federal term auction facilities Weighted-average maturity of FHLB advances Senior and Subordinated Debt 2012. The following table presents our significant fixed and determinable contractual obligations and significant commitments as of December 31, Transactional deposits (no stated maturity) Time deposits Borrowed funds Subordinated debt Operating leases Pension liability Uncertain tax positions liability Commitments to extend credit Letters of credit Regulatory capital ratios: Total capital to risk-weighted assets Tier 1 capital to risk-weighted assets Tier 1 leverage to average assets Regulatory capital ratios, excluding preferred stock (1): Total capital to risk-weighted assets Tier 1 capital to risk-weighted assets Tier 1 leverage to average assets Tier 1 common capital to risk-weighted assets (2)(3) Tangible common equity ratios: Tangible common equity to tangible assets Tangible common equity, excluding other comprehensive loss, to tangible assets Tangible common equity to risk-weighted assets Regulatory capital ratios, Bank only: Total capital to risk-weighted assets Tier 1 capital to risk-weighted assets Tier 1 leverage to average assets information on our minimum capital requirements. Reconciliation of Capital Components to Regulatory Requirements Total regulatory capital, as defined in federal regulations Preferred equity Total regulatory capital, excluding preferred stock Tier 1 capital, as defined in federal regulations Preferred equity Tier 1 regulatory capital, excluding preferred stock Trust preferred securities included in Tier 1 capital Tier 1 common capital Risk-weighted assets, as defined in federal regulations Average assets, as defined in federal regulations Total capital to risk-weighted assets Total capital, excluding preferred stock, to risk-weighted assets Tier 1 capital to risk-weighted assets Tier 1 capital, excluding preferred stock, to risk-weighted assets Tier 1 common capital to risk-weighted assets Tier 1 leverage to average assets Tier 1 leverage, excluding preferred stock, to average assets Reconciliation of Capital Components to GAAP Total stockholder's equity Preferred equity Common equity Goodwill and other intangible assets Tangible common equity Accumulated other comprehensive loss Tangible common equity, excluding accumulated other comprehensive loss Total assets Goodwill and other intangible assets Tangible assets Tangible common equity to tangible assets Tangible common equity, excluding accumulated other comprehensive loss, to tangible assets Tangible common equity to risk-weighted assets For further details of the regulatory capital requirements and ratios as of December 31, currently in effect. 30 Interest income Interest expense Net interest income Provision for loan losses Noninterest income Gains on securities sales, net Securities impairment losses Gain on FDIC-assisted transactions Gain on acquisition of deposits Noninterest expense Income (loss) before income tax (expense) benefit Income tax benefit (expense) Net income (loss) Preferred dividends and accretion on preferred stock Net loss (income) applicable to non-vested restricted shares Net income (loss) applicable to common shares Basic earnings (loss) per common share Diluted earnings (loss) per common share Dividends declared per common share Return on average common equity Return on average assets Net interest margin – tax-equivalent Income (loss) before taxes Provision for loan losses Pre-tax, pre-provision earnings Non-operating items Securities gains, net Gain on FDIC-assisted transactions Severance-related costs Integration costs associated with FDIC- assisted transactions Gain on acquisition of deposits Losses realized on OREO Total non-operating items Pre-tax, pre-provision core operating earnings Average for the quarter: Securities sold under agreements to repurchase Federal funds purchased FHLB advances Total borrowed funds Maximum amount outstanding at any day during the quarter: Securities sold under agreements to repurchase Federal funds purchased FHLB advances CRITICAL ACCOUNTING ESTIMATES value estimate. purchase price over the fair value of net assets acquired using the acquisition method of accounting. This method requires that all identifiable assets acquired and liabilities assumed in the transaction, both intangible and tangible, be recorded at their estimated fair value upon acquisition. Determining the fair value often involves estimates based on third-party valuations, such as appraisals, or internal valuations based on discounted cash flow analyses or other valuation techniques. Goodwill is not amortized, instead, we assess the potential for impairment on an annual basis or more frequently if events and circumstances indicate that goodwill might be impaired. this Form 10-K. rates. Due to the low interest rate environment as of December 31, 2014 and 2013, management determined that an immediate decrease in interest rates greater than 100 basis points was not meaningful for this analysis. simulated results due to timing, magnitude, and frequency of interest rate changes as well as changes in market conditions and management strategies. rates. December 31, 2011: Dollar change Percent change December 31, 2010: Dollar change Percent change December 31, 2011: Dollar change Percent change December 31, 2010: Dollar change Percent change Assets Cash and due from banks Interest-bearing deposits in other banks Trading securities, at fair value Securities available-for-sale, at fair value Securities held-to-maturity, at amortized cost (fair value 2011 – $61,477; 2010 – $82,525) Federal Home Loan Bank and Federal Reserve Bank stock, at cost Loans, excluding covered loans Covered loans Allowance for loan losses Net loans Other real estate owned ("OREO"), excluding covered OREO Covered OREO Federal Deposit Insurance Corporation ("FDIC") indemnification asset Premises, furniture, and equipment Accrued interest receivable Investment in bank-owned life insurance ("BOLI") Goodwill and other intangible assets Other assets Total assets Liabilities Noninterest-bearing deposits Interest-bearing deposits Total deposits Borrowed funds Senior and subordinated debt Accrued interest payable and other liabilities Total liabilities Stockholders' Equity Preferred stock Common stock Additional paid-in capital Retained earnings Accumulated other comprehensive loss, net of tax Treasury stock, at cost Total stockholders' equity Total liabilities and stockholders' equity Par value Shares authorized Shares issued Shares outstanding Treasury shares See accompanying notes to the consolidated financial statements. Interest Income Loans Investment securities – taxable Investment securities – tax-exempt Covered loans Federal funds sold and other short-term investments Total interest income Interest Expense Deposits Borrowed funds Senior and subordinated debt Total interest expense Net interest income Provision for loan losses Net interest income after provision for loan losses Noninterest Income Service charges on deposit accounts Wealth management fees Other service charges, commissions, and fees Card-based fees Total fee-based revenues Securities gains, net (reclassified from other comprehensive income (loss)) Gains on FDIC-assisted transactions Gains on early extinguishment of debt Other Total noninterest income Noninterest Expense Salaries and wages Retirement and other employee benefits OREO expense, net Net occupancy and equipment expense Technology and related costs Professional services FDIC premiums Advertising and promotions Merchant card expense Other expenses Total noninterest expense Income (loss) before income tax expense (benefit) Income tax expense (benefit) Net income (loss) Preferred dividends and accretion on preferred stock Net (income) loss applicable to non-vested restricted shares Net income (loss) applicable to common shares Per Common Share Data Basic earnings (loss) per common share Diluted earnings (loss) per common share Weighted-average common shares outstanding Weighted-average diluted common shares outstanding Net income (loss) Available-for-sale securities Unrealized holding gains: Before tax Tax effect Net of tax Reclassification of net gains included in net income: Before tax Tax effect Net of tax Net unrealized holding gains (losses) Unrecognized net pension costs Unrealized holding (losses) gains: Before tax Tax effect Net of tax Total other comprehensive income (loss) Comprehensive income (loss) Balance at January 1, 2009 Cumulative effect of change in accounting for other-than- temporary impairment Adjusted balance at January 1, 2009 2009 other comprehensive income Balance at December 31, 2009 2010 other comprehensive loss Balance at December 31, 2010 2011 other comprehensive income (loss) Balance at December 31, 2011 Balance at January 1, 2009 Cumulative effect of change in accounting for other-than- temporary impairment Adjusted beginning balance Comprehensive (loss) income Common dividends declared ($0.04 per common share) Preferred dividends declared ($50.00 per preferred share) Accretion on preferred stock Issuance of Common Stock Share-based compensation expense Restricted stock activity Treasury stock purchased for benefit plans Balance at December 31, 2009 Comprehensive loss Common dividends declared ($0.04 per common share) Preferred dividends declared ($50.00 per preferred share) Accretion on preferred stock Issuance of Common Stock Share-based compensation expense Restricted stock activity Treasury stock issued to benefit plans Balance at December 31, 2010 Comprehensive income Common dividends declared ($0.04 per common share) Preferred dividends declared ($44.86 per preferred share) Accretion on Preferred Shares Redemption of Preferred Shares Redemption of Warrant Share-based compensation expense Restricted stock activity Treasury stock issued to benefit plans Balance at December 31, 2011 Operating Activities Net income (loss) Adjustments to reconcile net income (loss) to net cash provided by operating activities: Provision for loan losses Depreciation of premises, furniture, and equipment Net amortization of premium on securities Net gains on securities Gains on FDIC-assisted transactions Gains on early extinguishment of debt Net losses on sales and write-downs of OREO Net losses (gains) on sales of premises, furniture, and equipment BOLI income Net pension cost Share-based compensation expense Tax (expense) benefit related to share-based compensation Deferred income taxes Net amortization of other intangible assets Originations and purchases of mortgage loans held-for-sale Proceeds from sales of mortgage loans held-for-sale Net decrease (increase) in trading account securities Net decrease in accrued interest receivable Net decrease in accrued interest payable Net decrease (increase) in other assets Net (decrease) increase in other liabilities Net cash provided by operating activities Investing Activities Proceeds from maturities, repayments, and calls of securities available-for-sale Proceeds from sales of securities available-for-sale Purchases of securities available-for-sale Proceeds from maturities, repayments, and calls of securities held-to-maturity Purchases of securities held-to-maturity Redemption (purchase) of FHLB and Federal Reserve Bank stock Net increase in loans Proceeds from claims on BOLI Proceeds from sales of OREO Proceeds from sales of premises, furniture, and equipment Purchases of premises, furniture, and equipment Net cash proceeds received in FDIC-assisted transactions Net cash provided by investing activities Financing Activities Net cash proceeds received in acquisition of deposits Net (decrease) increase in deposit accounts Net (decrease) in borrowed funds Proceeds (payments) for the issuance (retirement) of subordinated debt Redemption of Preferred Shares and related Warrant Proceeds from the issuance of Common Stock Cash dividends paid Restricted stock activity Excess tax benefit (expense) related to share-based compensation Net cash used in financing activities Net increase in cash and cash equivalents Cash and cash equivalents at beginning of year Cash and cash equivalents at end of year date in accordance with accounting guidance applicable to business combinations. See Note 3, "Acquisitions" for additional discussion related to these fair value adjustments. policies. Cash and Cash Equivalents – For purposes of the Consolidated Statements of Cash Flows, management income. recovery, an OTTI charge will be recognized through income as a realized loss and included in net securities gains (losses) in the Consolidated Statements of Income. If management does not expect to sell the security or believes it is not more likely than not that it will be required to sell the security prior to full recovery, the OTTI is separated into the amount related to credit deterioration, which is recognized through income as a realized loss, and the amount resulting from other factors, which is recognized in other comprehensive income (loss). basis. Expected future cash flows in excess of the fair value of loans at the purchase date ("accretable yield") are recorded as interest income over the life of the loans if the timing and amount of the expected future cash flows can be reasonably estimated. The non-accretable yield represents Subsequent determined. full or charged-off. installment loans. rate. covered PCI loans. On a periodic basis, the adequacy of this allowance is determined through a re-estimation of expected future cash flows on all of the outstanding covered PCI loans using either a probability of default/loss given default ("PD/LGD") methodology or a specific review methodology. The PD/LGD model is a loss model that estimates expected future cash flows using a probability of default curve and loss given default estimates. classifications by regulatory authorities. properties, are included in net OREO expense in the Consolidated Statements of Income. are included in other noninterest expense in the Consolidated Statements of Income. Maintenance and repairs are charged to operating expenses as incurred, while improvements that extend the useful life of assets are capitalized and depreciated over the estimated remaining life. Condition. Subsequent changes in a at inception. tables. Securities U.S. agency CMOs Other residential mortgage-backed securities Municipal securities CDOs Corporate debt securities Equity securities: Hedge fund investment Other equity securities Total equity securities Total Securities Held-to-Maturity Municipal Trading Securities One year or less One year to five years Five years to ten years After ten years CMOs Other residential mortgage-backed securities Equity securities Total Excluding securities issued or backed by the U.S. government and its agencies and U.S. government-sponsored enterprises, there were no investments in securities from one issuer that exceeded 10% of total stockholders' equity 2013. Proceeds from sales Gains (losses) on sales of securities: Gross realized gains Gross realized losses Net realized gains on securities sales Non-cash impairment charges: Other-than-temporary securities impairment Portion of other-than-temporary impairment recognized in other comprehensive income (loss) Net non-cash impairment charges Net realized gains Income tax expense on net realized gains Trading (losses) gains, net(1) Net non-cash impairment charges: CDOs Whole loan mortgage-backed security included in CMOs Equity securities Total Changes in Cumulative amount recognized at beginning of year Credit losses included in earnings(1): Losses recognized on securities that previously had credit losses Losses recognized on securities that did not previously have credit losses Cumulative amount recognized at end of year 2013. As of December 31, 2011 U.S. agency security CMOs Other residential mortgage- backed securities Municipal securities CDOs Corporate debt securities Total As of December 31, 2010 U.S. agency securities CMOs Other residential mortgage- backed securities Municipal securities CDOs Total The unrealized losses on CDOs as of December 31, Significant judgment is required to calculate the fair value of the CDOs, all of which are pooled. 1 2 3 4 5 6 7 The following table presents the Company's class. Commercial and industrial Agricultural Commercial real estate: Office, retail, and industrial Multi-family Residential construction Commercial construction Other commercial real estate Total commercial real estate Total corporate loans Home equity 1-4 family mortgages Installment loans Total consumer loans Total loans, excluding covered loans Covered loans(1) Total loans Deferred loan fees included in total loans Overdrawn demand deposits included in total loans Loans pledged to secure: Federal Home Loan Bank advances Federal term auction facilities Total Acquisition date Total assets of acquired institution at acquisition date Bargain-purchase gains Goodwill Stated loss threshold Reimbursement rate (2): Before stated loss threshold After stated loss threshold Home equity lines(1) Covered impaired loans Other covered loans(2) Total covered loans FDIC indemnification asset Covered other real estate owned Total covered assets Covered non-accrual loans Covered loans past due 90 days or more and still accruing interest In connection with the FDIC Agreements, the Company recorded an indemnification asset. To maintain eligibility for the loss share reimbursement, the Company is required to follow certain servicing procedures as specified in the FDIC Agreements. the carrying value of the FDIC indemnification asset for the years ended December 31, 2014, 2013, and 2012 is presented in the following table. Balance at beginning of year Additions Accretion (amortization) Expected reimbursements from the FDIC for changes in expected credit losses(1) Payments received from the FDIC Balance at end of year Balance at beginning of year Additions Accretion Reclassifications (to) from non-accretable difference, net(1) Balance at end of year AND TDRS Aging Analysis of Past Due Loans and Non-Performing Loans by Class December 31, 2011 Commercial and industrial Agricultural Commercial real estate: Office, retail, and industrial Multi-family Residential construction Commercial construction Other commercial real estate Total commercial real estate Total corporate loans Home equity 1-4 family mortgages Installment loans Total consumer loans Total loans, excluding covered loans Covered loans Total loans December 31, 2010 Commercial and industrial Agricultural Commercial real estate: Office, retail, and industrial Multi-family Residential construction Commercial construction Other commercial real estate Total commercial real estate Total corporate loans Home equity 1-4 family mortgages Installment loans Total consumer loans Total loans, excluding covered loans Covered loans Total loans Balance at beginning of year Loans charged-off Recoveries of loans previously charged-off Net loans charged-off Provision for loan losses Balance at end of year Allowance for loan losses Reserve for unfunded commitments Total allowance for credit losses Allowance for Credit Losses by Portfolio Segment Balance at January 1, 2009 Loans charged-off Recoveries of loans previously charged-off Net loans charged-off Provision for loan losses Balance at December 31, 2009 Loans charged-off Recoveries of loans previously charged-off Net loans charged-off Provision for loan losses Balance at December 31, 2010 Loans charged-off Recoveries of loans previously charged-off Net loans charged-off Provision for loan losses Balance at December 31, 2011 Impaired loans individually evaluated for impairment: Impaired loans with a specific reserve for credit losses(1) Impaired loans with no specific reserve(2) Total impaired loans individually evaluated for impairment Corporate non-accrual loans not individually evaluated for impairment(3) Total corporate non-accrual loans TDRs, still accruing interest Total impaired loans Valuation allowance related to impaired loans Average recorded investment in impaired loans Interest income recognized on impaired loans(4) The table below provides a Loans and Related Allowance for Credit Losses by Portfolio Segment December 31, 2011 Commercial, industrial, and agricultural Commercial real estate: Office, retail, and industrial Multi-family Residential construction Other commercial real estate Total commercial real estate Total corporate loans Consumer Total loans, excluding covered loans Covered loans(1) Total loans included in the calculation of the allowance for credit losses December 31, 2010 Commercial, industrial, and agricultural Commercial real estate: Office, retail, and industrial Multi-family Residential construction Other commercial real estate Total commercial real estate Total corporate loans Consumer Total 2013. PCI loans are excluded from this disclosure. Commercial and industrial Agricultural Commercial real estate: Office, retail, and industrial Multi-family Residential construction Commercial construction Other commercial real estate Total commercial real estate Total impaired loans individually evaluated for impairment Commercial and industrial Agricultural Commercial real estate: Office, retail, and industrial Multi-family Residential construction Commercial construction Other commercial real estate Total commercial real estate Total impaired loans individually evaluated for impairment Commercial and industrial Agricultural Commercial real estate: Office, retail, and industrial Multi-family Residential construction Commercial construction Other commercial real estate Total commercial real estate Total corporate loans Home equity 1-4 family mortgages Installment loans Total consumer loans Total loans Commercial and industrial Agricultural Commercial real estate: Office, retail and industrial Multi-family Residential construction Commercial construction Other commercial real estate Total commercial real estate Total corporate loans Home equity 1-4 family mortgages Installment loans Total consumer loans Total loans restructured TDRs, still accruing interest(2) TDRs included in non-accrual(3) Total Commercial and industrial Agricultural Commercial real estate: Office, retail and industrial Multi-family Residential construction Commercial construction Other commercial real estate Total commercial real estate Total corporate loans Home equity 1-4 family mortgages Installment loans Total consumer loans Total TDRs with charge-offs TDRs, still accruing interest TDRs included in non-accrual Total Credit Quality Indicators Corporate Credit Quality Indicators by Class, Excluding Covered Loans December 31, 2011 Commercial and industrial Agricultural Commercial real estate: Office, retail, and industrial Multi-family Residential construction Commercial construction Other commercial real estate Total commercial real estate Total corporate loans December 31, 2010 Commercial and industrial Agricultural Commercial real estate: Office, retail, and industrial Multi-family Residential construction Commercial construction Other commercial real estate Total commercial real estate Total corporate loans December 31, 2011 Home equity 1-4 family mortgages Installment loans Total consumer loans December 31, 2010 Home equity 1-4 family mortgages Installment loans Total consumer loans Land Premises Furniture and equipment Total cost Accumulated depreciation Net book value of premises, furniture, and equipment held-for-investment Assets held-for-sale Total premises, furniture, and equipment Depreciation expense on premises, furniture, and equipment 2014. Year ending December 31, 2012 2013 2014 2015 2016 2017 and thereafter Total minimum lease payments Rental expense charged to operations(1) Rental income from premises leased to others(2) 2014, 2013, and 2012. Balance at December 31, 2008 2009 activity Balance at December 31, 2009 Goodwill acquired through FDIC-assisted transaction Balance at December 31, 2010 Adjustment to goodwill recorded in 2010 (1) Adjusted balance at January 1, 2011 2011 activity Balance at December 31, 2011 detail regarding these transactions. Balance at beginning of year Additions Amortization expense Fully amortized assets/other Balance at end of year Weighted-average remaining life (in years) Estimated useful lives (in years) Year ending December 31, 2012 2013 2014 2015 2016 2017 and thereafter Total type. Demand deposits Savings deposits NOW accounts Money market deposits Time deposits less than $100,000 Time deposits of $100,000 or more Total deposits Year ending December 31, 2012 2013 2014 2015 2016 2017 and thereafter Total Maturing within 3 months After 3 but within 6 months After 6 but within 12 months After 12 months Total Securities sold under agreements to repurchase FHLB advances Total borrowed funds The Bank is a member of the FHLB and has access to term financing from the FHLB. These advances are secured by designated assets that may include qualifying residential and multi-family mortgages, home equity loans, and municipal and mortgage-backed securities. During 2014, the Company prepaid $114.6 million of FHLB advances. This transaction resulted in a $2.1 million pre-tax loss on the early extinguishment of debt and is included in other noninterest income in the Consolidated Statements of Income. At December 31, December 1, 2011 December 4, 2012 December 4, 2013 December 18, 2013 Available federal funds lines (1) Federal Reserve Bank Discount Window's primary credit program 5.875% senior notes due in 2016 Principal amount Discount Total senior notes due in 2016 5.85% subordinated notes due in 2016 Principal amount Discount Total subordinated notes due in 2016 6.95% junior subordinated debentures due in 2033 Principal amount Discount Total junior subordinated debentures Total long-term debt share. 2014. Net income (loss) Preferred dividends Accretion on preferred stock (1) Net (income) loss applicable to non-vested restricted shares Net income (loss) applicable to common shares Weighted-average common shares outstanding: Weighted-average common shares outstanding (basic) Dilutive effect of Common Stock equivalents Weighted-average diluted common shares outstanding Basic earnings (loss) per common share Diluted earnings (loss) per common share Anti-dilutive shares not included in the computation of diluted earnings per common share (2) Current tax expense (benefit): Federal State Total Deferred tax expense (benefit): Federal State Total Total income expense (benefit) Deferred tax assets: Alternative minimum tax ("AMT") and other credit carryforwards Federal net operating loss ("NOL") carryforwards Allowance for credit losses Unrealized losses OREO State NOL carryforwards Other state tax benefits Other Total deferred tax assets Deferred tax liabilities: Purchase accounting adjustments and intangibles Deferred loan fees Accrued retirement benefits Depreciation Cancellation of indebtedness income Other Total deferred tax liabilities Deferred tax valuation allowance Net deferred tax assets Tax effect of adjustments related to other comprehensive income (loss) Net deferred tax assets including adjustments Net operating loss carryforwards available to offset future taxable income: Federal gross NOL carryforwards, begin to expire in 2030 Illinois gross NOL carryforwards, begin to expire in 2018 Indiana gross NOL carryforwards, begin to expire in 2021 Wisconsin gross NOL carryforwards, begin to expire in 2025 Other credits (1) net deferred tax assets acquired from the Popular, National Machine Tool, and Great Lakes transactions. Statutory federal income tax rate Tax-exempt income, net of interest expense disallowance State income tax, net of federal income tax effect Other, net Effective tax rate The change in effective at statutory rates. The change in effective non-deductible BOLI modification loss recorded in 2013. The Company is no longer subject to examination by 2011. Balance at beginning of year Additions for tax positions relating to the current year Additions for tax positions relating to prior years Reductions for tax positions relating to prior years Reductions for settlements with taxing authorities Lapse in statute of limitations Balance at end of year Interest and penalties not included above (1): Interest expense (benefit), net of tax effect, and penalties Accrued interest and penalties, net of tax effect, at end of year Profit sharing expense Company dividends received by the Profit Sharing Plan Company shares held by the Profit Sharing Plan at year end: Number of shares Fair value Accumulated benefit obligation Change in benefit obligation: Projected benefit obligation at beginning of year Service cost Interest cost Actuarial losses Benefits paid Projected benefit obligation at end of year Change in plan assets: Fair value of plan assets at beginning of year Actual return on plan assets Benefits paid Employer contributions Fair value of plan assets at end of year Funded status recognized in the Consolidated Statements of Financial Condition: Noncurrent prepaid pension Noncurrent liabilities Amounts recognized in accumulated other comprehensive loss: Prior service cost Net loss Net amount recognized Actuarial losses included in accumulated other comprehensive loss as a percent of: Accumulated benefit obligation Fair value of plan assets Amounts expected to be amortized from accumulated other comprehensive loss into net periodic benefit cost in the next fiscal year: Prior service cost Net loss Net amount expected to be recognized Weighted-average assumptions at the end of the year used to determine the actuarial present value of the projected benefit obligation: Discount rate Rate of compensation increase Net Periodic Benefit Pension Cost Components of net periodic benefit cost: Service cost Interest cost Expected return on plan assets Recognized net actuarial loss Amortization of prior service cost Other (1) Net periodic cost Other changes in plan assets and benefit obligations recognized as a charge to other comprehensive income (loss): Net loss (gain) for the period Amortization of prior service cost Amortization of net loss Total Total recognized in net periodic pension cost and other comprehensive loss Weighted-average assumptions used to determine the net periodic cost: Discount rate Expected return on plan assets Rate of compensation increase Asset Category: Equity securities Fixed income Cash equivalents Total Year ending December 31, 2012 2013 2014 2015 2016 2017-2021 The fair value of the awards is determined based on the average of the high and low price of the Company's common stock on the grant date. restricted stock units, and performance share awards. Omnibus Plan Directors Plan periods presented. Effect of Recording Share-Based Compensation Expense Stock option expense Restricted stock/unit award expense Salary stock award expense Total share-based compensation expense Income tax benefit Share-based compensation expense, net of tax Basic earnings per common share Diluted earnings per common share Cash flows (used in) provided by operating activities Cash flows provided by (used in) financing activities (1) Outstanding at beginning of year Granted Expired Outstanding at end of period Ending vested and expected to vest Exercisable at end of period Expected life of the option (in years) Expected stock volatility Risk-free interest rate Expected dividend yield Weighted-average fair value of options at their grant date Share-based compensation expense Unrecognized compensation expense Weighted-average amortization period remaining (in years) Restricted Stock Awards Non-vested awards at beginning of year Granted Vested Forfeited Non-vested awards at end of year Restricted Stock Units Non-vested awards at beginning of year Granted Non-vested awards at end of year Share-based compensation expense Unrecognized compensation expense Weighted-average amortization period remaining (in years) Total fair value of vested restricted stock awards/unit, at end of period Income tax benefit realized from vesting/release of restricted stock awards/unit under regulatory accounting practices ("risk-weighted assets"). The capital amounts and classification are also subject to qualitative judgments by the regulators regarding components of capital and assets, risk weightings, and other factors. As of December 31, 2011: Total capital (to risk-weighted assets): First Midwest Bancorp, Inc. First Midwest Bank Tier 1 capital (to risk-weighted assets): First Midwest Bancorp, Inc. First Midwest Bank Tier 1 leverage (to average assets): First Midwest Bancorp, Inc. First Midwest Bank As of December 31, 2010: Total capital (to risk-weighted assets): First Midwest Bancorp, Inc. First Midwest Bank Tier 1 capital (to risk-weighted assets): First Midwest Bancorp, Inc. First Midwest Bank Tier 1 leverage (to average assets): First Midwest Bancorp, Inc. First Midwest Bank Fair Value Hedges Related to fixed rate commercial loans Notional amount outstanding Weighted-average interest rate received Weighted-average interest rate paid Weighted-average maturity (in years) Derivative liability fair value Cash pledged to collateralize net unrealized losses with counterparties (1) Aggregate fair value of assets needed to settle the instruments immediately (if the credit risk-related contingent features were triggered) Net hedge ineffectiveness recognized in noninterest income: Change in fair value of swaps Change in fair value of hedged items Net hedge ineffectiveness (1) Gains recognized in net interest income (2) instruments were not material for any period presented. The Company had no other derivative instruments as of December 31, 2014 and 2013. The Company does not enter into derivative transactions for purely speculative purposes. policy establishes limits on credit exposure to any single Contractual or Notional Amounts of Financial Instruments Commitments to extend credit: Home equity lines Credit card lines 1-4 family real estate construction Commercial real estate Commercial and industrial Overdraft protection program (1) All other commitments Total commitments Letters of credit: 1-4 family real estate construction Commercial real estate All other Total letters of credit Unamortized fees associated with letters of credit (2) (3) Remaining weighted-average term, in months Remaining lives, in years Recourse on assets securitized: Unpaid principal balance of assets securitized Cap on recourse obligation Carrying value of recourse obligation (2) Recourse loans repurchased during the year Recourse loans charged-off during the year FMCT: Principal balance of debentures issued by the Company Related interest receivable Total FMCT assets Interest in trust-preferred capital securities issuances Investment in low-income housing tax credit partnerships operations, or cash flows. on a Recurring Basis Assets and liabilities measured at fair value on a recurring basis Assets: Trading securities: Money market funds Mutual funds Total trading securities Securities available-for-sale: U.S. agency securities CMOs Other residential mortgage-backed securities Municipal securities CDOs Corporate debt securities Hedge fund investment Other equity securities Total securities available-for-sale Mortgage servicing rights (1) Total assets Liabilities: Derivative liabilities (1) Assets measured at fair value on an annual basis Pension plan assets: Mutual funds (2) U.S. government and government agency securities Corporate bonds Common stocks Common trust funds Total pension plan assets Assets measured at fair value on a non-recurring basis Collateral-dependent impaired loans (3) OREO (4) Loans held-for-sale (5) Assets held-for-sale (6) Total assets Assets and liabilities measured at fair value on a recurring basis Assets: Trading securities: Money market funds Mutual funds Total trading securities Securities available-for-sale: U.S. agency securities CMOs Other residential mortgage-backed securities Municipal securities CDOs Corporate debt securities Hedge fund investment Other equity securities Total securities available-for-sale Mortgage servicing rights (1) Total assets Liabilities: Derivative liabilities (1) Assets measured at fair value on an annual basis Pension plan assets: Mutual funds (2) U.S. government and government agency securities Corporate bonds Common stocks Common trust funds Total pension plan assets Assets measured at fair value on a non-recurring basis Collateral-dependent impaired loans (3) OREO (4) Total assets thousands) Trading Securities Weighted-average coupon rate Weighted-average maturity, in years Information on underlying residential mortgages: Origination dates Weighted-average coupon rate Weighted-average maturity, in years the default, the magnitude of the default, and the timing and magnitude of the cure probability are directly interrelated. Defaults that occur sooner and/or are greater than anticipated have a negative impact on the valuation. In addition, a high cure probability assumption has a positive effect on the fair value, and, if a cure event takes place sooner than anticipated, the impact on the valuation is also favorable. Balance at beginning of year Total income (loss): Included in earnings (1) Included in other comprehensive income (loss) Principal paydowns Accretion Transfer out of Level 3 (2) Balance at end of year Change in unrealized losses recognized in earnings relating to securities still held at end of period Carrying Value of Mortgage Servicing Rights Balance at beginning of year New servicing assets Total gains (losses) included in earnings (1): Due to changes in valuation inputs and assumptions (2) Other changes in fair value (3) Balance at end of year Key economic assumptions used in measuring fair value, at end of year: Weighted-average prepayment speed Weighted-average discount rate Weighted-average maturity, in months Contractual servicing fees earned during the year (1) Total amount of loans being serviced for the benefit of others, at end of year (4) properties. In certain circumstances, Collateral-dependent impaired loans OREO Loans held-for-sale Assets held-for-sale Goodwill and Other Intangible Assets judgment and the use of significant unobservable inputs. As discussed in Note Financial Condition, the Company must disclose the estimated fair values and the level within the fair value hierarchy as shown in the following table. experience, current collateral valuations, borrower credit scores, and internal risk ratings. For individually significant loans or credit relationships, the estimated fair value is determined by a specific loan level review utilizing appraised values for collateral and projections of the timing and amount of expected future cash flows. Borrowed Funds – The fair value of Financial Assets: Cash and due from banks Interest-bearing deposits in other banks Loans held-for-sale Trading securities Securities available-for-sale Securities held-to-maturity Loans, net of allowance for loan losses FDIC indemnification asset Accrued interest receivable Investment in bank-owned life insurance Financial Liabilities: Deposits Borrowed funds Senior and subordinated debt Accrued interest payable Derivative liabilities Standby letters of credit Income taxes refunded Interest paid to depositors and creditors Dividends declared but unpaid Non-cash transfers of securities available-for-sale to securities held-to-maturity Non-cash transfer of securities available-for-sale to other assets Non-cash transfers of loans held-for-investment to loans held-for-sale Non-cash transfers of loans to OREO Non-cash transfer of loans to securities available-for-sale Non-cash exchange of non-performing loans for performing loans Non-cash transfers of OREO to premises, furniture, and equipment Issuance of Common Stock in exchange for the extinguishment of subordinated debt Assets Cash and interest-bearing deposits Investments in and advances to subsidiaries Goodwill Other assets Total assets Liabilities and Stockholders' Equity Senior and subordinated debt Accrued expenses and other liabilities Stockholders' equity Total liabilities and stockholders' equity Income Dividends from subsidiaries Interest income Gains on early extinguishment of debt Securities transactions and other Total income Expenses Interest expense Salaries and employee benefits Other expenses Total expenses Income (loss) before income tax benefit and equity in undistributed (loss) income of subsidiaries Income tax benefit Income (loss) before undistributed (loss) income of subsidiaries Equity in undistributed (loss) income of subsidiaries Net income (loss) Preferred dividends and accretion on preferred stock Net (income) loss applicable to non-vested restricted shares Net income (loss) applicable to common shares Operating Activities Net income (loss) Adjustments to reconcile net income (loss) to net cash provided by (used in) operating activities: Equity in undistributed loss (income) of subsidiaries Depreciation of premises, furniture, and equipment Net losses on securities Gains on early extinguishment of debt Share-based compensation expense Tax (expense) benefit related to share-based compensation Net (increase) decrease in other assets Net increase (decrease) in other liabilities Net cash provided by (used in) operating activities Investing Activities Purchases of securities available-for-sale Proceeds from sales and maturities of securities available-for-sale Proceeds from sales of premises, furniture, and equipment Purchase of premises, furniture, and equipment Capital injection into subsidiary bank Capital injection into non-bank subsidiary Purchase of non-performing assets from subsidiary bank (1) Net cash used in investing activities Financing Activities Proceeds (payments) for the issuance (retirement) of subordinated debt Redemption of Preferred Shares and related Warrant Proceeds from the issuance of Common Stock Cash dividends paid Exercise of stock options and restricted stock activity Excess tax benefit (expense) related to share-based compensation Net cash (used in) provided by financing activities Net decrease in cash and cash equivalents Cash and cash equivalents at beginning of year Cash and cash equivalents at end of year Equity Compensation Plans Approved by security holders (1) Not approved by security holders (2) Total(State
incorporation or organization) (IRS60143-9768(Address60143-1254
Securities registered pursuant to Section 12(b) of the Act:Title of each class Name of each exchange on which registered Stock,stock, $.01 Par Value NasdaqNASDAQ Stock MarketNasdaqNASDAQ Stock MarketIndicate by check mark if disclosure of delinquent filers pursuant to Item 405 of Regulation S-K is not contained herein, and will not be contained, to the best of registrant's knowledge, in definitive proxy or information statements incorporated by reference in Part III of this Form 10-K or any amendment to this Form 10-K. [ ].or a non-accelerated filer, (as definedor a smaller reporting company. See definitions of "large accelerated filer," "accelerated filer" and "smaller reporting company" in Rule 12b-2 of the Exchange Act). Large accelerated filer [X] Accelerated filer [ ] Non-accelerated filer [ ].Large accelerated filer [X] Accelerated filer [ ] Non-accelerated filer [ ] Smaller reporting company [ ] (Do not check if a smaller reporting company) 2011,2014, determined using a per share closing price on that date of $12.29,$17.03, as quoted on The Nasdaqthe NASDAQ Stock Market, was $849,084,552.28, 2011,26, 2015, there were 74,693,95077,958,815 shares of common stock, $.01$0.01 par value, outstanding.20112015 Annual Stockholders' Meeting -are incorporated by reference into Part IIIFORM 10-KTABLE OF CONTENTSIncorporation by ReferenceCertain items in Part III of this report are incorporated by reference to portions of the Company's definitive 2012 Annual Meeting Proxy Statement to be filed within 120 days after the end of the year covered by this Annual Report on Form 10-K, pursuant to Regulation 14A (the "Proxy"). provides the following list of acronyms as a tool for the reader. The acronyms identified below are used in Management's Discussion and Analysis of Financial Condition & Results of Operations and in the Notes to Consolidated Financial Statements.2012 Proxy Statementthe Company's definitive Proxy Statement for our 2012 Annual Meeting of Stockholders to be held on May 16, 2012ActBank Holding Company Act of 1956, as amendedALCOAsset Liability CommitteeAMTalternative minimum tax under the Internal Revenue Code of 1986, as amendedARRAAmerican Recovery and Reinvestment Act of 2009ATMautomated teller machineBankFirst Midwest Bank (one of the Company's two wholly owned subsidiaries)BIABanking on Illinois ActBoardthe Board of Directors of First Midwest Bancorp, Inc.BOLIbank-owned life insuranceCAMELS ratinga bank's capital level and supervisory ratingCatalystCatalyst Asset Holdings, LLC (one of the Company's three wholly owned subsidiaries)CDOscollateralized debt obligationsCFPBConsumer Financial Protection BureauCMOscollateralized mortgage obligationsCodethe Code of Ethics and Standards of Conduct of First Midwest Bancorp, Inc.Committeethe Company's Retirement Plans CommitteeCommon Stockshares of common stock of First Midwest Bancorp, Inc. $0.01 par value per share, which is traded on the Nasdaq Stock Market under the symbol "FMBI"CompanyFirst Midwest Bancorp, Inc.CPPCapital Purchase Program enacted under TARP and the EESACRACommunity Reinvestment Act of 1977CSVcash surrender valueDIFthe FDIC's Deposit Insurance FundDirectors PlanNonemployees Directors Stock Plan that provides for the granting of equity awards to the Company's non-management Board MembersEESAEmergency Economic Stabilization Act of 2008Dodd-Frank Actthe Dodd-Frank Wall Street Reform and Consumer Protection ActEPSearnings per shareFannie MaeFederal National Mortgage AssociationFASBFinancial Accounting Standards BoardFDICFederal Deposit Insurance CorporationFDIC AgreementsPurchase and Assumption Agreements and Loss Share Agreements between the Bank and the FDICFederal ReserveBoard of Governors of the Federal Reserve systemFHCa financial holding companyFHLBFederal Home Loan BankFICOcredit score created by Fair Isaac CorporationFinCENFinancial Crimes Enforcement NetworkFirst DuPagethe former First DuPage Bank, acquired by the Company in an FDIC-assisted transactionFirst MidwestFirst Midwest Bancorp, Inc.FMCTFirst Midwest Capital Trust IFreddie MacFederal Home Loan Mortgage CorporationGAAPU.S. generally accepted accounting principlesGLBGramm-Leach-Bliley Act of 1999IBAIllinois Banking ActIDFPRIllinois Department of Financial and Professional RegulationLIBORLondon Interbank Offered RateNOLnet operating lossOFACOffice of Foreign Assets Control RegulationOld NationalOld National Bank of Evansville, IndianaOmnibus PlanOmnibus Stock and Incentive Plan that permits the granting of long-term incentives to certain key employees of the CompanyOREOOther real estate owned, or properties acquired through foreclosure in partial or total satisfaction of certain loans as a result of borrower defaultsOTTIother-than-temporary impairmentPalosthe former Palos Bank and Trust Company, acquired by the Company in an FDIC-assisted transactionParasolParasol Investment Management, LLC (one of the Company's three wholly owned subsidiaries)Parent CompanyFirst Midwest Bancorp, Inc. on an unconsolidated basisPension Planthe Company-sponsored noncontributory defined benefit retirement planPeotonethe former Peotone Bank and Trust Company, acquired by the Company in an FDIC-assisted transactionPreferred SharesFixed Rate Cumulative Perpetual Preferred Stock, Series B, liquidation preference of $1,000 per share and an initial fixed dividend rate of 5%, issued to the U.S. Department of the Treasury under the Treasury's Capital Purchase Program enacted under TARP and the EESAProfit Sharing Planthe Company's defined contribution retirement savings planPSLRASafe Harbor Provisions of the Private Securities Litigation Reform Act of 1995RestorationRestoration Asset Management, LLC (a wholly owned subsidiary of Catalyst)Riegle-NealRiegle-Neal Interstate Banking and Branching Efficiency Act of 1994S&P 500Standard & Poor's 500 Stock IndexS&P SmallCap 600 BanksStandard & Poor's SmallCap 600 Banks IndexSAFEthe Secure and Fair Enforcement for Mortgage Licensing ActSarbanes-OxleySarbanes-Oxley Act of 2002SECU.S. Securities and Exchange CommissionTARPTroubled Asset Relief ProgramTDRTroubled debt restructuringTLGPTemporary Liquidity Guarantee ProgramTreasuryU.S. Department of the TreasuryVIEvariable interest entityWarrantA 10-year warrant issued to the U.S. Department of the Treasury to purchase up to 1,305,230 shares of the Company's $0.01 par value per share common stock at an exercise price of $22.18 per share subject to anti-dilution adjustmentsINTRODUCTION"Company", "we","Company," "we," "us," or "our") is a single bank holding companyDelaware corporation incorporated in 1982 and headquartered in the Chicago suburb of Itasca, IllinoisIllinois. The Company is one of Illinois' largest independent publicly-traded banking companies, with operations throughout the greater Chicago metropolitan area as well as central and western Illinois and eastern Iowa. Our principal subsidiary is First Midwest Bank, which provides a broad rangeassets of commercial and retail banking and wealth management services to consumer, commercial and industrial, and public or governmental customers. We are committed to meeting the financial needs of the people and businesses in the communities where we live and work by providing customized banking solutions, quality products, and innovative services that fulfill those financial needs.AVAILABLE INFORMATIONWe file annual, quarterly, and current reports; proxy statements; and other information with the U.S. Securities and Exchange Commission ("SEC"), and we make this information available free of charge on or through the investor relations section of our web site atwww.firstmidwest.com/aboutinvestor_overview.asp. You may read and copy materials we file with the SEC from its Public Reference Room at 100 F. Street, NE, Washington, DC 20549. You may obtain information on the operation of the Public Reference Room by calling the SEC at 1-800-SEC-0330. In addition, the SEC maintains an Internet site athttp://www.sec.gov that contains reports, proxy and information statements, and other information regarding issuers that file electronically with the SEC. The following documents are also posted on our web site or are available in print upon the request of any stockholder to our Corporate Secretary:•Certificate of Incorporation,•Company By-laws,•Charters for our Audit, Compensation, and Nominating and Corporate Governance Committees,•Related Person Transaction Policies and Procedures,•Corporate Governance Guidelines,•Code of Ethics and Standards of Conduct (the "Code"), which governs our directors, officers, and employees, and•Code of Ethics for Senior Financial Officers.Within the time period required by the SEC and the Nasdaq Stock Market, we will post on our web site any amendment to the Code and any waiver applicable to any executive officer, director, or senior financial officer (as defined in the Code). In addition, our web site includes information concerning purchases and sales of our securities by our executive officers and directors. The Company's accounting and reporting policies conform to U.S. generally accepted accounting principles ("GAAP") and general practice within the banking industry. We post on our website any disclosure relating to certain non-GAAP financial measures (as defined in the SEC's Regulation G) that we may make public orally, telephonically, by webcast, by broadcast, or by similar means from time to time.Our Corporate Secretary can be contacted by writing to First Midwest Bancorp, Inc., One Pierce Place, Itasca, Illinois 60143, attention: Corporate Secretary. The Company's Investor Relations Department can be contacted by telephone at (630) 875-7533 or by e-mail atinvestor.relations@firstmidwest.com.CAUTIONARY STATEMENT PURSUANT TO THE PRIVATE SECURITIESLITIGATION REFORM ACT OF 1995We include or incorporate by reference in this Annual Report on Form 10-K, and from time to time our management may make, statements that may constitute "forward-looking statements" within the meaning of the safe harbor provisions of the Private Securities Litigation Reform Act of 1995. These statements are not historical facts, but instead represent only management's beliefs regarding future events, many of which, by their nature, are inherently uncertain and outside our control. Although we believe the expectations reflected in any forward-looking statements are reasonable, it is possible that our actual results and financial condition may differ, possibly materially, from the anticipated results and financial condition indicated in such statements. In some cases, you can identify these statements by forward-looking words such as "may," "might," "will," "should," "expect," "plan," "anticipate," "believe," "estimate," "predict," "probable," "potential," or "continue," and the negative of these terms and other comparable terminology. We caution you not to place undue reliance on forward-looking statements, which speak only$9.4 billion as of the date of this report or when made.Forward-looking statements are subject to knownDecember 31, 2014, and unknown risks, uncertainties, and assumptions and may contain projections relating to our future financial performance including our growth strategies and anticipated trends in our business. For a detailed discussion of these and other risks and uncertainties that could cause actual results and events to differ materially from such forward-looking statements, you should refer to the sections entitled "Risk Factors" in Part 1 Item 1A and "Management's Discussion and Analysis of Financial Condition and Results of Operations," in Part II Item 7 of this Annual Report on Form 10-K as well as our subsequent periodic and current reports filed with the SEC. However, these risks and uncertainties are not exhaustive. Other sections of this report describe additional factors that could adversely impact our business and financial performance.First Midwest Bancorp, Inc.First Midwest Bancorp, Inc. ("First Midwest" or the "Company") is a single bank holding company incorporated in Delaware in 1982 for the purpose of becoming a holding company registered under the Bank Holding Company Act of 1956, as amended (the "Act""BHC Act"). The Company is one of Illinois' largest publicly traded banking companies with assets of $8.0 billion as of December 31, 2011 and is headquartered in the Chicago suburb of Itasca, Illinois. The Company's common stock, $0.01 par value per share par value common stock("Common Stock"), is listed on the NasdaqNASDAQ Stock Market and trades under the symbol FMBI ("Common Stock")"FMBI".Historycommenced business in MarchBank (the "Bank"), is an Illinois state-chartered bank and provides a broad range of banking and wealth management services to commercial and industrial, commercial real estate, municipal, and consumer customers primarily throughout the greater Chicago metropolitan area as well as northwest Indiana, central and western Illinois, and eastern Iowa through 109 banking locations. At December 31, 2014, the Company and its subsidiaries employed a total of 1,788 full-time equivalent employees.afterthe Company became a multi-institutionbank holding company through the simultaneous acquisition of over 20 affiliated financial institutions. At the time, this transaction was the largest simultaneous acquisition of banks ever approved by the Board of Governors of the Federal Reserve System ("Federal Reserve")The Bank, through its predecessors, has provided banking and involvedtrust services for over 70 years. Since becoming a re-organization of existing ownership interest, as the acquired entities were under some form of common control. Since 1983,bank holding company, the Company has completed approximately 20 acquisitions ofgrown organically and expanded its market footprint by opening new locations, growing existing locations, and acquiring financial institutions, branches, and branches representing over $4 billion in assets, including the following recent Federal Deposit Insurance Corporation ("FDIC')-assisted transactions:Institution AcquiredDate AcquiredAssets of FormerInstitution (1)First DuPage Bank ("First DuPage")October 23, 2009$261 millionPeotone Bank and Trust Company ("Peotone")April 23, 2010$129 millionPalos Bank and Trust Company ("Palos")August 13, 2010$485 million(1)Assets acquired from Palos were adjusted based on additional information received in 2011 relating to the acquisition-date fair value of certain assets and liabilities acquired.For more information regarding the FDIC-assisted transactions, please refer to Note 5 of "Notes to Financial Statements" in Item 8 of this Form 10-K.may, from time to time, exploreexplores potential opportunities for expansion in core market and adjacent areas through organic growth and the acquisition of banking institutions.and non-banking organizations. As a matter of policy, the Company generally does not comment on any dialogue or negotiations with potential targets or possible acquisitions until a definitive acquisition agreement has been signed.SubsidiariesTheIn addition, the Company provides various services to its subsidiaries, establishes Company-wide policies and procedures, and provides other resources as needed, including capital. From time to time, the Company or the Bank has acquired or operatedsubsidiaries that only hold other real estate owned ("OREO") until such properties are sold. As of December 31, 2011,2014, the following were the Company's primary subsidiaries of First Midwest: (the "Bank")the majority of the Company's operations primarily throughout the greater Chicago metropolitan area, in communities in metropolitan Chicago,addition to northwest Indiana, central and western Illinois, and eastern Iowa. The following table presents key figures for the Bank.(Dollar amounts in thousands) December 31,
2011 December 31, 2014 $ 7,848,012 $ 9,314,575 $ 6,529,235 $ 7,933,652 102 1,768 Bank branches 103 Bank offices 6 •Calumet Investment Corporationagreementlimited liability company that manages investment securities.CalumetFMB Investments Ltd., a Bermuda corporation. CalumetFMB Investments Ltd. manages investment securities and is largely inactive.•LIH is a limited liability company that holds an equity interest in a Section 8 housing venture.•Synergy Property Holdings, LLC is a limited liability company that manages several of the Bank's OREO properties.Catalyst operates in the same offices as the Bank and, manages a portion of the Company's non-performing assets. The Company established Catalyst in first quarter 2010. In March of 2010, the Company purchased $168.1 million of non-performing assets from the Bank and transferred them to Catalyst in the form of a capital injection. Catalyst had $6.7 million in non-performing assets totaling $45.2 millionremaining as of December 31, 2011 and $93.1 million as of December 31, 2010. This transaction did not change the presentation of these non-performing assets in the Company's consolidated financial statements and did not impact the Company's consolidated financial position, results of operations, or regulatory capital ratios. However, the transaction improved the Bank's asset quality ratios, capital ratios, and liquidity.aan Illinois limited liability company that manages Catalyst's OREO properties. The Bank provides certain administrative and management services to Catalyst and Restoration pursuant to a services agreement. The amounts charged under this services agreement are intended to reflect the actual costs to the Bank for providing such services.Parasol, began operations in 2011 and is a registered investment advisor under the Investment Advisors Act of 1940 (the "IAA"), which began operations on July 1, 2011.1940. Parasol conducts its business in one of the Bank's offices and provides wealth management services to the Bank's trustwealth management division and to individual and institutional clients, such as corporate and public retirement plans, foundations and endowments, high net worth individuals, and multi-employer trust funds. A description of the IAA can be found in the section titled "Supervision and Regulation" of this Item 1.("FMCT")FMCT isGreat Lakes Statutory Trust II, and Great Lakes Statutory Trust III20032003. Great Lakes Statutory Trust II ("GLST II") and Great Lakes Statutory Trust III ("GLST III") are Delaware statutory business trusts formed in 2005 and 2007, respectively, and were acquired in the Great Lakes acquisition. These trusts were established for the purpose of issuing trust-preferred securities and lending the proceeds to the Company in return for junior subordinated debentures of the Company. ThequalifiesGLST II, and GLST III qualify as a variable interest entityentities for which the Company is not the primary beneficiary. Consequently, itsthe accounts of those entities are not consolidated in the Company's financial statements. However, the currently outstanding $87.4combined $50.7 million in trust-preferred securities issuedheld by FMCT isthe three trusts at December 31, 2014 are included in the Tier 1 capital of the Company for regulatory capital purposes. For a further description of FMCT, refer to Note 11 of "Notes to Consolidated Financial Statements" in Item 8 of this Form 10-K. For a discussionpotential impactCompany using consolidated information for purposes of the provisions of the recently enacted the Dodd-Frank Wall Street Reformallocating resources and Consumer Protection Act (the "Dodd-Frank Act") on the Company's ability to continue to include the trust-preferred securities in its Tier 1 capital, see the heading "Capital Guidelines" appearing later in this section.which includes the counties surrounding Cook County,as well as central and western Illinois. This area extends from the cities of Zion and Waukegan, Illinois into northwest Indiana to the cities of Crown Point and St. John, Indiana. The Bank's other service areas are located primarily in western Illinoisnorthwestern Indiana and eastern Iowa (including the cities of Galesburg, Moline, and East Moline, Illinois and Davenport and Bettendorf, Iowa) and central Illinois (including the cities of Champaign and Danville, Illinois).Iowa. These service areas include a mixture of urban, suburban, and rural markets and contain a diversified mix of industry groups, including manufacturing, health care, pharmaceutical, higher education, wholesale and retail trade, service, and agricultural. The Bank's business of attracting deposits and making loans is primarily conducted within its service areas and may be affected by significant changes in their economies.When comparing large national metropolitan areas (defined as metropolitan areas with populations exceeding one million), the Chicago metropolitan area currently ranks as follows:•Third in the nation with respect to total businesses,•Third in total population,•Twelfth in average household income, and•Eleventh in median income producing assets.areaarea) is highly competitive, and the Company expects it to remain so in the future.competitive. Generally, the Bank competes for banking customers and deposits with other local, regional, national, and internet banks and savings and loan associations; personal loan and finance companies andcompanies; credit unions; and mutual fundsfunds; and investment brokers. The Company faces intense competition from local and out of state institutions within its service areas.based ondriven by a number of factors, including interest rates charged on loans and paid on deposits; the ability to attract new deposits; the scope and type of banking and financial services offered; the hours during which business can be conducted; the location of bank branches and automated teller machines ("ATMs"); the availability, ease of use, and range of banking services on the internet; the availability of related services; and a variety of additional services, such as wealth management services. intense competition in attracting and retaining qualified employees. Its ability to continue to compete effectively will depend uponon its ability to attract new employees and retain and motivate existing employees.For over 60 years, theThe Bank has been in the basic business of commercial and communityretail banking for over 70 years, namely attracting deposits and making loans, as well as providing wealth management services. The Company does not engage in any sub-prime lending, nor does it engage in non-commercial banking activities, such as investment banking services.inat most commercial banks and financial institutions, including checking accounts, NOW accounts, money market accounts, savings accounts, and time deposits of various types ranging from shorter-term to longer-term certificates of deposit. The transaction accounts and time deposits are tailored to our primary service area at competitive rates. The Company also offers certain retirement account services, including individual retirement accounts.ofin the Bank's service areas. The Company's largest category of lending is commercial real estate, (including construction loans), followed by commercial and industrial. The mix of properties securing the loans in our commercial real estate portfolio are balanced between owner-occupied and investor categories and are diverse in terms of type and geographic location within the Company's markets. Generally, real estate loans are secured by the land and any improvements to, or developments on, the land. Generally, loan-to-value ratios at time of issuanceorigination are capped at 50% for unimproved land and 65% for developed land. The Company's consumer loans consist primarily of home equity loans and lines of credit and 1-4 family mortgages.65.7%60% of our loan portfolio at December 31, 2011 consisted of real estate-related loans including residential mortgage loans, and commercial mortgage loans.Bank'sCompany's ability to maintain affordable funding sources allows the CompanyBank to meet the credit needs of its customers and the communities it serves. The Bank maintains a relatively stable base of core deposits that are the primary source of the Company's funds for lending and other investment purposes. Deposits funded 81.3%84% of the Company's assets at the end of 20112014 with a net loans-to-deposits ratio of 78.5%85%. Consumer, commercial, and public deposits come from the Company's primary service areas through a broad selection of deposit products. By maintaining core deposits, the Company both controls its funding costs and builds client relationships., brokered repurchase; securities sold under agreements and certificates of deposits, andto repurchase; federal funds purchased; revolving lines of credit from unaffiliated banks; cash flows generated by operations; and proceeds from the issuance of debt and sales of the Company's Common Stock. For detailed information regarding the Company's funding sources, see the "Funding and Liquidity Management" section of "Management's Discussion and Analysis of Financial Condition and Results of Operations" in Item 7 of this Form 10-K.sizeable securities portfolio in order to provide the Company with financial stability, asset diversification, income, and collateral for borrowing. The Company administers thisits securities portfolio in accordance with an investment policy that has beenwas approved and adopted by the Board of Directors of the Bank.Company'sBank's Asset Liability Committee implements the investment policy based on the established guidelines within the written policy.keeping its investablefully investing available funds, fully employed, provide adequate regulatory and operational liquidity, minimize and/or adjust the interest rate risk position of the Company, minimizediversify and mitigate the Company's exposure to credit risk, and provide collateral for pledging requirements. For detailed information regarding the Company's securities portfolio, see the "Investment Portfolio Management" section of "Management's Discussion and Analysis of Financial Condition and Results of Operations" in Item 7 of this Form 10-K.whichSystem, and the Board of Governors of the Federal Reserve System (the "Federal Reserve") has the primary federal authority to examine and supervise the Bank in coordination with the Illinois Department of Financial and Professional Regulation (the "IDFPR"). The Company is a single bank holding company and is also subject to the primary federal bank regulatory authority of the Federal Reserve. The Company and its subsidiaries are also subject to extensive secondary regulation and supervision by various state and federal governmental regulatory authorities, including the FDIC,Federal Deposit Insurance Corporation ("FDIC"), which oversees insured deposits and assets covered by Purchase and Assumption Agreements and Loss Share Agreementsloss share agreements with the FDIC (the "FDIC("the FDIC Agreements"), and the U.S. Department of the Treasury ("Treasury"(the "Treasury"), which enforces money laundering and currency transaction regulations. In addition to banking regulations, asAs a public company, the Company is underalso subject to the jurisdictionregulatory authority of the SECU.S. Securities and Exchange Commission (the "SEC") and the disclosure and regulatory requirements of the Securities Act of 1933, as amended (the "Securities Act"), and the Securities Exchange Act of 1934.includingregulate the CompanyCompany's and its subsidiaries, regulate the subsidiaries' scope of business, investments, reserves against deposits, capital levels, the nature and amount of collateral for loans, the establishment of branches, mergers, consolidations,acquisitions, dividends, and other things.matters. This supervision and regulation is intended primarily for the protection of the FDIC's deposit insurance fund ("DIF"), a bank's depositors, and the depositors,stability of the U.S financial system, rather than the stockholders of a financial institution.report.Form 10-K. In some cases, the new proposalsrevisions and rulemaking may include a radicalsignificant overhaul of the regulation of financial institutions or limitations on the products they may offer.or regulatory policies, that areand regulatory and supervisory guidance applicable to the Company and its subsidiaries, and eventually adopted by the U.S. government may be disruptive tomanner in which market practices and structures develop around the Company's business andregulations, could have a material adverse effect on itsour business, financial condition, and results of operations. The Company cannot accurately predict the nature or the extent of the effects that any such changes woulddevelopments will have on its business and earnings. The following discussionsThese and other risks are summariesdiscussed in more detail in Item 1A, "Risk Factors" of the material statutes and regulations currently affecting the Company and its subsidiaries and are qualified in their entirety by reference to such statutes and regulations.Federal Reserve SystemThe Federal Reserve System serves as the nation's central bank and is responsible for monetary policy. It consists of a seven member Board of Governors in Washington, D.C. and twelve reserve banks located in major cities throughout the U.S. Through the Federal Reserve Act and the this Form 10-K. as amended (described below),Federal Reserve has regulatory and supervisory responsibilities over its member banks, bank holding companies, and Edge Act and agreement corporations. The Federal Reserve also sets margin requirements, which limit the use of credit for purchasing or carrying securities, and develops and administers regulations that implement major federal laws governing consumer credit such as the Truth in Lending Act, the Equal Credit Opportunity Act, the Home Mortgage Disclosure Act, and the Truth in Savings Act.Bank Holding Company Act of 1956, As Amended (the "Act")Generally, theBHC Act governs the acquisition and control of banks and non-banking companies by bank holding companies and requires bank holding companies to register with the Federal Reserve. The BHC Act requires a bankAct's principal areasBHC Act, the Bank Merger Act, and other federal and state statutes regulate acquisitions of concern include:•Federal Reserve's jurisdiction to regulate the terms of certain debt issues of bank holding companies, including the authority to impose reserve requirements.•The acquisition of 5% or more of the voting shares of any bank or bank holding company, which generallyBHC Act requires the prior approval of the Federal Reserve for the direct or indirect acquisition by a bank holding company of more than 5.0% of the voting shares of a commercial bank or its parent holding company. Under the Bank Merger Act, the prior approval of the Federal Reserve or other appropriate bank regulatory authority is required for a member bank to merge with another bank or purchase the assets or assume the deposits of another bank. In reviewing applications seeking approval of merger and is subjectacquisition transactions, the bank regulatory authorities will consider, among other things, the competitive effect and public benefits of the transactions, the capital position of the combined organization, the risks to applicable federalthe stability of the U.S. banking or financial system, the applicant's managerial and state law, includingfinancial resources, the Riegle-Neal Interstate Bankingapplicant's performance record under the Community Reinvestment Act and Branching Efficiencyfair housing laws, and the effectiveness of the banks in combating money laundering activities.of 1994 ("Riegle-Neal") for interstate transactions.•Prohibitingprohibits (with certain exceptions) a bank holding company from acquiring direct or indirect control or ownership, or control of more than 5%5.0% of the voting shares of any "non-banking" company unless the non-banking activities are found by the Federal Reserve to be "so closely related to banking as to be a proper incident thereto." Under current regulations of the Federal Reserve, a bank holding company and its non-bank subsidiaries are permitted to engage in such banking-related business ventures as consumer finance, equipment leasing, data processing, mortgage banking, financial and investment advice, securities brokerage services, and other activities.•Acquisition of "control" (10% of the outstanding shares of any class of voting stock) of a bank or bank holding company without prior notice to certain federal bank regulators.Federal Reserve ActReserve Act, including Sections 23AReserve. The Federal Reserve's regulations limit the types and 23B. These regulations place restrictionsamounts of covered transactions engaged in by the Bank and generally require those transactions to be on loansterms at least as favorable to the Bank as if the transaction were conducted with an unaffiliated third party. Covered transactions are defined by statute to include:bank topurchase of securities issued by an affiliate, asset purchases by a bankaffiliate.and otherunless otherwise exempted by the Federal Reserve.betweenthat create a bank and its affiliates. Thesecredit exposure to an affiliate.limit credit transactions between a bank and its affiliates, prescribe terms and conditions for bank affiliate transactions deemed to be consistent with safe and sound banking practices, require arms-length transactions between affiliates, and restrict the types of collateral security permitted in connection with a bank'sthat any extension of credit by the Bank (or its subsidiaries) with an affiliate must be secured by designated amounts of specified collateral and must be limited to affiliates. Section 22(h) of the Federal Reserve Act limitscertain thresholds on an individual and aggregate basis.a bankit may lend to its insiders and the insiders of its affiliates, including executive officers and directors.Bankpolicy, therequirement, a holding company is expected to commit resources to support its bank subsidiary even at times when the holding company may not be in a financial position to provide it.such resources. Any capital loans by a bank holding company to its subsidiary bank are subordinate in right of payment to deposits and to certain other indebtedness of such subsidiary bank. In the event of a bank holding company's bankruptcy, the Act provides that any commitment by the bank holding company to a federal bank regulatory agency to maintain the capital of a bank subsidiary will be assumed by the bankruptcy trustee and entitled to priority of payment.The CRA, requires depository institutions to assist in meeting the credit needs of their market areas consistent with safe and sound banking practices. Under the CRA, each depository institution is required to help meet the credit needs of its market areas by, among other things, providing credit to low-income and moderate-income individuals and communities. The applicable federalFederal regulators regularly conduct CRA examinations on a regular basis to assess the performance of financial institutions and assign one of four ratings to the institution's record of meeting the credit needs of its community. Banking regulators take into account CRA ratings when considering approval of a proposed transaction. During its last examination in August of 2012, the Bank received a rating of "outstanding," the highest rating available."GLB""GLB Act")The GLB, allows for banks and certain otherbank holding companies to elect to be treated as a financial institutions to enter into combinationsholding company (an "FHC") that permit a single financial services organization tomay offer customers a more comprehensive array of financial products and services. Such products and services may include insurance and securities underwriting and agency activities, merchant banking, and insurance company portfolio investment activities. Activities that are "complementary" to financial activities are also authorized. Under the GLB Act, the Federal Reserve may not permit a company to form a financial holdingregister or maintain status as an FHC if the company ifor any of its insured depository institution subsidiaries (i) are not well-capitalized and well managedmanaged. The Federal Reserve may prohibit an FHC from engaging in otherwise permissible activities at its supervisory discretion. In addition, for an FHC to commence any new activity permitted by the BHC Act or (ii) did not receiveto acquire a company engaged in any new activity permitted by the BHC Act, each insured depository institution subsidiary of the FHC must have received a rating of at least a satisfactory rating"satisfactory" in theirits most recent CRA exam.Alsoexamination under the GLB,CRA.have issued regulations implementing notice requirements and restrictions on a financial institution's ability to disclose non-public personal information about consumers to unaffiliated third parties.PatriotPATRIOT Acts require financial institutions to develop programs to prevent them from being used for money laundering, terrorist, and terroristother illegal activities. If such activities are detected or suspected, financial institutions are obligated to file suspicious activity reports with the Treasury's Office of Financial Crimes Enforcement Network ("FinCEN").Network. These rules require financial institutions to establish procedures for identifying and verifying the identity of customers seeking to open new accounts. Failure to comply with these regulationssanctions could result in sanctionshave serious legal and possible fines. ("OFAC")Treasury established the OFAC to imposeUnited States imposes economic sanctions that affect transactions with designated foreign countries, nationals, and others. These sanctions are administered by the Treasury's Office of Foreign Assets Control ("OFAC"). These sanctions include: (i) restrictions on trade with or investment in a sanctioned country, including prohibitions against direct or indirect imports from and exports to a sanctioned country and prohibitions on "U.S. persons" engaging in financial transactions relating to making investments in, or providing investment-related advice or assistance to, a sanctioned country; and (ii) a blocking of assets in which the government or specially designated nationals of the sanctioned country have an interest by prohibiting transfers of property subject to U.S. jurisdiction (including property in the possession or control of U.S. persons). Blocked assets (e.g., property and bank deposits) cannot be paid out, withdrawn, set off, or transferred in any manner without a license from OFAC. Failure to comply with these sanctions could have serious legal and reputational consequences.On July 21, 2010, President Obama signed the Dodd-Frank Act into law. has resulted in and will likely result in sweeping changessignificantly restructured the financial regulatory regime in the regulation of financial institutions aimed at strengtheningUnited States. Although the operation of the financial services sector. The Dodd-Frank Act's provisions that have received the most public attention generally have been those applying to or more likely to affect larger institutions. However,institutions, such as bank holding companies and banks with total consolidated assets of $10 billion or more, it contains numerous other provisions that will affect all banks and bank holding companies that will fundamentally change the system of bank oversight. The Dodd-Frank Act includes provisions that:•Change the assessment base for federal deposit insurance from the amount of insured deposits to consolidated assets less tangible capital, eliminate the ceiling on the size of the DIF, and increase the floor on the size of the DIF. This change generally requires an increase in the level of assessments for financial institutions with assets in excess of $10 billion effective April 1, 2011.•Make permanent the $250,000 limit for federal deposit insurance and provide unlimited federal deposit insurance until January 1, 2013 for non-interest bearing demand transaction accounts at all insured depository institutions.•Repeal the federal prohibitions on the ability of financial institutions to pay interest on business demand deposit accounts, thereby permitting depository institutions to pay interest on business transactional and other accounts effective July 21, 2011. As a result,banks, including the Company beganand the Bank, some of which are described in more detail below. We are monitoring developments with respect to pay interest on a limited number of business checking accounts in December 2011.•Centralize responsibility for consumer financial protection (discussed below) by creating a new agency within the Federal Reserve.•Apply the same leverage and risk-based capital requirements that applyprovisions applicable to insured depository institutions to most bank holding companies. One of these requirements will preclude financial institutions from including in Tier 1 capital any trust-preferred securities or cumulative preferred stock, issued on or after May 19, 2010. The Company's currently outstanding trust-preferred securities were grandfatheredcompanies and continue to qualify as Tier 1 capital. Therefore, this portion of the Dodd-Frank Act is not applicable to the Company as of December 31, 2011.•Amend the Electronic Fund Transfer Act to give the Federal Reserve the authority to establish rules regarding interchange fees charged for electronic debit transactions by payment card issuers having assets over $10 billion (discussed below).•Establish enhanced prudential standards for risk-based capital, leverage limits, stress testing, liquidity, risk management, and concentration/credit exposure limits for institutionsbanks with total consolidated assets of $50$10 billion or more.•In February 2012, regulatory agencies issued proposed rules to implement requirements undermore in the Dodd-Frank Actevent that will require banks with assets over $10 billion to conduct annual stress tests under regulations prescribed by the FDIC. The stress tests will be used to assess the potential impact of economic and financial conditions on the earnings, losses, and capital of a bank over a nine-quarter planning horizon, taking into account the current condition of the bank and its risks, exposures, strategies, and activities.itthe Company chooses to engage. Many aspects of the Dodd-Frank Act are still subject to future rulemaking, implementation, and guidance that will take effectoccur over several years, making it difficult to anticipate the overall financial impact on the Company, its customers, or the financial industry in general.With respect toFor primary examination and enforcement authority of financial entities, however, the CFPB's authority is limited to institutions with assets of $10 billion or more. Existing regulators retain this authority over institutions with assets of $10 billion or less, such as First Midwest.••with respect tofor federal consumer financial laws over "very large" insured institutions with assets of $10 billion or more. This includes the right to obtain information about an institution's activities and compliance systems and procedures and to detect and assess risks to consumers and markets.•First Midwest,the Bank, to support the CFPB in implementing federal consumer financial laws, supporting examination activities, and assessing and detecting risks to consumers and financial markets.•law) with respect tolaws) over institutions with assets under $10 billion, such as First Midwest.the Bank. Specifically, a CFPB examiner may be included on a sampling basis in the examinations performed by the institution's primary regulator.officially commenced operations on July 21, 2011 and engagedengages in several activities throughout the remainder of the year including (i) investigating consumer complaints about credit cards and mortgages, (ii) launching a supervision program,supervisory programs, (iii) conducting research for and developing mandatory financial product disclosures, and (iv) engaging in consumer financial protection rulemaking.Some uncertainty has arisen related to confidential treatment and privilege and the CFPB's ability to require reports from financial institutions. Banks currently have express legal protection that gives them the confidence and legal certainty to provide confidential "privileged" documents at the request of the federal banking agencies, and the current law provides that a bank does not "waive" confidentiality and risk disclosure of the information to an outside party, potentially involved in litigation with the bank, by providing the information to its regulator. The CFPB does not have the same express statutory protections relating to privilege that the other banking agencies are given.The full extent of the CFPB's authority and potential impact on the Company is unclear at this time, but the Company continues to monitor the CFPB's activities on an ongoing basis.alreadyalso subject to a number of regulations intended to protect consumers in various areas, such as equal credit opportunity, fair lending, customer privacy, identity theft, and fair credit reporting. For example, deposit activities arethe Bank is subject to such acts as the Federal Truth in Savings Act, the Home Mortgage Disclosure Act, and the Real Estate Settlement Procedures Act, and the Illinois Consumer Deposit Account Act. Electronic banking activities are subject to federal law, including the Electronic Funds Transfer Act, and state laws.Act. Wealth management activities of the Bank are subject to the Illinois Corporate Fiduciaries Act. Loans made by the Bank are subject to applicable provisions of the Illinois Interest Act, the Federal Truth in Lending Act, and the Illinois Financial Services Development Act. Other consumer financial regulationslaws include the Equal Credit Opportunity Act, Fair Credit Reporting Act, and Fair Debt Collection Practices Act.is responsiblehas primary responsibility for examination and enforcement of federal consumer financial laws with respect to the Company, and state authorities are responsible for monitoring the Company's compliance with all state consumer lawslaws. Failure to comply with respectthese requirements could have serious legal and reputational consequences for the institution, including causing applicable bank regulatory authorities not to the Company.Secure and Fair Enforcement for Mortgage Licensing Act ("SAFE Act")The SAFE Act requires the registration of residential mortgage loan originators employed by banks, savings associations, credit unions, Farm Credit System institutions, and certain subsidiaries of these financial institutionsapprove merger or acquisition transactions when regulatory approval is required or to register with the Nationwide Mortgage Licensing System and Registry, obtain a unique identifier from the registry, and maintain this registration.On June 29, 2011, the Federal Reserve adopted a final rule with respect toeffective on October 1, 2011, which establishesthe Federal Reserve established a maximum permissible interchange fee for many types of debit interchange transactionsequal to equal no more than 21 cents plus five basis points of the transaction value. Furthermore, thevalue for many types of debit interchange transactions. The Federal Reserve also adopted a rule to allow a debit card issuer to recover one cent per transaction for fraud prevention purposes if the issuer complies with certain fraud-related requirements promulgatedrequired by the Federal Reserve. The Company intends to complyis in compliance with these fraud-related requirements. The Federal Reserve also approvedhas rules governing routing and exclusivity that require issuers to offer two unaffiliated networks for routing transactions on each debit or prepaid product, which will be effective April 1, 2012.Guidelines have established risk-based capital guidelines to provide a framework for assessing the adequacy of the capital of national and state banks, thrifts, and their holding companies (collectively, "banking institutions"). These guidelines apply to all banking institutions, regardless of size, and are used in the examination and supervisory process and in the analysis of applications to be acted upon by the regulatory authorities. These guidelines require banking institutions to maintain capital based uponon the 1988 capital accord ("Basel I") of the Basel Committee on Banking Supervision (the "Basel Committee"). The name comes from Basel, Switzerland, the city in which the main international organization, The Bank for International Settlements, is located.three tiers:•••Market Risk Capital (Tier 3). Tier 3 capital includes qualifying unsecured subordinated debt. Adequately
Capitalized
Requirement "Well-Capitalized"
Requirement Well-Capitalized Requirement 4.00% 6.00% 4.00% 6.00% 8.00% 10.00% 8.00% 10.00% Tier 1 capital to average assets 4.00% 5.00% Bank holding companies and banks subject tomarket riskFederal Reserve published final rules (the "Basel III Capital Rules") establishing a new comprehensive capital guidelines are required to incorporate market and interest rate risk components into their risk-based capital standards.Inframework for U.S. banking organizations. The rules implement the Basel Committee’s December 2010 the Basel Committee released its final framework commonly known as "Basel III" for strengthening international capital and liquidity regulation, now officially identified bystandards as well as certain provisions of the Basel Committee as "Basel III".Dodd-Frank Act. The Basel III replaces Basel II, which was introduced byCapital Rules substantially revise the Basel Committee in 2004 and did not impact the Company. Basel III, when implemented by the U.S. banking agencies and fully phased-in, will requirerisk-based capital requirements applicable to bank holding companies and their bank subsidiariesdepository institutions, including the Company and the Bank, compared to maintain substantially morethe current U.S. risk-based capital with a greater emphasis on common equity.rules. The Basel III finalCapital Rules define the components of capital framework, amongand address other things:•Introducesissues impacting the numerator in banks’ regulatory capital ratios. The Basel III Capital Rules also address risk weights and other issues impacting the denominator in regulatory capital ratios and replace the existing risk-weighting approach with a more risk-sensitive approach. In addition, the Basel III Capital Rules implement the requirements of Section 939A of the Dodd-Frank Act to remove references to credit ratings from the federal banking agencies’ rules. The Basel III Capital Rules became effective for the Company and the Bank on January 1, 2015 (subject to a phase-in period). as a new capital measure,•Specifies, (ii) specify that Tier 1 capital consistsconsist of CET1 and "Additional Tier 1 capital"Capital" instruments meeting specified requirements,•Defines (iii) narrowly define CET1 narrowly by requiring that most deductions/adjustments to regulatory capital measures be made to CET1 and not to the other components of capital,•Expands and (iv) expand the scope of the deductions/adjustments compared to existing regulations,regulations. Bank holding companies with less than $15 billion in consolidated assets as of December 31, 2009, such as the Company, are permitted to include trust-preferred securities in Additional Tier 1 Capital on a permanent basis and•Adopts an international standard for a leverage ratio calculated as without any phase-out. As of December 31, 2014, the Company had $50.7 million of trust-preferred securities included in Tier I capital to adjusted average assets plus certain off-balance sheet exposures.The implementation of1 capital.final frameworkCapital Rules will commence on Januaryrequire the Company and the Bank to maintain the following:2013. On that date, banking institutions will be requiredcapital to meetrisk-weighted assets of at least 6.0%, plus the capital conservation buffer (resulting in a minimum Tier 1 capital ratios. ratio of 8.5% upon full implementation).2.5%minimum ratio of total capital conversion(Tier 1 capital plus Tier 2 capital) to risk-weighted assets of at least 8.0%, plus the capital conservation buffer will be added(resulting in a minimum total capital ratio of 10.5% upon full implementation).each ratio as it is phased in beginning January 1, 2016 until full implementation on January 1, 2019. A number of new deductions from and additions to CET1 will be phased in over a five-year period. The minimum capital ratios are as follows: Minimum Required
on January 1, 2013 Capital Conversion
Buffer Minimum Required
on January 1, 2019 4.5% 2.5% 7.0% 6.0% 2.5% 8.5% 8.0% 2.5% 10.5% N/A N/A 3.0% Basel III also provides for a "countercyclical capital buffer" generally to be imposed when national regulators determine that excess aggregate credit growth becomes associated with a buildup of systemic risk. (or below the combinedcapital conservation buffer and countercyclical capital buffer, when the latter is applied) will face constraints on dividends, equity repurchases, and compensation based on the amount of the shortfall.Effective July 28, 2011, federal banking regulatory agencies adopted The implementation of the capital conservation buffer will begin on January 1, 2016 at the 0.625% level and be phased in over a final rulefour-year period (increasing by that establishesamount on each subsequent January 1 until it reaches 2.5% on January 1, 2019).floornumber of deductions from and adjustments to CET1 to be phased-in over a four-year period through January 1, 2019 (beginning at 40% on January 1, 2015 and an additional 20% per year thereafter). Examples of these include the requirement that mortgage servicing rights, deferred tax assets depending on future taxable income, and significant investments in non-consolidated financial entities be deducted from CET1 to the extent that any one such category exceeds 10% of CET1 or all such categories in the aggregate exceed 15% of CET1. Under current capital standards, the effects of accumulated other comprehensive income items included in capital are excluded for the risk-basedpurposes of determining regulatory capital requirements applicable to the largest, internationally active banking organizations. Thus, each organization implementing Basel III will continue to calculate its risk-based capital requirements under general risk-based capital rules, and the capital requirement it computes under those rules will serve as a floor for its risk-based requirement computed under Basel III. In practice, the rule will not have an immediate effect on banking organizations' capital requirements because all organizations subject to Basel III are currently computing their capital requirements under the general risk-based capital rules. This rule does not currently impact the Company, nor is it expected to impact the Company in the near future.The U.S. banking agencies have indicated informally that they expect to implement regulations in mid-2012. Notwithstanding its release ofratios. Under the Basel III framework as a final framework,Capital Rules, the Basel Committee is considering further amendments to Basel III.Given the many ongoing regulatory initiatives related to capital requirements, the regulations ultimately applicable toeffects of certain accumulated other comprehensive items are not excluded; however, the Company and the Bank, may be substantially differentmake a one-time permanent election to continue to exclude these items, and the Company and the Bank expect to make such an election.discussed above. Requirements to maintain higher levels of capital or liquid assets could adversely impactunder the Company's net income and return on equity.Liquidity RequirementsThe proposed Basel III Capital Rules on a fully phased-in basis as if such requirements were currently in effect.also will requireputs forth regulatory requirements that banks and bank holding companies to measure their liquidity against specific tests, specifically:•Liquidity Coverage Ratio Testliquidity tests. One test, referred to as the liquidity coverage ratio ("LCR"): The LCR, is designed to ensure that the banking entity maintains an adequate level of unencumbered high-quality liquid assets equal to the greater of (i) the entity's expected net cash outflow for a 30-day time horizon or (ii)(or, if greater, 25% of its expected total cash outflowoutflow) under an acute liquidity stress scenario.•Net Stable Funding Ratio Test The other test, referred to as the net stable funding ratio ("NSFR"): The NSFR, is designed to promote more medium- and long-term funding of the assets and activities of banking entities over a one-year time horizon.If adopted in their current form, these These requirements would incentwill provide an incentive for banking entities to dramatically increase their holdings of U.S. Treasury securities and other sovereign debt as a component of assets and increase the use of long-term debt as a funding source.liquidity framework currently contemplates thatCapital Rules revised the LCR will be subject to an observation period continuing through mid-2013 and implemented as a minimum standard onformer prompt corrective action requirements effective January 1, 2015 subjectby (i) introducing a CET1 ratio requirement at each level (other than critically undercapitalized), with the required CET1 ratio being 6.5% for well-capitalized status; (ii) increasing the minimum Tier 1 capital ratio requirement for each category (other than critically undercapitalized), with the minimum Tier 1 capital ratio for well-capitalized status being 8% (as compared to any revisions resulting from the analyses conductedcurrent 6%); and data collected during(iii) eliminating the observation period. Similarly, the NSFR willcurrent provision that provides that a bank with a composite supervisory rating of 1 may have a 3% leverage ratio and still be subject to an observation period through mid-2016 and implemented as a minimum standard by January 1, 2018 subject to any revisions resulting from the analyses conducted and data collected during the observation period.liquidity standards are subjectCapital Rules do not change the total risk-based capital requirement for any prompt corrective action category.rulemaking,extended the transition period as to the restrictions on sponsoring or investing in private funds to 2017. Banks, such as the Bank, with less than $10 billion in total consolidated assets that do not engage in any covered activities other than trading in certain government, agency, state or municipal obligations, do not have any significant compliance obligations under the final rules. Although the Company is continuing to evaluate the impact of the Volcker Rule, it generally does not engage in the businesses prohibited by the Volcker Rule; therefore, management does not currently anticipate that the Volcker Rule will have a material effect on the operations of the Company and their terms may change before implementation.banking corporation. Thestate-chartered bank. Among other things, the IBA (i) defines the powers and permissible activities of an Illinois state-chartered bank, (ii) prescribes corporate governance standards, (iii) imposes approval requirements on mergersmerger and acquisition activity of Illinois state banks, (iv) prescribes lending limits, and (v) provides for the examination of state banks by the IDFPR. The Banking on Illinois Act ("BIA") became effective in mid-1999 and amended the IBA to provide a wide range of new activities allowed for Illinois state-chartered banks, including the Bank. The provisions of the BIA are to be construed liberally in order to create a favorable business climate for banks in Illinois. The main features of the BIA are to expand bank powers through a "wild card" provision that authorizes Illinois state-chartered banks to offer virtually any product or service that any bank or thrift may offerguidelines,above regulatory minimums, the Bank is limited in the amount of dividends it can pay to the Company under the IBA. Under this law, the Bank is permitted to declare and pay dividends in amounts up to the amount of its accumulated net profits, provided that it retains in its surplus at least one-tenth of its net profits since the date of the declaration of its most recent dividend until those additions to surplus, in the aggregate, equal the paid-in capital of the Bank. While it continues its banking business, the Bank may not pay dividends in excess of its net profits then on hand (after deductions for losses and bad debts). In addition, the Bank is limited in the amount of dividends it can pay under the Federal Reserve Act and Regulation H. For example, dividends cannot be paid that would constitute a withdrawal of capital; dividends cannot be declared or paid if they exceed a bank's undivided profits; and a bank may not declare or pay a dividend if all dividends declared during the calendar year are greater than current year net income plus retained net income of the prior two years without Federal Reserve approval.isare authorized to determine under certain circumstances relating to the financial condition of a bank or bank holding company, that the payment of dividends by the Company would be an unsafe or unsound practice and to prohibit payment thereof.under certain circumstances related to the financial condition of a bank or bank holding company. The Federal Reserve has taken the position that dividends that would create pressure or undermine the safety and soundness of a subsidiary bank are inappropriate.has engaged or is engaging in unsafe and unsound practices; is in an unsafe or unsound condition to continue operations; or has violated any applicable law, regulation, rule, order, or condition imposed by the FDIC or written agreement entered into with the FDIC. The Company is not aware of any practice, condition, or violation that might lead to termination of FDIC deposit insurance.uponon a risk matrix that takes into account a bank's capital level and supervisory rating ("CAMELS rating").rating. The risk matrix utilizes four risk categories, which are distinguished by capital levels and supervisory ratings. For deposit insurance assessment purposes, an insured depository institution is placed into one of the four risk categories each quarter. An institution's assessment is determined by multiplying its assessment rate by its assessment base.In past years and in early 2011, the that could be levied on banks ranged from 7 basis points for Risk Category I institutions to 77.5 basis points for Risk Category IV institutions. The assessment base was historically domestic deposits with some adjustments.Under a new rule mandated by the Dodd-Frank Act, the total base assessment rates now range from 2.5 basis points to 45 basis points. The assessment base is now based oncalculated using average consolidated total assets minus average tangible equity rather than domestic deposits. In addition,equity. At least semi-annually, the rule adopts a "scorecard" assessment schemeFDIC will update its loss and income projections for larger banks and suspends dividend payments if the DIF reserve ratio exceeds 1.5 percent but provides for decreasingand, if needed, will increase or decrease assessment rates, when the DIF reserve ratio reaches certain thresholds. The rule took effect during the quarter beginning April 1, 2011 and was first reflected in the invoices for assessments due September 30, 2011. following notice-and-comment rulemaking, if required.Government-Sponsored Enterprisegovernment-sponsored enterprise established in 1987 to serve as a financing vehicle for the failed Federal Savings and Loan Association, ("Financing Corporation").Association. These assessments will continue until the Financing Corporation bonds mature in 2019.Investment Advisors Act of 1940The SEC regulates investment advisers through the IAA. With certain exceptions, the IAA requires entities that are compensated for advising others about securities investments to register with the SEC and conform to regulations designed to protect investors. Generally, only advisers who have at least $100 million of assets under management or advise a registered investment company must register with the SEC. Although the Bank is exempt from registration as a financial institution, Parasol is subject to the IAA because it has over $100 million of assets under management and provides advice to investment company clients.The IAA is a "principles-based" regulatory scheme that requires advisors to adhere to strict disclosure requirements and certain recordkeeping standards and gives the SEC the authority at any time to inspect those books and records. Investment advisors are subject to a substantial number of standards of conduct under the IAA including a prohibition from: (i) employing any device, scheme, or artifice to defraud any client and (ii) engaging in any transaction, practice, or course of business that operates as a fraud upon any client. In enforcing these rules, the SEC does not need to prove that an investment adviser intended to commit fraud against its client. It is sufficient that the advisor acted recklessly or negligently, and the conduct operated as a fraud. The IAA also prohibits any investment adviser from making a false or misleading statement to prospective or existing investors in a pooled investment vehicle managed by the adviser or otherwise defrauding an investor.Sarbanes-Oxley Act of 2002The Sarbanes-Oxley Act of 2002 ("Sarbanes-Oxley") implemented a broad range of corporate governance and accounting measures to increase corporate responsibility, provide for enhanced penalties for accounting and auditing improprieties at publicly traded companies, and protect investors by improving the accuracy and reliability of disclosures under federal securities laws. The Company is subject to Sarbanes-Oxley because it is required to file periodic reports with the SEC under the Securities and Exchange Act of 1934. Sarbanes-Oxley has established new membership requirements and additional responsibilities for the Company's audit committee, imposed restrictions on the relationship between the Company and its outside auditors (including restrictions on the types of non-audit services its auditors may provide to the Company), imposed additional responsibilities for external financial statements on the Company's chief executive officer and chief financial officer, expanded the disclosure requirements for corporate insiders, required management to evaluate the Company's disclosure controls and procedures and its internal control over financial reporting, and required auditors to issue a report on the Company's internal control over financial reporting.Economic Recovery ProgramsFor most of 2011, the Company was subject to regulation relating to economic recovery programs. In response to the financial market crisis and continuing economic uncertainty, the U.S. government took a variety of extraordinary measures designed to restore confidence in the financial markets and to strengthen financial institutions, including measures available under the Emergency Economic Stabilization Act of 2008 ("EESA"), as amended by the American Recovery and Reinvestment Act of 2009 ("ARRA"), which included the Troubled Asset Relief Program ("TARP"). Under the EESA, the Treasury may take a range of actions to provide liquidity to the U.S. financial markets, including the direct purchase of equity of financial institutions through the Treasury's Capital Purchase Program ("CPP").The Company elected to participate in the CPP, and on December 5, 2008, First Midwest issued to the Treasury, in exchange for aggregate consideration of $193.0 million, (i) 193,000 shares of the Company's Fixed Rate Cumulative Perpetual Preferred Stock, Series B ("Preferred Shares") and (ii) a ten-year warrant ("Warrant") to purchase up to 1,305,230 shares of the Company's Common Stock at an exercise price of $22.18 per share subject to anti-dilution adjustments. In November 2011, the Company redeemed the Preferred Shares, and in December 2011, the Company redeemed the Warrant, which concluded the Company's participation in the CPP. No Preferred Shares or Warrant were outstanding as of December 31, 2011.insureensure that they: (i) provide employees with incentives that appropriately balance risk and reward and that do not encourage imprudent risk; (ii) are compatible with effective controls and risk management; and (iii) are supported by strong corporate governance including active and effective oversight by the banking organization's board of directors. Monitoring methods and processes used by a banking organization should be commensurate with the size and complexity of the organization and its use of incentive compensation.the National Credit Union Administration, the SEC, and the Federal Housing Finance Agency, established a rule that regulates incentive-based compensation for entities deemed to be a "covered financial institution",proposed such rules, which includes both the Company and the Bank.have not yet been finalized. These proposed rules incorporate many of the executive compensation principles described above, including a prohibition on compensation practices that encourage covered persons to take inappropriate risks by providing such person with excessive compensation.legislation is currentlylaws and regulations are being considered by Congress. This legislationCongress and regulatory agencies that may change banking statutes and the Company's operating environment in substantial and unpredictable ways and may increase reporting requirements and governance. If enacted, such legislationcompliance costs. These changes could increase or decrease the cost of doing business, limit or expand permissible activities, or affect the competitive balance among banks, savings associations, credit unions, and other financial institutions.Company cannot predict whetherfollowing documents are also posted on our website or are available in print upon the request of any potential legislationstockholder to our Corporate Secretary:enacted and, if enacted, the effect that it,contacted by writing to First Midwest Bancorp, Inc., One Pierce Place, Itasca, Illinois 60143, attention: Corporate Secretary. The Company's Investor Relations Department can be contacted by telephone at (630) 875-7533 or any implementing regulations, would have on its business, financial condition, results of operations, or liquidity.First Midwestour Common Stock is subject to risks inherent in the Company's business. The material risks and uncertainties that management believes affect the Company are described below. Before making an investment decision with respect to any of the Company's securities, you should carefully consider the risks and uncertainties as described below, together with all of the information included herein. The risks and uncertainties described below are not the only risks and uncertainties the Company faces. Additional risks and uncertainties not presently known or currently deemed immaterial also may have a material adverse effect on the Company's results of operations and financial condition. If any of the following risks actually occur, the Company's business, financial condition, and results of operations and financial condition could suffer,be adversely affected, possibly materially. In that event, the trading price of the Company's Common Stock or other securities could decline. The risks discussed below also include forward-looking statements, and actual results may differ substantially from those discussed or implied in these forward-looking statements.are largely dependent upondepend on its net interest income. Net interest income equals the difference between interest income and fees earned on interest-earning assets (such as loans and securities) and interest expense incurred on interest-bearing liabilities (such as deposits and borrowed funds). Interest rates are highly sensitive to many factors that are beyond the Company's control, including general economic conditions and policies of various governmental and regulatory agencies, particularly the Federal Reserve. Changes in monetary policy, including changes in interest rates, could influence the amount of interest the Company earns on loans and securities and the amount of interest it incurspays on deposits and borrowings. SuchThese changes could also affect (i) the Company's ability to originate loans and obtain deposits, (ii) the fair value of the Company's financial assets and liabilities, and (iii) the average duration of the Company's securities portfolio. If the interest rates paid on deposits and other borrowings increase at a faster rate than the interest rates received on loans and other investments, the Company's net interest income, and therefore earnings, could be adversely affected. Earnings could also be adversely affected if the interest rates received on loans and other investments fall more quickly than the interest rates paid on deposits and other borrowings.has implementedimplements effective asset and liability management strategies to reduce the potential effects of changes in interest rates on the Company's results of operations, any substantial, unexpected, or prolonged change in market interest rates could have a material adverse effect on the Company's business, financial condition, and results of operations. See the section captioned "Net Interest Income" in Item 7, "Management's Discussion and Analysis of Financial Condition and Results of Operations," located elsewhere in this reportForm 10-K for further discussion related to the Company's management of interest rate risk.risk,risks, especially those outside the Company's control. These risks include the impact of changes in interest rates, and changes in the economic conditions in the markets in which the Company operates as well as thoseand across the U.S., and the ability of borrowers to repay loans based on their respective circumstances. Increases in interest rates and/or continuing weakening economic conditions could adversely impact the ability of borrowers to repay outstanding loans or the value of the collateral securing those loans. continuing economic weakness in real estate and related markets could further increase the Company's lending risk as it relates to its commercial real estate loan portfolio and the value of the underlying collateral. The Company is also subject to various laws and regulations that affect its lending activities. Failure to comply with applicable laws and regulations could subject the Company to regulatory enforcement action that could result in the assessment of significant civil monetary penalties against the Company.2011, 82.2% of2014, the Company's loan portfolio consisted of commercial and industrial and86.3% of corporate loans, the majority of which were secured by commercial real estate, and 13.7% of consumer loans. The deterioration of one or a few of these loans could cause a significant increase in non-performing loans. An increase in non-performing loans could result in a net loss of earnings from these loans, an increase in the provision for loan and covered loan losses, and an increase in loan charge-offs, all of which could have a material adverse effect on the Company's business, financial condition, and results of operations. See the section captioned "Loan Portfolio and Credit Quality" in Item 7, "Management's Discussion and Analysis of Financial Condition and Results of Operations," located elsewhere in this reportForm 10-K for further discussion related to commercialcorporate and industrial and commercial real estateconsumer loans.operating performance.meaningand the repayment of the loan is largely dependent upondepends on the value of the collateral securing the loan and the successful operation of the property securing the loan.property. For collateral-dependent loans, the Company estimates the value of the loan based on the appraised value of the underlying collateral less costs to sell. The Company's OREO portfolio consists of properties acquired through foreclosure in partial or total satisfaction of certain loans as a result of borrower defaults. OREO is recorded at the lower of the recorded investment in the loans for which the property served as collateral or estimated fair value, less estimated selling costs.disposition, the net proceeds realized from such sales transactions could differ significantly from estimates used to determine the fair value of the properties.disposition. This could have a material adverse effect on the Company's business, financial condition, and results of operations. ("allowance") at a level believed adequate to absorb estimated losses inherent in theits existing loan portfolio. The level of the allowance for credit losses reflects management's continuing evaluation of industry concentrations; specific credit risks; credit loss experience; current loan portfolio quality; present economic political,and business conditions; changes in competitive, legal, and regulatory conditions; and unidentified losses inherent in the current loan portfolio. Determinationall of which may undergoare subject to material changes. Continuing deteriorationDeterioration in economic conditions affecting borrowers, new information regarding existing loans, identification of additional problem loans, changes in accounting principles, and other factors, both within and outside of the Company's control, may require an increase in the allowance for credit losses. In addition, bank regulatory agencies periodically review the Company's allowance for credit losses and may require an increase in the provision for loan and covered loan losses or the recognition of additional loan charge-offs based on judgments different from those of management. In addition,Furthermore, if charge-offs in future periods exceed the allowance for credit losses, the Company will need additional provisions to increase the allowance. Any increases in the allowance for credit losses will result in a decrease in net income and capital and may have a material adverse effect on the Company's financial condition and results of operations. See Note 1 of "Notes to the section captioned "Allowance for Credit Losses"Consolidated Financial Statements" in Item 7, "Management's Discussion and Analysis8 of Financial Condition and Results of Operations," located elsewhere in this reportForm 10-K for further discussion related to the Company's process for determining the appropriate level of the allowance for credit losses. financial information. The Company may also rely on representations of those customers, counterparties, or other third parties, such as independent auditors, as to the accuracy and completeness of that information. Reliance on inaccurate or misleading financial statements, credit reports, or other financial information could have a material adverse impact on the Company's business, financial condition, and results of operations.restricted.restricted by law. Dividend payments by the Bank to the Company in the future will require generation of future earnings by the Bank and could require regulatory approval if the proposed dividend is in excess of prescribed guidelines. Further, the Company's right to participate in the assets of the Bank upon its liquidation, reorganization, or otherwise will be subject to the claims of the Bank's creditors, including depositors, which will take priority except to the extent the Company may be a creditor with a recognized claim. As of December 31, 2011,2014, the Company's subsidiaries had deposits and other liabilities of $6.8$8.1 billion.aan adequate level of liquidity through asset and liability management. If the Company becomes unable to obtain funds when needed, it could have a material adverse effect on the Company's business, financial condition, and results of operations.If the Company's debt ratings are downgraded below investment grade, the interest rate applicable to the Company's senior notes will be increased ratably depending upon each agency's rating, however, the aggregate amount of any increase shall not exceed 2.00 percentage points.Rating Agency Rating BBB- Baa1 Baa2 BBB- uponon conditions in the capital markets, which are outside of its control, and on the Company's financial performance. Accordingly, the Company cannot be assured of its ability to raise capital when needed or on favorable terms. If the Company cannot raise additional capital when needed, it will be subject to increased regulatory supervision and the imposition of restrictions on its growth and business. These could negatively impact the Company's ability to operate or further expand its operations through acquisitions or the establishment of additional branches and may result in increases in operating expenses and reductions in revenues that could have a material adverse effect on its business, financial condition, and results of operations.difficult, subjective and complex judgments about matters that are inherently uncertain and because it is likely that materially different amounts would be reported under different conditions or using different assumptions. If such estimates or assumptions underlying the Company's financial statements are incorrect, itthe Company may experience material losses. See the section captioned "Critical Accounting Policies"Estimates" in Item 7, "Management's Discussion and Analysis of Financial Condition and Results of Operations," located elsewhere inof this reportForm 10-K for further discussion related to the Company's critical accounting policies.Changes in theseoccurring,updated and given the current economic environment, more drasticrefined and new standards are developed resulting in changes may occur. The implementation of such changesthat could have a material adverse effect on the Company's business, financial condition, and results of operations. in part on certain assumptions and can provide only reasonable, not absolute, assurances that the objectives of the system are met. Any failure or circumvention of the Company's controls and procedures or failure to comply with regulations related to controls and procedures could have a material adverse effect on the Company's business, financial condition, and results of operations. in large part, on its ability to attract and retain skilled people. Competition for the best people in most activities in which the Company engages can be intense, and the Company may not be able to hire people or retain them.business is primarily relationship-driven in that manycustomer relationships are critical to the success of its key employees have extensive customer relationships. Lossbusiness, and loss of key employees with suchsignificant customer relationships may lead to the loss of business if the customers were to follow that employee to a competitor. While the Company believes its relationships with its key personnel are strong, it cannot guarantee that all of its key personnel will remain with the organization. Loss of such key personnel, should they enter into an employment relationship with one of the Company's competitors,organization, which could result in the loss of some of its customers whichand could have a negativean adverse impact on the company'sCompany's business, financial condition, and results of operations.has increased, so haveincreases, the potential risks of a technology-related operation interruption (such as disruptionsinterruptions in the Company's customersystems)systems or the occurrence of a cyber incident (such as unauthorized access to the Company's systems).incidents also increases. Cyber incidents can result from deliberate attacks or unintentional events including, among other things, (i) gaining unauthorized access to digital systems for purposes of misappropriating assets or sensitive information, corrupting data, or causing potentially debilitating operational disruptions; (ii) causing denial-of-service attacks on websites; or (iii) intelligence gathering and social engineering aimed at obtaining information. The occurrence of operational interruption, cyber incident, or a deficiency in the cyber security of the Company's technology systems (internal or outsourced) could negatively impact the Company's financial condition or results of operations.TheDuring the year, the Company has experienced certain immaterial cyber attackscyber-attacks or breaches (such as phishing and ATM skimming) and continues to invest in security and controls to prevent and mitigate furtherfuture incidents. Although the Company has not experienced any material losses relatingrelated to a technology-related operational interruption or cyber attack,cyber-attack, there can be no assurance that such failures, interruptions, or security breaches will not occur in the future or, if they do occur, that the impact will not be substantial. (internal or outsourced) could damage the Company's reputation, result in a loss of customer business, result in the unauthorized release, gathering, monitoring, misuse, loss, or destruction of proprietary information, subject the Company to additional regulatory scrutiny, or expose the Company to civil litigation and possible financial liability, any of which could have a material adverse effect on the Company's business, financial condition, and results of operations, as well as its reputation or stock price. As cyber threats continue to evolve, the Company may alsoexpects it will be required to spend significant additional resources on an ongoing basis to continue to modify orand enhance its protective measures orand to investigate and remediate any information security vulnerabilities.is dependent upondepends on outside third parties for processing and handling of Company records and data.itstheir proprietary software on behalf of the Company.its behalf. These systems include, but are not limited to, general ledger, payroll, employee benefits, wealth management record keeping, loan and deposit processing, merchant processing, and securities portfolio management. While the Company performs a review of controls instituted by the vendorvendors over these programs in accordance with industry standards and performs its own testing of user controls, the Company must rely on the continued maintenance of these controls by the outside party, including safeguards over the security of customer data. Infinancial condition and results of operations.Improper and fraudulent mortgage servicing and foreclosure documentation could result in liability for losses.The financial industry has identified circumstances of improper and fraudulent mortgage servicing and foreclosure practices and documentation, such as "robo signing," among some of the nation's largest lenders. This has resulted in lengthy legal investigations and lawsuits brought by the various state attorneys general relating to the foreclosure practices of several financial institutions and their service providers and the suspension of foreclosures of single-family homes nationwide, including the Bank's service areas. Federal National Mortgage Association ("Fannie Mae") and Federal Home Loan Mortgage Corporation ("Freddie Mac") also have stated that their mortgage servicers will be held liable for losses incurred by the government-sponsored enterprises as a result of flawed foreclosure processes. Further, the SEC has issued a request for information about accounting and disclosure issues related to potential risks and costs associated with mortgage and foreclosure related activities.In February 2012, these lenders entered into a $25 billion joint state-federal agreement under which the lenders promise to send direct payments to people who were victims of foreclosure servicing abuse and adhere to certain servicing processes and procedures going forward. Homeowners that borrowed through Fannie Mae and FreddieMac, however, are not covered under the settlement. The Company was not a party to this litigation and is not a party to the joint settlement agreement.The Company has a centralized foreclosure process within a single department of the Bank, including foreclosures relating to all residential, home equity, commercial, and serviced loans. As of December 31, 2011, the Bank serviced $78.5 million in loans guaranteed by Fannie Mae or Freddie Mac as part of various securitization transactions. In addition, the Company engages a loan servicer to support the administration and the resolution of certain covered assets, including single-family covered assets acquired by the Bank in FDIC-assisted transactions. Failure to comply with the applicable mortgage servicing and foreclosure requirements could have an adverse impact on the Company's reputation and results of operations.New lines of business or new products and services may subject the Company to additional risks.From time to time, the Company may implement new lines of business or offer new products or services within existing lines of business. There can be substantial risks and uncertainties associated with these efforts, particularly in instances where the markets are not fully developed. In developing and marketing new lines of business and/or new products or services, the Company may invest significant time and resources. Initial timetables for the introduction and development of new lines of business and/or new products or services may not be achieved, and price and profitability targets may not prove feasible. External factors, such as compliance with regulations, competitive alternatives, and shifting market preferences, may also impact the successful implementation of a new line of business or a new product or service. Furthermore, any new line of business and/or new product or service could have a significant impact on the effectiveness of the Company's system of internal controls. Failure to successfully manage these risks in the development and implementation of new lines of business or new products or services could have a material adverse effect on the Company's business, financial condition, and results of operations.categorizedisclose these securities according to a fair value hierarchy. Less than one percent of the Company's available-for-sale securities were categorized in level 1 of the fair value hierarchy (meaning that the fair values were based on quoted market prices).hierarchy. Over 98%97% of the Company's available-for-sale securities were categorized in level 2 of the fair value hierarchy (meaning that their fair values were determined by quoted prices for similar instruments or other observable inputs). Theand the remaining securities were categorized as level 3 (meaning that their3. See Note 22 of "Notes to the Consolidated Financial Statements" in Item 8 of this Form 10-K for a detailed description of the fair values were determined by inputs that are unobservable in the market and therefore require a greater degree of management judgment).2011,2014, especially if the security is sold during a period of illiquidity or market disruption or as part of a large block of securities under a forced transaction. Any resulting write-downs of the fair value of the Company's available-for-sale securities would reduce earnings in the period in which it is recorded and could have a material adverse effect on the Company's business, financial condition, and results of operations.The Company's investment in bank-owned life insurance ("BOLI") may decline in value.The Company has bank-owned life insurance contracts with a cash surrender value ("CSV") of $206.2 million as of December 31, 2011. A majority of these contracts are separate account contracts. These contracts are supported by underlying investments whose fair values are subject to volatility in the market. The Company has limited its risk of loss in value of the securities through the use of stable value contracts that provide protection from a decline in fair value down to 80% of the CSV of the insurance policies. To the extent fair values on individual contracts fall below 80% of book value, the CSV of specific contracts may be reduced or the underlying assets transferred to short-duration investments, resulting in lower earnings. As of December 31, 2011, the fair value for all contracts exceeded 80% of book value, but turmoil in the market could result in declines that could have a material adverse effect on the Company's financial condition and results of operations.2011,2014, the Company had $283.7$334.2 million of goodwill and other intangible assets. If the Company's stock price declines and remains low for an extended period of time, the Company could be required to write off all or a portion of its goodwill, which represents the value in excess of the Company's tangible book value.goodwill. The Company's stock price is subject to market conditions that can be impacted by forces outside of the control of management, such as a perceived weakness in financial institutions in general, and may not be a direct result of the Company's performance. In addition, a significant decline in the Company's expected future cash flows, a significant adverse change in the business climate,and/orand other intangible assets would reduce earnings in the period in which it is recorded and could have a material adverse effect on the Company's business, financial condition, and results of operations.SuchThese competitors primarily include national, regional, and community banks within the markets in which the Company operates. The Company also faces competition from many other types of financial institutions, including savings and loan associations, credit unions, personal loan and finance companies, retail and discount stockbrokers, investment advisors, mutual funds, insurance companies, and other financial intermediaries. The financial services industry could become even more competitive as a result of legislative, regulatory, and technological changes; further illiquidity in the credit markets; and continued consolidation. Banks, securities firms, and insurance companies can merge under the umbrella of a financial holding company,an FHC, which can offer virtually any type of financial service, including banking, securities underwriting, insurance, and merchant banking. Also, technology has lowered barriers to entry and made it possible for non-banks to offer products and services traditionally provided by banks, such as automatic funds transfer and automatic payment systems. Many of the Company's competitors have fewer regulatory constraints and may have lower cost structures. In addition, dueDue to their size, many competitors may be able to achieve economies of scale and, as a result, may offer a broader range of products and services, as well as better pricing for those products and services than the Company can offer.•relationships;•position;•demands;•services;•service; and•generally is dependent upondepends to a large extent on the business environment in the suburban metropolitan Chicago market, the statestates of Illinois, Indiana, and Iowa, and the U.S. as a whole. In particular, the currentbusiness environment impacts the ability of borrowers to pay interest on and repay principal of outstanding loans as well as the value of collateral securing those loans. A favorable business environment is generally characterized by economic growth, low unemployment, efficient capital markets, low inflation, high business and investor confidence, strong business earnings, and other factors. Unfavorable or uncertain economic and market conditions can be caused by declines in economic growth, business activity, or investor or business confidence; limitations on the availability or increases in the cost of credit and capital; increases in inflation or interest rates; high unemployment; natural disasters; or a combination of these or other factors.statestates of Illinois, Indiana, and Iowa, and the U.S. as a whole experienced a downward economic cycle. Significant weakness in market conditions adversely impacted all aspects of the economycycle, including the Company's business. In particular, dramatic declines in the housing market, with decreasing home prices and increasing delinquencies and foreclosures, negatively impacted the credit performance of construction loans,a significant recession from which resulted in significant write-downs of assets by many financial institutions.it is slowly recovering. Business activitygrowth across a wide range of industries and regions was greatlyin the United States remains reduced, and local governments and many businesses experienced serious difficulty duecontinue to experience financial difficulty. Since the recession, economic growth has been slow and uneven, unemployment levels generally remain elevated and there are continuing concerns related to the lacklevel of consumer spendingU.S. government debt and the lack of liquidity in the credit markets. In addition, unemployment increased significantly duringfiscal actions that period. The business environment was adverse for many households and businesses in the suburban metropolitan Chicago market, the state of Illinois, the U.S., and worldwide.While economic conditions beganmay be taken to improve in 2011, the recent depressed business environment had an adverse effect on the Company's business.address that debt. There can be no assurance that the current improvementeconomic conditions will continue to improve, and future economic deterioration would likely exacerbate the adverse effectsthese conditions could worsen. Periods of recent difficult market conditionsincreased volatility in financial and other markets, such as those experienced recently with regard to oil and other commodity prices and current rates, and those that may arise from global political tensions and re-emerging concerns over European sovereign debt risk, can have a direct or indirect negative impact on the Company and othersour customers and introduce greater uncertainty into credit evaluation decisions and prospects for growth. Economic pressure on consumers and uncertainty regarding continuing economic improvement may also result in the financial institutions industry. Market stresschanges in consumer and business spending, borrowing and saving habits.and therefore,or its business, financial condition, andor results of operations, as well as other potential adverse impacts, including:••••forecastsanalysis of economic conditions and the impact of these economic conditions on borrowers' ability to repay their loans. The process could no longer be capable of accurate estimation and may, in turn, impact its reliability.••current levelsperiods of market disruption and volatility continue or worsen, there can be no assuranceConcerns about the European Union's sovereign debt crisis have also caused uncertainty for financial markets globally. Although the Company does not have direct exposure to European sovereign debt, these circumstances could indirectly affect the Company through general disruption in the global markets and the related effects on national and local economies, perceived weakness or market concerns about bank stocks generally, the Bank's hedging activities, customers with European businesses or assets denominated in the Euro, or companies in the Company's market with European businesses or affiliates.company'sCompany's investment securities.has historically experienced extremely low default rates, municipal securities are subject to systemic risk since cash flows are generally dependent upondepend on (i) the ability of the issuing authority to levy and collect taxes or (ii) the ability of the issuer to charge for and collect payment for essential services rendered. If the issuer defaults on its payments, it may result in the recognition of OTTI or total loss, which could have a material adverse effect on the Company's business, financial condition, and results of operations.use or sell the affected property or to repay the indebtedness secured by the property. In addition, future laws or more stringent interpretations or enforcement policiesSuchThese events could affect the stability of the Company's deposit base, impair the ability of borrowers to repay outstanding loans, reduce the value of collateral securing loans, cause significant property damage, result in loss of revenue, and/or cause the Company to incur additional expenses. Although management has established disaster recovery policies and procedures, the occurrence of any such event could have a material adverse effect on the Company's business, which, in turn, could have a material adverse effect on its financial condition, and results of operations.Recent and/or future Despiterecent actions taken by the U.S. governmentpast several years, due to raiseconcerns over the U.S. debt limit and address budget deficit, concerns, Standard & Poor's Rating Services ("S&P")the major ratings agencies have downgraded or lowered their outlooks for the U.S.'s credit rating from AAA to AA+ in 2011. It is difficult to predict the effect of this action, or of any futurerating. Further downgrades or changes in outlook by S&P or either of the other two majorU.S. federal government's sovereign credit rating, agencies. However, these eventsand the perceived creditworthiness of U.S. government-backed obligations, could impact the trading market forCompany's ability to obtain funding that is collateralized by affected instruments and to access capital markets on favorable terms. Such downgrades could also affect the pricing of funding, when funding is available. A downgrade of the credit rating of the U.S. government, securities, including agency securities, and the securities markets more broadly, and, consequently, could impact the value and liquidityor of financial assets, including assets in the Company's investment and bank-owned life insurance portfolios. These actions couldits agencies, government-sponsored enterprises or related institutions, agencies or instrumentalities, may also create broader financial turmoil and uncertainty, which may negativelyadversely affect the global banking systemmarket value of such instruments and, limitfurther, exacerbate the availability of funding, including borrowings under repurchase arrangements, at reasonable terms. In turn, thisother risks to which the Company is subject. These events could have a material adverse effect on the Company's financial condition, results of operations, and liquidity.The Company's business, may be adversely affected by the impact of uncertainty about the financial stability of troubled European Union member economies.Certain European Union member countries have fiscal obligations greater than their fiscal revenue, which has caused investor concern over such countries' ability to continue to service their debt and foster economic growth. Federal regulators are closely monitoring U.S. money market funds' exposure to commercial paper issued by European banks. Approximately one-half of all prime money market funds are invested in European bank commercial paper and those European banks are heavily invested in government bonds issued by the troubled economies of Greece, Portugal, and Spain. A default by any of those countries could have a broad negative effect on U.S. and world economies.In addition, the European debt crisis has caused credit spreads to widen in the fixed income debt markets and liquidity to be less abundant. A weaker European economy may transcend Europe, cause investors to lose confidence in the safety and soundness of European financial institutions and the stability of European member economies, and likewise impact U.S.-based financial institutions, the stability of the global financial markets, and the economic recovery underway in the U.S. The Company cannot predict the current or future impact this uncertainty may have on its financial condition, or results of operations.policiesother supervisory guidance for possible changes.or regulatory policies, or other supervisory guidance, including changes in the interpretation or implementation of those regulations or policies, could affect the Company in substantial and unpredictable ways and could have a material adverse effect on the Company's business, financial condition, and results of operations. SuchThese changes could subject the Company to additional costs, limit the types of financial services and products the Company may offer, and/orlimit the activities it is permitted to engage in, and increase the ability of non-banks to offer competing financial services and products. Failure to comply with laws, regulations, policies, or policiesother regulatory guidance could result in civil or criminal sanctions by regulatory agencies, civil monetary penalties, and/orand damage to the Company's reputation, whichreputation. Government authorities, including the bank regulatory agencies, are pursuing aggressive enforcement actions with respect to compliance and other legal matters involving financial activities. Any of these actions could have a material adverse effect on the Company's business, financial condition, and results of operations. While the Company has policies and procedures designed to prevent any such violations, there can be no assurance that such violations will not occur. See the section captioned "Supervision and Regulation" in Item 1, "Business," and Note 1819 of "Notes to the Consolidated Financial Statements" included in Item 8 "Financial Statements and Supplementary Data," of this Form 10-K. recent financial market crisis, the U.S. government, specifically the Treasury, Federal Reserve, and FDIC, working in cooperation with foreign governments and other central banks, has takentook a variety of extraordinary measures designed to restore confidence in the financial markets and to strengthen financial institutions. The rulemaking relating to these measures was accomplished on an emergency basis in order to address immediate concerns about the stability and continued existence of the global financial system. Recovery programs were rapidly proposed, adopted, and sometimes quickly abandoned in response to changing market conditions and other concerns. The speed of market developments required the government to abandon its traditional pattern and timeline of legislative and regulatory rulemaking, and issue rules on an interim basis without prior notice and comment. Rulemaking in this manner, rather than through the traditional legislative practice, does not allow for input by regulated financial institutions, such as the Company, and could lead to uncertainty in the financial markets, disruption to the Company's business, increased costs, and material adverse effects on the Company's business, financial condition, and results of operations.On July 21, 2010, President Obama signed into law thewhich significantly changeschanged the current bank regulatory structure and affects the lending, deposit, investment, trading, and operating activities of financial institutions and their holding companies. The Dodd-Frank Act requires various federal agencies to adopt a broad range of new rules and regulations and to prepare numerous studies and reports for Congress. The federal agencies are given significant discretion in drafting and implementing rules and regulations and, consequently, many of the details and much of the impact of portions of the Dodd-Frank Act that remain to be implemented may not be known for many months oruntil final rules are adopted and market practices and structures develop around the rules, which may take several years. See the section titled "Supervision and RegulationRegulation" in Item 1"1 of this Form 10-K for a discussion of several significant provisions of the Dodd-Frank Act.take effectoccur over several years, making it difficult to anticipate the overall financial impact on the Company. However, compliance with this new lawlaws and its regulations likely will result in additional operating costs that could have a material adverse effect on the Company's business, financial condition, and results of operations.On June 29, 2011, theapprovedhas implemented final rules establishing standards for debit card interchange fees and prohibiting network exclusivity arrangements and routing restrictions as required by the Dodd-Frank Act. A debit card interchange fee is a fee paid by a merchant's bank to the customer's bank for the use of the debit card. The effective date for the cap on interchange fees was October 1, 2011.The short-term and long-term impact of the new Basel III final framework on capital and liquidity ratio requirements is uncertain.The Basel III final framework introduces a new capital measure and specifies adjustments to the instruments that comprise Tier 1 capital. In addition, the Basel III final framework requires banks and bank holding companies to measure their liquidity against specific liquidity tests that, although similar in some respects to liquidity measures historically applied by banks and regulators for management and supervisory purposes, going forward will be required by regulation. For a more detailed description of this proposal, refer to the section titled "Supervision and Regulation" in Item 1, "Business" of this Form 10-K. The U.S. banking agencies have indicated informally that they expect to implement regulations in mid-2012. These new standards are subject to further rulemaking and their terms may well change before implementation. The resulting impact of Basel III on the Company's capital and liquidity ratios and compliance costs is unknown, and could negatively affect the costs and availability of capital alternatives. In addition, requirements to maintain higher levels of capital or liquid assets could adversely impact the Company's net income and return on equity.have promulgatedissued joint guidance on sound risk management practices for financial institutions with concentrations in commercial real estate lending. Under the guidance, a financial institution that is actively involved in commercial real estate lending should perform a risk assessment to identify concentrations. A financial institution may have a concentration in commercial real estate lending if (i) total reported loans for construction, land development, and other land represent 100% or more of total capital or (ii) total reported loans secured by multi-family and non-farm residential properties, loans for construction, land development, and other land loans otherwise sensitive to the general commercial real estate market, including loans to commercial real estate related entities, represent 300% or more of total capital. The joint guidance requires heightened risk management practices including board and management oversight and strategic planning, development of underwriting standards, risk assessment, and monitoring through market analysis and stress testing. The Company is currently in compliance with these regulations. If regulators determine the Company is in violation of these restrictions or has not adequately implemented risk management practices, they could impose additional regulatory restrictions against the Company, which could have a material negativeadverse impact on the Company's business, financial condition, and results of operations.The Company and its subsidiaries are subject to examinations and challenges by taxing authorities.In the normal course of business, the Company and its subsidiaries are routinely subjected to examinations and challenges from federal and state taxing authorities regarding tax positions taken by the Company and the determination of the amount of tax due. These examinations may relate to income, franchise, gross receipts, payroll, property, sales and use, or other tax returns filed, or not filed, by the Company. The challenges made by taxing authorities may result in adjustments to the amount of taxes due, and may result in the imposition of penalties and interest. If any such challenges are not resolved in the Company's favor, they could have a material adverse effect on the Company's financial condition, results of operations, and liquidity.The Company and its subsidiaries are subject to changes in federal and state tax laws and changes in interpretation of existing laws.The Company's financial performance is impacted by federal and state tax laws. Given the current economic and political environment, and ongoing budgetary pressures, the enactment of new federal or state tax legislation may occur. The enactment of such legislation, or changes in the interpretation of existing law, including provisions impacting income tax rates, apportionment, consolidation or combination, income, expenses, and credits, may have a material adverse effect on the Company's financial condition, results of operations, and liquidity.bases. basis.dependent upondepending on a number of factors, including the ability to realize the asset through carryback or carryforward to taxable income in prior or future years, the future reversal of existing taxable temporary differences, future taxable income, and the possible application of future tax planning strategies. A valuation allowance is established for any deferred tax asset for which recovery or settlement is not more likely than not.The Company is subject to claims and litigation pertaining to fiduciary responsibility.From time to time, customers make claims and take legal action pertaining to the Company's performance of its fiduciary responsibilities. Whether customer claims and legal action related to the Company's performance of its fiduciary responsibilities are founded or unfounded, if such claims and legal action are not resolved in a manner favorable to the Company, they may result in significant financial liability and/or adversely affect the market perception of the Company and its products and services as well as impact customer demand for those products and services. Any financial liability or reputational damage could have a material adverse effect on the Company's business, which, in turn, could have a material adverse impact on its financial condition and results of operations.In August 2011, the Bank was named in a purported class action lawsuit filed in the Circuit Court of Cook County, Illinois on behalf of certain of the Bank's customers who incurred overdraft fees. The lawsuit is based on the Bank's practices pursuant to debit card transactions, and alleges, among other things, that these practices have resulted in customers being unfairly assessed overdraft fees. The lawsuit seeks an unspecified amount of damages and other relief, including restitution.The Company believes that the complaint contains significant inaccuracies and factual misstatements and that the Bank has meritorious defenses. As a result, the Bank intends to vigorously defend itself against the allegations inthe lawsuit. The Bank filed a motion to dismiss this claim in November 2011, and the plaintiff filed an amended complaint in February 2012. other legal proceedings pending against the Company and its subsidiaries in the ordinary course of business. While the outcome of any legal proceeding is inherently uncertain, based on information currently available, the Company's management believes that any liabilities arising from pending legal matters would be immaterial.immaterial based on information currently available. However, if actual results differ from management's expectations, it could have a material adverse effect on the Company's financial condition, results of operations, or cash flows.FDIC-Assisted Transactions and Other Acquisition ActivityIn the past, thehas strategically acquiredlooks to acquire whole banks, or branches of other banks.banks, and non-banking organizations. The Company may consider future acquisitions of banks and non-banks to supplement internal growth opportunities.opportunities, as permitted by regulators. The Company seeks merger or acquisition partners that are culturally similar and possess either significant market presence or have potential for improved profitability through financial management, economies of scale, or expanded services. Acquiring other banks, branches, or branchesnon-banks involves potential risks that could have a material adverse impact on the Company's business, financial condition, orand results of operations, including:•banks;•Exposure to asset quality issues of acquired banks;•business;•banks;•profitability;•attention;•integration;•holdingsholders of the Company's Common Stock;•company;•long-term;•amounts;•benefits; and•typicallymay involve the payment of a premium over book and market values, and therefore, some dilution of the Company's tangible book value and net income per common share may occur in connection with any future transaction. Furthermore, failure to realize the expected revenue increases, cost savings, increases in geographic or product presence, and/or other projected benefits from an acquisition could have a material adverse effect on the Company's financial condition and results of operations.Competition for acquisitions is intense. The Company has engaged in FDIC-assisted transactions and may engage in future FDIC-assisted transactions, which could present additional risks to its business.In the current economic environment, the Company may be presented with opportunities to acquire the assets and liabilities of failed banks in FDIC-assisted transactions. These acquisitions involve risks similar to acquiringexisting banks even though the FDIC might provide assistance to mitigate certain risks, such as sharing in exposure to credit losses and providing indemnification against certain liabilities of the failed institution. However, because these acquisitions involve failing banks and are structured in a manner that do not allow the Company the time normally associated with preparing for and evaluating an acquisition (including preparing for integration of an acquired institution), the Company may face additional risks if it engages in FDIC-assisted transactions. The assets the Company would acquire would be more troubled than in a typical acquisition. The deposits the Company would assume would generally be higher priced than in a typical acquisition and, therefore, subject to higher attrition. Integration could be more difficult in this type of acquisition than in a typical acquisition since key staff would have departed. Any inability to overcome these risks could have an adverse effect on the Company's ability to achieve its business strategy and maintain its market value and profitability.Moreover, even if the Company is inclined to participate in additional FDIC-assisted transactions, the Company can only participate in the bid process if it receives approval of bank regulators. There can be no assurance that the Company will be allowed to participate in the bid process, or what the terms of such transaction might be or whether the Company would be successful in acquiring the bank or targeted assets. The Company may be required to raise additional capital as a condition to, or as a result of, participation in an FDIC-assisted transaction. Any such transactions and related issuances of stock may have a dilutive effect on earnings per common share and share ownership.Furthermore, assuming the Company is allowed to and chooses to participate in FDIC-assisted transactions, the Company may face competition from other financial institutions. To the extent that our competitors are selected to participate in FDIC-assisted transactions, our ability to identify and attract acquisition candidates and/or make acquisitions on favorable terms may be adversely affected.significant losses, and thepotential losses.may become dependent upon third party vendors in connection with FDIC-assisted transactions.In 2009 and 2010, the Company acquired the majority of the assets of three financial institutions inhas completed four FDIC-assisted transactions. MostIn three of those transactions, most loans and OREO acquired in the acquisitions are covered by the FDIC Agreements. Under the FDIC Agreements, under which the FDIC will reimburse the Bank for a portion of the losses and eligible expenses arising from certain assets of the acquired institutions.The Company has engaged a third party loan servicing vendor to administer a portion of the assets subject to the FDIC Agreements, and may engage this or another vendor to provide similar services in the future if the Company engages in future FDIC-assisted transactions. As a result, the Company is, and may increasingly become, dependent upon this vendor to provide key services to the Bank. While the Company carefully selected this vendor, the Company may not control the vendor's actions. Any failure by the vendor to complyNon-compliance with the terms of any loss share arrangement the Bank has with the FDIC or to properly serviceAgreements could result in the loans and OREO covered by any loss share arrangement, may causeof reimbursement on individual loans, or large pools of loans, to lose eligibility for reimbursement to the Bank from the FDIC. Thisor OREO and could result in material losses that are currently not anticipated and could adversely affect the Company's business or financial condition.Furthermore, the event the Bank engages in additional FDIC-assisted transactions with loss share arrangements,and the Company's dependencerelated FDIC indemnification asset, rely on this vendor could increase. The services provided by this vendor are unique and not provided by many vendors either locally or nationwide. As a result, the Company's ability to replace this vendor could entail significant delay, expense, and risk to the Company, its business operations, and financial condition.The Companyestimates that may not realize all of the expected benefits of its FDIC-assisted transactions.acquired in FDIC-assisted transactions.acquired. Although management makes various assumptions and judgments about the collectability of the acquired loans, including the creditworthiness of borrowers and the value of the real estate and other assets serving as collateral for the repayment of secured loans associated with these transactions, its estimates of the fair value of assets acquired could be inaccurate. Valuing these assets using inaccurate assumptions could materially and adversely affect the Company's business, financial condition, and results of operations, and future prospects.operations.InFor loans acquired in FDIC-assisted transactions that include loss-share agreements,FDIC Agreements, the Company records an FDIC indemnification asset that reflects its estimate of the timing and amount of reimbursements for future losses that are anticipated to occur. In determining the size of the FDIC indemnification asset, the Company analyzes the loan portfolio based on historical loss experience, volume and classification of loans, volume and trends in delinquencies and non-accruals, local economic conditions, and other pertinent information. Changes in the Company's estimate of the timing of those losses, specifically if those losses are to occur beyond the applicable loss-share periods, may result in impairments of the FDIC indemnification asset, which would have a material adverse effect on the Company's financial condition and results of operations. If the assumptions related to the timing or amount of expected losses are incorrect, there could be a negative impact on the Company's operating results. Increases in the amount of future losses in response to different economic conditions or adverse developments in the acquired loan portfolio may result in increased charge-offs, which would also negatively impact the Company's business, financial condition, and results of operations.reportForm 10-K and is subject to the same market forces that affect the price of common stock in any public company. As a result, if you acquire the Company's Common Stock, you could lose some or all of your investment.•operations;•analysts;•Company;•industry;•competitors;•competitors;•competitors;•acquisitions;•regulations; and•stockCommon Stock price to decrease regardless of operating results.NasdaqNASDAQ Stock Market, Exchange, theits trading volume in its Common Stock may be less than that of other, larger financial services companies. A public trading market having the desired characteristics of depth, liquidity, and orderliness depends on the presence in the marketplace of willing buyers and sellers of the Company's Common Stock at any given time. This presence depends on the individual decisions of investors and general economic and market conditions over which the Company has no control. During any period of lower trading volume of the Company's Common Stock, significant sales of shares of the Company's Common Stock, or the expectation of these sales could cause the Company's Common Stock price to fall.or finance acquisitions, or upon the exercisefor other corporate purposes, or conversion of outstanding options,in connection with its share-based compensation plans or retirement plans, and, if it does, the ownership percentage of holders of the Company's Common Stock could be diluted, potentially materially.On March 16, 2009, the Board of Directors of First Midwest Bancorp, Inc. ("the Board") announced a reduction in thequarterly Common Stockfourth quarter 2014 cash dividend from $0.225was $0.08 per share to $0.01 per share. While the Company considers future capital strategies, including an increase in quarterly dividends, any increase will be subject to regulatory review. The Company has not established a minimum dividend payment level, and the amount of its dividend may fluctuate. All dividends will be made at the discretion of the Board of Directors of First Midwest Bancorp, Inc. (the "Board") and will depend uponon the Company's earnings, financial condition, and such other factors as the Board may deem relevant from time to time. The Board may, at its discretion, further reduce or eliminate dividends or change its dividend policy in the future. has issued Federal Reserve Supervision and Regulation Letter SR-09-4, which requires bank holding companies to inform and consult with Federal Reserve supervisory staff prior to declaring and paying a dividend that exceeds earnings for the period for which the dividend is being paid. Under this regulation, if the Company experiences losses in a series of consecutive quarters, it may be required to inform and consult with the Federal Reserve supervisory staff prior to declaring or paying any dividends. In this event, there can be no assurance that the Company's regulators will approve the payment of such dividends. the Company's capital or raise additional capital by making additional offerings of debt or preferred equity securities, including trust-preferred securities, senior or subordinated notes, and preferred stock. UponIn the event of liquidation, holders of the Company's debt securities and shares of preferred stock and lenders with respect to other borrowings will receive distributions of the Company's available assets prior to the holders of the Company's Common Stock. Additional equity offerings may dilute the holdings of the Company's existing stockholders or reduce the market price of the Company's Common Stock, or both. Holders of the Company's Common Stock are not entitled to preemptive rights or other protections against dilution. classes or series of preferred stock from time to time without any action on the part of the Company's stockholders. The Board also has the power, without stockholder approval, to set the terms of any such classes or series of preferred stock that may be issued, including voting rights, dividend rights, and preferences over the Company's Common Stock with respect to dividends or upon the Company's dissolution, winding-up, liquidation, and other terms. If the Company issues preferred stock in the future that has a preference over the Company's Common Stock with respect to the payment of dividends or upon liquidation, or if the Company issues preferred stock with voting rights that dilute the voting power of the Company's Common Stock, the rights of holders of the Company's Common Stock or the market price of the Company's Common Stock could be adversely affected.The Company does not have any unresolved comments pending with the SEC staff.the Bank, and certain subsidiary operational facilities are located in a 16-story office building inat One Pierce Place, Itasca, Illinois, which isand are leased from an unaffiliated third party. The Company occupies a total of 102 facilities as presented in the following table.December 31,2011Bank offices:Executive office in Itasca, Illinois1Bank branches98Operational facility in Joliet, Illinois1Dedicated lending office in Champaign, Illinois1Dedicated commercial banking office in Chicago, Illinois1Total bank offices102Bank offices owned and not subject to any material liens79Leased bank offices23Total bank offices102Total ATMs132Theconducts business through 109 banking offices arelocations largely located in various communities throughout northern Illinois and northwestern Indiana, primarily the greater Chicago metropolitan suburban area. The Company also has banking offices inarea, as well as northwest Indiana, central and western Illinois, and eastern Iowa. At certain Bank locations, excess space is leased to third parties. MostThe majority, approximately 80%, of the Company's banking locations are owned and 20% are leased.locations, and some of themlocations. Some ATMs are independently located. In addition, the Company owns other real property that, when considered individually or in the aggregate, is not material to the Company's financial position.78 of "Notes to the Consolidated Financial Statements" in Item 8 of this Form 10-K.The naturethe business, of the Bank and the Company's other subsidiaries ordinarily results in athere were certain amount of claims, litigation, investigations, and legal and administrative cases and proceedings, all of which are considered incidental to the normal conduct of business. In managing such matters, management considers the merits and feasibility of all options and strategies available to the Company, including litigation prosecution, arbitration, insurance coverage, and settlement. Generally, if the Company determines it has meritorious defenses to a matter, it vigorously defends itself.In August 2011, the Bank was named in a purported class action lawsuit filed in the Circuit Court of Cook County, Illinois on behalf of certain of the Bank's customers who incurred overdraft fees. The lawsuit is based on the Bank's practices pursuant to debit card transactions, and alleges, among other things, that these practices have resulted in customers being unfairly assessed overdraft fees. The lawsuit seeks an unspecified amount of damages and other relief, including restitution.The Company believes that the complaint contains significant inaccuracies and factual misstatements and that the Bank has meritorious defenses. As a result, the Bank intends to vigorously defend itself against the allegations inthe lawsuit. The Bank filed a motion to dismiss this claim in November 2011, and the plaintiff filed an amended complaint in February 2012.Currently, there are certain other legal proceedings pending against the Company and its subsidiaries in the ordinary course of business.at December 31, 2014. While the outcome of any legal proceeding is inherently uncertain, based on information currently available, the Company's management believes thatdoes not expect any liabilities arising from pending legal matters are not expected to have a material adverse effect on the Company's business, financial position,condition, results of operations, or cash flows.NasdaqNASDAQ Global Select marketMarket tier of the NasdaqNASDAQ Stock Market. As of December 31, 2011,2014, there were 2,1351,960 stockholders of record, a number that does not include beneficial owners who hold shares in "street name" or shareholders(or stockholders from previously acquired companies that havedid not exchangedexchange their stock.stock). 2011 2010 2014 2013 Fourth Third Second First Fourth Third Second First Fourth Third Second First Fourth Third Second First $ 10.31 $ 12.72 $ 13.48 $ 13.07 $ 13.13 $ 13.43 $ 17.95 $ 14.43 $ 17.99 $ 17.77 $ 18.19 $ 17.83 $ 18.49 $ 16.20 $ 13.87 $ 13.60 $ 6.89 $ 7.22 $ 11.05 $ 10.79 $ 9.26 $ 10.72 $ 12.10 $ 10.37 15.01 15.64 15.49 15.36 14.90 13.81 11.57 12.11 $ 10.13 $ 7.32 $ 12.29 $ 11.79 $ 11.52 $ 11.53 $ 12.16 $ 13.55
$
0.01
$
0.01
$
0.01
$
0.01
$
0.01
$
0.01
$
0.01
$
0.01 0.08 0.08 0.08 0.07 0.07 0.04 0.04 0.01
0.39%
0.55%
0.33%
0.34%
0.35%
0.35%
0.33%
0.30% $ 12.93 $ 12.88 $ 12.74 $ 12.49 $ 12.40 $ 13.06 $ 13.00 $ 12.84 (1)Ratios are presented on an annualized basis.A furtherFurther discussion of the Company's philosophy regarding the payment of dividends is included in the "Management of Capital" section of "Management's Discussion and Analysis of Financial Condition and Results of Operations" in Item 7 of this Form 10-K.underin Items 1 and 1A of this Form 10-K.please refer tosee Item 12, "Security Ownership of Certain Beneficial Owners and Management and Related Stockholder Matters," of this Form 10-K.or depreciation andassuming the reinvestment of all dividends) to stockholders fromof the Company's Common Stock compared against a broad-market total return equity index, (the Standard & Poor's 500 Stock Index (the "S&P 500"))the NASDAQ Composite, and a published industry total return equity index, (the Standard & Poor's SmallCap 600the NASDAQ Banks, Index ("S&P SmallCap 600 Banks")) over a five yearfive-year period.S&P 500,NASDAQ Composite, and the S&P SmallCap 600NASDAQ Banks(1)
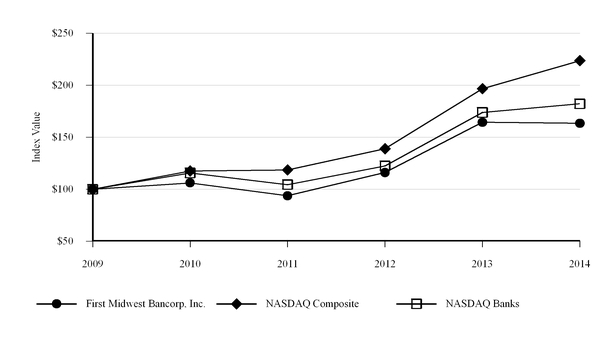
2006 2007 2008 2009 2010 2011 $ 100.00 $ 81.92 $ 56.17 $ 30.77 $ 32.66 $ 28.84 100.00 105.49 66.46 84.05 96.71 98.75 100.00 76.87 77.83 53.46 63.38 62.32 2009 2010 2011 2012 2013 2014 First Midwest Bancorp, Inc. $ 100.00 $ 106.14 $ 93.72 $ 116.22 $ 164.43 $ 163.45 NASDAQ Composite 100.00 117.61 118.70 139.00 196.83 223.74 NASDAQ Banks 100.00 115.72 104.50 122.51 173.89 182.21 (1)Assumes $100 invested on December 31, 2006 in the Company's Common Stock, the S&P 500, and the S&P SmallCap 600 Banks with the reinvestment of all related dividends.Assumes $100 invested on December 31, 2009 with the reinvestment of all related dividends. of 1933, as amended, or the Securities Exchange Act of 1934, the foregoing "Stock Performance Graph" will not be deemed incorporated, unless specifically provided otherwise in such filing and shall not otherwise be deemed filed under such Acts.2011.of 2014. The Board approved a stock repurchase program on November 27, 2007. Up to 2.5 million shares of the Company's Common Stock may be repurchased, and the total remaining authorization under the program was 2,494,747 shares as of December 31, 2011.2014. The repurchase program has no set expiration or termination date.(Number of shares in thousands) Total
Number of
Shares
Purchased (1) Average
Price
Paid per
Share Total Number
of Shares
Purchased as
Part of a
Publicly
Announced
Plan or
Program Maximum
Number of
Shares that
May Yet Be
Purchased
Under the
Plan or
Program - $ - - 2,494,747 - - - 2,494,747 14,053 9.91 - 2,494,747 14,053 $ 9.91 - Average Price Paid per Share October 1 – October 31, 2014 1,519 $ 16.10 — 2,494,747 November 1 – November 30, 2014 — — — 2,494,747 December 1 – December 31, 2014 1,024 16.87 — 2,494,747 Total 2,543 $ 16.41 — (1)Consists of shares acquired pursuant to the Company's share-based compensation plans and not the Company's Board-approved stock repurchase program. Under the terms of the Company's share-based compensation plans, the Company accepts previously owned shares of Common Stock surrendered by option holders upon exercise to cover the exercise price of the stock options or to satisfy tax withholding obligations associated with the vesting of restricted shares. shares acquired pursuant to the Company's share-based compensation plans and not the Company's repurchase program approved by its Board on November 27, 2007. Under the terms of these plans, the Company accepts shares of Common Stock from option holders if they elect to surrender previously owned shares upon exercise to cover the exercise price of the stock options or, in the case of restricted shares of Common Stock, the withholding of shares to satisfy tax withholding obligations associated with the vesting of restricted shares.The table above does not include the fourth quarter 2011 redemption of 193,000 Preferred Shares at $1,000 per share. For further details regarding the redemption of the Preferred Shares and the Company's stock repurchase programs, refer to the section titled "Management of Capital" in Item 7, "Management's Discussion and Analysis of Financial Condition and Results of Operations," of this Form 10-K.20112014 is presented in the following table. This summary should be read in conjunction with the consolidated financial statements and accompanying notes included in Item 8, "Financial Statements and Supplementary Data," of this Form 10-K. A more detailed discussion and analysis of the factors affecting the Company's financial condition and operating results is presented in Item 7, "Management's Discussion and Analysis of Financial Condition and Results of Operations," of this Form 10-K. Years ended December 31, As of or for the years ended December 31, 2011 2010 2009 2008 2007 2014 2013 2012 2011 2010 Operating Results (Amounts in thousands, except per share data) $ 36,563 $ (9,684 ) $ (25,750 ) $ 49,336 $ 80,159 $ 69,306 $ 79,306 $ (21,054 ) $ 36,563 $ (9,684 ) 25,437 (19,717 ) (35,551 ) 48,482 80,094 68,470 78,199 (20,748 ) 25,437 (19,717 ) $ 0.35 $ (0.27 ) $ (0.71 ) $ 1.00 $ 1.62 $ 0.92 $ 1.06 $ (0.28 ) $ 0.35 $ (0.27 ) 0.35 (0.27 ) (0.71 ) 1.00 1.62 0.92 1.06 (0.28 ) 0.35 (0.27 ) 0.040 0.040 0.040 1.155 1.195 0.31 0.16 0.04 0.04 0.04 12.93 12.40 13.66 14.72 14.94 14.17 13.34 12.57 12.93 12.40 10.13 11.52 10.89 19.97 30.60 17.11 17.53 12.52 10.13 11.52 2.69% (2.06% ) (4.84% ) 6.46% 10.68% 6.56 % 8.04 % (2.14 )% 2.69 % (2.06 )% 10.29 % 11.29 % (3.07 )% 3.86 % (3.15 )% 0.45% (0.12% ) (0.32% ) 0.60% 0.99% 0.80 % 0.96 % (0.26 )% 0.45 % (0.12 )% 4.04% 4.13% 3.72% 3.61% 3.58% 11.43% (14.81% ) (5.63% ) 115.50% 73.77% 13.72% 14.31% 11.50% 9.30% 9.27% Net interest margin – tax-equivalent 3.69 % 3.68 % 3.86 % 4.04 % 4.13 % 1.00 % 1.14 % 1.80 % 3.86 % 4.24 % 1.49 % 2.13 % 2.68 % 4.85 % 5.25 % As of December 31, As of or for the years ended December 31, 2011 2010 2009 2008 2007 2014 2013 2012 2011 2010 Balance Sheet Highlights (Amounts in thousands) $ 7,973,594 $ 8,138,302 $ 7,710,672 $ 8,528,341 $ 8,091,518 $ 9,445,139 $ 8,253,407 $ 8,099,839 $ 7,973,594 $ 8,138,302 5,088,113 5,100,560 5,203,246 5,360,063 4,963,672 5,348,615 5,472,289 5,349,565 5,360,063 4,963,672 Total loans 6,736,853 5,714,360 5,387,570 5,348,615 5,472,289 6,479,175 6,511,476 5,885,279 5,585,754 5,778,861 7,887,758 6,766,101 6,672,255 6,479,175 6,511,476 252,153 137,744 137,735 232,409 230,082 200,869 190,932 214,779 252,153 137,744 75,000 112,500 147,418 736 136,064 Long-term portion of FHLB advances — 114,550 114,581 75,000 112,500 962,587 1,112,045 941,521 908,279 723,975 1,100,775 1,001,442 940,893 962,587 1,112,045 2.40% 2.84% 2.78% 1.75% 1.25% 1.24 % 1.52 % 1.91 % 2.28 % 2.65 % 0.54 % 0.55 % 3.26 % 1.91 % 2.70 % 13.68% 16.27% 13.94% 14.36% 11.58% 11.23 % 12.39 % 11.90 % 13.68 % 16.27 % 11.61% 14.20% 11.88% 11.60% 9.03% 10.19 % 10.91 % 10.28 % 11.61 % 14.20 % 9.28% 11.21% 10.18% 9.41% 7.46% 9.03 % 9.18 % 8.40 % 9.28 % 11.21 % 8.83% 8.06% 6.29% 5.23% 5.58% 8.41 % 9.09 % 8.44 % 8.83 % 8.06 % Dividend payout ratio 33.70 % 15.09 % N/M 11.43 % N/M Average equity to average assets ratio 12.03 % 11.74 % 11.93 % 13.72 % 14.31 % See the "Performance Overview" section of "Management's Discussion and Analysis of Financial Condition and Results of Operations" in Item 7 of this Form 10-K for detail regarding the calculation of this performance metric. Due to the impact of business combination accounting and protection provided by the FDIC Agreements, acquired loans and covered loans and covered OREO are excluded from these metrics to provide for improved comparability to prior periods and better perspective into asset quality trends. For a discussion of acquired and covered loans, see Notes 1 and 6 of "Notes to the Consolidated Financial Statements" in Item 8 of this Form 10-K. 2009 through 2011ended December 31, 2014 and Consolidated Statements of Financial Condition as of December 31, 20102014 and 2011.2013. When we use the terms "First Midwest," the "Company," "we," "us," and "our," we mean First Midwest Bancorp, Inc., a Delaware corporation, and its consolidated subsidiaries. When we use the term "Bank," we are referring to our wholly owned banking subsidiary, First Midwest Bank. For your reference, a glossary of certain terms is presented on pages 3Management's discussion and 4 of this Form 10-K. The discussion is designed to provide stockholders with a comprehensive review of our operating results and financial condition andanalysis should be read in conjunction with the consolidated financial statements, accompanying notes thereto, and other financial information presented in Item 8 of this Form 10-K.generallocal and national economic conditions, (nationallybusiness spending, consumer confidence, legislative and in our service areas), legislativeregulatory changes, and changes in real estate and securities markets. Our management evaluates performance using a variety of qualitative and quantitative metrics. The primary quantitative metrics whichused by management include:•Pre-Tax Pre-Provision Operating Earnings – Pre-tax pre-provision operating earnings (which reflect our operating performance before the effects of credit-related charges and other unusual, infrequent, or non-recurring revenues and expenses) is a non-GAAP financial measure, which we believe is useful because it helps investors to assess the Company's operating performance. A reconciliation of pre-tax, pre-provision operating earnings to GAAP can be found in Table 1.•is our primary source of revenue. Net interest incomerevenue, equals the difference between interest income and fees earned on interest-earning assets (such as loans and securities) and interest expense incurred on interest-bearing liabilities (such as deposits and borrowed funds).liabilities.• – Net interest margin equals net interest income divided by total average interest-earning assets.•(such as service charges on deposit accounts and wealth management fees), BOLIinvestment in bank-owned life insurance ("BOLI") and other income, and non-operating revenues (such as securities gainsrevenues.losses).employee benefits, net occupancy and equipment, professional services, and other costs.•isrepresents an estimation of the quality of our loan portfolio, including an assessment of the credit risk related to existing and potential loss exposure, and incorporates an evaluationcan be evaluated using a number of a variety of factors,quantitative measures, such as non-performing loans to total loans.• qualifying non-cumulative perpetual preferred stock, and qualifying trust-preferred securities, less goodwill and most intangible assets and (ii) Tier 2 capital includes qualifying subordinated debt and the allowance for credit losses, subject to limitations.condensed reviewquarterly summary of operations for the fourth quarter of 2011years ended December 31, 2014 and 2013 is included in the section titled "Fourth Quarter 2011 vs. 2010""Quarterly Earnings" of this Item 7. The summary provides an analysis of the quarterly earnings performance for the fourth quarter of 2011 compared to the same period in 2010.ContentsPERFORMANCE OVERVIEWTable 1Selected Financial Data(Dollar amountspending or consummated transactions, and growth strategies, including possible future acquisitions. These statements are subject to certain risks, uncertainties and assumptions. These risks, uncertainties and assumptions include, among other things, the following:thousands, except per share data) Years ended December 31, % Change 2011 2010 2009 2011-2010 2010-2009 $ 321,511 $ 328,867 $ 341,751 (2.2 ) (3.8 ) (39,891 ) (49,518 ) (90,219 ) (19.4 ) (45.1 ) 281,620 279,349 251,532 0.8 11.1 94,182 86,762 85,168 8.6 1.9 4,269 5,270 7,395 (19.0 ) (28.7 ) (250,218 ) (234,975 ) (212,734 ) 6.5 10.5 129,853 136,406 131,361 (4.8 ) 3.8 (80,582 ) (147,349 ) (215,672 ) (45.3 ) (31.7 ) 3,346 17,133 26,726 (80.5 ) (35.9 ) (936 ) (4,917 ) (24,616 ) (81.0 ) (80.0 ) - 4,303 13,071 - (67.1 ) - - 15,258 - (100.0 ) 1,076 - - 100.0 - (3,785 ) (23,367 ) (12,584 ) (83.8 ) 85.7 (5,901 ) (17,113 ) (5,970 ) (65.5 ) 186.6 - (3,324 ) - (100.0 ) 100.0 (2,000 ) - - 100.0 - - - (3,500 ) - (100.0 ) 41,071 (38,228 ) (75,926 ) 207.4 49.7 (4,508 ) 28,544 50,176 (115.8 ) (43.1 ) 36,563 (9,684 ) (25,750 ) 477.6 62.4 (10,776 ) (10,299 ) (10,265 ) 4.6 0.3 (350 ) 266 464 (231.6 ) (42.7 ) $ 25,437 $ (19,717 ) $ (35,551 ) 229.0 44.5 $ 0.35 $ (0.27 ) $ (0.71 ) 229.6 62.0 2.69% (2.06% ) (4.84% ) 0.45% (0.12% ) (0.32% ) 4.04% 4.13% 3.72% 62.12% 58.84% 57.86% (1)furthera discussion of losses realized on OREO, integration costs associatedthese risks, uncertainties and assumptions, you should refer to the sections entitled "Risk Factors" and "Management’s Discussion and Analysis of Financial Condition and Results of Operations" in this report, as well as our subsequent filings made with FDIC-assisted transactions, severance-related costs,the SEC. However, these risks and an FDIC special assessment, see the section titled "Noninterest Expense"uncertainties are not exhaustive. Other sections of this Item 7.report describe additional factors that could adversely impact our business and financial performance.(2)U.S. generally accepted accounting principles ("GAAP")GAAP and general practice within the banking industry. As a supplement to GAAP, the Company has provided thisprovides non-GAAP performance result. Theresults, which the Company believes that this non-GAAP financial measure isare useful because it helpsthey assist investors to assessin assessing the Company's operating performance. This includes, but is not limited to, earnings per share, excluding acquisition and integration related expenses, total non-interest expense, excluding acquisition and integration related expenses, tax-equivalent net interest income (including its individual components), tax-equivalent net interest margin, the efficiency ratio, tier 1 common capital to risk-weighted assets, tangible common equity to tangible assets, tangible common equity, excluding accumulated other comprehensive loss, to tangible assets, tangible common equity to risk-weighted assets, and return on average tangible common equity. Although this non-GAAP financial measure is intended to enhance investors' understanding of the Company's business and performance, thisthese non-GAAP financial measuremeasures should not be considered an alternative to GAAP.Contents December 31,
2011 December 31,
2010 Dollar
Change %
Change $ 7,973,594 $ 8,138,302 $ (164,708 ) (2.0 ) 5,088,113 5,100,560 (12,447 ) (0.2 ) 5,348,615 5,472,289 (123,674 ) (2.3 ) 6,479,175 6,511,476 (32,301 ) (0.5 ) 4,820,058 4,519,492 300,566 6.7 78.5% 78.3% 74.4% 69.4% $ 187,325 $ 211,782 $ (24,457 ) (11.5 ) 9,227 4,244 4,983 117.4 196,552 216,026 (19,474 ) (9.0 ) 17,864 22,371 (4,507 ) (20.1 ) 33,975 31,069 2,906 9.4 $ 248,391 $ 269,466 $ (21,075 ) (7.8 ) $ 27,495 $ 23,646 $ 3,849 16.3 121,962 145,072 (23,110 ) (15.9 ) 2.40% 2.84% (1)Excludes coveredthe Chicago area banking operations of Banco Popular North America, ("Popular"), doing business as Popular Community Bank. The acquisition included Popular's twelve full-service retail banking offices and its small business and middle market commercial lending activities in the Chicago metropolitan area. On the date of acquisition, the Bank acquired $549 million in loans and covered OREO. For$732 million in deposits.discussioncustomer of coveredthe Bank for more than 15 years, National Machine Tool, now known as First Midwest Equipment Finance Co., provides equipment leasing and financing alternatives to traditional commercial bank financing.covered OREO, refer to$464 million in deposits on the date of acquisition.53 of "Notes to the Consolidated Financial Statements" in Item 8 of this Form 10-K. Asset quality, including covered loansThe conversion and covered OREO, is includedintegration of these transactions were substantially complete as of December 31, 2014.the section titled "Loan Portfolio and Credit Quality" of this Item 7.In a challenged business environment, consistent sales focus helped us to hold loan balances steady as we significantly reduced our exposure to troubled real estate lending categories. Our overall credit metrics significantly improved from 2010 as we reduced potential problem credits by almost 30% during this period. At the same time, transactional deposit growth helped our margins remain over 4% and our fee-based revenues expand. Our net interest margin performance in 2012 will depend, to a large extent, on our ability to redeploy excess cash from lower-yielding, shorter-term investments to higher-yielding loans, as well as maintain transactional deposits.Over the course of 2011, we significantly invested in our businesses, aligned our sales resources to areas of growth and opportunity, and continued to implement operating efficiencies that will help prepare us to benefit from an improving credit environment and economy. These actions, coupled with the redemption of the Preferred Shares in the fourth quarter of 2011, better position us to pursue opportunities for growth. Years ended December 31, 2014 2013 2012 Operating Results Interest income $ 299,864 $ 287,247 $ 300,569 Interest expense 23,012 27,115 34,901 Net interest income 276,852 260,132 265,668 Provision for loan and covered loan losses 19,168 16,257 158,052 Noninterest income 126,618 140,883 109,948 Noninterest expense 283,826 256,737 267,500 Income (loss) before income tax expense (benefit) 100,476 128,021 (49,936 ) Income tax expense (benefit) 31,170 48,715 (28,882 ) Net income (loss) $ 69,306 $ 79,306 $ (21,054 ) Weighted-average diluted common shares outstanding 74,496 73,994 73,666 Diluted earnings (loss) per common share $ 0.92 $ 1.06 $ (0.28 ) Performance Ratios Return on average common equity 6.56 % 8.04 % (2.14 )% 10.29 % 11.29 % (3.07 )% Return on average assets 0.80 % 0.96 % (0.26 )% 3.69 % 3.68 % 3.86 % 64.57 % 64.19 % 67.14 % Tangible common equity ("TCE") represents common stockholders’ equity less goodwill and identifiable intangible assets. Acquisition and integration related expenses of $13.9 million for the year ended December 31, 2014 are excluded from the return on average tangible common equity ratio. See the "Management of Capital" section of this Item 7 for the detailed calculation of TCE. See the section titled "Earnings Performance" of this Item 7 for the calculation of this metric. The efficiency ratio expresses noninterest expense, excluding other real estate owned ("OREO") expense, as a percentage of tax-equivalent net interest income plus total fee-based revenues, other income, net trading gains, and tax-equivalent adjusted BOLI income. In addition, acquisition and integration related expenses of $13.9 million are excluded from the efficiency ratio for the year ended December 31, 2014. As of December 31, 2014 2013 $ Change % Change Balance Sheet Highlights Total assets $ 9,445,139 $ 8,253,407 $ 1,191,732 14.4 Total loans, excluding covered loans 6,657,418 5,580,005 1,077,413 19.3 Total loans, including covered loans 6,736,853 5,714,360 1,022,493 17.9 Total deposits 7,887,758 6,766,101 1,121,657 16.6 Core deposits 6,616,200 5,558,318 1,057,882 19.0 Loans-to-deposits ratio 85.4 % 84.5 % Core deposits to total deposits 83.9 % 82.1 % As of December 31, 2014 2013 $ Change % Change Non-accrual loans $ 58,853 $ 59,798 $ (945 ) (1.6 ) 90 days or more past due loans (still accruing interest) 771 3,708 (2,937 ) (79.2 ) Total non-performing loans 59,624 63,506 (3,882 ) (6.1 ) Accruing trouble debt restructuring ("TDRs") 3,704 23,770 (20,066 ) (84.4 ) OREO 25,779 32,473 (6,694 ) (20.6 ) $ 89,107 $ 119,749 $ (30,642 ) (25.6 ) 30-89 days past due loans (still accruing interest) $ 13,473 $ 20,742 $ (7,269 ) (35.0 ) Allowance for Credit Losses Allowance for credit losses 74,510 87,121 (12,611 ) (14.5 ) Allowance for credit losses to loans, excluding acquired loans, including covered loans 1.24 % 1.52 % Allowance for credit losses to non-accrual loans, excluding acquired and covered loans 114.33 % 124.69 % Due to the impact of business combination accounting and protection provided by the FDIC Agreements, acquired loans and covered loans and covered OREO are excluded from these metrics to provide for improved comparability to prior periods and better perspective into asset quality trends. For a discussion of acquired and covered loans, see Notes 1 and 6 of "Notes to the Consolidated Financial Statements" in Item 8 of this Form 10-K. Asset quality, including acquired loans, covered loans, and covered OREO, is included in the "Loan Portfolio and Credit Quality" section below. 20112014 Compared with 201020112014 was $36.6 million, before adjustments for preferred dividends and accretion and non-vested restricted shares, and $25.4$69.3 million, or $0.35$0.92 per share, applicablecompared to common shareholders after such adjustments. This compares to a net lossincome of $9.7 million and a net loss applicable to common shareholders of $19.7$79.3 million, or $0.27$1.06 per share, for 2010. Net2013. The reduction in earnings per share was driven primarily by acquisition and integration related expenses of $13.9 million related to the Popular, National Machine Tool, and Great Lakes acquisitions. Excluding these acquisition and integration related expenses, earnings per share was $1.03 for the year ended December 31, 2014. In addition, net income for 2011 improved2013 was impacted by $46.2certain significant transactions including a $34.0 million from 2010, reflectinggain on the steady advancementsale of our strategic priorities as we benefited from continued, solid earningsan equity investment and substantially lower credit costs.Pre-tax, pre-provision operating earningsa $7.8 million gain on the termination of $129.9 million for 2011 were down $6.6 million, or 4.8%, compared to 2010 primarily as a result of a $15.2 million, or 6.5%, increasetwo FHLB forward commitments, offset in noninterest expense, excluding losses on sales andwrite-downs of OREO, integration costs, and severance-related costs. This was partially offsetpart by a $7.4$13.3 million increase in fee-based revenues with such increase spread across all categories.20112014 was 4.04%,in line with 2013 despite continued pressure on loan margins and investment portfolio yields as we improved the mix of earning assets and liabilities through organic loan growth and acquisitions, employed certain loan hedging strategies, and prepaid $114.6 million of FHLB advances.decline$34.0 million gain on the sale of 9 basis points from 4.13% in 2010. The reduction in margin resulted from a 23 basis point decrease in the average yield on interest-earning assets, largely due to the cumulative effect of prior year securities salesan equity investment and a lower yield$7.8 million gain on securities as cash flows from securities paydowns and maturities repriced at lower interest rates. While loans also repriced at lower ratesthe termination of two FHLB forward commitments, offset in 2011, the reduction was more than offset by an increase in the yield on covered loans. This effect was partially offsetpart by a 16 basis point drop$13.3 million non-deductible write-down of the CSV of certain BOLI policies.average rate paid for interest-bearing liabilities, driven by a 14 basis point decline in the average rate paid for time depositsnewly acquired locations. The conversion and a 16 basis point reduction in the aggregate rate paid on interest-bearing transaction accounts. Asintegration of these transactions was substantially complete as of December 31, 2011, our loan-to-deposit ratio was 78.5%,2014, with 74.4%certain remaining efficiencies to be implemented in the first half of our customer deposits consisting of demand, NOW, money market, and savings transactional accounts.The rise in noninterest expense was a result of higher loan remediation costs; increased salaries related to the expansion of commercial, retail, and wealth management sales staff; and a $1.3 million correction of a 2010 actuarial pension expense calculation related to the valuation of future early retirement benefits recorded in fourth quarter 2011. 2015.In December 2011, we completed the purchase of certain Chicago-market deposits from Old National Bank of Evansville, Indiana ("Old National") and recorded a gain of $1.1 million. The transaction included $106.7 million in deposits (comprised of $70.6 million in transactional deposits and $36.1 million in time deposits) and one banking facility.2011,2014 our securities portfolio totaled $1.1$1.2 billion, decreasing 5.8%rising $56.5 million, or 4.9%, from December 31, 2010, following a 15.6% decrease from December 31, 2009. Our2013. The addition of $219.3 million of securities portfolio declined over the past three years as we took advantage of opportunitiesacquired in the market to sell securities at a gain given the low interest rate environment.Great Lakes transaction was substantially offset by maturities, calls, and prepayments during 2014. For a detailed discussion of our securities portfolio, refer tosee the section titled "Investment Portfolio Management" of this Item 7.includingexcluding covered loans, of $5.3 billion as of December 30, 2011 declined $123.7 million, or 2.3%, from $5.5$6.7 billion as of December 31, 2010. The natural decline2014 reflects growth of $1.1 billion, or 19.3%, from December 31, 2013. Excluding loans acquired in covered loan balances accounted for the majorityPopular and Great Lakes transactions of this reduction.Total$718.3 million, total loans, excluding covered loans, as of December 31, 2011 were stable compared to December 31, 2010. The office, retail, and industrial and other commercial real estate portfolios exhibited 6.2% growth during this period, substantially in the form of owner-occupied business relationships. Offsetting this progress, we continued to reduce our exposure to more troubled construction and multi-family real estate categories during 2011.Non-performing assets, excluding covered loans and covered OREO, were $248.4 million at December 31, 2011, decreasing $21.1grew $359.2 million, or 7.8%6.4%, from December 31, 2010. The reduction2013. This growth was substantially due to management's remediation activities, dispositions, charge-offs,driven by solid performance from our legacy sales platform and the returncontinued impact of accruing TDRs to performing status, partially offset by loans downgraded to non-accrual status.greater resource investments and expansion into certain sector-based lending areas, such as agri-business, asset-based lending, and healthcare. For a detailed discussion of non-performing assets, refer toour loan portfolio, see the section titled "Loan Portfolio and Credit Quality" of this Item 7.20112014 increased $152.4$330.2 million from 2013, driven primarily by deposits assumed in the Popular and Great Lakes acquisitions which further strengthened our core deposit base. Growth in average demand deposits of $248.5 million, or 2.2%13.2%, from 2010 resulting from a $433.0 million, or 10.0%, increaseDecember 31, 2013 led the rise in average transactionalcore deposits and a $12.5 million, or 9.1%, increasemore than offset the reduction in higher-costing time deposits, borrowed funds, and senior and subordinated debt. These increases were partially offset by declines in higher-costing time deposits of $199.6 million, or 10.0%, and borrowed funds of $93.5 million, or 26.0%. The rise in demand deposits and drop in time deposits resulted inFor a more favorable product mix. For adetailed discussion of our funding sources see the section titled "Funding and Liquidity Management" of this Item 7.In fourth quarter 2011, we redeemed all of the $193.0 million of Preferred Shares issued to the Treasury, resulting in the recognition of $1.5 million in accelerated accretion. We funded the redemption through a combination of existing liquid assets and proceeds from a $115.0 million senior debt offering. The notes, which have an interest rate of 5.875%, payable semi-annually, will mature in November 2016. In a related transaction, we redeemed the Treasury's associated Warrant. We paid $900,000 to the Treasury to redeem the Warrant, which concluded ourparticipation in the CPP. For a discussion of our capital position, see the section titled "Management of Capital" of this Item 7.20102013 Compared with 2009loss in 2010income for 2013 was $9.7$79.3 million, before adjustment for preferred dividends and non-vested restricted shares, with a $19.7 million loss, or $0.27$1.06 per share, applicable to common shareholders after such adjustments. This comparescompared to a net loss of $25.8 million, before adjustment for preferred dividends and non-vested restricted shares and net loss applicable to common shareholders of $35.6$21.1 million, or $0.71$0.28 per share, for 2009. The year-over-year improvement was largely due to higher2012.income and fee-based revenues and lower provisionmargin declined 18 basis points to 3.68% for loan losses, which more than offset higher noninterest expense, including losses recognized2013 from 3.86% for 2012. The reduction in margin reflected a 30 basis point decrease in the average yield on the sale and write-down of OREO.Pre-tax, pre-provision operating earnings for 2010 were $136.4 million, an increase of 3.8% from 2009. The increase over 2009 was primarily driven by higher average interest-earning assets improved net interest margins,due primarily to a lower yield earned on new and renewing loans as a result of greater fee-based revenues, whichcustomer preference for floating rate loans, as well as the reinvestment of cash flows from the investment portfolio into lower yielding securities. These lower yields were partially offset higher costs related to FDIC-assisted transactions and loan remediation activities.Our 2010 tax-equivalent net interest income increased $24.5 million compared to 2009. Interest expense declined $40.7 million, reflecting bothby a decline in total interest-bearing liabilities and the rates paid for those liabilities. Tax-equivalent interest income declined $16.2 million compared to 2009 due tointerest-bearing liabilities, including a 142 basis point decline in tax-equivalent yield. on interest-bearing core deposits, a 28 basis point decline on time deposits, and a 3 basis point decline on senior and subordinated debt.netprovision for loan and covered loan losses was $16.3 million for 2013 compared to $158.1 million for 2012. The higher provision for loan and covered loan losses for the year ended December 31, 2012 resulted from the additional provision of $62.3 million recorded as a result of these changes was an increaseselling $172.5 million of non-performing and performing potential problem loans and recording charge-offs of $80.3 million.tax-equivalent net interest income.Fee-based revenuesTextura Corporation ("Textura") for $38.2 million, resulting in a gain of $86.8$34.0 million. The Company has no other similar investments. We hold a warrant to purchase 20,000 shares of Textura common stock.2010 grew by 1.9% compareda 5-year period beginning in 2014 at a weighted average interest rate of approximately 2.0% resulting in a gain of $7.8 million. This termination was executed to 2009. Service charge fees declinedtake advantage of a temporary rise in interest rates and an expectation that future liquidity needs could be better managed through maturities of securities, continued growth in our deposit base, and other similar low rate borrowings.lower overdraftthe redeployment of cash and non-sufficient fund fees. However, this decline was more than offset by increases in other service charges, commissions, and fees (primarily merchant fee income), card-based fees, and wealth management fees.Noninterest expense rose by 18.7% for 2010 compared to 2009. The increase was attributed to higher losses and write-downs on OREO and increases in loan remediation costs (including costs to service certain assets acquired in FDIC-assisted transactions), other professional services fees from the valuation and integrationcash equivalents into purchases of FDIC-acquired assets, and compensation expense. We recorded integration expenses associated with our FDIC-assisted transactions of $3.3 million in 2010.In 2010, we sold $390.2 million in collateralized mortgage obligations ("CMOs"), and other mortgage-backed securities ("MBSs"). These increases were partially offset by maturities and calls of municipal securities, and corporate bonds for a gain of $17.1 million. Net securities gains were $12.2 million for 2010 and were net of other-than-temporary impairment charges of $4.9 million. Impairment charges were primarily related to our collateralized debt obligations ("CDOs").Outstandingsecurities.$5.1$5.6 billion as of December 31, 2010 declined $102.72013 reflected growth of $390.3 million, or 2.0%7.5%, from December 31, 2009 as we charged-off $147.1 million in loans in 2010. Growth2012. The loan portfolio benefited from well-balanced corporate loan growth reflecting credits of 1.9% in commercialvarying size and industrial loans, 4.8% in multi-family loans, and 7.2% in other commercial real estate lending more than offset a 37.8% decline in the commercial and residential construction loan portfolios.Excludingdiverse geographic locations within our markets.non-performing assets as of December 31, 2010 were $269.5 million, down $66.5 million, or 19.8%,declined by 14.5% compared to December 31, 2009. Non-performing loans, excluding covered loans, represented 4.24% of total loans at December 31, 2010, compared to 4.77% at December 31, 2009. Loans 30-89 days delinquent totaled $23.6 million at December 31, 2010 down $14.3 million from December 31, 2009. The improvement2012. Improvement in asset quality was substantially driven by loan charge-offs, OREO write-downs, and disposals of non-performing assets, partly offset by loans downgraded to non-accrual status.In fourth quarter 2010, the lagging market recovery for real estate in the suburban Chicago market warranted a reassessment of the existing disposition strategies for certain non-performing assets and related credit metrics resulted primarily from management's continued focus on credit remediation.shift to more aggressively pursue remediation. In selecting non-performing assets for disposition strategy reassessment, we specifically targeted construction-related loansreduction in higher-costing time deposits. Average senior and OREO that we believed were subject to longer estimated recovery periods and a higher likelihood of further declines in value due to their geographic locations. Our determinationssubordinated debt decreased $18.4 million from 2012 driven by the full-year impact of the underlying collateral values were based on current offers. If offers were not available, we relied upon current offersTablerepurchase and retirement of Contentsfor similar properties located in similar geographic areas. As a result, we wrote down selected non-performing construction loans$4.3 million of junior subordinated debentures and OREO to better reflect expected proceeds from disposition and recorded additional$12.0 million of subordinated notes during the fourth quarter loan charge-offs and OREO write-downs of $47.7 million.We completed three FDIC-assisted transactions in 2009 and 2010. For a discussion of these transactions, refer to Note 5 of "Notes to Consolidated Financial Statements" in Item 8 of this Form 10-K.Average core transactional deposits for 2010 were $4.3 billion, an increase of $587.2 million, or 15.7%, from 2009. Contributing to this increase was approximately $325 million in core transactional deposits acquired through FDIC-assisted transactions.During 2010, we improved the quality of our capital composition through the issuance of Common Stock, resulting in a $196.0 million increase in stockholders' equity, net of underwriting discount and related expenses.revenue. Net interest income equals the difference between interest incomerevenue and fees earned on interest-earning assets (such as loans and securities) and interest expense incurred on interest-bearing liabilities (such as deposits and borrowed funds). The level ofis impacted by interest rates and the volume and mix of interest-earning assets and interest-bearing liabilities impact net interest income. Net interest margin represents net interest income as a percentage of total average interest-earning assets.liabilities. The accounting policies underlyingfor the recognition of interest income on loans, securities, and other interest-earning assets are presented in Note 1 of "Notes to the Consolidated Financial Statements" in Item 8 of this Form 10-K.U.S. generally accepted accounting principles ("GAAP")GAAP and general practice within the banking industry. For purposes of this discussion, both net interest income and net interest margin have been adjusted to a fully tax-equivalent basis to more appropriately compare the returns on certain tax-exempt loans and securities to those on taxable interest-earning assets. Although we believe that these non-GAAP financial measures enhance investors' understanding of our business and performance, these non-GAAP financial measuresthey should not be considered an alternative to GAAP. The effect of suchthis adjustment is shown at the bottom of Table 2.2011, 2010,2014, 2013, and 2009,2012, the related interest income and interest expense for each earning asset category and funding source, and the average interest rates earned and paid. Table 3 details changesdifferences in interest income and expense from prior years and analyzes the extent to which any changes are attributable to volume and rate changes.fluctuations. 2011 2010 2009 Average
Balance Interest Yield/
Rate
(%) Average
Balance Interest Yield/
Rate
(%) Average
Balance Interest Yield/
Rate
(%) $ 624,663 $ 1,546 0.25 $ 368,172 $ 933 0.25 $ 90,531 $ 199 0.22 15,321 168 1.10 13,851 181 1.51 12,270 227 1.85 561,799 14,115 2.51 538,208 22,116 4.11 899,368 42,392 4.71 548,820 34,694 6.52 668,828 42,506 6.56 847,844 53,339 6.29 1,125,940 48,977 4.55 1,220,887 64,803 5.51 1,759,482 95,958 5.45 59,352 1,369 2.51 60,249 1,349 2.24 55,081 1,199 2.18 5,101,621 254,533 4.99 5,191,154 260,809 5.02 5,348,979 262,634 4.91 398,559 28,904 7.25 323,595 17,285 5.54 28,049 1,419 5.06 5,500,180 283,437 5.15 5,514,749 278,094 5.04 5,377,028 264,053 4.91 7,310,135 335,329 4.59 7,164,057 345,179 4.82 7,282,122 361,409 4.96 119,709 125,273 119,469 (143,314 ) (154,634 ) (127,037 ) 873,376 889,958 789,555 $ 8,159,906 $ 8,024,654 $ 8,064,109 $ 934,937 1,615 0.17 $ 815,371 2,295 0.28 $ 751,386 3,024 0.40 1,091,184 1,130 0.10 1,082,774 1,895 0.18 984,529 3,102 0.52 1,230,090 2,891 0.24 1,199,362 6,019 0.50 937,766 9,213 0.98 3,256,211 5,636 0.17 3,097,507 10,209 0.53 2,673,681 15,339 0.57 1,792,009 21,620 1.21 1,991,637 26,918 1.55 2,001,207 48,838 2.44 5,048,220 27,256 0.54 5,089,144 37,127 0.73 4,674,888 64,177 1.57 265,702 2,743 1.03 359,174 3,267 0.91 1,118,792 12,569 1.12 150,285 9,892 6.58 137,739 9,124 6.52 208,621 13,473 6.46 5,464,207 39,891 0.73 5,586,057 49,518 0.89 6,002,301 90,219 1.50 1,498,900 1,224,629 1,061,208 77,276 65,749 72,927 947,145 955,219 734,673 172,378 193,000 193,000 $ 8,159,906 $ 8,024,654 $ 8,064,109 $ 295,438 4.04 $ 295,661 4.13 $ 271,190 3.72 $ 281,620 $ 279,349 $ 251,532 13,818 16,312 19,658 $ 295,438 $ 295,661 $ 271,190 (1)Interest income and yields are presented on a tax-equivalent basis, assuming a federal income tax rate of 35%.(2)Non-accrual loans, which totaled $187.5 million as of December 31, 2011, $211.8 million as of December 31, 2010, and $244.2 million as of December 31, 2009, are included in loans for purposes of this analysis.(3)Covered interest-earning assets consist of loans acquired through FDIC-assisted transactions and the related FDIC indemnification asset. For additional discussion, please refer to Note 5 of "Notes to Consolidated Financial Statements" in Item 8 of these Form 10-K. Covered non-accrual loans, which totaled $19.9 million as of December 31, 2011, Years Ended December 31, 2014 2013 2012 Interest Yield/
Rate (%) Interest Yield/
Rate (%) Interest Yield/
Rate (%)Assets: Other interest-earning assets $ 543,056 $ 1,591 0.29 $ 633,050 $ 1,819 0.29 $ 470,069 $ 1,143 0.24 Securities: Trading - taxable 17,964 174 0.97 15,526 161 1.04 15,415 181 1.17 Investment securities - taxable 649,161 14,516 2.24 713,237 12,249 1.72 679,753 12,670 1.86 461,571 25,705 5.57 510,412 28,636 5.61 512,136 31,231 6.10 Total securities 1,128,696 40,395 3.58 1,239,175 41,046 3.31 1,207,304 44,082 3.65 35,622 1,366 3.83 39,593 1,346 3.40 48,400 1,374 2.84 6,121,326 268,249 4.38 5,498,788 255,333 4.64 5,506,394 267,219 4.85 7,828,700 311,601 3.98 7,410,606 299,544 4.04 7,232,167 313,818 4.34 Cash and due from banks 120,358 121,564 120,757 (79,482 ) (95,698 ) (117,121 ) Other assets 808,136 841,967 873,923 Total assets $ 8,677,712 $ 8,278,439 $ 8,109,726 Liabilities and Stockholders' Equity: Savings deposits $ 1,222,292 904 0.07 $ 1,126,561 844 0.07 $ 1,038,379 1,055 0.10 NOW accounts 1,243,186 673 0.05 1,170,928 676 0.06 1,090,446 747 0.07 Money market deposits 1,392,367 1,784 0.13 1,306,625 1,735 0.13 1,216,173 1,934 0.16 3,857,845 3,361 0.09 3,604,114 3,255 0.09 3,344,998 3,736 0.11 Time deposits 1,211,882 7,016 0.58 1,306,888 8,646 0.66 1,529,006 14,316 0.94 5,069,727 10,377 0.20 4,911,002 11,901 0.24 4,874,004 18,052 0.37 Borrowed funds 149,559 573 0.38 205,461 1,607 0.78 193,643 2,009 1.04 Senior and subordinated debt 191,776 12,062 6.29 212,896 13,607 6.39 231,273 14,840 6.42 5,411,062 23,012 0.43 5,329,359 27,115 0.51 5,298,920 34,901 0.66 Demand deposits 2,137,778 1,889,247 1,762,968 Other liabilities 85,306 87,550 80,075 Stockholders' equity - common 1,043,566 972,283 967,763 $ 8,677,712 $ 8,278,439 $ 8,109,726 $ 288,589 3.69 $ 272,429 3.68 $ 278,917 3.86 Net interest income (GAAP) $ 276,852 $ 260,132 $ 265,668 Tax-equivalent adjustment 11,737 12,297 13,249 $ 288,589 $ 272,429 $ 278,917 Interest income and yields are presented on a tax-equivalent basis, assuming a federal income tax rate of 35%. Non-accrual loans, including acquired and covered non-accrual loans, which totaled $66.2 million as of December 31, 2014, $80.7 million as of December 31, 2013, and $98.7 million as of December 31, 2012, are included in loans for purposes of this analysis. Additional detail regarding non-accrual loans is presented in the following section titled "Non-Performing Asset and Performing Potential Problem Loans" of this Item 7. This item includes covered interest-earning assets consisting of loans acquired through the Company's FDIC-assisted transactions with loss share agreements and the related FDIC indemnification asset. For additional discussion, please see Note 6 of "Notes to the Consolidated Financial Statements" in Item 8 of this Form 10-K. purposes2013, an increase of this analysis. There$178.4 million, or 2.5%, from 2012, driven primarily by a rise in other interest-earning assets. Proceeds from bulk loan sales of $172.5 million in original carrying value of non-performing and performing potential problem loans during 2012 drove a significant portion of the increase in average other interest earning assets. Growth in average loans, excluding covered loans, of $102.8 million was offset by decreases of $93.8 million in average covered interest-earning assets.no covered non-accrualcomparable to 2012. Higher levels of interest-bearing core deposits more than offset the decline in time deposits.December 31, 2010 or 2009.cash flows from the investment portfolio into lower yielding securities due to the low interest rate environment. In addition, a greater customer preference for floating rate loans during the third and fourth quarters of 2013 contributed to the decrease. The lower yields on interest-earning assets were partially offset by a decline in the rates paid for interest-bearing liabilities, including a 2 basis point decline on interest-bearing core deposits, a 28 basis point decline on time deposits, and a 3 basis point decline on senior and subordinated debt.Table of Contents
Changes in Net Interest Income Applicable to Volumes and Interest Rates (1) 2011 compared to 2010 2010 compared to 2009 Volume Rate Total Volume Rate Total 2014 compared to 2013 2013 compared to 2012 $ 471 $ 142 $ 613 $ 700 $ 34 $ 734 Volume Rate Total Volume Rate Total Other interest-earning assets $ (265 ) $ 37 $ (228 ) $ 443 $ 233 $ 676 25 (38 ) (13 ) 35 (81 ) (46 ) 23 (10 ) 13 1 (21 ) (20 ) 1,017 (9,018 ) (8,001 ) (15,322 ) (4,954 ) (20,276 ) (959 ) 3,226 2,267 706 (1,127 ) (421 ) (7,587 ) (225 ) (7,812 ) (11,182 ) 349 (10,833 ) (2,721 ) (210 ) (2,931 ) (105 ) (2,490 ) (2,595 ) (6,545 ) (9,281 ) (15,826 ) (26,469 ) (4,686 ) (31,155 ) (3,657 ) 3,006 (651 ) 602 (3,638 ) (3,036 ) (19 ) 39 20 115 35 150 (73 ) 93 20 (250 ) 222 (28 ) (4,827 ) (1,449 ) (6,276 ) (6,924 ) 5,099 (1,825 ) 4,567 7,052 11,619 15,783 83 15,866 (260 ) 5,603 5,343 8,859 5,182 14,041 22,638 (9,722 ) 12,916 (3,829 ) (8,057 ) (11,886 ) (6,353 ) (3,497 ) (9,850 ) (16,795 ) 565 (16,230 ) 18,643 (6,586 ) 12,057 (3,034 ) (11,240 ) (14,274 ) 417 (1,097 ) (680 ) 289 (1,018 ) (729 ) 71 (11 ) 60 102 (313 ) (211 ) 15 (780 ) (765 ) 350 (1,557 ) (1,207 ) 39 (42 ) (3 ) 64 (135 ) (71 ) 158 (3,286 ) (3,128 ) 4,238 (7,432 ) (3,194 ) 105 (56 ) 49 164 (363 ) (199 ) 590 (5,163 ) (4,573 ) 4,877 (10,007 ) (5,130 ) Total interest-bearing core deposits 215 (109 ) 106 330 (811 ) (481 ) (2,558 ) (2,740 ) (5,298 ) (233 ) (21,687 ) (21,920 ) (600 ) (1,030 ) (1,630 ) (1,877 ) (3,793 ) (5,670 ) (1,968 ) (7,903 ) (9,871 ) 4,644 (31,694 ) (27,050 ) (385 ) (1,139 ) (1,524 ) (1,547 ) (4,604 ) (6,151 ) (1,089 ) 565 (524 ) (7,265 ) (2,037 ) (9,302 ) (359 ) (675 ) (1,034 ) 132 (534 ) (402 ) 826 (58 ) 768 (4,705 ) 356 (4,349 ) (1,331 ) (214 ) (1,545 ) (1,175 ) (58 ) (1,233 ) (2,231 ) (7,396 ) (9,627 ) (7,326 ) (33,375 ) (40,701 ) (2,075 ) (2,028 ) (4,103 ) (2,590 ) (5,196 ) (7,786 ) $ (4,122 ) $ 3,899 $ (223 ) $ (9,469 ) $ 33,940 $ 24,471 $ 20,718 $ (4,558 ) $ 16,160 $ (444 ) $ (6,044 ) $ (6,488 ) (1)For purposes of this table, changes which are not due solely to volume changes or rate changes are allocated to each category on the basis of the percentage relationship of each to the sum of the two.(2)Interest income is presented on a tax-equivalent basis, assuming a federal income tax rate of 35%.2011 Compared to 2010Average interest-earning assets of $7.3 billion for 2011 rose $146.1 million, or 2.0%, from 2010, with the increase primarily resulting from the short-term investment of additional customer deposits and the full year impact of additional assets acquired in an FDIC-assisted transaction in August 2010. This increase was partially offset by a decline in non-taxable investment securities as we sold securities at a gain to take advantage of opportunities in the market. We are maintaining an elevated level of short-term investments as we manage our liquidity within the current low-yield environment.Tax-equivalent net interest income for 2011 was relatively unchanged compared to 2010, as lower tax-equivalent interest income was offset by a decline in interest expense. A $9.9 million reduction in tax-equivalent interest income resulted from a 23 basis point decrease in tax-equivalent yield discussed below and the impact of securities sales. Interest expense declined $9.6 million, as we used proceeds from securities sales and maturities to reduce higher-costing time deposits and borrowed funds.For purposes of this table, changes which are not due solely to volume changes or rate changes are allocated to each category on the basis of the percentage relationship of each to the sum of the two. Interest income is presented on a tax-equivalent basis, assuming a federal income tax rate of 35%. This item includes covered interest-earning assets consisting of loans acquired through the Company's FDIC-assisted transactions with loss share agreements and the related FDIC indemnification asset. For additional discussion, please see Note 6 of "Notes to the Consolidated Financial Statements" in Item 8 of this Form 10-K. Tax-equivalent net interest margin for 2011 was 4.04%, a decline of 9 basis points from 4.13% in 2010. The reduction in margin resulted from a 23 basis point decrease in the average yield on interest-earning assets, largely due to the cumulative effect of prior year securities sales and a lower yield on securities as cash flows from securities paydowns and maturities repriced at lower interest rates. While loans also repriced at lower rates in 2011, the reduction was more than offset by an increase in the yield on covered loans (discussed below). This effect was partially offset by a 16 basis point drop in the average rate paid for interest-bearing liabilities, driven by a 14 basis point decline in the average rate paid for time deposits and a 16 basis point reduction in the aggregate rate paid on interest-bearing transaction accounts. As of December 31, 2011, our loan-to-deposit ratio was 78.5%, with 74.4% of our customer deposits consisting of demand, NOW, money market, and savings transactional accounts.Interest earned on covered loans is generally recognized through the accretion of the discount taken on expected future cash flows. The increase in the yield on covered interest-earning assets for 2011 compared to 2010 resulted from adjustments in accretable income based upon (i) revised cash flow estimates subsequent to acquisition and (ii) actual cash realized in excess of estimates upon final settlement of certain covered loans.2010 Compared to 2009Average interest-earning assets were $7.2 billion for 2010, a decrease of $118.1 million, or 1.6%, from 2009. Average securities decreased $538.6 million in 2010 compared to 2009 as we sold securities to realize gains available in the low interest rate environment. Average loans, excluding covered loans, were impacted by the charge-off of $147.1 million in loans in 2010. These decreases were partially offset by increases in covered assets acquired in FDIC-assisted transactions and short-term investments.Tax-equivalent net interest margin improved 41 basis points to 4.13% for 2010 from 3.72% for 2009. The improvement reflected a 61 basis point decline in the average rate paid for interest-bearing liabilities, led by a 109 basis point decline in the average rate paid for time deposits. The reduction in rates paid on deposits reflected the decline in the yield curve over the period. Over the same period, maturities and proceeds from sales of securities, coupled with the acquisition of deposits from FDIC-assisted transactions, reduced the need for higher cost wholesale funds.Our 2010 tax-equivalent net interest income increased $24.5 million compared to 2009. Interest expense declined $40.7 million, reflecting both a decrease in total interest-bearing liabilities and the rates paid for these liabilities. Tax-equivalent interest income was lower by $16.2 million compared to 2009 due to a 14 basis point decline in tax-equivalent yield. The net result of these changes was an increase in tax-equivalent net interest income.2009 through 2011ended December 31, 2014 is presented in the following table. Years ended December 31, % Change 2011 2010 2009 2011-2010 2010-2009 $ 37,879 $ 35,884 $ 38,754 5.6 (7.4 ) 16,224 15,063 14,059 7.7 7.1 20,486 18,238 16,529 12.3 10.3 19,593 17,577 15,826 11.5 11.1 94,182 86,762 85,168 8.6 1.9 2,231 1,560 2,263 43.0 (31.1 ) 2,729 2,180 2,590 25.2 (15.8 ) 99,142 90,502 90,021 9.5 0.5 (691 ) 1,530 2,542 (145.2 ) (39.8 ) 3,346 17,133 26,726 (80.5 ) (35.9 ) (936 ) (4,917 ) (24,616 ) (81.0 ) (80.0 )
transactions(6) - 4,303 13,071 (100.0 ) (67.1 ) - - 15,258 - (100.0 ) 1,076 - - 100.0 - $ 101,937 $ 108,551 $ 123,002 (6.1 ) (11.7 ) Years Ended December 31, % Change 2014 2013 2012 2014-2013 2013-2012 Service charges on deposit accounts $ 36,910 $ 36,526 $ 36,699 1.1 (0.5 ) Wealth management fees 26,474 24,185 21,791 9.5 11.0 24,340 21,649 20,852 12.4 3.8 Merchant servicing fees 11,260 10,953 10,806 2.8 1.4 Mortgage banking income 4,011 5,306 2,689 (24.4 ) 97.3 Other service charges, commissions, and fees 8,086 7,663 4,486 5.5 70.8 Total fee-based revenues 111,081 106,282 97,323 4.5 9.2 8,097 34,164 (921 ) (76.3 ) N/M 3,954 — — 100.0 — BOLI income (loss) 2,873 (11,844 ) 1,307 N/M N/M (2,059 ) (1,034 ) (558 ) 99.1 85.3 677 3,189 1,627 (78.8 ) 96.0 1,995 2,297 2,728 (13.1 ) (15.8 ) — 7,829 — (100.0 ) 100.0 Gain on bulk loan sales — — 5,153 — (100.0 ) — — 3,289 — (100.0 ) Total noninterest income $ 126,618 $ 140,883 $ 109,948 (10.1 ) 28.1 (1)Card-based fees consist of debit and credit card interchange fees charged for processing transactions, as well as various fees charged on both customer and non-customer ATM and point-of-sale transactions processed through the ATM and point-of-sale networks.(2)BOLI income represents benefit payments received and the change in CSV of the policies, net of premiums paid. The change in CSV is attributable to earnings or losses credited to the policies based on investments made by the insurer. For a further discussion of our investment in BOLI, see the section "Investment in Bank-Owned Life Insurance" and Note 1 of "Notes to Consolidated Financial Statements" in Item 8 of this Form 10-K.(3)Other income consists of various items including safe deposit box rentals, miscellaneous recoveries, and gains on the sales of various assets.(4)Trading (losses) gains, net result from the change in fair value of trading securities. Our trading securities represent diversified investment securities held in a grantor trust under deferred compensation arrangements in which plan participants may direct amounts earned to be invested in securities other than Company stock. These changes are substantially offset by an adjustment to salaries and wages expense.(5)We recognized net securities gains and securities impairment losses for each period presented. For a discussion of these items, see the section titled "Investment Portfolio Management" of this Item 7.(6)For a discussion of the gains on FDIC-assisted transactions, refer to Note 5 of "Notes to Consolidated Financial Statements" in Item 8 of this Form 10-K. 2011Card-based fees consist of debit and credit card interchange fees for processing transactions as well as various fees on both customer and non-customer automated teller machine ("ATM") and point-of-sale transactions processed through the ATM and point-of-sale networks. For a discussion of these items, see the section titled "Investment Portfolio Management" of this Item 7. These items are included in other income in the Consolidated Statements of Income. Net trading gains result from changes in the fair value of diversified investment securities held in a grantor trust under deferred compensation arrangements and are substantially offset by nonqualified plan expense for each period presented. Other income consists of various items, including safe deposit box rentals, miscellaneous recoveries, and gains on the sales of various assets. For a discussion of the 2012 gain on an FDIC-assisted transaction, see Note 3 of "Notes to the Consolidated Financial Statements" in Item 8 of this Form 10-K. 2010declined 6.1%was $126.6 million for 2011the year ended December 31, 2014, decreasing 10.1% from 2013. Total fee-based revenues were $111.1 million, increasing 4.5% compared to 2010. The decrease reflects lower net securities gains, a trading loss in 2011 following a trading gain in 2010, and a gain on an FDIC-assisted transaction in 2010, all of which more than offset increases in operating revenues.Fee-based revenues, which comprise the majority of2013. Total noninterest income of $94.2 million for 2011 rose 8.6% compared to 2010 asduring 2013 was impacted by certain significant transactions, including a result of increases in all categories.The growth in service charges on deposit accounts was due primarily to a combination of higher volumes of non-sufficient-funds fees (including transactions generated by customers obtained in a 2010 FDIC-assisted transaction) and more fees earned on business and personal checking accounts resulting from market-driven pricing increases.Average assets under management for 2011 totaled $4.4 billion, a $346.5 million increase from 2010, with such growth derived equally from improved equity market performance and new sales initiatives. The increase in average assets under management fueled the year-over-year growth in wealth management fees.A rise in merchant fees, miscellaneous loan fees, and investment revenue led to the increase in other service charges, commissions, and fees. The year-over-year increase in merchant fees was due primarily to a volume increase resulting from customers acquired in an FDIC-assisted transaction.We experienced continued growth in card-based fees resulting from both greater volumes and higher average rates per transaction. The increase in rates earned on card-based fees resulted from the migration in late 2010 from multi-merchant networks to an exclusive MasterCard network in most areas, which drove higher transaction yields and incentives.The $1.1$34.0 million gain on acquisitionthe sale of deposits related to our purchasean equity investment and a $7.8 million gain on the termination of two FHLB forward commitments, offset in part by a $13.3 million write-down of the CSV of certain Chicago-market deposits from Old National. The transaction closed in December 2011 and included $106.7 million in deposits (comprised of $70.6 million in core transactional deposits and $36.1 in time deposits) and one banking facility. 2010 Compared to 2009Total noninterest income decreased 11.7% for 2010 compared to 2009. The decline from 2009 resulted from changes in gains realized from net securities sales, early extinguishment of debt, and FDIC-assisted transactions and the fair value adjustment related to our non-qualified deferred compensation plan, which is reflected in trading (losses) gains, net.Fee-based revenues of $86.8 million for 2010 grew by 1.9% compared to 2009. BOLI policies.declined primarily duewere in line with 2013, as charges for services to lower overdraftnew customers acquired in the Popular and Great Lakes transactions offset the continued decline in revenue from non-sufficient funds fees. However, this decline was more than offset by increasestransactions. other service charges, commissions, and fees (primarily merchant fee income), card-based fees, and wealth management fees.The majorityfees of the decline in service charges on deposit accounts resulted from a $2.5 million decline in fees charged to customers with insufficient funds. The decrease was driven by (i) regulatory changes that require customers to affirmatively consent to our overdraft services for automated teller machine9.5% reflect new customer relationships and one-time debit card transactions before overdraft fees may be assessed and (ii) a change from a tiered rate to a flat rate.Wealth management fees improved from 2009 to 2010 primarily due to a $666.3 million, or 17.5%,an overall increase in assets under management during this period. Approximately $102.7to $7.2 billion, a rise of $544.1 million, or 8.1%, from 2013.$666.3secondary market compared to sales of $147.4 million increase was attributableduring 2013. Lower market pricing contributed to managed assets acquiredthe decline in an FDIC-assisted transaction.Higher retail investment advisory feesmortgage banking income compared to 2013.merchant processingcheck printing fees drove the increase in other service charges, commissions, and fees, which were partially offset by a decrease in sales of capital market products to commercial clients. The sales of leasing contracts were generated from 2009a new commercial product offering introduced with the acquisition of National Machine Tool in the third quarter of 2014.2010. Merchant processing fees improved 18.5%, andoptimize our retail investment advisory fees increased 9.9%distribution.20102013 rose 28.1% compared to 2009.2012 driven primarily by the $34.0 million gain on the sale of our investment in Textura, and a $7.8 million gain on the termination of two FHLB forward commitments, offset in part by a $13.3 million write-down of the CSV related to the modification of approximately $100 million of certain lower-yielding BOLI policies.2011, 2010, and 2009. Years ended December 31, % Change 2011 2010 2009 2011-2010 2010-2009 $ 101,703 $ 94,361 $ 82,640 7.8 14.2 27,071 20,017 23,908 35.2 (16.3 ) 128,774 114,378 106,548 12.6 7.3 3,785 23,367 12,584 (83.8 ) 85.7 5,901 17,113 5,970 (65.5 ) 186.6 6,607 9,554 4,905 (30.8 ) 94.8 16,293 50,034 23,459 (67.4 ) 113.3 15,210 11,020 7,458 38.0 47.8 11,146 11,883 8,338 (6.2 ) 42.5 26,356 22,903 15,796 15.1 45.0 - - 3,500 - (100.0 ) 7,990 10,880 10,173 (26.6 ) 6.9 7,990 10,880 13,673 (26.6 ) (20.4 ) 23,850 23,274 22,762 2.5 2.2 9,103 8,944 8,962 1.8 (0.2 ) 10,905 11,070 8,987 (1.5 ) 23.2 6,198 6,642 7,313 (6.7 ) (9.2 ) 8,643 7,882 6,453 9.7 22.1 23,792 22,772 20,835 4.5 9.3 $ 261,904 $ 278,779 $ 234,788 (6.1 ) 18.7 1,831 1,790 1,766 62.12% 58.84% 57.86% Years Ended December 31, % Change 2014 2013 2012 2014-2013 2013-2012 Salaries and employee benefits: Salaries and wages $ 115,763 $ 108,932 $ 103,245 6.3 5.5 815 3,699 1,986 (78.0 ) 86.3 Retirement and other employee benefits 27,245 26,119 25,524 4.3 2.3 Total salaries and employee benefits 143,823 138,750 130,755 3.7 6.1 Net occupancy and equipment expense 35,181 31,832 32,699 10.5 (2.7 ) Professional services 23,436 21,922 29,614 6.9 (26.0 ) Technology and related costs 12,875 11,335 11,846 13.6 (4.3 ) 9,195 8,780 8,584 4.7 2.3 Advertising and promotions 8,159 7,754 5,073 5.2 52.8 Net OREO expense 7,075 8,547 10,521 (17.2 ) (18.8 ) FDIC premiums 5,824 6,438 6,926 (9.5 ) (7.0 ) 4,251 4,021 3,939 5.7 2.1 20,135 15,858 20,838 27.0 (23.9 ) Acquisition and integration related expenses 13,872 — — 100.0 — Adjusted amortization of FDIC
indemnification asset — 1,500 6,705 (100.0 ) (77.6 ) Total noninterest expense $ 283,826 $ 256,737 $ 267,500 10.6 (4.0 ) N/M – Not meaningful.(1)OREO operating expense, net, consists of real estate taxes, commissions on sales, insurance, and maintenance, net of any rental income.(2)The efficiency ratio expresses noninterest expense, excluding OREO expense, as a percentage of tax-equivalent net interest income plus total fees and other income.2011Nonqualified plan expense results from changes in the Company's obligation to participants under deferred compensation agreements and is substantially offset by earnings on related assets, which are reported as net trading gains and included in noninterest income. These line items are included in other expense in the Consolidated Statements of Income. 2010Total20132011 decreased 6.1% from 2010. Excluding losses on sales and write-downs of OREO, integration costs, and severance-related costs, noninterest expense increased $15.22014 was $264.5 million, increasing $7.7 million, or 6.5%3.0%, as a result offrom 2013. This increase was primarily due to higher loan remediationsalaries and employee benefits and professional services expenses associated with growth and organizational needs.increased salaries related toassociated with the expansion of commercial, retail,Popular, National Machine Tool, and wealthmanagement sales staff and a $1.3 million correction of a 2010 actuarial pension expense calculation related to the valuation of future early retirement benefits recorded in fourth quarter 2011.In 2011, we recorded a $2.0 million charge for severance-related costs stemming from an organizational realignment implemented in December 2011. This charge includes $1.6 millionGreat Lakes locations were primarily concentrated in salaries and wages, $96,000 in retirementemployee benefits, net occupancy and equipment expense, professional services, and other employee benefits,expenses. The conversion and $274,000 in other professional services. The organizational realignment eliminated approximately 50 open positions and another 50 filled positions. The annual savings in future years is estimatedintegration of these transactions was substantially complete as of December 31, 2014, with certain remaining efficiencies to be $5.0 million.2011 compared to 2010 reflected the full year impact of additional staff employedemployee insurance. A reduction in pension expense as a result of a third quarter 2010 FDIC-assisted transaction,changes to the expansion of commercial sales staff, annual meritCompany’s defined benefit pension plan in 2013 partially offset these increases higher incentive compensation,during 2014.severance-related costs stemming from theconsulting fees, which were driven by growth and organizational realignment.needs. These increases were partially offset by a $2.5 million variance related to changeslower servicing costs for our covered loan portfolio.the obligations to participants in deferred compensation plans resulting from fluctuations in the fair value of trading securities held on behalf of plan participants.The variance in retirement and other employee benefits for 2011 compared to 2010 was driven by a $2.0 million increase in profit sharing expense, a one-time $1.3 million correction of the 2010 actuarial pension expense calculation, the impact of changes in overall staffing levels, and costs stemming from the organizational realignment.for 2011 declined 67.4%resulted from 2010. Prior year OREO expense was elevated due to higher levels of write-downs, lossesnet gains on sales of OREO andproperties in incurred to maintainconsistent with the reduction in OREO properties (including costs to service certain assets acquired in FDIC-assisted transactions). For a discussion of sales of OREO properties, referbalances, contributed to the section titled "Disposalsdecrease.Non-Performing Assets"adjusted amortization of this Item 7.Loan remediation costs rose as a result ofthe FDIC indemnification asset, which were partially offset by an increase in real estate taxes paidtotal compensation expense and advertising and promotions expense.preserve our rights to collateral associated with problem loans as well as higher legal fees incurred to remediate problem credits.Additional property tax expense from higher assessments and costs associated with operating branches acquired through FDIC-assisted transactions accounted for2012, the increase in occupancy and equipment expense for 2011 compared to 2010.FDIC premiums decreased for 2011 compared to 2010 primarily due to a regulatory change in calculating the premium. Specifically, the assessment base is now based on average consolidated total assets minus average tangible equity rather than domestic deposits.The increase in merchant cardcompensation expense was due primarily to higher transaction volumes, including the full year impact of transactions generated by customers acquiredincentive compensation and commissions and a decrease in deferred salaries related to loan originations.an FDIC-assisted transaction.The increase in other noninterest expense for 2011 compared to 20102012. This decline was due primarily to losses ona $6.4 million reduction in loan remediation costs including legal expenses, appraisal costs, and real estate taxes, as a result of management's accelerated credit remediation actions that occurred in 2012, including the salebulk loan sales. In addition, a decrease in covered loan servicing costs contributed to the variance. Lower levels of personnel recruitment expenses, attorney fees related to an FDIC-assisted acquisition, and write-down of certain fixed assets moved to held-for-sale.The efficiency ratio increasedvarious legal proceedings in 2012 also drove the decline in professional service expense from 58.84%2012.2010 to 62.12% for 2011, resulting2013 declined 18.8% from 2012 primarily from an increase$1.8 million in noninterest expense, excluding OREO expense,lower valuation adjustments and a $1.0 million decrease in expenses, partially offset by an increase in fee-based revenues.2010 Comparedlosses on sales of OREO.2009Noninterest expense rose by $44.0 million for 2010 compared to 2009. improved asset quality resulting from the bulk loan sales completed during the fourth quarter of 2012.was attributed to higher lossesin advertising and write-downs on OREO and increases in loan remediation costs, other professional servicespromotions expense from the valuation and integration of FDIC-acquired assets, and compensation expense. We recorded valuation and integration expenses associated with our FDIC-assisted transactions of $3.3 million in 2010.The 14.2% increase in salaries and wages for 2010 compared to 20092012 was driven by the additionlaunch of employees, primarily retail and commercial sales staff,our "Bank with Momentum" branding campaign during the second quarter of 2013.our three FDIC-assisted transactions, as well as standard merit increases and higher incentive and share-based compensation expense.The 16.3% decline in retirement and other employee benefits for 2010 compared to 2009 resulted from reductionschanges in the costtiming and amount of pension and profit sharing plans partially offset by an increase in payroll taxes.Losses during 2010 on sales and write-downs of OREO properties, as well as related operating costs, increased substantiallyexpected future cash flows expected to be received from 2009 and reflected continued weakness in the real estate market.In May 2009, the FDIC levied a special assessment upon all insured depository institutions to rebuildunder the FDIC's Deposit Insurance Fund. FDIC Agreements based on management's periodic estimates of expected future cash flows from covered loans.Company's special assessment was $3.5 million in 2009. There were no special assessments in 2010 or 2011.The increase in loan remediation expenses for 2010 compared to 2009 reflects the additional costs incurred to integrate and remediate covered loans acquired through FDIC-assisted transactions, as well as increased legal fees, appraisals, real estate tax redemptions, and utilities associated with non-performing loans.The majority of the 23.2% increase in technology and related costs for 2010 compared to 2009 was driven by system conversion costs related to FDIC-assisted transactions, as well as additional costs for servicing acquired customers and higher monthly fees for improved network access.Merchant card expense increased from 2009 to 2010 in line with the increased merchant fee income previously described. The increasedecline in other expenses was spread across several categories.The efficiency ratio increased from 57.86%2012 reflects a $1.8 million reduction in the reserve for 2009unfunded commitments. In addition, other expenses were elevated in 2012 from valuation adjustments of $2.6 million on a property held-for-sale and a former banking office transferred to 58.84% for 2010, resulting primarily from the increase in staffing and professional expenses incurred to remediate problem assets.expense.expense (benefit). An analysis of the provision for income taxes for the periods 2009 through 2011three years ended December 31, 2014 is detailed in the following table. Years ended December 31, Years Ended December 31, 2011 2010 2009 2014 2013 2012 $ 41,071 $ (38,228 ) $ (75,926 ) $ 100,476 $ 128,021 $ (49,936 ) $ 3,534 $ (23,821 ) $ (39,106 ) $ 24,244 $ 36,316 $ (23,728 ) 974 (4,723 ) (11,070 ) 6,926 12,399 (5,154 ) $ 4,508 $ (28,544 ) $ (50,176 ) $ 31,170 $ 48,715 $ (28,882 ) 11.0% 74.7% 66.1% 31.0 % 38.1 % 57.8 % and the related effective income tax rate are primarily influenced by the amount of tax-exempt income derived from investment securities and bank-owned life insurance in relation to pre-tax income and state income taxes. State income tax expense(benefit) and the related effective income tax rate are influenced by the amount of tax-exempt income derived from investment securities and BOLI in relation to pre-tax income (loss) and state income taxes. State income tax expense (benefit) and the related effective income tax rate are driven by the amount of state tax-exempt income in relation to pre-tax income (loss) and state tax rules related to consolidated/combined reporting and sourcing of income and expense.$4.5$31.2 million in 2011 following income tax benefits of $28.5 million in 2010 and $50.2 million in 2009. The variance from 2010 to 2011 was primarily attributable to an increase in pre-tax income in 2011for the year ended December 31, 2014 compared to $48.7 million for the prior year as well as a decrease in tax-exempt incomeended December 31, 2013 and the impact of the Illinois tax law change described below.Effective January 1, 2011, the Illinois corporate income tax rate increased from 7.3% to 9.5%. This rate increase resulted in additional state income tax expense, net of federal income tax, of $418,000 for 2011. We recorded a $1.6 millionan income tax benefit in first quarter 2011 related toof $28.9 million for the resulting increase in our deferred tax asset driven by this rate change.benefitsexpense from 20092013 to 20102014 was driven primarily attributableby a decline in income subject to a decreasetax at statutory rates. The increase in pre-tax loss in 2010 and the recording of $5.4 million in state income tax benefitsexpense from 2012 to 2013 resulted from a rise in 2009.underlyingfor the recognition of income taxes in the Consolidated Statements of Financial Condition and Income are included in Notes 1 and 1415 of "Notes to the Consolidated Financial Statements" in Item 8 of this Form 10-K.relate toconsist of securities held in a rabbigrantor trust for our nonqualified deferred compensation plan and are not considered part of the traditional investment portfolio. All other securities are classified as securities available-for-sale and are carried at fair value.Weportfolio. As of December 31, 2011 As of December 31, 2010 As of December 31, 2009 Fair Value Amortized
Cost % of
Total Fair Value Amortized
Cost % of
Total Fair Value Amortized
Cost % of
Total As of December 31, 2014 2013 2012 Amortized Cost Fair Value % of Total Amortized Cost Fair Value % of Total Amortized Cost Fair Value % of Total Securities Available-for-Sale Securities Available-for-Sale $ 5,035 $ 5,060 0.5 $ 17,886 $ 18,000 1.5 $ 756 $ 756 - $ 30,297 $ 30,431 2.5 $ 500 $ 500 — $ 508 $ 508 — 384,104 383,828 35.7 379,589 377,692 32.3 307,921 299,920 21.8 538,882 534,156 44.0 490,962 475,768 41.2 397,146 400,383 35.8 87,691 81,982 7.7 106,451 100,780 8.6 249,282 239,567 17.5 MBSs 155,443 159,765 13.1 135,097 136,164 11.8 117,785 122,900 11.0 490,071 464,282 43.2 503,991 512,063 43.7 651,680 649,269 47.3 414,255 423,820 34.9 457,318 461,393 39.9 495,906 520,043 46.5 13,394 48,759 4.5 14,858 49,695 4.2 11,728 54,359 4.0 48,502 33,774 2.8 46,532 18,309 1.6 46,533 12,129 1.1 30,014 27,511 2.6 32,345 29,936 2.6 37,551 36,571 2.7 1,719 1,802 0.1 12,999 14,929 1.3 13,006 15,339 1.4 2,697 2,189 0.2 2,682 2,134 0.2 7,842 7,667 0.6 3,224 3,261 0.3 3,706 5,662 0.5 9,690 11,101 1.0 1,013,006 1,013,611 94.4 1,057,802 1,090,300 93.1 1,266,760 1,288,109 93.9 Total available-for-
sale securities 1,192,322 1,187,009 97.7 1,147,114 1,112,725 96.3 1,080,574 1,082,403 96.8 Securities Held-to-Maturity Securities Held-to-Maturity 61,477 60,458 5.6 82,525 81,320 6.9 84,496 84,182 6.1 26,555 27,670 2.3 44,322 43,387 3.7 34,295 36,023 3.2 $ 1,074,483 $ 1,074,069 100.0 $ 1,140,327 $ 1,171,620 100.0 $ 1,351,256 $ 1,372,291 100.0 $ 1,218,877 $ 1,214,679 100.0 $ 1,191,436 $ 1,156,112 100.0 $ 1,114,869 $ 1,118,426 100.0 As of December 31, 2011 As of December 31, 2010 Effective
Duration (1) Average
Life (2) Yield to
Maturity Effective
Duration (1) Average
Life (2) Yield to
Maturity 0.85% 0.53 4.01% 1.91% 0.58 3.22% 0.92% 2.19 1.57% 0.74% 2.52 2.31% 1.96% 3.91 4.50% 2.36% 3.85 4.62% 3.84% 3.77 6.13% 5.35% 8.01 6.15% 0.25% 8.57 0.00% 0.25% 8.78 0.00% 6.07% 10.29 6.45% 6.58% 11.18 6.85% 2.45% 3.57 3.98% 3.22% 5.72 4.37% 5.31% 9.33 5.91% 5.78% 9.99 6.61% 2.61% 3.90 4.08% 3.40% 6.02 4.52% Refer to the following page for footnotes.(1)The effective duration of the securities portfolio represents the estimated percentage change in the fair value of the securities portfolio given a 100 basis point change up or down in the level of interest rates. This measure is used as a gauge of the portfolio's price volatility at a single point in time and is not intended to be a precise predictor of future fair values, since those values will be influenced by a number of factors.(2)Average life is presented in years and represents the weighted-average time to receive all future cash flows, using the dollar amount of principal paydowns, including estimated principal prepayments, as the weighting factor.2011,2014, our securities portfolio totaled $1.1$1.2 billion, decreasing 5.8%rising $56.5 million, or 4.9%, from December 31, 2010,2013, following a 15.6% decrease3.4% increase from December 31, 2009. Our2012. During the fourth quarter of 2014, we acquired $219.3 million of securities in the Great Lakes transaction which consisted of $31.8 million in U.S. agency securities, $137.7 million in CMOs, $39.7 million in MBSs, $2.8 million in municipal securities, $6.6 million in CDOs, and $690,000 in equity securities. These securities were recorded at fair value as of the acquisition date. In addition to the acquired securities portfolio, declined over the past three years as we took advantageyear end balance was impacted by purchases of opportunities in the market to sell securities at a gain given the low interest rate environment.Approximately 95%$28.5 million, maturities, calls, and prepayments of $176.7 million, and sales of $27.8 million.$1.0$1.2 billion available-for-sale portfolio iswas comprised of U.S. agency securities, municipals, CMOs, and other mortgage-backed securities as of December 31, 2011.MBSs. The remainder consists of seventhe portfolio was comprised of eleven CDOs with a fair value of $13.4$33.8 million and an aggregate unrealized loss of $35.4$14.7 million, and miscellaneous other securities totaling $32.7with fair values of $5.1 million.48.4%35.7%, or $490.1$423.8 million, of the total available-for-sale securities portfolio as of December 31, 2011. This type2014. The majority consists of securitygeneral obligations of local municipalities in various states. Our municipal securities portfolio has historically experienced very low default rates and providedprovides a predictable cash flow. Available-for-sale municipal securities declined 2.8% from $504.0 million at December 31, 2010. The decline was driven by sales, maturities, and paydowns. As of December 31, 2014 2013 Effective Average Yield to Effective Average Yield to Securities Available-for-Sale U.S. agency securities 3.32 % 3.72 2.98 % 2.23 % 2.25 0.49 % CMOs 3.45 % 3.67 1.91 % 4.48 % 4.26 1.86 % Other MBSs 2.88 % 4.18 2.77 % 3.93 % 4.85 2.45 % Municipal securities 2.89 % 2.37 5.50 % 5.11 % 3.27 5.53 % CDOs N/M N/M N/M N/M N/M N/M Corporate debt securities 0.45 % 0.50 6.72 % 4.86 % 7.18 6.39 % Equity securities N/M N/M N/M N/M N/M N/M Total available-for-sale securities 3.16 % 3.26 3.37 % 4.68 % 3.95 3.52 % Securities Held-to-Maturity Municipal securities 5.64 % 7.85 4.60 % 6.50 % 11.84 5.47 % Total securities 3.21 % 3.37 3.40 % 4.75 % 4.26 3.60 % The effective duration represents the estimated percentage change in the fair value of the securities portfolio given a 100 basis point increase or decrease in interest rates. This measure is used to evaluate the portfolio's price volatility at a single point in time and is not intended to be a precise predictor of future fair values since those values will be influenced by a number of factors. Average life is presented in years and represents the weighted-average time to receive all expected future cash flows using the dollar amount of principal paydowns, including estimated principal prepayments, as the weighting factor. Yields on municipal securities are reflected on a tax-equivalent basis, assuming a federal income tax rate of 35%. investmentavailable-for-sale securities portfolio declined from 6.02were both lower than the prior year at 3.26 years as of December 31, 2010 to 3.90 years as of December 31, 2011 driven primarilyand 3.16%, respectively. These decreases, which were partially offset by a decrease in the average life of our municipal securities. This decline reflected the impact of a higher probability of calls at December 31, 2011 compared to December 31, 2010 givensecurities acquired in the lower interest rate environmentGreat Lakes transaction, resulted mainly from maturities and improved economic outlook for municipalities, as well as sales of longer-term municipalinvestment securities duringthat were not reinvested in the period.Securities Saleswere $2.4of $8.1 million for 2011 compared to $12.2 million for 2010 and $2.1 million for 2009. Gains on sales of securities of $3.3 million for 20112014 resulted from the sale of $188.6a non-accrual CDO at a gain of $3.5 million, sales of certain longer-duration corporate bonds at gains of $2.0 million, sales of municipal securities at gains of $468,000, and the sale of certain other investments at gains of $2.1 million. In addition, four CDOs totaling $2.9 million acquired in the Great Lakes transaction were sold during the fourth quarter of 2014. These securities were recorded at fair value at the acquisition date, therefore, no gain or loss was recognized on the sale.debt securities. We sold these shorter-term investments in order to take advantage of opportunities in the market. These gains were partially offset by OTTI charges of $936,000 on two CDOs in 2011.In 2010, we sold $390.9 million in CMOs, other mortgage-backed securities, municipal securities, and corporate bonds for a gain of $17.1 million. Net securities gains were $12.2 million for 2010 and were net of OTTI charges of $4.9 million. Impairment charges were primarily related to our CDOs.portfolioportfolio. These amounts are presented in the Consolidated Statements of Comprehensive Income and are reported on an after-tax basis, as a separate component of stockholders' equity in accumulated other comprehensive loss and presented in the Consolidated Statements of Comprehensive Income (Loss).on an after-tax basis. This balance sheet component will fluctuatefluctuates as current market interest rates and conditions change thereby affectingand affect the aggregate fair value of the portfolio. Net unrealized losses at December 31, 20112014 were $605,000, down from $32.5$5.3 million compared to $34.4 million at December 31, 2010, reflecting2013.impact of lower interest rates and a tightening of credit spreads on our municipal securities. and other mortgage-backed securities are either backed by U.S. government-owned agencies or issued by U.S. government-sponsored enterprises. We do not believe any individual unrealized loss on these types of securities as of December 31, 20112014 represents OTTI since the unrealized losses associated with these securities are not believed to be attributablerelated to credit quality, but rather to changes in interest rates and temporary market movements.As of December 31, 2011, gross unrealized gains in the municipal securities portfolio totaled $26.2 million, and gross unrealized losses were $366,000 resulting in a net unrealized gain of $25.8 million compared to a netunrealized loss of $8.1 million as of December 31, 2010. The change in fair value of municipal securities reflects the impact of the change in market interest rates on these fixed-rate investments as well as an improved economic outlook for municipalities since December 31, 2010, which reduced credit spreads on these securities. Substantially all of these securities carry investment grade ratings, with the majority of them supported by the general revenues of the issuing governmental entity and supported by third-party insurance. We do not believe the unrealized loss on any of these securities is OTTI.Our investments in CDOs are supported by the credit of the underlying banks and insurance companies. The unrealized loss on these securities increased $528,000 since December 31, 2010. The unrealized loss reflects the difference between amortized cost and fair value that we determined did not relate to credit and reflects the market's unfavorable bias against these investments. We do not believe the unrealized losses on the CDOs as of December 31, 2011 represent OTTI. We currently have no evidence that would suggest further reductions in net cash flows on these investments from what has already been recognized.deterioration. In addition, we do not intend to sell the CDOsCMOs with unrealized losses within a short period of time, and we do not believe it is more likely than not that we will be required to sell them before recovery of their amortized cost bases,basis, which may be at maturity.cash flows for these investments and resulting fair values were based upon cash flow modeling, asfor the CDOs is described in Note 22 of "Notes to the Condensed Consolidated Financial Statements," in Item 8 of this Form 10-K.Effective DurationThe effective duration of the securities available-for-sale portfolio was 2.45% as of December 31, 2011 compared to 3.22% as of December 31, 2010 and 3.88% as of December 31, 2009. The effective duration as of December 31, 2011 decreased across almost all categories as a result of falling interest rates and a higher probability of calls on municipal securities since December 31, 2010. The effective duration on the aggregate investment portfolio declined in 2010 compared to 2009 due to a reduction in the securities portfolio through sales of longer-term securities and a strategy to not reinvest cash flows from security sales and maturities.8
9 As of December 31, 2011 One Year or Less One Year to Five Years Five Years to Ten Years After 10 years As of December 31, 2014 Amortized
Cost Yield to
Maturity (1) Amortized
Cost Yield to
Maturity (1) Amortized
Cost Yield to
Maturity (1) Amortized
Cost Yield to
Maturity (1) One Year or Less One Year to Five Years Five Years to Ten Years After 10 years Amortized Cost Amortized Cost Amortized Cost Amortized Cost Securities Available-for-Sale Securities Available-for-Sale $ - - $ - - $ 5,060 4.01% $ - - $ — — % $ 4,496 2.49 % $ 23,825 3.09 % $ 1,976 2.80 % 221,193 1.77% 139,082 1.21% 11,763 2.91% 11,790 0.53% 179,667 1.97 % 285,350 1.90 % 67,259 1.78 % 6,606 1.78 % 20,970 4.53% 27,578 4.52% 10,711 4.89% 22,723 4.25% 38,113 2.82 % 81,559 2.80 % 28,161 2.66 % 7,610 2.58 % 5,493 6.85% 332,943 6.06% 93,912 6.30% 31,934 6.28% 67,900 6.10 % 71,948 6.01 % 190,182 4.88 % 84,225 6.00 % - - - - - - 48,759 - — — — — — — 48,502 N/M 1,834 5.35% 3,783 4.36% 13,644 7.09% 10,439 6.55% 249,490 2.14% 503,386 4.62% 135,090 5.89% 125,645 2.96% — — 1,688 6.47 % — — 31 20.00 % — — — — 3,224 N/M — N/M 285,680 3.07 % 445,041 2.75 % 312,651 3.83 % 148,950 3.64 % Securities Held-to-Maturity 4,301 5.94% 20,582 5.86% 13,081 6.23% 22,494 5.77% 3,505 5.27 % 8,727 4.61 % 5,404 5.16 % 8,919 4.00 % $ 253,791 2.20% $ 523,968 4.67% $ 148,171 5.92% $ 148,139 3.39% $ 289,185 3.10 % $ 453,768 2.79 % $ 318,055 3.85 % $ 157,869 3.66 % (1)Based on amortized cost.(2)The repricing distributions and yields to maturity of CMOs and other mortgage-backed securities are based on estimated future cash flows and prepayments. Actual repricings and yields of the securities may differ from those reflected in the table depending upon actual interest rates and prepayment speeds.(3)Yields on municipal securities are reflected on a tax-equivalent basis, assuming a federal income tax rate of 35%. The maturity date of bonds is based on contractual maturity, unless the bond, based on current market prices, is deemed to have a high probability that the call will be exercised, in which case the call date is used as the maturity date.(4)Yields on other securities are reflected on a tax-equivalent basis, assuming a federal income tax rate of 35%. The maturity date of other securities is based on contractual maturity or repricing characteristics.Based on amortized cost. The repricing distributions and yields to maturity of CMOs and other MBSs are based on estimated expected future cash flows and prepayment assumptions. Actual repricings and yields of the securities may differ from those reflected in the table depending on actual interest rates and prepayment speeds. Yields on municipal securities are reflected on a tax-equivalent basis, assuming a federal income tax rate of 35%. The maturity date of bonds is based on contractual maturity, unless the bond, based on current market prices, is deemed to have a high probability that the call will be exercised, in which case the call date is used as the maturity date. Yields on corporate debt and equity securities are reflected on a tax-equivalent basis, assuming a federal income tax rate of 35%. Maturity dates are based on contractual maturity or repricing characteristics. arises fromis generated by our lending activities and is composed primarily composed of interest income and, to a lesser extent, fromas well as loan origination and commitment fees (net of related costs). The accounting policies underlyingfor the recording of loans in the Consolidated Statements of Financial Condition and the recognition and/or deferral of interest income and fees (netin the Consolidated Statements of costs) arising from lending activitiesIncome are included in Note 1 of "Notes to the Consolidated Financial Statements" in Item 8 of this Form 10-K.87.0%86.3% of total loans, outstandingexcluding covered loans, at December 31, 2011. The corporate loan component consists of commercial and industrial, agricultural, and commercial real estate lending categories with a small portion consisting of loans to small businesses.2014. Consistent with our emphasis on relationship banking, the majority of our corporate loans are made to our core, multi-relationship customers. TheThese customers usually maintain deposit relationships and utilize our other banking services, such as cash management or wealth management services.Wein place that are designed to maximize loan income within an acceptable level of risk. Managementmanagement reviews and modifies these policies and procedures on a regular basis. The review process is supplemented by providingIn addition, management with frequent reportsreceives periodic reporting related to loan production, loan quality, credit concentrations, of credit, loan delinquencies, and non-performing and performing potential problem loans.loans to monitor and mitigate potential and current risks in the portfolio. We do not offer any sub-prime products and we have policies to limit our exposure to any single borrower.9
10 As of December 31, As of December 31, 2011 % of Total 2010 % of Total 2009 % of Total 2008 % of Total 2007 % of Total 2014 2013 2012 2011 2010 $ 1,458,446 28.7 $ 1,465,903 28.7 $ 1,438,063 27.6 $ 1,490,101 27.8 $ 1,347,481 27.1 $ 2,253,556 33.9 $ 1,830,638 32.8 $ 1,631,474 31.5 $ 1,458,446 28.7 $ 1,465,903 28.7 243,776 4.8 227,756 4.5 209,945 4.0 216,814 4.1 235,498 4.8 358,249 5.4 321,702 5.8 268,618 5.2 243,776 4.8 227,756 4.5 444,368 8.7 396,836 7.8 394,228 7.6 339,912 6.3 256,211 5.2 494,637 7.4 459,202 8.2 474,717 9.1 444,368 8.7 396,836 7.8 334,034 6.6 328,751 6.4 331,803 6.4 265,568 5.0 193,581 3.9 452,225 6.8 392,576 7.0 368,796 7.1 334,034 6.6 328,751 6.4 520,680 10.2 478,026 9.4 486,934 9.3 419,761 7.8 374,286 7.5 531,517 8.0 501,907 9.0 489,678 9.4 520,680 10.2 478,026 9.4 288,336 5.7 349,862 6.9 333,961 6.4 286,963 5.4 217,266 4.4 564,421 8.4 332,873 6.0 285,481 5.5 288,336 5.7 349,862 6.9 105,836 2.1 174,690 3.4 313,919 6.0 509,059 9.5 505,194 10.2 144,909 2.8 164,472 3.2 231,518 4.5 356,575 6.6 388,193 7.8 Construction 204,236 3.1 186,197 3.3 186,416 3.6 250,745 4.9 339,162 6.6 888,146 17.4 856,357 16.8 798,983 15.4 729,329 13.6 661,480 13.3 887,897 13.3 807,071 14.5 773,121 14.9 888,146 17.4 856,357 16.8 2,726,309 53.5 2,748,994 53.9 2,891,346 55.6 2,907,167 54.2 2,596,211 52.3 3,134,933 47.0 2,679,826 48.0 2,578,209 49.6 2,726,309 53.5 2,748,994 53.9 4,428,531 87.0 4,442,653 87.1 4,539,354 87.2 4,614,082 86.1 4,179,190 84.2 5,746,738 86.3 4,832,166 86.6 4,478,301 86.3 4,428,531 87.0 4,442,653 87.1 416,194 8.2 445,243 8.7 470,523 9.1 477,105 8.9 464,981 9.4 543,185 8.2 427,020 7.7 390,033 7.5 416,194 8.2 445,243 8.7 201,099 4.0 160,890 3.2 139,983 2.7 198,197 3.7 220,741 4.4 291,463 4.4 275,992 4.9 282,948 5.5 201,099 4.0 160,890 3.2 42,289 0.8 51,774 1.0 53,386 1.0 70,679 1.3 98,760 2.0 Installment 76,032 1.1 44,827 0.8 38,394 0.7 42,289 0.8 51,774 1.0 659,582 13.0 657,907 12.9 663,892 12.8 745,981 13.9 784,482 15.8 910,680 13.7 747,839 13.4 711,375 13.7 659,582 13.0 657,907 12.9 5,088,113 100.0 5,100,560 100.0 5,203,246 100.0 5,360,063 100.0 4,963,672 100.0 6,657,418 100.0 5,580,005 100.0 5,189,676 100.0 5,088,113 100.0 5,100,560 100.0 260,502 371,729 146,319 – – Covered loans 79,435 134,355 197,894 260,502 371,729 $ 5,348,615 $ 5,472,289 $ 5,349,565 $ 5,360,063 $ 4,963,672 $ 6,736,853 $ 5,714,360 $ 5,387,570 $ 5,348,615 $ 5,472,289 (1)a detailed discussionadditional detail regarding acquired loans refer to the section below titled "Acquired Loans" of this Item 7.related accounting policy forpurchase of $51.9 million of high-quality, shorter duration home equity loans and the sale of $147.4 million of 1-4 family mortgage loans during 2013.refer to Notes 1net charge-offs, loans disposed through bulk loan sales, and 5loans acquired in an FDIC-assisted transaction, our loan portfolio increased by approximately 6.5% from December 31, 2011. The increase in commercial and industrial loans was driven by the targeted redistribution of "Notesthe loan portfolio from commercial real estate into this category, significant investments in sales staff, and refocusing current staff away from remediation activities, subsequent to the Condensed Consolidated Financial Statements"bulk loan sales. Strong origination efforts primarily contributed to growth in Item 81-4 family mortgages, in addition to loans acquired in an FDIC-assisted transaction. A decrease in the construction portfolio was driven by efforts to reduce lending exposure to this category. The decrease in covered loans of $62.6 million, or 24.0%, from December 31, 2011 reflects the continued decline in this Form 10-K.2011 Compared to 2010 loans, including covered loans of $5.3 billion as of December 30,31, 2011 declined $123.7 million, or 2.3%, from $5.5 billion as of December 31, 2010. The naturalcontinued decline in covered loan balances accounted for the majority of this reduction.Excluding 2011 net charge-offs of $103.7 million, total loans (excluding covered loans) would have increased 1.8%. The office, retail, and industrial, and other commercial real estate portfolios exhibited 6.2% growth during this period, substantially in the form of owner-occupied business relationships. Offsetting this progress,growth, we continued to reduce our exposure to more troubledthe higher risk construction and multi-family real estate categoriescategory during 2011.2010 Compared2009Totaloverall loan growth and expanded our market footprint. For a detailed discussion of these transactions, refer to the section titled "Performance Overview" of this Item 7.including covered loans, were $5.5 billionby category as of December 31, 2010, an increase2014 between legacy and loans acquired in the Popular and Great Lakes transactions, compared to loans as of $122.7 million, or 2.3%, from December 31, 2009. The increase was driven by the addition2013. As of As of December 31, 2014 December 31, 2013 Legacy % Legacy Acquired Total Total Change Commercial and industrial $ 2,148,858 $ 104,698 $ 2,253,556 $ 1,830,638 17.4 Agricultural 356,395 1,854 358,249 321,702 10.8 Commercial real estate: Office 389,348 105,289 494,637 459,202 (15.2 ) Retail 372,311 79,914 452,225 392,576 (5.2 ) Industrial 486,420 45,097 531,517 501,907 (3.1 ) Multi-family 367,995 196,426 564,421 332,873 10.6 Construction 196,387 7,849 204,236 186,197 5.5 Other commercial real estate 804,294 83,603 887,897 807,071 (0.3 ) Total commercial real estate 2,616,755 518,178 3,134,933 2,679,826 (2.4 ) Total corporate loans 5,122,008 624,730 5,746,738 4,832,166 6.0 Home equity 499,088 44,097 543,185 427,020 16.9 1-4 family mortgages 247,359 44,104 291,463 275,992 (10.4 ) Installment 70,701 5,331 76,032 44,827 57.7 Total consumer loans 817,148 93,532 910,680 747,839 9.3 Total loans, excluding covered loans 5,939,156 718,262 6,657,418 5,580,005 6.4 Covered loans 79,435 — 79,435 134,355 (40.9 ) Total loans $ 6,018,591 $ 718,262 $ 6,736,853 $ 5,714,360 5.3 covered loans acquired through FDIC-assisted transactions, which more than offset declines in the residential and commercial construction categories.Outstandingtotal loans, excluding covered loans, of $5.1and totaled $2.6 billion as ofat December 31, 2010 declined $102.72014, an increase of $459.5 million, or 2.0%,21.3% from December 31, 2009 as we charged-off $147.12013. Loans acquired in the Popular and Great Lakes transactions during the third and fourth quarters of 2014 contributed $106.6 million in loans in 2010. Excluding these charge-offs, total loans (excluding covered loans) would have increased 0.9%. Growth of 1.9% inthis growth. Our commercial and industrial loans 4.8% in multi-family loans, and 7.2% in other commercial real estate lending more than offset the 37.8% decline in the commercial and residential construction loan portfolios that resulted from our continued efforts to remediate and reduce exposure to these lending categories.Covered loans grew to $371.7 million at December 31, 2010 compared to $146.3 million at December 31, 2009 from the completion of two FDIC-assisted transactions.Comparisons of Prior Years (2009, 2008, and 2007)Outstanding loans, excluding covered loans, totaled $5.2 billion as of December 31, 2009,are a decrease of 2.9% from December 31, 2008. During 2009, extensions of new credit were more than offset by paydowns, net charge-offs, conversiondiverse group of loans to OREO, and the securitization of 1-4 family mortgages, which are includedmiddle market businesses generally located in the securities available-for-sale portfolio.OutstandingChicago metropolitan area with purposes that range from supporting seasonal working capital needs to term financing of equipment. The underwriting for these loans increased 8.0% from December 31, 2007 to December 31, 2008. The increase was led by growth in commercial real estate, specifically office, retail, and industrial, and commercial and industrial lending. The decline in consumer loans wasis based primarily due to continued run-off of indirect loans and the paydown in traditional home mortgages.The decline in our total loans outstanding from December 31, 2006 to December 31, 2007 reflected the combined impact of the payoff of loan participations, rapid prepayment of multi-family loan portfolios, which occurred primarily in the first half of 2007, and the continued paydown of our indirect auto loan portfolio. As of the same dates, corporate loans remained relatively unchanged at $4.2 billion.Commercial, Industrial, and Agricultural LoansEach commercial and industrial loan is underwritten after evaluating and understanding the borrower's ability to operate profitably. Underwriting standards are designed to ensure repayment of loans and mitigate loss exposure. As part of the underwriting process, we examine current and projected cash flows to determine the ability of the borrower to repay his obligation as agreed. Commercial and industrial loans are primarily made based on the identified cash flows of the borrower and secondarily on the underlying collateral provided by the borrower. The cash flows of the borrower, however, may not be as expected, and the collateral securing these loans may fluctuate in value. Most commercial and industrial loans are secured by the assets being financed or other business assets, such as accounts receivable or inventory, and usuallymay incorporate a personal guarantee. However, some short-termmay be made on an unsecured basis. In the caseare generally provided to meet seasonal production, equipment, and farm real estate borrowing needs of loans secured by accounts receivable, the availability of funds for the repayment of these loans may be substantially dependent upon the abilityindividual and corporate crop and livestock producers. As part of the borrower to collect amounts due from its customers.Commercial, industrial,underwriting process, the Company examines projected future cash flows, financial statement stability, and agricultural loans increased $8.6 million from $1.69 billion at December 31, 2010 to $1.70 billion at December 31, 2011. Our commercial and industrialthe value of the underlying collateral. Seasonal crop production loans are a diverse grouprepaid by the liquidation of the financed crop that is typically covered by crop insurance. Equipment and real estate term loans to small,Tableare repaid through cash flows of Contentsmedium, and large businesses. The purpose of these loans varies from supporting seasonal working capital needs to term financing of equipment.Table 10Commercial, Industrial, and Agricultural Loans(Dollar amounts in thousands) As of December 31, 2011 2010 2009 Amount % of Total Amount % of Total Amount % of Total $ 1,237,097 72.7 $ 1,226,398 72.4 $ 1,213,277 73.6 114,546 6.7 140,854 8.3 150,824 9.2 96,328 5.7 84,496 5.0 63,724 3.9 2,850 0.2 4,281 0.3 4,837 0.3 7,625 0.4 9,874 0.6 5,401 0.3 1,458,446 85.7 1,465,903 86.6 1,438,063 87.3 133,136 7.8 131,855 7.8 128,555 7.8 110,640 6.5 95,901 5.6 81,390 4.9 243,776 14.3 227,756 13.4 209,945 12.7 $ 1,702,222 100.0 $ 1,693,659 100.0 $ 1,648,008 100.0 33.5% 33.2% 31.6% (1)Represents obligations due from municipalities. These obligations primarily represent industrial revenue bonds and are separate and distinct from the municipal securities presented in Table 7.(2)Consists of proceeds on new loans, net of loan payments received, that have not yet been applied to specific accounts.loans, in addition to those standards and processes specific toloans. The repayment of commercial real estate loans. Commercial real estate lending typically involves higher loan principal amounts, and the repayment of these loans is largely dependent upondepends on the successful operation of the property securing the loan or the business conducted on the property securing the loan. Commercial real estateThis category of loans may be more adversely affected by conditions in the real estate market or in the general economy. The properties securing our commercial real estate portfolio are diverse in terms of type and geographic location within the greater suburban metropolitan Chicago market and contiguous markets.market. Management monitors and evaluates commercial real estate loans based on cash flow, collateral, geography, and risk graderating criteria.Commercial real estate The properties securing the loans represent 53.5% of loans, excluding covered loans, and totaled $2.7 billion at December 31, 2011, a decrease of $22.7 million, or 0.8%, from December 31, 2010. Our primary focus for thein our commercial real estate portfolio has been growth inare diversified between owner-occupied and investor categories and represent varying types across our market footprint.secured by owner-occupied real estate. These loans areTable generally based on estimates of Contentsviewed primarily as cash flow loans (similar to commercialcosts and industrial loans) and secondarily as loans secured by real estate.Nearly half of our commercial real estate loans consist of loans for industrial buildings, office buildings, and retail shopping centers. Approximately 40% ofvalue associated with the office, retail, and industrial loans were owner-occupied as of December 31, 2011.Other types of commercial real estate loans include construction loans for single-family and multi-family dwellings, residentialcompleted projects and commercial projects and loans for various types of other commercial properties, such as land for future commercial development, multi-unit residential mortgages, service stations, and hotels.Construction LoansConstruction loans are underwritten utilizing feasibility studies, independent appraisal reviews, sensitivity analyses of absorption and lease rates, and financial analyses of the developers and property owners. Construction loans are generally based upon estimates of costs and value associated with the completed projects. Construction loans often involve the disbursement of substantial funds with repayment primarily dependent upon the success of the completed project. Sources of repayment for these types of loans may be permanent loans from long-term lenders, sales of developed property, or an interim loan commitment until permanent financing is obtained. Generally, theseconstruction loans have a higher risk profile than other real estate loans due to theirsince repayment being sensitive tois impacted by real estate values, interest rate changes, governmental regulation of real property, demand and supply of alternative real estate, the availability of long-term financing, and changes in general economic conditions.We typically underwrite construction loans as combination construction and post-construction loans secured by the underlying real estate. These loans are reported as construction loans until construction is completed or principal amortization payments begin, and then are reclassified to the loan category appropriate to the nature of the underlying collateral or purpose of the completed project. Since these types of loans are initially underwritten to consider both construction and post-construction financing, no additional underwriting takes place at the time the completed construction loan migrates to other loan categories. Upon completion of the construction project and transfer into other loan categories, these loans retain their performance status and risk rating. For example, if a construction loan was on non-accrual at the time of completion, it would be transferred to the appropriate loan category as a non-accrual loan.Construction loans account for 9.2% of ourportfolioloan detail as of December 31, 2011. Total construction loans of $250.7 million consist of $105.8 million of residential construction2014, 2013, and $144.9 million of commercial construction.The following table provides details on the nature of our construction loan portfolios.Table 11Construction12 by Type Residential
Construction Commercial
Construction Combined Amount % of
Total Amount % of
Total Amount % of
Total $ 24,981 23.6 $ 42,768 29.5 $ 67,749 27.0 55,501 52.4 57,949 40.0 113,450 45.3 12,133 11.5 14,415 9.9 26,548 10.6 12,195 11.5 27,221 18.8 39,416 15.7 1,026 1.0 2,556 1.8 3,582 1.4 $ 105,836 100.0 $ 144,909 100.0 $ 250,745 100.0 0.63 0.74 0.69 2.1% 2.8% 4.9% 3.9% 5.3% 9.2% $ 35,401 20.3 $ 46,995 28.6 $ 82,396 24.3 83,229 47.6 71,856 43.7 155,085 45.7 14,077 8.1 22,882 13.9 36,959 10.9 32,538 18.6 22,284 13.5 54,822 16.2 9,445 5.4 455 0.3 9,900 2.9 $ 174,690 100.0 $ 164,472 100.0 $ 339,162 100.0 0.49 0.68 0.58 3.4% 3.2% 6.6% 6.3% 6.0% 12.3% As of December 31, 2014 % of
Total 2013 % of
Total 2012 % of
TotalOffice, retail, and industrial: Office $ 494,637 15.8 $ 459,202 17.1 $ 474,717 18.4 Retail 452,225 14.4 392,576 14.7 368,796 14.3 Industrial 531,517 17.0 501,907 18.7 489,678 19.0 Total office, retail, and industrial 1,478,379 47.2 1,353,685 50.5 1,333,191 51.7 Multi-family 564,421 18.0 332,873 12.4 285,481 11.1 Construction 204,236 6.5 186,197 7.0 186,416 7.2 Other commercial real estate: Rental properties 123,627 3.9 112,887 4.2 121,174 4.7 Service stations and truck stops 84,108 2.7 83,237 3.1 114,521 4.4 Warehouses and storage 128,396 4.1 122,325 4.6 110,367 4.3 Hotels 46,409 1.5 62,451 2.3 74,098 2.9 Restaurants 74,490 2.4 79,809 3.0 80,430 3.1 Automobile dealers 53,221 1.7 37,504 1.4 45,121 1.8 Recreational 48,718 1.5 56,327 2.1 41,058 1.6 Religious 36,427 1.2 32,614 1.2 29,196 1.1 Multi-use properties 191,011 6.1 118,351 4.4 63,120 2.4 Other 101,490 3.2 101,566 3.8 94,036 3.7 Total other commercial real estate 887,897 28.3 807,071 30.1 773,121 30.0 Total commercial real estate $ 3,134,933 100.0 $ 2,679,826 100.0 $ 2,578,209 100.0 $ 959,635 $ 933,151 $ 963,375 40.6 % 43.2 % 45.7 % Total constructiondecreased by $88.4represent 47.1% of total loans, excluding covered loans, and totaled $3.1 billion at December 31, 2014, an increase of $455.1 million, or 26.1%,17.0% from December 31, 2010 to2013. Overall, growth was driven by loans acquired in the Popular and Great Lakes transactions, which totaled $518.2 million at December 31, 2011. The decline in the portfolio was due to principal paydowns, charge-offs, reclassification2014.completed construction projects into other loan categories,total loans, excluding covered loans, and transfers of loans to OREO as we continued to reduce our exposure to this lending category.Other Commercial Real EstateOther commercial real estate totaled $888.1$910.7 million as ofat December 31, 2011. The properties securing other commercial real estate are diverse in terms of type and geographic location. The following table summarizes this category by product type.Table 12Other Commercial Real Estate Loan Detail by Product Type(Dollar amounts in thousands) As of December 31, 2011 2010 2009 Amount % of
Total Amount % of
Total Amount % of
Total $ 128,931 14.5 $ 140,774 16.4 $ 146,887 18.4 127,085 14.3 124,671 14.6 119,132 14.9 129,491 14.6 112,064 13.1 108,039 13.5 73,889 8.3 84,513 9.9 76,815 9.6 78,867 8.9 57,786 6.7 55,262 6.9 35,777 4.0 37,318 4.4 39,846 5.0 20,859 2.3 37,074 4.3 39,158 4.9 24,097 2.7 20,528 2.4 14,652 1.8 30,071 3.5 18,192 2.1 19,367 2.4 34,708 3.9 9,659 1.1 13,344 1.7 204,371 23.0 213,778 25.0 166,481 20.9 $ 888,146 100.0 $ 856,357 100.0 $ 798,983 100.0 (1)Includes loans secured by multi-use commercial real estate, commercial real estate with residential apartments, and other miscellaneous categories of commercial real estate, none of which are significant.Maturity and Interest Rate Sensitivity of Corporate LoansThe following table summarizes the maturity distribution of our corporate loan portfolio as of December 31, 2011, as well as the interest rate sensitivity of the loans that have maturities in excess of one year. For additional discussion of interest rate sensitivity, refer to Item 7A, "Quantitative and Qualitative Disclosures about Market Risk," of this Form 10-K.Table 13Maturities and Sensitivities of Corporate Loans to Changes in Interest Rates(Dollar amounts in thousands) As of December 31, 2011 Due in 1 year
or less Due after
1 year
through
5 years Due after
5 years Total $ 1,014,746 $ 561,328 $ 126,148 $ 1,702,222 873,225 1,703,078 150,006 2,726,309 $ 1,887,971 $ 2,264,406 $ 276,154 $ 4,428,531 $ 2,101,826 $ 243,357 162,580 32,797 $ 2,264,406 $ 276,154 Consumer Loansutilizingusing a credit scoring model developed by the Fair Isaac Corporation ("FICO") credit scoring. This is a credit score, with a scale that ranges from 300 to 850, developed by Fair Isaac Corporation that is used by many lenders.. It uses a risk-based system to determine the probability that a borrower may default on financial obligations.obligations to the lender. Underwriting standards for home equity loans are heavily influenced by statutory requirements, which include loan-to-value and affordability ratios, risk-based pricing strategies, and documentation requirements.As of December 31, 2011, consumer loans represented 13.0% of loans, excluding covered loans.Table 14Consumer Loans(Dollar amounts in thousands) As of December 31, 2011 2010 2009 Amount % of
Total Amount % of
Total Amount % of
Total $ 416,194 63.1 $ 445,243 67.7 $ 470,523 70.9 201,099 30.5 160,890 24.5 139,983 21.1 42,289 6.4 51,774 7.8 53,386 8.0 $ 659,582 100.0 $ 657,907 100.0 $ 663,892 100.0 As of December 31, 2011 Average
FICO Score Median
FICO Score % of Loans
with a Score
of 650 or
Above 741 751 83.5% 729 751 80.7% collateralcurrent appraised value at origination for these creditsof the collateral.generally range from 50%Interest Rate Sensitivity of Corporate Loans80%.Changes in Interest Rates Maturity Due In One Year or Less Greater Than One to Five Years Greater Than Five Years Total As of December 31, 2014 Commercial, industrial, and agricultural $ 1,211,466 $ 1,176,627 $ 223,712 $ 2,611,805 Commercial real estate 753,480 2,046,340 335,113 3,134,933 Total corporate loans $ 1,964,946 $ 3,222,967 $ 558,825 $ 5,746,738 Loans by interest rate type: Fixed interest rates $ 702,476 $ 1,946,905 $ 270,024 $ 2,919,405 Floating interest rates 1,262,470 1,276,062 288,801 2,827,333 Total corporate loans $ 1,964,946 $ 3,222,967 $ 558,825 $ 5,746,738 15
14 Past Due Total Loans Current 30-89 Days
Past Due 90 Days
Past Due Non-accrual TDRs $ 1,458,446 $ 1,397,569 $ 10,283 $ 4,991 $ 44,152 $ 1,451 243,776 242,727 30 - 1,019 - 444,368 436,881 - - 7,487 - 334,034 326,922 395 52 4,923 1,742 520,680 501,674 385 988 17,633 - 288,336 270,138 604 - 6,487 11,107 105,836 87,482 278 - 18,076 - 144,909 121,562 - - 23,347 - 888,146 829,492 5,273 1,707 51,447 227 2,726,309 2,574,151 6,935 2,747 129,400 13,076 4,428,531 4,214,447 17,248 7,738 174,571 14,527 416,194 400,570 5,986 1,138 7,407 1,093 201,099 190,052 3,636 - 5,322 2,089 42,289 41,133 625 351 25 155 659,582 631,755 10,247 1,489 12,754 3,337 5,088,113 4,846,202 27,495 9,227 187,325 17,864 260,502 195,289 4,232 43,347 19,879 - $ 5,348,615 $ 5,041,491 $ 31,727 $ 52,574 $ 207,204 $ 17,864 Past Due Total Loans Current 30-89 Days
Past Due 90 Days
Past Due Non-accrual TDRs Accruing Current 30-89 Days Past Due 90 Days Past Due TDRs Non-accrual As of December 31, 2014 $ 1,465,903 $ 1,403,409 $ 5,398 $ 1,552 $ 50,088 $ 5,456 $ 2,253,556 $ 2,225,507 $ 4,882 $ 205 $ 269 $ 22,693 227,756 223,021 65 187 2,497 1,986 358,249 355,955 1,934 — — 360 396,836 389,936 1,671 - 5,087 142 494,637 489,915 939 — — 3,783 328,751 320,477 447 - 7,827 - 452,225 446,702 288 76 413 4,746 478,026 468,995 461 - 6,659 1,911 531,517 525,955 979 — 173 4,410 349,862 343,070 486 - 6,203 103 564,421 561,436 1,261 83 887 754 174,690 122,317 51 200 52,122 - 164,472 135,787 - - 28,685 - Construction 204,236 197,255 — — — 6,981 856,357 802,461 8,115 345 40,605 4,831 887,897 875,080 4,976 438 433 6,970 2,748,994 2,583,043 11,231 545 147,188 6,987 3,134,933 3,096,343 8,443 597 1,906 27,644 4,442,653 4,209,473 16,694 2,284 199,773 14,429 5,746,738 5,677,805 15,259 802 2,175 50,697 445,243 428,726 4,055 1,870 7,948 2,644 543,185 533,738 2,361 145 651 6,290 160,890 149,419 2,267 4 3,902 5,298 291,463 285,531 1,947 166 878 2,941 51,774 50,899 630 86 159 - Installment 76,032 75,423 506 60 — 43 657,907 629,044 6,952 1,960 12,009 7,942 910,680 894,692 4,814 371 1,529 9,274 5,100,560 4,838,517 23,646 4,244 211,782 22,371 6,657,418 6,572,497 20,073 1,173 3,704 59,971 371,729 268,934 18,445 84,350 - - 79,435 65,682 2,565 5,002 — 6,186 $ 5,472,289 $ 5,107,451 $ 42,091 $ 88,594 $ 211,782 $ 22,371 $ 6,736,853 $ 6,638,179 $ 22,638 $ 6,175 $ 3,704 $ 66,157 As of December 31, 2013 Commercial and industrial $ 1,830,638 $ 1,805,516 $ 6,424 $ 393 $ 6,538 $ 11,767 Agricultural 321,702 321,123 60 — — 519 Commercial real estate: Office 459,202 455,547 1,200 731 — 1,724 Retail 392,576 385,234 939 272 624 5,507 Industrial 501,907 481,766 337 312 9,647 9,845 Multi-family 332,873 329,669 318 — 1,038 1,848 Construction 186,197 179,877 23 — — 6,297 Other commercial real estate 807,071 789,517 4,817 258 4,326 8,153 Total commercial real estate 2,679,826 2,621,610 7,634 1,573 15,635 33,374 Total corporate loans 4,832,166 4,748,249 14,118 1,966 22,173 45,660 Home equity 427,020 413,912 4,355 1,102 787 6,864 1-4 family mortgages 275,992 267,497 1,939 548 810 5,198 Installment 44,827 42,329 330 92 — 2,076 Total consumer loans 747,839 723,738 6,624 1,742 1,597 14,138 Total loans, excluding covered loans 5,580,005 5,471,987 20,742 3,708 23,770 59,798 Covered loans 134,355 93,100 2,232 18,081 — 20,942 Total loans $ 5,714,360 $ 5,565,087 $ 22,974 $ 21,789 $ 23,770 $ 80,740 for the past five years.16
15 As of December 31, 2011 2010 2009 2008 2007 As of December 31, 2014 2013 2012 2011 2010 $ 187,325 $ 211,782 $ 244,215 $ 127,768 $ 18,447 $ 58,853 $ 59,798 $ 84,534 $ 187,325 $ 211,782 9,227 4,244 4,079 36,999 21,149 771 3,708 8,689 9,227 4,244 196,552 216,026 248,294 164,767 39,596 59,624 63,506 93,223 196,552 216,026 17,864 22,371 30,553 7,344 7,391 33,975 31,069 57,137 24,368 6,053 Accruing TDRs 3,704 23,770 6,867 17,864 22,371 OREO 25,779 32,473 39,953 33,975 31,069 $ 248,391 $ 269,466 $ 335,984 $ 196,479 $ 53,040 $ 89,107 $ 119,749 $ 140,043 $ 248,391 $ 269,466 $ 27,495 $ 23,646 $ 37,912 $ 116,206 $ 100,820 $ 13,473 $ 20,742 $ 22,666 $ 27,495 $ 23,646 3.68% 4.15% 4.69% 2.38% 0.37% 0.99 % 1.07 % 1.63 % 3.68 % 4.15 % 3.86% 4.24% 4.77% 3.07% 0.80% 1.00 % 1.14 % 1.80 % 3.86 % 4.24 % 4.85% 5.25% 6.39% 3.65% 1.07% 1.49 % 2.13 % 2.68 % 4.85 % 5.25 % $ 19,879 $ - $ - $ - $ - $ 1,118 $ — $ — $ — $ — 43,347 84,350 30,286 - - 402 — — — — 63,226 84,350 30,286 - - 1,520 — — — — - - - - - 23,455 22,370 8,981 - - OREO 1,119 — — — — $ 86,681 $ 106,720 $ 39,267 $ - $ - $ 2,639 $ — $ — $ — $ — $ 4,232 $ 18,445 $ 22,988 $ - $ - $ 6,600 $ — $ — $ — $ — $ 207,204 $ 211,782 $ 244,215 $ 127,768 $ 18,447 $ 6,186 $ 20,942 $ 14,182 $ 19,879 $ — 52,574 88,594 34,365 36,999 21,149 5,002 18,081 31,447 43,347 84,350 259,778 300,376 278,580 164,767 39,596 11,188 39,023 45,629 63,226 84,350 17,864 22,371 30,553 7,344 7,391 57,430 53,439 66,118 24,368 6,053 OREO 8,068 8,863 13,123 23,455 22,370 $ 335,072 $ 376,186 $ 375,251 $ 196,479 $ 53,040 $ 19,256 $ 47,886 $ 58,752 $ 86,681 $ 106,720 30-89 days past due loans $ 2,565 $ 2,232 $ 6,514 $ 4,232 $ 18,445 Total non-performing assets Total non-performing assets Non-accrual loans $ 66,157 $ 80,740 $ 98,716 $ 207,204 $ 211,782 90 days or more past due loans 6,175 21,789 40,136 52,574 88,594 Total non-performing loans 72,332 102,529 138,852 259,778 300,376 Accruing TDRs 3,704 23,770 6,867 17,864 22,371 OREO 34,966 41,336 53,076 57,430 53,439 Total non-performing assets $ 111,002 $ 167,635 $ 198,795 $ 335,072 $ 376,186 $ 31,727 $ 42,091 $ 60,900 $ 116,206 $ 100,820 $ 22,638 $ 22,974 $ 29,180 $ 31,727 $ 42,091 3.87% 3.87% 4.57% 2.38% 0.37% 0.98 % 1.41 % 1.83 % 3.87 % 3.87 % 4.86% 5.49% 5.21% 3.07% 0.80% 1.07 % 1.79 % 2.58 % 4.86 % 5.49 % 6.20% 6.81% 6.93% 3.65% 1.07% 1.64 % 2.91 % 3.65 % 6.20 % 6.81 % $ 13,262 5,884 $ 7,378 Interest income not recognized in the financial statements related to non-accrual loans for 2014 Interest income not recognized in the financial statements related to non-accrual loans for 2014 $ 3,057 (1)Due to the impact of business combination accounting and protection provided by the FDIC Agreements, acquired loans and covered loans and covered OREO are separated in this table and excluded from these metrics to provide for improved comparability to prior periods and better perspective into asset quality trends. For a discussion of acquired and covered loans, see Notes 1 and 6 of "Notes to the Consolidated Financial Statements" in Item 8 of this Form 10-K. refer to Note 5 of "Notes to Consolidated Financial Statements" in Item 8 of this Form 10-K.Non-performing covered loans and covered OREO were recorded at their estimated fair values at the time of acquisition. These assets are covereddecreased by $30.6 million, or 25.6%, from December 31, 2013. This decrease was driven primarily by the FDIC Agreements that substantially mitigate the riskreturn of loss. Generally, covered loans are considered accruing loans. However, the timingthree TDRs totaling $20.7 million to performing status, sales of OREO properties, and amount of future cash flows for some loans may not be reasonably estimable. Those loans were classified as non-accrual loans as of December 31, 2011, and interest income will not be recognized until the timing and amount of the future cash flows can be reasonably estimated. Past due covered loans area decline in 90 days or more past due based on contractual terms but continue to perform in accordance with our expectations of cash flows.4.85%1.49% of total loans plus OREO as of December 31, 20112014 compared to 5.25%2.13% as of December 31, 20102013 and 6.39%2.68% as of December 31, 2009.were $248.4 million as ofdeclined 14.5% from December 31, 2012 to December 31, 2013. Improvement in non-performing assets and related credit metrics resulted primarily from management's focus on credit remediation.declining by $21.1 million, or 7.8%, compared to December 31, 2010. The reduction in non-performing assets from December 31, 20102012 was due mainly to December 31, 2011 was largely due to management's remediation activities and the return of accruing TDRs to performing status. During 2011, we had gross reductions of non-performing assets totaling $110.8 million, consisting of $80.3 milliona decline in non-accrual loans, that were sold, paid off, or transferred to held-for-sale and $30.5 million in OREO properties that were sold. For additional details, please refer towhich reflects the section titled "Disposals of Non-performing Assets" of this Item 7.The improvement inaggressive remediation actions taken by management during 2012, including the asset quality measures from December 31, 2009 to December 31, 2010 was substantially due tobulk loan charge-offs, OREO write-downs, and disposals of non-performing assets, partially offset by loans downgraded to non-accrual status. For additional details, please refer to the section titled "Credit Actions Taken in Fourth Quarter 2010" of this Item 7.$187.3$58.9 million as of December 31, 20112014 from $211.8$59.8 million as of December 31, 2010 following a decline2013.$244.2 million as of December 31, 2009. Thenon-accrual to accruing TDR status drove the decline in non-accrual loans from December 31, 20102012 to December 31, 2013.in aggregate exceededmore than offset the amount of loans downgraded from performing to non-accrual status during 2011.The amount of loans downgraded from performing to non-accrual during 2011 totaled $194.3 million (including a commercial borrowing relationship totaling $33.9 million) falling from $214.5 million in 2010 and $365.3 million during 2009, and reflects significantly fewer downgrades of construction loans and other commercial loan categories from prior years.A discussion of our accounting policies for non-accrual loans is contained in Note 1 of "Notes to Consolidated Financial Statements" in Item 8 of this Form 10-K.Table 17Non-Performing Construction Loans(Dollar amounts in thousands) December 31, 2011 December 31, 2010 Total
Loans Non-
Performing
Loans Non-
Performing
Loans as a
% of Loans Total
Loans Non-
Performing
Loans Non-
Performing
Loans as a
% of Loans $ 105,836 $ 18,076 17.1% $ 174,690 $ 52,322 30.0% 144,909 23,347 16.1% 164,472 28,685 17.4% $ 250,745 $ 41,423 16.5% $ 339,162 $ 81,007 23.9% $ 41,423 $ 80,807 - 200 $ 41,423 $ 81,007 Non-performing construction loans totaled $41.4 million as of December 31, 2011, a 48.9% decline compared to December 31, 2010, and represented 16.5% of total construction loans as of December 31, 2011 compared to 23.9% as of December 31, 2010.Six construction credits primarily in the raw land category represent 63.1% of the $41.4 million in non-performing construction loans as of December 31, 2011, with the largest single loan totaling $14.0 million. Life-to-date charge-offs on these six credits totaled $5.7 million. We had valuation allowances related to two of these loans totaling $1.7 million as of December 31, 2011.Of the $81.0 million in non-performing construction loans as of December 31, 2010, 51.7% was comprised of six credits. Life-to-date charge-offs on those six credits totaled $7.9 million as of December 31, 2010. We did not have a valuation allowance related to these loans as of December 31, 2010.are generallymay be performed at the request of the individual borrower and may include reductionreductions in interest rates, changes in payments, and extensions of maturity date extensions. A discussion of our accounting policies for TDRs is contained in Note 1 of "Notes to Consolidated Financial Statements" in Item 8 of this Form 10-K.Table 18TDRs by Type(Dollar amounts in thousands) December 31, 2011 December 31, 2010 December 31, 2009 Number of
Loans Amount Number of
Loans Amount Number of
Loans Amount 20 $ 2,348 46 $ 23,404 28 $ 4,062 - - 1 1,986 - - - - 1 142 - - 2 1,742 - - 1 91 - - 2 1,911 - - 9 12,865 9 3,193 10 11,462 - - 4 8,323 1 1,423 1 14,006 - - - - 9 11,644 13 7,229 11 13,852 21 40,257 29 20,798 23 26,828 25 1,564 50 3,233 34 1,724 26 3,382 49 6,703 51 7,953 1 155 - - - - 52 5,101 99 9,936 85 9,677 93 $ 47,706 175 $ 56,124 136 $ 40,567 57 $ 17,864 120 $ 22,371 108 $ 30,553 36 29,842 55 33,753 28 10,014 93 $ 47,706 175 $ 56,124 136 $ 40,567 $ 8,890 $ 11,534 $ 4,993 $ 94 $ - $ - At December 31, 2011, we had TDRs totaling $47.7 million, a decrease of $8.4 million, or 15.0%, from December 31, 2010. The December 31, 2011 total includes $17.9 million in loans that were restructured at market terms and are accruing interest. After a sufficient period of performance under the modified terms, these loans will be reclassified to performing status.We have other TDRs totaling $29.8 million as of December 31, 2011, which are reported as non-accrual because they are not performing in accordance with their modified terms or there has not been sufficient performance underthe modified terms.dates. We occasionally restructure loans at other than market rates or terms to enable the borrower to work through financial difficulties for a set period of time. As of December 31, 2014 2013 2012 Number of Loans Amount Number of Loans Amount Number of Loans Amount Commercial and industrial 7 $ 19,068 10 $ 8,659 6 $ 3,064 Agricultural — — — — — — Commercial real estate: Office — — — — — — Retail 1 413 2 624 — — Industrial 1 173 3 9,647 2 2,407 Multi-family 5 1,119 5 1,291 1 150 Construction — — — — — — Other commercial real estate 5 616 7 4,617 7 9,855 Total commercial real estate loans 12 2,321 17 16,179 10 12,412 Total corporate loans 19 21,389 27 24,838 16 15,476 Home equity 17 1,157 18 1,299 7 274 1-4 family mortgages 10 1,062 14 1,716 16 2,041 Installment — — — — — — Total consumer loans 27 2,219 32 3,015 23 2,315 Total TDRs 46 $ 23,608 59 $ 27,853 39 $ 17,791 Accruing TDRs 29 $ 3,704 39 $ 23,770 19 $ 6,867 Non-accrual TDRs 17 19,904 20 4,083 20 10,924 Total TDRs 46 $ 23,608 59 $ 27,853 39 $ 17,791 Year-to-date charge-offs on TDRs $ 8,457 $ 1,880 $ 10,003 Specific reserves related to TDRs 1,765 1,952 2,794 Potentialmanagement haswe have concerns about the ability of the obligorborrower to continue to comply with repaymentloan terms because ofdue to the obligor'sborrower's potential operating or financial difficulties.19
17 December 31, 2014 December 31, 2013
Mention (1)
Mention (1) Commercial and industrial $ 84,615 $ 30,809 $ 115,424 $ 23,679 $ 14,135 $ 37,814 Agricultural 294 — 294 344 — 344 Commercial real estate: Office, retail, and industrial 38,718 32,251 70,969 27,871 23,538 51,409 Multi-family 5,951 3,774 9,725 2,794 499 3,293 Construction 5,776 12,487 18,263 8,309 17,642 25,951 Other commercial real estate 32,225 19,407 51,632 14,567 22,576 37,143 Total commercial real estate 82,670 67,919 150,589 53,541 64,255 117,796 167,579 98,728 266,307 77,564 78,390 155,954 10,024 29,751 39,775 — — — $ 157,555 $ 68,977 $ 226,532 $ 77,564 $ 78,390 $ 155,954 2.92 % 1.72 % 4.63 % 1.61 % 1.62 % 3.23 % 3.08 % 1.35 % 4.42 % 1.61 % 1.62 % 3.23 % Loans categorized as special mention exhibit potential weaknesses that require the close attention of management since these potential weaknesses may result in the deterioration of repayment prospects in the future. Loans categorized as substandard exhibit a well-defined weakness or weaknesses that may jeopardize the liquidation of the debt. These loans continue to accrue interest because they are well secured and collection of principal and interest is expected within a reasonable time. Total performing potential problem loans excludes $1.8 million of accruing TDRs as of December 31, 2014 and $2.8 million of accruing TDRs as of December 31, 2013. Due to the impact of business combination accounting, acquired performing potential problem loans are separated in this table and excluded from these metrics to provide for improved comparability to prior periods and better perspective into trends. For a discussion of acquired loans, see Notes 1 and 6 of "Notes to the Consolidated Financial Statements" in Item 8 of this Form 10-K. As Of December 31, 2011 2010 2009 $ 276,577 $ 404,316 $ 373,735 126,657 151,651 150,289 $ 403,234 $ 555,967 $ 524,024 Proceeds Book Value Loan sales in 2014 by class: Commercial and industrial $ 650 $ 650 $ — $ — Office, retail, and industrial 17,100 20,550 (3,450 ) — 1-4 family mortgages 148,680 144,909 — 3,771 Total loan sales in 2014 $ 166,430 $ 166,109 $ (3,450 ) $ 3,771 Loan sales in 2013 by class: Commercial and industrial $ 469 $ 1,044 $ (575 ) $ — Office, retail, and industrial 806 1,791 (985 ) — 1-4 family mortgages 152,130 147,413 — 4,717 Total loan sales in 2013 $ 153,405 $ 150,248 $ (1,560 ) $ 4,717 Loan sales in 2012 by class: Commercial and industrial $ 19,705 $ 47,225 $ (22,508 ) $ (5,012 ) Agricultural 3,605 8,720 (4,356 ) (759 ) Commercial real estate: Office, retail, and industrial 35,488 49,345 (23,696 ) 9,839 Multi-family 3,151 4,043 (1,859 ) 967 Construction 9,074 18,274 (7,540 ) (1,660 ) Other commercial real estate 26,664 46,838 (21,825 ) 1,651 Total commercial real estate 74,377 118,500 (54,920 ) 10,797 Home equity 829 1,561 (773 ) 41 1-4 family mortgages 52,749 50,484 (90 ) 2,355 Total consumer loans 53,578 52,045 (863 ) 2,396 Total loan sales in 2012 $ 151,265 $ 226,490 $ (82,647 ) $ 7,422 (1)Loans categorized as special mention exhibit potential weaknesses that requireAmount represents charge-offs to the allowance for loan and covered loan losses at the time the loans were identified for sale. The net gains on the bulk loan sales represent gains realized subsequent to the transfer to held-for-sale and are included as a separate component of noninterest income in the Consolidated Statements of Income. Net gains on mortgage loan sales are included in mortgage banking income in the Consolidated Statements of Income. close attentionsale of management. If left uncorrected, these$144.9 million of 1-4 family mortgage loans during the year ended December 31, 2014. Additionally, we sold $21.2 million of other non-performing loans and recorded charge-offs of $3.5 million. weaknesses may result in the deterioration of repayment prospects at some future date.(2)Loans categorized as substandard continue to accrue interest, but exhibit a well-defined weakness or weaknesses that may jeopardize the liquidation of the debt. The loans continue to accrue interest because they are well secured and collection of principal and interest is expected within a reasonable time.Potential problem loans totaled $403.2for accelerated disposition through multiple bulk loan sales and recorded charge-offs of $80.3 million. The bulk loan sales of $172.5 million asin original carrying value resulted in proceeds of December 31, 2011, down $152.7$94.5 million or 27.5%, from $556.0and a gain of $5.2 million. In addition to the bulk loan sales, we sold $50.3 million as of December 31, 2010. The decline from December 31, 2010 reflects management's efforts to remediate problemmortgage loans, and the improvementresulting in the overall credit metricsgains of the loan portfolio.non-accrual loansOREO is contained in Note 1 of "Notes to the Consolidated Financial Statements" in Item 8 of this Form 10-K. OREO, excluding covered OREO, was $34.0 million at December 31, 2011, a $2.9 million increase from December 31, 2010.20
19 December 31, 2011 December 31, 2010 December 31, 2009 As of December 31, Number
of
Properties Amount Number
of
Properties Amount Number
of
Properties Amount 2014 2013 2012 5 $ 985 6 $ 1,113 50 $ 9,245 $ 2,433 $ 2,257 $ 2,054 8 8,316 5 7,467 4 9,658 1,917 4,037 3,244 - - 2 4,657 3 11,787 923 — 207 19 5,944 14 4,096 1 620 9,295 11,649 12,355 25 7,677 27 7,564 27 16,092 1,279 3,101 4,970 52 21,937 48 23,784 35 38,157 13,414 18,787 20,776 4 3,083 4 714 12 2,450 758 346 796 16 7,970 12 5,458 15 7,285 10,293 11,083 16,327 77 33,975 70 31,069 112 57,137 Total OREO, excluding covered OREO 26,898 32,473 39,953 46 23,455 44 22,370 9 8,981 8,068 8,863 13,123 123 $ 57,430 114 $ 53,439 121 $ 66,118 Total OREO $ 34,966 $ 41,336 $ 53,076
OREO ActivityTableContentsDisposals of Non-performing AssetsDuringOREO balances for the year ended December 31, 2011, we had gross reductions of non-performing assets totaling $110.8 million, comprised of $80.3 million2014 and 2013 is presented in non-accrual loans that were sold, paid off, or transferred to held-for-sale and $30.5 million in the following table.properties that were sold. The following tables summarize disposals of non-performing assets for the years ended December 31, 2011 and 2010.Table 21Disposals of Loans
Rollforward Proceeds Book Value Charge-offs $ 3,120 $ 4,226 $ (1,106 ) 2,051 2,987 (936 ) 4,891 7,864 (2,973 ) 3,800 4,000 (200 ) 2,700 2,700 - 13,442 17,551 (4,109 ) 16,562 21,777 (5,215 ) 58,549 58,549 - $ 75,111 $ 80,326 $ (5,215 ) $ 12,540 $ 19,088 $ (6,548 ) 4,000 11,138 (7,138 ) $ 16,540 $ 30,226 $ (13,686 ) (1)This represents 36 relationships in various loan categories.(2)Includes primarily commercial and industrial loans related to a single borrower.Proceeds from disposals of non-accrual loans represented 93.5% of carrying value for 2011 and 54.7% for 2010. Included in the totals are two loans held-for-sale totaling $4.2 million as of December 31, 2011.Table 22Disposals of OREO Properties(Dollar amounts in thousands) Year Ended December 31, 2011 Year Ended December 31, 2010 OREO Covered
OREO Total OREO Covered
OREO Total $ 24,622 $ 13,109 $ 37,731 $ 47,418 $ 9,062 $ 56,480 30,485 13,147 43,632 64,456 9,137 73,593 $ (5,863 ) $ (38 ) $ (5,901 ) $ (17,038 ) $ (75 ) $ (17,113 ) $ 841 $ - $ 841 $ 9,455 $ - $ 9,455 $ 2,388 $ 1,397 $ 3,785 $ 23,196 $ 171 $ 23,367 Years Ended December 31, 2014 2013 OREO Covered OREO Total OREO Covered OREO Total Beginning balance $ 32,473 $ 8,863 $ 41,336 $ 39,953 $ 13,123 $ 53,076 Transfers from loans 8,145 9,934 18,079 11,545 6,420 17,965 Acquired 1,244 — 1,244 — — — Proceeds from sales (11,513 ) (10,855 ) (22,368 ) (15,274 ) (10,523 ) (25,797 ) Gains (losses) on sales of OREO 1,051 186 1,237 (1,531 ) 30 (1,501 ) OREO valuation adjustments (4,502 ) (60 ) (4,562 ) (2,220 ) (187 ) (2,407 ) Ending Balance $ 26,898 $ 8,068 $ 34,966 $ 32,473 $ 8,863 $ 41,336 OREO sales, excluding covered OREO, for 2011 consisted of 122 properties, comprised primarily of farmland, residential lots, and 1-4 family. In 2010, OREO sales consisted of over 200 properties with most of the sales in 1-4 family and residential lots.In evaluating whether to enter into these transactions, management assessed current collateral values, projected cash flows, long-term costs to remediate and/or maintain collateral, current disposition strategies, and other unique circumstances specific to these loans. We continue to pursue the remediation of non-performing assets. Our efforts will likely be impacted by a number of factors, including but not limited to, the pace and timing of the overall recovery of the economy, illiquidity in the real estate market, and higher levels of foreclosed real estate coming into the market.Credit Actions Taken in Fourth Quarter 2010In fourth quarter 2010, the lagging market recovery for real estate in the suburban Chicago market warranted a reassessment of the existing disposition strategies for our non-performing assets and a shift to more aggressively pursue remediation. In selecting non-performing assets for disposition strategy reassessment, we specifically targeted approximately $115.0 million of construction-related loans and OREO that we believed were subject to longer estimated recovery periods and had a higher likelihood of further declines in value due to their geographic location. Our determination of the underlying collateral values was based on current offers. If offers were not available, we relied upon current offers for similar properties located in similar geographic areas. As a result, we wrote down selected non-performing construction loans and OREO to better reflect expected proceeds from disposition and recorded additional fourth quarter loan charge-offs and OREO write-downs of $47.7 million. Of these assets, approximately 20% remain at December 31, 2011.trends, and other factors.is dependent upondepends on a variety of factors beyond the Company's control, including the performance of its loan portfolio, the economy, changes in interest rates and property values, and the interpretation by regulatory authorities of loan risk classifications.ratings by regulatory authorities. Management believes that the allowance for credit losses of $122.0 million is an appropriate estimate of credit losses inherent in the loan portfolio as of December 31, 2011.policies underlying the establishment and maintenance ofpolicy for the allowance for credit losses are discussedcan be found in Note 1 of "Notes to the Consolidated Financial Statements" in Item 8 of this Form 10-K.of ContentsTable 23
21 Legacy and
Covered Loans Acquired Loans Total Year ended December 31, 2014 Beginning balance $ 87,121 $ — $ 87,121 Net charge-offs (31,979 ) — (31,979 ) Provision for loan and covered loan losses and other expense 19,368 — 19,368 Ending balance $ 74,510 $ — $ 74,510 Total loans $ 6,018,591 $ 718,262 $ 6,736,853 Remaining acquisition adjustment N/A 24,737 24,737 Allowance for credit losses as a percent of total loans 1.24 % N/A 1.11 % Remaining acquisition adjustment as a percent of acquired loans N/A 3.44 % N/A Years ended December 31, 2011 2010 2009 2008 2007 $ 145,072 $ 144,808 $ 93,869 $ 61,800 $ 62,370 (31,180 ) (35,829 ) (56,903 ) (14,557 ) (6,424 ) (1,570 ) (1,301 ) (180 ) (42 ) (15 ) (8,193 ) (10,322 ) (7,869 ) (852 ) - (14,584 ) (2,788 ) (3,485 ) (1,801 ) (491 ) (13,895 ) (55,611 ) (63,045 ) (15,780 ) (231 ) (6,316 ) (8,356 ) (3,620 ) - - (15,396 ) (28,869 ) (18,413 ) (1,253 ) (161 ) (9,411 ) (9,609 ) (13,589 ) (5,476 ) (2,599 ) (1,120 ) (1,031 ) (934 ) (576 ) (145 ) (101,665 ) (153,716 ) (168,038 ) (40,337 ) (10,066 ) 3,392 5,227 1,899 1,531 1,499 101 - - 4 5 79 612 13 120 - 410 363 2 5 1 2,830 770 403 - - 134 - 400 - - 508 494 116 5 195 412 691 468 487 563 18 49 4 - - 7,884 8,206 3,305 2,152 2,263 (93,781 ) (145,510 ) (164,733 ) (38,185 ) (7,803 ) (9,911 ) (1,575 ) - - - (103,692 ) (147,085 ) (164,733 ) (38,185 ) (7,803 ) 69,682 145,774 215,672 70,254 7,233 51,267 27,009 - - - (40,367 ) (25,434 ) - - - 10,900 1,575 - - - 80,582 147,349 215,672 70,254 7,233 $ 121,962 $ 145,072 $ 144,808 $ 93,869 $ 61,800 $ 119,462 $ 142,572 $ 144,808 $ 93,869 $ 61,800 2,500 2,500 - - - $ 121,962 $ 145,072 $ 144,808 $ 93,869 $ 61,800 Years ended December 31, 2014 2013 2012 2011 2010 Change in allowance for credit losses Beginning balance $ 87,121 $ 102,812 $ 121,962 $ 145,072 $ 144,808 Loan charge-offs: Commercial, industrial, and agricultural 17,424 12,094 64,668 32,750 37,130 Office, retail, and industrial 7,345 4,744 34,968 8,193 10,322 Multi-family 943 1,029 3,361 14,584 2,788 Construction 1,052 1,916 27,811 20,211 63,967 Other commercial real estate 4,834 4,784 36,474 15,396 28,869 Consumer 7,574 9,414 10,910 10,531 10,640 Total loan charge-offs 39,172 33,981 178,192 101,665 153,716 Recoveries of loan charge-offs: Commercial, industrial, and agricultural 3,800 3,797 3,393 3,493 5,227 Office, retail, and industrial 497 228 577 79 612 Multi-family 87 584 275 410 363 Construction 166 1,032 451 2,964 770 Other commercial real estate 1,727 1,646 125 508 494 Consumer 729 1,071 784 430 740 Total recoveries of loan charge-offs 7,006 8,358 5,605 7,884 8,206 Net loan charge-offs, excluding
covered loan charge-offs 32,166 25,623 172,587 93,781 145,510 Net covered loan (recoveries) charge-offs (187 ) 4,575 4,615 9,911 1,575 Net loan and covered loan charge-offs 31,979 30,198 177,202 103,692 147,085 Provision for loan and covered loan losses: Provision for loan losses 24,688 11,185 142,364 69,682 145,774 Provision for covered loan losses (3,643 ) 5,222 24,945 51,267 27,009 (1,877 ) (150 ) (9,257 ) (40,367 ) (25,434 ) Net provision for covered loan losses (5,520 ) 5,072 15,688 10,900 1,575 19,168 16,257 158,052 80,582 147,349 200 (1,750 ) — — — 19,368 14,507 158,052 80,582 147,349 Ending balance $ 74,510 $ 87,121 $ 102,812 $ 121,962 $ 145,072 Included in other noninterest expense in the Consolidated Statements of Income. Years ended December 31, 2011 2010 2009 2008 2007 $ 5,101,621 $ 5,191,154 $ 5,348,979 $ 5,149,879 $ 4,943,479 1.84% 2.80% 3.08% 0.74% 0.16% 2.40% 2.84% 2.78% 1.75% 1.25% 62% 67% 58% 57% 156%
$
5,421,943
$
5,440,752
$
5,377,028
$
5,149,879
$
4,943,479 1.91% 2.70% 3.06% 0.74% 0.16% 2.28% 2.65% 2.71% 1.75% 1.25% 47% 48% 52% 57% 156% Years ended December 31, 2014 2013 2012 2011 2010 Allowance for credit losses Allowance for loan losses $ 65,468 $ 72,946 $ 87,384 $ 118,473 $ 142,572 Allowance for covered loan losses 7,226 12,559 12,062 989 — 72,694 85,505 99,446 119,462 142,572 Reserve for unfunded commitments 1,816 1,616 3,366 2,500 2,500 Total allowance for credit losses $ 74,510 $ 87,121 $ 102,812 $ 121,962 $ 145,072 Average loans $ 5,882,859 $ 5,475,110 $ 5,435,670 $ 5,421,943 $ 5,440,752 Net loan charge-offs to average loans 0.54 % 0.55 % 3.26 % 1.91 % 2.70 % Total loans 1.24 % 1.52 % 1.91 % 2.28 % 2.65 % Non-accrual loans 114.56 % 107.90 % 104.15 % 58.86 % 68.50 % Non-performing loans 105.22 % 84.97 % 74.00 % 46.95 % 48.30 % Due to the impact of business combination accounting, acquired loans are excluded from these metrics to provide for improved comparability to prior periods and better perspective into asset quality trends. 2.40%1.24% of total loans, excluding acquired loans, including covered loans, at December 31, 20112014 compared to 2.84%1.52% at December 31, 2010. The allowance for credit losses as a percentage of non-performing loans, excluding covered loans, was 62% at December 31, 2011, down from 67% at December 31, 2010. An analysis of changes in the allowance for loan losses by portfolio segment is presented on the following pages.$80.6$19.2 million for 20112014 compared to $147.3$16.3 million for 20102013 and $215.7$158.1 million for 2009. Net2012. The provision for loan and covered loan losses was elevated for the year ended December 31, 2012 due primarily to additional provision of $62.3 million recorded as a result of selling $172.5 million of non-performing and performing potential problem loans and recording charge-offs excludingof $80.3 million.2011 were $93.8 million compared2012, to $145.5 million0.55% for 20102013, and $164.7 millionto 0.54% for 2009.elevated level ofsignificant improvement since 2012 reflects management's continued efforts to remediate problem credits, which includes the bulk loan sales completed in 2012. in 2010 related to our shift in disposition strategy primarily for certain construction loans to more aggressively pursue disposition. This resulted in further charge-offs in addition to the charge-offs we had already taken under our previous disposition strategy.Charge-offs related to covered loans for 2011 and 2010 reflect the decline, and recoveries reflect the increase, in estimatedexpected future cash flows of certain acquired loans, net of the reimbursement from the FDIC under the FDIC Agreements.loans. Management re-estimates expected future cash flows periodically, and the present value of any declinesdecreases in estimatedexpected future cash flows onfrom the FDIC is recorded as either a present value basis, net of loss share, are reflected as charge-offscharge-off in that period. Conversely, anyperiod or an allowance for covered loan losses is established. Any increases in estimatedexpected future cash flows net of loss share, are recorded through prospective yield adjustments over the remaining lives of the specific loans. To date, cumulative increases in estimated cash flows have exceeded cumulative declines.24
23 As of December 31, 2011 2010 2009 2008 2007 $ 46,017 $ 49,545 $ 54,452 $ 22,189 $ 27,380 16,012 20,758 20,164 22,048 (1) 5,067 3,996 4,555 2,680 (1) 14,563 27,933 33,078 32,910 (1) 24,471 29,869 21,084 7,927 (1) 60,113 82,556 78,881 65,565 29,404 14,843 12,971 11,475 6,115 5,016 120,973 145,072 144,808 93,869 61,800 989 - - - - $ 121,962 $ 145,072 $ 144,808 $ 93,869 $ 61,800 $ 5,088,113 $ 5,100,560 $ 5,203,246 $ 5,360,063 $ 4,963,672 $ 5,348,615 $ 5,472,289 $ 5,349,565 $ 5,360,063 $ 4,963,672 2.70% 2.93% 3.30% 1.30% 1.73% 1.23% 1.72% 1.66% 2.15% (1) 1.76% 1.14% 1.36% 0.93% (1) 13.76% 15.99% 10.54% 6.46% (1) 2.37% 2.93% 2.05% 0.73% (1) 2.20% 3.00% 2.73% 2.26% 1.13% 2.25% 1.97% 1.73% 0.82% 0.64% 2.40% 2.84% 2.78% 1.75% 1.25% As of December 31, 2014 2013 2012 2011 2010 $ 29,458 39.3 $ 30,381 38.6 $ 36,761 36.7 $ 46,017 33.5 $ 49,545 33.2 Commercial real estate: 10,992 22.2 10,405 24.2 11,432 25.6 16,012 25.5 20,758 23.6 Multi-family 2,249 8.4 2,017 6.0 3,575 5.5 5,067 5.7 3,996 6.9 Construction 2,769 3.1 6,712 3.3 10,241 3.6 17,935 4.9 32,624 6.6 8,841 13.3 11,187 14.5 14,699 14.9 21,099 17.4 25,178 16.8 24,851 47.0 30,321 48.0 39,947 49.6 60,113 53.5 82,556 53.9 Consumer 12,975 13.7 13,860 13.4 14,042 13.7 14,843 13.0 12,971 12.9 67,284 100.0 74,562 100.0 90,750 100.0 120,973 100.0 145,072 100.0 Covered loans 7,226 12,559 12,062 989 — Total allowance for
credit losses $ 74,510 $ 87,121 $ 102,812 $ 121,962 $ 145,072 Prior Percentages represent total loans in each category to 2008, we allocated our allowance for commercial real estatetotal loans, to the general category of commercial real estate.(2)excluding covered loans.Includes commercial construction.$23.1 millionby 14.5% from $145.1$87.1 million as of December 31, 20102013 to $122.0$74.5 million as of December 31, 2011. 2014, reflecting reductions across most categories. This decrease in the allowance for credit losses reflects the continued improvement in our non-performing loan levels and the related credit metrics, resulting from management's ongoing credit remediation focus. In addition, a decrease in the allowance for covered loans losses contributed to the variance, consistent with the wind-down of the covered loan portfolio.2011, we saw2012, declines in non-accrual non-performing, and performing potential problem loans as well as a shift away from construction loans, allaccelerated credit remediation actions, including the impact of which drovethe bulk loan sales, resulted in improved credit metrics and a decreasedecline in our estimate of credit losses inherent in the loan portfolio and the amount of allowance for credit losses deemed appropriate to cover those losses.In 2011, we decreased our allowance for loan losses for all categories of loans, excluding multi-family loans and covered loans. The increase in the allowance for loan losses allocated to multi-family loans reflects management's estimate of potential losses on smaller-sized loans in this portfolio. The allowance for covered loan losses on covered loans is allocatedincreased $11.1 million from 2011 to open-ended consumer loans that are not categorized as impaired loans.In 2010, we maintainedreflect the allowance for credit losses consistent withdifference between the December 31, 2009 level with a decrease in the allowance allocated to commercial, industrial, and agricultural loans offset by an increase in the amount allocated to other commercial real estate loans. We also reduced the allowance allocated to residential constructionloans in 2010. Due to the level of charge-offs on these loans in 2009 and 2010carrying value and the level of risk associated with the remaining loans, we estimated that a lower level of inherent losses remained in that portfolio as of December 31, 2010.We increased our allowance for credit losses by $50.9 million from December 31, 2008 to December 31, 2009 based in large part on higher charge-offs in each loan category.In 2008, we more than doubled the allowance for credit losses allocated to commercial real estate loans, increasing it from $29.4 million as of December 31, 2007 to $65.6 million as of December 31, 2008. The 2008 increase was the direct resultdiscounted present value of the economic decline and resulting impact on real estate and related markets, which was reflected in lower collateral values.purchasepreviously purchased life insurance policies on the lives of certain directors and officers and are the sole owner and beneficiary of the policies. We investinvested in these BOLI policies known as BOLI, to provide an efficient form of funding for long-term retirement and other employee benefit costs. Therefore, our BOLI policies are intended to be long-term investments to provide funding for long-term liabilities. We record these BOLI policies as a separate line item in the Consolidated Statements of Financial Condition at each policy's respective CSV with changes recorded inas a component of noninterest income in the Consolidated Statements of Income. As of December 31, 2011,2014, the CSV of BOLI assets totaled $206.2 million.2011, 28.6%2014, 35.5% of our total BOLI portfolio is invested in general account life insurance distributed between nineamong eleven insurance carriers, all of which carry investment grade ratings. This general account life insurance typically includes a feature guaranteeing minimum returns. The remaining 71.4%64.5% is in separate account life insurance, which is managed by third party investment advisors under pre-determined investment guidelines. Stable value protection is a feature available for separate account life insurance policies that is designed to protect within limits, a policy's CSV from market fluctuations, within limits, on underlying investments. Our entire separate account portfolio has stable value protection purchased from a highly rated financial institution. To the extent fair values on individual contracts fall below 80%, the CSV of the specific contracts may be reduced or the underlying assets may be transferred to short-duration investments, resulting in lower earnings.for 2011 increased 43.0% from 2010. Since fourth quarter 2008, management electedof $2.9 million compared to accept lower market returnsa prior year BOLI loss of $11.8 million. During 2013, we voluntarily modified approximately $100 million of certain lower-yielding BOLI policies, which resulted in ordera $13.3 million write-down of the CSV. This action gave us the flexibility to reduce our risk to market volatility through investment in shorter-duration, lower yielding money market instruments. This strategy also had the effect of improving our regulatory capital ratios by reducing risk-weighted assets.GOODWILLGoodwill is included in goodwill and other intangiblereinvest these assets in the Consolidated Statements of Financial Condition. longer duration securities at higher yields to enhance future BOLI income.valueamount of goodwill was $265.5$310.6 million as of bothat December 31, 20112014 and $264.1 million at December 31, 2010. As described in2013. Goodwill increased by $46.5 million from December 31, 2013 as a result of the Popular, Great Lakes, and National Machine Tool acquisitions completed during the third and fourth quarters of 2014. For additional detail regarding the goodwill impact for each acquisition, see Note 89 of "Notes to the Consolidated Financial Statements" in Item 8 of this Form 10-K, goodwill10-K. at least annually for impairment or when events or circumstances indicate a need to perform interim tests. Impairment testing is performed by comparingtests, as described in Note 1 of "Notes to the carrying valueConsolidated Financial Statements" in Item 8 of the reporting unit with management's estimate of the fair value of the reporting unit, which is based on a discounted cash flow analysis.this Form 10-K. During 2011,2014, we performed an analysisour annual impairment test of goodwill at September 30, 2011October 1, 2014 and updated that assessment during fourth quarter 2011. We determined that goodwill was not impaired at either date.DEFFEREDthat date and there was no indication that goodwill was impaired at December 31, 2014.attributableattributed to temporary differences between the financial statement carrying amounts of existing assets and liabilities and their respective tax bases.basis. For additional discussion of income taxes, see Notes 1 and 1415 of "Notes to the Consolidated Financial Statements" in Item 8 of this Form 10-K. Income tax expense and benefits recorded due to changes in uncertain tax positions are also described in Note 14.15.Table 25
24 December 31, % Change 2011 2010 2009 2011-2010 2010-2009 $ 102,624 $ 113,353 $ 92,479 (9.5 ) 22.6 - 30 2,503 (100.0 ) (98.8 ) As of December 31, % Change 2014 2013 2012 2014-2013 2013-2012 Net deferred tax assets $ 91,685 $ 107,624 $ 133,605 (14.8 ) (19.4 ) The decrease in deferred tax assets in 2011 was primarily attributable to a reduction in the allowance for loan losses for which there is a zero tax basis.pre-tax pre-provision operating earnings during that period,actual performance versuscompared to budget, trends in non-performing assets and performing potential problem loans, the Company's capital position, and trends in non-performing assets and adversely rated loans. Managementany unsettled circumstances that could impact future earnings. Based on this assessment, management determined that it is more likely than not that our deferred tax assets as of December 31, 2011 will be fully realized and no valuation allowance is required.increasedecrease in deferred tax assets in 20102013 was primarily attributableattributed to utilization of federal net operating losses, which was partially offset by an increase in federal and state loss andalternative minimum tax credit carryforwards and the tax effects of securities valuation adjustments recorded in other comprehensive income (loss).The valuation allowance at December 31, 2010 and December 31, 2009 related to certain state deferred tax assets, including net operating loss and credit carryforwards, which were not expected to be fully realized. In 2010, the valuation allowance was reduced to a nominal amount. The decrease resulted from certain statutory and structural changes that made it more likely than not that the referenced state deferred tax assets would be realized in full. as to how liquidity should be managed to maintain flexibility in responding to changes in liquidity needs over a 12-month forward-looking period, including the requirement to formulate a quarterly liquidity compliance plan for review by the Bank's Board of Directors. The compliance plan includes an analysis that measures projected needs to purchase and sell funds. The analysis incorporates a set of projected balance sheet assumptions that are updated at least quarterly. Based on these assumptions, we determine our total cash liquidity on hand and excess collateral capacity from pledging, unused federal funds purchased lines, and other unused borrowing capacity, such as FHLB advances, resulting in a calculation of our total liquidity capacity. Our total policy-directed liquidity requirement is to have funding sources available to cover 66.7% of non-collateralized, non-FDIC insured, non-maturity deposits. Based on our projections as of December 31, 2011,2014, we expect to have liquidity capacity in excess of policy guidelines for the forward twelve-month period.stockholders.stockholders, which totaled $54.0 million for the year ended December 31, 2014. The primary source of liquidity for the Parent Company is dividends from subsidiaries. The Parent Company had $87.3$47.6 million in junior subordinated debentures, related to trust-preferred securities, $50.5$38.5 million in other subordinated debt outstanding, $114.4notes, $114.8 million in senior debt,notes, and cash and equivalent short-term investmentsinterest-bearing deposits of $47.1$43.5 million at December 31, 2011.2014. At December 31, 2011,the end of 2014, the Parent Company did not have any unusedhad a $35.0 million short-term, unsecured revolving line of credit facilities availablewith a correspondent bank that we allowed to fund cash flows.expire on January 20, 2015. As of December 31, 2014, no amount was outstanding. The Parent Company has the ability to enhance its liquidity position by raising capital or incurring debt.20112014 are summarized in Notes 910 and 1011 of "Notes to the Consolidated Financial Statements" in Item 8 of this Form 10-K. The following table provides a comparison of average funding sources over the last three years. We believe that average balances, rather than period-end balances, are more meaningful in analyzing funding sources because of the inherent fluctuations that may occur on a monthly basis within most funding categories.26
25 Years Ended December 31, % Change Years Ended December 31, % Change 2011 % of
Total 2010 % of
Total 2009 % of
Total 2011-2010 2010-2009 2014 2013 2012 2014-2013 2013-2012 $ 1,498,900 21.5 $ 1,224,629 18.0 $ 1,061,208 15.0 22.4 15.4 $ 2,137,778 28.3 $ 1,889,247 26.2 $ 1,762,968 25.0 13.2 7.2 934,937 13.4 815,371 12.0 751,386 10.7 14.7 8.5 1,222,292 16.2 1,126,561 15.6 1,038,379 14.7 8.5 8.5 1,091,184 15.7 1,082,774 15.9 984,529 13.9 0.8 10.0 1,243,186 16.5 1,170,928 16.2 1,090,446 15.4 6.2 7.4 1,230,090 17.7 1,199,362 17.6 937,766 13.3 2.6 27.9 1,392,367 18.5 1,306,625 18.1 1,216,173 17.2 6.6 7.4 4,755,111 68.3 4,322,136 63.5 3,734,889 52.9 10.0 15.7 Core deposits 5,995,623 79.5 5,493,361 76.1 5,107,966 72.3 9.1 7.5 1,773,188 25.4 1,971,684 28.9 1,961,244 27.8 (10.1 ) 0.5 1,195,796 15.8 1,286,700 17.8 1,502,230 21.3 (7.1 ) (14.3 ) 18,821 0.3 19,953 0.3 39,963 0.5 (5.7 ) (50.1 ) 16,086 0.2 20,188 0.3 26,776 0.4 (20.3 ) (24.6 ) 1,792,009 25.7 1,991,637 29.2 2,001,207 28.3 (10.0 ) (0.5 ) 1,211,882 16.0 1,306,888 18.1 1,529,006 21.7 (7.3 ) (14.5 ) 6,547,120 94.0 6,313,773 92.7 5,736,096 81.2 3.7 10.1 7,207,505 95.5 6,800,249 94.2 6,636,972 94.0 6.0 2.5 117,065 1.7 191,826 2.8 398,062 5.6 (39.0 ) (51.8 ) 106,072 1.4 90,891 1.3 79,924 1.1 16.7 13.7 148,637 2.1 167,348 2.5 720,730 10.2 (11.2 ) (76.8 ) Federal funds purchased 82 — 5 — — — N/M 100.0 FHLB advances 43,405 0.6 114,565 1.6 113,719 1.6 (62.1 ) 0.7 265,702 3.8 359,174 5.3 1,118,792 15.8 (26.0 ) (67.9 ) 149,559 2.0 205,461 2.9 193,643 2.7 (27.2 ) 6.1 150,285 2.2 137,739 2.0 208,621 3.0 9.1 (34.0 ) 191,776 2.5 212,896 2.9 231,273 3.3 (9.9 ) (7.9 ) $ 6,963,107 100.0 $ 6,810,686 100.0 $ 7,063,509 100.0 2.2 (3.6 ) $ 7,548,840 100.0 $ 7,218,606 100.0 $ 7,061,888 100.0 4.6 2.2 20112014 increased $152.4$330.2 million from 2013, due primarily to deposits assumed in the Popular and Great Lakes acquisitions, further strengthening our core deposit base. Growth in average demand deposits of $248.5 million, or 2.2%13.2%, from 2010 resulting from a $433.0 million, or 10.0%, increaseDecember 31, 2013, led the rise in average transactionalcore deposits and a $12.5 million, or 9.1%, increase in senior and subordinated debt. These increases were partiallymore than offset by declinesthe reduction in higher-costing time deposits, of $199.6 million, or 10.0%, and borrowed funds, of $93.5and senior and subordinated debt.or 26.0%. The riseincrease in demand deposits and drop in time deposits resulted in a more favorable product mix.Total average funding sources for 2010 decreased 3.6%, or $252.8 million, from 2009 with most2012 resulted mainly from a rise in core deposits, which more than offset a reduction in higher-costing time deposits.the increaseTime Deposits Greater Than $100,000 Total Three months or less $ 80,613 Greater than three months to six months 81,415 Greater than six months to twelve months 109,789 Greater than twelve months 140,300 Total $ 412,117 (discussed below). is presented in the next table. 2014 2013 2012 Amount Amount Amount At period-end: $ 137,994 0.03 $ 109,792 0.03 $ 71,403 0.02 Federal funds purchased — — — — — — FHLB advances — — 114,550 1.34 114,581 1.72 Total borrowed funds $ 137,994 0.03 $ 224,342 0.70 $ 185,984 1.06 Average for the year-to-date period: $ 106,072 0.04 $ 90,891 0.03 $ 79,924 0.02 Federal funds purchased 82 — 5 — — — FHLB advances 43,405 1.23 114,565 1.38 113,719 1.76 Total borrowed funds $ 149,559 0.38 $ 205,461 0.78 $ 193,643 1.04 Maximum amount outstanding at the end of any day during the period: $ 149,067 $ 110,797 $ 103,591 Federal funds purchased 25,000 2,000 — FHLB advances 114,550 114,581 114,593 transactional depositsborrowed funds totaled $149.6 million for 2010 were $4.3 billion, an increase of $587.22014, decreasing $55.9 million, or 15.7%27.2%, from 2009. Contributing2013 due to this increasethe prepayment of $114.6 million of FHLB advances with a weighted-average rate of 1.33% during the second quarter of 2014. This decline was approximately $325 million in core transactional deposits acquired through FDIC-assisted transactions.partially offset by higher levels of securities sold under agreements to repurchase.ContentsBorrowed Funds and federal funds purchased generally mature within 1 to 90 days from the transaction date. Other borrowed funds consist of term auction facilities issued by the Federal Reserve that mature within 90 days. Federal term auction facilities were discontinued during 2010. A discussion of borrowed funds is presented in the next table.Table 27Borrowed Funds(Dollar amounts in thousands) 2011 2010 2009 Amount Rate (%) Amount Rate (%) Amount Rate (%) $ 92,871 0.02 $ 166,474 0.04 $ 238,390 0.38 - - - - - - 112,500 2.13 137,500 1.95 152,786 2.03 - - - - 300,000 0.25 $ 205,371 1.17 $ 303,974 0.90 $ 691,176 0.69 $ 117,065 0.02 $ 191,826 0.14 $ 398,062 1.40 603 0.22 4,371 0.15 164,627 0.22 148,034 1.84 142,703 2.06 174,643 3.21 - - 20,274 0.25 381,460 0.27 $ 265,702 1.03 $ 359,174 0.91 $ 1,118,792 1.12 $ 174,810 $ 683,685 $ 920,955 175,000 60,000 630,000 302,500 272,802 585,736 1 300,000 750,000 19.3 months 27.6 months 37.5 months Average borrowed funds totaled $265.7 million for 2011, decreasing $93.5 million, or 26.0%, from 2010, following a decrease of $759.6 million, or 67.9%, from 2009 to 2010. Since the last half of 2009, we reduced funding costs by using the proceeds from securities sales and maturities to reduce our level of borrowed funds and time deposits, resulting in an increase in our net interest margins.For 2011, the maximum daily balance in securities sold under agreements to repurchase occurred in January 2011. The increased funding was required to temporarily obtain collateral to pledge increased balances on our public accounts due to seasonal trends. For federal funds purchased, the maximum daily balance of 2011 occurred in April 2011 as a result of a test of the federal funds line. We test this line occasionally throughout the year to ensure availability. With the exception of two such tests, we did not have any federal funds purchased during the year. The maximum daily balance in FHLB advances occurred in September 2011 when we obtained a short-term $165.0 million FHLB advance with an interest rate of 6 basis points. The proceeds were used to purchase short-term investments, which earned a higher interest rate than the advance. The advance was paid off in October 2011.We make interchangeable use of repurchase agreements, FHLB advances, federal funds purchased, and, prior to March 2010, federal term auction facilities to supplement deposits and leverage the interest yields produced through our securities portfolio.increased $12.5decreased $21.1 million, or 9.1%9.9%, in 2011 comparedfrom 2013 to 2010 following a $70.92014. This decline resulted from the full-year impact of the repurchase and retirement of $24.0 million or 34.0%, decline from 2009 to 2010.As further explainedof junior subordinated debentures during the fourth quarter of 2013. The addition of $14.4 million of junior subordinated debentures acquired in the section titled "ManagementGreat Lakes transaction during the fourth quarter of Capital"2014 partially offset the decrease. See Note 12 of "Notes to the Consolidated Financial Statements" in Item 8 of this Item 7,Form 10-K for additional discussion regarding these transactions.November 2011, we redeemed $193.0average senior and subordinated debt from 2012 to 2013 reflects the full-year impact of the repurchase and retirement of $4.3 million of Preferred Shares issued to the Treasury. The redemption was funded through a combination of existing liquid assetsjunior subordinated debentures and the proceeds from a $115.0 senior debt issuance. Interest paid on the new senior debt in 2011 reduced net interest margin by one basis point.In 2009, we completed an offer to exchange approximately one-third each of our subordinated notes and trust-preferred subordinated debt for newly issued shares of Common Stock. The exchanges strengthened the composition of our capital base by increasing our Tier 1 common and tangible common equity ratios, while also reducing the interest expense associated with the debt securities.As a result of the exchange offers, $39.3 million of 6.95% trust-preferred subordinated debt was retired at a discount of 20% in exchange for 3,058,410 shares of Common Stock, and $29.5 million of 5.85% subordinated debt was retired at a discount of 10% in exchange for 2,584,695 shares of Common Stock. Subsequent to the exchanges, we retired an additional $1.0 million of trust-preferred subordinated debt at a discount of 20% for cash and $20.0$12.0 million of subordinated notes at a discountduring the fourth quarter of 7% for cash. In the aggregate, the exchange offers and the subsequent retirement of debt for cash resulted in the recognition of $15.3 million in pre-tax gains in 2009.SuchThese obligations generally relate to the funding of operations through deposits or debt issuances, as well as leases for premises and equipment. As a financial services provider, we routinely enter into commitments to extend credit. While contractual obligations represent our future cash requirements, a significant portion of commitments to extend credit may expire without being drawn upon. Suchdrawn. These commitments are subject to the same credit policies and approval process as all comparable loans we make.used for our loans.2011.2014. Further discussion of the nature of each obligation is included in the referenced note of "Notes to the Consolidated Financial Statements" in Item 8 of this Form 10-K. Payments Due In Note Reference Less Than
One Year One to
Three Years Three to
Five Years Over Five Years Total Payments Due In 9 $ 4,820,058 $ - $ - $ - $ 4,820,058 One Year or Less Greater Than One to Three Years Greater Than Five Years Total Core deposits (no stated maturity) 10 $ 6,616,200 $ — $ — $ — $ 6,616,200 9 1,227,564 323,914 107,072 567 1,659,117 10 865,149 300,557 105,584 268 1,271,558 10 55,824 126,656 22,891 - 205,371 11 137,994 — — — 137,994 11 - - - 252,153 252,153 12 — 153,263 — 47,606 200,869 7 3,627 6,299 4,398 5,552 19,876 8 5,071 9,289 5,955 13,031 33,346 15 5,276 10,078 10,386 26,124 51,864 16 5,298 10,283 8,409 17,518 41,508 14 N/A N/A N/A N/A 346 15 N/M N/M N/M N/M 912 20 N/A N/A N/A N/A 1,348,761 21 N/M N/M N/M N/M 1,982,595 20 N/A N/A N/A N/A 116,566 21 N/M N/M N/M N/M 110,639 profitable growth opportunities. Our capital policy requires that the Company and the Bank maintain capital ratios in excess of the minimum regulatory guidelines. It serves as an internal discipline in analyzing business risks and internal growth opportunities and sets targeted levels of return on equity. Under regulatory capital adequacy guidelines, the Company and the Bank are subject to various capital requirements set and administered by the federal banking agencies. These requirements specify minimum capital ratios, defined as Tier 1 and total capital as a percentage of assets and off-balance sheet items that have beenwere weighted according to broad risk categories and a leverage ratio calculated as Tier 1 capital as a percentage of adjusted average assets. We manage our capital ratios for both the Company and the Bank to consistently maintain suchthese measurements in excess of the Federal Reserve's minimum levels considered to be "well-capitalized," which is the highest capital category established.Capital resources of financial institutions are also regularly measured by tangible equity ratios, which are non-GAAP measures. Tangible common equity equals total shareholders' equity as defined by GAAP less goodwill and other intangible assets and preferred stock, which does not benefit common shareholders. Tangible assets equal total assets as defined by GAAP less goodwill and other intangible assets. The tangible equity ratios are a valuable indicator of a financial institution's capital strength since they eliminate intangible assets from shareholders' equity.20112014 and 2010.Table 29Capital Measurements December 31, Regulatory
Minimum For
"Well-
Capitalized" Excess Over
Required Minimums
at December 31,
2011 2011 2010 (Dollar amounts in millions) 13.68% 16.27% 10.00% 37% $ 230 11.61% 14.20% 6.00% 94% $ 350 9.28% 11.21% 5.00% 86% $ 334 13.68% 13.21% 10.00% 37% $ 230 11.61% 11.15% 6.00% 94% $ 350 9.28% 8.80% 5.00% 86% $ 334 10.26% 9.81% N/A (3) N/A (3) N/A (3) 8.83% 8.06% N/A (3) N/A (3) N/A (3) 9.00% 8.41% N/A (3) N/A (3) N/A (3) 10.88% 10.02% N/A (3) N/A (3) N/A (3) 14.37% 13.87% 10.00% 44% $ 268 13.11% 12.61% 6.00% 119% $ 436 10.37% 9.88% 5.00% 107% $ 416 (1)These ratios as of December 31, 2010 exclude2013. See the impact of $193.0 million in Preferred Shares issued to the Treasury. For additional discussion of the Preferred Shares, refer to Note 12 of "Notes to Consolidated Financial Statements""Supervision and Regulation" section included in Item 81, "Business," of this Form 10-K.(2)Excludes the impact of Preferred Shares as of December 31, 2010 and trust-preferred securities.(3)Ratio is not subject to formal Federal Reserve regulatory guidance.All regulatory mandated ratios10-K for characterization as "well-capitalized" were exceeded as of December 31, 2011.abovebelow are capital adequacy metrics used and relied uponon by investors and industry analysts; however, they are non-GAAP financial measures for SEC purposes. These non-GAAP measures are valuable indicators of a financial institution's capital strength since they eliminate intangible assets from stockholders' equity and retain the effect of accumulated other comprehensive loss in stockholders' equity. Reconciliations of the components of those ratios to GAAP are also presented in the table below.Table 30Reconciliation of 29Components to Regulatory Requirements and GAAP
Measurements December 31, 2011 2010 $ 853,961 $ 1,027,761 - (193,000 ) $ 853,961 $ 834,761 $ 724,863 $ 897,410 - (193,000 ) 724,863 704,410 (84,730 ) (84,730 ) $ 640,133 $ 619,680 $ 6,241,191 $ 6,317,744 $ 7,813,637 $ 8,002,186 13.68% 16.27% 13.68% 13.21% 11.61% 14.20% 11.61% 11.15% 10.26% 9.81% 9.28% 11.21% 9.28% 8.80% $ 962,587 $ 1,112,045 - (193,000 ) 962,587 919,045 (283,650 ) (286,033 ) 678,937 633,012 13,276 27,739 $ 692,213 $ 660,751 $ 7,973,594 $ 8,138,302 (283,650 ) (286,033 ) $ 7,689,944 $ 7,852,269 8.83% 8.06% 9.00% 8.41% 10.88% 10.02% As of December 31, 2014 2013 Bank regulatory capital ratios: Total capital to risk-weighted assets 12.30 % 13.86 % 10.00 % 23 % $ 174,282 Tier 1 capital to risk-weighted assets 11.32 % 12.61 % 6.00 % 89 % $ 402,834 Tier 1 leverage to average assets 9.76 % 10.24 % 5.00 % 95 % $ 418,334 Total capital to risk-weighted assets 11.23 % 12.39 % N/A N/A N/A Tier 1 capital to risk-weighted assets 10.19 % 10.91 % N/A N/A N/A Tier 1 leverage to average assets 9.03 % 9.18 % N/A N/A N/A 9.54 % 10.37 % N/A N/A N/A Reconciliation of Company capital components to GAAP: Total stockholder's equity $ 1,100,775 $ 1,001,442 Goodwill and other intangible assets (334,199 ) (276,366 ) Tangible common equity 766,576 725,076 Accumulated other comprehensive loss 15,855 26,792 $ 782,431 $ 751,868 Total assets $ 9,445,139 $ 8,253,407 Goodwill and other intangible assets (334,199 ) (276,366 ) Tangible assets $ 9,110,940 $ 7,977,041 Risk-weighted assets $ 7,879,366 $ 6,794,666 Tangible common equity to tangible assets 8.41 % 9.09 % N/A N/A N/A 8.59 % 9.43 % N/A N/A N/A Tangible common equity to risk-weighted assets 9.73 % 10.67 % N/A N/A N/A Ratio is not subject to formal Federal Reserve regulatory guidance. Excludes the impact of trust-preferred securities. Tangible common equity represents common stockholders’ equity less goodwill and identifiable intangible assets. In management’s view, Tier 1 common capital and TCE measures are meaningful to the Company, as well as analysts and investors, in assessing the Company’s use of equity and in facilitating comparisons with competitors. giving consideration toconsidering the current and expected operating environment as well as an evaluation of various capital deployment alternatives.20112014 and 20102013 for the Company and the Bank, see Note 1819 of "Notes to the Consolidated Financial Statements" in Item 8 of this Form 10-K.
Basel III Capital RulesTableContentsRedemption of Preferred SharesIn December 2008, we received $193.0 million from the sale of Preferred Shares to the Treasury as part of its CPP. In connection with the CPP, we issued to the Treasury (i) a total of 193,000 Preferred Shares and (ii) a Warrant to purchase up to 1,305,230 shares of2013, the Company's Common Stock. Both the Preferred Shares and the Warrant were accountedBank's primary federal regulator, the Federal Reserve, published final rules establishing a new comprehensive capital framework for as components of our regulatory Tier 1 capital.In November 2011, we redeemed all of the $193.0 million of Preferred Shares.U.S. banking organizations. The redemption was funded through a combination of existing liquid assets and the proceeds from a senior debt issuance. In December 2011, we paid $900,000 to the Treasury to redeem the Warrant, which concluded our participationBasel III Capital Rules are discussed in the CPP.Common Shares IssuedIn January 2010, we issued a total"Supervision and Regulation" section in Item 1, "Business" of 18,818,183 shares of Common Stock at a price of $11.00 per share, which resulted in a $196.0 million increase in stockholders' equity, net of the underwriting discount and related expenses. We used the proceeds to improve the quality of our capital position and for general operating purposes.We had 85,787,354 shares issuedthis Form 10-K.20112014 the Company and 2010. Therethe Bank would meet all capital adequacy requirements under the Basel III Capital Rules on a fully phased-in basis as if such requirements were 74,435,004 shares outstanding as of December 31, 2011 and 74,095,695 shares outstanding as of December 31, 2010.conjunctionconnection with our Dividend Reinvestment Plan, qualified and nonqualified retirement plans, share-based compensation plans, and other general corporate purposes. We reissued 103,770165,104 treasury shares in 20112014 and 18,845125,901 treasury shares in 20102013 to fund suchthese plans.Common Stockcash dividends of $0.010$0.01 per common share forfrom 2012 through the past twelve quarters.Other TransactionsIn January 2010, the Company made a $100.0 million capital contribution to the Bank. In addition, the Bank sold $168.1 millionfirst quarter of non-performing assets to the Company in March 2010. On the date of the sale, the Company recorded the assets at fair value. Since the majority of the assets were collateral-dependent loans, fair value was determined based on the lower of the recorded book value of the loan or the estimated fair value of the underlying collateral less costs to sell. No allowance for credit losses was recorded by the Company on the date of the purchase of these assets.2013. The Company had non-performing assets totaling $45.2 million asincreased the dividend to $0.04 per common share during the second quarter of December 31, 20112013, $0.07 per common share during the fourth quarter of 2013, and $93.1 million as of December 31, 2010. This transaction did not change the presentation of these non-performing assetsapproved another increase in the consolidated financial statements and did not impact the Company's consolidated financial position, resultssecond quarter of operations, or regulatory ratios. However, these two transactions improved the Bank's asset quality, capital ratios, and liquidity.of ContentsQUARTERLY REVIEWTable 31
Quarterly Earnings Performance(1) 2011 2010 Fourth Third (2) Second (2) First (2) Fourth Third Second First $ 78,757 $ 80,175 $ 81,296 $ 81,283 $ 82,476 $ 82,338 $ 82,274 $ 81,779 (9,679 ) (9,640 ) (9,935 ) (10,637 ) (10,897 ) (12,125 ) (12,655 ) (13,841 ) 69,078 70,535 71,361 70,646 71,579 70,213 69,619 67,938 (21,902 ) (20,425 ) (18,763 ) (19,492 ) (73,897 ) (33,576 ) (21,526 ) (18,350 ) 25,669 24,142 24,963 23,677 24,505 24,377 21,886 21,264 649 626 1,531 540 1,718 7,340 2,255 5,820 (759 ) (177 ) - - (56 ) (964 ) (1,134 ) (2,763 ) - - - - - 4,303 - 1,076 - - - - - - - (66,591 ) (64,176 ) (65,719 ) (65,418 ) (77,074 ) (68,777 ) (67,455 ) (65,473 ) 7,220 10,525 13,373 9,953 (53,225 ) (1,387 ) 7,948 8,436 (296 ) (1,583 ) (2,720 ) 91 25,066 3,972 (139 ) (355 ) 6,924 8,942 10,653 10,044 (28,159 ) 2,585 7,809 8,081 (3,027 ) (2,586 ) (2,582 ) (2,581 ) (2,579 ) (2,575 ) (2,573 ) (2,572 ) (20 ) (93 ) (100 ) (137 ) 411 1 (65 ) (81 ) $ 3,877 $ 6,263 $ 7,971 $ 7,326 $ (30,327 ) $ 11 $ 5,171 $ 5,428 $ 0.05 $ 0.09 $ 0.11 $ 0.10 $ (0.41 ) $ - $ 0.07 $ 0.08 $ 0.05 $ 0.09 $ 0.11 $ 0.10 $ (0.41 ) $ - $ 0.07 $ 0.08 $ 0.01 $ 0.01 $ 0.01 $ 0.01 $ 0.01 $ 0.01 $ 0.01 $ 0.01 1.60% 2.60% 3.39% 3.20% (12.49% ) 0.00% 2.16% 2.38% 0.34% 0.43% 0.52% 0.50% (1.34% ) 0.13% 0.40% 0.43% 3.95% 3.97% 4.10% 4.15% 4.02% 4.05% 4.21% 4.28% 2014 2013 Fourth Third Second First Fourth Third Second First Interest income $ 81,309 $ 76,862 $ 72,003 $ 69,690 $ 72,120 $ 72,329 $ 71,753 $ 71,045 Interest expense (5,490 ) (5,831 ) (5,696 ) (5,995 ) (6,432 ) (6,663 ) (6,823 ) (7,197 ) Net interest income 75,819 71,031 66,307 63,695 65,688 65,666 64,930 63,848 (1,659 ) (10,727 ) (5,341 ) (1,441 ) — (4,770 ) (5,813 ) (5,674 ) Fee-based revenues 29,364 29,660 27,008 25,049 26,712 27,804 26,008 25,758 Net securities gains (losses) (63 ) 2,570 4,517 1,073 147 33,801 216 — Other noninterest income 1,767 4,877 (332 ) 1,128 920 (3,517 ) 1,217 1,817 Noninterest expense (84,828 ) (70,313 ) (65,017 ) (63,668 ) (64,794 ) (64,702 ) (62,427 ) (64,814 ) 20,400 27,098 27,142 25,836 28,673 54,282 24,131 20,935 Income tax expense (5,807 ) (8,549 ) (8,642 ) (8,172 ) (9,508 ) (24,959 ) (7,955 ) (6,293 ) Net income $ 14,593 $ 18,549 $ 18,500 $ 17,664 $ 19,165 $ 29,323 $ 16,176 $ 14,642 $ 0.19 $ 0.25 $ 0.25 $ 0.24 $ 0.26 $ 0.39 $ 0.22 $ 0.20 $ 0.19 $ 0.25 $ 0.25 $ 0.24 $ 0.26 $ 0.39 $ 0.22 $ 0.20 $ 0.08 $ 0.08 $ 0.08 $ 0.07 $ 0.07 $ 0.04 $ 0.04 $ 0.01 Return on average common equity 5.35 % 6.91 % 7.08 % 6.97 % 7.53 % 11.66 % 6.66 % 6.17 % Return on average assets 0.63 % 0.84 % 0.88 % 0.86 % 0.91 % 1.38 % 0.79 % 0.74 % 3.76 % 3.72 % 3.65 % 3.61 % 3.62 % 3.63 % 3.70 % 3.77 % (1)All ratios are presented on an annualized basis.(2)The first three quarters of 2011 have been restated to correct a 2011 actuarial pension expense calculation related to the valuation of future early retirement benefits. The net impact was a reduction to net income of $174,000 per quarter, which had no impact on quarterly earnings per common share.FOURTH QUARTER 2011 vs. 2010All ratios are presented on an annualized basis. 2011 was $6.9 million, before adjustmentsof 2014 and $0.28 for preferred dividends and non-vested restricted shares, with a net incomethe third quarter of $3.9 million, or $0.05 per share, available to common shareholders after such adjustments. This compares to a net loss available to common shareholders of $30.3 million, or $0.41 per share, for fourth quarter 2010.Table 32Quarterly Operating Earnings(1)(Dollar amounts in thousands) 2011 2010 Fourth Third Second First Fourth Third Second First $ 7,220 $ 10,525 $ 13,373 $ 9,953 $ (53,225 ) $ (1,387 ) $ 7,948 $ 8,436 21,902 20,425 18,763 19,492 73,897 33,576 21,526 18,350 29,122 30,950 32,136 29,445 20,672 32,189 29,474 26,786 (110 ) 449 1,531 540 1,662 6,376 1,121 3,057 - - - - - - 4,303 - (2,000 ) - - - - - - - - - - - (576 ) (847 ) (1,772 ) (129 ) 1,076 - - - - - - - (1,425 ) (2,611 ) (3,423 ) (2,227 ) (15,412 ) (8,265 ) (8,924 ) (7,879 ) (2,459 ) (2,162 ) (1,892 ) (1,687 ) (14,326 ) (2,736 ) (5,272 ) (4,951 ) $ 31,581 $ 33,112 $ 34,028 $ 31,132 $ 34,998 $ 34,925 $ 34,746 $ 31,737 (1)The Company's accounting and reporting policies conform to GAAP and general practice within the banking industry. As a supplement to GAAP, the Company has provided this non-GAAP performance result. The Company believes that this non-GAAP financial measure is useful because it allows investors to assess the Company's operating performance. Although this non-GAAP financial measure is intended to enhance investors' understanding of the Company's business and performance, this non-GAAP financial measure should not be considered an alternative to GAAP.Pre-tax, pre-provision operating earnings decreased by $3.4 million from fourth quarter 2010 to fourth quarter 2011 driven by a decline in net interest income and a $1.3 million correction of a 2010 actuarial pension expense calculation related to the valuation of future early retirement benefits recorded in fourth quarter 2011.Average interest-earning assets for fourth quarter 2011 decreased $156.9 million, or 2.1%, from fourth quarter 2010. The decline was due to a reduction in average loans and covered interest-earning assets.Tax-equivalent net interest margin for fourth quarter 2011 was 3.95%, a decline of 7 basis points from fourth quarter 2010. The drop from the prior year was primarily due to the impact of the additional senior debt issued in November 2011 related to the redemption of Preferred Shares, lower average loans, and deposits invested in low-yielding short-term investments.Fee-based revenues for fourth quarter 2011 grew 6.6% compared to fourth quarter 2010. Net securities gains were $110,000 for fourth quarter 2011 and were net of other-than-temporary impairment charges of $759,000 related to two CDOs.Total noninterest expense for fourth quarter 2011 declined 13.6% from fourth quarter 2010. Fourth quarter 2011 salaries and wages increased 4.0% compared to fourth quarter 2011 as a result of severance2014. In addition, recurring costs stemming from an organizational realignment, partially offset by reductions in short-term incentive and share-based compensation. Retirement and other employee benefits rose from fourth quarter 2010 to fourth quarter 2011 and were impacted by higher profit sharing expense, employee insurance, and payroll taxes attributed to increased sales staff, and the correction of the 2010 actuarial pension expense calculation.OREO expenses for fourth quarter 2011 declined 83.4% from fourth quarter 2010 due to continued remediation efforts. Fourth quarter 2010 OREO expenses were elevated due to higher levels of write-downs and losses on sales of OREO and related operating expenses.An increase in real estate taxes paid to preserve our rights to collateral associated with problem loans,operating the newly acquired Popular, National Machine Tool, and Great Lakes locations of approximately $3.5 million and $2.0 million for the fourth and third quarters of 2014 impacted net income. The conversion and integration of these transactions was substantially complete as well as higher legal fees incurredof December 31, 2014, with certain remaining efficiencies to remediate problem credits, drove higher levelsbe implemented in the first half of loan remediation costs compared to fourth quarter 2010.FDIC premiums decreased compared to fourth quarter 2010 primarily due to a change in regulatory requirements for calculating the premium.Average funding sources for fourth quarter 2011 were $82.6 million, or 1.2%, lower than fourth quarter 2010 resulting from a drop in average time deposits. However, demand deposits increased from fourth quarter 2010 to fourth quarter 2011, including approximately $23 million of average deposits acquired in a December 2011 transaction, which resulted in a more favorable product mix.Table 33Borrowed Funds – Quarterly Comparison(Dollar amounts in thousands) Fourth Quarter 2011 Fourth Quarter 2010 Amount Rate
(%) Amount Rate
(%) $ 87,893 0.02 $ 143,549 0.06 - - 1 - 164,946 1.60 137,500 1.99 $ 252,839 1.05 $ 281,050 1.00 $ 97,383 $ 186,602 - 125 302,500 137,500 POLICIESCritical accounting policies are those policies that management believes are the most important to our financial position and results of operations. Application of critical accounting policiesGAAP requires management to make estimates, assumptions, and judgments based on information available as of the date of the financial statements that affect the amounts reported in the financial statements and accompanying notes. Critical accounting estimates are those estimates that management believes are the most important to our financial position and results of operations. Future changes in information may affectimpact these estimates, assumptions, and judgments, which in turn, may have a material affect the amounts reported in the financial statements.We have numerousof which the most significantand estimates are presented in Note 1 of "Notes to the Consolidated Financial Statements" in Item 8 of this Form 10-K. These policies, alongAlong with the disclosures presented in the other financial statement notes and in this discussion, these policies provide information on how significant assets and liabilities are valued in the financial statements and how those values are determined. Based on the valuation techniques used and the sensitivity of financial statement amounts to the methods, estimates, assumptions, and estimates underlying those amounts,judgments management determined that our accounting policies with respect toestimates for the allowance for credit losses, evaluation of impairmentvaluation of securities, and income taxes, are the accounting areas requiring subjective or complex judgments that are most important to our financial position and results of operations,goodwill and therefore,other intangible assets are considered to be our critical accounting policies, as discussed below.estimates.Determinationmay beare susceptible to significant change. Credit exposures deemed to be uncollectible are charged-off against the allowance for loan and covered loan losses, while recoveries of amounts previously charged-off are credited to the allowance for loan and covered loan losses. Additions to the allowance for loan and covered loan losses are established through the provision for loan and covered loan losses charged to expense. The amount charged to operating expense is dependent upondepends on a number of factors, including historic loan growth, changes in the composition of the loan portfolio, net charge-off levels, and our assessment of the allowance for loan and covered loan losses. For a full discussion of our methodology for determining the allowance for credit losses, see Note 1 of "Notes to the Consolidated Financial Statements" in Item 8 of this Form 10-K.Evaluation for ImpairmentWhere an activeIn the absence of quoted prices or where a market for the security does not exist, as for our CDOs, we have estimated fair value using a cash flow model withmanagement judgment and estimation is used, which may include modeling-based techniques. The use of different judgments and estimates to determine the assistance of a structured credit valuation firm. The valuation for each of the CDOs relies on independently verifiable historical financial data. The valuation firm performs a credit analysis of each of the entities comprising the collateral underlying each CDO in order to estimate the likelihood of default by any of these entities on their trust-preferred obligation. Cash flows are modeled based upon the contractual terms of the CDO and discounted to their present values to derive the estimated fair value of the individual CDO, as well as any credit loss or impairment. We believe the model uses reasonable assumptions to estimatesecurities could result in a different fair values where no market exists for these investments.make an assessmentassess securities with unrealized losses to determine whether there have been any events or circumstances to indicate that a security with an unrealized loss is other-than-temporarily impaired.OTTI has occurred. In evaluating other-than-temporary impairment, the CompanyOTTI, management considers many factors including the severity and duration of the impairment; the financial condition and near-term prospects of the issuer, which for debt securities considersincluding external credit ratings and recent downgrades;downgrades for debt securities; intent to hold the security until its value recovers; and the likelihood that the Company would be required to sell themthe securities before a recovery of their amortized cost bases.in value, which may be at maturity. The term other-than-temporary"other-than-temporary" is not intended to indicate that the decline is permanent. It indicates that the prospects for near-term recovery are not necessarily favorable or that there is a lack of evidence to support fair values greater than or equal to the carrying value of the investment. Securities for which there is an unrealized loss that is deemed to be other-than-temporary are written down to fair value with the write-down recorded as a realized loss and included in net securities gains net,(losses), but only to the extent the impairment is related to credit deterioration. The amount of the impairment related to other factors is recognized in other comprehensive income (loss) unless management intends to sell the security in a short period of time or believes it is more likely than not that it will be required to sell the security prior to full recovery. The determination of OTTI is subjective and different judgments and assumptions could affect the timing and amount of loss realization. For additional discussion on securities, see Notes 1 and 34 of "Notes to the Consolidated Financial Statements" in Item 8 of this Form 10-K. also assess the likelihood that any deferred tax assets will be realized through the reduction or refund of taxes in future periods and establish a valuation allowance for those assets for which recovery is not more likely than not. In making this assessment, management makes judgments and estimates regarding the ability to realize the asset through carryback to taxable income in prior years, the future reversal of existing taxable temporary differences, future taxable income, and the possible application of future tax planning strategies. Management believes that it is more likely than not that deferred tax assets included in the accompanying Consolidated Statements of Financial Condition will be fully realized, although there is no guarantee that those assets will be recognizable in future periods.ContentsFORWARD-LOOKING STATEMENTSfollowing is a statement under the Safe Harbor Provisionsdetermination of the Private Securities Litigation Reform Act of 1995 (the "PSLRA"): We and our representatives may, from timeuseful lives over which an intangible asset will be amortized is subjective. Intangible assets are also reviewed at least annually for impairment to time, make written or oral statements that are intended to qualify as "forward-looking" statements under the PSLRA and provide information other than historical information, including statements contained in this Form 10-K, our other filings with the Securities and Exchange Commission, or in communications to our stockholders. These statements involve known and unknown risks, uncertainties, and other factors that may cause actual results to be materially different fromdetermine whether there were any results, levels of activity, performance, or achievements expressed or implied by any forward-looking statement. These factors include, among other things, the factors listed below.In some cases, we have identified forward-looking statements by such words or phrases as "will likely result," "is confident that," "remains optimistic about," "expects," "should," "could," "seeks," "may," "will continue to," "believes," "anticipates," "predicts," "forecasts," "estimates," "projects," "potential," "intends," or similar expressions identifying forward-looking statements within the meaning of the PSLRA, including the negative of those words and phrases. These forward-looking statements are based on management's current views and assumptions regarding future events, future business conditions, and our outlook for the Company based on currently available information. We wish to caution readers not to place undue reliance on any such forward-looking statements, which speak only at the date made.In connection with the safe harbor provisions of the PSLRA, we are hereby identifying important factors that could affect our financial performance and could cause our actual results for future periods to differ materially from any opinions or statements expressed with respect to future periods in any forward-looking statements.Among the factors that could have an impact on our ability to achieve operating results, growth plan goals, and the beliefs expressed or implied in forward-looking statements are:•Management's ability to reduce and effectively manage interest rate risk and the impact of interest rates in general on the volatility of our net interest income;•Asset and liability matching risks and liquidity risks;•Fluctuations in the value of our investment securities;•The ability to attract and retain senior management experienced in banking and financial services;•The sufficiency of the allowance for credit losses to absorb the amount of actual losses inherent in the existing portfolio of loans;•The failure of assumptions underlying the establishment of the allowance for credit losses and estimation of values of collateral and various financial assets and liabilities;•Credit risks and risks from concentrations (by geographic area and by industry) within our loan portfolio;•The effects of competition from other commercial banks, thrifts, mortgage banking firms, consumer finance companies, credit unions, securities brokerage firms, insurance companies, money market and other mutual funds, and other financial institutions operating in our markets or elsewhere providing similar services;•Changes in the economic environment, competition, or other factors that may influence the anticipated growth rate of loans and deposits, the quality of the loan portfolio, and loan and deposit pricing;•Changes in general economic or industry conditions, nationally or in the communities in which we conduct business;•Volatility of rate sensitive deposits;•Our ability to adapt successfully to technological changes to compete effectively in the marketplace;•Operational risks, including data processing system failures or fraud;•Our ability to successfully pursue acquisition and expansion strategies and integrate any acquired companies;•The impact of liabilities arising from legal or administrative proceedings, enforcement of bank regulations, and enactment or application of securities regulations;•Governmental monetary and fiscal policies and legislative and regulatory changes that may result in the imposition of costs and constraints through higher FDIC insurance premiums, significant fluctuations in market interest rates, increases in capital requirements, or operational limitations;•Changes in federal and state tax laws or interpretations, including changes affecting tax rates, income not subject to tax under existing law and interpretations, income sourcing, or consolidation/combination rules;•Changes in accounting principles, policies, or guidelines affecting the businesses we conduct;•Acts of war or terrorism; and•Other economic, competitive, governmental, regulatory, and technological factors affecting our operations, products, services, and prices.The foregoing list of important factors may not be all-inclusive, and we specifically decline to undertake any obligation to publicly revise any forward-looking statements that have been made to reflect events or circumstances afterthat indicate the daterecorded amount is not recoverable from projected undiscounted net operating cash flows. For additional discussion of such statements orgoodwill and other intangible assets, see Notes 1 and 9 of "Notes to reflect the occurrenceConsolidated financial Statements" in Item 8 of anticipated or unanticipated events.With respect to forward-looking statements set forth in the notes to consolidated financial statements, including those relating to contingent liabilities and legal proceedings, some of the factors that could affect the ultimate disposition of those contingencies are changes in applicable laws, the development of facts in individual cases, settlement opportunities, and the actions of plaintiffs, judges, and juries.
ABOUT MARKET RISK set forth in this item are qualified by Item 1A. Risk Factors and the section captioned "Forward-Looking"Cautionary Statement Regarding Forward-Looking Statements" included in Item 7. Management's7 "Management's Discussion and Analysis of Financial Condition and Results of Operations," of this report, and other cautionary statements set forth elsewhere in this report. and Liability Committee ("ALCO") oversees financial risk management by developing programs to measure and manage interest rate risks within authorized limits set by the Bank's Board of Directors. ALCO also approves the Bank's asset and liability management policies, oversees the formulation and implementation of strategies to improve balance sheet positioning and earnings, and reviews the Bank's interest rate sensitivity position. Management uses net interest income and economic value of equity simulation modeling tools to analyze and capture short-term and long-termexposure of earnings to changes in interest rate exposures.sensitivitiessensitivity assesses the magnitude of changes in net interest income over a twelve-month measurement period resulting from immediate changes in interest rates over a 12-month horizon using multiple rate scenarios. These scenarios include, but are not limited to, a most likely forecast, a flat to inverted or unchanged rate environment, a gradual increase and decrease of 200 basis points that occur in equal steps over a six-month time horizon, and immediate increases and decreases of 100, 200, and 300 basis points, and an immediate decrease of 100 basis points.actualexpected future cash flows and repricing characteristics for balance sheet and off-balance sheet instruments and incorporates market-based assumptions regarding the effect of changing interest rates on the prepayment rates of certain assets and liabilities. This simulationIn addition, this sensitivity analysis includes management's projections for activity levels in eachexamines assets and liabilities at the beginning of the product lines we offer.measurement period and does not assume any changes from growth or business plans over the next twelve months. Interest-earning assets and interest-bearing liabilities are assumed to re-price based on contractual terms over the twelve-month measurement period assuming an instantaneous parallel shift in interest rates in effect at the beginning of the measurement period. The simulation analysis also incorporates assumptions based on the historical behavior of deposit rates and balances in relation to interest rates. Because these assumptions are inherently uncertain, the simulation analysis cannot definitively measure net interest income or predict the impact of the fluctuation in interest rates on net interest income.income, but does provide an indication of the Company's sensitivity to changes in interest rates. Actual results may differ fromWe monitormanagematurity characteristics and simulation analysis assumptions. The Bank’s current simulation analysis indicates we would benefit from rising interest rates. Interest-earning assets consist of short and long-term products. Excluding non-accrual loans, 49% of the loan portfolio consisted of fixed rate loans and 51% were floating rate loans as of December 31, 2014. Investments, consisting of securities and interest-bearing deposits in other banks, are more heavily weighted toward fixed rate securities at 67% of the total compared to 33% for floating rate interest-bearing deposits in other banks. Fixed rate loans are most sensitive to the 3-5 year portion of the yield curve and the Bank limits its loans with maturities that extend beyond 5 years. The majority of floating rate loans are indexed to the short-term Prime or LIBOR rates. The amount of floating rate loans in the money with interest rate risk within approved policy limits. Our currentfloors was $644.6 million, or 25%, of the floating rate loan portfolio as of December 31, 2014. On the liability side of the balance sheet, 84% of deposits are demand deposits and interest-bearing transactional deposits, which either do not pay interest rate risk policy limitsor the interest rates are determined by measuring the change in netexpected to rise at a slower pace than short-term interest income over a 12-month horizon. Gradual Change in Rates(1) Immediate Change in Rates -200 +200 -200 +200 -300(2) +300 Immediate Change in Rates +300 +200 +100 -100 December 31, 2014: $ (8,457 ) $ 13,392 $ (13,983 ) $ 19,209 N/M $ 36,576 $ 42,922 $ 27,471 $ 12,707 $ (12,748 ) -3.1% +4.9% -5.2% +7.1% N/M +13.5% 14.3 % 9.2 % 4.2 % (4.3 )% December 31, 2013: $ (13,609 ) $ 7,393 $ (18,736 ) $ 10,072 N/M $ 21,148 $ 45,209 $ 28,307 $ 11,925 $ (11,791 ) -4.7% +2.5% -6.4% +3.4% N/M +7.2% 17.3 % 10.8 % 4.6 % (4.5 )% (1)Reflectsassumed uniform changeinstantaneous parallel shift in interest rates across all termsrate changes is reflected as both dollar and percent changes. This table illustrates that occursan instantaneous 200 basis point rise in equal steps over a six-month horizon.(2)N/M – Due to the low level of interest rates as of December 31, 2011 and 2010, management deemed an assumed 300 basis point drop2014 would increase net interest income $27.5 million, or 9.2%, over the next twelve months compared to no change in interest rates not meaningful in the existing interest rate environment.Overall, inrates. This same measure was $28.3 million, or 10.8%, as of December 31, 2013.is morewas less positive at December 31, 2011 than at December 31, 2010 and in declining interest rate scenarios, interest rate risk volatility is less negative at December 31, 20112014 compared to December 31, 2010. The2013. During 2014, growth in floating rate loans were funded by the rise in core deposits, which are less rate sensitive. Overall, this increase in positiverate sensitive assets was offset by the prepayment of $114.6 million of FHLB advances at fixed rates and the hedging of $325.0 million of certain corporate variable rate loans using interest rate volatility assuming rising rates is due to a shortening ofswaps through which we receive fixed amounts and pay variable amounts. The rise in fixed rate loans, driven primarily by acquisition activity, was offset by the average life of investmentreduction in securities as cash flows from maturities, calls, and a lengthening of the aggregate maturity of liabilities through an increaseprepayments were not reinvested in the volume of transaction accounts and the issuance of senior debt. As our interest-earning assets continueportfolio. While net interest income is projected to repricedecline in the lowa decreasing interest rate environment, we believe the exposure to further declinesrisk of a significant decrease in interest rates is reduced and drives the decrease in net interest income volatility under falling interest rate scenarios.Economic Value of EquityIn addition to the simulation analysis, management uses an economic value of equity sensitivity technique to understand the risk in both shorter-term and longer-term positions and to study the impact of longer-term cash flows on earnings and capital. In determining the economic value of equity, we discount present values of expected cash flows on all assets, liabilities, and off-balance sheet contracts under different interest rate scenarios. The discounted present value of all cash flows represents our economic value of equity. Economic value of equity does not represent the true fair value of asset, liability, or derivative positions because certain factors are not considered, such as credit risk, liquidity risk, and the impact of future changes to the balance sheet.Analysis of Economic Value of Equityminimal.(Dollar amounts in thousands) Immediate Change in Rates -200 +200 -300(1) +300 $ (168,853 ) $ 148,369 N/M $ 221,525 -13.3% +11.7% N/M +17.4% $ (148,859 ) $ 61,708 N/M $ 93,682 -9.2% +3.8% N/M +5.8% (1)N/M – Due to the low level of interest rates as of December 31, 2011 and 2010, management deemed an assumed 300 basis point drop in interest rates not meaningful in the existing interest rate environment.As of December 31, 2011, the estimated sensitivity of the economic value of equity to changes in rising interest rates is more positive compared to December 31, 2010, and the estimated sensitivity to falling rates is more negative compared to December 31, 2010. The duration of the investment portfolio is lower at December 31, 2011 compared to December 31, 2010 due to (i) balance sheet strategies implemented during 2011, (ii) an increase in short-term investments, and (iii) a lengthening of liabilities through an increase in transaction accounts and the issuance of senior debt. The impact of these factors resulted in a reduction of the amount of negative price volatility as interest rates rise and reduced the amount of positive price volatility as rates decline.Interest Rate DerivativesAs part of our approach to controlling the interest rate risk within our balance sheet, we use derivative instruments (specifically interest rate swaps with third parties) to limit volatility in net interest income. The advantages of using such interest rate derivatives include minimization of balance sheet leverage resulting in lower capital requirements compared to cash instruments, the ability to maintain or increase liquidity, and the opportunity to customize the interest rate swap to meet desired risk parameters. The accounting policies underlying the treatment of derivative financial instruments in the Consolidated Statements of Financial Condition and Income of the Company are described in Note 1 of "Notes to Consolidated Financial Statements" in Item 8 of this Form 10-K.We had total interest rate swaps in place with an aggregate notional amount of $16.9 million at December 31, 2011 and $18.0 million at December 31, 2010, hedging various balance sheet categories. The specific terms of the interest rate swaps outstanding as of December 31, 2011 and 2010 are discussed in Note 19 of "Notes to Consolidated Financial Statements" in Item 8 of this Form 10-K.Nasdaq)NASDAQ). The Audit Committee meets periodically with management, the independent accountants, and the internal auditors to review matters relating to the Company's financial statements, compliance with legal and regulatory requirements relating to financial reporting and disclosure, annual financial statement audit, engagement of independent accountants, internal audit function, and system of internal controls. The internal auditors and the independent accountants periodically meet alone with the Audit Committee and have access to the Audit Committee at any time./s/ MICHAEL L. SCUDDER /s/ PAUL F. CLEMENS Michael L. Scudder President andChief Executive Officer Paul F. Clemens March 2, 2015 February 28, 201220112014 and 2010,2013, and the related consolidated statements of income, comprehensive income, (loss), changes in stockholders' equity, and cash flows for each of the three years in the period ended December 31, 2011.2014. These financial statements are the responsibility of the Company'sCompany’s management. Our responsibility is to express an opinion on these financial statements based on our audits.First Midwest Bancorp, Inc.the Company at December 31, 20112014 and 2010,2013, and the consolidated results of its operations and its cash flows for each of the three years in the period ended December 31, 2011,2014, in conformity with U.S. generally accepted accounting principles.First Midwest Bancorp, Inc.'sthe Company’s internal control over financial reporting as of December 31, 2011,2014, based on criteria established in Internal Control-Integrated Framework issued by the Committee of Sponsoring Organizations of the Treadway Commission (2013 framework) and our report dated February 28, 2012March 2, 2015 expressed an unqualified opinion thereon. As of December 31, 2014 2013 Assets Cash and due from banks $ 117,315 $ 110,417 Interest-bearing deposits in other banks 488,947 476,824 Trading securities, at fair value 17,460 17,317 Securities available-for-sale, at fair value 1,187,009 1,112,725 Securities held-to-maturity, at amortized cost (fair value 2014 – $27,670; 2013 – $43,387) 26,555 44,322 Federal Home Loan Bank ("FHLB") and Federal Reserve Bank ("FRB") stock, at cost 37,558 35,161 Loans, excluding covered loans 6,657,418 5,580,005 Covered loans 79,435 134,355 Allowance for loan and covered loan losses (72,694 ) (85,505 ) Net loans 6,664,159 5,628,855 Other real estate owned ("OREO"), excluding covered OREO 26,898 32,473 Covered OREO 8,068 8,863 Federal Deposit Insurance Corporation ("FDIC") indemnification asset 8,452 16,585 Premises, furniture, and equipment, net 131,109 120,204 Investment in bank-owned life insurance ("BOLI") 206,498 193,167 Goodwill and other intangible assets 334,199 276,366 Accrued interest receivable and other assets 190,912 180,128 Total assets $ 9,445,139 $ 8,253,407 Liabilities Noninterest-bearing deposits $ 2,301,757 $ 1,911,602 Interest-bearing deposits 5,586,001 4,854,499 Total deposits 7,887,758 6,766,101 Borrowed funds 137,994 224,342 Senior and subordinated debt 200,869 190,932 Accrued interest payable and other liabilities 117,743 70,590 Total liabilities 8,344,364 7,251,965 Stockholders' Equity Common stock 882 858 Additional paid-in capital 449,798 414,293 Retained earnings 899,516 853,740 Accumulated other comprehensive loss, net of tax (15,855 ) (26,792 ) Treasury stock, at cost (233,566 ) (240,657 ) Total stockholders' equity 1,100,775 1,001,442 Total liabilities and stockholders' equity $ 9,445,139 $ 8,253,407 December 31, 2014 December 31, 2013 Par value $ — $ 0.01 $ — $ 0.01 Shares authorized 1,000 150,000 1,000 100,000 Shares issued — 88,228 — 85,787 Shares outstanding — 77,695 — 75,071 Treasury shares — 10,533 — 10,716 Years Ended December 31, 2014 2013 2012 Interest Income Loans, excluding covered loans $ 256,842 $ 239,224 $ 248,752 Covered loans 8,659 13,804 15,873 Investment securities – taxable 14,516 12,249 12,670 Investment securities – tax-exempt 16,716 18,644 20,253 Other short-term investments 3,131 3,326 3,021 Total interest income 299,864 287,247 300,569 Interest Expense Deposits 10,377 11,901 18,052 Borrowed funds 573 1,607 2,009 Senior and subordinated debt 12,062 13,607 14,840 Total interest expense 23,012 27,115 34,901 Net interest income 276,852 260,132 265,668 Provision for loan and covered loan losses 19,168 16,257 158,052 Net interest income after provision for loan and covered loan losses 257,684 243,875 107,616 Noninterest Income Service charges on deposit accounts 36,910 36,526 36,699 Wealth management fees 26,474 24,185 21,791 Card-based fees 24,340 21,649 20,852 Merchant servicing fees 11,260 10,953 10,806 Mortgage banking income 4,011 5,306 2,689 Other service charges, commissions, and fees 8,086 7,663 4,486 Net securities gains (losses) 8,097 34,164 (921 ) BOLI income (loss) 2,873 (11,844 ) 1,307 Other income 4,567 4,452 7,086 Gain on termination of FHLB forward commitments — 7,829 — Gain on bulk loan sales — — 5,153 Total noninterest income 126,618 140,883 109,948 Noninterest Expense Salaries and wages 116,578 112,631 105,231 Retirement and other employee benefits 27,245 26,119 25,524 Net occupancy and equipment expense 35,181 31,832 32,699 Professional services 23,436 21,922 29,614 Technology and related costs 12,875 11,335 11,846 Merchant card expense 9,195 8,780 8,584 Advertising and promotions 8,159 7,754 5,073 Net OREO expense 7,075 8,547 10,521 FDIC premiums 5,824 6,438 6,926 Other expenses 24,386 19,879 24,777 Acquisition and integration related expenses 13,872 — — Adjusted amortization of FDIC indemnification asset — 1,500 6,705 Total noninterest expense 283,826 256,737 267,500 Income (loss) before income tax expense (benefit) 100,476 128,021 (49,936 ) Income tax expense (benefit) 31,170 48,715 (28,882 ) Net income (loss) $ 69,306 $ 79,306 $ (21,054 ) Per Common Share Data Basic earnings (loss) per common share $ 0.92 $ 1.06 $ (0.28 ) Diluted earnings (loss) per common share 0.92 1.06 (0.28 ) Weighted-average common shares outstanding 74,484 73,984 73,665 Weighted-average diluted common shares outstanding 74,496 73,994 73,666 Years Ended December 31, 2014 2013 2012 Net income (loss) $ 69,306 $ 79,306 $ (21,054 ) Securities available-for-sale Unrealized holding gains (losses): Before tax 37,173 (2,054 ) 1,513 Tax effect (14,918 ) 711 (588 ) Net of tax 22,255 (1,343 ) 925 Reclassification of net gains (losses) included in net income (loss): Before tax 8,097 34,164 (921 ) Tax effect (3,311 ) (13,973 ) 377 Net of tax 4,786 20,191 (544 ) Net unrealized holding gains (losses) 17,469 (21,534 ) 1,469 Derivative instruments Unrealized holding losses: Before tax (1,930 ) — — Tax effect 792 — — Net of tax (1,138 ) — — Unrecognized net pension costs Unrealized holding (losses) gains: Before tax (9,127 ) 17,600 (6,520 ) Tax effect 3,733 (7,198 ) 2,667 Net of tax (5,394 ) 10,402 (3,853 ) Total other comprehensive income (loss) 10,937 (11,132 ) (2,384 ) Total comprehensive income (loss) $ 80,243 $ 68,174 $ (23,438 ) Accumulated Unrealized Loss on Derivative Instruments Balance at December 31, 2011 $ (354 ) $ — $ (12,922 ) $ (13,276 ) Other comprehensive income (loss) 1,469 — (3,853 ) (2,384 ) Balance at December 31, 2012 1,115 — (16,775 ) (15,660 ) Other comprehensive (loss) income (21,534 ) — 10,402 (11,132 ) Balance at December 31, 2013 (20,419 ) — (6,373 ) (26,792 ) Other comprehensive income (loss) 17,469 (1,138 ) (5,394 ) 10,937 Balance at December 31, 2014 $ (2,950 ) $ (1,138 ) $ (11,767 ) $ (15,855 ) Total Balance at December 31, 2011 74,435 $ 858 $ 428,001 $ 810,487 $ (13,276 ) $ (263,483 ) $ 962,587 Comprehensive loss — — — (21,054 ) (2,384 ) — (23,438 ) — — — (2,980 ) — — (2,980 ) Share-based compensation expense — — 6,004 — — — 6,004 Restricted stock activity 408 — (15,604 ) — — 14,284 (1,320 ) Treasury stock issued to benefit plans (3 ) — (83 ) — — 123 40 Balance at December 31, 2012 74,840 858 418,318 786,453 (15,660 ) (249,076 ) 940,893 Comprehensive income (loss) — — — 79,306 (11,132 ) — 68,174 — — — (12,019 ) — — (12,019 ) Share-based compensation expense — — 5,903 — — — 5,903 Restricted stock activity 234 — (9,814 ) — — 8,276 (1,538 ) Treasury stock issued to benefit plans (3 ) — (114 ) — — 143 29 Balance at December 31, 2013 75,071 858 414,293 853,740 (26,792 ) (240,657 ) 1,001,442 Comprehensive income — — — 69,306 10,937 — 80,243 — — — (23,530 ) — — (23,530 ) Common stock issued, net of issuance costs 2,441 24 38,276 — — — 38,300 Share-based compensation expense — — 5,926 — — — 5,926 Restricted stock activity 176 — (8,560 ) — — 6,585 (1,975 ) Treasury stock issued to benefit plans 7 — (137 ) — — 506 369 Balance at December 31, 2014 77,695 $ 882 $ 449,798 $ 899,516 $ (15,855 ) $ (233,566 ) $ 1,100,775 ![]()
Chicago, IllinoisFebruary 28, 2012FIRST MIDWEST BANCORP, INC.CONSOLIDATED STATEMENTS OF FINANCIAL CONDITION(Amounts in thousands, except per share data) December 31, 2011 2010 $ 123,354 $ 102,495 518,176 483,281 14,469 15,282 1,013,006 1,057,802 60,458 81,320 58,187 61,338 5,088,113 5,100,560 260,502 371,729 (119,462 ) (142,572 ) 5,229,153 5,329,717 33,975 31,069 23,455 22,370 65,609 95,899 134,977 140,907 29,826 29,953 206,235 197,644 283,650 286,033 179,064 203,192 $ 7,973,594 $ 8,138,302 $ 1,593,773 $ 1,329,505 4,885,402 5,181,971 6,479,175 6,511,476 205,371 303,974 252,153 137,744 74,308 73,063 7,011,007 7,026,257 - 190,882 858 858 428,001 437,550 810,487 787,678 (13,276 ) (27,739 ) (263,483 ) (277,184 ) 962,587 1,112,045 $ 7,973,594 $ 8,138,302 December 31, 2011 December 31, 2010 Preferred
Shares Common
Shares Preferred
Shares Common
Shares None $ 0.01 None $ 0.01 1,000 100,000 1,000 100,000 - 85,787 193 85,787 - 74,435 193 74,096 - 11,352 - 11,691 CONSOLIDATED STATEMENTS OF INCOME(Amounts in thousands, except per share data) Years ended December 31, 2011 2010 2009 $ 252,865 $ 259,318 $ 261,221 14,115 22,116 42,392 22,544 27,685 35,094 28,904 17,285 1,419 3,083 2,463 1,625 321,511 328,867 341,751 27,256 37,127 64,177 2,743 3,267 12,569 9,892 9,124 13,473 39,891 49,518 90,219 281,620 279,349 251,532 80,582 147,349 215,672 201,038 132,000 35,860 37,879 35,884 38,754 16,224 15,063 14,059 20,486 18,238 16,529 19,593 17,577 15,826 94,182 86,762 85,168 2,410 12,216 2,110 – 4,303 13,071 – – 15,258 5,345 5,270 7,395 101,937 108,551 123,002 101,703 94,361 82,640 27,071 20,017 23,908 16,293 50,034 23,459 32,953 32,218 31,724 10,905 11,070 8,987 26,356 22,903 15,796 7,990 10,880 13,673 6,198 6,642 7,313 8,643 7,882 6,453 23,792 22,772 20,835 261,904 278,779 234,788 41,071 (38,228 ) (75,926 ) 4,508 (28,544 ) (50,176 ) 36,563 (9,684 ) (25,750 ) (10,776 ) (10,299 ) (10,265 ) (350 ) 266 464 $ 25,437 $ (19,717 ) $ (35,551 ) $ 0.35 $ (0.27 ) $ (0.71 ) $ 0.35 $ (0.27 ) $ (0.71 ) 73,289 72,422 50,034 73,289 72,422 50,034 See accompanying notes to consolidated financial statements.FIRST MIDWEST BANCORP, INC.CONSOLIDATED STATEMENTS OF COMPREHENSIVE INCOME (LOSS)(Amounts in thousands) Years Ended December 31, 2011 2010 2009 $ 36,563 $ (9,684 ) $ (25,750 ) $ 34,303 $ 1,067 $ 2,556 (13,427 ) (406 ) (986 ) 20,876 661 1,570 2,410 12,216 2,110 (986 ) (4,764 ) (824 ) 1,424 7,452 1,286 19,452 (6,791 ) 284 (8,860 ) (3,740 ) 16,988 3,871 1,458 (6,625 ) (4,989 ) (2,282 ) 10,363 14,463 (9,073 ) 10,647 $ 51,026 $ (18,757 ) $ (15,103 ) Accumulated
Unrealized
Loss on
Securities
Available-
for-Sale Unrecognized
Net Pension
Costs Total
Accumulated
Other
Comprehensive
Loss $ (2,028 ) $ (16,014 ) $ (18,042 ) (11,271 ) - (11,271 ) (13,299 ) (16,014 ) (29,313 ) 284 10,363 10,647 (13,015 ) (5,651 ) (18,666 ) (6,791 ) (2,282 ) (9,073 ) (19,806 ) (7,933 ) (27,739 ) 19,452 (4,989 ) 14,463 $ (354 ) $ (12,922 ) $ (13,276 ) See accompanying notes to consolidated financial statements.FIRST MIDWEST BANCORP, INC.CONSOLIDATED STATEMENTS OF CHANGES IN STOCKHOLDERS' EQUITY(Amounts in thousands, except per share data) Common
Shares
Out-
Standing Preferred
Stock Common
Stock Additional
Paid-in
Capital Retained
Earnings Accumulated
Other
Comprehensive
(Loss)
Income Treasury
Stock Total 48,630 $ 189,617 $ 613 $ 210,698 $ 837,390 $ (18,042 ) $ (311,997 ) $ 908,279 - - - - 11,271 (11,271 ) - - 48,630 189,617 613 210,698 848,661 (29,313 ) (311,997 ) 908,279 - - - - (25,750 ) 10,647 - (15,103 ) - - - - (2,019 ) - - (2,019 ) - - - - (9,650 ) - - (9,650 ) - 616 - - (616 ) - - - 5,643 - 57 56,560 - - - 56,617 - - - 3,516 - - - 3,516 539 - - (18,341 ) - - 18,366 25 (19 ) - - (111 ) - - (33 ) (144 ) 54,793 190,233 670 252,322 810,626 (18,666 ) (293,664 ) 941,521 - - - - (9,684 ) (9,073 ) - (18,757 ) - - - - (2,965 ) - - (2,965 ) - - - - (9,650 ) - - (9,650 ) - 649 - - (649 ) - - - 18,818 - 188 195,847 - - - 196,035 - - - 5,638 - - - 5,638 460 - - (15,864 ) - - 15,624 (240 ) 25 - - (393 ) - - 856 463 74,096 190,882 858 437,550 787,678 (27,739 ) (277,184 ) 1,112,045 - - - - 36,563 14,463 - 51,026 - - - - (2,978 ) - - (2,978 ) - - - - (8,658 ) - - (8,658 ) - 2,118 - - (2,118 ) - - - - (193,000 ) - - - - - (193,000 ) - - - (910 ) - - - (910 ) - - - 6,362 - - - 6,362 335 - - (14,895 ) - - 13,507 (1,388 ) 4 - - (106 ) - - 194 88 74,435 $ - $ 858 $ 428,001 $ 810,487 $ (13,276 ) $ (263,483 ) $ 962,587 See accompanying notes to consolidated financial statements.FIRST MIDWEST BANCORP, INC.
CONSOLIDATED STATEMENTS OF CASH FLOWS Years ended December 31, 2011 2010 2009 $ 36,563 $ (9,684 ) $ (25,750 ) 80,582 147,349 215,672 10,995 11,397 10,917 10,314 2,404 1,527 (2,410 ) (12,216 ) (2,110 ) - (4,303 ) (13,071 ) - - (15,258 ) 9,686 17,113 5,970 1,252 (92 ) (6 ) (2,231 ) (1,560 ) (2,263 ) 3,911 872 4,076 6,362 5,638 3,516 (179 ) 350 581 2,160 (15,057 ) (34,458 ) 3,802 4,279 3,929 - (7,612 ) - 236 8,531 - 813 (1,046 ) (1,878 ) 127 3,195 10,728 (633 ) (1,531 ) (6,047 ) 7,674 31,130 (22,945 ) (1,903 ) 14,412 (48,589 ) 167,121 193,569 84,541 271,511 257,934 314,601 188,556 390,217 855,405 (391,282 ) (375,342 ) (187,412 ) 83,113 70,194 80,511 (62,251 ) (62,326 ) (80,335 ) 3,151 (2,301 ) - (14,297 ) (23,957 ) (113,088 ) 2,588 1,878 2,834 37,731 56,480 19,331 5,542 354 24 (11,018 ) (22,265 ) (4,682 ) - 122,329 28,585 113,344 413,195 915,774 106,499 - - (139,037 ) 80,076 67,164 (98,603 ) (411,466 ) (1,022,029 ) 114,387 - (19,400 ) (193,910 ) - - - 196,035 - (12,838 ) (12,422 ) (12,423 ) (1,256 ) (401 ) (379 ) 47 (189 ) (177 ) (224,711 ) (148,367 ) (987,244 ) 55,754 458,397 13,071 585,776 127,379 114,308 $ 641,530 $ 585,776 $ 127,379 Years Ended December 31, 2014 2013 2012 Operating Activities Net income (loss) $ 69,306 $ 79,306 $ (21,054 ) Adjustments to reconcile net income (loss) to net cash provided by operating activities: Provision for loan and covered loan losses 19,168 16,257 158,052 Depreciation of premises, furniture, and equipment 12,224 11,038 10,874 Net amortization of premium on securities 8,218 9,174 22,433 Net securities (gains) losses (8,097 ) (34,164 ) 921 Gains on loan sales (3,771 ) (4,717 ) (7,422 ) Gain on termination of FHLB forward commitments — (7,829 ) — Gain on FDIC-assisted transaction — — (3,289 ) Net losses on early extinguishment of debt 2,059 1,034 558 Net losses on sales and valuation adjustments of OREO 3,325 3,908 4,886 (3,277 ) (79 ) 2,695 BOLI (income) loss (2,873 ) 11,844 (1,307 ) Net pension (income) cost (959 ) 2,169 2,813 Share-based compensation expense 5,926 5,903 6,004 Tax (expense) benefit related to share-based compensation (106 ) (10 ) 170 Net decrease (increase) in net deferred tax assets 8,851 33,467 (29,279 ) Amortization of other intangible assets 2,889 3,278 3,372 Originations of mortgage loans held-for-sale (97,535 ) (40,681 ) — Proceeds from sales of mortgage loans held-for-sale 96,006 37,788 — Net (increase) decrease in trading securities (143 ) (3,155 ) 307 Net (increase) decrease in accrued interest receivable and other assets (10,651 ) 30,696 10,117 Net increase (decrease) in accrued interest payable and other liabilities 22,367 (21,859 ) 8,973 Net cash provided by operating activities 122,927 133,368 169,824 Investing Activities Proceeds from maturities, repayments, and calls of securities available-for-sale 172,001 219,458 362,481 Proceeds from sales of securities available-for-sale 27,805 78,636 153,668 Purchases of securities available-for-sale (25,856 ) (335,442 ) (588,429 ) Proceeds from maturities, repayments, and calls of securities held-to-maturity 4,675 7,043 66,215 Purchases of securities held-to-maturity (2,638 ) (17,070 ) (48,999 ) Net (purchases) redemption of FHLB stock (427 ) 12,071 11,918 Proceeds from bulk loan sales — — 94,470 Net increase in loans (276,637 ) (351,616 ) (272,618 ) Premiums paid for BOLI, net of claims (85 ) 1,394 1,137 Proceeds from sales of OREO 22,368 25,797 50,566 Proceeds from sales of premises, furniture, and equipment 3,906 1,463 6,768 Purchases of premises, furniture, and equipment (14,085 ) (11,030 ) (8,764 ) Cash received from acquisitions, net of cash paid 200,645 — — Cash received in FDIC-assisted transactions — — 26,980 Net cash provided by (used in) investing activities 111,672 (369,296 ) (144,607 ) Financing Activities Net (decrease) increase in deposit accounts (73,244 ) 93,846 120,362 Net (decrease) increase in borrowed funds (1,288 ) 38,358 (29,343 ) Payments for the retirement of subordinated debt — (24,094 ) (37,033 ) (116,609 ) 7,829 — Cash dividends paid (22,568 ) (7,508 ) (2,977 ) Restricted stock activity (2,781 ) (1,607 ) (1,469 ) Excess tax benefit (expense) related to share-based compensation 912 79 (21 ) Net cash (used in) provided by financing activities (215,578 ) 106,903 49,519 Net increase (decrease) in cash and cash equivalents 19,021 (129,025 ) 74,736 Cash and cash equivalents at beginning of year 587,241 716,266 641,530 Cash and cash equivalents at end of year $ 606,262 $ 587,241 $ 716,266 Years Ended December 31, 2014 2013 2012 Supplemental Disclosures of Cash Flow Information: Income taxes paid (refunded) $ 16,375 $ 4,945 $ (6,845 ) Interest paid to depositors and creditors 23,088 27,599 36,036 Dividends declared, but unpaid 6,222 5,260 749 Common stock issued for acquisitions, net of issuance costs 38,300 — — Non-cash transfers of loans to OREO 18,079 17,965 47,628 Non-cash transfers of loans held-for-investment to loans held-for-sale 71,272 1,925 93,714 Non-cash transfers of loans held-for-sale to loans held-for-investment — — 1,957 — 2,787 — Non-cash transfers of premises, furniture, and equipment to OREO — — 1,833 located in northern Illinois, principally inthroughout the suburbangreater Chicago metropolitan Chicago area, as well as central and western Illinois, eastern Iowa, and eastern Iowa.northwestern Indiana. The Company operates three wholly owned subsidiaries: First Midwest Bank (the "Bank"), Catalyst Asset Holdings, LLC ("Catalyst"), and Parasol Investment Management, LLC ("Parasol"). The Bank conducts the majority of the Company's operations. Catalyst operates in the same offices of the Bank and manages a portion of the Company's non-performing assets. Parasol conducts its business in one of the Bank's offices and serves in an advisory capacity to certain wealth management accounts with the Bank. For your reference, a glossary of certain terms is presented on pages 3 and 4 of this Form 10-K.accountsfinancial position and results of operations of the Company and its subsidiaries after elimination of all significant intercompany accounts and transactions. Assets held in a fiduciary or agency capacity are not assets of the Company or its subsidiaries and accordingly, are not included in the consolidated financial statements.have beenwere made to prior year amounts to conform to the current year presentation.2010,of 2014, the CompanyBank acquired the majority of the assets and assumed the deposits of a former bankliabilities in an FDIC-assisted transaction.two separate transactions. The fair values initially assigned to thethese assets acquired and liabilities assumed were preliminary and subject to refinement after the closingacquisition date of the acquisition as new information related to closingacquisition date fair values became available. During secondthe fourth quarter 2011,of 2014, the CompanyBank obtained specific information (including the completion of appraisals or other valuations) relating to the acquisition-dateacquisition date fair valuevalues of certain assets and liabilities acquired and finalized its purchase price allocation, which required an adjustment to those assets and liabilities and to goodwill. After considering this additional information, the estimated fair value of covered loans decreased $2.9 million, covered OREO decreased $7.3 million, the FDIC indemnification asset increased $6.9 million, and accrued interest payable and other liabilities decreased $8.7 million from that originally reported in the quarter ended September 30, 2010.a retrospective adjustment. These revised estimates resulted in a $5.4 million decrease in goodwill and other intangible assets. In accordance with accounting guidance applicable to business combinations, these adjustments were recognized as if they had happened as of the acquisition date.policies adhered to in the preparation of the consolidated financial statements.purchaseacquisition method of accounting. Under the purchase method, net assets of the businessAssets acquired and liabilities assumed are recorded at their estimated fair values as of the date of acquisition, with any excess of the costpurchase price of the acquisition over the fair value of the net tangible and identifiable intangible assets acquired recorded as goodwill. ResultsAlternatively, a gain is recorded if the fair value of assets purchased exceeds the fair value of liabilities assumed and consideration paid. The results of operations of the acquired business are included in the Consolidated Statements of Income from the effective date of the acquisition.has defineddefines cash and cash equivalents to include cash and due from banks, interest-bearing deposits in other banks, and other short-term investments, if any, such as federal funds sold and securities purchased under agreements to resell.available-for-sale,trading, or tradingavailable-for-sale at the time of purchase.held-to-maturityHeld-to-Maturity – Securities classified as held-to-maturity are securities for which management has the positive intent and ability to hold to maturity andmaturity. These securities are stated at cost and adjusted for amortization of premiums and accretion of discounts over the estimated lifelives of the securitysecurities using the effective interest method.account securitiesSecurities – TradingThe Company's trading securities held by the Company representconsist of diversified investment securities held in a grantor trust ("rabbi trust") under deferred compensation arrangements in which plan participants may direct amounts earned to be invested in securities other than Company stock. The accounts of the rabbigrantor trust are consolidated with the accounts of the Company in its consolidated financial statements. Trading securities are reported at fair value. TradingNet trading gains (losses) gains, net, represent changes in the fair value of the trading securities portfolio and are included in other noninterest income in the Consolidated Statements of Income. The corresponding deferred compensation obligation is also reported at fair value with unrealized gains and losses recognized as a component of compensation expense. Other than the securities held in the rabbigrantor trust, the Company does not carry any securities for trading purposes.available-for-saleAvailable-for-Sale – All other securities are classified as available-for-sale. Available-for-sale securitiesSecurities available-for-sale are carried at fair value with unrealized gains and losses, net of related deferred income taxes, recorded in stockholders' equity as a separate component of accumulated other comprehensive loss.premiumpremiums and accretion of discountdiscounts are included in interest income from the related security.net(losses) in the Consolidated Statements of Income. The cost of securities sold is based on the specific identification method. On a quarterly basis, the Company makes an assessment (at the individual security level)individually assesses securities with unrealized losses to determine whether there have beenwere any events or circumstances indicating that a security with an unrealized loss is other-than-temporarily impaired.other-than-temporary impairment ("OTTI") has occurred. In evaluating OTTI, the Company considers many factors, including (i) the severity and duration of the impairment;impairment, (ii) the financial condition and near-term prospects of the issuer, which for debt securities considersincluding external credit ratings and recent downgrades;downgrades for debt securities, (iii) its intent to hold the security for a period of time sufficient for a recovery in value;until its value recovers, and (iv) the likelihood that it will be required to sell the security before a recovery in value, which may be at maturity. Accounting guidance requires that only the credit portion of an OTTI charge be recognized through income with the write-down recorded as a realized loss and included in securities gains, net in the Consolidated Statements of Income. The amount of the impairment related to other factors is recognized in other comprehensive income (loss) unlessIf management intends to sell the security or believes it is more likely than not that it will be required to sell the security prior to full recovery. Interest income onis accrued based on principal amounts outstanding. Loanconsist of loans acquired by the Company in FDIC-assisted transactions, the majority of which are covered by loss share agreements with the FDIC (the "FDIC Agreements"), under which the FDIC reimburses the Company for the majority of the losses and lease origination fees, fees for commitmentseligible expenses related to these assets. Acquired loans consist of all other loans that were acquired in business combinations that are expected to be exercised, and certain direct loan origination costs are deferred, and the net amount is amortized over the estimated life of the related loans or commitments as a yield adjustment. Fees related to standby letters of credit, whose ultimate exercise is remote, are amortized into fee income over the estimated life of the commitment. Other credit-related fees are recognized as fee income when earned.Purchased Impaired Loans – Purchased impaired loans are recorded at their estimated fair values on the respective purchase dates and are accounted for prospectively based on expected cash flows.not covered by FDIC Agreements. No allowance for credit losses is recorded on theseacquired and covered loans at the acquisition date. In determiningdate since business combination accounting requires that they are recorded at fair value.datedate. PCI loans include loans that had evidence of credit deterioration since origination and for which it was probable at acquisition that the Company would not collect all contractually required principal and interest payments. Evidence of credit deterioration was evaluated using various indicators, such as past due and non-accrual status. Other key considerations included past performance of the institutions' credit underwriting standards, completeness and accuracy of credit files, maintenance of risk ratings, and age of appraisals. Leases and revolving loans do not qualify to be accounted for as PCI loans. of purchased impaired loans, and in subsequent accounting, the Company generally aggregates purchased consumer loans and certain smaller balance commercial loans into pools of loans with common risk characteristics, such as delinquency status, credit score, and internal risk rating. LargerThe fair values of larger balance commercial loans are usually accounted forestimated on an individualestimated losses in the portfolio and is equal to the difference between contractually required payments and the expected future cash flows expected to be collecteddetermined at acquisition. to the purchase date, increases in expected future cash flows over those expected at the purchase date are recognized as interest income prospectively. The present value of any decreases in expected future cash flows after the purchase date is recognized by recording a charge-off through the allowance for loan and covered loan losses or providing an allowance for loan and covered loan losses.loansLoans – Generally, commercialcorporate loans and loans secured by real estate are placed on non-accrual status:status (i) when either principal or interest payments become 90 days or more past due based on contractual terms unless the loancredit is sufficiently collateralized such that full repayment of both principal and interest is expected and is in the process of renewal or collection within a reasonable period; or (ii) when an individual analysis of a borrower'sborrower’s creditworthiness indicateswarrants a credit should be placed ondowngrade to non-accrual status whether or not the loan is 90 days or moreregardless of past due.due status. When a loan is placed on non-accrual status, unpaid interest credited to income in the current year is reversed, and unpaid interest accrued in prior years is charged against the allowance for loan losses. After the loan is placed on non-accrual, all debt service payments are applied to the principal on the loan. Future interest income may only be recorded on a cash basis after recovery of principal is reasonably assured. Non-accrual loans are returned to accrual status when the financial position of the borrower and other relevant factors indicate there is no longer doubt that the Company will collect all principal and interest due.interest.generally charged-off when deemed uncollectible. A loss is recorded at that time if the net realizable value can be quantified and itof the underlying collateral is less than the associatedoutstanding principal and interest outstanding.interest. Consumer loans that are not secured by real estate are subject to mandatory charge-off at a specified delinquency date and are usually not classified as non-accrual prior to being charged-off. Closed-end consumer loans, which include installment, automobile, and single payment loans, are generallyusually charged-off in full no later than the end of the month in which the loan becomes 120 days past due.Generally, purchased impairedThose loans wereLoans without reasonable cash flow estimates are classified as non-accrual loans, as of December 31, 2011, and interest income willis not be recognized on those loans until the timing and amount of the expected future cash flows can be reasonably estimated.TDRs are loans for which the original contractual terms of the loans have been modified and both of the following conditions exist:A restructuring is considered a TDR when (i) the restructuring constitutes a concession (including forgiveness of principal or interest) and (ii) the borrower is experiencing financial difficulties.difficulties and (ii) the creditor grants a concession, such as forgiveness of principal, reduction of the interest rate, changes in payments, or extension of the maturity date. Loans are not classified as TDRs when the modification is short-term or results in only an insignificant delay or shortfall in the payments to be received.payments. The Company'sCompany’s TDRs are determined on a case-by-case basis in connection with ongoing loan collection processes.basis.any TDRsa TDR unless it believes collection of all principal and interest under the modified terms is reasonably assured. For a TDR to begin accruing interest, the borrower must demonstrate both some level of past performance and the future capacity to perform under the modified terms. Generally, six months of consecutive payment performance by the borrower under the restructured terms is required before a TDR is returned to accrual status. However, the period could vary depending uponon the individual facts and circumstances of the loan. An evaluation of the borrower'sborrower’s current creditworthiness is used to assess whether the borrower has theborrower’s capacity to repay the loan under the modified terms. This evaluation includes an estimate of expected future cash flows, evidence of strong financial position, and estimates of the value of collateral, if applicable. However,For TDRs to be removed from TDR status in accordancethe calendar year after the restructuring, the loans must (i) have an interest rate and terms that reflect market conditions at the time of restructuring, and (ii) be in compliance with industry regulation, suchthe modified terms. If the loan was restructured loans continueat below market rates and terms, it continues to be separately reported as restructured until after the calendar yearit is paid in which the restructuring occurred if the loan was restructured at reasonable market rates and terms.With the exception of loans that were restructured and still accruing interest, abe unable tonot collect all contractual principal and interest due according tointerest. With the termsexception of the loan agreement based on current information and events. Loans deemed to beaccruing TDRs, impaired loans are classified as non-accrual and are exclusive of smaller homogeneous loans, such as home equity, 1-4 family mortgages, andWhen a loan is designated as impaired, any subsequent principal and interest payments received are applied to the principal on the loan. Future interest income may only be recorded on a cash basis after recovery of principal is reasonably assured.Certain impairedImpaired loans with balances under a specified threshold are not individually evaluated for impairment. For all other impaired loans, impairment is measured by comparing the estimated value of the loan to the recorded book value. The value of collateral-dependent loans is based on the loanfair value of the underlying collateral, less costs to sell. The value of other loans is measured based onusing the present value of expected future cash flows discounted at the loan'sloan’s initial effective interest rate, or the fair value of the underlying collateral less costs to sell if repayment of the loan is collateral-dependent. All impaired loans are included in non-performing assets. Purchased credit impaired loans are not reported as impaired loans provided that estimates of the timing and amount of future cash flows can be reasonably determined.90-Day Past Due Loans – 90 days or more past due loans are loans for which principal or interest payments become three months or more past due, but that still accrue interest. The Company continues to accrue interest if it determines these loans are well secured and in the process of collection within a reasonable time period.inherently subjectivebased on a migration analysis that uses historical loss experience, consideration of current economic trends, and other factors.The allowance for loan losses takes into consideration such internal and external qualitative factors as changes in the nature, volume, size and current risk characteristics of the loan portfolio; an assessment of individual problem loans; actual and anticipated loss experience; current economic conditions that affect the borrower's ability to pay; and other pertinent factors. Credit exposuresestablishedcharged to expense through the provision for loan losses charged to expense.and covered loan losses. The amount charged to operating expense is dependent uponof provision depends on a number of factors, including historicnet charge-off levels, loan growth, changes in the composition of the loan portfolio, net charge-off levels, and the Company'sCompany’s assessment of the allowance for loan and covered loan losses based on the methodology discussed below.established for probable losses on individual loans for whichwhere the recorded investment in the loan exceeds the value, of the loan, (ii) an allowance based on a loss migration analysis that uses historical credit loss experience for each loan category, and (iii) the impact ofand allowance based on other internal and external qualitative factors.amount whereamount. If the internal credit rating is at or below a predetermined classification and other loans that management believes are subject to a higher risk of loss, regardless of internal credit rating. The value of thean impaired loan is measured using the present value of expected future cash flows discounted at the loan's initial effective interest rate or the fair value of the underlying collateral less costs to sell if repayment of the loan is collateral-dependent. If the resulting amount is less than the recorded book value, the Company either establishes a valuation allowance (i.e., a specific reserve) equal to the excess of the book value over the value of the loan as a component of the allowance for loan losses or charges off the amount if it is a confirmed loss.of the allowance for loan lossesis based on a loss migration analysis, which examines actual loss experience by loan category for a rolling 8-quarter period and the related internal risk rating of loans charged-off for corporate loans. The loss migration analysis is performedupdated quarterly andusing actual loss factors are updated regularly based on actual experience. The lossThis component derived from a migration analysis is then adjusted for management's estimatebased on management’s consideration of losses inherent in the loan portfolio that have yet to be manifested in historical charge-off experience. Management takes into consideration many internal and external qualitative factors, when estimating this adjustment, including:•and trends in the volume and terms of loans, as well asand trends in delinquent and non-accrual loans that could indicate that historical trends do not reflect current conditions;conditions.•includingsuch as underwriting standards and collection, charge-off, and recovery practices not considered elsewhere in estimating credit losses;•staff;•Company'sCompany’s loan review system and Board oversight;• existence and effect of any concentration of credit and changes in the level of concentrations, such as market, loan type or risk rating;•loans;•portfolio, including the condition of various market segments; and•levelCompany’s loan portfolio.estimated credit losses in the Company's existing portfolio.credit commitments, including letters of credit, to provide for the risk of loss inherent in these arrangements. The reserve for unfunded credit commitments is computed based on aestimated using the loss migration analysis similar to that used to determinefrom the allowance for loan losses, taking into considerationadjusted for probabilities of future funding requirements. ThisThe reserve for unfunded commitments is included in other liabilities in the Consolidated Statements of Financial Condition.and includes a level of imprecision given the difficulty of identifying all ofassessing the factors impacting loan repayment and estimating the timing and amount of when losses actually occur.losses. While management utilizes its best judgment and information available, the ultimate adequacy of the allowance for credit losses is dependent upondepends on a variety of factors beyond the Company'sCompany’s control, including the performance of its loan portfolio, the economy, changes in interest rates and property values, and the interpretation by regulatory authorities of loan risk classifications. While each component of the allowance for credit losses is determined separately, the entire balance is available for the entire loan portfolio.Other Real Estate Owned ("OREO")OREO – OREO consists of properties acquired through foreclosure in partial or total satisfaction of certain loans as a result of borrower defaults.defaulted loans. At initial transfer into OREO, isproperties are recorded at the lower of the recorded investment in the loan(s) for which the property served as collateral or its estimated fair value, less estimated selling costs. Write-downsSubsequently, OREO is carried at the lower of the cost basis or fair value, less estimated selling costs. OREO also includes excess properties that the Company no longer intends to utilize. Those properties are transferred to OREO at the lower of their historical cost, less accumulated depreciation, or fair value, which represents the current appraised value of the properties, less selling costs. OREO write-downs occurring at foreclosuretheOn a periodic basis,Subsequent to the initial transfer, the carrying values of OREO may be adjusted to reflect reductions in value resulting from new appraisals, new list prices, changes in market conditions, or changes in disposition strategies. These valuation adjustments, are included in OREO expense, net in the Consolidated Statements of Income, along with expenses related to maintenance of the properties.Federal Deposit Insurance Corporation ("FDIC")FDIC Indemnification Asset – MostThe majority of loans and OREO acquired through FDIC-assisted transactions are covered by loss share agreements with the FDIC (the "FDIC Agreements"), wherebyAgreements, under which the FDIC reimburses the Company for the majority of the losses incurred. Accordingly,and eligible expenses related to these assets during the indemnification period. The FDIC indemnification asset represents the fairpresent value of expected future expected reimbursements from the FDIC. Since the indemnified items are covered loans and covered OREO, which are initially measured at fair value, the FDIC indemnification asset is also initially measured at fair value by discounting the expected future cash flows expected to be received from the FDIC. These expected future cash flows are estimated by multiplying estimated losses on purchased impairedcovered PCI loans and covered OREO by the reimbursement rates set forth in the FDIC Agreements.expectations of discounted estimatedexpected future cash flows. As described above, increasesDecreases in expected cash flows on covered loansestimated reimbursements from the FDIC are recorded prospectively through interest incomeamortization and decreasesincreases in expected cash flows on covered loans are recorded as a charge-off through the allowance for loan losses. These adjustments are recorded net of a corresponding increase or decrease toestimated reimbursements from the FDIC indemnification asset forare recognized by an increase in the covered portioncarrying value of the loan.indemnification asset. Payments from the FDIC for reimbursement of losses are accounted for asresult in a reduction inof the FDIC indemnification asset.equipment, and leasehold improvementsequipment are stated at cost, less accumulated depreciation. Depreciation expense is determined by the straight-line method over the estimated useful lives of the assets. Useful lives range from 3 to 10 years for furniture and equipment and 25 to 40 years for premises. Leasehold improvements are amortized on a straight-line basis over the shorter of the life of the asset or the lease term. Rates of depreciation are generally based on the following useful lives: buildings, 25 to 40 years; building improvements, 3 to 15 years but longer under limited circumstances; and furniture and equipment, 3 to 10 years. Gains on dispositions are included in other noninterest income, and losses on dispositions undiscounted future cash flows of a long-lived asset are less than its carrying value. In that event, the Company recognizes a loss for the difference between the carrying amount and the estimated fair value of the asset based on a quoted market price, if applicable, or a discounted cash flow analysis. Impairment losses are recorded in other noninterest expense in the Consolidated Statements of Income.Bank-Owned Life Insurance ("BOLI")BOLI – BOLI represents life insurance policies on the lives of certain Company directors and officers for which the Company is the sole owner and beneficiary. These policies are recorded as an asset onin the Consolidated Statements of Financial Condition at their CSVcash surrender value ("CSV") or the current amount that could be realized currently.if settled. The change in CSV and insurance proceeds received are recordedincluded as BOLIa component of noninterest income in the Consolidated Statements of Income in noninterest income.Income.purchaseacquisition method of accounting. Goodwill is not amortized butamortized. Instead, impairment testing is tested at leastconducted annually for impairment or more often if events or circumstances between annual tests indicate that there may be impairment.process. Thequantitative approach. In the first step, of the goodwill impairment testmanagement compares management'sits estimate of the fair value of a reporting unit, (whichwhich is based on a discounted cash flow analysis)analysis, with its carrying amount, including goodwill. If the fair value of a reporting unit exceeds its carrying amount, goodwill of the reporting unit is not impaired and the second step of the impairment test is not required. If necessary, the second step of the goodwill impairment test compares the implied fair value of the reporting unit goodwill with the carrying amount of that goodwill. The implied fair value of goodwill is determined in the same manner as the amount of goodwill recognized in a business combination by assigning the fair value of a reporting unit to all of the assets and liabilities of that unit, (includingincluding any other identifiable intangible assets) as if the reporting unit had been acquired in a business combination.assets. An impairment loss would beis recognized if the carrying amount of the reporting unit goodwill exceeds the implied fair value of that goodwill. also lack physical substance, but can be distinguished from goodwill because of contractual or other legal rights or because the asset is capable of being sold or exchanged either on its own or in combination with a related contract, asset, or liability. Identified intangible assets that have a finite useful life are amortized over that life in a manner that reflects the estimated decline in the economic value of the identified intangible asset. All of the Company's other intangible assets have finite lives and are amortized over varying periods not exceeding 13 years.These intangiblehave beenwere any events or circumstances tothat indicate that the recorded amount is not recoverable from projected undiscounted net operating cash flows. If the projected undiscounted net operating cash flows are less than the carrying amount, a loss is recognized to reduce the carrying amount to fair value and when appropriate, the amortization period ismay also be reduced. Unamortized intangible assets associated with disposed assets are included in the determination of the gain or loss on the sale of the disposed assets. and Hedging Activities – InTo provide derivative products to customers and in the ordinary course of business, the Company enters into derivative transactions as part of its overall interest rate risk management strategy to minimize significant unplanned fluctuations in earnings and expected future cash flows caused by interest rate volatility. All derivative instruments are recorded at fair value as either other assets or other liabilities in the Consolidated Statements of Financialderivative'sderivative’s fair value are recognized in earnings unless specific hedge accounting criteria are met.as well asincluding its risk management objective and strategy for undertaking each hedge transaction.hedge'shedge’s inception and at least quarterly thereafter, a formal assessment is performed to determine the effectiveness of the derivative in offsetting changes in the fair values or expected future cash flows of the hedged items in the current period and prospectively. If a derivative instrument designated as a hedge is terminated or ceases to be highly effective, hedge accounting is discontinued prospectively, and the gain or loss is amortized tointo earnings. For fair value hedges, the gain or loss is amortized over the remaining life of the hedged asset or liability. For cash flow hedges, the gain or loss is amortized over the same period that the forecasted hedged transactions impact earnings. If the hedged item is disposed of, or the forecasted transaction is no longer probable, any fair value adjustments are included in the gain or loss from the disposition of the hedged item. InIf the case of a forecasted transaction that is no longer probable, the gain or loss is included in earnings immediately. effective fair value hedges, changes in the fair value of the derivative instruments, as well as the changes in the fair value of the hedged item, attributable to the hedged risk, are recognized in current earnings. For cash flow hedges, the effective portion of the change in fair value of the derivative instrument is reported as a component of accumulated other comprehensive loss. The unrealized gain or loss and is reclassified intoto earnings in the same periodwhen the hedged transaction affects earnings (for example, when a hedged item is terminated or redesignated).The Company uses the dollar-offset method to measure ineffectiveness for its derivatives. reflected in earnings.Advertising CostsComprehensive Income (Loss) – All advertising costs incurred byComprehensive income (loss) is the total of reported net income (loss) and other comprehensive income (loss) ("OCI"). OCI includes all other revenues, expenses, gains, and losses that are not reported in net income under GAAP. The Company are expensedincludes the following items, net of tax, in other comprehensive income (loss) in the Consolidated Statements of Comprehensive Income: (i) changes in unrealized gains or losses on securities available-for-sale, (ii) changes in the fair value of derivatives designated as cash flow hedges, and (iii) changes in unrecognized net pension costs related to the Company's pension plan.which they are incurred.exchange for such award. Share-based compensation expense is included in salaries and wages in the Consolidated Statements of Income.the U.S. federal jurisdiction and in Illinois, Indiana, Iowa, and Wisconsin.various states. The provision for income taxes is based on income in the consolidated financial statements, rather than amounts reported on the Company's income tax return.bases.basis. Deferred tax assets and liabilities are measured using the enacted tax rates that are expected to apply to taxable income in years in which those temporary differences are expected to be recovered or settled. A valuation allowance is established for any deferred tax asset for which recovery or settlement is not more likely than not. The effect of a change in tax rates on deferred tax assets and liabilities is recognized as income or expense in the period that includes the enactment date.Perper Common Share ("EPS") – EPS is computed using the two-class method. Basic EPS is computed by dividing net income (loss) applicable to common shares by the weighted-average number of common shares outstanding during the applicable period, excluding outstanding participating securities. Participating securities include non-vested restricted stock awards and restricted stock units, which contain nonforfeitable rights to dividends or dividend equivalents. Diluted earnings per common share is computed using the weighted-average number of shares determined for the period. The basic EPSearnings per common share computation excludesplus the dilutive effect of all Common Stock equivalents. Diluted EPS is computed by dividing net income applicable to common shares by the weighted-average number of common shares outstanding plus all potential common shares. Diluted EPS reflects the potential dilution that could occur if securities or other contracts to issue Common Stock were exercised or converted into Common Stock. The Company's potential common shares represent shares issuable under its long-term incentivestock compensation plans and under the Warrant. Such Common Stock equivalents are computed based onusing the treasury stock method using the average market price for the period.method.Treasury Stock – Treasury stock acquired is recorded at cost and is carried as a reduction of stockholders' equity in the Consolidated Statements of Financial Condition. Treasury stock issued is valued based on the "last in, first out" inventory method. The difference between the consideration received upon issuance and the carrying value is charged or credited to additional paid-in capital.Share-Based Compensation – The Company accounts for share-based compensation using the modified prospective transition method and recognizes share-based compensation expense based on the estimated fair value of the option or award at the date of grant or modification. Share-based compensation expense is included in "salaries and wages" in the Consolidated Statements of Income.Comprehensive Income (Loss) – Comprehensive income (loss) is the total of reported net income and other comprehensive income (loss) ("OCI"). OCI includes all other revenues, expenses, gains, and losses that are not reported in net income under GAAP. The Company includes the following items, net of tax, in other comprehensive income (loss) in the Consolidated Statements of Comprehensive Income (Loss): (i) changes in unrealized gains or losses on securities available-for-sale, (ii) changes in the fair value of derivatives designated under cash flow hedges (when applicable), and (iii) changes in unrecognized net pension costs related to the Company's pension plan.Segment Disclosures – An operating segment is a component of a business that (i) engages in business activities to earn revenues and incur expenses; (ii) has operating results that are reviewed regularly by the entity's chief operating decision maker to make decisions about resources to be allocated to the segment and assess its performance; and (iii) has discrete financial information. The Company's chief operating decision maker evaluates the operations of the Company as one operating segment (commercial banking) for purposes of allocating resources and assessing performance. Therefore, segment disclosures are not required. The Company offers the following products and services to external customers: deposits, loans, and wealth management services. Revenues for each of these products and services are disclosed separately in the Consolidated Statements of Income.Recently Credit Quality and Allowance for Credit Losses Disclosures:Income Taxes: In July 2010,January of 2014, the FASBFinancial Accounting Standards Board ("FASB") issued guidance that requires companiesan entity to provide more information aboutpresent an unrecognized tax benefit, or a portion of an unrecognized tax benefit, as a reduction to a deferred tax asset for a net operating loss carryforward, a similar tax loss, or a tax credit carryforward. To the extent a net operating loss carryforward, a similar tax loss, or a tax credit risks inherent in their loan and lease portfolios and how management considers those credit risks in determiningcarryforward is not available at the allowance for credit losses. A company is required to disclose its accounting policies,reporting date or, if the methods it uses to determine the componentstax law of the allowance for credit losses, and qualitative and quantitative information about the credit quality of its loan portfolio, such as aging information and credit quality indicators. Both new and existing disclosures are required, either by portfolio segment or class, based on how a company develops its allowance for credit losses and how it manages its credit exposure. The guidance is effective for all financing receivables, including loans and trade accounts receivables. However, short-term trade accounts receivables, receivables measured at fair value or lower of cost or fair value, and debt securities are exempt from these disclosure requirements. The Company adopted the period end disclosure requirements on December 31, 2010, disclosure requirements pertaining to period activity on January 1, 2011, and disclosure requirements related to TDRs on July 1, 2011. These disclosures are presented in Note 1, "Summary of Significant Accounting Policies," and Note 6, "Past Due Loans, Allowance for Credit Losses, and Impaired Loans." As this guidance affected only disclosures, its adoption did not impact the Company's financial position, results of operations, or liquidity.Clarification to Accounting for Troubled Debt Restructurings: In April 2011, the FASB issued guidance to clarify the accounting for TDRs. Given the recent economic downturn, many banks have experienced an increase in the number of loan modifications. This new guidance was developed to assist creditors in determining whether a loan modification meets the criteria to be considered a TDR for recording impairment and for disclosure. In evaluating whether a restructuring constitutes a TDR, the amendment specifies that both of the following conditions exist: (i) the restructuring constitutes a concession and (ii) the borrower is experiencing financial difficulties. The Company adopted this guidance effective July 1, 2011, and applied this guidance to restructurings occurring on or after January 1, 2011. The new guidance did not impact the Company's financial position, results of operations, or liquidity.Statement of Comprehensive Income: In April 2011, the FASB issued accounting guidance requiring companies to include a statement of comprehensive income as part of its interim and annual financial statements. The new guidance gives companies the option to present net income and comprehensive income either in one continuous statement or in two separate, but consecutive statements. This approach represents a change from previous standards, which allowed companies to report OCI and its components in the statement of shareholder's equity. The guidance also allows companies to present OCI either net of tax with details in the notes or shown grossof tax (with tax effects shown parenthetically). This guidance is effective for fiscal years beginning after December 15, 2011, but early adoption is permitted. The Company elected to adopt this guidance in 2011 and presented the disclosure requirements in its new Consolidated Statements of Comprehensive Income. Since the new guidance impacted disclosures only, it did not have an impact on the Company's financial position, results of operations, or liquidity.Recently Issued Accounting GuidanceAmendments to Achieve Common Fair Value Measurement and Disclosure Requirements in U.S. GAAP and International Financial Reporting Standards ("IFRS"): In April 2011, the FASB issued guidance that clarifies the wording used to describe many of the requirements in GAAP for measuring fair value and for disclosing information about fair value measurements. The guidanceapplicable jurisdiction does not extendrequire the entity to use, of fair value accounting, but clarifiesand the wording on how it should be applied to be consistent with IFRS and expands certain disclosure requirements relating to Level 3 fair value measurements. For many of the requirements, the FASBentity does not intend to use, the deferred tax asset for such purpose, the amendments to resultunrecognized tax benefit should be presented in the financial statements as a change in application from current guidance. This guidance is toliability and should not be applied prospectively for interim and annual periods beginning after December 15, 2011. Since the guidance only relates to disclosure, thecombined with deferred tax assets. The adoption of this guidance ison January 1, 2014 did not expected tomaterially impact the Company's financial condition, results of operations, or liquidity.ReconsiderationReceivables - Troubled Debt Restructurings by Creditors: In January of Effective Control for Repurchase Agreements: In April 2011,2014, the FASB issued guidance to clarify when an in substance repossession or foreclosure occurs and an entity is considered to have received physical possession of the residential real estate property such that improvesa loan receivable should be derecognized and the accounting for repurchase agreementsreal estate property recognized. Additionally, the guidance requires interim and other similar agreementsannual disclosure of the amount of foreclosed residential real estate property held by the entity and the recorded investment in consumer mortgage loans collateralized by residential real estate property that both entitle and obligate a transferorare in the process of foreclosure according to redeem financial assets before maturity.local requirements of the applicable jurisdiction. The guidance modifies the criteriais effective for determining when these transactions would be recorded as financing agreements as opposed to purchase or sale agreements with a commitment to resell. This is accomplished by removing (i) the criterion requiring the transferor to have the ability to repurchase or redeem the consolidated financial assets on substantially the agreed terms, even in the event of default by the transfereeannual and (ii) the collateral maintenance implementation guidance related to that criterion. This guidance is to be applied prospectively for interim and annual periods beginning after December 15, 2011. The2014 and can be applied retrospectively or prospectively. Management does not expect the adoption of this guidance is not expected towill materially impact the Company's financial condition, results of operations, or liquidity.Testing Goodwill for Impairment:Reporting Discontinued Operations: In September 2011,April of 2014, the FASB issued new guidance that givesrequires an entity the option to first assess qualitative factors to determine whether the existence of events or circumstances leads toreport a determination that it is more likely than not that the fair valuedisposal of a reporting unit is less than its carrying amount. If, after assessing those events or circumstances,component of an entity determines it is not more likely than not that the fair valueor a group of a reporting unit is less than its carrying amount, then performing the two-step impairment test is not necessary. However, ifcomponents of an entity concludes otherwise, then it is required to performin discontinued operations if the first stepdisposal represents a strategic shift that has (or will have) a major effect on an entity's operations and financial results when the component of the two-step impairment test by calculating the fair value of the reporting unit and comparing the fair value with the carrying amount of the reporting unit. If the carrying amount of a reporting unit exceeds its fair value, then the entity is required to perform the second step of the goodwill impairment test to measure the amount of the impairment loss, if any. Under the amendments in this guidance, an entity hasor group of components of an entity (i) meets the optioncriteria to bypass the qualitative assessmentbe classified as held for any reporting unit in any period and proceed directly to performing the first stepsale, (ii) is disposed of the two-step goodwill impairment test. An entity may resume performing the qualitative assessment in any subsequent period.by sale, or (iii) is disposed of other than by sale. The amendments do not change the current guidance for testing other indefinite lived intangible assets for impairment. The amendments areis effective for annual and interim goodwill impairment tests performed for fiscal yearsreporting periods beginning on or after December 15, 2011. Early adoption is permitted. The2014, and must be applied prospectively. Management does not expect the adoption of this guidance is not expected to have a materialwill materially impact on the Company's financial condition, results of operation,operations, or liquidity.TableContentsthe Chicago area banking operations of Banco Popular North America ("Popular"), doing business as Popular Community Bank, which is a subsidiary of Popular, Inc. The acquisition included Popular’s twelve full-service retail banking offices and its small business and middle market commercial lending activities in the Chicago metropolitan area at a purchase price of $19.0 million paid in cash. The Company recorded goodwill of $32.2 million associated with the acquisition. Popular Great Lakes August 8, 2014 December 2, 2014 Assets $ 161,276 $ 78,609 Securities available-for-sale — 219,279 FHLB and FRB stock — 1,970 Loans 549,386 223,169 OREO — 1,244 Investment in BOLI — 10,373 Goodwill 32,181 10,339 Other intangible assets 8,003 6,192 Premises, furniture, and equipment 4,647 5,011 Accrued interest receivable and other assets 6,574 10,059 Total assets $ 762,067 $ 566,245 Liabilities Deposits: Noninterest-bearing deposits $ 163,299 $ 110,885 Interest-bearing deposits 568,573 353,424 Total deposits 731,872 464,309 Intangible liabilities 10,631 — Borrowed funds — 29,490 Senior and subordinated debt — 9,809 Accrued interest payable and other liabilities 564 6,887 Total liabilities 743,067 510,495 Consideration Paid — 38,300 Cash paid 19,000 17,450 Total consideration paid 19,000 55,750 $ 762,067 $ 566,245 3.table. December 31, 2011 2010 Gross Unrealized Gross Unrealized Amortized
Cost Fair
Value Amortized
Cost Fair
Value Gains Losses Gains Losses
Available-for-Sale $ 5,060 $ - $ (25 ) $ 5,035 $ 18,000 $ 7 $ (121 ) $ 17,886 383,828 2,622 (2,346 ) 384,104 377,692 4,261 (2,364 ) 379,589 81,982 5,732 (23 ) 87,691 100,780 5,732 (61 ) 106,451 464,282 26,155 (366 ) 490,071 512,063 4,728 (12,800 ) 503,991 48,759 - (35,365 ) 13,394 49,695 - (34,837 ) 14,858 27,511 2,514 (11 ) 30,014 29,936 2,409 - 32,345 1,231 385 - 1,616 1,245 438 - 1,683 958 123 - 1,081 889 110 - 999 2,189 508 - 2,697 2,134 548 - 2,682 $ 1,013,611 $ 37,531 $ (38,136 ) $ 1,013,006 $ 1,090,300 $ 17,685 $ (50,183 ) $ 1,057,802
securities $ 60,458 $ 1,019 $ - $ 61,477 $ 81,320 $ 1,205 $ - $ 82,525 $ 14,469 $ 15,282 As of December 31, 2014 2013 Gross Unrealized Gross Unrealized Fair
Value Gains Losses Gains Losses Securities Available-for-Sale U.S. agency securities $ 30,297 $ 144 $ (10 ) $ 30,431 $ 500 $ — $ — $ 500 Collateralized mortgage
obligations ("CMOs") 538,882 2,256 (6,982 ) 534,156 490,962 1,427 (16,621 ) 475,768 Other mortgage-backed
securities ("MBSs") 155,443 4,632 (310 ) 159,765 135,097 3,349 (2,282 ) 136,164 Municipal securities 414,255 10,583 (1,018 ) 423,820 457,318 9,673 (5,598 ) 461,393 48,502 152 (14,880 ) 33,774 46,532 — (28,223 ) 18,309 Corporate debt securities 1,719 83 — 1,802 12,999 1,930 — 14,929 Equity securities 3,224 72 (35 ) 3,261 3,706 2,046 (90 ) 5,662 $ 1,192,322 $ 17,922 $ (23,235 ) $ 1,187,009 $ 1,147,114 $ 18,425 $ (52,814 ) $ 1,112,725 Securities Held-to-Maturity Municipal securities $ 26,555 $ 1,115 $ — $ 27,670 $ 44,322 $ — $ (935 ) $ 43,387 Trading Securities $ 17,460 $ 17,317 December 31, 2011 Available-for-Sale Held-to-Maturity Amortized
Cost Fair
Value Amortized
Cost Fair
Value $ 7,327 $ 7,232 $ 4,301 $ 4,374 336,726 332,345 20,582 20,929 111,698 110,245 13,081 13,302 89,861 88,692 22,494 22,872 383,828 384,104 - - 81,982 87,691 - - 2,189 2,697 - - $ 1,013,611 $ 1,013,006 $ 60,458 $ 61,477 As of December 31, 2014 Available-for-Sale Held-to-Maturity One year or less $ 67,900 $ 67,221 $ 3,504 $ 3,651 After one year to five years 78,132 77,351 8,727 9,093 After five years to ten years 214,007 211,868 5,404 5,631 After ten years 134,734 133,387 8,920 9,295 Securities that do not have a single contractual maturity date 697,549 697,182 — — Total $ 1,192,322 $ 1,187,009 $ 26,555 $ 27,670 $592.7$779.4 million at December 31, 20112014 and $808.3$755.3 million at December 31, 2010.2013. No securities held-to-maturity were pledged as of December 31, 20112014 or 2010.2013.onas of December 31, 20112014 or 2010.
(Losses) Years ended December 31, 2011 2010 2009 $ 188,556 $ 390,217 $ 855,405 $ 4,103 $ 18,444 $ 26,735 (757 ) (1,311 ) (9 ) 3,346 17,133 26,726 (1,464 ) (5,364 ) (48,928 ) 528 447 24,312 (936 ) (4,917 ) (24,616 ) $ 2,410 $ 12,216 $ 2,110 $ 986 $ 4,764 $ 824 $ (691 ) $ 1,530 $ 2,542 $ 936 $ 4,664 $ 24,509 - 86 - - 167 107 $ 936 $ 4,917 $ 24,616 Years Ended December 31, 2014 2013 2012 Gains (losses) on sales of securities: Gross realized gains $ 8,188 $ 34,572 $ 3,045 Gross realized losses (63 ) — (297 ) Net realized gains on sales of securities 8,125 34,572 2,748 Non-cash impairment charges: OTTI (28 ) (408 ) (3,728 ) Portion of OTTI recognized in other comprehensive income (loss) — — 59 Net non-cash impairment charges (28 ) (408 ) (3,669 ) Net realized gains (losses) $ 8,097 $ 34,164 $ (921 ) $ 677 $ 3,189 $ 1,627 Net non-cash impairment charges: CMOs $ 28 $ 6 $ 1,443 Municipal securities — 402 — CDOs — — 2,226 Total $ 28 $ 408 $ 3,669 (1)All net trading (losses) gains relate to trading securities still held as of December 31, 2014, 2013, and 2012 and are included in other income in the Consolidated Statements of Income.2011.The non-cash impairment charges2014, 2013, and 2012 were $8.1 million, $34.6 million, and $2.7 million, respectively. During 2014, net securities gains consisted of the sale of a non-accrual CDO at a gain of $3.5 million, sales of corporate bonds at gains of $2.0 million, sales of municipal securities at gains of $468,000, and sales of certain other investments at gains of $2.1 million. In addition, four CDOs totaling $2.9 million acquired in the table above primarily relate toGreat Lakes transaction were sold during the fourth quarter of 2014. These securities were recorded at fair value at the acquisition date, therefore, no gain or loss was recognized on the sale. During 2013, the Company sold its investment in an equity security which resulted in a $34.0 million gain.charges on CDOs that ischarge be recognized in current operations. In deriving the credit component of the impairment on the CDOs, projected cash flows were discounted at the contractual rate ranging from the London Interbank Offered Rate ("LIBOR") plus 125 basis points to LIBOR plus 160 basis points. Fair values are computed by discounting future projected cash flows at higher rates, ranging from LIBOR plus 1,300 basis points to LIBOR plus 1,500 basis points. The higher rates are used to account for other market factors, such as liquidity.through income. If a decline in fair value below carrying value is not attributable to credit lossdeterioration and the Company does not intend to sell the security or believe it would not be more likely than not required to sell the security prior to recovery, the Company records the non-credit related portion of the decline in fair value in other comprehensive income (loss).Changes in the amountcredit losseslife-to-date OTTI recognized in earnings onrelated to all available-for-sale securities held by the Company for the years ended December 31, 2014, 2013, and 2012. The majority of the beginning and ending balance of OTTI relates to CDOs and other securities are summarized incurrently held by the following table.Company.Credit LossesOTTI Recognized in Earnings Years Ended December 31, 2011 2010 2009 $ 35,589 $ 30,839 $ 6,330 936 4,421 11,797 - 329 12,712 $ 36,525 $ 35,589 $ 30,839 Years Ended December 31, 2014 2013 2012 Beginning balance $ 32,422 $ 38,803 $ 36,525 Losses on securities that previously had OTTI 28 — 2,278 Losses on securities that did not previously have OTTI — 408 1,391 (8,570 ) (6,789 ) (1,391 ) Ending balance $ 23,880 $ 32,422 $ 38,803 (1)Included in securities gains, net in the Consolidated Statements of Income.Included in net securities gains (losses) in the Consolidated Statements of Income. During the year ended December 31, 2014, one CDO with a carrying value of $1.3 million was sold. In addition, one CDO with a carrying value of zero was sold during the year ended December 31, 2013. These CDOs had OTTI of $8.6 million and $6.8 million, respectively, that were previously recognized in earnings. 20112014 and 2010. Less Than 12 Months 12 Months or Longer Total Number
of
Securities Fair
Value Unrealized
Losses Fair
Value Unrealized
Losses Fair
Value Unrealized
Losses Less Than 12 Months Greater Than 12 Months Total 2 $ - $ - $ 5,035 $ 25 $ 5,035 $ 25 As of December 31, 2014 U.S. agency securities 1 $ 1,943 $ 10 $ — $ — $ 1,943 $ 10 30 163,819 1,818 12,628 528 176,447 2,346 87 61,321 559 284,327 6,423 345,648 6,982 4 182 17 1,072 6 1,254 23 Other MBSs 11 1,113 1 39,043 309 40,156 310 19 934 2 7,857 364 8,791 366 91 1,317 9 53,987 1,009 55,304 1,018 6 - - 13,394 35,365 13,394 35,365 4 — — 22,791 14,880 22,791 14,880 1 2,157 11 - - 2,157 11 Equity securities 1 — — 2,270 35 2,270 35 62 $ 167,092 $ 1,848 $ 39,986 $ 36,288 $ 207,078 $ 38,136 195 $ 65,694 $ 579 $ 402,418 $ 22,656 $ 468,112 $ 23,235 4 $ 9,096 $ 120 $ - $ 1 $ 9,096 $ 121 As of December 31, 2013 19 131,056 1,727 7,843 637 138,899 2,364 67 $ 338,064 $ 14,288 $ 57,269 $ 2,333 $ 395,333 $ 16,621 5 6,084 51 159 10 6,243 61 Other MBSs 19 57,311 2,281 356 1 57,667 2,282 479 99,537 3,142 166,403 9,658 265,940 12,800 154 65,370 3,245 27,565 2,353 92,935 5,598 6 - - 14,858 34,837 14,858 34,837 6 — — 18,309 28,223 18,309 28,223 Equity securities 1 2,168 90 — — 2,168 90 513 $ 245,773 $ 5,040 $ 189,263 $ 45,143 $ 435,036 $ 50,183 247 $ 462,913 $ 19,904 $ 103,499 $ 32,910 $ 566,412 $ 52,814 Approximately 99%mortgage-backed securitiesMBSs are either backed by U.S. government-owned agencies or issued by U.S. government-sponsored enterprises. Municipal securities are issued by municipal authorities, and the majority isare supported by third-party insurance or some other form of credit enhancement. Management does not believe any individual unrealized loss as of December 31, 20112014 represents OTTI.an OTTI related to credit deterioration. The unrealized losses associated with these securities are not believed to be attributed to credit quality, but rather to changes in interest rates and temporary market movements. In addition, the Company does not intend to sell the securities with unrealized losses, and it is not more likely than not that the Company will be required to sell them before recovery of their amortized cost basis, which may be at maturity.The unrealized loss on the corporate debt security is not believed to be attributed to credit quality, but rather to changes in interest rates and temporary market movements. The Company does not intend to sell this security before recovery of its amortized cost basis, which may be at maturity.20112014 reflect the market's unfavorable view of structured investment vehicles given the current interest rate and liquidity environment.changes in market activity for these securities. Management does not believe thethese unrealized losses on the CDOs represent OTTI related to credit deterioration. In addition, the Company does not intend to sell the CDOs with unrealized losses within a short period of time, and the Company does not believe it is more likely than not thatAs of December 31, 2011, the portion of OTTI recognized in accumulated other comprehensive loss (i.e., not related to credit) totaled $35.4 million.Generally, fair value determinations are based on several factors regarding current market and economic conditions relating to such securities and the underlying collateral. For these reasons, and due to the illiquidity in the secondary market for these CDOs, the Company estimates the fair value of these securities using discounted cash flow analyses with the assistance of a structured credit valuation firm.Prepayment assumptions are a key factor in estimating the cash flows of CDOs. Prepayments may occur on the collateral underlying the Company's CDOs based on call options or other factors. Mostdetailed discussion of the collateral underlying the CDOs have a 5-year call option (on the fifth anniversary of issuance, the issuer has the right to call the security at par). In addition, most underlying indentures trigger an issuer call right if a capital treatment event occurs, such as a regulatory change that affects its status as Tier 1 capital (as defined in federal regulations). The Dodd-Frank Act constituted such an event for certain holding companies. Specifically, companies with $15 billion or more in consolidated assets can no longer include hybrid capital instruments, such as trust-preferred securities, in Tier 1 capital beginning January 1, 2013. As of December 31, 2011, the Company assumed a 15% prepayment rate for those banks with greater than $15 billion in assets in year 2 (the start of the phase out period for Tier 1 capital treatment), followed by an annual prepayment rate of 1%.For additional discussion of thisCDO valuation methodology, refer tosee Note 22, "Fair Value."Certain Characteristics and Metrics of the CDOs as of December 31, 2011(Dollar amounts in thousands) Actual
Deferrals and
Defaults as a
% of the
Original
Collateral(1) Expected
Deferrals and
Defaults as a
% of the
Remaining
Performing
Collateral(1) Excess
Subordination
as a % of the
Remaining
Performing
Collateral(2) Lowest Credit
Rating Assigned
to the Security % of Banks/
Insurers
Currently
Performing Original
Par Amortized
Cost Fair
Value Number
of Banks/
Insurers Number Class Moody's Fitch 1 C-1 $ 17,500 $ 7,140 $ 3,000 Ca C 34 73.9% 15.8% 24.5% 0.0% 2 C-1 15,000 7,132 1,494 Ca C 47 82.5% 16.1% 23.5% 0.0% 3 C-1 15,000 13,069 3,080 Ca C 48 77.4% 9.0% 16.8% 7.2% 4 B1 15,000 13,922 3,900 Ca C 35 55.6% 37.3% 32.3% 0.0% 5 C 10,000 1,317 303 C C 33 58.9% 45.4% 31.3% 0.0% 6 C 6,500 6,179 1,617 Ca C 54 68.4% 24.3% 12.7% 9.8% 7 (3) A-3L 6,750 - - N/A N/A N/A N/A N/A N/A N/A $ 85,750 $ 48,759 $ 13,394 (1)Deferrals and defaults are provided net of recoveries. No recovery is assumed for collateral that has already defaulted. For deferring collateral, the Company assumes a recovery rate of 10% of par for banks, thrifts, and other depository institutions and 15% of par for insurance companies.(2)Excess subordination represents additional defaults in excess of current defaults that the CDO can absorb before the security experiences any credit impairment. The excess subordination percentage is calculated by dividing the amount of potential additional loss that can be absorbed (before the receipt of all expected future principal and interest payments is affected) by the total balance of performing collateral. Even with excess subordination, the CDO could experience an OTTI charge if future deterioration of underlying collateral in excess of current excess subordination is anticipated.(3)Characteristics and metrics are not reported for this CDO since the security had an amortized cost and fair value of zero as of December 31, 2011.Credit-Related CDO Impairment Losses(Dollar amounts in thousands) Years Ended December 31, Life-to-
Date 2011 2010 2009 2008 (1) $ - $ - $ 8,474 $ 1,886 $ 10,360 525 794 6,549 - 7,868 411 142 1,017 - 1,570 - 684 394 - 1,078 - 2,801 5,769 - 8,570 - 243 - - 243 - - 2,306 4,444 6,750 $ 936 $ 4,664 $ 24,509 $ 6,330 $ 36,439 (1)Amount is shown net of an $18.5 million adjustment recorded on January 1, 2009 pursuant to the adoption of new accounting guidance related to the recognition of OTTI.4. LOANSloan portfolioloans held-for-investment by category. December 31, As of December 31, 2011 2010 2014 2013 $ 1,458,446 $ 1,465,903 $ 2,253,556 $ 1,830,638 243,776 227,756 358,249 321,702 1,299,082 1,203,613 1,478,379 1,353,685 288,336 349,862 564,421 332,873 105,836 174,690 144,909 164,472 Construction 204,236 186,197 888,146 856,357 887,897 807,071 2,726,309 2,748,994 3,134,933 2,679,826 4,428,531 4,442,653 5,746,738 4,832,166 416,194 445,243 543,185 427,020 201,099 160,890 291,463 275,992 42,289 51,774 Installment 76,032 44,827 659,582 657,907 910,680 747,839 5,088,113 5,100,560 6,657,418 5,580,005 260,502 371,729 79,435 134,355 $ 5,348,615 $ 5,472,289 $ 6,736,853 $ 5,714,360 $ 7,828 $ 8,042 $ 3,922 $ 4,656 $ 2,850 $ 4,281 3,438 5,047 (1)For information on covered loans, refer to Note 5, "Covered Assets."For information on covered loans, see Note 6, "Acquired and Covered Loans." smallcommunity-based and mid-sized businesses, commercial real estate customers, and consumers in the markets in which the Company operates.its markets. Within these areas, the Company diversifies its loan portfolio by loan type, industry, and borrower.It isCompany's policyborrower's ability to review each prospective credit in orderoperate its business. As part of the underwriting process, the Company examines current and expected future cash flows to determine the appropriatenessability of the borrower to repay its obligation. Commercial and industrial loans are primarily made based on the identified cash flows of the borrower and secondarily on the underlying collateral provided by the borrower. The cash flows of the borrower may not be as expected, and the adequacy of securitycollateral securing these loans may fluctuate in value due to economic or collateral prior to makingother factors. Most commercial and industrial loans are secured by the assets being financed or other business assets, such as accounts receivable or inventory, and may incorporate a loan.personal guarantee. Some short-term loans may be made on an unsecured basis. In the eventcase of loans secured by accounts receivable, the availability of funds for the repayment of these loans substantially depend on the ability of the borrower default,to collect amounts due from its customers.seeks recoveryexamines expected future cash flows, financial statement stability, and the value of the underlying collateral. Seasonal crop production loans are repaid by the liquidation of the financed crop that is typically covered by crop insurance. Equipment and real estate term loans are repaid through cash flows of the farming operation.compliancethe real estatestate lending lawsthe completed project. Sources of repayment for these loans may be permanent loans from long-term lenders, sales of developed property, or an interim loan commitment until permanent financing is obtained. Generally, construction loans have a higher risk profile than other real estate loans since repayment is impacted by real estate values, interest rate changes, governmental regulation of real property, demand and supply of alternative real estate, the availability of long-term financing, and changes in general economic conditions.monitoringscoring model developed by the Fair Isaac Corporation ("FICO"). It uses a risk-based system to determine the probability that a borrower may default on financial obligations to the lender. Underwriting standards for home equity loans are heavily influenced by statutory requirements, which include loan-to-value and remediation procedures.Bookaffordability ratios, risk-based pricing strategies, and documentation requirements. The home equity category consists mainly of revolving lines of credit secured by junior liens on owner-occupied real estate. Loan-to-value ratios on home equity loans and 1-4 family mortgages are based on the current appraised value of the collateral. December 31, As of December 31 2011 2010 2014 2013 $ 694,944 $ 573,743 1,971,801 1,968,947 FHLB advances $ 1,952,736 $ 1,632,069 FRB's Discount Window Primary Credit Program 845,974 766,870 $ 2,666,745 $ 2,542,690 $ 2,798,710 $ 2,398,939 5. COVERED ASSETSIn 20092010,2012. Proceeds Book Value Loan sales in 2014 Mortgage loans $ 148,680 $ 144,909 $ — $ 3,771 Non-performing loans 17,750 21,200 (3,450 ) — Total loan sales in 2014 $ 166,430 $ 166,109 $ (3,450 ) $ 3,771 Loan sales in 2013 Mortgage loans $ 152,130 $ 147,413 $ — $ 4,717 Non-performing loans 1,275 2,835 (1,560 ) — Total loan sales in 2013 $ 153,405 $ 150,248 $ (1,560 ) $ 4,717 Loan sales in 2012 Bulk loan sales $ 94,470 $ 169,577 $ (80,260 ) $ 5,153 Mortgage loans 52,595 50,326 — 2,269 Non-performing loans 4,200 6,587 (2,387 ) — Total loan sales in 2012 $ 151,265 $ 226,490 $ (82,647 ) $ 7,422 Amount represents charge-offs to the allowance for loan and covered loan losses at the time the loans were identified for sale. The net gains on the bulk loan sales represent gains realized subsequent to the transfer to held-for-sale and are included as a separate component of noninterest income in the Consolidated Statements of Income. Net gains on mortgage loan sales are included in mortgage banking income in the Consolidated Statements of Income. acquiredsold $147.4 million of mortgage loans, resulting in a gain of $4.7 million. The Company retained servicing responsibilities on the majority of mortgages sold and collects servicing fees equal to a percentage of the assetsoutstanding principal balance of the loans being serviced. The Company also retained limited recourse for credit losses on the sold loans. A description of the recourse obligation is presented in Note 21, "Commitments, Guarantees, and assumedContingent Liabilities."depositsthird quarter of three financial institutions2012, the Company identified certain non-performing and performing potential problem loans for accelerated disposition through bulk loan sales and transferred them into the held-for-sale category at the lower of the recorded investment or the estimated fair value, which resulted in charge-offs of $80.3 million and a provision for loan and covered loan losses of $62.3 million. The fair value was determined by the estimated bid price of the potential sale. The bulk loan sales were completed in the fourth quarter of 2012, and net gains realized on the sales are included as a separate component of noninterest income in the Consolidated Statements of Income.thesethose transactions are covered by the FDIC Agreements, whereby the FDIC will reimburse the Company for the majority of the losses incurred on these assets.Agreements. The significant accounting policies related to purchased impairedacquired and covered loans, which are classified as PCI and theirNon-PCI, and the related FDIC indemnification assetsasset are presented in Note 1, "Summary of Significant Accounting Policies."certain key data related to the Company's FDIC-assisted transactions.FDIC-Assisted Transactions
PCI and Non-PCI loans as of December 31, 2014 and 2013. First DuPage
Bank Peotone Bank
and Trust Company Palos Bank and
Trust Company (1) October 23, 2009 April 23, 2010 August 13, 2010 $ 261,422 $ 129,447 $ 484,764 $ 13,071 $ 4,303 $ - $ - $ - $ 2,591 $ 65,000 N/A $ 117,000 80% 80% 70% 95% N/A 80% (1)Assets acquired and goodwill amounts were adjusted based on additional information received in 2011 relating to the acquisition-date fair value of certain assets and liabilities acquired. Refer to Note 1, "Summary of Significant Accounting Policies," for further details of this adjustment.(2)Represents the rate at which the FDIC will reimburse the Company for losses incurred.Total covered assets as of December 31, 2011 and 2010 were as follows.Covered Assets(Dollar amounts in thousands) As of December 31, 2014 2013 PCI Non-PCI Total PCI Non-PCI Total Acquired loans $ 28,712 $ 714,836 $ 743,548 $ 15,608 $ 17,024 $ 32,632 Covered loans 54,682 24,753 79,435 103,525 30,830 134,355 Total acquired and covered loans $ 83,394 $ 739,589 $ 822,983 $ 119,133 $ 47,854 $ 166,987 December 31, 2011 2010 $ 45,451 $ 52,980 178,025 281,893 37,026 36,856 260,502 371,729 65,609 95,899 23,455 22,370 $ 349,566 $ 489,998 $ 19,879 $ - $ 43,347 $ 84,350 (1)These loans are open-end consumer loans that are not categorized as purchased impaired loans.(2)These are loans that did not have evidence of impairment on the date of acquisition.The loans purchased in the three FDIC-assisted transactions were recorded at their estimated fair values on the respective purchase dates and are accounted for prospectively based on expected cash flows. An allowance for loan losses was not recorded on these loans at the acquisition date. Except for leases and revolving loans, including lines of credit and credit card loans, management determined that a significant portion of the acquired loans ("purchased impaired loans") had evidence of credit deterioration since origination, and it was probable at the date of acquisition that the Company would not collect all contractually required principal and interest payments. Evidence of credit quality deterioration included such factors as past due and non-accrual status. Other key considerations and indicators include the past performance of the troubled institutions' credit underwriting standards, completeness and accuracy of credit files, maintenance of risk ratings, and age of appraisals.Although some loans were contractually 90 days or more past due at the acquisition date, most of the purchased impaired loans at December 31, 2011 and December 31, 2010 were not classified as non-performing loans since the loans continued to perform substantially in accordance with the Company's expectations of cash flows. Interest income is recognized on all purchased impaired loans through accretion of the difference between the carrying amount of the loans and the expected cash flows.Contents Years Ended December 31, 2011 2010 2009 $ 95,899 $ 67,945 $ - - 58,868 67,945 (11,495 ) (4,596 ) - 39,096 30,982 - (57,891 ) (57,300 ) - $ 65,609 $ 95,899 $ 67,945 Years Ended December 31, 2014 2013 2012 Beginning balance $ 16,585 $ 37,051 $ 65,609 Amortization (3,315 ) (2,984 ) (14,098 ) (481 ) (1,242 ) 3,338 Payments received from the FDIC (4,337 ) (16,240 ) (17,798 ) Ending balance $ 8,452 $ 16,585 $ 37,051 (1)The increases in indemnification asset were a result of decreases in estimated cash flows on certain loans. The indemnification asset increased by the applicable loss share percentage for additional expected losses.balanceyield for purchased impairedacquired and covered PCI loans were as follows. Years Ended December 31, 2011 2010 2009 $ 63,616 $ 9,298 $ - - 41,592 10,717 (36,827 ) (24,804 ) (1,419 ) 25,358 37,530 - $ 52,147 $ 63,616 $ 9,298 Years Ended December 31, 2014 2013 2012 Beginning balance $ 36,792 $ 51,498 $ 52,147 Additions 3,517 — 7,224 Accretion (12,535 ) (15,016 ) (20,632 ) 470 310 12,759 Ending balance $ 28,244 $ 36,792 $ 51,498 (1)Amount represents a (decrease) increase in the estimated cash flows to be collected over the remaining estimated life of the underlying portfolio.6.Increases represent a rise in the expected future cash flows to be collected over the remaining estimated life of the underlying portfolio. AND IMPAIRED LOANS,20112014 and 2010.2013. The aging is determined without regard to accrual status. The table also presents non-performing loans, consisting of non-accrual loans (most(the majority of which are past due) and loans 90 days or more past due and still accruing interest, as of each balance sheet date. Aging Analysis (Accruing and Non-accrual) Non-performing Loans Current 30-89 Days
Past Due 90 Days or
More Past
Due Total
Past Due Total
Loans Non-accrual
Loans 90 Days Past
Due Loans,
Still Accruing
Interest Aging Analysis (Accruing and Non-accrual) Non-performing Loans Current 90 Days Past Due Loans, Still Accruing Interest As of December 31, 2014 $ 1,415,165 $ 13,731 $ 29,550 $ 43,281 $ 1,458,446 $ 44,152 $ 4,991 $ 2,230,947 $ 19,505 $ 3,104 $ 22,609 $ 2,253,556 $ 22,693 $ 205 242,727 30 1,019 1,049 243,776 1,019 - 355,982 1,934 333 2,267 358,249 360 — 1,276,920 2,931 19,231 22,162 1,299,082 30,043 1,040 1,463,724 2,340 12,315 14,655 1,478,379 12,939 76 281,943 1,121 5,272 6,393 288,336 6,487 - 562,625 1,261 535 1,796 564,421 754 83 87,606 2,164 16,066 18,230 105,836 18,076 - 129,310 320 15,279 15,599 144,909 23,347 - Construction 197,255 — 6,981 6,981 204,236 6,981 — 849,066 6,372 32,708 39,080 888,146 51,447 1,707 876,609 5,412 5,876 11,288 887,897 6,970 438 2,624,845 12,908 88,556 101,464 2,726,309 129,400 2,747 3,100,213 9,013 25,707 34,720 3,134,933 27,644 597 4,282,737 26,669 119,125 145,794 4,428,531 174,571 7,738 5,687,142 30,452 29,144 59,596 5,746,738 50,697 802 402,842 6,112 7,240 13,352 416,194 7,407 1,138 535,587 3,216 4,382 7,598 543,185 6,290 145 192,646 3,712 4,741 8,453 201,099 5,322 - 287,892 2,246 1,325 3,571 291,463 2,941 166 41,288 625 376 1,001 42,289 25 351 Installment 75,428 506 98 604 76,032 43 60 636,776 10,449 12,357 22,806 659,582 12,754 1,489 898,907 5,968 5,805 11,773 910,680 9,274 371 4,919,513 37,118 131,482 168,600 5,088,113 187,325 9,227 6,586,049 36,420 34,949 71,369 6,657,418 59,971 1,173 195,289 7,853 57,360 65,213 260,502 19,879 43,347 66,331 2,714 10,390 13,104 79,435 6,186 5,002 $ 5,114,802 $ 44,971 $ 188,842 $ 233,813 $ 5,348,615 $ 207,204 $ 52,574 $ 6,652,380 $ 39,134 $ 45,339 $ 84,473 $ 6,736,853 $ 66,157 $ 6,175 As of December 31, 2013 $ 1,428,841 $ 7,706 $ 29,356 $ 37,062 $ 1,465,903 $ 50,088 $ 1,552 $ 1,814,660 $ 6,872 $ 9,106 $ 15,978 $ 1,830,638 $ 11,767 $ 393 225,007 65 2,684 2,749 227,756 2,497 187 321,156 134 412 546 321,702 519 — 1,183,952 4,009 15,652 19,661 1,203,613 19,573 - 1,335,027 2,620 16,038 18,658 1,353,685 17,076 1,315 345,018 2,811 2,033 4,844 349,862 6,203 - 330,960 318 1,595 1,913 332,873 1,848 — 139,499 1,320 33,871 35,191 174,690 52,122 200 140,044 4,000 20,428 24,428 164,472 28,685 - Construction 180,083 23 6,091 6,114 186,197 6,297 — 813,333 9,091 33,933 43,024 856,357 40,605 345 795,462 5,365 6,244 11,609 807,071 8,153 258 2,621,846 21,231 105,917 127,148 2,748,994 147,188 545 2,641,532 8,326 29,968 38,294 2,679,826 33,374 1,573 4,275,694 29,002 137,957 166,959 4,442,653 199,773 2,284 4,777,348 15,332 39,486 54,818 4,832,166 45,660 1,966 431,446 4,715 9,082 13,797 445,243 7,948 1,870 415,791 4,830 6,399 11,229 427,020 6,864 1,102 154,999 2,523 3,368 5,891 160,890 3,902 4 268,912 2,046 5,034 7,080 275,992 5,198 548 50,899 742 133 875 51,774 159 86 Installment 42,350 330 2,147 2,477 44,827 2,076 92 637,344 7,980 12,583 20,563 657,907 12,009 1,960 727,053 7,206 13,580 20,786 747,839 14,138 1,742 4,913,038 36,982 150,540 187,522 5,100,560 211,782 4,244 5,504,401 22,538 53,066 75,604 5,580,005 59,798 3,708 268,934 18,445 84,350 102,795 371,729 - 84,350 94,211 2,232 37,912 40,144 134,355 20,942 18,081 $ 5,181,972 $ 55,427 $ 234,890 $ 290,317 $ 5,472,289 $ 211,782 $ 88,594 $ 5,598,612 $ 24,770 $ 90,978 $ 115,748 $ 5,714,360 $ 80,740 $ 21,789 believeddeemed adequate by management to absorb probable losses inherent in the loan portfolio.Allowance See Note 1, "Summary of Significant Accounting Policies," for Credit Losses(Dollar amountsthe accounting policy for the allowance for credit losses. A rollforward of the allowance for credit losses by portfolio segment for the years ended December 31, 2014, 2013, and 2012 is presented in thousands) Years Ended December 31, 2011 2010 2009 $ 145,072 $ 144,808 $ 93,869 (111,576 ) (155,330 ) (168,038 ) 7,884 8,245 3,305 (103,692 ) (147,085 ) (164,733 ) 80,582 147,349 215,672 $ 121,962 $ 145,072 $ 144,808 $ 119,462 $ 142,572 $ 144,808 2,500 2,500 - $ 121,962 $ 145,072 $ 144,808 Commercial, Industrial, and Agricultural Office, Retail, and Industrial Multi-Family Residential Construction Other Commercial Real Estate Consumer Covered Loans Total Allowance $ 22,189 $ 22,048 $ 2,680 $ 32,910 $ 7,927 $ 6,115 $ - $ 93,869 (57,083 ) (7,869 ) (3,485 ) (63,045 ) (22,033 ) (14,523 ) - (168,038 ) 1,899 13 2 403 516 472 - 3,305 (55,184 ) (7,856 ) (3,483 ) (62,642 ) (21,517 ) (14,051 ) - (164,733 ) 87,447 5,972 5,358 62,810 34,674 19,411 - 215,672 54,452 20,164 4,555 33,078 21,084 11,475 - 144,808 (37,130 ) (10,322 ) (2,788 ) (55,611 ) (37,225 ) (10,640 ) (1,614 ) (155,330 ) 5,227 612 363 770 494 740 39 8,245 (31,903 ) (9,710 ) (2,425 ) (54,841 ) (36,731 ) (9,900 ) (1,575 ) (147,085 ) 26,996 10,304 1,866 49,696 45,516 11,396 1,575 147,349 49,545 20,758 3,996 27,933 29,869 12,971 - 145,072 (32,750 ) (8,193 ) (14,584 ) (13,895 ) (21,712 ) (10,531 ) (9,911 ) (111,576 ) 3,493 79 410 2,830 642 430 - 7,884 (29,257 ) (8,114 ) (14,174 ) (11,065 ) (21,070 ) (10,101 ) (9,911 ) (103,692 ) 25,729 3,368 15,245 (2,305 ) 15,672 11,973 10,900 80,582 $ 46,017 $ 16,012 $ 5,067 $ 14,563 $ 24,471 $ 14,843 $ 989 $ 121,962 Commercial, Industrial, and Agricultural Office, Retail, and Industrial Multi-family Construction Other Commercial Real Estate Consumer Covered Loans Reserve for Unfunded Commitments Total Allowance As of December 31, 2014 Beginning balance $ 30,381 $ 10,405 $ 2,017 $ 6,316 $ 10,817 $ 13,010 $ 12,559 $ 1,616 $ 87,121 Charge-offs (17,424 ) (7,345 ) (943 ) (1,052 ) (4,834 ) (7,574 ) (1,012 ) — (40,184 ) Recoveries 3,800 497 87 166 1,727 729 1,199 — 8,205 Net charge-offs (13,624 ) (6,848 ) (856 ) (886 ) (3,107 ) (6,845 ) 187 — (31,979 ) Provision for loan
and covered loan
losses and other 12,701 7,435 1,088 (3,133 ) 617 5,980 (5,520 ) 200 19,368 Ending Balance $ 29,458 $ 10,992 $ 2,249 $ 2,297 $ 8,327 $ 12,145 $ 7,226 $ 1,816 $ 74,510 As of December 31, 2013 Beginning balance $ 36,761 $ 11,432 $ 3,575 $ 9,223 $ 13,531 $ 12,862 $ 12,062 $ 3,366 $ 102,812 Charge-offs (12,094 ) (4,744 ) (1,029 ) (1,916 ) (4,784 ) (9,414 ) (4,599 ) — (38,580 ) Recoveries 3,797 228 584 1,032 1,646 1,071 24 — 8,382 Net charge-offs (8,297 ) (4,516 ) (445 ) (884 ) (3,138 ) (8,343 ) (4,575 ) — (30,198 ) Provision for loan
and covered loan
losses and other 1,917 3,489 (1,113 ) (2,023 ) 424 8,491 5,072 (1,750 ) 14,507 Ending balance $ 30,381 $ 10,405 $ 2,017 $ 6,316 $ 10,817 $ 13,010 $ 12,559 $ 1,616 $ 87,121 As of December 31, 2012 Beginning balance $ 46,017 $ 16,012 $ 5,067 $ 17,795 $ 19,451 $ 14,131 $ 989 $ 2,500 $ 121,962 Charge-offs (64,668 ) (34,968 ) (3,361 ) (27,811 ) (36,474 ) (10,910 ) (4,615 ) — (182,807 ) Recoveries 3,393 577 275 451 125 784 — — 5,605 Net charge-offs (61,275 ) (34,391 ) (3,086 ) (27,360 ) (36,349 ) (10,126 ) (4,615 ) — (177,202 ) Provision for loan
and covered loan
losses and other 52,019 29,811 1,594 18,788 30,429 8,857 15,688 866 158,052 Ending balance $ 36,761 $ 11,432 $ 3,575 $ 9,223 $ 13,531 $ 12,862 $ 12,062 $ 3,366 $ 102,812 Impaired LoansA portion of the Company's allowance for credit losses is allocated to loans deemed impaired. Impaired loans consist of corporate non-accrual loans and TDRs. Smaller homogeneous loans, such as home equity, 1-4 family mortgages, and installment loans, are not individually assessed for impairment.Impaired Loans(Dollar amounts in thousands) December 31, 2011 2010 $ 76,397 $ 13,790 83,090 173,534 159,487 187,324 15,084 12,449 174,571 199,773 17,864 22,371 $ 192,435 $ 222,144 $ 26,095 $ 6,343 Years Ended December 31, 2011 2010 2009 $ 172,314 $ 203,118 $ 217,872 $ 596 $ 244 $ 157 (1)These impaired loans require a valuation allowance because the present value of expected future cash flows or the estimated value of the related collateral less estimated selling costs is less than the recorded investment in the loans.(2)No specific reserve for credit losses is allocated to these loans since they are deemed to be sufficiently collateralized or had charge-offs.(3)These are loans with balances under a specified threshold.(4)Recorded using the cash basis of accounting.break-downbreakdown of loans and the related allowance for credit losses by portfolio segment. Loans individually evaluated for impairment include corporate non-accrual loans with the exception of certain loans with balances under a specified threshold.The present value of any decreases in expected cash flows of covered loans after the purchase date is recognized by recording a charge-off through the allowance for loan losses. Since most covered loans are accounted for as purchased impaired loans and the carrying values of those loans are periodically adjusted for any changes in expected future cash flows, they are not included in the calculation of the allowance for credit losses and are not displayed in this table. Loans Allowance For Credit Losses Individually
Evaluated
For
Impairment Collectively
Evaluated
For
Impairment Total Individually
Evaluated
For
Impairment Collectively
Evaluated
For
Impairment Total Loans Allowance for Credit Losses PCI Total PCI Total As of December 31, 2014 $ 37,385 $ 1,664,837 $ 1,702,222 $ 14,827 $ 31,190 $ 46,017 $ 19,796 $ 2,588,141 $ 3,868 $ 2,611,805 $ 2,249 $ 27,209 $ — $ 29,458 28,216 1,270,866 1,299,082 1,507 14,505 16,012 12,332 1,458,918 7,129 1,478,379 271 10,721 — 10,992 5,589 282,747 288,336 20 5,047 5,067 939 561,400 2,082 564,421 — 2,249 — 2,249 17,378 88,458 105,836 2,502 12,061 14,563 Construction 6,671 195,094 2,471 204,236 — 2,297 — 2,297 70,919 962,136 1,033,055 7,239 17,232 24,471 3,266 880,087 4,544 887,897 11 8,316 — 8,327 122,102 2,604,207 2,726,309 11,268 48,845 60,113 23,208 3,095,499 16,226 3,134,933 282 23,583 — 23,865 159,487 4,269,044 4,428,531 26,095 80,035 106,130 43,004 5,683,640 20,094 5,746,738 2,531 50,792 — 53,323 - 659,582 659,582 - 14,843 14,843 — 902,062 8,618 910,680 — 11,822 323 12,145 159,487 4,928,626 5,088,113 26,095 94,878 120,973 43,004 6,585,702 28,712 6,657,418 2,531 62,614 323 65,468 - 45,451 45,451 - 989 989 $ 159,487 $ 4,974,077 $ 5,133,564 $ 26,095 $ 95,867 $ 121,962 Covered loans — 24,753 54,682 79,435 — 488 6,738 7,226 Reserve for unfunded
commitments — — — — — 1,816 — 1,816 Total loans $ 43,004 $ 6,610,455 $ 83,394 $ 6,736,853 $ 2,531 $ 64,918 $ 7,061 $ 74,510 As of December 31, 2013 $ 43,365 $ 1,650,294 $ 1,693,659 $ 2,650 $ 46,895 $ 49,545 $ 13,178 $ 2,137,440 $ 1,722 $ 2,152,340 $ 4,046 $ 26,335 $ — $ 30,381 18,076 1,185,537 1,203,613 - 20,758 20,758 26,348 1,327,337 — 1,353,685 214 10,191 — 10,405 5,696 344,166 349,862 497 3,499 3,996 1,296 331,445 132 332,873 18 1,999 — 2,017 51,269 123,421 174,690 - 27,933 27,933 Construction 5,712 180,485 — 186,197 178 6,138 — 6,316 68,918 951,911 1,020,829 3,196 26,673 29,869 9,298 793,703 4,070 807,071 704 10,113 — 10,817 143,959 2,605,035 2,748,994 3,693 78,863 82,556 42,654 2,632,970 4,202 2,679,826 1,114 28,441 — 29,555 187,324 4,255,329 4,442,653 6,343 125,758 132,101 55,832 4,770,410 5,924 4,832,166 5,160 54,776 — 59,936 - 657,907 657,907 - 12,971 12,971 — 738,155 9,684 747,839 — 13,010 — 13,010 $ 187,324 $ 4,913,236 $ 5,100,560 $ 6,343 $ 138,729 $ 145,072 Total loans, excluding
covered loans 55,832 5,508,565 15,608 5,580,005 5,160 67,786 — 72,946 Covered loans — 30,830 103,525 134,355 — 702 11,857 12,559 Reserve for unfunded
commitments — — — — — 1,616 — 1,616 Total loans $ 55,832 $ 5,539,395 $ 119,133 $ 5,714,360 $ 5,160 $ 70,104 $ 11,857 $ 87,121 (1)These are open-end consumer loans that are not categorized as purchased impaired loans.are analyzed on an individual basis when the internal credit rating is at or below a predetermined classification and the loan exceeds a fixed dollar amount. Individually Evaluated for Impairment20112014 and December 31, 2010. December 31, 2011 Year Ended December 31, 2011 As of December 31, Recorded Investment In 2014 2013 Allowance
for Credit
Losses
Allocated Average
Recorded
Investment
Balance Recorded Investment In Recorded Investment In Loans with
No Specific
Reserve Loans with
a Specific
Reserve Unpaid
Principal
Balance Interest
Income
Recognized(1) $ 10,801 $ 26,028 $ 58,591 $ 14,827 $ 44,449 $ 326 $ 666 $ 19,130 $ 35,457 $ 2,249 $ 10,047 $ 3,131 $ 25,887 $ 4,046 556 - 556 - 1,515 - — — — — — — — — 11,897 16,319 33,785 1,507 33,038 81 9,623 2,709 18,340 271 23,872 2,476 35,868 214 5,072 517 11,265 20 13,619 44 939 — 1,024 — 1,098 198 1,621 18 9,718 7,660 33,124 2,502 31,068 69 19,019 3,790 28,534 758 31,445 - Construction 6,671 — 7,731 — 4,586 1,126 10,037 178 26,027 22,083 70,868 6,481 17,180 76 2,752 514 4,490 11 7,553 1,745 11,335 704 71,733 50,369 177,576 11,268 126,350 270 19,985 3,223 31,585 282 37,109 5,545 58,861 1,114 $ 83,090 $ 76,397 $ 236,723 $ 26,095 $ 172,314 $ 596 $ 20,651 $ 22,353 $ 67,042 $ 2,531 $ 47,156 $ 8,676 $ 84,748 $ 5,160 December 31, 2010 Year Ended December 31, 2010 Recorded Investment In Allowance
for Credit
Losses
Allocated Average
Recorded
Investment
Balance Loans with
No Specific
Reserve Loans with
a Specific
Reserve Unpaid
Principal
Balance Interest
Income
Recognized(1) $ 40,715 $ 2,650 $ 53,353 $ 2,650 $ 37,502 $ 67 2,447 - 2,982 - 2,098 1 18,076 - 26,193 - 26,517 - 4,565 1,131 7,322 497 8,068 - 51,269 - 129,698 - 83,189 119 28,685 - 38,404 - 28,709 - 27,777 10,009 60,465 3,196 17,035 57 130,372 11,140 262,082 3,693 163,518 176 $ 173,534 $ 13,790 $ 318,417 $ 6,343 $ 203,118 $ 244 (1)Recorded using the cash basis of accounting.TDRsTDRsloans for which the original contractual terms of the loans have been modifiedexcluded from this disclosure.both of the following conditions exist: (i) the restructuring constitutes a concession (including forgiveness of principal or interest) and (ii) the borrower is experiencing financial difficulties.Interest Income Recognized on Impaired Loans are not classified as TDRs when the modification is short-term or results in only an insignificant delay or shortfall in the payments to be received. The Company's TDRs are determined on a case-by-case basis in connection with ongoing loan collection processes.TDRs by Class As of December 31, 2011 As of December 31, 2010 Accruing(1) Non-accrual(2) Total Accruing(1) Non-accrual(2) Total $ 1,451 $ 897 $ 2,348 $ 5,456 $ 17,948 $ 23,404 - - - 1,986 - 1,986 1,742 - 1,742 2,053 - 2,053 11,107 1,758 12,865 103 3,090 3,193 - - - - 8,323 8,323 - 14,006 14,006 - - - 227 11,417 11,644 4,831 2,398 7,229 13,076 27,181 40,257 6,987 13,811 20,798 14,527 28,078 42,605 14,429 31,759 46,188 1,093 471 1,564 2,644 589 3,233 2,089 1,293 3,382 5,298 1,405 6,703 155 - 155 - - - 3,337 1,764 5,101 7,942 1,994 9,936 $ 17,864 $ 29,842 $ 47,706 $ 22,371 $ 33,753 $ 56,124 Years Ended December 31, 2014 2013 2012 Average
Recorded
Balance
Income
Recognized (1)Commercial and industrial $ 16,137 $ 371 $ 20,925 $ 205 $ 45,101 $ 94 Agricultural — — — — 1,138 — Commercial real estate: Office, retail, and industrial 19,003 245 24,802 18 32,439 2 Multi-family 1,245 5 1,116 8 6,226 — Construction 5,764 — 5,932 — 31,202 1 Other commercial real estate 6,014 138 13,141 31 35,715 38 Total commercial real estate 32,026 388 44,991 57 105,582 41 Total impaired loans $ 48,163 $ 759 $ 65,916 $ 262 $ 151,821 $ 135 (1)These loans are still accruing interest.(2)These loans are included in non-accrual loans in the preceding tables.Recorded using the cash basis of accounting. Loan modifications are generally performed at the request of the individual borrower and may include reduction in interest rates, changes in payments, and maturity date extensions. The following table presents a summary of loans that were restructured during the year ended December 31, 2011.TDRs Restructured During the Year(Dollar amounts in thousands) Year Ended December 31, 2011 Number of
Loans Pre-Modification
Recorded
Investment Principal
Charged-off(1) Funds
Disbursed Interest
and Escrow
Capitalized Post-Modification
Recorded
Investment 10 $ 886 $ - $ - $ 7 $ 893 - - - - - - 0 3 3,407 - 293 9 3,709 1 14,107 (3,000 ) - - 11,107 - - - - - - 1 17,508 - - - 17,508 1 174 - - 74 248 6 35,196 (3,000 ) 293 83 32,572 16 36,082 (3,000 ) 293 90 33,465 9 523 - - 15 538 11 1,440 - - 79 1,519 1 151 - - 4 155 21 2,114 - - 98 2,212 37 $ 38,196 $ (3,000 ) $ 293 $ 188 $ 35,677 34 $ 20,446 $ (3,000 ) $ 293 $ 111 $ 17,850 3 17,750 - - 77 17,827 37 $ 38,196 $ (3,000 ) $ 293 $ 188 $ 35,677 (1)The Company restructured this loan into two separate notes and charged-off one of the notes. Since the borrower demonstrated an ongoing ability to comply with the restructured terms of the remaining note, the restructured loan is classified as an accruing loan.(2)These loans are still accruing interest as of December 31, 2011.(3)These loans are included in non-accrual loans as of December 31, 2011.The specific reserve portion of the allowance for loan losses on TDRs for all segments of loans is determined by estimating the value of the loan. This is determined by discounting the restructured cash flows at the original effective rate of the loan before modification or is based on the fair value of the underlying collateral less costs to sell, if repayment of the loan is collateral-dependent. If the resulting amount is less than the recorded book value, the Company either establishes a valuation allowance (i.e. specific reserve) as a component of the allowance for loan losses or charges off the impaired balance if it determines that such amount is a confirmed loss. As of December 31, 2011, one of the restructured loans had a $94,000 valuation reserve. No restructured loans had valuation reserves as of December 31, 2010.The allowance for loan losses also includes an allowance based on a loss migration analysis for each loan category for loans that are not individually evaluated for impairment. All loans charged-off, including TDRs charged-off, are factored into this calculation by portfolio segment.The following table presents TDRs that had charge-offs during the year ended December 31, 2011. These loans defaulted within twelve months of being restructured, resulting in a principal charge-off during 2011. None of these loans accrued interest during the year ended December 31, 2011.TDRs That Defaulted Within Twelve Months of Being Restructured(Dollar amounts in thousands) Year Ended December 31, 2011 Number of
Loans Pre-Charge-off
Recorded
Investment Principal
Charged-off Post-Charge-off
Recorded
Investment 7 $ 1,163 $ (552 ) $ 611 - - - - 1 397 (397 ) - 13 4,590 (1,324 ) 3,266 4 4,295 (2,106 ) 2,189 1 17,508 (3,502 ) 14,006 2 823 (435 ) 388 21 27,613 (7,764 ) 19,849 28 28,776 (8,316 ) 20,460 6 430 (333 ) 97 4 482 (241 ) 241 - - - - 10 912 (574 ) 338 38 $ 29,688 $ (8,890 ) $ 20,798 - $ - $ - $ - 38 29,688 (8,890 ) 20,798 38 $ 29,688 $ (8,890 ) $ 20,798 There were no commitments to lend additional funds to borrowers with TDRs as of December 31, 2011.collateral, management characteristics, and other factors.collateral. Ratings for commercial credits are reviewed periodically. Consumer loans are assessed forThe following tables present credit quality based on the delinquency status of the loan. The assessment ofindicators by class for corporate and consumer loans, is completed at the endexcluding covered loans, as of each reporting period.December 31, 2014 and 2013. Pass
Mention (1)(4) Total As of December 31, 2014 Commercial and industrial $ 2,115,170 $ 84,615 $ 31,078 $ 22,693 $ 2,253,556 Agricultural 357,595 294 — 360 358,249 Commercial real estate: Office, retail, and industrial 1,393,885 38,891 32,664 12,939 1,478,379 Multi-family 553,255 6,363 4,049 754 564,421 Construction 178,992 5,776 12,487 6,981 204,236 Other commercial real estate 829,003 32,517 19,407 6,970 887,897 Total commercial real estate 2,955,135 83,547 68,607 27,644 3,134,933 Total corporate loans $ 5,427,900 $ 168,456 $ 99,685 $ 50,697 $ 5,746,738 As of December 31, 2013 Commercial and industrial $ 1,780,194 $ 23,806 $ 14,871 $ 11,767 $ 1,830,638 Agricultural 320,839 344 — 519 321,702 Commercial real estate: Office, retail, and industrial 1,284,394 28,677 23,538 17,076 1,353,685 Multi-family 326,901 3,214 910 1,848 332,873 Construction 153,949 8,309 17,642 6,297 186,197 Other commercial real estate 761,465 14,877 22,576 8,153 807,071 Total commercial real estate 2,526,709 55,077 64,666 33,374 2,679,826 Total corporate loans $ 4,627,742 $ 79,227 $ 79,537 $ 45,660 $ 4,832,166 Loans categorized as special mention exhibit potential weaknesses that require the close attention of management since these potential weaknesses may result in the deterioration of repayment prospects in the future. Loans categorized as substandard exhibit a well-defined weakness or weaknesses that may jeopardize the liquidation of the debt. These loans continue to accrue interest because they are well secured and collection of principal and interest is expected within a reasonable time. Loans categorized as non-accrual exhibit a well-defined weakness or weaknesses that may jeopardize the liquidation of the debt or result in a loss if the deficiencies are not corrected. Total special mention and substandard loans includes accruing TDRs of $1.8 million as of December 31, 2014 and $2.8 million as of December 31, 2013. Performing Non-accrual Total As of December 31, 2014 Home equity $ 536,895 $ 6,290 $ 543,185 1-4 family mortgages 288,522 2,941 291,463 Installment 75,989 43 76,032 Total consumer loans $ 901,406 $ 9,274 $ 910,680 As of December 31, 2013 Home equity $ 420,156 $ 6,864 $ 427,020 1-4 family mortgages 270,794 5,198 275,992 Installment 42,751 2,076 44,827 Total consumer loans $ 733,701 $ 14,138 $ 747,839 As of December 31, 2014 2013 Accruing Total Accruing Total Commercial and industrial $ 269 $ 18,799 $ 19,068 $ 6,538 $ 2,121 $ 8,659 Agricultural — — — — — — Commercial real estate: Office, retail, and industrial 586 — 586 10,271 — 10,271 Multi-family 887 232 1,119 1,038 253 1,291 Construction — — — — — — Other commercial real estate 433 183 616 4,326 291 4,617 Total commercial real estate 1,906 415 2,321 15,635 544 16,179 Total corporate loans 2,175 19,214 21,389 22,173 2,665 24,838 Home equity 651 506 1,157 787 512 1,299 1-4 family mortgages 878 184 1,062 810 906 1,716 Installment — — — — — — Total consumer loans 1,529 690 2,219 1,597 1,418 3,015 Total loans $ 3,704 $ 19,904 $ 23,608 $ 23,770 $ 4,083 $ 27,853 These TDRs are included in non-accrual loans in the preceding tables. Charge-offs Year Ended December 31, 2014 Commercial and industrial 7 $ 23,852 $ — $ — $ — $ 23,852 Office, retail, and industrial 1 417 — — — 417 Multi-family 1 275 — — — 275 Home equity 1 75 — — — 75 Total TDRs restructured during the period 10 $ 24,619 $ — $ — $ — $ 24,619 Year Ended December 31, 2013 Commercial and industrial 7 $ 14,439 $ — $ 2 $ — $ 14,441 Office, retail, and industrial 6 2,275 30 — — 2,305 Multi-family 5 1,274 — 57 — 1,331 Construction 2 508 — — — 508 Other commercial real estate 5 526 — — — 526 Home equity 13 1,189 — — — 1,189 1-4 family mortgages 1 132 — 4 — 136 Total TDRs restructured during the period 39 $ 20,343 $ 30 $ 63 $ — $ 20,436 Year Ended December 31, 2012 Commercial and industrial 5 $ 3,277 $ — $ — $ 170 $ 3,107 Office, retail, and industrial 2 2,416 — — — 2,416 Other commercial real estate 5 1,070 — — 125 945 Home equity 1 19 — — — 19 1-4 family mortgages 4 563 — 4 — 567 Total TDRs restructured during the period 17 $ 7,345 $ — $ 4 $ 295 $ 7,054 Years Ended December 31, 2014 2013 2012 Commercial and industrial 2 $ 125 1 $ 350 — $ — Office, retail, and industrial — — — — 2 837 Other commercial real estate — — 3 354 2 717 Home equity 1 77 — — — — 1-4 family mortgages — — — — 1 62 Total 3 $ 202 4 $ 704 5 $ 1,616 Pass Special
Mention(1) Substandard(2) Non-accrual(3) Total $ 1,308,812 $ 57,866 $ 47,616 $ 44,152 $ 1,458,446 232,270 10,487 - 1,019 243,776 1,147,026 78,578 43,435 30,043 1,299,082 275,031 5,803 1,015 6,487 288,336 48,806 27,198 11,756 18,076 105,836 92,568 23,587 5,407 23,347 144,909 746,213 73,058 17,428 51,447 888,146 2,309,644 208,224 79,041 129,400 2,726,309 $ 3,850,726 $ 276,577 $ 126,657 $ 174,571 $ 4,428,531 $ 1,303,142 $ 83,259 $ 29,414 $ 50,088 $ 1,465,903 209,317 15,667 275 2,497 227,756 1,026,124 123,800 34,116 19,573 1,203,613 307,845 20,643 15,171 6,203 349,862 57,209 35,950 29,409 52,122 174,690 85,305 35,750 14,732 28,685 164,472 697,971 89,247 28,534 40,605 856,357 2,174,454 305,390 121,962 147,188 2,748,994 $ 3,686,913 $ 404,316 $ 151,651 $ 199,773 $ 4,442,653 Years Ended December 31, 2014 2013 2012 Accruing Beginning balance $ 23,770 $ 6,867 $ 17,864 Additions 804 4,847 2,504 Net payments (1,440 ) (723 ) (205 ) Returned to performing status (20,656 ) (5,529 ) (16,619 ) Net transfers from non-accrual 1,226 18,308 3,323 Ending balance 3,704 23,770 6,867 Non-accrual Beginning balance 4,083 10,924 29,842 Additions 23,815 15,589 4,550 Net advances (payments) 1,991 (1,359 ) (1,761 ) Charge-offs (8,457 ) (1,880 ) (10,003 ) Transfers to OREO (302 ) (77 ) (6,778 ) Loans sold — (806 ) (1,603 ) Net transfers to accruing (1,226 ) (18,308 ) (3,323 ) Ending balance 19,904 4,083 10,924 Total TDRs $ 23,608 $ 27,853 $ 17,791 Performing Non-accrual Total $ 408,787 $ 7,407 $ 416,194 195,777 5,322 201,099 42,264 25 42,289 $ 646,828 $ 12,754 $ 659,582 $ 437,295 $ 7,948 $ 445,243 156,988 3,902 160,890 51,615 159 51,774 $ 645,898 $ 12,009 $ 657,907 (1)Loans categorized as special mention exhibit potential weaknesses that require the close attention of management. If left uncorrected, these potential weaknesses may resultFor TDRs to be removed from TDR status in the deteriorationcalendar year after the restructuring, the loans must (i) have an interest rate and terms that reflect market conditions at the time of repayment prospectsrestructuring, and (ii) be in compliance with the modified terms. TDRs that were returned to performing status totaled $20.7 million, $5.5 million and $16.6 million for the years ended December 31, 2014, 2013, and 2012, respectively. Loans that were not restructured at some future date.(2)Loans categorized as substandard continue to accrue interest, but exhibit a well-defined weakness or weaknessesmarket rates and terms, that may jeopardize the liquidation of the debt. The loans continue to accrue interest because they are well secured and collection of principal and interest is expected within a reasonable time.(3)Loans categorized as non-accrual exhibit a well-defined weakness or weaknesses that may jeopardize the liquidation of the debt and are characterized by the distinct possibility that the Company could sustain some loss if the deficiencies are not corrected. These loans have been placed on non-accrual status.Commercial and industrial loans are underwritten after evaluating and understandingin compliance with the borrower's ability to operate profitably and prudently expand its business. Underwriting standards are designed to ensure repayment of loans and mitigate loss exposure. As part ofmodified terms, or for which there is a concern about the underwriting process, the Company examines current and projected cash flows to determine thefuture ability of the borrower to repay his obligationmeet its obligations under the modified terms, continue to be separately reported as agreed. Commercialrestructured until paid in full or charged-off.industrial loans are primarily made based on the identified cash flows$180,000 in commitments to lend additional funds to borrowers with TDRs as of the borrowerDecember 31, 2014 and secondarily on the underlying collateral provided by the borrower. The cash flows of the borrower, however, may not be as expected, and the collateral securing these loans may fluctuate in value. Most commercial and industrial loans are secured by the assets being financed or other business assets, such as accounts receivable or inventory, and usually incorporate a personal guarantee. However, some short-term loans may be made on an unsecured basis. In the case of loans secured by accounts receivable, the availability of funds for the repayment of these loans may be substantially dependent upon the ability of the borrower to collect amounts due from its customers.Commercial real estate loans are subject to underwriting standards and processes similar to commercial and industrial loans, in addition to those standards and processes specific to real estate loans. Except for construction loans, these loans are viewed primarily as cash flow loans and secondarily as loans secured by real estate. Commercial real estate lending typically involves higher loan principal amounts, and the repayment of these loans is largely dependent upon the successful operation of the property securing the loan or the business conducted on the property securing the loan. Commercial real estate loans may be more adversely affected by conditions in the real estate market or in the general economy. The properties securing the Company's commercial real estate portfolio are diverse in terms of type and geographic location within the greater suburban metropolitan Chicago market and contiguous markets. Management monitors and evaluates commercial real estate loans based on cash flow, collateral, geography, and risk grade criteria.Construction loans are underwritten utilizing feasibility studies, independent appraisal reviews, sensitivity analyses of absorption and lease rates, and financial analyses of the developers and property owners. Construction loans are generally based upon estimates of costs and value associated with the completed project. Construction loans often involve the disbursement of substantial funds with repayment primarily dependent upon the success of the completed project. Sources of repayment for these types of loans may be permanent loans from long-term lenders, sales of developed property, or an interim loan commitment until permanent financing is obtained. Generally, these loans have a higher risk profile than other real estate loans due to their repayment being sensitive to real estate values, interest rate changes, governmental regulation of real property, demand and supply of alternative real estate, the availability of long-term financing, and changes in general economic conditions.Consumer loans are centrally underwritten utilizing the FICO credit scoring. This is a credit score developed by Fair Isaac Corporation that is used by many mortgage lenders. It uses a risk-based system to determine the probability that a borrower may default on financial obligations to the lender. Underwriting standards for home equity loans are heavily influenced by statutory requirements, which include, but are not limited to, loan-to-value and affordability ratios, risk-based pricing strategies, and documentation requirements. December 31, 2011 2010 $ 50,895 $ 48,506 147,065 158,889 72,279 76,734 270,239 284,129 (143,195 ) (143,222 ) 127,044 140,907 7,933 - $ 134,977 $ 140,907 As of December 31, 2014 2013 Land $ 51,104 $ 48,590 Premises 148,963 139,336 Furniture and equipment 85,489 81,002 Total cost 285,556 268,928 Accumulated depreciation (156,473 ) (152,751 ) Net book value of premises, furniture, and equipment 129,083 116,177 Assets held-for-sale 2,026 4,027 Total premises, furniture, and equipment $ 131,109 $ 120,204 Years Ended December 31, 2011 2010 2009 $ 10,995 $ 11,397 $ 10,917 2011,2014, the Company was obligated to utilize certain premises and equipment under certain non-cancelable operating leases, for premises and equipment, which expire at various dates through the year 2024.ended December 31, 2030. Many of these leases contain renewal options and certain leases provide options to purchase the leased property during or at the expiration of the lease period at specific prices. Some leases contain escalation clauses calling for rentals to be adjusted for increased real estate taxes and other operating expenses or proportionately adjusted for increases in consumer or other price indices. The following summary reflects the future minimum rental payments by year required under operating leases that have initial or remaining non-cancelable lease terms in excess of one year as of December 31, 2011.Leases
Lease Payments Total $ 3,627 3,858 2,441 2,214 2,184 5,552 $ 19,876 Total Year ending December 31, 2015 $ 5,071 2016 4,697 2017 4,592 2018 3,873 2019 2,082 2020 and thereafter 13,031 Total minimum lease payments $ 33,346 Years Ended December 31, 2011 2010 2009 $ 4,193 $ 3,244 $ 3,314 $ 1,136 $ 1,144 $ 533
Financial Condition.(1)Includes amounts paid under short-term cancelable leases.(2)IncludedAs part of the Popular acquisition, the Company assumed certain operating leases related to various branches. On the date of acquisition, an intangible liability of $10.6 million was recorded as the cash flows of the leases exceeded the fair market value. This intangible liability will be accreted into income as a reduction to net occupancy and equipment expense using the straight line method over the initial term of each lease, which expire between 2018 to 2030. The intangible liability is included in accrued interest and other liabilities in the Consolidated Statements of Income.TableContentsthe intangible liability by year. Total Year ending December 31, 2015 $ 1,144 2016 1,144 2017 1,144 2018 900 2019 651 2020 and thereafter 5,195 Total accretion $ 10,178 Years Ended December 31, 2014 2013 2012 $ 4,216 $ 3,123 $ 3,379 541 531 931 Net operating lease expense $ 3,675 $ 2,592 $ 2,448 Includes amounts paid under short-term cancelable leases and included in net occupancy and equipment expense in the Consolidated Statements of Income. As of December 31, 2014, lease expense is net of $453,000 in accretion related to the intangible liability. Included as a reduction to net occupancy and equipment expense in the Consolidated Statements of Income. 8.three-year periodyears ended December 31, 2011. $ 262,886 - 262,886 7,941 270,827 (5,350 ) 265,477 - $ 265,477 Years Ended December 31, 2014 2013 2012 Beginning balance $ 264,062 $ 265,477 $ 265,477 Acquisitions 46,527 — — Sale of equity method investment — (1,415 ) — Ending balance $ 310,589 $ 264,062 $ 265,477 (1)Goodwill was adjusted based on additional information received2011 relating togoodwill resulted from the acquisition date value of certain assetsPopular, Great Lakes, and liabilities. Refer toNational Machine Tool acquisitions. See Note 1, "Summary of Significant Accounting Policies,3, "Acquisitions," for further details of this adjustment.Goodwill is not amortized but is subject to impairment testing on an annual basis or more often if events or circumstances indicate the potential for impairment. Due to volatile market conditions and a decline in the Company's market capitalization, management determined that an interim impairment test of goodwill as of September 30, 2011 was appropriate. The testing was performed by comparing the carrying value of the reporting unit with management's estimate of the fair value of the reporting unit, which was based on a discounted cash flow analysis. Step 1 of the interim test indicated that management's estimate of the fair value of the reporting unit exceeded the carrying value of the reporting unit; therefore, no impairment existed, and Step 2 of the impairment test was not required.The Company's annual impairment test date is October 1. Given the proximity of the interim test to the annual test date and management's evaluation of market conditions, no additional goodwill impairment testing was deemed necessary during the fourth quarter of 2011.premiums,intangibles, which are being amortized over their estimated useful lives. The Company reviews intangible assets at least annually for possible impairment or more often if events or changes in circumstances between tests indicate that carrying amounts may not be recoverable. The Company's annual impairment testing was performed as of November 30, 20112014 by comparing the carrying value of intangiblesother intangible assets with our anticipated discounted expected future cash flows, and it was determined that no impairment existed as of that date.In December 2011, the Company completed the purchase of certain Chicago-market deposits from Old National. The transaction included $106.7 million in deposits (comprised of $70.6 million in core transactional deposits and $36.1 in time deposits) and one banking facility located in the market in which the Company operates. As a result of the transaction, the Company recorded $1.4 million in core deposit intangibles and a net gain of $1.1 million. Years Ended December 31, 2011 2010 2009 Gross Accumulated
Amortization Net Gross Accumulated
Amortization Net Gross Accumulated
Amortization Net $ 42,832 $ 22,276 $ 20,556 $ 36,591 $ 17,998 $ 18,593 $ 35,731 $ 14,069 $ 21,662 1,419 - 1,419 6,242 - 6,242 860 - 860 - 3,802 (3,802 ) - 4,279 (4,279 ) - 3,929 (3,929 ) (9,933 ) (9,933 ) - (1 ) (1 ) - - - - $ 34,318 $ 16,145 $ 18,173 $ 42,832 $ 22,276 $ 20,556 $ 36,591 $ 17,998 $ 18,593 6.9 7.3 7.0 3.3 to 12.6 3.3 to 12.6 5.5 to 11.8 Years Ended December 31, 2014 2013 2012 Gross Net Gross Net Gross Net Beginning balance $ 33,775 $ 21,471 $ 12,304 $ 33,775 $ 18,193 $ 15,582 $ 34,318 $ 16,145 $ 18,173 Additions 14,195 — 14,195 — — — 781 — 781 Amortization expense — 2,889 (2,889 ) — 3,278 (3,278 ) — 3,372 (3,372 ) Fully amortized assets — — — — — — (1,324 ) (1,324 ) — Ending balance $ 47,970 $ 24,360 $ 23,610 $ 33,775 $ 21,471 $ 12,304 $ 33,775 $ 18,193 $ 15,582 Weighted-average remaining life (in years) 8.0 5.9 6.4 Estimated remaining useful lives (in years) 0.3 to 10.3 0.2 to 11.3 0.7 to 12.3 Total Total $ 3,336 3,192 2,603 2,414 $ 3,920 2,337 3,843 4,291 2017 3,063 2018 2,138 2019 2,073 2020 and thereafter 8,573 $ 18,173 $ 23,610 9.type of account. December 31, As of December 31, 2011 2010 2014 2013 $ 1,593,773 $ 1,329,505 $ 2,301,757 $ 1,911,602 970,016 871,166 1,391,444 1,135,155 1,057,887 1,073,211 1,413,973 1,220,693 1,198,382 1,245,610 1,509,026 1,290,868 1,126,462 1,330,733 859,441 820,925 532,655 661,251 Time deposits greater than $100,000 412,117 386,858 $ 6,479,175 $ 6,511,476 $ 7,887,758 $ 6,766,101 tables providetable provides maturity information related to the Company's time deposits. Total $ 1,227,564 228,049 95,865 56,861 50,211 567 $ 1,659,117 Maturities of Time Deposits of $100,000 or More(Dollar amounts in thousands) Total Year ending December 31, 2015 $ 865,149 2016 211,496 2017 89,061 2018 38,623 2019 66,961 2020 and thereafter 268 Total $ 1,271,558 Total $ 135,029 108,518 148,477 140,631 $ 532,655 10. December 31, As of December 31, 2011 2010 2014 2013 $ 92,871 $ 166,474 $ 137,994 $ 109,792 112,500 137,500 — 114,550 $ 205,371 $ 303,974 $ 137,994 $ 224,342 generally mature within 1 to 90 days from the transaction date. They are treated as financings and the obligations to repurchase securities sold are included as a liability in the Consolidated Statements of Financial Condition. Repurchase agreements are secured by U.S.the Treasury and U.S. agency securities and if required, are held in third party pledge accounts.accounts, if required. The securities underlying the agreements remain in the respective asset accounts. As of December 31, 2011,2014, the Company did not have amounts at risk under repurchase agreements with any individual counterparty or group of counterparties that exceeded 10% of stockholders' equity.2011, all2013, FHLB advances fromtotaled $114.6 million with a weighted average interest rate of 1.34%.FHLBCompany did not have a fixed rate with interest payable monthly.Maturityan outstanding balance as of December 31, 2014 and Rate Schedule for FHLB Advances(Dollar amounts in thousands) December 31, 2011 December 31, 2010 Maturity Date Advance
Amount Rate (%) Advance
Amount Rate (%) $ - - $ 25,000 1.15 37,500 1.70 37,500 1.70 25,000 2.28 25,000 2.28 50,000 2.37 50,000 2.37 $ 112,500 2.13 $ 137,500 1.95 Unused Short-Term Credit Lines Available for Use December 31, 2011 2010 $ 528,000 $ 650,000 1,460,313 1,467,052 As of December 31, 2014 2013 Available federal funds lines $ 685,500 $ 681,100 FRBs Discount Window Primary Credit Program 675,507 632,498 Correspondent bank line of credit 35,000 — (1)Subject to the liquidity position of other banks. December 31, 2011 2010 $ 115,000 $ - (600 ) - 114,400 - 50,500 50,500 (24 ) (29 ) 50,476 50,471 87,351 87,351 (74 ) (78 ) 87,277 87,273 $ 252,153 $ 137,744 As of December 31, Interest Rate 2014 2013 Senior notes due in 2016 5.875% $ 114,768 $ 114,645 Subordinated notes due in 2016 5.850% 38,495 38,491 Junior subordinated debentures: First Midwest Capital Trust I ("FMCT") due in 2033 6.950% 37,797 37,796 Great Lakes Statutory Trust II ("GLST II") due in 2035 3 month LIBOR + 1.400% 4,202 — Great Lakes Statutory Trust III ("GLST III") due in 2037 3 month LIBOR + 1.700% 5,607 — Total junior subordinated debentures 47,606 37,796 Total senior and subordinated debt $ 200,869 $ 190,932 In November 2011, the Company issued $115.0 million of 5-year senior notes. The notes were issued atdiscount and have a fixed coupon interest rate of 5.875% per annum, payable semi-annually. The notes are redeemable prior to maturity only at the Company's option and are unsecured, senior obligations of the Company. The proceeds were primarily used to fund the redemption of preferred stock. For details relating to the redemption of preferred stock, refer to Note 12, "Material Transactions Affecting Stockholders' Equity." The notes contain provisions that require the Company's debt to remain above a certain credit rating by each of the major credit rating agencies. If the Company's debt were to fall below that credit rating, it would be in violation of those provisions and the interest rate would be increased.In 2006, the Company issued $99.9 million of 10-year subordinated notes (the "Notes"). The notes were issued at a discount and have a fixed coupon interest rate of 5.85% per annum, payable semi-annually. The notes are redeemable prior to maturity only at the Company's option and are junior and subordinate to the Company's senior indebtedness. For regulatory capital purposes, the notes qualify as Tier 2 Capital.In 2003, the Company formed First Midwest Capital Trust I ("FMCT"), aDelaware statutory business trust organizedthat was formed in 2003. During the fourth quarter of 2014, the Company acquired two Delaware statutory business trusts, GLST II and GLST III, in the Great Lakes transaction. These trusts were established for the sole purpose of issuing trust-preferred securities to third party investors. FMCT issued $125.0 million in preferred securities and 3,866 shares of common stock and usedlending the proceeds to purchasethe Company in return for junior subordinated debentures issued by the Company ("Subordinated Debentures"). The trust-preferred securities of the trust represent preferred beneficial interests in the assets of the trust and are subject to mandatory redemption, in whole or in part, upon payment of the junior subordinated debentures held by the trust. The common securities of the trust are wholly owned by the Company. The trust's ability to pay amounts dueCompany guarantees payments of distributions on the trust-preferred securities is solely dependent upon the Company making payment on the related junior subordinated debentures. The Company's obligations under the junior subordinated debentures and other relevant trust agreements, in aggregate, constitute a full and unconditional guarantee by the Company of the trust's obligations under the trust-preferred securities issued by the trust. The guarantee covers the distributions and payments on liquidation or redemption of the trust-preferred securities but only to the extent of funds held by the trust.FMCT qualifieson a limited basis. The statutory trusts qualify as a variable interest entityentities for which the Company is not the primary beneficiary; therefore,beneficiary. Consequently, the trust isaccounts of those entities are not consolidated in the Company's financial statements.subordinated debentures issued by the Company to the trust are included in seniorrepurchased and subordinated debt in the Company's Consolidated Statements of Financial Condition with the corresponding interest distributions recorded as interest expense in the Company'sConsolidated Statements of Income. The common shares issued by the trust are included in other assets in the Company's Consolidated Statements of Financial Condition.In 2009, the Company completed an offer to exchange a portion of the notes and a separate offer to exchange a portion of the subordinated debentures for newly issued shares of Common Stock. The exchanges strengthened the composition of First Midwest's capital base by increasing its Tier 1 common and tangible common equity ratios, while also reducing the interest expense associated with the debt securities. As a result of the exchange offers, $39.3retired $24.0 million of subordinated debentures were retired at a discount of 20% in exchange for 3,058,410 shares of Common Stock, and $29.5 million of notes were retired at a discount of 10% in exchange for 2,584,695 shares of Common Stock. In 2009, the Company also retired an additional $1.0 million ofjunior subordinated debentures at a discountpremium of 20% for cash and $20.0 million of notes at a discount of 7% for cash. In the aggregate, the exchange offers and the subsequent retirement of debt for cash3.5% during 2013. This transaction resulted in the recognition of $15.3a pre-tax loss of $1.0 million and is included in pre-tax gains in 2009. These gains are shown as a separate component ofother noninterest income in the Consolidated Statements of Income.12.Redemption of Preferred SharesIn 2008, in response to the financial crises affecting the financial markets and the banking system, the Treasury announced several initiatives under the Troubled Asset Relief Program ("TARP") intended to help stabilize the banking industry. One of these initiatives was the voluntary CPP designed to encourage qualifying financial institutions to build capital. Under the CPP, the Company received $193.0 million from the sale of preferred shares to the Treasury.In exchange for the $193.0 million,TreasuryCompany's Restated Certificate of Incorporation. The amendment increased the Company's authorized common stock by 50,000,000 shares. Following this amendment, the Company is now authorized to issue a total of 193,000 Preferred Shares and a Warrant to purchase up to 1,305,230151,000,000 shares, including 1,000,000 shares of Common Stock. Both the Preferred SharesStock, without a par value, and the Warrant were accounted for as components of the Company's regulatory Tier 1 capital.In November 2011, the Company redeemed all of the $193.0 million of Preferred Shares issued to the Treasury. The redemption was funded through a combination of existing liquid assets and the proceeds from the senior debt issuance.In connection with the redemption, the Company accelerated the accretion of the remaining issuance discount on the Preferred Shares and recorded a corresponding reduction to retained earnings of $1.5 million. This resulted in a one-time, non-cash reduction in net income available to common shareholders and related basic and diluted earnings per share.Dividends of $214,000 were paid to the Treasury on November 23, 2011 when the Preferred Shares were redeemed. The Company paid total dividends on Preferred Shares of $8.7 million in 2011 and $9.7 million in 2010 and 2009.In December 2011, the Company redeemed the Treasury's Warrant for $900,000, which concluded the Company's participation in the CPP.Common Shares IssuedOn January 13, 2010, the Company sold 18,818,183150,000,000 shares of Common Stock, in an underwritten public offering. The price to the public was $11.00$0.01 par value per share, and the proceeds to the Company, net of the underwriters' discount, were $196.0 million, or $10.45 per share, net of related expenses. The net proceeds were used to improve the quality of the Company's capital composition and for general operating purposes.The Company had 85,787,354 shares issued as of December 31, 2011 and 2010. There were 74,435,004 and 74,095,695 shares outstanding as of December 31, 2011 and December 31, 2010, respectively.forfrom 2012 through the past twelve quarters.Tablefirst quarter of ContentsTransactions with2013. The Company increased the BankIn January 2010,quarterly dividend to $0.04 per share during the Company made a $100.0 million capital contributionsecond quarter of 2013, to $0.07 per share during the Bank. In addition,fourth quarter of 2013, and to $0.08 per share during the Bank sold $168.1 millionsecond quarter of non-performing assets to the Company in March 2010. On the date of the sale, the Company recorded the assets at fair value and transferred them to Catalyst in the form of a capital injection. Since the majority of the assets were collateral-dependent loans, fair value was determined based on the lower of the recorded book value of the loan or the estimated fair value of the underlying collateral less costs to sell. No allowance for credit losses was recorded at the Company on the date of the purchase of these assets. Catalyst had non-performing assets totaling $45.2 million as of December 31, 2011 and $93.1 million as of December 31, 2010. This transaction did not change the presentation of these non-performing assets in the consolidated financial statements and did not impact the Company's consolidated financial position, results of operations, or regulatory ratios. However, these two transactions improved the Bank's asset quality, capital ratios, and liquidity.2011 and December 31, 2010.13.2014. Years Ended December 31, Years Ended December 31, 2011 2010 2009 2014 2013 2012 $ 36,563 $ (9,684 ) $ (25,750 ) $ 69,306 $ 79,306 $ (21,054 ) (8,658 ) (9,650 ) (9,650 ) (2,118 ) (649 ) (615 ) (350 ) 266 464 (836 ) (1,107 ) 306 $ 25,437 $ (19,717 ) $ (35,551 ) $ 68,470 $ 78,199 $ (20,748 ) 73,289 72,422 50,034 74,484 73,984 73,665 - - - Dilutive effect of common stock equivalents 12 10 1 73,289 72,422 50,034 74,496 73,994 73,666 $ 0.35 $ (0.27 ) $ (0.71 ) $ 0.92 $ 1.06 $ (0.28 ) $ 0.35 $ (0.27 ) $ (0.71 ) 0.92 1.06 (0.28 ) 3,511 3,823 3,993 1,198 1,462 1,759 (1)Includes $1.5 million in accelerated accretion related to the redemption of the Preferred Shares.(2)Represents outstanding stock options and the Warrant for which the exercise price is greater than the average market price of the Company's Common Stock.This amount represents outstanding stock options for which the exercise price is greater than the average market price of the Company's common stock. 14. Years Ended December 31, 2011 2010 2009 Years Ended December 31, 2014 2013 2012 Current income tax expense: $ 1,929 $ (14,926 ) $ (10,298 ) $ 16,343 $ 4,744 $ — 419 1,439 (5,420 ) (1,388 ) 10,504 1 2,348 (13,487 ) (15,718 ) 14,955 15,248 1 Deferred income tax expense (benefit): 1,605 (8,895 ) (28,808 ) 7,901 31,572 (23,728 ) 555 (6,162 ) (5,650 ) 8,314 1,895 (5,155 ) 2,160 (15,057 ) (34,458 ) 16,215 33,467 (28,883 ) $ 4,508 $ (28,544 ) $ (50,176 ) $ 31,170 $ 48,715 $ (28,882 ) primarily influenced by the amount of tax-exempt income derived from investment securities and bank-owned life insuranceBOLI in relation to pre-tax income (loss) and state income taxes. State income tax expense (benefit) and the related effective income tax rate are influenceddriven by the amount of state tax-exempt income in relation to pre-tax income (loss) and state tax rules relating tofor consolidated/combined reporting and sourcing of income and expense.$4.5$31.2 million in 2011 following for the year ended December 31, 2014 compared to income tax expense of $48.7 million for the year ended December 31, 2013 and an income tax benefit of $28.5$28.9 million for the year ended December 31, 2012. The decrease in 2010.income tax expense in 2014 was driven primarily by a decrease in income subject to tax at statutory rates. The varianceincrease in income tax expense from 2012 to 2013 was primarily attributable tothe result of an increase in pre-tax income subject to tax at statutory rates and to a non-deductible BOLI modification loss recorded in 2011 compared to the prior year, as well as a decrease in tax-exempt income and the impact of the Illinois tax law change described below.Effective January 1, 2011, the Illinois corporate income tax rate increased from 7.3% to 9.5%. This rate increase resulted in additional state tax expense, net of federal tax, of $418,000 for 2011. The Company recorded a $1.6 million income tax benefit in first quarter 2011 related to the resulting increase in the Company's deferred tax asset. The rate will decline to 7.75% in 2015 and return to 7.3% in 2025. The legislation also suspends net operating loss utilization in 2011 and limits the amount of utilization to $100,000 per year in 2012 and 2013.basesbasis of assets and liabilities result in temporary differences for which deferred tax assets and liabilities have beenwere recorded. December 31, As of December 31, 2011 2010 2014 2013 $ 12,798 $ 8,185 $ 29,007 $ 19,184 16,962 7,299 — 14,579 42,687 50,775 26,078 30,492 22,940 24,610 Unrealized losses on securities 18,527 21,374 5,376 8,490 3,480 6,541 11,456 11,776 11,917 15,859 8,150 8,221 10,783 10,191 18,390 19,049 131,152 129,547 107,399 127,078 (10,278 ) (12,569 ) (11,181 ) (16,977 ) (3,215 ) (3,441 ) (6,681 ) (2,354 ) (6,732 ) (7,095 ) (2,843 ) (2,063 ) (845 ) (2,111 ) (5,340 ) (5,340 ) (4,272 ) (5,340 ) (9,365 ) (8,160 ) (3,978 ) (6,313 ) (37,722 ) (33,927 ) (27,008 ) (37,836 ) - (30 ) — — 93,430 95,590 80,391 89,242 9,194 17,763 11,294 18,382 $ 102,624 $ 113,353 $ 91,685 $ 107,624 $ 48,463 $ 20,856 $ 220,101 $ 225,027 $ 23,872 $ 19,872 $ 229 $ - $ 12,798 $ 8,185 Federal gross NOL carryforwards, begin to expire in 2032 $ — $ 41,654 Illinois gross NOL carryforwards, begin to expire in 2021 232,834 290,076 Indiana gross NOL carryforwards, begin to expire in 2022 17,192 16,112 Alternative minimum tax credits 25,739 16,090 Other credits, begin to expire in 2028 3,268 3,094 (1)Consists of AMT credits, which have an indefinite life and other credits, which have a 20-year life. Approximately $2.6other credits will begin to expire in 2028. Years Ended December 31, Years Ended December 31, 2011 2010 2009 2014 2013 2012 35.0% 35.0% 35.0% 35.0 % 35.0 % 35.0 % (21.3%) 27.0% 16.5% (7.5 )% (6.2 )% 16.8 % (0.3%) 9.5% 12.1% 4.5 % 6.4 % 7.0 % (2.4%) 3.2% 2.5% Net other (1.0 )% 2.9 % (1.0 )% 11.0% 74.7% 66.1% 31.0 % 38.1 % 57.8 % income tax rate from 2010the year ended December 31, 2013 to 2011the year ended December 31, 2014 was primarily attributable tothe result of a decrease in tax-exempt income as a percent of total pre-tax income or loss and,subject to a lesser extent, by an increase in the Illinois income tax rate.income tax rate from 2009the year ended December 31, 2012 to 2010the year ended December 31, 2013 was primarily attributable tothe result of an increase in tax-exempt interest asincome subject to tax at statutory rates and a percent of the pre-tax loss.2011, 2010,2014, 2013, and 2009,2012, the Company's retained earnings included an appropriation for an acquired thrift's tax bad debt reserves of approximately $2.5 million for which no provision for federal or state income taxes has been made. If, in the future, this portion of retained earnings waswere distributed as a result of the liquidation of the Company or its subsidiaries, federal and state income taxes would be imposed at the then applicable rates. U.S. federal jurisdiction and in Illinois, Indiana, Iowa, and Wisconsin. Audits of the Company's 2002-2005 Illinois income tax returns were closed during 2010 without significant adjustments. Audits of the Company's 2006-2007 Illinois income tax returns were closed in 2011 without significant adjustments. The Internal Revenue Service initiatedcompleted audits of the Company's 2006, 2007, and 20092006-2010 federal income tax returns and Illinois completed audits of the Company's 2008-2009 Illinois income tax returns. No significant adjustments were proposed in these audits.The Company believes it is reasonably possible that these audits will be resolved in 2012 without significant changes to the returns as filed.federalIllinois, Indiana, Iowa and Wisconsin tax authorities for years prior to 2006; by Indiana and Iowa tax authorities for years prior to 2008; and Illinois tax authorities for years prior to 2008, except with respect to an amended 2006 Illinois return for which the statute of limitations remains open. The Company began filing in Wisconsin in 2009 as a result of changes in the Wisconsin tax law. Years Ended December 31, 2011 2010 2009 Years Ended December 31, $ 429 $ 314 $ 5,751 2014 2013 2012 Beginning balance $ 279 $ — $ 368 - 2 9 635 279 — 226 263 - (80 ) (72 ) (5,446 ) (2 ) — — (207 ) - - — — (368 ) - (78 ) - $ 368 $ 429 $ 314 Ending balance $ 912 $ 279 $ — $ 44 $ (21 ) $ (556 ) Interest (benefit) expense, net of tax effect, and penalties $ 4 $ — $ (52 ) $ 52 $ 8 $ 29 4 — — (1)Included in income tax expense (benefit) in the Consolidated Statements of Income.The reductions in uncertain tax positions in 2011 compared to 2010 are a result of the resolution of certain tax authority examinations, partially offset by a change in exposure as a result of the prior year settlement with taxing authorities. The increase in uncertain tax positions in 2010 compared to 2009 resulted from additions for tax positions relating to prior years.Included in income tax expense (benefit) in the Consolidated Statements of Income. 20112014 and 2013 are tax positions totaling $269,000$597,000 and $181,000, respectively, that would favorably affect the Company's effective tax rate if recognized in future periods.Savings and , which allows that covers qualified employees at theirwho meet certain eligibility requirements. During 2014, the Profit Sharing Plan was amended to give qualified employees the option to makeincrease contributions up tofrom 45% of their pre-tax base salary (15% for certain highly compensated employees) to 100% (including certain highly compensated employees) of their pre-tax base salary through salary deductions under Section 401(k) of the Internal Revenue Code. At the employees' direction, employee contributions are invested among a variety of investment alternatives. ForThe amendment also increased the Company’s matching contribution from a maximum of 2% to 4% of the eligible employee's compensation. In addition, pursuant to the amendment, the Company makes certain automatic and transition contributions. On an annual basis, the Company automatically contributes 2% of the employee's eligible compensation regardless of voluntary contributions made by the employee. Transition contributions of up to 4% will be made through December 31, 2015 for certain employees who make voluntary contributions towere active participants in the defined benefit retirement plan (the "Pension Plan"), which was frozen in 2013. The amendment did not change the discretionary profit sharing component of the Profit Sharing Plan, the Company contributes an amount equal to 2% of the employee's compensation. The Profit Sharing Plan alsowhich permits the Company to distribute a discretionary profit-sharing component up to 15% of the employee's compensation. The Company's matching contribution vestsand transition contributions vest immediately, while the automatic and discretionary component vestscomponents vest over a period of six years.Savings and Years Ended December 31, 2011 2010 2009 Years Ended December 31, $ 2,897 $ 859 $ 2,454 2014 2013 2012 $ 6,354 $ 2,914 $ 2,532 $ 72 $ 72 $ 452 $ 428 $ 159 $ 71 Company shares held by the Profit Sharing Plan at the end of the year: 1,806,262 2,752,521 2,916,152 1,364,558 1,426,708 1,743,085 $ 18,297 $ 31,709 $ 31,757 $ 23,348 $ 25,010 $ 21,823 Included in retirement and other employee benefits in the Consolidated Statements of Income. a noncontributory defined benefit retirement plan (the "Pension Plan") thatthe Pension Plan which provides for retirement benefits based on years of service and compensation levels of the participants. The Pension Plan covers a majority of employees who met certain eligibility requirements and were hired before April 1, 2007, whenthe date it was amended to eliminate new enrollment of employees. new participants. During 2013, the Board of Directors approved an amendment to freeze benefit accruals under the Pension Plan effective on January 1, 2014. Based on December 31, 2013 actuarial assumptions, the amendment decreased the pension obligation by $9.9 million and increased other comprehensive income (loss) by $5.9 million, after tax. These actions reduced 2013 pension expense by approximately $1.0 million.operations.operations and included in retirement and other employee benefits in the Consolidated Statements of Income. The Company's funding policy is to contribute amounts to its planthe Pension Plan that are sufficient to meet the minimum funding requirements of the Employee Retirement Income Security Act of 1974 plus such additional amounts as the Company deems appropriate.Plan'sPlan Cost and Obligations December 31, As of December 31, 2011 2010 2014 2013 $ 55,782 $ 43,889 $ 67,283 $ 61,292 $ 51,963 $ 43,671 Change in projected benefit obligation: Beginning balance $ 61,292 $ 72,855 2,725 2,352 — 2,600 3,032 2,665 2,346 2,414 8,067 4,957 Curtailment — (9,947 ) Settlements (6,502 ) — Actuarial loss (gain) 10,508 (1,494 ) (2,776 ) (1,682 ) (361 ) (5,136 ) $ 63,011 $ 51,963 $ 54,713 $ 51,033 Ending balance $ 67,283 $ 61,292 Change in fair value of plan assets: Beginning balance $ 74,370 $ 63,501 1,053 5,362 4,686 9,005 (2,776 ) (1,682 ) (361 ) (5,136 ) 10,000 - — 7,000 $ 62,990 $ 54,713 Settlements (6,502 ) — Ending balance $ 72,193 $ 74,370 $ - $ 2,750 (21 ) - Noncurrent asset $ 4,910 $ 13,078 $ 4 $ 8 $ — $ — 21,860 12,996 19,911 10,784 $ 21,864 $ 13,004 $ 19,911 $ 10,784 39.2% 29.6% 29.6 % 17.6 % 34.7% 23.8% 27.6 % 14.5 % $ 3 $ 3 $ — $ — 1,336 525 401 215 $ 1,339 $ 528 $ 401 $ 215 4.40% 5.50% 3.60 % 4.30 % 2.50% 3.00% N/A N/A The rate of compensation increase is no longer applicable in determining the present value of the projected benefit obligation due to the amendment to freeze benefit accruals, which is discussed above. 20112014 exceeded 10% of the accumulated benefit obligation and the fair value of planPension Plan assets. The amortization of net actuarial losses is a component Years Ended December 31, 2014 2013 2012 Components of net periodic benefit cost: Service cost $ — $ 2,600 $ 2,862 Interest cost 2,346 2,414 2,720 Expected return on plan assets (4,931 ) (4,299 ) (4,456 ) Recognized net actuarial loss 249 1,453 1,684 Amortization of prior service cost — 1 3 Recognized settlement loss 1,377 — — Net periodic (income) cost (959 ) 2,169 2,813 Net (loss) gain for the period (10,752 ) 16,146 (8,207 ) Amortization of prior service cost — 1 4 Amortization of net loss 1,625 1,453 1,683 Total unrealized (loss) gain (9,127 ) 17,600 (6,520 ) $ (8,168 ) $ 15,431 $ (9,333 ) Discount rate 4.30 % 3.40 % 4.40 % Expected return on plan assets 7.25 % 7.25 % 7.25 % Rate of compensation increase N/A 2.50 % 2.50 % The rate of compensation increase is no longer applicable in determining the net periodic cost due to the amendment to freeze benefit accruals, which is discussed above. Years Ended December 31, 2011 2010 2009 $ 2,725 $ 2,352 $ 3,404 3,032 2,665 3,337 (4,110 ) (4,150 ) (4,558 ) 976 2 1,153 3 3 3 1,285 - 737 3,911 872 4,076 11,124 3,746 (15,830 ) (4 ) (4 ) (4 ) (2,260 ) (2 ) (1,154 ) 8,860 3,740 (16,988 ) $ 12,771 $ 4,612 $ (12,912 ) 5.50% 6.00% 6.25% 7.50% 7.50% 8.50% 3.00% 3.00% 4.50% (1)The 2011 amount represents the correction of a 2010 actuarial pension expense calculation related to the valuation of future early retirement benefits.Pension Plan Asset Allocation(Dollar amounts in thousands) Target Allocation 2014 2013 Asset Category: Equity securities 50 - 60% $ 42,826 59 % 63 % Fixed income 30 - 48% 25,832 36 % 30 % Cash equivalents 2 - 10% 3,535 5 % 7 % Total $ 72,193 100 % 100 % Percentage of Plan Assets Target Allocation 2011 Fair Value of
Plan Assets (1) 2011 2010 50 - 60% $ 32,360 51% 61% 30 - 48% 18,937 30% 33% 2 - 10% 11,693 19% 6% $ 62,990 100% 100% (1)Additional information regarding the fair value of plan assets can be found in Note 22, "Fair Value."As of December 31, 2011, asset category allocations were outside the target range due to a December 2011 employer contribution included in cash equivalents. On January 31, 2012, subsequent to investing this contribution, allocations were 55% equity, 35% fixed income, and 10% cash equivalents.Additional information regarding the fair value of Pension Plan assets at December 31, 2014 can be found in Note 22, "Fair Value." assets allocation is developed.asset allocation.above. As a strategyabove and reallocating those assets as needed to mitigate volatility, investmentsstay within those allocations. Investments are weighted toward publicly traded securities, andsecurities. Investment strategies that include alternative asset classes, such as private equity hedge funds and real estate, are generally avoided. The assets are reallocated as needed by the fund manager to meet the above target allocations. Under the advisement of a certified investment advisor, the Committee reviews the investment policy on a quarterly basis to determine if any adjustments to the policy or investment strategy are necessary.Based on the actuarial assumptions, the Company does not anticipate making a contribution to the Pension Plan in 2012. which reflect expected future service, for fiscal years 2012ending December 31, 2015 through 2021,2024 are as follows. Total $ 5,276 4,944 5,134 5,146 5,240 26,124 Total Year ending December 31, 2015 $ 5,298 2016 5,397 2017 4,886 2018 4,324 2019 4,085 2020-2024 17,518 16.grantinggrant of both incentive and non-statutory ("nonqualified") stock options, stock appreciation rights, restricted stock, awards, restricted stock units, performance units, and performance shares to certain key employees.In August 2006, as an enhancement to the current compensation program, the Board approved the granting of restricted stock awards and restricted stock units to certain key officers. These awards are restricted to transfer, but are not restricted to dividend payment and voting rights.Sinceoptions in February of each year.options. The option exercise price is set at the fair value of the Company's Common Stock on the date the options are granted. The fair value is defined as the average of the high and low price of the Company's common stock price on the date of grant.grant date. All options have a term of ten years from the grant date, of grant, include reload features, and are non-transferable except to immediate family members, family trusts, or partnerships.grantshas granted restricted stock and restricted stock unit awards instead of nonqualified stock options to certain key employees, typically in February of each year.employees. Both restricted stock options and restricted stock unit awards vest over three years, with 50% vesting after two years fromon the datesecond anniversary of the grant date and the remaining 50% vesting three years afteron the datethird anniversary of the grant date, provided the employee remains employed by the Company during this period (subject to accelerated vesting in the event of a change-in-control or upon terminationcertain terminations of employment, as set forth in the applicable award agreement).non-qualifiednonqualified stock options were issued under the Directors Plan. The exercise price of the options is equal to the fair valueaverage of the Common Stockhigh and low price of the Company's common stock on the date of grant.grant date. All options have a term of ten10 years from the date of grant.grant date.awards.awards, among other items. The awards are restricted as to transfer, but are not restricted as to dividend payment and voting rights. Dividends accrue and are paid at the vesting date. Both the options and the restricted stock awards vest one year from the grant date of grant subject to accelerated vesting in the event of retirement, death, disability, or change-in-control, as defined in the Directors Plan.Options or restricted stock awards are granted annually at the first regularly scheduled Board meeting in each calendar year (generally in February). Directors elected during the service year are granted equity awards on a pro-rata basis.have beenand material amendments, were submitted to and approved by the stockholders of the Company. The Company issues treasury shares to satisfy stock option exercises and the vesting of restricted stock, award releases. December 31, 2011 As of December 31, 2014 Shares
Authorized Shares Available
For Grant 8,631,641 2,474,769 8,631,641 2,237,337 481,250 98,026 481,250 75,294 In October 2009, the Board approved adjustmentsThe Company also periodically issues salary stock awards to the 2010 base salaries of certain of its executive officers, as permitted by the executive compensation provisions of TARP. The approved adjustments became effective on January 1, 2010 and modified the mix between the fixed and variable components of compensation to be paid to these officers during 2010 and 2011. The salary adjustments were paid in accordance with the Company's standard payroll procedures with 25% paid in cash and 75% paid inofficers. This stock is fully vested shares of Common Stock. The number of shares of Common Stock granted as of each payroll period end date to each executive officer is determined by dividing that portion of the executive officer's salary adjustment payable for the period by the closing price of the Common Stock on the date prior to the applicable payrollgrant date.In 2011, 45,889 shares were granted at a weighted-average price of $10.10 per share, and in 2010, 49,569 shares were granted at a weighted-average price of $12.30 per share. The issuance of these sharessalary stock awards is included in share-based compensation expense, but does not reduce the number of shares issued and outstanding under the Omnibus Plan as the issuance is not considered part of the share-based plans referenced above.Since Years ended December 31, 2014 2013 2012 Shares granted — 8,693 10,983 Weighted-average price $ — $ 14.30 $ 11.51 Year Ended December 31, 2014 Number of Options Options outstanding beginning balance 1,436 $ 32.99 Expired (283 ) 33.23 Options outstanding ending balance 1,153 $ 32.93 1.62 $ 215 Exercisable at the end of the year 1,153 $ 32.93 1.62 $ 215 Represents the average remaining contractual life in years. Aggregate intrinsic value represents the total pre-tax intrinsic value that would have been received by the option holders if they had exercised their options on December 31, 2014. Intrinsic value equals the difference between the Company's average of the high and low stock price on the last trading day of the year and the option exercise price, multiplied by the number of shares. This amount will fluctuate with changes in the fair value of the Company's common stock. Company's participationfair value of stock options at the grant date using a Black-Scholes option-pricing model. No stock options were granted or exercised and no stock option award modifications were made during the three years ended December 31, 2014. Year Ended December 31, 2014 Restricted Stock/Unit Awards Performance Shares Non-vested awards beginning balance 1,123 $ 12.10 127 $ 12.68 Granted 417 16.13 118 16.13 Vested (474 ) 11.79 — 11.79 Forfeited (69 ) 13.53 (7 ) 13.53 Non-vested awards ending balance 997 $ 13.79 238 $ 14.36 Years Ended December 31, 2014 2013 2012 $ 16.13 $ 13.01 $ 11.35 7,546 4,917 4,921 2,939 1,966 1,884 CPP was concluded in December 2011,periods presented. No restricted stock, restricted stock unit, and performance share award modifications were made during the Company is no longer subject to the executive compensation provisions of TARP.Accounting Treatmentdate of grant or modification.modification date. Share-based compensation expense is included in salaries and wages in the Consolidated Statements of Income.(Dollar amounts in thousands, except per share data) Years ended December 31, 2011 2010 2009 $ 291 $ 317 $ 785 5,607 4,712 2,731 464 609 - 6,362 5,638 3,516 2,602 2,199 1,371 $ 3,760 $ 3,439 $ 2,145 $ 0.05 $ 0.05 $ 0.04 $ 0.05 $ 0.05 $ 0.04 $ (47 ) $ 189 $ 177 $ 47 $ (189 ) $ (177 ) (1)Amount represents cash flows resulting from the tax benefits of tax deductions in excess of recognized compensation expense.Stock OptionsNonqualified Stock Option Transactions(Amounts in thousands, except per share data) Year Ended December 31, 2011 Options Average
Exercise
Price Weighted Average Remaining Contractual Term (1) Aggregate Intrinsic Value (2) 2,492 $ 32.23 42 12.17 (560 ) 30.62 1,974 $ 32.25 3.60 $ - 1,974 $ 32.25 3.60 $ - 1,974 $ 32.25 3.60 $ - (1)Represents the average remaining contractual life in years.(2)Aggregate intrinsic value represents the total pre-tax intrinsic value (i.e., the difference between the Company's average of the high and low stock price on the last trading day of the year and the option exercise price, multiplied by the number of shares) that would have been received by the option holders if they had exercised their options on December 31, 2011. This amount will fluctuate with changes in the fair value of the Common Stock.Stock Option Valuation Assumptions – The Company estimates the fair value of stock options at the date of grant using a Black-Scholes option-pricing model that utilizes the assumptions outlined in the following table. No stock options were granted in 2009 or 2010.Stock Option Valuation Assumptions Years Ended December 31, 2011 2010 2009 5.3 - - 42% - - 2% - - 0.33% - - $ 4.72 $ - $ - Expected life is based on historical exercise and termination behavior. Expected stock price volatility is derived from historical volatility of the Common Stock over the expected life of the options. The risk-free interest rate is based on the implied yield currently available on U.S. Treasury zero-coupon issues with a remaining term equal to the expected life of the option. The expected dividend yield represents the three-year historical average of the annual dividend yield as of the date of grant. Management reviews and adjusts the assumptions used to calculate the fair value of an option on a periodic basis to better reflect expected trends.Other Stock Option Information
(Dollar amounts in thousands) Years Ended December 31, 2011 2010 2009 Years ended December 31, $ 291 $ 317 $ 785 2014 2013 2012 $ 5,926 $ 5,779 $ 5,877 Salary stock award expense — 124 127 Total share-based compensation expense 5,926 5,903 6,004 Income tax benefit 2,424 2,414 2,456 Share-based compensation expense, net of tax $ 3,502 $ 3,489 $ 3,548 $ - $ 23 $ 283 $ 6,937 $ 6,327 $ 5,674 - 0.1 0.4 1.3 1.2 1.1 No stock options were exercised during the three years ended December 31, 2011. No stock option award modifications were made during 2009, 2010, or 2011.Restricted Stock and Restricted Stock Unit AwardsRestricted Stock Award Transactions(Amounts in thousands, except per share data) Years Ended December 31, 2011 2010 Number of
Shares/Units Weighted
Average
Grant Date
Fair Value Number of
Shares/Units Weighted
Average
Grant Date
Fair Value 978 $ 11.99 653 $ 11.94 490 12.08 448 13.26 (358 ) 11.77 (108 ) 16.90 (99 ) 13.95 (15 ) 11.99 1,011 $ 11.92 978 11.99 - $ - - $ - 26 12.08 - - 26 $ 12.08 - - The fair value of restricted stock/unit awards is determined based on the average of the high and low stock price on the date of grant and is recognized as compensation expense over the vesting period.Other Restricted Stock Award/Unit Information(Dollar amounts in thousands) Years Ended December 31, 2011 2010 2009 $ 5,607 $ 4,712 $ 2,731 $ 4,784 $ 5,248 $ 4,489 0.95 1.1 1.6 $ 10,264 $ 11,421 $ 7,205 $ 1,828 $ 724 $ 258 No restricted stock unit award modifications were made during 2009, 2010, or 2011.17.18. STOCKHOLDER RIGHTS PLANCommon StockCompany common stock held on record on March 1, 1989 pursuant to a Rights Agreement dated February 15, 1989. The Rights Agreement was amended and restated on November 15, 1995 and again on June 18, 1997 to exclude an acquisition. The Rights Agreement was further amended on December 9, 2008 to clarify certain items. As amended, each rightRight entitles the registered holder to purchase from the Company 1/100 of a share of Series A Preferred Stock for a price of $150, subject to adjustment. The Rights will be exercisable only if a person or group has acquired,acquires, or announces the intention to acquire, 10% or more of the Company's outstanding shares of Common Stock.common stock. The Company is entitled to redeem each Right for $0.01, subject to adjustment, at any time prior to the earlier of the tenth business day following the acquisition by any person or group of 10% or more of the outstanding shares of the Common Stockcommon stock or the expiration date of the Rights. The Rights Agreement will expire on November 15, 2015.distribution,Agreement, 600,000 of the 1,000,000 shares of authorized preferred stock were reserved for issuance as Series A Preferred Stock.18.Federal Reserve BankFRB and are based on the average daily balances and statutory reserve ratios prescribed by the type of deposit account. Reserve balances totaling $18.3$60.0 million at December 31, 20112014 and $19.3$68.7 million at December 31, 20102013 were maintained in fulfillment ofaccordance with these requirements.the Parent CompanyFirst Midwest Bancorp, Inc. on an unconsolidated basis (the "Parent Company") and its non-bank subsidiaries. Loans or advances to a single subsidiary may not exceed 10%, and loans to all subsidiaries may not exceed 20% of the Bank's capital stock and surplus, as defined. Loans from subsidiary banks to non-bank subsidiaries, including the Parent Company, are also required to be collateralized.be paidpay to the Parent Company by the Bank.Company. Without prior regulatory approval and while maintaining its well-capitalized status, the Bank can initiate aggregate dividend payments in 20122015 of $48.8$61.2 million plus an additional amount equal to its net profits for 2012,2015, as defined by statute, up to the date of any such dividend declaration. Future payment of dividends by the Bank is dependent upondepends on individual regulatory capital requirements and levels of profitability.2011,2014, the Company and the Bank met all capital adequacy requirements to which they are subject.requirements. As of December 31, 2011,2014, the most recent regulatory notification classified the Bank as "well-capitalized" under the regulatory framework for prompt corrective action. There are no conditions or events since that notification that management believes would change the Bank's classification. Actual Adequately
Capitalized "Well-Capitalized"
for FDICIA Capital Ratio Capital Ratio Capital Ratio Actual To Be Well-Capitalized Under Prompt Corrective Action Provisions Capital Ratio % Capital Ratio % Capital Ratio % As of December 31, 2014 $ 853,961 13.68% $ 499,295 8.00% $ 624,119 10.00% $ 884,692 11.23 $ 630,140 8.00 N/A N/A 880,223 14.37 489,968 8.00 612,459 10.00 931,829 12.30 606,038 8.00 $ 757,547 10.00 724,863 11.61 249,648 4.00 374,471 6.00 802,483 10.19 315,070 4.00 N/A N/A 803,054 13.11 244,984 4.00 367,476 6.00 857,362 11.32 303,019 4.00 454,528 6.00 724,863 9.28 234,409 3.00 390,682 5.00 802,483 9.03 355,362 4.00 N/A N/A 803,054 10.37 232,370 3.00 387,284 5.00 857,362 9.76 351,222 4.00 439,028 5.00 As of December 31, 2013 $ 1,027,761 16.27% $ 505,420 8.00% $ 631,774 10.00% $ 841,787 12.39 $ 543,573 8.00 N/A N/A 856,027 13.87 493,622 8.00 617,027 10.00 897,255 13.86 517,721 8.00 $ 647,152 10.00 897,410 14.20 252,710 4.00 379,065 6.00 741,414 10.91 271,787 4.00 N/A N/A 778,008 12.61 246,811 4.00 370,216 6.00 816,286 12.61 258,861 4.00 388,291 6.00 897,410 11.21 240,066 3.00 400,107 5.00 741,414 9.18 242,277 4.00 N/A N/A 778,008 9.88 236,253 3.00 393,755 5.00 816,286 10.24 239,065 4.00 398,442 5.00 19.strategy to minimize significant unplanned fluctuations in earnings and cash flows caused by interest rate volatility.strategy. The significant accounting policies related to derivative instruments and hedging activities are presented in Note 1, "Summary of Significant Accounting Policies."During 2010 and 2011, thehedgedhedges the fair value of fixed rate commercial real estate loans through the use of pay fixed, receive variableusing interest rate swaps.swaps through which the Company pays fixed amounts and receives variable amounts. These derivative contracts wereare designated as fair value hedges and are valued using observable market prices, if available, or third party cash flow projection models. The valuations and expected lives presented in the following table are based on yield curves, forward yield curves, and implied volatilities that were observable in the cash and derivatives markets as of December 31, 2011 and December 31, 2010.Interest Rate Derivatives Portfolio
hedges. December 31, 2011 2010 $ 16,947 $ 17,994 2.19% 2.17% 6.39% 6.40% 5.76 6.76 $ (2,459 ) $ (1,833 ) $ 2,516 $ 1,836 $ 2,492 $ 1,868 As of December 31, 2014 2013 Gross notional amount outstanding $ 12,793 $ 14,730 Derivative liability fair value (1,032 ) (1,472 ) Weighted-average interest rate received 2.07 % 2.08 % Weighted-average interest rate paid 6.37 % 6.39 % Weighted-average maturity (in years) 2.95 3.76 1,057 1,502 (1)No other collateral was required to be pledged.This amount represents the fair value if credit risk related contingent features were triggered. Ineffectiveness and Gains Recognized(Dollar amounts in thousands) Years ended December 31, 2011 2010 2009 $ (626 ) $ (588 ) $ 1,383 624 585 (1,389 ) $ (2 ) $ (3 ) $ (6 ) $ - $ - $ 120 (1)Includedineffectiveness is recognized in other noninterest income in the Consolidated Statements of Income. NoFor the years ended December 31, 2014, 2013, and 2012, gains or losses were recognized related to componentsfair value hedge ineffectiveness were not material. As of December 31, 2014 2013 Gross notional amount outstanding $ 650,000 $ — Derivative asset fair value 1,166 — Derivative liability fair value (3,096 ) — Weighted-average interest rate received 1.63 % — Weighted-average interest rate paid 0.16 % — Weighted-average maturity (in years) 4.52 — As of December 31, 2014 2013 Gross notional amount outstanding $ 527,893 $ 256,638 Derivative asset fair value 7,852 2,235 Derivative liability fair value (7,852 ) (2,235 ) 8,130 1,305 This amount represents the fair value if credit risk related contingent factors were triggered. were excluded fromdo not receive hedge accounting treatment consisting of commitments to originate 1-4 family mortgage loans and foreign exchange contracts. In addition, the assessment of hedge ineffectiveness during the years presented.(2)The gain represents the fair value on discontinued fair value hedges in connectionCompany occasionally enters into risk participation agreements with our subordinated fixed rate debt that were being amortized through earnings over the remaining lifecounterparty banks to transfer or assume a portion of the hedged item (debt). In additioncredit risk related to customer transactions. The amounts of these amounts, interest accruals on fair value hedges are also reported in net interest income.risk. Credit risk, occurswhich represents the Company’s risk of loss when the counterparty to a derivative contract fails to perform according to the terms of the agreement. Credit risk is managed by limiting and collateralizing the aggregate amount of net unrealized gains in agreements,losses by transaction, monitoring the size and the maturity structure of the derivatives, and applying uniform credit standards for all activities with credit risk. Understandards. Companycounterparty cannot exceed 2.5% of stockholders' equity.counterparty. In addition, the Company established bilateral collateral agreements with its primary derivative counterparties that provide for exchanges of marketable securities or cash to collateralize either party'sparty’s net gainslosses above an agreed-upona stated minimum threshold. In determining the amount of collateral required, gains and losses on derivative instruments are netted with the same counterparty. OnAt December 31, 2011,2014 and 2013, these collateral agreements covered 100% of the fair value of the Company'sCompany’s outstanding interest rate swaps. Net losses with counterparties must be collateralized with either cash or U.S. government or U.S. government-sponsored agency securities.fair value hedges. Derivative assets and liabilities are presented gross, rather than net, of pledged collateral amounts. Derivative Assets Derivative Liabilities As of December 31, As of December 31, 2014 2013 2014 2013 Gross amounts recognized $ 9,018 $ 2,235 $ 11,980 $ 3,707 — — — — 9,018 2,235 11,980 3,707 Gross amounts not offset in the Consolidated Statements of Financial Condition Offsetting derivative positions (1,195 ) (704 ) (1,195 ) (704 ) Cash collateral pledged — — (10,785 ) (3,003 ) Net credit exposure $ 7,823 $ 1,531 $ — $ — Included in other assets or other liabilities in the Consolidated Statements of Financial Condition. 20112014 and December 31, 2010, all of2013, the Company'sCompany’s derivative instruments generally contained provisions that require the Company'sCompany’s debt to remain above a certain credit rating by each of the major credit rating agencies.agencies or that the Company maintain certain capital levels. If the Company'sCompany’s debt were to fall below that credit rating or the Company's capital were to fall below the required levels, it would be in violation of those provisions, and the counterparties to the derivative instruments could terminate the swap transaction and demand cash settlement of the derivative instrument in an amount equal to the derivative liability fair value. For the year endedAs of December 31, 2011,2014 and 2013, the Company was not in violation of these provisions.The Company's derivative portfolio also includes derivative instruments not designated in a hedge relationship consisting of commitments to originate 1-4 family mortgage loans and foreign exchange contracts. The amount of these instruments was not material for any period presented. The Company had no other derivative instruments as of December 31, 2011 or December 31, 2010. The Company does not enter into derivative transactions for purely speculative purposes.20.activities. These instruments includeactivities, including commitments to extend credit and standby and commercial letters of credit. These instruments involve to varying degrees, elements of credit and interest rate risk in excess of the amount recognized in the Consolidated Statements of Financial Condition. December 31, 2011 2010 $ 257,315 $ 275,826 21,257 26,376 13,300 26,682 139,574 175,608 609,601 553,168 178,699 169,824 129,015 97,299 $ 1,348,761 $ 1,324,783 $ 8,661 $ 10,551 49,373 54,896 58,532 74,594 $ 116,566 $ 140,041 $ 668 $ 696 9.62 12.2 0.1 to 12.6 0.1 to 9.5 $ - $ 7,424 $ - $ 2,208 $ - $ 148 As of December 31, 2014 2013 Commitments to extend credit: Commercial, industrial, and agricultural $ 1,299,683 $ 1,077,201 Commercial real estate 170,573 133,867 Home equity 317,783 268,311 194,556 181,702 Total commitments to extend credit $ 1,982,595 $ 1,661,081 Standby letters of credit $ 110,639 $ 110,453 Recourse on assets sold: Unpaid principal balance of loans sold $ 185,910 $ 170,330 155 162 (1)Federal regulation regarding electronic fund transfers require customers to affirmatively consent to the institution's overdraft service for automated teller machine and one-time debit card transactions before overdraft fees may be assessed on the account. Customers are provided a specific line for the amount they may overdraw.(2)Included in other liabilities in the Consolidated Statements of Financial Condition.(3)The Company is amortizing these amounts into income over the commitment period.Other commitments includes installment and overdraft protection program commitments. Included in other liabilities in the Consolidated Statements of Financial Condition. as long as there is no violation of any condition in the contract.subject to contractual terms and covenants. Commitments generally have fixed expiration dates or other termination clauses, and variable interest rates, and may require payment of a fee.fee requirements, when applicable. Since many of the commitments are expected to expire without being drawn, upon, the total commitment amounts do not necessarily represent future cash-flowcash flow requirements.thosethe commitments. The credit risk is essentially the same as that involved in extending loans to customers and is subject to standard credit policies.customers. The Company uses the same credit policies in makingfor credit commitments as it does for on-balance sheetits loans and minimizes exposure to credit loss through various collateral requirements.uponon the failure of the customer to perform according to the terms of the underlying contract with the third party and are most often issued in favor of a municipality where construction is taking place to ensure the borrower adequately completes the construction.Pursuant to the securitizationsale of certain 1-4 family mortgage loans, in 2004, the Company wasis contractually obligated to repurchase at recorded value any non-performing loans defined asor loans past due greater than 90 days.that do not meet underwriting requirements at recorded value. In accordance with the securitization agreement,sales agreements, there is no limitation to the maximum potential future payments or expiration of the Company's recourse obligationobligation. There were no material loan repurchases during the years ended on November 30, 2011.Repurchases and Charge-OffsDecember 31, 2014 or 2013.Recourse Loans(Dollar amounts in thousands) Years ended December 31, 2011 2010 2009 $ - $ 241 $ 767 - 174 73 In August 2011, the Bank was named2.0%. The Company terminated these forward commitments during 2013, resulting in a purported class action lawsuit filedgain of $7.8 million recorded as a component of noninterest income in the Circuit CourtConsolidated Statement of Cook County, Illinois on behalfIncome.certain of the Bank's customers who incurred overdraft fees. The lawsuit is based on the Bank's practices pursuant to debit card transactions, and alleges, among other things, that these practices have resulted in customers being unfairly assessed overdraft fees. The lawsuit seeks an unspecified amount of damages and other relief, including restitution.The Company believes that the complaint contains significant inaccuracies and factual misstatements and that the Bank has meritorious defenses. As a result, the Bank intends to vigorously defend itself against the allegations in the lawsuit. The Bank filed a motion to dismiss this claim in November 2011, and the plaintiff filed an amended complaint in February 2012.As of December 31, 2011,business, there were certain other legal proceedings pending against the Company and its subsidiaries inat December 31, 2014. While the ordinary courseoutcome of business. The Companyany legal proceeding is inherently uncertain, based on information currently available, the Company's management does not believeexpect that any liabilities individually or in the aggregate, potentially arising from any of these proceedings wouldpending legal matters will not have a material adverse effect on the consolidated financial condition of the Company as of December 31, 2011.21. VARIABLE INTEREST ENTITIES ("VIE"s)A VIE is a partnership, limited liability company, trust, or other legal entity that does not have sufficient equity to finance its activities without additional subordinated financial support from other parties, or whose investors lack one of three characteristics associated with owning a controlling financial interest. Those characteristics are: (i) the direct or indirect ability to make decisions about an entity's activities through voting rights or similar rights; (ii) the obligation to absorb the expected losses of an entity, if they occur; and (iii) the right to receive the expected residual returns of the entity, if they occur.GAAP requires VIEs to be consolidated by the party that has both (i) the ability to direct the VIE's activities that most impact the entity's economic performance and (ii) the exposure to a majority of the VIE's expected losses and/or residual returns (i.e., meets the definition of the primary beneficiary). The following table summarizes the VIEs in which the Company has an interest. December 31, 2011 December 31, 2010 Number
of
VIEs Carrying
Amount
of Assets Maximum
Exposure
to Loss Number
of
VIEs Carrying
Amount
of Assets Maximum
Exposure
to Loss $ 87,277 $ 87,277 $ 87,273 $ 87,273 506 506 506 506 1 $ 87,783 $ 87,783 1 $ 87,779 $ 87,779 1 $ 32 $ 31 1 $ 32 $ 31 12 $ 1,066 $ 1,011 12 $ 1,546 $ 1,222 The Company owns 100% of the common stock of FMCT, a business trust that was formed in November 2003 to issue trust-preferred securities to third party investors. FMCT issued preferred securities and common stock and used the proceeds to purchase junior subordinated debentures issued by the Company. FMCT's only assets as of December 31, 2011 and 2010 were the principal balance of the debentures and the related interest receivable. FMCT meets the definition of a VIE, but the Company is not the primary beneficiary of FMCT. Accordingly, FMCT is not consolidated in the Company's financial statements. The subordinated debentures issued by the Company to FMCT are included in senior and subordinated debt in the Company's Consolidated Statementsposition, results of Financial Condition.The Company holds an interest in one trust-preferred capital securities issuance. Although this investment may meet the definition of a VIE, the Company is not the primary beneficiary. The Company accounts for its interest in this investment as an available-for-sale security.The Company has limited partner interests in low-income housing tax credit partnerships and limited liability corporations, which were acquired at various times from 1997 to 2004. These entities meet the definition of a VIE. Since the Company is not the primary beneficiary of the entities, it accounts for its investment using the cost method. The carrying amount of the Company's investment in these partnerships is included in other assets in the Consolidated Statements of Financial Condition.The Company measures, monitors, and discloses certain of its assets and liabilities at fair value in accordance with fair value accounting guidance. is defined asrepresents the price that wouldamount expected to be received to sell an asset or paid to transfer a liability in theits principal or most advantageous market for the asset or liability in an orderly transaction between market participants at the measurement date. In accordance with fair value accounting guidance, the Company measures, records, and reports various types of assets and liabilities at fair value on either a recurring or non-recurring basis in the Consolidated Statements of Financial Condition. Those assets and liabilities are presented below in the sections titled "Assets and Liabilities Required to be Measured at Fair value is usedValue on a recurring basisRecurring Basis" and "Assets and Liabilities Required to account for trading securities, securities available-for-sale, mortgage servicing rights, derivativebe Measured at Fair Value on a Non-Recurring Basis."derivative liabilities. It is also used on an annual basisliabilities are not required to disclose thebe measured at fair value in the Consolidated Statements of pension plan assets. In addition,Financial Condition, but must be disclosed at fair value. Refer to the "Fair Value Measurements of Other Financial Instruments" section of this footnote. Any aggregation of the estimated fair values presented in this footnote does not represent the value is usedof the Company. a non-recurring basis (i) to apply lower-of-cost-or-market accounting to OREO, loans held-for-sale (excluding mortgage loans held-for-sale), and assets held-for-sale; (ii) to evaluate assets or liabilities for impairment, including collateral-dependent impaired loans, goodwill, and other intangible assets; and (iii) for disclosure purposes.Depending upon the nature of the asset or liability, the Company uses various valuation techniquesmethodologies and assumptions when estimating fair value. The Company maximizes the use of observable inputs and minimizes the use of unobservable inputs when measuringto estimate fair value. GAAP establishesprovides a three-tiered fair value hierarchy that prioritizesbased on the inputs used to measure fair value into three levels.value. The three levels of the fair value hierarchy areis defined as follows:••data for substantially the full term of the asset or liability.•The categorization These inputs require significant management judgment or estimation, some of an asset or liabilitywhich use model-based techniques and may be internally developed. is based on the lowest level of significant input that is significantused to themeasure fair value measurement. Transfers betweenvalue. Assets and liabilities may change levels ofwithin the fair value hierarchy due to market conditions or other circumstances. Those transfers are recognized on the actual date of circumstancethe event that resulted inprompted the transfer. There were no transfers of assets or liabilities between levels of the fair value hierarchy during 2010 or 2011. In 2009, there was a transfer of certain mortgage-backed securities from level 3 to level 2. The transfer out of level 3 represents securities that were manually priced using broker quotes (a level 3 input) at the beginning of the year, but valued by an external pricing service using level 2 inputs at the end of the year.periods presented.hierarchy level and fair value for each class of assets and liabilities required to be measured at fair value.Fair Value Measurements(Dollar amounts in thousands) December 31, 2011 Level 1 Level 2 Level 3 Total $ 1,565 $ - $ - $ 1,565 12,904 - - 12,904 14,469 - - 14,469 - 5,035 - 5,035 - 384,104 - 384,104 - 87,691 - 87,691 - 490,071 - 490,071 - - 13,394 13,394 - 30,014 - 30,014 - 1,616 - 1,616 41 1,040 - 1,081 41 999,571 13,394 1,013,006 - - 929 929 $ 14,510 $ 999,571 $ 14,323 $ 1,028,404 $ - $ 2,459 $ - $ 2,459 $ 17,970 $ - $ - $ 17,970 5,954 7,029 - 12,983 - 5,954 - 5,954 16,537 - - 16,537 - 9,546 - 9,546 $ 40,461 $ 22,529 $ - $ 62,990 $ - $ - $ 96,220 $ 96,220 - - 57,430 57,430 - - 4,200 4,200 - - 7,933 7,933 $ - $ - $ 165,783 $ 165,783 Refer to the following page for footnotes. December 31, 2010 Level 1 Level 2 Level 3 Total $ 1,196 $ - $ - $ 1,196 14,086 - - 14,086 15,282 - - 15,282 - 17,886 - 17,886 - 379,589 - 379,589 - 106,451 - 106,451 - 503,991 - 503,991 - - 14,858 14,858 - 32,345 - 32,345 - 1,683 - 1,683 38 961 - 999 38 1,042,906 14,858 1,057,802 - - 942 942 $ 15,320 $ 1,042,906 $ 15,800 $ 1,074,026 $ - $ 1,833 $ - $ 1,833 $ 8,995 $ - $ - $ 8,995 2,670 4,950 - 7,620 - 10,500 - 10,500 16,155 - - 16,155 - 11,443 - 11,443 $ 27,820 $ 26,893 $ - $ 54,713 $ - $ - $ 125,258 $ 125,258 - - 53,439 53,439 $ - $ - $ 178,697 $ 178,697 (1)Mortgage servicing rights are included in other assets, and derivative liabilities are included in other liabilitiesvalue on a recurring basis in the Consolidated Statements of Financial Condition.(2)Includes mutual funds, money market funds, cash, cash equivalents, and accrued interest.(3)RepresentsCondition by level in the carrying value of loans for which adjustments are based on the appraised or market-quoted value of the collateral, net of selling costs. Collateral-dependent loans for which no fair value adjustments were necessary during the year ended December 31, 2011 are not included.(4)Represents the estimated fair value, net of selling costs, based on appraised value and includes covered OREO.(5)Includedhierarchy.other assets in the Consolidated Statements of Financial Condition.(6)Included in premises, furniture, and equipment in the Consolidated Statements of Financial Condition.Valuation Methodology As of December 31, 2014 As of December 31, 2013 Level 1 Level 2 Level 3 Level 1 Level 2 Level 3 Assets: Trading securities: Money market funds $ 1,725 $ — $ — $ 1,847 $ — $ — Mutual funds 15,735 — — 15,470 — — Total trading securities 17,460 — — 17,317 — — Securities available-for-sale: U.S. Agency securities — 30,431 — — 500 — CMOs — 534,156 — — 475,768 — Other MBSs — 159,765 — �� 136,164 — Municipal securities — 423,820 — — 461,393 — CDOs — — 33,774 — — 18,309 Corporate debt securities — 1,802 — — 14,929 — Equity securities — 3,261 — 44 5,618 — — 1,153,235 33,774 44 1,094,372 18,309 — — 1,728 — — 1,893 — 9,018 — — 2,235 — Liabilities: $ — $ 11,980 $ — $ — $ 3,707 $ — Included in other assets in the Consolidated Statements of Financial Condition. Included in other liabilities in the Consolidated Statements of Financial Condition. describessections describe the specific valuation methodologiestechniques and inputs used by the Company forto measure financial assets and liabilities measured at fair value. – Tradingrepresentconsist of diversified investment securities held in a rabbigrantor trust and are invested in money market and mutual funds. The fair value of these money market and mutual funds is based on quoted market prices in active exchange markets and is classified in level 1 of the fair value hierarchy. All trading securities are reported at fair value with changes in the fair value included in other noninterest income. – Securitiesvalue of these securities isvalues are based on quoted prices in active markets or market prices for similar securities obtained from external pricing services or dealer market participants and isare classified in level 2 ofin the fair value hierarchy. TheQuarterly, the Company has evaluatedevaluates the methodologies used by its external pricing services to developestimate the fair valuesvalue of these securities to determine whether suchthe valuations are representative ofrepresent an exit price in the Company'sCompany’s principal markets. Examples of such securities measured at fair value U.S. agency securities, municipal bonds, CMOs, and other mortgage-backed securities.The following table provides inputs used in the evaluation of the Company's CMOs and other mortgage-backed securities. Collateralized
Mortgage
Obligations Other
Mortgage-Backed
Securities 4.5% 1.8% 2.2 3.9 2000 to 2010 2000 to 2010 5.7% 5.8% 8.3 9.2 The Company's hedge fund investment is also classified in level 2 of3 in the fair value hierarchy. The fair value is derived from monthly and annual financial statements provided by hedge fund management. The majority of the hedge fund's investment portfolio is held in securities that are freely tradable and are listed on national securities exchanges.In certain cases, where there is limited market activity or less transparent inputs to the valuation, securities are classified in level 3 of the fair value hierarchy. For instance, in the valuation of CDOs, the determination of fair value requires benchmarking to similar instruments or analyzing default and recovery rates. Due to the illiquidity in the secondary market for the Company's CDOs, the Company estimates the value of these securitiesfair values for each CDO using discounted cash flow analyses with the assistance of a structured credit valuation firm. The valuationThis methodology is based on a credit analysis and historical financial data for each of the issuers underlying the CDOs relies on historical financial data(the "Issuers"). These estimates are highly subjective and sensitive to several significant, unobservable inputs. The cash flows for the obligors of the underlying collateral. The valuation firm performs a credit analysis of each of the entities comprising the collateral underlying each CDO in order to estimate the entities' likelihood of default on their trust-preferred obligations. Cash flowsIssuer are modeled according to the contractual terms of the CDO,then discounted to their present values andusing LIBOR plus an adjustment to reflect the impact of market factors. Finally, the discounted cash flows for each Issuer are usedaggregatAs of December 31, 2014 Probability of prepayment 2.9% - 15.2% Probability of default 18.4% - 57.7% Loss given default 83.8% - 97.0% Probability of deferral cure 6.7% - 75.0% individual CDO. CDO associated with that Issuer.discount rates used inlikelihood that an Issuer who is currently deferring payment on the discounted cash flow analyses range from LIBOR plus 1,300 to LIBOR plus 1,500 basis points depending uponsecurities will pay all deferred amounts and remain current thereafter is based on an analysis of the specific CDOIssuer's asset quality, leverage ratios, and reflects the higher risk inherent in these securities given the current market environment. other measures of financial viability.the assumptions used to valueany of these securitieskey inputs could result in a significantly higher or lower estimate of fair value measurement.Tablefor each CDO. The timing of ContentsLevel 3 Securities Available-for-Sale
CDOs Years Ended December 31, 2011 2010 2009 Collateralized
Debt
Obligations Collateralized
Debt
Obligations Mortgage-
Backed
Securities Collateralized
Debt
Obligations Total $ 14,858 $ 11,728 $ 16,632 $ 42,086 $ 58,718 (936 ) (4,664 ) - (24,509 ) (24,509 ) (528 ) 7,794 566 (5,834 ) (5,268 ) - - (1,590 ) (22 ) (1,612 ) - - (2 ) 7 5 - - (15,606 ) - (15,606 ) $ 13,394 $ 14,858 $ - $ 11,728 $ 11,728 $ (936 ) $ (4,664 ) $ - $ (24,509 ) $ (24,509 ) Years Ended December 31, 2014 2013 2012 Beginning balance $ 18,309 $ 12,129 $ 13,394 Additions 6,549 — — Total income (loss): — — (2,226 ) 13,495 6,180 961 (4,579 ) — — Ending balance $ 33,774 $ 18,309 $ 12,129 $ — $ — $ (2,226 ) (1)Included in securities gains, net in the Consolidated Statements of Income and related to securities still held at the end of the year.(2)The transfer out of level 3 represents securities that were manually priced using broker quotes (a level 3 input) at the beginning of the year, but valued by an external pricing service using level 2 inputs at the end of the year.Included in net securities gains (losses) in the Consolidated Statements of Income and related to securities still held at the end of the period. Included in unrealized holding gains (losses) in the Consolidated Statements of Comprehensive Income. During the year ended December 31, 2014, one CDO with a carrying value of $1.3 million and four CDOs totaling $2.9 million, which were acquired in the Great Lakes transaction, were sold. In addition, one CDO with a carrying value of zero was sold during the year ended December 31, 2013. – In 2009, the Company securitized $25.7 million of 1-4 family mortgages, converting the loans into mortgage-backed securities issued through the Federal National Mortgage Association. retained servicing responsibilities for the mortgages supporting these securitiesservices mortgage loans owned by third parties and collects servicing fees equal to a percentage of the outstanding principal balance of the loans being serviced. The Company also services loans from prior securitizations and loans for which theMortgage servicing was acquired as part of a 2006 bank acquisition. As of December 31, 2011, the Company had no recourse for credit losses on loans being serviced.The Company records its mortgage servicing rights are recorded at fair value and includes themare included in other assets in the Consolidated Statements of Financial Condition. Mortgage servicing rights do not trade in an active market with readily observable prices. Accordingly,Therefore, the Company determines the fair value of mortgage servicing rights by estimating the present value of theexpected future cash flows associated with the mortgage loans being serviced. Key economic assumptions used in measuring the fair value of mortgage servicing rights at December 31, 20112014 included prepayment speeds, maturities, and discount rates. While market-based data is used to determine the assumptions, the Company incorporates its own estimates of the assumptions market participants would use in determining the fair value of mortgage servicing rights, which results in a level 3 classification in the fair value hierarchy. Changes inassumptions used tocarrying value theof mortgage servicing rights could resultfor the three years ended December 31, 2014 is presented in a higher or lower fair value measurement.the following table. Years Ended December 31, 2011 2010 2009 $ 942 $ 1,238 $ 1,461 - - 237 179 (28 ) (145 ) (192 ) (268 ) (315 ) $ 929 $ 942 $ 1,238 12.4% 17.3% 20.1% 11.6% 11.5% 11.4% 199.7 202.2 210.7 $ 235 $ 301 $ 324 $ 78,594 $ 114,720 $ 123,842 Years Ended December 31, 2014 2013 2012 Beginning balance $ 1,893 $ 985 $ 929 New mortgage servicing rights 315 1,060 347 Changes in valuation inputs and assumptions (480 ) 63 (72 ) — (215 ) (219 ) Ending balance $ 1,728 $ 1,893 $ 985 $ 520 $ 418 $ 209 220,372 214,458 109,730 (1)Included in other service charges, commissions, and fees in the Consolidated Statements of Income and relate to assets still held at the end of the year.(2)Principally reflects changes in prepayment speed assumptions.(3)Primarily represents changes in expected cash flows over time due to payoffs and paydowns.(4)These loans are serviced for and owned by third parties and are not included in the Company's Consolidated Statements of Financial Condition.Included in mortgage banking income in the Consolidated Statements of Income and relate to assets still held at the end of the year. Primarily represents changes in expected future cash flows over time due to payoffs and paydowns. – entered into by the Companyand derivative transactions with commercial customers. These derivative transactions are executed in the dealer market, and pricing is based on market quotes obtained from the counterparty that transacted the derivative contract.counterparties. The market quotes were developed by the counterparty using market observable inputs, which primarily include LIBOR for swaps.LIBOR. Therefore, derivatives are classified in level 2 of the fair value hierarchy. For its derivative assets and liabilities, the Company also considers non-performance risk, including the likelihood of default by itself and its counterparties, when evaluating whether the market quotes from the counterpartycounterparties are representative of an exit price. The Company has a policy of executing derivative transactions only with counterparties above a certain credit rating. Credit risk is also mitigated through the pledging of collateral when certain thresholds are reached. – Mutual As of December 31, 2014 As of December 31, 2013 Level 1 Level 2 Total Level 1 Level 2 Total Pension plan assets: $ 25,499 $ — $ 25,499 $ 23,896 $ — $ 23,896 7,879 8,063 15,942 7,261 8,930 16,191 Corporate bonds — 6,599 6,599 — 5,984 5,984 Common stocks 14,149 — 14,149 17,261 — 17,261 Common trust funds — 10,004 10,004 — 11,038 11,038 Total pension plan assets $ 47,527 $ 24,666 $ 72,193 $ 48,418 $ 25,952 $ 74,370 Includes mutual funds, money market funds, cash, cash equivalents, and accrued interest. Treasury securities,government agency, and U.S. government agencyTreasury securities are valued at quoted prices from independent sources that are based on observable market trades or observable prices for similar bonds where a price for the identical bond is not observable and, therefore, are classified asin level 2 of the fair value hierarchy. Common trust funds are valued at quoted redemption values on the last business day of the Pension Plan's year end and are classified asin level 2 of the fair value hierarchy. There were no Pension Plan assets classified in level 3 of the fair value hierarchy. As of December 31, 2014 As of December 31, 2013 Level 1 Level 2 Level 3 Level 1 Level 2 Level 3 $ — $ — $ 23,799 $ — $ — $ 13,103 — — 22,760 — — 13,347 — — 9,459 — — 4,739 — — 2,026 — — 4,027 Includes impaired loans with charge-offs and impaired loans with a specific reserve during the periods presented. Includes OREO and covered OREO with fair value adjustments subsequent to initial transfer that occurred during the periods presented. Included in other assets in the Consolidated Statements of Financial Condition. Included in premises, furniture, and equipment in the Consolidated Statements of Financial Condition. – Theimpaired loans is disclosed in Note 6, "Past Due Loans, Allowance for Credit Losses,the loan and Impaired Loans." The Company does not record loans at fair value on a recurring basis. However, from time to time, fair value adjustments are recorded in the form of specific reserves or charge-offs on these loans to reflect (i) specific reserves or partial charge-offs that are based on the current appraised value of the underlying collateral or (ii) the full charge-off of the loan's carrying value.collateral. The fair value adjustmentsvalues of collateral-dependent impaired loans are primarily determined by current appraised values of the underlying collateral, net of estimated selling costs. For collateral-dependent impaired loans, newcollateral. Based on the age and/or type, appraisals are generally required every annually for construction loans and every two years for all other commercial real estate loans. In limited circumstances, such as cases of outdated appraisals, the appraised values may be reduced by aadjusted in the range of 0% - 15%. In certain percentage depending upon the specific facts and circumstances, orcases, an internal valuation may be used when the underlying collateral is located in areas where comparable sales data is limited outdated, or unavailable. Accordingly, collateral-dependent impaired loans are classified in level 3 of the fair value hierarchy.Other Real Estate Owned – OREO consists of properties acquired through foreclosure in partial or total satisfaction of certain loans. Upon initial transfer into OREO, a current appraisal is required (generally less than six months old for residential and commercial land and less than one year old for all other commercial property). Properties are recorded at the lower of the recorded investment in theproperties previously served as collateral or the fair value which representsis greater than the recorded investment are not measured at fair value in the Consolidated Statements of Financial Condition and are not included in this disclosure.properties, less estimated selling costs. Fair value assumes an orderly disposition except where a specific disposition strategy is expected, which would require the use of other appraised values, such as forced liquidation or as-completed/stabilized values.thea current appraised valueappraisal may not be available or may not represent an accurate measurement of the property's current fair value due to imprecision, subjectivity, outdated market information or other factors. In these cases, the fair value is determined based on the lower of the (i) currentmost recent appraised value, (ii) internal valuation,broker price opinion, (iii) current listing price, or (iv) signed sales contract. Any appraisal that is greater than twelve months old is adjusted to account for estimated declines in the real estate market until an updated appraisal can be obtained. Given these valuation methods, OREO is classified in level 3 of the fair value hierarchy. Any write-downs incarrying value of a property at the time of initial transfer into OREO are charged against the allowance for credit losses.Subsequentintent to the initial transfer, periodic impairment analyses of OREO are performed,sell, and new appraisals are obtained annually unless circumstances warrant an earlier appraisal. Periodic impairment analyses take into consideration current real estate market trends and adjustments to listing prices. Any write-downs of the properties subsequent to initial transfer, as well as gains or losses on disposition and income or expense from the operations of OREO, are recognized in operating results in the period in which they occur.Loans Held-for-Sale – The loans held-for-sale consist of one office, retail, and industrial loan and one other commercial real estate loan. During the last halfloan as of 2011, the Company determined that theboth December 31, 2014 and 2013. These loans met the held-for-sale criteria andwere transferred them intoto the held-for-sale category at the lower of the recorded investment in the loan or the estimated fair value, less costs to sell. The fair value was determined by the sales contract price. Accordingly, the loans held-for-saleprice and, accordingly, are classified in level 3 of the fair value hierarchy. – In second quarter 2011,Company entered into an agreement to sell property held for expansion and classified itheld-for-sale category at the lower of their fair value as held-for-sale.determined by a current appraisal or their recorded investment. Based on the sales contract price, the Company wrote-down the book value of the property andthese valuation methods, they are classified it in level 3 of the fair value hierarchy. The sale of the property is expected to close in early 2012.Fair Value Measurements Recorded forAssets Measured at Fair Value on a Non-Recurring Basis(Dollar amounts in thousands) Year Ended December 31, 2011 Charged to
Allowance for
Loan Losses Charged to
Earnings $ 88,017 $ - - 3,785 2,191 - - 671 – Goodwill represents the excess of purchase price over the fair value of net assets acquired using the purchase method of accounting. Other intangible assets represent purchased assets that also lack physical substance but can be distinguished from goodwill because of contractual or other legal rights or because the asset is capable of being sold or exchanged either on its own or in combination with a related contract, asset, or liability.judgment. Goodwill is tested at least annually for impairment or more often if events or circumstances between annual tests indicate that there may be impairment.8,9, "Goodwill and Other Intangible Assets," the annual impairment tests indicated no impairment existed.subjected to nonrecurring fair value adjustments as a level 3 nonrecurringnon-recurring fair value measurement. Additional information regarding goodwill, other intangible assets, and impairment policies can be found in Note 1, "Summary of Significant Accounting Policies," and Note 8,9, "Goodwill and Other Intangible Assets."
Financial Instruments Not Required to be Measured at Fair ValueTableContentsDisclosureMeasurements of Other AssetsFinancial Instruments As of December 31, 2014 As of December 31, 2013 Fair Value Hierarchy
Level Carrying
Amount Fair Value Carrying
Amount Fair Value Assets: Cash and due from banks 1 $ 117,315 $ 117,315 $ 110,417 $ 110,417 Interest-bearing deposits in other banks 2 488,947 488,947 476,824 476,824 Securities held-to-maturity 2 26,555 27,670 44,322 43,387 FHLB and FRB stock 2 37,558 37,558 35,161 35,161 Net loans 3 6,664,159 6,532,622 5,628,855 5,544,146 FDIC indemnification asset 3 8,452 3,626 16,585 7,829 Investment in BOLI 3 206,498 206,498 193,167 193,167 Accrued interest receivable 3 27,506 27,506 25,735 25,735 Other interest-earning assets 3 3,799 3,904 6,550 6,809 Liabilities: Deposits 2 $ 7,887,758 $ 7,879,413 $ 6,766,101 $ 6,765,404 Borrowed funds 2 137,994 137,994 224,342 226,839 Senior and subordinated debt 1 200,869 199,226 190,932 201,147 Accrued interest payable 2 2,324 2,324 2,400 2,400 LiabilitiesGAAP requires disclosure ofassumptions to determine the estimated fair values of certainthe financial instruments both assets and liabilities, on and off-balance sheet, for which it is practical to estimatein the fair value. Since the estimated fair values provided herein exclude disclosure of the fair value of certain other financial instruments and all non-financial instruments, any aggregation of the estimated fair value amounts presented would not represent the underlying value of the Company. Examples of non-financial instruments having significant value include the future earnings potential of significant customer relationships and the value of the Company's wealth management operations and other fee-generating businesses. In addition, other significant assets including premises, furniture, and equipment and goodwill and other intangible assets are not considered financial instruments and, therefore, have not been valued.Various methodologies and assumptions have been utilized in management's determination of the estimated fair value of the Company's financial instruments, which are detailed below.table above. The fair value estimates are made at a discrete point in time based on relevant market information. Since no market exists for a significant portion of these financial instruments, fair value estimates are based oninformation and consider management's judgments regarding future expected economic conditions, loss experience, and specific risk characteristics of the financial instruments. These estimates are subjective, involve uncertainties, and cannot be determined with precision. Changes in assumptions could significantly affect the estimates.In addition to the valuation methodology explained above for financial instruments recorded at fair value, the following methods and assumptions were used in estimating the fair value of financial instruments that are carried at cost in the Consolidated Statements of Financial Condition.federal funds sold and other short-term investments, mortgages held-for-sale, accrued interest receivable, and accrued interest payable.based on quoted market prices or dealer quotes. If a quoted market price is not available,estimated using the present value of expected future cash flows of the remaining maturities of the securities.estimated using quoted market pricesnon-marketable.similar securities.loan and covered loan losses.Loans, net of Allowance for Loan Losses – The fair value of loans is estimated using the present value techniques by discountingof the expected future cash flows of the remaining maturities of the loans. Prepayment assumptions were considered based onthat consider the Company’s historical experience and current economic and lending conditions.conditions were included. The discount rate was based on the LIBOR yield curve with rate adjustments for liquidity and credit risk.Covered Loans (includedrisk inherent in Loans, net of Allowance for Loan Losses)the loans. – based on certain input assumptions. The market interest rate (discount rate)which is derived from LIBOR swap rates over the expected weighted-average life of thethose loans. The expected future cash flows are based onderived from the contractual terms of the covered loans, net of any projected credit losses. For valuation purposes, these loans are placed into groups with similar characteristics and defaultrisk factors, where appropriate. The timing and amount of credit losses for each group are estimated using historical default and loss given default assumptions. expected to be received from the FDIC. TheseThe expected future cash flows are estimated by multiplying expectedanticipated losses on covered loans and covered OREO by the reimbursement rates set forth in the FDIC Agreements.Bank-Owned Life InsuranceBOLI – The fair value of investments in bank-owned life insurance isBOLI approximates the carrying amount as both are based on each policy's respective CSV.CSV, which is the amount the Company would receive from liquidation of these investments. The CSV is derived from monthly reports provided by the managing brokers and is determined using the Company's initial insurance premium and earnings of the underlying assets, offset by management fees.Deposit LiabilitiesOther Interest-Earning Assets – The fair value of other interest-earning assets is estimated using the present value of the expected future cash flows of the remaining maturities of the assets. by definition, equal to the amount payable on demand at the reporting date (i.e., their carrying amounts). The fair value for fixed-rate time deposits was estimated using present value techniques by discounting the expected future cash flows discounted based on the LIBOR yield curve, plus or minus the spread associated with current pricing. repurchase agreements and FHLB advances is estimated by discounting the agreements based on maturities using the rates currently offered for repurchase agreementsFHLB advances of similar remaining maturities.maturities adjusted for prepayment penalties that would be incurred if the borrowings were paid off on the measurement date. The carrying amounts of federal funds purchased, federal term auction facilities, and other borrowed fundssecurities sold under agreements to repurchase approximate their fair value due to their short-term nature.availablequoted market quotes.prices.StandbyCommitments to Extend Credit and Letters of Credit – The fair value of standby letters of credit represent deferred fees arising from the related off-balance sheet financial instruments. These deferred fees approximateCompany estimated the fair value of these instruments and are based on several factors, including the remaining terms of the agreement and the credit standing of the customer.Commitments – The Company has estimated the fair value oflending commitments outstanding to be immaterial based on the following factors: (i) the limited interest rate exposure posed byof the commitments outstanding due to their variable nature, (ii) the general short-term nature of the commitment periods, entered into, (iii) termination clauses provided in the agreements, and (iv) the market rate of fees charged.Financial Instruments(Dollar amounts in thousands) December 31, 2011 2010 Carrying
Amount Estimated
Fair Value Carrying
Amount Estimated
Fair Value $ 123,354 $ 123,354 $ 102,495 $ 102,495 518,176 518,176 483,281 483,281 4,200 4,200 236 236 14,469 14,469 15,282 15,282 1,013,006 1,013,006 1,057,802 1,057,802 60,458 61,477 81,320 82,525 5,229,153 5,224,254 5,329,717 5,323,830 65,609 65,609 95,899 95,899 29,826 29,826 29,953 29,953 206,235 206,235 197,644 197,644 $ 6,479,175 $ 6,479,309 $ 6,511,476 $ 6,512,626 205,371 208,728 303,974 306,703 252,153 237,393 137,744 122,261 4,019 4,019 4,557 4,557 2,459 2,459 1,833 1,833 668 668 696 696 SUPPLEMENTARY CASH FLOW INFORMATIONSupplemental Disclosures to the Consolidated Statements of Cash Flows(Dollar amounts in thousands) Years Ended December 31, 2011 2010 2009 $ (12,388 ) $ (7,676 ) $ (1,378 ) 40,429 50,069 95,661 746 742 549 - 5,120 - - 2,744 - 12,320 - - 52,249 76,804 79,430 - - 25,742 - 19,088 - 841 9,455 6,860 - - 57,966 24. RELATED PARTY TRANSACTIONShas mademakes loans and hadhas transactions with certain of its directors and executive officers. However, all suchAll of these loans and transactions were made in the ordinary course of business on substantially the same terms, including interest rates and collateral requirements, as those prevailing at the time for comparable transactions with other unrelated persons and did not involve more than the normal risk of collectability or present other unfavorable features. The SecuritiesFor the years ended December 31, 2014 and Exchange Commission has determined that disclosure of borrowings by2013, loans to directors and executive officers totaled $31.8 million and certain of their related interests should be made if the loans are greater than 5% of stockholders' equity in the aggregate. These loans totaled $4.0$27.6 million, at December 31, 2011 and $927,000 at December 31, 2010respectively, and were not greater than 5% of stockholders' equity at either December 31, 2011 or 2010.
equity.25. December 31, As of December 31, 2011 2010 2014 2013 $ 47,101 $ 51,442 $ 43,546 $ 13,071 1,135,930 1,173,342 1,211,244 1,120,745 10,358 10,358 13,625 8,943 45,592 35,582 79,468 77,948 $ 1,238,981 $ 1,270,724 $ 1,347,883 $ 1,220,707 $ 252,153 $ 137,744 $ 200,869 $ 190,932 24,241 20,935 46,239 28,333 962,587 1,112,045 1,100,775 1,001,442 $ 1,238,981 $ 1,270,724 $ 1,347,883 $ 1,220,707 Years ended December 31, Years ended December 31, 2011 2010 2009 2014 2013 2012 $ 104,000 $ - $ 750 $ 56,881 $ 54,200 $ 38,000 259 518 1,596 1,502 1,067 619 - - 15,258 Net losses on early extinguishment of debt — (1,034 ) (558 ) (189 ) 1,950 3,157 6,451 37,485 1,982 104,070 2,468 20,761 64,834 91,718 40,043 9,892 9,124 13,592 12,062 13,607 14,840 10,865 11,056 8,308 12,589 15,198 13,232 4,756 6,178 4,715 5,867 5,792 5,740 25,513 26,358 26,615 30,518 34,597 33,812 78,557 (23,890 ) (5,854 ) 10,414 9,388 2,617 88,971 (14,502 ) (3,237 ) (52,408 ) 4,818 (22,513 ) 34,316 57,121 6,231 Income tax benefit (expense) 8,710 (962 ) 13,070 Income before undistributed income (loss) of subsidiaries 43,026 56,159 19,301 Equity in undistributed income (loss) of subsidiaries 26,280 23,147 (40,355 ) 36,563 (9,684 ) (25,750 ) 69,306 79,306 (21,054 ) (10,776 ) (10,299 ) (10,265 ) (350 ) 266 464 (836 ) (1,107 ) 306 $ 25,437 $ (19,717 ) $ (35,551 ) $ 68,470 $ 78,199 $ (20,748 ) Years ended December 31, Years ended December 31, 2011 2010 2009 2014 2013 2012 $ 36,563 $ (9,684 ) $ (25,750 ) $ 69,306 $ 79,306 $ (21,054 ) 52,408 (4,818 ) 22,513 Equity in undistributed (income) loss of subsidiaries (26,280 ) (23,147 ) 40,355 9 10 8 6 7 6 - 110 - - - (15,258 ) Net gains on sales of securities (5,702 ) (34,119 ) — Net losses on early extinguishment of debt — 1,034 558 6,362 5,638 3,516 5,926 5,903 6,004 (179 ) 350 581 (106 ) (10 ) 170 (10,290 ) 4,053 (10,370 ) Net decrease (increase) in other assets 4,599 1,084 (6,207 ) 4,618 (263 ) (9,850 ) 14,063 (1,624 ) 1,366 89,491 (4,604 ) (34,610 ) Net cash provided by operating activities 61,812 28,434 21,198 - - (1,050 ) — (46,532 ) (5,811 ) 14 16 800 8,540 43,329 — 103 (16 ) (96 ) (15 ) — — (18 ) - (100,000 ) - (363 ) (750 ) - - (168,088 ) - Cash received from acquisitions, net of cash paid (15,809 ) — — (262 ) (268,918 ) (265 ) (7,269 ) (3,203 ) (5,829 ) 114,387 - (19,400 ) (193,910 ) - - - 196,035 - Payments for retirement of subordinated debt — (24,094 ) (37,033 ) Treasury stock activity 369 — — (12,838 ) (12,422 ) (12,423 ) (22,568 ) (7,508 ) (2,977 ) (1,256 ) (401 ) (379 ) Restricted stock activity (2,781 ) (1,607 ) (1,469 ) 47 (189 ) (177 ) 912 79 (21 ) (93,570 ) 183,023 (32,379 ) (4,341 ) (90,499 ) (67,254 ) Net cash used in financing activities (24,068 ) (33,130 ) (41,500 ) Net increase (decrease) in cash and cash equivalents 30,475 (7,899 ) (26,131 ) 51,442 141,941 209,195 13,071 20,970 47,101 $ 47,101 $ 51,442 $ 141,941 $ 43,546 $ 13,071 $ 20,970 Supplemental Disclosures of Cash Flow Information: Common stock issued for acquisitions, net of issuance costs $ 38,300 $ — $ — (1)These assets were transferred to Catalyst in the form of a capital injection.26. SUBSEQUENT EVENTSThe Company has evaluated the impact of events that have occurred subsequent to December 31, 2011 through the date its consolidated financial statements were issued. Based on the evaluation, management does not believe any subsequent events have occurred that would require further disclosure or adjustment to the consolidated financial statements.20112014 that have materially affected, or are reasonably likely to materially affect, the Company's internal control over financial reporting.overOver Financial ReportingSecurities Exchange Act of 1934.Act. The Company's internal control over financial reporting is designed to provide reasonable assurance to the Company's management and Board of Directors regarding the preparation and fair presentation of published financial statements.2011.2014. In making this assessment, management used the criteria set forth in "Internal Control – Integrated Framework" issued by the Committee of Sponsoring Organizations of the Treadway Commission.Commission (2013 framework) (the COSO criteria). Based on this assessment, management has determined that the Company's internal control over financial reporting as of December 31, 20112014 is effective based on the specified criteria.2011.2014. The report, which expresses an unqualified opinion on the Company's internal control over financial reporting as of December 31, 2011,2014, is included in this Item under the heading "Attestation Report of Independent Registered Public Accounting Firm."'s’s (the “Company”) internal control over financial reporting as of December 31, 2011,2014, based on criteria established in Internal Control – IntegratedControl-Integrated Framework issued by the Committee of Sponsoring Organizations of the Treadway Commission (2013 framework) (the COSO criteria). First Midwest Bancorp Inc.'sThe Company’s management is responsible for maintaining effective internal control over financial reporting, and for its assessment of the effectiveness of internal control over financial reporting included in the accompanying Management'sManagement’s Report on Internal Control overOver Financial Reporting. Our responsibility is to express an opinion on the company'sCompany’s internal control over financial reporting based on our audit.company'scompany’s internal control over financial reporting is a process designed to provide reasonable assurance regarding the reliability of financial reporting and the preparation of financial statements for external purposes in accordance with generally accepted accounting principles. A company'scompany’s internal control over financial reporting includes those policies and procedures that (1) pertain to the maintenance of records that, in reasonable detail, accurately and fairly reflect the transactions and dispositions of the assets of the company; (2) provide reasonable assurance that transactions are recorded as necessary to permit preparation of financial statements in accordance with generally accepted accounting principles, and that receipts and expenditures of the company are being made only in accordance with authorizations of management and directors of the company; and (3) provide reasonable assurance regarding prevention or timely detection of unauthorized acquisition, use, or disposition of the company'scompany’s assets that could have a material effect on the financial statements.First Midwest Bancorp, Inc.the Company maintained in all material respects, effective internal control over financial reporting as of December 31, 2011,2014, based on the COSO criteria.First Midwest Bancorp, Inc.the Company as of December 31, 20112014 and 2010,2013, and the related consolidated statements of income, comprehensive income, (loss), changes in stockholders'stockholders’ equity, and cash flows for each of the three years in the period ended December 31, 20112014 of First Midwest Bancorp, Inc.the Company and our report dated February 28, 2012March 2, 2015 expressed an unqualified opinion thereon.![]()
February 28, 2012Name (Age) Position or Employment for Past Five Years Michael L. Scudder (51)(54) President and Chief Executive Officer of the Company since 20082008; Chairman since 2011 and Vice Chairman from 2010 to 2011 of the Bank's Board of Directors andDirectors; Chief Executive Office of the Bank since 2011. Previously, since 2010, Mr. Scudder served as the Vice Chairman of the Bank's Board of Directors and since 2007, Mr. Scudder served as the Company's President and Chief Operating Officer as well as Group Executive Vice President of the Bank, before which he served as the Company's Executive Vice President and Chief Financial Officer of the Company and Group Executive Vice President and Chief Financial Officer of the Bank.2002Kent S. Belasco (60)Executive Vice President and Chief Information and Operations Officer of the Bank since 2011; prior thereto, Executive Vice President2010 and Chief Information Officer of the Bank.2004Victor P. Carapella (62)Executive Vice President and Director of Commercial Banking since 2011; prior thereto, Executive Vice President and Commercial Banking Group Manager of the Bank since 2008; prior thereto, Sales Manager.2008Paul F. Clemens (59)Executive Vice President and Chief Financial Officer of the Company and the Bank since 2008; prior thereto, Senior Vice President, Chief Accounting Officer, and Principal Accounting Officer of the Company.2006Robert P. Diedrich (48)Executive Vice President and Director of Wealth Management of the Bank since 2011; prior thereto, President, of the Wealth Management Division of First Midwest Bank.2004James P. Hotchkiss (55)Executive Vice President and Treasurer of the Company and the Bank.2004Michael J. Kozak (60)Executive Vice President and Chief Credit Officer of the Bank.2004Cynthia A. Lance (43)Executive Vice President and Corporate Secretary since 2007; prior thereto, Assistant General Counsel of CBOT Holdings, Inc. and NYSE Group, Inc. and corporate attorney for Sonnenschein, Nath & Rosenthal.2007Name (Age)Position or Employment for Past Five YearsExecutiveOfficerSinceKevin L. Moffitt (52)Executive Vice President and Chief Risk Officer of the Company and the Bank since 2011; prior thereto, Executive Vice President and Audit Services Director of the Company since 2009; prior thereto, Vice President and Head of Internal Audit at Nuveen Investments, Inc. since 2007; and prior thereto, Group Senior Vice President and Compliance Regional Chief Operating Officer of ABN AMRO North America, Inc.and various other senior management positions with the Bank.20092002
Mark G. Sander (53)(56)
President and Chief Operating Officer of the Bank and Senior Executive Vice President and Chief Operating Officer of the Company since 2011; prior thereto, Executive Vice President and head of Commercial Banking for Associated Banc-Corp and its subsidiary, Associated Bank, since 2009;from 2009 to 2011, and prior thereto, leader of Commercial Banking for the Midwest Regionbefore that in numerous leadership positions in commercial banking at Bank of America since 2007.and LaSalle Bank.
2011JanetKent S. Belasco (64)Executive Vice President and Chief Information and Operations Officer of the Bank since 2011; prior thereto, Executive Vice President and Chief Information Officer of the Bank. 2004 Nicholas J. Chulos (55) Executive Vice President, Corporate Secretary, and General Counsel since 2012; prior thereto, Partner of Krieg DeVault, LLP. 2012 Paul F. Clemens (62) Executive Vice President and Chief Financial Officer of the Company and the Bank. 2006 Robert P. Diedrich (51) Executive Vice President and Director of Wealth Management of the Bank since 2011; prior thereto, President of the Wealth Management Division of First Midwest Bank. 2004 Caryn J. Guinta (64) Executive Vice President and Director of Employee Resources of the Bank since 2005. 2013 James P. Hotchkiss (58) Executive Vice President and Treasurer of the Company and the Bank since 2004. 2004 Kevin L. Moffitt (55) Executive Vice President and Chief Risk Officer of the Company and the Bank since 2011; prior thereto, Executive Vice President and Audit Services Director of the Company since 2009. 2009 Thomas M. Viano (56)Prame (45)
Executive Vice President and Director of Retail Sales and ServicesBanking of the Bank since 2011;2012; prior thereto, Group President, Retail Banking of the Bank.2002Stephanie R. Wise (44)
Executive Vice President, DirectorSales and Service at RBS/Citizen's Bank.2012 Angela L. Putnam (36) Senior Vice President of Strategic Planningthe Company and ExecutionBank and Chief Accounting Officer of the Bank since 2011;2014; prior thereto. thereto, Vice President and Financial Reporting Manager for the Company since 2013; prior thereto, Director in the Assurance Services practice of McGladrey LLP.2015 Michael C. Spitler (61) Executive Vice President Business and Institutional Services.Chief Credit Officer of the Bank since 2013; prior thereto, Executive Vice President and Commercial Chief Credit Officer for Busey Bank since 2011; and prior thereto, Senior Vice President and Managing Senior Credit Officer for Fifth Third Bank, Chicago affiliate, West Region and Structured Finance Group.2004
2013Information relatingour directors, including our audit committee and audit committee financial experts and the procedures by which stockholders can recommend director nominees,this item will be contained in ourthe Company’s definitive Proxy Statement for our 2012relating to its 2015 Annual Meeting of Stockholders to be held on May 16, 2012, which will be filed within 120 days of the end of our fiscal year ended December 31, 2011 (the "2012 Proxy Statement")20, 2015 and is incorporated herein by reference.Exhibit 3.2 contains the Company's Revised By-Laws, which were modified February 22, 2012, reflecting the addition of Section 6.11, which states the Company's continuing obligations with respect to director indemnification.Informationour executive officer and director compensation willits 2015 Annual Meeting of Stockholders to be in the 2012 Proxy Statementheld on May 20, 2015 and is incorporated herein by reference.Informationsecurity ownershipits 2015 Annual Meeting of certain beneficial owners of Common Stock and information relatingStockholders to the security ownership of our management will be in the 2012 Proxy Statementheld on May 20, 2015 and is incorporated herein by reference.2011,2014, relating to equity compensation plans of the Company pursuant to which options, restricted stock, restricted stock units, performance shares, or other rights to acquire shares may be granted from time to time. Equity Compensation Plan Information Equity Compensation Plan Information Equity Compensation Plan Category Number of securities to be issued upon exercise of outstanding options, warrants, and rights
(a) Weighted-average exercise price of outstanding options, warrants, and rights
(b) Number of securities remaining available for future issuance under equity compensation plans (excluding securities reflected in column (a))
(c) 1,973,915 $ 32.25 2,572,795 1,153,213 $ 32.93 2,312,631 5,188 17.73 - 5,337 17.67 — 1,979,103 $ 32.21 2,572,795 1,158,550 32.86 2,312,631 (1)Includes all outstanding options and awards under the Company's Omnibus Stock and Incentive Plan and the Non-Employee Directors' Stock Plan (the "Plans"). Additional information and details about the Plans are also disclosed in Notes 1 and 17 of "Notes to Consolidated Financial Statements" in Item 8 of this Form 10-K.(2)Represents shares underlying deferred stock units credited under the Company's Nonqualified Retirement Plan ("NQ Plan"), payable on a one-for-one basis in shares of Common Stock.Includes all outstanding options and restricted stock, restricted stock unit, and performance share awards under the Company's Omnibus Stock and Incentive Plan and the Non-Employee Directors' Stock Plan (the "Plans"). Additional information and details about the Plans are also disclosed in Notes 1 and 17 of "Notes to the Consolidated Financial Statements" in Item 8 of this Form 10-K. Restricted stock, restricted stock units, and performance shares that do not vest or are not earned, as well as the shares underlying options that expire unexercised, are added to the number of securities available for future issuance. Represents shares underlying deferred stock units credited under the Company's Nonqualified Retirement Plan ("NQ Plan"), payable on a one-for-one basis in shares of common stock. has elected to defer. Participant accounts are deemed to be invested in separate investment accounts under the NQ Plan with similar investment alternatives as those available under the Company's tax-qualified savings and profit sharing plan, including an investment account deemed invested in shares of Common Stock.common stock. The accounts are adjusted to reflect the investment return related to such deemed investments. Except for the 5,1885,337 shares set forth in the table above, all amounts credited under the NQ Plan are paid in cash.Information regarding certain relationships and related transactions and director independence2012Company’s definitive Proxy Statement relating to its 2015 Annual Meeting of Stockholders to be held on May 20, 2015 and is incorporated herein by reference.Information regarding principal accountant fees and services2012Company's definitive Proxy Statement relating to its 2015 Annual Meeting of Stockholders to be held on May 20, 2015 and is incorporated herein by reference.(a)(1) Financial Statements(a) 20112014 and 2010.2013.2011, 2010,2014, 2013, and 2009.2011, 2010,2014, 2013, and 2009.2011, 2010,2014, 2013, and 2009.2011, 2010,2014, 2013, and 2009.(a)(2) Financial Statement Schedules(a) (a)(3) Exhibits(a) ExhibitNumberDescription of Documents Exhibit Number Description of Documents 3.1 Restated Certificate of Incorporation of First Midwest Bancorp, Inc.the Company is incorporated herein incorporated by reference to Exhibit 3.1 to the Company's Annual Report on Form 10-K filed with the Securities and Exchange Commission on February 27, 2009.3.2 Certificate of Amendment of Restated By-lawsCertificate of First Midwest Bancorp, Inc.Incorporation of the Company is incorporated herein by reference to Exhibit 3.2 to the Company's Quarterly Report on Form 10-Q filed with the Securities and Exchange Commission on August 4, 2014
3.3
Amended and Restated By-Laws of the Company is incorporated herein by reference to Exhibit 3.2 to the Company's Annual Report on Form 10-K filed with the Securities and Exchange Commission on February 28, 2012.4.1
Amended and Restated Rights Agreement dated November 15, 1995, is incorporated herein by reference to Exhibits (1) through (3) of the Company's Registration Statement on Form 8-A filed with the Securities and Exchange Commission on November 21, 1995.
4.2
4.2
First Amendment to Rights AgreementsAgreement dated June 18, 1997, is incorporated herein by reference to Exhibit 4 of the Company's Amendment No. 2 to the Registration Statement on Form 8-A filed with the Securities and Exchange Commission on June 30, 1997.
4.3
4.3
Second Amendment No. 2 to Rights Agreements dated November 14, 2005, is incorporated herein by reference to Exhibit 4.1 of the Company's Amendment No. 3 to the Registration Statement on Form 8-A filed with the Securities and Exchange Commission on November 17, 2005.
4.4
4.4
Third Amendment No. 3 to Rights Agreements dated December 3, 2008, is incorporated herein by reference to Exhibit 4.4 of the Company's Amendment No. 4 to the Registration Statement on Form 8-A filed with the Securities and Exchange Commission on December 9, 2008.
4.5
4.5
Form of Common Stock Certificate, incorporated by reference to Exhibit 1 of the Registrant's Form 8-A Registration Statement, filed with the Securities and Exchange Commission on March 7, 1983.Certificate.
4.6
4.6
Certificate of Designation for Fixed Rate Cumulative Perpetual Preferred Stock Series B dated December 5, 2008 is incorporated herein by reference to Exhibit 4.1 to the Company's Current Report on Form 8-K filed with the Securities and Exchange Commission on December 9, 2008.
4.7
4.7
Senior Debt Indenture dated as of November 22, 2011, by and between the RegistrantCompany and U.S. Bank National Association, as trustee, incorporated herein by reference to Exhibit 4.1 of the Registrant's Current Report on Form 8-K, filed with the Securities and Exchange Commission on November 22, 2011.
4.8
4.8
Subordinated Debt Indenture dated as of March 1, 2006, by and between the RegistrantCompany and U.S. Bank National Association, as trustee, incorporated herein by reference to Exhibit 4.1 of the Registrant'sCompany's Current Report on Form 8-K filed with the Securities and Exchange Commission on April 3, 2006.
4.9
4.9
Amended and Restated Declaration of Trust of First Midwest Capital Trust I dated August 21, 2009 is incorporated herein by reference to Exhibit 4.2 to the Company's Current Report on Form 8-K filed with the Securities and Exchange Commission on August 27, 2009.
4.10
4.10
Supplemental Indenture between the Company and Wilmington Trust Company, as trustee, dated August 21, 2009 is incorporated herein by reference to Exhibit 4.1 to the Company's Current Report on Form 8-K filed with the Securities and Exchange Commission on August 27, 2009.
4.11
4.11
Series A Capital Securities Guarantee Agreement dated November 18, 2003 is incorporated herein by reference to Exhibit 4.6 to the Company's Annual Report on Form 10-K filed with the Securities and Exchange Commission on March 9, 2004.
10.1
10.1Senior Executive Letter Agreement under the TARP Capital Purchase Program by and between First Midwest Bancorp, Inc. and the United States Department of the Treasury dated December 5, 2008,Short-term Incentive Compensation Plan is incorporated herein by reference to Exhibit 10.2 to the Company's Current Report on Form 8-K filed with the Securities and Exchange Commission on December 9, 2008.10.2First Midwest Savings and Profit Sharing Plan as Amended and Restated effective January 1, 2008 is herein incorporated by reference to Exhibit 10.3 to the Company's Annual Report on Form 10-K filed with the Securities and Exchange Commission on February 27, 2009.28, 2012.10.3Short-term Incentive Compensation Plan.10.410.2 First Midwest Bancorp, Inc. Omnibus Stock and Incentive Plan is incorporated herein by reference to AddendumAnnex A to the Company's Proxy Statement filed with the Securities and Exchange Commission on April 8, 2009.9, 2013.
10.3
10.5Amendment to the First Midwest Bancorp, Inc. Omnibus Stock and Incentive Plan is incorporated herein by reference to Exhibit 10.3 to the Company's Quarterly Report on Form 10-Q filed with the Securities and Exchange Commission on May 12, 2014.10.4
First Midwest Bancorp, Inc. Amended and Restated Non-Employee Directors Stock Plan dated May 21, 2008 is incorporated herein incorporated by reference to Exhibit 10.7 to the Company's Annual Report on Form 10-K filed with the Securities and Exchange Commission on February 27, 2009.
10.5
10.6
Restated First Midwest Bancorp, Inc. Nonqualified Stock Option-Gain Deferral Plan effective January 1, 2008 is incorporated herein by reference to Exhibit 10.12 to the Company's Annual Report on Form 10-K filed with the Securities and Exchange Commission on February 28, 2008.10.710.6
Restated First Midwest Bancorp, Inc. Deferred Compensation Plan for Non-employee Directors effective January 1, 2008, is incorporated herein by reference to Exhibit 10.13 to the Company's Annual Report on Form 10-K filed with the Securities and Exchange Commission on February 28, 2008.
10.7
10.8
Restated First Midwest Bancorp, Inc. Nonqualified Retirement Plan effective January 1, 2008, is incorporated herein by reference to Exhibit 10.14 to the Company's Annual Report on Form 10-K filed with the Securities and Exchange Commission on February 28, 2008.
10.8
10.9
Form of Non-Employee Director Restricted Stock grantAward Agreement between the Company and non-employee directors of the Company pursuant to the First Midwest Bancorp, Inc. Amended and Restated Non-Employee Directors Stock Plan is incorporated herein by reference to Exhibit 10.1 to the Company's Current Report on Form 8-K filed with the Securities Exchange Commission on May 28, 2008.
10.9
10.10
Form of Nonqualified Stock Option grantAward Agreement between the Company and directors of the Company pursuant to the First Midwest Bancorp, Inc. Non-Employee Directors Stock Option Plan is incorporated herein by reference to Exhibit 10.2 to the Company's Quarterly Report on Form 10-Q filed with the Securities Exchange Commission on May 12, 2008.
10.10
10.11
Form of Nonqualified Stock Option grantAward Agreement between the Company and certain officers of the Company pursuant to the First Midwest Bancorp, Inc. Omnibus Stock and Incentive Plan is incorporated herein by reference to Exhibit 10.1 to the Company's Quarterly Report on Form 10-Q filed with the Securities and Exchange Commission on May 12, 2008.
10.11
10.12
Form of Restricted Stock Unit grantAward Agreement between the Company and certain officers of the Company pursuant to the First Midwest Bancorp, Inc. Omnibus Stock and Incentive Plan is incorporated herein by reference to Exhibit 10.1710.11 to the Company's Annual Report on Form 10-K filed with the Securities and Exchange Commission on February 28, 2008.March 3, 2014.
10.12
10.13
Form of Restricted Stock grantAward Agreement between the Company and certain officers of the Company pursuant to the First Midwest Bancorp, Inc. Omnibus Stock and Incentive Plan is incorporated herein by reference to Exhibit 10.1810.12 to the Company's Annual Report on Form 10-K filed with the Securities and Exchange Commission on February 28, 2008.March 3, 2014.
10.13
10.14
Form of TARP Compliant Restricted ShareIndemnification Agreement between the Company and certain officers and directors of the Company is incorporated herein by reference to Exhibit 4.1 to the Company's Quarterly Report on Form 10-Q filed with the Securities and Exchange Commission on August 3, 2012.10.14 Employment Agreement between the Company and its highly compensated executivesChief Executive Officer is incorporated herein by reference to Exhibit 10.16 to the Company's Annual Report on Form 10-K filed with the Securities and Exchange Commission on March 1, 2013.10.15 Employment Agreement between the Company and its Chief Operating Officer is incorporated herein by reference to Exhibit 10.1 to the Company's Quarterly Report on Form 10-Q filed with the Securities and Exchange Commission on August 9, 2011. 10.16 Employment Agreement between the Company and its Retail Banking Director is incorporated herein by reference to Exhibit 10.4 to the Company's Quarterly Report on Form 10-Q filed with the Securities and Exchange Commission on August 3, 2012. 10.17 Form of Class II Employment Agreement between the Company and certain of its officers is incorporated herein by reference to Exhibit 10.17 to the Company's Annual Report on Form 10-K filed with the Securities and Exchange Commission on March 1, 2010.2013.
10.18
10.15
Form of IndemnificationClass III Employment Agreement executed between the Company and certain officers and directors of the Company is incorporated herein by reference to Exhibit 10.4 to the Company's Quarterly Report on Form 10-Q filed with the Securities and Exchange Commission on May 9, 2007.10.16Form of Class IA Employment Agreement is incorporated herein by reference to Exhibit 10.19 to the Company's Annual Report on Form 10-K filed with the Securities and Exchange Commission on March 1, 2010.10.17Form of Class II Employment Agreement is incorporated herein by reference to Exhibit 10.20 to the Company's Annual Report on Form 10-K filed with the Securities and Exchange Commission on March 1, 2010.10.18Form of Class III Agreement is incorporated herein by reference to Exhibit 10.21 to the Company's Annual Report on Form 10-K filed with the Securities and Exchange Commission on March 1, 2010.10.19 Form of Tier II Employment Agreement between the Company and certain officers of the Company is incorporated herein by reference to Exhibit 10.1 to the Company's Quarterly Report on Form 10-Q filed with the Securities and Exchange Commission on August 3, 2012. 10.20 Form of Tier III Employment Agreement between the Company and certain officers of the Company is incorporated herein by reference to Exhibit 10.2 to the Company's Quarterly Report on Form 10-Q filed with the Securities and Exchange Commission on August 3, 2012. 10.21 Form of Commission Tier III Employment Agreement between the Company and certain officers of the Company is incorporated herein by reference to Exhibit 10.3 to the Company's Quarterly Report on Form 10-Q filed with the Securities and Exchange Commission on August 3, 2012. 10.22 Form of Amendment to the Employment Agreement between the Company and its Chief Executive Officer and to the Class II Employment Agreements between the Company and certain of its officers is incorporated herein by reference to Exhibit 10.22 to the Company's Annual Report on Form 10-K filed with the Securities and Exchange Commission on March 1, 2013. 10.23 Amendment to the Employment Agreement between the Company and its Chief Operating Officer is incorporated herein by reference to Exhibit 10.23 to the Company's Annual Report on Form 10-K filed with the Securities and Exchange Commission on March 1, 2013. 10.24 10.19Form of Confidentiality and Restrictive Covenants Agreement between the Company and its Chief Executive Officer and its Chief Operating Officer is incorporated herein by reference to Exhibit 10.24 to the Company's Annual Report on Form 10-K filed with the Securities and Exchange Commission on March 1, 2013.10.25 Form of Confidentiality and Restrictive Covenants Agreement between the Company and certain of its officers of the Company is incorporated herein by reference to Exhibit 10.25 to the Company's Annual Report on Form 10-K filed with the Securities and Exchange Commission on March 1, 2013. 10.26 Form of Restricted Stock Unit grant between the Company and certain retirement-eligible officers of the Company pursuant to the First Midwest Bancorp, Inc. Omnibus Stock and Incentive Plan is incorporated herein by reference to Exhibit 10.21 to the Company's Annual Report on Form 10-K filed with the Securities and Exchange Commission on March 1, 2011.
10.27
10.20Retirement and Consulting Agreement and Continuing Participant Agreement to the First Midwest Bancorp, Inc. Omnibus Stock and Incentive Plan executed between the Company and a former executive of the Company is incorporated herein by reference to Exhibit 10.2 to the Company's Annual Report on Form 10-K filed with the Securities and Exchange Commission on March 7, 2003.10.21Retirement and Consulting Agreements executed between the Company and a former executive of the Company is incorporated herein by reference to Exhibit 10.8 to the Company's Quarterly Report on Form 10-Q filed with the Securities and Exchange Commission on May 9, 2007.10.22Employment Agreement between the Company and its Chief Operating Officer is incorporated herein by reference to Exhibit 10.1 to the Company's Quarterly Report on Form 10-Q filed with the Securities and Exchange Commission on August 9, 2011.10.23Grant of Nonqualified Stock Option Letter Agreement between the Company and its Chief Operating Officer is incorporated herein by reference to Exhibit 10.2 to the Company's Quarterly Report on Form 10-Q filed with the Securities and Exchange Commission on August 9, 2011.
10.28
10.24Grant of Restricted Stock Letter Agreement between the Company and its Chief Operating Officer is incorporated herein by reference to Exhibit 10.3 to the Company's Quarterly Report on Form 10-Q filed with the Securities and Exchange Commission on August 9, 2011.
10.29
10.25
Supplemental Salary Stock Compensation Award Agreement between the Company and its Chief Operating Officer is incorporated herein by reference to Exhibit 10.4 to the Company's Quarterly Report on Form 10-Q filed with the Securities and Exchange Commission on August 9, 2011.
10.30
10.26
Compensation Award Agreement between the Company and its Chief Operating Officer is incorporated herein by reference to Exhibit 10.5 to the Company's Quarterly Report on Form 10-Q filed with the Securities and Exchange Commission on August 9, 2011.
10.31
10.27OutsourcingLoan Agreement by and between the Company and Metavante CorporationU.S. Bank National Association dated July 1, 1999January 21, 2014 is incorporated herein by reference to Exhibit 10.2410.1 to the Company's Current Report on Form 8-K filed with the Securities and Exchange Commission on January 27, 2014.10.32 First Midwest Bancorp, Inc. Savings and Profit Sharing Plan as Amended and Restated effective January 1, 2014 is incorporated herein by reference to Exhibit 10.33 to the Company's Quarterly Report on Form 10-Q filed with the Securities and Exchange Commission on May 12, 2014. 10.33 Form of Performance Share Award Agreement between the Company and certain officers of the Company pursuant to the First Midwest Bancorp, Inc. Omnibus Stock and Incentive Plan is incorporated herein by reference to Exhibit 10.34 to the Company's Annual Report on Form 10-K filed with the Securities and Exchange Commission on March 1, 2011.3, 2014.
11
10.28Amendment to the Outsourcing Agreement by and between the Company and Metavante Corporation dated April 28, 2004 is incorporated herein by reference to Exhibit 10.25 to the Company's Annual Report on Form 10-K filed with the Securities and Exchange Commission on March 1, 2011.10.29Amendment to the Outsourcing Agreement by and between the Company and Metavante Corporation dated July 1, 2006 is incorporated herein by reference to Exhibit 10.26 to the Company's Annual Report on Form 10-K filed with the Securities and Exchange Commission on March 1, 2011.10.30Information Technology Services Agreement by and between the Company and Fidelity Information Services, LLC dated November 30, 2011.10.31Summary of Executive Compensation.10.32Summary of Director Compensation.11
Statement re: Computation of Per Share Earnings – The computation of basic and diluted earnings per common share is included in Note 1314 of the Company's Notes to the Consolidated Financial Statements included in "ITEM"Item 8. FINANCIAL STATEMENTS AND SUPPLEMENTARY DATA"Financial Statements and Supplementary Data" on Form 10-K for the year ended December 31, 2011.2014.
12
12
Statement re: Computation of Ratio of Earnings to Fixed Charges.14.1Code of Ethics and Standards of Conduct is incorporated herein by reference to Exhibit 14.1 to the Company's Annual Report on Form 10-K filed with the Securities and Exchange Commission on February 28, 2008.21 14.2Code of Ethics for Senior Financial Officers is incorporated herein by reference to Exhibit 14.2 to the Company's Annual Report on Form 10-K filed with the Securities and Exchange Commission on February 28, 2008.21
Subsidiaries of the Registrant.
23
23
Consent of Independent Registered Public Accounting Firm.
31.1
31.1
Certification of Chief Executive Officer pursuant to 18 U.S.C. Section 1350, as adopted pursuant to Section 302 of the Sarbanes-Oxley Act of 2002 for the Company's Annual Report on Form 10-K for the year ended December 31, 2010.2014.
31.2
31.2
Certification of Chief Financial Officer pursuant to 18 U.S.C. Section 1350, as adopted pursuant to Section 302 of the Sarbanes-Oxley Act of 2002 for the Company's Annual Report on Form 10-K for the year ended December 31, 2010.2014.
Certification of Chief Executive Officer pursuant to 18 U.S.C. Section 1350, as adopted pursuant to Section 906 of the Sarbanes-Oxley Act of 2002 for the Company's Annual Report on Form 10-K for the year ended December 31, 2010.2014.
Certification of Chief Financial Officer pursuant to 18 U.S.C. Section 1350, as adopted pursuant to Section 906 of the Sarbanes-Oxley Act of 2002 for the Company's Annual Report on Form 10-K for the year ended December 31, 2010.2014.
101
99.1Certification of Chief Executive Officer pursuant to Section 111(b)(4) of the Emergency Economic Stabilization Act of 2008.99.2Certification of Chief Financial Officer pursuant to Section 111(b)(4) of the Emergency Economic Stabilization Act of 2008.101 (1)
Interactive Data File.By / S/s/ MICHAEL L. SCUDDERMichael L. Scudder February 28, 2012February 28, 2012.March 2, 2015.Signatures
/S/s/ ROBERT P. O'MEARARobert P. O'Meara
Chairman of the Board
Robert P. O'Meara/s/ MICHAEL L. SCUDDER Michael L. Scudder
President, Chief Executive Officer, and Director
Michael L. Scudder/ S/s/ PAUL F. CLEMENSPaul F. Clemens
Executive Vice President, Chief Financial Officer, and Principal Accounting Officer
Paul F. Clemens/ S/s/ BARBARA A. BOIGEGRAINDirector Barbara A. Boigegrain Director
/S/ BRUCE S. CHELBERGBruce S. ChelbergDirector/S/s/ JOHN F. CHLEBOWSKI, JR.Director John F. Chlebowski, Jr. Director
/S/ JOSEPH W. ENGLANDJoseph W. EnglandDirector/S/s/ BROTHER JAMES GAFFNEY, FSCDirector Brother James Gaffney, FSC Director
/S/s/ PHUPINDER S. GILLDirector Phupinder S. Gill Director
/S/s/ PETER J. HENSELERDirector Peter J. Henseler Director
/S/s/ PATRICK J. MCDONNELLDirector Patrick J. McDonnell Director
/S/s/ ELLEN A. RUDNICKDirector Ellen A. Rudnick Director
/S/s/ MARK G. SANDERDirector Mark G. Sander /s/ MICHAEL J. SMALL Director Michael J. Small Director
/S/s/ JOHN L. STERLINGDirector John L. Sterling Director
/S/s/ J. STEPHEN VANDERWOUDEDirector J. Stephen Vanderwoude Director