Use these links to rapidly review the document
TABLE OF CONTENTS 1
TABLE OF CONTENTS 2
Table of Contents
UNITED STATES
SECURITIES AND EXCHANGE COMMISSION
Washington, D.C. 20549
FORM 10-K
| | |
ý |
|
ANNUAL REPORT PURSUANT TO SECTION 13 OR 15(d) OF THE SECURITIES EXCHANGE ACT OF 1934 |
For the fiscal year ended September 30, 2012 |
OR |
o |
|
TRANSITION REPORT PURSUANT TO SECTION 13 OR 15(d) OF THE SECURITIES EXCHANGE ACT OF 1934 |
xANNUAL REPORT PURSUANT TO SECTION 13 OR 15(d) OF THE SECURITIES EXCHANGE ACT OF 1934 For the fiscal year ended September 30, 2014 OR oTRANSITION REPORT PURSUANT TO SECTION 13 OR 15(d) OF THE SECURITIES EXCHANGE ACT OF 1934 For the transition period from to . For the transition period from to .
|
Commission File No. 000-31157
INNOVATIVE SOLUTIONS AND SUPPORT, INC.
(Exact name of registrant as specified in its charter)
Pennsylvania |
| 23-2507402 |
Pennsylvania
(State or other jurisdiction of incorporation) |
| 23-2507402
(IRS Employer Identification No.) |
|
|
|
720 Pennsylvania Drive, Exton, Pennsylvania |
|
19341
|
(Address of principal executive offices) |
|
19341
(Zip Code) |
(610) 646-9800
(Registrant'sRegistrant’s telephone number, including area code)
Securities registered pursuant to Section 12(b) of the Act:
| | |
Title of each class: | | |
| Name of each exchange on which registered |
|---|
Common Stock par value $.001 per share | | The NASDAQ Stock Market, LLC |
Securities registered pursuant to Section 12(g) of the Act: None
Indicate by check mark if the registrant is a well-known seasoned issuer, as defined in Rule 405 of the Securities Act. Yes o No ýx
Indicate by check mark if the registrant is not required to file reports pursuant to Section 13 or Section 15(d) of the Act Yes o No ýx
Note: Checking the box above will not relieve any registrant required to file reports pursuant to Section 13 or section 15(d) of the Exchange Act from their obligations under those sections.
Indicate by check mark whether the registrant (1) has filed all reports required to be filed by Section 13 or 15(d) of the Securities Exchange Act of 1934 during the preceding 12 months (or for such shorter period that the registrant was required to file such reports), and (2) has been subject to such filing requirements for the past 90 days. Yes ýo No ox
Indicate by check mark whether the registrant has submitted electronically and posted on its corporate Web site, if any, every Interactive Data File required to be submitted and posted pursuant to Rule 405 of Regulation S-T (§ 232.405 of this chapter) during the preceding 12 months (or for such shorter period that the registrant was required to submit and post such files).). Yes ýx No o
Indicate by check mark if disclosure of delinquent filers pursuant to Item 405 of Regulation S-K (§229.405) is not contained herein, and will not be contained, to the best of the registrant'sregistrant’s knowledge, in definitive proxy or information statements incorporated by reference in Part III of this Form 10-K or any amendment to this Form 10-K. ýx
Indicate by check mark whether the registrant is a large accelerated filer, an accelerated filer, a non-accelerated filer, or a smaller reporting company. See the definitions of "large“large accelerated filer," "accelerated” “accelerated filer," "non-accelerated” “non-accelerated filer,"” and "smaller“smaller reporting company,"” in Rule 12b-2 of the Exchange Act. (Check one):
| | | | | | |
Large accelerated filer o | | Accelerated filer ox |
| | |
Non-accelerated filer o | | Smaller Reporting Company ýo |
Indicate by check mark whether the registrant is a shell company (as defined in Rule 12b-2 of the Act). Yeso Noýx
The aggregate market value of the Registrant'sRegistrant’s common stock held by non-affiliates of the Registrant as of March 31, 20122014 (the last business day of the registrant'sregistrant’s most recently completed second quarter) was approximately $45.4$79.6 million. Shares of common stock held by each executive officer and director and by each person who owns 10% or more of the Registrant'sRegistrant’s outstanding common stock have been excluded since such persons may be deemed affiliates. This determination of affiliate status is not necessarily a conclusive determination for other purposes.
As of November 30, 2012,28, 2014, there were 16,583,03716,957,642 outstanding shares of the Registrant'sRegistrant’s Common Stock
Documents Incorporated by Reference
Portions of the Registrant'sRegistrant’s Proxy Statement for the 20122014 Annual Meeting of Shareholders to be filed prior to January 25, 201327, 2015 are incorporated by reference into Part III of this Report. Such Proxy Statement, except for the parts therein which have been specifically incorporated by reference, shall not be deemed "filed"“filed” for the purposes of this Report on Form 10-K.
Table of Contents
INNOVATIVE SOLUTIONS AND SUPPORT, INC.
2012
2014 Annual Report on Form 10-K
Table of Contents
1
Table of Contents
FORWARD LOOKING STATEMENTS
This report contains forward looking statements within the meaning of Section 21E of the Securities Exchange Act of 1934, as amended (the "Exchange Act"“Exchange Act”). These forward looking statements are based largely on current expectations and projections about future events and trends affecting the business, are not guarantees of future performance, and involve a number of risks, uncertainties and assumptions that are difficult to predict. In this report, the words "anticipates," "believes," "may," "will," "estimates," "continues," "anticipates," "intends," "forecasts," "expects," "plans," "could," "should," "would,""“anticipates,” “believes,” “may,” “will,” “estimates,” “continues,” “anticipates,” “intends,” “forecasts,” “expects,” “plans,” “could,” “should,” “would,”“is likely"likely” and similar expressions, as they relate to the business or to its management, are intended to identify forward looking statements, but they are not exclusive means of identifying them. Unless the context otherwise requires, all references herein to "IS“IS&S," "the” “the Registrant," "the” “the Company," "we," "us"” “we,” “us” or "our"“our” are to Innovative Solutions and Support, Inc. and its consolidated subsidiaries.
The forward looking statements in this report are only predictions, and actual events or results may differ materially. In evaluating such statements, a number of risks, uncertainties and other factors could cause actual results, performance, financial condition, cash flows, prospects and opportunities to differ materially from those expressed in, or implied by, the forward looking statements. These risks, uncertainties and other factors include those set forth in Item 1A (Risk Factors) of this Annual Report on Form 10-K and the following factors:
·
•- the availability of government funding;
·
•- the impact of general economic trends on the
Company'sCompany’s business;·
•- the deferral or termination of programs or contracts for convenience by customers;
·
•- difficulties in developing and producing the
Company'sCompany’s COCKPIT/IP®IP® Flat Panel Display System or other planned products or product enhancements;·
•- market acceptance of the
Company'sCompany’s flat panel display systems, or COCKPIT/IP®IP® or other planned products or product enhancements;·
•- continued market acceptance of the
Company'sCompany’s air data systems and products;·
•- the ability to gain regulatory approval of products in a timely manner;
·
•- delays in receiving components from third party suppliers;
·
•- the competitive environment and new product offerings from competitors;
·
•- the bankruptcy or insolvency of one or more key customers;
·
•- protection of intellectual property rights;
·
•- failure to retain/recruit key personnel;
·
•- a cyber security incident;
·
•- the ability to service the international market;
·
•- potential future acquisitions; and
·
•- other factors disclosed from time to time in the
Company'sCompany’s filings with the United States Securities and Exchange Commission (the "SEC"“SEC”).
Except as expressly required by the federal securities laws, the Company undertakes no obligation to publicly update or revise any forward looking statements, whether as a result of new information, future events, or otherwise after the date of this report. Results of operations in any past period should not be considered indicative of the results to be expected for future periods. Fluctuations in operating results may also result in fluctuations in the price of the Company'sCompany’s common stock.
Table of Contents
Readers are cautioned not to place undue reliance on these forward-looking statements, which speak only as of the date of this Annual Report on Form 10-K. The Company does not undertake any obligation to publicly release any revisions to these forward-looking statements to reflect events, circumstances or changes in expectations after the date of this Annual Report on Form 10-K, or to reflect the occurrence of unanticipated events. The forward-looking statements in this document are intended to be subject to the safe harbor protection provided by Sections 27A of the Securities Act of 1933, as amended (the "Securities Act"“Securities Act”), and 21E of the Exchange Act.
Investors should also be aware that while the Company, from time to time, communicates with securities analysts, it is against its policy to disclose any material non-public information or other confidential commercial information. Accordingly, shareholders should not assume that the Company agrees with any statement or report issued by any analyst irrespective of the content of the statement or report. Furthermore, the Company has a policy against issuing or confirming financial forecasts or projections issued by others. Thus, to the extent that reports issued by securities analysts contain any projections, forecasts or opinions, such reports arenot the responsibility of Innovative Solutions and Support, Inc.
2
Table of Contents
PART I
Item 1. Business
Overview
Innovative Solutions and Support, Inc. (the "Company,"“Company,” or "IS&S"“IS&S”) was foundedincorporated in Pennsylvania on February 12, 1988. The Company isoperates in one business segment as a systems integrator that designs, manufactures, sells, and sellsservices air data equipment, engine display systems, standby equipment, primary flight guidance and cockpit display systems for retrofit applications and original equipment manufacturers ("OEMs"(“OEMs”) and retrofit applications.. The Company supplies integrated Flight Management Systems ("FMS"(“FMS”), Flat Panel Display Systems (“FPDS”), Integrated Standby Units (“ISU”) and advanced Global Positioning System ("GPS"(“GPS”) receivers for precisionthat enable reduced carbon footprint navigation.
Increasingly, the
The Company is positioninghas continued to position itself as a system integrator, which capability provides the Company with the potential to generate more substantive orders over a broader product base. The Company has demonstrated an ability to incorporate added electronic flight bag functionality such as charting and mapping systems into its Flat Panel Display Systems ("FPDS") product line. The strategy, as both a manufacturer and integrator, is designed to leverage the latest technologies developed for the computer and telecommunications industries into advanced and cost-effective solutions for the general aviation, commercial theair transport, United States Department of Defense ("DoD"(“DoD”)/governmental, and foreign military markets. This approach, combined with the Company'sCompany’s industry experience, enablesis designed to enable IS&S to develop high-quality products and systems, to reduce substantially product time to market, and to achieve cost advantages over products offered by its competitors.
For several years the Company has been working with advances in technology to provide pilots with more information to enhance both the safety and efficiency of flying, and has developed its COCKPIT/IP® Cockpit Information Portal ("CIP"(“CIP”) product line, referred to as Flat Panel Display System ("FPDS"), that incorporates proprietary technology, low cost, reduced power consumption, decreased weight, and increased functionality. The Company believes the FPDSCIP product line is suited to address market demand that will be driven by regulatory mandates, new technologies, and the high cost of maintaining aging/obsolete equipment on airplanes that have been in service for up to fifty years. IS&SThe Company has incorporated Electronic Flight Bag (“EFB”) functionality, such as charting and mapping systems, into its FPDS product line.
More recently, the Company has developed an FMS that combines the savings long associated with in flight fuel optimization in enroute flight management combined with the precision of satellite-based navigation required to comply with the regulatory environments of both domestic and international markets. The Company believes that the transitionFMS coupled with its FPDS product line is well suited to FPDS as partaddress market demand driven by further regulatory mandates, new technologies, and the high cost of airplane retrofit requirementsmaintaining aging and obsolete equipment on aircraft that will continue.be in service for up to fifty years. The shift in the regulatory and technological environment is illustrated by the dramatic increase in the number of Space Based Augmentation System (“SBAS”) or Wide Area Augmentation System ("WAAS"(“WAAS”) approach qualified airports.airports, particularly as realized through Localizer Performance with Vertical guidance (“LPV”) navigation procedures. Aircraft equipped with the Company'sCompany’s FMS and FPDS product line (equipped with a WAASSBAS/WAAS/LPV enabled navigator) will be qualified to land at such airports and to comply with upcoming Federal Aviation Administration ("FAA"(“FAA”) mandates for Required Navigation Performance ("RNP"(“RNP”), and Automatic Dependent Surveillance-Broadcast ("ADS-B"(“ADS-B”) navigation, a fact which IS&S believes will further increase the demand for the Company'sCompany’s products. The Company’s FMS/FPDS product line is designed for new production and retrofit applications into general aviation, commercial air transport and military transport aircraft. In addition, the Company offers a state of the art ISU, integrating the full functionality of the primary and navigation displays into a small backup-powered unit. This ISU builds on the Company’s legacy air data computer to form a complete next-generation cockpit display and navigation upgrade offering to the commercial and military markets.
IS&S sells to both the OEM and the retrofit market and OEMs.markets. Customers include thevarious OEMs, commercial air transport carriers and corporate/general aviation companies, DoD and its commercial contractors, aircraft operators, aircraft modification centers, and foreign militaries, and various OEMs.militaries. Occasionally, IS&S sells its products directly to DoD; however, the Company sells its products primarily to commercial customers for end use in DoD programs. Sales to defense contractors are generally made on commercial terms, although some of the termination and other provisions of government contracts are applicable to these contracts.
Customers have been and may continue to be affected by the uncertain economic conditions that currently exist both in the United States and abroad. Such conditions may cause customers to curtail or delay their spending on both new and existing aircraft. Factors that can impact general economic conditions and the level of spending by customers include, but are not limited to, general levels of consumer spending, increases in fuel and energy costs, conditions in the real estate and mortgage markets, labor and healthcare costs, access to credit, consumer confidence, and other macroeconomic factors that affect spending behavior. In October 2012 Eclipse Aerospace, Inc. placedaddition, the Budget Control Act of 2011 (the “Budget Act”) triggered substantial, automatic reductions in both defense and discretionary spending. The automatic across-the-board sequestration cuts are in addition to reductions already reflected in defense funding over a production order with IS&S forten-year period. Furthermore, spending by government agencies may be reduced in the future if tax revenues decline. If customers curtail or delay their spending or are forced to declare bankruptcy or liquidate their operations because of adverse economic conditions, the Company’s revenues and results of operations would be affected adversely. However, the Company believes that, in an initial fifty ship sets of a three hundred ship set contract for the IS&S advanced avionics suite for the production model Eclipse 550. IS&S is the supplier of Primary Flight and Multi-Function Displays as well as the Integrated Flight Management System ("IFMS") for the Eclipse Jet. The advanced avionics suite will include Dual Flight Management systems, Auto Throttles, Synthetic Vision, integrated Terrain Awareness System ("TAWS") and Enhanced Vision System ("EVS").uncertain economic
3
Table of Contents
In August 2012, the FAA issued its Supplemental Type Certificate ("STC")
environment, customers that may have otherwise elected to IS&Spurchase newly manufactured aircraft may be interested instead in retrofitting existing aircraft as a cost-effective alternative, thereby creating market opportunity for its FPDS for use on Classic B-737 aircraft. This certification enables IS&S to expand its marketing of its FPDS to owners of B737 in the United States.&S.
In October 2011, Eclipse Aerospace Inc. selected IS&S to design and develop the advanced avionics suite for the production model Eclipse 550.
In July 2011, the National Nuclear Security Administration ("NNSA") awarded IS&S a contract for the complete Systems Integration and Cockpit Avionics upgrade of their B737-400 classic aircraft. Upon completion, this upgrade will provide NNSA full Communication Navigation Surveillance/Air Traffic Management ("CNS/ATM") capabilities and similar efficiency and performance to the B737 Next Generation ("NG") at the fraction of the cost of a new aircraft. This program complements the IS&S FPDS contracts for more than 400 B757/B767 aircraft with more than 160 aircraft already in revenue service. The upgrade for the B737-300/-400/-500 series aircraft and the existing B757/B767 FPDS are platforms for compliance with NextGen and Single European Sky ATM Research ("SESAR") requirements, is Controller Pilot Data Link Communication ("CPDLC"), RNP, ADS-B and in-Trail capable, provides power and weight savings, and reduces fuel consumption and CO2 emissions.
In June 2011, Boeing awarded IS&S a contract to design and develop the Aerial Refueling Operator Control and Display Units ("AROCDU") for the KC-46A Tanker Program.
In March 2011, IS&S announced it received FAA STC for its FMS and dual GPS receivers for the Eclipse Aerospace, Inc. ("EAI") Twin-Engine Jet. The IS&S FMS displays controls all major systems on the aircraft and includes improvements to e-Chart, mapping and satellite weather functionality and precision navigation. Eclipse Twin-Engine Jet operators are now able to upgrade their aircraft within Integrated Flight Management System through EAI.
In February 2011,November 2014, the FAA issued its Technical Standard Order authorization ("TSO"(“TSO”) and Supplemental Type Certificate (“STC”) to IS&S for its Beta-3 Global Positioning System ("GPS")—Satellite Based Augmentation System ("SBAS") Receiver. This certificationuse on the B737 Classic aircraft which enabled IS&S to expand its product offering to includeowners of the B737 in the United States.
In October 2014, Delta Airlines, Inc. (“Delta”) issued a GPScancellation notice to the Company purporting to terminate its contract with IS&S. The Company will enter into a contractually mandated non-binding mediation with Delta in its FPDS. Additionally,accordance with the terms of the contract. (See Item 3. Legal Proceedings).
In February 2014, the FAA alsoissued an STC for the Company’s Auto Throttle System and Standby Display Unit (“SDU”) which has been incorporated into its Integrated Flight Management System (“IFMS®”). In September 2013, the FAA issued a TSO in March 2011to IS&S for the IS&S Class Gamma 3 FMS and a Type 2 FAA Letter of Acceptance ("LOA") that allowsits SDU, which enabled IS&S to provide navigation data. The combinationoffer the SDU to owners of these certifications enablesvarious aircraft types in the United States, subject to certification of minor technical modifications for use in specific aircraft. This certification led IS&S to bedevelop an ISU, which combines the Company’s air data technology with the SDU as a flight management system provider to its customers.standalone industry product.
In December 2010, the European Aviation Safety Agency ("EASA"), the European counterpart ofSeptember 2013, the FAA issued its Supplemental Type Certificate ("STC")a TSO to IS&S for its Digital Air Data Computer (“DADC”) for the B757 FPDS. Further, in August 2011, IS&S obtained an STC from EASA for its B767 FPDS. These certifications enableRC-135 aircraft, which enabled IS&S to expand its marketingproduct offering of its B757the DADC to owners of the RC-135 in the United States.
In May 2013, Pilatus Aircraft Limited (“Pilatus”) of Switzerland executed an agreement with IS&S to develop and B767 FPDSmanufacture the Utilities Management System (“UMS”) for the Pilatus PC-24 aircraft under a multi-year production contract. The UMS integrates multiple aircraft utility functions commonly supported by multiple individual controllers and monitors. The IS&S UMS will provide integrated control of systems from within the avionics suite and automate various tasks to customersreduce crew workload and improve safety conditions.
In February 2013, Sierra Nevada Corporation awarded IS&S a contract to design, develop, manufacture and supply an upgraded, high definition Integrated Flat Panel Display System for a number of Pilatus PC-12 type aircraft in Europe.the United States.
Industry4
Table of Contents
Industry
A wide range of information is critical for proper and safe operation of aircraft. With advances in technology, new types of information to assist pilots are becoming available for display in cockpits, such as satellite based weather, and ground terrain maps.maps, and ADS-B navigation. The Company believes that aircraft cockpits will increasingly become more complete information centers, capable of delivering additional information that is either mandated by regulation or demanded by pilots to assist in the safe and efficient operation of aircraft.
There are three
The Company classifies flight data into four general types of flight data:types: aircraft heading and altitude information, flight critical aircraft control data, navigation data, and navigationmaintenance and aircraft health data. Aircraft heading and altitude information includes aircraft speed, altitude, and rates of ascent and descent. Flight critical aircraft control information includes engine data such as fuel and oil quantity, and other engine measurements. Navigation data includes radio position, flight management, GPS, and alternative source information; which isinformation (i.e. information not originating on the aircraft, including weather depiction maps, GPS navigation, and surface terrain maps.maps). Maintenance and aircraft health data includes on-board sensors and programs to measure parameters related to the health of a system on the aircraft. Air data calculations are based primarily on air pressure measurements derived from sensors on the
Table of Contents
aircraft. Engine data are determined by measuring various indices such as temperature, volume, revolutions per minute ("RPM"(“RPM”), and pressure within an aircraft'saircraft’s engines and other mechanical equipment. GPS and alternative source information are derived typically from satellites or equipment located on land and fedtransmitted by satellite or radio signals to the aircraft. Pilots can presently display thisMaintenance and aircraft health data measure multiple parameters on various products and interface with various components to manage, measure, and report on the health, reliability and usability of a system. This information is displayed in the cockpit for reference, and enhanced position awareness.awareness, and reduced support logistics on properly equipped aircraft.
Traditionally, flight data and other cockpit information were displayed on a series of separate analog mechanical instruments. In the early 1980s, Cathode Ray Tubes (“CRT”) and digital displays using Cathode Ray Tubes ("CRT"Liquid Crystal Displays (“LCD”) began to replace some individual analog instruments. Presently, the industry offers high resolution color flat panels using Active Matrix Liquid Crystal Displays ("AMLCD"(“AMLCD”) to replace traditional analog instruments, CRT or CRTLCD displays. IS&S expects that the ability to display more information in aan efficient space efficient and custom platform will become increasingly important if additional information, such as weather depiction maps, traffic information, and surface terrain maps, datalink messaging, and surveillance displays, becomes mandated by regulation or demanded by pilots. Accordingly, the Company believes flat panel displays, which can integrate and display a "suite"“suite” of information, will increasingly replace individual instruments CRTs and CRTs as the method for displaying information in cockpits.LCDs on legacy aircraft.
In the past, equipment data, such as engine and fuel related information, were displayed on conventional analog mechanical instruments. Engine and fuel instruments provide information on engine activity, including oil and hydraulic pressures, and temperature. These instruments are clustered throughout an aircraft'saircraft’s cockpit. Engine and fuel instruments tend to be replaced more frequently than other instruments due to obsolescence and normal wear-and-tear. Inasmuch as information displayed by these instruments is vital for safe and efficient flight, aircraftAircraft operators continue to purchase individual conventional engine and fuel instruments as replacements.replacements, because the information that these instruments display is vital for safe and efficient flight. Increasingly, operators are replacing their clusters of analog mechanical instruments with integrated FPDS.Engine Instrument Display Systems (“EIDS”) or a FPDS packages.
As the skies and airports become more crowded, the aviation industry and its regulators are concentrating on new technologies, procedures, and regulations that allow more aircraft to operate in the skies and on the ground safely, efficiently, and with less impact on the environment. These new technologies and procedures, such as traffic avoidance, ground awareness, increased precision of navigation and vertical position, runway incursion prevention, and increased digital communication, will require innovation and intuitive methods to display situational awareness information for the pilots. The Company believes that flat panel displays provide the best solution to handle these requirements.
Strategy
The Company'sCompany’s objective is to become a leading supplier and integrator of cockpit information, and believes that its industry experience and reputation, technology and products, and business strategy provide the basis to achieve this objective. Key elements of the Company'sCompany’s strategy include:
•·Focusing on retrofits.Cockpit avionics upgrades for existing aircraft is of great interest in the present economic environment. The retrofit of an aircraft with the COCKPIT/IP®IP® FPDS, FMS, and ISU system components is cost effective compared to the acquisition of a new aircraft and can provide the same functionality. When the economy returnsequivalent functionality to more robust levels, the Company believes that lead times to acquireof new aircraft will lengthen and demand for retrofits will continue as operators update their existing fleets to provide needed capacity.aircraft.
·
•- Establishing leadership in the flat panel display market.IS&S expects that many aircraft will be retrofitted with flat panel displays over the next several years. Given the versatility, visual appeal, and lower cost of displaying a series of instruments and other flight relevant information on a single flat panel, the Company believes that flat panel displays will increasingly replace individual analog and digital instruments, LCDs and CRTs. The Company believes that the COCKPIT/
IP®IP® has significant benefits over competitive flat panel displays, currently offered by competitors, including lower cost, larger size, reduced5
Table of Contents
weight, enhanced viewing angles, and a broader array of functions. The
Table of Contents
Company's Company’s patented and proprietary Integrity Checking Processor and Zooming features provide increased situational awareness, reliability, performance, and utility to the owner/operator. Accordingly, the Company believes that these advantages will allow IS&S to generate significant revenues from the COCKPIT/IP®IP® product, and to increase market share. In addition, demand for new aircraft, FAA mandates to upgrade older aircraft and obsolescence issues on older aircraft will contribute to this growth.
•·Continuing engineering and product development successes.IS&S develops innovative products by combining its avionics, engineering, and design expertise with commercially available technologies, components, and products from non-aviation applications, including the personal computer and telecommunications industries. The Company'sCompany’s COCKPIT/IP® FPDS is an exampleIP® system components present examples of theits ability to engineer products through the selective application of non-avionic technology. In addition, as permitted by law, IS&S applies for and registers its patents and trademarks for the technology and products it develops in the United States and various countries around the world to protect its intellectual property. Research and development ("(“R&D"&D”) expenses were $2.7$2.8 million, $5.5$2.6 million and $5.2$2.7 million for fiscal years ended September 30, 2012, 20112014, 2013 and 2010,2012, respectively. During fiscal 2012, 20112014, 2013 and 20102012 revenues related to Engineering—Modification andEngineering Development ("EMD"Contracts (“EDC”) revenues accounted for 26%32%, 2%26% and 7%26%, respectively, of total sales. AgainstIn support of these EMD revenues,EDC programs, the Company's R&D resourcesCompany charged $4.7$15.5 million, $0.2$8.3 million, and $0.8$4.7 million for fiscal years ended September 30, 2012, 20112014, 2013 and 2010,2012, respectively to cost of sales for EMD revenues.sales.
·
•- Maintaining leadership in air data markets.The Company believes that it is one of the largest suppliers of air data products to the U.S. retrofit market.
Demand remains toThe pressures on DoD procurement budget make the retrofit of aging military aircraft with newer, more advanced, and more supportable air data systems. Additionally, upgrading business aircraft withsystems more attractive. In addition, higher performance engines is drivingin business aircraft are creating a need for more sophisticated air data products supplied bywhich the Company.Company supplies.
·
•- Increasing sales to
the DoD, other government agencies, defense contractors, commercial air transport and corporate/general aviation markets.IS&S has extended its efforts to diversify sales to include all aviation end user markets, especially legacy military programs and the commercial air transport aircraft. In the commercial air transport market, these efforts havethe Company has addressed national carriers, regional carriers, and other fleet operators. The Company has also targeted the corporate/general aviation market, both for retrofits and original equipment, and has won new and ongoing retrofit programs and two OEM programs. One of which isprograms with Eclipse Aerospace and the other of which is not public. The Company continues to build a sales and marketing force to address these markets more effectively.Pilatus.
·
•- Expanding international presence.IS&S plans to increase its international sales by adding sales and marketing personnel.
As large flat panel displays become more prevalent, theThe Company believes that European and other international aircraft operators and aircraft modification centers will accelerate retrofitting activities, thereby increasing demand forretrofit legacy in-service aircraft with large flat panel displays. IS&S has obtained approval from the EASAEuropean Aviation Safety Agency (“EASA”) for installing the FPDS in Europe for the B757/B767 aircraft and will continue obtainingexpects to obtain EASA approvals for other European installations as applicable.aircraft types.
·
•- Growing through acquisitions or joint ventures.IS&S may pursue strategic acquisitions or joint ventures as a means to expand the business with enhanced technology, distribution, customer base, or products. The Company may seek to acquire developers or suppliers of complementary products, technology,
or information, or to acquire suppliers of similar products as a means of increasingto increase its product offerings and market share.
Table of Contents
Products
Current linelines of products includes:include:
Flat Panel Display Systems
In recent years color flat panel displays have been introduced into aircraft cockpits.
Flat panel displays are Liquid Crystal Display ("LCD")AMLCD screens that can replicate the display of one or a suite of analog or digital displays on one screen. As with other instrumentation, flatFlat panel displays can be installed in new aircraft or used to replace existing displays in legacy aircraft. LCDsAMLCDs are used also used for security monitoring on-board aircraft and as tactical workstations on military aircraft. The flat panel product line presentsoffers numerous advantages for presentation of engine performance data. During fiscal 2012, 2011years 2014, 2013 and 20102012, revenues related to FPDS accounted for 87%88%, 79%88% and 68%87%, respectively, of total sales.
6
Table of Contents
The Company'sCompany’s FPDS can replace conventional analog and digital displays used currently in a cockpit and can display additional information which is not commonly displayed in the cockpit with conventional analog and digital displays. The COCKPIT/IP®IP® is capable of displaying nearly all types of air data, engine and fuel data, altitude, heading and navigational data, maintenance and aircraft health data, and alternative source information. As technology and information delivery systems develop further, additional information will be displayed in the cockpit, such as surface terrain maps and data link messaging. IS&S designed the COCKPIT/IP®IP® to be capable of displaying information generated from a variety of sources, including its Reduced Vertical Separation Minimum ("RVSM"(“RVSM”) air data system, engine and fuel instrumentation, and third-party data and information products.
The Company's new Integrated Multifunction Standby Unit ("IMSU") can be installed in a variety of fixed wing aircraft and helicopters. The IMSU measures, processes, and displays altitude, attitude, airspeed, slip/skid, and navigation display information into an intuitive and concise single instrument display. The IMSU incorporates an integral Inertial Measurement Unit ("IMU") and includes an air data module to measure static and total pressure for independent display of altitude, airspeed, and Mach number. The unit also has an optional battery module that provides one hour of operation of the unit during emergency conditions or complete electrical system failures.
From time to time, customers may order one or more FPDSs customized to their particular requirements. Typically, the Company charges for the added development cost. This source of revenue is characterizedreported as EMDEDC on the consolidated statement of operations. Consistent with this approach, engineeringincome. Engineering costs incurred in customizing the FPDSs are included in cost of sales (Engineering—Modificationsales.
Flight Management Systems
The IS&S NextGen Flight Management System is an easily installed navigation and Development)performance computer that complements the IS&S Flat Panel Display System upgrade for commercial air transport aircraft. The FMS interfaces with the IS&S SBAS GPS receiver to provide a Global Positioning System (“GPS”) receiver to provide a GPS based navigation solution. The GPS receiver is located remotely depending on space availability. To minimize use of cockpit space and ease installation efforts, the FMS is housed in an ARINC 739B compliant Multifunction and Control Display Unit (MCDU).
Each FMS/MCDU has an LCD display, keyboard, mode and function keys, line select keys, annunciator lights, and supports ethernet data loading. The flight crew can manually or datalink waypoint flight plans, routes or user-defined waypoints on the IS&S FMS and modify and update these plans via the FMS/MCDU screen. Once the flight plan data is entered, the MCDU computes the most economical flight profiles and provides steering commands for use by the aircraft control system to fly the airplane along the desired route.
The FMS/MCDU package incorporates a robust navigation database capable of storing today’s global database with ample growth for the future. Flight crews can utilize the data in the navigation database to create, edit and modify flight plans for display on the FPDS. The navigation data includes airways, jet routes, SIDS, STARS, and company stored routes.
The FMS/MCDU is ARINC 739B compliant, which provides an interface option for other cockpit equipment such as SATCOM, ACARS, CMU, HUD, and a printer. The interface to the IS&S FPDS is provided via Ethernet. The IS&S Electronic Flight Bag (“EFB”) is integrated with the FMS/MCDU and FPDS where the control selection of the EFB features and applications are handled via the FMS/MCDU. The display is a five inch LCD with VGA resolution. The touchscreen display uses LED backlighting and is sunlight readable.
Integrated Standby Unit
The Company’s new Integrated Standby Unit (ISU) incorporates the measurement and display of attitude, altitude, airspeed, and navigation data into a single standby/backup navigation instrument for military, commercial air transport and corporate/general aviation applications. The ISU has an optional battery module that allows operation of the unit under emergency conditions. The ISU has an integral Inertial Measurement Unit that includes accelerometer, gyro, and magnetometer triads. The unit also includes an integral air data measurement module for measurement of static and total pressure for display of altitude, airspeed, and mach number.
The ISU is a highly reliable and accurate standby navigation system that is based on IS&S’s merger of COCKPIT/IP® display technology and RVSM air data products coupled with the latest breakthroughs in MEMS Gyros with exceptional stability. An IS&S proprietary algorithm provides for accurate computation of attitude, heading and air data parameters. The unit includes a triaxial magnetometer that is designed to be tolerant to the local soft iron effects.
The display uses a familiar Primary Flight Display (“PFD”) format to reduce pilot workload. Logistics and maintenance savings are realized due to increased reliability and a reduction in LRUs. The unit is equipped with built-in test and display of navigational aid and maintenance data.
Air Data Systems and Components
The Company'sCompany’s air data products calculate and display various measures such as aircraft speed, altitude, and rate of ascent and descent. These air data products utilize advanced sensors to gather air pressure data and customized algorithms to interpret data, thus allowing the system to calculate altitude more accurately. During fiscal 2012, 2011,2014, 2013, and 2010,2012, sales of air data systems and components accounted for 13%12%, 21%12%, and 32%13%, respectively, of total revenues.
IS&S sells individual components as well asand partial and complete air data systems. The components and systems include:
Table of Contents
·digital air data computers, which calculate various air data parameters such as altitude, airspeed, vertical speed, angle of attack and other information derived from the measure of air pressure;
·
•integrated air data computers and display units, which calculate and convey air data information;
·
•altitude displays, which convey aircraft altitude measurements;
Table of Contents·
•- airspeed displays, which convey various
types of airspeed measurements including vertical airspeed and rates of ascent and descent; and
·
•- altitude alerters which allow
the pilotpilots to select a desired cruising altitude that the aircraft will reach and maintain, and alsowhich provide warnings to pilots when an unacceptable deviation occurs.
Engine and Fuel Displays
IS&S develops, manufactures and markets engine and fuel displays. These solid-state multifunction displays convey information with respect to fuel and oil levels, and engine activity, such as oil and hydraulic pressure and temperature. This instrumentation includesThey include individual and multiple displays installed throughout the cockpit. The displays can be used in conjunction with the Company'sCompany’s engine and fuel data equipment or that of other manufacturers.
Engine and fuel displays are found in all aircraft and are vital to safe and proper aircraft flight. In addition, accurate conveyance of engine and fuel information is critical for the monitoring of engine stress and the maintenance of engine parts.parts maintenance. Engine and fuel displays tend to be replaced more frequently than other displays, and have remained largely unchangedbeen slow to incorporate new technology since their introduction due tobecause of their low cost, standard design and universal use.
IS&S believes that its air data engine and fuel displays are extremely reliable, have been designed to be programmable, and are adaptable easily without major modification to most modern aircraft. These products have been installed on B727, B737, C-130H, DC-9, DC-10, P-3, F-16, and A-10 aircraft.
Customers
The Company'sCompany’s customers include the United States government (including DoD, DOIthe Department of Interior (“DOI”) and the Department of Homeland Security)Security (“DHS”)), ABX Air, American Airlines, TheInc. (“AAI”), Boeing, Company, BAE Systems, Eclipse, Aerospace, Inc., Federal ExpressFedEx Corporation ("FedEx"(“FedEx”), Icelandair, L-3 Communications, Lockheed Martin Corporation, Pilatus, Sierra Nevada Corporation, and the Department of National Defense (Canada), among others. In fiscal year 2014, the three largest customers, Pilatus, Eclipse and FedEx, accounted for 17%, 14% and 12% of total revenue, respectively. In fiscal 2013, the two largest customers, Eclipse Aerospace and American Airlines, accounted for 24%, and 14% of total revenue, respectively. In fiscal year 2012, the three largest customers, Eclipse, Aerospace, FedEx, and the National Nuclear Security Administration (“NNSA”), accounted for 20%, 14% and 13% of total revenue, respectively. In fiscal year 2011, the two largest customers, Eclipse Aerospace, Inc. and FedEx, accounted for 20% and 15% of total revenue, respectively. In fiscal year 2010 the two largest customers, Lockheed Martin and FedEx, accounted for 11% and 10% of total revenue, respectively.
On November 29, 2011, AMR Corporation, the parent company of American Airlines, Inc. ("AAI") and certain of its other U.S. based subsidiaries filed voluntary petitions for Chapter 11 reorganization in the U.S. Bankruptcy Court for the Southern District of New York (the "Bankruptcy"). The Company's revenues from American Airlines, Inc. accounted for 5%, 8% and 8% of total revenue for the fiscal years 2012, 2011 and 2010, respectively. As at September 30, 2012, orders from American Airlines, Inc. account for a material portion of the Company's backlog. AAI continued to purchase products from the Company in the ordinary course of business after November 29, 2011. (See Note 13—Commitments and Contingencies in Notes to Consolidated Financial Statements attached).
Retrofit Market
Historically, a majority of the Company'sCompany’s sales have come from the retrofit market. Among other reasons,market, which IS&S has pursued the retrofit market because of its continued rapid growth in response to the increasing need to support the world'sworld’s aging fleet of aircraft. The design and airframe structure of many types of older aircraft generally exceeds the technology and technical capabilities of the original cockpit instruments and avionics. The Company has developed products that enable owners and operators to upgrade their aircraft by retrofitting them with IS&S products at a competitive cost and with equipment that provides cockpit displays with capabilities and technology equivalent to new aircraft.
Updating an individual aircraft's electronics equipment has become increasingly common as new technology obsoletes existing instrumentation while an aircraft is still structurally and mechanically
Table of Contents
sound. Retrofitting an aircraft is generally a substantially less expensive alternative than purchasing a new aircraft. IS&S expects its main customers in the retrofit market will continue to be:
•·the DoD and defense contractors;contractors,
·
•- aircraft
operators;operators, and
·
•- aircraft modification centers.
Department of Defense and Defense Contractors. The Company sells its products directly to the DoD and to domestic and international defense contractors for end use on military aircraft retrofit programs. DoD programs generally take one of two forms: a subcontract with a prime government contractor, such as Boeing, Lockheed Martin, or L-3 Communications;Communications, or a direct contract with the appropriate government agency, such as the U.S. Air Force. The government'sgovernment’s desire for a cost-effective retrofit of its aircraft has led it to purchase commercial off-the-shelf equipment rather than to develop specially designed products, which are usually more costly and take longer to implement. These retrofit contracts tend to be on arms length commercial terms, although some termination and other provisions of government contracts are typically applicable to these contracts, as described under "Government Regulation" “Government Regulation”
8
Table of Contents
below. Each government agency or general contractor retains the right to terminate a contract at any time at its convenience. Upon such alteration or termination, IS&S generally wouldis entitled typically to be entitled to an equitable adjustment to the contract price so that it would receive the purchase pricecompensated for already delivered items and reimbursement for allowable costs incurred.
Aircraft Operators. The Company also sells its products to aircraft operators, including commercial airlines, cargo carriers, and business and general aviation aircraft owners or suppliers. The products are used mostly insuppliers, primarily for retrofitting of aircraft owned or operated by these customers, which generally retrofit and maintain their aircraft themselves.customers. The Company'sCompany’s commercial fleet customers include or have included, among others, American Airlines,AAI, ABX Air, Air Canada, FedEx Icelandair and Northwest Airlines.Icelandair. IS&S sells these customers a range of products from FPDS to air data systems.
Aircraft Modification Centers. TheAircraft modification centers, which repair and retrofit private aircraft, represent the primary retrofit market for private and corporate jets is through aircraft modification centers, which repair and retrofit private aircraft.jets. IS&S has established relationships with a number of aircraft modification centers throughout the United States. These modification centersStates, which act as distribution outlets for the Company'sCompany’s products.
OEM Market
The Company has beenwas selected to provide the cockpit avionics suite for the new Eclipse Aerospace, Inc. ("Eclipse") newE550 production aircraft designatedaircraft. During the E550. Eclipse isyears 2006 through late 2008, the successor toCompany provided cockpit displays in support of Eclipse Aviation Inc. ("Aviation"’s (“Aviation”) which declared bankruptcyproduction of approximately 150 aircraft until late 2008 when Aviation filed for bankruptcy. Eclipse purchased the assets of Aviation in late 2008.2009. In late 2010, Sikorsky Aircraft (a unit of United Technologies Corp.) announced its intention to invest in Eclipse. In October 2011, Eclipse announced the planned production in 2013 of the E550 aircraft and selected IS&S as the system integrator. During the years 2006 through late 2008, the Company provided cockpit displays in support of Aviation production of approximately 150 aircraft. Eclipse purchased the assets of Aviation in 2009. During the past threefive years, IS&S has been providing, through Eclipse, enhanced capability through retrofits to numerous owners of the Aviation produced aircraft.
In May 2013, Pilatus announced that it had selected IS&S to develop and manufacture the Utilities Management System (“UMS”) for the recently announced Pilatus PC-24 aircraft under a multi-year production contract. The UMS integrates multiple aircraft utility functions commonly supported by multiple individual controllers and monitors. The UMS will provide integrated control of systems from within the avionics suite and automate various normal and emergency tasks to reduce crew workload and improve safety conditions. This open architecture system will allow Pilatus to design and/or refine control and monitoring algorithms internally.
IS&S also markets its products to other original equipment manufacturers including Boeing and Lockheed Martin.
Backlog
As of September 30, 2012 and 2011, the Company's backlog was $19.7 million and $27.5 million, respectively.
| | September 30 | |
| | 2014 | | 2013 | |
| | (In Thousands) | |
Backlog, beginning of period | | $ | 91,100 | | $ | 19,712 | |
Plus: bookings during period, net | | 23,295 | | 102,955 | |
Less: Delta debooking | | (61,883 | ) | — | |
Less: revenue recognized during period | | (44,095 | ) | (31,567 | ) |
Backlog, end of period | | $ | 8,417 | | $ | 91,100 | |
Backlog represents the value of contracts and purchase orders, received, less the revenue recognized to date on those contracts and purchase orders. The year over year decrease of $7.8$82.7 million
Table of Contents
was the result of booking $28.2$23.5 million in new business, offset by $24.6$62.1 million in debookings of which $61.9 million relates to Delta’s purported termination of a contract with IS&S to provide an upgraded cockpit and certain navigation capabilities for its fleet of MD88 and MD90 aircraft, (See Item 3. Legal Proceedings), and $44.1 million of recognized revenue and order reductions of $11.4 million primarily by American Airlines.revenue. Air Datadata product backlog as of September 30, 2012 increased2014 decreased by $0.4$3.3 million from September 30, 2011,2013, and FPDS backlog as of September 30, 20122014 decreased by $8.2$79.4 million from September 30, 2011.2013, reflecting increased FPDS sales during the period and the debooking of Delta . The backlog excludes potential future sole-source production orders from products currently in development under the Company’s EDC programs, including the Eclipse E550, the Pilatus PC-24, and the KC-46A, all of which the Company expects backlog to improve in the future becauseenter into extended production phases upon completion of potential future sole source production sales resulting from the present customer-funded EMD contracts.development. Although the Company believes that the orders included in backlog are firm, most of the backlog involves orders that can be modified or terminated by the customer. As of September 30, 2012,2014, approximately 36%6% of the Company'sCompany’s backlog is notwas expected to be filled withinbeyond fiscal 2013.2015.
Engineering Development
The Company invests a large percentage of its sales on engineering development, both R&D and EMD.EDC. At September 30, 2012,2014, approximately 50%40% of the Company'sCompany’s employees were engineers engaged in various engineering development projects. IS&S invests a large percentage of its sales in engineering development to allow its customers to benefit from the latest technological advancements. Total engineering development expense is comprised of both internally funded R&D and product development and design charges related to specific customer contracts. Engineering development expense consists primarily of payroll-related expenses of employees engaged in engineering developmentEDC projects, engineering related product materials and equipment, and subcontracting costs. R&D charges incurred for product design, product enhancements, and future product development are expensed as incurred. Product development and design charges
9
Table of Contents
related to specific customer contracts are charged to cost of sales-engineering modification and developmentsales-EDC based on the method of contract accounting (either percentage of completion or completed contract) applicable to such contracts.
Sales and Marketing
IS&S focuses its sales efforts on passenger and cargo carrying aircraft operators, general aviation operators, aircraft modification centers, the DoD, DoD contractors, and OEMs. ThePeriodically, the Company periodically evaluates its sales and marketing efforts with respect to these focus areas and, where appropriate, makes use of third-party sales representatives who receive compensation through commissions based on performance.
The Company'sCompany’s ability to provide prompt and effective repair and upgrade service is critical to its marketing efforts. The Company’s customer service program offers a 24-hour customer hotline. The Company services its customers utilizing either field service engineers or its in-house repair and upgrade facility. The Company canmay lend spare units to customers during periods when it is repairing or overhauling their equipment. The Company'sCompany’s in-house turnaround times for both repairs and upgrades average less than 30 days. Generally, IS&S provides customers with a standard two-year warranty on new products. The Company offers customers extended warranties of varying termslengths beyond the two years for additional fees.
The majority of the Company'sCompany’s sales, personnel and assets are within the United States. In fiscal year 2012, 20112014, 2013 and 20102012 net sales outside the United States amounted to $4.4$12.0 million, $4.0$4.8 million and $2.8$4.4 million, respectively.
Government Regulation
FAA regulations govern the manufacture and installation of the Company'sCompany’s products in aircraft owned and operated in the United States, and the IS&S facility is FAA certified. The most significant product and installation regulations are TSO and STC, which establish the minimum product performance standards.
Generally, sales of IS&S products to European or other non-U.S. owners of aircraft require approval of EASA, the European counterpart of the FAA, or other relevant governmental agencies.
Table of Contents
EASA certification requirements for the manufacture and installation of the Company'sCompany’s products in European owned aircraft mirror FAA regulations. The EASAregulations, and its process for granting European certificationscertification is similar to that of the FAA.
In addition to product related regulations, IS&S is subject to U.S. Government procurement regulations with respect to the sale of the Company'sCompany’s products to government entities or government contractors. These regulations establish requirements which contractors must meet to do business with or on behalf of government entities. The government agency or general contractor retains the right to terminate a contract at any time at its convenience. Upon such alteration or termination, IS&S is generally entitled to an equitable adjustment to the contract price so that the Company receives the purchase price for products or services already delivered and reimbursement for allowable costs incurred and for termination related costs.
Manufacturing, Assembly and Materials Acquisition
The Company'sCompany’s manufacturing activities consist primarily of assembling and testing components and subassemblies, and integrating them into finished systems. IS&S believes this approach allows it to achieve relatively flexible manufacturing capacity and to minimize expenses. Typically, the Company purchases components for products from third-party suppliers and assembles them in a clean room environment. Many of the components purchased are standard products, although certain parts are made to the Company'sCompany’s specifications.
When appropriate, IS&S enters into long-term supply agreements and uses its relationships with long-term suppliers to improve product quality and availability, and to reduce delivery times and product costs. In addition, the Company identifies alternative suppliers for important component parts. Generally, the introduction of component parts from new suppliers ininto existing products requires FAA certification of the entire finished product if the newly sourced component varies significantly from the original drawings and specifications. To date, IS&S has not experienced significant delays in delivery of products caused by the inability to obtain either component parts or FAA approval of products incorporating new component parts.
Quality Assurance
Product quality is of vital importance to the Company's customers and IS&S.importance. The Company is ISO 9001 and AS 9100CAS9100C certified. These standards represent an international consensus on effective management practices with the goal of ensuring that a company can deliver its products and related services consistently in a manner that meets or exceeds customer quality requirements. IS&S's&S’s certification to these standards allows the Company to represent to customers that it maintains high quality industry standards in the education of its employees, and in the design and manufacture of its products. In addition, the Company'sCompany’s products undergo extensive and documented quality control testing prior to being delivered to customers. As part
10
Table of its quality assurance procedures, IS&S maintains detailed records of test results and its quality control processes.
CompetitionContents
Competition
The market for the Company'sCompany’s products is highly competitive, and the Company competes in several niches in which a number of manufacturers specialize.competitive. Competitors vary in size and resources, and substantially all of the Company'sCompany’s competitors are much larger than IS&S and have substantially greater resources. With respect to air data systems and related products, the Company'sCompany’s principal competitors include Honeywell International Inc. (“Honeywell”), Rockwell Collins, Inc., Thales Communications, Inc. (“Thales”), and Garmin.Garmin Ltd. (“Garmin”). With respect to flat panel displays, principal competitors currently include Honeywell, Rockwell Collins, Inc., L-3 Communications, Garmin and GE Aviation.Aviation Systems (“GEAS”). However, becauseas the flat panel display industry is a newevolves and
Table of Contents
evolving market, as the demand for flat panel displays increases, IS&S may face future competition in this area from other suppliers.
The Company believes that the principal competitive factors in its markets are cost, development cycle time, responsiveness to customer preferences, product quality, technology, and reliability. IS&S believes that its significant and long-standing customer relationships reflect the Company'sCompany’s ability to compete favorably with respect to these factors.
Intellectual Property and Proprietary Rights
IS&S relies on patents to protect its proprietary technology. As of September 30, 20122014, the Company holds 2429 U.S. patents and has 56 U.S. patent applications pending relating to its technology. In addition, IS&S holds 2559 international patents and has 2526 international patent applications pending. Certain of these patents and patent applications cover technology relating to air data measurement systems whileand others cover technology relating to flat panel display systems and other aspects of the COCKPIT/IP®IP® solution. While IS&S believes these patents have significant value in protecting its technology, it believes that the innovative skill, technical expertise, and know-how of the Company'sCompany’s personnel in applying the technology reflected in its patents would be difficult, costly, and time consuming to reproduce.
While IS&S is not aware of any pending lawsuits against the Company alleging patent infringement or the violation of other intellectual property rights, it cannot be certain such infringement claims will not be asserted against the Company in the future.
Employees
As of September 30, 2012,2014, IS&S had 105146 employees. The Company'sCompany’s future success depends on its ability to attract, train and retain highly qualified personnel. IS&S plans to hire additional personnel, in particular R&D engineers, during the next twelve months. Competition for such qualified personnel is intense, and the Company may not be able to attract, train, and retain highly qualified personnel in the future. The Company is non union.not unionized.
Executive Officers of the Registrant
The following is a list of the Company'sCompany’s executive officers, their ages and their positions:positions in each case. Effective December 15, 2014, Ronald C. Albrecht, the Company chief financial officer during fiscal 2014, will retire as the Company’s chief financial officer and be succeeded by Relland M. Winand:
| | | | | |
| | |
| Age | | |
| Position |
|---|
Geoffrey S. M. Hedrick | | 72 | 70 | | Chairman of the Board and Chief Executive Officer |
Shahram Askarpour | | 57 | 55 | | President |
Ronald C. Albrecht | | 69 | 67 | | Chief Financial Officer - Will retire effective December 15 |
Relland M. Winand | | 60 | | Chief Financial Officer |
Geoffrey S. M. Hedrick was the Chief Executive Officer from the time he founded the Company in February 1988 through June 4, 2007, and was reappointed as Chief Executive Officer on September 8, 2008. He has been Chairman of the Board since 1997. Prior to founding IS&S, Mr. Hedrick served as President and Chief Executive Officer of Smiths Industries North American Aerospace Companies. He founded Harowe Systems, Inc. in 1971, which was subsequently acquired by Smiths Industries. Mr. Hedrick has over 40 years of experience in the avionics industry, and he holds a number of patents in the electronics, optoelectric, electromagnetic, aerospace, and contamination control fields.
Shahram Askarpour has been President since MarchApril 2012. Dr. Askarpour joined the Company as a Director of Engineering in 2003, and was promoted to Vice President of Engineering in 2005.2005, and was promoted to President on April 2, 2012. Dr. Askarpour has more than 30 years of aerospace industry experience in managerial and technical positions. Prior to joining IS&S, he was employed by Smiths Aerospace (a division of Smiths Group PLC), Instrumentation Technology and Marconi Avionics. He holds a number of key patents in
Table of Contents
the aviation field. Dr. Askarpour received his engineering education in the United Kingdom, and received an undergraduate degree in Electrical Engineering from Middlesex University, a post graduate Certificate of Advanced Study in Systems Engineering, and a PhD in Automatic Control from Brunel University. He was awarded the title of Associate Research Fellow for three consecutive years by Brunel University, and has published numerous papers in leading international, peer reviewed journals. In addition, he has completed management courses at Carnegie Mellon University and finance courses at the Wharton Business School.
Ronald C. Albrecht has been Chief Financial Officer since August 2010. Prior to joining the Company, Mr. Albrecht served in a number of executive positions, both operational and financial, with Smiths Aerospace (UK). Smiths Aerospace was acquired by GEGeneral Electric Aviation Systems ("GEAS"(“GEAS”) in 2007. Most recently, Mr. Albrecht served as Vice President and General Manager of Smiths Aerospace Electro Mechanical Business from 2003 to 2007 and, subsequently, of GEAS'GEAS’ Electro Mechanical Business from 2007 to 2010. Prior to his operational roles, he served as Chief Financial Officer of Smiths Aerospace, based in London, and has substantial mergers & acquisition and strategic planning experience. Mr. Albrecht received a B.A. in Government and Economics from Dartmouth College and a MBAM.B.A. in Finance from Stanford University. He is a Certified Public Accountant (California/Inactive).
Other Mr. Albrecht will retire as the Company’s chief financial officer effective December 15, 2014.
11
Table of Contents
Relland M. Winand has been appointed to succeed Mr. Albrecht as the Company’s chief financial officer effective December 15, 2014. Mr. Winand has served in a number of executive financial capacities with public companies including Chief Financial Officer of ECC International, Corp, a manufacturer of computer controlled maintenance simulators primarily for the Department of Defense, and Vice President Finance and Administration of Traffic.com, Inc. a leading provider of accurate, real-time traffic information in the United States. Prior to joining Innovative Solutions and Support, Inc., from 2008 to 2013, Mr. Winand was Chief Financial Officer of Orbit/FR, Inc., an international developer and manufacturer of sophisticated microwave test and measurement systems for aerospace/defense, wireless, satellite and automotive industries. From January 2014 until August 2014, Mr. Winand served as a consultant for Solomon Edwards Group LLC. He has over 30 years’ experience in financial management and reporting for both public domestic and international manufacturing companies. Mr. Winand received a B.S. in Accounting from Drexel University and an M.B.A. in Finance from Widener University.
Other
The public may read and copy any materials filed by IS&S with the SEC at the SEC'sSEC’s public reference room located at 100 F Street, N.E., Washington, D.C. 20549. The public may obtain information about the operation of the SEC'sSEC’s public reference rooms by calling the SEC at 1-800-SEC-0330. The SEC also maintains a website at http://www.sec.gov that contains reports, proxy and information statements, and other information about issuers that file electronically with the SEC.
IS&S maintains its corporate website at http://www.innovative-ss.com and makes available, free of charge, on that website (under the "Investor Relations"“Investor Relations” tab) the Company'sCompany’s annual reportreports on Form 10-K, quarterly reports on Form 10-Q, current reports on Form 8-K, and amendments to those as reasonably practicable after it electronically files such material with, or furnishes it to, the SEC. The information on the Company'sCompany’s web site is not incorporated as part of this annual report.Annual Report on Form 10-K.
Table of Contents
Item 1A. Risk Factors
Each reader should carefully consider the risks, uncertainties and other factors described below, in addition to the other information set forth in this report, because they could materially and adversely affect the Company'sCompany’s business, operating results, financial condition, cash flows, prospects, and the value of an investment in IS&S common stock.
Risks Related to IS&S Business
Reductions in government expenditures could adversely affect IS&S business.
The Budget Control Act of 2011 (the "Budget Act") will result in reduced U.S. government funding of the defense industry unless Congress acts. The Budget Act set $900 billion in immediate cuts to discretionary government spending for 2012 through 2021. It also established a bi-partisan congressional Joint Select Committee on Deficit Reduction (the "Super Committee") and charged it with recommending legislation by November 23, 2011, the result of which would reduce net government spending by at least $1.2 trillion over the next 10 years, in addition to the $900 billion in immediate discretionary spending reductions. The failure of the Super Committee to meet its objectives has triggered an automatic sequestration of discretionary appropriations, which if not altered by Congress, will make up any shortfall necessary to achieve the $1.2 trillion target. Under the Budget Act, 50% of any shortfall from the $1.2 trillion target would automatically be applied as a reduction to discretionary appropriations for national defense programs. Unless the U.S. Government takes further action, the Budget Control Act of 2011 (Budget Act) will trigger substantial, automatic reductions in both defense and discretionary spending in January 2013. While the impact of sequestration is yet to be determined,spending. The automatic across-the-board sequestration cuts would beare in addition to reductions already reflected in the defense funding over a ten-year period. The resulting automatic across-the board budget cuts in sequestrationperiod and could have negativesignificant consequences to the Company'sCompany’s business and industry. There could be disruptionWhile the full impact of ongoing programs and initiatives, andsequestration is undetermined, the resulting personnel reductions could negatively impact the Company's manufacturing operations and engineering expertise, and accelerate the loss of skills and knowledge. The impact of any resulting reductions in defense appropriations, and/or reductions in U.S. defense spending could result in delays in procurement of products and services due to lack of funding, and negatively affect the Company'sIS&S’s revenues, financial condition and results of operations.
The ongoing global recessionuncertainty and concern regarding credit tighteningavailability could adversely affect IS&S.
The global recessionuncertainty and continued concern regarding credit availability, including failures of financial institutions, has initiatedproduced unprecedented government intervention in the U.S., Europe and other regions of the world. If these concerns continue or worsen, risks to IS&S include:
•·declines in revenues and profitability from reduced orders, payment delays or other factors caused by the economic problems of customers;
·
•- reprioritization of government spending away from defense programs in which IS&S participates;
·
•- reduced access to credit sources; and
·
•- disruptions in supplies associated with any financial constraints faced by vendors.
A portion of IS&S sales has been, and is expected to continue to be, from defense contractors or government agencies in connection with government aircraft retrofit or original equipment manufacturing contracts. Sales to government contractors and government agencies could decline as a result of DoD spending cuts and general budgetary constraints which may become more severe as the federal budget deficit remains high.
Table of Contents
Tax changes could affect the Company's effective tax rate and future profitability.
The Company's future results could be affected negatively by changes in the effective tax rate as a result of changes in the overall profitability and changes to statutory tax rates in the United States, changes in tax legislation, and the results of audits and examination of previously filed tax returns.
The loss of a key customer or a significant deterioration in the financial condition of a key customer could have a material adverse effect on the Company'sCompany’s results of operations.
The Company'sCompany’s revenue is concentrated with a limited number of customers. During fiscal year 20122014 IS&S derived 63%59% of revenue from the top 5 five customers. IS&S expects a relatively small number of customers to account for a majority of its revenues for the
12
Table of Contents
foreseeable future. As a result of the concentrated customer base, a loss of one or more of these customers or a dispute or litigation with one of these key customers could have a material adverse effect onaffect adversely its revenue and results of operations. For example, in October 2014, Delta issued a cancellation notice to the Company purporting to terminate its contract with IS&S. The Company will enter into a contractually mandated non-binding mediation with Delta in accordance with the terms of the contract. (See Item 3. Legal Proceedings).
In addition, the Company monitors and evaluates the credit status of its customers and attempts to adjust sales terms as appropriate. Despite these efforts, a significant deterioration in the financial condition or bankruptcy filing of a key customer could have a material effect onaffect adversely the Company'sCompany’s business, results of operations, and financial condition.
On November 29, 2011, AMR Corporation, the parent company of American Airlines, Inc. and certain of its other U.S.-based subsidiaries, filed voluntary petitions for Chapter 11 reorganization in the U.S. Bankruptcy Court for the Southern District of New York. The Company's revenues from American Airlines, Inc. accounted for 5%, 8% and 8% total revenue for the fiscal years 2012, 2011 and 2010, respectively. (See Note 13—Commitments and Contingencies in Notes to Consolidated Financial Statements attached).
Growth of the Company'sCompany’s customer base could be limited by delays or difficulties in completing development and introduction of planned products or product enhancements. If IS&S fails to enhance existing products, or to develop and achieve market acceptance for flat panel displays, flight management systems and other new products that meet customer requirements, its business, willreputation and statements of income may be adversely affected.affected adversely.
Currently, IS&S currently spends a large portion of its research and developmentR&D efforts in developing and marketing the FPDS, FMS, and complementary products. The Company'sCompany’s ability to grow and diversify its operations through introduction and sale of new products is dependent upon the continued success in product development and engineering activities, its sales and marketing efforts, and regulatory approvals to sell such products. Sales growth will depend in part on market acceptance of and demand for the FPDS, FMS, and future products. IS&S cannot be certain that it will be able to develop, introduce or market its FPDS, FMS, or other new products or product enhancements in a timely or cost-effective manner, or that any new products will receive market acceptance or necessary regulatory approval. In addition, the Company’s business is dependent upon maintaining its reputation and relationships with existing customers. If the Company’s performance does not meet its customers expectations, the Company’s reputation and its relationships could be damaged, which may have a material adverse impact on the Company’s business and statements of income.
In seeking new customers, the Company may have difficulty in displacing the products of incumbent competitors. Accordingly, IS&S cannot be assured that potential customers will accept its products or that existing customers will not abandon them.
The Company'sCompany’s revenue and operating results may vary significantly from quarter to quarter, which may cause its stock price to decline.
The Company'sCompany’s revenue and operating results may vary significantly from quarter to quarter due tobecause of a number of factors, including:
•·demand for products and/or delivery schedule changes by its customers;
·
•- capital expenditure budgets of aircraft owners and operators, and appropriation cycles of the U.S. government;
Table of Contents·
•- changes in the use of the
Company'sCompany’s products, including air data systems, and flat panel displays;displays, and flight management systems;
·
•- delays in introducing or obtaining government approval for new products;
·
•- new product introductions by competitors;
·
•- changes in IS&S pricing policies or pricing policies of
competitors,competitors; and
·
•- costs related to possible acquisition of technologies or businesses.
IS&S plans to structure its sales and marketing operations and to fund levels of product development in proportion to its total sales. As a result, a delay in generating revenues could cause significant variations in its operating results from quarter to quarter.
Contracts can be terminated by customers at any time and, therefore, may not result in sales.
The Company'sCompany’s retrofit projects are generally pursuant to either a direct contract with a customer or a subcontract with a general contractor to a customer (including government agencies). Each contract, including contracts with government agencies, includes various terms and conditions that impose certain requirements on IS&S, including the ability of the customergovernment agency or general contractor to alter the price, quantity or delivery schedule of the products. In addition, typically, the customerAdditionally, each government agency or general contractor retains the right to terminate the contract at any time at its convenience. Upon alteration or termination of these contracts, IS&S could beis entitled typically to an equitable adjustment to the contract price so that it may receive the purchase pricewould be compensated for delivered items that it has delivered and reimbursement for allowable costs incurred. Accordingly, because these contracts can be terminated, the Company cannot be assured that its retrofit backlog will result in sales. For example, in October 2014, Delta issued a cancellation notice to the Company purporting to terminate its contract with IS&S resulting in $61.9 million of debookings with respect thereto.
13
Table of Contents
The Company enters into fixed-price contracts or service arrangements to perform specified design and EMDEDC services related to its products that could subject IS&S to losses in the event the Company incurs cost overruns on its projects.
During fiscal 2012,2014, approximately 25%32% percent of the Company'sCompany’s total sales were from fixed-price customer funded EMD serviceEDC arrangements with customers to perform specified design and EMDEDC services related to its products. This allowsThese arrangements allow IS&S to benefit by recovering some of the cost of its engineeringproduct development group,costs, but it carries the burdenrisk of potential cost overruns because the Company assumes all of the cost risk.overruns. If the Company'sCompany’s initial cost estimates are incorrect, it can incur potentially incur large one time charges and losses on these contracts. These EMD serviceEDC arrangements can expose the Company potentially, to potential losses because the customer may compel IS&S to complete a project or, in the event of a termination for default, pay the incremental cost of its replacement by another provider regardless of the size of any cost overruns that occur over the life of the contract.provider. Because some of these projects involve new technologies and applications, and can last for more than a year, unforeseen events such as technological difficulties, fluctuations in the price of raw materials, problems with subcontractors, and cost overruns can result in the contractual price becoming less favorable or even unprofitable to IS&S over time. Furthermore, if the Company does not meet project deadlines or if its products do not meet customer specifications, it may need to renegotiate contracts on less favorable terms, be forced to pay penalties or liquidated damages, or suffer losses if the customer exercises its right to terminate. The Company'sCompany’s results of operations are dependent on its ability to maximize earnings from the EMDEDC service arrangements. Lower earnings caused by cost overruns could have a negative impact on the Company'sCompany’s financial condition, operating results, and cash flows.
IS&S depends on key personnel to manage its business effectively, and an inability to retain its key employees could adversely impact the Company'sCompany’s ability to compete.
The Company'sCompany’s success depends on the efforts, abilities, and expertise of its senior management and other key personnel. There can be no assurance IS&S will be able to retain such employees, and the
Table of Contents
loss of some of whom could damage its ability to execute its business strategy. The Company intends to continue hiring key management, engineering, and sales and marketing personnel. In spite of a U.S. unemployment rate of approximately 8% during 2012, competitionCompetition for skilled personnel is intense, and IS&S may not be able to attract or retain additional qualified personnel.
The Company'sCompany’s future success will depend in part on its ability to implement and improve its operational, administrative and financial systems and controls and to manage, train and expand its employee base. IS&S cannot be assuredprovide assurance that, after giving effect to its cost containment initiatives, that current and planned personnel levels, systems, procedures, and controls will be adequate to support the current and future customer base. In such a circumstance, the Company may not be able to exploit existing and potential market opportunities. Any delays or difficulties encountered could impair the Company'sCompany’s ability to attract new customers or maintain its relationships with existing customers.
IS&S relies on third party suppliers for components of its products, and any interruption in the supply of these components could hinder its ability to deliver products on a timely basis.
The Company'sCompany’s manufacturing process consists primarily of assembling components purchased from its supply chain. The suppliers may not continue to be available to IS&S. If the Company is unable to maintain relationships with key third party suppliers, the development and distribution of its products could be delayed until equivalent components can be obtained and integrated into the products. In addition, substitution of certain components from other manufacturers may require product redesign, FAA or other approval, which could delay the Company'sCompany’s ability to ship products.
The Company'sCompany’s competition includes other manufacturers of air data systems and flight information displays against whom it may not be able to compete successfully.
The markets for the Company'sCompany’s products are intensely competitive and subject to rapid technological change. Competitors include Honeywell, International Inc., Rockwell Collins, Inc., Thales, Communications, Inc., GE AviationGEAS, and L-3 Communications. All these competitors have substantially significantly greater financial, technical, and human resources than does IS&S. In addition, these competitors have much greater experience in and resources for marketing their products. As a result, these competitors may be able to respond more quickly to new or emerging technologies and customer preferences, or to devote greater resources to development, promotion and sale of their products than IS&S can. The Company'sCompany’s competitors may have greater name recognition and more extensive customer bases. Such competition could result in price reductions, fewer customer orders, reduced gross margins, and loss of market share.
The Company'sCompany’s success depends on its ability to protect its proprietary rights against potential risk of infringement. If IS&S is unable to protect and enforce its intellectual property rights, it may be unable to compete effectively.
The Company'sCompany’s success and ability to compete will depend in part on its ability to obtain and maintain patent or other protection for its technology and products, both in the United States and internationally. In addition, IS&S must operate without infringing the proprietary rights of others.
IS&S currently holds 2429 U.S. patents and has 56 U.S. patent applications pending. In addition, the Company holds 2559 international patents and has 2526 international patent applications pending. IS&S cannot be certain that patents will be issued on any of its present or future applications. In addition, existing patents or future patents may not adequately protect the Company'sCompany’s technology if they are not
14
Table of Contents
broad enough and are successfully challenged, or if other entities are able to develop competing methods without violating its patents. If IS&S is not successful in protecting its intellectual property, competitors could begin to offer products that incorporate the Company'sCompany’s technology. Patent protection involves complex legal and factual questions, and, therefore, is highly uncertain. Litigation relating to
Table of Contents
intellectual property is often very time consuming and expensive. If a successful claim of patent infringement were made against IS&S, and if the Company were unable to develop non-infringing technology, or to license the infringed or similar technology on a timely and cost-effective basis, the Company might not be able to produce and sell some of its products. Further, IS&S has incurred, and may continue to incur, significant legal and other costs in defense of its intellectual property.
A cybersecuritycyber security incident could have a negative impact.
A cyber-attack that bypasses the Company'sCompany’s information technology (IT)(“IT”) security systems causing an IT security breach, may lead to a material disruption of its IT business systems and/or the loss of business information resulting in an adverse business impact. Risks may include:
•·negative impact on future results due to the theft, destruction, loss, misappropriation, or release of confidential data or intellectual property;
·
•- operational or business delays resulting from the disruption of IT systems and subsequent clean-up and mitigation activities; and
·
•- negative publicity resulting in reputation or brand damage with customers, partners or industry peers.
Tax changes could affect the Company’s effective tax rate and future profitability.
The Company’s future results could be affected negatively by changes in the effective tax rate as a result of changes in the overall profitability and changes to statutory tax rates in the United States, changes in tax legislation, and the results of audits and examinations of previously filed tax returns.
IS&S may not be able to identify or complete acquisitions, or it may consummate an acquisition that adversely affects the Company'sCompany’s operating results.
One of the Company'sCompany’s strategies ismay be to acquire businesses or technologies that complement its existing operations. IS&S has limited experience in acquiring businesses or technologies. There can be no assurance IS&S will be able to acquire or profitably manage acquisitions or successfully integrate them into its operations. Furthermore, certain risks are inherent in pursuing acquisitions, such as the demands of management'smanagement’s time and attention and combiningintegrating disparate company cultures and facilities. Acquisitions may have an adverse effect on the Company'sCompany’s operating results, particularly in quarters immediately following the consummation of such transactions, as the Company integrates operations of acquired businesses into its operations. Once integrated, acquisitions may not perform as expected or be accretive to the Company'sCompany’s results of operations.
Risks Related to the Company'sCompany’s Industry
If IS&S is unable to respond to rapid technological change, its products could become obsolete and its reputation could suffer.
Future generations of flat panel displays, air data systems, engine and fuel displays, and flat panel displaysflight management systems which embody new technologies or new industry standards could render the Company'sCompany’s products obsolete. The market for aviation products is subject to rapid technological change, new product introductions, changes in customer preferences, and evolving industry standards and government regulations. The Company'sCompany’s future success will depend on its ability to:
•·embrace rapidly changing technologies;
·
•- adapt the
Company'sCompany’s products to evolving industry standards and government regulations; and
·
•- develop and introduce timely, high quality, cost effective new products, and product enhancements to address the increasingly sophisticated needs of its customers.
If IS&S fails to modify or improve its products in response to evolving industry standards and government regulations, its products could rapidly become obsolete.
The Company'sCompany’s products are currently subject to direct regulation by the FAA its European counterpart, EASA, and other equivalent organizations. The Company'sCompany’s products, as they relate to
Table of Contents
aircraft applications, must be approved by the FAA, EASA, or other equivalent organizations before they can be installed in an aircraft. To be certified, IS&S must demonstrate that its products are accurate and able to maintain certain levels
15
Table of Contents
of repeatability over time. Although certification requirements of the FAA and EASA are substantially similar, no formal reciprocity exists between the two regulators. Accordingly, even though the Company'sCompany’s products are FAA-approved,FAA approved, it may need to obtain approval from EASA or other appropriate organizations to have them certified for installation outside the United States.
Significant delay in receiving certification for newly developed products or enhancements to the Company'sCompany’s products, or the loss of certification for its existing products, could result in lost sales or delays in sales. Furthermore, new regulations or product standards, and changes to existing product standards could require IS&S to change its products and underlying technology. IS&S cannot ensure that it will receive regulatory approval on a timely basis or at all.
Inasmuch as the Company'sCompany’s products utilize sophisticated technology and are deployed in complex aircraft cockpit environments, problems with these products may arise that could harm the Company'sCompany’s reputation for quality assurance and, consequently, its business prospects.
The Company'sCompany’s products use complex system designs and components that may contain errors, omissions, or defects, particularly when the Company incorporates new technologies into its products or when it releases new versions or enhancements of its existing products. Despite the Company'sCompany’s quality assurance process, errors, omissions or defects could occur in its current products, in new products, or in new versions or enhancements of existing products. IS&S may be required to redesign or recall those products or pay damages. Such an event could result in the following:
•·delay or loss of revenues;
·
•- cancellation of customer contracts;
·
•- diversion of development resources;
·
•- damage to the
Company'sCompany’s reputation;
·
•- increased service and warranty costs; or
·
•- litigation costs.
Although IS&S carries product liability insurance, this insurance may not be adequate to cover its losses in the event of a large product liability claim. In addition, IS&S may not be able to maintain such insurance in the future.
The Company has limited experience in marketing and distributing its products internationally.
IS&S expectsplans to derive an increasing amount of its revenues from sales outside the United States, particularly in Europe. Risks inherent in doing business internationally include:
•·differing regulatory requirements;
·
•- legal uncertainty regarding liability;
·
•- tariffs, trade barriers, and other regulatory barriers;
·
•- political and economic instability;
·
•- changes in diplomatic and trade relationships;
·
•- potentially adverse tax consequences;
·
•- the impact of recessions in economies outside the United States; and
Table of Contents·
•- variances and unexpected changes in local laws and regulations.
Currently, all of the Company'sCompany’s international sales are denominated in U.S. dollars. An increase in the dollar'sdollar’s value compared to other currencies could render its products less competitive in the international markets. In the future, IS&S may be required to conduct sales in the foreign country'scountry’s local currency, thus exposing the Company to fluctuations and volatility in exchange rates that could adversely affect its operating results.
16
Table of Contents
Item 1B. Unresolved Staff Comments.
None
Item 2. Properties.
In fiscal 2001, IS&S purchased 7.5 acres of land in the Eagleview Corporate Park in Exton, Pennsylvania. Shortly thereafter, the Company constructed a 45,000 square foot design, manufacturing and office facility on this site. Land development approval allows for expansion of up to 20,400 square feet. Such expansion would provide for a 65,20065,400 square foot facility which the Company believes is adequate to meet the needs of the Company for the foreseeable future.
The Company also occupies approximately 8,358 square feet of office and warehouse space in Exton, Pennsylvania under a lease expiring March, 2018. The lease contains two options to extend the lease for a total of six additional years. The Company’s current annual lease expense for this property is approximately $52,000.
Item 3. Legal Proceedings.
In the ordinary course of business, the Company is subject to various legal proceedings and claims. IS&S does not believe any such matters that are currently pending will have a material effect on the Company'sCompany’s results of operations or financial position.position, except as described below with respect to the Delta matter.
On September 26, 2011, Farhad Daghigh, a former employee of
In October 2014 the Company filedannounced that Delta had issued a lawsuit againstcancellation notice to the Company purporting to terminate its contract with IS&S into develop, manufacture and install new cockpit displays and certain navigation capabilities on Delta’s fleet of approximately 182 MD88 and MD90 aircraft. On October 6, 2014 Delta sent the Court of Common Pleas of Chester County alleging breach of contractCompany a cancellation notice citing alleged schedule delays and violation of the Pennsylvania Wage Payment and Collection Law claiming unpaid sales commissions, prejudgment interest, and liquidated damages totaling approximately $583,000 for the fiscal years ended 2007, 2008, 2009 and 2010. The Company vehemently denies any allegations of liability and is vigorously defending the lawsuit. This matter has not been resolved as of the date hereof.technical infeasibility. The Company believes that Delta’s purported termination of the probabilitycontract was wrongful and in breach of an unfavorable outcomethe terms of the contract. The contract provides for non-binding mediation in the event of such a dispute, and the Company has initiated the mediation process. The Company had $3.7 million of unbilled receivables and $0.2 million of inventory on this claim is remote, and therefore, no contingent liability has been recorded as ofits balance sheet relating to the Delta program at September 30, 2012.2014 both of which are fully reserved. At this time, the outcome of the mediation and any potential subsequent negotiation with or litigation against Delta is not determinable.
On January 17, 2007 the Company filed suit in the Court of Common Pleas for Delaware County, Pennsylvania against Strathman Associates, a former software consultant for IS&S, alleging that Strathman had improperly used IS&S trade secret and proprietary information in assisting J2 and Kollsman in developing the J2/Kollsman Air Data Computer. The case has not been resolved as of the date hereof.
Item 4. Mine Safety Disclosures.
Not applicable.
17
Table of Contents
Part II
Item 5. Market for the Registrant'sRegistrant’s Common Equity, Related Stockholder Matters, and Issuer Repurchases of Equity Securities.
The Company'sCompany’s common stock has been traded on the NASDAQ Stock Market, LLC under the symbol "ISSC"“ISSC” since its initial public offering on August 4, 2000. The following table lists the high and low per share sale prices for the common stock for the periods indicated:
| | | | | | | | | | | | | |
| | Fiscal Year 2012 | | Fiscal Year 2011 | |
|---|
Period | | High | | Low | | High | | Low | |
|---|
First Quarter | | $ | 4.80 | | $ | 3.20 | | $ | 6.07 | | $ | 4.61 | |
Second Quarter | | | 4.51 | | | 3.50 | | | 6.16 | | | 5.67 | |
Third Quarter | | | 4.75 | | | 3.02 | | | 5.87 | | | 5.15 | |
Fourth Quarter | | | 4.50 | | | 3.20 | | | 5.80 | | | 4.42 | |
| | Fiscal Year 2014 | | Fiscal Year 2013 | |
Period | | High | | Low | | High | | Low | |
First Quarter | | $ | 8.07 | | $ | 6.57 | | $ | 5.41 | | $ | 3.20 | |
Second Quarter | | 8.82 | | 6.27 | | 4.93 | | 3.36 | |
Third Quarter | | 7.89 | | 6.13 | | 9.25 | | 4.56 | |
Fourth Quarter | | 7.91 | | 5.12 | | 8.41 | | 6.38 | |
| | | | | | | | | | | | | |
On November 30, 2012,28, 2014, there were 1716 holders of record of the shares of outstanding common stock. This total does not reflect beneficial shareholders who hold their stock in nominee or "street"“street” name through brokerage firms.
The Company did not pay dividends in fiscal 2012 or fiscal 2011.
On December 7, 2012April 17, 2014 the Company's Board of Directors declared a special cash dividend in the amount of $1.50 per share, payable on or about December 27, 2012 to shareholders of record as of the close of business on December 17, 2012. The aggregate amount of the payment to be made in connection with the dividend will be approximately $24.9 million. The declaration and payment of any dividend in the future will be at the discretion of the Company's Board of Directors.
On February 18, 2011, the Company'sCompany’s Board of Directors approved the Company'sextension of the current share repurchase program (originally approved on April 29, 2013) which allows the Company to acquire up to 1,000,000250,000 shares of the Company'sits outstanding common stock.stock until May 1, 2015. Under the share repurchase program, the Company may purchase shares of its common stock through open market transactions, in privately negotiated block purchases, or in other private transactions (either solicited or unsolicited). The timing and amount of repurchase transactions under this program will depend on market conditions, and subject to corporate and regulatory considerations. The program expired on February 10, 2012 and was extended by the Board of Directors on February 3, 2012 until February 10, 2013. The program may be discontinued or suspended at any time. During the yearyears ended September 30, 2012,2014 and 2013, the Company purchased 211,722did not make any purchases of shares of the Company’s common stock under the share repurchase plan. As at September 30, 2014, the number of shares that may be yet purchased under the new share repurchase program atwas 250,000 shares.
On December 7, 2012 the Company’s Board of Directors declared a costspecial cash dividend in the amount of $798,445 at an average cost of $3.77$1.50 per share, financed with cash. The following table sets forth the purchases made under this plan for each monthpayable on or about December 27, 2012 to shareholders of record as of the close of business on December 17, 2012. The total dividend payment was approximately $25 million. The Company did not pay dividends in fiscal year ended September 30, 2012:2014 or fiscal 2012. The declaration and payment of any dividend in the future will be at the discretion of the Company’s Board of Directors.
18
| | | | | | | | | | | | | |
Period | | Total Number of
Shares Purchased | | Average Price
Paid
per Share | | Total Number of
Shares Purchased as
Part of Publicly
Announced Plans
or Programs | | Number of
Shares that
May Yet Be
Purchased Under
the Program | |
|---|
October 2011 | | | 17,263 | | $ | 4.67 | | | 17,263 | | | 908,337 | |
November 2011 | | | 16,155 | | | 4.35 | | | 16,155 | | | 892,182 | |
December 2011 | | | 55,098 | | | 3.56 | | | 55,098 | | | 837,084 | |
January 2012 | | | 31,518 | | | 3.96 | | | 31,518 | | | 805,566 | |
February 2012 | | | 19,726 | | | 4.02 | | | 19,726 | | | 785,840 | |
March 2012 | | | 1,341 | | | 4.28 | | | 1,341 | | | 784,499 | |
April 2012 | | | — | | | — | | | — | | | 784,499 | |
May 2012 | | | 4,900 | | | 3.24 | | | 4,900 | | | 779,599 | |
June 2012 | | | 34,500 | | | 3.33 | | | 34,500 | | | 745,099 | |
July 2012 | | | 23,477 | | | 3.34 | | | 23,477 | | | 721,622 | |
August 2012 | | | 3,944 | | | 3.32 | | | 3,944 | | | 717,678 | |
September 2012 | | | 3,800 | | | 4.00 | | | 3,800 | | | 713,878 | |
| | | | | | | | | | | |
| | | 211,722 | | $ | 3.75 | | | 211,722 | | | | |
| | | | | | | | | | | |
Table of Contents
The graph below shows the cumulative shareholder return on $100 invested at the market close on September 30, 20072009 through and including September 30, 2012,2014, the last trading day before the end of the Company'sCompany’s most recently completed fiscal year, with the cumulative total return over the same time period of the same amount invested in the NASDAQ Composite Index, the Russell 2000 Index, and the Dow Jones US Aerospace & Defense Index.
COMPARISON OF 5 YEAR CUMULATIVE TOTAL RETURN*
Among Innovative Solutions and Support, Inc., the NASDAQ Composite Index, the Russell 2000 Index, and the Dow Jones US Aerospace & Defense Index
| | 9/09 | | 9/10 | | 9/11 | | 9/12 | | 9/13 | | 9/14 | |
| | | | | | | | | | | | | |
Innovative Solutions and Support, Inc. | | 100.00 | | 97.60 | | 96.41 | | 79.44 | | 228.57 | | 149.75 | |
NASDAQ Composite | | 100.00 | | 112.55 | | 116.28 | | 153.12 | | 189.49 | | 227.09 | |
Russell 2000 | | 100.00 | | 113.35 | | 109.35 | | 144.24 | | 187.59 | | 194.96 | |
Dow Jones US Aerospace & Defense | | 100.00 | | 113.44 | | 115.00 | | 137.44 | | 200.35 | | 238.46 | |
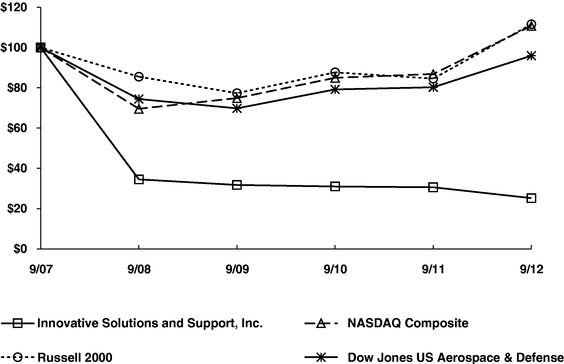
| | | | | | | | | | | | | | | | | | | |
| | 9/07 | | 9/08 | | 9/09 | | 9/10 | | 9/11 | | 9/12 | |
|---|
Innovative Solutions and Support, Inc. | | | 100.00 | | | 34.53 | | | 31.75 | | | 30.99 | | | 30.60 | | | 25.22 | |
NASDAQ Composite | | | 100.00 | | | 69.59 | | | 74.90 | | | 84.99 | | | 86.87 | | | 110.79 | |
Russell 2000 | | | 100.00 | | | 85.52 | | | 77.35 | | | 87.68 | | | 84.58 | | | 111.57 | |
Dow Jones US Aerospace & Defense | | | 100.00 | | | 74.43 | | | 69.81 | | | 79.20 | | | 80.28 | | | 95.95 | |
*$100 invested on 9/30/0709 in stock or index—including reinvestment of dividends.
Fiscal year ending September 30.
Copyright© 20122014 Dow Jones & Co. All rights reserved
Copyright© 2014 Russell Investment Group. All rights reserved.
19
Table of Contents
Item 6. Selected Consolidated Financial Data.
The following tables present portions of the Company'sCompany’s consolidated financial statements. The following selected consolidated financial data set forth below should be read together with "Management's“Management’s Discussion and Analysis of Financial Condition and Results of Operations"Operations” and the consolidated financial statements and related notes to the consolidated financial statements appearing elsewhere herein. The selected statement of operationsincome data for the fiscal years ended September 30, 2012, 20112014, 2013 and 20102012 and the balance sheet data as ofat September 30, 20122014 and 20112013 are derived from the Company'sCompany’s audited consolidated financial statements included elsewhere in this Annual Report on Form 10-K. The selected statements of operationsincome data for the fiscal years ended September 30, 20092011 and 20082010 and the balance sheet data as ofat September 30, 2010, 20092012, 2011 and 20082010 are extracted from the Company'sCompany’s audited consolidated financial statements that are not included in this Annual Report on Form 10-K.
| | Fiscal year ended September 30, | |
| | 2014 | | 2013 | | 2012 | | 2011 | | 2010 | |
Statement of Income Data: | | | | | | | | | | | |
Net sales | | $ | 44,095,023 | | $ | 31,567,307 | | $ | 24,578,198 | | $ | 25,737,652 | | $ | 25,257,323 | |
Cost of sales | | 30,508,823 | | 18,942,737 | | 14,067,933 | | 11,945,184 | | 11,520,029 | |
Gross profit | | 13,586,200 | | 12,624,570 | | 10,510,265 | | 13,792,468 | | 13,737,294 | |
Research and development | | 2,618,054 | | 2,578,034 | | 2,693,554 | | 5,500,924 | | 5,234,240 | |
Selling, general and administrative | | 11,111,014 | | 8,119,071 | | 7,400,199 | | 7,683,637 | | 8,099,587 | |
Total operating expenses | | 13,729,068 | | 10,697,105 | | 10,093,753 | | 13,184,561 | | 13,333,827 | |
Operating income (loss) | | (142,868 | ) | 1,927,465 | | 416,512 | | 607,907 | | 403,467 | |
Interest income, net | | 21,756 | | 41,174 | | 100,414 | | 142,433 | | 185,815 | |
Other income | | 37,758 | | 38,120 | | 65,005 | | 150,010 | | 50,000 | |
Income (loss) before income taxes | | (83,354 | ) | 2,006,759 | | 581,931 | | 900,350 | | 639,282 | |
Income tax expense (benefit) | | (283,622 | ) | 119,842 | | (2,397,063 | ) | 183,760 | | (109,094 | ) |
Net income | | $ | 200,268 | | $ | 1,886,917 | | $ | 2,978,994 | | $ | 716,590 | | $ | 748,376 | |
| | | | | | | | | | | |
Net income per common share: | | | | | | | | | | | |
Basic | | $ | 0.01 | | $ | 0.11 | | $ | 0.18 | | $ | 0.04 | | $ | 0.04 | |
Diluted | | $ | 0.01 | | $ | 0.11 | | $ | 0.18 | | $ | 0.04 | | $ | 0.04 | |
| | | | | | | | | | | |
Cash dividends declared per common share | | $ | — | | $ | 1.50 | | $ | — | | $ | — | | $ | — | |
| | | | | | | | | | | |
Weighted average shares outstanding: | | | | | | | | | | | |
Basic | | 16,927,879 | | 16,753,068 | | 16,641,895 | | 16,782,223 | | 16,751,528 | |
Diluted | | 17,149,106 | | 16,855,854 | | 16,641,900 | | 16,824,621 | | 16,777,886 | |
| | As of September 30, | |
| | 2014 | | 2013 | | 2012 | | 2011 | | 2010 | |
Balance Sheet Data: | | | | | | | | | | | |
Cash and cash equivalents | | $ | 15,214,584 | | $ | 16,386,207 | | $ | 42,977,501 | | $ | 42,625,854 | | $ | 40,916,346 | |
Working capital | | 29,520,030 | | 27,944,914 | | 49,087,538 | | 47,332,110 | | 46,311,056 | |
Total assets | | 44,162,510 | | 42,630,511 | | 62,597,231 | | 58,257,604 | | 57,590,522 | |
Debt and capital lease obligations, less current portion | | — | | — | | — | | — | | 15,560 | |
Total shareholders’ equity | | 37,011,524 | | 35,994,247 | | 57,080,403 | | 54,260,787 | | 53,468,037 | |
| | | | | | | | | | | | | | | | |
20
| | | | | | | | | | | | | | | | |
| | Fiscal year ended September 30, | |
|---|
| | 2012 | | 2011 | | 2010 | | 2009 | | 2008 | |
|---|
Statement of Operations Data: | | | | | | | | | | | | | | | | |
Net Sales | | $ | 24,578,198 | | $ | 25,737,652 | | $ | 25,257,323 | | $ | 36,734,150 | | $ | 30,533,311 | |
Cost of sales | | | 14,067,933 | | | 11,945,184 | | | 11,520,029 | | | 17,895,984 | | | 20,551,857 | |
| | | | | | | | | | | | |
Gross profit | | | 10,510,265 | | | 13,792,468 | | | 13,737,294 | | | 18,838,166 | | | 9,981,454 | |
Research and development | | | 2,693,554 | | | 5,500,924 | | | 5,234,240 | | | 5,313,007 | | | 10,304,279 | |
Selling, general and administrative | | | 7,400,199 | | | 7,683,637 | | | 8,099,587 | | | 8,647,506 | | | 22,306,016 | |
Asset Impairment | | | — | | | — | | | — | | | — | | | 2,475,000 | |
| | | | | | | | | | | | |
Total operating expenses | | | 10,093,753 | | | 13,184,561 | | | 13,333,827 | | | 13,960,513 | | | 35,085,295 | |
Operating income (loss) | | | 416,512 | | | 607,907 | | | 403,467 | | | 4,877,653 | | | (25,103,841 | ) |
Interest income, net | | | 100,414 | | | 142,433 | | | 185,815 | | | 315,765 | | | 1,415,732 | |
Other income | | | 65,005 | | | 150,010 | | | 50,000 | | | 50,099 | | | 17,300,000 | |
| | | | | | | | | | | | |
Income (loss) before income taxes | | | 581,931 | | | 900,350 | | | 639,282 | | | 5,243,517 | | | (6,388,109 | ) |
Income tax (benefit) expense, net | | | (2,397,063 | ) | | 183,760 | | | (109,094 | ) | | 234,856 | | | 1,509,139 | |
| | | | | | | | | | | | |
Net income (loss) | | $ | 2,978,994 | | $ | 716,590 | | $ | 748,376 | | $ | 5,008,661 | | $ | (7,897,248 | ) |
| | | | | | | | | | | | |
Net income (loss) per common share: | | | | | | | | | | | | | | | | |
Basic | | $ | 0.18 | | $ | 0.04 | | $ | 0.04 | | $ | 0.30 | | $ | (0.47 | ) |
Diluted | | $ | 0.18 | | $ | 0.04 | | $ | 0.04 | | $ | 0.30 | | $ | (0.47 | ) |
Weighted average shares outstanding: | | | | | | | | | | | | | | | | |
Basic | | | 16,641,895 | | | 16,782,223 | | | 16,751,528 | | | 16,745,379 | | | 16,887,049 | |
Diluted | | | 16,641,900 | | | 16,824,621 | | | 16,777,886 | | | 16,760,500 | | | 16,887,049 | |
Cash dividends declared per Common Share | | $ | — | | $ | — | | $ | — | | $ | — | | $ | 1.00 | |
| | | | | | | | | | | | | | | | |
| | As of September 30, | |
|---|
| | 2012 | | 2011 | | 2010 | | 2009 | | 2008 | |
|---|
Balance Sheet Data: | | | | | | | | | | | | | | | | |
Cash and cash equivalents | | $ | 42,977,501 | | $ | 42,625,854 | | $ | 40,916,346 | | $ | 35,565,694 | | $ | 35,031,932 | |
Working capital | | $ | 49,087,538 | | $ | 47,332,110 | | $ | 46,311,056 | | $ | 44,624,477 | | $ | 42,491,253 | |
Total assets | | $ | 62,597,231 | | $ | 58,257,604 | | $ | 57,590,522 | | $ | 57,536,012 | | $ | 59,896,714 | |
Debt and capital lease obligations, less current portion | | $ | — | | $ | — | | $ | 15,560 | | $ | 26,991 | | $ | 4,362,725 | |
Total shareholders' equity | | $ | 57,080,403 | | $ | 54,260,787 | | $ | 53,468,037 | | $ | 52,398,742 | | $ | 46,804,126 | |
Table of Contents
Item 7. Management'sManagement’s Discussion and Analysis of Financial Condition and Results of Operations.
The following discussion and analysis should be read in conjunction with "Selected“Selected Consolidated Financial Data"Data” and the consolidated financial statements and related notes included in this report.
Overview
Innovative Solutions and Support, Inc. (the “Company,” or “IS&S”) was foundedincorporated in Pennsylvania on February 12, 1988. The Company isoperates in one business segment as a systems integrator that designs, develops, manufactures, sells, and sellsservices flight guidance and cockpit display systems for original equipment manufacturers ("OEMs"(“OEMs”) and retrofit applications. The Company supplies integrated flight management systems ("FMS"Flight Management Systems (“FMS”) and advanced global positioning system ("GPS"Global Positioning System (“GPS”) receivers for precisionthat enable reduced carbon footprint navigation. Increasingly, theThe Company is positioningcontinues to position itself as a system integrator, which capability provides the Company with the potential to generate more substantive orders over a broader product base. The Company has demonstrated an ability to incorporate added electronic flight bag functionality such as charting and mapping systems into its Flat Panel Display Systems ("FPDS") product line. The strategy, as both a manufacturer and integrator, is designed to leverage the latest technologies developed for the computer and telecommunications industries into advanced and cost-effective solutions for the general aviation, commercial theair transport, United States Department of Defense ("DoD"(“DoD”)/governmental, and foreign military markets. This approach, combined with the Company'sCompany’s industry experience, enablesis designed to enable IS&S to develop high-qualityhigh quality products and systems, to reduce substantially product time to market and to achieve cost advantages over products offered by its competitors.
The Company's sales are derived from the sale of its productsCompany sells to both the retrofit market and OEMs. Customers include thecommercial air transport carriers and corporate/general aviation companies, DoD and its commercial contractors, aircraft operators, aircraft modification centers, foreign militaries, and various OEMs. Occasionally, IS&S sells its products directly to DoD; however, the Company sells its products primarily to commercial customers for end use in DoD programs. Sales to defense contractors are made on commercial terms, although some of the termination and other provisions of government contracts are applicable to these contracts.
Cost of sales related to product sales is comprised of material, components and componentsthird party avionics purchased from the Company's supplier base andsuppliers, direct in-house assembly labor, and overhead costs. Many components used in assemblingof the productscomponents are standard, although certain parts are manufactured to meet the Company'sIS&S specifications. The overhead portion of cost of sales is comprised primarily of salaries and benefits, building occupancy costs, depreciation, supplies, and outside service costs related to production, purchasing, material control, and quality departments, andcontrol. Cost of sales includes warranty costs.
IS&S cost
Cost of sales related to Engineering-Modification andEngineering Development ("EMD"Contracts (“EDC”) sales is comprised of engineering labor, consulting services, and other costs associated with specific design and development projects thatprojects. These costs are billable under specific customer agreements.
incurred pursuant to contractual arrangements and are accounted for typically as contract costs within cost of sales with the reimbursement accounted for as a sale in accordance with the percentage-of-completion method of accounting. Company funded research and development (“R&D”) expenditures relate to internally-funded efforts towards the development of new products and the improvement of existing products. These costs are expensed as incurred and reported as R&D expenses. The Company intends to continue investing in the development of new products that complement its current product offerings and willto expense associated R&D costs as they are incurred.
Selling, general and administrative expenses consist of sales, marketing, business development, professional services, costs; salaries and benefits for executive and administrative personnel;personnel, facility costs, recruiting, legal, and accounting, costs;bad debt expense and other general corporate expenses.
IS&S sells its products to agencies of the United States and foreign governments, aircraft operators, aircraft modification centers, and original equipment manufacturers. The Company'sCompany’s customers have been and may continue to be affected by the ongoing adverseuncertain economic conditions that currently exist both in the United States and abroad. Such conditions may cause the Company'sCompany’s customers to curtail or delay spending on both new and existing aircraft. Factors that can impact general economic conditions and the level of spending by IS&S customers include, but are not limited to, general levels of consumer spending, increases in fuel and energy costs, conditions in the real estate and mortgage markets, labor and healthcare costs, access to credit, consumer confidence, and other
Table of Contents
factors which can affect spending behavior. In addition, the Budget Control Act of 2011 triggered substantial, automatic reductions in both defense and discretionary spending. The automatic across-the-board sequestration cuts are in addition to reductions already reflected in defense funding over a ten-year period. Furthermore, future spending by government agencies may be further reduced because of declining tax revenues associated with the present economic environment.revenues. If the Company'sCompany’s customers curtail or delay their spending, or are forced to declare bankruptcy or liquidate their operations because of adverse economic conditions, IS&S's&S’s revenues and results of operations will be negatively affected. However, the Company believes that, in a decliningan uncertain economic environment, customers that may have otherwise elected to purchase newly manufactured aircraft, may be interested instead in retrofitting existing aircraft as a cost effective alternative, which will create a marketthereby creating an opportunity for IS&S's products.&S.
On November 29, 2011, AMR Corporation, the parent company of American Airlines, Inc. and certain of its other U.S.-based subsidiaries filed voluntary petitions for Chapter 11 reorganization in the U.S. Bankruptcy Court for the Southern District of New York. The Company's revenues from American Airlines, Inc. accounted for 5%, 8% and 8% total revenue for the fiscal years 2012, 2011 and 2010, respectively. As at September 30, 2012, orders from American Airlines, Inc. account for a material portion of the Company's backlog. (See Note 13—Commitments and Contingencies in Notes to Consolidated Financial Statements attached).
The Company experienced reductions ofincreases in personnel costs in fiscal 2012year 2014 primarily in the R&D and 2011,production departments, and reductions in personnel costs in each of fiscal years 2013 and 2012, primarily through resignation and retirements of employees who were not replaced, and a planned reduction in workforce. The reductions affected most departments in the Company.
21
Table of Contents
Results of Operations
The following table sets forth statement of operationsincome data expressed as a percentage of total net sales for the fiscal years indicated (some items may not add due to rounding):
| | | | | | | | | | |
| | Twelve Months Ending
September 30, | |
|---|
| | 2012 | | 2011 | | 2010 | |
|---|
Net sales: | | | | | | | | | | |
Product | | | 74.4 | % | | 97.8 | % | | 92.6 | % |
Engineering—modification and development | | | 25.6 | % | | 2.2 | % | | 7.4 | % |
| | | | | | | | |
Total net sales | | | 100.0 | % | | 100.0 | % | | 100.0 | % |
| | | | | | | | |
Cost of sales | | | | | | | | | | |
Product | | | 38.2 | % | | 45.8 | % | | 42.5 | % |
Engineering—modification and development | | | 19.0 | % | | 0.6 | % | | 3.1 | % |
| | | | | | | | |
Total cost of sales | | | 57.2 | % | | 46.4 | % | | 45.6 | % |
| | | | | | | | |
Gross profit | | | 42.8 | % | | 53.6 | % | | 54.4 | % |
Operating expenses: | | | | | | | | | | |
Research and development | | | 11.0 | % | | 21.4 | % | | 20.7 | % |
Selling, general and administrative | | | 30.1 | % | | 29.9 | % | | 32.1 | % |
| | | | | | | | |
Total operating expenses | | | 41.1 | % | | 51.3 | % | | 52.8 | % |
| | | | | | | | |
Operating income | | | 1.7 | % | | 2.3 | % | | 1.6 | % |
Interest income | | | 0.4 | % | | 0.6 | % | | 0.7 | % |
Interest (expense) | | | (0.1 | %) | | (0.1 | %) | | (0.0 | %) |
Other income | | | 0.3 | % | | 0.6 | % | | 0.2 | % |
| | | | | | | | |
Income (loss) before income taxes | | | 2.3 | % | | 3.4 | % | | 2.5 | % |
Income tax expense (benefit) | | | (9.8 | %) | | 0.7 | % | | (0.4 | %) |
| | | | | | | | |
Net income | | | 12.1 | % | | 2.7 | % | | 3.0 | % |
| | | | | | | | |
| | Twelve Months Ending September 30, | |
| | 2014 | | 2013 | | 2012 | |
Net sales: | | | | | | | |
Product | | 68.0 | % | 74.3 | % | 74.4 | % |
Engineering development contracts | | 32.0 | % | 25.7 | % | 25.6 | % |
Total net sales | | 100.0 | % | 100.0 | % | 100.0 | % |
| | | | | | | |
Cost of sales: | | | | | | | |
Product | | 34.1 | % | 33.6 | % | 38.2 | % |
Engineering development contracts | | 35.1 | % | 26.4 | % | 19.0 | % |
Total cost of sales | | 69.2 | % | 60.0 | % | 57.2 | % |
| | | | | | | |
Gross profit | | 30.8 | % | 40.0 | % | 42.8 | % |
| | | | | | | |
Operating expenses: | | | | | | | |
Research and development | | 5.9 | % | 8.2 | % | 11.0 | % |
Selling, general and administrative | | 25.2 | % | 25.7 | % | 30.1 | % |
Total operating expenses | | 31.1 | % | 33.9 | % | 41.1 | % |
| | | | | | | |
Operating income (loss) | | (0.3 | )% | 6.1 | % | 1.7 | % |
| | | | | | | |
Interest income | | 0.0 | % | 0.1 | % | 0.4 | % |
Interest (expense) | | 0.0 | % | 0.0 | % | (0.1 | )% |
Other income | | 0.1 | % | 0.1 | % | 0.3 | % |
| | | | | | | |
Income (loss) before income taxes | | (0.1 | )% | 6.3 | % | 2.3 | % |
| | | | | | | |
Income tax expense (benefit) | | (0.6 | )% | 0.4 | % | (9.8 | )% |
| | | | | | | |
Net income | | 0.5 | % | 5.9 | % | 12.1 | % |
Table of Contents
Fiscal Year Ended September 30, 20122014 Compared to Fiscal Year Ended September 30, 20112013
Net sales. Net sales decreased $1.2increased $12.5 million, or 4.5%39.7%, to $24.5$44.1 million for fiscal 20122014 from $25.7$31.6 million for fiscal 2011.2013. For fiscal 2012,2014, product sales decreased $6.9increased $6.5 million and EMDEDC sales increased $5.7$6.0 million from fiscal 2011.2013. The decreaseincrease in product sales was primarily the result of higher shipments of displays for retrofit programs to the DoD, military subcontractors and commercial transport customers. The increase in EDC sales was primarily the result of increased activity on EDC projects awarded in prior years and additional contract modifications received during fiscal 2014. EDC sales recognized under the Delta contract were $2.9 million and $0.8 million in fiscal 2014 and fiscal 2013, respectively.
Cost of sales. Cost of sales was $30.5 million, or 69.2% of net sales for fiscal 2014 compared to $18.9 million or 60% of net sales in fiscal 2013. The increase in cost of sales was primarily the result of increased sales volume in both product and EDC programs. The increase in cost of sales as a percentage of net sales reflects primarily increased costs to the EDC programs. In addition, EDC margins were negatively impacted by net cumulative catch-up adjustments of $1.5 million and $444,000 resulting from changes in estimated costs to complete on certain EDC programs for fiscal 2014 and 2013, respectively. Margin in fiscal 2014 was 30.8% as compared to 40% in fiscal 2013. The margin decrease reflects primarily the negative margins on EDC contracts and product mix shipped during fiscal 2014.
22
Table of Contents
Research and development. R&D expense was $2.6 million for fiscal 2014 and fiscal 2013. R&D expense declined to 5.9% of net sales in fiscal 2014 compared to 8.2% in fiscal 2013 reflecting the increase in fiscal 2014 net sales.
Selling, general, and administrative. Selling, general and administrative expenses increased $3.0 million, or 36.9%, to $11.1 million or 25.2%, of net sales for fiscal 2014 from $8.1 million or 25.7% of net sales, for fiscal 2013. The increase in selling, general and administrative expenses for the year ended September 30, 2014 reflects the bad debt expense of $3.7 million related to the Delta contract, (See Item 3. Legal Proceedings.), partially offset by the expense of $657,000 recorded in the year ended September 30, 2013 related to a previously disclosed legal matter. (See the description of the Daghigh matter in Note 14-Contingencies in Notes to Consolidated Financial Statements attached).
Interest income, net. Net interest income decreased by $19,000 to $22,000 for fiscal 2014 from $41,000 for fiscal 2013. The decrease in interest was primarily the result of lower cash balances throughout the year ended September 30, 2014 versus the year ended September 30, 2013. A special cash dividend of $25 million was paid to shareholders in late December 2012.
Other income. Other miscellaneous income remained unchanged in fiscal 2014 compared to fiscal 2013.
Income taxes. The income tax benefit for fiscal year ended September 30, 2014 was $0.3 million compared to an income tax expense of $0.1 million or for the fiscal year ended September 30, 2013. The tax benefit for the fiscal year ended September 30, 2014 resulted from a pretax loss of $0.1 million and the favorable impact of the Federal Research and Development Tax Credits (“Federal R&D Tax Credits”) . The tax expense for the fiscal year ended September 30, 2013 was attributable to the pretax income offset in part by Federal R&D Tax Credits. On January 1, 2013, Congress enacted the American Taxpayer Relief Act of 2012 which retroactively reinstated and extended the Federal R&D Tax Credit from January 1, 2012 to December 31, 2013. The 2013 fiscal year income tax provision reflects the benefit of the retroactive application of the Federal R&D Tax Credit for nine months from the 2012 fiscal year plus a full year benefit for the current fiscal year in accordance with FASB ASC Topic 740 “Income Taxes” (“ASC Topic 740”).
The effective tax rate for the year ended September 30, 2013 was 6.0%. The effective tax rate differs from the statutory rate for the year ended September 30, 2013 primarily because of the benefit of the retroactive application of the Federal R&D Tax Credit.
Net income. As a result of the factors described above, the Company’s net income for fiscal 2014 was $0.2 million compared to net income of $1.9 million for fiscal 2013. On a fully diluted basis, the net income per share was $0.01 for fiscal 2014, compared to $0.11 for fiscal 2013.
Fiscal Year Ended September 30, 2013 Compared to Fiscal Year Ended September 30, 2012
Net sales. Net sales increased $7.0 million, or 28.4%, to $31.6 million for fiscal 2013 from $24.6 million for fiscal 2012. For fiscal 2013, product sales increased $5.2 million and EDC sales increased $1.8 million from fiscal 2012. The increase in product sales was primarily the result of higher shipments to customers who slowed or delayedfor their respectiveupgrade and retrofit programs, while the increase in EMDEDC sales resulted from increased activity on several EDC programs and from new customer design and EMD programs.EDC programs awarded during the year. For fiscal 20122013 and 2011,2012, the Company recognized equal amountsrevenue of revenue and cost of $2.4$4.8 million and $0,$2.4 million, respectively, related to certain contracts for which, at the time of recognition, either zero margins are expected to be earned or a zero margin approach to applying the percentage of completion method is used in accordance with the guidance of Financial Accounting Standards Board (“FASB”) Accounting Standards Codification (“ASC”) Topic 605-35, "Construction-Type“Construction-Type and Production-Type Contracts", which substantially explains the lower gross profit percentage on EMD revenues for the year ended September 30, 2012 when compared to the year ended September 30, 2011.Contracts” (“ASC Topic 605-35”).
Cost of sales. Cost of sales increased $2.1$4.9 million, or 17.8%34.7%, to $14.1$18.9 million, or 60.0% of net sales, for fiscal 2013 from $14.0 million, or 57.2% of net sales, for fiscal 2012 from $11.9 million, or 46.4%2012. The increase in cost of net sales for fiscal 2011. The increase resulted primarily from the change in sales mix and the decreaseincrease in product sales volume in fiscal 20122013 as compared to fiscal 2011. As2012. In addition, EDC margins include the negative impact of net cumulative catch-up adjustments of $444,000 and $8,000 resulting from changes in estimated cost to complete on certain EDC programs for fiscal 2013 and 2012, respectively. An increased proportion of higher margin revenues generated from product sales was offset by the impact of an increase in zero margin or negative margin EDC revenues resulting in a resultlower gross profit percentage of the decreased sales volume, product cost of sales40.0% for the year ended September 30, 2012 was lower as a percentage of total net sales at 38.2%2013 compared to 45.8%42.8% for the year ended September 30, 2011. The combination2012.
Research and development. R&D expense decreased $0.1 million, or 4.3%, to $2.6 million, or 8.2% of decreased net sales, and change in product mix resulted in a lower gross profit percentage compared to the same period in the prior year.
Research and development. Research and development expense decreased $2.8 million, or 51.0%, tofor fiscal 2013, from $2.7 million, or 11.0% of net sales, for fiscal 2012, from $5.5 million or 21.4% of net sales for fiscal 2011.2012. The decrease in research and developmentR&D expense for the year ended September 30, 2012 was primarily2013 resulted from an increase in EDC revenues which required the result ofCompany to allocate more engineering resources to support new EDC programs compared to the change in mix whereby a higher number of engineering hours were devoted to working on new customer design and EMD programs instead of internal research and development.prior fiscal year.
Selling, general, and administrative. Selling, general and administrative expenses decreased $0.3increased $0.7 million, or 3.7%9.7%, to $8.1 million, or 25.7% of net sales, for fiscal 2013 from $7.4 million or 30.1% of net sales, for fiscal 2012 from $7.7 million or 29.9% of net sales for fiscal 2011.2012. The slight decreaseincrease in selling, general, and administrative expense for the year ended September 30, 20122013 was primarilycaused by the resultnon-recurring expense of $657,000 recorded for a reduced numberpreviously disclosed legal matter. (See Note 14 — Contingencies in Notes to Consolidated Financial Statements attached). The
23
Table of personnel compared to the prior year period and cost containment efforts. The increaseContents
decrease as a percentage of net sales for the year ended September 30, 2012,2013, compared to the prior year ended September 30, 2011,2012, is attributable primarily to the decreaseincrease in net sales.
Interest income, net.net . Net interest income decreased by $42,000$59,000 to $41,000, or 0.1% of net sales, for fiscal 2013 from $100,000, or 0.4% of net sales, for fiscal 2012 from $142,000 or 0.6% of net sales for fiscal 2011.2012. The decrease in interest income was primarily becausethe result of lower interest rates during fiscal 2012cash balances in the last nine months compared to fiscal 2011.the same prior year period as a result of the special cash dividend paid to shareholders in late December 2012.
Other income.Other miscellaneous income decreased marginally by $0.1 million$27,000 in fiscal 2012 when2013 compared to fiscal 2011 from proceeds of miscellaneous income items.2012.
Income taxes. The income tax benefitexpense for fiscal year ended September 30, 20122013 was $2.4$0.1 million compared to an income tax expense of $0.2 million for the fiscal year ended September 30, 2011. The tax benefit was attributable primarily to the reversal of valuation allowances of $2.4 million for the fiscal year ended September 30, 2012. The tax expense for the fiscal year ended September 30, 2013 was attributable to the pretax income offset in part by Federal Research and Development Tax Credits (“Federal R&D Tax Credit”). On January 1, 2013, Congress enacted the American Taxpayer Relief Act of 2012 relatedwhich retroactively reinstated and extended the Federal R&D Tax Credit from January 1, 2012 to federal net deferredDecember 31, 2013. The 2013 fiscal year income tax assetsprovision reflects the benefit of the retroactive application of the Federal R&D Tax Credit for nine months from the 2012 fiscal year plus a full year benefit for the current fiscal year in accordance with FASB ASC Topic 740 "“Income Taxes” (“ASC Topic 740”)."
The effective tax rate for the year ended September 30, 2013 was 6.0%. The effective tax rate differs from the statutory rate for the year ended September 30, 2013 primarily because of the recent historyfavorable impact of income before income taxes, together with projections of profitability inthe Federal R&D Tax Credit for the fiscal 2013 and future years.
year discussed above. The effective tax benefit rate for the year ended September 30, 2012 was (411.9%). The effective tax benefit rate differs from the statutory rate for the year ended September 30, 2012 primarily because of the reversal of valuation allowances of $2.4 million for the fiscal year ended September 30, 2012 related to federal net deferred tax assets in accordance with ASC Topic 740, "Income Taxes".
Table of Contents
The effective tax rate for the year ended September 30, 2011 was 20.4%. The effective tax rate differsresulting from the statutory rate for the year ended September 30, 2011 primarily due to the utilization of research and development tax credits.
The Company had maintained a full valuation allowance against its deferred tax assets in prior years due to uncertainty as to the extent and timing of profitability in future periods. At September 30, 2012, the Company considered all available evidence, including the recent history of pre-tax income before income taxes, together with projections of profitability in future periods. As a resultyears.
The current balance of this analysis, the Company determined that the positive evidence at September 30, 2012 was sufficient to conclude that it was appropriate to reverse thedeferred income tax valuation allowance previously recorded against itsrelates principally to net federal deferred tax assets at September 30, 2012.operating losses (“NOL”) of certain state taxing jurisdictions. The Company believes that its estimate of future taxable income is inherently uncertain, and if its current or future operations generate losses, further adjustments to the valuation allowance are possible. The current balance of the deferred tax valuation allowance relates principally to net operating losses ("NOL") of certain state taxing jurisdictions. There is currently no assurance of such future income before income taxes.
Net income. As a result of the factors described above, the Company'sCompany’s net income for fiscal 20122013 was $3.0$1.9 million for fiscal 2012 compared to net income of $0.7$3.0 million for fiscal 2011.2012. Net income for fiscal 2012 includes the tax benefit of $2.4 million related to the reversal of valuation allowances related to federal net deferred tax assets discussed above. On a fully diluted basis, the net income per share was $0.11 for fiscal 2013 compared to $0.18 for fiscal 2012, compared to $0.04 for fiscal 2011.2012.
Fiscal Year Ended September 30, 2011 Compared to Fiscal Year Ended September 30, 2010
Net sales. Net sales increased $0.5 million, or 1.9%, to $25.7 million for fiscal 2011 from $25.2 million for fiscal 2010. For fiscal 2011, product sales increased $1.8 million and EMD sales decreased $1.3 million from fiscal 2010. The increase in product sales was primarily the result of sales to new commercial customers and retrofit upgrades for Eclipse E500 aircraft owners through Eclipse Aerospace Inc., while the decrease in EMD sales was primarily the result of a reduction in volume and a delayed contract award.
Cost of sales. Cost of sales increased $0.4 million, or 3.7%, to $11.9 million, or 46.4% of net sales for fiscal 2011 from $11.5 million, or 45.6% of net sales for fiscal 2010. The increase resulted primarily from an increase in variable production costs associated with increased sales volume and higher material costs in fiscal 2011 compared to fiscal 2010.
Research and development. Research and development expense increased $0.3 million, or 5.1%, to $5.5 million or 21.4% of net sales for fiscal 2011 from $5.2 million, or 20.7% of net sales for fiscal 2010. This increase resulted from research and development investment incurred to win EMD contracts, and is consistent with the Company's strategy to target a percentage of total sales in a given period, for the purposes of continued investment in on-going research and development. The Company's R&D expense consists primarily of payroll-related expenses of employees engaged in R&D activities, engineering related product materials and equipment and subcontracting costs.
Selling, general, and administrative. Selling, general and administrative expenses decreased $0.4 million, or 5.1%, to $7.7 million, or 29.9% of net sales for fiscal 2011 from $8.1 million or 32.1% of net sales for fiscal 2010. The decrease was primarily the result of a reduction in selling expenses (primarily reduced participation in trade shows) and travel expenses during the year.
Interest income, net. Net interest income decreased slightly by $43,000 to $142,000 or 0.6% of net sales for fiscal 2011 from $186,000 or 0.7% of net sales for fiscal 2010. The decrease was primarily because of lower interest rates during fiscal 2011 compared to fiscal 2010.
Other income. Other income increased marginally by $0.1 million in fiscal 2011 compared to fiscal 2010 from proceeds of settlements of legal proceedings.
24
Table of Contents
Income taxes. The income tax expense for fiscal year ended September 30, 2011 was $0.2 million compared to an income tax benefit of $0.1 million for the fiscal year ended September 30, 2010. The increase in the amount of tax from a tax benefit to an expense was attributable primarily to the increase in pre-tax income for the fiscal year ended 2011, and less net reversals of deductible temporary differences in the fiscal year ended September 30, 2011 compared to the fiscal year ended September 30, 2010.
The effective tax rate for the year ended September 30, 2011 was 20.4%. The effective tax rate differs from the statutory rate for the year ended September 30, 2011 primarily due to the utilization of research and development tax credits.
The effective tax benefit rate for the year ended September 30, 2010 was (17.1%). The effective tax rate differs from the statutory rate for the year ended September 30, 2010 due to the reversal of certain deductible temporary differences in the fiscal year ended September 30, 2010, which at September 30, 2009 were offset by a valuation allowance, as such reversals generated current tax benefits in the fiscal year ended September 30, 2010, and decreases in uncertain tax positions due to the lapse of applicable statutes of limitation.
Net income. As a result of the factors described above, the Company's net income for fiscal 2011 was $0.7 million for both fiscal 2011 and fiscal 2010. On a fully diluted basis, the net income per share was $0.04 for both fiscal 2011 and for fiscal 2010.
Liquidity and Capital Resources
| | | | | | | |
| | September 30,
2012 | | September 30,
2011 | |
|---|
Cash and cash equivalents | | $ | 42,977,501 | | $ | 42,625,854 | |
Accounts receivable, net | | $ | 3,978,512 | | $ | 3,124,114 | |
Current assets | | $ | 54,377,366 | | $ | 50,572,834 | |
Current liabilities | | $ | 5,289,828 | | $ | 3,240,724 | |
Deferred revenue | | $ | 1,426,552 | | $ | 232,630 | |
Total debt and other non-current liabilities(1) | | $ | 227,000 | | $ | 769,282 | |
Quick ratio(2) | | | 8.88 | | | 14.12 | |
Current ratio(3) | | | 10.28 | | | 15.61 | |
| | | | | | | | | | |
| | Twelve Months Ended September 30, | |
|---|
| | 2012 | | 2011 | | 2010 | |
|---|
Cash flow activites: | | | | | | | | | | |
Net cash provided by operating activites | | $ | 1,380,831 | | $ | 2,276,166 | | $ | 5,600,467 | |
Net cash used in investing activites | | | (217,533 | ) | | (255,454 | ) | | (189,790 | ) |
Net cash used in financing activites | | | (811,651 | ) | | (311,204 | ) | | (60,025 | ) |
The following table highlights key financial measurements of the Company:
| | September 30, | | September 30, | |
| | 2014 | | 2013 | |
Cash and cash equivalents | | $ | 15,214,584 | | $ | 16,386,207 | |
Accounts receivable | | $ | 4,419,863 | | $ | 4,489,434 | |
Current assets | | $ | 36,526,292 | | $ | 34,437,485 | |
Current liabilities | | $ | 7,006,262 | | $ | 6,492,571 | |
Deferred revenue | | $ | 526,320 | | $ | 447,525 | |
Other non-current liabilities (1) | | $ | 144,724 | | $ | 143,693 | |
Quick ratio (2) | | 2.80 | | 3.22 | |
Current ratio (3) | | 5.21 | | 5.30 | |
| | Twelve Months Ended September 30, | |
| | 2014 | | 2013 | | 2012 | |
Cash flow activites: | | | | | | | |
Net cash (used in) provided by operating activites | | $ | (712,206 | ) | $ | (2,152,317 | ) | $ | 1,380,831 | |
Net cash used in investing activites | | (718,922 | ) | (586,801 | ) | (217,533 | ) |
Net cash provided by (used in) financing activites | | 259,505 | | (23,852,176 | ) | (811,651 | ) |
| | | | | | | | | | |
(1)
- Excludes deferred
revenue; includes current portion of capitalized lease obligations
- revenue
(2)
- Calculated as: the sum of cash and cash equivalents plus accounts receivable, net, divided by current liabilities
(3)
- Calculated as: current assets divided by current liabilities
The Company'sCompany’s principal source of liquidity has been cash flows from current year operations and cash accumulated from prior years'years’ operations. Cash is used principally to finance inventory, accounts receivable, unbilled receivables, and payroll.
TableOperating Activities
The Company used $0.7 million of Contents
Operating Activitiescash in operating activities during fiscal 2014 compared to a $2.2 million use of cash in fiscal 2013. The cash used in operating activities for the year ended September 30, 2014 resulted primarily from an increase in net unbilled receivables of $0.9 million, inventory of $1.3 million and deferred income taxes of $0.6 million, partially offset by cash provided from increase in accrued expenses of $0.6 million, share-based compensation of $0.6 million and depreciation and amortization of $0.6 million. Unbilled receivables represent principally sales recorded under the percentage-of-completion method of accounting that have not been billed to customers in accordance with applicable contract terms on engineering development projects. The increases in both unbilled receivables and inventory reflect increased sales in the engineering development contract and product sales in fiscal 2014.
The Company used $2.2 million of cash in operating activities during fiscal 2013 compared to operating activities providing cash of $1.4 million during fiscal 2012. The cash used in operating activities for the year ended September 30, 2013 resulted primarily from an increase in unbilled receivables of $4.9 million, partially offset by cash provided from increases in accounts payable and accrued expenses of $2.0 million. The Company expects to recover the cash invested in funding the EDC programs from customers as it completes project milestones.
During fiscal 2012, the Company generated $1.4 million in cash from operating activities. Cash generated from operations was dueattributable primarily to increases in accounts payable, accrued expenses and deferred revenues resulting from advance billings to customers as scheduled by the respective EMD program contracts. These wereEDC programs, offset partially by increases in inventory and unbilled receivables, which funded materials, inventory and third party service providers to fulfill the Company'sCompany’s obligations under the EMDEDC programs.
The Company generated $2.3 million in cash flow from operating activities during fiscal 2011. A focus on inventory reduction contributed to the positive cash flow, and was offset by increases in accounts receivable and decreases in accounts payable and accrued expenses. Increase in accounts receivable at the end
25
Table of 2011 was due to higher sales to customers on normal credit terms at the end of the year compared to sales to customers on advance payment terms at the end of 2010.
Cash flow provided by operating activities was $5.6 million in fiscal 2010, or a $0.3 million increase from fiscal 2009, despite the $4.3 million decline in net income in fiscal 2010. The increase was attributable primarily to decreases in accounts receivable, prepaid expenses, inventory reductions and an increase in income tax payable, offset by a decrease in accounts payable and accrued expenses.
Investing ActivitiesContents
Investing Activities
Cash used in investing activities was $0.2$0.7 million, $0.3$0.6 million and $0.2 million for fiscal yearyears 2014, 2013 and 2012 2011 and 2010 respectively, and consisted of spending for production equipment and laboratory test equipment and licensing fees.equipment. The Company plans to continue investing in capital expenditures atequipment to support engineering development efforts and operations.
Financing Activities
Cash provided by financing activities was $0.3 million for fiscal year 2014 and consisted of the proceeds from the exercise of stock options by employees.
On December 7, 2012, the Company’s Board of Directors declared a special cash dividend in the amount of $1.50 per share which was paid to shareholders on December 27, 2012. The aggregate amount of the dividend payment was approximately $25 million. For the same level it has in prior years.
Financing Activitiesfiscal year ended September 30, 2013, the Company received $1.2 million from the exercise of options to acquire shares of common stock. The Company used $696 to purchase 175 shares of the Company’s common stock under the share repurchase program on the first day of fiscal 2013.
Cash used in financing activities was $0.8 million for fiscal year 2012 and was used primarily for the repurchase of 211,722 shares of the Company's common stock. Cash used in financing activities was $0.3 million for fiscal year 2011 and consisted primarily of the repurchase of 62,400 shares of the Company's common stock. Cash used in financing activities was $0.1 million for fiscal year 2010 and consisted primarily of the repurchase of 12,000 shares of the Company'sCompany’s common stock.
Summary
Future capital requirements depend upon numerous factors, including market acceptance of the Company'sCompany’s products, the timing and rate of expansion of business, acquisitions, joint ventures, and other factors. IS&S has experienced increases in expenditures since its inception and anticipates that expenditures will continuereturn to increaselevels experienced prior to fiscal 2014 in the foreseeable future. On December 7, 2012 the Company's Board of Directors declared a special cash dividend in the amount of $1.50 per share, payable on or about December 27, 2012 to shareholders of record as of the close of business on December 17, 2012. The aggregate amount of the payment to be made in connection with the dividend will be approximately $24.9 million. The Company believes that its cash and cash equivalents after payment of the special cash dividend will still beprovide sufficient to provide capital to fund operations for at least the next twelve months. Further, IS&S may need to develop and introduce new or enhanced products, to respond to competitive pressures, to invest in or acquire businesses or technologies, or to respond to unanticipated requirements or developments. If additional funds are raised through the issuance of equity securities, dilution to existing shareholders may result. If insufficient funds are available, the Company may not be able to introduce new products or to compete effectively.
Table of Contents
Contractual Obligations
The Company'sCompany’s contractual obligations as of September 30, 20122014 mature as follows:
| | Payments Due by Period | |
| | | | Less than | | | | | | After 5 | |
Contractual Obligations | | Total | | 1 Year | | 1-3 Years | | 4-5 Years | | Years | |
Operating leases | | $ | 319,989 | | $ | 95,782 | | $ | 224,207 | | $ | — | | $ | — | |
Purchase obligations (1) | | 2,102,045 | | 2,042,087 | | 47,719 | | 12,240 | | — | |
Other liabilities | | 11,725 | | — | | 11,725 | | — | | — | |
| | $ | 2,433,759 | | $ | 2,137,868 | | $ | 283,651 | | $ | 12,240 | | $ | — | |
| | | | | | | | | | | | | | | | |
| | Payments Due by Period | |
|---|
Contractual Obligations | | Total | | Less than 1 Year | | 1-3 Years | | 4-5 Years | | After 5 Years | |
|---|
Office lease | | | 10,577 | | | 10,577 | | | — | | | — | | | — | |
Purchase obligations* | | | 1,881,045 | | | 1,620,695 | | | 77,282 | | | 183,068 | | | — | |
Other liabilities | | | 98,002 | | | — | | | 98,002 | | | — | | | — | |
| | | | | | | | | | | | |
| | $ | 1,989,624 | | $ | 1,631,272 | | $ | 175,284 | | $ | 183,068 | | $ | — | |
| | | | | | | | | | | | |
*(1)A "purchase obligation"“purchase obligation” is defined as an agreement to purchase goods or services that is enforceable and legally binding on the Company and that specifies all significant terms, including:including fixed or minimum quantities to be purchased; fixed, minimum or variable price provisions; and the approximate timing of the transaction. These amounts are primarily comprised of open purchase order commitments entered in the ordinary course of business with vendors and subcontractors pertaining to fulfillment of the Company'sCompany’s current order backlog.
Off-Balance Sheet Arrangements
The Company has no off-balance sheet arrangements.
Inflation26
Table of Contents
Inflation
IS&S does not believe inflation had a material effect on its financial position or results of operations during the past three years. However,years; however, it cannot predict future effects of inflation.
Critical Accounting Policies
The preparation of financial statements in conformity with accounting principles generally accepted in the United States of America ("GAAP"(“GAAP”) requires management to make estimates and assumptions that affect reported amounts of assets and liabilities, disclosure of contingent assets and liabilities at the date of the financial statements and the reported amount of revenues and expenses during the reporting period. The Company'sCompany’s most critical accounting policies are revenue recognition, income taxes, inventory valuation, share based compensation and warranty reserves.
Revenue recognition
The Company enters into sales arrangements with customers that, in general, provide for the Company to design, develop, manufacture and deliver air data equipment, large flat-panel display systems, flight information computers, and advanced monitoring systems that measure and display critical flight information, including data relative to aircraft separation, airspeed, and altitude, as well asand engine and fuel data measurements. The Company'sCompany’s sales arrangements may include multiple deliverables as defined in FASB ASC Topic 605-25 "“Multiple-Element Arrangements"Arrangements ("” (“ASC Topic 605-25"605-25”), which typically include design and engineering services and the production and delivery of the flat panel display and related components. The Company includes any design and engineering services elements in EMDEDC sales and any functional upgrade and product elements in product sales on the accompanying consolidated statementstatements of operations.income.
To the extent that an arrangement contains software elements that are essential to the functionality of tangible products sold in the arrangement, the Company recognizes revenue for the deliverables in
Table of Contents
accordance with the guidance included in FASB Accounting Standards Update 2009-14, "“Revenue Arrangements That Include Software Elements", ("” (“ASU 2009-14"2009-14”), ; and FASB Accounting Standards Update 2009-13, “Multiple-Deliverable Revenue Arrangements-a consensus of the FASB Emerging Issues Task Force” (“ASU 2009-132009-13”); and FASB ASC Topic 605, "Revenue Recognition" ("“Revenue Recognition” (“ASC Topic 605"605”).
To the extent that an arrangement contains software components, which include functional upgrades that are sold on a standalone basis and which the Company has deemed outside the scope of the exception defined by ASU 2009-14, the Company recognizes software revenue in accordance with ASC Topic 985, "“Software" ("” (“ASC Topic 985"985”).
Multiple Element Arrangements—Arrangements
The Company identifies all goods and/or services that are to be delivered separately under such a sales arrangement and allocates revenuesales to each deliverable (if more than one) based on that deliverable'sdeliverable’s selling price. The Company then considers the appropriate recognition method for each deliverable. The Company'sCompany’s multiple element arrangements can include typically defined design and development activities, and/or functional upgrades, along withand product sales.
The Company utilizes the selling price hierarchy that has been established by FASB Accounting Standards UpdateASU 2009-13, "Multiple-Deliverable Revenue Arrangements—a consensus of the FASB Emerging Issues Task Force" ("ASU 2009-13"), which requires that the selling price for each deliverable be based on vendor-specific objective evidence if available, third-party evidence if vendor-specific objective evidence is not available, or estimated selling price if neither vendor-specific objective evidence nor third-party evidence is available. To the extent that an arrangement includes a deliverable for which estimated selling price is used, the Company'sCompany determines the best estimate of selling price by applying the same pricing policies and methodologies that would be used to determine the price to sell the deliverable on a standalone basis.
To the extent that an arrangement contains defined design and EMDEDC activities as an identified deliverable in addition to products (resulting in a multiple element arrangement), the Company recognizes as EMD revenueEDC sales amounts earned during the design and development phase of the contract following the guidance included in FASB ASC Topic 605-35, "“Construction-Type and Production-Type Contracts" ("Contracts” (“ASC Topic 605-35"605-35”). To the extent that multiple element arrangements include product sales, revenue issales are generally recognized once revenue recognition criteria for the product deliverabledeliverables have been met based on the provisions of FASB ASC Topic 605. The Company includes any design and engineering services elements in EMDEDC sales and any functional upgrade and product elements in "Product"product sales on the accompanying consolidated statementstatements of operations.income.
Single Element Arrangements—
Products—Arrangements
Products
To the extent that a single element arrangement provides for product sales and repairs, the Company recognizes revenue when revenue recognition criteria for the product deliverable have been met based on the provisions of ASC Topic 605. TheIn addition, the Company also receives orders for equipment and parts. Generally,parts, and in general, recognizes revenue from the sale of such products is recognized upon shipment to the customer.
27
Table of Contents
The Company offers its customers extended warranties for additional fees. These warranty sales are recordedfees, which it records as deferred revenue and recognizedrecognizes as sales on a straight-line basis over the warranty period.
Engineering—modification and development servicesperiods.
Engineering development contract services
The Company may enter into contracts to perform specified design and EMDEDC services related to its products. The Company recognizes revenue from these arrangements as EMDEDC revenue, following the guidance included in ASC Topic 605-35, and considers the nature of these contracts (including
Table of Contents
term, size of contract, and level of effort) when determining the appropriate accounting treatment for a particular contract. Certain of these contracts are accounted for under the percentage-of-completion method of accounting when the Company determines that progress toward completion is reasonable and reliably estimable, and the contract is long-term in nature. The Company uses the completed contract method for all others contracts. Sales and earningsprofit margins under the percentage-of-completion method are recorded based on the ratio of actual costs incurred to total estimated costs expected to be incurred related to the contract under the cost-to-cost method (for development effort).method.
The percentage-of-completion method of accounting requires the Company to estimate the profit margin for each individual contract, and to apply that profit margin on a uniform basis as sales are recorded under the contract. The estimation of profit margins requires the Company to make projections of the total sales to be generated and the total costs that will be incurred under a contract. TheseThe projections require the Company to make numerous assumptions and estimates relating to items such as the complexity of design and related development costs, performance of subcontractors, availability and cost of materials, engineering productivity and cost, overhead, and capital costs. These contracts sometimeContracts sometimes include purchase options for additional quantities and customer change orders for additional or revised product functionality. Sales and costs related to profitable purchase options are included in the Company'sCompany’s estimates only when the options are exercised, while sales and costs related to unprofitable purchase options are included in the Company'sCompany’s estimates when exercise is determined to be probable. Sales related to change orders are included in profit estimates only if they can be estimated reliably estimated and collectability is reasonably assured. Purchase options and change orders are accounted for either as an integral part of the original contract or separately, depending upon the nature and value of the item. Anticipated losses on contracts are recognized in full in the period in which losses become probable and estimable.
For contracts for which uncertainty regarding the performance against certain contract terms remains and in which no loss is expected, the Company uses the zero profit margin approach to applying the percentage of completion method following the guidance included in FASB ASC Topic 605-35.
Estimates
The Company reviews estimates of profit margins for contracts are reviewed typically by the Company on a quarterly basis. AssumingIf the initial estimates of sales and costs under a contract are accurate, the percentage-of-completion method results in the profit margin being recorded evenly as revenue is recognized under the contract.contracts. Changes in these underlying estimates due tobecause of either revisions in sales and cost estimates or the exercise of contract options may result in profit margins being recognized unevenly over a contract asbecause such changes are accounted for on a cumulative basis in the period in which estimates are revised. Significant changes in estimates related to accounting for long-term contracts may have a material effect on the Company'sCompany’s results of operationsincome in the period in which the revised estimate is made. Cumulative catch-up adjustments resulting from changes in estimates did not have a material effect on our resultsare disclosed in the notes to the consolidated financial statements of operations during the years ended September 30, 2012, 2011 or 2010.Company.
Income taxes
Income taxes are recorded in accordance with FASB ASC Topic 740, "Income Taxes" ("“Income Taxes” (“ASC Topic 740"740”), which utilizes a balance sheet approach to provide for income taxes. Under this method, the Company recognizes deferred tax assets and liabilities for temporary differences between the financial reporting basis and the tax basis of the Company'sCompany’s assets, liabilities, and expected benefits of utilizing net operating lossNOL and tax credit carry-forwards. The impact on deferred taxes of changes in tax rates and laws, if any, are applied to the years during which temporary differences are expected to be settled, and are reflected in the consolidated financial statements in the period of enactment. At the end of each interim and year-end reporting period, the Company prepares an estimate of the annual effective income tax rate and applies that annual effective income tax rate to ordinary year-to-date pre-tax income for the interim period. Specific tax items discrete to a particular quarter are recorded in income tax expense for that quarter. The estimated annual effective tax rate used in providing for income taxes on a year-to-date basis may change in subsequent periods.
Deferred tax assets are reduced by valuation allowances if, based on the consideration of all available evidence, it is more likely than not that some portion of the deferred tax asset will not be
Table of Contents
realized. Significant weight is given to evidence that can be objectively verified, and significant management judgment is required in determining any valuation allowances recorded against net deferred tax assets. The Company evaluates deferred income taxes on a quarterly basis to determine if valuation allowances are required by considering available evidence. Deferred tax assets are recognized when expected future taxable income is sufficient to allow the related tax benefits to reduce taxes that would otherwise be payable. The sources of taxable income that may be available to realize the benefit of deferred tax assets are future reversals of existing taxable temporary differences, future taxable income exclusive of reversing temporary differences and credit carry-forwards, taxable income in carry-back years, and tax planning strategies which are both prudent and feasible. The Company believes that its estimate of future taxable income is inherently uncertain and if its current
28
Table of Contents
or future operations generate losses, that it could make further adjustments to the valuation allowance are possible.allowance. The current balance of the deferred tax valuation allowance relates principally to net operating losses ("NOL")NOL of certain state taxing jurisdictions. There is currently no assurance of such future income before income taxes.
The accounting for uncertainty in income taxes requires a more likely than not threshold for financial statement recognition and measurement of tax positions taken or expected to be taken in a tax return. The Company records a liability for the difference between the (i) benefit recognized and measured for financial statement purposes and (ii) the tax position taken or expected to be taken on the Company'sCompany’s tax return. To the extent that the Company'sCompany’s assessment of such tax positions changes, the change in estimate is recorded in the period in which the determination is made. The Company has elected to record any interest or penalties associated with uncertain tax positions as income tax expense.
Inventory valuation
The Company values inventory at the lower of cost (first-in, first-out) or market. Inventories are written down for estimated obsolescence equal to the difference between inventory cost and estimated net realizable value based on a combination of historical usage and assumptions based on expected usage related to estimated future customer and market demands. The Company'sCompany’s method of valuing inventory contains uncertainties because the calculation requires management to consider inventory aging, to make assumptions regarding expected usage, and to apply judgments on forecasted future demand, market conditions, and technological obsolescence. If actual future demand or market conditions are less favorable than those projected by management, additional inventory write-down may be required.
Stock-based compensation
The Company accounts for stock-based compensation under FASB ASC Topic 505-50,"“Equity-Based Payments to Non-Employees"Non-Employees” (" (“ASC Topic 505-50"505-50”) and FASB ASC Topic 718, "“Stock Compensation" ("” (“ASC Topic 718"718”), which require the Company to measure the cost of employee or non-employee director services received in exchange for an award of equity instruments based on the grant-date fair value of the award using an option pricing model. That cost is recognized over the period during which an employee or non-employee director is required to provide service in exchange for the award.
Accordingly, adoption of ASC Topic 505-50's505-50’s and ASC Topic 718's718’s fair value method results in recording compensation costs under the Company'sCompany’s stock based compensation plans. The Company determined the fair value of its stock option awards at the date of grant using the Black-Scholes option pricing model. Option pricing models and generally accepted valuation techniques require management to make assumptions and to apply judgment to determine the fair value of its awards. These assumptions and judgments include estimating future volatility of the Company'sCompany’s stock price, expected dividend yield, future employee turnover rates, and future employee stock option exercise behaviors.
Table of Contents
Changes in these assumptions can materially affect fair value estimates. The Company does not believe that there is a reasonable likelihood exists that there will be a material change in future estimates or assumptions used to determine stock-based compensation expense. However, if actual results are not consistent with the Company'sCompany’s estimates or assumptions, the Company would have to adjust its estimates. Such adjustments could have a material impact on the Company'sCompany’s financial position.
Warranty reserves
The Company offers warranties on allsome products of various lengths. At the time of shipment, and when sold separately, the Company establishes a reserve estimated for costs of warranties based on its best estimate of the amounts necessary to settle future and existing claims using historical data on products sold as of the balance sheet date. The length of the warranty period, the product'sproduct’s failure rates, and the customer'scustomer’s usage affect warranty cost. If actual warranty costs differ from the Company'sCompany’s estimated amounts, future results of operations could be adversely affected.affected adversely. Warranty cost is recorded as cost of sales, and the reserve balance is recorded as an accrued expense. While the Company maintains product quality programs and processes, its warranty obligation is affected by product failure rates and the related corrective costs. If actual product failure rates and/or corrective costs differ from the estimates, the Company revises estimated warranty liability.
Self-insurance reserves
Beginning January 1, 2014, the Company self-insured a significant portion of its employee medical insurance. The Company maintains a stop-loss insurance policy that limits its losses both on a per employee basis and an aggregate basis. Liabilities associated with the risks that are retained by the Company are estimated based upon actuarial assumptions such as historical claims experience, demographic factors and other actuarial assumptions. The Company estimated the total medical claims incurred but not reported and the Company believes that it has adequate reserves for these claims at September 30, 2014. However, the actual value of such claims could be significantly affected if future occurrences and claims differ from these assumptions. At September 30, 2014, the estimated liability for medical claims incurred but not reported was $106,000. The Company has recorded the excess of funded premiums over estimated claims incurred but not reported of $169,000 as a current asset in the accompanying consolidated balance sheet.
29
Table of Contents
New Accounting Pronouncements
In May 20112014, the FASBFinancial Accounting Standards Board (FASB) issued ASU 2011-04, "Fair Value MeasurementNo. 2014-09, “Revenue from Contracts with Customers (Topic 820), Amendments to Achieve Common Fair Value Measurement606)”. The comprehensive new standard will supersede existing revenue recognition guidance and Disclosure Requirements in U.S. GAAP and IFRSs". ("ASU 2011-04"). ASU 2011-04 amends the fair value measurement and disclosure guidance to converge GAAP and IFRS requirements for measuring amounts at fair value as well as disclosures about these measurements. ASU 2011-04 wasrequire revenue to be adopted prospectively and wasrecognized when promised goods or services are transferred to customers in amounts that reflect the consideration to which the Company expects to be entitled in exchange for those goods or services. The new standard is effective for the interim and annualreporting periods beginning after December 15, 2011.2016, and early adoption is not permitted. Adoption of the new rules could affect the timing of revenue recognition for certain transactions. The guidance permits two implementation approaches, one requiring retrospective application of the new standard with restatement of prior years and one requiring retrospective application of the new standard with the cumulative effect of applying the new standard as of the date of initial application recognized and disclosure of results under old standards. The Company is currently evaluating the impacts of adoption and the implementation approach to be used.
In July 2013, the FASB issued ASU 2013-11, “Presentation of an Unrecognized Tax Benefit when a Net Operating Loss Carryforward, a Similar Tax Loss, or a Tax Credit Carryforward Exists” (“ASU 2013-11”). ASU 2013-11 provides that a liability related to an unrecognized tax benefit should be offset against a deferred tax asset for a NOL carryforward, a similar tax loss or a tax credit carryforward if such liability is to be settled by reducing an available tax carryforward in the event the uncertain tax position is disallowed. ASU 2013-11 is effective for fiscal years, and interim periods within those years, beginning after December 15, 2013 for public entities, with early adoption permitted. The adoption of ASU 2011-042013-11 during the fourth quarter of fiscal year ending September 30, 2013 did not have a material impact on the Company'sCompany’s consolidated financial statements.
In June 2011, the FASB issued ASU No. 2011-05, "Comprehensive Income (Topic 220): Presentation of Comprehensive Income" ("ASU 2011-05") which requires that all non-owner changes in stockholders' equity be presented either in a single continuous statement of comprehensive income or in two separate but consecutive statements. In the two-statement approach, the first statement would present total net income and its components followed consecutively by a second statement that would present total other comprehensive income, the components of other comprehensive income, and the total of comprehensive income. ASU 2011-05 is to be adopted retrospectively and is effective for annual periods beginning after December 2011. The adoption of ASU 2011-05 will not have an impact on the Company's consolidated financial position, results of operations, or cash flows, because the guidance only changes the presentation of financial information. On December 15, 2011, the FASB issued ASU 2011-12 deferring the effective date for implementation of ASU 2011-05 related only to reclassification out of accumulated other comprehensive income until a later date to be determined after further consideration by the FASB.
Business Segments
The Company operates in one business segment whichas a systems integrator that designs, manufactures, sells, and sellsservices flight information computers, large flat-panel displaysguidance and advanced monitoringcockpit display systems to the DoD, government agencies, defense contractors,for OEMs and retrofit applications. Customers include commercial air transport carriers and corporate/general aviation markets.companies, DoD and its commercial contractors, aircraft operators, aircraft modification centers, foreign militaries, and various OEMs. The Company currently derives the majority of its revenues from the sale of this equipment and related EMDEDC services. Almost all of the Company'sCompany’s sales, operating results and identifiable assets are in the United States. In fiscal year 2012, 2011,2014, 2013, and 20102012 net sales outside the United States amounted to $12 million, $4.8 million and $4.4 million, $4.0 million and $2.8 million, respectively.
Table of Contents
Item 7A. Quantitative and qualitative disclosures about market risk.
The Company'sCompany’s operations are exposed to market risks primarily as a result of changes in interest rates. The Company does not use derivative financial instruments for speculative or trading purposes. The Company'sCompany’s exposure to market risk for changes in interest rates relates to its cash equivalents. The Company'sCompany’s cash equivalents consist of funds invested in money market accounts,funds, which bear interest at a variable rate. The Company does not participate in interest rate hedging. A change in interest rates earned on the Company’s cash equivalents would impact interest income and cash flows, but would not impact the fair market value of the underlying instruments. Assuming that the balances during fiscal 20122014 were to remain constant and no actions were takenthat the Company did not act to alter the existing interest rate sensitivity, a hypothetical 1% increase in the Company's variable interest rates would have affected interest income by approximately $0.4$0.1 million. This would result in a net impact on cash flows of approximately $0.4$0.1 million for fiscal 2012.2014.
Item 8. Financial statements and supplementary data.
The financial statements of Innovative Solutions and Support, Inc. listed in the index appearing under Item 8 herein are filed as part of this Report.
Table of Contents
Innovative Solutions and Support, Inc.
INDEX TO CONSOLIDATED FINANCIAL STATEMENTS
30
| | |
| | Page |
|---|
Report of Independent Registered Public Accounting Firm
| | 39 |
Consolidated Balance Sheets
| | 40 |
Consolidated Statements of Operations
| | 41 |
Consolidated Statements of Shareholders' Equity
| | 42 |
Consolidated Statements of Cash Flows
| | 43 |
Notes to Consolidated Financial Statements
| | 44-67 |
Table of Contents
Innovative Solutions and Support, Inc.
INDEX TO CONSOLIDATED FINANCIAL STATEMENTS
31
Table of Contents
REPORT OF INDEPENDENT REGISTERED PUBLIC ACCOUNTING FIRM
Board of Directors and Shareholders
Innovative Solutions and Support, Inc.
We have audited the accompanying consolidated balance sheet of Innovative Solutions and Support, Inc. (a Pennsylvania corporation) and subsidiaries (the “Company”) as of September 30, 2014, and the related consolidated statements of income, shareholders’ equity, and cash flows for the year ended September 30, 2014. These financial statements are the responsibility of the Company’s management. Our responsibility is to express an opinion on these financial statements based on our audit.
We conducted our audit in accordance with the standards of the Public Company Accounting Oversight Board (United States). Those standards require that we plan and perform the audit to obtain reasonable assurance about whether the financial statements are free of material misstatement. An audit includes examining, on a test basis, evidence supporting the amounts and disclosures in the financial statements. An audit also includes assessing the accounting principles used and significant estimates made by management, as well as evaluating the overall financial statement presentation. We believe that our audit provides a reasonable basis for our opinion.
In our opinion, the consolidated financial statements referred to above present fairly, in all material respects, the financial position of Innovative Solutions and Support, Inc. and subsidiaries as of September 30, 2014, and the results of their operations and their cash flows for the year ended September 30, 2014 in conformity with accounting principles generally accepted in the United States of America.
We also have audited, in accordance with the standards of the Public Company Accounting Oversight Board (United States), the Company’s internal control over financial reporting as of September 30, 2014, based on criteria established in the 1992 Internal Control—Integrated Framework issued by the Committee of Sponsoring Organizations of the Treadway Commission (COSO), and our report dated December 15, 2014 expressed an unqualified opinion on the Company’s internal control over financial reporting.
/s/ GRANT THORNTON LLP
Philadelphia, Pennsylvania
December 15, 2014
32
Table of Contents
REPORT OF INDEPENDENT REGISTERED PUBLIC ACCOUNTING FIRM
To the Board of Directors and Shareholders of
Innovative Solutions and Support, Inc.
Exton, Pennsylvania
We have audited the accompanying consolidated balance sheetssheet of Innovative Solutions and Support, Inc. and subsidiaries (the "Company"“Company”) as of September 30, 2012 and 2011,2013, and the related consolidated statements of operations,income, cash flows, and shareholders'shareholders’ equity for each of the threetwo years in the period ended September 30, 2012.2013. These consolidated financial statements are the responsibility of the Company'sCompany’s management. Our responsibility is to express an opinion on the financial statements based on our audits.
We conducted our audits in accordance with the standards of the Public Company Accounting Oversight Board (United States). Those standards require that we plan and perform the audit to obtain reasonable assurance about whether the financial statements are free of material misstatement. An audit includes examining, on a test basis, evidence supporting the amounts and disclosures in the financial statements. An audit also includes assessing the accounting principles used and significant estimates made by management, as well as evaluating the overall financial statement presentation. We believe that our audits provide a reasonable basis for our opinion.
In our opinion, such consolidated financial statements present fairly, in all material respects, the financial position of the Company as of September 30, 2012 and 2011,2013 and the results of its operations and its cash flows for each of the threetwo years in the period ended September 30, 2012,2013, in conformity with accounting principles generally accepted in the United States of America.
We have also audited, in accordance with the standards of the Public Company Accounting Oversight Board (United States), the Company's internal control over financial reporting as of September 30, 2012, based on the criteria established inInternal Control—Integrated Framework
/s/ DELOITTE & TOUCHE LLP issued by the Committee of Sponsoring Organizations of the Treadway Commission and our report dated December 12, 2012 expressed an unqualified opinion on the Company's internal control over financial reporting. | |
Philadelphia, Pennsylvania | |
December 20, 2013 | |
/s/ DELOITTE & TOUCHE LLP
Philadelphia, Pennsylvania
December 14, 2012
33
Table of Contents
INNOVATIVE SOLUTIONS AND SUPPORT, INC.
CONSOLIDATED BALANCE SHEETS
| | | | | | | | | September 30, | | September 30, | |
| | September 30,
2012 | | September 30,
2011 | | | 2014 | | 2013 | |
|---|
ASSETS | ASSETS | | ASSETS |
Current assets | | | | | | |
Cash and cash equivalents | | $ | 42,977,501 | | $ | 42,625,854 | | | $ | 15,214,584 | | $ | 16,386,207 | |
Accounts receivable, net | | 3,978,512 | | 3,124,114 | | |
Accounts receivable | | | 4,419,863 | | 4,489,434 | |
Unbilled receivables, net | | | 7,425,728 | | 6,539,442 | |
Inventories | | 3,801,547 | | 3,508,595 | | | 5,470,786 | | 4,377,513 | |
Deferred income taxes | | 1,588,162 | | 438,635 | | | 3,245,223 | | 2,002,679 | |
Prepaid expenses and other current assets | | 2,031,644 | | 875,636 | | | 750,108 | | 642,210 | |
| | | | | | | | | | | |
Total current assets | | 54,377,366 | | 50,572,834 | | | 36,526,292 | | 34,437,485 | |
| | | | | | |
Property and equipment, net | | 7,214,378 | | 7,476,362 | | | 7,467,663 | | 7,320,495 | |
Non-current deferred income taxes | | 846,887 | | — | | | 57,707 | | 650,998 | |
Other assets | | 158,600 | | 208,408 | | | 110,848 | | 221,533 | |
| | | | | | | | | | | |
Total assets | | $ | 62,597,231 | | $ | 58,257,604 | | | $ | 44,162,510 | | $ | 42,630,511 | |
| | | | | | | | | | | |
LIABILITIES AND SHAREHOLDERS' EQUITY | | |
LIABILITIES AND SHAREHOLDERS’ EQUITY | | LIABILITIES AND SHAREHOLDERS’ EQUITY |
| | | | | | |
Current liabilities | | | | | | |
Current portion of capitalized lease obligations | | $ | — | | $ | 13,189 | | |
Accounts payable | | 1,139,464 | | 443,516 | | | $ | 2,402,652 | | $ | 2,372,137 | |
Accrued expenses | | 2,723,812 | | 2,551,389 | | | 4,077,290 | | 3,672,909 | |
Deferred revenue | | 1,426,552 | | 232,630 | | | 526,320 | | 447,525 | |
| | | | | | | | | | | |
Total current liabilities | | 5,289,828 | | 3,240,724 | | | 7,006,262 | | 6,492,571 | |
| | | | | | |
Non-current deferred income taxes | | 128,998 | | 566,963 | | | 132,999 | | 132,202 | |
Other liabilities | | 98,002 | | 189,130 | | | 11,725 | | 11,491 | |
| | | | | | | | | | | |
Total liabilities | | 5,516,828 | | 3,996,817 | | | 7,150,986 | | 6,636,264 | |
| | | | | | | | | | | |
Commitments and contingencies (See Note 13) | | — | | — | | |
Shareholders' equity | | |
Preferred Stock, 10,000,000 shares authorized, $.001 par value, of which 200,000 shares are authorized as Class A Convertible stock. No shares issued and outstanding at September 30, 2012 and 2011 | | — | | — | | |
Common stock, $.001 par value: 75,000,000 shares authorized, 18,329,314 and 18,286,884 issued at September 30, 2012 and 2011, respectively | | 18,329 | | 18,287 | | |
Commitments and contingencies (See Note 14) | | | — | | — | |
| | | | | | |
Shareholders’ equity | | | | | | |
| | | | | | |
Preferred stock, 10,000,000 shares authorized, $.001 par value, of which 200,000 shares are authorized as Class A Convertible stock. No shares issued and outstanding at September 30, 2014 and 2013 | | | — | | — | |
| | | | | | |
Common stock, $.001 par value: 75,000,000 shares authorized, 18,714,449 and 18,632,328 issued at September 30, 2014 and 2013, respectively | | | 18,715 | | 18,632 | |
| | | | | | |
Additional paid-in capital | | 47,845,732 | | 47,206,690 | | | 50,697,497 | | 49,880,571 | |
Retained earnings | | 29,605,236 | | 26,626,242 | | | 6,684,902 | | 6,484,634 | |
Treasury stock, at cost, 1,756,632 and 1,544,910 shares at September 30, 2012 and 2011, respectively | | (20,388,894 | ) | | (19,590,432 | ) | |
Treasury stock, at cost, 1,756,807 shares at September 30, 2014 and 2013 | | | (20,389,590 | ) | (20,389,590 | ) |
| | | | | | | | | | | |
Total Shareholders' Equity | | 57,080,403 | | 54,260,787 | | |
Total shareholders’ equity | | | 37,011,524 | | 35,994,247 | |
| | | | | | | | | | | |
Total liabilities and shareholders' equity | | $ | 62,597,231 | | $ | 58,257,604 | | |
| | | | | | | |
Total liabilities and shareholders’ equity | | | $ | 44,162,510 | | $ | 42,630,511 | |
The accompanying notes are an integral part of these statements.
34
Table of Contents
INNOVATIVE SOLUTIONS AND SUPPORT, INC.
CONSOLIDATED STATEMENTS OF OPERATIONS
INCOME
|
| | For the Fiscal Year Ended September 30, | | | For the Fiscal Year Ended September 30, | |
|---|
| | 2012 | | 2011 | | 2010 | | | 2014 | | 2013 | | 2012 | |
|---|
Net sales: | | | | | | | | |
Product | | $ | 18,289,963 | | $ | 25,174,846 | | $ | 23,383,504 | | | $ | 29,975,410 | | $ | 23,459,034 | | $ | 18,289,963 | |
Engineering—modification and development | | 6,288,235 | | 562,806 | | 1,873,819 | | |
| | | | | | | | | |
Engineering development contracts | | | 14,119,613 | | 8,108,273 | | 6,288,235 | |
Total net sales | | 24,578,198 | | 25,737,652 | | 25,257,323 | | | 44,095,023 | | 31,567,307 | | 24,578,198 | |
| | | | | | | | | | | | | | | |
Cost of sales | | |
Cost of sales: | | | | | | | | |
Product | | 9,389,904 | | 11,790,885 | | 10,732,091 | | | 15,050,608 | | 10,601,057 | | 9,389,904 | |
Engineering—modification and development | | 4,678,029 | | 154,299 | | 787,938 | | |
| | | | | | | | | |
Engineering development contracts | | | 15,458,215 | | 8,341,680 | | 4,678,029 | |
Total cost of sales | | 14,067,933 | | 11,945,184 | | 11,520,029 | | | 30,508,823 | | 18,942,737 | | 14,067,933 | |
| | | | | | | | | | | | | | | |
Gross profit | | 10,510,265 | | 13,792,468 | | 13,737,294 | | | 13,586,200 | | 12,624,570 | | 10,510,265 | |
| | | | | | | | | | | | | | | |
Operating expenses: | | | | | | | | |
Research and development | | 2,693,554 | | 5,500,924 | | 5,234,240 | | | 2,618,054 | | 2,578,034 | | 2,693,554 | |
Selling, general and administrative | | 7,400,199 | | 7,683,637 | | 8,099,587 | | | 11,111,014 | | 8,119,071 | | 7,400,199 | |
| | | | | | | | | |
Total operating expenses | | 10,093,753 | | 13,184,561 | | 13,333,827 | | | 13,729,068 | | 10,697,105 | | 10,093,753 | |
| | | | | | | | | | | | | | | |
Operating income | | 416,512 | | 607,907 | | 403,467 | | |
Operating income (loss) | | | (142,868 | ) | 1,927,465 | | 416,512 | |
| | | | | | | | |
Interest income | |
101,012 | |
143,942 | |
188,171 | | | 21,756 | | 41,174 | | 101,012 | |
Interest (expense) | | (598 | ) | | (1,509 | ) | | (2,356 | ) | | — | | — | | (598 | ) |
Other income | | 65,005 | | 150,010 | | 50,000 | | | 37,758 | | 38,120 | | 65,005 | |
Income (loss) before income taxes | | | (83,354 | ) | 2,006,759 | | 581,931 | |
| | | | | | | | | | | | | | | |
Income before income taxes | | 581,931 | | 900,350 | | 639,282 | | |
Income tax (benefit) expense | |
(2,397,063 |
) | |
183,760 | |
(109,094 |
) | | (283,622 | ) | 119,842 | | (2,397,063 | ) |
| | | | | | | | | | | | | | | |
Net income | | $ | 2,978,994 | | $ | 716,590 | | $ | 748,376 | | | $ | 200,268 | | $ | 1,886,917 | | $ | 2,978,994 | |
| | | | | | | | | | | | | | | |
Net income per common share: | | | | | | | | |
Basic | | $ | 0.18 | | $ | 0.04 | | $ | 0.04 | | | $ | 0.01 | | $ | 0.11 | | $ | 0.18 | |
| | | | | | | | | |
Diluted | | $ | 0.18 | | $ | 0.04 | | $ | 0.04 | | | $ | 0.01 | | $ | 0.11 | | $ | 0.18 | |
| | | | | | | | | | | | | | | |
Weighted Average Shares Outstanding: | | |
Cash dividend per share | | | $ | — | | $ | 1.50 | | $ | — | |
| | | | | | | | |
Weighted average shares outstanding: | | | | | | | | |
Basic | | 16,641,895 | | 16,782,223 | | 16,751,528 | | | 16,927,879 | | 16,753,068 | | 16,641,895 | |
| | | | | | | | | |
Diluted | | 16,641,900 | | 16,824,621 | | 16,777,886 | | | 17,149,106 | | 16,855,854 | | 16,641,900 | |
| | | | | | | | | |
The accompanying notes are an integral part of these statements.
35
Table of Contents
INNOVATIVE SOLUTIONS AND SUPPORT, INC.
CONSOLIDATED STATEMENTS OF SHAREHOLDERS'SHAREHOLDERS’ EQUITY
| | | | | | | | | | | | | | | | | | | | Additional | | | | | | | |
| | Common
Stock | | Additional
Paid-In
Capital | | Retained
Earnings | | Treasury
Stock | | Total | | | Common | | Paid-In | | Retained | | Treasury | | | |
|---|
Balance, September 30, 2009 | | $ | 18,207 | | $ | 46,462,135 | | $ | 25,161,276 | | $ | (19,242,876 | ) | $ | 52,398,742 | | |
Share-based compensation | |
— | |
169,565 | |
— | |
— | |
169,565 | | |
Issuance of stock to directors | | 38 | | 199,946 | | — | | — | | 199,984 | | |
Purchase of treasury stock | | — | | — | | — | | (48,630 | ) | | (48,630 | ) | |
Net Income | | — | | — | | 748,376 | | — | | 748,376 | | |
| | | | | | | | | | | | | | Stock | | Capital | | Earnings | | Stock | | Total | |
Balance, September 30, 2010 | | $ | 18,245 | | $ | 46,831,646 | | $ | 25,909,652 | | $ | (19,291,506 | ) | $ | 53,468,037 | | |
| | | | | | | | | | | | | |
Share-based compensation | | — | | 177,399 | | — | | — | | 177,399 | | |
Issuance of stock to directors | | 42 | | 197,645 | | — | | — | | 197,687 | | |
Purchase of treasury stock | | — | | — | | — | | (298,926 | ) | | (298,926 | ) | |
Net income | | — | | — | | 716,590 | | — | | 716,590 | | |
| | | | | | | | | | | | | | | | | | | | | | | |
Balance, September 30, 2011 | | $ | 18,287 | | $ | 47,206,690 | | $ | 26,626,242 | | $ | (19,590,432 | ) | $ | 54,260,787 | | | $ | 18,287 | | $ | 47,206,690 | | $ | 26,626,242 | | $ | (19,590,432 | ) | $ | 54,260,787 | |
| | | | | | | | | | | | | | | | | | | | | | | |
Share-based compensation | | — | | 439,085 | | — | | — | | 439,085 | | | — | | 439,085 | | — | | — | | 439,085 | |
Issuance of stock to directors | | 42 | | 199,957 | | — | | — | | 199,999 | | | 42 | | 199,957 | | — | | — | | 199,999 | |
Purchase of treasury stock | | — | | — | | — | | (798,462 | ) | | (798,462 | ) | | — | | — | | — | | (798,462 | ) | (798,462 | ) |
Net income | | — | | — | | 2,978,994 | | — | | 2,978,994 | | |
Net Income | | | — | | — | | 2,978,994 | | — | | 2,978,994 | |
| | | | | | | | | | | | | | | | | | | | | | | |
Balance, September 30, 2012 | | $ | 18,329 | | $ | 47,845,732 | | $ | 29,605,236 | | $ | (20,388,894 | ) | $ | 57,080,403 | | | $ | 18,329 | | $ | 47,845,732 | | $ | 29,605,236 | | $ | (20,388,894 | ) | $ | 57,080,403 | |
| | | | | | | | | | | | | | | | | | | | | | | |
Share-based compensation | | | — | | 678,840 | | — | | — | | 678,840 | |
Exercise of stock options | | | 255 | | 1,156,039 | | — | | — | | 1,156,294 | |
Issuance of stock to directors | | | 48 | | 199,960 | | — | | — | | 200,008 | |
Purchase of treasury stock | | | — | | — | | — | | (696 | ) | (696 | ) |
Dividends | | | — | | — | | (25,007,519 | ) | — | | (25,007,519 | ) |
Net income | | | — | | — | | 1,886,917 | | — | | 1,886,917 | |
| | | | | | | | | | | | |
Balance, September 30, 2013 | | | $ | 18,632 | | $ | 49,880,571 | | $ | 6,484,634 | | $ | (20,389,590 | ) | $ | 35,994,247 | |
| | | | | | | | | | | | |
Share-based compensation | | | — | | 407,391 | | — | | — | | 407,391 | |
Exercise of stock options | | | 58 | | 259,505 | | — | | — | | 259,563 | |
Issuance of stock to directors | | | 25 | | 150,030 | | — | | — | | 150,055 | |
Net income | | | — | | — | | 200,268 | | — | | 200,268 | |
| | | | | | | | | | | | |
Balance, September 30, 2014 | | | $ | 18,715 | | $ | 50,697,497 | | $ | 6,684,902 | | $ | (20,389,590 | ) | $ | 37,011,524 | |
The accompanying notes are an integral part of these statements.
36
Table of Contents
INNOVATIVE SOLUTIONS AND SUPPORT, INC.
CONSOLIDATED STATEMENTS OF CASH FLOWS
|
| | For the Fiscal Year Ended September 30, | | | For the Fiscal Year Ended September 30, | |
|---|
| | 2012 | | 2011 | | 2010 | | | 2014 | | 2013 | | 2012 | |
|---|
CASH FLOWS FROM OPERATING ACTIVITIES: | | | | | | | | |
Net income | | $ | 2,978,994 | | $ | 716,590 | | $ | 748,376 | | | $ | 200,268 | | $ | 1,886,917 | | $ | 2,978,994 | |
Adjustments to reconcile net income to net cash provided by operating activities: | | |
Adjustments to reconcile net income to net cash (used in) provided by operating activities: | | | | | | | | |
Depreciation and amortization | | 529,325 | | 672,196 | | 826,748 | | | 576,478 | | 545,620 | | 529,325 | |
Deposit forfeiture, installation kits | | — | | — | | 118,660 | | |
Share-based compensation expense: | | |
Share-based compensation expense | | | | | | | | |
Stock options | | 444,507 | | 170,586 | | 171,491 | | | 660,136 | | 712,395 | | 444,507 | |
Nonvested stock awards | | 199,998 | | 199,712 | | 199,946 | | |
Excess tax adjustment from share-based compensation: | | |
Nonvested stock awards | | (5,422 | ) | | 6,813 | | (1,926 | ) | |
Provision for (recovery) loss on accounts receivable | | (1,373 | ) | | 17,225 | | — | | |
Loss on disposal of property and equipment | | — | | 2,413 | | 4,917 | | |
Stock awards | | | 150,055 | | 200,008 | | 199,998 | |
Tax adjustment from share-based compensation | | | (252,688 | ) | (33,301 | ) | (5,422 | ) |
Recovery of loss on accounts receivable | | | — | | — | | (1,373 | ) |
Provision for loss on unbilled receivables | | | 3,680,679 | | — | | — | |
(Gain) loss on disposal of property and equipment | | | 78 | | (11,536 | ) | — | |
Excess and obsolete inventory cost | | 113,456 | | 471,496 | | — | | | 196,205 | | 48,450 | | 113,456 | |
Deferred income taxes | | (2,434,379 | ) | | 751 | | (11,081 | ) | | (648,456 | ) | (215,424 | ) | (2,434,379 | ) |
(Increase) decrease in: | | | | | | | | |
Accounts receivable | | (853,025 | ) | | (611,363 | ) | | 3,658,730 | | | 69,571 | | (510,922 | ) | (853,025 | ) |
Unbilled receivables | | | (4,566,965 | ) | (4,944,006 | ) | (1,210,796 | ) |
Inventories | | (406,408 | ) | | 676,301 | | 650,593 | | | (1,289,478 | ) | (624,416 | ) | (406,408 | ) |
Prepaid expenses and other current assets | | (1,156,008 | ) | | 78,066 | | 273,711 | | | (107,899 | ) | (206,002 | ) | 54,788 | |
Other non-current assets | | — | | (121,237 | ) | | — | | | 105,886 | | (116,333 | ) | — | |
Increase (decrease) in: | | | | | | | | |
Accounts Payable | | 695,948 | | (100,362 | ) | | (664,113 | ) | |
Accounts payable | | | 30,515 | | 1,232,673 | | 695,948 | |
Accrued expenses | | 192,101 | | (188,354 | ) | | (200,500 | ) | | 557,222 | | 744,085 | | 192,101 | |
Income taxes payable | | (110,805 | ) | | 219,324 | | (116,058 | ) | | (152,608 | ) | 118,502 | | (110,805 | ) |
Deferred revenue | | 1,193,922 | | 66,009 | | (59,027 | ) | | 78,795 | | (979,027 | ) | 1,193,922 | |
| | | | | | | | | |
Net cash provided by operating activities | | 1,380,831 | | 2,276,166 | | 5,600,467 | | |
Net cash (used in) provided by operating activities | | | (712,206 | ) | (2,152,317 | ) | 1,380,831 | |
| | | | | | | | | | | | | | | |
CASH FLOWS FROM INVESTING ACTIVITIES: | | | | | | | | |
Purchases of property and equipment | | (217,533 | ) | | (255,454 | ) | | (189,790 | ) | | (719,522 | ) | (605,301 | ) | (217,533 | ) |
| | | | | | | | | |
Proceeds from the sale of property and equipment | | | 600 | | 18,500 | | — | |
Net cash (used in) investing activities | | (217,533 | ) | | (255,454 | ) | | (189,790 | ) | | (718,922 | ) | (586,801 | ) | (217,533 | ) |
| | | | | | | | | | | | | | | |
CASH FLOWS FROM FINANCING ACTIVITIES: | | | | | | | | |
Purchase of treasury stock | | (798,462 | ) | | (298,926 | ) | | (48,630 | ) | |
Proceeds from exercise of stock options | | | 259,505 | | 1,156,039 | | — | |
Purchases of treasury stock | | | — | | (696 | ) | (798,462 | ) |
Dividend paid | | | — | | (25,007,519 | ) | — | |
Repayment of capitalized lease obligations | | (13,189 | ) | | (12,278 | ) | | (11,431 | ) | | — | | — | | (13,189 | ) |
Other | | — | | — | | 36 | | |
Net cash provided by (used in) financing activities | | | 259,505 | | (23,852,176 | ) | (811,651 | ) |
| | | | | | | | | | | | | | | |
Net cash (used in) financing activities | | (811,651 | ) | | (311,204 | ) | | (60,025 | ) | |
| | | | | | | | | |
Net increase in cash and cash equivalents | | 351,647 | | 1,709,508 | | 5,350,652 | | |
Net increase (decrease) in cash and cash equivalents | | | (1,171,623 | ) | (26,591,294 | ) | 351,647 | |
Cash and cash equivalents, beginning of year | | 42,625,854 | | 40,916,346 | | 35,565,694 | | | 16,386,207 | | 42,977,501 | | 42,625,854 | |
| | | | | | | | | | | | | | | |
Cash and cash equivalents, end of year | | $ | 42,977,501 | | $ | 42,625,854 | | $ | 40,916,346 | | | $ | 15,214,584 | | $ | 16,386,207 | | $ | 42,977,501 | |
| | | | | | | | | | | | | | | |
SUPPLEMENTAL DISCLOSURE OF CASH FLOW INFORMATION | | | | | | | | |
Cash paid for interest | | $ | 599 | | $ | 1,509 | | $ | 2,357 | | | $ | — | | $ | — | | $ | 599 | |
| | | | | | | | | |
Cash paid for income tax | | $ | 153,327 | | $ | 11,500 | | $ | 121,473 | | | $ | 770,000 | | $ | 250,000 | | $ | 153,327 | |
| | | | | | | | | |
Cash received from income tax refund | | $ | 4,096 | | $ | 43,253 | | $ | 1,000 | | | $ | — | | $ | — | | $ | 4,096 | |
| | | | | | | | | |
The accompanying notes are an integral part of these statements.
37
Table of Contents
INNOVATIVE SOLUTIONS AND SUPPORT, INC.
NOTES TO CONSOLIDATED FINANCIAL STATEMENTS
1. Background:
1.Background:
Innovative Solutions and Support, Inc. (the "Company"“Company” or "IS&S"“IS&S”) was incorporated in Pennsylvania on February 12, 1988. The Company isoperates in one business segment as a systems integrator that designs, manufactures, sells and sellsservices air data equipment, engine display systems, standby equipment, primary flight guidance and cockpit display systems for retrofit applications and original equipment manufacturers ("OEMs"(“OEMs”) and retrofit applications. The Company supplies integrated Flight Management Systems (“FMS”) and advanced Global Positioning System (“GPS”) receivers that enable reduced carbon footprint navigation. The Company continues to position itself as a system integrator, which capability provides the Company with the potential to generate more substantive orders over a broader product base. This strategy, as both a manufacturer and integrator, is to leverage the latest technologies developed for the computer and telecommunications industries into advanced and cost-effective solutions for the general aviation, commercial, commercial air transport, the United States Department of Defense (“DoD”)/governmental, and foreign military markets. This approach, combined with the Company’s industry experience, is designed to enable IS&S to develop high-quality products and systems, to reduce product time to market, and to achieve cost advantages over products offered by its competitors. Customers include commercial air transport carriers and corporate/general/general aviation companies, the Department of Defense ("DoD")DoD and its commercial contractors, aircraft operators, aircraft modification centers, foreign militaries and various OEMs.OEM’s.
2.Concentrations:
Major Customers and Products
In fiscal 2012, 20112014, 2013 and 2010,2012, the Company derived 63%59%, 61%,64% and 48%63%, respectively, of total sales from five customers, although not all the same customers in each year. Accounts receivable and unbilled receivables related to those top five customers was $1.7$7.9 million, $1.8$5.9 million, and $0.3$2.4 million as at September 30, 2012, 20112014, 2013 and 2010,2012, respectively.
During
In fiscal 2014, three of the Company’s customers, Pilatus, Eclipse and FedEx, accounted for 17%, 14% and 12% of total sales, respectively. In fiscal 2013, two of the Company’s customers, Eclipse and American Airlines Inc. (“AAI”), accounted for 24% and 14% of total sales, respectively. In fiscal 2012, three of the Company'sCompany’s customers, Eclipse, Aerospace, FedEx and National Nuclear Security Administration, accounted for 20%, 14%, and 13% of total sales, respectively. In fiscal 2011, two of the Company's customers, Eclipse Aerospace
Flat panel sales were 88%, 88% and FedEx, accounted for 20% and 15%87% of total sales respectively. In fiscal 2010, two ofin the Company's customers, Lockheed Martinyears ended September 30, 2014, 2013 and FedEx, accounted for 11% and 10% of total sales,2012, respectively.
Sales of air data systems and components were 13%12%, 21%,12% and 32%13% of total sales for the years ended September 30, 2012, 20112014, 2013 and 2010, respectively. Flat Panel sales were 87%, 79%, and 68% of total sales in the years ended September 30, 2012, 2011 and 2010, respectively. Sales to government contractors and agencies accounted for approximately 45%39%, 30%,28% and 43%45% of total sales during fiscal years 2014, 2013 and 2012, 2011 and 2010, respectively. While under these contracts theThe government agency or general contractor typically retains the right to terminate the contract at any time at its convenience, to dateconvenience. Upon alteration or termination of these contracts, have generally included provisions requiring the paymentIS&S is entitled typically to an equitable adjustment to the Company of all revenue earnedcontract price so that it would be compensated for delivered items and allowable costs incurred byincurred. Accordingly, because these contracts can be terminated, the Company through the date of contract termination and do not entitle the customer to receive a refund of any previously paid fees.cannot be assured that its backlog will result in sales.
On November 29, 2011, AMR Corporation, the parent company of AAI and certain of its other U.S.-based subsidiaries filed voluntary petitions for Chapter 11 reorganization in the U.S. Bankruptcy Court for the Southern District of New York. The Company's revenues from AAI accounted for 5%, 8% and 8% total revenue for the fiscal years 2012, 2011 and 2010, respectively. (See also Note 13—Commitments and Contingencies).
Major Suppliers
The Company buys several of its components from sole source suppliers. Although there are a limited number of manufacturerssuppliers of particular components, management believes other suppliers could provide similar components on comparable terms.
During fiscal 2012 and 20112014 the Company had one supplier whothat accounted for 20% and 27%, respectively,15% of the Company'sCompany’s total inventory related purchases. During fiscal 2013 the Company had one supplier that accounted for 30% of the Company’s total inventory related purchases.
38
Table of Contents
INNOVATIVE SOLUTIONS AND SUPPORT, INC.
NOTES TO CONSOLIDATED FINANCIAL STATEMENTS (Continued)
2. Concentrations: (Continued)
Concentration of Credit Risk
Financial instruments that potentially subject the Company to concentration of credit risk consist principally of cash balances and accounts receivable. The Company invests its excess cash where preservation of principal is the major consideration. Cash balances are maintained with two major banks. Balances on deposit with certain money market accounts and operating accounts may exceed the Federal Deposit Insurance Corporation (“FDIC”) limits. The Company'sCompany’s customer base consists principally of companies within the aviation industry. The Company may requestrequests advance payments and/or letters of credit from new customers or existing customers whosethat it considers to be credit ratings do not meet the Company's standards for extending normal credit terms.risks.
The Company maintained reservesrecorded a charge for doubtful accountsimpairment for unbilled receivables in the amount of $0.2$3.7 million and $0.2 millionrelated to the Delta contract as of September 30, 2014, (See Note 5. Unbilled Receivable in Notes to Consolidated Financial Statements). The Company had no such charge at September 30 2012 and 2011, respectively. The reserve balances for both fiscal 2012 and 2011 related to sales of Engineering—Modification and Development services ("EMD") to a customer that was negatively impacted by the current economic environment. As of September 30, 2012, the Company had pre-Bankruptcy outstanding accounts receivable of $760,000 from AAI. Based on the present status of the Bankruptcy proceedings, the Company is not able to determine the amount, if any, that could be uncollectible. (See also Note 13—Commitments and Contingencies).2013.
3.Summary of Significant Accounting Policies:
Principles of Consolidation
The consolidated financial statements include the accounts of the Company and its subsidiaries. All inter-company balances and transactions have been eliminated in consolidation.
Use of Estimates
Preparation of consolidated
The financial statements of the Company have been prepared in conformityaccordance with accounting principles generally accepted in the United States of America, requireswhich require management to make estimates and assumptions that affect the amounts reported amounts of assets and liabilities, and disclosure of contingent assets and liabilities, as of the date ofin the financial statements and the reported amounts of revenues and expenses during the reporting period.statements. Actual results could differ from those estimates. Estimates are used in accounting for, among other items, allowancelong term contracts, allowances for doubtful accounts, inventory obsolescence, product warranty cost liability,liabilities, income taxes, engineering and material costs on EDC programs, percentage of completion on customer funded EMDEDC contracts, recoverability of long-lived assets and contingencies. Actual results could differ materially from those estimates.Estimates and assumptions are reviewed periodically and the effects of changes, if any, are reflected in the Consolidated Statement of Income in the period they are determined.
Cash and Cash Equivalents
Highly liquid investments purchased with an original maturity of three months or less are classified as cash equivalents. Cash equivalents at September 30, 20122014 and 20112013 consist of cash on deposit and cash invested in money market funds with financial institutions.
Table of Contents
INNOVATIVE SOLUTIONS AND SUPPORT, INC.
NOTES TO CONSOLIDATED FINANCIAL STATEMENTS (Continued)
3. Summary of Significant Accounting Policies: (Continued)
Inventory valuation
Inventories are stated at the lower of cost (first-in, first-out) or market and consist of the following:
| | | | | | | | | September 30, | | September 30, | |
| | September 30,
2012 | | September 30,
2011 | | | 2014 | | 2013 | |
|---|
Raw materials | | $ | 2,752,833 | | $ | 2,520,437 | | | $ | 4,389,334 | | $ | 3,126,592 | |
Work-in-process | | 555,495 | | 223,437 | | | 905,529 | | 857,602 | |
Finished goods | | 493,219 | | 764,721 | | | 175,923 | | 393,319 | |
| | | | | | | | $ | 5,470,786 | | $ | 4,377,513 | |
| | $ | 3,801,547 | | $ | 3,508,595 | | |
| | | | | | | |
Property and Equipment
Property and equipment are stated at cost. Depreciation is provided using an accelerated method over estimated useful lives of the assets (the lesser of three to seven years or over the lease term), except for the corporate airplane and manufacturing facility which areand the corporate airplane. The building is being depreciated using theon a straight-line methodbasis over estimated useful lives of ten years and thirty-nine39 years. During fiscal 2012,2014, no depreciation was provided for the airplane because it had been depreciated to its estimated salvage value. Major additions and improvements are capitalized, while maintenance and repairs that do not improve or extend the life of assets are charged to expense as incurred.
39
Table of Contents
Long-Lived Assets
The Company assesses the impairment of long-lived assets in accordance with FASB ASCFinancial Accounting Standards Board (“FASB”) Accounting Standards Codification (“ASC”) Topic 360-10, "“Property, Plant and Equipment"Equipment”. This statement requires that long-lived assets be reviewed for impairment whenever events or changes in circumstances indicate the carrying amount of an asset may not be recoverable. In addition, long-lived assets to be disposed of should be reported at the lower of the carrying amount or fair value less cost to sell. The Company considers historical performance and future estimated results in its evaluation of potential impairment and then compares the carrying amount of the asset to estimated future cash flows expected to result from use of the asset. If the carrying amount of the asset exceeds the estimated expected undiscounted future cash flows, the Company measures the amount of the impairment by comparing the carrying amount of the asset to its fair value. The estimation of fair value is generally measured by discounting expected future cash flows. No impairment charges were recorded in fiscal years 2012, 20112014, 2013 or 2010.2012.
Revenue Recognition
The Company enters into sales arrangements with customers that, in general, provide for the Company to design, develop, manufacture, and deliver large flat-panel display systems, flight information computers, and advanced monitoring systems that measure and display critical flight information, including data relative to aircraft separation, airspeed, altitude, and engine and fuel data measurements. The Company'sCompany’s sales arrangements may include multiple deliverables as defined in FASB ASC Topic 605-25 "“Multiple ElementMultiple-Element Arrangements" ("” (“ASC Topic 605-25"605-25”), which typically include customer funded design EMDand engineering services, and the production and delivery of the flat panel display and related components. The Company includes any design and EMDengineering development services elements in EMDEDC sales and any
Table of Contents
INNOVATIVE SOLUTIONS AND SUPPORT, INC.
NOTES TO CONSOLIDATED FINANCIAL STATEMENTS (Continued)
3. Summary of Significant Accounting Policies: (Continued)
functional upgradesupgrade and product elements in product sales onin the accompanying consolidated statementConsolidated Statement of operations.Income.
To the extent that an arrangement contains software elements that are essential to the functionality of tangible products sold in the arrangement, the Company recognizes revenue for the deliverables in accordance with the guidance included in FASB Accounting Standards Update No. 2009-14, "“Revenue Arrangements That Include Software Elements" ("” (“ASU 2009-14"2009-14”),; FASB ASU 2009-13, “Multiple-Deliverable Revenue Arrangements—a consensus of the FASB Emerging Issues Task Force” (“ASU 2009-13”); and FASB ASC Topic 605, "Revenue Recognition" ("“Revenue Recognition” (“ASC Topic 605"605”).
To the extent that an arrangement contains software components, which include functional upgrades that are soldthe Company sells on a standalone basis and which the Companyit has deemed outside the scope of the exception defined by ASU 2009-14, the Company recognizes software revenue in accordance with FASB ASC Topic 985, “"Software",Software although no such sales have occurred to date.” (“ASC Topic 985”).
Multiple Element Arrangements
The Company identifies all goods and/or services that are to be delivered separately under such a sales arrangement and allocates revenuesales to each deliverable (if more than one) based on that deliverable's selling price.deliverable’s fair value. The Company then considers the appropriate recognition method for each deliverable. The Company'sCompany’s multiple element arrangements can include defined design and EMDdevelopment activities and/or functional upgrades, along withand product sales.
The Company utilizes the selling price hierarchy that has been established by FASB Accounting Standards Update No.ASU 2009-13, "Multiple Deliverable Revenue Arrangements—a consensus of the FASB Emerging Issues Task Force" ("ASU 2009-13"), which requires that the selling price for each deliverable be based on vendor specificvendor-specific objective evidence if available, third partythird-party evidence if vendor specificvendor-specific objective evidence is not available, or estimated selling price if neither vendor specificvendor-specific objective evidence nor third partythird-party evidence is available. To the extent that an arrangement includes a deliverable for which estimated selling price is used, the Company determines the best estimate of selling price by applying the same pricing policies and methodologies that it would be useduse to determine the price to sell the deliverable on a standalone basis.
To the extent that an arrangement contains defined design and EMDEDC activities as an identified deliverabledeliverables in addition to products (resulting in a multiple element arrangement), the Company recognizes as EMD revenueEDC sales amounts earned during the design and EMDdevelopment phase of the contract following the guidance included in FASB ASC Topic 605-35, "“Construction-Type and Production-Type Contracts"Contracts ("” (“ASC Topic 605-35"605-35”). under the percentage of completion method. To the extent that multiple element arrangements include product sales, the Company recognizes revenue whensales are generally recognized once revenue recognition criteria for the product deliverabledeliverables have been met based on the provisions of ASC Topic 605. The Company includes any design and engineering services elements in EMD sales, and any functional upgrades and product elements in product sales on the accompanying consolidated statement
40
Table of operations.Contents
Single Element Arrangements
Products
Products
To the extent that a single element arrangement provides for product sales and repairs, the Company recognizes revenuesales when revenue recognition criteria for the product deliverabledeliverables have been
Table of Contents
INNOVATIVE SOLUTIONS AND SUPPORT, INC.
NOTES TO CONSOLIDATED FINANCIAL STATEMENTS (Continued)
3. Summary of Significant Accounting Policies: (Continued)
met based on the provisions of ASC Topic 605. TheIn addition, the Company also receives orders for equipment and parts. Generally,parts, and in general, recognizes revenue from the sale of such products is recognized upon shipment to the customer.customers.
The Company offersmay offer its customers extended warranties for additional fees. These warranty sales are recordedfees, which it records as deferred revenue and recognized as sales on a straight-line basis over the warranty period.
Engineering—modification and development servicesperiods.
Engineering Development Contracts
The Company may enter into contracts to perform specified design and EMD servicesEDC related to its products. The Company recognizes revenue from these arrangements as EMD revenue,EDC sales, following the guidance included in ASC Topic 605-35, and considers the nature of these contracts (including term, size of contract, and level of effort) when determining the appropriate accounting treatment for a particular contract. Certain of these contracts are accounted for under the percentage-of-completion method of accounting when the Company determines that progress toward completion is reasonablereasonably and reliably estimable, and the contract is long-term in nature. The Company uses the completed contract method for all othersother contracts. Sales and earningsprofit margins under the percentage-of-completion method are recorded based on the ratio of actual costs incurred to total estimated costs expected to be incurred related to the contract under the cost-to-cost method (for development effort).method.
The percentage-of-completion method of accounting requires the Company to estimate the profit margin for each individual contract or contract segment and to apply that profit margin on a uniform basis as sales are recorded under the contract. The estimation of profit marginsmargin requires the Company to make projections of the total sales to be generated and the total costs that will be incurred under a contract. These projections require the Company to make numerous assumptions and estimates relating to items such as the complexity of design and related development costs, performance of subcontractors, availability and cost of materials, engineering productivity, and cost,prototype costs, overhead costs, and capital costs. These contracts sometimesometimes include purchase options for additional quantities and for customer change orders for additional or revised product functionality. SalesRevenues and costs related to profitable purchase options are included in the Company'sCompany’s estimates only when the options are exercised, while salesrevenues and costs related to unprofitable purchase options are included in the Company'sCompany’s estimates when exercise is determined to be probable. SalesRevenues related to change orders are included in profit estimates only if they can be estimated reliably estimated and collectability is reasonably assured. Purchase options and change orders are accounted for either as an integral part of the original contract, or separately, depending upon the nature and value of the item.item, in the period in which any change order or purchase option becomes effective. Anticipated losses on contracts are recognized in full in the period in which losses become probable and estimable.
For contracts for which uncertainty regarding the performance against certain contract terms remains, and in which no loss is expected, the Company uses the zero profit margin approach to applying the percentage of completionpercentage-of-completion method following the guidance included in FASB ASC Topic 605-35.
Estimates of profit margins for contracts are reviewed typically by the Company on a quarterly basis. Assuming the initial estimates of salesrevenues and costs under a contract are accurate, the percentage-of-completion method results in the profit margin being recorded evenly as revenue is recognized under the contract.contracts. Changes in these underlying estimates due to revisions in salesrevenue and cost estimates or the exercise of contract options may result in profit margins being recognized unevenly over a contract as such changes are accounted for on a cumulative basis in the period in which the estimates are
Table of Contents
INNOVATIVE SOLUTIONS AND SUPPORT, INC.
NOTES TO CONSOLIDATED FINANCIAL STATEMENTS (Continued)
3. Summary of Significant Accounting Policies: (Continued)
revised. Significant changes in estimates related to accounting for long-term contracts may have a material effect on the Company'sCompany’s results of operations in the period in which the revised estimate isestimates are made. Cumulative catch-up adjustments if any, resulting from changes in estimates, did not have a material effect on ourare included in results of operations duringand disclosed in the years ended September 30, 2012, 2011 or 2010.notes to consolidated financial statements.
41
Table of Contents
Income Taxes
Income taxes are recorded in accordance with FASB ASC Topic 740, "“Income Taxes" ("” (“ASC Topic 740"740”), which utilizes a balance sheet approach to provide for income taxes. Under this method, the Company recognizes deferred tax assets and liabilities for temporary differences between the financial reporting basis and the tax basis of the Company'sCompany’s assets, liabilities, and expected benefits of utilizing net operating loss (“NOL”)and tax credit carry-forwards. The impact on deferred taxes of changes in tax rates and laws, if any, are applied to the years during which temporary differences are expected to be settled and are reflected in the consolidated financial statements in the period of enactment.
Deferred tax assets are reduced by valuation allowances if, based on the consideration of all available evidence, it is more likely than not that some portion of the deferred tax asset will not be realized. Significant weight is given to evidence that can be verified objectively, and significant management judgment is required in determining any valuation allowances recorded against net deferred tax assets. The Company evaluates deferred income taxes on a quarterly basis to determine if valuation allowances are required by considering available evidence. Deferred tax assets are recognized when expected future taxable income is sufficient to allow the related tax benefits to reduce taxes that would otherwise be payable. The sources of taxable income that may be available to realize the benefit of deferred tax assets are future reversals of existing taxable temporary differences, future taxable income exclusive of reversing temporary differences and credit carry-forwards, taxable income in carry-back years, and tax planning strategies which are both prudent and feasible. The Company believes that its estimate of future taxable income is inherently uncertain, and if its current or future operations generate losses, further adjustments to the valuation allowance arewould be possible. The current balance of the deferred tax valuation allowance relates principally to net operating losses ("NOL")NOLs of certain state taxing jurisdictions. There is currently no assurance of such future, state income before income taxes.
The accounting for uncertainty in income taxes requires a more likely than not threshold for financial statement recognition and measurement of tax positions taken or expected to be taken in a tax return. The Company records a liability for the difference between the (i) benefit recognized and measured for financial statement purposes and (ii) the tax position taken or expected to be taken on the Company'sCompany’s tax return. To the extent that the Company'sCompany’s assessment of such tax positions changes, the change in estimate is recorded in the period in which the determination is made. The Company has elected to record any interest or penalties associated with uncertain tax positions as income tax expense.
The Company files a consolidated United States federal income tax return. The Company prepares and files tax returns based on the interpretation of tax laws and regulations, and records estimates based on these judgments and interpretations. In the normal course of business, the tax returns are subject to examination by various taxing authorities. Such examinations may result in future tax and interest assessments by these taxing authorities, and the Company records a liability when it is probable that there will be an assessment. The Company adjusts the estimates periodically as a result of ongoing
Table of Contents
INNOVATIVE SOLUTIONS AND SUPPORT, INC.
NOTES TO CONSOLIDATED FINANCIAL STATEMENTS (Continued)
3. Summary of Significant Accounting Policies: (Continued)
examinations by and settlements with the various taxing authorities, and changes in tax laws, regulations and precedent. The consolidated tax provision of any given year includes adjustments to prior years'years’ income tax accruals that are considered appropriate, and any related estimated interest. Management believes that it has made adequate accruals have been made for income taxes. Differences between estimated and actual amounts determined upon ultimate resolution, individually or in the aggregate, are not expected to have a material effect on the Company'sCompany’s consolidated financial position, but could possibly be material to its consolidated results of operations or cash flow of any one period.
Engineering Development
Total engineering development expense is comprised of both internally funded research and development (“R&D&D”) and product development and design charges related to specific customer contracts.EDC. Engineering development expense consists primarily of payroll-related expenses of employees engaged in engineering development projects,EDC, engineering related product materials and equipment, and subcontracting costs. R&D charges incurred for product design, product enhancements and future product development are expensed as incurred. Product development and design charges related to specific customer contractsEDC are charged to cost of sales-engineering modification and development based on the method of contract accounting (either percentage of completion or completed contract) applicable to such contracts.sales.
Comprehensive Income
Comprehensive Income
Pursuant to FASB ASC Topic 220, "Comprehensive Income" ("“Comprehensive Income” (“ASC Topic 220"220”), the Company is required to classify items of other comprehensive income by their nature in a financial statement and display the accumulated balance of other comprehensive income separately from retained earnings and additional paid-in capital in the equity section of its condensed consolidated balance sheets. For fiscal 20122014, 2013 and 2011,2012 comprehensive income consisted of net income only, and there were no items of other comprehensive income for any of the periods presented.
42
Table of Contents
Fair Value of Financial Instruments
The net carrying amounts of cash and cash equivalents, accounts receivable, cash overdraft, accounts payable and short-term debt approximate their fair value due tobecause of the short-term nature of these instruments. For financial assets and liabilities measured at fair value on a recurring basis, fair value is the price the Company would receive to sell an asset or pay to transfer a liability in an orderly transaction with a market participant at the measurement date. A three-level fair value hierarchy prioritizes the inputs used to measure fair value as follows:
| | | | |
| | Level 1— | | Unadjusted quoted prices that are available in active markets for the identical assets or liabilities at the measurement date. |
|
|
Level 2— |
|
Other observable inputs available at the measurement date, other than quoted prices included in Level 1, either directly or indirectly, including: |
| | | | • Level 1 — Unadjusted quoted prices that are available in active markets for the identical assets or liabilities at the measurement date. Level 2 — Other observable inputs available at the measurement date, other than quoted prices included in Level 1, either directly or indirectly, including: ·Quoted prices for similar assets or liabilities in active markets; |
| | | | •
Quoted prices for identical or similar assets in non-active markets;
|
| | | | •
Inputs other than quoted prices that are observable for the asset or liability; and
|
| | | | •
Inputs that are derived principally from or corroborated by other observable market data.
|
Table of Contents
INNOVATIVE SOLUTIONS AND SUPPORT, INC.·Quoted prices for identical or similar assets in non-active markets;
NOTES TO CONSOLIDATED FINANCIAL STATEMENTS (Continued)·Inputs other than quoted prices that are observable for the asset or liability; and
3. Summary·Inputs that are derived principally from or corroborated by other observable market data.
Level 3 — Unobservable inputs that cannot be corroborated by observable market data and reflect the use of Significant Accounting Policies: (Continued)significant management judgment. These values are generally determined using pricing models for which the assumptions utilize management’s estimates of market participant assumptions.
| | | | |
|
|
Level 3— |
|
Unobservable inputs that cannot be corroborated by observable market data and reflect the use of significant management judgment. These values are generally determined using pricing models for which the assumptions utilize management's estimates of market participant assumptions. |
The following table sets forth by level within the fair value hierarchy the Company'sCompany’s financial assets and liabilities that were accounted for at fair value on a recurring basis as of September 30, 20122014 and 2011,2013, according to the valuation techniques the Company used to determine their fair values.
| | | | | | | | | | |
| | Fair Value Measurement on September 30, 2012 | |
|---|
| | Quoted Price in
Active Markets for
Identical Assets | | Significant Other
Observable
Inputs | | Significant
Unobservable
Inputs | |
|---|
| | (Level 1) | | (Level 2) | | (Level 3) | |
|---|
Assets | | | | | | | | | | |
Cash and cash equivalents: | | | | | | | | | | |
Money market funds | | $ | 40,384,756 | | $ | — | | $ | — | |
| | Fair Value Measurement on September 30, 2014 | |
| | Quoted Price in | | Significant Other | | Significant | |
| | Active Markets for | | Observable | | Unobservable | |
| | Identical Assets | | Inputs | | Inputs | |
| | (Level 1) | | (Level 2) | | (Level 3) | |
Assets | | | | | | | |
Cash and cash equivalents: | | | | | | | |
Money market funds | | $ | 13,397,547 | | $ | — | | $ | — | |
| | | | | | | | | | |
| | | Fair Value Measurement on September 30, 2013 | |
| | | | | | | | | | | | Quoted Price in | | Significant Other | | Significant | |
| | Fair Value Measurement on September 30, 2011 | | | Active Markets for | | Observable | | Unobservable | |
|---|
| | Quoted Price in
Active Markets for
Identical Assets | | Significant Other
Observable
Inputs | | Significant
Unobservable
Inputs | | | Identical Assets | | Inputs | | Inputs | |
|---|
| | (Level 1) | | (Level 2) | | (Level 3) | | | (Level 1) | | (Level 2) | | (Level 3) | |
|---|
Assets | | | | | | | | |
Cash and cash equivalents: | | | | | | | | |
Money market funds | | $ | 40,330,266 | | $ | — | | $ | — | | | $ | 14,396,014 | | $ | — | | $ | — | |
|
Share-Based Compensation
The Company accounts for share-based compensation under FASB ASC Topic 505-50, "“Equity-Based Payments to Non-Employees"Non-Employees” ("(“ASC Topic 505-50"505-50”) and ASC Topic 718, "“Stock Compensation"Compensation” ("(“ASC Topic 718"718”), which requiresrequire the Company to measure the cost of employee or non-employee director services received in exchange for an award of equity instruments based on the grant-date fair value of the award using an option pricing model. ThatThe Company recognizes that cost is recognized over the period during which an employee or non-employee director is required to provide service in exchange for the award.
Warranty
IS&S
The Company offers warranties on allsome products of various lengths. At the time of shipment, the Company establishes a reserve for estimated costs of warranties based on its best estimate of the amounts necessary to settle future and existing claims using historical data on products sold as of the balance sheet date. The length of the warranty period, the product'sproduct’s failure rates, and the customer's customer’s
43
Table of Contents
usage affect warranty cost. If actual warranty costs differ from the Company'sCompany’s estimated amounts, future results of operations could be adversely affected.affected adversely. Warranty cost is recorded as cost of sales, and the reserve balance recorded as an accrued expense. While the Company maintains product quality programs and processes, its warranty obligation is affected by product failure rates and the related corrective costs. If actual product failure rates and/or corrective costs differ from the estimates, the Company revises estimated warranty liability.liability accordingly.
TableSelf-Insurance Reserves
Beginning January 1, 2014, the Company self-insured a significant portion of Contentsits employee medical insurance. The Company maintains a stop-loss insurance policy that limits its losses both on a per employee basis and an aggregate basis. Liabilities associated with the risks that are retained by the Company are estimated based upon actuarial assumptions such as historical claims experience, demographic factors and other actuarial assumptions. The Company estimated the total medical claims incurred but not reported and the Company believes that it has adequate reserves for these claims at September 30, 2014. However, the actual value of such claims could be significantly affected if future occurrences and claims differ from these assumptions. At September 30, 2014, the estimated liability for medical claims incurred but not reported was $106,000. The Company has recorded the excess of funded premiums over estimated claims incurred but not reported of $169,000 as a current asset in the accompanying consolidated balance sheet.
INNOVATIVE SOLUTIONS AND SUPPORT, INC.
NOTES TO CONSOLIDATED FINANCIAL STATEMENTS (Continued)
3. Summary of Significant Accounting Policies: (Continued)
New Accounting Pronouncements
In May 2011August 2014, the FASB issued ASU 2011-04,"Fair Value Measurement (Topic 820), AmendmentsNo. 2014-15, Presentation of Financial Statements - Going Concern (Subtopic 205-40) (ASU 2014-15). The objective of ASU 2014-15 is to Achieve Common Fair Value Measurementdefine management’s responsibility to evaluate whether there is substantial doubt about an organization’s ability to continue as a going concern and Disclosure Requirements in U.S.provide related disclosures. Currently, GAAP and IFRSs". ("ASU 2011-04"). ASU 2011-04 amends the fair value measurement and disclosuredoes not provide guidance to converge GAAPevaluate whether there is substantial doubt regarding an organization’s ability to continue as a going concern. This ASU provides guidance to an organization’s management, with principles and IFRS requirements for measuring amounts at fair value as well asdefinitions to reduce diversity in the timing and content of financial statement disclosures about these measurements.commonly provided by organizations. ASU 2011-04 was to be adopted prospectively and was2014-15 is effective for theperiods ending after December 15, 2016 and interim andperiods within annual periods beginning after December 15, 2011.2016. Early adoption is permitted.
Management does not believe that any recently issued, but not yet effective, accounting standards could have a material effect on the accompanying financial statements. As new accounting pronouncements are issued, we will adopt those that are applicable under the circumstances
In May 2014, the Financial Accounting Standards Board (“FASB”) issued ASU No. 2014-09, “Revenue from Contracts with Customers (ASC Topic 606)”. The comprehensive new standard will supersede existing revenue recognition guidance and require revenue to be recognized when promised goods or services are transferred to customers in amounts that reflect the consideration to which the company expects to be entitled in exchange for those goods or services. The new standard is effective for reporting periods beginning after December 15, 2016, and early adoption is not permitted. Adoption of the new rules could affect the timing of revenue recognition for certain transactions. The guidance permits two implementation approaches, one requiring retrospective application of the new standard with restatement of prior years and one requiring retrospective application of the new standard with the cumulative effect of applying the new standard as of the date of initial application recognized and disclosure of results under old standards. The Company is currently evaluating the impacts of adoption and the implementation approach to be used.
In July 2013, the FASB issued ASU 2013-11, “Presentation of an Unrecognized Tax Benefit when a Net Operating Loss Carryforward, a Similar Tax Loss, or a Tax Credit Carryforward Exists” (“ASU 2013-11”). ASU 2013-11 provides that a liability related to an unrecognized tax benefit should be offset against a deferred tax asset for a NOL carryforward, a similar tax loss or a tax credit carryforward if such liability is to be settled by reducing an available tax carryforward in the event the uncertain tax position is disallowed. ASU 2013-11 is effective for fiscal years, and interim periods within those years, beginning after December 15, 2013 for public entities, with early adoption permitted. The adoption of ASU 2011-042013-11 during the fourth quarter of fiscal year ending September 30, 2013 did not have a material impact on the Company'sCompany’s consolidated financial statements.
In June 2011, the FASB issued ASU No. 2011-05, "Comprehensive Income (Topic 220): Presentation of Comprehensive Income" ("ASU 2011-05") which requires that all non-owner changes in stockholders' equity be presented either in a single continuous statement of comprehensive income or in two separate but consecutive statements. In the two-statement approach, the first statement would present total net income and its components followed consecutively by a second statement that would present total other comprehensive income, the components of other comprehensive income, and the total of comprehensive income. ASU 2011-05 is to be adopted retrospectively and is effective for annual periods beginning after December 2011. The adoption of ASU 2011-05 will not have an impact on the Company's consolidated financial position, results of operations, or cash flows, because the guidance only changes the presentation of financial information. In December 15, 2011, the FASB issued ASU 2011-12 deferring the effective date for implementation of ASU 2011-05 related only to reclassification out of accumulated other comprehensive income until a later date to be determined after further consideration by the FASB.
4. Net Income Per Share:
| | For the Fiscal Year Ended September 30, | |
| | 2014 | | 2013 | | 2012 | |
Numerator: | | | | | | | |
Net income | | $ | 200,268 | | $ | 1,886,917 | | $ | 2,978,994 | |
Denominator: | | | | | | | |
Basic weighted average shares | | 16,927,879 | | 16,753,068 | | 16,641,895 | |
Dilutive effect of share-based awards | | 221,227 | | 102,786 | | 5 | |
Diluted weighted average shares | | 17,149,106 | | 16,855,854 | | 16,641,900 | |
| | | | | | | |
Net income per common share: | | | | | | | |
Basic | | $ | 0.01 | | $ | 0.11 | | $ | 0.18 | |
Diluted | | $ | 0.01 | | $ | 0.11 | | $ | 0.18 | |
Net income per share is calculated pursuant to ASC Topic 260,Earnings per Share ("(“ASC Topic 260"260”). Basic earnings per share ("EPS"(“EPS”) excludeexcludes potentially dilutive securities and is computed by dividing net income by the weighted average number of Commoncommon shares outstanding for the period. Diluted EPS is computed assuming the conversion or exercise of all dilutive securities such as employee stock options.
In fiscal 2012 there was a difference
44
Table of five shares between basic weighted average shares outstanding and diluted weighted average shares outstanding used in the computation of diluted EPS. In fiscal 2011 there was a difference of 42,398 shares between basic weighted average shares outstanding and diluted weighted average shares outstanding used in the computation of diluted EPS. In fiscal 2010 there was a difference of 26,358 shares between basic weighted average shares outstanding and diluted weighted average shares outstanding used in the computation of diluted EPS.Contents
The number of incremental shares from the assumed exercise of stock options is calculated by using the treasury stock method. As of September 30, 20122014 and 2011,2013, there were 836,200687,168 and 617,800824,834 options to purchase common stock outstanding, respectively. The average outstanding diluted shares calculation excludes options with an exercise price that exceeds the average market price of shares during the period. For fiscal yearyears 2014, 2013 and 2012, 55,666, 445,472, and 806,200 options to purchase common stock, respectively, were excluded from the computation of diluted earnings per share because the effect would be anti-dilutive. For fiscal year 2011, 184,300 options
5. Unbilled Receivables:
Unbilled receivables principally represent sales recorded under the percentage-of-completion method of accounting that have not been billed to purchase common stockcustomers in accordance with applicable contract terms. Unbilled receivables, net of progress payments and recorded an impairment for unbilled receivables of $3.7 million related to the Delta contract, were excluded from$7.4 million at September 30, 2014 (See Note 14. Commitments and Contingencies). Unbilled receivables, net of progress payments were $6.5 million at September 30, 2013. The unbilled receivables recorded under the computation of diluted earnings per share, because the effect would be anti-dilutive.
Table of Contents
INNOVATIVE SOLUTIONS AND SUPPORT, INC.
NOTES TO CONSOLIDATED FINANCIAL STATEMENTS (Continued)
5. Prepaid expensesDelta contract were $3.7 million and other current assets:$774,000 at September 30, 2014 and 2013, respectively.
The percentage-of-completion method of accounting for EDC revenue, requires estimates of profit margins for contracts be reviewed by the Company on a quarterly basis. If the initial estimates of revenues and costs under a contract are accurate, the percentage-of-completion method results in the profit margin being recorded evenly as revenue is recognized under the contract. Changes in these underlying estimates because of revisions in revenue and cost estimates or the exercise of contract options may result in profit margins being recognized unevenly over a contract because such changes are accounted for on a cumulative basis in the period in which the estimates are revised. Significant changes in estimates related to accounting for long-term contracts may have a material effect on the Company’s results of operations in the period in which the revised estimates are made. Net cumulative catch-up adjustments resulting from changes in estimates reduced operating income by $1.5 million, $444,000 and $8,000 during fiscal years ended September 30, 2014, 2013 and 2012, respectively.
6. Prepaid Expenses and Other Current Assets:
Prepaid expenses and other current assets consist of the following:
| | | | | | | | | September 30, | | September 30, | |
| | September 30,
2012 | | September 30,
2011 | | | 2014 | | 2013 | |
|---|
Revenue recognized not yet invoiced | | $ | 1,595,436 | | $ | 384,640 | | |
| | | | | | |
Prepaid insurance | | 176,340 | | 254,171 | | | $ | 398,090 | | $ | 350,913 | |
Other | | 259,868 | | 236,825 | | | 352,018 | | 291,297 | |
| | | | | | | | $ | 750,108 | | $ | 642,210 | |
| | $ | 2,031,644 | | $ | 875,636 | | |
| | | | | | | |
6.7. Property and equipment:Equipment:
Property and equipment, net consists of the following balances:
| | | | | | | |
| | September 30,
2012 | | September 30,
2011 | |
|---|
Computer equipment | | $ | 2,090,556 | | $ | 2,055,128 | |
Corporate airplane | | | 3,082,186 | | | 3,082,186 | |
Furniture and office equipment | | | 1,076,849 | | | 1,074,279 | |
Manufacturing facility | | | 5,605,616 | | | 5,605,616 | |
Equipment | | | 4,378,714 | | | 4,205,243 | |
Land | | | 1,021,245 | | | 1,021,245 | |
| | | | | | |
| | | 17,255,166 | | | 17,043,697 | |
Less: Accumulated depreciation and amortization | | | (10,040,788 | ) | | (9,567,335 | ) |
| | | | | | |
| | $ | 7,214,378 | | $ | 7,476,362 | |
| | | | | | |
| | September 30, | | September 30, | |
| | 2014 | | 2013 | |
| | | | | |
Computer equipment | | $ | 2,292,548 | | $ | 2,173,266 | |
Corporate airplane | | 3,128,504 | | 3,128,504 | |
Furniture and office equipment | | 1,063,254 | | 1,062,296 | |
Manufacturing facility | | 5,728,437 | | 5,631,001 | |
Equipment | | 5,047,737 | | 4,678,678 | |
Land | | 1,021,245 | | 1,021,245 | |
| | 18,281,725 | | 17,694,990 | |
Less accumulated depreciation and amortization | | (10,814,062 | ) | (10,374,495 | ) |
| | $ | 7,467,663 | | $ | 7,320,495 | |
Depreciation related to property and equipment was approximately $0.6 million in fiscal year 2014, and $0.5 million $0.5 millionin fiscal years 2013 and $0.8 million for fiscal 2012, 2011 and 2010, respectively.2012.
7. Other assets:45
Table of Contents
8. Other Assets:
Other assets consist of the following:
| | | | | | | |
| | September 30,
2012 | | September 30,
2011 | |
|---|
Intangible assets, net of accumulated amortization of $441,637 and $391,829 at September 30, 2012 and September 30, 2011 | | $ | 158,600 | | $ | 208,408 | |
| | | | | | |
| | September 30, | | September 30, | |
| | 2014 | | 2013 | |
Intangible assets, net of accumulated amortization of $499,837 and $495,037 at September 30, 2014 and September 30, 2013 | | $ | 100,400 | | $ | 105,200 | |
Other non-current assets | | 10,448 | | 116,333 | |
| | $ | 110,848 | | $ | 221,533 | |
Intangible assets consist of licensing and certification rights which are amortized over a defined number of units. The Company had no non-cash purchases of other assets in 2012, 2011 and 2010. No impairment charges were recorded in fiscal 2012, 20112014, 2013 or 2010.2012.
Total intangible amortization expense was approximately $0.1 million, $0.1 million$5,000 in fiscal year 2014 and $0.1 million forin each of fiscal 2012, 2011years 2013 and 2010, respectively. Since2012. The timing of future amortization expense is not determinable because the intangible assets are being amortized over a defined number of units,units.
Other non-current assets as of September 30, 2014 include the timingsecurity deposit and advance payment of future amortization expense isthe last month’s rent due under an operating lease for the property located at 180 Gordon Drive, Exton, PA. As of September 30, 2013, the other non-current assets consisted of advanced payments made to vendors to secure end-of-life purchases of materials that were not determinable.
Table of Contents
INNOVATIVE SOLUTIONS AND SUPPORT, INC.
NOTES TO CONSOLIDATED FINANCIAL STATEMENTS (Continued)
8. Accrued expenses:expected to be applied during the next twelve months.
9. Accrued Expenses:
Accrued expenses consist of the following:
| | | September 30, | | September 30, | |
| | | | | | | | | 2014 | | 2013 | |
| | September 30,
2012 | | September 30,
2011 | | | | | | |
|---|
Warranty | | $ | 850,499 | | $ | 955,549 | | | $ | 777,599 | | $ | 701,456 | |
Salary, benefits and payroll taxes | | 531,862 | | 476,152 | | | 787,277 | | 679,325 | |
Professional fees | | 330,858 | | 352,559 | | | 431,612 | | 393,570 | |
Income taxes payable | | 132,980 | | 152,658 | | | 185,151 | | 337,993 | |
Materials on order | | 43,374 | | 89,392 | | |
Other | | 834,239 | | 525,079 | | |
Other, including losses on contracts | | | 1,895,651 | | 1,560,565 | |
| | | | | | | | $ | 4,077,290 | | $ | 3,672,909 | |
| | $ | 2,723,812 | | $ | 2,551,389 | | |
| | | | | | | |
Other accrued expense at September 30, 2014 includes $1.5 million of EDC program costs. Other accrued expense at September 30, 2013 includes $0.7 million related to an adverse judgment against the Company from a lawsuit by a former employee, (See Note 14. Commitments and Contingencies).
9.10. Warranty:
The Company provides for the estimated cost of product warranties at the time revenue is recognized. Warranty cost is recorded as cost of sales and the reserve balance is recorded as an accrued expense in the financial statements. While the Company engages in extensive product quality programs and processes, the Company'sCompany’s warranty obligation is affected by product failure rates and by the related material, labor, and delivery costs incurred in correcting a product failure. If actual product failure rates, material, or labor costs differ from the Company'sCompany’s estimates, further revisions to the estimated warranty liability would be recorded.
Warranty cost and accrual information for fiscal years ended September 30, 20122014 and 2011:2013:
| | | | | | | |
| | 2012 | | 2011 | |
|---|
Warranty Accrual as of October 1, | | $ | 955,549 | | $ | 933,270 | |
Accrued expense for fiscal year | | | 89,815 | | | 244,408 | |
Warranty cost incurred for fiscal year | | | (194,865 | ) | | (222,129 | ) |
| | | | | | |
Warranty accrual as of September 30, | | $ | 850,499 | | $ | 955,549 | |
| | | | | | |
10. Income Taxes:
Income taxes are recorded in accordance with ASC Topic 740"Income Taxes", which utilizes a balance sheet approach to provide for income taxes. Under this method, the Company recognizes deferred tax assets and liabilities for temporary differences between the financial reporting basis and the tax basis of the Company's assets, liabilities, and expected benefits of utilizing net operating loss and tax credit carry-forwards. The impact on deferred taxes of changes in tax rates and laws, if any, are applied to the years during which temporary differences are expected to be settled, and are reflected in the consolidated financial statements in the period of enactment.46
Table of Contents
INNOVATIVE SOLUTIONS AND SUPPORT, INC.
| | 2014 | | 2013 | |
Warranty accrual as of October 1, | | $ | 701,456 | | $ | 850,499 | |
Accrued expense for fiscal year | | 265,362 | | (272 | ) |
Warranty cost incurred for fiscal year | | (189,219 | ) | (148,771 | ) |
Warranty accrual as of September 30, | | $ | 777,599 | | $ | 701,456 | |
NOTES TO CONSOLIDATED FINANCIAL STATEMENTS (Continued)
10.11. Income Taxes: (Continued)
The components of income taxes are as follows:
| | | | | | | | | | | | For the Fiscal Year Ended September 30, | |
| | For the Fiscal Year Ended September 30, | | | 2014 | | 2013 | | 2012 | |
|---|
| | 2012 | | 2011 | | 2010 | | | | | | | | |
|---|
Current provision (benefit): | | | | | | | | |
Federal | | $ | 46,792 | | $ | 183,527 | | $ | (33,770 | ) | | $ | 614,729 | | $ | 432,211 | | $ | 46,792 | |
State | | (9,476 | ) | | (518 | ) | | (64,243 | ) | | 363 | | (2,731 | ) | (9,476 | ) |
| | | | | | | | | | | | | | | |
Total current provision (benefit) | | 37,316 | | 183,009 | | (98,013 | ) | |
Total current provision | | | 615,092 | | 429,480 | | 37,316 | |
| | | | | | | | | | | | | | | |
Deferred (benefit) provision: | | | | | | | | |
Federal | | (2,435,049 | ) | | — | | — | | | (857,049 | ) | (255,154 | ) | (2,435,049 | ) |
State | | 670 | | 751 | | (11,081 | ) | | (41,665 | ) | (54,484 | ) | 670 | |
| | | | | | | | | | | | | | | |
Total deferred (benefit) provision | | (2,434,379 | ) | | 751 | | (11,081 | ) | | (898,714 | ) | (309,638 | ) | (2,434,379 | ) |
| | | | | | | | | | | | | | | |
Total current and deferred (benefit) provision | | $ | (2,397,063 | ) | $ | 183,760 | | $ | (109,094 | ) | | $ | (283,622 | ) | $ | 119,842 | | $ | (2,397,063 | ) |
| | | | | | | | | |
Table of Contents
INNOVATIVE SOLUTIONS AND SUPPORT, INC.
NOTES TO CONSOLIDATED FINANCIAL STATEMENTS (Continued)
10. Income Taxes: (Continued)
Following is a reconciliation of the statutory federal rate to the Company'sCompany’s effective income tax rate:
| | | | | | | | | | |
| | For the Fiscal Year Ended September 30, | |
|---|
| | 2012 | | 2011 | | 2010 | |
|---|
U.S. Federal statutory tax rate | | | 34.0 | % | | 34.0 | % | | 34.0 | % |
State income taxes, net of federal benefit | | | 6.5 | % | | (7.1 | )% | | 13.8 | % |
Permanent items | | | (1.8 | )% | | (0.4 | )% | | 1.3 | % |
Research and development tax credits | | | (3.6 | )% | | (27.5 | )% | | (20.7 | )% |
Valuation allowance | | | (433.5 | )% | | 14.2 | % | | (38.7 | )% |
Change in unrecognized tax benefits | | | (13.5 | )% | | 7.2 | % | | (6.8 | )% |
| | | | | | | | |
Effective income tax rate | | | (411.9 | )% | | 20.4 | % | | (17.1 | )% |
| | | | | | | | |
In December of 2010,
| | For the Fiscal Year Ended September 30, | |
| | 2014 | | 2013 | | 2012 | |
| | | | | | | |
U.S. Federal statutory tax rate | | 34.0 | % | 34.0 | % | 34.0 | % |
State income taxes, net of federal benefit | | 29.6 | % | (1.3 | )% | 6.5 | % |
Permanent items, principally Section 199 manufacturing deduction | | 123.9 | % | (2.9 | )% | (1.8 | )% |
Research and development tax credits | | 190.4 | % | (27.4 | )% | (3.6 | )% |
Valuation allowance | | 3.9 | % | (0.8 | )% | (433.5 | )% |
Change in unrecognized tax benefits | | (41.5 | )% | 4.4 | % | (13.5 | )% |
Effective income tax rate | | 340.3 | % | 6.0 | % | (411.9 | )% |
On January 1, 2013, Congress enacted a two-year extensionthe American Taxpayer Relief Act of 2012 which retroactively reinstated and extended the Research and Development Tax Credit ("(“R&D Tax Credit"Credit”), which retroactively reinstated and from January 1, 2012 to December 31, 2013. Congress has not extended the federalR&D Tax Credit beyond December 31, 2013. The Company’s effective income tax rate in fiscal 2014 reflects an R&D Tax Credit for amounts paid or incurred from January 1, 2010 to December 31, 2011. The Company recognized the entire impact of this retroactive extension in the quarterthree months ended December 31, 2010,2013. The fiscal year 2013 effective income tax rate reflects the benefit of the retroactive application of the R&D Tax Credit for nine months from the fiscal year ended September 30, 2012, plus a full year benefit for the fiscal year ended September 30, 2013, as required by ASC Topic 740. The Company's effective tax rate for the year ended September 30, 2011 reflects the benefit
47
Table of the R&D Tax Credit generated over the period January 1, 2010 through September 30, 2011. The amount reported above for the year ended September 30, 2012 reflects R&D Tax Credits generated from October 1, 2011 through December 31, 2011.Contents
The deferred tax effect of temporary differences giving rise to the Company'sCompany’s deferred tax assets and liabilities consists of the components below.
| | | | | | | | | | | | | |
| | As of September 30, | |
|---|
| | 2012 | | 2011 | |
|---|
| | Current | | Non Current | | Current | | Non Current | |
|---|
Deferred tax assets: | | | | | | | | | | | | | |
Deferred revenue | | $ | — | | $ | — | | $ | 3,058 | | $ | — | |
Reserves and accruals | | | 1,514,711 | | | 240,390 | | | 1,677,183 | | | 238,179 | |
Research and development credits | | | 80,000 | | | 774,318 | | | 80,000 | | | 848,669 | |
NOL carryforwards—state | | | — | | | 1,236,554 | | | — | | | 1,226,649 | |
Stock options | | | — | | | 614,087 | | | — | | | 503,978 | |
Other | | | — | | | 6,304 | | | — | | | 12,973 | |
| | | | | | | | | | |
| | | 1,594,711 | | | 2,871,653 | | | 1,760,241 | | | 2,830,448 | |
Less: Valuation allowance | | | (6,549 | ) | | (1,448,177 | ) | | (1,307,517 | ) | | (2,696,113 | ) |
| | | | | | | | | | |
Total deferred tax assets | | | 1,588,162 | | | 1,423,476 | | | 452,724 | | | 134,335 | |
| | | | | | | | | | |
Deferred tax liabilities: | | | | | | | | | | | | | |
Depreciation | | | — | | | (705,587 | ) | | — | | | (701,298 | ) |
Other | | | — | | | — | | | (14,089 | ) | | — | |
| | | | | | | | | | |
Total deferred tax liabilities | | | — | | | (705,587 | ) | | (14,089 | ) | | (701,298 | ) |
| | | | | | | | | | |
Net deferred tax asset (liability) | | $ | 1,588,162 | | $ | 717,889 | | $ | 438,635 | | $ | (566,963 | ) |
| | | | | | | | | | |
Table of Contents
INNOVATIVE SOLUTIONS AND SUPPORT, INC.
NOTES TO CONSOLIDATED FINANCIAL STATEMENTS (Continued)
10. Income Taxes: (Continued)below:
| | As of September 30, | |
| | 2014 | | 2013 | |
| | Current | | Non Current | | Current | | Non Current | |
Deferred tax assets: | | | | | | | | | |
Reserves and accruals | | $ | 2,880,747 | | $ | 170,562 | | $ | 1,657,601 | | $ | 196,312 | |
Research and development credit | | 396,276 | | 208,384 | | 349,195 | | 548,952 | |
NOL carryforwards - state | | 5,500 | | 1,237,553 | | 1,600 | | 1,246,615 | |
Stock options | | | | 630,160 | | — | | 714,040 | |
Depreciation | | | | (795,050 | ) | | | (626,063 | ) |
Other | | | | 4,105 | | — | | 4,023 | |
| | 3,282,523 | | 1,455,714 | | 2,008,396 | | 2,083,879 | |
| | | | | | | | | |
Less: Valuation allowance | | (37,300 | ) | (1,398,007 | ) | (5,717 | ) | (1,432,881 | ) |
| | | | | | | | | |
Total deferred tax assets | | 3,245,223 | | 57,707 | | 2,002,679 | | 650,998 | |
| | | | | | | | | |
Deferred tax liabilities: | | | | | | | | | |
Depreciation | | — | | (132,999 | ) | — | | (132,202 | ) |
Other | | — | | — | | — | | — | |
| | | | | | | | | |
Total deferred tax liabilities | | — | | (132,999 | ) | — | | (132,202 | ) |
| | | | | | | | | |
Net deferred tax asset (liability) | | $ | 3,245,223 | | $ | (75,292 | ) | $ | 2,002,679 | | $ | 518,796 | |
At September 30, 2012,2014, the Company had state net operating losses ("NOL")NOL carryforwards of $21.1$21.2 million, which begin to expire in varying amounts after the fiscal year ending September 30, 2026. In addition, the Company has federal R&D Tax Credit carryforwards of approximately $646,000,$396,000, which begin to expire in varying amounts after fiscal year ending September 30, 2028,2029, and state R&D Tax Credit carryforwards of $208,000 (net of federal impact), which begin to expire in varying amounts after the fiscal year ending September 30, 2023.
Deferred tax assets are reduced by valuation allowances if, based on the consideration of all available evidence, it is more likely than not that some portion of the deferred tax asset will not be realized. Significant weight is given to evidence that can be verified objectively, and significant management judgment is required in determining any valuation allowances recorded against net deferred tax assets. The Company evaluates deferred income taxes on a quarterly basis to determine if valuation allowances are required by considering available evidence, including historical and projected taxable income and tax planning strategies which are both prudent and feasible. ASC Topic 740 "Income Taxes" requires the consideration of a valuation allowance to reflect the likelihood of realization of deferred tax assets. Significant management judgment is required in determining any valuation allowance recorded against net deferred tax assets.assets
At September 30, 2012,2014 and 2013, the Company considered all available evidence, including the recent history of income before income taxes, together with projections of profitability in future periods. As a result of this analysis, the Company determined that the positive evidence, which relates primarily to the recent history of income before income taxes, and projections of future profits, was sufficient to conclude that it was appropriate to reverse the valuation allowances previously recorded against its net federal deferred tax assets. The valuation allowance decreased by $2.4 million for the year ended September 30, 2012 primarily because of the reversal of certain valuation allowances described above. The valuation allowance decreased by $48,000 for the year ended September 30, 2011 primarily because of net reversals of deductible temporary differences.
The current balance of the deferred tax valuation allowance relates principally to net operating losses ("NOL")NOLs of certain state taxing jurisdictions. InThe valuation allowance decreased by $3,000 and $16,000 for the eventyears ended September 30, 2014 and 2013 respectively, primarily because of the partial reversal of state valuation allowances related to state NOLs and other deferred tax assets, based on forecasts of future taxable income. If the Company were to determine that it would be able to realize theseadditional state deferred tax assets in the future, it would make an adjustment would be made to the valuation allowance which would reduce the provision for income taxes. The Company will continue to maintain the balance of the valuation allowance until an appropriate level of profitability is sustained to warrant a conclusion that it is no longer more likely than not that a portion of these net deferred tax assets will not be realized in future periods. There is currently no assurance of such future income before taxes. The Company believes that its estimate of future taxable income is inherently uncertain, and if its current or future operations generate losses, further adjustments to the valuation allowance are possible.
At September 30, 2012, the Company considered all available evidence, including the recent history of income before income taxes, together with projections of profitability in future periods. As a result of this analysis, the Company determined that the positive evidence, which related primarily to the recent history of income before income taxes, and projections of future profits, was sufficient to conclude that it was appropriate to reverse $2.4 million of valuation allowances previously recorded against its net federal deferred tax assets.
48
Table of Contents
INNOVATIVE SOLUTIONS AND SUPPORT, INC.
NOTES TO CONSOLIDATED FINANCIAL STATEMENTS (Continued)
10. Income Taxes: (Continued)
Following is a reconciliation of beginning and ending balances of total amounts of gross unrecognized tax benefits:
| | | | | | | | | | |
| | For the Fiscal Year Ended September 30, | |
|---|
| | 2012 | | 2011 | | 2010 | |
|---|
Balance at beginning of year | | $ | 491,000 | | $ | 425,000 | | $ | 474,000 | |
Unrecognized tax benefits related to prior years | | | — | | | — | | | — | |
Unrecognized tax benefits related to current year | | | 12,000 | | | 67,000 | | | 34,000 | |
Settlements | | | — | | | — | | | — | |
Decrease in unrecognized tax benefits due to the lapse of applicable statute of limitations | | | (100,000 | ) | | (1,000 | ) | | (83,000 | ) |
| | | | | | | | |
Balance at end of year | | $ | 403,000 | | $ | 491,000 | | $ | 425,000 | |
| | | | | | | | |
| | For the Fiscal Year Ended September 30, | |
| | 2014 | | 2013 | | 2012 | |
Balance at beginning of year | | $ | 492,000 | | $ | 403,000 | | $ | 491,000 | |
Unrecognized tax benefits related to prior years | | 1,500 | | — | | — | |
Unrecognized tax benefits related to current year | | 32,500 | | 120,000 | | 12,000 | |
Decrease in unrecognized tax benefits due to the lapse of applicable statute of limitations | | — | | (31,000 | ) | (100,000 | ) |
| | | | | | | |
Balance at end of year | | $ | 526,000 | | $ | 492,000 | | $ | 403,000 | |
The total liabilities associated with the unrecognized tax benefits that, if recognized, would impact the Company'sCompany’s effective tax rate were $403,000, $491,000$526,000, $492,000 and $425,000$403,000 at September 30, 2012, 20112014, 2013 and 2010,2012, respectively. It is not anticipated that the balance of unrecognized tax benefits at September 30, 20122014 will change significantly over the next twelve months. The balance of unrecognized tax benefits as reflected in the table above at September 30, 2014 and 2013 are recorded on the balance sheet as a reduction to deferred tax assets, except for approximately $10,000 which is included in Other Liabilities at September 30, 2014 and 2013, respectively.
The Company'sCompany’s policy is to recognize interest accrued and, if applicable, penalties related to unrecognized tax benefits in income tax expense for all periods presented. The Company has accrued approximately $4,000 and $12,000$1,000 for the payment of interest, net of tax benefits, at September 30, 20122014 and 2011,2013, respectively. There is no accrual recorded for penalties.
For the fiscal year ended September 30, 2012, 20112014, 2013 and 2010,2012, the Company recognized expense (benefit) of $(8,000), $4,000$0, $(3,000) and ($10,000)$(8,000), respectively, for interest (net of federal impact) within income tax expense.
The Company is subject to income taxes in the U.S. federal and various state jurisdictions. Tax regulations within each jurisdiction are subject to the interpretation of related tax laws and regulations and require significant judgment to apply. The Company'sCompany’s federal income tax returns for the fiscal years ended September 30, 20092011 and thereafter are open years subject to examination by the Internal Revenue Service ("IRS"(“IRS”). The Company also files income tax returns in various state jurisdictions, as appropriate, with varying statutes of limitation. During fiscal year 2012, the IRS examined the Company'sCompany’s income tax return for the year ended September 30, 2010;2010, and no adjustments resulted from this examination. There are no state income tax examinations in process at this time.
On September 13, 2013, the U.S. Treasury Department and the IRS issued final regulations that address costs incurred in acquiring, producing, or improving tangible property (the “tangible property regulations”). The tangible property regulations are generally effective for tax years beginning on or after January 1, 2014, and may be adoptedin earlier years. The tangible property regulations will require the Company to make additional tax accounting method changes as of October 1, 2014; however, management does not anticipate the impact of these changes to be material to the Company’s consolidated financial position, its consolidated statements of income, or both.
11.12. Savings Plan:
The Company sponsors a voluntary defined contribution savings plan covering all employees. The Company made contributions of $145,000, $167,000,$163,000, $128,000 and $175,000$145,000 for the fiscal years ended September 30, 2014, 2013 and 2012, 2011 and 2010, respectively.
Table of Contents
INNOVATIVE SOLUTIONS AND SUPPORT, INC.
NOTES TO CONSOLIDATED FINANCIAL STATEMENTS (Continued)
12.13. Share-Based Compensation:
The Company accounts for share-based compensation under the provisions of ASC Topic 505-50 and ASC Topic 718 by using the fair value method for expensing stock options and non-vested stock awards.
Total share-based compensation expense was $645,000, $371,000$810,000, $912,000 and $371,000$645,000 for the fiscal years ended September 30, 2012, 20112014, 2013 and 2010,2012, respectively. The income tax impact recognized as a (charge) credit to additional paid—paid in capital in the statement of shareholders'shareholders’ equity related to share-based compensation arrangements was ($5,000)253,000), $7,000($33,000) and ($2,000)$(5,000) for the fiscal years ended September 30, 2012, 20112014, 2013 and 2010,2012, respectively. Compensation expense related to share-based awards is recorded as a component of selling, general and administrative expense.expenses.
By unanimous consent of the Company’s Board of Directors on January 25, 2013, the applicable option exercise price of each outstanding option to purchase common stock was reduced by $1.50 per share pursuant to the terms of the 1998 Plan or the 2009 Plan (each as defined below), as applicable, to offset the dilutive impact of the special cash dividend paid by the Company on
49
Table of Contents
December 27, 2012 to common shareholders of record on December 17, 2012. As required by ASC Topic 718, the Company recorded an expense of $22,000 related to the vested outstanding options as a result of this one-time reduction to the option exercise price in the quarter ended March 31, 2013. For non-vested options, the Company added the additional compensation cost of $59,000 to the remaining unrecognized compensation cost for the original share options, granted under the 2009 Plan, and will expense the total amount ratably over the remaining vesting period of the options in accordance with the guidance provided by ASC Topic 718.
The Company has three share-based compensation plans, the 1998 Stock Option Plan (the "1998 Plan"“1998 Plan”), the 2003 Restricted Stock Plan (the "Restricted Plan"“Restricted Plan”) and the 2009 Stock-Based Incentive Compensation Plan (the "2009 Plan"“2009 Plan”). These plans were approved by, each of which the Company's shareholders.shareholders approved. The 1998 Plan expired on November 13, 2008. The last awards under the Restricted Plan were made in 2010, and no further shares remain to awardbe awarded under the Restricted Plan.
1998 Stock Option Plan
The 1998 Plan allowed the granting of incentive and nonqualified stock options to employees, officers, directors and independent contractors, and consultants. No stock options were granted to independent contractors or consultants under this plan. Incentive stock options granted under the 1998 Plan have exercise prices that are at least equal to the fair value of the common stock on grant date. Nonqualified stock options granted under the plan have exercise prices that are less than, equal to or greater than the fair value of the common stock on the date of grant. The Company reserved 3,389,000 shares of Common Stockcommon stock for awards under the plan. On November 13, 2008, the 1998 Plan expired and no additional shares were granted under the 1998 Plan after that date.
Table of Contents
INNOVATIVE SOLUTIONS AND SUPPORT, INC.
NOTES TO CONSOLIDATED FINANCIAL STATEMENTS (Continued)
12. Share-Based Compensation: (Continued)
Following is a summary of option activity under the 1998 Plan for fiscal years ended September 30, 2012, 2011,2014, 2013, and 20102012 and changes during the periods then ended:
| | | | | | | | | | |
| | Options | | Weighted
Average
Exercise
Price | | Aggregate
Intrinsic
Value | |
|---|
Outstanding at September 30, 2009 | | | 606,549 | | $ | 9.45 | | $ | — | |
Granted | | | — | | | — | | | — | |
Exercised | | | — | | | — | | | — | |
Cancelled | | | (115,349 | ) | | 10.49 | | | — | |
| | | | | | | | |
Outstanding at September 30, 2010 | | | 491,200 | | $ | 9.21 | | $ | — | |
Granted | | | — | | | — | | | — | |
Exercised | | | — | | | — | | | — | |
Cancelled | | | (103,400 | ) | | 10.95 | | | — | |
| | | | | | | | |
Outstanding at September 30, 2011 | | | 387,800 | | $ | 8.74 | | $ | — | |
Granted | | | — | | | — | | | — | |
Exercised | | | — | | | — | | | — | |
Cancelled | | | (11,600 | ) | | 12.65 | | | — | |
| | | | | | | | |
Outstanding at September 30, 2012 | | | 376,200 | | $ | 8.62 | | | — | |
| | | | | | | | |
Vested and expected to vest | | | 375,200 | | $ | 8.60 | | $ | — | |
| | | | | | | | |
Options exercisable at September 30, 2012 | | | 366,200 | | $ | 8.64 | | $ | — | |
| | | | | | | | |
| | | | Weighted | | | |
| | | | Average | | Aggregate | |
| | | | Exercise | | Intrinsic | |
| | Options | | Price | | Value | |
Outstanding at September 30, 2011 | | 387,800 | | $ | 8.74 | | $ | — | |
Granted | | — | | — | | — | |
Exercised | | — | | — | | — | |
Cancelled | | (11,600 | ) | 12.65 | | — | |
| | | | | | | |
Outstanding at September 30, 2012 | | 376,200 | | $ | 8.62 | | — | |
Granted | | — | | — | | — | |
Exercised | | (226,800 | ) | 4.63 | | 174,112 | |
Cancelled | | (4,900 | ) | 11.42 | | — | |
| | | | | | | |
Outstanding at September 30, 2013 | | 144,500 | | $ | 12.79 | | $ | — | |
Granted | | — | | — | | — | |
Exercised | | (12,000 | ) | 7.40 | | 8,604 | |
Cancelled | | (70,500 | ) | 16.25 | | — | |
| | | | | | | |
Outstanding at September 30, 2014 | | 62,000 | | $ | 9.91 | | $ | — | |
Vested | | 62,000 | | $ | 9.91 | | $ | — | |
Options exercisable at September 30, 2014 | | 62,000 | | $ | 9.91 | | $ | — | |
In fiscal 20122014 and 2011,2013 and 2012, no options were granted or exercised under the 1998 Plan; therefore,Plan. Therefore, there is no weighted-average grant date fair value of individual options granted and no intrinsic value attributable to individual options granted. 12,000 and 226,800 options under the 1998 Plan were exercised options.in fiscal 2014 and 2013, respectively.
50
Table of Contents
The following table summarizes information about stock options under the 1998 Plan at September 30, 2012:2014:
| | | | | | | | | | | | | | | | |
| | Options Outstanding | | Options Exercisable | |
|---|
Range of Exercise Prices | | Outstanding
As of September 30,
2012 | | Weighted-
Average
Remaining
Contractual
Life | | Weighted-
Average
Exercise
Price | | As of
September 30,
2012 | | Weighted-
Average
Exercise
Price | |
|---|
$ — - $ 5.00 | | | 181,800 | | | 0.6 | | $ | 4.21 | | | 181,800 | | $ | 4.21 | |
$ 5.01 - $10.00 | | | 101,400 | | | 3.3 | | | 7.60 | | | 91,400 | | | 7.58 | |
$10.01 - $15.00 | | | 47,500 | | | 2.5 | | | 13.62 | | | 47,500 | | | 13.62 | |
$15.01 - $20.00 | | | 12,000 | | | 2.5 | | | 16.93 | | | 12,000 | | | 16.93 | |
$20.01 - $27.00 | | | 33,500 | | | 4.3 | | | 25.57 | | | 33,500 | | | 25.57 | |
| | | | | | | | | | | | |
| | | 376,200 | | | 1.9 | | $ | 8.62 | | | 366,200 | | $ | 8.64 | |
| | | | | | | | | | | | |
| | Options Outstanding | | Options Exercisable | |
Range of Exercise
Prices | | Outstanding
As of September 30,
2014 | | Weighted-
Average
Remaining
Contractual
Life | | Weighted-
Average
Exercise
Price | | As of
September
30, 2014 | | Weighted-
Average
Exercise
Price | |
| | | | | | | | | | | |
$ 0.00 | - | $ 5.00 | | 0 | | 0.000 | | $ | — | | 0 | | $ | — | |
$ 5.01 | - | $ 10.00 | | 30,000 | | 3.395 | | 6.270 | | 30,000 | | 6.270 | |
$ 10.01 | - | $ 15.00 | | 28,500 | | 1.164 | | 12.523 | | 28,500 | | 12.523 | |
$ 15.01 | - | $ 20.00 | | 1,500 | | 0.268 | | 18.380 | | 1,500 | | 18.380 | |
$ 20.01 | - | $ 25.00 | | 2,000 | | 0.767 | | 20.853 | | 2,000 | | 20.853 | |
| | 62,000 | | 2.209 | | $ | 9.91 | | 62,000 | | $ | 9.91 | |
Fair value of each option grant is estimated on the date of grant using the Black-Scholes option pricing model. Options are exercisable over a maximum term of ten years from date of grant and vest typically vest over periods of three to five years from the grant date. The expected term of options
Table of Contents
INNOVATIVE SOLUTIONS AND SUPPORT, INC.
NOTES TO CONSOLIDATED FINANCIAL STATEMENTS (Continued)
12. Share-Based Compensation: (Continued)
represents the period of time that options granted are expected to be outstanding and is based on historical experience. Expected volatility is based on historical volatility of the Company's stock.Company’s stock price. The risk free interest rate is based on U.S. Treasuries with constant maturities consistent with the expected life of the options in effect at the time of grant. Compensation expense for employee stock options includes an estimate for forfeitures, and is recognized ratably over the vesting term. Because no options were granted from the 1998 Plan in fiscal 2012, 20112014, 2013 and 2010,2012, the data for expected dividend, expected volatility, weighted average risk-free interest rate and expected lives is not applicable.
Total compensation expense associated with stock option awards to employees under the 1998 Plan was $67,000, $117,000,$0, $34,000 and $159,000$67,000 for fiscal years ended September 30, 2012, 20112014, 20113 and 2010,2012, respectively.
At September 30, 2012,2014, there is no unrecognized compensation expense of $11,000, net of forfeitures related to non-vested stock options under the 1998 Plan that is expected to be recognized during fiscal 2013.2015.
Restricted Plan
The Restricted Plan for non-employee directors was approved by shareholders at the Company'sCompany’s February 26, 2004 Annual Meeting of Shareholders. It calledprovided for an annual award of non-vested stock having a fair market value of $40,000 at the close of business on October 1 of each year for all eligible non-employee directors. The stock was awardedawards vested and were issued in four quarterly installments during the fiscal year provided the director was still servingcontinued to serve on the board on the quarterly issue date. The last awards under the Restricted Plan were made in 2010, and no further shares remain to awardbe awarded under this Plan. However, the Company continued to make an annual grant of non-vested stock under the 2009 Plan. Total share-based compensation expenseThere were no expenses associated with the annual grant of non-vested stock to non-employee directors under the Restricted Plan was $0, $0 and $200,000 for the fiscal years ended September 30, 2012, 20112014, 2013 and 2010,2012, respectively.
The following table outlines restricted stock awards from the Restricted Plan for fiscal years ended September 30, 2012, 2011 and 2010:
| | | | | | | |
| | Non-vested
Stock Awards | | Weighted Average
Share Price | |
|---|
Balance at September 30, 2009 | | | 9,050 | | $ | 5.52 | |
Granted | | | 41,150 | | | 4.86 | |
Issued | | | (37,862 | ) | | 5.02 | |
Cancelled | | | — | | | — | |
| | | | | | |
Balance at September 30, 2010 | | | 12,338 | | $ | 4.86 | |
Granted | | | 43,385 | | | 4.61 | |
Issued | | | (42,237 | ) | | 5.49 | |
Cancelled | | | — | | | — | |
| | | | | | |
Balance at September 30, 2011 | | | 13,486 | | $ | 4.61 | |
Granted | | | — | | | — | |
Issued | | | — | | | — | |
Cancelled | | | — | | | — | |
| | | | | | |
Balance at September 30, 2012 | | | 13,486 | | $ | 4.61 | |
| | | | | | |
Table of Contents
INNOVATIVE SOLUTIONS AND SUPPORT, INC.
NOTES TO CONSOLIDATED FINANCIAL STATEMENTS (Continued)
12. Share-Based Compensation: (Continued)
2009 Stock-Based Incentive Compensation Plan
The 2009 Plan authorizes the grant of Stock Appreciation Rights ("SARs"), Restricted Stock, Optionsstock appreciation rights, restricted stock, options and other equity-based awards under the 2009 Plan (collectively referred to as "Awards"“Awards”). Options granted under the 2009 Plan may be either "incentive“incentive stock options"options” as defined in section 422 of the Internal Revenue Code of 1986, as amended (the "Code"“Code”), or nonqualified stock options, as determined by the Compensation Committee of the Company'sCompany’s Board of Directors (the "Compensation Committee"“Compensation Committee”).
Subject to an adjustment necessary upon a stock dividend, recapitalization, forward split or reverse split, reorganization, merger, consolidation, spin-off, combination, repurchase or share exchange, extraordinary or unusual cash distribution,or other similar corporate transaction or event, the maximum number of shares of common stock available for Awards under the 2009 Plan shall be 1,200,000, all of which may be issued pursuant to Awards of incentive stock options. In addition, the Plan provides that no more than 300,000 shares of common stock per year may be awarded to any employee as a performance-based Award under Section 162(m) of the Code. At September 30, 20122014 there were 655,333356,395 shares of common stock available for awards under the plan.
51
Table of Contents
If any Award is forfeited, or if any Optionoption terminates, expires or lapses without being exercised, the related shares of common stock subject to such Award will again be available for future grant. Any shares tendered by a participant in payment of the exercise price of an Optionoption or the tax liability with respect to an Award (including, in any case, shares withheld from any such Award) will not be available for future grant under the 2009 Plan. If there is any change in the Company'sCompany’s corporate capitalization, the Compensation Committee must proportionately and equitably adjust the number and kind of shares of common stock which may be issued in connection with future Awards, the number and type of shares of common stock covered by Awards then outstanding under the 2009 Plan, the number and type of shares of common stock available under the 2009 Plan, the exercise or grant price of any Award, or if deemed appropriate, make provision for a cash payment with respect to any outstanding Award, provided that no adjustment may be made that would adversely affect the status of any Award that is intended to be a performance-based Award under Section 162(m) of the Code, unless otherwise determined by the Compensation Committee. In addition, the Compensation Committee may make adjustments in the terms and conditions of any Awards, including any performance goals, in recognition of unusual or nonrecurring events affecting the Company or any subsidiary, or in response to changes in applicable laws, regulations or accounting principles, provided that no adjustment may be made that would adversely affect the status of any Award that is intended to be a performance-based Award under Section 162(m) of the Code, unless otherwise determined by the Compensation Committee.
Table of Contents
INNOVATIVE SOLUTIONS AND SUPPORT, INC.
NOTES TO CONSOLIDATED FINANCIAL STATEMENTS (Continued)
12. Share-Based Compensation: (Continued)
Following is a summary of option activity under the 2009 Plan for fiscal years ended September 30, 20122014, 2013 and 2011,2012, and changes during the periods then ended:
| | | | | | | | | | |
| | Options | | Weighted
Average
Exercise
Price | | Aggregate
Intrinsic
Value | |
|---|
Outstanding at September 30, 2010 | | | 50,000 | | $ | 4.50 | | $ | — | |
Granted | | | 180,000 | | | 5.28 | | | — | |
Exercised | | | — | | | — | | | — | |
Cancelled | | | — | | | — | | | — | |
| | | | | | | | |
Outstanding at September 30, 2011 | | | 230,000 | | $ | 5.11 | | $ | — | |
Granted | | | 280,000 | | | 3.92 | | | — | |
Exercised | | | — | | | — | | | — | |
Cancelled | | | (50,000 | ) | | 4.50 | | | — | |
| | | | | | | | |
Outstanding at September 30, 2012 | | | 460,000 | | $ | 4.45 | | $ | — | |
| | | | | | | | |
Vested and expected to vest | | | 460,000 | | $ | 4.45 | | $ | — | |
| | | | | | | | |
Options exercisable at September 30, 2012 | | | 60,003 | | $ | 5.28 | | $ | — | |
| | | | | | | | |
In fiscal 2012 and 2011, no options were exercised under the 2009 Plan; therefore, there is no intrinsic value attributable to exercised options.
| | | | Weighted | | | |
| | | | Average | | Aggregate | |
| | | | Exercise | | Intrinsic | |
| | Options | | Price | | Value | |
Outstanding at September 30, 2011 | | 230,000 | | $ | 5.11 | | $ | — | |
Granted | | 280,000 | | 3.92 | | — | |
Exercised | | — | | — | | — | |
Cancelled | | (50,000 | ) | 4.50 | | — | |
| | | | | | | |
Outstanding at September 30, 2012 | | 460,000 | | $ | 4.45 | | $ | — | |
Granted | | 250,000 | | 4.06 | | — | |
Exercised | | (27,999 | ) | 3.78 | | 118,802 | |
Cancelled | | (1,667 | ) | 3.78 | | — | |
| | | | | | | |
Outstanding at September 30, 2013 | | 680,334 | | $ | 3.32 | | 3,153,696 | |
Granted | | — | | — | | — | |
Exercised | | (44,666 | ) | 3.78 | | 178,823 | |
Cancelled | | (10,500 | ) | 3.78 | | — | |
| | | | | | | |
Outstanding at September 30, 2014 | | 625,168 | | $ | 3.28 | | $ | 1,210,138 | |
Vested and expected to vest | | 625,168 | | $ | 3.28 | | $ | 1,210,138 | |
Options exercisable at September 30, 2014 | | 345,167 | | $ | 3.22 | | $ | 690,369 | |
The following table summarizes information about stock options under the 2009 Plan at September 30, 2012:2014:
Options Outstanding | | Options Exercisable | |
Range of Exercise
Prices | | Outstanding
As of
September 30,
2014 | | Weighted-
Average
Remaining
Contractual
Life | | Weighted-
Average
Exercise Price | | As of
September 30,
2014 | | Weighted-
Average
Exercise Price | |
| | | | | | | | | | | |
$ 0.00 | - | $ 5.00 | | 625,168 | | 7.7 | | $ | 3.28 | | 345,167 | | $ | 3.22 | |
| | | | | | | | | | | | | | | |
52
| | | | | | | | | | | | | | | | |
| | Options Outstanding | | Options Exercisable | |
|---|
Range of Exercise Prices | | Outstanding
As of
September 30,
2012 | | Weighted-
Average
Remaining
Contractual Life | | Weighted-
Average
Exercise Price | | As of
September 30, 2012 | | Weighted-
Average
Exercise
Price | |
|---|
$ — - $ 5.00 | | | 280,000 | | | 9.4 | | $ | 3.92 | | | — | | $ | — | |
$5.01 - $10.00 | | | 180,000 | | | 8.9 | | | 5.28 | | | 60,003 | | | 5.28 | |
| | | | | | | | | | | | |
| | | 460,000 | | | 9.2 | | $ | 4.45 | | | 60,003 | | $ | 5.28 | |
| | | | | | | | | | | | |
Table of Contents
Fair value of each option grant is estimated on the date of grant using the Black-Scholes option pricing model. Options are exercisable over a maximum term of ten years from date of grant and vest typically vest over periods of three to five years from the grant date. The expected term of options represents the period of time that options granted are expected to be outstanding and is based on historical experience and the expected turnover rate of the employees receiving the options. Expected volatility is based on historical volatility of the Company'sCompany’s stock. The risk free interest rate is based on U.S. Treasuries with constant maturities consistent with the expected life of the options in effect at the time of grant. Compensation expense for employee stock options includes an estimate for forfeitures and is recognized ratably over the vesting term.
Table of Contents
INNOVATIVE SOLUTIONS AND SUPPORT, INC.
NOTES TO CONSOLIDATED FINANCIAL STATEMENTS (Continued)
12. Share-Based Compensation: (Continued)
Below are the fair value assumptions used to record compensation expense, related to the 2009 Plan, for the periodfollowing periods identified:
| | Fiscal Year Ended September 30, | |
| | 2014 (1) | | 2013 | | 2012 | |
Expected dividend rate | | — | | — | | — | |
Expected volatility | | — | % | 64.6 | % | 71.1 | % |
Weighted average risk-free interest rate | | — | % | 1.0 | % | 2.1 | % |
Expected lives (years) | | — | | 7.6 | | 8.7 | |
| | | | | | | | | | |
| 2009 Plan | |
|---|
| | Fiscal Year Ended September 30, | |
|---|
| | 2012 | | 2011 | | 2010 | |
|---|
Expected dividend rate | | | — | | | — | | | — | |
Expected volatility | | | 71.1 | % | | 63.0 | % | | 70.0 | % |
Weighted average risk-free interest rate | | | 2.1 | % | | 1.9 | % | | 2.6 | % |
Expected lives (years) | | | 8.70 | | | 10.00 | | | 4.15 | |
(1) The Company did not grant any options in fiscal 2014.
Total compensation expense associated with stock option awards to employees under the 2009 Plan was $377,000, $54,000$660,000, $678,000 and $23,000$377,000 for fiscal years ended September 30, 2012, 20112014, 2013 and 2010,2012, respectively.
Total share-based compensation expense associated with the annual grant of restricted stock awards to non-employee directors under the 2009 Plan was $200,000, $200,000 and $0$200,000 for the fiscal years ended September 30, 2012, 20112014, 2013 and 2010,2012, respectively.
At September 30, 2012,2014, unrecognized compensation expense of approximately $1,074,000,$411,000, net of forfeitures, related to non-vested stock options under the 2009 Plan, is expected to be recognized over a period of approximately 2two years.
13.14. Commitments and Contingencies:
Capital Lease
The Company leases certain equipment under capital leases with terms of five years and an implicit interest rate of 7.2%. The capitalized cost of $57,450 and related annual amortization of $5,000, $5,000 and $7,000 have been included in property and equipment at September 30, 2012, 2011 and 2010, respectively. The balance due on these leases was $0, $13,000 and $26,000 as of September 30, 2012, 2011 and 2010, respectively.
Operating Leases
Rent expense under operating leases totaled $30,000, $31,000$69,000, $39,000 and $26,000$30,000 for the years ended September 30, 2014, 2013 and 2012, 2011respectively.
Purchase Obligations
A “purchase obligation” is defined as an agreement to purchase goods or services that is enforceable and 2010, respectively. Aslegally binding on the Company and that specifies all significant terms, including fixed or minimum quantities to be purchased, fixed, minimum or variable price provisions, and the approximate timing of the transaction. These amounts are comprised primarily of open purchase order commitments entered in the ordinary course of business with vendors and subcontractors pertaining to fulfillment of the Company’s current order backlog. The purchase obligations on open purchase orders were $2.1 million, $3.8 million and $1.9 million as of September 30, 2014, 2013 and 2012, the Company has no future minimum payments related to any non-cancelable operating leases in fiscal 2012.respectively.
Product Liability
The Company has product liability insurance of $50,000,000. The Company has not experienced any material product liability claims in the past.
Table of Contentsclaims.
INNOVATIVE SOLUTIONS AND SUPPORT, INC.
NOTES TO CONSOLIDATED FINANCIAL STATEMENTS (Continued)
13. Commitments and Contingencies: (Continued)
Legal Proceedings
In the ordinary course of business, the Company is at times subject to various legal proceedings and claims. Except as set forth below with respect to the Delta matter, IS&S does not believe any such matters that are currently pending will have a material effect on its results of operations or financial position.
On November 29, 2011, AMR Corporation,
53
Table of Contents
The Company announced previously that Delta Airlines (“Delta”) purported to terminate its contract with the parent company of AAICompany to develop, manufacture and install new cockpit displays and certain navigation capabilities on it’s fleet of its other U.S. based subsidiaries filed voluntary petitionsapproximately 182 MD88 and MD90 aircraft. On October 6, 2014 Delta sent the Company a cancellation notice citing alleged schedule delays and technical infeasibility. The Company believes that Delta’s purported termination of the contract was wrongful and in breach of the terms of the contract. The contract provides for Chapter 11 reorganizationnon-binding mediation in the U.S. Bankruptcy Court for the Southern Districtevent of New York (the "Bankruptcy"). For the year ended September 30, 2012 and 2011, AAI accounted for approximately 5% and 8%, respectively, of net sales. AAI continued to purchase and pay for products from the Company in the ordinary course of business after November 29, 2011. As of November 29, 2011, the Company had pre-Bankruptcy outstanding accounts receivable of $760,000 from AAI. Based on the present status of the Bankruptcy proceedings, the Company is not able to determine the amount, if any, that could be uncollectible. In the 90 days preceding the filing of the Bankruptcy petition, the Company received $828,000 from AAI in the ordinary course of business. Under the U.S. bankruptcy laws, debtors have the right to avoid certain payments made during the 90 days preceding the filing of the bankruptcy petition. No such avoidance action has been asserted or filed,disputes, and the Company believes that it would have valid defenseshas initiated the mediation process. The Company had $3.7 million of unbilled receivables and $0.2 million of inventory on the balance sheet relating to the Delta program at September 30, 2014, both of which are fully reserved. At this time, the outcome of the mediation and any potential subsequent negotiation with or litigation against any such action.Delta is not determinable.
On September 26, 2011, Farhad Daghigh, a former employee of the Company, filed a lawsuit against IS&Sthe Company in the Court of Common Pleas of Chester County (“the Court”) alleging breach of contract and violation of the Pennsylvania Wage Payment and Collection Law claimingand claimed unpaid sales commissions, prejudgment interest, and liquidated damages totaling approximately $583,000 for the fiscal years ended 2007, 2008, 2009 and 2010.2010, plus attorneys’ fees and costs. In June 2013, the Court found in favor of the plaintiff awarding him damages for breach of contract, violation of the Pennsylvania Wage Payment and Collection Law, prejudgment interest, and plaintiff’s reasonable attorneys’ fees. The Company vehemently denies any allegationsrecorded an estimated total liability of liability$657,000, ( which includes the plaintiff’s estimated attorney’s fees), in selling, general and will vigorously defendadministrative expenses for the lawsuit. This matter has not been resolved as of the date hereof.fiscal year ended September 30, 2013. The Company believes thatsettled the probability of an unfavorable outcome on this claim is remote, and, therefore, no contingent liability has been recorded as at September 30, 2012.matter with the plaintiff in December 2013.
On January 17, 2007 the Company filed suit in the Court of Common Pleas for Delaware County, Pennsylvania against Strathman Associates, a former software consultant for IS&S, alleging that Strathman had improperly used IS&S trade secret and proprietary information in assisting J2 and Kollsman in developing the J2/Kollsman Air Data Computer. The case has not been resolved as of the date hereof.
14.15. Related Party Transactions:
The Company incurred legal fees of $110,000, $116,000$99,000, $45,000 and $138,000$110,000 for the fiscal years ended September 30, 2012, 20112014, 2013 and 2010,2012, respectively with a law firm which is a shareholder of the Company.
For the years ended September 30, 2012, 20112014, 2013 and 2010,2012, respectively, the Company incurred service fees of $2,000, $0,$6,000, $4,000, and $25,000$2,000 with a commercial graphics firm controlled by an individual who is married to a shareholder and a daughter of the Company'sCompany’s Chairman and Chief Executive Officer.
Table of Contents
INNOVATIVE SOLUTIONS AND SUPPORT, INC.
NOTES TO CONSOLIDATED FINANCIAL STATEMENTS (Continued)
15.16. Quarterly Financial Data (unaudited):
Summarized quarterly results of operations of the Company for the years ended September 30, 20122014 and September 30, 20112013 are presented below:
54
| | | | | | | | | | | | | |
| | Fiscal Year Ended September 30, 2012 | |
|---|
| | First Quarter | | Second Quarter | | Third Quarter | | Fourth Quarter | |
|---|
Net Sales | | $ | 4,755,459 | | $ | 6,760,221 | | $ | 6,134,492 | | $ | 6,928,026 | |
Cost of sales | | | 2,629,860 | | | 3,659,505 | | | 3,518,867 | | | 4,259,701 | |
Gross profit | | | 2,125,599 | | | 3,100,716 | | | 2,615,625 | | | 2,668,325 | |
Operating income (loss) | | | (658,199 | ) | | 346,543 | | | 355,162 | | | 373,006 | |
Net income (loss) | | | (342,979 | ) | | 288,873 | | | 259,971 | | | 2,773,129 | |
Net income (loss) per common share | | | | | | | | | | | | | |
Basic | | $ | (0.02 | ) | $ | 0.02 | | $ | 0.02 | | $ | 0.17 | |
Diluted | | $ | (0.02 | ) | $ | 0.02 | | $ | 0.02 | | $ | 0.17 | |
| | | | | | | | | | | | | | | Fiscal Year Ended September 30, 2014 | |
| | Fiscal Year Ended September 30, 2011 | | | First Quarter | | Second Quarter | | Third Quarter | | Fourth Quarter | |
|---|
| | First Quarter | | Second Quarter | | Third Quarter | | Fourth Quarter | | |
|---|
Net Sales | | $ | 6,529,811 | | $ | 6,746,070 | | $ | 5,971,494 | | $ | 6,490,277 | | |
Net sales | | | $ | 11,105,811 | | $ | 12,495,016 | | $ | 10,575,976 | | $ | 9,918,221 | |
Cost of sales | | 2,935,655 | | 2,873,414 | | 2,811,960 | | 3,324,155 | | | 7,325,375 | | 8,709,891 | | 7,413,849 | | 7,059,709 | |
Gross profit | | 3,594,156 | | 3,872,656 | | 3,159,534 | | 3,166,122 | | | 3,780,436 | | 3,785,125 | | 3,162,127 | | 2,858,512 | |
Operating income (loss) | | 151,200 | | 466,686 | | (104,935 | ) | | 94,956 | | | 1,408,624 | | 1,089,640 | | 659,901 | | (3,301,032 | ) |
Net income (loss) | | 284,780 | | 499,152 | | (78,981 | ) | | 11,639 | | | 1,008,596 | | 784,217 | | 497,030 | | (2,089,575 | ) |
| | | | | | | | | | |
Net income (loss) per common share | | | | | | | | | | |
Basic | | $ | 0.02 | | $ | 0.03 | | $ | (0.00 | ) | $ | 0.00 | | | $ | 0.06 | | $ | 0.05 | | $ | 0.03 | | $ | (0.12 | ) |
Diluted | | $ | 0.02 | | $ | 0.03 | | $ | (0.00 | ) | $ | 0.00 | | | $ | 0.06 | | $ | 0.05 | | $ | 0.03 | | $ | (0.12 | ) |
| | Fiscal Year Ended September 30, 2013 | |
| | First Quarter | | Second Quarter | | Third Quarter | | Fourth Quarter | |
Net sales | | $ | 6,536,734 | | $ | 8,214,974 | | $ | 8,778,254 | | $ | 8,037,345 | |
Cost of sales | | 3,496,482 | | 4,263,580 | | 5,332,798 | | 5,849,877 | |
Gross profit | | 3,040,252 | | 3,951,394 | | 3,445,456 | | 2,187,468 | |
Operating income | | 384,591 | | 1,210,837 | | 285,500 | | 46,537 | |
Net income | | 317,589 | | 1,107,128 | | 307,473 | | 154,727 | |
| | | | | | | | | |
Net income per common share | | | | | | | | | |
Basic | | $ | 0.02 | | $ | 0.07 | | $ | 0.02 | | $ | 0.01 | |
Diluted | | $ | 0.02 | | $ | 0.07 | | $ | 0.02 | | $ | 0.01 | |
Quarterly and totalfull fiscal year earnings per shareEPS are calculated independently based on the weighted average number of shares outstanding during each period. As a result, the sum of each quarter’s per share amount may not equal the total per share amount for the respective year.
16.17. Business Segments:
The Company operates in one business segment which designs, manufactures and sells flat panel displays, flight information computers, and advanced monitoring systems to the DoD, DOI,the Department of Interior (“DOI”), other government agencies, commercial air transport carriers, and corporate/general aviation markets. The Company currently derives virtually all of its revenues from the sale of this equipment and related EMD services.EDC. Most of the Company'sCompany’s sales, operating results, and identifiable assets are in the United States. During fiscal 2012, 20112014, 2013 and 2010,2012, IS&S derived 87%88%, 79%88% and 68%87%, respectively, of its total revenues from the sale of FPDS. During fiscal 2012, 20112014, 2013 and 2010,2012, the Company derived 13%12%, 21%12% and 32%13%, respectively, of total revenues from the sale of air data systems related products. During fiscal 2012, 20112014, 2013 and 2010,2012, the Company derived 26%32.9%, 2%26% and 7%26%, respectively, of total revenues from the sale of EMDEDC services.
Table of Contents
INNOVATIVE SOLUTIONS AND SUPPORT, INC.
NOTES TO CONSOLIDATED FINANCIAL STATEMENTS (Continued)
16. Business Segments: (Continued)
Geographic Data
Most of the Company'sCompany’s sales, operating results and identifiable assets are in the United States. In fiscal yearyears 2014, 2013 and 2012, 2011 and 2010, net sales outside the United States amounted to $4.4$12.0 million, $4.0$4.8 million and $2.8$4.4 million, respectively.
Product Data
The Company'sCompany’s current product line includes FPDS, flight management systems, and air data systems and components. During fiscal 2012, 20112014, 2013 and 2010,2012, the Company derived 87%88%, 79%88% and 68%87%, respectively, of its revenue from sales of FPDS. The remaining revenue for each of the fiscal years was from sales of air data systems and components.
17. Subsequent Event:55
On December 7, 2012 the Company's BoardTable of Directors declared a special cash dividend in the amount of $1.50 per share, payable on or about December 27, 2012 to shareholders of record as of the close of business on December 17, 2012. The aggregate amount of the payment to be made in connection with the dividend will be approximately $24.9 million.Contents
Item 9. Changes in and disagreements with accountants on accounting and financial disclosure.
None
Item 9A. Controls and procedures
(a)
(a)- An evaluation was performed under supervision and with participation of the
Company'sCompany’s management, including its Chief Executive Officer ("CEO"(“CEO”), and Chief Financial Officer ("CFO"(“CFO”), of the effectiveness of the Company'sCompany’s disclosure controls and procedures, as such term is defined under Rule 13a-15(e) promulgated under the Securities Exchange Act of 1934, as amended (the "Exchange Act"“Exchange Act”) as of September 30, 2012.2014. Based on that evaluation, the Company'sCompany’s management, including the CEO and CFO, concluded the Company'sCompany’s disclosure controls and procedures are effective to provide reasonable assurance that information required to be disclosed by the Company in reports that it files or submits under the Exchange Act, is recorded, processed, summarized, and reported as specified in Securities and Exchange Commission rules and forms and that such information is accumulated and communicated by the Company'sCompany’s management, including the CEO and CFO, or persons performing similar functions, as appropriate to allow timely decisions regarding required disclosure.
(b)
Management'sManagement’s annual report on internal control over financial reporting and the attestation report of the Company'sCompany’s independent registered public accounting firm are set forth below on this Annual Report on Form 10-K.
(c)
- There were no changes in the
Company'sCompany’s internal control over financial reporting identified in connection with the evaluation of such controls that occurred during the Company'sCompany’s most recent fiscal quarter that has materially affected, or is reasonably likely to materially affect, the Company'sCompany’s internal control over financial reporting.
Management'sManagement’s report on internal control over financial reporting
Management of Innovative Solutions & Support, Inc. and its subsidiaries (the "Company"“Company”) is responsible for establishing and maintaining adequate internal control over financial reporting. The Company'sCompany’s internal control over financial reporting is a process designed under the supervision of the Company'sCompany’s principal executive officer and principal financial officer to provide reasonable assurance regarding the reliability of financial reporting and preparation of the Company'sCompany’s financial statements for external purposes in accordance with accounting principles generally accepted in the United States of America.
The Company'sCompany’s internal control over financial reporting includes policies and procedures that (1) pertain to maintenance of records that, in reasonable detail, accurately and fairly reflect transactions and dispositions of the assets of the Company; (2) provide reasonable assurance that transactions are recorded as necessary to permit preparation of financial statements in accordance with generally accepted accounting principles, and that receipts and expenditures of the Company are being made only in accordance with authorizations of management and directors of the Company; and (3) provide reasonable assurance regarding prevention or timely detection of unauthorized acquisition, use, or disposition of Company assets that could have a material effect on financial statements.
Due to its inherent limitations, internal control over financial reporting may not prevent or detect misstatements and, even when determined to be effective, can only provide reasonable, not absolute, assurance with respect to financial statement preparation and presentation. Projections of any evaluation of effectiveness to future periods are subject to risk that controls may become inadequate as a result of changes in conditions or deterioration in the degree of compliance.
Management assessed the effectiveness of the Company'sCompany’s internal control over financial reporting as of September 30, 2012.2014. This assessment was based on criteria for effective internal control over financial reporting described in "Internal Control—Integrated“Internal Control-Integrated Framework" (1992),” issued by the Committee on Sponsoring Organizations of the Treadway Commission. Based on this assessment, management believes that, as of September 30, 2012,2014, internal control over financial reporting was effective to provide reasonable assurance regarding the reliability of financial reporting and the preparation of financial statements in accordance with U.S. generally accepted accounting principles.
The Company'sCompany’s internal control over financial reporting has been audited by Deloitte & ToucheGrant Thornton LLP, an independent registered public accounting firm, as stated in their report which is included herein.
56
Table of Contents
REPORT OF INDEPENDENT REGISTERED PUBLIC ACCOUNTING FIRM
To the
Board of Directors and Shareholders of
Innovative Solutions and Support, Inc.
Exton, Pennsylvania
We have audited the internal control over financial reporting of Innovative Solutions and Support, Inc. a Pennsylvania corporation and subsidiaries (the "Company"“Company”) as of September 30, 2012,2014, based on criteria established in the 1992 Internal Control—Integrated Framework issued by the Committee of Sponsoring Organizations of the Treadway Commission.Commission (COSO). The Company'sCompany’s management is responsible for maintaining effective internal control over financial reporting and for its assessment of the effectiveness of internal control over financial reporting, included in the accompanying Management'sManagement’s Report on Internal Control over Financial Reporting.Reporting . Our responsibility is to express an opinion on the Company'sCompany’s internal control over financial reporting based on our audit.
We conducted our audit in accordance with the standards of the Public Company Accounting Oversight Board (United States). Those standards require that we plan and perform the audit to obtain reasonable assurance about whether effective internal control over financial reporting was maintained in all material respects. Our audit included obtaining an understanding of internal control over financial reporting, assessing the risk that a material weakness exists, testing and evaluating the design and operating effectiveness of internal control based on the assessed risk, and performing such other procedures as we considered necessary in the circumstances. We believe that our audit provides a reasonable basis for our opinion.
A company'scompany’s internal control over financial reporting is a process designed by, or under the supervision of, the company's principal executive and principal financial officers, or persons performing similar functions, and effected by the company's board of directors, management, and other personnel to provide reasonable assurance regarding the reliability of financial reporting and the preparation of financial statements for external purposes in accordance with generally accepted accounting principles. A company'scompany’s internal control over financial reporting includes those policies and procedures that (1) pertain to the maintenance of records that, in reasonable detail, accurately and fairly reflect the transactions and dispositions of the assets of the company; (2) provide reasonable assurance that transactions are recorded as necessary to permit preparation of financial statements in accordance with generally accepted accounting principles, and that receipts and expenditures of the company are being made only in accordance with authorizations of management and directors of the company; and (3) provide reasonable assurance regarding prevention or timely detection of unauthorized acquisition, use, or disposition of the company'scompany’s assets that could have a material effect on the financial statements.
57
Table of Contents
Because of theits inherent limitations, of internal control over financial reporting including the possibility of collusion or improper management override of controls, material misstatements due to error or fraud may not be preventedprevent or detected on a timely basis.detect misstatements. Also, projections of any evaluation of the effectiveness of the internal control over financial reporting to future periods are subject to the risk that the controls may become inadequate because of changes in conditions, or that the degree of compliance with the policies or procedures may deteriorate.
In our opinion, the Company maintained, in all material respects, effective internal control over financial reporting as of September 30, 2012,2014, based on the criteria established in the 1992 Internal Control—Integrated Framework issued by the Committee of Sponsoring Organizations of the Treadway Commission.COSO.
We also have also audited, in accordance with the standards of the Public Company Accounting Oversight Board (United States), the consolidated financial statements of the Company as of and for the year ended September 30, 2012 of the Company2014, and our report dated December 12, 201215, 2014 expressed an unqualified opinion on those consolidated financial statements.
/s/ DELOITTE & TOUCHEGRANT THORNTON LLP
Philadelphia, Pennsylvania
December 14, 201215, 2014
58
Table of Contents
PART III
Item 10. Directors, executive officers and corporate governance.
This information (other than information relating to executive officers included in Part I Item 1.) will be included in the Company'sCompany’s Proxy Statement relating to its Annual Meeting of Shareholders, which will be filed within 120 days after the close of the Company'sCompany’s fiscal year covered by this Annual Report on Form 10-K, and is hereby incorporated by reference to such Proxy Statement. IS&S has adopted a written code of business conduct and ethics, known as the Company'sCompany’s code of conduct, which applies to all of its directors, officers, and employees, including its chief executive officer, its president, and its chief financial officer. The Company'sCompany’s code of conduct is available on its Internet website,www.innovative-ss.com. The code of conduct may also be obtained by contacting investor relations at (610) 646-9800. Any amendments to the Company'sCompany’s code of conduct or waivers from provisions of the code for its directors and officers will be disclosed on the Company'sCompany’s Internet website promptly following the date of such amendment or waiver.
Item 11. Executive compensation.
This information will be included in the Company'sCompany’s Proxy Statement relating to its Annual Meeting of Shareholders, which will be filed within 120 days after close of the Company'sCompany’s fiscal year covered by this Report, and is hereby incorporated by reference to such Proxy Statement.
Item 12. Security ownership of certain beneficial owners and management and related stockholder matters.
This information will be included in the Company'sCompany’s Proxy Statement relating to its Annual Meeting of Shareholders, which will be filed within 120 days after close of the Company'sCompany’s fiscal year covered by this Report, and is hereby incorporated by reference to such Proxy Statement.
Equity Compensation Plan Information
The following table gives information about the Company'sCompany’s common stock that may be issued upon the exercise of options and rights under all of its existing equity compensation plans and arrangements as of September 30, 2012.2014.
| | | | | | | | | | |
Plan Category | | Number of Securities to
be issued upon exercise
of outstanding options
and rights | | Weighted-average
exercise price of
outstanding options
and rights | | Number of Securities
remaining available for future
issuance under equity
compensation plans
(excluding securities reflected
in second column) | |
|---|
Equity compensation plans approved by security holders | | | 870,668 | | $ | 6.37 | | | 656,471 | |
Equity compensation plans not approved by security holders | | |
— | |
$ |
— | | |
— | |
| | | | | | Number of Securities | |
| | | | | | remaining available for future | |
| | Number of Securities to | | Weighted-average | | issuance under equity | |
| | be issued upon exercise | | exercise price of | | compensation plans | |
| | of outstanding options | | outstanding options | | (excluding securities reflected | |
Plan Category | | and rights | | and rights | | in second column) | |
| | | | | | | |
Equity compensation plans approved by security holders | | 687,168 | | $ | 3.88 | | 356,395 | |
| | | | | | | |
Equity compensation plans not approved by security holders | | — | | $ | — | | — | |
The 2003 Restricted Stock Plan for non-employee directors was approved by shareholders at the Company'sCompany’s February 26, 2004 Annual Meeting of Shareholders. The Plan called for an annual award of restricted stock having a fair market value of $25,000 as of the close of business on October 1 of the current fiscal year for all eligible non-employee directors. In fiscal year 2005 the annual award was increased to $40,000 effective the fourth quarter of the fiscal year. The stock iswas awarded in four installments quarterly during the fiscal year provided the director iswas still serving on the board on the quarterly issue date. The last awards under the Restricted Plan were made in 2010, and there are no further shares to award under this Plan. However, the Company continued to make an annual grant of restricted shares under the 2009 Plan. Total share-based compensation expense for non-employee
directors was $200,000, $200,000 and $200,000 for the fiscal years ended September 30, 2014, 2013 and 2012, 2011 and 2010, respectively.
In the fiscal years ended September 30, 2012, 20112014, 2013 and 2010,2012, awards to the Company'sCompany’s non-employee directors under the Plan were 42,430, 42,23712,890, 48,215 and 37,86242,430 shares respectively.
59
Table of Contents
Item 13. Certain relationships and related transactions and director independence.
Related Party Transactions
This information will be included in the Company'sCompany’s Proxy Statement relating to its Annual Meeting of Shareholders, which will be filed within 120 days after close of the Company'sCompany’s fiscal year covered by this Report, and is hereby incorporated by reference to such Proxy Statement.
Item 14. Principal accounting fees and services
This information will be included in the Company'sCompany’s Proxy Statement relating to its Annual Meeting of Shareholders, which will be filed within 120 days after close of the Company'sCompany’s fiscal year covered by this Report, and is hereby incorporated by reference to such Proxy Statement.
60
Table of Contents
PART IV
Item 15. Exhibits, financial statement schedules.
(a)
(a)- The following documents are filed as part of this report:
1.
- Financial Statements
2.
- Financial Statement Schedules
Schedules have been omitted because they are not applicable or are not required or the information required to be set forth therein is included in the financial statements or notes thereto.
3.
- The following exhibits are filed as part of, or incorporated by reference into this report:
| | | |
Exhibit
Number | | |
| Exhibit Title |
|---|
3.1 | 3.1 | | Articles of Incorporation of IS&S.(2) |
3.2 | 3.2 | | Bylaws of IS&S.(7) |
10.1 | 10.1 | | IS&S 1988 Incentive Stock Option Plan.(1)(3) |
10.2 | 10.2 | | IS&S 1998 Stock Option Plan.(1)(4) |
10.3 | 10.3 | | IS&S 2003 Restricted Stock Plan(1)Plan (1) (6) |
10.4 | 10.4 | | IS&S 2009 Stock-Based Incentive Compensation Plan(5)Plan (5) |
10.5 | 10.5 | | Employment Agreement, dated February 14, 2012, between IS&S and Shahram Askarpour(10)Askarpour (10) |
| 21 | |
21 | | Subsidiaries of IS&S. |
23.1 | 23.1 | | Consent of Deloitte and ToucheGrant Thornton LLP. |
31.1 | 31.1 | | Certification of Chief Executive Officer pursuant to Rule 13a-14(a) |
31.2 | 31.2 | | Certification of Chief Financial Officer Pursuant to Rule 13a-14(a) |
32.1 | 32.1 | | Certification Pursuant to U.S.C. Section 1350, as Adopted Pursuant to Section 906 of the Sarbanes-Oxley Act of 2002. |
99.1 | 99.1 | | Amendment to the IS&S 1998 Stock Option Plan.(1)(8) |
| 101 | | |
101 | 101.INS | |
101.INS | | XBRL Instance Document(9)Document (9) |
101.SCH | 101.SCH | | XBRL Taxonomy Extension Scheme Document(9)Document (9) |
101.CAL | 101.CAL | | XBRL Taxonomy Extension Calculation Linkbase Document(9)Document (9) |
101.DEF. | 101.DEF. | | XBRL Taxonomy Extension Definition Linkbase Document(9)Document (9) |
101.LAB. | 101.LAB | | XBRL Taxonomy Extension Label Linkbase Document(9)Document (9) |
101.PRE. | 101.PRE. | | XBRL Taxonomy Extension Presentation Linkbase Document(9)Document (9) |
(1)Constitutes a management contract or compensatory plan or arrangement required to be filed as an exhibit to this form.
(2)Incorporated by reference from the Registrant'sRegistrant’s Current Report on Form 8-K filed with the Commission on September 19, 2007.
(3)Incorporated by reference from the Registrant'sRegistrant’s Registration Statement on Form S-1 (File No. 333-96584) filed with the Commission on May 9, 2000, as amended.
(4)Incorporated by reference from the Registrant'sRegistrant’s Proxy Statement filed with the Commission on March 1, 2005.
(5)Incorporated by reference from the Registrant'sRegistrant’s Proxy Statement filed with the Commission on January 28, 2009.
(6)
- Incorporated by reference from the
Registrant'sRegistrant’s Proxy Statement filed with the Commission on January 26, 2004
(7)
- Incorporated by reference from the
Registrant'sRegistrant’s Quarterly Report on Form 10-Q filed with the Commission on August 6, 2010.
(8)
- Incorporated by reference from the
Registrant'sRegistrant’s Annual Report on Form 10-K filed with the Commission for the fiscal year 2008.
(9)
- Pursuant to Regulation S-T, these interactive data files are deemed not filed or incorporated in any registration statement or prospectus for purposes of Sections 11 or 12 of the Securities Act of 1933 or Section 18 of the Securities Exchange Act of 1934 and otherwise are not subject to liability under those sections.
(10)
- Incorporated by reference from the
Registrant'sRegistrant’s Current Report on Form 8-K filed with the Commission on April 2, 2012.
61
Table of Contents
SIGNATURESSIGNATURES
Pursuant to the requirements of Section 13 or 15(d) of the Securities Exchange Act of 1934, the Registrant has duly caused this report to be signed on its behalf by the undersigned, thereunto duly authorized.
| | | | |
| | INNOVATIVE SOLUTIONS AND SUPPORT, INC. |
|
|
By: |
|
|
| By: | /s/ GEOFFREY S. M.M HEDRICK
|
|
|
| Geoffrey S. M. Hedrick
|
|
|
| Chairman & Chief Executive Officer |
|
|
|
| | Dated: December 14, 2012
15, 2014 |
Pursuant to the requirements of the Securities Exchange Act of 1934, this report has been signed by the following persons on behalf of the Registrant and in the capacities and on the dates indicated.
| | | | |
| | | | |
|---|
|
|
|
|
|
|
|
|
|
|
/s/ GEOFFREY S. M.M HEDRICK
| | Chairman & Chief Executive Officer | | December 15, 2014 |
Geoffrey S. M. Hedrick | | Chairman & Chief Executive Officer | | December 14, 2012 |
| | | | |
/s/ SHAHRAM ASKARPOUR
| | President | | December 15, 2014 |
Shahram Askarpour |
|
President |
|
December 14, 2012 |
| | | | |
/s/ RONALD C. ALBRECHT
Ronald C. Albrecht |
|
Chief Financial Officer (Principal Accounting Officer) |
|
December 14, 2012 15, 2014 |
Ronald C. Albrecht | | | | |
| | | | |
/s/ GLEN R. BRESSNER
| | Director | | December 15, 2014 |
Glen R. Bressner |
|
Director |
|
December 14, 2012 |
| | | | |
/s/ WINSTON J. CHURCHILL
| | Director | | December 15, 2014 |
Winston J. Churchill |
|
Director |
|
December 14, 2012 |
| | | | |
/s/ ROBERT MIONIS
| | Director | | December 15, 2014 |
Robert Mionis |
|
Director |
|
December 14, 2012 |
| | | | |
/s/ ROBERT E. MITTELSTAEDT, JR.
| | Director | | December 15, 2014 |
Robert E. Mittelstaedt, Jr. |
|
Director |
|
December 14, 2012 |
| | | | |
/s/ ROBERT H. RAU
| | Director | | December 15, 2014 |
Robert H. Rau |
|
Director |
|
December 14, 2012 |
62