Republic of Liberia (State or other jurisdiction of incorporation or organization) | 98-0081645 (I.R.S. Employer Identification No.) | |
12, 2015.Title of each class Name of each exchange on which registered Common Stock, par value $.01 per share New York Stock Exchange ýx No oýxýx No oýx No oýx ýx29, 201230, 2014 (based upon the closing sale price of the common stock on the New York Stock Exchange on June 29, 2012)30, 2014) held by those persons deemed by the registrant to be non-affiliates was approximately $4.5$9.9 billion. Shares of the registrant's common stock held by each executive officer and director and by each entity or person that, to the registrant's knowledge, owned 10% or more of the registrant's outstanding common stock as of June 29, 201230, 2014 have been excluded from this number in that these persons may be deemed affiliates of the registrant. This determination of possible affiliate status is not necessarily a conclusive determination for other purposes.219,168,946219,620,652 shares of common stock outstanding as of February 13, 2013.20132015 Annual Meeting of Shareholders are incorporated by reference in Part III, Items 10-14 of this Annual Report on Form 10-K as indicated herein.
our consolidated financial statements under Item 8.Financial Statements and Supplementary Datafor further details. Royal Caribbean Europe, Hawaii, itineraries. Azamara Club Cruises sails in Asia, Northern and Western Europe, the Mediterranean, South and Central America, the less-traveled islands of the Caribbean and North America. We currently operate three ships with an aggregate capacity of approximately 2016. Pullmantur serves the contemporary segment of the Spanish, Portuguese and Latin American cruise markets. Pullmantur's strategy is to attract cruise guests from these target markets by providing a variety of cruising options and Pullmantur Air. See Note 1. private equity fund. 2008 2009 2010 2011 2012 Based on industry data, cruise guests sourced from the Asia/Pacific region represented approximately 8.5% of global cruise guests in 2014. The compound annual growth rate in cruise guests sourced from this market was approximately 16.4% from 2010 to 2014. improve the guest experience. We make deployment decisions generally 12 to 18 months in advance, with the goal of optimizing the overall profitability of our portfolio. Additionally, the infrastructure investments we The need to develop and use innovative technology is increasingly important. the Seas. Royal Caribbean International Royal Caribbean International Allure of the Seas Oasis of the Seas Independence of the Seas Liberty of the Seas Freedom of the Seas Jewel of the Seas Mariner of the Seas Serenade of the Seas Navigator of the Seas Brilliance of the Seas Adventure of the Seas Radiance of the Seas Explorer of the Seas Voyager of the Seas Vision of the Seas Enchantment of the Seas Rhapsody of the Seas Grandeur of the Seas Splendour of the Seas Legend of the Seas Majesty of the Seas Celebrity Cruises Celebrity Reflection Celebrity Silhouette Celebrity Eclipse Celebrity Equinox Celebrity Solstice Celebrity Constellation Celebrity Summit Celebrity Infinity Celebrity Millennium Celebrity Century Celebrity Xpedition(3) Azamara Club Cruises Azamara Journey(4) Azamara Quest(5) Pullmantur Zenith Empress Sovereign Monarch of the Seas(6) CDF Croisières de France Horizon(7) TUI Cruises(8) Mein Schiff 1(9) Mein Schiff 2(10) Total Royal Caribbean International— Quantum-class: Anthem of the Seas Mein Schiff 4 that period. Passengers Carried Passenger Cruise Days Available Passenger Cruise Days (APCD) Occupancy respectively. respectively. similar cost and revenue components. In addition, our brands source passengers from similar markets around the world and operate in similar economic environments with a significant degree of commercial overlap. As a result, our brands (including TUI Cruises) have been aggregated as a single reportable segment based on the similarity of their economic characteristics, types of consumers, regulatory environment, maintenance requirements, supporting systems and processes as well as products and services provided. Our Chairman and Chief Executive Officer has been identified as the chief operating decision-maker and all significant operating decisions including the allocation of resources are based upon the analyses of the Company as one segment.(For financial information see Item 8.Financial Statements and Supplementary Data.) own loss experience and by losses incurred in direct and reinsurance markets. We historically have been able to obtain insurance coverage in amounts and at premiums we have deemed to be commercially acceptable. No assurance can be given that affordable and secure insurance markets will be available to us in the future, particularly for war risk insurance. for ship design, structural features, materials, construction, life saving equipment and safe management and operation of ships to ensure guest and crew safety. The SOLAS standards are revised from time to time and the most recent modifications were phased in through 2010. Compliance with these modified standards did not have a material effect on our operating costs. SOLAS incorporates the International Safety Management Code cruise industry. In June 2013, the European Commission proposed legislation which would require cruise ship operators using ports in the European Union to monitor and report on the vessels’ annual carbon dioxide emissions starting in 2018. We Consumer Financial Responsibility Regulations 2014. proposed guidelines. United States Income Taxation repealed, then, as explained below, such companies would be subject to United States income taxation on a portion of their income derived from or incidental to the international operation of our ships. United Kingdom Income Tax Additionally, some remittances of revenue from sales of certain cruises in the Brazilian market benefit from an exemption from withholding taxes which is scheduled to expire at the end of 2015. If the exemption is not extended, this may result in increased taxation for our Brazilian operations. operations. Richard D. Fain Adam M. Goldstein Lawrence Pimentel Harri U. Kulovaara In November 2014, the Board of Directors of Cruise Lines International Association ("CLIA") elected Mr. Goldstein to serve a two-year term as Chairman of CLIA beginning January 1, 2015. Royal Caribbean International's hotel, marine and port operations. KPMG LLP. Demand for our cruises is also influenced by geopolitical events. Unfavorable conditions, such as cross-border conflicts, civil unrest and governmental changes, especially in regions with popular ports of call, can undermine consumer demand and/or pricing for itineraries featuring these ports. Although we believe we can access sufficient liquidity to fund our operations and obligations as expected, there can be no assurances to that effect. the cruise vacation industry management strategies. others, Aida Cruises, Carnival Cruise more information. In addition, we are subject to various international, national, state and local laws, regulations and treaties that govern, among other things, safety standards applicable to our ships, treatment of disabled persons, health and sanitary standards applicable to our guests, security standards on board our ships and at the ship/port interface areas, and financial responsibilities to our guests. These issues are, and we believe will continue to be, an area of focus by the relevant authorities throughout the regulations. flows. operations, including potentially impairing the value of our goodwill. Shipyards and their subcontractors may experience financial difficulties or consolidation which could cause or result in delay, ship cancellations, our inability to procure new capacity in a timely fashion or increases in shipbuilding costs that could adversely affect our results of operations. In addition, there are a limited number of shipyards with the capability and capacity to build our new Price increases for commercial airline service for our guests or major changes or reduction in commercial airline service and/or availability could adversely impact the demand for cruises and undermine our ability to provide reasonably priced vacation packages to our guests. Business activities that involve our co-investment with third parties may subject us to additional risks. These or other issues related to our co-investment with third parties could adversely impact our operations. adversely impacting our results of operations. We are not a United States corporation and our shareholders may be subject to the uncertainties of a foreign legal system in protecting their interests. 2012 Fourth Quarter Third Quarter Second Quarter First Quarter 2011 Fourth Quarter Third Quarter Second Quarter First Quarter As of February 2013 and the first and second quarters of 2014. The dividend amount was increased to $0.30 per share for the dividends declared in the third and fourth quarters of 2014. The declaration of dividends shall at all times be subject to the final determination of our Board of Directors that a dividend is prudent at that time in consideration of the needs of the business. Royal Caribbean Cruises Ltd. S&P 500 Dow Jones US Travel & Leisure Operating Data: Total revenues Operating income(1) Net income(1)(2) Per Share Data—Basic: Net income Weighted-average shares Per Share Data—Diluted: Net income Weighted-average shares and potentially dilutive shares Dividends declared per common share Balance Sheet Data: Total assets Total debt, including capital leases Common stock Total shareholders' equity expenses We use judgment when estimating the period between drydocks, which can result in adjustments to the estimated amortization of drydock costs. If the vessel is disposed of before the next drydock, the remaining balance in deferred drydock is written-off to the gain or loss upon disposal of vessel in the period in which the sale takes place. We also use judgment when identifying costs incurred during a drydock which are necessary to maintain the vessel's Class certification as compared to those costs attributable to repairs and maintenance which are expensed as incurred. The impairment review for indefinite-life intangible assets consists of a comparison of the fair value of the asset with its carrying amount. We estimate the fair value of our indefinite-life intangible assets, which consist of trademarks and trade names related to Pullmantur, using a discounted cash flow model and the relief-from-royalty method. The royalty rate used is based on comparable royalty agreements in the tourism and hospitality industry. The discount rate used is comparable to the rate used in valuing the Pullmantur reporting unit in our goodwill impairment test. If the carrying amount exceeds its fair value, an impairment loss is recognized in an amount equal to that excess. If the fair value exceeds its carrying amount, the indefinite-life intangible asset is not considered impaired. Other intangible assets assigned finite useful lives are amortized on a straight-line basis over their estimated useful lives. vessels to the Pullmantur fleet is most significant to the projected future cash flows. If the transfers do not occur, we will likely fail step one of the goodwill impairment test and record an impairment loss related to our trademarks and tradenames. As of December 31, 2014, the carrying amounts of our goodwill and trademarks and trade names attributable to our Pullmantur reporting unit was $133.6 million and $188.0 million, respectively. As of December 31, 2014, the carrying amount of goodwill attributable to our Royal Caribbean International reporting unit was $287.0 million. risk. derived from other appropriate valuation models using similar assumptions, inputs or conditions suggested by actual historical experience. that period. Onboard and other revenues Celebrity Century included within Other operating expenses. Net Revenuesrepresent total revenues less commissions, transportation and other expenses and onboard and other expenses (each of which is described above under the Description of Certain Line Items heading). For the periods prior further information. Total revenues Operating income Net income Pullmantur impairment related charges Non-GAAP Net income Basic earnings per share: Net income Non-GAAP Net income Diluted earnings per share: Net income Non-GAAP Net income Passenger ticket revenues Onboard and other revenues Total revenues Cruise operating expenses: Commissions, transportation and other Onboard and other Payroll and related Food Fuel Other operating Total cruise operating expenses Marketing, selling and administrative expenses Depreciation and amortization expenses Impairment of Pullmantur related assets Operating income Other expense Net income Passengers Carried Passenger Cruise Days APCD Occupancy Passenger ticket revenues Onboard and other revenues Total revenues Less: Commissions, transportation and other Onboard and other Net revenues APCD Gross Yields Net Yields Total cruise operating expenses Marketing, selling and administrative expenses Gross Cruise Costs Less: Commissions, transportation and other Onboard and other Net Cruise Costs Less: Fuel Net Cruise Costs Excluding Fuel APCD Gross Cruise Costs per APCD Net Cruise Costs per APCD Net Cruise Cost Excluding Fuel per APCD Net Debt-to-Capital was calculated as follows (in thousands): Long-term debt, net of current portion Current portion of long-term debt Total debt Less: Cash and cash equivalents Net Debt Total shareholders' equity Total debt Total debt and shareholders' equity Debt-to-Capital Net Debt Net Debt and shareholders' equity Net Debt-to-Capital Net Cruise Costs per APCD Net Cruise Costs per APCD, excluding Fuel Capacity Increase Depreciation and Amortization Interest Expense, net Fuel Consumption (metric tons) Fuel Expenses Percent Hedged (fwd consumption) Impact of 10% change in fuel prices Since our earnings release on 2013. and lower costs incurred. 2014. basis for 2014 remained consistent compared to 2013. 2012 2012. the approximately $34.1 million. 2015. 2016, $0.4 billion for 2017 and $2.2 billion for 2018. Operating Activities: Operating lease obligations(1)(2) Interest on long-term debt(3) Other(4) Investing Activities: Ship purchase obligations(5) Financing Activities: Long-term debt obligations(6) Capital lease obligations(7) Other(8) Total balances, including interest swapped using the applicable rate at December 31, In connection with the sale ofCelebrity Mercury in February 2011, we and TUI AG each guaranteed repayment of 50% of our unsecured revolving credit facility due August 2018 by $300 million by utilizing the accordion feature, bringing our total capacity under this facility to $1.2 billion as of December 31, 2014. We purchased the We are exposed to market risk attributable to changes in interest rates, foreign currency exchange rates and fuel prices. We manage these risks through a combination of our normal operating and financing activities and through the use of derivative financial instruments pursuant to our hedging practices and policies. The financial impact of these hedging instruments is primarily offset by corresponding changes in the underlying exposures being hedged. We achieve this by closely matching the amount, term and conditions of the derivative instrument with the underlying risk being hedged. Although certain of our derivative financial instruments do not qualify or are not accounted for under hedge accounting, we do not hold or issue derivative financial instruments for trading or other speculative purposes. We monitor our derivative positions using techniques including market valuations and sensitivity analyses. (See Note agreements by $55.5 million. approximately These interest rate swap agreements are accounted for as cash flow hedges. Celebrity Reflection term loan. Our interest rate swap agreements effectively converted the interest rate on a portion of the Celebrity Reflection unsecured amortizing term loan balance of approximately $545.4 million from LIBOR plus 0.40% to a fixed rate (including applicable margin) of 2.85% through the term of the loan. Furthermore, at December 31, 2014, we maintained interest rate swap agreements on our Quantum of the Seas term loan. Our interest rate swap agreements effectively converted the interest rate on a portion of the Quantum of the Seas unsecured amortizing term loan balance of approximately $735.0 million from LIBOR plus 1.30% to a fixed rate of 3.74% (inclusive of margin) through the term of the loan. These interest rate swap agreements are accounted for as cash flow hedges. The majority of our foreign currency forward contracts, collar options and cross-currency swap agreements are accounted for as cash flow, fair value or net investment hedges depending on the designation of the related hedge. Accumulated other comprehensive (loss) income at December 31, 2014 and December 31, 2013, respectively. Other income (expense) in our consolidated statements of comprehensive income (loss). Changes in Internal 23, 2015 Interactive Data File Passenger ticket revenues Onboard and other revenues Total revenues Cruise operating expenses: Commissions, transportation and other Onboard and other Payroll and related Food Fuel Other operating Total cruise operating expenses Marketing, selling and administrative expenses Depreciation and amortization expenses Impairment of Pullmantur related assets Operating Income Other income (expense): Interest income Interest expense, net of interest capitalized Extinguishment of unsecured senior notes Other (expense) income (including in 2012 $28.5 million net deferred tax expense related to the Pullmantur impairment) Net Income Basic Earnings per Share: Net income Diluted Earnings per Share: Net income Comprehensive Income (Loss) Net Income Other comprehensive income (loss): Foreign currency translation adjustments Change in defined benefit plans Loss on cash flow derivative hedges Total other comprehensive loss Comprehensive (Loss) Income Assets Current assets Cash and cash equivalents Trade and other receivables, net Inventories Prepaid expenses and other assets Derivative financial instruments Total current assets Property and equipment, net Goodwill Other assets Liabilities and Shareholders' Equity Current liabilities Current portion of long-term debt Accounts payable Accrued interest Accrued expenses and other liabilities Customer deposits Total current liabilities Long-term debt Other long-term liabilities Commitments and contingencies (Note 14) Shareholders' equity Preferred stock ($0.01 par value; 20,000,000 shares authorized; none outstanding) Common stock ($0.01 par value; 500,000,000 shares authorized; 229,080,109 and 227,366,165 shares issued, December 31, 2012 and December 31, 2011, respectively) Paid-in capital Retained earnings Accumulated other comprehensive loss Treasury stock (10,308,683 common shares at cost, December 31, 2012 and December 31, 2011) Total shareholders' equity Operating Activities Net income Adjustments: Depreciation and amortization Impairment of Pullmantur related assets Net deferred tax expense related to Pullmantur impairment Loss (gain) on fuel call options Loss on extinguishment of unsecured senior notes Changes in operating assets and liabilities: Decrease in trade and other receivables, net Increase in inventories Increase in prepaid expenses and other assets Increase (decrease) in accounts payable (Decrease) increase in accrued interest Increase in accrued expenses and other liabilities Increase in customer deposits Cash received on settlement of derivative financial instruments Dividends received from unconsolidated affiliate Other, net Net cash provided by operating activities Investing Activities Purchases of property and equipment Cash (paid) received on settlement of derivative financial instruments Loan to unconsolidated affiliate Cash payments received on loan to unconsolidated affiliate Proceeds from sale of ships Other, net Net cash (used in) investing activities Financing Activities Debt proceeds Debt issuance costs Repayments of debt Extinguishment of unsecured senior notes Dividends paid Proceeds from exercise of common stock options Other, net Net cash (used in) provided by financing activities Effect of exchange rate changes on cash Net (decrease) increase in cash and cash equivalents Cash and cash equivalents at beginning of year Cash and cash equivalents at end of year Supplemental Disclosures Cash paid during the year for: Interest, net of amount capitalized Balances at January 1, 2010 Issuance under employee related plans Dividends declared by Pullmantur Air, S.A.(1) Changes related to cash flow derivative hedges Change in defined benefit plans Foreign currency translation adjustments Net income Balances at December 31, 2010 Issuance under employee related plans Common Stock dividends Dividends declared by Pullmantur Air, S.A.(1) Changes related to cash flow derivative hedges Change in defined benefit plans Foreign currency translation adjustments Net income Balances at December 31, 2011 Issuance under employee related plans Common Stock dividends Dividends declared by Pullmantur Air, S.A.(1) Changes related to cash flow derivative hedges Change in defined benefit plans Foreign currency translation adjustments Net income Balances at December 31, 2012 The following Accumulated net gain (loss) on cash flow derivative hedges at beginning of year Net (loss) gain on cash flow derivative hedges Net (gain) loss reclassified into earnings Accumulated net gain (loss) on cash flow derivative hedges at end of year Accumulated other comprehensive gain at beginning of the year Current-period change Accumulated other comprehensive gain at end of year The accompanying notes are an integral part of these consolidated financial statements. See Note 2. Ship improvements Buildings and improvements Computer hardware and software Transportation equipment and other Leasehold improvements If estimated future cash flows are less than the carrying value of an asset, an impairment charge is recognized to the extent its carrying value exceeds fair value. certification. Class certification is necessary in order for our cruise ships to be flagged in a specific country, obtain liability insurance and legally operate as passenger cruise ships. The activities associated with those drydocking costs cannot be performed while the vessel is in service and, as such, are done during a drydock as a planned major maintenance activity. The significant deferred drydock costs consist of hauling and wharfage services provided by the drydock facility, hull inspection and related activities (e.g., scraping, pressure cleaning, bottom painting), maintenance to steering propulsion, Contingencies —Litigation The On an ongoing basis, we assess whether derivatives used in hedging transactions are "highly effective" in offsetting changes in the fair value or cash flow of hedged items. We use the long-haul method to assess hedge effectiveness using regression analysis for each hedge relationship under our interest rate, foreign currency and fuel hedging programs. We apply the same methodology on a consistent basis for assessing hedge effectiveness to all hedges within each hedging program (i.e., interest rate, foreign currency and fuel). We perform regression analyses over an observation period of up to three years, utilizing market data relevant to the hedge horizon of each hedge relationship. High effectiveness is achieved when a statistically valid relationship reflects a high degree of offset and correlation between the changes in the fair values of the derivative instrument and the hedged item. The determination of ineffectiveness is based on the amount of dollar offset between the change in fair value of the derivative instrument and the change in safety and liquidity. We do not normally require collateral or other security to support credit relationships; however, in certain circumstances this option is available to us. Passenger ticket revenues: United States All other countries Accrued expenses and other liabilities to Derivative financial instruments within Total current liabilities in order to conform to the current year presentation. Balance at December 31, 2010 Foreign currency translation adjustment Balance at December 31, 2011 Impairment charge Foreign currency translation adjustment Balance at December 31, 2012 Based on the probability-weighted discounted cash flows, we determined the fair value of the Pullmantur reporting unit exceeded its carrying value by approximately 52% resulting in no impairment to Pullmantur's goodwill. Indefinite-life intangible asset—Pullmantur trademarks and trade names Impairment charge Foreign currency translation adjustment Total Ships Ship improvements Ships under construction Land, buildings and improvements, including leasehold improvements and port facilities Computer hardware and software, transportation equipment and other Total property and equipment Less—accumulated depreciation and amortization Other operating expenses in our consolidated statements of comprehensive income (loss). We subsequently acquired a 35% equity stake in Skysea Holding in November 2014. See Note See Note 16. Mein Schiff 1 and Mein Schiff 2. Based on current facts and circumstances, we do not believe potential obligations under our guarantee of this bank loan are probable. Other income (expense). $1.1 billion unsecured revolving credit facility, LIBOR plus 1.75%, currently 1.96% and a facility fee of 0.3675%, due 2016 $525.0 million unsecured revolving credit facility, LIBOR plus 2.50%, currently 2.71% and a facility fee of 0.625%, due 2014 Unsecured senior notes and senior debentures, 5.25% to 11.88%, due 2013 through 2016, 2018, 2022 and 2027 €745.0 million unsecured senior notes, 5.63%, due 2014 Unsecured term loans, LIBOR plus 2.75%, due 2013 $225 million unsecured term loan, LIBOR plus 1.25%, due 2012 $570 million unsecured term loan, 4.02%, due through 2013 $589 million unsecured term loan, 4.39%, due through 2014 $530 million unsecured term loan, LIBOR plus 0.62%, currently 1.21%, due through 2015 $519 million unsecured term loan, LIBOR plus 0.45%, currently 1.01%, due through 2020 $420 million unsecured term loan, 5.41%, due through 2021(1) $420 million unsecured term loan, LIBOR plus 2.10%, currently 2.65%, due through 2021(1) €159.4 million unsecured term loan, EURIBOR plus 1.58%, currently 1.98%, due through 2021(1) $524.5 million unsecured term loan, LIBOR plus 0.50%, currently 1.23%, due through 2021 $566.1 million unsecured term loan, LIBOR plus 0.37%, currently 0.97%, due through 2022 $1.1 billion unsecured term loan, LIBOR plus 2.10%, currently 2.65%, due through 2022(2) $632.0 million unsecured term loan, LIBOR plus 0.40%, currently 1.13%, due through 2023 $673.5 million unsecured term loan, LIBOR plus 0.40%, currently 1.03%, due through 2024 $290.0 million unsecured term loan, LIBOR plus 2.5%, currently 2.72%, due through 2016 $7.3 million unsecured term loan, LIBOR plus 2.5%, currently 2.81%, due through 2023 $30.3 million unsecured term loan, LIBOR plus 3.75%, currently 4.06%, due through 2021 Capital lease obligations Less—current portion Long-term portion During 2013 2014 2015 2016 2017 Thereafter 2014. 20,172 shares of common stock in 2014. In thousands Marketing, selling and administrative expenses Payroll and related expenses Total Compensation Expense Dividend yield Expected stock price volatility Risk-free interest rate Expected option life Outstanding at January 1, 2012 Granted Exercised Canceled Outstanding at December 31, 2012 Vested and expected to vest at December 31, 2012 Options Exercisable at December 31, 2012 The weighted-average estimated fair value of stock options granted was $9.90 Non-vested share units at January 1, 2012 Granted Vested Canceled Non-vested share units expected to vest as of December 31, 2012 Non-vested share units at January 1, 2012 Granted Vested Canceled Non-vested share units expected to vest as of December 31, 2012 Net income for basic and diluted earnings per share Weighted-average common shares outstanding Dilutive effect of stock options, performance stock awards and restricted stock awards Diluted weighted-average shares outstanding Basic earnings per share: Net income Diluted earnings per share: Net income 2013 (in thousands): Assets: Cash and cash equivalents(4) Total Assets Liabilities: Long-term debt (including current portion of long-term debt)(5) Total Liabilities 2013. Assets: Derivative financial instruments(4) Investments(5) Total Assets Liabilities: Derivative financial instruments(6) Total Liabilities The reported fair values are based on a variety of factors and assumptions. Accordingly, the fair values may not represent actual values of the financial instruments that could have been realized as of December 31, Pullmantur Goodwill(1) Indefinite-life intangible asset—Pullmantur trademarks and trade names(2) Long-lived assets—Pullmantur aircraft(3) comprehensive income (loss). Long-lived assets are reported within reporting period. If it is determined that a derivative is not highly effective as a hedge or hedge accounting is discontinued, any change in fair value of the derivative since the last date at which it was determined to be effective is recognized in earnings. In addition, the ineffective portion of our highly effective hedges is immediately recognized in earnings In addition, at December 31, matured January 2014. On a regular basis, we enter into foreign currency forward contracts and, from time to time, we utilize cross-currency swap agreements to minimize the volatility resulting from the remeasurement of net monetary assets and liabilities denominated in a currency other than our functional currency or the functional currencies of our foreign subsidiaries. During 2012 2013 2014 2015 2016 Projected fuel purchases for year: 2012 2013 2014 2015 2016 In thousands Derivatives designated as hedging instruments under ASC 815-20(1) Interest rate swaps Cross currency swaps Foreign currency forward contracts Foreign currency forward contracts Foreign currency collar options Fuel swaps Fuel swaps Total derivatives designated as hedging instruments under 815-20 Derivatives not designated as hedging instruments under ASC 815-20 Foreign currency forward contracts Fuel swaps Fuel call options Fuel call options Total derivatives not designated as hedging instruments under 815-20 Total derivatives The In thousands Foreign currency debt Foreign currency debt In thousands Interest rate swaps Interest rate swaps Interest rate swaps Foreign currency forward contracts Cross currency swaps Other income (expense) Other income (expense) Cross currency swaps Interest Expense Other income (expense) Interest rate swaps Other income (expense) Other income (expense) Foreign currency forward contracts Depreciation and amortization expenses Other income (expense) Foreign currency forward contracts Other income (expense) Other income (expense) Foreign currency collar options Depreciation and amortization expenses Other income (expense) Fuel swaps Fuel Other income (expense) Foreign Currency Debt Other income (expense) The effect of derivatives not designated as hedging instruments on the consolidated financial statements was as follows: Foreign currency forward contracts Fuel swaps Fuel call options service in the second quarter of As of December 31, 2013 2014 2015 2016 2017 Thereafter At December 31, 2013 2014 2015 2016 2017 Thereafter Total revenues(1) Operating income(2) Net income (loss)(2),(3) Earnings per share: Basic Diluted Dividends declared per sharePage Business Properties Signatures "Royal“Royal Caribbean,"” the "Company," "we," "our"“Company,” “we,” “our” and "us"“us” refer to Royal Caribbean Cruises Ltd. and, depending on the context, Royal Caribbean Cruises Ltd.'s’s consolidated subsidiaries and/or affiliates. The terms "Royal“Royal Caribbean International," "Celebrity” “Celebrity Cruises," "Pullmantur," "Azamara” “Pullmantur,” “Azamara Club Cruises," "CDF” “CDF Croisières de France,"” and "TUI Cruises"“TUI Cruises” refer to our cruise brands. However, because TUI Cruises is an unconsolidated investment, our operating results and other disclosures herein do not include TUI Cruises unless otherwise specified. In accordance with cruise vacation industry practice, the term "berths"“berths” is determined based on double occupancy per cabin even though many cabins can accommodate three or more passengers.parties'parties’ trademarks, trade names or service marks is not intended to and does not imply a relationship with, or endorsement or sponsorship of us by, these other parties other than as described herein.BusinessBusiness. We are the world's second largest cruise company. We own Royal Caribbean International, Celebrity Cruises, Pullmantur, Azamara Club Cruises and CDF Croisières de France, as well as TUI Cruises through a 50% joint venture. Together, these six brands operate a combined 41 ships in the cruise vacation industry with an aggregate capacity of approximately 98,650 berths as of December 31, 2012. Our ships operate on a selection of worldwide itineraries that call on approximately 455 destinations on all seven continents. In addition to our headquarters in Miami, Florida, we have offices and a network of international representatives around the world which focus on our global guest sourcing. We compete principally on the basis of exceptional service provided by our crew; innovation and quality of ships; variety of itineraries; choice of destinations; and price. We believe that our commitment to build state-of-the-art ships and to invest in the maintenance and revitalization of our fleet to, among other things, incorporate our latest signature innovations, allows us to continue to attract new and loyal repeat guests. We believe cruising continues to be a widely accepted vacation choice due to its inherent value, extensive itineraries and variety of shipboard and shoreside activities. In addition, we believe that our products appeal to a large consumer base and are not dependent on a single market or demographic.62,00064,150 berths under our Royal Caribbean International brand, offering cruise itineraries that range from two to 18 nights. As previously announced, we will redeployMonarch of the Seas fromIn October 2014, Royal Caribbean International to Pullmantur in April 2013.took delivery of the 4,150 berth Quantumof the Seas, its first newbuild since 2010 and the first of a new generation of cruise ships. In addition, we currently have threefour ships on order for our Royal Caribbean International brand with an aggregate capacity of approximately 13,600 berths19,200 berths. These include our second Quantum-class ship, which are expectedis scheduled to enter service in the fourth quarter of 2014, the second quarter of 2015, our third Oasis-class ship and third Quantum-class ship, each of which is scheduled to enter service in the second quarter of 2016 respectively. This includesand our recently ordered thirdfourth Oasis-class ship.ship, which is scheduled to enter service in the second quarter of 2018. Additionally, we announced that we will redeploy Majesty of the Seas from Royal Caribbean International to Pullmantur in 2016. Royal Caribbean International offers a variety of itineraries to destinations worldwide, including Alaska, Asia, Australia, Bahamas, Bermuda, Canada, the Caribbean, Europe, the Middle East, the Panama Canal, South America South Pacific and New Zealand.International'sInternational’s strategy is to attract an array of vacationing guests by providing a wide variety of itineraries and cruise lengths with multiple innovative options for onboard dining, entertainment and other onboard activities. During 2011 Royal Caribbean International initiated a vessel revitalization program in order to incorporate some of the most popular features of our newer ships across the fleet. Nine ships were revitalized under this program during 2011 and 2012 and an additional three ships are scheduled for revitalization during 2013. Royal Caribbean International offers a variety of shore excursions at each port of call. We believe that the variety and quality of Royal Caribbean International'sInternational’s product offerings represent excellent value to consumers, especially to couples and families traveling with children. Because of the brand'sbrand’s extensive and innovative product offerings, we believe Royal Caribbean International is well positioned to attract new consumers to the cruise vacation industry and to continue to bring loyal repeat guests back for their next vacation.24,80024,900 berths under our Celebrity Cruises brand, offering cruise itineraries that range from two to 1823 nights. In February 2015, we entered into construction agreements with STX France to build two new ships of a new generation of Celebrity Cruises ships. These 2,900-berth ships, being developed under the name "Project Edge", are expected to enter service in the second half of 2018 and the first half of 2020, respectively. In September 2014, we sold Celebrity Century to a subsidiary of Skysea Holding International Ltd. ("Skysea Holding"). As part of the sale agreement, we agreed to charter the ship from the buyer until April 2015 to fulfill existing passenger commitments. As discussed further below, we acquired a 35% equity stake in Skysea Holding in November 2014. Celebrity Cruises offers a global cruise experience by providing a variety of cruise lengths and itineraries to marqueepopular destinations, throughout the world, including Alaska, Asia, Australia, Bermuda, Canada, the Caribbean, New England, New Zealand, the Panama Canal the US Pacific Coast and South America. Celebrity Cruises was the first major cruise line to operate a ship in the Galapagos Islands,Celebrity Xpedition, operating in this location since 2004.Celebrity Xpedition has 96 berths and provides this unique experience on seven day cruises that include pre-cruise tours in Ecuador.Cruises delivers a modern luxury cruise vacation experience that appeals to experienced cruisers, resulting in a strong base of loyal repeat guests. The brand also appeals to vacationers who have not yet cruised who seek to explore destinations throughout the world and would enjoy the high quality, service-focused and modern luxury experience the brand offers. Celebrity Cruises'Cruises’ strategy is to deliver an intimatetarget experienced cruisers and quality and service oriented new cruisers by delivering a destination-rich experience onboard upscale ships that offer, among other things, luxurious accommodations, a high staff-to-guest ratio, fine dining, personalized service and extensive spa facilities, and unique onboard activities and entertainment. Thefacilities. In 2013, the brand begancompleted a revitalization ship upgrade for all four Millennium-class ships in 2010 in order to incorporate well receivedwell-received concepts from theits Solstice-class ships. The revitalization program is expected to be completed in 2013 whenCelebrity Constellation, the final Millennium-class vessel to be revitalized, will undergo a second revitalization to incorporate additional amenities and staterooms.1820 nights. Azamara Club Cruises is designeditineraries to ports which are inaccessible to larger ships.Cruises'Cruises’ strategy is to deliver distinctive destination experiences featuringthrough unique itineraries with more overnights and longer stays as well as thoroughcomprehensive tours allowing guests to truly experience the destination.destination in more depth. Azamara Club Cruises'Cruises’ focus is to attract experienced travelers who are looking for more in-depthcomprehensive destination experiences, and who seek a more intimate onboard experience and a high level of service. In furtherance of this strategy, Azamara Club Cruises sails in Asia, Northern and Western Europe, the Mediterranean, South and Central America, the less-traveled islands of the Caribbean and North America. Azamara Club Cruises offers a variety of onboard services, amenities and activities, including gaming facilities, fine dining, spa and wellness, butler service for suites, as well as entertainment venues. Azamara Club Cruises also includes as part of the base price of the cruise certain complimentary onboard services, amenities and activities which are not normally included in the base price of most other cruise lines.Pullmantur5,3006,200 berths under our Pullmantur brand, offering cruise itineraries that range from fourtwo to 12 nights. As previously17 nights throughout South America, the Caribbean and Europe. Additionally, we announced that MonarchMajesty of the Seas will be redeployed from Royal Caribbean International to Pullmantur in April 2013.Pullmantur also has land-based tour operations and owns a 49% interest in an air business that operates four Boeing 747 aircraft in support of its cruise and tour operations.land-based travel packages. Pullmantur offers a range of cruise itineraries to Brazil, the Caribbean andEurope. Pullmantur offers a wide array of onboard activities directed at couples and servicesfamilies traveling with children. Over the last few years, Pullmantur has systematically increased its focus on Latin America and has expanded its presence in that market.guests, including exercise facilities, swimming pools, beauty salons, gaming facilities, shopping, dining, certain complimentary beverages, and entertainment venues.facilitate Pullmantur's ability to focus on its core cruise business, on March 31, 2014, Pullmantur sold the majority of its interest in its non-core businesses. These non-core businesses included Pullmantur’s land-based tour operations, sell land-based travel packages primarily to Spanish guests, including hotels and flights mainly to Caribbean resorts, and land-based tour packages to Europe primarily aimed at Latin American guests. In addition, Pullmantur owns a travel agency network that offersand 49% interest in its air business. In connection with the sale agreement, we retained a wide array19% interest in each of travel related productsthe non-core businesses as well as 100% ownership of the aircraft which are being dry leased to guests in Spain.currently operatesbrand. CDF Croisières de France offers seasonal itineraries to the 1,350-berthMediterranean, Europe and Caribbean. During the winter season, HorizonZenith. is deployed to the Pullmantur brand for sailings in South America. CDF Croisières de France is designed to serve the contemporary segment of the French cruise market by providing a brand tailored for French cruise guests. CDF Croisières de France offers seasonal itineraries to the Mediterraneanvariety of onboard services, amenitiesGerman tourism and activities, including entertainment venues, exerciseshipping company, and spa facilities, fine dining, and gaming facilities.TUI Cruises TUI Cruises is designed to serve the contemporary and premium segments of the German cruise market by offering a product tailored product for German guests. All onboard activities, services, shore excursions and menu offerings are designed to suit the preferences of this target market. TUI Cruises operates twothree ships,Mein Schiff I1, andMein Schiff II2 and Mein Schiff 3, with an aggregate capacity of approximately 3,8006,300 berths. In addition, TUI Cruises currently has twothree newbuild ships on order eachat the Finnish Meyer Turku yard with aan aggregate capacity of 2,500 berths, approximately 7,500 berths:Mein Schiff 4,scheduled for delivery in the second quarter of 20142015, Mein Schiff 5, scheduled for delivery in the third quarter of2015, respectively. TUI2017.iswill offer a joint venturecustom-tailored product for Chinese cruise guests operating the ship purchased from Celebrity Cruises. The new cruise line will begin service in the second quarter of 2015. We and Ctrip each own 35% of the new company, Skysea Holding, with the balance being owned 50% by usSkysea Holding management and 50% by TUI AG, a German tourism and shipping company that also owns 51% of TUI Travel, a British tourism company.well establishedwell-established vacation sector in the North American market, a growing sector over the long-term in the European market and a developing but promising sector in several other emerging markets. Industry data indicates that market penetration rates are still low and that a significant portion of cruise guests carried are first-time cruisers. We believe this presents an opportunity for long-term growth and a potential for increased profitability. We estimate thatglobal cruise industry carried 20.8 millionnumber of annual cruise guests in 2012 compared to 20.2 million cruise guests carried in 2011 and 18.8 million cruise guests carried in 2010. as a percentage of the total population:Year North America(1) Europe(2) 2010 3.1% 1.1% 2011 3.4% 1.1% 2012 3.3% 1.2% 2013 3.4% 1.2% 2014 3.5% 1.3% (1) Source: Our estimates are based on a combination of data obtained from publicly available sources including the International Monetary Fund and Cruise Lines International Association ("CLIA"). Rates are based on cruise guests carried for at least two consecutive nights. Includes the United States of America and Canada. (2) Source: Our estimates are based on a combination of data obtained from publicly available sources including the International Monetary Fund and CLIA Europe, formerly European Cruise Council. 432,000457,000 berths on approximately 282283 ships at the end of 2012.2014. There are approximately 1933 ships with an estimated 65,00098,650 berths that are expected to be placed in service in the global cruise market between 20132015 and 2017,2019, although it is also possible that ships could be ordered or taken out of service during these periods. We estimate that the global cruise industry carried 22.0 million cruise guests in 2014 compared to 21.3 million cruise guests carried in 2013 and 20.9 million cruise guests carried in 2012.Year Royal Caribbean Cruises Ltd. Total Berths Global
Cruise
Guests(1) 2010 391,000 92,300 18,800,000 10,781,000 5,540,000 2011 412,000 92,650 20,227,000 11,625,000 5,894,000 2012 425,000 98,650 20,898,000 11,640,000 6,139,000 2013 432,000 98,750 21,300,000 11,816,000 6,399,000 2014 448,000 105,750 22,006,063 12,260,238 6,535,365 (1) Source: Our estimates of the number of global cruise guests and the weighted-average supply of berths marketed globally are based on a combination of data that we obtain from various publicly available cruise industry trade information sources including Seatrade Insider, Cruise Industry News and CLIA. In addition, our estimates incorporate our own statistical analysis utilizing the same publicly available cruise industry data as a base. (2) Source: CLIA based on cruise guests carried for at least two consecutive nights (see number 1 above). Includes the United States of America and Canada. (3) Source: CLIA Europe, formerly European Cruise Council, (see number 2 above). have historically beenare sourced from North America, and Europe.North America The North Americanwhich represented approximately 55.7% of global cruise market has historically experienced significant growth.guests in 2014. The compound annual growth rate in cruise guests forsourced from this market was approximately 4.5%3.3% from 20082010 to 2012. We estimate that North America was served by 144 ships with2014.212,000 berths at the beginning29.7% of 2008 and by 146 ships with approximately 258,000 berths at the end of 2012. There are approximately 10 ships with an estimated 40,000 berths that are expected to be placedglobal cruise guests in service in the North American cruise market between 2013 and 2017.Europe As compared to North America, the European cruise market represents a smaller but even faster growing sector of the vacation industry. It has experienced a2014. The compound annual growth rate in cruise guests ofsourced from this market was approximately 7.6%4.2% from 20082010 to 2012. This market has recently experienced a number of challenges as a result of the effects of the Costa Concordia incident and the continued instability in the European economic landscape. However, we continue to believe in the long term growth potential of this market. We estimate that Europe was served by 102 ships with approximately 108,000 berths at the beginning of 2008 and by 117 ships with approximately 156,000 berths at the end of 2012. There are approximately 9 ships with an estimated 25,000 berths that are expected to be placed in service in the European cruise market between 2013 and 2017. The following table details the growth in the global, North American and European cruise markets in terms of cruise guests and estimated weighted-average berths over the past five years: Global
Cruise
Guests(1) Weighted-Average
Supply of
Berths
Marketed
Globally(1) North American
Cruise
Guests(2) Weighted-Average
Supply of
Berths
Marketed in
North America(1) European
Cruise
Guests Weighted-Average
Supply of
Berths
Marketed in
Europe(1) 17,184,000 347,000 10,093,000 219,000 4,500,000 120,000 17,340,000 363,000 10,198,000 222,000 5,000,000 131,000 18,800,000 391,000 10,781,000 232,000 5,540,000 143,000 20,227,000 412,000 11,625,000 245,000 5,894,000 149,000 20,823,000 425,000 12,044,000 254,000 6,040,000 152,000 (1)Source: Our estimates of the number of global cruise guests, and the weighted-average supply of berths marketed globally, in North America and Europe are based on a combination of data that we obtain from various publicly available cruise industry trade information sources including Seatrade Insider and Cruise Line International Association ("CLIA"). In addition, our estimates incorporate our own statistical analysis utilizing the same publicly available cruise industry data as a base.(2)Source: Cruise Line International Association based on cruise guests carried for at least two consecutive nights for years 2008 through 2011. Year 2012 amounts represent our estimates (see number (1) above).(3)Source: CLIA Europe, formerly European Cruise Council, for years 2008 through 2011. Year 2012 amounts represent our estimates (see number (1) above).Other Markets as discussed above, we expect the Asia/Pacific region to demonstrate an even higher growth rate in the near term, although it will continue to represent a relatively small sector compared to North America and Europe.Lines,Line, Costa Cruises, Cunard Line, Holland America Line, Iberocruceros, P&O Cruises and Princess Cruises; Disney Cruise Line; MSC Cruises; Norwegian Cruise Line Holdings Ltd, which owns Norwegian Cruise Line, Oceania Cruises and OceaniaRegent Seven Seas Cruises. Cruise lines compete with other vacation alternatives such as land-based resort hotels and sightseeing destinations for consumers'consumers’ leisure time. Demand for such activities is influenced by political and general economic conditions. Companies within the vacation market are dependent on consumer discretionary spending.••••••revitalizationupgrade and maintenance of existing ships and the transfer of key innovations across each brand, while prudently expanding our fleet with the new state-of-the-art cruise ships, recently delivered and on order,•••in which our ships sail and the communities in which we operate by reducing/mitigating adverse environmental consequences and using resources efficiently.operate. As part of this commitment, we have established aour Safety, Environment and Health Department to overseeoversees our maritime safety, global security, environmental stewardship and medical/public health activities. We also haveOur dedication to these areas is guided by a Maritime Advisory Board of experts as well asand overseen by the Safety, Environment and Health (SEH) Committee of our Board of Directors which oversees these important areas. In addition, we publish anDirectors. We publicly share our safety, environment and health performance along with our social and governance performance through our annual Stewardship Report on(calendar years 2008 through 2012) and through its successor, our performance in these important areas,Sustainability Report, each of which can be accessed on our brand websites. Following Our most recent report, covering the Costa Concordia incident in early 2012, we2013 year, adopted the Global Reporting Initiative format widely used around the world to help companies better identify and other cruise lines performed reviewsreport on the environmental and social aspects that are most significant to the organization and its stakeholders. Our brand websites also provide information about our environmental performance goals and our voluntary reporting of safety and emergency response procedures to identify lessons learned and best practices to further protect the safetyonboard security incidents. The foregoing information contained on our websites is not a part of our guests and crew. During this process, we held regular meetings with other cruise companies to propose new industry-wide policies that we believe will further drive our Company's and the industry's safety performance. A numberany of these policies have already been implemented and/reports and is not incorporated by reference herein or publicly announced byin any other report or document we file with the Cruise Lines International Association as well as shared with international regulators.StrengthenSecurities and support our humanExchange Commission.backgroundsand perspectives as diverse as our guest base.extraordinary vacations. Attracting, engaging, and retaining key employees has been and will remain critical to our success. continue our focus on providing our employees with a competitive compensation structure and development and other personal and professional growth opportunities in order to strengthen and support our human capital. We also seek to select, develop and have strategies to retain high performing leaders to advance the enterprise now and in the future. To that end, we pay special attention to identifying high performing potential leaders and developdeveloping deep bench strength so these leaders can assume leadership roles throughout the organization. We strive to maintain a work environment that reinforces collaboration, motivation and innovation, and believe that maintaining our vibrant and distinctivestrong employee-focused culture is criticalbeneficial to the growth and expansion of our business.Strengthen our consumerhigh valuehigh-value guests by better understanding consumer data and insights and creating communication strategies that best resonate with our target audiences.In 2013, we will continue toWe have strategically investinvested in a number of potential revenue enhancing projects onboard our ships, including the implementation of new onboard revenue initiatives. Weinitiatives that we believe these initiatives will provide opportunities for increased ticketdrive profitability and onboard revenues.by usingthrough the use of communication strategies and marketing campaigns designed to emphasize the unique qualities of each brand and to broaden the awareness of the brand, especially among the brandbrand's target customer groups. Our marketing strategies include the use of traditional media, social media, brand websites and travel agencies. Our brands engage past and potential guests by collaborating with travel partners and through call centers, international offices and international representatives. In addition, Royal Caribbean International, Celebrity Cruises and Azamara Club Cruises retaintarget repeat guests with exclusive benefits offered through their respective loyalty programs.whowhich generate the majority of our bookings. We are committed to further developing and strengthening this very important distribution channel by continuing to focus the travel agents on the unique qualities of each of our brands.North Americathe United States and Canada through our offices in the United Kingdom, France, Germany, Norway, Italy, Spain, Singapore, China, Brazil, Australia and Mexico. We believe that having a local presence in these markets provides us with the ability to react more quickly to local market conditions and better understand our consumer base in each market. We further extend our geographic reach with a network of 3638 independent international representatives located throughout the world covering 111115 countries. Historically, our focus has been to primarily source guests for our global brands from North America. Over the last several years, we have continuedWe also continue to expand our focus on selling and marketing our cruise brands to guests in countries outside of North America through fleet innovationby tailoring itineraries and by respondingonboard product offerings to the itinerary preferences and cultural characteristics and preferences of our international guests. In 2013,addition, we will continue to focus on the development of key markets in Asia and we will focus on sourcing guests and adding capacity to the markets where we expect significant growth and profitability, such as China and Australia. We are also focused on expanding our Pullmantur brand into Latin America, with particular emphasis in Brazil. We also look forexplore opportunities that may arise to acquire or develop brands tailored to specific markets. TUI Cruises, our joint venture with TUI AG, is a cruise brand targeted at the cruise market in Germany. TUI Cruises complements our other tailored brands including Pullmantur and CDF Croisières de France.49%47% of total passenger ticket revenues in 2014 and 48% and 49% in 2013 and 2012, and 2011, and 45% in 2010.respectively. International guests have grown from approximately 1.31.8 million in 20082010 to approximately 2.2 million in 2012.Focus on cost2014. manage our operating expenditures and ensure adequate cash and liquidityare committed tocontinue our effortscommitment to identify and implement cost containment initiatives. Our most recent initiatives including a numberrelate to realizing economies of scale and improving service delivery to our travel partners and guests by restructuring and consolidating our global sales, marketing, general and administrative structure. We also continue our initiatives to reduce energy consumption and, by extension, fuel costs. These include the design of more fuel efficientfuel-efficient ships as well as the implementation of more efficient hardware, including propulsion and cooling systems incorporating energy efficiencies. In addition, weWe are also continuingIn addition, we continue to pursue our long-term objective of returning our credit ratings to investment grade. We believe these strategies enhance our ability to achieve our overall goal of maximizing our return on invested capital and long-term shareholder value.revitalization,upgrade, maintenance and expansion"Royal Promenade"“Royal Promenade” (a boulevard with shopping, dining and entertainment venues), ice skating rinks, rock climbing walls, miniature golf and full court basketball for the Royal Caribbean International brand and theenhanced design of thefeatures found on our Solstice-class ships contemporary quality dining, spacious staterooms and suites with verandas, spa facilities and variety of bars and lounges for the Celebrity Cruises brand. In 2009 and 2010, Royal Caribbean International took delivery of sister ships,Oasis of the Seas andAllure of the Seas, which are the largest and most innovative cruise ships in the cruise industry. With the same focus on product innovation, Celebrity Cruises ordered a total of five Solstice-class ships, the last of which,Celebrity Reflection, was delivered in 2012. The Solstice-class ships incorporate many new and improved design features.revitalizationupgrade and maintenance programs enable us to incorporate many of our latest signature innovations throughout the brand fleet and allow us to benefit from economies of scale by leveraging our suppliers. Ensuring consistency across our fleet provides us with the flexibility to redeploy our ships among our brand portfolio. As part of these efforts:•Royal Caribbean International initiated a vessel revitalization program in 2011 in order to introduce some of the most popular features of the Oasis-class ships on certain Freedom-class, Radiance-class and Vision-class ships.Liberty of the Seas,Freedom of the Seas,Radiance of the Seas andSplendour of the Seas were revitalized in 2011 andRhapsody of the Seas,Mariner of the Seas,Grandeur of the Seas, Serenade of the Seas andEnchantment of the Seas were revitalized in 2012 as part of this revitalization program. An additional three ships are scheduled for revitalization in 2013.•Celebrity Cruises began investing in the revitalization of the Millennium-class ships in 2010 asCelebrity Constellation underwent a revitalization of its onboard amenities and public areas to incorporate certain Solstice-class features. In 2011 and the early part of 2012,Celebrity Infinity, Celebrity Summit andCelebrity Millennium added onboard amenities, public areas and new staterooms. In 2013,Celebrity Constellation will undergo a second revitalization to incorporate additional amenities and staterooms. also committed to building state-of-the-art ships and currently our brands, includingexcluding our 50% joint venture TUI Cruises, currently have signedeffective agreements for the construction of fivefour new ships. These consist of our recently ordered third Oasis-class ship which is scheduled to enter service in the second quarter of 2016, two Quantum-class ships, of a new generation of Royal Caribbean International cruise ships to be known as the Quantum-class which are scheduled to enter service in the fourth quarter of 2014 and second quarterquarters of 2015 respectively, and 2016 and two Oasis-class ships, which are scheduled to enter service in the second quarters of 2016 and 2018, respectively. We also reached conditional agreements with STX France to build two ships of a new generation for TUICelebrity Cruises, which are scheduled to enter service in the second quarterhalf of 20142018 and second quarterthe first half of 2015, respectively. These additions are2020. The addition of these six ships is expected to increase our passenger capacity by approximately 18,60025,000 berths by December 31, 2016,2020, or approximately 18.9%25.1%, as compared to our capacity as of December 31, 2012. 2014. In support of our maintenance programs, we own a 40% interest in a ship repair and maintenance facility, Grand Bahama Shipyard Ltd., which is the largest cruise ship dry-dock repair facility in the world and is located in Freeport, Grand Bahama. We utilize this facility, among other ship repair facilities, for our regularly scheduled drydocks and certain emergency repairs as may be required. In addition, the facility serves unaffiliated cruise and cargo ships, oil and gas tankers, and offshore units.and our investment in infrastructure allows us to expand into new markets and helps us reduce our dependency on any one market by allowing us to create "home ports" around the world. In addition, it allows us to readily deploy our ships to meet demand within our existing cruise markets.455 ports480 destinations in 95113 countries, spanning all seven continents. We are focused on obtaining the best possible long-term shareholder returns by operating in established markets while growing our presence in developing markets. New capacity allows us to expand into new markets and itineraries. Our brands have expanded their mix of itineraries while strengthening our ability to further penetrate the Asian, Australian, Caribbean, European, and Latin American markets further. In addition,markets. Additionally, in order to capitalize on the summer season in the Southern Hemisphere and mitigate the impact of the winter weather in the Northern Hemisphere, our brands have increasedfocused on deployment toin Australia and Latin America. We continue to focus on the acceleration of Royal Caribbean International's, Celebrity Cruises' and Azamara Club Cruises' strategic positioning as global cruise brands. In 2012, Royal Caribbean International continued its global expansion by seasonally adding a second ship in Asia and a third ship in Australia, adding new departure ports in Southern Europe in order to target guests in key source markets in the region and increasing capacity in Northern Europe. The brand also modified certain of its itineraries for 2012 due to continuing geopolitical unrest in Northern Africa and Greece. In 2013,Monarch of the Seas will be redeployed to the Pullmantur fleet and Royal Caribbean International will decrease its European capacity by approximately 23% in order to mitigate its exposure to the uncertain outlook in the European market. Royal Caribbean International will continue to offer short Bahamassailings, return to year-round southern Caribbean sailings and increase capacity in Asia and China with the repositioning ofMariner of the Seas. In October 2012, Celebrity Cruises introducedCelebrity Reflection, the fifth and final Solstice-class ship, which offers sailings in Europe and the Caribbean. The addition ofCelebrity Reflection allows Celebrity Cruises to introduce a Solstice-class ship in Alaska and Australia/New Zealand, offer a British Isles/Northern European program, and an Asia program for 2013. The added product offerings in Europe result in a 12% capacity increase for 2013. Celebrity Cruises is expanding its focus on destination by emphasizing exotic ports and calling on new destinations in Australia and New Zealand, Hawaii, the Panama Canal and Asia, with longer cruises in Southeast Asia, Indonesia, China and Japan. In 2013, Azamara Club Cruises' voyages will be sailing to 184 ports in 60 countries around the globe with more than 50% of its ports-of-call featuring late night stays or overnights, allowing guests to experience the destination by day and by night. The Azamara Club Cruises 2013 deployment features South America, including Carnival in Rio de Janeiro, Antarctica, the West Indies, British Isles and Western Europe, Scandinavia and the Baltics, Eastern & Western Mediterranean, as well as the Indian Ocean and Asia. Also, Pullmantur and CDF Croisières de France will continue to offer itineraries in the Caribbean, Europe and South America with particular emphasis in Brazil.partnerspartnerships established to develop and/or operate the port facilities, by providing direct development and management expertise or in certain limited circumstances, by providing direct or indirect financial support. In exchange for our involvement, we generally secure preferential berthing rights for our ships.Enhance our technological capabilitiesTo this end, technologyTechnology is a pervasive part of virtually every business process we use in order to support our strategic focus and provide a quality experience to our customers before, during and after their cruise. Moreover, as the use of our various websites and social media platforms continue to increase along with the increasing use of technology onboard our ships by both our guests and crew, we continually need to upgrade our systems, infrastructure and technologies to facilitate this growth. To further our customer-centricity, during 2013,As a result, we intend to continue to improve our customer experiences online through the launch of ahave launched several new digital platforminitiatives, which will include among other improvements, revamped websites, new vacation packaging capabilities, support of mobile applicationsapps and increasedmodern high speed bandwidth capabilities onboard our ships helpingthree largest vessels. We also provided a host of new and innovative guest engaging technologies on our guests remain well-connected while at sea. Active engagement in social media channels is also an integral partnewest ship, the Quantum of our marketing strategy and a part of our broader consumer engagement strategy and relationship management platform. during 2012, we began to implement new capabilities to improve our revenue management systems and decision support processes in advanceprocesses. As part of our WAVE season (traditionally the first two months of the year where cruise lines experience disproportionately higher volume cruise sales). In 2013,this effort, we will continue to build on this new platform and introducehave introduced new price optimization tools and continue to further leverage the pricing and promotion management capabilities in our reservations system. As part of the Royal Caribbean International and Celebrity Cruises revitalization programs, we have incorporated many of the technological innovations from the Oasis-class ships and Solstice-class ships, respectively, across our fleet. In addition, to position ourselves for the future, we have embarked on several multi-year information technology strategic initiatives to ensure that we can continue to innovate and respond to the ever increasing expectations of our guests in a scalable and cost effective manner.also provide brand dedicated sales representatives who assistserve as advisors to our travel partners through a number of platforms, includingpartners. We also provide trained customer service representatives, call centers and online training tools. direct sales initiatives, we have established a Consumer Outreach department which allows consumers 24 hour24-hour access to our certified vacation planners, group vacation planners and customer service agents in our call centers throughout the world.centers. In addition, we maintain and invest in our websites, including mobile applications and mobile websites, which allow guests to directly plan, book and customize their cruise, as well as encourage guests to book their next cruise vacations onboard our ships.Captain'sCaptain��s Club and Le Club Voyage, respectively, to encourage repeat business. Crown & Anchor Society has over 7.2approximately 8.4 million members worldwide. Captain'sCaptain’s Club and Le Club Voyage have 2.02.9 million members combined worldwide. Members are typically eligible to enroll in these complimentary programs after one sailing and earn increasing membership status by accumulating cruise points or credits, depending on the brand, which may be redeemed on future sailings. Members are awarded points or credits in proportion to the number of cruise days and stateroom category. The loyalty programs provide certain tiers of membership benefits which can be redeemed by guests after accumulating the number of cruise points or credits specified for each tier. In addition, upon achieving a certain level of cruise points or credits, members benefit from reciprocal membership benefits across all of our loyalty programs. Examples of the rewards available under our loyalty programs include, but are not limited to, priority ship embarkation, priority waitlist for shore excursions, complimentary laundry service, complimentary internet, booklets with onboard discount offers, upgraded bathroom amenities, private seating on the pool deck, ship tours and, in the case of our most loyal guests who have achieved the highest levels of cruise points or credits, complimentary cruises.cruise days. We regularly work to enhance each of our loyalty programs by adding new features and amenities in order to reward our repeat guests.2012,2014, our brands, including our 50% joint venture TUI Cruises, operate 4143 ships with a selection of worldwide itineraries ranging from two to 1823 nights that call on approximately 455480 destinations.20132015 under ourthese six cruise brands including our 50% joint venture TUI Cruises, and their geographic areas of operation based on 2013current 2015 itineraries (subject to change). Year Ship
Entered Service(2) Approximate
Berths Primary Areas of Operation Ship Year Ship
Built
Entered Service(1) Approximate
Berths Primary Areas of Operation Anthem of the Seas 2015 2015 4,150 Europe, Eastern/Western/Southern Caribbean, Bahamas Quantum of the Seas 2014 2014 4,150 Bahamas, Eastern/Southern Caribbean, Asia 2010 5,400 Eastern/Western Caribbean 2010 2010 5,400 Eastern/Western Caribbean, Europe 2009 5,400 Eastern/Western Caribbean 2009 2009 5,450 Eastern/Western Caribbean 2008 3,600 Europe, Eastern/Western Caribbean 2008 2008 3,600 Eastern/Western Caribbean 2007 3,600 Europe, Short Caribbean 2007 2007 3,600 Eastern/Western Caribbean, Bermuda, Canada 2006 3,600 Eastern/Western Caribbean 2006 2006 3,600 Eastern/Western Caribbean 2004 2,100 Short Western Caribbean, South Caribbean 2004 2004 2,100 Alaska, Southern Caribbean 2003 3,100 Western Caribbean, Asia 2003 2003 3,100 Asia 2003 2,100 Western Caribbean, Europe, Middle East 2003 2003 2,100 Southern Caribbean, Europe, Canada 2002 3,100 Western Caribbean, Europe 2002 2002 3,250 Eastern/Western Caribbean 2002 2,100 Europe, Western/Southern Caribbean, Canada 2002 2002 2,100 Europe, Western Caribbean, Canada 2001 3,100 Southern Caribbean, Europe 2001 2001 3,100 Southern Caribbean 2001 2,100 Alaska, Australia/New Zealand/South Pacific 2001 2001 2,100 Alaska, Australia/New Zealand 2000 3,100 Eastern/Southern Caribbean, Bermuda, Canada 2000 2000 3,100 Eastern/Southern Caribbean, Europe, Australia/New Zealand 1999 3,100 Asia, Australia/New Zealand 1999 1999 3,250 Asia, Australia/New Zealand 1998 2,000 Europe, Southern/Eastern Caribbean, Panama Canal 1998 1998 2,000 Western Caribbean, Europe 1997 2,250 Eastern/Western Caribbean, Bahamas 1997 1997 2,250 Bahamas 1997 2,000 Australia/New Zealand, Alaska 1997 1997 2,000 Europe, South America 1996 1,950 Southern/Eastern/Western Caribbean, Bermuda, Canada 1996 1996 1,950 Southern/Eastern/Western Caribbean, Bermuda, Canada 1996 1,800 Europe, Brazil 1996 1996 1,800 Europe, Dubai 1995 1,800 Asia, Europe, Eastern/Southern Caribbean, Panama Canal 1995 1995 1,800 Eastern/Southern Caribbean, Asia, Australia/New Zealand 1992 2,350 Bahamas 1992 1992 2,350 Bahamas 2012 3,000 Europe, Eastern Caribbean 2012 2012 3,000 Europe, Eastern/Western Caribbean 2011 2,850 Europe, Eastern / Western Caribbean 2011 2011 2,850 Europe, Eastern/Western Caribbean 2010 2,850 Europe, Southern Caribbean 2010 2010 2,850 Europe, Southern Caribbean 2009 2,850 Europe, Long Caribbean 2009 2009 2,850 Europe, Eastern/Western/Southern Caribbean 2008 2,850 Alaska, Australia/New Zealand 2008 2008 2,850 Alaska, Australia/New Zealand 2002 2,050 Short Caribbean, Europe 2002 2002 2,150 Short Caribbean, Eastern Caribbean, Europe 2001 2,150 Southern Caribbean, Bermuda, Canada/New England 2001 2001 2,150 Southern Caribbean, Bermuda, Canada 2001 2,150 Europe, Panama Canal, South America 2001 2001 2,150 Alaska, Panama Canal, S. America 2000 2,150 Alaska, Asia, Panama Canal 2000 2000 2,150 Alaska, Asia 1995 1,800 Alaska, Hawaii, Panama Canal, Pacific Coastal 2004 96 Galapagos Islands 1995 1995 1,800 Asia Celebrity Xpedition 2001 2004 100 Galapagos Islands Year Ship
Entered Service(2) Approximate
Berths Primary Areas of Operation 2004 700 Europe, Asia 2006 700 Europe, South/Central America, Panama Canal 1992 1,400 Europe, Brazil 1990 1,600 Europe, Brazil 1988 2,300 Europe, Brazil 1991 2,350 Southern Caribbean, South America 1990 1,350 Europe, Southern Caribbean 2009 1,900 Europe, Southern Caribbean 2011 1,900 Europe, Middle East, Southern Caribbean 98,646 Ship Year Ship
Built
Entered Service(1) Approximate
Berths Primary Areas of Operation Azamara Club Cruises Azamara Quest 2000 2007 700 Europe, Asia Azamara Journey 2000 2007 700 Europe, Asia, Central/South America, Eastern/Western and Southern Caribbean, Panama Canal Monarch 1991 2013 2,350 Southern Caribbean Empress 1990 2008 1,600 Europe, Brazil Sovereign 1988 2008 2,300 Europe, Brazil CDF Croisières de France Horizon 1990 2010 1,400 Europe, Southern Caribbean 1992 2014 1,400 Europe, Brazil TUI Cruises Mein Schiff 4 2015 2015 2,500 Northern Europe, Canary Islands Mein Schiff 3 2014 2014 2,500 Europe, Canary Islands Mein Schiff 2 1997 2011 1,900 Europe, Middle East, Southern Caribbean Mein Schiff 1 1996 2009 1,900 Europe, Canary Islands, Southern Caribbean Total 112,450 (1) The year a ship entered service refers to the year in which the ship commenced cruise revenue operations for the brand. (2) (3) (4) (1)It does not include Pullmantur'sAtlantic Star which has been out of operation since 2009 and will be transferred to an affiliate of STX France as part of the consideration for building the third Oasis-class ship if the agreement becomes effective. Additionally, in April 2012, we deliveredOcean Dream, previously operated by Pullmantur, to an unrelated third party as part of a six year bareboat charter agreement. The charter agreement provides a renewal option exercisable by the unrelated third party for an additional four years.(2)The year a ship entered service refers to the year in which the ship commenced cruise revenue operations for the Company, which is the same as the year the ship was built, unless otherwise noted.(3)Celebrity Xpedition was built in 2001.(4)Azamara Journey (formerlyBlue Dream) was built in 2000.(5)Azamara Quest (formerlyBlue Moon) was built in 2000.(6)Monarch of the Seas will be redeployed from Royal Caribbean International to Pullmantur in April 2013.(7)Horizon was built in 1990.(8)TUI Cruises refers to our 50% joint venture.(9)Mein Schiff 1 (formerlyGalaxy) was built in 1996.(10)Mein Schiff 2 (formerlyMercury) was built in 1997.fiveseven ships on order. Two ships on order are being built in Germany by Meyer Werft GmbH, twothree are being built in Finland by STX FinlandMeyer Turku shipyard and one will betwo are being built in France by STX France. The expected dates that our ships on order will enter service and their approximate berths are as follows:Ship ShipExpected to Quantum of the Seas4th Quarter 20144,1002nd Quarter 2015 4,150 4,100Oasis-class(1):2nd Quarter 2016 4,150 Oasis-class: UnnamedOasis 3 2nd Quarter 2016 5,450 5,400TUI Cruises—2nd Quarter 2018 5,450 TUI Cruises (50% joint venture)— Mein Schiff 32nd Quarter 20142,5002nd Quarter 2015 2,500 Mein Schiff 5 3rd Quarter 2016 2,500 Mein Schiff 6 2nd Quarter 2017 2,500 Total Berths 26,700 Total Berths18,600
2015. The ships will each have a capacity of approximately 2,900 berths and are expected to enter service in the second half of 2018 and the first half of 2020, respectively.(1)December 2012,addition, we orderedreached conditional agreements with STX France to build two ships of a third Oasis-class ship through a conditional agreement.new generation of Celebrity Cruises ships, known as "Project Edge." The agreement isagreements are subject to certain closing conditions and isto effectiveness expected to become effectiveoccur in the firstsecond quarter of 2013.Hemisphere'sHemisphere’s summer months and holidays. In order to mitigate the impact of the winter weather in the Northern Hemisphere and to capitalize on the summer season in the Southern Hemisphere, our brands have increasedfocused on deployment to Southin Australia and Latin America and Australia during the Northern Hemisphere winter months.Management'sManagement’s Discussion and Analysis of Financial Condition and Results of Operations, for definitions): Year Ended December 31, Year Ended December 31, 2012 2011 2010 2009 2008 2014 2013 2012 2011 2010 4,852,079 4,850,010 4,585,920 3,970,278 4,017,554 5,149,952 4,884,763 4,852,079 4,850,010 4,585,920 35,197,783 34,818,335 32,251,217 28,503,046 27,657,578 36,710,966 35,561,772 35,197,783 34,818,335 32,251,217 33,705,584 33,235,508 30,911,073 27,821,224 26,463,637 34,773,915 33,974,852 33,705,584 33,235,508 30,911,073 104.4 % 104.8 % 104.3 % 102.5 % 104.5 % 105.6 % 104.7 % 104.4 % 104.8 % 104.3 % to certain travel agencies and tour operators in select markets mainly outsideIn 2013,During 2014, we plandeveloped and implemented revenue management tools that enabled us to use new optimization toolsbetter understand and react to setthe current demand and pricing and leverage enhancements for the web and our reservation systems.environment. Historically, we have opened cruises for sale at least one year in advance and often as much as two years in advance. Additionally, we offer air transportation as a service for guests that elect to utilize our transportation program. Our air transportation program is available in major cities around the world and prices vary by gateway and destination. Generally, air tickets are sold to guests at prices close to cost.2011 and 2010. From time to time, we have introduced temporary fuel supplements to partially offset a portion of fuel costs, which result in an additional fee being charged to the guests. While none of our brands are currently charging fuel supplements, we reserve the right to reinstate our fuel supplements for one or more of our brands and will continue to monitor our markets and review our position based upon the appropriate facts and circumstances.Royal Caribbean International, Celebrity Cruises and Azamara Club Cruises offer functionalityMany of these services are available for pre-booking on their respectivethe internet sites for selecting shore excursions, specialty dining and amenities prior to embarkation.Pullmantur offers land-based travel packagesDuring 2014, we continued to European vacation travelers including hotels and flights to Caribbean resorts and sells land based tour packages to Europe aimed at Latin American guests. Pullmantur also owns a 49% interestexpand the markets in an air business that operates four Boeing 747 aircraft in support of its cruise and tour operations. In addition,which we sell our cruise vacation protection coverage, which provides guests with coverage for trip cancellation, medical protection and baggage protection. We expect to offer these programs more globally in 2013. Onboard and other revenues accounted for approximately 27%, 28% and 27% of total revenues in 2014, 2013 and 2012, 2011 and 2010.2012, we2014, our brands, excluding our 50% joint venture, TUI Cruises, employed approximately 62,000over 64,000 employees, including 55,00058,000 shipboard employees as well as 6,2005,700 full-time and 750600 part-time employees in our shoreside operations. As of December 31, 2012,2014, approximately 80%86% of our shipboard employees were covered by collective bargaining agreements. Based on employee survey results, we believe our employees' satisfaction level with our organization is strong.which includes additional coverage for disbursements, earnings and increased value, which are maintained in amounts relatedwith insured values generally equal to the netTheThis coverage for each of the hull policies is maintained with syndicates offinancially sound insurance underwriters from the British, Scandinavian, French, United States and other reputable international insurance markets. liability protection and indemnity liability insurance, which provides coverage for eachliabilities, costs and expenses for illness and injury to crew, guest injury, pollution and other third-party claims that arise out of, or are the result of, our shipscruise operations. Our vessels are insured through either the United Kingdom Mutual Steam Ship Assurance Association (Bermuda) Limited or the Steamship Mutual Underwriting Association (Bermuda) Limited or the Assuranceforeningen SKULD (Gjensidig).Limited. Our protection and indemnity liability insurance is done on a mutual basis and we are subject to additional premium calls in amounts based on claim records of all members of the mutual protection and indemnity association. We are also subject to additional premium calls based on investment shortfalls experienced by the insurer.and general liability, off-vessel liability, directors & officers and network & privacy risks are maintained with insurance underwriters in the United States and the United Kingdom. We carry business interruption insurance for certain of our shoreside operations. The Athens Convention relating toCarriage of PassengersEuropean Union's Passenger Liability Regulations (effective December 31, 2012) and their Luggage by Sea (1974) and the 1976 Protocol to the Athens Convention are generally applicable to passenger ships. The United States has not ratified the Athens Convention; however, with limited exceptions, the 1976 Athens Convention Protocol may be contractually enforced with respect to those of our cruises that do not call at a United States port. The International Maritime Organization Diplomatic Conference agreed upon a new Protocol to the Athens Convention on November 1, 2002. The 2002 Protocol which is not yet in force pending ratification by the requisite number of countries, substantially(effective April 2014 ) require substantial increases to the level of compulsory insurance which must be maintained by passenger ship operators. In an attempt to expedite implementation, the European Union adopted the European Union Regulation 392/2009 ("EU Passenger Liability Regulation") on the liability of carriers of passengers by sea, which became effective on December 31, 2012. This regulation incorporates the 2002 Protocol in many ways. ComplianceMaintaining compliance with the EU Passenger Liability Regulation doesthese regulations has not havehad a material impact on operating costs."Royal“Royal Caribbean International"International” and its crown and anchor logo, the name "Celebrity Cruises"“Celebrity Cruises” and its "X"“X” logo, the name "Azamara“Azamara Club Cruises"Cruises” and its globe with an “A” logo, the names "Pullmantur Cruises"“Pullmantur Cruises” and "Pullmantur"“Pullmantur” and their logos, the name "CDF“CDF Croisières de France"France” and its logo, and the names of various cruise ships.ships, as well as loyalty program names and other marketing programs. We believe our trademarks are widely recognized throughout the world and have considerable value.Ecuador (collectively, the "Flag States").Ecuador. Each ship is subject to regulations issued by its country of registry, including regulations issued pursuant to international treaties governing the safety of our ships, guests and crew as well as environmental protection. Each country of registry conducts periodic inspections to verify compliance with these regulations as discussed more fully below. Ships operating out of United States ports are subject to inspection by the United States Coast Guard for compliance with international treaties and by the United States Public Health Service for sanitary and health conditions. Our ships are also subject to similar inspections pursuant to the laws and regulations of various other countries our ships visit.("SOLAS"(“SOLAS”), which among other things, establishes requirements("(“ISM Code"Code”), which provides an international standard for the safe management and operation of ships and for pollution prevention. The ISM Code is mandatory for all vessels, including passenger vessel operators. It is possible that the Costa Concordia incident could lead to new safety legislation and/or regulations. Although it is too early to assess the impact of any such legislation or regulation, we already equal or exceed most of the new safety measures under discussion and, accordingly, do not expect that we would be required to incur additional material compliance costs.("(“ISPS Code"Code”), which is part of SOLAS, and the U.S. Maritime Transportation Security Act of 2002 ("MTSA"(“MTSA”), which applies to ships that operate in U.S. ports. In order to satisfy these security requirements, we implement security measures, conduct vessel security assessments, and develop security plans. The security plans for all of our ships have been submitted to and approved by the respective countries of registry for our ships in compliance with the ISPS Code and the MTSA. In July 2010, the U.S. adopted theStates. This actStates, requires the implementation of certain safety design features as well as the establishment of practices for the reporting of and dealing with allegations of crime. In 2013,The cruise industry supported this legislation and we believe that our internal standards are generally as strict or stricter than the law requires. A few provisions of the law call for regulations which have not yet been finalized; however, based on proposed regulations issued by the U.S. Coast Guard is expected to issue regulations governing implementation of certain provisions of the act. We already exceed most of the requirements of the act andin January 2015, we do not expect any costs that would be material to us to be requiredcosts due to implementing these likely regulations.United Statesinternational and internationalnational laws and regulations relating to environmental protection. Under such laws and regulations, we are generally prohibited from amongdischarging materials other things, discharging certain materials, such as petrochemicals and plastics,than food waste into the waterways. We have made, and will continue to make, capital and other expenditures to comply with environmental laws and regulations. From time to time, environmental and other regulators consider more stringent regulations, which may affect our operations and increase our compliance costs. We believe that the impact of ships on the global environment will continue to be an area of focus by the relevant authorities throughout the world and, accordingly, may subject us to increasing compliance costs in the future, including the items described below.Organization's ("IMO"Organization’s (‘‘IMO’’) regulations under the International Convention for the Prevention of Pollution from Ships (the "MARPOL Regulations"‘‘MARPOL Regulations’’), which includes requirements designed to prevent and minimize pollution by oil, sewage, garbage and air emissions. We have obtained the relevant international compliance certificates relating to oil, sewage and air pollution prevention for all of our ships. These regulations will also require the worldwide limitations on sulfur content of fuel to be reduced to 0.5% by January 1, 2020, subject to a feasibility review to be completed by IMO no later than 2018. If such a reduced limitation is implemented worldwide in 2020, our fuel costs could increase significantly. In addition to the global limitations, theThe MARPOL Regulations also establish special Emission Control Areas ("ECAs"(‘‘ECAs’’) with stringent limitations on sulfur and nitrogen oxide emissions in these areas. As of July 1, 2010, ships operating in designated ECAs are required to operate on fuel with a sulfur content of 1.0%. Under these regulations, ships operating in ECAs will be required to further reduce their fuel sulfur content to 0.1% beginning on January 1, 2015. As of February 2013,2015, there are threefour established ECAs: the Baltic Sea, the North Sea/English Channel, and certain of the waters surrounding the North American coast. In addition, in July 2011, the IMO acceptedcoast, and adopted the application by the United States to designate the waters surrounding Puerto Rico and the USU.S. Virgin Islands as an ECA. This designation will be effective as ofIslands.2014. As of the date hereof, the1, 2015, ships operating in ECAs have been required to reduce their fuel sulfur content reductions infrom 1.0% to 0.1%. We have been planning for this additional requirement for the existing ECAs has not had a materiallast several years and continue to take steps to mitigate the potential impact on our fuel cost. Both of the ships delivered in 2014 (dohave not expectbeen able to successfully mitigate the initial sulfur content reductions in the Puerto Rico/US Virgin Islands ECA will have a material effect on our fuel and operating costs. However, the additional reduction to 0.1% as of January 1, 2015 will increaseimpact with evolving technical solutions, our fuel costs after this date. Basedcould increase significantly.2013 itinerariesorder, and, projectedaccordingly, reduce our fuel consumption inside these ECAs,costs. We continue to work to improve the efficiency of our existing fleet, including improvements in operations and voyage planning as well as current fuel pricesimprovements to the propulsion, machinery, HVAC and technologies,lighting systems. The overall impact of these efforts has resulted in a 21% improvement in energy efficiency since 2005 and we estimatebelieve that implementation ofour energy consumption per guest is currently the 0.1% low sulfur content requirement in all four currently designated ECAs would increase our 2013 fuel costs by approximately $65.0 million to $70.0 million. These costs may be reduced by possible mitigating factors, such as decreases in fuel prices, changeslowest in the future supply and demand for fuel, the development of emissions abatement technologies, including new engine designs or exhaust gas treatment systems, the acceptance of alternative compliance methods, the cost migration effects of equivalent compliance initiatives and new fuel conservation initiatives.became effective onapply to new vessels commissioned after January 1, 2013. We do not anticipate that complianceCompliance with these regulations willhas not had nor do we expect it to have a material effect on our operating costs.are required to obtain certificates from the United States Coast Guard relating toexpect that compliance with this regulation, if adopted, will not materially impact our ability to satisfy liability in casesresults of water pollution. Pursuant to United States Coast Guard regulations, we arrange through our insurers for the provisionoperations."Convention"“Convention”). which became effective in August 2013. The Convention which will be effective starting in August 2013, reflects a broad range of standards and conditions to governgoverning all aspects of crew management for ships in international commerce, including additional requirements not previously in effect relating to the health, safety, repatriation, entitlements and status of crewmembers and crew recruitment practices. Each of our Flag States will be required to enact legislation prior to August 2013 that includes standards at least as stringent as those set forth inships has received its certification of compliance with the requirements of the Convention. As of the date of this report, this legislation hasWe have not been finalized. Assuming that the Flag Statesincurred and do not impose regulations that materially differ from the Convention requirements, we do no anticipate that our compliance costs will be material. There can be no assurances, however, that the Flag States will not seek to adopt additional requirements that could require usexpect to incur unanticipated material expenses.costs related to implementation and ongoing compliance with the Convention.PursuantAs a condition to obtaining the United States Federal Maritime Commission regulations,required certificates, we arrange through our insurers for the provision of guarantees in the amount of $15.0 millionsurety for eachthree of our two U.S. ship-operating companies, Royal Caribbean Cruises Ltd. and Celebrity Cruises Inc. and a bondcompanies. The required surety amount is currently $22.0 million per operator. However, under amendments approved in the amount of $15.0 million for one of our U.K. ship operating companies, as a condition to obtaining the required certificates. In February 2013, the United States Federal Maritime Commission approved amendments to the performance bond requirements thatrequired amount will increase the required guarantees to $30.0 million per operator ($90.0 million in the aggregate) over a two-year phase-in period. Once phased-in, the guarantee requirementsby April 2015 and will be subject to additional consumer price index based adjustments. The new rules will become effective in the first quarter of 2014.adjustments thereafter. We do not anticipate that compliance with the new rules will have a material effect on our costs.£32.1£31.5 million. The Norwegian Travel Guarantee Fund requires us to maintain performance bonds in varying amounts during the course of the year to cover our financial responsibility in Norway, Finland and the Baltics. These amounts ranged from $4.9NOK 33 million to $18.8NOK 87 million during 2012. We are also required to pay to the United Kingdom Civil Aviation Authority a non-refundable levy of £2.50 per guest where we arrange a flight as part of the cruise vacation.2010,June 2013, the United StatesU.S. Architectural and Transportation Barriers Compliance Board proposed guidelines for the construction and alteration of passenger vessels to ensure that the vessels are readily accessible to and usable by passengers with disabilities. Once finalized, these guidelines will be used by the U.S. Department of Transportation issued regulations (the "New ADA Regulations") addressing various issues applicableand U.S. Department of Justice to implement mandatory and enforceable standards for passenger vessels undercovered by the AmericanAmericans with Disabilities Act (the "ADA"). Part I of the New ADA Regulations, which include required reservation policies for disabled guests and requirements for aids and services to disabled passengers, became effective in January 2011. We believe we are in compliance with Part I of the New ADA Regulations and did not need to make any material expenditures to comply. Part II, when issued, is expected to address physical accessibility standards.Act. While we believe our vessels have been designed and outfitted to meet the needs of our disabled guests with disabilities, we cannot at this time accurately predict whether we will be required to make material modifications or incur significant additional expenses in response to Part IIgiven the preliminary status of the New ADA Regulations. We During 2012, we also operated other businesses primarily consisting of the land-tour operation in Alaska and the Pullmantur land-tour and air business."primarily“primarily and regularly traded on an established securities market"market” in the United States or another qualifying country such as Norway. In the opinion of our United States tax counsel, Drinker Biddle & Reath LLP, based on the representations and assumptions set forth in that opinion, we, Celebrity Cruises Inc. and our ship-owning subsidiaries qualify for the benefits of Section 883 because we and each of those subsidiaries are incorporated in Liberia or Malta, which are qualifying countries, and our common stock is primarily and regularly traded on an established securities market in the United States or Norway.Norway (i.e., we are a "publicly traded" corporation). If, in the future, (1) Liberia or Malta no longer qualifies as an equivalent exemption jurisdiction, and we do not reincorporate in a jurisdiction that does qualify for the exemption, or (2) we fail to qualify as a publicly traded corporation, we and all of our ship-owning or operating subsidiaries that rely on Section 883 for tax exemption on qualifying income would be subject to United States federal income tax on their United States source shipping income and income from activities incidental thereto.underUnder Section 883"branch profits"“branch profits” tax at the rate of 30%. We and Celebrity Cruises Inc. would also be potentially subject to tax on portions of certainstate'sstate’s portion of the United States source income subject to federal income taxes. Additionally, the state of Alaska subjects an allocated portion of the total income of companies doing business in Alaska and certain other affiliated companies to Alaska corporate state income taxes and also imposes a 33% tax on adjusted gross income from onboard gambling activities conducted in Alaska waters. This did not have a material impact to our results of operations for all years presented.France'sFrance’s ship, qualify as licensed shipping organizations in Malta. No Maltese income tax is charged on the income derived from shipping activities of a licensed shipping organization. Instead, a licensed shipping organization is liable to pay a tonnage tax based on the net tonnage of the ship or ships registered under the relevant provisions of the Merchant Shipping Act. A company qualifies as a shipping organization if it engages in qualifying activities and it obtains a license from the Registrar-General to enable it to carry on such activities. Qualifying activities include, but are not limited to, the ownership, operation (under charter or otherwise), administration and management of a ship or ships registered as a Maltese ship in terms of the Merchant Shipping Act and the carrying on of all ancillary financial, security and commercial activities in connection therewith.functions, land-based tour operations and air business in Spain.functions. These activities are subject to Spanish taxation. The tax from these operations is not considered significant to our operations.thirteenfourteen ships under companies which have elected to be subject to the United Kingdom tonnage tax regime ("(“U.K. tonnage tax"tax”).affiliate'saffiliate’s earnings are subject to Brazilian taxation which is not considered significant. The charter payments made to the U.K. tonnage tax company and to Pullmantur are exempt from Brazilian income tax under current Brazilian domestic law.incomevalue-added and other indirect taxes most of which are reclaimable, zero-rated or exempt. Changes in the application or interpretation of applicable indirect tax laws or changes in other jurisdictionstax legislation could have a material impact on income that does not qualify for exemption or tonnage tax regimes. The tax on such income was not material to our results of operations for all years presented. Our U.K. tonnage tax company is exempt from some taxation in certain jurisdictions where those companies have business operations under relevant United Kingdom tax treaties. CDF Croisières de France's operations within France are minimal and therefore, its French income taxes are minimal.25, 2013,23, 2015, our executive officers are:Name Age Position 6567 Chairman, Chief Executive Officer and Director 55 President and Chief Operating Officer Michael W. Bayley 5356 President and Chief Executive Officer, Royal Caribbean International Michael W. Bayley5457 President and Chief Executive Officer, Celebrity Cruises Gonzalo Chico Barbier52President and Chief Executive Officer, Pullmantur6163 President and Chief Executive Officer, Azamara Club Cruises Brian J. Rice41 President and Chief Executive Officer, Pullmantur Jason T. Liberty 5439 Vice Chairman and Chief Financial Officer6062 Executive Vice President, Maritime Lisa Bauer-Rudzki59 Senior Vice President, General Counsel, Chief Compliance Officer Henry L. Pujol 4947 ExecutiveSenior Vice President, Global Sales & Marketing, Royal Caribbean InternationalLisa Lutoff-Perlo55Executive Vice President, Operations, Royal Caribbean InternationalChief Accounting Officerover 35approximately 40 years.aan Assistant Purser onboard one of the company'sCompany’s ships. He has served in a number of roles including most recently, as Executive Vice President, Operations from February 2012 until August 2012. Other positions Mr. Bayley has held include Executive Vice President, International from May 2010 until February 2012; Senior Vice President, International from December 2007 to May 2010; Senior Vice President, Hotel Operations for Royal Caribbean International; and Chairman and Managing Director of Island Cruises. Gonzalo Chico BarbierPullmanturCelebrity Cruises since June 2008. From 1995December 2014. Prior to June 2008, Mr. Chicothis, she served as Executive Vice President, of TNT Spain, a division of TNT, a global distribution, logistics and international mail service company. From 1986 until 1995, Mr. Chico wasOperations for Royal Caribbean International since September 2012. Ms. Lutoff-Perlo has been employed with the Company since 1985 in a variety of positions with Ford Motor Company in Spainwithin both Celebrity Cruises and in the United Kingdom, including Pan-European Fleet BusinessRoyal Caribbean International. She started at Royal Caribbean International as District Sales Manager for New England and from August 2008 to August 2012, she was responsible for Celebrity Cruises’ entire hotel operation. In her role as Executive Vice President of FordOperations, Ms. Lutoff-Perlo was responsible for all of Europe, Ltd.'s’s Seabourn Cruise Line and from May 1998 to February 2001, he was President and Chief Executive Officer of Carnival Corp.'s’s Cunard Line. Brian J. RiceVice ChairmanPresident and Chief Executive Officer of Pullmantur since July 2014. Mr. Vilches has spent the past 10 years in the travel industry, holding various positions with LATAM Airlines Group S.A., one of the largest airline groups in the world whose shares are traded in Santiago. Most recently, from 2012 to May 2014, he served as Chief Executive Officer of LATAM's long haul business unit, the group's biggest division in terms of capacity and revenue, and, prior to that, as CEO of LAN Peru from 2007 to 2012.September 2012.May 2013. Mr. RiceLiberty previously served as ExecutiveSenior Vice President, Strategy and Chief Financial OfficerFinance from November 2006September 2012 through September 2012.May 2013, overseeing the Company’s Corporate and Strategic Planning, Treasury, Investor Relations and Deployment functions. Prior to this, Mr. Rice has been employed withLiberty served, from 2010 through 2012, as Vice President of Corporate and Revenue Planning and, from 2008 to 2010, as Vice President of Corporate and Strategic Planning. Before joining Royal Caribbean, since 1989 inMr. Liberty was aTable Senior Manager at the international public accounting firm of Contentsvariety of positions including Executive Vice President, Revenue Performance. In such capacity, Mr. Rice was responsible for revenue management, air/sea, groups, international operations, decision support, reservations and customer service for both Royal Caribbean International and Celebrity Cruises. Lisa Bauer-RudzkiExecutive Vice PresidentGeneral Counsel of Global Sales & Marketing for Royal Caribbean Internationalthe Company since September 2012. Since joining the company in 2002, Mrs. Bauer-Rudzki2006. He has held various key roles within Royal Caribbean International, including, servingalso served as Senior Vice President Global Sales & Marketing fromand Chief Compliance Officer of the Company since February 2012 to September 20122009 and servingFebruary 2011, respectively. Mr. Stein has been with Royal Caribbean since 1992. Before joining Royal Caribbean, Mr. Stein worked in private practice in New York and Miami.Hotel Operations from November 2007 to February 2012. As Executive Vice PresidentChief Accounting Officer of Global Sales & Marketing, Ms. Bauer-Rudzki is responsible for Royal Caribbean International's worldwide marketing and revenue management as well as for the corporation's international sales and marketing offices. Lisa Lutoff-Perlo has served as Executive Vice President, Operations for Royal Caribbean International since September 2012 after serving as Senior Vice President, Operations for Royal Caribbean International from August 2012 to September 2012. Mrs. Lutoff-Perlo has been employed with the Company since 1985 in a variety of positions within both Celebrity Cruises andMay 2013. Mr. Pujol originally joined Royal Caribbean International. She started atin 2004 as Assistant Controller and was promoted to Corporate Controller in May 2007. Before joining Royal Caribbean, International as District SalesMr. Pujol was a Senior Manager for New England and more recently, from August 2008 to August 2012, she was responsible for Celebrity Cruises' entire hotel operation. In her role as Executive Vice Presidentat the international public accounting firm of Operations, Ms. Lutoff-Perlo is responsible for all of Royal Caribbean International's hotel, marine and port operations.Management'sManagement’s Discussion and Analysis of Financial Condition and Results of Operations for a cautionary note regarding forward-looking statements.The slow pace of the economic recovery coupledIn recent years, we have been faced with continued instability in thevery challenging global economic landscape has had and continues toconditions, which have an adverse effect on vacationers'adversely affected vacationers’ discretionary income and consumer confidence. This, in turn, has resulted in cruise booking slowdowns, decreased cruise prices and lower onboard revenues for us and for others in the cruise industry as compared to more robust economic times. Although the cruise industry continued to recover in 2012, recovery has been slow and has been hindered by2014, ongoing economic instability,challenges continue in certain key markets, including the continuing European sovereign debt crisis and financial market volatility.Europe. In addition, certain countries have been more severely impacted by recent economic conditions than other economies including, for example, Spain where we operate our Pullmantur brand. We cannot predict with any certainty whether demand for cruises will continue to improve in countries that have experienced improved economic conditions or the ratestrength of such improvement. StagnantAny significant deterioration of global, national or worsening globallocal economic conditions could result in a prolonged period of booking slowdowns, depressed cruise prices and reduced onboard revenues.During 2012, we recognized total impairment related charges of $413.9 million associated with our Pullmantur brand. See "Item 7. Management's Discussion and Analysis of Financial Condition and Results of OperationsCritical Accounting Policies ." Despite the Pullmantur related impairment charges, if the Spanish economy weakens further or recoversfor more slowly than contemplated or if the economies of other markets (e.g. France, Brazil, Latin America) perform worse than contemplated in our discounted cash flow model, or if there are material changes to the projected future cash flows used in the impairment analyses, especially in Net Yields, an additional impairment charge of the Pullmantur reporting unit's goodwill and trademarks and trade names may be required.information.TheWe also condition the effectiveness of our ship orders on obtaining committed financing arrangements. Any circumstance or event which leads to a decrease in consumer cruise spending, such as a result ofworsening global economic conditions or significant incidents impacting the Costa Concordia incident and the economic uncertainty in Europe had an adverse impact oncruise industry, could negatively affect our operating cash flows from operations in 2012.flows. See "—“-Adverse worldwide economic, geopolitical or other conditions....conditions…"” and "—“-Incidents or adverse publicity concerning the cruise vacation industry...."industry…” for more information. Ifworldwide economic conditions worsen or there is another significant incident impacting the cruise industry, our operational cash flows could be negatively affected. During 2013, we anticipate raising additional funds in the capital or credit markets as part of our refinancing strategy for our upcoming 2013 and 2014 maturities. Our ability to access additional funding as and when needed, our ability to timely refinance and/or replace our outstanding debt securities and credit facilities on acceptable terms and our cost of funding will depend upon numerous factors including but not limited to the vibrancy of the financial markets, our financial performance and credit ratings and the performance of our industry in general. See"Item 7. Management's Discussion & Analysis of Financial Condition and Results of Operations—Funding Needs and Sources" for more information.covenants that require us to maintain minimum net worth and fixed charge coverage ratios and limit our net debt-to-capital ratio. Our ability to comply with the terms of our outstanding facilities may be affected by general economic conditions, industry conditions and other events, some of which may be beyond our control.covenants. In addition, our ability to make borrowings under our available credit facilities is subject to the absence of material adverse changes in our business. Our ability to maintain our credit facilities may also be impacted by changes in our ownership base. More specifically, we may be required to prepay a majority of our debt facilities if"Applicable Group"“Applicable Group”) acquires ownership of more than 33% of our common stock and the Applicable Group owns less of our common stock than such person or (ii) subject to certain exceptions, during any 24-month period, a majority of the Board is no longer comprised of individuals who were members of the Board on the first day of such period. Certain of our outstanding debt securities also contain change of control provisions that would be triggered by the acquisition of greater than 50% of our common stock by a person other than a member of the Applicable Group coupled with a ratings downgrade. In addition, under several of our agreements with credit card processors that accept credit cards for the sale of cruises and other services, the credit card processor may hold back a reserve from our credit card receivables following the occurrence of certain events, including a default under our major credit facilities. As of December 31, 2012, we were not required to maintain any reserve under such agreements. guest safety, health, security and vacation satisfaction which could negatively impact our reputation. Incidents involving cruise ships, and, in particular the safety and security of guests and crew, such as the Costa Concordia incident, media coverage thereof, as well as adverse media publicity concerningor unusual weather patterns or natural disasters or disruptions, such as hurricaneshave impacted and earthquakes, andcould in the collateral impact thereof couldfuture impact demand for our cruises.cruises and pricing in the industry. The considerable expansion in the use of social media and digital marketing over recent years has compounded the potential scope of the negative publicity that could be generated by those incidents. If any such incident occurs during a time of high seasonal demand, the effect could disproportionately impact our results of operations for the year. In addition, incidents involving cruise ships may result in additional costs to our business, increasing government or other regulatory oversight and, in the case of incidents involving our ships, potential litigation.markets and additional economic concerns from some of the countries in the European Union continue to strain the financial markets both in the US and internationally.markets. A recurrence of these or similar disruptions could cause our counterparties and others to breach their obligations to us under our contracts with them. This could include failures of banks or other financial service companies to fund required borrowings under our loan agreements or to pay us amounts that may become due under our derivative contracts for hedging of fuel prices, interest rates and foreign currencies or other agreements. If any of the foregoing occurs it may have a negative impact on our cash flows, including our ability to meet our obligations, our results of operations and our financial condition.1933 new ships65,00098,650 berths are on order for delivery through 20172019 in the cruise industry. The further growth in capacity from these new ships and future orders, without an increase in the cruise industry'sindustry’s share of the vacation market, could depress cruise prices and impede our ability to achieve yield improvement.strategystrategies with our goal of satisfying guest expectations, it may adversely impact our business success.containment efforts.Lines,Line, Costa Cruises, Cunard Line, Holland America Line, Iberocruceros, P&O Cruises and Princess Cruises; Disney Cruise Line; MSC Cruises; Norwegian Cruise Line Holdings Ltd which owns Norwegian Cruise Line, Oceania Cruises and OceaniaRegent Seven Seas Cruises.AsIn view of our global operations, we continue to globalize our operations, wehave become susceptible to a wider range of adverse events.earn revenues, pay expenses, recognize assets and incur liabilities in currencies other than the U.S. dollar, including, among others, the British pound sterling, the Canadian dollar, the euro, the Australian dollar and the Brazilian real. In 2012, we derived approximately 49% of revenues from operations outside the United States. Because our consolidated financial statements are presented in U.S. dollars, we must convert revenues, income and expenses, as well as assets and liabilities, into U.S. dollars at exchange rates in effect during or at the end of each reporting period. Therefore, absent offsettingexposed to market risk attributable to changes in other foreign currencies, increases or decreases in the value of the U.S. dollar against other major currencies will affect our revenues, operating income and the value of balance sheet items denominated in foreign currencies. We use derivative financial instruments to mitigate our net balance sheet exposure to currency exchange rate fluctuations. However, there can be no assurances that fluctuations in foreign currency exchange rates, particularly the strengtheningfuel prices and changes in interest rates. High levels of volatility with respect to any of the U.S. dollar against major currencies, would not materially affectforegoing could have a material impact on our financial results. In addition, we have ship construction contracts which are denominated in euros. While we have entered into euro-denominated forward contracts and collar options to manage a portionresults, net of the currency risk associated with these ship construction contracts, we are exposed to fluctuations in the euro exchange rateimpact of our hedging activities and other natural offsets. See “Item 7A. the portion of the ship construction contracts that has not been hedged. Additionally, if the shipyard is unable to perform under the related ship construction contract, any foreign currency hedges that were entered into to manage the currency risk would need to be terminated. Termination of these contracts could result in a significant loss."ItemItem 1. Business—Regulation—Environmental Regulations."Business-Regulation-Environmental Regulations. An increase in fuel prices not only impacts our fuel costs, but also some of our other expenses, such as crew travel, freight and commodity prices.world, especially in light of the Costa Concordia incident.world. This could result in the enactment of more stringent regulation of cruise ships that could subject us to increasing compliance costs in the future.globally and plan to continue to develop our international presence.globally. Operating internationally exposes us to a number of risks, including unstableincreased exposure to a wider range of regional and local economic conditions, volatile local political conditions, potential changes in duties and taxes, including changing and/or uncertain interpretations of existing tax laws and regulations, required compliance with additional laws and policies affecting cruising, vacation or maritime businesses or governing the operations of foreign-based companies, currency fluctuations, interest rate movements, difficulties in operating under local business environments, port quality and availability in certain regions, U.S. and global anti-bribery laws or regulations, imposition of trade barriers and restrictions on repatriation of earnings. In addition, if a country where weWe have significant operations or obligations leavesrecently expanded our presence in China and, accordingly, our exposure to the euro currencyrisks of doing business in the country. China’s economy differs from the economies of other developed countries in many respects and, as the legal system our financial conditionin China continues to evolve, there may be adversely impacted. If we are unablegreater uncertainty as to address these risks adequately, our financial positionthe interpretation and resultsenforcement of operations could be adversely affected, including potentially impairing the value of our ships, goodwillapplicable laws and other assets.regulatorytax requirements. In many parts of the world, including countries in which we operate, practices in the local business communities might not conform to international business standards. We must adhere to policies designed to promote legal and regulatory compliance as well as applicable laws and regulations. However, we might not be successful in ensuring that our employees, agents, representatives and other third parties with which we associate throughout the world properly adhere to them. Failure by us, our employees or any of these third parties to adhere to our policies or applicable laws or regulations could result in penalties, sanctions, damage to our reputation and related costs which in turn could negatively affect our results of operations and cash flow.Brazilian, Asian, Latin American, and Australian markets. Expansion into new markets requires significant levels of investment. There can be no assurance that these markets will develop as anticipated or that we will have success in these markets, and if we do not, we may be unable to recover our investment, which could adversely impact our business, financial condition and results of operations.revitalizationupgrade delays or mechanical faults may result in cancellation of cruises or unscheduled drydocks and repairs and thus adversely affect our results of operations.revitalizeupgrade our cruise ships on a timely basis and in good working order. The sophisticated nature of building a ship involves risks. Delays or mechanical faults in ship construction or revitalizationupgrades or mechanical faults have in the past and may in the future result in delays or cancellation of cruises or necessitate unscheduledrevitalizeupgrade our vessels.ships. Financial difficulties, liquidations or closures suffered by these shipyards and/or their subcontractors may impact the timely delivery or costs of new ships or the ability of shipyards to repair and revitalizeupgrade our fleet in accordance with our needs or expectations. The shipyard that is building the two newbuilds for our TUI Cruises joint venture is currently experiencing financial difficulties. We have engaged in discussions with the shipyard to assess the impact on the ships they are building for TUI Cruises. This situation could have a material impact on the ability of the shipyard to deliver these ships in accordance with the terms of the contract, the costs borne by TUI Cruises associated with these ships and/or the financial support that we may need to provide (e.g. parent guarantees, additional equity contributions) to seek to ensure timely completion.vesselsships and, accordingly, closures or consolidation in the cruise shipyard industry could impact our ability to construct new vesselsships when and as planned and/or could result in stronger bargaining power on the part of the shipyards and thus higher prices for our future ship orders. Delivery delays and cancelledcanceled deliveries can adversely affect our results of operations, as can any constraints on our ability to build, repair and maintain our ships on a timely basis. especially fuel expenditures, could increase due to market forces and economic or geopoliticalgeo- political factors beyond our control. Expenditures for fuel represent a significant cost of operating our business. If fuel prices rise significantly in a short period of time, we may be unable to increase fares or other fees sufficiently to offset fully our increased fuel costs. We routinely hedge a portion of our future fuel requirements to protect against rising fuel costs. However, there can be no assurance that our hedge contracts will provide a sufficient level of protection against increased fuel costs or that our counterparties will be able to perform under our hedge contracts, such as in the case of a counterparty's bankruptcy. Further volatility in fuel prices or disruptions in fuel supplies could have a material adverse effect on our results of operations, financial condition and liquidity. other operating costs, including fuel, food, payroll, airfare, taxes, insurance and security costs are all subject to increases due to market forces and economic or political conditions or other factors beyond our control. Increases in these operating costs could adversely affect our profitability.guests'guests’ ability to obtain airfare as well as our ability to fly our guests to or from our cruise ships which could adversely affect our results of operations.call centers for reservationsshoreside offices throughout the world. Although we have developed disaster recovery and similar contingency plans, actualActual or threatened natural disasters (e.g., hurricanes, earthquakes, tornados,tornadoes, fires, floods) or similar events in these locations may have a material impact on our business continuity, reputation and results of operations. In addition, substantial or repeated information systems failures, computer viruses or cyber-attacks impacting our shoreside or shipboard operations could adversely impact our business. We do not generally carry business interruption insurance for the majority of our shoreside operations or our information systems. As such, any losses or damages incurred by us could have an adverse impact on our results of operations.employees.personnel in key markets. We must continue to sufficiently recruit, retain, train and motivate management and otherour employees sufficient to maintain our current business and support our projected global growth. Furthermore, as of December 31, 2012, 80%2014, 86% of our shipboard employees were covered by collective bargaining agreements. A dispute under our collective bargaining agreements could result in a work stoppage of those employees covered by the agreements. A loss of key employees or disruptions among our personnel could adversely affect our results of operations.customers'customers’ demands and expectations. If we are unable to do so in a timely manner or within reasonable cost parameters or if we are unable to appropriately and timely train our employees to operate any of these new systems, our business could suffer. We also may not achieve the benefits that we anticipate from any new technology or system, and a failure to do so could result in higher than anticipated costs or could impair our operating results. The provisionstime by legislation.time. Moreover, changes could occur in the future with respect to the identity, residence or holdings of our direct or indirect shareholders, trading volume or trading frequency of our shares, or relevant foreign tax laws of Liberia or Malta such that they no longer qualify as equivalent exemption jurisdictions, that could affect our eligibility for the Section 883 exemption. Accordingly, there can be no assurance that we will continue to be exempt from United States income tax on United States source shipping income in the future. If we were not entitled to the benefit of Section 883, we and our subsidiaries would be subject to United States taxation on a portion of the income derived from or incidental to the international operation of our ships, which would reduce our net income.resulting in lower net income.BylawsBy-Laws and Liberian law could inhibit others from acquiring us, prevent a change of control, and may prevent efforts by our shareholders to change our management.BylawsBy-Laws and Liberian law may inhibit third parties from effectuating a change of control of the Company without Board approval which could result in the entrenchment of current management. These include provisions in our Articles of Incorporation that prevent third parties, other than A. Wilhelmsen AS. and Cruise Associates, from acquiring beneficial ownership of more than 4.9% of our outstanding shares without the consent of our Board of Directors.Strategies—Strategies - Fleet revitalization,upgrade, maintenance and expansionsection and theOperations—Operations - Cruise Ships and Itineraries andItinerariessection inItem 1. Business. Information regarding our cruise ships under construction, estimated expenditures and financing may be found within theFuture Capital CommitmentsandFunding Needs and Sources sections of Item 7.Management's Management’s Discussion and Analysis of Financial Condition and Results of Operations.twoone office buildingsbuilding in the United Kingdom totaling approximately 57,00024,000 square feet used to conduct our operations in the United Kingdom. We also lease a number of international offices throughout Europe, Asia, Mexico, South America and Australia to administer our brand operations globally.twoone office buildingsbuilding totaling approximately 95,000 square feet in Wichita, Kansas, which areis used as a call centerscenter for reservations and customer service. We lease two buildings in Miramar, Florida totaling approximately 178,000179,000 square feet. One building is used primarily as office space and the other building is used as a call center for reservations. We also lease our logistics center in Weston, Florida totaling approximately 267,000 square feet. Between August 1, 2011 and September 8, 2011, three similar purported class action lawsuits were filed against us and certain of our current and former officers in the U.S. District Court of the Southern District of Florida. The cases have since been consolidated and a consolidated amended complaint was filed on February 17, 2012. The consolidated amended complaint was filed on behalf of a purported class of purchasers of our common stock during the period from October 26, 2010 through July 27, 2011 and names the Company, our Chairman and CEO, our CFO, the President and CEO of our Royal Caribbean International brand and the former President and CEO of our Celebrity Cruises brand as defendants. The consolidated amended complaint alleges violations of Section 10(b) of the Securities Exchange Act of 1934 and SEC Rule 10b-5 as well as, in the case of the individual defendants, the control person provisions of the Securities Exchange Act. The complaint principally alleges that the defendants knowingly made incorrect statements concerning the Company's outlook for 2011 by not taking into proper account lagging European and Mediterranean bookings. The consolidated amended complaint seeks unspecified damages, interest, and attorneys' fees. We filed a motion to dismiss the complaint on April 9, 2012. Briefing on that motion was completed on August 2, 2012. The motion is currently pending. We believe the claims made against us are without merit and we intend to vigorously defend ourselves against them.classclass action complaint was filed in June 2011 against Royal Caribbean Cruises Ltd. in the United States District Court for the Southern District of Florida on behalf of a purported class of stateroom attendants employed onboard Royal Caribbean International cruise vessels allegingvessels. The complaint alleged that theythe stateroom attendants were required to pay other crew members to help with their duties in violation of the U.S. Seaman's Wage Act. The lawsuit also allegesand that certain stateroom attendants were required to work back of house assignments without the ability to earn gratuities, in each case, in violation of the U.S. Seaman'sSeaman’s Wage Act. Plaintiffs seek judgment for damages, wage penalties and interest in an indeterminate amount. In May 2012, the Courtdistrict court granted our motion to dismiss the complaint on the basis that the applicable collective bargaining agreement requires any such claims to be arbitrated. Plaintiff's appeal of this decision was dismissed for lack of jurisdiction by theThe United States Court of Appeals, 11th Circuit. PlaintiffsCircuit, affirmed the district court’s dismissal and denied the plaintiffs’ petition for re-hearing and re-hearing en banc. In October 2014, the United States Supreme Court denied the plaintiffs’ request to review the order compelling arbitration. Subsequently, approximately 575 crew members submitted demands for arbitration. The demands make substantially the same allegations as in the federal court complaint and are similarly seeking damages, wage penalties and interest in an indeterminate amount. Unlike the federal court complaint, the demands for arbitration are being brought individually by each of the crew members and not on behalf of a purported class of stateroom attendants. At this time, we are unable to renew their appeal. Weestimate the possible impact of this matter on us. However, we believe the appeal is without merit as are the underlying claims made against us are without merit, and we intend to vigorously defend ourselves against them. Because of the inherent uncertainty as to the outcome of the proceedings described above, we are unable at this time to estimate the possible impact of these matters on us. None.High Low High Low 2014 Fourth Quarter $83.90 $52.32 638.00 347.00 Third Quarter $69.31 $53.66 439.60 332.00 Second Quarter $57.38 $49.65 349.00 300.00 First Quarter $54.93 $45.95 332.60 284.20 2013 Fourth Quarter $47.66 $35.97 292.60 216.10 Third Quarter $40.71 $33.31 241.80 201.40 Second Quarter $38.62 $31.35 224.90 178.00 First Quarter $38.56 $31.72 213.50 184.10 (1) Denominated in Norwegian kroner, as listed in the price history database available at www.oslobors.no NYSE
Common Stock OSE
Common Stock(1) High Low High Low $ 36.18 $ 30.26 202.50 169.70 31.97 22.45 182.90 134.50 29.45 22.12 167.60 134.60 31.96 25.40 183.70 149.30 $ 30.99 $ 18.70 168.00 111.60 39.43 21.50 214.30 121.10 42.30 32.68 232.60 180.00 49.99 40.26 293.10 226.30
Holders(1)Denominated in Norwegian kroner, as listed in the price history database available at www.oslobors.no.Holders13, 201312, 2015 there were 1,128961 record holders of our common stock. Since certain of our shares are held by brokers and other institutions on behalf of shareholders, the foregoing number is not representative of the number of beneficial owners.July 2011, our Board of Directors reinstated our quarterly dividend, which had been discontinued in the fourth quarter of 2008. We subsequently2013, we declared cash dividends on our common stock of $0.10$0.12 per share during the third and fourth quarters of 2011 and the first and second quarters of 2012.2013. We increased the dividend amount to $0.12$0.25 per share for the dividends declared in the third and fourth quarters of 2012.Liberia (2000)2000 as Amended and the regulations thereunder, and (2) our ship-owning subsidiaries are not now engaged, and are not in the future expected to engage, in any business in Liberia, including voyages exclusively within the territorial waters of the Republic of Liberia. Under current Liberian law, no Liberian taxes or withholding will be imposed on payments to holders of our securities other than to a holder that is a resident Liberian entity or a resident individual or an individual or entity subject to taxation in Liberia as a result of having a permanent establishment within the meaning of the Liberia Revenue Code of Liberia (2000)2000 as Amended in Liberia.Period Total number of shares purchased Average price paid per share Total number of shares purchased as part of publicly announced plans or programs Maximum number of shares that may yet be purchased under the plans or programs 3,500,000 $67.45 — — Total this quarter 3,500,000 $67.45 — — 20072009 to December 31, 2012.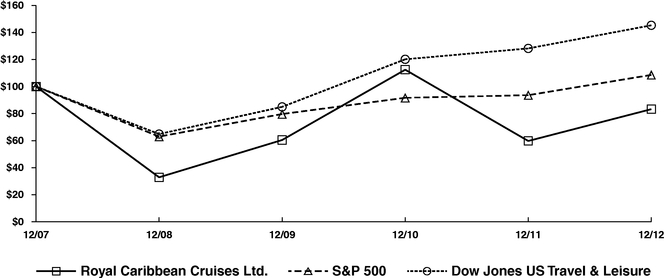

12/07 12/08 12/09 12/10 12/11 12/12 12/09 12/10 12/11 12/12 12/13 12/14 100.00 32.89 60.47 112.43 59.75 83.26 100.00 185.92 98.79 137.68 195.65 346.17 100.00 63.00 79.67 91.67 93.61 108.59 100.00 115.06 117.49 136.30 180.44 205.14 100.00 64.87 84.97 120.13 128.17 145.26 100.00 141.39 150.84 170.95 248.70 289.40 20072009 and that all dividends were reinvested. Past performance is not necessarily an indicator of future results.20082010 through 20122014 and as of the end of each such year are derived from our audited consolidated financial statements and should be read in conjunction with those financial statements and the related notes as well as in conjunction with Item 7.Management's Discussion and Analysis of Financial Condition and Results of Operations. Year Ended December 31, 2014 2013 2012 2011 2010 (in thousands, except per share data) Operating Data: Total revenues $ 8,073,855 $ 7,959,894 $ 7,688,024 $ 7,537,263 $ 6,752,504 $ 941,859 $ 798,148 $ 403,110 $ 931,628 $ 802,633 $ 764,146 $ 473,692 $ 18,287 $ 607,421 $ 515,653 Per Share Data—Basic: Net income $ 3.45 $ 2.16 $ 0.08 $ 2.80 $ 2.40 Weighted-average shares 221,658 219,638 217,930 216,983 215,026 Per Share Data—Diluted: Net income $ 3.43 $ 2.14 $ 0.08 $ 2.77 $ 2.37 Weighted-average shares and potentially dilutive shares 223,044 220,941 219,457 219,229 217,711 Dividends declared per common share $ 1.10 $ 0.74 $ 0.44 $ 0.20 $ — Balance Sheet Data: Total assets $ 20,713,190 $ 20,072,947 $ 19,827,930 $ 19,804,405 $ 19,653,829 Total debt, including capital leases $ 8,443,948 $ 8,074,804 $ 8,489,947 $ 8,495,853 $ 9,150,116 Common stock $ 2,331 $ 2,308 $ 2,291 $ 2,276 $ 2,262 Total shareholders' equity $ 8,284,359 $ 8,808,265 $ 8,308,749 $ 8,407,823 $ 7,900,752 (1) (2) (3) Year Ended December 31, 2012 2011 2010 2009 2008 (in thousands, except per share data) $ 7,688,024 $ 7,537,263 $ 6,752,504 $ 5,889,826 $ 6,532,525 403,110 931,628 802,633 488,511 831,984 18,287 607,421 515,653 152,485 573,722 $ 0.08 $ 2.80 $ 2.40 $ 0.71 $ 2.69 217,930 216,983 215,026 213,809 213,477 $ 0.08 $ 2.77 $ 2.37 $ 0.71 $ 2.68 219,457 219,229 217,711 215,295 214,195 $ 0.44 $ 0.20 $ 0.00 $ 0.00 $ 0.45 $ 19,827,930 $ 19,804,405 $ 19,653,829 $ 18,224,425 $ 16,463,310 8,489,947 8,495,853 9,150,116 8,419,770 7,011,403 2,291 2,276 2,262 2,243 2,239 8,308,749 8,407,823 7,900,752 7,489,781 6,803,012 (1)Amounts for 2012 include an impairment charge of $385.4 million to write down Pullmantur's goodwill to its implied fair value and to write down trademarks and trade names and certain long-lived assets, consisting of three aircraft owned and operated by Pullmantur Air, to their fair value. (SeeValuation of Goodwill, Indefinite-Lived Intangible Assets and Long-Lived Assets under Item 7.Management's Discussion and Analysis of Financial Condition and Results of Operations for more information regarding the impairment of these assets).(2)Amounts for 2012 include a $33.7 million charge to record a 100% valuation allowance related to our deferred tax assets for Pullmantur. In addition, we reduced the deferred tax liability related to Pullmantur's trademarks and trade names by $5.2 million. These adjustments resulted in an increase of $28.5 million toother (expense) income. (SeeValuation of Goodwill, Indefinite-Lived Intangible Assets and Long-Lived Assets under Item 7.Management's Discussion and Analysis of Financial Condition and Results of Operations for more information regarding these transactions).20132015, our earnings and yield estimates for 2015 set forth under the heading "Outlook" below)below and expectations regarding the timing and results of our Double-Double Program), business and industry prospects or future results of operations or financial position, made in this Annual Report on Form 10-K are forward-looking. Words such as "anticipate," "believe," "could," "estimate," "expect," "goal," "intend," "may," "plan," "project," "seek," "should," "will," and similar expressions are intended to further identify any of these forward-looking statements. Forward-looking statements reflect management's current expectations but they are based on judgments and are inherently uncertain. Furthermore, they are subject to risks, uncertainties and other factors, that could cause our actual results, performance or achievements to differ materially from the future results, performance or achievements expressed or implied in those forward-looking statements. Examples of these risks, uncertainties and other factors include, but are not limited to, the following:•the impact of the worldwide economic and geopolitical environment or other conditionsthose discussed in this Annual Report on the demand for cruises;•the impact of the worldwide economic environment on our ability to generate cash flows from operations, satisfy the financial covenants required by our credit facilities, or obtain new borrowings from the credit or capital markets;•the impact of disruptions in the global financial markets on the ability of our counterparties and others to perform their obligations to us including those associated with our loan agreements and derivative contracts;•negative incidents concerning the Company and the cruise vacation industry, or adverse publicity, including those involving the health, safety and security of guests, accidents, unusual weather conditions or natural disasters or disruptions;•our ability to appropriately balance our cost management strategy with our goal of satisfying guest expectations;•failure to keep pace with developments in technology which could impair our operations or competitive position;•the uncertainties of conducting business globally and our ability to realize the intended benefits of our investments in new markets;•changes in operating and financing costs, including changes in foreign exchange rates, interest rates, fuel, food, payroll, airfare, insurance and security costs;•vacation industry competition and industry overcapacity in certain markets;•the cost of or changes in tax, environmental, labor, health, safety, security and other laws and regulations affecting our business;•pending or threatened litigation, enforcement actions, fines or penalties;•emergency ship repairs, including the related lost revenue;•the impact of ship construction, repair or refurbishment delays, ship cancellations or ship construction price increases brought about by construction faults, mechanical problems or financial difficulties encountered by shipyards or their subcontractors;•the global political climate, fears of terrorist and pirate attacks, armed conflict, the unavailability or cost of air service and the resulting concerns over safety and security aspects of traveling;•the spread of contagious diseases;•disruptions to our shoreside business related to actual or threatened natural disasters, information systems failure or similar events;•our ability to differentiate our products;•our ability to manage our business activities that involve our co-investment with third parties;•our inability to adequately incentivize our travel agents or changes and/or disruptions to the travel agency industry;•the loss of key personnel, strained employee relations and/or our inability to retain or recruit qualified personnel;•changes in our principal shareholders;•uncertainties of a foreign legal system as we are not incorporated in the United States;•the unavailability of ports of call; and•weather. The above examples are not exhaustiveForm 10-K and, in addition, newparticular, the risks emerge from time to time. discussed under the caption "Risk Factors" in Part I, Item 1A of this report. You should consider the areas of risk described above, as well as those set forth under the heading "Risk Factors" in Part I, Item 1A. in this Annual Report on Form 10-K, when considering any forward-looking statements that may be made by us and our business generally.hashave been organized to present the following:• review of our financial presentation, including discussion of certain operational and financial metrics we utilize to assist us in managing our business;•20122014 compared to the same period in 20112013 and the year ended December 31, 20112013 compared to the same period in 2010;•2013;2015; and•) Certain of our accounting policies are deemed "critical," as they require management's highest degree of judgment, estimates and assumptions. We have discussed these accounting policies and estimates with the audit committee of our board of directors. We believe our most critical accounting policies are as follows:30 year30-year useful life of our newly constructed ships and 15% associated residual value are both based on the weighted-average of all major componentsexpenses. stabilizers, thruster equipment and ballast tanks, port services such as tugs, pilotage and line handling, and freight associated with these items. We perform a detailed analysis of the various activities performed for each drydock and only defer those costs that are directly related to planned major maintenance activities necessary to maintain Class. The costs deferred are related to activities not otherwise routinely periodically performed to maintain a vessel's designed and intended operating capability. Repairs and maintenance activities are charged to expense as incurred. (See Note 2.Summary of Significant Accounting Policies to our consolidated financial statements under Item 8.Financial Statements and Supplementary Data).20122014 would have increased by approximately $40.4$24.3 million. If our ships were estimated to have no residual value, depreciation expense for 20122014 would have increased by approximately $166.7$159.1 million.20132015 projected operating results as a base. To that base, we add future years' cash flows assuming multiple revenue and expense scenarios that reflect the impact of different global economic environments beyond 20132015 on the reporting unit. We discount the projected cash flows using rates specific to the reporting unit based on its weighted-average cost of capital. If the fair value of the reporting unit exceeds its carrying value, no further analysis or write-down of goodwill is required. If the fair value of the reporting unit is less than the carrying value of its net assets, the implied fair value of the reporting unit is allocated to all its underlying assets and liabilities, including both recognized and unrecognized tangible and intangible assets, based on their fair value. If necessary, goodwill is then written down to its implied fair value. The factors influencing expected future cash flows for purposes of goodwill impairment testing discussed above also affect the assessment of recoverability of Pullmantur's deferred tax assets. Pullmantur's deferred tax assets principally result from net operating loss carryforwards. We regularly review deferred tax assets for recoverability based on our history of earnings, expectations of future earnings, and tax planning strategies. Realization of deferred tax assets ultimately depends on the existence of sufficient taxable income to support the amount of deferred tax assets. A valuation allowance is recorded in those circumstances in which we conclude it is not more-likely-than-not we will recover the deferred tax assets prior to their expiration.(See Note 2.Summary of Significant Accounting Policies to our consolidated financial statements under Item 8.Financial Statements and Supplementary Data). If estimated future cash flows are less than the carrying value of an asset, an impairment charge is recognized forto the difference between the asset's estimated fair value andextent its carrying value exceeds fair value.Impairment of related assets2012,2014, we performed our annual impairment review of goodwill for Pullmantur's reporting unit. We did not perform a qualitative assessment but instead proceeded directly to the two-step goodwill impairment test. Pullmantur is a brand targeted primarily at the Spanish, Portuguese and Latin American markets and although Pullmantur has diversified its passenger sourcing over the past few years, Spain still represents Pullmantur's largest market. As previously disclosed, European economies continued to demonstrate instability in light of heightened concerns over sovereign debt issues as well as the impact of proposed austerity measures on certain markets. The Spanish economy was more severely impacted than many other economies and there is significant uncertainty as to when it will recover. In addition, the impact of the Costa Concordia incident has had a more lingering effect than expected and the impact in future years is uncertain. These factors were identified in the past as significant risks which could lead to the impairment of Pullmantur's goodwill. The Spanish economy has progressively worsened and forecasts suggest the challenging operating environment will continue for an extended period of time. The unemployment rate in Spain reached26% during the fourth quarter of 2012 and is expected to rise further in 2013. The International Monetary Fund, which had projected GDP growth of 1.8% a year ago, revised its 2013 GDP projections downward for Spain to a contraction of 1.3% during the fourth quarter of 2012 and further reduced it to a contraction of 1.5% in January of 2013. During the latter half of 2012 new austerity measures, such as increases to the Value Added Tax, cuts to benefits, the phasing out of exemptions and the suspension of government bonuses, were implemented by the Spanish government. We believe these austerity measures are having a larger impact on consumer confidence and discretionary spending than previously anticipated. As a result there has been a significant deterioration in bookings from guests sourced from Spain duringof the 2013 WAVE season. The combination of all of these factors has caused us to negatively adjust our cash flow projections, especially our closer-in Net Yield assumptions and the expectations regarding future capacity growth for the brand. Based on our updated cash flow projections,test, we determined the implied fair value of goodwill was $145.5 million and recognized anthe Pullmantur reporting unit exceeded its carrying value by approximately 52% resulting in no impairment charge of $319.2 million. Similarly, we determined thatto Pullmantur's goodwill. We also performed the fair valueannual impairment review of Pullmantur's trademarks and trade names no longer exceeded theirusing a discounted cash flow model and the relief-from-royalty method to compare the fair value of these indefinite-lived intangible assets to its carrying value. Accordingly, we recognized an impairment chargeThe results of approximately $17.4 million to write downour testing indicated that the fair value of the trademarks and trade names exceeded its carrying value by approximately 4%, resulting in no impairment to their fair valuePullmantur's trademarks and tradenames for the year ended December 31, 2014.identified that the estimated fair values ofagreed to retain certain long-lived assets, consisting of threethe aircraft owned and operated by Pullmantur Air, were less than their carrying values. As a result,Air. Due to the anticipated change in the nature of the cash flows to be generated by the Pullmantur aircraft, during the fourth quarter of 2013, we proceeded to our long-lived asset impairment test. Pullmantur's strategy to further diversify its passenger sourcing and reduce its reliance onreviewed the Spanish market has led us to reduce the expected years in which we will use these aircraft when performingfor impairment. We identified that the undiscounted cash flow test. The undiscountedfuture cash flows for Pullmantur'sof the aircraft were determined to be less than their carrying value and recorded an impairment charge of $48.9 million was required. The combined impairment charge of $385.4 million related to Pullmantur's goodwill, trademarks and trade names and aircraft was recognized in earnings during the fourth quarter ended December 31, 2012 andof 2013, which is reported withinin Impairment of PullmanturRestructuring and related assetsimpairment charges withinin our consolidated statements of comprehensive income (loss). The factors influencing the Spanish economy and Pullmantur's operating cash flows discussed above also affect the recoverability of Pullmantur's deferred tax assets. During the fourth quarter of 2012, we updated our deferred tax asset recoverability analysis for projections included withinperformed the goodwill valuation model discussed above. These projections, including the impact of recently enacted laws regarding net operating loss utilization, and the reviewannual impairment evaluation of our tax planning strategies show that it is no longer more-likely-than-not thatgoodwill and trademarks and trade names and we will recover the deferred tax assets prior to their expiration. As such, we have determined thatrecognized total impairment related charges of $413.9 million associated with our Pullmantur brand. Included in this amount was a 100% valuation allowance of our deferred tax assets was required resultingwhich resulted in a deferred income tax expense of $33.7 million.million recorded during the fourth quarter of 2012. In addition, Pullmantur has a deferred tax liability that was recorded at the time of acquisition. This liability represents the tax effect of the basis difference between the tax and book values of the trademarks and trade names that were acquired at the time of the acquisition. Due to the 2012 impairment charge related to these intangible assets, we reduced the deferred tax liability byand recorded a deferred tax benefit of $5.2 million.million during the fourth quarter of 2012. The net $28.5 million impact of these adjustments was recognized in earnings during the fourth quarter of 2012 and iswas reported withinOther income (expense) income in our statements of comprehensive income (loss). Ifeconomy weakens further or recovers more slowly than contemplated or if the economies of otherPortuguese and Latin American markets, (e.g. France, Brazil,with an increasing focus on Latin America) perform worse than contemplatedAmerica. The persistent economic instability in these markets has created significant uncertainties in forecasting operating results and future cash flows used in our impairment analyses. We continue to monitor economic events in these markets for their potential impact on Pullmantur’s business and valuation. Further, the estimation of fair value utilizing discounted expected future cash flow model, or ifflows includes numerous uncertainties which require our significant judgment when making assumptions of expected revenues, operating costs, marketing, selling and administrative expenses, interest rates, ship additions and retirements as well as assumptions regarding the cruise vacation industry's competitive environment and general economic and business conditions, among other factors.material changes to ourthe projected future cash flows used in the impairment analyses, especially in Net Yields, or if anticipated transfers of vessels from our other cruise brands to the Pullmantur fleet do not take place, it is possible that an additional impairment charge of the PullmanturPullmantur’s reporting unit'sunit’s goodwill and trademarks and trade names and long-lived assets may be required.Table Of these factors, the planned transfers of Contents2012,2014, we performed a qualitative assessment of the Royal Caribbean International reporting unit. Based on our qualitative assessment, we concluded that it was more-likely-than-not that the estimated fair value of the Royal Caribbean International reporting unit exceeded its carrying value as of December 31, 2012 and thus, we did not proceed to the two-step goodwill impairment test. No indicators of impairment exist primarily because the reporting unit's fair value has consistently exceeded its carrying value by a significant margin, its financial performance has been solid in the face of mixed economic environments and forecasts of operating results generated by the reporting unit appear sufficient to support its carrying value.have entered into represent economic hedges which arewere not designated as hedging instruments for accounting purposes and thus, changes in their fair value arewere immediately recognized in earnings. Although certain of our derivativeourwe do not hold or issue derivative financial instruments are not held for trading or other speculative purposes. We account for derivative financial instruments in accordance with authoritative guidance. Refer to Note 2.Summary of Significant Accounting Policies and Note 13.14. Fair Value Measurements and Derivative Instruments to our consolidated financial statements under Item 8. Financial Statements and Supplementary Data for more information on related authoritative guidance, the Company's hedging programs and derivative financial instruments.third partythird-party institutions in over-the-counter markets. We estimate the fair value of our foreign currency forward contracts and interest rate and cross-currency swaps using expected future cash flows based on the instruments' contract terms and published forward curvesprices for foreign currency exchange and interest rates. We apply present value techniques and LIBOR-based discount rates to convert the expected future cash flows to the current fair value of the instruments.curves,prices, foreign exchange volatility levels and discount rates.risk, when applicable.any.any, which are recorded as assets when recoverability is probable. We accrue a liability when we believe a loss is probable and the amount of loss can be reasonably estimated. Due to the inherent uncertainties related to the eventual outcome of litigation and potential insurance recoveries, it is possible that certain matters may be resolved for amounts materially different from any provisions or disclosures that we have previously made.increasedfocused on deployment to SouthAustralia and Latin America and Australia during the Northern Hemisphere winter months.••tours,tours. Additionally, revenue related to Pullmantur's travel agency network, land-based tours and hotel and air packages including Pullmantur Air's charter business to third parties.parties are included in onboard and other revenues through the date of the sale of Pullmantur's non-core businesses further discussed below. also include revenues we receive from independent third partythird-party concessionaires that pay us a percentage of their revenues in exchange for the right to provide selected goods and/or services onboard our ships.••Table of Contents••••operating lease costs,related insurance and entertainment. Additionally, costs associated with Pullmantur's travel agency network, land-based tours and Pullmantur Air'sair charter business to third parties vessel related insurance and entertainment.are included in other operating expenses through the date of the sale of Pullmantur's non-core businesses further discussed below.costs,expenses, food costs,expenses, fuel costsexpenses or other operating costsexpenses to the expense categories attributable to passenger ticket revenues or onboard and other revenues since they are incurred to provide the total cruise vacation experience. We believe that the impairment charges recognized in 2012 related to Pullmantur's goodwill, trademarks, trade names and long-lived assets and the charges related to the adjustments to Pullmantur's deferred tax assets and deferred tax liability ("the impairment related charges") are not an indication of our future earnings performance. As such, we believe it is more meaningful for the impairment related charges to be excluded from our net income and earnings per share, and accordingly, we have elected to also present non-GAAP net income and non-GAAP EPS excluding these impairment related charges for the year ended December 31, 2012.allowallows us to perform capacity and rate analysis to separate the impact of known capacity changes from other less predictable changes which affect our business. We believe these non-GAAP measures provide expanded insight to measure revenue and cost performance in addition to the standard United States GAAP based financial measures. There are no specific rules or regulations for determining non-GAAP and Constant Currency measures, and as such, there exists the possibility that they may not be comparable to other companies within the industry. We believeoperations$764.1 million, or $3.43 per diluted share, compared to $473.7 million, or $2.14 per diluted share, in 2013. Adjusted Net Income was $755.7 million, or $3.39 per share, compared to $539.2 million, or $2.44 per share, in 2013. Adjusted Earnings per Share of $3.39 per share represented approximately a 40% increase in year-over-year EPS growth and established a new record for 2012 demonstrateour Company.strengthindustry grew by 13% in 2014 and resiliencycomprised 49% of our brandstotal capacity. This considerable growth led to increased levels of promotional activity throughout the industry and depressed our pricing power. Helping offset the value proposition of a cruise vacation. Caribbean was the double-digit yield improvement in Europe and China. The European season was the strongest we have seen in several years and China’s ability to absorb our capacity growth while driving higher yields continues to impress.slow pacedifficulties in the Caribbean, the Company grew 2014 Net Yields by 2.4% on a Constant Currency basis. Net ticket revenue yield improved 1.4% while onboard revenue yield increased by 3.8% on a Constant Currency basis. Onboard revenue continues to be a bright spot with beverage packages, specialty restaurants and internet packages driving strong growth in the Caribbean and Europe, while gaming and retail are fueling our growth in Asia. This, coupled with our investments in ship revitalizations and technology, has helped continue onboard’s strong growth trajectory.economic recoverySeas’ arrival in China is approaching, and we feel encouraged by the continued instabilityadvance demand that the ship has generated in the global economic landscape, especiallymarket. Our capacity in Europe,Asia continues to surge with 53% growth in 2015 on top of 22% growth in 2014. Investments in the region will continue to expand in order to ensure we maintain our net income for 2012, beforeposition in the impairment related charges, was $432.2 million and our Net Yields increased 1.5%. Duringmarket.2012,2014, we recognized an impairment charge of $385.4 million to write down Pullmantur's goodwill to its implied fair valuesaw a rapid decline in fuel prices that was coupled with a strengthening in the U.S. dollar. This produced some volatility in our earnings and to write down trademarks and trade names and certain long-lived assets, consisting of three aircraft owned and operated by Pullmantur Air, to their fair value. In addition, we recognized a $33.7 million charge to record a 100% valuation allowance related to our deferred tax assets for Pullmantur and we reduced the deferred tax liability related to Pullmantur's trademarks and trade names by $5.2 million. As a result, our net income for 2012 was $18.3 million as compared to $607.4 million for 2011, which was not impacted by the impairment related charges. Our results of operations for the year ended December 31, 2012 were also negatively impacted by the effect of the Costa Concordia incident on booking patterns throughout the industry. These effects were magnified by the timing of the incident, which occurred in early 2012 during WAVE season (traditionally the first two months of the year where cruise lines experience disproportionately higher volume cruise sales). We continue to believe the impact of the Costa Concordia incident will not have a significant long term impact on our business. Our results of operations were also influenced by changes to our international distribution system mainly in Brazil implemented in late 2011 pursuant to which we began directly distributing certain of our cruises rather than indirectly distributing them through charter arrangements. In addition, our results were impacted by certain deployment initiatives including, but not limited to, increased deployment in Australia and China. Our continued focus on cost control has helped us to maintain our profitability despite a tough operating environment with upward pressure on costs. We intend to continue these efforts during 2013. In addition, during 2013 we will continue to strengthen our revenue enhancement opportunities by strategically investing in a number of projects, including the introduction of beverage packages fleet wide, retail and casino enhancements, the continuation of our vessel revitalization program, the introduction of new onboard revenue initiatives and various information technology infrastructure investments. We also intend to enhance our focus on identifying the needs of our guests and creating product features that our customers value. We are focused on targeting high-value guests by better understanding consumer data and insights and creating communication strategies that best resonate with our target audiences. In 2013, we will continue to focus on the development of key markets in Asia and we will focus on sourcing guests and adding capacity to other markets where we expect significant growth and profitability, such as Australia. We believe these initiatives will provide opportunities for increased ticket and onboard revenues with the ultimate goal of maximizing our long-term return on invested capital and shareholder value. During 2012, we took delivery ofCelebrity Reflection, the fifth and final Solstice-class ship, and ordered a third Oasis-class ship through a conditional agreement. The agreementthis trend is subject to certain closing conditions and is expected to become effectivepersisting in the first quarter of 2013. The2015 as fuel prices continue to fluctuate considerably while the U.S. dollar continues to appreciate. Our fuel hedging program and some natural currency offsets within our results of operations will help mitigate the volatility but will not eliminate it completely.is scheduled for delivery inAnthem of the second quarterSeas, followed by Ovation of 2016. We also have two Quantum-class ships on order for Royal Caribbean International which are expected to enter service inthe Seas and the third quarter of 2014Oasis-class vessel in 2016. These ships are materially more energy efficient than our fleet average, and in the second quarter of 2015, respectively, and two ships on order for our joint venture TUI Cruises which are scheduled for delivery in the second quarter of 2014 and second quarter of 2015, respectively. As part of our vessel revitalization program, five ships were revitalized for the Royal Caribbean International brand during 2012. By the end of 2013, we expect that all of the Vision-class and Freedom-class ships and all but one of the Radiance-class ships will have been revitalized. For thethem to generate strong consumerunderwent revitalization during 2012 to incorporate certain Solstice-class features. Bywith the end of 2013, the Millennium-class revitalization program will be complete as the final ship is scheduled to be revitalized during the course of 2013. As of December 31, 2012, our liquidity position remained strong at $2.2 billion, consisting of approximately $194.9 millionfirst one being delivered in cash and cash equivalents and $2.0 billion available under our unsecured credit facilities. In addition,2018. While we continue to grow our fleet through newbuilds, we also consider opportunities to divest of older tonnage as evidenced with our sale of focused onan important step towards our goalDouble-Double goals. We expect to deliver step-change earnings growth by leveraging our innovative hardware, strong brands, global footprint and exceptional employees.•our establishment of new borrowing capacity, including €365.0 million in available capacity under a Euro-denominated unsecured term loan due July 2017 to be drawn at any time on or prior to June 30, 2013 and $233.0 million of additional revolving credit capacity utilizing the accordion feature on our revolving facility due July 2016. During 2013, it is likely we will secure additional liquidity in the capital and/or credit markets as part of our refinancing strategy for our upcoming 2013 and 2014 maturities. We anticipate funding these maturities and other obligations in 2013 through a combination of currently available and anticipated new credit facilities and other financing arrangements and operating cash flows.Overview",Overview," significant items for 20122014 include:•2.0%1.4% to $7.7$8.1 billion from $7.5$8.0 billion in 2011 partially due to a 1.5% increase in Net Yields and a 1.4% increase in capacity (measured by APCD for such period).•Cruise operating expenses increased 4.3% to $5.2 billion from $4.9 billion in 2011 partially2013 primarily due to an increase in fueloverall capacity and ticket prices.andof $5.3 billion for 2014 remained consistent with 2013.1.4% increase in capacity noted above.•We recognized an impairment charge of $385.4 million to write down Pullmantur's goodwill to its implied fair value and to write down trademarks and trade names and certain long-lived assets, consisting of three aircraft owned and operated by Pullmantur Air, to their fair value. In addition, we recognized a $33.7 million charge to record a 100% valuation allowance related to our deferred tax assets for Pullmantur and we reduced the deferred tax liability related to Pullmantur's trademarks and trade names by $5.2 million. As a result, our net income for 2012 was $18.3 millionyear ended December 31, 2014 as compared to $607.4 million December 31, 2013. The decrease was primarily due to lower interest rates and, to a lesser extent, a lower average debt level. See Note 7. Long-Term Debt to our consolidated financial statements under Item 8. Financial Statements and Supplementary Data for 2011.further information.•WeDuring 2014, we took delivery ofCelebrity ReflectionQuantum of the Seas. To finance the purchase, we borrowed $673.5$791.1 million under oura previously committed 12-year unsecured term loan which is 95% guaranteed by Hermes. SeeRefer to Note 7.Long-Term Debtto our consolidated financial statements under Item 8. Financial Statements and Supplementary Data for further information.TableDuring the fourth quarter of Contents•We exercised our option under our agreement with Meyer Werft to constructAnthem2014, Spain adopted tax reform legislation that, among other things, amended the net operating loss carryforward rules. As a result, we reversed a portion of the Seasdeferred tax asset valuation allowance recorded in 2012 which resulted in a deferred tax benefit of $33.5 million. Refer to Note 12. ,Income Taxes to our consolidated financial statements under Item 8. Financial Statements and Supplementary Data for further discussion on the second Quantum-class ship for Royal Caribbean International with approximately 4,100 berths which is expectedtransaction.enter service in the second quarter of 2015. We have a committed bank financing agreement to finance the purchase of the ship which includes a sovereign financing guarantee. See Note 14.16. CommitmentsRestructuring and ContingenciesRelated Charges to our consolidated financial statements under Item 8.Financial Statements and Supplementary Datafor further information.discussion on the sales transaction.•We reached a conditional agreement with STX France to buildBrilliance of the third Oasis-class ship for Royal Caribbean International. The agreement is subject to certain closing conditions and is expected to become effective in the first quarter of 2013. The ship will have a capacity of approximately 5,400 berths and is expected to enter service in the second quarter of 2016. If the agreement becomes effective, Pullmantur'sAtlantic Star,Seas which has been out of operation since 2009, will be transferred to an affiliate of STX France asunder the 25-year operating lease originally entered into in July 2002, denominated in British pound sterling. As part of the consideration. The transfer is not expectedagreement, we purchased the Brilliance of the Seas for a net settlement purchase price of approximately £175.4 million or $275.4 million. Refer to result in a gain or a loss. See Note 5.Property and Equipmentto our consolidated financial statements under Item 8.Financial Statements and Supplementary Datafor further information.discussion on the transaction.Other Items:•TUI Cruises, our 50% joint venture,FinlandFrance S.A. to build its second newbuildthe fourth Oasis-class ship scheduled for delivery inRoyal Caribbean International. Refer to Note 15. Commitments and Contingencies to our consolidated financial statements for further information.secondfourth quarter of 2015. TUI Cruises has entered into a credit agreement providing financing2014, we repurchased from A. Wilhelmsen AS, our largest shareholder, 3.5 million shares of our common stock. Refer to Note 8. Shareholders' Equity to our consolidated financial statements for up to 80% of the contract price of the ship. historical total revenues, operating income, net income, non-GAAP net income (excluding the impairment related charges),Adjusted Net Income, earnings per share and non-GAAP earningsAdjusted Earnings per share (excluding the impairment related charges)Share as shown in the following table (in thousands, except per share data): Year Ended December 31, 2012 2011 2010 $ 7,688,024 $ 7,537,263 $ 6,752,504 $ 403,110 $ 931,628 $ 802,633 $ 18,287 $ 607,421 $ 515,653 413,932 — — $ 432,219 $ 607,421 $ 515,653 $ 0.08 $ 2.80 $ 2.40 $ 1.98 $ 2.80 $ 2.40 $ 0.08 $ 2.77 $ 2.37 $ 1.97 $ 2.77 $ 2.37 Year Ended December 31, 2014 2013 2012 Adjusted Net Income $ 755,729 $ 539,224 $ 442,873 Net income 764,146 473,692 18,287 Net Adjustments to Net Income (Decrease) Increase $ (8,417 ) $ 65,532 $ 424,586 Adjustments to Net Income: $ — $ — $ 413,932 Restructuring and related impairment charges 4,318 56,946 — Other initiative costs 21,211 — — Estimated impact of divested businesses prior to sales transaction 11,013 8,586 10,654 Loss on sale of ship included within other operating expenses 17,401 — — (28,877 ) — — Reversal of a deferred tax valuation allowance (33,483 ) Net Adjustments to Net Income (Decrease) Increase $ (8,417 ) $ 65,532 $ 424,586 Basic: Adjusted Earnings per Share $ 3.41 $ 2.46 $ 2.03 Earnings per Share $ 3.45 $ 2.16 $ 0.08 Diluted: Adjusted Earnings per Share $ 3.39 $ 2.44 $ 2.02 Earnings per Share $ 3.43 $ 2.14 $ 0.08 Weighted-Average Shares Outstanding: Basic 221,658 219,638 217,930 Diluted 223,044 220,941 219,457 historical operating dataresults as a percentage of total revenues for the last three years: Year Ended December 31, Year Ended December 31, 2012 2011 2010 2014 2013 2012 72.8 % 73.3 % 72.7 % 73.0 % 71.9 % 72.8 % 27.2 26.7 27.3 27.0 28.1 27.2 100.0 % 100.0 % 100.0 % 100.0 100.0 100.0 16.8 % 17.2 % 17.4 % 17.0 16.5 16.8 6.9 7.1 7.1 7.2 7.1 6.9 10.8 11.0 11.4 10.5 10.6 10.8 5.8 5.6 5.7 5.9 5.9 5.8 11.8 10.1 9.6 11.7 11.6 11.8 15.0 14.5 14.8 13.3 14.9 15.0 67.1 65.6 66.0 65.7 66.7 67.1 13.2 12.7 12.6 13.0 13.1 13.2 9.5 9.3 9.5 9.6 9.5 9.5 5.0 — — — — 5.0 Restructuring and related impairment charges 0.1 0.7 — 5.2 12.4 11.9 11.7 10.0 5.2 (5.0 ) (4.3 ) (4.2 ) (2.2 ) (4.1 ) (5.0 ) 0.2 % 8.1 % 7.6 % 9.5 % 6.0 % 0.2 % historical statistical information is shown in the following table: Year Ended December 31, Year Ended December 31, 2012 2011 2010 2014 2013 2012 4,852,079 4,850,010 4,585,920 5,149,952 4,884,763 4,852,079 35,197,783 34,818,335 32,251,217 36,710,966 35,561,772 35,197,783 33,705,584 33,235,508 30,911,073 34,773,915 33,974,852 33,705,584 104.4 % 104.8 % 104.3 % 105.6 % 104.7 % 104.4 % Year Ended December 31, Year Ended December 31, 2012 2012
On a
Constant
Currency
basis 2011 2010 2014 2014
On a
Constant
Currency
basis 2013 2012 $ 5,594,595 $ 5,698,635 $ 5,525,904 $ 4,908,644 $ 5,893,847 $ 5,956,386 $ 5,722,718 $ 5,594,595 2,093,429 2,116,296 2,011,359 1,843,860 2,180,008 2,184,683 2,237,176 2,093,429 7,688,024 7,814,931 7,537,263 6,752,504 8,073,855 8,141,069 7,959,894 7,688,024 1,289,255 1,317,028 1,299,713 1,175,522 1,372,785 1,383,339 1,314,595 1,289,255 529,453 540,011 535,501 480,564 582,750 585,631 568,615 529,453 $ 5,869,316 $ 5,957,892 $ 5,702,049 $ 5,096,418 Net revenues including divested businesses 6,118,320 6,172,099 6,076,684 5,869,316 Less: Net revenues related to divested businesses prior to sales transaction 35,656 34,403 218,350 189,527 Net Revenues $ 6,082,664 $ 6,137,696 $ 5,858,334 $ 5,679,789
33,705,584
33,705,584
33,235,508
30,911,073 34,773,915 34,773,915 33,974,852 33,705,584 $ 228.09 $ 231.86 $ 226.78 $ 218.45 $ 232.18 $ 234.11 $ 234.29 $ 228.09 $ 174.13 $ 176.76 $ 171.56 $ 164.87 $ 174.92 $ 176.50 $ 172.43 $ 168.51 Year Ended December 31, Year Ended December 31, 2012 2012 On a
Constant
Currency
basis 2011 2010 2014 2014 On a
Constant
Currency
basis 2013 2012 $ 5,157,434 $ 5,231,963 $ 4,942,607 $ 4,458,076 $ 5,306,281 $ 5,329,013 $ 5,305,270 $ 5,157,434 1,011,543 1,029,564 960,602 848,079 1,048,952 1,048,921 1,044,819 1,011,543 6,168,977 6,261,527 5,903,209 5,306,155 6,355,233 6,377,934 6,350,089 6,168,977 1,289,255 1,317,028 1,299,713 1,175,522 1,372,785 1,383,339 1,314,595 1,289,255 529,453 540,011 535,501 480,564 582,750 585,631 568,615 529,453 Net Cruise Costs including divested businesses 4,399,698 4,408,964 4,466,879 4,350,269 Less: Net Cruise Costs related to divested businesses prior to sales transaction 47,854 46,158 224,864 199,596 Other initiative costs included within cruise operating expenses and marketing, selling and administrative expenses 18,972 19,354 — — Loss on sale of ship included within other operating expenses 17,401 17,401 — — $ 4,350,269 $ 4,404,488 $ 4,067,995 $ 3,650,069 4,315,471 4,326,051 4,242,015 4,150,673 909,691 914,444 764,758 646,998 947,391 950,945 924,414 909,691 $ 3,440,578 $ 3,490,044 $ 3,303,237 $ 3,003,071 $ 3,368,080 $ 3,375,106 $ 3,317,601 $ 3,240,982
33,705,584
33,705,584
33,235,508
30,911,073 34,773,915 34,773,915 33,974,852 33,705,584 $ 183.03 $ 185.77 $ 177.62 $ 171.66 $ 182.76 $ 183.41 $ 186.91 $ 183.03 $ 129.07 $ 130.68 $ 122.40 $ 118.08 $ 124.10 $ 124.41 $ 124.86 $ 123.14 $ 102.08 $ 103.54 $ 99.39 $ 97.15 $ 96.86 $ 97.06 $ 97.65 $ 96.16 As of
December 31, As of December 31, 2012 2011 2014 2013 $ 6,970,464 $ 7,856,962 $ 7,644,318 $ 6,511,426 1,519,483 638,891 799,630 1,563,378 8,489,947 8,495,853 8,443,948 8,074,804 194,855 262,186 189,241 204,687 $ 8,295,092 $ 8,233,667 $ 8,254,707 $ 7,870,117
$
8,308,749
$
8,407,823 $ 8,284,359 $ 8,808,265 8,489,947 8,495,853 8,443,948 8,074,804 16,798,696 16,903,676 $ 16,728,307 $ 16,883,069 50.5 % 50.3 % 50.5 % 47.8 % 8,295,092 8,233,667 $ 8,254,707 $ 7,870,117 $ 16,603,841 $ 16,641,490 $ 16,539,066 $ 16,678,382 50.0 % 49.5 % 49.9 % 47.2 % February 4, 2013,January 29, 2015, we announced the following initial first quarter and full year 20132015 guidance:20132015As Reported Constant CurrencyNet Yields 3%Constant CurrencyNet Yields (0.5%) to 5%1.5% 2%2.5% to 4%4.5%(4.5%) to (5.5%) 3%(3.0%) to 4%Approx. 3%(4.0%)(1.5%) to (0.5%) Approx. 3%2% to 3%1% or better1.4%5.5% $ 750840 to $770$850 million $ 335260 to $355$270 million 1,377,5001,400,000 $ 960806 million 55%52% $ 4325 million EPS$4.65 to $4.85 $2.30As Reported Constant Currency Net Yields Approx. (5.0%) (1.5%) to $2.50(2.0%)Net Cruise Costs per APCD (3.5%) to (4.0%) Approx. (2.0%) Net Cruise Costs per APCD, excluding Fuel Flat to up 1% 2.0% to 3.0% Capacity Increase 3.8% Depreciation and Amortization $195 to $205 million Interest Expense, net $60 to $70 million Fuel Consumption (metric tons) 353,000 Fuel Expenses $207 million Percent Hedged (fwd consumption) 54% Impact of 10% change in fuel prices $7 million $0.10 to $0.15 First Quarter 2013As ReportedConstant CurrencyNet YieldsApprox. 2%2% to 3%Net Cruise Costs per APCD2% to 3%2% to 3%Net Cruise Costs per APCD, excluding FuelApprox. 2%Approx. 2%Capacity Increase1.5%Depreciation and Amortization$183 to $193 millionInterest Expense, net$82 to $92 millionFuel Consumption (metric tons)350,600Fuel Expenses$245 millionPercent Hedged (fwd consumption)53%Impact of 10% change in fuel prices$12 millionEPS$0.10 to $0.20February 4, 2013,January 29, 2015, bookings have remained encouraging and consistent with our previous expectations. Accordingly, our outlookforecast has remained essentially unchanged.20122014 Compared to Year Ended December 31, 2011201320122014 refer to the year ended December 31, 20122014 and references to 20112013 refer to the year ended December 31, 2011.20122014 increased $150.8$114.0 million, or 2.0%1.4%, to $7.7$8.1 billion from $7.5$8.0 billion in 2011. Despite the impact2013.passengerPassenger ticket revenues comprised 73.0% of our 2014 total revenues. Passenger ticket revenues increased $68.7by $171.1 million, or 1.2%3.0%, to $5.6 billion from $5.5$5.9 billion in 2011 and ouronboard and other revenues increased $82.1 million or 4.1% to $2.1 billion2014 from $2.0$5.7 billion in 2011.2013. The increase was primarily due to: Approximately $171.1 million of thetotalcapacity, which increased Passenger ticket revenues was driven by an increase in Pullmantur's land-based tours, hotel and air packages, an increase in onboard spending on a per passenger basis, and an increase in concession revenues.$134.6 million. The increase in Pullmantur's land-based tours, hotel and air packages was attributable to an increase in guests and the addition of new itineraries. The increase in onboard spendingcapacity was primarily due to the addition of specialty restaurantsQuantum of the Seas which entered service in October 2014 and other onboard activities asthe transfer of Monarch of the Seas to Pullmantur in April 2013 reducing capacity in 2013 due to the two-month lag further discussed in Note 1. General to our consolidated financial statements. Passenger ticket revenues also includes the impact of the change in our voyage proration methodology; andresultdecrease in ticket prices for Caribbean sailings, all of our ship revitalization projects and other revenue enhancing initiatives. which contributed to a $99.1 million increase in Passenger ticket revenues.concessionpassenger ticket revenues was due to an increase in spending on a per passenger basis. In addition, the increase in total revenues was partially attributable to changes to our international distribution system mainly in Brazil and certain deployment initiatives including, but not limited to increased deployment in Australia and China as described above. These increases were partially offset by the unfavorable effect of changes in foreign currency exchange rates related to our revenue transactions denominated in currencies other than the United States dollar of approximately $126.9$62.5 million. Approximately $106.6 millionThe remaining 27.0% of the increase in2014 total revenues was attributable to a 1.4% increasecomprised of onboard and other revenues, which decreased $57.2 million, or 2.6%. The decrease in capacity. The increase in capacityonboard and other revenues was primarily due to a $177.2 million decrease in revenues related to Pullmantur's non-core businesses that were sold in 2014 as noted above. The decrease was partially offset by:ofCelebrity Silhouette which entered service in July 2011 and promotion of specialty restaurants, the addition ofCelebrity Reflection which entered service in October 2012. Thisincreased revenue associated with internet and other telecommunication services and other onboard activities;partially offset byrecorded in 2013 to correct the sale ofCelebrity Mercury to TUI Cruises in February 2011 and the completioncalculation of our one-year charterliability for our credit card rewards program.theBleu de France$324.3 million in November 2011 following its sale to a third party2014 and $316.3 million in November 2010. We consolidate the operating results of Pullmantur and its wholly-owned subsidiary, CDF Croisières de France, on a two-month lag to allow for more timely preparation of our consolidated financial statements. (See Note 1.2013.General to our consolidatedfinancial statements under Item 8.Financial Statements and Supplementary Data). The increase in capacity was also partially offset by the delivery ofOcean Dream to an unrelated third party in April 2012 as part of a six year bareboat charter agreement.20122014 increased $214.8 million or 4.3% to $5.2 billion from $4.9 billion for 2011. Approximately $219.4 million of this$1.0 million. The increase was primarily due to:increasesthe 2.4% increase in fuel expenses,capacity noted above, which includes the impact of the change in our voyage proration methodology;land-based tours, hotel and air packages.Fuel expenses, which are netnon-core businesses that were sold in 2014 as noted above;result of increasing fuel prices. The increase in Pullmantur's land-based tours, hotel and air packages expenses was primarily attributable to an increase in guests and the addition of new itineraries. These increases were partially offset by a$16.3 million decrease in commissions expensesexpense attributable to increased charter business and changesshifts in our distribution channels. In addition, $69.9channels; andof the increasedecrease in cruise operating expenses wasshore excursion expense attributable to the 1.4% increase in capacity mentioned above. These increases in cruise operating expenses were partially offset by the favorable effect ofitinerary changes in foreign currency exchange rates related to our cruise operating expenses denominated in currencies other than the United States dollar of approximately $74.5 million.20122014 increased $50.9$4.1 million, or 5.3% to $1.0 billion from $960.6 million for 2011. The increase was due to an increase in costs associated with investments in technology and to an increase in advertising expenses related to our global expansion. These increases were partially offset by the favorable effect of changes in foreign currency exchange rates related to ourmarketing, selling and administrative expenses denominated in currencies other than the United States dollar.Depreciation and Amortization ExpensesDepreciation and amortization expenses for 2012 increased $28.1 million or 4.0% to $730.5 million from $702.4 million for 2011.0.4%. The increase was primarily due to the addition ofan increase in other costs associated with our restructuring activities. Refer to Note 16. Celebrity SilhouetteRestructuring and Related Impairment Charges which entered serviceto our consolidated financial statements for further information on our restructuring activities.July 2011, the addition ofCelebrity Reflection which entered service in October 2012 and to2013. The increase was primarily driven by new shipboard additions associated with our ship revitalization projects. This increase was partially offset byupgrade programs, the saleaddition of our new reservations pricing engine in December of 2013 and the addition of Celebrity MercuryQuantum of the Seas which entered service in October 2014.TUI Cruises$56.9 million in February 2011.Impairment of Pullmantur related assets During 2012,2013. In 2013, we recognized an impairment charge of $385.4$33.5 million to write down Pullmantur's goodwillthe assets held for sale related to its implied fair valuethe Pullmantur businesses and to write down trademarks and trade names and certain long-lived assets, consisting of three aircraft owned and operated by Pullmantur Air, to their fair value. (Seevalue which did not recur in 2014. Refer to Note 16. Valuation of Goodwill, Indefinite-Lived Intangible AssetsRestructuring and Long-Lived AssetsRelated Impairment Charges aboveto our consolidated financial statements for morefurther information regarding the impairment of these assets)on our restructuring activities.$355.8$258.3 million in 20122014 from $382.4$332.4 million in 2011.2013. The decrease was due to lower interest rates and, to a lesser extent, a lower average debt level.TableOther income in 2014 was $70.2 million compared to Other expense of ContentsOther expense was $50.4$1.7 million in 2012 compared toother2013. The increase in income of $32.9$72.0 million in 2011 for a net change of $83.3 million when comparing these periods. The change inother expense was primarily due to the following:•Deferred incomea $33.5 million tax expense of $33.7 million as a result of a 100% valuation allowance recorded in connection with Pullmantur's deferred tax assets that are no longer expected to be recovered prior to their expiration;•A reduction in deferred income tax expense of $5.2 million due to a reduction in Pullmantur's deferred tax liabilitybenefit related to the impairment chargereversal of Pullmantur's trademarks and trade names;•A lossa deferred tax asset valuation allowance resulting from Spanish tax reform, ineffectiveness gains of $5.7$11.5 million associated with changes in the fair value offrom our fuel call options in 2012 asinterest rate swap agreements compared to a gainineffectiveness losses of $18.9$7.3 million in 2011, for a net change2013 and to income of $24.6 million;•A loss of $2.7$51.6 million due to ineffectiveness onfrom our fuel swapsequity method investments in 2012 as2014 compared to a gainincome of $7.1$32.0 million in 2011, for a net change2013.$9.8 million;unsecured senior notes•A loss of $7.5 million on the early extinguishment of €255.0 million, or approximately $328.0 decreased $4.2 million in aggregate principal amount of our outstanding €1.0 billion2014 compared to the same period in 2013 as we did not repurchase any unsecured senior notes due 2014 in September 2012.1.5%1.4% in 20122014 compared to 20112013 primarily due an increase in Pullmantur's land based tours, hotel and air packages revenue and an increase in onboard spending. In addition, the increase was due to the changesincrease in our international distribution system mainly in Brazil and certain deployment initiatives.passenger ticket revenues noted above. Net Yields increased 3.0%2.4% in 20122014 compared to 20112013 on a Constant Currency basis.6.9%1.7% in 20122014 compared to 20112013 primarily due to the 1.4% increase in capacity and a 5.4% increase in Net Cruise Cost per APCD. The increase innoted above. Net Cruise Costs per APCD was primarily due to an increase in fuel and Pullmantur's land-based tours, hotel and air packages expenses as discussed above. In addition, the increase in Net Cruise Cost per APCD was due to the changes in our international distribution system mainly in Brazil and certain deployment initiatives. Net Cruise Costs per APCD increased 6.8% in 2012 compared to 2011 on a Constant Currency basis. basis remained consistent compared to 2013.increased 2.7%decreased 0.8% in 20122014 compared to 2011.2013. Net Cruise Costs Excluding Fuel per APCD increased 4.2% in 2012 compared to 2011 on a Constant Currency basis.20112013 Compared to Year Ended December 31, 201020112013 refer to the year ended December 31, 20112013 and references to 20102012 refer to the year ended December 31, 2010.20112013 increased $784.8$271.9 million, or 11.6%3.5%, to $7.5$8.0 billion from $6.8$7.7 billion in 2010. Approximately $507.82012.of thisor 2.3%, to $5.7 billion in 2013 from $5.6 billion in 2012. The increase was attributableprimarily due to:7.5%$117.6 million increase in capacity.Passenger ticket revenues; anda full yearthe addition of revenue generated byAllure of the SeasCelebrity Reflection which entered service in December 2010, the addition ofCelebrity Silhouette which entered service in July 2011, and a full year ofCelebrity Eclipse which entered service in April 2010.October 2012. This increase in capacity was partially offset by the saletransfer ofCelebrity MercuryOcean Dream to TUI Cruisesan unrelated third-party in February 2011. In addition, approximately $277.0 millionApril 2012 as part of a six year bareboat charter agreement and the transfer of Monarch of the Seas to Pullmantur in April 2013 reducing capacity due to the two-month lag further discussed in Note 1. General.revenuepassenger ticket revenues was drivenpartially offset by an increase in ticket prices andfavorableunfavorable effect of changes in foreign currency exchange rates related to our revenue transactions denominated in currencies other than the United States dollar. These increases were partially mitigated by the impactdollar of geopolitical events including the political unrest in the Eastern Mediterranean and Northern Africa and the earthquake and related events in Japan which offset pricing improvements in other regions. These events resulted in deployment changes to avoid calling on ports in those areas and pricing reductions to stimulate demand in other areas.$273.4$316.3 million in 20112013 and $288.6 million in 2012;$237.0$7.5 million in 2012. The decrease is due to a lower amount of notes repurchased during 2013 partially offset by a higher premium paid in connection with the 2013 repurchases.2010. The increase2012. This change was primarily due to:concession revenues was due to an increase in spending on a per passenger basis and the increase in capacity mentioned above.Cruise Operating Expenses Total cruise operating expenses for 2011 increased $484.5 million or 10.9% to $4.9 billion from $4.5 billion for 2010. Approximately $335.2 million of the increase was attributable to the 7.5% increase in capacity mentioned above. Other significant drivers of the increase include an increase in fuel, air and other hotel and vessel expenses and head taxes, as well as the unfavorable effect of changes in foreign currency exchange rates related to our cruise operating expenses denominated in currencies other than the United States dollar. Fuel expenses, which are net of the financial impact of fuel swap agreements, increased 18.4% per metric ton in 2011 as compared to 2010 primarilydeferred income tax expense as a result of increasing fuel prices. The increasea 100% valuation allowance recorded in air and other hotel and vessel expenses and head taxes were primarily due to deployment changes.Marketing, Selling and Administrative ExpensesMarketing, selling and administrative expenses for 2011 increased $112.5 million or 13.3% to $960.6 million from $848.1 million for 2010. The increase was due to an increaseconnection with Pullmantur's deferred tax assets in marketing, selling and payroll expenses primarily associated with our international expansion and, to a much lesser extent, an increase in expenses associated with technological innovations.Depreciation and Amortization expensesDepreciation and amortization expensesfor 2011 increased $58.7 million or 9.1% to $702.4 million from $643.7 million for 2010. The increase is primarily due to a full year of Allure of the Seaswhich entered service in December 2010, the addition of Celebrity Silhouettewhich entered service in July 2011, and a full year of Celebrity Eclipsewhich entered service in April 2010. These increases were partially offset by the sale of Celebrity Mercuryto TUI Cruises and the sale of Bleu de France.Other Income (Expense)Interest expense, net of interest capitalized, increased to $382.4 million in 2011 from $371.2 million in 2010. The increase was due to a reduction in interest capitalized for ships under construction. Interest capitalized decreased to $14.0 million in 2011 from $28.1 million in 2010 primarily due to a lower average level of investment in ships under construction. Gross interest expense decreased to $396.4 million from $399.3 million in 2010. The decrease was primarily due to lower interest rates2012 partially offset by a higher average debt level.Other income decreasedreduction in Pullmantur's deferred tax liability and resulting tax benefit related to $32.9a 2013 impairment of Pullmantur's long-lived assets and a 2012 impairment charge of Pullmantur's trademarks and trade names; andin 2011 from $75.0 million in 2010. The $42.1 million decrease inother income was due primarily to an $89.0 million gain recorded from a litigation settlement during 2010 that did not recur in 2011, which was partially offset by:
2012.•Income on our equity method investments in unconsolidated subsidiaries of $22.2 million in 20112013 as compared to income of $0.2$23.8 million in 2010, for a net increase of $22.0 million when comparing these periods;•A gain on our fuel call options of $18.9 million in 2011 as compared to a loss of $2.8 million in 2010, for a net change of $21.7 million.4.1%2.7% in 20112013 compared to 20102012 primarily due to an increase in ticket prices, onboard revenue and the favorable impact of changes in exchange rates, as discussedPullmantur’s travel agency network and air charter business noted above. Net Yields per APCD increased 2.4%3.2% in 20112013 compared to 20102012 on a Constant Currency basis.11.4%2.7% in 20112013 compared to 20102012 primarily due to the 7.5% increase in capacity and a 3.7% increase in Net Cruise Cost per APCD. The increase in Net Cruise Costs per APCD was primarily driven by an increase in fuel and other hotel and vesselcrew expenses, food expenses, indirect operating expenses and expenses related to a lesser extent, the unfavorable impact of changes in exchange rates, as discussedPullmantur’s travel agency network and air charter business, noted above. Net Cruise Costs per APCD increased 2.7%1.9% in 20112013 compared to 20102012. Net Cruise Costs per APCD on a Constant Currency basis. basis increased 1.7% in 2013 compared to 2012.2.3%2.1% in 20112013 compared to 2010.2012. Net Cruise Costs Excluding Fuel per APCD increased 1.3% in 2011 compared to 2010 on a Constant Currency basis.Recently Adopted, and basis increased 1.8% in 2013 compared to 2012.Recently Adopted Accounting Standards andRecent Accounting Pronouncements. decreased $74.0increased $331.7 million to $1.7 billion for 2014 compared to $1.4 billion for 2012 compared to $1.5 billion for 2011. This decrease2013. The increase was primarily a result ofdue to a decrease in net income after adjusting for non-cash itemsinterest paid in 2014 compared to 2013 and to the timing of collections on our tradeproceeds from accounts receivable partially offsetand payments to vendors in 2014. Net cash provided by a higher rate of increase operating activities in customer deposits and an increase in cash received on the settlement of derivative financial instruments.2013 remained consistent compared to 2012.$1.3$1.8 billion for 20122014 compared to $924.6$824.5 million for 2011.2013. The change was primarily due to $290.0 million of proceeds received from the sale ofCelebrity Mercury and $55.0 million of proceeds received from the sale ofBleu de France during 2011 which did not recur in 2012. During 2012, our use of cash was primarily related to capital expenditures of $1.3 billion, up from $1.2 billion for 2011. The increase in capital expenditures was primarily attributable to an increase in payments relatedcapital expenditures of $1.0 billion in 2014 compared to our ship revitalization projects 2013 primarily due to the delivery of Quantum of the Seas and the purchase of Brilliance of the Seas in 2012. We also provided $110.7 million under a debt facility2014. Additionally, there was an increase in investments in and loans to one of our unconsolidated affiliates during 2011of $118.0 million and an increase in cash paid on the settlement of derivative financial instruments of $50.8 million. These cash outlays were partially offset by cash received of $220.0 million in 2014 for the sale of Celebrity Century which did not occur in 2013 and a $52.8 million increase in cash received from repayments of a loan to an unconsolidated affiliate in 2014 compared to 2013.was $179.6of $576.6 million for 2012 compared to $676.5 million for 2011, primarily as a result of our refinancing strategy for our upcoming 2013 and 2014 maturities. The2013. This change was primarily due to a net$1.7 billion increase in debt facility drawings of $980.1proceeds and a $40.8 million during 2012 as compared to 2011. The net increase in the proceeds from the exercise of common stock options, partially offset by the repurchase of treasury stock of $236.1 million, an increase of $867.7 million in repayments of debt facility drawingsand an increase of dividends paid of $55.3 million. The increase in repayments of debt and proceeds from issuance of debt was primarily due to proceeds received from the issuance of $650.0 million unsecured senior notes and amounts borrowed under an unsecured term loan of $290.0$791.1 million during 2012 which did not occur due to the delivery of Quantum of the Seas in 2011. The change in net2014, a higher level of bond maturities and higher drawings and repayments on our revolving credit facilities.also due$576.6 million for 2013 compared to an increase in repayments of debt of approximately $382.2 million. The increase in repayments of debt$179.6 million for 2012. This change was primarily due to an increase of $590.0$295.2 million in repayments on our unsecured revolving credit facilities from $885.0 million during 2011 to $1.5 billion during 2012. The increase in repayments of debt was also due $344.6and an increase of $25.9 million paid in conjunction with the repurchasedividends, partially offset by a decrease of €255.0$109.0 million in debt proceeds.or approximately $328.0 million in aggregate principal amount of our €1.0 billion 5.625% unsecured senior notes and the prepayment of a $100.0 million unsecured term loan during 2012 as compared to the repayment of a $500.0 million unsecured senior note and a prepayment of $200.0 million on ourAllure of the Seas unsecured term loan during 2011. The change was also due to cash dividends paid on our common stock of $117.7 million for 2012 as compared to $21.7 million for 2011.Future Capital Commitments2012,2014, we had two Quantum-class ships and onetwo Oasis-class shipships on order for our Royal Caribbean International brand with an aggregate capacity of approximately 13,60019,200 berths. The agreementAdditionally, we have two "Project Edge" ships on order for our Oasis-class ship is subject to certain closing conditions and isCelebrity Cruises brand with an aggregate capacity of approximately 5,800 berths, which are expected to become effective in the firstsecond quarter of 2013. We also have an option to construct a fourth Oasis-class ship which will expire five days prior to the first anniversary of the effective date of the contract.2012,2014, the aggregate cost of our ships on order, not including the "Project Edge" ships, was approximately $3.6$5.0 billion, of which we had deposited $131.0$394.4 million as of such date. Approximately 49.7%28.8% of the aggregate cost was exposed to fluctuations in the euroEuro exchange rate at December 31, 2012.2014. (See Note 13.14. Fair Value Measurements and Derivative Instrumentsand Note 14.15. Commitments and Contingencies to our consolidated financial statements under Item 8.Financial Statements and Supplementary Data).2012, we2014, anticipated overall capital expenditures, will bebased on our existing ships on order, are approximately $0.7 billion for 2013, $1.2 billion for 2014, $1.2$1.6 billion for 2015, and $1.3$2.3 billion for 2016.2012,2014, our contractual obligations were as follows (in thousands): Payments due by period Less than 1-3 3-5 More than Total 1 year years years 5 years Operating Activities: $ 189,519 $ 18,154 $ 28,750 $ 17,618 $ 124,997 1,150,946 245,162 344,430 214,598 346,756 843,262 214,817 303,590 197,012 127,843 Investing Activities: 0 3,673,286 946,752 1,770,213 956,321 — 58,811 58,811 — — — Financing Activities: 0 8,391,302 790,920 2,765,464 2,307,677 2,527,241 52,646 8,710 11,525 6,603 25,808 88,610 25,652 37,375 19,099 6,484 Total $ 14,448,382 $ 2,308,978 $ 5,261,347 $ 3,718,928 $ 3,159,129 Payments due by period Total Less than
1 year 1-3
years 3-5
years More than
5 years $ 630,948 $ 65,929 $ 118,563 $ 108,343 $ 338,113 1,404,380 314,315 396,439 232,940 460,686 779,112 231,137 273,093 178,234 96,648 2,896,826 242,391 1,609,550 1,044,885 — 8,437,016 1,509,945 2,604,499 1,841,418 2,481,154 52,931 9,538 8,097 4,875 30,421 98,665 30,740 46,580 17,664 3,681 $ 14,299,878 $ 2,403,995 $ 5,056,821 $ 3,428,359 $ 3,410,703 a ship, offices, warehouses and motor vehicles.(2)Under theBrilliance Amounts represent contractual obligations with initial terms in excess of the Seas lease agreement, we may be required to make a termination payment of approximately £65.4 million, or approximately $106.3 million based on the exchange rate at December 31, 2012, if the lease is canceled in 2020. This amount is included in the more than 5 years column.(3)2012.2014. Debt denominated in other currencies is calculated based on the applicable exchange rate at December 31, 2012.(4)(5)represent contractualdo not include potential obligations with initial terms in excess of one year. Amounts includewhich remain subject to cancellation at our third Oasis-class ship which was ordered under a conditional agreement in December 2012 and is expectedsole discretion.become effective in the first quarter of 2013. In July 2002, we entered into an operating lease denominated in British pound sterling for theBrilliance of the Seas. The lease payments vary based on sterling LIBOR. The lease has a contractual life of 25 years; however, both the lessor and we have certain rights to cancel the lease at year 18 (i.e. 2020) upon advance notice given approximately one year prior to cancellation. In the event of early termination at year 18, we have the option to cause the sale of the vessel at its fair value and to use the proceeds towards the applicable termination payment. Alternatively, we could opt at such time to make a termination payment of approximately £65.4 million, or approximately $106.3 million based on the exchange rate at December 31, 2012 and relinquish our right to cause the sale of the vessel. Under current circumstances we do not believe early termination of this lease is probable. Under theBrilliance of the Seas operating lease, we have agreed to indemnify the lessor to the extent its after-tax return is negatively impacted by unfavorable changes in corporate tax rates, capital allowance deductions and certain unfavorable determinations which may be made by United Kingdom tax authorities. These indemnifications could result in an increase in our lease payments. We are unable to estimate the maximum potential increase in our lease payments due to the various circumstances, timing or a combination of events that could trigger such indemnifications. The United Kingdom tax authorities are disputing the lessor's accounting treatment of the lease and the lessor and tax authorities are in discussions on the matter. If the characterization of the lease is ultimately determined to be incorrect, we could be required to indemnify the lessor under certain circumstances. The lessor has advised us that they believe their characterization of the lease is correct. Based on the foregoing and our review of available information, we do not believe an indemnification payment is probable. However, if the lessor loses its dispute and we are required to indemnify the lessor, we cannot at this time predict the impact that such an occurrence would have on our financial condition and results of operations.ana €180.0 million 5-year amortizing bank loan provided to TUI Cruises.Cruises which is due 2016. As of December 31, 2012, €153.02014, €117.0 million, or approximately $201.7$141.6 million based on the exchange rate at December 31, 2012,2014, remains outstanding. Based on current facts and circumstances, we do not believe potential obligations under this guarantee are probable.STX FinlandMeyer Turku shipyard that includes certain restrictions on each of our and TUI AG's ability to reduce our current ownership interest in TUI Cruises below 37.5% through the construction period for the first TUI newbuild vessel. In addition, the bank credit facility agreement for the financing of the ship extends this restriction through 2019.and our debt service obligations represent our largest funding needs. As of December 31, 2014, we have approximately $2.3 billion in contractual obligations due through December 31, 2015 of which approximately $790.9 million relates to debt maturities, $946.8 million relates to the acquisition of Anthem of the Seas along with progress payments on our other ship purchases and $245.2 million relates to interest on long-term debt. We have historically relied on a combination of cash flows provided by operations, drawdowns under our available credit facilities, the incurrence of additional debt and/or the refinancing of our existing debt and the issuance of additional shares of equity securities to fund these obligations.$3.2$3.0 billion as of December 31, 20122014 as compared to a working capital deficit of $2.1$3.3 billion as of December 31, 2011.2013. Included within our working capital deficit is $1.5 billion$799.6 million and $0.6$1.6 billion of current portion of long-term debt, including capital leases, as of December 31, 20122014 and 2011,December 31, 2013, respectively. The increase isdecrease in working capital deficit was primarily due to the increasedecrease in current maturities of long-term debt. Similar to others in our industry, we operate with a substantial working capital deficit. This deficit is mainly attributable to the fact that, under our business model, a vast majority of our passenger ticket receipts are collected in advance of the applicable sailing date. These advance passenger receipts remain a current liability until the sailing date. The cash generated from these advance receipts is used interchangeably with cash on hand from other sources, such as our revolving credit facilities and other cash from operations. The cash received as advanced receipts can be used to fund operating expenses for the applicable future sailing or otherwise, pay down our revolving credit facilities, invest in long term investments or any other use of cash. In addition, we have a relatively low-level of accounts receivable and rapid turnover results in a limited investment in inventories. We generate substantial cash flows from operations and our business model, along with our unsecured revolving credit facilities, has historically allowed us to2012, we have approximately $8.5 billion in long-term debt obligations, of which approximately $2.5 billion is due through January 2014. Also, we have approximately $894.0 million in contractual obligations, other than long-term debt, due through December 31, 2013. We expect to fund these obligations through our existing liquidity, future financing arrangements andcash flows from operations. As of December 31, 2012, our liquidity was $2.2 billion, consisting of approximately $194.9 million in cash and cash equivalents and $2.0 billion available under our unsecured credit facilities. Of the $2.0 billion available under our unsecured credit facilities, $1.5 billion is from revolving credit facilities and €365.0 million (or $0.5 billion based on the exchange rate at December 31, 2012) is from an unsecured Euro-denominated term loan facility. We have the ability to draw on the €365.0 million facility at any time on or prior to June 30, 2013. During 2013, it is likely we will secure additional liquidity in the capital and/or credit markets as part of our refinancing strategy for our upcoming 2013 and 2014, maturities. In addition, we may elect to fund our contractual obligations through other means if opportunities arise. As of December 31, 2012, we have on order two Quantum-class ships and onetwo Oasis-class ship. Eachships each of the Quantum-class ships havewhich has committed unsecured bank financing arrangements which include sovereign financing guarantees. The agreement Refer to Note 15. Oasis-class ship is subject€745.0 million 5.625% unsecured senior notes with proceeds from our $380.0 million unsecured term loan facility and our revolving credit facilities and we amended and restated our €365.0 million unsecured term loan due July 2017 primarily to certain closing conditionsreduce the margin on the facility. Additionally, in March 2014, we amended our unsecured term loans for Oasis of the Seas and is expectedAllure of the Seas primarily to become effectivereduce the margins on those facilities and eliminate the lenders' option to exit those facilities in 2015 and 2017, respectively.first quartercapacity of 2013.our current available credit facilities and our current and anticipated financing arrangements, as described above, will be adequate to meet our capital expenditures and debt repayments over the next twelve-month period.continueimplemented a broad profitability improvement program with initiatives aimed at improving our returns on invested capital. One of those initiatives, commenced in the third quarter of 2013, relates to realizing economies of scale and improving service delivery to our travel partners and guests by restructuring and consolidating our global sales, marketing and general and administrative structure. A second initiative, commenced in the fourth quarter of 2013, relates to Pullmantur’s focus on ensuring adequateits cruise business and expansion in Latin America. During 2014, we incurred approximately $30 million in cash outlays to implement these initiatives and liquidity. we do not expect any further cash outlays to be significant.are focused on cost efficiency andalso continue to implement cost containment initiatives including a number of initiatives to reduce energy consumption and, by extension, fuel costs. These include the design of more fuel efficient ships and the implementation of other hardware and energy efficiencies."Applicable Group"“Applicable Group”) acquires ownership of more than 33% of our common stock and the Applicable Group owns less of our common stock than such person, or (ii) subject to certain exceptions, during any 24-month period, a majority of the Board is no longer comprised of individuals who were members of the Board on the first day of such period, we may be obligated to prepay indebtedness outstanding under the majority of our credit facilities, which we may be unable to replace on similar terms. Certain of our outstanding debt securities also contain change of control provisions that would be triggered by the acquisition of greater than 50% of our common stock by a person other than a member of the Applicable Group coupled with a ratings downgrade. If this were to occur, it would have an adverse impact on our liquidity and operations.$5.6$6.2 billion, a fixed charge coverage ratio of at least 1.25x and limit our net debt-to-capital ratio to no more than 62.5%. The fixed charge coverage ratio is calculated by dividing net cash from operations for the past four quarters by the sum of dividend payments plus scheduled principal debt payments in excess of any new financings for the past four quarters. Our minimum net worth and maximum net debt-to-capital calculationsaccumulatedAccumulated other comprehensive (loss) income ontotalTotal shareholders' equity. We are well in excess of all debtfinancial covenant requirements as of December 31, 2012.2014. The specific covenants and related definitions can be found in the applicable debt agreements, the majority of which have been previously filed with the Securities and Exchange Commission. Weand paida cash dividendsdividend on our common stock of $0.10$0.30 per share which was paid in the first quarter of 2015. We declared a cash dividend on our common stock of $0.30 per share during eachthe third quarter of 2014 which was paid in the fourth quarter of 2014. During the first and second quarters of 20122014, we declared and $0.12paid a cash dividend on our common stock of $0.25 per share. During the first quarter of 2014, we also paid a cash dividend on our common stock of $0.25 per share which was declared during eachthe fourth quarter of the third and fourth quarters of 2012.2013.General13.14. Fair Value Measurementsand Derivative Instrumentsto our consolidated financial statements under Item 8.Financial Statements and Supplementary Data.)payments, and our operating lease forBrilliance of the Seas.payments. At December 31, 2012,2014, approximately 45.8%28.5% of our long-term debt was effectively fixed as compared to 40%34.6% as of December 31, 2011.2013. We use interest rate swap agreements to modify our exposure to interest rate movements and to manage our interest expense and rent expense.fixed ratefixed-rate debt is the potential increase in fair value resulting from a decrease in interest rates. We use interest rate swap agreements that effectively convert a portion of our fixed-rate debt to a floating-rate basis to manage this risk. At December 31, 20122014 and December 31, 2011,2013, we maintained interest rate swap agreements on the $420.0 million fixed ratefixed-rate portion of ourOasis of the Seas unsecured amortizing term loan.loan and on the $650.0 million unsecured senior notes due 2022. The interest rate swap agreements on Oasis of the Seas debt effectively changed the interest rate on the balance of the unsecured term loan, which was $315.0$245.0 million as of December 31, 2012,2014, from a fixed rate of 5.41% to a LIBOR-based floating rate equal to LIBOR plus 3.87%, currently approximately 4.42%4.20%. The interest rate swap agreements on the $650.0 million unsecured senior notes effectively changed the interest rate of the unsecured senior notes from a fixed rate of 5.25% to a LIBOR-based floating rate equal to LIBOR plus 3.63%, currently approximately 3.86%. These interest rate swap agreements are accounted for as fair value hedges. In addition, during 2012, we terminated our interest rate swap agreements that effectively changed $350.0 million of debt with a fixed rate of 7.25% to LIBOR-based floating rate debt in order to manage our percentage of fixed rate debt. Terminating the swaps did not result in a gain or loss. Upon termination of these swaps, we received net cash proceeds of approximately $60.6 million. A $60.1 million increase to the carrying value of the debt is being amortized to reduce interest expense over the remaining life of the debt.fixed ratefixed-rate debt at December 31, 20122014 was $4.5$2.1 billion, using quoted market prices, where available, or using the present value of expected future cash flows which incorporates risk profile. The fair value of our fixed to floating interest rate swap agreements was estimated to be an asseta liability of $5.7$22.3 million as of December 31, 2012,2014, based on the present value of expected future cash flows. A hypothetical one percentage point decrease in interest rates at December 31, 20122014 would increase the fair value of our hedged and unhedged long-term fixed ratefixed-rate debt by approximately $51.5$96.4 million net of anand would increase in the fair value of the associatedour fixed to floating interest rate swap agreements.floating ratefloating-rate debt is the potential increase in interest expense from an increase in interest rates. We use interest rate swap agreements that effectively convert a portion of our floating-rate debt to a fixed-rate basis to manage this risk. A hypothetical one percentage point increase in interest rates would increase our forecasted 20132015 interest expense by$31.6$48.4 million, assuming no change in foreign currency exchange rates.20122014 and December 31, 2011,2013, we maintained forward-starting interest rate swap agreements that beginning April 2013 effectively convert the interest rate on approximately $627.2 million of theCelebrity Reflection unsecured amortizing term loan balance from LIBOR plus 0.40% to a fixed-rate (including applicable margin) of 2.85% through the term of the loan. These interest rate swap agreements are accounted for as cash flow hedges. In addition, during 2012, we entered into forward-starting interest rate swap agreements that hedge the anticipated unsecured amortizing term loansloan that will finance our purchase ofQuantum of the Seas andAnthem of the Seas. Forward-starting interest rate swaps hedging theQuantum of the Seas loan will effectively convert the interest rate for $735.0 million of the anticipated loan balance from LIBOR plus 1.30% to a fixed rate of 3.74% (inclusive of margin) beginning in October 2014. Forward-starting interest rate swaps hedging theAnthem of the Seas loan will effectively convert the interest rate for $725.0 million of the anticipated loan balance from LIBOR plus 1.30% to a fixed rate of 3.86% (inclusive of margin) beginning$55.5$47.5 million as of December 31, 20122014 based on the present value of expected future cash flows. Market risk associated with our operating lease forBrilliance of the Seas is the potential increase in rent expense from an increase in sterling LIBOR rates. A hypothetical one percentage point increase in sterling LIBOR rates would increase our forecasted 2013 rent expense by approximately $2.7 million, based on the exchange rateIn addition, at December 31, 2012.2014 and December 31, 2013, we maintained interest rate swap agreements on our euroEuros, our foreign currency denominated debt and our growing international business operations. We enter into foreign currency forward contracts, collar options and cross currencycross-currency swap agreements to manage portions of the exposure to movements in foreign currency exchange rates.20122014, of our euro-denominatedEuro-denominated forward contracts associated with our ship construction contracts was an asseta liability of $4.1$182.2 million, based on the present value of expected future cash flows. As of December 31, 2012,2014, the aggregate cost of our ships on order was approximately $3.6$5.0 billion, of which we had deposited $131.0$394.4 million as of such date. Approximately 49.7%28.8% and 43.3%36.3% of the aggregate cost of the ships under construction was exposed to fluctuations in the euroEuro exchange rate at December 31, 20122014 and December 31, 2011,2013, respectively. A hypothetical 10% strengthening of the euroEuro as of December 31, 2012,2014, assuming no changes in comparative interest rates, would result in a $205.3$188.4 million increase in the United States dollar cost of the foreign currency denominated ship construction contracts exposed to fluctuations in the euroEuro exchange rate. growing international business operations subject us to an increasing level of foreign currency exchange risk. We transact business in many different foreign currencies and maintain investments in foreign operations which may expose us to financial market risk resulting from fluctuations in foreign currency exchange rates. Movements in foreign currency exchange rates may affect the translated value of our earnings and cash flows. We manage most of this exposure on a consolidated basis, which allows us to take advantage of any natural offsets. Therefore, weakness in one particular currency might be offset by strengths in other currencies over time. Our earnings are also subject to volatility resulting from the remeasurement of net monetary assets and liabilities denominated in a currency other than the United States dollar. To mitigate our foreign currency exchange rate exposure resulting from our net foreign currency denominated monetary assets and liabilities, we denominate a portion of our debt in our subsidiaries' and investments' functional currencies, enter into foreign currency forward contracts and we have historically utilized cross currency swap agreements. During 2012, we terminated a portion of our foreign currency forward contracts forCelebrity Reflection because their maturity dates were not aligned with the ship's delivery date. The terminatedcontracts were designated as cash flow hedges. Simultaneously, we entered into new foreign currency forward contracts that were aligned with the ship's delivery date and designated the contracts as cash flow hedges. We effected the termination of the contracts by entering into offsetting foreign currency forward contracts. Neither the original nor the offsetting foreign currency forward contracts were designated as hedging instruments. As a result, subsequent changes in the fair value of the original and offsetting foreign currency forward contracts were recognized in earnings immediately and were reported withinother income (expense) in our consolidated statements of comprehensive income (loss). We deferred a loss of $10.8 million withinaccumulated other comprehensive income (loss) and a gain of $1.7 million withinproperty and equipment, net for the terminated contracts. During the fourth quarter of 2012, we began recognition of the net deferred loss of $9.1 million as an increase todepreciation expense over the estimated useful life of the vessel. During 2012, we entered into foreign currency collar options to hedge a portion of our foreign currency exposure on the construction contract price forAnthem of the Seas. These options mature in April 2015 and have an estimated fair value of $9.0 million at December 31, 2012. In addition, to further increase the portion of our €1.0 billion debt that we utilize as a net investment hedge of our euro denominated investments in foreign operations, we terminated our cross currency swap agreements that effectively changed €150.0 million of our €1.0 billion unsecured senior notes which bear interest at a fixed rate of 5.625%, to $190.9 million with a fixed rate of 6.68%. Upon termination of these swaps, we received net cash proceeds of approximately $9.1 million and deferred a loss of $2.6 million withinaccumulated other comprehensive income (loss) which we will recognize withininterest expense, net of capitalized interest over the remaining life of the debt.subsidiaries'subsidiaries’ and investments'investments’ functional currencies and designating it as a hedge of these subsidiaries and investments. We had assigneddesignated debt as a hedge of our net investments in Pullmantur and TUI Cruises of approximately €481.7€139.4 million and €665.0€544.9 million, or approximately $635.1$168.7 million and $863.2$750.8 million, through December 31, 20122014 and 2011, respectively. Accordingly, we have included approximately $10.1 million of foreign-currency transaction losses in the foreign currency translation adjustment component ofaccumulated other comprehensive income (loss) at December 31, 2012.2013, respectively. A hypothetical 10% increase or decrease in the December 31, 2012 euro2014 Euro exchange rate would increase or decrease the fair value of our assigned debt by $68.0$16.9 million, which would be offset by a corresponding decrease or increase in the United States dollar value of our net investment. Furthermore, during 2014, we entered into foreign currency forward contracts and designated them as hedges of a portion of our net investments in Pullmantur and TUI Cruises of €415.6 million or approximately $502.9 million, based on the exchange rate at December 31, 2014. These forward currency contracts mature in April 2016 and their estimated fair value was an asset of $64.0 million as of December 31, 2014. Accordingly, we have included approximately $45.0 million and2012,2014, we maintained an average of approximately $334.7$474.0 million of these foreign currency forward contracts. These instruments are not designated as hedging instruments. ForeignIn 2014, 2013 and 2012 changes in the fair value of the foreign currency forward contractcontracts were (losses) gains of approximately ($48.6) million, ($19.3) million and $7.7 million, are recognized in earnings withinother income (expense) in our consolidated statements of comprehensive income (loss). This gainrespectively, which offset exchange lossesgains (losses) arising from the remeasurement of monetary assets and liabilities denominated in foreign currencies in those same years of $11.8$49.5 million, $13.4 million and ($11.8) million, respectively. These changes were recognized in 2012.earnings within 2012, 10.1% in 2011 and 9.6% in 2010.2012. We use a range of instruments including fuel swap agreements and fuel call options to mitigate the financial impact of fluctuations in fuel prices. During 2012, we terminated our remaining fuel call options by sellingoffsetting fuel call options in order to adjust the hedged percentage of our projected fuel requirements. Upon termination, we received net cash proceeds of approximately $10.7 million. Subsequent to the termination, neither the original nor the offsetting fuel call options were designated as hedging instruments and changes in their fair value were recognized in earnings immediately and were reported inother income (expense) in our consolidated statements of comprehensive income (loss).2012,2014, we had fuel swap agreements to pay fixed prices for fuel with an aggregate notional amount of approximately $1.1$1.4 billion, maturing through 2016.2018. The fuel swap agreements represent 55% of our projected 2013 fuel requirements, 45% of our projected 2014 fuel requirements, 25%represented 58% of our projected 2015 fuel requirements, and 7%55% of our projected 2016 fuel requirements, 35% of our projected 2017 fuel requirements and 15% of our projected 2018 fuel requirements. These fuel swap agreements are accounted for as cash flow hedges. The estimated fair value of these contracts at December 31, 20122014 was estimated to be an asseta liability of $48.6$497.8 million. We estimate that a hypothetical 10% increase in our weighted-average fuel price from that experienced during the year ended December 31, 20122014 would increase our forecasted 20132015 fuel cost by approximately $35.8$22.7 million, net of the impact of fuel swap agreements. None. and Vice Chairman and Chief Financial Officer, conducted an evaluation of the effectiveness of our disclosure controls and procedures, as such term is defined in Exchange Act Rule 13a-15(e), as of the end of the period covered by this report. Based upon such evaluation, our Chairman and Chief Executive Officer and Vice Chairman and Chief Financial Officer concluded that those controls and procedures are effective to provide reasonable assurance that information required to be disclosed by us in the reports that we file or submit under the Exchange Act is accumulated and communicated to management, including our Chairman and Chief Executive Officer and our Vice Chairman and Chief Financial Officer, as appropriate, to allow timely decisions regarding required disclosure and are effective to provide reasonable assurance that such information is recorded, processed, summarized and reported within the time periods specified by the SEC'sSEC’s rules and forms.Vice Chairman and Chief Financial Officer, conducted an evaluation of the effectiveness of our internal control over financial reporting based on the framework inInternal Control-Integrated Framework (2013) issued by the Committee of Sponsoring Organizations ("COSO") of the Treadway Commission. Based on this evaluation, management concluded that our internal control over financial reporting was effective as of December 31, 2012.2014. The effectiveness of our internal control over financial reporting as of December 31, 20122014 has been audited by PricewaterhouseCoopers LLP, the independent registered certified public accounting firm that audited our consolidated financial statements included in this Annual Report on Form 10-K, as stated in its report, which is included herein on page F-2.ControlsControl Over Financial ReportingRulesRule 13a-15 during the quarter ended December 31, 20122014 that have materially affected, or are reasonably likely to materially affect, our internal control over financial reporting.the reasonable assurance that our controls will succeed in achieving their goals under all potential future conditions. None.(2)Financial Statement Schedules(2) Financial Statement Schedules (3)Exhibits(3) Exhibits
By:By:
/s/ BRIAN J. RICE
JASON T. LIBERTYBrian J. Rice
Jason T. Liberty Vice Chairman and Chief Financial Officer25, 201325, 2013.23, 2015./s/ RICHARD D. FAIN
/s/ BRIAN J. RICEBrian J. RiceVice Chairman andJASON T. LIBERTY
/s/ HENRY L. PUJOLand Corporate Controller(PrincipalChief Accounting Officer (Principal Accounting Officer)
**Director
**John F. Brock
Director* Director
**Director
*
Director* Gert W. Munthe
Director* * * * *By: /s/ JASON T. LIBERTY *Eyal M. Ofer
Jason T. Liberty, Director*Thomas J. PritzkerDirector*William K. ReillyDirector*Bernt ReitanDirector*Vagn O. SørensenDirector*Arne Alexander WilhelmsenDirector*By:/s/ BRIAN J. RICE Brian J. Rice,as Attorney-in-Fact10.1510.17 through 10.3210.38 represent management compensatory plans or arrangements.Exhibit Description 3.1 —Restated Articles of Incorporation of the Company, as amended (composite) (incorporated by reference to Exhibit 3.1 to the Company'sCompany’s Registration Statement on Form S-3, File No. 333-158161, filed with the Securities and Exchange Commission (the "Commission"‘‘Commission’’)) on March 23, 2009.
3.2
—Amended and Restated By-Laws of the Company (incorporated by reference to Exhibit 3.1 to the Company'sCompany’s Current Report on Form 8-K filed with the Commission on April 5, 2012)September 11, 2013).
4.1
—Indenture dated as of July 15, 1994 between the Company, as issuer, and The Bank of New York Trust Company, N.A., successor to NationsBank of Georgia, National Association, as Trustee (incorporated by reference to Exhibit 2.4 to the Company'sCompany’s 1994 Annual Report on Form 20-F, File No. 1-11884).
4.2
—Sixth Supplemental Indenture dated as of October 14, 1997 to Indenture dated as of July 15, 1994 between the Company, as issuer, and The Bank of New York Trust Company, N.A., as Trustee (incorporated by reference to Exhibit 2.11 to the Company'sCompany’s 1997 Annual Report on Form 20-F, File No. 1-11884).
4.3
—Eighth Supplemental Indenture dated as of March 16, 1998 to Indenture dated as of July 15, 1994 between the Company, as issuer, and The Bank of New York Trust Company, N.A., as Trustee (incorporated by reference to Exhibit 2.13 to the Company'sCompany’s 1997 Annual Report on Form 20-F, File No. 1-11884).
4.4—Thirteenth Supplemental Indenture dated as of November 21, 2003 to Indenture dated as of July 15, 1994 between the Company, as issuer, and The Bank of New York Trust Company, N.A., as Trustee (incorporated by reference to Exhibit 2.14 to the Company's 2003 Annual Report on Form 20-F, File No. 1-11884.)
4.44.5
—Fourteenth Supplemental Indenture dated as of June 12, 2006 to Indenture dated as of July 15, 1994 between the Company, as issuer, and The Bank of New York Trust Company, N.A., as Trustee (incorporated by reference to Exhibit 4.13 to the Company's 2006 Annual Report on Form 10-K).4.6—Fifteenth Supplemental Indenture dated as of June 12, 2006 to Indenture dated as of July 15, 1994 between the Company, as issuer, and The Bank of New York Trust Company, N.A., as Trustee (incorporated by reference to Exhibit 4.14 to the Company'sCompany’s 2006 Annual Report on Form 10-K).
4.74.5
—Form of Indenture dated as of July 31, 2006 between the Company, as issuer, and The Bank of New York Trust Company, N.A., as Trustee (incorporated by reference to Exhibit 4.1 to the Company'sCompany’s Registration Statement on Form S-3 (No. 333-136186) filed with the Commission on July 31, 2006).4.8—Indenture dated as of January 25, 2007 among the Company, as issuer, The Bank of New York, as trustee, transfer agent, principal paying agent and security registrar, and AIB/BNY Fund Management (Ireland) Limited, as Irish paying agent (incorporated by reference to Exhibit 10.1 to the Company's Current Report on Form 8-K filed with the Commission on January 26, 2007).ExhibitDescription 4.94.6 —First Supplemental Indenture dated as of July 6, 2009 between the Company, as issuer, and The Bank of New York Mellon Trust Company, N.A. (incorporated by reference to Exhibit 4.1 to the Company'sCompany’s Current Report on Form 8-K filed with the Commission on July 2, 2009).
4.104.7
—Second Supplemental Indenture dated as of November 7, 2012 between the Company, as issuer, and The Bank of New York Mellon Trust Company, N.A. (incorporated by reference to Exhibit 4.1 to the Company'sCompany’s Current Report on Form 8-K filed with the Commission on November 7, 2012).
10.1
—Amended and Restated Registration Rights Agreement dated as of July 30, 1997 among the Company, A. Wilhelmsen AS., Cruise Associates, Monument Capital Corporation, Archinav Holdings, Ltd. and Overseas Cruiseship, Inc. (incorporated by reference to Exhibit 2.20 to the Company'sCompany’s 1997 Annual Report on Form 20-F, File No. 1-11884).
10.2
—Assignment and Amendment to the US$875,000,000 Amended and Restated Credit Agreement dated as of July 15, 2011 among the Company, the various financial institutions party thereto and Citibank, N.A., as administrative agent (incorporated by reference to Exhibit 10.1 to the Company'sCompany’s Current Report on Form 8-K filed on July 19, 2011).
10.3
—US$525,000,000 Assignment and Amendment to the Credit Agreement, dated as of November 19, 2010, as amended,August 23, 2013, among the Company, the various financial institutions as are or shall become parties thereto and Nordea Bank Finland plc, New York Branch, as administrative agent for the lender parties (incorporated by reference to Exhibit 10.1 to the Company'sCompany’s Current Report on Form 8-K filed with the Commission on November 19, 2010 and Exhibit 10.9 to the Company's 2010 Annual Report on Form 10-K)August 26, 2013).
10.4—Assignment and Amendment Deed to Hull No. 679 Credit Agreement, dated as of February 17, 2012, among Celebrity Silhouette Inc., the Company and KfW IPEX-BANK GMBH, in its capacity as agent for Hermes, administrative agent and lender (incorporated by reference to Exhibit 10.5 to the Company's 2011 Annual Report on Form 10-K).
10.410.5
—Assignment and Amendment Deed to Hull No. 691 Credit Agreement, dated as of February 17, 2012, among Celebrity Solstice V Inc., the Company and KfW IPEX-BANK GMBH, in its capacity as agent for Hermes, administrative agent and lender (incorporated by reference to Exhibit 10.6 to the Company'sCompany’s 2011 Annual Report on Form 10-K).
10.610.5
—Assignment and Amendment No. 41 to Amended and Restated Credit Agreement dated as of March 26, 2012,7, 2014 among Oasis of the Seas Inc., Royal Caribbean Cruises Ltd.,Company, the various financial institutions as are parties to the Credit Agreement and BNP Paribas,PARIBAS FORTIS S.A./N.V., as administrative agent for the lenders (incorporated by reference to Exhibit 10.1 to the Company'sCompany’s Quarterly Report on Form 10-Q for the quarterly period ended March 31, 2012)2014).
10.710.6
—Assignment and Amendment No. 41 to Amended and Restated Credit Agreement dated as of March 26, 2012,7, 2014 among Allure of the Seas Inc., Royal Caribbean Cruises Ltd.,Company, the various financial institutions as are parties to the Credit Agreement and Skandinaviska Enskilda BankenSKANDINAVISKA ENSKILDA BANKEN AB, as administrative agent for the lenders (incorporated by reference to Exhibit 10.110.2 to the Company'sCompany’s Quarterly Report on Form 10-Q for the quarterly period ended March 31, 2012)2014).10.8Exhibit
Description 10.7 —Hull No. S-697 Credit Agreement, dated as of June 8, 2011, between Company, the Lenders from time to time party thereto and KfW-IPEX-Bank GmbH, as Hermes Agent, Facility Agent and Initial Mandated Lead Arranger, as amended on February 17, 2012 and May 10, 2012 (incorporated by reference to Exhibit 10.1 to the Company'sCompany’s Quarterly Report on Form 10-Q for the Quarterly Period ended June 30, 2012).ExhibitDescription 10.910.8 —Amendment Agreement in connection with the Credit Agreement in respect of Hull No. S-698, dated as of February 17, 2012, between the Company, the Lenders from time to time party thereto and KfW-IPEX-Bank GmbH, as Hermes Agent, Facility Agent and Initial Mandated Lead Arranger (incorporated by reference to Exhibit 10.10 to the Company'sCompany’s 2011 Annual Report on Form 10-K).
10.1010.9
— Amendment and Restatement Agreement dated as of April 15, 2014 in respect of a Facility Agreement dated as of July 9, 2013 between the Company, the Lenders from time to time party thereto, Société Générale, as Facility Agent and Mandated Lead Arranger, BNP Paribas, as Documentation Bank and Mandated Lead Arranger, and HSBC France, as Mandated Lead Arranger (incorporated by reference to Exhibit 10.1 to the Company’s Current Report on Form 8-K filed on April 21, 2014). 10.10 — Hull No. S-699 Credit Agreement, dated as of November 27, 2013, between the Company, as the Borrower, the Lenders from time to time party thereto and KfW IPEX-Bank GmbH, as Hermes Agent, Facility Agent and Initial Mandated Lead Arranger (incorporated by reference to Exhibit 10.1 to the Company’s Current Report on Form 8-K filed on December 3, 2013). 10.11 — Facility Agreement dated as of April 15, 2014 between the Company, the Lenders from time to time party thereto, The Bank of Tokyo-Mitsubishi UFJ, Ltd., as Facility Agent, Documentation Bank and Mandated Lead Arranger, Banco Santander, S.A., as COFACE Agent and Mandated Lead Arranger, and KfW IPEX-BANK GmbH, as Mandated Lead Arranger (incorporated by reference to Exhibit 10.2 to the Company’s Current Report on Form 8-K filed on April 21, 2014) 10.12 — Novation Agreement, dated as of January 30, 2015, between Frosaitomi Finance Ltd., Royal Caribbean Cruises Ltd., Citibank International Limited, Citicorp Trustee Company Limited, Citibank N.A., London Branch and the banks and financial institutions as a lender parties thereto (incorporated by reference to Exhibit 10.1 to the Company’s Current Report on Form 8-K filed on February 5, 2015) 10.13 — Office Building Lease Agreement dated July 25, 1989 between Miami-Dade County and the Company, as amended (incorporated by reference to Exhibits 10.116 and 10.117 to the Company'sCompany’s Registration Statement on Form F-1, File No. 33-46157, filed with the Commission and Exhibit 10.1 to the Company'sCompany’s Current Report on Form 8-K filed on August 5, 2011).
10.1110.14
—Office Building Lease Agreement dated January 18, 1994 between Miami-Dade County and the Company (incorporated by reference to Exhibit 2.13 to the Company'sCompany’s 1993 Annual Report on Form 20-F, File No. 1-11884 and Exhibit 10.2 to the Company'sCompany’s Current Report on Form 8-K filed on August 5, 2011).
10.1210.15
—Multi-Tenant Office Lease Agreement dated May 3, 2000, as amended through January 26, 2010, between the Company and RT Miramar II, LLC (incorporated by reference to Exhibit 4.6 to the Company'sCompany’s 2003 Annual Report on Form 20-F and Exhibit 10.17 to the Company'sCompany’s 2009 Annual Report on Form 10-K).
10.1310.16
—Lease Agreement dated January 24, 2005, as amended through March 20, 2006, between the Company and RC Springfield 2007, LLC (formerly Workstage-Oregon, LLC) (incorporated by reference to Exhibit 10.7 to the Company'sCompany’s 2004 Annual Report on Form 10-K, Exhibit 10.2 to the Company'sCompany’s Quarterly Report on Form 10-Q for the quarterly period ended June 30, 2005 and Exhibit 10.12 to the Company'sCompany’s 2007 Annual Report on Form 10-K).
10.14—Lease dated August 30, 2006 between DV3 Addlestone Limited, RCL Investments Ltd. (formerly Harmony Investments (Global) Limited) and the Company (incorporated by reference to Exhibit 10.12 to the Company's 2006 Annual Report on Form 10-K).
10.1710.15
—Royal Caribbean Cruises Ltd. 2000 Stock Award Plan, as amended and restated through September 18, 2006 (incorporated by reference to Exhibit 10.1 to the Company'sCompany’s Current Report on Form 8-K filed with the Commission on December 8, 2005 and Exhibit 10.1 to the Company'sCompany’s Current Report on Form 8-K filed with the Commission on September 22, 2006).
10.1610.18
—Royal Caribbean Cruises Ltd. 2008 Equity Incentive Plan, as amended by Amendment No. 1 dated as of May 20, 2010to date (incorporated by reference to Exhibit 10.1 to the Company'sCompany’s Quarterly Report on Form 10-Q for the quarterly period ended JuneSeptember 30, 2008 and Exhibit 10.3 to the Company's Quarterly Report on Form 10-Q for the quarterly period ended June 30, 2010)2014).
10.1710.19
—Form of Royal Caribbean Cruises Ltd. 2008 Equity Incentive Plan Stock Option Award Agreement—Incentive Options (incorporated by reference to Exhibit 10.3 to the Company'sCompany’s Quarterly Report on Form 10-Q for the quarterly period ended September 30, 2008).
10.1810.20
—Form of Royal Caribbean Cruises Ltd. 2008 Equity Incentive Plan Stock Option Award Agreement—Nonqualified shares (incorporated by reference to Exhibit 10.4 to the Company'sCompany’s Quarterly Report on Form 10-Q for the quarterly period ended September 30, 2008).
10.19Exhibit
Description10.21 —Form of Royal Caribbean Cruises Ltd. 2008 Equity Incentive Plan Restricted Stock Unit Agreement for grants made in 2011, 2012, 2013 and December 2014 (incorporated by reference to Exhibit 10.5 to the Company'sCompany’s Quarterly Report on Form 10-Q for the quarterly period ended September 30, 2008).ExhibitDescription 10.2010.22 — Form of Royal Caribbean Cruises Ltd. 2008 Equity Incentive Plan Restricted Stock Unit Agreement for grants made in February 2014 and 2015 (incorporated by reference to Exhibit 10.23 to the Company’s 2013 Annual Report on Form 10-K). 10.23 —Form of Royal Caribbean Cruises Ltd. 2008 Equity Incentive Plan Restricted Stock Unit Agreement—Director Grants (incorporated by reference to Exhibit 10.31 to the Company'sCompany’s 2010 Annual Report on Form 10-K).
10.2110.24
—Form of Royal Caribbean Cruises Ltd. 2008 Equity Incentive Plan Performance Share Agreement for grants made in 2012 and 2013 (incorporated by reference to Exhibit 10.1 to the Company's Current Report on Form 8-K filed with the Commission on February 22, 2012).
10.2210.25
— Form of Royal Caribbean Cruises Ltd. 2008 Equity Incentive Plan Performance Share Agreement for grants made in February 2014 (incorporated by reference to Exhibit 10.23 to the Company’s 2013 Annual Report on Form 10-K). 10.26 — Form of Royal Caribbean Cruises Ltd. 2008 Equity Incentive Plan Performance Share Agreement for grants made in December 2014.* 10.27 — Form of Royal Caribbean Cruises Ltd. 2008 Equity Incentive Plan Performance Share Agreement for grants made in February 2015.* 10.28 — Employment Agreement dated December 31, 2012 between the Company and Richard D. Fain*Fain (incorporated by reference to Exhibit 10.22 to the Company’s 2012 Annual Report on Form 10-K).
10.2310.29
—Employment Agreement dated December 31, 2012 between the Company and Adam M. Goldstein*Goldstein (incorporated by reference to Exhibit 10.23 to the Company’s 2012 Annual Report on Form 10-K).
10.2410.30
—Employment Agreement dated December 31, 2012 between Celebrity Cruises Inc. and Michael W. Bayley*Bayley (incorporated by reference to Exhibit 10.24 to the Company’s 2012 Annual Report on Form 10-K).
10.25—Employment Agreement dated December 31, 2012 between the Company and Brian J. Rice*
10.3110.26
—Employment Agreement dated December 31, 2012 between the Company and Harri U. Kulovaara*10.27—Description of consulting arrangement between the Company and William K. ReillyKulovaara (incorporated by reference to Exhibit 10.1610.26 to the Company's 2004Company’s 2012 Annual Report on Form 10-K).
10.2810.32
—Royal Caribbean Cruises Ltd. Executive Short-Term Bonus Plan Employment Agreement dated as of September 12, 2008, as amendedMay 20, 2013 between the Company and Jason T. Liberty (incorporated by reference to Exhibit 10.510.2 to the Company'sCompany’s Quarterly Report on Form 10-Q for the quarterly period ended SeptemberJune 30, 2011)2013).
10.2910.33
— Form of First Amendment to Employment Agreement dated as of February 6, 2015 (entered into between the Company and each of Messrs. Fain, Goldstein, Bayley, Kulovaara and Liberty).* 10.34 — Royal Caribbean Cruises Ltd. Executive Short-Term Bonus Plan, as amended to date (incorporated by reference to Exhibit 10.1 to the Company’s Quarterly Report on Form 10-Q for the quarterly period ended June 30, 2014). 10.35 — Royal Caribbean Cruises Ltd. et. al. Non Qualified Deferred Compensation Plan, formerly Royal Caribbean Cruises Ltd. et. al. Non Qualified 401(k) Plan, as amended through November 11, 2008 (incorporated by reference to Exhibit 10.2 to the Company'sCompany’s Current Report on Form 8-K filed with the Commission on December 8, 2005, Exhibit 10.29 to the Company'sCompany’s 2006 Annual Report on Form 10-K, Exhibit 10.28 to the Company'sCompany’s 2007 Annual Report on Form 10-K, Exhibit 10.29 to the Company'sCompany’s 2007 Annual Report on Form 10-K and Exhibit 10.36 to the Company'sCompany’s 2008 Annual Report on Form 10-K).
10.3010.36
—Royal Caribbean Cruises Ltd. Supplemental Executive Retirement Plan as amended through November 11, 2008 (incorporated by reference to Exhibit 10.3 to the Company'sCompany’s Current Report on Form 8-K filed with the Commission on December 8, 2005, Exhibit 10.31 to the Company'sCompany’s 2006 Annual Report on Form 10-K, Exhibit 10.31 to the Company'sCompany’s 2007 Annual Report on Form 10-K, Exhibit 10.1 to the Company'sCompany’s Quarterly Report on Form 10-Q for the quarterly period ended September 30, 2008 and Exhibit 10.38 to the Company'sCompany’s 2008 Annual Report on Form 10-K).
10.3110.37
—Summary of Royal Caribbean Cruises Ltd. Board of Directors Compensation (incorporated by reference to Exhibit 10.29 to the Company's 2010 Annual Report on Form 10-K).Compensation.*
10.3210.38
—Cruise Policy effective as of October 3, 2007 for Members of the Board of Directors of the Company (incorporated by reference to Exhibit 10.210.35 to the Company's QuarterlyCompany’s 2013 Annual Report on Form 10-Q for the quarterly period ended September 30, 2007)10-K).12.1Exhibit
Description 12.1 —Statement regarding computation of fixed charge coverage ratio* 21.1—List of Subsidiaries*ExhibitDescription 23.121.1 — List of Subsidiaries* 23.1 —Consent of PricewaterhouseCoopers LLP, an independent registered certified public accounting firm*
23.2
—Consent of Drinker Biddle & Reath LLP*
24.1
—Power of Attorney*
31.1
—Certification of Richard D. Fain required by Rule 13a-14(a) or Rule 15d-14(a) of the Securities Exchange Act of 1934*
31.2
—Certification of Brian J. RiceJason T. Liberty required by Rule 13a-14(a) or Rule 15d-14(a) of the Securities Exchange Act of 1934*
32.1
—Certification of Richard D. Fain and Brian J. RiceJason T. Liberty pursuant to Section 1350 of Chapter 63 of Title 18 of the United States Code*** Filed herewith ** Furnished herewith *Filed herewith**Furnished herewith101 —The following financial statements from Royal Caribbean Cruises Ltd.'s Annual Report on Form 10-K for the year ended December 31, 2012,2014, as filed with the SEC on February 25, 2013,23, 2015, formatted in XBRL, as follows:
(i)(i)
the Consolidated Statements of Comprehensive Income (Loss) for the years ended December 31, 2012, 20112014, 2013 and 2010;2012; (ii) the Consolidated Balance Sheets at December 31, 20122014 and 2011;2013; (iii) the Consolidated Statements of Cash Flows for the years ended December 31, 2012, 20112014, 2013 and 2010;2012; (iv) the Consolidated Statements of Shareholders' Equity for the years ended December 31, 2012, 20112014, 2013 and 2010;2012; and (v) the Notes to the Consolidated Financial Statements, tagged in summary and detail. Page and cash flows present fairly, in all material respects, the financial position of Royal Caribbean Cruises Ltd. and its subsidiaries at December 31, 20122014 and 2011,2013, and the results of their operations and their cash flows for each of the three years in the period ended December 31, 20122014 in conformity with accounting principles generally accepted in the United States of America. Also in our opinion, the Company maintained, in all material respects, effective internal control over financial reporting as of December 31, 2012,2014, based on criteria established inInternal Control—Control - Integrated Framework (2013) issued by the Committee of Sponsoring Organizations of the Treadway Commission (COSO). The Company's management is responsible for these financial statements, for maintaining effective internal control over financial reporting and for its assessment of the effectiveness of internal control over financial reporting, included in Management's Report on Internal Control Over Financial Reporting appearing under Item 9A. Our responsibility is to express opinions on these financial statements and on the Company's internal control over financial reporting based on our integrated audits. We conducted our audits in accordance with the standards of the Public Company Accounting Oversight Board (United States). Those standards require that we plan and perform the audits to obtain reasonable assurance about whether the financial statements are free of material misstatement and whether effective internal control over financial reporting was maintained in all material respects. Our audits of the financial statements included examining, on a test basis, evidence supporting the amounts and disclosures in the financial statements, assessing the accounting principles used and significant estimates made by management, and evaluating the overall financial statement presentation. Our audit of internal control over financial reporting included obtaining an understanding of internal control over financial reporting, assessing the risk that a material weakness exists, and testing and evaluating the design and operating effectiveness of internal control based on the assessed risk. Our audits also included performing such other procedures as we considered necessary in the circumstances. We believe that our audits provide a reasonable basis for our opinions.25, 201323, 2015 Year Ended December 31, Year Ended December 31, 2012 2011 2010 2014 2013 2012 (in thousands, except per share data) (in thousands, except per share data) $ 5,594,595 $ 5,525,904 $ 4,908,644 $ 5,893,847 $ 5,722,718 $ 5,594,595 2,093,429 2,011,359 1,843,860 2,180,008 2,237,176 2,093,429 7,688,024 7,537,263 6,752,504 8,073,855 7,959,894 7,688,024 1,289,255 1,299,713 1,175,522 1,372,785 1,314,595 1,289,255 529,453 535,501 480,564 582,750 568,615 529,453 828,198 825,676 767,586 847,641 841,737 828,198 449,649 424,308 388,205 478,130 469,653 449,649 909,691 764,758 646,998 947,391 924,414 909,691 1,151,188 1,092,651 999,201 1,077,584 1,186,256 1,151,188 5,157,434 4,942,607 4,458,076 5,306,281 5,305,270 5,157,434 1,011,543 960,602 848,079 1,048,952 1,044,819 1,011,543 730,493 702,426 643,716 772,445 754,711 730,493 385,444 — — — — 385,444 7,284,914 6,605,635 5,949,871 Restructuring and related impairment charges 4,318 56,946 — 7,131,996 7,161,746 7,284,914 403,110 931,628 802,633 941,859 798,148 403,110 21,331 25,318 9,243 10,344 13,898 21,331 (355,785 ) (382,416 ) (371,207 ) (258,299 ) (332,422 ) (355,785 ) (7,501 ) — — — (4,206 ) (7,501 ) (42,868 ) 32,891 74,984 (384,823 ) (324,207 ) (286,980 ) Other income (expense) (including $33.5 million deferred tax benefit related to the reversal of a valuation allowance in 2014 and ($28.5) million net deferred tax expense related to impairments in 2012) 70,242 (1,726 ) (42,868 ) (177,713 ) (324,456 ) (384,823 ) $ 18,287 $ 607,421 $ 515,653 $ 764,146 $ 473,692 $ 18,287 $ 0.08 $ 2.80 $ 2.40 $ 3.45 $ 2.16 $ 0.08 $ 0.08 $ 2.77 $ 2.37 $ 3.43 $ 2.14 $ 0.08 Comprehensive (Loss) Income
$
18,287
$
607,421
$
515,653 $ 764,146 $ 473,692 $ 18,287 Other comprehensive (loss) income: (2,764 ) (18,200 ) (29,065 ) (26,102 ) 1,529 (2,764 ) (4,567 ) (6,698 ) (5,422 ) (7,213 ) 10,829 (4,567 ) (51,247 ) (76,106 ) (123,180 ) (58,578 ) (101,004 ) (157,667 ) (Loss) gain on cash flow derivative hedges (869,350 ) 127,829 (51,247 ) Total other comprehensive (loss) income (902,665 ) 140,187 (58,578 ) $ (40,291 ) $ 506,417 $ 357,986 $ (138,519 ) $ 613,879 $ (40,291 )
F-3 As of December 31, As of December 31, 2012 2011 2014 2013 (in thousands, except share data) (in thousands, except share data) $ 194,855 $ 262,186 $ 189,241 $ 204,687 281,421 292,447 261,392 259,746 146,295 144,553 123,490 151,244 207,662 185,460 226,960 252,852 57,827 84,642 — 87,845 888,060 969,288 801,083 956,374 17,451,034 16,934,817 18,235,568 17,517,752 432,975 746,537 420,542 439,231 1,055,861 1,153,763 1,255,997 1,159,590 $ 19,827,930 $ 19,804,405 $ 20,713,190 $ 20,072,947 $ 1,519,483 $ 638,891 $ 799,630 $ 1,563,378 351,587 304,623 331,505 372,226 106,366 123,853 49,074 103,025 541,722 564,272 635,138 539,414 Derivative financial instruments 266,986 24,288 1,546,993 1,436,003 1,766,914 1,664,679 4,066,151 3,067,642 3,849,247 4,267,010 6,970,464 7,856,962 7,644,318 6,511,426 482,566 471,978 935,266 486,246 Commitments and contingencies (Note 15) — — — — 2,291 2,276 Common stock ($0.01 par value; 500,000,000 shares authorized; 233,106,019 and 230,782,315 shares issued, December 31, 2014 and December 31, 2013, respectively) 2,331 2,308 3,109,887 3,071,759 3,253,552 3,159,038 5,744,791 5,823,430 6,575,248 6,054,952 (134,516 ) (75,938 ) (413,704 ) (413,704 ) Accumulated other comprehensive (loss) income (896,994 ) 5,671 Treasury stock (13,808,683 and 10,308,683 common shares at cost, December 31, 2014 and December 31, 2013, respectively) (649,778 ) (413,704 ) 8,308,749 8,407,823 8,284,359 8,808,265 $ 20,713,190 $ 20,072,947 $ 19,827,930 $ 19,804,405
F-4 Year Ended December 31, Year Ended December 31, 2012 2011 2010 2014 2013 2012 (in thousands) (in thousands) $ 18,287 $ 607,421 $ 515,653 $ 764,146 $ 473,692 $ 18,287 730,493 702,426 643,716 772,445 754,711 730,493 385,444 — — — — 385,444 28,488 — — 5,651 (18,920 ) 2,826 Restructuring related impairments — 33,514 — Net deferred income tax (benefit) expense (44,437 ) (1,842 ) 28,939 Loss on sale of ship 17,401 — — Loss (gain) on derivative instruments not designated as hedges 48,637 19,287 (2,014 ) 7,501 — — — 4,206 7,501 8,026 87,872 146,498 100,095 95,401 8,026 (1,645 ) (18,423 ) (20,274 ) (1,614 ) (17,052 ) (10,954 ) 36,602 56,755 (15,507 ) (15,786 ) (28,553 ) 13,359 33,060 25,318 71,969 Decrease (increase) in inventories 26,254 (4,321 ) (1,645 ) Decrease (increase) in prepaid expenses and other assets 41,077 (22,657 ) (1,614 ) (Decrease) increase in accounts payable (40,651 ) 18,957 36,602 Decrease in accrued interest (53,951 ) (3,341 ) (15,786 ) Increase (decrease) in accrued expenses and other liabilities 70,565 (6,714 ) 33,060 103,733 19,482 135,975 14,885 37,077 103,733 69,684 12,200 172,993 — — 69,684 — 21,147 — Dividends received from unconsolidated affiliates 5,814 5,093 — (26,190 ) 6,066 6,765 21,479 9,005 (18,976 ) 1,381,734 1,455,739 1,663,019 1,743,759 1,412,068 1,381,734 (1,291,499 ) (1,173,626 ) (2,187,189 ) (1,811,398 ) (763,777 ) (1,291,499 ) (10,886 ) 16,307 (91,325 ) — (110,660 ) — 23,512 — — Cash paid on settlement of derivative financial instruments (68,098 ) (17,338 ) (10,886 ) Investments in and loans to unconsolidated affiliates (188,595 ) (70,626 ) — Cash received on loan to unconsolidated affiliate 76,167 23,372 23,512 9,811 345,000 — 220,000 — 9,811 5,739 (1,586 ) (9,404 ) 1,546 3,831 5,739 (1,263,323 ) (924,565 ) (2,287,918 ) Net cash used in investing activities (1,770,378 ) (824,538 ) (1,263,323 ) 2,558,474 1,578,368 2,420,262 4,153,958 2,449,464 2,558,474 (75,839 ) (84,381 ) (90,782 ) (72,974 ) (57,622 ) (75,839 ) (2,216,701 ) (2,179,046 ) (1,600,265 ) (3,724,218 ) (2,856,481 ) (2,561,290 ) (344,589 ) — — Purchase of treasury stock (236,074 ) — — (117,707 ) (21,707 ) — (198,952 ) (143,629 ) (117,707 ) 15,146 19,463 26,158 70,879 30,125 15,146 Cash received on settlement of derivative financial instruments 22,835 — — 1,599 10,788 1,587 2,026 1,517 1,599 (179,617 ) (676,515 ) 756,960 Net cash provided by (used in) financing activities 17,480 (576,626 ) (179,617 ) (6,125 ) (12,402 ) 3,249 (6,307 ) (1,072 ) (6,125 )
(67,331
)
(157,743
)
135,310
262,186
419,929
284,619 $ 194,855 $ 262,186 $ 419,929 $ 341,047 $ 360,892 $ 297,477
F-5Net (decrease) increase in cash and cash equivalents (15,446 ) 9,832 (67,331 ) Cash and cash equivalents at beginning of year 204,687 194,855 262,186 Cash and cash equivalents at end of year $ 189,241 $ 204,687 $ 194,855 Supplemental Disclosures Cash paid during the year for: Interest, net of amount capitalized $ 276,933 $ 319,476 $ 341,047 Non-Cash Investing Activities Purchase of property and equipment through asset trade-in $ — $ 46,375 $ — Common Stock Paid-in Capital Retained Earnings Accumulated Other Comprehensive Income (Loss) Treasury Stock Total Shareholders' Equity (in thousands) Balances at January 1, 2012 $ 2,276 $ 3,071,759 $ 5,823,430 $ (75,938 ) $ (413,704 ) $ 8,407,823 Issuance under employee related plans 15 38,128 — — — 38,143 Common Stock dividends — — (95,979 ) — — (95,979 ) — — (947 ) — — (947 ) Changes related to cash flow derivative hedges — — — (51,247 ) — (51,247 ) Change in defined benefit plans — — — (4,567 ) — (4,567 ) Foreign currency translation adjustments — — — (2,764 ) — (2,764 ) Net income — — 18,287 — — 18,287 Balances at December 31, 2012 2,291 3,109,887 5,744,791 (134,516 ) (413,704 ) 8,308,749 Issuance under employee related plans 17 49,151 — — — 49,168 Common Stock dividends — — (162,727 ) — — (162,727 ) — — (804 ) — — (804 ) Changes related to cash flow derivative hedges — — — 127,829 — 127,829 Change in defined benefit plans — — — 10,829 — 10,829 Foreign currency translation adjustments — — — 1,529 — 1,529 Net income — — 473,692 — — 473,692 Balances at December 31, 2013 2,308 3,159,038 6,054,952 5,671 (413,704 ) 8,808,265 Issuance under employee related plans 23 94,514 — — — 94,537 Common Stock dividends — — (243,550 ) — — (243,550 ) — — (300 ) — — (300 ) Changes related to cash flow derivative hedges — — — (869,350 ) — (869,350 ) Change in defined benefit plans — — — (7,213 ) — (7,213 ) Foreign currency translation adjustments — — — (26,102 ) — (26,102 ) Purchases of Treasury Stock — — — — (236,074 ) (236,074 ) Net income — — 764,146 — — 764,146 Balances at December 31, 2014 $ 2,331 $ 3,253,552 $ 6,575,248 $ (896,994 ) $ (649,778 ) $ 8,284,359 (1) Dividends declared by Pullmantur Air, S.A. to its non-controlling shareholder. (2) Dividends declared by Falmouth Land Company Limited to its non-controlling shareholder. Common Stock Paid-in Capital Retained Earnings Accumulated Other Comprehensive Income (Loss) Treasury Stock Total Shareholders' Equity (in thousands) $ 2,243 $ 2,973,495 $ 4,745,014 $ 182,733 $ (413,704 ) $ 7,489,781 19 53,635 — — — 53,654 — — (669 ) — — (669 ) — — — (123,180 ) — (123,180 ) — — — (5,422 ) — (5,422 ) — — — (29,065 ) — (29,065 ) — — 515,653 — — 515,653 $ 2,262 $ 3,027,130 $ 5,259,998 $ 25,066 $ (413,704 ) $ 7,900,752 14 44,629 — — — 44,643 — — (43,435 ) — — (43,435 ) — — (554 ) — — (554 ) — — — (76,106 ) — (76,106 ) — — — (6,698 ) — (6,698 ) — — — (18,200 ) — (18,200 ) — — 607,421 — — 607,421 $ 2,276 $ 3,071,759 $ 5,823,430 $ (75,938 ) $ (413,704 ) $ 8,407,823 15 38,128 — — — 38,143 — — (95,979 ) — — (95,979 ) — — (947 ) — — (947 ) — — — (51,247 ) — (51,247 ) — �� — — (4,567 ) — (4,567 ) — — — (2,764 ) — (2,764 ) — — 18,287 — — 18,287 $ 2,291 $ 3,109,887 $ 5,744,791 $ (134,516 ) $ (413,704 ) $ 8,308,749 (1)Dividends declared by Pullmantur Air, S.A. to its non-controlling shareholder. See Note 6.Other Assets for further information regarding Pullmantur Air, S.A.'s ownership structure.tables summarizetable summarizes activity in accumulated other comprehensive income (loss) related to derivatives designated as cash flow hedges change in defined benefit plans and the foreign currency translation adjustments (in thousands): Year Ended December 31, Year Ended December 31, 2012 2011 2010 2014 2013 2012 $ (33,258 ) $ 42,848 $ 166,028 $ 43,324 $ (84,505 ) $ (33,258 ) 58,138 70,480 (54,877 ) (903,830 ) 197,428 58,138 (109,385 ) (146,586 ) (68,303 ) $ (84,505 ) $ (33,258 ) $ 42,848 Net loss (gain) reclassified into earnings 34,480 (69,599 ) (109,385 ) Accumulated net (loss) gain on cash flow derivative hedges at end of year $ (826,026 ) $ 43,324 $ (84,505 ) Changes
related to cash
flow derivative
hedges Change in
defined
benefit plans Foreign
currency
translation
adjustments Accumulated
other
comprehensive
income (loss) $ (33,258 ) $ (30,256 ) $ (12,424 ) $ (75,938 ) (51,247 ) (4,567 ) (2,764 ) (58,578 ) $ (84,505 ) $ (34,823 ) $ (15,188 ) $ (134,516 )
F-74143 ships as of December 31, 2012.2014. Our ships operate on a selection of worldwide itineraries that call on approximately 455480 destinations on all seven continents.its wholly-owned subsidiary, CDF Croisières de France on a two-month lag to allow for more timely preparation of our consolidated financial statements. On March 31, 2014, Pullmantur sold the majority of its interest in its non-core businesses. These non-core businesses included Pullmantur’s land-based tour operations, travel agency and 49% interest in its air business. See Note 16. Restructuring Charges and Related Impairment Charges for further discussion on the Pullmantur sales transaction. No material events or transactions affecting Pullmantur or CDF Croisières de France have occurred during the two-month lag period of November 2012 and December 20122014 that would require disclosure or adjustment to our consolidated financial statements as of December 31, 2012, except for the impairment of Pullmantur related assets, as described in Note 3.2014.Goodwill, Note 4.Intangible Assets, Note 5.Property and Equipment and Note 12.Income Taxes.direct costscruise operating expenses of a voyage, upon completion ofvoyage.with durations(voyages of ten days or less,less) upon voyage completion while we recognized revenues and on a pro-rata basiscruise operating expenses for voyages in excess of ten days. days on a pro-rata basis. We followed this completed voyage recognition approach on our shorter voyages because the difference between prorating revenue from such voyages and recognizing such revenue at the completion of the voyage was immaterial to our consolidated financial statements. As of September 30, 2014, we changed our methodology and recognized passenger ticket revenues, revenues from onboard and other goods and services and all associated cruise operating expenses for all of our uncompleted voyages on a pro-rata basis. We believe that recognizing revenues and cruise operating expenses on a pro-rata basis for all voyages is preferable as revenues and expenses are recorded in the period in which the revenue generating activities are performed.passengerPassenger ticket revenues on a gross basis were $459.8$546.6 million, $442.9$494.2 million and $398.0$459.8 million for the years 2014, 2013 and 2012, 2011 and 2010, respectively.
InventoriesROYAL CARIBBEAN CRUISES LTD.NOTES TO THE CONSOLIDATED FINANCIAL STATEMENTS (Continued)Note 2.Summary of Significant Accounting Policies (Continued)InventoriescruiseCruise operating expenses.expenses. Liquidated damages received from shipyards as a result of the late delivery of a new ship are recorded as reductions to the cost basis of the ship.30 year30-year useful life of our newly constructed ships and 15% associated residual value are both based on the weighted-average of all major components of a ship. Our useful life and residual value estimates take into consideration the impact of anticipated technological changes, long-term cruise and vacation market conditions and historical useful lives of similarly-built ships. In addition, we take into consideration our estimates of the weighted-average useful lives of the ships' major component systems, such as hull, superstructure, main electric, engines and cabins. Depreciation for assets under capital leases is computed using the shorter of the lease term or related asset life. (See Note 5.Property and Equipment.)YearsShips Years Ships generally 30 3-20 10-40 3-5 3-30 Shorter of remaining lease term or useful life 3-30 We evaluate asset impairment in accordance with ASC 360-10-35-23 (Property, Plant and Equipment), which requires that, forFor purposes of recognition and measurement of an impairment loss, long-lived assets beare grouped with other assets and liabilities at the lowest level for which identifiable cash flows are largely independent of the cash flows of other assets and liabilities. The lowest level for which we maintain identifiable cash flows that are independent of the cash flows of other assets and liabilities is at the ship level for our ships and at the aggregated asset group level for our aircraft.ROYAL CARIBBEAN CRUISES LTD.NOTES TO THE CONSOLIDATED FINANCIAL STATEMENTS (Continued)Note 2.Summary of Significant Accounting Policies (Continued) stabilizers, thruster equipment and ballast tanks, port services such as tugs, pilotage and line handling, and freight associated with these items. We perform a detailed analysis of the various activities performed for each drydock and only defer those costs that are directly related to planned major maintenance activities necessary to maintain Class. The costs deferred are not otherwise routinely periodically performed to maintain a vessel's designed and intended operating capability. Repairs and maintenance activities are charged to expense as incurred.ofto which value has been assigned to them based on our estimates. Intangible assets that are deemed to have an indefinite life are not amortized, but are subject to an annual impairment test, or when events or circumstances dictate, more frequently. The indefinite-life intangible asset impairment test consists of a comparison of the fair value of the indefinite-life intangible asset with its carrying amount. If the carrying amount exceeds its fair value, an impairment loss is recognized in an amount equal to that excess. If the fair value exceeds its carrying amount, the indefinite-life intangible asset is not considered impaired.ROYAL CARIBBEAN CRUISES LTD.NOTES TO THE CONSOLIDATED FINANCIAL STATEMENTS (Continued)Note 2.Summary of Significant Accounting Policies (Continued)any.any, which are recorded as assets when recoverability is probable. We accrue a liability when we believe a loss is probable and the amount of loss can be reasonably estimated. Due to the inherent uncertainties related to the eventual outcome of litigation and potential insurance recoveries, it is possible that certain matters may be resolved for amounts materially different from any provisions or disclosures that we have previously made.$200.9$205.2 million, $193.7$205.8 million and $166.0$200.9 million, and brochure, production and direct mail costs were $130.4$136.7 million, $124.3$137.1 million and $104.1$130.4 million for the years 2014, 2013 and 2012, 2011 and 2010, respectively.accumulatedAccumulated other comprehensive (loss) income until the underlying hedged transactions are recognized in earnings.foreign-currencyforeign currency transaction gain or loss of our non-derivative financial instruments designated as hedges of our net investment in foreign operations and investments are recognized as a component ofaccumulatedAccumulated other comprehensive (loss) income along with the associated foreign currency translation adjustment of the foreign operation.ROYAL CARIBBEAN CRUISES LTD.NOTES TO THE CONSOLIDATED FINANCIAL STATEMENTS (Continued)Note 2.Summary of Significant Accounting Policies (Continued)immediately and reported inotherOther income (expense) in our consolidated statements of comprehensive income (loss).accumulatedAccumulated other comprehensive (loss) income, which is reflected as a separate component ofshareholders'Shareholders' equity. Exchange gains or losses arising from the remeasurement of monetary assets and liabilities denominated in a currency other than the functional currency of the entity involved are immediately included in our earnings, except for certain liabilities that have been designated to act as a hedge of a net investment in a foreign operation or investment. Exchange lossesgains (losses) were $11.8$49.5 million, $1.6$13.4 million and $9.5$(11.8) million for the years 2012, 20112014, 2013 and 2010,2012, respectively, and were recorded withinotherOther income (expense). The majority of our transactions are settled in United States dollars. Gains or losses resulting from transactions denominated in other currencies are recognized in income at each balance sheet date.withmany of which we have long-term relationships with and which have credit risks acceptable to us or where the credit risk is spread out among a large number of counterparties. In addition, our exposure under foreign currency forward contracts, foreign currency collar options, fuel call options, interest rate and fuel swap agreements was approximately $60.8 million and $135.5 million asAs of December 31, 2012 and2014, we did not have any counterparty credit risk exposure under our derivative instruments. As of December 31, 2011, respectively, and2013, we had counterparty credit risk exposure under our derivative instruments of approximately $92.5 million, which was limited to the cost of replacing the contracts in the event of non-performance by the counterparties to the contracts, all of which are currently our lending banks. We do not anticipate nonperformance by any of our significant counterparties. In addition, we have established guidelines we follow regarding credit ratings and instrument maturities that we follow to maintainROYAL CARIBBEAN CRUISES LTD.NOTES TO THE CONSOLIDATED FINANCIAL STATEMENTS (Continued)Note 2.Summary of Significant Accounting Policies (Continued) (See Note 10.Earnings Per Share.) 2012 2011 2010 2014 2013 2012 51 % 51 % 55 % 53% 52% 51% 49 % 49 % 45 % 47% 48% 49% Recently Adopted Accounting Standards In January 2012, we adopted authoritative guidance issued in 2011, the purpose of which was to achieve consistent fair value measurements and to clarify certain disclosure requirements for fair value measurements. The guidance includes clarification about when the concept of highest and best use isROYAL CARIBBEAN CRUISES LTD.NOTES TO THE CONSOLIDATED FINANCIAL STATEMENTS (Continued)Note 2.Summary of Significant Accounting Policies (Continued)applicable to fair value measurements, requires quantitative disclosures about inputs used and qualitative disclosures about the sensitivity of recurring Level 3 measurements, and requires the classification of all assets and liabilities measured at fair value in the fair value hierarchy, including those assets and liabilities which are not recorded at fair value but for which fair value is disclosed. The adoption of this guidance did not have a material impact on our consolidated financial statements. See Note 13.Fair Value Measurements and Derivative Instruments for our disclosures required under this guidance. In January 2012, we adopted authoritative guidance issued in 2011 on the presentation of comprehensive income which requires an entity to present components of net income and other comprehensive income in one continuous statement, referred to as the statement of comprehensive income, or in two separate but consecutive statements. The new guidance eliminates the option to report other comprehensive income and its components in the statement of changes in equity. We elected to present this information using one continuous statement. See our consolidated statements of comprehensive income (loss).July 2012,January 2014, amended guidance was issued regarding the periodic impairment testing of indefinite-lived intangible assets.accounting for service concession arrangements. The new guidance allowsdefines a service concession as an arrangement between a public-sector entity to assess qualitative factors to determine if it is more-likely-than-not that indefinite-lived intangible assets might be impairedgrantor and based on this assessment, whether it is necessary to performan operating entity under which the quantitative impairment tests. This guidance will be effectiveoperating entity operates and maintains the grantor’s infrastructure for our annuala specified period of time and interim impairment testsin return receives payments from the grantor and or third-party user for fiscal years beginning after September 15, 2012. The adoption of this newly issued guidance will not have an impact on our consolidated financial statements. In February 2013, amended guidance was issued over the presentation of amounts reclassified from accumulated other comprehensive income to net income. The new guidance requires an entity to present, either in a single note or parenthetically on the faceuse of the financial statements,infrastructure. The guidance prohibits the effect of significant amounts reclassifiedoperating entity from each component of accumulated other comprehensive income based on its source (e.g.,accounting for a service concession arrangement as a lease and from recording the release due to cash flow hedges from interest rate contracts)infrastructure used in the arrangement within property, plant and the income statement line items affected by the reclassification (e.g., interest income or interest expense).equipment. This guidance must be applied prospectivelyusing a modified retrospective approach and will be effective for our interim and annual reporting periods beginning after December 15, 2012.2014. Early adoption is permitted. The adoption of this newly issued guidance is not expected to have a material impact to our consolidated financial statements.addedeffective prospectively for our interim and annual reporting periods beginning after December 15, 2014. The guidance will impact the reporting and disclosures of future disposals, if any.our future filings when applicable.clarify the principles used to recognize revenue for all entities. The guidance is based on the principle that revenue should be recognized to depict the transfer of promised goods or services to customers in an amount that reflects the consideration to which the entity expects to be entitled in exchange forthe Pullmantur reporting units was as follows (in thousands): Royal
Caribbean
International Pullmantur Other Total $ 283,723 $ 473,383 $ 2,222 $ 759,328 — (14,254 ) 1,463 (12,791 ) $ 283,723 $ 459,129 $ 3,685 $ 746,537 — (319,214 ) — (319,214 ) — 5,624 28 5,652 Royal
Caribbean
International Pullmantur Total $ 283,723 $ 145,539 $ 3,713 $ 432,975 $ 287,436 $ 145,539 $ 432,975 Foreign currency translation adjustment (312 ) 6,568 6,256 Balance at December 31, 2013 $ 287,124 $ 152,107 $ 439,231 Foreign currency translation adjustment (166 ) (18,523 ) (18,689 ) Balance at December 31, 2014 $ 286,958 $ 133,584 $ 420,542 2012,2014, we performed a qualitative assessment of whether it was more-likely-than-not that our Royal Caribbean International reporting unit's fair value was less than its carrying amount before applying the two-step goodwill impairment test. The qualitative analysis included assessing the impact of certain factors such as general economic conditions, limitations on accessing capital, changes in forecasted operating results, changes in fuel prices and fluctuations in foreign exchange rates. Based on our qualitative assessment, we concluded that it was more-likely-than-not that the estimated fair value of the Royal Caribbean International reporting unit exceeded its carrying value as of December 31, 2012 and thus, we did not proceed to the two-step goodwill impairment test. No indicators of impairment exist primarily because the reporting unit's fair value has consistently exceeded its carrying value by a significant margin, its financial performance has been solid in the face of mixed economic environments and forecasts of operating results generated by the reporting unit appear sufficient to support its carrying value. In addition, during the fourth quarter of 2012, weunit.unit during the fourth quarter of 2014. We did not perform a qualitative assessment but instead proceeded directly to the two-step goodwill impairment test. We estimated the fair value of the Pullmantur reporting unit using a probability-weighted discounted cash flow model. The principal assumptions used in the discounted cash flow model are projected operating results, weighted-average cost of capital, and terminal value. Significantly impacting these assumptions are the transfer of vessels from our other cruise brands to Pullmantur. The discounted cash flow model used our 20132015 projected operating results as a base. To that base, we added future years' cash flows assuming multiple revenue and expense scenarios that reflect the impact on Pullmantur's reporting unit of different global economic environments beyond 2013.2015 on Pullmantur's reporting unit. We assigned a probability to each revenue and expense scenario. 2014 2013 Indefinite-life intangible asset—Pullmantur trademarks and trade names $ 214,112 $ 204,866 Foreign currency translation adjustment (26,074 ) 9,246 Total $ 188,038 $ 214,112 Pullmantur is a brand targeted primarily at the Spanish, Portuguese and Latin American markets and although Pullmantur has diversified its passenger sourcing over the past few years, Spain still represents Pullmantur's largest market. As previously disclosed, during 2012 European economies continued to demonstrate instabilityROYAL CARIBBEAN CRUISES LTD.NOTES TO THE CONSOLIDATED FINANCIAL STATEMENTS (Continued)Note 3.Goodwill (Continued)in light of heightened concerns over sovereign debt issues as well as the impact of proposed austerity measures on certain markets. The Spanish economy was more severely impacted than many other economies andIf there is significant uncertainty as to when it will recover. In addition, the impact of the Costa Concordia incident has had a more lingering effect than expected and the impact in future years is uncertain. These factors were identified in the past as significant risks which could lead to the impairment of Pullmantur's goodwill. More recently, the Spanish economy has progressively worsened and forecasts suggest the challenging operating environment will continue for an extended period of time. The unemployment rate in Spain reached 26% during the fourth quarter of 2012 and is expected to rise further in 2013. The International Monetary Fund, which had projected GDP growth of 1.8% a year ago, revised its 2013 GDP projections downward for Spain to a contraction of 1.3% during the fourth quarter of 2012 and further reduced it to a contraction of 1.5% in January of 2013. During the latter half of 2012 new austerity measures, such as increases to the Value Added Tax, cuts to benefits, the phasing out of exemptions and the suspension of government bonuses, were implemented by the Spanish government. We believe these austerity measures are having a larger impact on consumer confidence and discretionary spending than previously anticipated. As a result, there has been a significant deterioration in bookings from guests sourced from Spain during the 2013 WAVE season. The combination of all of these factors has caused us to negatively adjust our cash flow projections, especially our closer-in Net Yield assumptions and the expectations regarding future capacity growth for the brand. Based on our updated cash flow projections, we determined the implied fair value of goodwill for the Pullmantur reporting unit was $145.5 million and recognized an impairment charge of $319.2 million. This impairment charge was recognized in earnings during the fourth quarter of 2012 and is reported withinImpairment of Pullmantur related assets within our consolidated statements of comprehensive income (loss). There have been no goodwill impairment charges related to the Pullmantur reporting unit in prior periods. See Note 13.Fair Value Measurements and Derivative Instruments for further discussion. If the Spanish economy weakens further or recovers more slowly than contemplated or if the economies of other markets (e.g. France, Brazil, Latin America) perform worse than contemplated in our discounted cash flow model, or if there are material changes to the projected future cash flows used in the impairment analyses,analysis, especially in Net Yields or if certain transfers of vessels from our other cruise brands to the Pullmantur fleet do not take place, an additional impairment charge ofwith respect to the Pullmantur reporting unit's goodwill may be required.Note 4.Intangible Assets Intangible assets are reported inother assets in our consolidated balance sheets and consist of the following (in thousands): 2012 2011 $ 218,883 $ 225,679 (17,356 ) — 3,339 (6,796 ) $ 204,866 $ 218,883 ROYAL CARIBBEAN CRUISES LTD.NOTES TO THE CONSOLIDATED FINANCIAL STATEMENTS (Continued)Note 4.Intangible Assets (Continued) During the fourth quarter of 2012, we performed the annual impairment review of ourunit’s trademarks and trade names using a discounted cash flow model and the relief-from-royalty method. The royalty rate used is based on comparable royalty agreements in the tourism and hospitality industry. These trademarks and trade names relate to Pullmantur and we have used a discount rate comparable to the rate used in valuing the Pullmantur reporting unit in our goodwill impairment test. As described in Note 3.Goodwill, the continued deterioration of the Spanish economy caused us to negatively adjust our cash flow projections for the Pullmantur reporting unit, especially our closer-in Net Yield assumptions and the timing of future capacity growth for the brand. Based on our updated cash flow projections, we determined that the fair value of Pullmantur's trademarks and trade names no longer exceeded their carrying value. Accordingly, we recognized an impairment charge of approximately $17.4 million to write down trademarks and trade names to their fair value of $204.9 million. This impairment charge was recognized in earnings during the fourth quarter of 2012 and is reported withinImpairment of Pullmantur related assets within our consolidated statements of comprehensive income (loss). See Note 13.Fair Value Measurements and Derivative Instruments for further discussion. If the Spanish economy weakens further or recovers more slowly than contemplated or if the economies of other markets (e.g. France, Brazil, Latin America) perform worse than contemplated in our discounted cash flow model, or if there are material changes to the projected future cash flows used in the impairment analyses, especially in Net Yields, an additional impairment charge of Pullmantur's trademarks and trade names maywill likely be required.2012, 2011,2014, 2013, and 20102012 consolidated financial statements. 2012 2011 2014 2013 $ 20,855,606 $ 19,958,127 $ 21,620,336 $ 20,858,553 1,341,137 976,363 1,904,524 1,683,644 169,274 227,123 561,779 563,676 377,821 360,399 349,339 394,120 698,865 748,102 889,579 771,304 23,442,703 22,270,114 25,325,557 24,271,297 (5,991,669 ) (5,335,297 ) (7,089,989 ) (6,753,545 ) $ 18,235,568 $ 17,517,752 $ 17,451,034 $ 16,934,817 commitment fees and other associated costs. We capitalized interest costs of $13.3$28.8 million, $14.0$17.9 million and $28.1$13.3 million for the years 2014, 2013 and 2012, 2011respectively.2010, respectively. During 2012, Pullmantur deliveredOcean DreamContingencies to an unrelated third party as part of a six year bareboat charter agreement. The charter agreement provides a renewal option exercisable by thefor further information.TableDuring 2014, we sold Celebrity Century to a subsidiary of ContentsSkysea Holding International Ltd. ("Skysea Holding") for $220.0 million in cash. We agreed to charter the ROYAL CARIBBEAN CRUISES LTD.Celebrity Century NOTES TO THE CONSOLIDATED FINANCIAL STATEMENTS (Continued)from the buyer until April 2015 to fulfill existing passenger commitments. The sale resulted in a loss of $17.4 million that was recognized in earnings during the third quarter of 2014 and is reported within 5.6. Property and Equipment (Continued)Other Assetsunrelated third party for an additional four years. The charter agreement constitutes anfurther discussion.and charter revenue is being recognized on a straight-line basis over the six year charter term. The charter revenue recognized during 2012 was not material to our results of operations. We review our long-lived assets for impairment whenever events or changesoriginally entered into in circumstances indicate, based on estimated undiscounted future cash flows.July 2002, denominated in British pound sterling. As part of step twothe agreement, we purchased the Brilliance of the Seas for a net settlement purchase price of approximately £175.4 million or $275.4 million. At the date of purchase, the total carrying amount of the ship, including capital improvements previously accounted for as leasehold improvements, was $330.5 million which approximated the estimated fair market value of the ship. We funded the purchase using proceeds from our goodwill impairment analysis, (see$1.2 billion unsecured revolving credit facility. See Note 3.7. GoodwillLong-Term Debt for further information), we identified thatinformation.estimated fair valuesvalue of certain long-lived assets, consisting of threePullmantur's aircraft owned and operated by Pullmantur Air, were determined to be less than their carrying values. Asvalue and a result, we proceeded torestructuring related impairment charge of $13.5 million was recognized in earnings during the fourth quarter of 2013 and reported within Restructuring and related impairment charges within our long-lived asset impairment test. Pullmantur's strategy to further diversify its passenger sourcing and reduce its reliance onconsolidated statements of comprehensive income (loss). Furthermore, in 2012, the Spanish market has led us to reduce the numberfair value of years during which we expect to use these aircraft when performing the undiscounted cash flow test. The undiscounted cash flows for Pullmantur's aircraft were determined to be less than their carrying value and an impairment charge of $48.9 million was required. This impairment charge was recognized in earnings during the fourth quarter of 2012 and is reported withinImpairment of Pullmantur related assets within our consolidated statements of comprehensive income (loss).13.14. Fair Value Measurements and Derivative Instruments and Note 16. Restructuring and Related Impairment Charges for further discussion. In December 2012, we reached a conditional agreement with STX France to build the third Oasis-class ship for Royal Caribbean International. The agreement is subject to certain closing conditions and is expected to become effective in the first quarter of 2013. The ship will have a capacity of approximately 5,400 berths and is expected to enter service in the second quarter of 2016. If the agreement becomes effective, Pullmantur'sAtlantic Star, which has been out of operation since 2009, will be transferred to an affiliate of STX France as part of the consideration. The transfer is not expected to result in a gain or a loss. In addition, we have an option to construct a fourth Oasis-class ship which will expire five days prior to the first anniversary of the effective date of the contract.Variable Interest Entities, is an entity in which the equity investors have not provided enough equity to finance the entity's activities or the equity investors (1) cannot directly or indirectly make decisions about the entity's activities through their voting rights or similar rights; (2) do not have the obligation to absorb the expected losses of the entity; (3) do not have the right to receive the expected residual returns of the entity; or (4) have voting rights that are not proportionate to their economic interests and the entity's activities involve or are conducted on behalf of an investor with a disproportionately small voting interest.2012 and December 31, 2011,2014, the net book value of our investment in Grand Bahama includingwas approximately $53.8 million, consisting of $7.7 million in equity and loans,$46.1 million in loans. As of December 31, 2013, the net book value of our investment in Grand Bahama was approximately $59.3$56.1 million, consisting of $6.4 million in equity and $61.4$49.7 millionROYAL CARIBBEAN CRUISES LTD.NOTES TO THE CONSOLIDATED FINANCIAL STATEMENTS (Continued)Note 6.Other Assets (Continued)respectively, which is also in loans. These amounts represent our maximum exposure to loss as we are not contractually required to provide any financial or other support to the facility. The majority of our loans to Grand Bahama are in non-accrual status and the majority of this amount was included withinotherOther assets in our consolidated balance sheets. We received approximately $5.5$3.6 million and $10.8$6.2 million in principal and interest payments related to loans that are in accrual status from Grand Bahama in 20122014 and 2011,2013, respectively, and recorded income associated with our investment in Grand Bahama. We monitor credit risk associated with these loans through our participation on the Grand Bahama's board of directors along with our review of the Grand Bahama's financial statements and projected cash flows. Based on this review, we believe the risk of loss associated with these loans was not probable as of December 31, 2012.2014. In conjunction with our acquisitionin 2006, we obtained asold the majority of its 49% noncontrolling interest in Pullmantur Air S.A. ("Pullmantur Air"), a small airaircraft business that operates four aircraft in support of Pullmantur's operations. We have determinedPost-sale, we retained a 19% interest in Pullmantur Air isas well as 100% ownership of the aircraft, which are now being dry leased to Pullmantur Air. We will continue to utilize the services provided by Pullmantur Air. Consistent with our Pullmantur two-month lag reporting period, we reported the impact of the sale in the second quarter of 2014. As of the date of the sale, we determined that Pullmantur Air was no longer a VIE and have accounted for our 19% investment in Pullmantur Air under the cost method of accounting.arewere the primary beneficiary as we have the power to direct the activities that most significantly impact its economic performance and we are obligated to absorb its losses. In accordance with authoritative guidance, we have consolidated the assets and liabilities of Pullmantur Air.Air in our consolidated balance sheets as of December 31, 2013. We dodid not separately disclose the assets and liabilities of Pullmantur Air as they arewere immaterial to our December 31, 2012 and December 31, 20112013 consolidated financial statements.20122014 and December 31, 2011,2013, our investment in TUI Cruises, including equity and loans, was approximately $287.0$370.1 million and $282.0$354.3 million, respectively, and therespectively. The majority of this amount was included withinotherOther assetsin our consolidated balance sheets. In addition, in conjunction with our sale ofCelebrity Mercury to TUI Cruises in 2011, we and TUI AG, our joint venture partner, have each guaranteed the repayment of 50% of ana €180.0 million 5-year bank loan provided to TUI Cruises (refer to further details below). Thisdue in 2016. Our investment amount and the potential obligations under this guarantee are substantially our maximum exposure to loss. We have determined that we are not the primary beneficiary of TUI Cruises. We believe that the power to direct the activities that most significantly impact TUI Cruises' economic performance are shared between ourselves and our joint venture partner, TUI AG. All the significant operating and financial decisions of TUI Cruises require the consent of both parties which we believe creates shared power over TUI Cruises. Accordingly, we do not consolidate this entity and account for this investment under the equity method of accounting. As of December 31, 2014, TUI Cruises' bank loan that is guaranteed by the shareholders had a remaining balance of €117.0 million, or approximately $141.6 million based on the exchange rate at December 31, 2014. This bank loan amortizes quarterly and is secured by first mortgages on both million.million and maturing through June 2018. During 2014, we made several amendments to the facility, including increasing the maximum amount of the facility to €125.0 million and providing TUI Cruises with the ability to draw upon the available capacity through December 31, 2015 to fund installment payments for its newbuild ships. Any amounts drawn under the facility to fund newbuild installments mature in March 2016. Interest under the loan accrues at the rate of 5.0% per annum. This facility is 50% guaranteed by TUI AG and is secured by second and third mortgages on Mein Schiff 1 and Mein Schiff 2. The outstanding principal amount of the facility as of December 31, 20122014 was €68.6€55.7 million, or approximately $90.4$67.4 million based on the exchange rate at December 31, 2012. The loan bears interest at the rate of 9.54% per annum, is payable over seven years, is 50% guaranteed by 2014.AG (our joint venture partner) and is secured by second mortgagesCruises currently has three newbuild ships on both of TUI Cruises' ships,order with Meyer Turku shipyard:Mein Schiff 14 and,Mein Schiff 2. In addition, we and TUI AG each guaranteed the repayment of 50% of an €180.0 million 5-year bank loan provided to TUI Cruises, of which €153.0 million, or approximately $201.7 million based on the exchange rate at December 31, 2012, remains outstanding as of December 31, 2012, in connection with the sale of the ship. The bank loan amortizes quarterly and is secured by first mortgages on bothMein Schiff 1 andMein Schiff 2. Based on current facts and circumstances, we do not believe potential obligations under this guarantee are probable.ROYAL CARIBBEAN CRUISES LTD.NOTES TO THE CONSOLIDATED FINANCIAL STATEMENTS (Continued)Note 6.Other Assets (Continued) During 2011, TUI Cruises entered into a construction agreement with STX Finland to build its first newbuild ship, scheduled for delivery in the second quarter of 2014.2015, Mein Schiff 5, scheduled for delivery in the third quarter of 2016 and Mein Schiff 6, scheduled for delivery in the second quarter of 2017. TUI Cruises has entered into a credit agreementin place commitments for the financing of up to 80% of the contract price of the ship.each ship on order. The remaining portion of the contract price of the shipships will be funded through either TUI Cruises'Cruises’ cash flows from operations and/or shareholder loans (via the debt facility described above or otherwise) and/or equity contributions from us and TUI AG. The various ship construction agreement includesand credit agreements include certain restrictions on each of our and TUI AG'sAG’s ability to reduce our current ownership interest in TUI Cruises below 37.5% through 2019.construction period. In addition,fourth quarter of 2014, we acquired a 35% noncontrolling interest in Skysea Holding. We have determined that Skysea Holding is a VIE for which we are not the credit agreement extendsprimariy beneficiary, as we do not have the power to direct the activities that most significantly impact the entity's economic performance. Accordingly, we do not consolidate this restriction through 2019. In 2012, TUI Cruises exercised their optionentity and we account for this investment under the agreement with STX Finlandequity method of accounting. As of December 31, 2014, our investment balance in Skysea Holding was $26.3 million. In December 31, 2014, we and Ctrip.com International Ltd, who also owns 35% of Skysea Holding, each provided a debt facility to construct their second newbuild ship, scheduled for deliveryExquisite Marine Ltd., one of Skysea Holding's wholly-owned subsidiaries, in the second quarteramount of 2015. TUI Cruises has$80.0 million. Interest under these facilities, which mature in January 2030, initially accrues interest at a rate of 3.0% per annum with an increase of at least 0.5% every two years. The facilities, which are pari passu to each other, are each 100% guaranteed by Skysea Holding and secured by a bank financing commitment for 80% of the contract price of the second ship as well as a conditional guarantee commitment from Finnvera, the official export agency of Finland, for 95% of the bank loan facility. The remaining portion of the contract price offirst priority mortgage on the ship, will be funded through either TUI Cruises' cash flows from operations or loans and/or equity contributions from us Celebrity Century, which we sold to Exquisite Marine Ltd. in September 2014. See Note 5. Property and TUI AG.Equipment for further discussion on the sales transaction. We have determined that Exquisite Marine Ltd. is a VIE and that we are not the primary beneficiary, as we do not have the power to direct the activities 2012 2011 $ 48,000 $ 523,000 12,000 67,000 2,698,531 2,059,510 1,004,940 1,356,312 — 100,000 — 32,085 40,714 122,143 126,214 210,358 189,286 265,000 346,097 389,360 318,230 348,142 315,000 350,000 157,643 172,463 393,375 437,083 448,138 495,311 767,754 844,529 579,295 631,959 673,474 — 290,000 — 5,867 6,343 22,458 25,173 52,931 60,082 8,489,947 8,495,853 (1,519,483 ) (638,891 ) $ 6,970,464 $ 7,856,962 (1)Corresponds toOasis of the Seas 2014 2013 $1.1 billion unsecured revolving credit facility, LIBOR plus 1.75%, currently 1.92% and a facility fee of 0.37%, due 2016 $ 713,000 $ 435,000 $1.2 billion unsecured revolving credit facility, LIBOR plus 1.75%, currently 1.91% and a facility fee of 0.37%, due 2018 778,000 295,000 Unsecured senior notes and senior debentures, 5.25% to 11.88%, due 2015, 2016, 2018, 2022 and 2027 1,721,190 1,703,040 €745 million unsecured senior notes, 5.63%, due 2014 — 1,028,126 $589 million unsecured term loan, 4.47%, due through 2014 — 42,071 $530 million unsecured term loan, LIBOR plus 0.51%, currently 0.83%, due through 2015 37,857 113,571 $519 million unsecured term loan, LIBOR plus 0.45%, currently 0.77%, due through 2020 259,573 302,835 $420 million unsecured term loan, 5.41%, due through 2021 241,827 274,974 $420 million unsecured term loan, LIBOR plus 1.85%, currently 2.17%, due through 2021 245,000 280,000 €159.4 million unsecured term loan, EURIBOR plus 1.58%, currently 1.77%, due through 2021 112,540 146,452 $524.5 million unsecured term loan, LIBOR plus 0.50%, currently 0.83%, due through 2021 305,958 349,667 $566.1 million unsecured term loan, LIBOR plus 0.37%, currently 0.69%, due through 2022 353,793 400,966 $1.1 billion unsecured term loan, LIBOR plus 1.85%, currently 2.17%, due through 2022 614,203 690,978 $632.0 million unsecured term loan, LIBOR plus 0.40%, currently 0.73%, due through 2023 473,969 526,632 $673.5 million unsecured term loan, LIBOR plus 0.40%, currently 0.73%, due through 2024 561,228 617,351 $65.0 million unsecured term loan, LIBOR plus 2.12%, currently 2.29%, due through 2019 51,100 — $1.0 million unsecured term loan, 3.00%, due through 2015 750 — $380.0 million unsecured term loan, LIBOR plus 2.12%, currently 2.29%, due through 2018 380,000 — $791.1 million unsecured term loan, LIBOR plus 1.30%, currently 1.62%, due through 2026 791,108 — $290.0 million unsecured term loan, LIBOR plus 2.5%, currently 2.67%, due 2016 290,000 290,000 €365 million unsecured term loan, EURIBOR plus 2.30%, currently 2.32%, due 2017 441,687 502,934 $7.3 million unsecured term loan, LIBOR plus 2.5%, currently 2.82%, due through 2023 4,915 5,391 $30.3 million unsecured term loan, LIBOR plus 3.75%, currently 3.99%, due through 2021 13,603 15,073 Capital lease obligations 52,647 54,743 8,443,948 8,074,804 Less—current portion (799,630 ) (1,563,378 ) Long-term portion $ 7,644,318 $ 6,511,426 loan. With respect to 60% of the financing, the lenders have the ability to exit the facility in October 2015.(2)Corresponds toAllure of the Seas unsecured term loan. With respect to 100% of the financing, the lenders have the ability to exit the facility in October 2017.ROYAL CARIBBEAN CRUISES LTD.NOTES TO THE CONSOLIDATED FINANCIAL STATEMENTS (Continued)Note 7.Long-Term Debt (Continued) During 2012, the credit facility we obtained in connection with our purchase ofCelebrity Solstice was assigned from Celebrity Solstice Inc., our subsidiary which owns the ship, to Royal Caribbean Cruises Ltd. Similar assignments were simultaneously made from the ship-owning subsidiary level to Royal Caribbean Cruises Ltd. for the facilities relating toCelebrity Equinox, Celebrity Eclipse, Celebrity Silhouette, Celebrity Reflection, Oasis of the Seas andAllure of the Seas. Other than the change in borrower, the economic terms of these facilities remain unchanged. These amended facilities each contain covenants substantially similar to the covenants in our other parent-level ship financing agreements and our revolving credit facilities. During 2012, we entered into a credit agreement which provides an unsecured Euro-denominated term loan facility in an amount up to €365.0 million, or approximately $481.2 million based on the exchange rate at December 31, 2012. We have the ability to draw on this facility at anytime on or prior to June 30, 2013. As of February 25, 2013, we have not drawn on this facility. All amounts borrowed under the facility will beThe loan is due and payable at maturity in July 2017. Interest on the loan accrues at a floating rate based on EURIBOR plus the applicable margin. The applicable margin varies with our debt rating and would have been 3.0% as of December 31, 2012. In addition, we are subject to a commitment fee of 1.05% per annum of the undrawn amount. We anticipate the proceeds from this loan facility will be used primarily as part of our refinancing strategy for our maturities in 2013 and 2014. In connection with entering into this facility, we prepaid our $100.0 million unsecured floating rate term loan due September 2013. During 2012, we borrowed $290.0 million under an unsecured term loan. All amounts borrowed under the facility will be due and payable at maturity in February 2016.August 2018. Interest on the loan accrues at a floating rate based on LIBOR plus the2.5%2.12% as of December 31, 2012.2014. The proceeds of this loan were used to reduce outstanding balances onrepay our revolving credit facilities. During 2012, we repurchased €255.0€745.0 million or approximately $328.0 million in aggregate principal amount of our €1.0 billion 5.625% unsecured senior notes due January 2014.throughwe amended and restated our €365.0 million unsecured term loan due July 2017. Interest on the amended facility accrues at a debt tender offer conducted outside offloating rate based on EURIBOR plus a margin which varies with our credit rating. The amendment reduced the United States. Total consideration paid in connection with the tender offer, including premium and related fees and expenses was $344.6 million. The repurchase of the unsecured senior notesmargin, which at our current credit rating resulted in a lossdecrease from 3.00% to 2.30%. The amendment did not result in the extinguishment of debt.early$420.0 million floating rate tranche of the Oasis of the Seas term loan was reduced from LIBOR plus 2.10% to LIBOR plus 1.85%. The interest rate on the entire $1.1 billion Allure of the Seas term loan was reduced from LIBOR plus 2.10% to LIBOR plus 1.85%. These amendments did not result in the extinguishment of debt of approximately $7.5 million which was recognized in earnings immediately and is reported withindebt.extinguishment of unsecured senior notes in our consolidated statements of comprehensive income (loss).2012,2014, we took delivery ofCelebrity ReflectionQuantum of the Seas. To finance the purchase, we borrowed $673.5$791.1 million under oura previously committed unsecured term loan which is 95% guaranteed by Hermes. The loan amortizes semi-annually over 12 years and bears interest at LIBOR plus a margin of 0.40%1.30%, currently approximately 1.03%1.62%. In addition, during 2011,2012, we entered into forward-starting interest rate swap agreements which effectively convertconverted the floating rate available to us per the credit agreement to a fixed rate, (includingincluding the applicable margin)margin, of 2.85%3.74% effective April 2013October 2014 through the remaining term of the loan. See Note 13.14. Fair Value Measurements and Derivative Instrumentsfor further information regarding these agreements. In November 2012, we issued $650.0 million of 5.25% unsecured senior notes due 2022 at par. The net proceeds from the offering were used to repay amounts outstanding under our unsecured revolving credit facilities. The issuance of these notes was part of our refinancing strategy for our maturities in 2013 and 2014.ROYAL CARIBBEAN CRUISES LTD.NOTES TO THE CONSOLIDATED FINANCIAL STATEMENTS (Continued)Note 7.Long-Term Debt (Continued)2012,2014, we increased the capacity of our unsecured revolving credit facility due July 2016August 2018 by $233.0$300 million by utilizing the accordion feature, bringing our total capacity under this facility to $1.1$1.2 billion as of December 31, 2012. We have the ability to increase the capacity of this facility by an additional $67.0 million subject to the receipt of additional or increased lender commitments.2014. We also have a revolving credit facility due November 2014July 2016 with capacity of $525.0 million$1.1 billion as of December 31, 2012,2014, giving us an aggregate revolving borrowing capacity of $1.6$2.3 billion.inunder certain of our facilities based upon our credit ratings) or (2) an upfront fee of approximately 2.3% to 2.37% of the maximum loan amount. We amortize the fees that are paid upfront over the life of the loan and those that are paid semi-annually over each respective payment period. We classify these fees withinDebt issuance costs in our consolidated statements of cash flows and withinOther Assetsassets in our consolidated balance sheets.20122014 for each of the next five years (in thousands): $ 1,519,483 1,549,057 1,063,539 $ 799,630 1,102,119 1,856,302 744,174 920,687 2018 1,785,083 2019 529,197 2,511,575 2,553,049 $ 8,443,948 $ 8,489,947 2012,2014, we declared a cash dividend on our common stock of $0.30 per share which was paid in the first quarter of 2015. We declared a cash dividend on our common stock of $0.30 per share during the third quarter of 2014 which was paid in the fourth quarter of 2014. We declared and paid a cash dividend on our common stock of $0.25 per share during the first and second quarters of 2014.share.share during the first and second quarters of 2013. During the fourthfirst quarter of 2012,2013, we also paid a cash dividend on our common stock of $0.12 per share which was declared during the thirdfourth quarter of 2012. We declared and paid cash dividends on our common stock of $0.10 per share during the first and second quarters of 2012. During the first quarter of 2012, we also paid a cash dividend on our common stock of $0.10 per share which was declared during the fourth quarter of 2011.ROYAL CARIBBEAN CRUISES LTD.NOTES TO THE CONSOLIDATED FINANCIAL STATEMENTS (Continued)threetwo stock-based compensation plans, which provide for awards to our officers, directors and key employees. The plans consist of a 1995 Incentive Stock Option Plan, a 2000 Stock Award Plan and a 2008 Equity Plan. Our ability to issue new awards under the 1995 Incentive Stock Option Plan and the 2000 Stock Award Plan terminated in accordance with the terms of the plansplan in February 2005 and September 2009, respectively.2009. The 2008 Equity Plan, as amended, provides for the issuance of up to 11,000,000 shares of our common stock pursuant to grants of (i) incentive and non-qualified stock options, (ii) stock appreciation rights, (iii) restricted stock, (iv) restricted stock units and (v) performance shares. During any calendar year, no one individual shall be granted awards of more than 500,000 shares. With limited exceptions, optionsOptions and restricted stock units outstanding as of December 31, 20122014 generally vest in equal installments over four to five years from the date of grant. In addition, performance shares generally vest in three years. With certain limited exceptions, options, and restricted stock units and performance shares are forfeited if the recipient ceases to be a director or employee before the shares vest. Options are granted at a price not less than the fair value of the shares on the date of grant and expire not later than ten years after the date of grant. In we redesigned our long-term incentive award program and began to grant performance shares to our officers in lieu of stock options. Under our prior program, our officers received a combination of stock options and restricted stock units. Beginning in 2012, our officers instead receive their long-term incentive awards through a combination of performance shares and restricted stock units. Each performance share award is expressed as a target number of performance shares based upon the fair market value of our common stock on the date the award is issued. The actual number of shares underlying each award (not to exceed 200% of the target number of performance shares) will be determined based upon the Company's2012,2014, the performance target is diluted earnings per sharereturn on invested capital ("EPS"ROIC") for the year ended December 31, 2012,2014, as adjusted by the Compensation Committee of our Board of Directors for events that are outside of management's control. In 2012,2014, we issued a target number of 329,088233,831 performance shares which will vest on the third anniversary of the award issue date. In February 2013,2015, the Compensation Committee of our Board of Directors set the actual payout level at 94%119% of target for the performance shares issued in 2012.800,0001,300,000 shares of common stock in the aggregate. Offerings to employees are made on a quarterly basis. Subject to certain limitations, the purchase price for each share of common stock is equal to 90%85.0% of the average of the market prices of the common stock as reported on the New York Stock Exchange on the first business day of the purchase period and the last business day of each month of the purchase period. 35,927, 28,802,During 2014, 2013 and 30,0542012, 26,921, 27,036 and 35,927 shares of our common stock were issued under the ESPP at a weighted-average price of $52.08, $33.16 and $25.58, $29.46respectively.$27.87 during 2012, 2011 and 2010, respectively. UnderChief Executive Officer an award of common stock, issuable in quarterly installments of 10,086 shares until the chief executive officer'searlier of the termination of his employment agreement,or June 2014. In furtherance of this grant, we issued 10,086an aggregate of 40,344 shares of our common stock per quarter duringin each of 2012 2011 and 2010 to the chief executive officer.Table2013 and an aggregate of ContentsROYAL CARIBBEAN CRUISES LTD.NOTES TO THE CONSOLIDATED FINANCIAL STATEMENTS (Continued)Note 9.Stock-Based Employee Compensation (Continued)2011 and 2010 werewas as follows: Employee Stock-Based Compensation 2012 2011 2010 $ 24,153 $ 23,803 $ 27,598 — — 475 $ 24,153 $ 23,803 $ 28,073 Employee Stock-Based Compensation Classification of expense 2014 2013 2012 (In thousands) Marketing, selling and administrative expenses $ 26,116 $ 21,178 $ 24,153 Total compensation expense $ 26,116 $ 21,178 $ 24,153 The majority of ourWe did not issue any stock option grants occur earlyoptions in our fiscal year.2014 and 2013. The assumptions used in the Black-Scholes option-pricing model are as follows: 2012 2011 2010 1.5% 0.0% 0.0% 46.0% 46.0% 45.0% 1.1% 2.6% 2.6% 6 years 6 years 6 years 2012 Dividend yield 1.5% Expected stock price volatility 46.0% Risk-free interest rate 1.1% Expected option life 6 years optionsoption activity and information about stock options outstanding are summarized in the following tables:table:Stock Option Activity Number of
Options Weighted-
Average
Exercise
Price Weighted-
Average
Remaining
Contractual
Term
Intrinsic
Value(1) (years) (in thousands) Outstanding at January 1, 2014 2,694,872 $ 36.30 3.83 $ 30,080 Granted — $ — — — Exercised (1,941,365 ) $ 36.22 — — Canceled (47,456 ) $ 43.02 — — Outstanding at December 31, 2014 706,051 $ 36.03 3.64 $ 33,182 Vested and expected to vest at December 31, 2014 704,796 $ 36.02 3.63 $ 33,130 Options Exercisable at December 31, 2014 622,168 $ 34.85 3.31 $ 29,970 (1) The intrinsic value represents the amount by which the fair value of stock exceeds the option exercise price as of December 31, 2014. Number of
Options Weighted-
Average
Exercise
Price Weighted-
Average
Remaining
Contractual
Term Aggregate
Intrinsic
Value(1) (years) (in thousands) 5,671,658 $ 30.62 6.15 $ 21,887 7,576 $ 26.06 (906,011 ) $ 16.24 (324,450 ) $ 30.40 4,448,773 $ 33.56 4.55 $ 25,522 4,367,468 $ 33.54 4.50 $ 25,113 3,329,335 $ 36.24 3.83 $ 12,565 (1)The intrinsic value represents the amount by which the fair value of stock exceeds the option exercise price as of December 31, 2012.ROYAL CARIBBEAN CRUISES LTD.NOTES TO THE CONSOLIDATED FINANCIAL STATEMENTS (Continued)Note 9.Stock-Based Employee Compensation (Continued)$21.39 and $11.69 during the yearsyear ended December 31, 2012, 2011 and 2010, respectively.2012. The total intrinsic value of stock options exercised during the years ended December 31, 2014, 2013 and 2012 2011 and 2010 was $15.3$35.9 million, $17.3$17.5 million and $26.9$15.3 million, respectively. As of December 31, 2012,2014, there was approximately $2.6$0.1 million of total unrecognized compensation cost, net of estimated forfeitures, related to stock options granted under our stock incentive plans which is expected to be recognized over a weighted-average period of 0.60.14 years. Number of
Awards Weighted-
Average
Grant Date
Fair Value Number of
Awards Weighted-
Average
Grant Date
Fair Value 1,372,225 $ 15.67 Non-vested share units at January 1, 2014 989,005 $ 9.26 599,163 $ 30.03 472,150 $ 54.60 (613,650 ) $ 30.19 (405,001 ) $ 51.24 (161,298 ) $ 26.00 (74,601 ) $ 55.30 1,196,440 $ 14.02 Non-vested share units expected to vest as of December 31, 2014 981,553 $ 10.25 2011,2013, and 20102012 were $45.67$36.07 and $25.32,$30.03, respectively. The total fair value of shares released on the vesting of restricted stock units during the years ended December 31, 2014, 2013 and 2012 2011 and 2010 was $18.8$20.7 million, $25.1$19.2 million and $12.0$18.8 million, respectively. As of December 31, 2012,2014, we had $9.3$14.6 million of total unrecognized compensation expense, net of estimated forfeitures, related to restricted stock unit grants, which will be recognized over the weighted-average period of 1.11.27 years.stockshare awards are converted into shares of common stock upon vesting on a one-for-one basis. We estimate the fair value of each performance share when the grant is authorized and the related service period has commenced. We remeasure the fair value of our performance shares in each subsequent reporting period until the grant date has occurred, which is the date when the performance conditions are satisfied. We recognize compensation cost over the vesting period based on the probability of the service and performance conditions being achieved adjusted for each subsequent fair value measurement until the grant date. If the specified service and performance conditions are notNote 9.Stock-Based Employee Compensation (Continued) Number of
Awards Weighted-
Average
Grant Date
Fair Value — $ — Performance Stock Activity Number of
Awards Weighted-
Average
Grant Date
Fair ValueNon-vested share units at January 1, 2014 459,929 $ 32.36 329,088 $ 30.16 233,831 $ 56.72 — $ — (7,301 ) $ 53.81 (40,595 ) $ 25.74 (27,573 ) $ 54.11 288,493 $ 30.78 Non-vested share units expected to vest as of December 31, 2014 658,886 $ 39.86 2012,2014, we had $6.2$12.9 million of total unrecognized compensation expense, net of estimated forfeitures, related to performance share unit grants, which will be recognized over the weighted-average period of 20.89 years. Year Ended December 31, Year Ended December 31, 2012 2011 2010 2014 2013 2012 $ 18,287 $ 607,421 $ 515,653 $ 764,146 $ 473,692 $ 18,287
217,930
216,983
215,026 221,658 219,638 217,930 1,527 2,246 2,685 Dilutive effect of stock options, performance share awards and restricted stock awards 1,386 1,303 1,527 219,457 219,229 217,711 223,044 220,941 219,457 $ 0.08 $ 2.80 $ 2.40 $ 3.45 $ 2.16 $ 0.08 $ 0.08 $ 2.77 $ 2.37 $ 3.43 $ 2.14 $ 0.08 3.1 million, 2.81.9 million and 2.63.1 million shares for each of the years ended December 31, 2012, 20112013 and 2010,2012, respectively, because the effect of including them would have been antidilutive. There were no antidilutive shares for the year ended December 31, 2014.$15.2$15.4 million, $15.3$13.0 million and $13.3$15.2 million for the years ended December 31, 2014, 2013 and 2012, 2011 and 2010, respectively.ROYAL CARIBBEAN CRUISES LTD.NOTES TO THE CONSOLIDATED FINANCIAL STATEMENTS (Continued)(expense)(benefit) expense for items not qualifying under Section 883, tonnage taxes and income taxes for the remainder of our subsidiaries was approximately $(55.5)$(20.9) million, $(20.7)$24.9 million and $(20.3)$55.5 million and was recorded withinotherOther income (expense)for the years ended December 31, 2012, 20112014, 2013 and 2010,2012, respectively. In addition, all interest expense and penalties related to income tax liabilities are classified as income tax expense withinotherOther income (expense).As previously disclosed, duringDuring 2012, European economies continued to demonstrate instability in light of heightened concerns over sovereign debt issues as well as the impact of proposed austerity measures on certain markets. The Spanish economy was more severely impacted than many other economies around the world where we operate and there is significant uncertainty as to when it will recover. In addition, the impact of the Costa Concordia incident has had a more lingering effect than expected and the impact in future years is uncertain. Please refer to Note 3.Goodwill for further information. During the fourth quarter of 2012, we updated our deferred tax asset recoverability analysis for projections included within the goodwill valuation model. These projections, including the impact of recently enacted laws regarding net operating loss utilization, and the review of our tax planning strategies show that it is no longer more-likely-than-not that we will recover the deferred tax assets prior to their expiration. As such, we have determined that a 100% valuation allowance of our deferred tax assets was required resulting in a deferred income tax expense of $33.7 million. In addition, Pullmantur has a deferred tax liability that was recorded at the time of acquisition. This liability represents the tax effect of the basis difference between the tax and book values of the trademarks and trade names that were acquired at the time of the acquisition. Due to the impairment charge related to these intangible assets, we reduced the deferred tax liability byand recorded a deferred tax benefit of $5.2 million to $61.5 million. The net $28.5 million impact of these adjustments was recognized in earnings during the fourth quarter of 2012 and iswas reported withinOther income (expense) income in our statements of comprehensive income (loss).12.13. Changes in Accumulated Other Comprehensive Income Taxes (Continued)(Loss) Deferred tax assets, related valuation allowances and deferred tax liabilities related to our operations are not material as of20122014 and 2011. Changes related to cash flow derivative hedges Changes in defined
benefit plans Foreign currency translation adjustments Accumulated other comprehensive (loss) income Accumulated comprehensive loss at January 1, 2013 $ (84,505 ) $ (34,823 ) $ (15,188 ) $ (134,516 ) Other comprehensive income before reclassifications 197,428 8,240 1,529 207,197 Amounts reclassified from accumulated other comprehensive income (loss) (69,599 ) 2,589 — (67,010 ) Net current-period other comprehensive income 127,829 10,829 1,529 140,187 Accumulated comprehensive income (loss) at January 1, 2014 43,324 (23,994 ) (13,659 ) 5,671 Other comprehensive loss before reclassifications (903,830 ) (8,937 ) (28,099 ) (940,866 ) Amounts reclassified from accumulated other comprehensive income (loss) 34,480 1,724 1,997 38,201 Net current-period other comprehensive loss (869,350 ) (7,213 ) (26,102 ) (902,665 ) Accumulated comprehensive loss at December 31, 2014 $ (826,026 ) $ (31,207 ) $ (39,761 ) $ (896,994 ) Amount of Gain (Loss) Reclassified from Accumulated Other Comprehensive (Loss) Income into Income Details about Accumulated Other Comprehensive Income (Loss) Components Year Ended December 31, 2014 Year Ended December 31, 2013 Affected Line Item in Statements of Comprehensive Income (Loss) Gain (loss) on cash flow derivative hedges: Cross currency swaps $ (261 ) $ (3,531 ) Interest expense, net of interest capitalized Foreign currency forward contracts (1,887 ) (1,797 ) Depreciation and amortization expenses Foreign currency forward contracts (4,291 ) 27,423 Other (expense) income Foreign currency forward contracts (57 ) (440 ) Interest expense, net of interest capitalized Fuel swaps (27,984 ) 47,944 Fuel (34,480 ) 69,599 Amortization of defined benefit plans: Actuarial loss (888 ) (1,753 ) Payroll and related Prior service costs (836 ) (836 ) Payroll and related (1,724 ) (2,589 ) Release of foreign cumulative translation due to sale of Pullmantur's non-core businesses: Foreign cumulative translation (1,997 ) — Other operating Total reclassifications for the period $ (38,201 ) $ 67,010 13.14.Fair Value Measurements and Derivative Instrumentson a recurring basis, categorized based upon the fair value hierarchy, are as follows (in thousands): Fair Value Measurements at December 31, 2014 Using Fair Value Measurements at December 31, 2013 Using Description Total Carrying Amount Total Fair Value Total Carrying Amount Total Fair Value Assets: $ 189,241 $ 189,241 $ 189,241 $ — $ — $ 204,687 $ 204,687 $ 204,687 $ — $ — Total Assets $ 189,241 $ 189,241 $ 189,241 $ — $ — $ 204,687 $ 204,687 $ 204,687 $ — $ — Liabilities: $ 8,391,301 $ 8,761,414 $ 1,859,361 $ 6,902,053 $ — $ 8,020,061 $ 8,431,220 $ 2,888,255 $ 5,542,965 $ — Total Liabilities $ 8,391,301 $ 8,761,414 $ 1,859,361 $ 6,902,053 $ — $ 8,020,061 $ 8,431,220 $ 2,888,255 $ 5,542,965 $ — (1) Inputs based on quoted prices (unadjusted) in active markets for identical assets or liabilities that we have the ability to access. Valuation of these items does not entail a significant amount of judgment. (2) Inputs other than quoted prices included within Level 1 that are observable for the liability, either directly or indirectly. For unsecured revolving credit facilities and unsecured term loans, fair value is determined utilizing the income valuation approach. This valuation model takes into account the contract terms of our debt such as the debt maturity and the interest rate on the debt. The valuation model also takes into account the creditworthiness of the Company. (3) Inputs that are unobservable. The Company did not use any Level 3 inputs as of December 31, 2014 and December 31, 2013. (4) Consists of cash and marketable securities with original maturities of less than 90 days. (5) Consists of unsecured revolving credit facilities, senior notes, senior debentures and term loans. Does not include our capital lease obligations. Fair Value Measurements
at December 31, 2012 Using Fair Value Measurements
at December 31, 2011 Using Total Level 1(1) Level 2(2) Level 3(3) Total Level 1(1) Level 2(2) Level 3(3) $ 194,855 194,855 — — $ 262,186 262,186 — — $ 194,855 $ 194,855 $ — $ — $ 262,186 $ 262,186 $ — $ — $ 8,859,310 3,917,398 4,941,912 — $ 8,557,095 3,424,722 5,132,373 — $ 8,859,310 $ 3,917,398 $ 4,941,912 $ — $ 8,557,095 $ 3,424,722 $ 5,132,373 $ — (1)Inputs based on quoted prices (unadjusted) in active markets for identical assets or liabilities that we have the ability to access. Valuation of these items does not entail a significant amount of judgment.(2)Inputs other than quoted prices included within Level 1 that are observable for the liability, either directly or indirectly. For unsecured revolving credit facilities and unsecured term loans, fair value is determined utilizing the income valuation approach. This valuation model takes into account the contract terms of our debt such as the debt maturity and the interest rate on the debt. The valuation model also takes into account our creditworthiness based on publicly available credit default swap rates.(3)Inputs that are unobservable. The Company did not use any Level 3 inputs as of December 31, 2012 and December 31, 2011.(4)Consists of cash and marketable securities with original maturities of less than 90 days.(5)Consists of unsecured revolving credit facilities, unsecured senior notes, senior debentures and unsecured term loans. Does not include our capital lease obligations.Note 13.Fair Value Measurements and Derivative Instruments (Continued)20122014 and December 31, 2011. Fair Value Measurements at December 31, 2014 Using Fair Value Measurements at December 31, 2013 Using Description Total Fair Value Total Fair Value Assets: $ 63,981 $ — $ 63,981 $ — $ 188,576 $ — $ 188,576 $ — $ 5,531 5,531 — — $ 6,044 6,044 — — Total Assets $ 69,512 $ 5,531 $ 63,981 $ — $ 194,620 $ 6,044 $ 188,576 $ — Liabilities: $ 767,635 $ — $ 767,635 $ — $ 100,260 $ — $ 100,260 $ — Total Liabilities $ 767,635 $ — $ 767,635 $ — $ 100,260 $ — $ 100,260 $ — (1) Inputs based on quoted prices (unadjusted) in active markets for identical assets or liabilities that we have the ability to access. Valuation of these items does not entail a significant amount of judgment. (2) Inputs other than quoted prices included within Level 1 that are observable for the asset or liability, either directly or indirectly. For foreign currency forward contracts, interest rate swaps, cross currency swaps and fuel swaps, fair value is derived using valuation models that utilize the income valuation approach. These valuation models take into account the contract terms, such as maturity as well as other inputs, such as foreign exchange rates and curves, fuel types, fuel curves and interest rate yield curves. Fair value for foreign currency collar options is determined by using standard option pricing models with inputs based on the options' contract terms, such as exercise price and maturity, and readily available public market data, such as foreign exchange curves, foreign exchange volatility levels and discount rates. All derivative instrument fair values take into account the creditworthiness of the counterparty and the Company. (3) Inputs that are unobservable. The Company did not use any Level 3 inputs as of December 31, 2014 and December 31, 2013. (4) Consists of foreign currency forward contracts, foreign currency collar options, interest rate swaps and fuel swaps. Please refer to the "Fair Value of Derivative Instruments" table for breakdown by instrument type. (5) Consists of exchange-traded equity securities and mutual funds. (6) Consists of interest rate swaps, fuel swaps, foreign currency forward contracts and foreign currency collar options. Please refer to the "Fair Value of Derivative Instruments" table for breakdown by instrument type. Fair Value Measurements
at December 31, 2012 Using Fair Value Measurements
at December 31, 2011 Using Total Level 1(1) Level 2(2) Level 3(3) Total Level 1(1) Level 2(2) Level 3(3) $ 96,489 — 96,489 — $ 201,130 — 201,130 — $ 6,231 6,231 — — $ 6,941 6,941 — — $ 102,720 $ 6,231 $ 96,489 $ — $ 208,071 $ 6,941 $ 201,130 $ — $ 85,119 — 85,119 — $ 84,344 — 84,344 — $ 85,119 $ — $ 85,119 $ — $ 84,344 $ — $ 84,344 $ — (1)Inputs based on quoted prices (unadjusted) in active markets for identical assets or liabilities that we have the ability to access. Valuation of these items does not entail a significant amount of judgment.(2)Inputs other than quoted prices included within Level 1 that are observable for the asset or liability, either directly or indirectly. For foreign currency forward contracts, interest rate swaps, cross currency swaps and fuel swaps, fair value is derived using valuation models that utilize the income valuation approach. These valuation models take into account the contract terms, such as maturity as well as other inputs, such as foreign exchange rates and curves, fuel types, fuel curves and interest rate yield curves. For fuel call options, fair value is determined by using the prevailing market price for the instruments consisting of published price quotes for similar assets based on recent transactions in an active market. Fair value for foreign currency collar options is determined by using standard option pricing models with inputs based on the options' contract terms, such as exercise price and maturity, and readily available public market data, such as foreign exchange curves, foreign exchange volatility levels and discount rates. All derivative instrument fair values take into account the creditworthiness of the counterparty and the Company.(3)Inputs that are unobservable. The Company did not use any Level 3 inputs as of December 31, 2012 and December 31, 2011.(4)Consists of foreign currency forward contracts and collar options, interest rate swaps, cross currency swaps, fuel swaps and purchased fuel call options. Please refer to the "Fair Value of Derivative Instruments" table for breakdown by instrument type.(5)Consists of exchange-traded equity securities and mutual funds.(6)Consists of interest rate swaps, fuel swaps, foreign currency forward contracts and sold fuel call options. Please refer to the "Fair Value of Derivative Instruments" table for breakdown by instrument type.ROYAL CARIBBEAN CRUISES LTD.NOTES TO THE CONSOLIDATED FINANCIAL STATEMENTS (Continued)Note 13.Fair Value Measurements and Derivative Instruments (Continued)20122014 or December 31, 2011,2013, or that will be realized in the future, and do not include expenses that could be incurred in an actual sale or settlement.goodwill, indefinite-life intangible assets and long-lived assets for our Pullmantur reporting unit and assets held for sale recorded at fair value on a nonrecurring basis (in thousands): Fair Value Measurements at December 31, 2013 Using Description Total Carrying Amount Total Fair Value Level 3 Total Impairment $ 49,507 $ 49,507 $ 49,507 $ 13,529 $ — $ — $ — $ 19,985 (1) For 2013, we estimated the fair value of our long-lived assets using an undiscounted cash flow model. A significant assumption in performing the undiscounted cash flow test was the number of years during which we expect to use these aircraft. Additionally, as of December 31, 2013, the expected operating use of the aircraft modified the expected cash flows. (2) Fair Value Measurements
at December 31, 2012 Using Total Level 1 Level 2 Level 3 Total Impairment $ 145,539 — — 145,539 $ 319,214 $ 204,866 — — 204,866 $ 17,356 $ 62,288 — — 62,288 $ 48,874 (1)We estimatedThe assets related to Pullmantur’s non-core businesses that met the criteria for held for sale classification as of December 31, 2013 were adjusted to the lower of their carrying amount or fair value less cost to sell. At December 31, 2013, the fair value of certain assets held for sale was lower than the Pullmantur reporting unit usingcarrying amount, resulting in a probability-weighted discounted cash flow model. The principal assumptions used in the discounted cash flow model are projected operating results, weighted-average costloss of capital, and terminal value. Significantly impacting these assumptions were the anticipated future transfer of vessels from our other cruise brands to Pullmantur. The discounted cash flow model used our 2013 projected operating results as a base. To that base we added future years' cash flows through 2017 assuming multiple revenue and expense scenarios that reflect the impact of different global economic environments for this period on Pullmantur's reporting unit. We assigned a probability to each revenue and expense scenario. We discounted the projected cash flows using rates specific to Pullmantur's reporting unit based on its weighted-average cost of capital,$20.0 million which was determined to be 10%.(2)We estimated the fair value of our indefinite-life intangible asset using a discounted cash flow model and the relief-from-royalty method. We used a royalty rate of 3% based on comparable royalty agreements in the tourism and hospitality industry. These trademarks and trade names relate to Pullmantur and we have used a discount rate of 11%, comparable to the rate used in valuing the Pullmantur reporting unit.(3)We estimated the fair value of our long-lived assets using an undiscounted cash flow model. A significant assumption in performing the undiscounted cash flow test was the number of years during which we expect to use these aircraft. Goodwill and indefinite-life intangible assets related to Pullmantur with a carrying amount of $459.1 million and $218.9 million, respectively, were written down to its implied fair value of $145.5 million and its fair value of $204.9 million, respectively. The impairment charges, totaling approximately $336.6 million, were recognized during the fourth quarter of 20122013 and areis reported withinImpairment of PullmanturRestructuring and related assetsimpairment charges in our consolidated statements of comprehensive income (loss). Pullmantur's goodwillSee Note 16. Restructuring and indefinite-life intangible assets are reported withingoodwillRelated Impairment Charges andfor further discussion.other assets, respectively, in our consolidated balance sheets. Long-livedIn 2013, long-lived assets with a carrying amount of $116.3$63.0 million were written down to their fair value of $62.3$49.5 million, resulting in a losslosses of $48.9$13.5 million, which waswere recognized during the fourth quarter of 20122013 and iswere reported withinImpairment of PullmanturRestructuring and related assetsimpairment charges in our consolidated statements ofROYAL CARIBBEAN CRUISES LTD.NOTES TO THE CONSOLIDATED FINANCIAL STATEMENTS (Continued)Note 13.Fair Value Measurements and Derivative Instruments (Continued)propertyProperty and equipment, net in our consolidated balance sheets. Gross Amounts not Offset in the Consolidated Balance Sheet that are Subject to Master Netting Agreements As of December 31, 2014 As of December 31, 2013 Gross Amount of Derivative Assets Presented in the Consolidated Balance Sheet Gross Amount of Eligible Offsetting
Recognized
Derivative Liabilities Cash Collateral
Received Net Amount of
Derivative Assets Gross Amount of Derivative Assets Presented in the Consolidated Balance Sheet Gross Amount of Eligible Offsetting
Recognized
Derivative Assets Cash Collateral
Received Net Amount of
Derivative Assets(In thousands of dollars) Derivatives subject to master netting agreements $ 63,981 $ (63,981 ) $ — $ — $ 188,576 $ (91,627 ) $ — $ 96,949 Total $ 63,981 $ (63,981 ) $ — $ — $ 188,576 $ (91,627 ) $ — $ 96,949 Gross Amounts not Offset in the Consolidated Balance Sheet that are Subject to Master Netting Agreements As of December 31, 2014 As of December 31, 2013 Gross Amount of Derivative Liabilities Presented in the Consolidated Balance Sheet Gross Amount of Eligible Offsetting
Recognized
Derivative Assets Cash Collateral
Pledged Net Amount of
Derivative Liabilities Gross Amount of Derivative Liabilities Presented in the Consolidated Balance Sheet Gross Amount of Eligible Offsetting
Recognized
Derivative Liabilities Cash Collateral
Pledged Net Amount of
Derivative Liabilities(In thousands of dollars) Derivatives subject to master netting agreements $ (767,635 ) $ 63,981 $ — $ (703,654 ) $ (100,260 ) $ 91,627 $ — $ (8,633 ) Total $ (767,635 ) $ 63,981 $ — $ (703,654 ) $ (100,260 ) $ 91,627 $ — $ (8,633 ) accumulatedAccumulated other comprehensive (loss) income until the underlying hedged transactions are recognized in earnings. The foreign currency transaction gain or loss of our non-derivative financial instruments and the changes in the fair value of derivatives designated as hedges of our net investment in foreign operations and investments are recognized as a component ofaccumulatedAccumulated other comprehensive (loss) income along with the associated foreign currency translation adjustment of the foreign operation.commensurate with the contractual life of the derivative instrument, up to three years, for interest rate and foreign currency relationships and four years for fuel relationships.utilizing market data relevant to the hedge horizon of each hedge relationship. High effectiveness is achieved when a statistically valid relationship reflects a high degree of offset and correlation between the changes in the fair values of the derivative instrument and the hedged item. The determination of ineffectiveness is based on the amount of dollar offset between the change in fair value of the derivative instrument and the change in fair value of the hedged item at the end of theROYAL CARIBBEAN CRUISES LTD.NOTES TO THE CONSOLIDATED FINANCIAL STATEMENTS (Continued)Note 13.Fair Value Measurements and Derivative Instruments (Continued)immediately and reported inotherOther income (expense) in our consolidated statements of comprehensive income (loss).2012,2014, approximately 45.8%28.5% of our long-term debt was effectively fixed as compared to 40%34.6% as of December 31, 2011.2013. We use interest rate swap agreements to modify our exposure to interest rate movements and to manage our interest expense.20122014 and 2011,2013, we maintained interest rate swap agreements on the $420.0 million fixed rate portion of ourOasis of the Seas Seas unsecured amortizing term loan.loan and on the $650.0 million unsecured senior notes due 2022. The interest rate swap agreements on Oasis of the Seas debt effectively changed the interest rate on the balance of the unsecured term loan, which was $315.0$245.0 million as of December 31, 2012,2014, from a fixed rate of 5.41% to a LIBOR-based floating rate equal to LIBOR plus 3.87%, currently approximately 4.42%4.20%. The interest rate swap agreements on the $650.0 million unsecured senior notes effectively changed the interest rate of the unsecured senior notes from a fixed rate of 5.25% to a LIBOR-based floating rate equal to LIBOR plus 3.63%, currently approximately 3.86%. These interest rate swap agreements are accounted for as fair value hedges. During 2012, we terminated our interest rate swap agreements that effectively changed $350.0 million of debt with a fixed rate of 7.25% to LIBOR-based floating rate debt. The swaps were designated as fair value hedges and terminating the swaps did not result in a gain or loss. We received net cash proceeds of approximately $60.6 million upon termination. A $60.1 million increase to the carrying value of the debt is being amortized to reduce interest expense over the remaining life of the debt.During 2012,At December 31, 2014 and 2013, we entered intomaintained forward-starting interest rate swap agreements that hedge the anticipated unsecured amortizing term loans that will finance our purchase ofQuantum of the Seas andAnthem of the Seas. Forward-starting interest rate swaps hedging theQuantum of the Seas loan will effectively convert the interest rate for $735.0 million of the anticipated loan balance from LIBOR plus 1.30% to a fixed rate of 3.74% (inclusive of margin) beginning in October 2014. Forward-starting interest rate swaps hedging theAnthem of the Seas loan will effectively convert the interest rate for $725.0 million of the anticipated loan balance from LIBOR plus 1.30% to a fixed rate of 3.86% (inclusive of margin) beginning in April 2015. These interest rate swap agreements are accounted for as cash flow hedges.ROYAL CARIBBEAN CRUISES LTD.NOTES TO THE CONSOLIDATED FINANCIAL STATEMENTS (Continued)Note 13.Fair Value Measurements and Derivative Instruments (Continued)20122014 and 2011,December 31, 2013, we maintained forward-starting interest rate swap agreements that beginning April 2013on our Celebrity Reflection term loan. Our interest rate swap agreements effectively convertconverted the interest rate on a portion of theCelebrity Reflection unsecured amortizing term loan balance forof approximately $627.2$545.4 million from LIBOR plus 0.40% to a fixed-ratefixed rate (including applicable margin) of 2.85% through the term of the loan. Furthermore, at December 31, 2014, we maintained interest rate swap agreements on our Quantum of the Seas term loan. Our interest rate swap agreements effectively converted the interest rate on a portion of the Quantum of the Seas unsecured amortizing term loan balance of approximately $735.0 million from LIBOR plus 1.30% to a fixed rate of 3.74% (inclusive of margin) through the term of the loan. These interest rate swap agreements are accounted for as cash flow hedges.20122014 and 20112013 was $2.4$2.9 billion and $1.3$3.0 billion, respectively.eurosEuros, our foreign currency denominated debt and our growing international business operations. We enter into foreign currency forward contracts, collar options and cross currency swap agreements to manage portions of the exposure to movements in foreign currency exchange rates. As of December 31, 2012,2014, the aggregate cost of our ships on order was approximately $3.6$5.0 billion, of which we had deposited $131.0$394.4 million as of such date. Approximately 49.7%28.8% and 43.3%36.3% of the aggregate cost of the ships under construction was exposed to fluctuations in the euroEuro exchange rate at December 31, 20122014 and December 31, 2011,2013, respectively. The majority of our foreign currency forward contracts, collar options and cross currency swap agreements are accounted for as cash flow, or fair value or net investment hedges depending on the designation of the related hedge. We terminated a portion of our foreign currency forward contracts forCelebrity Reflection prior to the ship's delivery in 2012 because the forward contract maturity dates were not aligned with the ship's delivery date. The terminated contracts were designated as cash flow hedges. Simultaneously, we entered into new foreign currency forward contracts that were aligned with the ship's delivery date and designated the contracts as cash flow hedges. We effected the termination of the contracts by entering into offsetting foreign currency forward contracts. Neither the original nor the offsetting foreign currency forward contracts were designated as hedging instruments. As a result, subsequent changes in the fair value of the original and offsetting foreign currency forward contracts were recognized in earnings immediately and were reported withinother income (expense) in our consolidated statements of comprehensive income (loss). We deferred a loss of $10.8 million withinaccumulated other comprehensive income (loss) and a gain of $1.7 million withinproperty and equipment, net for the terminated contracts. the fourth quarter of 2012, we began recognition of the net deferred loss of $9.1 million todepreciation expense over the estimated useful life of the vessel. During 2012,2013, we entered into foreign currency collar optionsforward contracts to hedge a portion€365.0 million of our foreign currency exposure on the construction contract price ofAnthem of the Seas.€745.0 million 5.625% unsecured senior notes due January 2014. These foreign currency collar options areforward contracts were accounted for as cash flow hedges and mature in April 2015. During 2012, we terminated our cross currency swap agreements that effectively changed €150.0 million of our €1.0 billion unsecured senior notes which bear interest at a fixed rate of 5.625%, to $190.9 million with a fixed rate of 6.68%. We received net cash proceeds of approximately $9.1 million and deferred a loss of $2.6 million withinaccumulated other comprehensive income (loss)ROYAL CARIBBEAN CRUISES LTD.NOTES TO THE CONSOLIDATED FINANCIAL STATEMENTS (Continued)Note 13.Fair Value Measurements and Derivative Instruments (Continued)which we will recognize withininterest expense, net of capitalized interest over the remaining life of the debt.2012,2014, we maintained an average of approximately $334.7$474.0 million of these foreign currency forward contracts. These instruments are not designated as hedging instruments. ChangesIn 2014, 2013 and 2012 changes in the fair value of the foreign currency forward contracts were (losses) gains of approximately $(48.6) million, $(19.3) million and $7.7 million, arerespectively, which offset gains (losses) arising from the remeasurement of monetary assets and liabilities denominated in foreign currencies in those same years of $49.5 million, $13.4 million and $(11.8) million, respectively. These changes were recognized in earnings withinotherOther income (expense)in our consolidated statements of comprehensive income (loss). The notional amount of outstanding foreign exchange contracts including our forward contracts, cross currency swap agreements and collar options as of December 31, 2012 and December 31, 2011 was $1.2 billion and $0.9 billion, respectively.Non-Derivative Instrumentspartiallyalso address the exposure of our investments in foreign operations by denominating a portion of our debt in our subsidiaries' and investments' functional currencies and designating it as a hedge of these subsidiaries and investments. We had assigneddesignated debt as a hedge of our net investments in Pullmantur and TUI Cruises of approximately €481.7€139.4 million and €665.0€544.9 million, or approximately $635.1$168.7 million and $863.2$750.8 million, through December 31, 20122014 and 2011,2013, respectively.2012,2014, we have hedged the variability in future cash flows for certain forecasted fuel transactions occurring through 2016.2018. As of December 31, 20122014 and 2011,2013, we had entered into the following outstanding fuel swap agreements: Fuel Swap Agreements As of
December 31, 2012 As of
December 31, 2011 Fuel Swap Agreements (metric tons) As of December 31, 2014 As of December 31, 2013 — 738,000 755,000 644,000 (metric tons) 635,000 418,000 — 762,000 363,000 284,000 806,000 665,000 104,000 — 802,000 372,000 2017 525,000 74,000 2018 226,000 — ROYAL CARIBBEAN CRUISES LTD.NOTES TO THE CONSOLIDATED FINANCIAL STATEMENTS (Continued)Note 13.Fair Value Measurements and Derivative Instruments (Continued) Fuel Swap Agreements Fuel Swap Agreements As of
December 31, 2012 As of
December 31, 2011 As of December 31, 2014 As of December 31, 2013 (% hedged) (% hedged) 0 % 55 % 55 % 47 % 45 % 30 % — 57 % 25 % 20 % 58 % 45 % 7 % — 55 % 25 % 2017 35 % 5 % 2018 15 % — % 20122014 and 2011, $47.22013, $(223.1) million and $78.5$9.5 million, respectively, of estimated unrealized net gains(loss) gain associated with our cash flow hedges pertaining to fuel swap agreements were expected to be reclassified to earnings fromAccumulated other accumulated comprehensive (loss) income within the next twelve months. Reclassification is expected to occur as the result of fuel consumption associated with our hedged forecasted fuel purchases. During 2012, we terminated our remaining fuel call options by selling offsetting fuel call options. We received net cash proceeds of approximately $10.7 million upon termination. Subsequent to the termination, neither the original nor the offsetting fuel call options are designated as hedging instruments and changes in their fair value are recognized in earnings immediately and are reported inother income (expense) in our consolidated statements of comprehensive income (loss).Note 13.Fair Value Measurements and Derivative Instruments (Continued) Fair Value of Derivative Instruments Asset Derivatives Liability Derivatives Balance Sheet
Location As of December 31, 2014 As of December 31, 2013 Balance Sheet
Location As of December 31, 2014 As of December 31, 2013 Fair Value Fair Value Fair Value Fair Value (In thousands) Interest rate swaps Other assets $ — $ 56,571 Other long-term liabilities $ 65,768 $ 66,920 Foreign currency forward contracts Derivative financial instruments — 61,596 Derivative financial instruments 17,619 — Foreign currency forward contracts Other assets 63,981 13,783 Other long-term liabilities 164,627 — Foreign currency collar options Other assets — 22,172 Other long-term liabilities — — Foreign currency collar options Derivative financial instruments — — Derivative financial instruments 21,855 — Fuel swaps Derivative financial instruments — 10,902 Derivative financial instruments 227,512 1,657 Fuel swaps Other assets — 8,205 Other long-term liabilities 270,254 9,052 Total derivatives designated as hedging instruments under ASC 815-20 63,981 173,229 767,635 77,629 Derivatives not designated as hedging instruments under ASC 815-20 Foreign currency forward contracts Derivative Financial Instruments — 15,347 Derivative financial instruments — 22,631 Total derivatives not designated as hedging instruments under ASC 815-20 — 15,347 — 22,631 Total derivatives $ 63,981 $ 188,576 $ 767,635 $ 100,260 (1) Fair Value of Derivative Instruments Asset Derivatives Liability Derivatives As of
December 31,
2012 As of
December 31,
2011 As of
December 31,
2012 As of
December 31,
2011 Balance Sheet
Location Balance Sheet
Location Fair Value Fair Value Fair Value Fair Value Other Assets $ 5,099 $ 65,531 Other long-term liabilities $ 55,471 $ 11,369 Other Assets — 2,914 Other long-term liabilities — — Derivative Financial Instruments 951 1,895 Accrued expenses and other liabilities 338 31,775 Other Assets 11,564 — Other long-term liabilities 1,000 — Other Assets 8,974 — Other long-term liabilities — — Derivative Financial Instruments 48,624 82,747 Accrued expenses and other liabilities 1,761 — Other Assets 8,585 26,258 Other long-term liabilities 6,369 29,213 83,797 179,345 64,939 72,357 Other Assets $ 4,440 $ 5,414 Other long-term liabilities $ 11,475 $ 11,987 Derivative Financial Instruments — — Accrued expenses and other liabilities 475 — Derivative Financial Instruments 8,252 — Accrued expenses and other liabilities 8,230 — Other Assets — 16,371 Other long-term liabilities — — 12,692 21,785 20,180 11,987 $ 96,489 $ 201,130 $ 85,119 $ 84,344 (1)Accounting Standard Codification 815-20 "Derivatives and Hedging".ROYAL CARIBBEAN CRUISES LTD.NOTES TO THE CONSOLIDATED FINANCIAL STATEMENTS (Continued)Note 13.Fair Value Measurements and Derivative Instruments (Continued)faircarrying value and line item caption of non-derivative instruments designated as hedging instruments recorded waswithin our consolidated balance sheets were as follows: Carrying Value Carrying Value
hedging instrument under ASC 815-20 Balance Sheet Location As of December 31,
2012 As of December 31,
2011 Balance Sheet Location As of December 31, 2014 As of December 31, 2013 (In thousands) Current portion of long-term debt $ 17,516 $ 17,246 Current portion of long-term debt $ — $ 477,442 Long-term debt 617,593 845,971 Long-term debt 168,718 273,354 $ 168,718 $ 750,796 $ 635,109 $ 863,217 Location of Gain
(Loss)
Recognized in
Income on
Derivative and
Hedged Item Amount of Gain (Loss)
Recognized in
Income on Derivative Amount of Gain (Loss)
Recognized in
Income on Hedged Item
under ASC 815-20 Fair Value Hedging
Relationships Year Ended
December 31,
2012 Year Ended
December 31,
2011 Year Ended
December 31,
2012 Year Ended
December 31,
2011 Interest expense, net of interest capitalized $ 13,682 $ 18,278 $ 32,389 $ 31,045 Other income (expense) (1,763 ) 7,817 2,070 (7,223 ) Extinguishment of unsecured senior notes — — 9,698 — Other income (expense) — 22,901 — (23,720 ) $ 11,919 $ 48,996 $ 44,157 $ 102 Note 13.Fair Value Measurements and Derivative Instruments (Continued) Location of Gain
(Loss)
Recognized in
Income on
Derivative and
Hedged Item Amount of Gain (Loss)
Recognized in
Income on Derivative Amount of (Loss) Gain
Recognized in
Income on Hedged ItemDerivatives and related Hedged Items
under ASC 815-20 Fair Value Hedging
Relationships Year Ended December 31, 2014 Year Ended December 31, 2013 Year Ended December 31, 2014 Year Ended December 31, 2013 (In thousands) Interest rate swaps Interest expense, net of interest capitalized $ 12,217 $ 9,354 $ 17,403 $ 37,745 Interest rate swaps Other income (expense) 42,530 (71,630 ) (34,304 ) 68,743 $ 54,747 $ (62,276 ) $ (16,901 ) $ 106,488 hedging instruments in cash flow hedgeshedging instruments on the consolidated financial statements was as follows: Amount of Gain (Loss)
Recognized in Income
on Derivative (Ineffective
Portion and
Amount
Excluded from
Effectiveness testing) Amount of Gain (Loss)
Recognized in OCI
on Derivative
(Effective Portion) Amount of Gain (Loss)
Reclassified from Accumulated
OCI into Income
(Effective Portion) Location of Gain
(Loss) Recognized
in Income on
Derivative
(Ineffective
Portion and Amount Excluded from
Effectiveness
Testing) Location of Gain
(Loss) Reclassified
from Accumulated
OCI into Income
(Effective Portion)Amount of Gain (Loss)
Recognized in Income
on Derivative (Ineffective
Portion and
Amount
Excluded from
Effectiveness testing) Amount of (Loss) Gain
Recognized in OCI
on Derivative
(Effective Portion) Location of
(Loss) Gain Reclassified
from Accumulated
OCI into Income
(Effective Portion) Amount of (Loss) Gain
Reclassified from Accumulated
OCI into Income
(Effective Portion) Location of
(Loss) Gain Recognized
in Income on
Derivative
(Ineffective
Portion and Amount Excluded from
Effectiveness
Testing) Amount of (Loss) Gain
Recognized in Income
on Derivative (Ineffective
Portion and
Amount
Excluded from
Effectiveness testing)
ASC 815-20 Cash Flow
Hedging Relationships Year Ended
December 31,
2012 Year Ended
December 31,
2011 Year Ended
December 31,
2012 Year Ended
December 31,
2011 Location of Gain
(Loss) Recognized
in Income on
Derivative
(Ineffective
Portion and Amount Excluded from
Effectiveness
Testing)Year Ended
December 31,
2012 Year Ended
December 31,
2011 Year Ended December 31, 2014 Year Ended December 31, 2013 Year Ended December 31, 2014 Year Ended December 31, 2013 Year Ended December 31, 2014 Year Ended December 31, 2013 In thousands $ 851 $ (6,013 ) $ 2,505 $ (15,011 ) — $ — (In thousands)
—
—
(2,209
)
—
—
— $ — $ — Interest Expense $ (261 ) $ (3,531 ) Other income (expense) $ — $ —
(44,971
)
(10,131
)
—
—
(348
)
(21
) (97,851 ) 111,223 Other income (expense) — — Other income (expense) (99 ) 431 Foreign currency forward contracts (246,627 ) 68,364 Depreciation and amortization expenses (1,887 ) (1,797 ) Other income (expense) (34 ) 9
11,928
(22,263
)
(953
)
(734
)
—
(1,015
) — — Other income (expense) (4,291 ) 27,423 Other income (expense) — —
—
(12,375
)
(953
)
(285
)
—
— — — Interest expense (57 ) (440 ) Other income (expense) — —
3,316
—
—
—
—
— (44,028 ) 13,199 Depreciation and amortization expenses — — Other income (expense) — —
87,014
121,262
110,995
162,616
(1,041
)
7,086 (515,324 ) 4,642 Fuel (27,984 ) 47,944 Other income (expense) (14,936 ) (3,413 ) $ (903,830 ) $ 197,428 $ (34,480 ) $ 69,599 $ (15,069 ) $ (2,973 )
$
58,138
$
70,480
$
109,385
$
146,586
$
(1,389
)
$
6,050 hedging instruments in net investment hedgeshedging instruments on the consolidated financial statements was as follows: Amount of Gain (Loss) Recognized in Income
(Ineffective Portion and
Amount Excluded from
Effectiveness Testing) Amount of Gain (Loss)
Recognized in OCI
(Effective Portion) Location of Gain
(Loss) in Income
(Ineffective Portion
and Amount
Excluded from
Effectiveness Testing) Amount of Gain (Loss)
Recognized in OCI
(Effective Portion) Location of Gain
(Loss) in Income
(Ineffective Portion
and Amount
Excluded from
Effectiveness Testing) Amount of Gain (Loss) Recognized in Income
(Ineffective Portion and
Amount Excluded from
Effectiveness Testing)
Net Investment Hedging Relationships Year Ended
December 31,
2012 Year Ended
December 31,
2011 Year Ended
December 31,
2012 Year Ended
December 31,
2011 Year Ended December 31, 2014 Year Ended December 31, 2013 Year Ended December 31, 2014 Year Ended December 31, 2013 In thousands (In thousands) $ (11,065 ) $ 13,241 $ — $ — $ 25,382 $ (34,295 ) Other income (expense) $ — $ — $ 25,382 $ (34,295 ) $ — $ — $ (11,065 ) $ 13,241 $ — $ — ROYAL CARIBBEAN CRUISES LTD.NOTES TO THE CONSOLIDATED FINANCIAL STATEMENTS (Continued)Note 13.Fair Value Measurements and Derivative Instruments (Continued) Amount of Gain (Loss) Recognized
in Income on Derivative Amount of Gain (Loss) Recognized
in Income on Derivative
Instruments under ASC 815-20 Location of Gain (Loss)
Recognized in Income
on Derivative Year Ended
December 31, 2012 Year Ended
December 31, 2011 Location of Gain (Loss)
Recognized in Income
on Derivative Year Ended December 31, 2014 Year Ended December 31, 2013 In thousands (In thousands) Other income (expense) $ 7,152 $ 4,633 Other income (expense) $ (48,791 ) $ (21,244 ) Other income (expense) (3,058 ) — Other income (expense) (1,795 ) 243 Other income (expense) (5,613 ) 18,915 Other income (expense) — (23 ) $ (50,586 ) $ (21,024 ) $ (1,519 ) $ 23,548 andor on allany succeeding fifth-year anniversariesanniversary our credit ratings for our senior unsecured debt were to be below BBB- by Standard & Poor's and Baa3 by Moody's, then each counterparty to such derivative transaction with whom we are in a net liability position that exceeds the applicable minimum call amount may demand that we post collateral in an amount equal to the net liability position. The amount of collateral required to be posted following such event will change each time our net liability position increases or decreases by more than the applicable minimum call amount. If our credit rating for our senior unsecured debt is subsequently equal to, or above BBB- by Standard & Poor's or Baa3 by Moody's, then any collateral posted at such time will be released to us and we will no longer be required to post collateral unless we meet the collateral trigger requirement at the next fifth-year anniversary. Currently, our senior unsecured debt credit rating is BB with a stablepositive outlook by Standard & Poor's and Ba1 with a stable outlook by Moody's. We currently have fourfive interest rate derivative hedges that have a term of at least five years. The aggregate fair values of all derivative instruments with such credit-related contingent features in net liability positions as of December 31, 20122014 and December 31, 20112013 were $55.5$65.8 million and $11.4$66.9 million, respectively, which do not include the impact of any such derivatives in net asset positions. The earliest that any of the fourfive interest rate derivative hedges will reach their fifth anniversary is November 2016. Therefore, as of December 31, 2012,2014, we were not required to post collateral for any of our derivative transactions.14.15.Commitments and Contingencies2012,2014, we had two Quantum-class ships and onetwo Oasis-class shipships on order for our Royal Caribbean International brand with an aggregate capacity of approximately 13,60019,200 berths. for our Oasis-class ship is subject to certain closing conditions to effectiveness expected to occur in the second quarter of 2015. The ships will each have a capacity of approximately 2,900 berths and are expected to enter service in the second half of 2018 and the first half of 2020.become effective in the first quarter of 2013. We also have an option to construct a fourth Oasis-class ship which will expire five days prior to the first anniversary of the effective date of the contract. During 2012, we exercised our option under the agreement with Meyer Werft to constructAnthem of the Seas, the second Quantum-class ship, with approximately 4,100 berths which is expected to enterROYAL CARIBBEAN CRUISES LTD.NOTES TO THE CONSOLIDATED FINANCIAL STATEMENTS (Continued)Note 14.Commitments and Contingencies (Continued)2015. During 2011,2018. In January 2015, we entered into a credit agreements to financeagreement for the construction ofQuantumUS dollar financing of the Seas andAnthem of the Seas. Each facilityfourth Oasis-class ship. The credit agreement makes available to us an unsecured term loansloan in an amount up to the United States dollarUS Dollar equivalent corresponding toof €931.2 million, or approximately €595.0 million. Hermes has agreed to guarantee to$1.1 billion, based on the lenders payment of 95%exchange rate as of the financing.transaction date. The loans will amortizeloan amortizes semi-annually and will mature 12 years following delivery of the applicable ship. PursuantAt our election, prior to the credit agreements,ship delivery, interest on the loansloan will accrue either (1) at our election (to be made prior to funding) at either a fixed rate of 4.76%3.82% (inclusive of the applicable margin) or (2) at a floating rate ofequal to LIBOR plus a margin of 1.30%1.10%. Separately, have entered into forward-starting interest rate swap agreements which effectively converta credit agreement for the floating ratesUS dollar financing of a portion of the third Oasis-class ship. The credit agreement makes available to us peran unsecured term loan in an amount up to the credit agreementsUS dollar equivalent of €178.4 million, or approximately $215.9 million, based on the exchange rate at December 31, 2014. The loan amortizes semi-annually and will mature 12 years following delivery of the ship. At our election, prior to the ship delivery, interest on the loan will accrue either (1) at a fixed rates (includingrate of 2.53% (inclusive of the applicable margin) of 3.74% and 3.86% forQuantumor (2) at a floating rate equal to LIBOR plus 1.20%. In connection with this credit agreement, we amended the €892.2 million credit agreement, originally entered into in 2013 to finance the ship, reducing the maximum facility amount to approximately €713.8 million. Both of the Seasfacilities are 100% guaranteed by COFACE. andAnthem of the Seas, respectively. See Note 13.Fair Value Measurements and Derivative Instruments for further information regarding these swap agreements.2012,2014, the aggregate cost of our ships on order, not including those subject to closing conditions, was approximately $3.6$5.0 billion, of which we had deposited $131.0$394.4 million as of such date. Approximately 49.7%28.8% of the aggregate cost was exposed to fluctuations in the euroEuro exchange rate at December 31, 2012.2014. (See Note 13.14. Fair Value Measurements and Derivative Instruments). Between August 1, 2011 and September 8, 2011, three similar purported class action lawsuits were filed against us and certain of our current and former officers in the U.S. District Court of the Southern District of Florida. The cases have since been consolidated and a consolidated amended complaint was filed on February 17, 2012. The consolidated amended complaint was filed on behalf of a purported class of purchasers of our common stock during the period from October 26, 2010 through July 27, 2011 and names the Company, our Chairman and CEO, our CFO, the President and CEO of our Royal Caribbean International brand and the former President and CEO of our Celebrity Cruises brand as defendants. The consolidated amended complaint alleges violations of Section 10(b) of the Securities Exchange Act of 1934 and SEC Rule 10b-5 as well as, in the case of the individual defendants, the control person provisions of the Securities Exchange Act. The complaint principally alleges that the defendants knowingly made incorrect statements concerning the Company's outlook for 2011 by not taking into proper account lagging European and Mediterranean bookings. The consolidated amended complaint seeks unspecified damages, interest, and attorneys' fees. We filed a motion to dismiss the complaint on April 9, 2012. Briefing on that motion was completed on August 2, 2012. The motion is currently pending. We believe the claims made against us are without merit and we intend to vigorously defend ourselves against them.vessels allegingvessels. The complaint alleged that theythe stateroom attendants were required to pay other crew members to help with their duties in violation of the U.S. Seaman's Wage Act. The lawsuit also allegesand that certain stateroom attendants were required to work back of house assignments without the ability to earn gratuities, in each case in violation of the U.S. Seaman'sSeaman’s Wage Act. Plaintiffs seek judgment for damages, wage penalties and interest in an indeterminate amount. In May 2012, the Courtdistrict court granted our motion to dismiss the complaint on the basis that the applicable collective bargaining agreement requires any such claims to be arbitrated. Plaintiff's appeal of this decision was dismissed for lack of jurisdiction by theThe United States Court of Appeals, 11th Circuit. Plaintiffs11th Circuit, affirmed the district court’s dismissal and denied the plaintiffs’ petition for re-hearing and re-hearing en banc. In October 2014, the United States Supreme Court denied the plaintiffs’ request to review the order compelling arbitration. Subsequently, approximately 575 crew members submitted demands for arbitration. The demands make substantially the same allegations as in the federal court complaint and are similarly seeking damages, wage penalties and interest in an indeterminate amount. Unlike the federal court complaint, the demands for arbitration are being brought individually by each of the crew members and not on behalf of a purported class of stateroom attendants. At this time, we are unableNote 14.Commitments and Contingencies (Continued)seeking renew their appeal. Weestimate the possible impact of this matter on us. However, we believe the appeal is without merit as are the underlying claims made against us are without merit, and we intend to vigorously defend ourselves against them. Because of the inherent uncertainty as to the outcome of the proceedings described above, we are unable at this time to estimate the possible impact of these matters on us.TheIn December 2014, we terminated the leasing of Brilliance of the Seas and, as part of the agreement, purchased the ship for a net settlement purchase price of approximately £175.4 million or $275.4 million. Refer to Note 5. Property and Equipment for further discussion on the transaction. Prior to the purchase, the lease payments varyvaried based on sterling LIBOR. The lease has a contractual lifeLIBOR and were included in Other operating expenses in our consolidated statements of 25 years; however, both the lessor and we have certain rights to cancel the lease at year 18 (i.e. 2020) upon advance notice given approximately one year prior to cancellation. In the event of early termination at year 18, we have the option to cause the salecomprehensive income (loss). Brilliance of the vessel at its fair valueSeas lease expense amounts were approximately £11.7 million, £12.3 million and to use the proceeds towards the applicable termination payment. Alternatively, we could opt at such time to make a termination payment of approximately £65.4£14.6 million, or approximately $106.3$19.3 million, based on$19.1 million and $23.3 million for the exchange rate atyears ended December 31, 2014, 2013 and 2012, and relinquish our right to cause the sale of the vessel. Under current circumstances we do not believe early termination of this lease is probable.respectively. Under theBrilliance of the Seas operating lease, we have agreed to indemnify the lessor to the extent its after-tax return is negatively impacted by unfavorable changes in corporate tax rates, capital allowance deductions and certain unfavorable determinations which may be made by United Kingdom tax authorities. These indemnifications could result in an increase in our lease payments. are unable to estimate the maximum potential increase in our lease payments due to the various circumstances, timing or a combination of events that could trigger such indemnifications. The United Kingdom tax authorities are disputing the lessor's accounting treatment of the lease and the lessor and tax authorities are in discussions on the matter. If the characterization of the lease is ultimately determined to be incorrect, we could be required to indemnify the lessor under certain circumstances. The lessor has advised us that they believe their characterization of the lease is correct. Based on the foregoing and our review of available information, we do not believe an indemnification payment is probable. However, if the lessor loses its dispute and we are required to indemnify the lessor, we cannot at this time predict the impact that such an occurrence would have on our financial condition and results of operations.ROYAL CARIBBEAN CRUISES LTD.NOTES TO THE CONSOLIDATED FINANCIAL STATEMENTS (Continued)Note 14.Commitments and Contingencies (Continued) In addition, we are obligated under other noncancelable operating leases primarily for offices, warehouses and motor vehicles. As of December 31, 2012,2014, future minimum lease payments under noncancelable operating leases were as follows (in thousands): $ 65,929 60,357 58,206 $ 18,154 55,547 16,279 52,796 12,471 2018 9,919 2019 7,699 338,113 124,997 $ 189,519 $ 630,948 $61.6$52.0 million, $60.2$57.5 million and $50.8$61.6 million for the years 2014, 2013 and 2012, 2011 and 2010, respectively.ROYAL CARIBBEAN CRUISES LTD.NOTES TO THE CONSOLIDATED FINANCIAL STATEMENTS (Continued)Note 14.Commitments and Contingencies (Continued)2012,2014, we have future commitments to pay for our usage of certain port facilities, marine consumables, services and maintenance contracts as follows (in thousands): $ 231,137 144,288 128,805 $ 214,817 83,603 149,336 94,631 154,253 2018 82,010 2019 115,002 96,648 127,843 $ 843,261 $ 779,112 15.16. Restructuring and Related Impairment Charges 2014 2013 Restructuring exit costs $ 4,318 $ 23,432 Impairment charges — 33,514 Restructuring and related impairment charges $ 4,318 $ 56,946 Beginning
Balance
January 1, 2013 Accruals Payments Beginning
Balance
January 1, 2014 Accruals Payments Ending Balance December 31, 2014 Cumulative
Charges
Incurred Expected
Additional
Expenses
to be
IncurredTermination benefits $ — $ 9,638 $ 1,323 $ 8,315 $ 917 $ 8,926 $ 306 $ 10,555 $ — Contract termination costs — 4,142 4,016 126 (58 ) 68 — 4,084 — Other related costs — 4,379 2,982 1,397 234 1,334 297 4,613 — Total $ — $ 18,159 $ 8,321 $ 9,838 $ 1,093 $ 10,328 $ 603 $ 19,252 $ — Beginning
Balance
January 1, 2013 Accruals Payments Beginning
Balance
January 1,
2014 Accruals Payments Ending Balance December 31, 2014 Cumulative
Charges
Incurred Expected
Additional
Expenses
to be
Incurred(2)Termination benefits $ — $ 3,910 $ — $ 3,910 $ 3,084 $ 4,879 $ 2,115 $ 6,994 $ — Contract termination costs — 847 — 847 (607 ) — 240 240 — Other related costs — 516 — 516 748 1,264 — 1,264 — Total $ — $ 5,273 $ — $ 5,273 $ 3,225 $ 6,143 $ 2,355 $ 8,498 $ — (In thousands, except per share data) First Quarter Second Quarter Third Quarter Fourth Quarter 2014 2013 2014 2013 2014 2013 2014 2013 $ 1,887,224 $ 1,911,220 $ 1,980,043 $ 1,882,767 $ 2,388,762 $ 2,311,749 $ 1,817,826 $ 1,854,158 $ 97,466 $ 165,632 $ 195,587 $ 113,338 $ 529,462 $ 444,209 $ 119,344 $ 74,969 $ 26,457 $ 76,226 $ 137,673 $ 24,747 $ 490,248 $ 365,701 $ 109,768 $ 7,018 Earnings per share: Basic $ 0.12 $ 0.35 $ 0.62 $ 0.11 $ 2.20 $ 1.66 $ 0.50 $ 0.03 Diluted $ 0.12 $ 0.35 $ 0.62 $ 0.11 $ 2.19 $ 1.65 $ 0.49 $ 0.03 Dividends declared per share $ 0.25 $ 0.12 $ 0.25 $ 0.12 $ 0.30 $ 0.25 $ 0.30 $ 0.25 (1) Our revenues are seasonal based on the demand for cruises. Demand is strongest for cruises during the Northern Hemisphere's summer months and holidays. (2) Amounts for the fourth quarter of 2013 include an impairment charge of $33.5 million to write down the assets held for sale related to the businesses to be sold and certain long-lived assets, consisting of aircraft owned and operated by Pullmantur Air, to their fair value. (In thousands, except per share data) First Quarter Second Quarter Third Quarter Fourth Quarter 2012 2011 2012 2011 2012 2011 2012 2011 $ 1,834,480 $ 1,671,995 $ 1,821,004 $ 1,767,873 $ 2,226,390 $ 2,321,994 $ 1,806,150 $ 1,775,401 $ 135,375 $ 149,534 $ 96,905 $ 168,190 $ 452,137 $ 507,742 $ (281,307 ) $ 106,162 $ 46,964 $ 78,410 $ (3,653 ) $ 93,491 $ 367,779 $ 398,958 $ (392,803 ) $ 36,562 $ 0.22 $ 0.36 $ (0.02 ) $ 0.43 $ 1.69 $ 1.84 $ (1.80 ) $ 0.17 $ 0.21 $ 0.36 $ (0.02 ) $ 0.43 $ 1.68 $ 1.82 $ (1.80 ) $ 0.17 $ 0.10 $ — $ 0.10 $ — $ 0.12 $ 0.10 $ 0.12 $ 0.10
ROYAL CARIBBEAN CRUISES LTD.(1)Our revenues are seasonal based on the demand for cruises. Demand is strongest for cruises during the Northern Hemisphere's summer months and holidays.(2)Amounts for the fourth quarter of 2012, include an impairment charge of $385.4 million to write down Pullmantur's goodwill to its implied fair value and to write down trademarks and trade names and certain long-lived assets, consisting of three aircraft owned and operated by Pullmantur Air, to their fair value.(3)Amounts for the fourth quarter of 2012, include a $33.7 million charge to record a 100% valuation allowance related to our deferred tax assets for Pullmantur. In addition, we reduced the deferred tax liability related to Pullmantur's trademarks and trade names by $5.2 million. These adjustments resulted in an increase of $28.5 million to other (expense) income.
NOTES TO THE CONSOLIDATED FINANCIAL STATEMENTS (Continued)(3) (4)