Use these links to rapidly review the documentTable of ContentsTABLE OF CONTENTS1WADDELL & REED FINANCIAL, INC. Index to Consolidated Financial StatementsTABLE OF CONTENTS2
UNITED STATES
SECURITIES AND EXCHANGE COMMISSION
Washington, D.C. 20549
FORM 10-K
ý Annual report pursuant to Section 13 or 15(d) of the Securities Exchange Act of 1934
For the fiscal year ended December 31, 20122015
OR
o Transition report pursuant to Section 13 or 15(d) of the Securities Exchange Act of 1934
Commission file number 001-13913
WADDELL & REED FINANCIAL, INC.
(Exact name of registrant as specified in its charter)
| Delaware (State or other jurisdiction of incorporation or organization) | 51-0261715 (I.R.S. Employer Identification No.) |
6300 Lamar Avenue
Overland Park, Kansas 66202
913-236-2000
(Address, including zip code, and telephone number of Registrant's principal executive offices)
SECURITIES REGISTERED PURSUANT TO SECTION 12(b) OF THE ACT
| Title of each class | Name of each exchange on which registered | |
| Class A Common Stock, $.01 par value | New York Stock Exchange |
SECURITIES REGISTERED PURSUANT TO SECTION 12(g) OF THE ACT:
None
(Title of class)
Indicate by check mark if the registrant is a well-known seasoned issuer, as defined in Rule 405 of the Securities Act. YES ý NO o
Indicate by check mark if the registrant is not required to file reports pursuant to Section 13 or Section 15(d) of the Act. YES o NO ý.
Indicate by check mark whether the registrant (1) has filed all reports required to be filed by Section 13 or 15(d) of the Securities Exchange Act of 1934 during the preceding 12 months (or for such shorter period that the registrant was required to file such reports), and (2) has been subject to such filing requirements for the past 90 days. Yes ý No o.
Indicate by check mark whether the registrant has submitted electronically and posted on its corporate Web site, if any, every Interactive Data File required to be submitted and posted pursuant to Rule 405 of Regulation S-T during the preceding 12 months (or for such shorter period that the registrant was required to submit and post such files). Yes ý No o.
Indicate by check mark if disclosure of delinquent filers pursuant to Item 405 of Regulation S-K is not contained herein, and will not be contained, to the best of registrant's knowledge, in definitive proxy or information statements incorporated by reference in Part III of this Form 10-K or any amendments to this Form 10-K. ( )o
Indicate by check mark whether the registrant is a large accelerated filer, an accelerated filer, a non-accelerated filer or a smaller reporting company (as defined in Rule 12b-2 of the Exchange Act).
| Large accelerated Filer | ý | Accelerated Filer | o | |||
| Non-accelerated Filer | o | Smaller Reporting Company | o | |||
| (Do not check if a smaller reporting company) | ||||||
Indicate by check mark whether the registrant is a shell company (as defined by Rule 12b-2 of the Exchange Act). Yes o No ý.
The aggregate market value of the voting and non-voting common stock equity held by non-affiliates (i.e. persons other than officers, directors and stockholders holding greater than 5% of the registrant's common stock) based on the closing sale price on June 30, 20122015 was $2.32$3.82 billion.
Shares outstanding of each of the registrant's classes of common stock as of February 15, 201312, 2016 Class A common stock, $.01 par value: 85,595,30481,758,013.
DOCUMENTS INCORPORATED BY REFERENCE
In PartParts II and III of this Form 10-K, portions of the definitive proxy statement for the 20132016 Annual Meeting of Stockholders to be held April 17, 2013.13, 2016.
Index of Exhibits (Pages 8490 through 88)94)
Total Number of Pages Included Are 8894
WADDELL & REED FINANCIAL, INC.
INDEX TO ANNUAL REPORT ON FORM 10-K
For the fiscal year ended December 31, 20122015
| | | Page | ||||
|---|---|---|---|---|---|---|
Part I | ||||||
Item 1. | Business | 3 | ||||
Item 1A. | Risk Factors | 11 | ||||
Item 1B. | Unresolved Staff Comments | |||||
Item 2. | Properties | |||||
Item 3. | Legal Proceedings | |||||
Item 4. |
| |||||
Part II | ||||||
Item 5. | Market for Registrant's Common Equity, Related Stockholder Matters and Issuer Purchases of Equity Securities | |||||
Item 6. | Selected Financial Data | |||||
Item 7. | Management's Discussion and Analysis of Financial Condition and Results of Operations | |||||
Item 7A. | Quantitative and Qualitative Disclosures About Market Risk | |||||
Item 8. | Financial Statements and Supplementary Data | |||||
Item 9. | Changes in and Disagreements with Accountants on Accounting and Financial Disclosure | |||||
Item 9A. | Controls and Procedures | |||||
Item 9B. | Other Information | |||||
Part III | ||||||
Item 10. | Directors, Executive Officers and Corporate Governance | |||||
Item 11. | Executive Compensation | |||||
Item 12. | Security Ownership of Certain Beneficial Owners and Management and Related Stockholder Matters | |||||
Item 13. | Certain Relationships and Related Transactions, and Director Independence | |||||
Item 14. | Principal Accounting Fees and Services | |||||
Part IV | ||||||
Item 15. | Exhibits, Financial Statement Schedules | |||||
| ||||||
INDEX TO CONSOLIDATED FINANCIAL STATEMENTS | ||||||
INDEX TO EXHIBITS | ||||||
Forward-Looking Statements
This Annual Report on Form 10-K and the letter to stockholders contains "forward-looking statements" within the meaning of Section 27A of the Securities Act of 1933, as amended, and Section 21E of the Securities Exchange Act of 1934, as amended, which reflect the current views and assumptions of management with respect to future events regarding our business and the industry in general. These forward-looking statements include all statements, other than statements of historical fact, regarding our financial position, business strategy and other plans and objectives for future operations, including statements with respect to revenues and earnings, the amount and composition of assets under management, distribution sources, expense levels, redemption rates and the financial markets and other conditions. These statements are generally identified by the use of words such as "may," "could," "should," "would," "believe," "anticipate," "forecast," "estimate," "expect," "intend," "plan," "project," "outlook," "will," "potential" and similar statements of a future or forward-looking nature. Readers are cautioned that any forward-looking information provided by or on behalf of the Company is not a guarantee of future performance. Certain important factors that could cause actual results to differ materially from our expectations are disclosed in the Item 1 "Business" and Item 1A "Risk Factors" sections of this Annual Report on Form 10-K, which include, without limitation, the adverse effect from a decline in securities markets or in the relative investment performance of our products, our inability to pay future dividends, the loss of existing distribution channels or the inability to access new ones, a reduction of the assets we manage on short notice, and adverse results of litigation and/or arbitration. The forgoing factors should not be construed as exhaustive and should be read together with other cautionary statements included in this and other reports and filings we make with the SEC. All forward-looking statements speak only as of the date on which they are made and we undertake no duty to update or revise any forward-looking statements, whether as a result of new information, future events or otherwise.
General
Waddell & Reed Financial, Inc. (hereinafter referred to as the "Company," "we," "our" or "us") is a corporation, incorporated in the state of Delaware in 1981, that conducts business through its subsidiaries. Founded in 1937, we are one of the oldest mutual fund complexes in the United States, having introduced the Waddell & Reed Advisors Groupgroup of Mutual Fundsmutual funds (the "Advisors Funds") in 1940. Over time we added additional mutual fund families: Ivy Funds (the "Ivy Funds"), Ivy Funds Variable Insurance Portfolios ("Ivy Funds VIP") and, InvestEd Portfolios, our 529 college savings plan ("InvestEd") (collectively, the Advisors Funds, Ivy Funds, Ivy Funds VIP and InvestEd are referred to as the "Funds") and the Ivy Global Investors Fund SICAV (the "SICAV") and its Ivy Global Investors sub-funds (the "IGI Funds"), an undertaking for the collective investment in transferable securities ("UCITS"). As of December 31, 2012,2015, we had $96.4$104.4 billion in assets under management.
We derive our revenues from providing investment management, investment advisory, investment product underwriting and distribution, and shareholder services administration to mutual fundsthe Funds, the IGI Funds and institutional and separately managed accounts. Investment management fees are based on the amount of average assets under management and are affected by sales levels, financial market conditions, redemptions and the composition of assets. Our underwriting and distribution revenues consist of commissions derived from sales of investment and insurance products, Rule 12b-1 asset-based service and distribution fees, distribution fees on certain variable products, fees earned on fee-based asset allocation products and related advisory services.services, commissions derived from sales of investment and insurance products, and distribution fees on certain variable products. The products sold have various commission structures and the revenues received from those sales vary based on the type and dollar amount sold. Shareholder service feesfee revenue includes transfer agency fees, custodian fees from retirement plan accounts, and portfolio accounting and administration fees, and is earned based on assets under management or number of client accounts.
We operate our business through three distincta balanced distribution channels.network. Our retail products are distributed through third-partiesthird parties such as other broker/dealers, registered investment advisors and various retirement platforms (collectively, the "Wholesale channel") or through our sales force of independent financial advisors (the "Advisors channel"). We also market our investment advisory services to institutional investors, either directly or through consultants (the "Institutional channel").
Our Wholesale channel efforts include retail fund distribution through broker/dealers (the largestprimary method of distributing mutual funds for the industry), registered investment advisors (fee-based financial advisors who generally sell mutual funds through financial supermarkets) and retirement and insurance platforms. Assets under management in this channel were $48.9$45.6 billion at the end of 2012.2015.
In the Advisors channel, our sales force focuses its efforts primarily on financial planning, serving primarilymostly middle class and mass affluent clients. We compete with smaller broker/dealers and independent financial advisors, as well as a span of other financial service providers. Assets under management in this channel were $35.7$43.4 billion at December 31, 2012.2015.
Through our Institutional channel, we manage assets in a varietyserve as subadvisor for domestic and foreign distributors of investment stylesproducts for a varietypension funds, Taft-Hartley plans and endowments. Additionally, we serve as investment advisor and distributor of types of institutions. The largest client type is funds that hire us to act as subadvisor; they are typically distributors who lack scale or the track record to manage internally, or choose to market multi-manager styles.IGI Funds. Assets under management in the Institutional channel were $11.8$15.4 billion at December 31, 2012.2015.
Organization
We operate our investment advisory business through our subsidiary companies, primarily Waddell & Reed Investment Management Company ("WRIMCO"), a registered investment adviser for the Advisors Funds, the Ivy Funds VIP and InvestEd, and Ivy Investment Management Company ("IICO"), the registered investment adviser for the Ivy Funds and the IGI Funds and global distributor of the IGI Funds.
Our underwriting and distribution business operates through two broker/dealers: Waddell & Reed, Inc. ("W&R") and Ivy Funds Distributor, Inc. ("IFDI"). W&R is a registered broker/dealer and investment adviser that acts primarily as the national distributor and underwriter for shares of the Advisors
Funds, Ivy Funds VIP, InvestEd and other mutual funds, and as a distributor of variable annuities and other insurance products issued by our business partners. In addition, W&R is the ninthsixth largest distributor of ourthe Ivy Funds. IFDI is the distributor and underwriter for the Ivy Funds.
During 2012, the Company committed to a plan to sell its Legend group of subsidiaries ("Legend"), and on October 29, 2012 the Company signed a definitive agreement to execute the transaction. The sale closed effective January 1, 2013. Legend is a mutual fund distribution and retirement planning subsidiary based in Palm Beach Gardens, Florida. Through its network of financial advisors, Legend primarily serves employees of school districts and other not-for-profit organizations. Legend Advisory Corporation, the registered investment adviser for the Legend group, and Legend Equities Corporation, a registered broker/dealer ("LEC"), were among the subsidiaries sold.
Waddell & Reed Services Company ("WRSCO") provides transfer agency and accounting services to the Advisors Funds, Ivy Funds, Ivy Funds VIP and InvestEd.Funds. W&R, WRIMCO, WRSCO, IICO and IFDI are hereafter collectively referred to as the "Company," "we," "us" or "our" unless the context requires otherwise.
Investment Management Operations
Our investment advisory business provides one of our largest sources of revenues and profits.revenues. We earn investment management fee revenues by providing investment advisory and management services pursuant to investment management agreements with each fund within the Advisors Funds family, the Ivy Funds family, the Ivy Funds VIP family, and InvestEd (collectively, the "Funds").Funds. While the specific terms of the agreements vary, the basic terms are similar. The agreements provide that we render overall investment management services to each of the Funds, subject to the oversight of each Fund's board of trustees and in accordance with each Fund's investment objectives and policies. The agreements permit us to enter into separate agreements for shareholder services or accounting services with each respective Fund.
Each Fund's board of trustees, including a majority of the trustees who are not "interested persons" of the Fund or the Company within the meaning of the Investment Company Act of 1940, as amended (the "ICA") ("disinterested members") and the Fund's shareholders must approve the investment management agreement between the respective Fund and the Company. These agreements may continue in effect from year to year if specifically approved at least annually by (i) the Fund's board, including a majority of the disinterested members, or (ii) the vote of a majority of both the shareholders of the Fund and the disinterested members of each Fund's board, each vote being cast in person at a meeting called for such
purpose. Each agreement automatically terminates in the event of its assignment, as defined by the ICA or the Investment Advisers Act of 1940, as amended (the "Advisers Act"), and may be terminated without penalty by any Fund by giving us 60 days' written notice if the termination has been approved by a majority of the Fund's trustees or the Fund's shareholders. We may terminate an investment management agreement without penalty on 120 days' written notice.
In addition to performing investment management services for the Funds, we act as an investment adviser for the IGI Funds, institutional and other private investors and we provide subadvisory services to other investment companies. Such services are provided pursuant to various written agreements and our fees are generally based on a percentage of assets under management.
Our investment management team meets every morningbegins each business day in a collaborative settingdiscussion that fosters idea sharing, yet reinforces individual accountability. Through all market cycles, we remain dedicated to the following investment principles:
These three principles shape our investment philosophy and money management approach. Over seven decades,For nearly 80 years, our investment organization has delivered consistently competitive investment performance. Through bull and bear markets, our investment professionals have not strayed from what works —works—fundamental research and a time-tested investment process and fundamental research.process. We believe investors turn to us because they appreciate that our investment approach continues to identify and create opportunities for wealth creation.
Our investment management team comprises 7988 professionals, including 3234 portfolio managers who average 2123 years of industry experience and 1516 years of tenure with our firm. We have significant experience in virtually all major asset classes, several specialized asset classes and a range of investment styles. At December 31, 2012, over 75%2015, 80% of the Company's $96.4$104.4 billion in assets under management were invested in equities, of which 72%81% was domestic and 28%19% was international. In recent years, we have supported growth of international investments by adding investment professionals native to countries that we consider emerging markets. They, along with other members of the investment team, focus on understanding foreign markets and capturing investment opportunities. Our investment management team also includes subadvisors who bring similar investment philosophies and additional expertise in specific asset classes.
Investment Management Products
Our mutual fund families offer a wide variety of investment options. We are the exclusive underwriter and distributor of 8189 registered open-end mutual fund portfolios in the Advisors Funds, which includes 17 investment styles. Additionally, we have one closed-end offering through the Ivy Funds Ivyand offer the IGI Funds VIP and InvestEd.through our Institutional channel. The Advisors Funds, variable products offering the Ivy Funds VIP, and InvestEd are offered primarily through our financial advisors;advisors in the Advisors channel; in some circumstances, certain of thesethose funds are also offered through the Wholesale channel. The Ivy Funds are offered through both our Wholesale channel and Advisors channel. The Funds' assets under management are included in either our Wholesale channel or our Advisors channel depending on which channel marketed the client account or is the broker of record.
We added one fund to our product line in 2012. We launched the Ivy Global Equity Income fund for investors interested in generating a reasonable level of current income given current market conditions. The fund focuses on equity securities issued by companies located largely in developed markets, of any size. Under normal circumstances, the fund invests at least 80% of its net assets in equity securities. For this purpose, equity securities consist primarily of dividend-paying common stocks across the globe. The fund also may invest in preferred stock, convertible securities, or other instruments whose price is linked to the value of common stock. The fund may invest in U.S. and non-U.S. issuers. Although the fund primarily invests in large cap companies, it may invest in companies of any size.
Additionally, in 2012, the Ivy International Balanced fund was renamed the Ivy Global Income Allocation fund. This fund seeks to provide total return through a combination of current income and capital appreciation. The fund invests principally in equity and debt securities issued by companies and governments of any size and under normal market conditions, invests primarily in income-producing securities across the globe. The fund may invest in U.S. and non-U.S. issuers. In an attempt to enhance return, the fund may also invest, to a lesser extent, in securities not currently providing income or in companies and governments in countries with new or comparatively undeveloped and emerging economies.
During 2015, we launched two income-oriented mutual funds in partnership with Apollo Credit Management. The Ivy Apollo Strategic Income fund invests among three investment strategies: Apollo's total return and Ivy's global bond and high income. The Ivy Apollo Multi-Asset Income fund invests among four investment strategies: Apollo's total return and Ivy's high income, global equity income and global real estate, which is subadvised by LaSalle Investment Management Securities. We launched three new sub-funds of the SICAV in 2015. The Ivy Global Investors Balanced fund seeks to provide total return by investing primarily in a balanced mix of equities of medium to large U.S. companies, debt or preferred securities and short-term instruments, typically within moderate asset allocation ranges. The Ivy Global Investors Emerging Markets Equity fund will primarily invest in equity securities of companies from countries considered to be in emerging markets or those that are economically linked to emerging markets. The Ivy Global Investors Energy fund will primarily invest in the equity of companies around the world that are within the energy sector or that develop products and services to enhance energy efficiency. In January of 2016, we launched the Ivy Targeted Return Bond fund, subadvised by Pictet Asset Management. This fund seeks to provide a positive total return over the long-term across all market environments by investing in any form of debt security issued in the U.S or internationally.
During 2015, we also entered into a preliminary agreement with Navigate Fund Solutions, a subsidiary of Eaton Vance Corporation, to support the launch by Ivy Funds of a family of NextShares exchange-traded managed funds ("ETMFs"). The Ivy Funds launch of NextShares ETMFs is subject to securing exemptive order relief from the SEC to allow it to manage exchange-traded managed funds, as well as the development of implementation technology by broker/dealers and other market participants.
Other Products
We offer our Advisors channel customers fee-based asset allocation products, including Managed Allocation Portfolio ("MAP"), MAPPlus and Strategic Portfolio Allocation ("SPA"), which utilize the Funds. As of December 31, 2015, clients had $17.6 billion invested in our fee-based asset allocation products, of which $15.7 billion is invested in our mutual funds and included in our mutual fund assets under management.
In our Advisors channel, we distribute various business partners' variable annuity products, which offer the Ivy Funds VIP as an investment vehicle. We also offer our Advisors channel customers retirement and life insurance products underwritten by our business partners. Through our insurance agency subsidiaries,subsidiary, our financial advisors also sell life insurance and disability products underwritten by various carriers.
In addition, we offer our Advisors channel customers fee-based asset allocation investment advisory products, including Managed Allocation Portfolio ("MAP"), MAPPlus and Strategic Portfolio Allocation ("SPA"), which utilize our Funds. As of December 31, 2012, clients had $8.2 billion invested in our MAP, MAPPlus and SPA products. These assets are included in our mutual fund assets under management.
Distribution Channels
We distribute our investment products through the Wholesale, Advisors and Institutional channels.
Wholesale Channel
Our Wholesale channel generates sales through various third-partythird party distribution outlets. Our assets under management in the Wholesale channel were $48.9$45.6 billion at December 31, 2012, including $2.6 billion in assets subadvised by other managers.2015.
Our team of 5061 external wholesalers lead our wholesaling efforts, which focus principally on distributing the Ivy Funds through three segments: broker/dealers (the largest method of distributing mutual funds for the industry and for us), retirement platforms (401(k) platforms using multiple managers) and registered investment advisors (fee-based financial advisors who generally sell mutual funds through financial supermarkets).
During 2012, Additionally, our Ivy Asset Strategy fund continued to play a lead role inNational Accounts team, comprised of 19 employees, work with the Wholesale channel's results, comprising 32%home offices of the channel's gross salesour distribution partners managing current and 27% of total assets under management as of December 31, 2012. While we recognize the past success of this fund, we are also aware of the concentration risks to our revenue streams created by the size of this fund, despite its flexible mandate. Our compensation program for wholesalers encourages the sales of other products with track records of strong performance. Over the past three years, our wholesalers successfully marketed additional products to their financial advisor clients, which resulted in Wholesale channel sales for the Ivy Asset Strategy fund decreasing from 60% in 2010 to 32% in 2012. We plan to continue to stress diversification of sales as we enter 2013.new relationships.
Advisors Channel
Assets under management in the Advisors channel were $35.7$43.4 billion at December 31, 2012. Historically,2015. Throughout our history, our advisors have sold investment products primarily to middle income and mass
affluent individuals, families and businesses across the country in geographic markets of all sizes. We assist clients on a wide range of financial issues with a significant focus on helping them plan, generally, for long-term investments such as retirement and education, and offer one-on-one consultations that emphasize long-term relationships through continued service. As a result of this approach, this channel has developed a loyal customer base with clients maintaining their accounts significantly longer than the industry average. Over the past several years, we have expanded our Choice brokerage platform technology and offerings, and continue to do so which should allowenable us to competitively recruit experienced advisors.
As of December 31, 2012,2015, our sales force consisted of 1,7631,819 financial advisors who operate out of 165 offices located throughout the United States and 263 individual advisor offices.States. We believe, based on industry data, that our financial advisors are currently one of the largest sales forces in the United States selling primarily mutual funds, and that W&R, our broker/dealer subsidiary, ranks among the largest
independent broker/dealers. As of December 31, 2012, ourWe continue to experience growth in sales force production. Advisors channel had approximately 484 thousand mutual fund customers.
Over the past several years, we have instituted more stringent production requirements for our sales force, which has resulted in a steady decline in our number of advisors. However, gross sales have not declined, and this channel produced 12% more in 2012 with 13% fewer advisors, on average, compared to 2010. This headcount decline leveled off during 2012. We utilize gross revenue per advisor to measure advisor productivity. For purposes of this measure, gross revenue consists of front-end load salesunderwriting and distribution fee revenues as would be received from an underwriter, from salesper the average number of both our Funds and other mutual funds. It also includes fee revenues from our asset allocation products and financial plans, and commission revenues earned on insurance products. Gross revenue per advisor was $168advisors were $265 thousand, $156$254 thousand and $119$215 thousand for the years ended December 31, 2012, 20112015, 2014 and 2010,2013, respectively. As of December 31, 2015, our Advisors channel had approximately 449 thousand mutual fund customers.
Institutional Channel
Through this channel, we manage assets in a variety of investment styles for a variety of institutions. The largest client type is other asset managers that hire us to act as subadvisor; they are typically domestic and foreign distributors of investment products who lack scale or the track record to manage internally, or choose to market multi-manager styles. Our diverse client list also includes corporations, foundations, endowments, Taft-Hartley plans and public funds, including defined benefit plans and defined contribution plans. Over time, the Institutional channel has been successful in developing subadvisory relationships. Asrelationships, and as of December 31, 2012, this type of2015, subadvisory business comprised more than 65%70% of the Institutional channel's assets, which management views as a positive development as it believes this type of business has better growth potential thanassets. Our diverse client list also includes the defined benefit business.IGI Funds, pension funds, Taft-Hartley plans and endowments. Assets under management in the Institutional channel were $11.8$15.4 billion at December 31, 2012.2015.
Service Agreements
We earn service fee revenues by providing various services to the Funds and their shareholders. Pursuant to the shareholder servicing agreements, we perform shareholder servicing functions for which the Funds pay us a monthly fee, including: maintaining shareholder accounts; issuing, transferring and redeeming shares; distributing dividends and paying redemptions; furnishing information related to the Funds; and handling shareholder inquiries. Pursuant to the accounting service agreements, we provide the Funds with bookkeeping and accounting services and assistance for which the Funds pay us a monthly fee, including: maintaining the Funds' records; pricing Fund shares; and preparing prospectuses for existing shareholders, proxy statements and certain other shareholder reports.
Agreements with the Funds may be adopted or amended with the approval of the disinterested members of each Fund's board of trustees and have annually renewable terms of one year.
Competition
The financial services industry is a highly competitive global industry. According to the ICI,Investment Company Institute (the "ICI"), at the end of 20122015 there were more than 8,7009,500 open-end investment companies and more than 500 closed-end investment companies of varying sizes, investment policies and objectives whose shares are being offered to the public in the United States alone. Factors affecting our business include brand recognition, business reputation, investment performance, quality of service and the continuity of both client relationships and assets under management. A majority of mutual fund sales go to funds that are highly rated by a small number of well-known ranking services that focus on investment performance. Competition is based on distribution methods, the type and quality of shareholder services, the success of marketing efforts, and the ability to develop investment products for certain market segments to meet the changing needs of investors, and to achievethe achievement of competitive investment management performance.
We compete with hundreds of other mutual fund management, distribution and service companies that distribute their fund shares through a variety of methods, including affiliated and unaffiliated sales
forces, broker/dealers and direct sales to the public of shares offered at a low or no sales charge. Many larger mutual fund complexes have significant advertising budgets and established relationships with brokerage houses with large distribution networks, which enable these fund complexes to reach broad client bases. Many investment management firms offer services and products similar to ours, as well as other independent financial advisors. We also compete with brokerage and investment banking firms, insurance companies, commercial banks and other financial institutions and businesses offering other financial products in all aspects of their businesses. Although no single company or group of companies consistently dominates the mutual fund management and services industry, many are larger than us, have greater resources and offer a wider array of financial services and products. We believe that competition in the mutual fund industry will increase as a result of increased flexibility afforded to banks and other financial institutions to sponsor mutual funds and distribute mutual fund shares. Additionally, barriersBarriers to entry into the investment management business are relatively few, and thus, we face a potentially growing number of competitors, especially during periods of strong financial and economic markets.
The distribution of mutual funds and other investment products has undergone significant developments in recent years, which has intensified the competitive environment in which we operate. These developments include the introduction of new products, increasingly complex distribution systems with multiple classes of shares, the development of internet websites providing investors with the ability to invest on-line, the introduction of sophisticated technological platforms used by financial advisors to sell and service mutual funds for their clients, the introduction of separately managed accounts—previously available only to institutional investors—to individuals, and growth in the number of mutual funds offered.
We believe we effectively compete across multiple dimensions of the asset management and broker/dealer businesses. First, we market our products, primarily the Ivy Funds family, to unaffiliated broker/dealers and advisors and compete against other asset managers offering mutual fund products. This distribution method allows us to move beyond proprietary distribution and increases our potential pool of clients. Competition is based on sales techniques, personal relationships and skills, and the quality of financial planning products and services offered. We compete against asset managers that are both larger and smaller than our firm, but we believe that the breadth and depth of our products position us to compete in this environment. Second, our proprietary broker/dealer consists of a sales force of independent contractors affiliated with our companyCompany who have access to our proprietary financial products. We believe our business model targets customers seeking personal assistance from financial advisors or planners where the primary competition is companies distributing products through financial advisors. The market for financial advice is extremely broad and fragmented. Our financial advisors compete primarily with large and small broker/dealers, independent financial advisors, registered investment advisors, financial institutions and insurance representatives. The market for financial advice is extremely broad and fragmented. Finally, we compete in the institutional marketplace, working with consultants who select asset managers for various opportunities, as well as working directly with plan sponsors, foundations, endowments, sovereign funds and other asset managers who hire subadvisors. In this marketplace, we compete with a broad range of asset managers.
We also face competition in attracting and retaining qualified financial advisors and employees. To maximize our ability to compete effectively in our business, we offer competitive compensation.
Regulation
The securities industry is subject to extensive regulation and virtually all aspects of our business are subject to various federal and state laws and regulations. These laws and regulations are primarily intended to protect investment advisory clients and shareholders of registered investment companies. Under such laws and regulations, agencies and organizations that regulate investment advisers, broker/dealers, and transfer agents like us have broad administrative powers, including the power to limit, restrict or prohibit an investment adviser, broker/dealer or transfer agent from carrying on its business in the event that it fails to comply with applicable laws and regulations. In such event, the possible sanctions that may be imposed include, but are not limited to, the suspension of individual employees or agents, limitations on engaging in
certain lines of business for specified periods of time, censures, fines and the revocation of investment adviser and other registrations.
The United States Securities and Exchange Commission (the "SEC") is the federal agency responsible for the administration of federal securities laws. Certain of our subsidiaries are registered with the SEC as investment advisers under the Advisers Act, which imposes numerous obligations on registered investment advisers including, among other things, fiduciary duties, record-keeping and reporting requirements, operational requirements and disclosure obligations, as well as general anti-fraud prohibitions. Investment advisers are subject to periodic examination by the SEC, and the SEC is authorized to institute proceedings and impose sanctions for violations of the Advisers Act, ranging from censure to termination of an investment adviser's registration.
Our Funds are registered as investment companies with the SEC under the ICA, and various filings are made with states under applicable state rules and regulations. The ICA regulates the relationship between a mutual fund and its investment adviser and prohibits or severely restricts principal transactions and joint transactions. Various regulations cover certain investment strategies that may be used by the Funds for hedging and/or speculative purposes. To the extent the Funds purchase futures contracts, options on futures contracts, swaps and foreign currency contracts, they are subject to the commodities and futures regulations of the Commodity Futures Trading Commission.
We derive a large portion of our revenues from investment management agreements. Under the Advisers Act, our investment management agreements terminate automatically if assigned without the client's consent. Under the ICA, investment advisory agreements with registered investment companies, such as the Funds, terminate automatically upon assignment. The term "assignment" is broadly defined and includes direct assignments, as well as assignments that may be deemed to occur, under certain circumstances, upon the transfer, directly or indirectly, of a controlling interest in the Company.
The Company is also subject to federal and state laws affecting corporate governance, including the Sarbanes-Oxley Act of 2002, ("S-OX"), as well as rules adopted by the SEC. In 2004, we implemented compliance with Section 404 of S-OX. Our related report on internal controls over financial reporting for 20122015 is included in Part I, Item 9A.
As a publicly traded company, we are also subject to the rules of the New York Stock Exchange (the "NYSE"), the exchange on which our stock is listed, including the corporate governance listing standards approved by the SEC.
Two of our subsidiaries, W&R and IFDI, are registered as broker/dealers with the SEC and the states. A third broker/dealer subsidiary, LEC, was sold effective January 1, 2013. Much of the broker/dealer regulation has been delegated by the SEC to self-regulatory organizations, principally the Municipal Securities Rulemaking Board and the Financial Industry Regulatory Authority, Inc. ("FINRA"), which is the primary regulator of our broker/dealer activities. These self-regulatory organizations adopt rules (subject to approval by the SEC) that govern the industry and conduct periodic examinations of our operations over which they have jurisdiction. Securities firms are also subject to regulation by state securities administrators in those states in which they conduct business. Broker/dealers are subject to regulations that cover all aspects of the securities business, including sales practices, market making and trading among broker/dealers, the use and safekeeping of clients' funds and securities, capital structure, record-keeping, and the conduct of directors, officers and employees. Violation of applicable regulations can result in the revocation of broker/dealer licenses, the imposition of censures or fines, and the suspension or expulsion of a firm, its officers or employees.
W&R LEC and IFDI are each subject to certain net capital requirements pursuant to the Securities Exchange Act of 1934, as amended (the "Exchange Act"). Uniform Net Capital Rule 15c3-1 of the Exchange Act (the "Net Capital Rule") specifies the minimum level of net capital a registered broker/dealer must maintain and also requires that part of its assets be kept in a relatively liquid form. The Net
Capital Rule is designed to ensure the financial soundness and liquidity of broker/dealers. Any failure to maintain the required minimum net capital may subject us to suspension or revocation of our registration
or other limitations on our activity by the SEC, and suspension or expulsion by FINRA or other regulatory bodies, and ultimately could require the broker/dealer's liquidation. The maintenance of minimum net capital requirements may also limit our ability to pay dividends. As of December 31, 2012, 20112015 and 2010,2014, net capital for W&R LEC and IFDI exceeded all minimum requirements.
Pursuant to the requirements of the Securities Investor Protection Act of 1970, W&R is a member of the Securities Investor Protection Corporation (the "SIPC"). IFDI is exempt from the membership requirements and is not a member of the SIPC. The SIPC provides protection against lost, stolen or missing securities (but not loss in value due to a rise or fall in market prices) for clients in the event of the failure of a broker/dealer. Accounts are protected up to $500,000 per client with a limit of $100,000 for cash balances. However, since the Funds, and not our broker/dealer subsidiaries, maintain customer accounts, SIPC protection would not cover mutual fund shareholders whose accounts are maintained directly with the Funds.Funds, but would apply to brokerage accounts held on our brokerage platform.
Title III of the USA PATRIOT Act, the International Money Laundering Abatement and Anti-Terrorist Financing Act of 2001, imposes significant anti-money laundering requirements on all financial institutions, including domestic banks and domestic operations of foreign banks, broker/dealers, futures commission merchants and investment companies.
Our operations outside the United States are subject to the laws and regulations of various non-U.S. jurisdictions and non-U.S. regulatory agencies and bodies, including the regulation of the IGI Funds by Luxembourg's Commission de Surveillance du Secteur Financier as UCITS. As we broaden our distribution globally, we will become subject to increased international regulations, some of which are comparable to the regulations to which our United States operations are subject. Similar to the United States, non-U.S. regulatory agencies have broad authority in the event of non-compliance with laws and regulations.
Our businesses may be materially affected not only by regulations applicable to us as an investment adviser, broker/dealer or transfer agent, but also by law and regulations of general application. For example, the volume of our principal investment advisory business in a given time period could be affected by, among other things, existing and proposed tax legislation and other governmental regulations and policies (including the interest rate policies of the Federal Reserve Board), and changes in the interpretation or enforcement of existing laws and rules that affect the business and financial communities.
Our business is also subject to new and changing laws and regulations. For additional discussion regarding the impact of current and proposed legal or regulatory requirements, please see the "Regulatory Risk Is Substantial In Our Business And Non-Compliance With Regulations, Or Changes In Regulations, Could Have A Significant Impact On The Conduct Of Our Business, Reputation And Prospects" risk factor included in Item 1A—Risk Factors in this annual report.
Intellectual Property
We regard our names as material to our business, and have registered certain service marks associated with our business with the United States Patent and Trademark Office.
Employees
At December 31, 20122015 we had 1,6561,691 full-time employees, consisting of 1,1631,351 home office employees 123 Legend employees and 370340 employees responsible for advisor field supervision and administration.
Available Information
We file reports, proxy statements, and other information with the SEC, copies of which can be obtained from the SEC's Public Reference Room at 100 F Street NE, Room 1580, Washington, D.C. 20549. Information on the operation of the Public Reference Room can be obtained by calling the SEC at 1-800-732-0330.
Reports we file electronically with the SEC via the SEC's Electronic Data Gathering, Analysis and Retrieval system ("EDGAR") may be accessed through the internet. The SEC maintains an internet site that contains reports, proxy and information statements, and other information regarding issuers that file electronically with the SEC, atwww.sec.gov. The Company makesmake available free of charge our proxy statements, annual reports on Form 10-K, quarterly reports on Form 10-Q,10-Q, current reports on Form 8-K and amendments to those reports under the "Reports & SEC Filings" menu on the "Investor Relations" section of our internet website atwww.waddell.com as soon as it is reasonably practical after such filing has been made with the SEC.
Also available on the "Corporate Governance" page in the "Our Firm" dropdown menu is information on corporate governance. Stockholders can view our Corporate Code of Business Conduct and Ethics (the "Code of Ethics"), which applies to directors, officers and all employees of the Company,
our Corporate Governance Guidelines, and the charters of key committees (including the Audit, Compensation, and Nominating and Corporate Governance Committees). Printed copies of these documents are available to any stockholder upon request by calling the investor relations department at 1-800-532-2757. Any future amendments to or waivers of the Code of Ethics will be posted to our website, as required.
Our Financial Advisors Are Classified As Independent Contractors, And Changes To Their Classification May Increase Our Operating Expenses. From time to time, various legislativeYou should carefully consider the following risk factors as well as the other risks and uncertainties contained in this Annual Report on Form 10-K or regulatory proposals are introduced atin our other SEC filings. The occurrence of one or more of these risks or uncertainties could materially and adversely affect our business, financial condition, operating results and cash flows. In this Annual Report on Form 10-K, unless the federal orcontext expressly requires a different reading, when we state levels to change the status of independent contractors' classification to employees for either employment tax purposes (withholding, social security, Medicare and unemployment taxes) or other benefits available to employees. Currently, most individuals are classified as employees or independent contractors for employment tax purposes based on 20 "common law" factors, rather than any definition found in the Internal Revenue Code or Treasury regulations. We classify the majority of our financial advisors as independent contractors for all purposes, including employment tax and employee benefit purposes. There can be no assurance that legislative, judicial or regulatory (including tax) authorities will not introduce proposals or assert interpretations of existing rules and regulations that would change the independent contractor/employee classification of those financial advisors currently doing business with us. The costs associated with potential changes, if any, with respect to these independent contractor classificationsa factor could "adversely affect us," have a material"material adverse effect on our business," "adversely affect our business" and similar expressions, we mean that the Company, includingfactor could materially and adversely affect our business, financial condition, operating results and cash flows. Information contained in this section may be considered "forward-looking statements." See "Part I—Forward Looking Statements" for a discussion of operations and financial condition. See Part I, Item 3. "Legal Proceedings."certain qualifications regarding forward-looking statements.
Our Business Is Subject To Substantial Risk From Litigation, Regulatory Investigations And Potential Securities Laws Liability. Many aspects of our business involve substantial risks of litigation, regulatory investigations and/or arbitration, and from time to time, we are involved in various legal proceedings in the course of operating our business. The Company is exposed to liability under federal and state securities laws, other federal and state laws and court decisions, as well as rules and regulations promulgated by the SEC, FINRA and other regulatory bodies. We, our subsidiaries, and/or certain of our past and present officers, have been named as parties in legal actions, regulatory investigations and proceedings, and securities arbitrations in the past and have been subject to claims alleging violation of such laws, rules and regulations, which have resulted in the payment of fines and settlements. An adverse resolution of any lawsuit, legal or regulatory proceeding or claim against us could result in substantial costs or reputational harm to the Company, and have a material adverse effect on the Company's business, financial condition or results of operations, which, in turn, may negatively affect the market price of our common stock and our ability to pay dividends. In addition to these financial costs and risks, the defense of litigation or arbitration may divert resources and management's attention from operations. See Part I, Item 3. "Legal Proceedings."
An IncreasingA Significant Percentage Of Our Assets Under Management Are Distributed Through Our Wholesale Channel, Which Has Higher Redemption Rates Than Our Traditional Advisors Channel. In recent years, we have focused on expanding distribution efforts relating to our Wholesale channel. The percentage of our assets under management in the Wholesale channel has increased from 10% at December 31, 2003 to 51%44% at December 31, 2012,2015, and the percentage of our total sales represented by the Wholesale channel has increased from 17% for the year ended December 31, 2003 to 70%61% for the year ended December 31, 2012.2015. The success of sales in our Wholesale channel depends upon our maintaining strong relationships with institutional accounts, certain strategic partners and our third party distributors. Many of those distribution sources also offer investors competing funds that are internally or externally managed, which could limit the distribution of our products. The loss of any of these distribution channels and the inability to continue to access new distribution channels could decrease our assets under management and adversely affect our results of operations and growth. There are no assurances that these channels and their client bases will continue to be accessible to us. The loss or diminution of the level of business we do with those providers could have a material adverse effect on our business, especially with the high concentration of assets in
certain funds in this channel, namely the Ivy Asset Strategy fund. Compared to the industry average redemption rate of 24.5% and 27.0%24.7% for the years ended December 31, 20122015 and 2011,2014, respectively, the Wholesale channel had redemption rates of 30.2%43.0% and 29.5%34.8% for the years ended December 31, 20122015 and 2011,2014, respectively. Redemption rates were 9.9%9.1% and 10.0%8.3% for our Advisors channel in the same periods, reflecting the higher rate of transferability of investment assets in the Wholesale channel.
Our Business Is Subject To Substantial Risk From Litigation, Regulatory Investigations And Potential Securities Laws Liability. Many aspects of our business involve substantial risks of litigation, regulatory investigations and/or arbitration, and from time to time, we are involved in various legal proceedings in the course of operating our business. We are exposed to liability under federal and state securities laws, other federal and state laws and court decisions, as well as rules and regulations promulgated by the SEC, FINRA and other regulatory bodies. We, our subsidiaries, and/or certain of our past and present officers, have been named as parties in legal actions, regulatory investigations and proceedings, and securities arbitrations in the past and have been subject to claims alleging violation of such laws, rules and regulations, which have resulted in the payment of fines and settlements. An adverse resolution of any lawsuit, legal or regulatory proceeding or claim against us could result in substantial costs or reputational harm to us, and have a material adverse effect on our business. In addition to these financial costs and risks, the defense of litigation, regulatory investigations or arbitration may divert resources and management's attention from operations.
Our Financial Advisors Are Classified As Independent Contractors, And Changes To Their Classification May Increase Our Operating Expenses. From time to time, various legislative or regulatory proposals are introduced at the federal or state levels to change the status of independent contractors' classification to employees for either employment tax purposes (withholding, social security, Medicare and unemployment taxes) or other benefits available to employees. Currently, most individuals are classified as employees or independent contractors for employment tax purposes based on 20 "common law" factors, rather than any
definition found in the Internal Revenue Code or Treasury regulations. We classify the majority of our financial advisors as independent contractors for all purposes, including employment tax and employee benefit purposes. There can be no assurance that legislative, judicial or regulatory (including tax) authorities will not introduce proposals or assert interpretations of existing rules and regulations that would change the independent contractor/employee classification of those financial advisors currently doing business with us. The costs associated with potential changes, if any, with respect to these independent contractor classifications could have a material adverse effect on our business.
There May Be Adverse Effects On Our Business If Our Funds' Performance Declines. Success in the investment management and mutual fund businesses is dependent on the investment performance of client accounts relative to market conditions and the performance of competing funds. Good relative performance stimulates sales of the Funds' shares and tends to keep redemptions low. Sales of the Funds' shares in turn generate higher management fees and distribution revenues. Good relative performance also attracts institutional and separate accounts. Conversely, poor relative performance results in decreased sales, increased redemptions of the Funds' shares and the loss of institutional and separate accounts, resulting in decreases in revenues. As of December 31, 2015, 15% our assets under management were concentrated in the Ivy Asset Strategy fund. As a result, our operating results are significantly affected by the performance of that fund and our ability to minimize redemptions from and maintain assets under management in that fund. If a significant amount of investments are withdrawn from that fund for any reason, our revenues would decline and our operating results would be adversely affected. Further, given the size and prominence of the Ivy Asset Strategy fund within our product line, any adverse performance of that fund may also indirectly affect the net sales and redemptions in our other products, which in turn may adversely affect our business.
There May Be An Adverse Effect On Our Revenues And EarningsBusiness If Our Investors Redeem The Assets We Manage On Short Notice. Mutual fund investors may redeem their investments in our mutual funds at any time without any prior notice. Additionally, our investment management agreements with institutions and other non-mutual fund accounts are generally terminable upon relatively short notice. Investors can terminate their relationship with us, reduce their aggregate amount of assets under management, or shift their funds to other types of accounts with different rate structures for any number of reasons, including investment performance, changes in prevailing interest rates and financial market performance. The abilityrisk of our investors to accomplish thisredeeming their investments in our mutual funds on short notice has increased materially due to the growth of assets in our Wholesale channel and with the high concentration of assets in certain funds in this channel, including the Ivy Asset Strategy fund. The decrease in revenues that could result from any such event could have a material adverse effect on our business and earnings.business.
There Is No Assurance That New Information Systems Will Be Implemented Successfully.We May Not Reduce Our Expenses Rapidly Enough To Align With Decreases In Our Revenues. We expect that, as we transition our load-waived Class A number of the Company's key information technology systems were developed solelyshares to handle the Company's particular information technology infrastructure. The Company isClass I shares in the process of evaluating and implementing new information technology and systems that it believes could facilitate and improve our core businesses andinvestments advisory products, our productivity. There can be no assurance that the Companyoperating revenue will be successfulsignificantly lower in implementing the new information technology and systems or that their implementation will be completed2016. If we are unable to effect appropriate expense reductions in a timely manner through operational changes or cost effective manner. Failureperformance improvement initiatives in response to implementthis expected decline in our revenues or maintain adequate information technology infrastructure could impededue to, among other things, the level of our ability to supportassets under management or our current business growth.environment, our business may be adversely affected.
Regulatory Risk Is Substantial In Our Business And Non-Compliance With Regulations, Or Changes In Regulations, Could Have A Significant Impact On The Conduct Of Our Business, Reputation And Our Prospects, Revenues And Earnings.Prospects. Our investment advisory and broker/dealer businesses are heavily regulated, primarily at the federal level. Non-compliance with applicable laws or regulations could result in sanctions being levied against us, including fines and censures, suspension or expulsion from a certain jurisdiction or market, or the revocation of licenses. Non-compliance with applicable laws or regulations could also adversely affect our business, reputation prospects, revenues and earnings.prospects. In addition, changes in current legal, regulatory, accounting, tax or compliance requirements or in governmental policies could adversely affect our operations, revenues and
earnings by, among other things, increasing expenses and reducing investor interest in certain products we offer. Distribution fees paid to mutual fund distributors in accordance with Rule 12b-1 promulgated under the Investment Company Act of 1940, as amended ("Rule 12b-1"), are an important element of the distribution of the mutual funds we manage. TheIn 2010, the SEC has proposed replacing Rule 12b-1 with a new regulation that would significantly change current fund distribution practices in the industry. If this proposed regulation is adopted, it may have a material impact on the compensation we pay to distributors for distributing the mutual funds we manage and/or our ability to recover expenses related to the distribution of our funds, and thus could materially affect our business. In 2015, the U.S. Department of Labor (the "DOL") proposed regulations to expand the scope of a "fiduciary" under the Employee Retirement Income Security Act of 1974, as amended ("ERISA"), and Section 4975 of the Internal Revenue Code of 1986, as amended (the "Code"), which, if enacted, would impact how advice can be provided to retirement account holders in 401(k) plans, individual retirement accounts and other qualified retirement programs. The DOL proposal also would create new exemptions and amend existing exemptions from the prohibited transaction rules applicable to fiduciaries under ERISA and the Code that would allow broker/dealers, investment advisers and others to continue to receive a variety of common forms of compensation that otherwise would be prohibited as conflicts of interest. If the proposed regulations are enacted, they may have a material impact on the provision of investment services to retirement accounts, including imposing additional compliance, reporting and operational requirements, which could negatively affect our revenue and net income.business. Additionally, our profitability could be affected by rules and regulations that impact the business and financial communities generally, including changes to the laws governing state and federal taxation.
Our Revenues, EarningsBusiness And Prospects Could Be Adversely Affected If The Securities Markets Decline. Our results of operations are affected by certain economic factors, including the levelsuccess of the securities markets. The on-going existence of adverseAdverse market conditions, which is particularly material to usthe U.S. domestic stock market due to our high concentration of assets under management in the United States domestic stockthat market, and lack of investor confidence could result in investors further withdrawing from the markets or decreasing their rate of investment, either of which could adversely affect our revenues, earnings and growth prospects to a greater extent. Because our revenues are, to a large extent, investment management fees that are based on the value of assets under management, a decline in the value of these assets adversely affects our revenues and earnings. Our growth is dependent to a significant degree upon our ability to attract and retain mutual fund assets, and, in an adverse economic environment, this may prove more difficult. Our growth rate has varied from year to year and there can be no assurance that theour average growth rates sustained in recent years will continue. Declines in the securities markets could significantly reduce our future revenues and earnings. In addition, a decline in the market value of these assets could cause our clients to withdraw funds in favor of investments they perceive as offering greater opportunity or lower risk, which could also negatively impact our revenues and earnings. The combination of adverse marketsmarket conditions reducing sales and investment management fees could compound on each other and materially affect earnings.
There May Be Adverse Effects On Our Revenues And Earnings If Our Funds' Performance Declines. Success in the investment management and mutual fund businesses is dependent on the investment performance of client accounts relative to market conditions and the performance of competing funds. Good relative performance stimulates sales of the Funds' shares and tends to keep redemptions low. Sales of the Funds' shares in turn generate higher management fees and distribution revenues. Good relative performance also attracts institutional and separate accounts. Conversely, poor relative performance results in decreased sales, increased redemptions of the Funds' shares and the loss of institutional and separate accounts, resulting in decreases in revenues. Failure of our Funds to perform well could, therefore, have a material adverse effect on our revenues and earnings.business.
Our Ability To Hire And Retain Senior Executive Management And Other Key Personnel Is Significant To Our Success And Growth. Our continued success depends to a substantial degree on our ability to attract and retain qualified senior executive management and other key personnel to conduct our broker/dealer, fund management and investment advisory businesses. The market for qualified fund managers, investment analysts, financial advisors and wholesalers is extremely competitive. Additionally, we are dependent on our financial advisors and select wholesale distributors to sell our mutual funds and other investment products. Our growth prospects will be directly affected by the quality, quantity and productivity of financial advisors and wholesalers we are able to successfully recruit and retain. There can be no assurances that we will be successful in our efforts to recruit and retain the required personnel.
A Failure In Or Breach Of Our Operational Or Security Systems Or Our Technology Infrastructure, Or Those Of Third Parties, Could Result In A Material Adverse Effect On Our Business And Reputation. We are highly dependent upon the use of various proprietary and third party software applications and other technology
systems to operate our business. As part of our normal operations, we process a large number of transactions on a daily basis and maintain and transmit confidential client and employee information, the safety and security of which is dependent upon the effectiveness of our information security policies, procedures and capabilities to protect such systems and the data that reside on or are transmitted through them.
Although we take protective measures and endeavor to modify these protective measures as circumstances warrant, technology is subject to rapid change and the nature of the threats continue to evolve. As a result, our operating and technology systems, software and networks may fail to operate properly or become disabled, or may be vulnerable to unauthorized access, inadvertent disclosure, loss or destruction of data (including confidential client information), computer viruses or other malicious code, cyber attacks and other events that could materially damage our operations, have an adverse security impact, or cause the disclosure or modification of sensitive or confidential information. Most of the software applications that we use in our business are licensed from, and supported, upgraded and maintained by, third party vendors. A suspension or termination of certain of these licenses or the related support, upgrades and maintenance could cause temporary system delays or interruption. We also take precautions to password protect and/or encrypt our laptops and other mobile electronic hardware. If such hardware is stolen, misplaced or left unattended, it may become vulnerable to hacking or other unauthorized use, creating a possible security risk and resulting in potentially costly actions by us. Further, while we have in place a disaster recovery plan to address catastrophic and unpredictable events, there is no guarantee that this plan will be sufficient in responding to or ameliorating the effects of all disaster scenarios, and we may experience system delays and interruptions as a result of natural disasters, power failures, acts of war, and third party failures.
The breach of our operational or security systems or our technology infrastructure, or those of third parties, due to one or more of these events could cause interruptions, malfunctions or failures in our operations and/or the loss or inadvertent disclosure of confidential client information could result in substantial financial loss or costs, liability for stolen assets or information, breach of client contracts, client dissatisfaction and/or loss, regulatory actions, remediation costs to repair damage caused by the breach, additional security costs to mitigate against future incidents and litigation costs resulting from the incident. These events, and those discussed above, could have a material adverse effect on our business and reputation.
There Is No Assurance That New Information Technology Systems Will Be Implemented Successfully. A number of our key information technology systems were developed solely to handle our particular information technology infrastructure. We are in the process of implementing new information technology systems that we believe could facilitate and improve our core businesses and our productivity. There can be no assurance that we will be successful in implementing the new information technology systems or that their implementation will be completed in a timely or cost effective manner. Failure to implement or maintain adequate information technology infrastructure could impede our ability to support business growth.
Support Provided To New Products May Reduce Fee Revenue, Increase Expenses And Expose Us To Potential Loss On Invested Capital. We may support the development of new investment products by waiving a portion of the fees we usually receive for managing such products, by subsidizing expenses or by making seed capital investments. There can be no assurance that new investment products we develop will be successful, which could have a material adverse effect on our business. Failure to have or devote sufficient capital to support new products could have an adverse impact on our future growth. Seed capital investments in new products utilize Company capital that would otherwise be available for general corporate purposes and expose us to capital losses due to investment market risk. Our non-operating investment and other income could be adversely affected by the realization of losses upon the disposition of our investments or the recognition of significant other-than-temporary impairments in the case of our available-for-sale portfolio and the recognition of unrealized losses related to our sponsored investment
portfolios that are held as trading and accounted for under the equity method. We may use various derivative instruments to mitigate the risk of our seed capital investments, although some market risk would remain. The risk of loss may be greater for seed capital investments that are not hedged, or if an intended hedge does not perform as expected. Our use of derivatives would result in counterparty risk in the event of non-performance by counterparties to these derivative instruments, regulatory risk and the risk that the underlying positions do not move identically to the related derivative instruments. As a result, volatility in the capital markets may affect the value of our seed capital investments, which may increase the volatility of our earnings and adversely affect our business.
Expansion Into International Markets May Increase Operational And Regulatory Risks. As we broaden our distribution globally, we face increased operational and regulatory risks. The failure of our systems of internal control to properly mitigate such additional risks, or of our operating infrastructure to support such international expansion could result in operational failures and regulatory fines or sanctions. Local regulatory environments may vary widely and place additional demands on our sales, legal and compliance personnel. Identifying and hiring well qualified personnel and adopting policies, procedures and controls to address local or regional requirements require time and resources. Regulators in non-U.S. jurisdictions could also change their policies or laws in a manner that might restrict or otherwise impede our ability to offer our investment strategies in their respective markets. Any of these local requirements, activities or needs could increase the costs and expenses we incur in a specific jurisdiction without any corresponding increase in revenues and income from operating in the jurisdiction.
We Have Substantial Intangibles On Our Balance Sheet, And Any Impairment Of Our Intangibles Could Adversely Affect Our Results of Operations And Financial Position.Operations. At December 31, 2012,2015, our total assets were approximately $1.2$1.6 billion, of which approximately $162.0$158.1 million, or 14%10%, consisted of goodwill and identifiable intangible assets. We complete an ongoing review of goodwill and intangible assets for impairment on an annual basis or more frequently whenever events or a change in circumstances warrant. Important factors in determining whether an impairment of goodwill or intangible assets might exist include significant continued underperformance compared to peers, the likelihood of termination or non-renewal of a mutual fund advisory or subadvisory contract or substantial changes in revenues earned from such contracts, significant changes in our business and products, material and ongoing negative industry or economic trends, or other factors specific to each asset or subsidiary being tested. Because of the significance of goodwill and other intangibles to our consolidated balance sheets, the annual impairment analysis is critical. Any changes in key assumptions about our business and our prospects, or changes in market conditions or other externalities, could result in an impairment charge. Any such charge could have a material effect on our results of operations and financial position.
Table of Contentsoperations.
There May Be Adverse Effects On Our Business And Earnings Upon The Termination Of, Or Failure To Renew, Certain Agreements. A majority of our revenues are derived from investment management agreements with the Funds that, as required by law, are terminable on 60 days' notice. Each investment management agreement must be approved and renewed annually by the disinterested members of each Fund's board of trustees or its shareholders, as required by law. Additionally, our investment management agreements provide for automatic termination in the event of assignment, which includes a change of control, without the consent of our clients and, in the case of the Funds, approval of the Funds' board of directors/trustees and shareholders to continue the agreements. There can be no assurances that our clients will consent to any assignment of our investment management agreements, or that those and other contracts will not be terminated or will be renewed on favorable terms, if at all, at their expiration and new agreements may not be available. See "Business—Distribution Channels—Wholesale Channel, Institutional Channel." The decrease in revenues that could result from any such event could have a material adverse effect on our business and earnings.business.
A Failure In Or Breach Of Our Operational Or Security Systems Or Our Technology Infrastructure, Or Those Of Third Parties, Could Result In A Material Adverse Effect On Our Business, Reputation, Cash Flows and Results Of Operations. We are highly dependent upon the use of various proprietary and third-party software applications and other technology systems to operate our business. As part of our normal operations, we process a large number of transactions on a daily basis and maintain and transmit confidential client and employee information, the safety and security of which is dependent upon the effectiveness of our information security policies, procedures and capabilities to protect such systems and the data that reside on or are transmitted through them.
Although we take protective measures and endeavor to modify these protective measures as circumstances warrant, technology is subject to rapid change and the nature of the threats continue to evolve. As a result, our operating and technology systems, software and networks may fail to operate properly or become disabled, or may be vulnerable to unauthorized access, inadvertent disclosure, loss or destruction of data (including confidential client information), computer viruses or other malicious code, cyber attacks and other events that could materially damage our operations, have an adverse security impact, or cause the disclosure or modification of sensitive or confidential information. Most of the software applications that we use in our business are licensed from, and supported, upgraded and maintained by, third-party vendors. A suspension or termination of certain of these licenses or the related support, upgrades and maintenance could cause temporary system delays or interruption. We also take precautions to password protect and/or encrypt our laptops and other mobile electronic hardware. If such hardware is stolen, misplaced or left unattended, it may become vulnerable to hacking or other unauthorized use, creating a possible security risk and resulting in potentially costly actions by us. Further, while we have in place a disaster recovery plan to address catastrophic and unpredictable events, there is no guarantee that this plan will be sufficient in responding to or ameliorating the effects of all disaster scenarios, and we may experience system delays and interruptions as a result of natural disasters, power failures, acts of war, and third-party failures.
The breach of our operational or technology systems, software and networks, or those of third parties, due to one or more of these events could cause interruptions, malfunctions or failures in our operations and/or the loss or inadvertent disclosure of confidential client information could result in substantial financial loss or costs, liability for stolen assets or information, breach of client contracts, client dissatisfaction and/or loss, regulatory actions, remediation costs to repair damage caused by the breach, additional security costs to mitigate against future incidents and litigation costs resulting from the incident. These events, and those discussed above, could have a material adverse effect on our business, reputation, results of operations, financial position, cash flow, revenues and income.
Regulations Restricting The Use Of "Soft Dollars" Could Result In An Increase In Our Expenses. On behalf of our mutual fund and investment advisory clients, we make decisions to buy and sell securities for each
portfolio, select broker/dealers to execute trades, and negotiate brokerage commission rates. In connection
with these transactions, we may receive "soft dollar credits" from broker/dealers that we can use to defray certain of our expenses. If regulations are adopted eliminating the ability of asset managers to use "soft dollars," our operating expenses could increase.
Fee Pressures Could Reduce Our Revenues And Profitability. There is a trend toward lower fees in some segments of the investment management business. In addition, the SEC has adopted rules that are designed to improve mutual fund corporate governance, which could result in further downward pressure on investment advisory fees in the mutual fund industry. Accordingly, there can be no assurance that we will be able to maintain our current fee structure. Fee reductions on existing or future new business could adversely affect us.
Challenges To Our Tax Positions May Adversely Affect Our Effective Tax Rate and Business. The application of complex tax laws and regulations involves numerous uncertainties. Tax authorities may disagree with certain tax positions that we have an adversetaken and assess additional taxes, which could result in adjustments to, or impact onthe timing or amount of, taxable income, deductions or other tax allocations, which may adversely affect our revenueseffective tax rate and profitability.business.
We Could Experience Adverse Effects On Our Revenues, Profits And Market Share Due To Strong Competition From Numerous And Sometimes Larger Companies. We compete with stock brokerage firms, mutual fund companies, investment banking firms, insurance companies, banks, internet investment sites, and other financial institutions and individual registered investment advisers. Many of these companies not only offer mutual fund investments and services, but also offer an ever-increasing number of other financial products and services. Many of our competitors have more products and product lines, services and brand recognition and may also have substantially greater assets under management. Many larger mutual fund complexes have developed more extensive relationships with brokerage houses with large distribution networks, which may enable those fund complexes to reach broader client bases. In recent years, there has been a trend of consolidation in the mutual fund industry resulting in stronger competitors with greater financial resources than us. There has also been a trend toward online internet financial services. If existing or potential customers decide to invest with our competitors instead of with us, our market share revenues and income could decline.decline, which could have a material adverse effect on our business.
The Terms Of Our Credit Facility And Senior Unsecured Notes Impose Restrictions On Our Operations That May Adversely Impact Our Prospects And The Operations Of Our Business. There are no assurances that we will be able to raise additional capital if needed, which could negatively impact our liquidity, prospects and operations. We have entered into a 3-year5-year revolving credit facility with various lenders providing for total loansavailability of $125.0 million. Under this facility, the lenders may, at their option upon our request, expand the facility to $200.0 million. At February 15, 2013,12, 2016, there was no balance outstanding under the revolving credit facility. We also entered into a note purchase agreement with various purchasers for the sale and issuance of $190.0 million of unsecured senior notes comprised of $95 million of 5.0% senior notes, series A, due 2018 and $95 million of 5.75% senior notes, series B, due 2021, all of which were issued on January 13, 2011. The terms and conditions of our revolving credit facility and note purchase agreement impose restrictions that affect, among other things, our ability to incur additional debt, make capital expenditures and acquisitions, merge, sell assets, pay dividends and create or incur liens. Our ability to comply with the financial covenants set forth in our credit facility and note purchase agreement could be affected by events beyond our control, and there can be no assurance that we will achieve operating results that will comply with such terms and conditions, a breach of which could result in a default under our credit facility and note purchase agreement. In the event of a default under the credit facility and/or note purchase agreement, the banks could elect to declare the outstanding principal amount of our credit facility, all interest thereon, and all other amounts payable under our credit facility to be immediately due and payable, and the Company's obligations under the senior unsecured notes could be accelerated and become due and payable, including any make-whole amount, respectively.
Our ability to meet our cash needs and satisfy our debt obligations will depend upon our future operating performance, asset values, the perception of our creditworthiness and, indirectly, the market value of our stock. These factors will be affected by prevailing economic, financial and business conditions and other circumstances, some of which are beyond our control. We anticipate that any funds generated by the issuance of our senior unsecured notes and any borrowings from our existing credit facility and/or cash provided by operating activities will provide sufficient funds to finance our business plans, meet our operating expenses and service our debt obligations as they become due. However, in the event that we
require additional capital, there can be no assurance that we will be able to raise such capital when needed or on satisfactory terms, if at all, and there can be no assurance that we will be able to renew or refinance our credit facility or senior unsecured notes upon their maturity or on favorable terms. If we are unable to raise capital or obtain financing, we may be forced to incur unanticipated costs or revise our business plan.
Our Own Operational Failures Or Those Of Third Parties We Rely On, Including Failures Arising Out Of Human Error, Could Disrupt Our Business And Damage Our Reputation. Our business is highly dependent on our ability to process, on a daily basis, large numbers of transactions. These transactions generally must comply with client investment guidelines, as well as stringent legal and regulatory standards. Despite our employees being highly trained and skilled, due to the large number of transactions we process errors may occur. If we make mistakes in performing our services that cause financial harm to our clients, our clients may seek to recover their losses. The occurrence of mistakes, particularly significant ones, could have a material adverse effect on our reputation and business.
Potential Misuse Of Funds And Information In The Possession Of Our Employees And/Or Advisors Could Result In Liability To Our Clients, Subject Us To Regulatory Sanctions Or Otherwise Adversely Affect Our Revenues and Profitability.Business. Our business is based on the trust and confidence of our clients, for whom our financial advisors handle a significant amount of funds, as well as financial and personal information. Although we have implemented a system of internal controls to minimize the risk of fraudulent taking or misuse of funds and confidential information, there can be no assurance that our controls will be adequate or that a taking or misuse of funds and confidential information by our employees or financial advisors can be prevented. We could be liable in the event of a taking or misuse of funds and confidential information by our employees or financial advisors and we could also be subject to regulatory sanctions. Although we believe that we have adequately insured against these risks, there can be no assurance that our insurance will be maintained or that it will be adequate to meet any liability.liability resulting from these activities. Any damage to the trust and confidence placed in us by our clients may cause our assets under management to decline, which could adversely affect our revenues, financial condition, resultsbusiness and prospects.
There Are No Assurances That We Will Pay Future Dividends, Which Could Adversely Affect Our Stock Price. The Waddell & Reed Financial, Inc. Board of operationsDirectors (the "Board of Directors") currently intends to continue to declare quarterly dividends on our Class A common stock. However, the declaration and payment of dividends is subject to the discretion of our Board of Directors. Any determination as to the payment of dividends, as well as the level of such dividends, will depend on, among other things, general economic and business prospects.conditions, our strategic plans, our financial results and condition, and contractual, legal, and regulatory restrictions on the payment of dividends by us or our subsidiaries. We are a holding company and, as such, our ability to pay dividends is subject to the ability of our subsidiaries to provide us with cash. There can be no assurance that the current quarterly dividend level will be maintained or that we will pay any dividends in any future period. Any change in the level of our dividends or the suspension of the payment of dividends could adversely affect our stock price.
Our Stockholders Rights Plan Could Deter Takeover Attempts, Which Some Of Our Stockholders May Believe To Be In Their Best Interest. Under certain conditions, the rights under our stockholders rights plan entitle the holders of such rights to receive shares of our common stock having a value equal to two times the exercise price of the right. The rights are attached to each share of our outstanding common stock and generally are exercisable only if a person or group acquires 15% or more of the voting power represented
by our common stock. Our stockholders rights plan could impede the completion of a merger, tender offer, or other takeover attempt even though some or a majority of our stockholders might believe that a merger, tender offer or takeover is in their best interests, and even if such a transaction could result in our stockholders receiving a premium for their shares of our stock over the then current market price of our stock.
Provisions Of Our Organizational Documents Could Deter Takeover Attempts, Which Some Of Our Stockholders May Believe To Be In Their Best Interest. Under our Restated Certificate of Incorporation, our Board of Directors has the authority, without action by our stockholders, to fix certain terms and issue shares of our Preferred Stock, par value $1.00 per share. Actions of our Board of Directors pursuant to this authority may have the effect of delaying, deterring or preventing a change in control of the Company. Other provisions in our Restated Certificate of Incorporation and in our Amended and Restated Bylaws impose procedural and other requirements that could be deemed to have anti-takeover effects, including replacing incumbent directors. Our Board of Directors is divided into three classes, each of which is to serve for a staggered three-year term after the initial classification and election, and incumbent directors may not be removed without cause, all of which may make it more difficult for a third party to gain control of our Board of Directors. In addition, as a Delaware corporation we are subject to section 203 of the Delaware General Corporation Law. With certain exceptions, section 203 imposes restrictions on mergers and other business combinations between us and any holder of 15% or more of our voting stock.
Our Holding Company Structure Results In Structural Subordination And May Affect Our Ability To Fund Our Operations And Make Payments On Our Debt. We are a holding company and, accordingly, substantially all of our operations are conducted through our subsidiaries. As a result, our cash flow and our ability to service our debt, including $190.0 million of our senior notes, are dependent upon the earnings of our subsidiaries and the distribution of earnings, loans or other payments by our subsidiaries to us. Our subsidiaries are separate and distinct legal entities and have no obligation to pay any amounts due on our debt or provide us with funds for our payment obligations, whether by dividends, distributions, loans or other payments. In addition, any payment of dividends, distributions, loans or advances to us by our subsidiaries could be subject to statutory or contractual restrictions. Payments to us by our subsidiaries will also be contingent upon our subsidiaries' earnings and business considerations. Our right to receive any
assets of any of our subsidiaries upon their liquidation or reorganization, and therefore the right of the holders of our debt to participate in those assets, would be effectively subordinated to the claims of those subsidiaries' creditors, including trade creditors. In addition, even if we were a creditor of any of our subsidiaries, our rights as a creditor would be effectively subordinate to any security interest in the assets of our subsidiaries and any indebtedness of our subsidiaries senior to that held by us.
There Are No Assurances That We Will Pay Future Dividends, Which Could Adversely Affect Our Stock Price. The Waddell & Reed Financial, Inc. Board of Directors (the "Board of Directors") currently intends to continue to declare quarterly dividends on our Class A common stock (our "common stock"); however, the declaration and payment of dividends is subject to the discretion of our Board of Directors. Any determination as to the payment of dividends, as well as the level of such dividends, will depend on, among other things, general economic and business conditions, our strategic plans, our financial results and condition, and contractual, legal, and regulatory restrictions on the payment of dividends by us or our subsidiaries. We are a holding company and, as such, our ability to pay dividends is subject to the ability of our subsidiaries to provide us with cash. There can be no assurance that the current quarterly dividend level will be maintained or that we will pay any dividends in any future period(s). Any change in the level of our dividends or the suspension of the payment thereof could adversely affect our stock price.
ITEM 1B. Unresolved Staff Comments
None.
We own twofour buildings in the vicinity of buildings currently leased by our home offices:office: two 50,000 square foot buildings and a 50,00052,000 square foot building located in Overland Park, KSKansas and a 45,000 square foot building located in Mission, KS. ExistingKansas. Our existing home office lease agreements cover approximately 310,000298,000 square feet for Waddell & Reed located in Overland Park, Kansas and 38,000 square feet for our disaster recovery facility and 39,000 square feet for Legend located in Palm Beach Gardens, Florida. The lease agreement for Legend was assumed by the purchaser, effective January 1, 2013. An additional lease covers office space of 41,000 square feet in Boca Raton, Florida. This space has been sublet and the lease agreement ends March 31, 2013.facility. In addition, we lease office space for sales management which is available to our financial advisors for use, in various locations throughout the United States totaling approximately 661,000688,000 square feet. A majority of this office space is available to our financial advisors to use. In the opinion of management, the office space owned and leased by the Company is adequate for existing operating needs.
The Company is involved from time to time in various legal proceedings, regulatory investigations and claims incident to the normal conduct of business, which may include proceedings that are specific to us
and others generally applicable to business practices within the industries in which we operate. A substantial legal liability or a significant regulatory action against us could have an adverse effect on our business, financial condition and on the results of operations in a particular quarter or year.
The Company accrues an undiscounted liabilityestablishes reserves for litigation and similar matters when those matters present material loss contingencies where the incurrence of a loss isthat management determines to be both probable and the amount can be reasonably estimated.estimable in accordance with Accounting Standards Codification ("ASC")"Contingencies Topic," ASC 450. These amounts are not reduced by amounts that may be recovered under insurance or claims against third parties, but undiscounted receivables from insurers or other third parties may be accrued separately. The Company regularly revises such accruals in light of new information. For contingencies where an unfavorable outcome is reasonably possible and that are significant, theThe Company discloses the nature of the contingency when management believes it is reasonably possible the outcome may be significant to the Company's consolidated financial statements and, where feasible, an estimate of the possible loss. For purposes of our litigation contingency disclosures, "significant" includes material matters as well as other items that management believes should be disclosed. ManagementManagement's judgment is required related to contingent liabilities andbecause the outcome of litigation because bothoutcomes are difficult to predict.
Michael E. Taylor, Kenneth B. Young, individuals, In an action filed on behalf of themselves individually and on behalf of others similarly situated v. Waddell & Reed, Inc., a Delaware Corporation; and DOES 1 through 10 inclusive; Case No. 09-CV-2909 DMS WVG;February 18, 2016 in the United States District Court for the Southern District of California.Kansas,
Saket Kapor(sic), Peter Brockett and Hieu Phan v. Ivy Investment Management Company, et. al.
Table (Case No. 2:16-cv-02106-JWL-TJJ), the Company's registered investment advisor subsidiaries, the trustees of Contentstwo of the Company's affiliated mutual funds, and an officer of a Company subsidiary were sued in a putative derivative action by three mutual fund shareholders alleging breach of fiduciary duty and breach of contract claims relating to investments held in the affiliated mutual funds. On behalf of the mutual funds, Plaintiffs seek monetary damages and demand a jury trial. To date, no responsive pleading has been filed and no discovery has taken place.
In the opinion of management, the ultimate resolution and outcome of this action filed December 28, 2009,matter is uncertain. Given the preliminary nature of the proceedings and the Company's dispute over the merits of the claims, the Company was sued inis unable to estimate a range of reasonably possible loss, if any, that such matter may represent. While the ultimate resolution of this matter is uncertain, an individual action, class action and Fair Labor Standards Act ("FLSA") nationwide collective action by two former advisors asserting misclassification of financial advisors as independent contractors instead of employees. Plaintiffs, on behalf of themselves and a purported class of Waddell & Reed, Inc. financial advisors, assert claims under the FLSA for minimum wages and overtime wages, and under California Labor Code Statutes for timely payment of wages, minimum wages, overtime compensation, meal periods, reimbursement of losses and business expenses and itemized wage statements and a claim for Unfair Business Practices under §17200 of the California Business & Professions Code. Plaintiffs seek declaratory and injunctive relief and monetary damages.
Plaintiffs moved for conditional collective action certification under the FLSA. The Company opposed this motion and additionally moved for summary judgment on Plaintiffs' individual FLSA claims. The Court issued an order on January 3, 2012 granting the Company's summary judgment motions, holding that Plaintiffs' individual FLSA claims fail as a matter of law, and denying Plaintiffs' motion for conditional collective action certification under the FLSA as moot. This ruling effectively removes all nationwide FLSA claims from the case.
Subsequently,adverse determination against the Company moved for summary judgmentcould have a material adverse impact on Plaintiffs' individual California claims. The Court issued an order on August 20, 2012 granting the Company's summary judgment motions, holding that Plaintiffs' individual California claims fail as a matterour business, financial condition and results of law. This order effectively dismissed Plaintiffs from the case, both individually and as putative class representatives.
However, in its August 20, 2012 order, the Court also granted Plaintiffs' motion to add a new individual and putative class representative to the action, effectively replacing the originally named Plaintiffs. The newly named Plaintiff continued to pursue the California claims referenced above on behalf of the putative class, as well as newly added representative derivative claims under the California Private Attorney General Act.
The Company moved for summary judgment, asking the Court to dismiss the newly named Plaintiff's individual claims. The arguments made in support of this request were the same as those that prevailed in the Taylor and Young motions for summary judgment. On February 1, 2013, the Court issued an order granting the Company's summary judgment motion. This ruling effectively dismisses all remaining claims in the case in their entirety, pending appeal. No appeal has yet been filed. The Company intends to continue to vigorously defend the matter at appeal, if any.operations.
ITEM 4. Submission of Matters to a Vote of Security HoldersMine Safety Disclosures
During the fourth quarter of the fiscal year covered by this report, no matter was submitted to a vote of the Company's security holders, through the solicitation of proxies or otherwise.Not applicable.
ITEM 5. Market for Registrant's Common Equity, Related Stockholder Matters and Issuer Purchases of Equity Securities
Our Class A common stock ("common stock") is traded on the NYSE under the ticker symbol "WDR." The following table sets forth, for the periods indicated, the high and low sale prices of our common stock, as reported by the NYSE, as well as the cash dividends declared for these time periods:
| | 2012 | 2011 | ||||||||||||||||||
|---|---|---|---|---|---|---|---|---|---|---|---|---|---|---|---|---|---|---|---|---|
| Quarter | High | Low | Dividends Per Share | High | Low | Dividends Per Share | ||||||||||||||
| 1 | $ | 33.58 | $ | 24.40 | $ | 0.25 | $ | 42.20 | $ | 34.54 | $ | 0.20 | ||||||||
| 2 | 33.53 | 26.55 | 0.25 | 42.49 | 34.45 | 0.20 | ||||||||||||||
| 3 | 34.04 | 27.02 | 0.25 | 40.04 | 24.78 | 0.20 | ||||||||||||||
| 4 | 35.77 | 30.91 | 1.28 | 29.78 | 22.85 | 0.25 | ||||||||||||||
| | 2015 | 2014 | ||||||||||||||||||
|---|---|---|---|---|---|---|---|---|---|---|---|---|---|---|---|---|---|---|---|---|
| Quarter | High | Low | Dividends Per Share | High | Low | Dividends Per Share | ||||||||||||||
| 1 | $ | 51.80 | $ | 41.06 | $ | 0.43 | $ | 74.33 | $ | 61.49 | $ | 0.34 | ||||||||
| 2 | 51.23 | 45.89 | 0.43 | 76.46 | 59.00 | 0.34 | ||||||||||||||
| 3 | 48.05 | 33.64 | 0.43 | 65.57 | 51.25 | 0.34 | ||||||||||||||
| 4 | 38.85 | 27.82 | 0.46 | 51.84 | 42.39 | 0.43 | ||||||||||||||
The cash dividends declared during the fourth quarter of 2012 includes a special cash dividend on our common stock of $1.00 per share that was paid on December 6, 2012.
Year-end closing prices of our common stock were $34.82$28.66 and $24.77$49.82 for 20122015 and 2011,2014, respectively. The closing price of our common stock on February 15, 201312, 2016 was $42.73.$22.35.
According to the records of our transfer agent, we had 3,0012,442 holders of record of common stock as of February 15, 2013.12, 2016. We believe that a substantially larger number of beneficial stockholders hold such shares in depository or nominee form.
Dividends
The declaration of dividends is subject to the discretion of the Board of Directors. We intend, from time to time, to pay cash dividends on our common stock as our Board of Directors deems appropriate, after consideration of our operating results, financial condition, cash and capital requirements, compliance with covenants in our revolving credit facility, note purchase agreement and such other factors as the Board of Directors deems relevant. To the extent assets are used to meet minimum net capital requirements under the Net Capital Rule, they are not available for distribution to stockholders as dividends. See Part I, Item 1. "Business—Regulation." We anticipate that quarterly dividends will continue to be paid.
Common Stock Repurchases
Our Board of Directors has authorized the repurchase of our common stock in the open market and/or private purchases. The acquired shares may be used for corporate purposes, including shares issued to employees in our stock-based compensation programs. During the year ended December 31, 2012,2015, we repurchased 1,536,9681,955,509 shares in the open market and privately at an aggregate cost, including commissions, of $48.7$80.3 million, including 568,568432,353 shares from related partiesemployees to cover their tax withholdings from the vesting of shares granted under our stock-based compensation programs. The aggregate cost of shares obtained from related parties during 20122015 was $19.1 million. The purchase price paid by us for private repurchases of our common stock from related parties is the closing market price on the purchase date.
The following table sets forth certain information about the shares of common stock we repurchased during the fourth quarter of 2012.2015.
Period | Total Number of Shares Purchased (1) | Average Price Paid per Share | Total Number of Shares Purchased as Part of Publicly Announced Program | Maximum Number (or Approximate Dollar Value) of Shares That May Yet Be Purchased Under The Program | Total Number of Shares Purchased (1) | Average Price Paid per Share | Total Number of Shares Purchased as Part of Publicly Announced Program | Maximum Number (or Approximate Dollar Value) of Shares That May Yet Be Purchased Under The Program | ||||||||||||||||
|---|---|---|---|---|---|---|---|---|---|---|---|---|---|---|---|---|---|---|---|---|---|---|---|---|
October 1 - October 31 | 125,000 | $ | 32.17 | 125,000 | n/a | (1) | 30,000 | $ | 34.26 | 30,000 | n/a | (1) | ||||||||||||
November 1 - November 30 | 53,285 | 32.22 | 53,285 | n/a | (1) | 130,535 | 35.80 | 130,000 | n/a | (1) | ||||||||||||||
December 1 - December 31 | 199,963 | 34.74 | 199,963 | n/a | (1) | 359,619 | 31.58 | 240,000 | n/a | (1) | ||||||||||||||
| | | | | | | | | | | | | |||||||||||||
Total | 378,248 | $ | 33.54 | 378,248 | 520,154 | $ | 32.79 | 400,000 | ||||||||||||||||
| | | | | | | | | | | | | |||||||||||||
| | | | | | | | | | | |||||||||||||||
| | | | | | | | | | | | | |||||||||||||
Total Return Performance
Comparison of Cumulative Total Return (1)
The above graph compares the cumulative total stockholder return on the Company's Class A common stock from December 31, 20072010 through December 31, 2012,2015, with the cumulative total return of the Standard & Poor's 500 Stock Index and the SNL Asset Manager Index. The SNL Asset Manager Index is a composite of 3644 publicly traded asset management companies (including, among others, the companies in the peer group reviewed by the Compensation Committee for executive compensation purposes) prepared by SNL Financial, Charlottesville, Virginia. The graph assumes the investment of $100 in the Company's Class A common stock and in each of the two indices on December 31, 20072010 with all dividends being reinvested. The closing price of the Company's Class A common stock on December 31, 20072010 (the last trading day of the year) was $36.09$35.29 per share. The stock price performance on the graph is not necessarily indicative of future price performance.
| | Period Ending | | Period Ending | | ||||||||||||||||||||||||||||||||||||
|---|---|---|---|---|---|---|---|---|---|---|---|---|---|---|---|---|---|---|---|---|---|---|---|---|---|---|---|---|---|---|---|---|---|---|---|---|---|---|---|---|
| Index | 12/31/07 | 12/31/08 | 12/31/09 | 12/31/10 | 12/31/11 | 12/31/12 | | 12/31/10 | 12/31/11 | 12/31/12 | 12/31/13 | 12/31/14 | 12/31/15 | | ||||||||||||||||||||||||||
| | | |||||||||||||||||||||||||||||||||||||||
Waddell & Reed Financial, Inc. | 100.00 | 44.46 | 90.61 | 107.45 | 77.53 | 115.11 | 100.00 | 72.16 | 107.13 | 205.58 | 160.85 | 96.28 | ||||||||||||||||||||||||||||
SNL Asset Manager | 100.00 | 47.52 | 77.10 | 88.75 | 76.76 | 98.48 | 100.00 | 86.50 | 110.97 | 170.54 | 179.91 | 153.43 | ||||||||||||||||||||||||||||
S&P 500 | 100.00 | 63.00 | 79.68 | 91.68 | 93.61 | 108.59 | 100.00 | 102.11 | 118.45 | 156.82 | 178.28 | 180.75 | ||||||||||||||||||||||||||||
ITEM 6. Selected Financial Data
The following table sets forth our selected consolidated financial and other data atas of the dates and for the periods indicated, and reflects continuing operations data. Selected financial data should be read in conjunction with, and is qualified in its entirety by, "Management's Discussion and Analysis of Financial Condition and Results of Operations" and our Consolidated Financial Statements and the Notes thereto appearing elsewhere in this report.
| | For the Year Ended December 31, | For the Year Ended December 31, | ||||||||||||||||||||||||||||||
|---|---|---|---|---|---|---|---|---|---|---|---|---|---|---|---|---|---|---|---|---|---|---|---|---|---|---|---|---|---|---|---|---|
| | 2012 | 2011 | 2010 | 2009 | 2008 (1) | 2015 | 2014 | 2013 | 2012 | 2011 | ||||||||||||||||||||||
| | (in thousands, except per share data and number of financial advisors) | (in thousands, except per share data, percentages, sales and personnel data) | ||||||||||||||||||||||||||||||
Revenues from: | ||||||||||||||||||||||||||||||||
Investment management fees | $ | 549,231 | 530,599 | 457,538 | 354,593 | 399,863 | $ | 709,562 | 768,102 | 650,442 | 549,231 | 530,599 | ||||||||||||||||||||
Underwriting and distribution fees | 496,465 | 469,484 | 410,380 | 331,754 | 365,345 | 663,998 | 678,678 | 582,819 | 496,465 | 469,484 | ||||||||||||||||||||||
Shareholder service fees | 128,109 | 122,449 | 110,348 | 97,969 | 94,514 | 143,071 | 150,979 | 137,093 | 128,109 | 122,449 | ||||||||||||||||||||||
| | | | | | | | | | | | | | | | | | ||||||||||||||||
Total revenues | 1,173,805 | 1,122,532 | 978,266 | 784,316 | 859,722 | 1,516,631 | 1,597,759 | 1,370,354 | 1,173,805 | 1,122,532 | ||||||||||||||||||||||
Income from continuing operations | 192,528 | 172,205 | 153,428 | 104,051 | 96,210 | |||||||||||||||||||||||||||
Net income | $ | 245,536 | 313,331 | 252,998 | 192,528 | 172,205 | ||||||||||||||||||||||||||
Operating margin | 27% | 30% | 28% | 26% | 25% | |||||||||||||||||||||||||||
Net income per share from continuing operations, basic and diluted | 2.25 | 2.01 | 1.79 | 1.22 | 1.12 | $ | 2.94 | 3.71 | 2.96 | 2.25 | 2.01 | |||||||||||||||||||||
Dividends declared per common share | $ | 2.03 | 0.85 | 0.77 | 0.76 | 0.76 | $ | 1.75 | 1.45 | 1.18 | 2.03 | 0.85 | ||||||||||||||||||||
Wholesale channel data: | ||||||||||||||||||||||||||||||||
Sales (net of commissions) | $ | 15,258,158 | 16,527,674 | 14,448,552 | 14,653,043 | 15,524,989 | ||||||||||||||||||||||||||
Sales (in millions) | $ | 12,218 | 18,534 | 21,411 | 15,930 | 16,873 | ||||||||||||||||||||||||||
Number of external wholesalers | 50 | 51 | 46 | 34 | 35 | 61 | 59 | 50 | 50 | 51 | ||||||||||||||||||||||
Advisor channel data: | ||||||||||||||||||||||||||||||||
Sales (net of commissions) | $ | 4,050,418 | 3,799,077 | 3,615,654 | 3,201,867 | 3,724,165 | ||||||||||||||||||||||||||
Gross revenue per advisor | 168.2 | 155.7 | 118.9 | 92.8 | 103.0 | |||||||||||||||||||||||||||
Number of financial advisors (end of period) | 1,763 | 1,816 | 1,847 | 2,393 | 2,366 | |||||||||||||||||||||||||||
Sales (in millions) | $ | 5,073 | 5,545 | 5,232 | 4,505 | 4,153 | ||||||||||||||||||||||||||
Advisors' productivity (1) | $ | 265 | 254 | 215 | 180 | 165 | ||||||||||||||||||||||||||
Average number of financial advisors | 1,762 | 1,757 | 2,019 | 2,336 | 2,297 | 1,774 | 1,750 | 1,749 | 1,762 | 1,757 | ||||||||||||||||||||||
Institutional channel sales | $ | 2,501,643 | 3,413,748 | 3,588,260 | 1,703,470 | 2,358,104 | ||||||||||||||||||||||||||
Institutional channel sales (in millions) | $ | 2,743 | 3,392 | 3,108 | 2,720 | 3,526 | ||||||||||||||||||||||||||
Shares outstanding at December 31 | 82,850 | 83,654 | 85,236 | 85,679 | 85,564 | |||||||||||||||||||||||||||
| | As of December 31, | |||||||||||||||
|---|---|---|---|---|---|---|---|---|---|---|---|---|---|---|---|---|
| | 2015 | 2014 | 2013 | 2012 | 2011 | |||||||||||
| | (in millions, except for percentages) | |||||||||||||||
Assets under management | $ | 104,399 | 123,650 | 126,543 | 96,365 | 83,157 | ||||||||||
Diversification (company total) | ||||||||||||||||
As % of Sales | ||||||||||||||||
Asset Strategy | 13% | 25% | 29% | 26% | 37% | |||||||||||
Fixed Income | 21% | 26% | 29% | 34% | 18% | |||||||||||
Other | 66% | 49% | 42% | 40% | 45% | |||||||||||
As % of Assets Under Management | ||||||||||||||||
Asset Strategy | 21% | 29% | 34% | 34% | 35% | |||||||||||
Fixed Income | 18% | 18% | 18% | 21% | 17% | |||||||||||
Other | 61% | 53% | 48% | 45% | 48% | |||||||||||
Balance sheet data: | ||||||||||||||||
Goodwill and identifiable intangible assets | $ | 158.1 | 158.1 | 162.0 | 162.0 | 162.0 | ||||||||||
Total assets | 1,555.7 | 1,511.9 | 1,337.0 | 1,152.8 | 1,082.4 | |||||||||||
Long-term debt | 190.0 | 190.0 | 190.0 | 190.0 | 190.0 | |||||||||||
Total liabilities | 709.3 | 725.8 | 649.7 | 642.6 | 558.8 | |||||||||||
Stockholders' equity | 846.5 | 786.1 | 687.3 | 510.2 | 523.6 | |||||||||||
| | As of December 31, | |||||||||||||||
|---|---|---|---|---|---|---|---|---|---|---|---|---|---|---|---|---|
| | 2012 | 2011 | 2010 | 2009 | 2008 | |||||||||||
| | (in millions) | |||||||||||||||
Assets under management | $ | 96,365 | 83,157 | 83,673 | 69,783 | 47,484 | ||||||||||
Balance sheet data: | ||||||||||||||||
Goodwill and identifiable intangible assets | 162.0 | 162.0 | 162.0 | 162.0 | 162.0 | |||||||||||
Total assets | 1,152.8 | 1,082.4 | 976.9 | 983.4 | 775.4 | |||||||||||
Long-term debt | 190.0 | 190.0 | 190.0 | 200.0 | 200.0 | |||||||||||
Total liabilities | 642.6 | 558.8 | 519.8 | 614.3 | 455.3 | |||||||||||
Stockholders' equity | 510.2 | 523.6 | 457.1 | 369.1 | 320.1 | |||||||||||
ITEM 7. Management's Discussion and Analysis of Financial Condition and Results of Operations
This Item contains "forward-looking statements" within the meaning of Section 27A of the Securities Act of 1933, as amended, and Section 21E of the Securities Exchange Act of 1934, as amended, which reflect the current views and assumptions of management with respect to future events regarding our business and the industry in general. These forward-looking statements include all statements, other than statements of historical fact, regarding our financial position, business strategy and other plans and objectives for future operations, including statements with respect to revenues and earnings, the amount and composition of assets under management, distribution sources, expense levels, redemption rates and the financial markets and other conditions. These statements are generally identified by the use of words such as "may," "could," "should," "would," "believe," "anticipate," "forecast," "estimate," "expect," "intend," "plan," "project," "outlook," "will," "potential" and similar statements of a future or forward-looking nature. Readers are cautioned that any forward-looking information provided by or on behalf of the Company is not a guarantee of future performance. Certain important factors that could cause actual results to differ materially from our expectations are disclosed in the "Risk Factors" section of this Form 10-K, which include, without limitation, the adverse effect from a decline in securities markets or in the relative investment performance of our products, our inability to pay future dividends, the loss of existing distribution channels or the inability to access new ones, a reduction of the assets we manage on short notice, and adverse results of litigation and/or arbitration. All forward-looking statements speak only as of the date on which they are made and we undertake no duty to update or revise any forward-looking statements, whether as a result of new information, future events or otherwise.
The following should be read in conjunction with the "Selected Financial Data" and our Consolidated Financial Statements and Notes thereto appearing elsewhere in this report.
Executive Overview
We are one of the oldest mutual fund and asset management firms in the country, with expertise in a broad range of investment styles and across a variety of market environments. Our earnings and cash flows are heavily dependent on financial market conditions. Significant increases or decreases in the various securities markets can have a material impact on our results of operations, financial condition and cash flows.
Revenue Sources
We derive our revenues from providing investment management and advisory services, investment product underwriting and distribution, and shareholder services administration to mutual fundsthe Funds, the IGI Funds, and institutional and separately managed accounts. Investment management and/or advisory fees are based on the amount of average assets under management and are affected by sales levels, financial market conditions, redemptions and the composition of assets. Our underwriting and distribution revenues consist of commissions derived from sales of investment and insurance products, Rule 12b-1 asset-based service and distribution fees, distribution fees on certain variable products, fees earned on fee-based asset allocation products and related advisory services.services, distribution fees on certain variable products, and commissions derived from sales of investment and insurance products. The products sold have various commission structures and the revenues received from those sales vary based on the type and dollar amount sold. Shareholder service fee revenue includes transfer agency fees, custodian fees from retirement plan accounts, portfolio accounting and administration fees, and is earned based on assets under management or number of client accounts.
Expense Drivers
Our major expenses are underwriting and distribution-relatedfor commissions, employee compensation, amortization of deferred sales commissions, subadvisory fee expensesfield support, dealer services and information technology expense.technology.
Our Distribution Channels
One of our distinctive qualities is that we aredistribute our investment products through a significant distributor of investment products.balanced distribution network. Our retail products are distributed through our Wholesale channel, which includes third-partiesthird parties such as other broker/dealers, registered investment advisors and various retirement platforms or through our Advisors
channel sales force of independent financial advisors. We also market our investment advisory services to institutional investors, either directly or through consultants, in our Institutional channel.
Our Wholesale Channelchannel is our fastest growing distribution channel. Channel efforts are led by the solid long-term performance record of the Ivy Funds family.Funds. We distribute retail mutual funds through broker/dealers, and registered investment advisors and various retirement platforms through a team of external, internal and hybrid wholesalers as well as a team dedicated to national accounts.
The Ivy Funds maintain strong positions on many of the leading third-partythird party distribution platforms, and we continue efforts to diversify our sales by offering other solid performing funds besides our flagship Ivy Asset Strategy fund to our partners.sales. During 2012,2015, we had nine funds exceed gross sales of $250 million. Sales of products other than our Ivy Asset Strategy fund accounted for 68%83% of total Ivy Funds sales during 20122015 compared to 53%66% during 20112014 and 40%64% for 2010.2013. We expect the Wholesale Channelchannel to be critical in driving our organic growth rate in the coming years.
Our Advisors channel sales force consists of 1,7631,819 independent financial advisors spread throughout the United States, who carry out our mission of providing financial advice for retirement, education funding, estate planning and other financial needs for our clients. A distinguishing aspect of this channel is its industry low redemption rate, which can be attributed to the personal and customized nature in which our
advisors provide service to our clients by focusing on meeting their clients.long-term financial objectives; this, in turn, leads to a more stable asset base for the channel.
Over the past three years, weWe have experienced a decline in our number of financial advisors; however, the decline was not unexpected as we continue to push for higher production from our advisors by increasing minimum production requirements for them to stay licensed with us. Our gross revenue production per advisor increased 41%, to $168 thousand, and gross sales in the channel increased 12%, to $4.1 billion, during the past two years, despite the 13% decrease in advisor headcount. This headcount decline leveled off during 2012. We continue to focusfocused our recruiting efforts on bringing in experienced advisors.advisors, which has allowed us to achieve productivity growth, as Advisors channel underwriting and distribution fee revenues per advisor increased 4%, to $265 thousand, while sales in the channel decreased 3%, to $5.1 billion, during the past two years.
Through our Institutional channel we manage assets in a variety of investment styles for a variety of types of institutions.institutions as well as the IGI Funds. The largest percentage of our clients hire us to act as subadvisor for their branded products; they are typically domestic or foreign distributors of investment products who lack scale or the track record to manage internally, or choose to market multi-manager styles. This is the smallest of our three distribution channels but it has experienced positive gross sales and net flow trends over the past two years due to our growing subadvisory relationships. Our subadvisory relationships currently accountaccounted for more than 65%70% of the channel's $11.8$15.4 billion in assets at the end of 2012.2015. Our diverse client list also includes pension funds, Taft-Hartley plans and endowments.
Market DevelopmentsStrategic Initiatives
As previously announced in 2016, we will undertake a modernization of our brokerage and product platform that will include the restructuring of our share classes. This new platform will move us from a paper-based, labor intensive environment to one utilizing innovative brokerage platform technology, which also will include significant enhancements to our investment advisory programs, financial planning capabilities and client experience, all of which we expect to enhance both advisor and back-office efficiency. As part of this effort, we intend to convert load-waived Class A shares into the more widely used institutional shares (Class I or Y) as the exclusive share classes in our investment advisory programs. This step is consistent with industry trends and will allow us to compete more effectively for investment advisory assets. The financial markets experienced strong gainsshare conversion is expected to occur in 2012 despite ongoing uncertainty surrounding government policymid-2016, and global economic growth. Retail investors were willingthe platform launch will likely take place in the third quarter of 2016. We believe that these initiatives, referred to accept minimal returns rather than expose themselvesinternally as "Project E," positions the Advisors channel for long-term competitiveness.
With the staged implementation of Project E, we expect operating income to be reduced by approximately $29.0 million in 2016 due to one-time and on-going costs associated with Project E, and a reduction in our Rule 12b-1 asset-based service and distribution fee revenue following the highly unpredictable equity market, which led to meaningful outflowsconversion of actively managed equity funds. Through this volatile year, the Company generated net flows of $2.3approximately $17.6 billion and maintained stable redemption rates compared to industry averages. Strong market appreciation combined with positive flows contributed to a 16% increase in assets under management comparedin our investment advisory programs from load-waived Class A shares to December 31, 2011, as we reachedinstitutional shares classes. Load-waived Class A shares held in advisory programs have historically charged a maximum fee of 0.25% of the average daily net assets under management of $96.4 billion atpursuant to the applicable Rule 12b-1 service and distribution plan; institutional shares classes do not charge a Rule 12b-1 fee. Rule 12b-1 service and distribution revenue on load-waived Class A share mutual funds held in advisory program accounts was $41.8 million and $37.8 million for the years ended December 31, 2012.
Sale of Legend
During 2012,2015 and December 31, 2014, respectively. Since the Company committed tocurrently pays a plan to sell its Legend subsidiaries and on October 29, 2012 the Company signed a definitive agreement to execute the transaction. The sale closed effective January 1, 2013. Based on the valuelarge portion of the considerationRule 12b-1 service and distribution fees it receives from load-waived Class A share mutual funds held in advisory program accounts to the Company expected to receive upon closing, whichfinancial advisors servicing and distributing the shares, the impact of the loss of Rule 12b-1 fee revenue is less thansomewhat offset by the carrying value of net assetscorresponding reduction in Rule 12b-1 fee payments to be sold,made to financial advisors. Rule 12b-1 fee payments to financial advisors were $28.8 million and $25.8 million for the Company recorded a non-cash impairment charge of $42.4 million, which is reflected in income (loss) from discontinued operations on the statementyears ended December 31, 2015 and December 31, 2014, respectively.
of income. The consideration received was subject to working capital and regulatory capital adjustments throughfollowing are the closing date. The Company retained $7.7 million of Legend's excess working capital as partcomponents of the agreement. The agreement also includes an earnout provisionestimated $29.0 million impact to 2016 operating income based on asset retention forDecember 31, 2015, assets and an assumed July 1, 2016, conversion date (amounts in millions):
Revenues: | |||||||
Underwriting and distribution fees | $ | (19 | ) | ||||
Shareholder service fees | (8 | ) | |||||
| | | | | | | | |
Total | (27 | ) | |||||
Operating expenses: | |||||||
Underwriting and distribution | |||||||
12b-1 payout (direct) | (11 | ) | |||||
Platform (indirect) | 8 | ||||||
Other | 1 | ||||||
| | | | | | | | |
Total | (2 | ) | |||||
General and administrative | |||||||
Networking fees | 4 | ||||||
| | | | | | | | |
Total | 4 | ||||||
| | | | | | | | |
Pre-tax operating income | $ | (29 | ) | ||||
| | | | | | | | |
| | | | | | | | |
| | | | | | | | |
To offset the projected decrease in 2016 operating income, we will undertake significant cost reduction efforts to reduce fixed costs by approximately 10%, or $40.0 million, on our annual run-rate basis over the next 12-18 months, with a periodgoal to realize approximately two-thirds of two years following the closing date.reduction in 2016. The Company's profitability may be adversely impacted if the Company in unable to generate additional revenue in lieu of Rule 12b-1 fees associated with load-waived Class A shares or if it is unsuccessful in its cost reduction efforts.
The operational results of Legend have been presented as discontinued operationsAdditionally, in the consolidated financial statements for all periods presented. Unless otherwise stated, referencesan effort to globalize our distribution network and further strategic goals, our Institutional and Wholesale channels will work together to establish a footprint in Management's Discussion and Analysis of Financial Condition and Results of Operations refers to continuing operations.London by mid 2016.
Operating Results
The companyCompany ended the year with $1.2$1.5 billion in revenues. The revenue increasedecrease of 5% relative to fiscal 20112014 was reflective of an increasea decrease in our average managed assets and positive net flows.of 10%. Average assets under management were $91.7$117.6 billion in 20122015 compared to $87.1$130.1 billion in 2011.
Income from continuing operations increased 12%2014. Net income decreased 22% compared to 20112014 while our operating margin improved slightlydeclined to 27.4% from 25.5% to 25.8%30.3%. We plan to continue our focus on cost controls during 2013.
Our balance sheet remains strong, as we ended the year with cash and investments of $504.2 million, after payment of an $85.4 million special dividend in December.$850.2 million. At December 31, 2012,2015, we had no borrowings outstanding under our threefive year revolving credit facility, which provides for initial borrowings of up to $125.0 million and can be expanded to $200.0 million.
Table of Contentsfacility.
Assets Under Management
Assets under management of $96.4$104.4 billion on December 31, 2012 increased $13.22015 decreased $19.3 billion, or 16%, compared to $83.2$123.7 billion reported a year ago. Market appreciationon December 31, 2014. The decrease in assets under management is due to outflows of $10.9$13.8 billion, across the complex, and net sales of $1.4which $10.7 billion generated bywas in the Wholesale channel, were the primary contributors to this increase.and market depreciation of $5.5 billion.
Change in Assets Under Management (1)
| | Wholesale Channel | Advisors Channel | Institutional Channel | Total | |||||||||
|---|---|---|---|---|---|---|---|---|---|---|---|---|---|
| | (in millions) | ||||||||||||
December 31, 2015 | |||||||||||||
Beginning Assets | $ | 60,335 | 45,517 | 17,798 | 123,650 | ||||||||
Sales (2) | 12,218 | 5,073 | 2,743 | 20,034 | |||||||||
Redemptions | (23,686) | (5,044) | (5,081) | (33,811) | |||||||||
Net Exchanges | 809 | (809) | — | — | |||||||||
| | | | | | | | | | | | | | |
Net Flows | (10,659) | (780) | (2,338) | (13,777) | |||||||||
Market Depreciation | (4,035) | (1,393) | (46) | (5,474) | |||||||||
| | | | | | | | | | | | | | |
Ending Assets | $ | 45,641 | 43,344 | 15,414 | 104,399 | ||||||||
| | | | | | | | | | | | | | |
| | | | | | | | | | | | | | |
| | | | | | | | | | | | | | |
December 31, 2014 | |||||||||||||
Beginning Assets | $ | 67,055 | 43,667 | 15,821 | 126,543 | ||||||||
Sales (2) | 18,534 | 5,545 | 3,392 | 27,471 | |||||||||
Redemptions | (23,524) | (4,575) | (2,920) | (31,019) | |||||||||
Net Exchanges | (101) | (384) | 485 | 0 | |||||||||
| | | | | | | | | | | | | | |
Net Flows | (5,091) | 586 | 957 | (3,548) | |||||||||
Market Appreciation | (1,629) | 1,264 | 1,020 | 655 | |||||||||
| | | | | | | | | | | | | | |
Ending Assets | $ | 60,335 | 45,517 | 17,798 | 123,650 | ||||||||
| | | | | | | | | | | | | | |
| | | | | | | | | | | | | | |
| | | | | | | | | | | | | | |
December 31, 2013 | |||||||||||||
Beginning Assets | $ | 48,930 | 35,660 | 11,775 | 96,365 | ||||||||
Sales (2) | 21,411 | 5,232 | 3,108 | 29,751 | |||||||||
Redemptions | (14,313) | (4,304) | (2,622) | (21,239) | |||||||||
Net Exchanges | 303 | (306) | — | (3) | |||||||||
| | | | | | | | | | | | | | |
Net Flows | 7,401 | 622 | 486 | 8,509 | |||||||||
Market Appreciation | 10,724 | 7,385 | 3,560 | 21,669 | |||||||||
| | | | | | | | | | | | | | |
Ending Assets | $ | 67,055 | 43,667 | 15,821 | 126,543 | ||||||||
| | | | | | | | | | | | | | |
| | | | | | | | | | | | | | |
| | | | | | | | | | | | | | |
| | Wholesale Channel | Advisors Channel | Institutional Channel | Total | |||||||||
|---|---|---|---|---|---|---|---|---|---|---|---|---|---|
| | (in millions) | ||||||||||||
December 31, 2012 | |||||||||||||
Beginning Assets | $ | 40,954 | 31,709 | 10,494 | 83,157 | ||||||||
Sales (net of commissions) | 15,325 | 4,051 | 2,502 | 21,878 | |||||||||
Redemptions | (13,896) | (4,156) | (2,760) | (20,812) | |||||||||
Net Sales | 1,429 | (105) | (258) | 1,066 | |||||||||
Net Exchanges | 155 | (158) | - | (3) | |||||||||
Reinvested Dividends and Capital Gains | 605 | 454 | 218 | 1,277 | |||||||||
Net Flows | 2,189 | 191 | (40) | 2,340 | |||||||||
Market Appreciation | 5,787 | 3,760 | 1,321 | 10,868 | |||||||||
Ending Assets | $ | 48,930 | 35,660 | 11,775 | 96,365 | ||||||||
December 31, 2011 | |||||||||||||
Beginning Assets | $ | 40,883 | 33,181 | 9,609 | 83,673 | ||||||||
Sales (net of commissions) | 16,594 | 3,800 | 3,413 | 23,807 | |||||||||
Redemptions | (12,995) | (4,047) | (2,479) | (19,521) | |||||||||
Net Sales | 3,599 | (247) | 934 | 4,286 | |||||||||
Net Exchanges | 261 | (262) | - | (1) | |||||||||
Reinvested Dividends and Capital Gains | 279 | 353 | 112 | 744 | |||||||||
Net Flows | 4,139 | (156) | 1,046 | 5,029 | |||||||||
Market Depreciation | (4,068) | (1,316) | (161) | (5,545) | |||||||||
Ending Assets | $ | 40,954 | 31,709 | 10,494 | 83,157 | ||||||||
December 31, 2010 | |||||||||||||
Beginning Assets | $ | 32,818 | 29,474 | 7,491 | 69,783 | ||||||||
Sales (net of commissions) | 14,505 | 3,616 | 3,588 | 21,709 | |||||||||
Redemptions | (10,560) | (3,526) | (2,874) | (16,960) | |||||||||
Net Sales | 3,945 | 90 | 714 | 4,749 | |||||||||
Net Exchanges | 190 | (308) | 116 | (2) | |||||||||
Reinvested Dividends and Capital Gains | 237 | 338 | 114 | 689 | |||||||||
Net Flows | 4,372 | 120 | 944 | 5,436 | |||||||||
Market Appreciation | 3,693 | 3,587 | 1,174 | 8,454 | |||||||||
Ending Assets | $ | 40,883 | 33,181 | 9,609 | 83,673 | ||||||||
Average assets under management, which are generally more indicative of trends in revenue for providing investment management services than the year over year change in ending assets under management, increaseddecreased by 5%10% compared to 2011.2014.
Average Assets Under Management
| | 2012 | 2011 | 2010 | 2015 | 2014 | 2013 | ||||||||||||||||||||||||||||||||
|---|---|---|---|---|---|---|---|---|---|---|---|---|---|---|---|---|---|---|---|---|---|---|---|---|---|---|---|---|---|---|---|---|---|---|---|---|---|---|
| | Average | Percentage of Total | Average | Percentage of Total | Average | Percentage of Total | Average | Percentage of Total | Average | Percentage of Total | Average | Percentage of Total | ||||||||||||||||||||||||||
| | (in millions, except percentage data) | (in millions, except percentage data) | ||||||||||||||||||||||||||||||||||||
Distribution Channel: | ||||||||||||||||||||||||||||||||||||||
Wholesale Channel | ||||||||||||||||||||||||||||||||||||||
Equity | $ | 37,924 | 83% | 39,387 | 91% | 32,805 | 92% | $ | 45,434 | 82% | 54,563 | 80% | 45,047 | 80% | ||||||||||||||||||||||||
Fixed income | 7,684 | 17% | 3,684 | 8% | 2,385 | 7% | 9,848 | 18% | 13,203 | 20% | 11,359 | 20% | ||||||||||||||||||||||||||
Money market | 191 | 0% | 320 | 1% | 284 | 1% | 154 | — | 168 | — | 184 | — | ||||||||||||||||||||||||||
| | | | | | | | | | | | | | | | | | | | | |||||||||||||||||||
Total | $ | 45,799 | 100% | 43,391 | 100% | 35,474 | 100% | $ | 55,436 | 100% | 67,934 | 100% | 56,590 | 100% | ||||||||||||||||||||||||
| | | | | | | | | | | | | | | | | | | | | |||||||||||||||||||
| | | | | | | | | | | | | | | |||||||||||||||||||||||||
| | | | | | | | | | | | | | | | | | | | | |||||||||||||||||||
Advisors Channel | ||||||||||||||||||||||||||||||||||||||
Equity | $ | 24,227 | 70% | 24,477 | 73% | 22,430 | 74% | $ | 33,799 | 74% | 32,999 | 74% | 28,449 | 72% | ||||||||||||||||||||||||
Fixed income | 8,933 | 26% | 7,629 | 23% | 6,614 | 22% | 9,911 | 22% | 9,935 | 22% | 9,477 | 24% | ||||||||||||||||||||||||||
Money market | 1,318 | 4% | 1,203 | 4% | 1,288 | 4% | 1,864 | 4% | 1,966 | 4% | 1,565 | 4% | ||||||||||||||||||||||||||
| | | | | | | | | | | | | | | | | | | | | |||||||||||||||||||
Total | $ | 34,478 | 100% | 33,309 | 100% | 30,332 | 100% | $ | 45,574 | 100% | 44,900 | 100% | 39,491 | 100% | ||||||||||||||||||||||||
| | | | | | | | | | | | | | | | | | | | | |||||||||||||||||||
| | | | | | | | | | | | | | | |||||||||||||||||||||||||
| | | | | | | | | | | | | | | | | | | | | |||||||||||||||||||
Institutional Channel | ||||||||||||||||||||||||||||||||||||||
Equity | $ | 10,630 | 93% | 9,627 | 93% | 7,467 | 91% | $ | 15,440 | 93% | 16,483 | 95% | 12,433 | 95% | ||||||||||||||||||||||||
Fixed income | 784 | 7% | 780 | 7% | 732 | 9% | 1,134 | 7% | 824 | 5% | 668 | 5% | ||||||||||||||||||||||||||
Money market | - | - | - | - | - | - | — | — | — | — | — | — | ||||||||||||||||||||||||||
| | | | | | | | | | | | | | | | | | | | | |||||||||||||||||||
Total | $ | 11,414 | 100% | 10,407 | 100% | 8,199 | 100% | $ | 16,574 | 100% | 17,307 | 100% | 13,101 | 100% | ||||||||||||||||||||||||
| | | | | | | | | | | | | | | | | | | | | |||||||||||||||||||
| | | | | | | | | | | | | | | |||||||||||||||||||||||||
| | | | | | | | | | | | | | | | | | | | | |||||||||||||||||||
Total by Asset Class: | ||||||||||||||||||||||||||||||||||||||
Equity | $ | 72,781 | 84% | 73,491 | 84% | 62,702 | 85% | $ | 94,673 | 80% | 104,045 | 80% | 85,929 | 79% | ||||||||||||||||||||||||
Fixed income | 17,401 | 14% | 12,093 | 14% | 9,731 | 13% | 20,893 | 18% | 23,962 | 18% | 21,504 | 20% | ||||||||||||||||||||||||||
Money market | 1,509 | 2% | 1,523 | 2% | 1,572 | 2% | 2,018 | 2% | 2,134 | 2% | 1,749 | 1% | ||||||||||||||||||||||||||
| | | | | | | | | | | | | | | | | | | | | |||||||||||||||||||
Total | $ | 91,691 | 100% | 87,107 | 100% | 74,005 | 100% | $ | 117,584 | 100% | 130,141 | 100% | 109,182 | 100% | ||||||||||||||||||||||||
| | | | | | | | | | | | | | | | | | | | | |||||||||||||||||||
| | | | | | | | | | | | | | | |||||||||||||||||||||||||
| | | | | | | | | | | | | | | | | | | | | |||||||||||||||||||
The following table summarizes our five largest mutual funds as of December 31, 20122015 by ending assets under management and investment management fees, forwith the last three years.comparative positions in 2014 and 2013. The assets under management and management fees of our five largestthese mutual funds are presented as a percentage of our total assets under management and total management fees.
Five Largest Mutual Funds by Ending Assets Under Management and Investment Management Fees
| | 2012 | 2011 | 2010 | 2015 | 2014 | 2013 | ||||||||||||||||||||||||||||||||
|---|---|---|---|---|---|---|---|---|---|---|---|---|---|---|---|---|---|---|---|---|---|---|---|---|---|---|---|---|---|---|---|---|---|---|---|---|---|---|
| | Ending | Percentage of Total | Ending | Percentage of Total | Ending | Percentage of Total | Ending | Percentage of Total | Ending | Percentage of Total | Ending | Percentage of Total | ||||||||||||||||||||||||||
| | (in millions, except percentage data) | (in millions, except percentage data) | ||||||||||||||||||||||||||||||||||||
By Assets Under Management: | ||||||||||||||||||||||||||||||||||||||
Ivy Asset Strategy | $ | 25,981 | 27% | 23,642 | 28% | 25,106 | 30% | $ | 15,261 | 15% | 27,431 | 22% | 34,647 | 27% | ||||||||||||||||||||||||
Ivy Science & Technology | 5,921 | 6% | 5,926 | 5% | 4,648 | 4% | ||||||||||||||||||||||||||||||||
Ivy High Income | 7,228 | 8% | 3,197 | 4% | 1,694 | 2% | 5,263 | 5% | 8,341 | 7% | 10,365 | 8% | ||||||||||||||||||||||||||
Advisors Asset Strategy | 3,076 | 3% | 2,772 | 3% | 3,328 | 4% | ||||||||||||||||||||||||||||||||
Ivy International Core Equity | 4,505 | 4% | 2,715 | 2% | 2,005 | 2% | ||||||||||||||||||||||||||||||||
Advisors Core Investment | 3,067 | 3% | 2,724 | 3% | 2,888 | 3% | 4,131 | 4% | 4,507 | 4% | 4,169 | 3% | ||||||||||||||||||||||||||
Ivy Mid Cap Growth | 2,777 | 3% | 1,500 | 2% | 543 | 1% | ||||||||||||||||||||||||||||||||
| | | | | | | | | | | | | | | | | | | | | |||||||||||||||||||
Total | $ | 42,129 | 44% | 33,835 | 40% | 33,559 | 40% | $ | 35,081 | 34% | 48,920 | 40% | 55,834 | 44% | ||||||||||||||||||||||||
| | | | | | | | | | | | | | | | | | | | | |||||||||||||||||||
| | | | | | | | | | | | | | | |||||||||||||||||||||||||
| | | | | | | | | | | | | | | | | | | | | |||||||||||||||||||
(in thousands, except percentage data) | (in thousands, except percentage data) | |||||||||||||||||||||||||||||||||||||
By Management Fees: | ||||||||||||||||||||||||||||||||||||||
Ivy Asset Strategy | $ | 142,701 | 26% | 146,649 | 28% | 123,638 | 27% | $ | 126,688 | 18% | 189,106 | 25% | 164,372 | 25% | ||||||||||||||||||||||||
Ivy Global Natural Resources (1) | 28,886 | 5% | 46,324 | 9% | 43,839 | 10% | ||||||||||||||||||||||||||||||||
Ivy Science & Technology | 49,199 | 7% | 43,950 | 5% | 22,949 | 4% | ||||||||||||||||||||||||||||||||
Ivy High Income | 28,182 | 5% | 12,843 | 2% | 7,925 | 2% | 37,938 | 5% | 54,252 | 7% | 44,095 | 7% | ||||||||||||||||||||||||||
Advisors Asset Strategy | 19,248 | 4% | 20,465 | 4% | 20,402 | 4% | ||||||||||||||||||||||||||||||||
Ivy Mid Cap Growth | 37,900 | 5% | 38,416 | 5% | 30,082 | 5% | ||||||||||||||||||||||||||||||||
Advisors Science & Technology | 19,007 | 3% | 19,208 | 3% | 18,379 | 4% | 31,074 | 4% | 30,296 | 4% | 24,500 | 4% | ||||||||||||||||||||||||||
| | | | | | | | | | | | | | | | | | | | | |||||||||||||||||||
Total | $ | 238,024 | 43% | 245,489 | 46% | 214,183 | 47% | $ | 282,799 | 39% | 356,020 | 46% | 285,998 | 45% | ||||||||||||||||||||||||
| | | | | | | | | | | | | | | | | | | | | |||||||||||||||||||
| | | | | | | | | | | | | | | |||||||||||||||||||||||||
| | | | | | | | | | | | | | | | | | | | | |||||||||||||||||||
Results of Operations
Net Income from Continuing Operations
| | For the Year Ended December 31, | Variance | ||||||||||||||
|---|---|---|---|---|---|---|---|---|---|---|---|---|---|---|---|---|
| | 2012 vs. 2011 | 2011 vs. 2010 | ||||||||||||||
| | 2012 | 2011 | 2010 | |||||||||||||
| | (in thousands, except percentage data) | |||||||||||||||
Income from continuing operations | $ | 192,528 | 172,205 | 153,428 | 12% | 12% | ||||||||||
Net income per share from continuing operations, basic and diluted | $ | 2.25 | 2.01 | 1.79 | 12% | 12% | ||||||||||
Operating Margin | 26% | 25% | 25% | 1% | 0% | |||||||||||
| | For the Year Ended December 31, | Variance | ||||||||||||||
|---|---|---|---|---|---|---|---|---|---|---|---|---|---|---|---|---|
| | 2015 | 2014 | 2013 | 2015 vs. 2014 | 2014 vs. 2013 | |||||||||||
| | (in thousands, except per share and percentage data) | |||||||||||||||
Net income | $ | 245,536 | 313,331 | 252,998 | –22% | 24% | ||||||||||
Net income per share, basic and diluted | $ | 2.94 | 3.71 | 2.96 | –21% | 25% | ||||||||||
Operating Margin | 27% | 30% | 28% | –3% | 2% | |||||||||||
We reported income from continuing operations of $192.5 million, or $2.25 per diluted share, in 2012 compared to $172.2 million, or $2.01 per diluted share, in 2011 and $153.4 million, or $1.79 per diluted share, in 2010.
Total Revenues
Total revenues increaseddecreased 5% in 20122015 compared to 2011,2014, attributable to an increasea decrease in average assets under management of 5%,10% and a decrease in sales of 27%. Total revenues increased 17% in 2014
compared to 2013, attributable to increases in average assets under management of 19% partially offset by a decrease in gross sales of 8%, while total revenues increased 15% in 2011 compared to 2010, attributable to an increase in average assets under management of 18% and an increase in gross sales of 10%.
| | For the Year Ended December 31, | Variance | ||||||||||||||||||||||||||||||
|---|---|---|---|---|---|---|---|---|---|---|---|---|---|---|---|---|---|---|---|---|---|---|---|---|---|---|---|---|---|---|---|---|
| | 2012 vs. 2011 | 2011 vs. 2010 | For the Year Ended December 31, | Variance | ||||||||||||||||||||||||||||
| | 2012 | 2011 | 2010 | 2015 | 2014 | 2013 | 2015 vs. 2014 | 2014 vs. 2013 | ||||||||||||||||||||||||
| | (in thousands, except percentage data) | (in thousands, except percentage data) | ||||||||||||||||||||||||||||||
Investment management fees | $ | 549,231 | 530,599 | 457,538 | 4% | 16% | $ | 709,562 | 768,102 | 650,442 | –8% | 18% | ||||||||||||||||||||
Underwriting and distribution fees | 496,465 | 469,484 | 410,380 | 6% | 14% | 663,998 | 678,678 | 582,819 | –2% | 16% | ||||||||||||||||||||||
Shareholder service fees | 128,109 | 122,449 | 110,348 | 5% | 11% | 143,071 | 150,979 | 137,093 | –5% | 10% | ||||||||||||||||||||||
| | | | | | | | | | | | | | | | ||||||||||||||||||
Total revenues | $ | 1,173,805 | 1,122,532 | 978,266 | 5% | 15% | $ | 1,516,631 | 1,597,759 | 1,370,354 | –5% | 17% | ||||||||||||||||||||
| | | | | | | | | | | | | | | | ||||||||||||||||||
| | | | | | | | | | | | | |||||||||||||||||||||
| | | | | | | | | | | | | | | | ||||||||||||||||||
Investment Management Fee Revenues
Investment management fee revenues are earned forby providing investment advisory services to the Funds, the IGI Funds and to institutional and separate accounts. Investment management fee revenues increased $18.6decreased $58.5 million, or 4%8%, in 20122015 and increased $73.1$117.7 million, or 16%18%, in 2011.2014.
Investment management fee revenues are based on the level of average assets under management and are affected by sales, financial market conditions, redemptions and the composition of assets. The following graph illustrates the direct relationship between average assets under management and investment management fee revenues for the years ending December 31, 2013, 2014 and 2015.
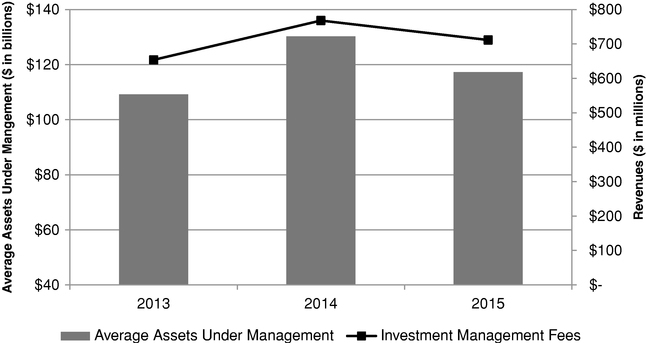
The following table summarizes investment management fee revenues, related average assets under management, fee waivers and investment management fee rates for the years ending December 31, 2015, 2014 and 2013.
| | For the Year Ended December 31, | Variance | ||||||||||||||
|---|---|---|---|---|---|---|---|---|---|---|---|---|---|---|---|---|
| | 2015 | 2014 | 2013 | 2015 vs. 2014 | 2014 vs. 2013 | |||||||||||
| | (in thousands, except for management fee rate, average assets and percentage data) | |||||||||||||||
Retail investment management fees | $ | 652,494 | 709,179 | 602,120 | –8% | 18% | ||||||||||
Retail average assets (in millions) | 101,010 | 112,834 | 96,081 | –10% | 17% | |||||||||||
Retail management fee rate | 0.6460% | 0.6285% | 0.6267% | |||||||||||||
Money market fee waivers | 7,239 | 7,844 | 6,486 | –8% | 21% | |||||||||||
Other fee waivers | 3,646 | 3,958 | 3,660 | –8% | 8% | |||||||||||
| | | | | | | | | | | | | | | | | |
Total fee waivers | $ | 10,885 | 11,802 | 10,146 | –8% | 16% | ||||||||||
Institutional investment management fees | $ | 57,068 | $ | 58,923 | $ | 48,322 | –3% | 22% | ||||||||
Institutional average assets (in millions) | 16,574 | 17,307 | 13,101 | –4% | 32% | |||||||||||
Institutional management fee rate | 0.3443% | 0.3405% | 0.3688% | |||||||||||||
Revenues from investment management services provided to our retail mutual funds, which are distributed through the Wholesale, Advisors and Institutional channels, were $506.1decreased $56.7 million in 2012 and increased $16.1 million,2015, or 3%8%, compared to 2011, while the related retail average assets increased 5%.2014. Investment management fee revenues increased lessdecreased at a lesser rate than the related retail average assets in 2015 due to a slight increase in the effect of recordingaverage management fee waivers as an offset to investment management fees beginning in the third quarter of 2010. Of the total management fee waivers recorded in 2012 of $8.7 million, $5.5 million related to money market accounts.rate. Revenues from investment management services provided to our retail mutual funds increased $107.1 million in 2014, or 18%, compared to 2013. Investment management fee revenues increased at a greater rate than the related retail average assets in 2014 due to a slight increase in the average management fee rate. A lower asset base in the Ivy Asset Strategy fund and Ivy High Income fund have resulted in increased management fee rates for both comparative periods, due to both funds having management fee rates less than our average management fee rate. Management fee waivers are recorded as an offset to investment management fees up to the amount of fees earned. Retail sales were $17.3 billion, $24.1 billion and $26.6 billion in 2015, 2014 and 2013, respectively.
Institutional and separate account revenues in 2015 decreased $1.9 million, or 3%, compared to 2014 due to a 4% decrease in average assets under management, while revenues in 2014 increased $10.6 million, or 22%, compared to 2013 due to a 32% increase in average assets under management. For the comparative period 2014 to 2013, account revenues increased significantly less than the related average assets under management due to a decline in the average management fee rate driven by a mix-shift of assets into investment styles and account types with lower management fee rates.
| | Annualized long-term redemption rates (excludes money market redemptions) for the year ended December 31, | ||||||||
|---|---|---|---|---|---|---|---|---|---|
| | 2015 | 2014 | 2013 | ||||||
Wholesale channel | 43.0% | 34.8% | 25.2% | ||||||
Advisors channel | 9.1% | 8.3% | 8.9% | ||||||
Institutional channel | 30.7% | 16.9% | 20.0% | ||||||
Total | 28.3% | 23.4% | 18.8% | ||||||
funds were $490.0 million The increased long-term redemption rate in 2011 and increased $65.9 million, or 16%, compared to 2010, while the related retail average assets increased 17%. Retail sales were $19.4 billion, $20.4 billion and $18.1 billion in 2012, 2011 and 2010, respectively.
Institutional and separate account revenues were $43.2 million, $40.6 million and $33.4 million in 2012, 2011 and 2010, respectively. The increase in revenues in 2012 compared to 2011 was primarily attributable to a 10% increase in average assets while the increase in revenues in 2011 compared to 2010 was a result of a 27% increase in average assets.
Inboth comparative periods for the Wholesale channel long-term redemption rates were 30.2% in 2012, compared to 29.5% in 2011 and 29.3% in 2010. Long-term redemption rates (which exclude money market fund redemptions)was primarily driven by redemptions in the AdvisorsAsset Strategy and High Income funds. Redemptions in the Asset Strategy and High Income funds comprised over 75% of Wholesale channel were 9.9%redemptions in 2012 compared to 10.0%2015 and 9.3%2014. Prolonged redemptions in 2011 and 2010, respectively.the Wholesale channel could negatively affect revenues in future periods. We expect the Advisors channel long-term redemption rate to remain lower than that of the Wholesale channelindustry average due to the personal and customized nature in which our financial advisors provide service to our clients.
clients by focusing on meeting their long-term financial objectives. The increased long-term redemption rate for our Institutional channel was 24.2% in 20122015 compared to 23.8%2014 was primarily driven by an institutional account moving from an active core strategy to a smart beta strategy. Also, a large Asset Strategy account with approximately $2.2 billion in 2011 and 35.1% in 2010. Subadvisory and defined contribution pension business comprise more than 65%assets under management that we subadvise, has notified us of its intent to recommend to its board a redemption of most of the Institutional channel'saccount's assets asin the middle of December 31, 2012 and unlike defined benefit pension accounts,2016. Additionally, an $800.0 million institutional account in our municipal high income strategy is expected to close in 2016. Our overall redemption rate of 28.3% in 2015 is higher than the active daily flows in or outindustry average of these accounts can result in an increase in contributions and withdrawals and impact24.7% based on data provided by the channel's redemption rate.ICI.
Underwriting and Distribution
We earn underwriting and distribution fee revenues primarily by distributing the Funds pursuant to an underwriting agreement with each Fund (except the Ivy Funds VIP as explained below) and, to a lesser extent, by distributing mutual funds offered by other unaffiliated companies. Pursuant to each agreement, we offer and sell the Funds' shares on a continuous basis (open-end funds) and pay certain costs associated with underwriting and distributing the Funds, including the costs of developing and producing sales literature and printing of prospectuses, which may be either partially or fully reimbursed by the Funds. The Funds are sold in various classes that are structured in ways that conform to industry standards (i.e., "front-end load," "back-end load," "level-load" and institutional).
When a client purchases Class A shares (front-end load), the client pays an initial sales charge of up to 5.75% of the amount invested. The sales charge for Class A shares typically declines as the investment amount increases. In addition, investors may combine their purchases of all fund shares to qualify for a reduced sales charge. Class A shares purchased at net asset value are assessed a 1% contingent deferred sales charge ("CDSC") if the shares are redeemed within 12 months of purchase. When a client invests in an asset allocation product, Class A shares are purchased at net asset value. We do not charge an initial sales charge, but investors are assessed a CDSC upon early redemption of shares, up to 3% of the amount originally invested and declining to zero for investments held more than three years. When a client purchases Class B shares (back-end load), we do not charge an initial sales charge, but we do charge a CDSC upon early redemption of shares, up to 5% of the lesser of the current market net asset value or the purchase cost of the redeemed shares in the first year and declining to zero for shares held for more than six years. Class B shares convert to Class A shares after seven years. When a client purchases Class C shares (level-load), we do not charge an initial sales charge, but we do charge investors who redeem their Class C shares in the first year a CDSC of 1% of the current market net asset value or the purchase cost of the shares redeemed, whichever is less.
Under a Rule 12b-1 service plan, the Funds may charge a maximum fee of 0.25% of the average daily net assets under management for expenses paid to broker/dealers and other sales professionals in connection with providing ongoing services to the Funds' shareholders and/or maintaining the Funds' shareholder accounts, with the exception of the Funds' Class R shares, for which the maximum fee is 0.50%. The Funds' Class B and Class C shares may charge a maximum of 0.75% of the average daily net
assets under management under a Rule 12b-1 distribution plan to broker/dealers and other sales professionals for their services in connection with distributing shares of that class. The Rule 12b-1 plans are subject to annual approval by the Funds' board of trustees, including a majority of the disinterested members, by votes cast in person at a meeting called for the purpose of voting on such approval. All Funds may terminate the service plan at any time with approval of fund trustees or portfolio shareholders (a majority of either) without penalty.
We offer fee-based asset allocation investment advisory products that utilize our Funds. These products offer clients a selection of traditional asset allocation models, as well as features such as systematic rebalancing and client and advisor participation in determining asset allocation across asset classes. We earn asset-based fees on our asset allocation products. In connection with Project E, we intend to convert the load-waived Class A shares currently offered in our investment advisory products.programs to institutional share classes, which do not charge a Rule 12b-1 fee. As a result, we will no longer collect Rule 12b-1 asset-based service and distribution fee revenue on these assets under management, which will reduce our pre-tax operating income by an estimated $8.0 million in 2016, net of underwriting and distribution expenses.
We distribute variable products offering the Ivy Funds VIP as investment vehicles pursuant to general agency arrangements with our business partners and receive commissions, marketing allowances and other compensation as stipulated by such agreements. In connection with these arrangements, the Ivy Funds VIP are offered and sold on a continuous basis.
In addition to distributing variable products, we distribute a number of other insurance products through our insurance agency subsidiaries,subsidiary, including individual term life, group term life, whole life, accident and health, long-term care, Medicare supplement and disability insurance. We receive commissions and compensation from various underwriters for distributing these products. We are not an underwriter for any insurance policies.
Underwriting and Distribution Fee Revenues and Expenses
The following tables illustrate our underwriting and distribution fee revenues and expenses segregated by distribution channel for the years ended December 31, 2012, 20112015, 2014 and 2010:2013:
| | Total | | | ||||||||||||
|---|---|---|---|---|---|---|---|---|---|---|---|---|---|---|---|
| | 2012 | 2011 | 2010 | 2012 vs. 2011 | 2011 vs. 2010 | ||||||||||
| | (in thousands, except percentage data) | ||||||||||||||
Revenue | $ | 496,465 | 469,484 | 410,380 | 6% | 14% | |||||||||
Expenses: | |||||||||||||||
Direct | 444,854 | 428,447 | 372,537 | 4% | 15% | ||||||||||
Indirect | 145,127 | 131,772 | 120,919 | 10% | 9% | ||||||||||
Total Expenses | 589,981 | 560,219 | 493,456 | 5% | 14% | ||||||||||
Net Underwriting & Distribution | $ | (93,516) | (90,735) | (83,076) | -3% | -9% | |||||||||
| | Total | | | |||||||||||||
|---|---|---|---|---|---|---|---|---|---|---|---|---|---|---|---|---|
| | 2015 vs. 2014 | 2014 vs. 2013 | ||||||||||||||
| | 2015 | 2014 | 2013 | |||||||||||||
| | (in thousands, except percentage data) | |||||||||||||||
Revenues | $ | 663,998 | 678,678 | 582,819 | –2% | 16% | ||||||||||
Expenses—Direct | (589,810 | ) | (615,954 | ) | (524,071 | ) | –4% | 18% | ||||||||
Expenses—Indirect | (179,971 | ) | (167,373 | ) | (152,642 | ) | 8% | 10% | ||||||||
| | | | | | | | | | | | | | | | | |
Net Distribution (Costs)/Excess | $ | (105,783 | ) | (104,649 | ) | (93,894 | ) | –1% | –11% | |||||||
| | | | | | | | | | | | | | | | | |
| | | | | | | | | | | | | | | | | |
| | | | | | | | | | | | | | | | | |
| | Wholesale Channel | | | ||||||||||||
|---|---|---|---|---|---|---|---|---|---|---|---|---|---|---|---|
| | 2012 | 2011 | 2010 | 2012 vs. 2011 | 2011 vs. 2010 | ||||||||||
Revenue | $ | 178,700 | 179,407 | 158,273 | 0% | 13% | |||||||||
Expenses: | |||||||||||||||
Direct | 224,744 | 224,089 | 195,379 | 0% | 15% | ||||||||||
Indirect | 39,929 | 34,358 | 33,188 | 16% | 4% | ||||||||||
Total Expenses | 264,673 | 258,447 | 228,567 | 2% | 13% | ||||||||||
Net Underwriting & Distribution | $ | (85,973) | (79,040) | (70,294) | -9% | -12% | |||||||||
| | Wholesale Channel | | | |||||||||||||
|---|---|---|---|---|---|---|---|---|---|---|---|---|---|---|---|---|
| | 2015 vs. 2014 | 2014 vs. 2013 | ||||||||||||||
| | 2015 | 2014 | 2013 | |||||||||||||
Revenues | $ | 194,041 | 234,939 | 207,419 | –17% | 13% | ||||||||||
Expenses—Direct | (254,778 | ) | (302,459 | ) | (268,047 | ) | –16% | 13% | ||||||||
Expenses—Indirect | (55,944 | ) | (51,675 | ) | (43,923 | ) | 8% | 18% | ||||||||
| | | | | | | | | | | | | | | | | |
Net Distribution (Costs)/Excess | $ | (116,681 | ) | (119,195 | ) | (104,551 | ) | 2% | –14% | |||||||
| | | | | | | | | | | | | | | | | |
| | | | | | | | | | | | | | | | | |
| | | | | | | | | | | | | | | | | |
| | Advisors Channel | | | |||||||||||||
|---|---|---|---|---|---|---|---|---|---|---|---|---|---|---|---|---|
| | 2015 | 2014 | 2013 | 2015 vs. 2014 | 2014 vs. 2013 | |||||||||||
Revenues | $ | 469,957 | 443,739 | 375,400 | 6% | 18% | ||||||||||
Expenses—Direct | (335,032 | ) | (313,495 | ) | (256,024 | ) | 7% | 22% | ||||||||
Expenses—Indirect | (124,027 | ) | (115,698 | ) | (108,719 | ) | 7% | 6% | ||||||||
| | | | | | | | | | | | | | | | | |
Net Distribution (Costs)/Excess | $ | 10,898 | 14,546 | 10,657 | –25% | 36% | ||||||||||
| | | | | | | | | | | | | | | | | |
| | | | | | | | | | | | | | | | | |
| | | | | | | | | | | | | | | | | |
The following tables summarize the significant components of underwriting and distribution fee revenues segregated by distribution channel for the years ended December 31, 2015, 2014 and 2013:
| | Total | ||||||||
|---|---|---|---|---|---|---|---|---|---|
| | 2015 | 2014 | 2013 | ||||||
| | (in thousands) | ||||||||
Underwriting and distribution fee revenues: | |||||||||
Rule 12b-1 service and distribution fees | $ | 309,279 | 346,304 | 304,659 | |||||
Fee-based asset allocation product revenues | 224,918 | 202,178 | 155,501 | ||||||
Sales commissions on front-end load mutual fund and variable annuity sales | 78,923 | 78,484 | 75,008 | ||||||
Sales commissions on other products | 24,096 | 24,024 | 22,069 | ||||||
Other revenues | 26,782 | 27,688 | 25,582 | ||||||
| | | | | | | | | | |
Total | $ | 663,998 | 678,678 | 582,819 | |||||
| | | | | | | | | | |
| | | | | | | | | | |
| | | | | | | | | | |
| | Advisors Channel | | | ||||||||||||
|---|---|---|---|---|---|---|---|---|---|---|---|---|---|---|---|
| | 2012 | 2011 | 2010 | 2012 vs. 2011 | 2011 vs. 2010 | ||||||||||
Revenue | $ | 317,765 | 290,077 | 252,107 | 10% | 15% | |||||||||
Expenses: | |||||||||||||||
Direct | 220,110 | 204,358 | 177,158 | 8% | 15% | ||||||||||
Indirect | 105,198 | 97,414 | 87,731 | 8% | 11% | ||||||||||
Total Expenses | 325,308 | 301,772 | 264,889 | 8% | 14% | ||||||||||
Net Underwriting & Distribution | $ | (7,543) | (11,695) | (12,782) | 36% | 9% | |||||||||
| | Wholesale Channel | ||||||||
|---|---|---|---|---|---|---|---|---|---|
| | 2015 | 2014 | 2013 | ||||||
| | (in thousands) | ||||||||
Underwriting and distribution fee revenues: | |||||||||
Rule 12b-1 service and distribution fees | $ | 186,994 | 224,669 | 198,283 | |||||
Sales commissions on front-end load mutual fund sales | 3,091 | 5,843 | 5,506 | ||||||
Other revenues | 3,956 | 4,427 | 3,630 | ||||||
| | | | | | | | | | |
Total | $ | 194,041 | 234,939 | 207,419 | |||||
| | | | | | | | | | |
| | | | | | | | | | |
| | | | | | | | | | |
| | Advisors Channel | ||||||||
|---|---|---|---|---|---|---|---|---|---|
| | 2015 | 2014 | 2013 | ||||||
| | (in thousands) | ||||||||
Underwriting and distribution fee revenues: | |||||||||
Rule 12b-1 service and distribution fees | $ | 122,285 | 121,635 | 106,376 | |||||
Fee-based asset allocation product revenues | 224,918 | 202,178 | 155,501 | ||||||
Sales commissions on front-end load mutual fund and variable annuity sales | 75,832 | 72,641 | 69,502 | ||||||
Sales commissions on other products | 24,096 | 24,024 | 22,069 | ||||||
Other revenues | 22,826 | 23,261 | 21,952 | ||||||
| | | | | | | | | | |
Total | $ | 469,957 | 443,739 | 375,400 | |||||
| | | | | | | | | | |
| | | | | | | | | | |
| | | | | | | | | | |
A significant portion of underwriting and distribution revenues are received from Rule 12b-1 asset-based distributionservice and servicedistribution fees earned on both load, and load-waived and deferred-load products sold by our financial advisors and third party intermediaries. Underwriting and distribution revenues also include asset-based fees earned on our asset allocation products and commissions, earned on the sale of other insurance products. A portion of underwriting and distribution fee revenues in our Advisors channel are derived from sales commissions charged on front-end load products sold by our financial advisors, including mutual fund Class A shares (those sponsored by the Company and those underwritten by other non-proprietary mutual fund companies), variable annuities, sales of other insurance products, and financial planning fees. A significant amount of Wholesale channel mutual fund sales are load-waived.
We divide the costs of underwriting and distribution into two components—direct costs and indirect costs. Direct selling costs fluctuate with sales volume, such as advisor commissions and commission overridesmanagement commissions paid to field management, advisor incentive compensation, commissions paid to third parties and to our own wholesalers, and related overridesmanagement commissions in our Wholesale channel. Direct selling costs also fluctuate with assets under management, such as Rule 12b-1 service and distribution fees paid to the samethird parties. Indirect selling costs are fixed costs that do not necessarily fluctuate with sales levels. Indirect costs include expenses incurred by our home office and field offices such as wholesaler salaries, marketing costs, promotion and distribution of our products through the Wholesale and Advisors channels; support and management of our financial advisors such as field office overhead, sales programs and technology infrastructure; and costs of managing and supporting our wholesale efforts through technology infrastructure and personnel. While the Institutional channel does have marketing expenses, those expenses are accounted for in compensation and related costs and general and administrative expense instead of underwriting and distribution because of the channel's integration with our investment management division, its relatively small size and the fact that there are no Rule 12b-1 service and distribution fees, loads, CDSCs,contingent deferred sales charges ("CDSCs"), or any other charges to separate account clients except investment management fees.
We recover certain of our underwriting and distribution costs through Rule 12b-1 service and distribution fees, which are paid by the Funds. All Rule 12b-1 service and distribution fee revenue received from the Funds is recorded on a gross basis.
Underwriting and distribution revenues earned in 2012 increased2015 decreased by $27.0$14.7 million, or 6%2%, compared to 2011. During 2012,2014. Rule 12b-1 asset based service and distribution fees decreased $37.0 million, or 11%, year over year, driven by a decrease in average mutual fund assets under management for which we earn Rule 12b-1 revenues. Approximately 75% of Rule 12b-1 revenues earned are a pass-through to direct underwriting and distribution expenses. Revenues from fee-based asset allocation products continued to be a meaningful contributor to revenues, increasing to 23%48% of Advisors channel underwriting and distribution revenues in 20122015 compared to 18%46% in 2011. Assets2014. Fee-based asset allocation assets grew from $6.0$17.3 billion at December 31, 2014 to $8.2$17.6 billion year over yearat December 31, 2015, generating an increase of fee-based asset allocation revenue of $22.7 million, or 11%, as advisors increasingly utilize fee-based programs for their clients.
Underwriting and distribution revenues generated from these assetsearned in 2014 increased $33.1 million. Technology fees collected from our advisors increased revenues $3.0 million. Priorby $95.9 million, or 16%, compared to the fourth quarter of 2011, these fees were netted in operating expenses.2013. Increased Rule 12b-1 asset-based service and distribution fees of $2.2$41.6 million, or 14%, resulted from the increase in average mutual fund assets under management. Offsetting these increases, revenues from variable annuity products
sold in the Advisors channel decreased by $10.5 million. Insurance-related revenues and revenues from financial plans each decreased $1.1 million compared to 2011.
Underwriting and distribution revenues earned in 2011 increased by $59.1 million, or 14%, compared to 2010.management for which we earn Rule 12b-1 revenues. Revenues from fee-based asset allocation products increased $33.3to 46% of Advisors channel underwriting and distribution revenues in 2014 compared to 41% in 2013. Fee-based asset allocation assets grew from $14.4 billion at December 31, 2013 to $17.3 billion at December 31, 2014, generating an increase of fee-based asset allocation revenue of $46.7 million, or 30%.
Underwriting and distribution expenses in 2015 decreased by $13.5 million, or 2%, compared to 2014. Direct expenses in the Wholesale channel decreased $47.7 million compared to 20102014 as a result of a decrease in average wholesale assets grew from $4.5 billion to $6.0 billionunder management and lower sales volume year over year.year, which resulted in lower dealer compensation, wholesaler commissions and Rule 12b-1 asset-based service and distribution fees increased $28.5 million comparedexpenses paid to 2010 as a result of an increase in average mutual fund assets under management. Revenues from front-load product sales soldthird party distributors. Direct expenses in the Advisors channel decreased by $4.5 million; however, this overallgrew in relation to revenue, offsetting the decrease included an increase in variable annuity revenues of $7.5 million. Insurance-related revenues decreased $1.1the Wholesale Channel. Indirect expenses across both channels increased $12.6 million, or 8%, compared to 2010.2014, primarily due to increased employee compensation and benefits, consulting expenses, rent expense and advertising expenses, partially offset by lower computer services and software expenses.
Underwriting and distribution expenses in 20122014 increased by $29.8$106.6 million, or 5%16%, compared to 2011.2013. Direct expenses in the Wholesale channel increased $0.7$34.4 million compared to 20112013 as a result of an increase in average wholesale assets under management, partially offset by lower sales volume year over year. We incurred higher dealer compensation paid to third party distributors and increased Rule 12b-1 asset-based service and distribution expenses paid to third party distributors, partially offset by lower wholesaler commissions.dealer compensation. Direct expenses in the Advisors channel increased $15.8 million, or 8%grew faster than revenue due to increased commissions related toadvisor payouts, as a result of a change in the sale of fee-based asset allocation products of $25.1 million, partially offset by lower commissions on variable annuity products of $6.1 million. Expenses related to financial plans and insurance products decreased $1.0 million and $0.5 million, respectively.Advisors compensation plan. Indirect expenses across both channels increased a total of $13.4$14.7 million, or 10%, compared to 2011. The indirect expenses increase of $5.6 million in the Wholesale channel was2013, primarily due to increased marketing costscomputer services and software expenses, employee compensation and benefits expenses. The increase in indirect expenses in the Advisors channel of $7.8 million was due to costs associated with our electronic books and records conversion project and increased employee compensation and benefitsmarketing expenses.
Underwriting and distribution expenses in 2011 increased by $66.8 million, or 14%, compared to 2010. A significant part of this increase was attributable to higher direct expenses in the Wholesale channel of $28.7 million as a result of an increase in average wholesale assets under management year over year. We incurred higher dealer compensation paid to third party distributors, increased Rule 12b-1 asset-based service and distribution expenses and higher wholesaler commissions, partially offset by lower amortization expense of deferred sales commissions. Direct expenses in the Advisors channel increased $27.2 million, or 15%, compared to 2010 due to higher fee-based asset allocation expenses of $23.8 million, higher Rule 12b-1 asset-based service and distribution commissions of $6.3 million and higher amortization expense of deferred sales commissions of $0.9 million, partially offset by lower point of sale commissions on front-load product sales of $2.6 million and insurance expenses of $0.6 million. The indirect expenses increase of $1.2 million in the Wholesale channel was mostly due to higher employee compensation and benefits expense. The increase in indirect expenses in the Advisors channel of $9.7 million was due to increased employee compensation and benefits expenses, higher convention costs, increased field office expenses and higher expenses incurred beginning mid-year 2011 related to our electronic books and records conversion project.
Shareholder Service Fees Revenue
Shareholder service fee revenue primarily includes transfer agency fees, custodian fees from retirement plan accounts, and portfolio accounting and administration fees. Transfer agency fees and portfolio accounting and administration fees are asset-based revenues or account-based revenues, while custodian fees from retirement plan accounts are based on the number of client accounts.
During 2012, The share conversion from load-waived Class A shares to institutional share classes, which do not charge a Rule 12b-1 fee, offered in our investment advisory programs will result in lower shareholder service fee revenue in 2016. Certain transfer agency fees revenue increased $5.7 million, or 5%, over 2011, due to higher asset-based fees of $4.5 million year over year in certainfor institutional share classes are asset-based and $1.2 million attributablemaintain lower revenue rates compared to account-based revenues, duetransfer agency fees. Shareholder service fee revenue will decline following the share class conversion in 2016 and will result in lower revenue rates compared to a 1% increaseaccount-based transfer agency fees. Based on the composition of accounts and relative balances as of December 31, 2015, shareholder service fee revenue is expected to decline approximately $8.0 million in the average number of client accounts.2016.
During 2011,2015, shareholder service fees revenue decreased $7.9 million, or 5%, over 2014. Of the total decrease, asset-based fees accounted for $8.1 million, partially offset by an increase in account-based fees. A majority of the decrease in asset-based fees was driven by fees for the I, Y, R and R6 share classes which decreased $8.4 million, or 18%, when compared to 2014. Assets in the I, Y, R and R6 share classes declined from an average of $31.0 billion at December 31, 2014 to an average of $25.6 billion at December 31, 2015, representing a decrease of 17%.
During 2014, shareholder service fees revenue increased $12.1$13.9 million, or 11%10%, over 2010, due to higher2013. Of the total increase, asset-based fees accounted for $11.5 million and account-based fees increased $2.7 million, partially offset by a decrease in retirement plan fees. A majority of $8.6 million year over yearthe increase in certainasset-based fees was driven by fees for the I, Y and R share classes, which increased $10.8 million, or 30%, when compared to 2013. Assets in the I, Y and $3.5R share classes grew from an average of $23.8 billion at December 31, 2013 to an average of $31.0 billion at December 31, 2014, representing an increase of 30%. The account-based fees increase of $2.7 million attributable to account-based revenues,was due to a 2% increase in the average number of client accounts.accounts compared to the same period.
Total Operating Expenses
Operating expenses increased $35.0decreased $12.6 million, or 4%1%, in 20122015 compared to 20112014 primarily due to increaseddecreased underwriting and distribution expenses, andas well as a $7.9 million intangible asset impairment charge recorded in 2014, partially offset by increased compensation and related costs, partially offset by decreased subadvisory fees.costs. Underwriting and distribution expenses are discussed above.
Operating expenses increased $102.5$127.6 million, or 14%13%, in 20112014 compared to 20102013 primarily due to increased underwriting and distribution expenses, compensation and related costs, andincreased general and administrative expenses.costs and an intangible asset impairment charge, partially offset by decreased subadvisory fees.
| | For the Year Ended December 31, | Variance | For the Year Ended December 31, | Variance | ||||||||||||||||||||||||||
|---|---|---|---|---|---|---|---|---|---|---|---|---|---|---|---|---|---|---|---|---|---|---|---|---|---|---|---|---|---|---|
| | 2012 | 2011 | 2010 | 2012 vs. 2011 | 2011 vs. 2010 | 2015 | 2014 | 2013 | 2015 vs. 2014 | 2014 vs. 2013 | ||||||||||||||||||||
| | (in thousands, except percentage data) | (in thousands, except percentage data) | ||||||||||||||||||||||||||||
Underwriting and distribution | $ | 589,981 | 560,219 | 493,456 | 5% | 14% | $ | 769,781 | 783,327 | 676,713 | –2% | 16% | ||||||||||||||||||
Compensation and related costs | 171,775 | 157,332 | 138,207 | 9% | 14% | 200,752 | 194,410 | 197,597 | 3% | –2% | ||||||||||||||||||||
General and administrative | 75,332 | 74,110 | 60,785 | 2% | 22% | 105,066 | 104,637 | 86,419 | 0% | 21% | ||||||||||||||||||||
Subadvisory fees | 21,009 | 29,885 | 27,823 | -30% | 7% | 9,134 | 8,436 | 12,220 | 8% | –31% | ||||||||||||||||||||
Depreciation | 13,211 | 14,764 | 13,525 | -11% | 9% | 16,046 | 14,634 | 12,834 | 10% | 14% | ||||||||||||||||||||
Intangible asset impairment | — | 7,900 | — | NM | NM | |||||||||||||||||||||||||
| | | | | | | | | | | | | | | |||||||||||||||||
Total operating expenses | $ | 871,308 | 836,310 | 733,796 | 4% | 14% | $ | 1,100,779 | 1,113,344 | 985,783 | –1% | 13% | ||||||||||||||||||
| | | | | | | | | | | | | | | |||||||||||||||||
| | | | | | | | | | | | ||||||||||||||||||||
| | | | | | | | | | | | | | | |||||||||||||||||
Compensation and Related Costs
| | For the Year Ended December 31, | Variance | |||||||||||||
|---|---|---|---|---|---|---|---|---|---|---|---|---|---|---|---|
| | 2015 | 2014 | 2013 | 2015 vs. 2014 | 2014 vs. 2013 | ||||||||||
| | (in thousands, except percentage data) | ||||||||||||||
Compensation and related costs | $ | 200,752 | 194,410 | 197,597 | 3% | –2% | |||||||||
As a percent of revenue | 13% | 12% | 14% | 1% | –2% | ||||||||||
Compensation and related costs in 20122015 increased $14.4$6.3 million, or 9%3%, compared to 2011. Base2014. An increase in base salaries and payroll taxes contributed $6.1of $5.3 million to the increase, due to an increase in average headcount and annual merit raises, and an increase in pension expense of 6%$3.3 million were the primary drivers. Expense also increased $1.5 million related to incentive compensation, increased $1.4 million related to our deferred compensation program for portfolio
managers, and increased $1.3 million related to miscellaneous compensation. Partially offsetting these increases was a decrease in share-based compensation of $6.6 million due to forfeitures and lower non-employee expense.
Compensation and related costs in 2014 decreased $3.2 million, or 2%, compared to 2013. A decrease in incentive compensation of $6.1 million and a decrease in pension expense of $3.6 million were the primary drivers. Expense also decreased $2.3 million related to our deferred compensation program for portfolio managers due to market depreciation. Partially offsetting these decreases were an increase in base salaries, payroll taxes and savings plan costs of $5.7 million due to an increase in headcount and annual merit increases during 2012. Share-based2014, and an increase in share-based compensation increased $3.4of $1.0 million compared to 2011 primarily due to higher amortization expense associated with our April 2012, December 2011 and April 2011 grants of nonvested stockrestricted stock. In addition, higher compensation costs related to Institutional channel marketing contributed $0.8 million compared to grants that became fully vested in 2012. Pension costs increased $3.2 million year over year, incentive compensation expense increased $0.9 million2013 and group insurance costsexpense increased $0.6$0.5 million based ondue to unfavorable claims experience.
Compensation and related costs in 2011 increased $19.1 million, or 14%, compared to 2010. Base salaries and payroll taxes contributed $6.8 million to the increase, due to an increase in average headcount of 12% and annual merit increases during 2011. Share-based compensation increased $6.3 million compared to 2010 primarily due to higher amortization expense associated with our April 2011, December 2010 and April 2010 grants of nonvested stock compared to grants that became fully vested in 2011. We had a decrease in capitalized software development activities of $2.7 million, higher commission expense on managed and institutional accounts of $1.5 million and experienced higher incentive compensation expense of $0.8 million and group insurance costs of $0.3 million.
General and Administrative Expenses
| | For the Year Ended December 31, | Variance | |||||||||||||
|---|---|---|---|---|---|---|---|---|---|---|---|---|---|---|---|
| | 2015 | 2014 | 2013 | 2015 vs. 2014 | 2014 vs. 2013 | ||||||||||
| | (in thousands, except percentage data) | ||||||||||||||
General and administrative expenses | $ | 105,066 | 104,637 | 86,419 | 0% | 21% | |||||||||
As a percent of revenue | 7% | 7% | 6% | 0% | 1% | ||||||||||
General and administrative expenses are operating costs other than those related to compensation and to distribution efforts, including, but not limited to, computer services and software costs, telecommunications, facilities costs of our home offices, costs of professional services including legal and accounting, and insurance.
General and administrative expenses increased $1.2$0.4 million for the year ended December 31, 20122015 compared to 2011. During 2012, we recorded a charge2014. Technology consulting expenses and computer services and software costs increased $8.7 million related to the implementation of $5.0 million to reflect the impairment of certain capitalized software development costs. Our ongoing assessment and changes to our enterprise information technology infrastructure initiatives. Offsetting these increases were lower consulting costs of $3.1 million, lower temporary office staff expense of $2.6 million, lower shareholder adjustments of $1.2 million and software resultedlower dealer service costs of $1.2 million. A majority of dealer service costs represent pass-through account servicing costs to third party dealers and are based on lower asset levels in the decision to discontinue the usage of certain software. Also included in 2012 was an adjustment to lower generalshare classes.
General and administrative expenses by $3.5increased $18.2 million for the year ended December 31, 2014 compared to reflect lower estimated2013. Included in 2013 were one-time structuring, offering and organizational costs for the launch of distributing an SEC market timing settlement dating back to 2006, and a reductionthe Ivy High Income Opportunities fund in the estimated legal costs related to an ongoing class action suit. Included in 2011 is a $1.8 million charge related to the write-offamount of software capitalization costs due to the discontinuation of use of certain software licenses.$6.7 million. Excluding these charges in 2013, general and administrative expenses increased $1.5$24.9 million, due primarily to higher consulting costs of $8.7 million, of which $5.7 million is related to technology consulting, increased dealer service costs incurred for third party servicingbased on higher asset levels in certain share classes of our shareholder accounts of $3.1$5.4 million, higher computer services and software costs and increased costs for temporary office staff related to our electronic books and records conversion project. Costs decreased related to our national branding campaign launched in 2011 year over year. We expect computer services and software costs to increase in the coming year based on our current project plan.
General and administrative expenses increased $13.3 million in 2011 compared to 2010. Included in 2011 is a $1.8 million charge related to the write-off of software capitalization costs due to the discontinuation of use of certain software licenses. The remaining variance is due to increased costs incurred for third party servicing of our shareholder accounts of $4.1 million, costs incurred for our national branding campaign launched in the first quarter of 2011, higher computer services and software costs of $2.7$4.0 million and increased legal, expenses of $2.4 million, partially offset by lowertemporary office staff and fund expenses of $0.7 million. Fee waivers were recorded as part of fund expenses prior to the third quarter of 2010. Fee waivers are now netted against management fee revenues.expense costs.
Subadvisory Fees
Subadvisory fees represent fees paid to other asset managers for providing advisory services for certain mutual fund portfolios. These expenses reduce our operating margin since we pay out approximately half of our management fee revenuerevenues received from subadvised products. Gross management fee revenues for products subadvised by others were $41.7$16.3 million for the year ended December 31, 20122015 compared to $59.3$15.9 million and $55.3$24.0 million for 20112014 and 2010,2013, respectively, due to a 31%14% increase in average assets from 2014 to 2015 and a 24% decrease in average assets from 20112013 to 2012 and2014.
Gross management fee revenues for subadvised products in 2015 increased at a 8% increaselesser rate than the related average net assets under management due to a decrease in the average management fee rate. The decrease in average net assets from 20102013 to 2011.2014 is a result of internalizing the management of the Global Natural Resources funds after the portfolio manager's retirement from Mackenzie Financial Corporation ("MFC"), the subadvisor, during the third quarter of 2013. Subadvisory expenses in 2015 increased in relation to gross management fee revenues due to termination fees related to internalizing management of the Micro Cap Growth funds as of June 30, 2015. Subadvisory expenses followed the same pattern for the past three years.
Subadvised assets under management at December 31, 2012 were $4.3 billion compared to the annual average of $5.0 billion for 2012. Since subadvisory expenses are a function of sales, redemptions and market action for subadvised assets, assuming a flat market in 2013, the lower asset base will likely result in a decrease to bothas gross management fee revenues for 2014 and 2013.
Intangible Asset Impairment
During the third quarter of 2014, we recorded an intangible asset impairment charge of $7.9 million related to our subadvisory expensesagreement to manage certain mutual fund products for MFC recorded in connection with our purchase of Mackenzie Investment Management, Inc. in 2002. The impairment charge was a result of a decline in assets under management attributable to a realignment of MFC's fund offerings and additional asset reductions. It is possible that the coming year.assets we manage for MFC may decrease in the future, which would require us to assess the need for an additional write-down of the intangible asset associated with our subadvisory agreement with MFC.
At December 31, 2015, the remaining balance of our subadvisory intangible asset was $8.4 million. The deferred tax liability established as a part of purchase accounting related to this intangible asset was $3.1 million as of December 31, 2015.
Other Income and Expenses
Investment and Other Income
Investment and other income increased $7.7decreased $22.0 million in 20122015 compared to 2011.2014. The current year includedmajority of the decrease is related to mark-to-market activity on sponsored funds (Advisors Funds, Ivy Funds and IGI Funds) held as equity method investments and sponsored funds held as trading in our investment portfolio. We recorded mark-to-market losses of $15.4 million in 2015, compared to mark-to-market gains of $2.4 million in 2014. Realized gains on mutual fund holdingsthe sale of available for sale sponsored funds decreased $2.2 million in our trading portfolio of $4.8 million2015 compared to losses2014. Sponsored fund dividend income and capital gain distributions decreased $1.0 million in 2011 of $1.1 million. We recorded2015, compared to 2014.
Investment and other income decreased $3.1 million in 2014 compared to 2013, primarily due to a $9.3 million decrease in realized gains on the sale of available for sale mutualsponsored funds of $3.2 million during 2012 compared to $2.2 million in 2011. Interest and gains related to our corporate bond portfolio increased $0.8 million compared to the prior year. In 2012 and 2011, we recorded write-downs of our investment in limited partnerships of $2.0 million anda $1.5 million respectively.
Investment and other income decreased $6.5 milliondecrease in 2011 compared to 2010. The most significant contributor to this decrease related to mark-to-market lossesgains on mutualsponsored fund holdings in our trading portfolio of $1.1portfolio. A $3.0 million increase in 2011 compared to gains in 2010 of $5.1 million. We recorded realized gains on the sale of available for sale mutual funds of $2.2 million during 2011 compared to $2.9 million in 2010. Highersponsored fund dividend income on available for sale mutual fund holdings of $1.0 million in 2011 compared to 2010and capital gain distributions partially offset these declines. Wethe decrease. In 2013, we recorded write-downs oflosses related to our investment in a limited partnership of $1.5 million in both years.
Table of Contents$4.9 million.
Interest Expense
Interest expense was $11.3$11.1 million, $11.4$11.0 million and $12.7$11.2 million in 2012, 20112015, 2014 and 2010,2013, respectively. In January 2011, we completedAlthough the refinancingmajority of our senior notes with more favorable terms, which resulted in lower interest expense in 2011 compared to 2010. We also experiencedis fixed based on our $190.0 million senior unsecured notes, we did benefit from lower costs associated with the renewal of our $125.0 million credit facility which was entered into in August 2010.2013.
Income Taxes
Our effective income tax rate from continuing operations was 36.0%38.5%, 37.8%36.1% and 36.2%35.7% in 2012, 20112015, 2014 and 2010,2013, respectively. During 2009, theThe Company sold a subsidiary,Legend in 2013, which generated a capital loss available to offset potential future and prior period capital gains. Due to the character of the losslosses and the limited carryforward period permitted by law, a valuation allowance was recorded on a portion of this capital loss. The lowerDuring 2015, unrealized losses on equity method investments and the trading securities portfolio increased the valuation allowance. These losses were partially offset by capital gain distributions from investments and realized capital gains on the sale of securities in the Company's investment portfolios. Overall, the losses in excess
of gains resulted in an increase in the valuation allowance that was recorded as a charge to income tax expense of $3.7 million, which increased our effective income tax rate in 2012 was primarily the result of additional utilization of the capital loss in 2012 as compared to 2011.rate. During 20122014 and 2011,2013, realized capital gains allowed for a release of the valuation allowance of $2.3$5.0 million, and $0.4$7.2 million, respectively. In both years, this release of the valuation allowance was recorded as a reduction to income tax expense and, as a result, decreased our effective tax rate. The higher effective tax rate in 2011 over 20102015 as compared to 2014 was primarily the result of less utilization of the capital lossinvestment losses in 20112015 as compared to 2010.investment gains in 2014. The higher effective tax rate in 2014 as compared to 2013 was primarily the result of lower investment gains in 2014.
Our 2012, 20112015, 2014 and 20102013 effective tax rates from continuing operations, removing the effects of the valuation allowance, would have been 36.8%37.6%, 38.0%37.1%, and 37.3%37.5%, respectively. The effective income tax rate, exclusive of the valuation allowance, decreasedincreased in 20122015 as compared to 20112014 due to the lapse of the statute of limitationsincreases in tax years, which allowed for the recognition of tax benefits previously considered partially uncertain. Also in 2012, the Company identified favorable treatment on expenses previously considered nondeductiblethat are not deductible for income tax purposes as well as lower income before taxes in years for2015, which increases the statuteimpact of limitations remains open.nondeductible expenses. The effective income tax rate, exclusive of the valuation allowance, increaseddecreased in 2011 over that of 20102014 as compared to 2013 due to changes in state legislation in jurisdictions inhigher income before taxes, which diluted the impact of expenses that are not deductible for income tax purposes. Additionally, the Company operatesgenerated larger state tax incentives related to capital expenditures made by the Company in 2014 as well as a chargecompared to tax expense in 2011 on tax positions for which the outcome is uncertain in tax years in which the statute of limitations remains open.2013.
Liquidity and Capital Resources
The following table summarizes certain key financial data relating to our liquidity and capital resources:
| | For the Year Ended December 31, | Variance | ||||||||||||||
|---|---|---|---|---|---|---|---|---|---|---|---|---|---|---|---|---|
| | 2012 vs. 2011 | 2011 vs. 2010 | ||||||||||||||
| | 2012 | 2011 | 2010 | |||||||||||||
| | (in thousands, except percentage data) | |||||||||||||||
Balance Sheet Data:(2) | ||||||||||||||||
Cash and cash equivalents | $ | 328,027 | 323,916 | 190,070 | 1% | 70% | ||||||||||
Cash and cash equivalents - restricted | 92,980 | 50,556 | 71,689 | 84% | -29% | |||||||||||
Investment securities | 176,142 | 134,262 | 191,322 | (1) | 31% | -30% | ||||||||||
Long-term debt | 190,000 | 190,000 | 189,999 | 0% | 0% | |||||||||||
Cash Flow Data: | ||||||||||||||||
Cash flows from operating activities | 233,435 | 283,139 | (1) | 140,643 | -18% | 101% | ||||||||||
Cash flows from investing activities | (17,129) | (30,242) | (67,806) | -43% | -55% | |||||||||||
Cash flows from financing activities | (213,059) | (121,129) | (121,881) | -76% | 1% | |||||||||||
Maturities of the U.S. treasury bills and commercial paper during 2011 of $66.0 million is included in cash flows from operating activities.
| | For the Year Ended December 31, | Variance | ||||||||||||||
|---|---|---|---|---|---|---|---|---|---|---|---|---|---|---|---|---|
| | 2015 vs. 2014 | 2014 vs. 2013 | ||||||||||||||
| | 2015 | 2014 | 2013 | |||||||||||||
| | (in thousands, except percentage data) | |||||||||||||||
Balance Sheet Data: | ||||||||||||||||
Cash and cash equivalents | $ | 558,495 | 566,621 | 487,845 | –1% | 16% | ||||||||||
Cash and cash equivalents—restricted | 66,880 | 76,595 | 121,419 | –13% | –37% | |||||||||||
Investment securities | 291,743 | 243,283 | 201,348 | 20% | 21% | |||||||||||
Long-term debt | 190,000 | 190,000 | 190,000 | 0% | 0% | |||||||||||
Cash Flow Data: | ||||||||||||||||
Cash flows from operating activities | 233,950 | 345,042 | 286,916 | –32% | 20% | |||||||||||
Cash flows from investing activities | (22,595) | (39,108) | 25,622 | –42% | –253% | |||||||||||
Cash flows from financing activities | (219,481) | (227,158) | (155,023) | 3% | –47% | |||||||||||
Our operations provide much of the cash necessary to fund our priorities, as follows:
Finance Internal Growth
We use cash to fund growth in our distribution channels. Our Wholesale channel which has a higher cost to gather assets, requires cash outlays for wholesaler commissions and commissions to third parties on deferred load product sales. We continue to invest in our Advisors channel by providing additional support to our advisors throughoffering home office resources, wholesaling efforts and enhanced technology tools.tools, including the modernization of our brokerage and product platform associated with Project E. Across both channels, we provide seed money for new products.
Pay Dividends
The Board of Directors approved a special cash dividend on our common stock of $1.00 per share that was paid on December 6, 2012, and an increase in the quarterly dividend on our common stock from $0.25$0.43 per share to $0.28$0.46 per share beginning with ourthe dividend we declared in the fourth quarter 2012 dividend,2015 and paid on February 1, 2013.2016 to stockholders of record on January 11, 2016. Dividends on our common stock resulted in financing cash outflows of $171.3$144.0 million, $68.8$115.3 million and $65.2$96.0 million in 2012, 20112015, 2014 and 2010,2013, respectively.
Repurchase Our Stock
In 2012,2015, we purchased 1.5 million of our shares, compared to 2.0 million shares of our common stock, compared to 2.3 million shares and 1.5 million shares in both 20112014 and 2010.2013, respectively. These share repurchase amounts included 568,568432,353 shares, 494,207599,340 shares and 426,665665,035 shares from employees who elected to tender shares to cover their minimum tax withholdings with respect to vesting of stock awards during the years ended December 31, 2012, 20112015, 2014 and 2010,2013, respectively.
In the future, we plan to repurchase shares, at a minimum, to offset dilution from shares issued for employee share plans.stock-based compensation programs. During 2013,2016, we estimate that we will repurchase approximately 670 thousand400,000 shares from employees who elect to tender shares to cover their minimum tax withholdings arising from the vesting of nonvested shares.
Operating Cash Flows
Excluding the cash flowsCash from operating activities generated from the maturityoperations is our primary source of U.S. treasuriesfunds and commercial paper in 2011 of $66.0 million, net cash provided by operating activities increased $16.3decreased $111.1 million from 20112014 to 2012.2015. The decrease is primarily due to a decrease in net income of $67.8 million in 2015, increased purchases of trading securities of $36.5 million and an increase in other assets of $19.5 million, partially offset by a net decrease in deferred sales commission payments related to deferred sales load and fee based products of $8.8 million in 2015.
The payable to investment companies for securities, payable to customers and other receivables accounts can fluctuate significantly based on trading activity at the end of a reporting period. Changes in these accounts result in variances within cash from operations on the statement of cash flows; however, there is no impact to the Company's liquidity and operations for the variances in these accounts.
We payDuring 2015, we paid our financial advisors and third parties upfront commissions on the sale of Class B and C shares and certain fee-based asset allocation products. Effective January 1, 2014, we suspended sales of Class B shares, but prior to that date, we paid upfront commissions on Class B shares as well. Funding of such commissions during the years ended December 31, 2012, 20112015, 2014 and 20102013 totaled $54.4$10.9 million, $57.9$41.0 million and $59.0$68.5 million, respectively. The driversIn 2015, 100% of the commission funding in 2012 were fee-based asset allocation products, for which $28.0 million was funded, andrelated to Class C shares, for which $19.0 million was funded. The drivers ofshares. During 2014, commission funding in 2011 were fee-based asset allocation products, for which $26.5 million was funded, and Class C shares, for which $23.0 million was funded. The drivers of commission funding in 2010 were Class C shares, for which $25.9 million was funded,Shares and fee-based asset allocation products was 57% and 43% of the annual commission funding, respectively. In 2013, 54% of the commission funding was related to fee-based asset allocation products and 36% was related to Class C shares. We continue to expect payment of upfront fund commission for which $24.8certain fee-based asset allocation products will decline in future periods.
A contribution of $20.0 million was funded. Management expects future cash requirementsmade to our pension plan in January 2016, and no further contributions are planned for sales commissions may2016.
In connection with Project E strategic initiatives and the share class conversion, which are expected to reduce operating revenue by approximately $29.0 million in 2016, we will undertake significant cost reduction efforts to reduce fixed costs by approximately 10%, or $40.0 million, on our annual run-rate basis over the next 12 - 18 months, with a goal to realize approximately two-thirds of the reduction in 2016.
exceed the level experienced in previous years due to increased sales in our fee-based asset allocation products.
Contributions to our pension plan are not expected to exceed $20 million for 2013. A contribution of $10 million was made to the plan in January 2013.
Investing Cash Flows
Investing activities consist primarily of the purchaseseeding and sale of available for salesponsored investment securities, as well as capital expenditures. We expect our 20132016 capital expenditures to be in the range of $15.0 to $20.0$25.0 million.
Financing Cash Flows
As noted previously, dividends and stock repurchases accounted for a majority of our financing cash outflows in 2012.2015.
During 2010, we repurchased $10.0 million of our $200.0 million aggregate principal amount 5.6% senior notes due January 2011 (the "Notes"). On August 31, 2010, the Company entered into an agreement to complete a $190.0 million private placement of senior unsecured notes (thethat were issued and sold in two tranches: $95.0 million bearing interest at 5.0% and maturing January 13, 2018, Series A, and $95.0 million bearing interest of 5.75% and maturing January 13, 2021, Series B (collectively, the "Senior Notes"). The agreement contained a delayed funding provision that allowed the Company to draw down the proceeds in January 2011 when the existing Notes5.6% senior notes (the "Notes") matured. The Company used the proceeds of the issuance and sale of the Senior Notes to repay in full the Notes expiring in January 2011. The Senior Notes are unsecured and were issued in two tranches: $95.0 million bearing interest at 5% and maturing January 13, 2018, Series A, and $95.0 million bearing interest of 5.75% and maturing January 13, 2021, Series B.full. Interest is payable semi-annually in January and July of each year. The most restrictive provisions of the agreement require the Company to maintain a consolidated leverage ratio not to exceed 3.0 to 1.0 for four consecutive quarters and a consolidated interest coverage ratio of not less than 4.0 to 1.0 for four consecutive quarters. The Company was in compliance with these covenants for all periods presented. As of December 31, 2015, the Company's consolidated leverage ratio was 0.4 to 1.0, and consolidated interest coverage ratio was 42.9 to 1.0.
Simultaneous with the refinancing of our senior notes, theThe Company entered into a threefive year revolving credit facility (the "Credit Facility") with various lenders, effective August 31, 2010,June 28, 2013, which provides for initial borrowings of up to $125.0 million and replaced the Company's previous revolving credit facility. Lenders could,may, at their option upon the Company's request, expand the facility to $200.0 million. At December 31, 2012, thereThere were no borrowings outstanding under the Credit Facility. BothFacility at December 31, 2015 or at any point during the year. The Credit Facility andFacility's covenants match those outlined above for the Senior Notes contain financial covenants with respect to leverage and interest coverage, both of which we were in compliance with throughout fiscal 2012.Notes.
Short Term Liquidity and Capital Requirements
Management believes its available cash, marketable securities and expected cash flow from operations will be sufficient to fund its short-term operating and capital requirements during 2013.2016. Expected short-term uses of cash include dividend payments, interest payments on outstanding debt, income tax payments, seed money for new products, capital expenditures including those related to the Project E initiatives, share repurchases, payment of deferred commissions to our financial advisors and third parties, capital expenditurespension funding, and home office leasehold and building improvements, and could include strategic acquisitions.
In 2016, the Company plans to offer terminated, vested pension plan participants a one-time voluntary lump sum window distribution equal to the present value of the participant's pension benefit, in an effort to reduce pension obligations and ongoing annual pension expense. This offer may result in a noncash charge in the fourth quarter of 2016, in accordance with the relevant accounting standards, dependent on the number of plan participants who elect to take the lump sum distribution and the total amount of such distributions.
Long Term Liquidity and Capital Requirements
Expected long-term capital requirements include indebtedness, operating leases and purchase obligations, and potential recognition of tax liabilities, summarized in the following table as of
December 31, 2012.2015. Purchase obligations include amounts that will be due for the purchase of goods and
services to be used in our operations under long-term commitments or contracts. The majority of our purchase obligations are reimbursable to us by the Funds.
| | Total | 2013 | 2014- 2015 | 2016- 2017 | Thereafter/ Indeterminate | Total | 2016 | 2017- 2018 | 2019- 2020 | Thereafter/ Indeterminate | ||||||||||||||||||||||
|---|---|---|---|---|---|---|---|---|---|---|---|---|---|---|---|---|---|---|---|---|---|---|---|---|---|---|---|---|---|---|---|---|
| | (in thousands) | (in thousands) | ||||||||||||||||||||||||||||||
Long-term debt obligations, including interest | $ | 262,557 | 10,213 | 20,425 | 20,425 | 211,494 | $ | 231,919 | 10,213 | 113,050 | 10,925 | 97,731 | ||||||||||||||||||||
Non-cancelable operating lease commitments | 89,386 | 20,498 | 29,998 | 17,313 | 21,577 | 80,000 | 22,564 | 31,664 | 13,577 | 12,195 | ||||||||||||||||||||||
Purchase obligations | 261,419 | 38,358 | 63,714 | 59,087 | 100,260 | 147,604 | 55,066 | 64,968 | 20,098 | 7,472 | ||||||||||||||||||||||
Unrecognized tax benefits | 10,788 | 329 | - | - | 10,459 | 11,890 | 38 | — | — | 11,852 | ||||||||||||||||||||||
| | | | | | | | | | | | | | | | | | ||||||||||||||||
| $ | 471,413 | 87,881 | 209,682 | 44,600 | 129,250 | |||||||||||||||||||||||||||
| $ | 624,150 | 69,398 | 114,137 | 96,825 | 343,790 | |||||||||||||||||||||||||||
| | | | | | | | | | | | | | | | | | ||||||||||||||||
| | | | | | | | | | | | | |||||||||||||||||||||
| | | | | | | | | | | | | | | | | | ||||||||||||||||
Other possible long-term discretionary uses of cash could include capital expenditures for enhancement of technology infrastructure and home office expansion, strategic acquisitions, payment of dividends, income tax payments, seed money for new products, pension funding, repurchases of our common stock, and payment of upfront fund commissions for Class B shares, Class C shares and certain fee-based asset allocation products. We expect payment of upfront fund commissions for certain fee-based asset allocation products pension funding and repurchaseswill decline in future years due to a change in our advisor compensation plan whereby a smaller population of our common stock.advisors are eligible for upfront fund commissions on the sale of these products.
Off-Balance Sheet Arrangements
Other than operating leases, which are included in the table above, the Company does not have any off-balance sheet financing. The Company has not created, and is not party to, any special-purpose or off-balance sheet entities for the purpose of raising capital, incurring debt or operating its business.
Critical Accounting Policies and Estimates
Management believes the following critical accounting policies affect its significant estimates and judgments used in the preparation of its consolidated financial statements.
Accounting for Goodwill and Intangible Assets
As of December 31, 2012,2015, our total goodwill and intangible assets were $162.0$158.1 million, or 14%10%, of our total assets. Two significant considerations arise with respect to these assets that require management estimates and judgment: (i) the valuation in connection with the initial purchase price allocation, and (ii) the ongoing evaluation of impairment.
In connection with all of our acquisitions, an evaluation is completed to determine reasonable purchase price allocations. The purchase price allocation process requires management estimates and judgments as to expectations for the various products, distribution channels and business strategies. For example, certain growth rates and operating margins were assumed for different products and distribution channels. If actual growth rates or operating margins, among other assumptions, differ from the estimates and judgments used in the purchase price allocation, the amounts recorded in the financial statements for identifiable intangible assets and goodwill could be subject to charges for impairment in the future.
We complete an ongoing review of the recoverability of goodwill and intangible assets using a fair-value or income based approach on an annual basis or more frequently whenever events occur or circumstances change that would more likely than not reduce the fair value of a reporting unit below its carrying amount. Intangible assets with indefinite lives, primarily acquired mutual fund advisory contracts, are also tested for impairment annually by comparing their fair value to the carrying amount of the asset. We consider mutual fund advisory contracts indefinite lived intangible assets as they are expected to be renewed without significant cost or modification of terms. Factors that are considered important in
determining whether an impairment of goodwill or intangible assets might exist include significant continued underperformance compared to peers, the likelihood of termination or non-renewal of a mutual fund advisory or subadvisory contract or substantial changes in revenues earned from such contracts, significant changes in our business
and products, material and ongoing negative industry or economic trends, or other factors specific to each asset or subsidiary being evaluated. Because of the significance of goodwill and other intangibles to our consolidated balance sheets, the annual impairment analysis is critical. Any changes in key assumptions about our business and our prospects, or changes in market conditions or other externalities, could result in an impairment charge.
As of June 30, 2012,In 2015, the Company's annual impairment test indicated that the fair value of the Legend reporting unit exceeded its carrying value, which resulted in no goodwill impairment. During preliminary due diligence conducted in the third quarter regarding a possible sale of Legend, several significant issues arose regarding executive leadership, advisor retention and employee morale. As due diligence discussions progressed into formal negotiations throughout the third quarter, the Company's concerns regarding these matters escalated, the depth and consequence of which led us to determine that a change in the strategic direction of Legend was necessary, and as a result, the Company decided to move forward with a sale of Legend at a price lower than the fair value utilized in the annual impairment analysis incompleted during the second quarter. During the third quarter of 2012, $59.2 million of goodwill related to Legend was allocated to assets of discontinued operations held for sale and $42.4 million of goodwill related to Legend was written down and is included in the loss from discontinued operations in the statement of income.
The Company's annual impairment test indicated that remaining goodwill and identifiable intangible assets were not impaired. Related to goodwill, the fair value of the investment management and related services reporting unit exceeded its carrying value by more than 100%. The fair value of our indefinite-lifeindefinite life intangible assets excluding the MFC intangible also exceeded their respectiveits carrying valuesvalue by more than 80%100%. The fair value of the MFC intangible related to our subadvisory agreement to manage certain mutual fund products for MFC exceeded its carrying amount by 10%. Based on the result of our annual test, we increased the frequency of our impairment analysis for the MFC intangible asset. It is possible that the assets we manage for MFC may decrease in the future, which would require us to assess the need for a write-down of the intangible asset.
During the third quarter of 2014, we recorded an impairment charge of $7.9 million related to the MFC intangible asset as a result of a decline in the related assets under management and associated cash flows. We also reduced the associated deferred tax liability by $2.9 million. As of December 31, 2014, the MFC intangible balance is $8.4 million with an associated deferred tax liability of $3.1 million.
Additionally during the third quarter of 2014, we recorded a $4.1 million intangible asset related to a fund adoption transaction agreement with Emerging Managers Group, L.P., which became effective in August 2014, pursuant to which IICO assumed responsibility as investment adviser and global distributor of the IGI Funds.
Accounting for Income Taxes
In the ordinary course of business, many transactions occur for which the ultimate tax outcome is uncertain. In addition, respective tax authorities periodically audit our income tax returns. These audits examine our significant tax filing positions, including the timing and amounts of deductions and the allocation of income among tax jurisdictions. We adjust our income tax provision in the period in which we determine the actual outcomes will likely be different from our estimates. The recognition or derecognition of income tax expense related to uncertain tax positions is determined under the guidance as prescribed by Accounting Standards Codification ("ASC")ASC 740"Income Taxes Topic"Topic." ASC 740. During 20122015, 2014, and 2010,2013, the Company settled three, six, and ninefour open tax years, respectively, that were undergoing audit by state jurisdictions in which the Company operates. These audits were settled in all material respects with no significant adjustments. The Company is currently undergoing auditsbeing audited in various otherone state jurisdictions that have not yet been settled.jurisdiction.
We recognize an asset or liability for the deferred tax consequences of temporary differences between the tax basis of assets and liabilities and their reported amounts in the financial statements, including the determination of any valuation allowance that might be required for deferred tax assets. These temporary differences will result in taxable or deductible amounts in future years when the reported amounts of assets are recovered or liabilities are settled.
In 2009,During 2013, the Company sold a subsidiary that generatedrealized a capital loss on the sale of Legend, which is available to offset potential future capital gains. Any unutilized capital loss carryforward will expire in 2018. Due to the character of the loss and the limited carryforward period permitted by law, the Company may not realize the full tax benefit of the capital loss. The capital loss carryforward generated in 2009, if not utilized, will expire in 2014. During 2012,Additionally, the Company recorded a non-cash impairment chargehas deferred tax assets for itsunrealized capital losses on investment in the Legend subsidiaries. The impairment created excess tax basis in its investment in Legend that will be characterized as a capital loss upon the sale of Legend. Capital losses generated by the Legend sale will expire five years from when the loss is realized.securities. Management believes it is not more likely than not that the Company will generate sufficient future capital gains to realize the full benefit of these capital losses.
Accordingly, a valuation allowance has been recorded on the deferred tax assets that were capital in nature as of December 31, 20122015, December 31, 2014 and December 31, 2011.2013.
Also asAs of December 31, 2012, four2015, two of the Company's subsidiaries have state net operating loss carryforwards in certain states in which those companies file on a separate company basis. These entities have recognized a deferred tax asset for such carryforwards. The carryforwards, if not utilized, will expire between 20132016 and 2032.2035. Management believes it is not more likely than not that three of the subsidiaries will generate sufficient future taxable income in these states to realize the benefit of these state net operating loss carryforwards and, accordingly, a valuation allowance has been recorded at December 31, 20122015, December 31, 2014 and December 31, 2011.2013.
We have not recorded a valuation allowance on any other deferred tax assets as of the current reporting period based on our belief that operating income will, more likely than not, be sufficient to realize the benefit of these assets over time. In the event that actual results differ from estimates or if our historical trend of positive operating income changes, we may be required to record a valuation allowance on deferred tax assets, which could have a significant effect on our consolidated financial condition and results of operations.
Income taxes are recorded at the rates in effect in the various tax jurisdictions in which we operate. Tax law and rate changes are reflected in the income tax provision in the period in which such changes are enacted.
Pension and Other Postretirement Benefits
Accounting for our pension and postretirement benefit plans requires us to estimate the cost of benefits to be provided well into the future and the current value of our benefit obligations. Three critical assumptions affecting these estimates are the discount rate, the expected return on assets and the expected health care cost trend rate. In 2012 and 2011, theThe discount rate assumption was based on the Aon Hewitt AA Only Above Median Yield Curve. This discount rate was determined separately for each plan by plotting the expected benefit payments from each plan against a yield curve of high quality, zero coupon bonds and calculating the single rate that would produce the same present value of liabilities as the yield curve. Prior to 2011, the discount rate assumption was based on the Mercer Bond Model, which calculated the yield on a theoretical portfolio of high-grade corporate bonds with cash flows that generally matched our expected benefit payments. The expected return on plan assets and health care cost trend rates are based upon an evaluation of our historical trends and experience, taking into account current and expected future market conditions. Other assumptions include rates of future compensation increases, participant withdrawals and mortality rates, and participant retirement ages. These estimates and assumptions impact the amount of net pension expense or income recognized each year and the measurement of our reported benefit obligation under the plans.
In 2012,2015, we decreased theutilized a discount rate of 4.60% for our pension plan compared to 4.22% from 4.99% used4.13% in 20112014 and 6.00% used4.97% in 2010, and decreased the2013 to reflect market rates. The discount rate for our postretirement medical plan to 4.18% from 5.00% usedwas 4.44%, 4.07% and 4.94% in 20112015, 2014 and 6.00% used in 2010, to reflect market interest rates. We continue2013 respectively. In 2015, we continued to assume long-term asset returns of 7.75% on the assets in our pension plan, the same as our assumption in 20112014 and 2010.2013. Our pension plan assets at December 31, 20122015 were 100% invested in the Asset Strategy style and while we have targeted this same investment strategy going forward.forward, we will assume long-term asset returns of 7.50% beginning in 2016.
The effect of hypothetical changes to selected assumptions on the Company's retirement benefit plans would be as follows:
| | | As of December 31, | For the year ended December 31, | |||||
|---|---|---|---|---|---|---|---|---|
| Assumptions | Change | Increase (Decrease) PBO/APBO (1) | Increase (Decrease) Expense (2) | |||||
| | | (in thousands) | ||||||
Pension | ||||||||
Discount rate | +/ | $ | $ | |||||
Expected return on assets | +/ | N/A | ||||||
Salary scale | +/ | |||||||
Other Postretirement | ||||||||
Discount rate | +/ | |||||||
Health care cost trend rate | +/ | |||||||
Deferred Sales Commissions
We pay upfront sales commissions to our financial advisors and third party intermediary broker/dealers in connection with the sale of certain classes of mutual fund shares sold without a front-end sales charge. These costs are capitalized and amortized over the period during which the shareholder is subject to a CDSC, not to exceed five years. We recover these costs through Rule 12b-1 and other distribution plan fees, which are paid by the applicable share classes of the Advisors Funds, Ivy Funds and InvestEd, Portfolios, along with CDSCs paid by shareholders who redeem their shares prior to completion of the specified holding periods. Should we lose our ability to recover such sales commissions through distribution plan payments and CDSCs, the value of these assets would immediately decline, as would future cash flows. We periodically review the recoverability of deferred sales commission assets as events or changes in circumstances indicate that the carrying amount of deferred sales commission assets may not be recoverable and adjust the deferred assets accordingly.
Valuation of Investments
We record substantially all investments in our financial statements at fair value. Where available, we use prices from independent sources such as listed market prices or broker/dealer price quotations. We evaluate our investmentsavailable for sale securities for other than temporary declines in value on a periodic basis. This may exist when the fair value of an investment security has been below the current value for an extended period of time. As most of our investments are carried at fair value, ifIf an other than temporary decline in value is determined to exist, the unrealized investment loss recorded net of tax in accumulated other comprehensive income is realized as a charge to net income, in the period in which the other than temporary decline in value is determined. While we believe that we have accurately estimated the amount of the other than temporary decline in the value of our portfolio, different assumptions could result in changes to the recorded amounts in our financial statements.
Loss Contingencies
The likelihood that a loss contingency exists is evaluated using the criteria of"Contingencies Topic," ASC 450 through consultation with legal counsel. A loss contingency is recorded if the contingency is considered probable and reasonably estimable as of the date of the financial statements.
Seasonality and Inflation
We do not believe our operations are subject to significant seasonal fluctuation. We have historically experienced increased sales activity in the first and fourth quarters of the year due to funding of retirement accounts by our clients. The Company has not suffered material adverse effects from inflation in the past. However, a substantial increase in the inflation rate in the future may adversely affect customers' purchasing decisions, may increase the costs of borrowing, or may have an impact on the Company's margins and overall cost structure.
ITEM 7A. Quantitative and Qualitative Disclosures About Market Risk
We use various financial instruments with certain inherent market risks, primarily related to interest rates and securities prices. The principal risks of loss arising from adverse changes in market rates and prices to which we are exposed relate to interest rates on debt and marketable securities. Generally, these instruments have not been entered into for trading purposes. Management actively monitors these risk exposures; however, fluctuations could impact our results of operations and financial position. As a matter of policy, we only execute derivative transactions to manage exposures arising in the normal course of business and not for speculative or trading purposes. The following information, together with information included in other parts of Management's Discussion and Analysis of Financial Condition and Results of Operations, which are incorporated herein by reference, describe the key aspects of certain financial instruments that have market risk to us.
Interest Rate Sensitivity
Our interest sensitive liabilities include our long-term fixed rate senior notes and obligations for any balances outstanding under our credit facility or other short-term borrowings. Increases in market interest rates would generally cause a decrease in the fair value of the senior notes and an increase in interest expense associated with short-term borrowings and borrowings under the credit facility. Decreases in market interest rates would generally cause an increase in the fair value of the senior notes and a decrease in interest expense associated with short-term borrowings and borrowings under the credit facility. We had no short-term borrowings outstanding as of December 31, 2012.2015.
Available for Sale InvestmentsInvestment Securities Sensitivity
We maintain an investment portfolio of various holdings, types and maturities. Our portfolio is diversified and consists primarily of investment grade debt securities and equity mutualsponsored funds. A portion of investments are classified as available for sale investments. At any time, a sharp increase in interest rates or a sharp decline in the United States stock market could have a significant negative impact on the fair value of our investment portfolio. If a decline in fair value is determined to be other than temporary by management, the cost basis of the individual security or mutual fund is written down to fair value. We do not currentlyIn 2016, we have established a hedging program that uses a total return swap to hedge these exposures.our exposure to fluctuations in the value of our investment portfolio. Conversely, declines in interest rates or a sizeable rise in the United States stock market could have a significant positive impact on our investment portfolio. However, unrealized gains are not recognized in operations on available for sale securities until they are sold.
The following is a summary of the effect that a 10% increase or decrease in equity or fixed income prices would have on our investment portfolio subject to equity or fixed income price fluctuations at December 31, 2015:
| Investment Securities | Fair Value | Fair Value Assuming a 10% Increase | Fair Value Assuming a 10% Decrease | |||||||
|---|---|---|---|---|---|---|---|---|---|---|
| | | (in thousands) | | |||||||
Available for sale: | ||||||||||
Sponsored funds | $ | 40,552 | 44,607 | 36,497 | ||||||
Sponsored privately offered funds | 825 | 908 | 743 | |||||||
Trading: | ||||||||||
Sponsored funds | 29,701 | 32,671 | 26,731 | |||||||
Equity securities | 87 | 96 | 78 | |||||||
Asset-backed securities | 20 | 22 | 18 | |||||||
Corporate bonds | 5 | 6 | 5 | |||||||
Equity Method: | ||||||||||
Sponsored funds | 217,380 | 239,118 | 195,642 | |||||||
Sponsored privately offered funds | 3,173 | 3,490 | 2,856 | |||||||
| | | | | | | | | | | |
Total | $ | 291,743 | 320,918 | 262,570 | ||||||
| | | | | | | | | | | |
| | | | | | | | | | | |
| | | | | | | | | | | |
Securities Price Sensitivity
Our revenues are dependent on the underlying assets under management in the Funds to which investment advisory services are provided. The Funds include portfolios of investments comprised of various combinations of equity, fixed income and other types of securities and commodities. Fluctuations in the value of these securities are common and are generated by numerous factors, including, without
limitation, market volatility, the overall economy, inflation, changes in investor strategies, availability of alternative investment vehicles, government regulations and others. Accordingly, declines in any one or a combination of these factors, or other factors not separately identified, may reduce the value of investment securities and, in turn, the underlying assets under management on which our revenues are earned. These declines have an impact in our investment sales and our trading portfolio, thereby compounding the impact on our earnings.
ITEM 8. Financial Statements and Supplementary Data
Reference is made to the Consolidated Financial Statements referred to in the Index on page 4852 setting forth our consolidated financial statements, together with the report of KPMG LLP dated February 27, 201325, 2016 on page 49.53.
ITEM 9. Changes in and Disagreements with Accountants on Accounting and Financial Disclosure
None.
ITEM 9A. Controls and Procedures
well conceived and operated, can provide only reasonable, not absolute, assurance that the objectives of the control system are met. The Company's Chief Executive Officer and Chief Financial Officer, after evaluating the effectiveness of the Company's disclosure controls and procedures (as defined in RulesRule 13a-15(e) and 15d-15(e) of the Securities Exchange Act of 1934, as amended (the "Exchange Act"))Act) as of the end of the period covered by this report,December 31, 2015, have concluded that the Company's disclosure controls and procedures arewere effective to provide reasonable assurance that information required to be disclosed by the Company in the reports that it files or submits under the Exchange Act is accumulated and communicated to the Company's management, including its principal executive officer and principal financial officer, as appropriate to allow timely decisions regarding required disclosure and are effective to provide reasonable assurance that such information is recorded, processed, summarized and reported within the time periods specified in the SEC's rules and forms.
of December 31, 2015.
Based on our evaluation under the framework in"Internal Control-Integrated Framework (2013)," management concluded that, as of December 31, 2012,2015, our internal control over financial reporting was effective. KPMG LLP, the independent registered public accounting firm that audited the financial statements included in this Annual Report on Form 10-K, also audited the effectiveness of our internal control over financial reporting as of December 31, 2012,2015, as stated in their attestation report which follows.
Report of Independent Registered Public Accounting Firm
The Board of Directors and Stockholders
Waddell & Reed Financial, Inc.:
We have audited Waddell & Reed Financial, Inc.'s (the Company) internal control over financial reporting as of December 31, 2012,2015, based on criteria established inInternal Control—Integrated Framework (2013) issued by the Committee of Sponsoring Organizations of the Treadway Commission (COSO). Waddell & Reed Financial, Inc.'s management is responsible for maintaining effective internal control over financial reporting and for its assessment of the effectiveness of internal control over financial reporting, included in the accompanying Management's Report on Internal Control over Financial Reporting. Our responsibility is to express an opinion on the Company's internal control over financial reporting based on our audit.
We conducted our audit in accordance with the standards of the Public Company Accounting Oversight Board (United States). Those standards require that we plan and perform the audit to obtain reasonable assurance about whether effective internal control over financial reporting was maintained in all material respects. Our audit included obtaining an understanding of internal control over financial reporting, assessing the risk that a material weakness exists, and testing and evaluating the design and operating effectiveness of internal control based on the assessed risk. Our audit also included performing such other procedures as we considered necessary in the circumstances. We believe that our audit provides a reasonable basis for our opinion.
A company's internal control over financial reporting is a process designed to provide reasonable assurance regarding the reliability of financial reporting and the preparation of financial statements for external purposes in accordance with generally accepted accounting principles. A company's internal control over financial reporting includes those policies and procedures that (1) pertain to the maintenance of records that, in reasonable detail, accurately and fairly reflect the transactions and dispositions of the assets of the company; (2) provide reasonable assurance that transactions are recorded as necessary to permit preparation of financial statements in accordance with generally accepted accounting principles, and that receipts and expenditures of the company are being made only in accordance with authorizations of management and directors of the company; and (3) provide reasonable assurance regarding prevention or timely detection of unauthorized acquisition, use, or disposition of the company's assets that could have a material effect on the financial statements.
Because of its inherent limitations, internal control over financial reporting may not prevent or detect misstatements. Also, projections of any evaluation of effectiveness to future periods are subject to the risk that controls may become inadequate because of changes in conditions, or that the degree of compliance with the policies or procedures may deteriorate.
In our opinion, Waddell & Reed Financial, Inc. maintained, in all material respects, effective internal control over financial reporting as of December 31, 2012,2015, based on criteria established inInternal Control—Integrated Framework (2013) issued by the Committee of Sponsoring Organizations of the Treadway Commission.
We also have audited, in accordance with the standards of the Public Company Accounting Oversight Board (United States), the consolidated balance sheets of Waddell & Reed Financial, Inc. and subsidiaries as of December 31, 20122015 and 2011,2014, and the related consolidated statements of income, comprehensive income, stockholders' equity, and cash flows for each of the years in the three-year period ended December 31, 2012,2015, and our report dated February 27, 201325, 2016 expressed an unqualified opinion on those consolidated financial statements.
/s/ KPMG LLP
Kansas City, Missouri
February 27, 201325, 2016
None.
ITEM 10. Directors, Executive Officers and Corporate Governance
Information required by this Item 10.10 is incorporated herein by reference to our definitive proxy statement for our 20132016 Annual Meeting of Stockholders to be filed pursuant to Regulation 14A under the Exchange Act.
ITEM 11. Executive Compensation
Information required by this Item 11.11 is incorporated herein by reference to our definitive proxy statement for our 20132016 Annual Meeting of Stockholders to be filed pursuant to Regulation 14A under the Exchange Act.
ITEM 12. Security Ownership of Certain Beneficial Owners and Management and Related Stockholder Matters
Information required by this Item 12.403 of Regulation S-K is incorporated herein by reference to our definitive proxy statement for our 20132016 Annual Meeting of Stockholders to be filed pursuant to Regulation 14A under the Exchange Act.
ITEM 13. Certain Relationships and Related Transactions, and Director Independence
Information required by this Item 13.13 is incorporated herein by reference to our definitive proxy statement for our 20132016 Annual Meeting of Stockholders to be filed pursuant to Regulation 14A under the Exchange Act.
ITEM 14. Principal Accounting Fees and Services
Information required by this Item 14.14 is incorporated herein by reference to our definitive proxy statement for our 20132016 Annual Meeting of Stockholders to be filed pursuant to Regulation 14A under the Exchange Act.
ITEM 15. Exhibits, Financial Statement Schedules
(a)(1) | Financial Statements. | |
| Reference is made to the Index to Consolidated Financial Statements on page | ||
(a)(2) | Financial Statement Schedules. | |
| None. | ||
(b) | Exhibits. | |
| Reference is made to the Index to Exhibits beginning on page |
Pursuant to the requirements of Section 13 or 15(d) of the Securities Exchange Act of 1934, as amended, the Company has duly caused this Report to be signed on its behalf by the undersigned, thereunto duly authorized, in the City of Overland Park, State of Kansas, on February 27, 2013.26, 2016.
| WADDELL & REED FINANCIAL, INC. | ||||
By: | /s/ HENRY J. HERRMANN Henry J. Herrmann Chairman of the Board and Chief Executive Officer | |||
Pursuant to the requirements of the Securities Exchange Act of 1934, as amended, this Report has been signed below by the following persons on behalf of the Company and in the capacities and on the dates indicated.
Name | Title | Date | ||
|---|---|---|---|---|
/s/ HENRY J. HERRMANN Henry J. Herrmann | Chief Executive Officer, Chairman of the Board and Director (Principal Executive Officer) | February | ||
|
|
| ||
Brent K. Bloss |
|
| ||
Sharilyn S. Gasaway |
|
| ||
Thomas C. Godlasky |
|
| ||
Alan W. Kosloff |
|
| ||
Dennis E. Logue |
|
| ||
Michael F. Morrissey |
|
| ||
James M. Raines |
|
| ||
|
|
| ||
Jerry W. Walton |
|
| ||
Jeffrey P. Bennett |
|
|
WADDELL & REED FINANCIAL, INC.
Index to Consolidated Financial Statements
| | Page | |
|---|---|---|
Report of Independent Registered Public Accounting Firm | ||
Consolidated Balance Sheets at December 31, | ||
Consolidated Statements of Income for each of the years in the three-year period ended December 31, | ||
Consolidated Statements of Comprehensive Income for each of the years in the three-year period ended December 31, | ||
Consolidated Statements of Stockholders' Equity for each of the years in the three-year period ended December 31, | ||
Consolidated Statements of Cash Flows for each of the years in the three-year period ended December 31, | ||
Notes to Consolidated Financial Statements |
Report of Independent Registered Public Accounting Firm
The Board of Directors and Stockholders
Waddell & Reed Financial, Inc.:
We have audited the accompanying consolidated balance sheets of Waddell & Reed Financial, Inc. and subsidiaries (the Company) as of December 31, 20122015 and 2011,2014, and the related consolidated statements of income, comprehensive income, stockholders' equity, and cash flows for each of the years in the three-year period ended December 31, 2012.2015. These consolidated financial statements are the responsibility of the Company's management. Our responsibility is to express an opinion on these consolidated financial statements based on our audits.
We conducted our audits in accordance with the standards of the Public Company Accounting Oversight Board (United States). Those standards require that we plan and perform the audit to obtain reasonable assurance about whether the financial statements are free of material misstatement. An audit includes examining, on a test basis, evidence supporting the amounts and disclosures in the financial statements. An audit also includes assessing the accounting principles used and significant estimates made by management, as well as evaluating the overall financial statement presentation. We believe that our audits provide a reasonable basis for our opinion.
In our opinion, the consolidated financial statements referred to above present fairly, in all material respects, the financial position of Waddell & Reed Financial, Inc. and subsidiaries as of December 31, 20122015 and 2011,2014, and the results of their operations and their cash flows for each of the years in the three-year period ended December 31, 2012,2015, in conformity with U.S. generally accepted accounting principles.
We also have audited, in accordance with the standards of the Public Company Accounting Oversight Board (United States), Waddell & Reed Financial, Inc.'s internal control over financial reporting as of December 31, 2012,2015, based on criteria established inInternal Control—Integrated Framework (2013) issued by the Committee of Sponsoring Organizations of the Treadway Commission (COSO), and our report dated February 27, 201325, 2016 expressed an unqualified opinion on the effectiveness of the Company's internal control over financial reporting.
/s/ KPMG LLP
Kansas City, Missouri
February 27, 201325, 2016
WADDELL & REED FINANCIAL, INC.
CONSOLIDATED BALANCE SHEETS
December 31, 20122015 and 2011
2014
| | 2012 | 2011 | 2015 | 2014 | ||||||||
|---|---|---|---|---|---|---|---|---|---|---|---|---|
| | (in thousands) | (in thousands) | ||||||||||
Assets: | ||||||||||||
Cash and cash equivalents | $ | 328,027 | 323,916 | $ | 558,495 | 566,621 | ||||||
Cash and cash equivalents - restricted | 92,980 | 50,556 | ||||||||||
Cash and cash equivalents—restricted | 66,880 | 76,595 | ||||||||||
Investment securities | 176,142 | 134,262 | 291,743 | 243,283 | ||||||||
Receivables: | ||||||||||||
Funds and separate accounts | 33,886 | 31,842 | 34,399 | 39,110 | ||||||||
Customers and other | 136,073 | 107,125 | 220,660 | 216,843 | ||||||||
Deferred income taxes | 7,978 | 11,900 | ||||||||||
Income taxes receivable | 5,577 | 15,067 | 10,594 | 7,747 | ||||||||
Prepaid expenses and other current assets | 9,080 | 10,042 | 34,974 | 14,980 | ||||||||
Assets of discontinued operations held for sale | 15,150 | 14,901 | ||||||||||
| | | | | | | | ||||||
Total current assets | 804,893 | 699,611 | 1,217,745 | 1,165,179 | ||||||||
Property and equipment, net | 69,328 | 73,143 | 105,434 | 92,304 | ||||||||
Deferred sales commissions, net | 69,355 | 68,788 | 24,262 | 56,472 | ||||||||
Goodwill and identifiable intangible assets | 161,969 | 161,969 | 158,118 | 158,123 | ||||||||
Deferred income taxes | 17,797 | 5,046 | 32,692 | 27,490 | ||||||||
Other non-current assets | 11,491 | 13,533 | 17,468 | 12,298 | ||||||||
Assets of discontinued operations held for sale | 18,010 | 60,274 | ||||||||||
| | | | | | | | ||||||
Total assets | $ | 1,152,843 | 1,082,364 | $ | 1,555,719 | 1,511,866 | ||||||
| | | | | | | | ||||||
| | | | | | ||||||||
| | | | | | | | ||||||
Liabilities: | ||||||||||||
Accounts payable | $ | 68,977 | 51,951 | $ | 32,858 | 32,263 | ||||||
Payable to investment companies for securities | 152,749 | 104,304 | 113,648 | 129,633 | ||||||||
Payable to third party brokers | 49,848 | 67,954 | ||||||||||
Payable to customers | 120,420 | 110,399 | ||||||||||
Accrued compensation | 46,347 | 42,670 | 69,335 | 67,574 | ||||||||
Payable to third party brokers | 46,169 | 41,125 | ||||||||||
Other current liabilities | 43,504 | 42,298 | 57,104 | 55,143 | ||||||||
Liabilities of discontinued operations held for sale | 7,587 | 6,550 | ||||||||||
| | | | | | | | ||||||
Total current liabilities | 365,333 | 288,898 | 443,213 | 462,966 | ||||||||
Long-term debt | 190,000 | 190,000 | 190,000 | 190,000 | ||||||||
Accrued pension and postretirement costs | 62,458 | 56,548 | 48,810 | 45,936 | ||||||||
Other non-current liabilities | 24,531 | 23,068 | 27,241 | 26,880 | ||||||||
Liabilities of discontinued operations held for sale | 281 | 207 | ||||||||||
| | | | | | | | ||||||
Total liabilities | 642,603 | 558,721 | 709,264 | 725,782 | ||||||||
| | | | | | | | ||||||
Commitments and contingencies | ||||||||||||
Stockholders' equity: | ||||||||||||
Preferred stock—$1.00 par value: 5,000 shares authorized; none issued | - | - | — | — | ||||||||
Class A Common stock—$0.01 par value: 250,000 shares authorized; 99,701 shares issued; 85,679 shares outstanding (85,564 at December 31, 2011) | 997 | 997 | ||||||||||
Class A Common stock—$0.01 par value: 250,000 shares authorized; 99,701 shares issued; 82,850 shares outstanding (83,654 at December 31, 2014) | 997 | 997 | ||||||||||
Additional paid-in capital | 230,021 | 216,426 | 331,611 | 318,636 | ||||||||
Retained earnings | 698,423 | 721,281 | 1,141,608 | 1,041,909 | ||||||||
Cost of 14,022 common shares in treasury (14,137 at December 31, 2011) | (372,404) | (366,954) | ||||||||||
Cost of 16,851 common shares in treasury (16,047 at December 31, 2014) | (566,256) | (525,015) | ||||||||||
Accumulated other comprehensive loss | (46,797) | (48,107) | (61,505) | (50,443) | ||||||||
| | | | | | | | ||||||
Total stockholders' equity | 510,240 | 523,643 | 846,455 | 786,084 | ||||||||
| | | | | | | | ||||||
Total liabilities and stockholders' equity | $ | 1,152,843 | 1,082,364 | $ | 1,555,719 | 1,511,866 | ||||||
| | | | | | | | ||||||
| | | | | | ||||||||
| | | | | | | | ||||||
See accompanying notes to consolidated financial statements.
WADDELL & REED FINANCIAL, INC.
CONSOLIDATED STATEMENTS OF INCOME
Years ended December 31, 2012, 20112015, 2014 and 2010
2013
| | 2012 | 2011 | 2010 | 2015 | 2014 | 2013 | ||||||||||||
|---|---|---|---|---|---|---|---|---|---|---|---|---|---|---|---|---|---|---|
| | (in thousands, except per share data) | (in thousands, except per share data) | ||||||||||||||||
Revenues: | ||||||||||||||||||
Investment management fees | $ | 549,231 | 530,599 | 457,538 | $ | 709,562 | 768,102 | 650,442 | ||||||||||
Underwriting and distribution fees | 496,465 | 469,484 | 410,380 | 663,998 | 678,678 | 582,819 | ||||||||||||
Shareholder service fees | 128,109 | 122,449 | 110,348 | 143,071 | 150,979 | 137,093 | ||||||||||||
| | | | | | | | | | | |||||||||
Total | 1,173,805 | 1,122,532 | 978,266 | 1,516,631 | 1,597,759 | 1,370,354 | ||||||||||||
Operating expenses: | ||||||||||||||||||
Underwriting and distribution | 589,981 | 560,219 | 493,456 | 769,781 | 783,327 | 676,713 | ||||||||||||
Compensation and related costs (including share-based compensation of $48,748, $45,384 and $39,128, respectively) | 171,775 | 157,332 | 138,207 | |||||||||||||||
Compensation and related costs (including share-based compensation of $47,518, $54,144 and $53,179, respectively) | 200,752 | 194,410 | 197,597 | |||||||||||||||
General and administrative | 75,332 | 74,110 | 60,785 | 105,066 | 104,637 | 86,419 | ||||||||||||
Subadvisory fees | 21,009 | 29,885 | 27,823 | 9,134 | 8,436 | 12,220 | ||||||||||||
Depreciation | 13,211 | 14,764 | 13,525 | 16,046 | 14,634 | 12,834 | ||||||||||||
Intangible asset impairment | — | 7,900 | — | |||||||||||||||
| | | | | | | | | | | |||||||||
Total | 871,308 | 836,310 | 733,796 | 1,100,779 | 1,113,344 | 985,783 | ||||||||||||
| | | | | | | | | | | |||||||||
Operating income | 302,497 | 286,222 | 244,470 | 415,852 | 484,415 | 384,571 | ||||||||||||
Investment and other income | 9,817 | 2,105 | 8,619 | |||||||||||||||
Investment and other income (loss) | (5,244) | 16,790 | 19,904 | |||||||||||||||
Interest expense | (11,311) | (11,408) | (12,728) | (11,068) | (11,042) | (11,244) | ||||||||||||
Income from continuing operations before provision for income taxes | 301,003 | 276,919 | 240,361 | |||||||||||||||
| | | | | | | | | | | |||||||||
Income before provision for income taxes | 399,540 | 490,163 | 393,231 | |||||||||||||||
Provision for income taxes | 108,475 | 104,714 | 86,933 | 154,004 | 176,832 | 140,233 | ||||||||||||
Income from continuing operations | 192,528 | 172,205 | 153,428 | |||||||||||||||
Income (loss) from discontinued operations net of tax expense of $1,058, $2,556 and $2,592, respectively | (41,576) | 3,254 | 3,531 | |||||||||||||||
| | | | | | | | | | | |||||||||
Net income | $ | 150,952 | 175,459 | 156,959 | $ | 245,536 | 313,331 | 252,998 | ||||||||||
| | | | | | | | | | | |||||||||
| | | | | | | | ||||||||||||
| | | | | | | | | | | |||||||||
Net income per share, basic and diluted: | $ | 2.94 | 3.71 | 2.96 | ||||||||||||||
Income from continuing operations | $ | 2.25 | 2.01 | 1.79 | ||||||||||||||
Income (loss) from discontinued operations | (0.49) | 0.04 | 0.04 | |||||||||||||||
Net income | $ | 1.76 | $ | 2.05 | $ | 1.83 | ||||||||||||
Weighted average shares outstanding: | ||||||||||||||||||
Basic | 85,726 | 85,783 | 85,618 | |||||||||||||||
Diluted | 85,728 | 85,793 | 85,647 | |||||||||||||||
Weighted average shares outstanding, basic and diluted: | 83,499 | 84,485 | 85,589 | |||||||||||||||
See accompanying notes to consolidated financial statements.
WADDELL & REED FINANCIAL, INC.
CONSOLIDATED STATEMENTS OF COMPREHENSIVE INCOME
Years ended December 31, 2012, 20112015, 2014 and 2010
2013
| | 2012 | 2011 | 2010 | ||||||
|---|---|---|---|---|---|---|---|---|---|
| | (in thousands) | ||||||||
Net income | $ | 150,952 | 175,459 | 156,959 | |||||
Other comprehensive income: | |||||||||
Net unrealized appreciation (depreciation) of investment securities during the year, net of income taxes of $3,195, $(2,120) and $2,028, respectively | 5,444 | (3,635) | 3,493 | ||||||
Valuation allowance on investment securities' deferred tax asset during the year | 2,024 | (2,955) | 963 | ||||||
Pension and postretirement benefits, net of income taxes of $(2,532), $(13,232) and $628, respectively | (4,157) | (22,062) | 1,061 | ||||||
Reclassification adjustments for amounts included in net income, net of income taxes of $(1,162), $(830) and $(1,139), respectively | (2,001) | (1,428) | (1,980) | ||||||
Total other comprehensive income | 1,310 | (30,080) | 3,537 | ||||||
Comprehensive income | $ | 152,262 | 145,379 | 160,496 | |||||
| | 2015 | 2014 | 2013 | ||||||
|---|---|---|---|---|---|---|---|---|---|
| | (in thousands) | ||||||||
Net income | $ | 245,536 | 313,331 | 252,998 | |||||
Other comprehensive income: | |||||||||
Unrealized appreciation (depreciation) of available for sale investment securities during the year, net of income tax expense (benefit) of $2, $1 and $(9), respectively | (4,771) | (6,158) | 2,105 | ||||||
Pension and postretirement benefits, net of income tax expense (benefit) of $(3,794), $(16,725) and $17,272, respectively | (6,291) | (28,426) | 28,833 | ||||||
| | | | | | | | | | |
Comprehensive income | $ | 234,474 | 278,747 | 283,936 | |||||
| | | | | | | | | | |
| | | | | | | | | | |
| | | | | | | | | | |
See accompanying notes to consolidated financial statements.
WADDELL & REED FINANCIAL, INC.
CONSOLIDATED STATEMENTS OF STOCKHOLDERS' EQUITY
Years ended December 31, 2012, 20112015, 2014 and 2010
2013
(in thousands)
| | Common Stock | | | | | | |||||||||||||||
|---|---|---|---|---|---|---|---|---|---|---|---|---|---|---|---|---|---|---|---|---|---|
| | Additional Paid-in Capital | Retained Earnings | | Accumulated Other Comprehensive Income (Loss) | Total Stockholders' Equity | ||||||||||||||||
| | Shares | Amount | Treasury Stock | ||||||||||||||||||
Balance at December 31, 2009 | 99,701 | $ | 997 | 189,900 | 527,876 | (328,154) | (21,564) | 369,055 | |||||||||||||
Net income | — | — | — | 156,959 | — | — | 156,959 | ||||||||||||||
Recognition of equity compensation | — | — | 40,319 | 19 | — | — | 40,338 | ||||||||||||||
Issuance of nonvested shares and other | — | — | (37,631) | — | 37,631 | — | — | ||||||||||||||
Dividends accrued, $.77 per share | — | — | — | (66,041) | — | — | (66,041) | ||||||||||||||
Exercise of stock options | — | — | 2,726 | — | 10,331 | — | 13,057 | ||||||||||||||
Excess tax benefits from share-based payment arrangements | — | — | 6,128 | — | — | — | 6,128 | ||||||||||||||
Repurchase of common stock | — | — | — | — | (65,872) | — | (65,872) | ||||||||||||||
Unrealized appreciation on available for sale investment securities | — | — | — | — | — | 3,493 | 3,493 | ||||||||||||||
Valuation allowance on investment securities' deferred tax asset | 963 | 963 | |||||||||||||||||||
Pension and postretirement benefits | — | — | — | — | — | 1,061 | 1,061 | ||||||||||||||
Reclassification for amounts included in net income | — | — | — | — | — | (1,980) | (1,980) | ||||||||||||||
Balance at December 31, 2010 | 99,701 | 997 | 201,442 | 618,813 | (346,064) | (18,027) | 457,161 | ||||||||||||||
Net income | — | — | — | 175,459 | — | — | 175,459 | ||||||||||||||
Recognition of equity compensation | — | — | 46,457 | 16 | — | — | 46,473 | ||||||||||||||
Issuance of nonvested shares | — | — | (40,442) | — | 40,442 | — | — | ||||||||||||||
Dividends accrued, $.85 per share | — | — | — | (73,007) | — | — | (73,007) | ||||||||||||||
Exercise of stock options | — | — | 949 | — | 4,131 | — | 5,080 | ||||||||||||||
Excess tax benefits from share-based payment arrangements | — | — | 8,020 | — | — | — | 8,020 | ||||||||||||||
Repurchase of common stock | — | — | — | — | (65,463) | — | (65,463) | ||||||||||||||
Unrealized depreciation on available for sale investment securities | — | — | — | — | — | (3,635) | (3,635) | ||||||||||||||
Valuation allowance on investment securities' deferred tax asset | — | — | — | — | — | (2,955) | (2,955) | ||||||||||||||
Pension and postretirement benefits | — | — | — | — | — | (22,062) | (22,062) | ||||||||||||||
Reclassification for amounts included in net income | — | — | — | — | — | (1,428) | (1,428) | ||||||||||||||
Balance at December 31, 2011 | 99,701 | 997 | 216,426 | 721,281 | (366,954) | (48,107) | 523,643 | ||||||||||||||
Net income | — | — | — | 150,952 | — | — | 150,952 | ||||||||||||||
Recognition of equity compensation | — | — | 49,937 | 56 | — | — | 49,993 | ||||||||||||||
Issuance of nonvested shares | — | — | (43,106) | — | 43,106 | — | — | ||||||||||||||
Dividends accrued, $2.03 per share | — | — | — | (173,866) | — | — | (173,866) | ||||||||||||||
Exercise of stock options | — | — | (27) | — | 132 | — | 105 | ||||||||||||||
Excess tax benefits from share-based payment arrangements | — | — | 6,791 | — | — | — | 6,791 | ||||||||||||||
Repurchase of common stock | — | — | — | — | (48,688) | — | (48,688) | ||||||||||||||
Unrealized appreciation on available for sale investment securities | — | — | — | — | — | 5,444 | 5,444 | ||||||||||||||
Valuation allowance on investment securities' deferred tax asset | — | — | — | — | — | 2,024 | 2,024 | ||||||||||||||
Pension and postretirement benefits | — | — | — | — | — | (4,157) | (4,157) | ||||||||||||||
Reclassification for amounts included in net income | — | — | — | — | — | (2,001) | (2,001) | ||||||||||||||
Balance at December 31, 2012 | 99,701 | $ | 997 | 230,021 | 698,423 | (372,404) | (46,797) | 510,240 | |||||||||||||
| | Common Stock | | | | | | |||||||||||||||
|---|---|---|---|---|---|---|---|---|---|---|---|---|---|---|---|---|---|---|---|---|---|
| | Additional Paid-in Capital | Retained Earnings | | Accumulated Other Comprehensive Income (Loss) | Total Stockholders' Equity | ||||||||||||||||
| | Shares | Amount | Treasury Stock | ||||||||||||||||||
Balance at December 31, 2012 | 99,701 | $ | 997 | 230,021 | 698,423 | (372,404) | (46,797) | 510,240 | |||||||||||||
Net income | — | — | — | 252,998 | — | — | 252,998 | ||||||||||||||
Recognition of equity compensation | — | — | 52,992 | 187 | — | — | 53,179 | ||||||||||||||
Net issuance/forfeiture of nonvested shares | — | — | (28,564) | — | 28,564 | — | — | ||||||||||||||
Dividends accrued, $1.18 per share | — | — | — | (101,008) | — | — | (101,008) | ||||||||||||||
Exercise of stock options | — | — | (35) | — | 170 | — | 135 | ||||||||||||||
Excess tax benefits from share-based payment arrangements | — | — | 12,992 | — | — | — | 12,992 | ||||||||||||||
Repurchase of common stock | — | — | — | — | (72,132) | — | (72,132) | ||||||||||||||
Other comprehensive income | — | — | — | — | — | 30,938 | 30,938 | ||||||||||||||
| | | | | | | | | | | | | | | | | | | | | | |
Balance at December 31, 2013 | 99,701 | 997 | 267,406 | 850,600 | (415,802) | (15,859) | 687,342 | ||||||||||||||
Net income | — | — | — | 313,331 | — | — | 313,331 | ||||||||||||||
Recognition of equity compensation | — | — | 53,912 | 232 | — | — | 54,144 | ||||||||||||||
Net issuance/forfeiture of nonvested shares | — | — | (21,817) | — | 21,817 | — | — | ||||||||||||||
Dividends accrued, $1.45 per share | — | — | — | (122,254) | — | — | (122,254) | ||||||||||||||
Excess tax benefits from share-based payment arrangements | — | — | 19,135 | — | — | — | 19,135 | ||||||||||||||
Repurchase of common stock | — | — | — | — | (131,030) | — | (131,030) | ||||||||||||||
Other comprehensive income | — | — | — | — | — | (34,584) | (34,584) | ||||||||||||||
| | | | | | | | | | | | | | | | | | | | | | |
Balance at December 31, 2014 | 99,701 | 997 | 318,636 | 1,041,909 | (525,015) | (50,443) | 786,084 | ||||||||||||||
Net income | — | — | — | 245,536 | — | — | 245,536 | ||||||||||||||
Recognition of equity compensation | — | — | 47,256 | 262 | — | — | 47,518 | ||||||||||||||
Net issuance/forfeiture of nonvested shares | — | — | (39,094) | — | 39,094 | — | — | ||||||||||||||
Dividends accrued, $1.75 per share | — | — | — | (146,099) | — | — | (146,099) | ||||||||||||||
Excess tax benefits from share-based payment arrangements | — | — | 4,813 | — | — | — | 4,813 | ||||||||||||||
Repurchase of common stock | — | — | — | — | (80,335) | — | (80,335) | ||||||||||||||
Other comprehensive income | — | — | — | — | — | (11,062) | (11,062) | ||||||||||||||
| | | | | | | | | | | | | | | | | | | | | | |
Balance at December 31, 2015 | 99,701 | $ | 997 | 331,611 | 1,141,608 | (566,256) | (61,505) | 846,455 | |||||||||||||
| | | | | | | | | | | | | | | | | | | | | | |
| | | | | | | | | | | | | | | | | | | | | | |
| | | | | | | | | | | | | | | | | | | | | | |
See accompanying notes to consolidated financial statements.
WADDELL & REED FINANCIAL, INC.
CONSOLIDATED STATEMENTS OF CASH FLOWS
Years ended December 31, 2012, 20112015, 2014 and 2010
2013
| | 2012 | 2011 | 2010 | 2015 | 2014 | 2013 | ||||||||||||
|---|---|---|---|---|---|---|---|---|---|---|---|---|---|---|---|---|---|---|
| | (in thousands) | (in thousands) | ||||||||||||||||
Cash flows from operating activities: | ||||||||||||||||||
Net income | $ | 150,952 | 175,459 | 156,959 | $ | 245,536 | 313,331 | 252,998 | ||||||||||
Adjustments to reconcile net income to net cash provided by operating activities: | ||||||||||||||||||
Write-down of impaired assets | 42,373 | — | — | — | 7,900 | — | ||||||||||||
Depreciation and amortization | 15,093 | 16,332 | 13,834 | 16,050 | 14,754 | 13,681 | ||||||||||||
Amortization of deferred sales commissions | 53,863 | 53,855 | 58,381 | 43,074 | 64,380 | 57,931 | ||||||||||||
Share-based compensation | 49,993 | 46,473 | 40,338 | 47,518 | 54,144 | 53,179 | ||||||||||||
Excess tax benefits from share-based payment arrangements | (6,791) | (8,020) | (6,128) | (4,813) | (19,135) | (12,992) | ||||||||||||
Gain on sale of available for sale investment securities | (3,163) | (2,258) | (2,893) | |||||||||||||||
Investments (gain) loss, net | 12,412 | (7,496) | (18,257) | |||||||||||||||
Net purchases and sales or maturities of trading securities | (27,470) | 59,034 | (60,623) | (75,160) | (38,662) | (25,959) | ||||||||||||
Unrealized (gain) loss on trading securities | (5,470) | 1,231 | (5,101) | |||||||||||||||
Loss on sale and retirement of property and equipment | 5,326 | 2,059 | 201 | |||||||||||||||
Capital gains and dividends reinvested | — | — | (365) | |||||||||||||||
Deferred income taxes | (6,236) | 2,395 | (5,200) | (1,410) | 728 | (2,982) | ||||||||||||
Other | 680 | 1,774 | 493 | |||||||||||||||
Changes in assets and liabilities: | ||||||||||||||||||
Cash and cash equivalents - restricted | (42,812) | 30,628 | (8,256) | |||||||||||||||
Cash and cash equivalents—restricted | 9,715 | 44,824 | (28,439) | |||||||||||||||
Other receivables | (3,817) | (75,428) | (5,690) | |||||||||||||||
Payable to investment companies for securities and payable to customers | (5,964) | 17,283 | 24,818 | |||||||||||||||
Receivables from funds and separate accounts | (2,044) | (4,608) | 7,714 | 4,711 | (2,643) | (2,581) | ||||||||||||
Other receivables | (29,422) | (32,260) | 94,678 | |||||||||||||||
Other assets | 2,872 | (512) | (4,245) | (25,111) | (5,568) | (1,139) | ||||||||||||
Deferred sales commissions | (54,430) | (57,933) | (58,968) | (10,864) | (40,958) | (68,470) | ||||||||||||
Accounts payable and payable to investment companies | 65,753 | (2,002) | (88,946) | |||||||||||||||
Accounts payable and payable to third party brokers | (17,510) | 21,640 | 8,613 | |||||||||||||||
Other liabilities | 25,048 | 3,266 | 9,263 | (1,097) | (5,826) | 41,712 | ||||||||||||
| | | | | | | | | | | |||||||||
Net cash provided by operating activities | 233,435 | 283,139 | 140,643 | 233,950 | 345,042 | 286,916 | ||||||||||||
| | | | | | | | | | | |||||||||
Cash flows from investing activities: | ||||||||||||||||||
Purchases of available for sale investment securities | (51,676) | (102,451) | (76,961) | |||||||||||||||
Proceeds from sales and maturities of available for sale investment securities | 49,809 | 92,282 | 26,463 | |||||||||||||||
Purchases of available for sale and equity method securities | (27,388) | (166,302) | (241,644) | |||||||||||||||
Proceeds from sales and maturities of available for sale and equity method securities | 36,657 | 164,247 | 262,171 | |||||||||||||||
Additions to property and equipment | (15,300) | (20,078) | (17,313) | (29,610) | (35,606) | (16,905) | ||||||||||||
Proceeds from sales of property and equipment | 38 | 5 | 5 | |||||||||||||||
Net cash used in investing activities | (17,129) | (30,242) | (67,806) | |||||||||||||||
Disposition of companies | — | — | 22,000 | |||||||||||||||
Other | (2,254) | (1,447) | — | |||||||||||||||
| | | | | | | | | | | |||||||||
Net cash provided by (used in) investing activities | (22,595) | (39,108) | 25,622 | |||||||||||||||
| | | | | | | | | | | |||||||||
Cash flows from financing activities: | ||||||||||||||||||
Debt repayment | — | — | (10,000) | |||||||||||||||
Dividends paid | (171,267) | (68,766) | (65,194) | (143,959) | (115,263) | (96,018) | ||||||||||||
Repurchase of common stock | (48,688) | (65,463) | (65,872) | (80,335) | (131,030) | (72,132) | ||||||||||||
Exercise of stock options | 105 | 5,080 | 13,057 | — | — | 135 | ||||||||||||
Excess tax benefits from share-based payment arrangements | 6,791 | 8,020 | 6,128 | 4,813 | 19,135 | 12,992 | ||||||||||||
| | | | | | | | | | | |||||||||
Net cash used in financing activities | (213,059) | (121,129) | (121,881) | (219,481) | (227,158) | (155,023) | ||||||||||||
| | | | | | | | | | | |||||||||
Net increase (decrease) in cash and cash equivalents | 3,247 | 131,768 | (49,044) | (8,126) | 78,776 | 157,515 | ||||||||||||
Cash and cash equivalents at beginning of year | 327,083 | 195,315 | 244,359 | 566,621 | 487,845 | 330,330 | ||||||||||||
| | | | | | | | | | | |||||||||
Cash and cash equivalents at end of year | 330,330 | 327,083 | 195,315 | $ | 558,495 | 566,621 | 487,845 | |||||||||||
Less cash and cash equivalents of discontinued operations at end of year | 2,303 | 3,167 | 5,245 | |||||||||||||||
Cash and cash equivalents of continuing operations at end of year | $ | 328,027 | $ | 323,916 | $ | 190,070 | ||||||||||||
| | | | | | | | | | | |||||||||
| | | | | | | | ||||||||||||
| | | | | | | | | | | |||||||||
Cash paid for: | ||||||||||||||||||
Income taxes (net) | $ | 98,181 | 105,080 | 92,038 | $ | 152,262 | 165,189 | 124,196 | ||||||||||
Interest | $ | 10,286 | 10,426 | 10,920 | $ | 10,297 | 10,291 | 10,297 | ||||||||||
See accompanying notes to consolidated financial statements.
WADDELL & REED FINANCIAL, INC.
NOTES TO CONSOLIDATED FINANCIAL STATEMENTS
December 31, 2012, 20112015, 2014 and 20102013
1. Description of Business
Waddell & Reed Financial, Inc. and subsidiaries (hereinafter referred to as the "Company," "we," "our" and "us") derive revenues from investment management, investment product underwriting and distribution, and shareholder services administration provided to the Waddell & Reed Advisors Group of Mutual Funds (the "Advisors Funds"), Ivy Funds (the "Ivy Funds"), Ivy Funds Variable Insurance Portfolios (the "Ivy Funds VIP") and InvestEd Portfolios ("InvestEd") (collectively, the Advisors Funds, Ivy Funds, Ivy Funds VIP and InvestEd are referred to as the "Funds"), and institutional and separately managed accounts. The Funds and the institutional and separately managed accounts operate under various rules and regulations set forth by the United States Securities and Exchange Commission (the "SEC"). Services to the Funds are provided under investment management agreements, underwriting agreements and shareholder servicing and accounting service agreements that set forth the fees to be charged for these services. The majority of these agreements are subject to annual review and approval by each Fund's board of trustees and shareholders. Our revenues are largely dependent on the total value and composition of assets under management. Accordingly, fluctuations in financial markets and composition of assets under management can significantly impact revenues and results of operations.
2. Summary of Significant Accounting Policies
Basis of Presentation
The accompanying consolidated financial statements are prepared in accordance with accounting principles generally accepted in the United States of America ("GAAP") and include the accounts of the Company and its subsidiaries. All significant intercompany accounts and transactions have been eliminated in consolidation. Amounts in the accompanying financial statements and notes are rounded to the nearest thousand unless otherwise stated. Certain amounts in the prior years' financial statements have been reclassified for consistent presentation.
The Company operates in one business segment. Althoughsegment as the Company's management utilizes a consolidated approach to assess performance and allocate resources.
Consolidation
We provide seed capital to new investment products at the time we launch the products. These investment products include certain of the Advisors Funds and the Ivy Funds ("1940 Act Mutual Funds"), the IGI Funds, limited liability companies ("LLCs"), and an open-end mutual fund organized in Canada (the "Canadian Mutual Fund"). The primary purpose of providing seed capital is to generate an investment performance track record to attract third party investors. Our seed investment in a new product represents 100% ownership in that product when the product is launched.
Assessing if an entity is a variable interest entity ("VIE") or voting interest entity ("VOE") involves judgment and analysis on an entity by entity basis. Factors included in this assessment include the legal organization of the entity, the company's contractual involvement with the entity and any implications resulting from or associated with related parties' involvement with the entity.
Seeded investments in 1940 Act Mutual Funds and the Canadian Mutual Fund are organized under a series fund structure, whereby each open-ended mutual fund represents a separate share class of a legal entity organized under a statutory trust. The Company has determined that the 1940 Act Mutual Funds and the Canadian Mutual Fund are VOEs because the structure of the investment product is such that the voting rights held by the equity holders provide for equality among equity investors. To the extent material, these investment products would be consolidated if Company ownership, directly or indirectly, represents a majority interest.
The privately offered funds seeded by the Company does provide supplemental disclosure regarding assets under management and underwriting revenues and expenses by distribution channel,are structured as investment companies in the legal form of LLCs. The Company is the managing member of these LLCs. For the majority of these LLCs, the Company's determinationinvestment represents an ownership of less than 3%. Generally, limited partnerships and similar entities in which the general partner does not have substantive equity at risk and the other limited partners do not have substantive rights to remove the general partner would be considered VIEs. During the fourth quarter of 2015, the LLC agreements were amended so that it operates in one business segment is based onall of the fact thatmembers of the Company's Chief Executive Officer, who isprivately offered funds now hold substantive kick-out and participation rights. They also have the chief operating decision maker, reviews financial results, assesses performanceability to remove the managing member and allocates resources atto dissolve the consolidated level.
DuringLLC. Given the third quarter of 2012,substantive rights afforded the members, the Company committedhas concluded the LLCs are VOEs. These investment products would be consolidated, if material, if a majority interest is held, directly or indirectly, by the Company.
The Company has determined the SICAV to be a plan to sellVOE, as its Legend grouplegal structure and the powers of subsidiaries ("Legend")its equity investors prevent the SICAV from meeting the characteristics of being a VIE. To the extent
WADDELL & REED FINANCIAL, INC.
NOTES TO CONSOLIDATED FINANCIAL STATEMENTS (Continued)
December 31, 2015, 2014 and on October 29, 20122013
material, the Company signed a definitive agreementwould be required to executeconsolidate the transaction. The sale closed effective January 1, 2013. The operational resultsSICAV if ownership of Legend have been reclassified as discontinued operations in our consolidated financial statements for all periods presented. Unless otherwise stated, footnote references refer to continuing operations.the SICAV, directly or indirectly, represents more than 50% of the outstanding voting shares of the SICAV.
Use of Estimates
GAAP requires us to make estimates and assumptions that affect the reported amounts of assets, liabilities, revenues and expenses in the consolidated financial statements and accompanying notes, and related disclosures of commitments and contingencies. Estimates are used for, but are not limited to, depreciation and amortization, income taxes, valuation of assets, pension and postretirement obligations, and contingencies. Management evaluates its estimates and assumptions on an ongoing basis using historical experience and other factors, including the current economic environment. Actual results could differ from our estimates.
WADDELL & REED FINANCIAL, INC.
NOTES TO CONSOLIDATED FINANCIAL STATEMENTS (Continued)
December 31, 2012, 2011 and 2010
Cash and Cash Equivalents
Cash and cash equivalents include cash on hand and short-term investments. We consider all highly liquid investments with maturities upon acquisition of 90 days or less to be cash equivalents. Cash and cash equivalents – equivalents—restricted represents cash held for the benefit of customers and non-customers segregated in compliance with federal and other regulations.
Disclosures About Fair Value of Financial Instruments
Fair value of cash and cash equivalents, short-term investments, receivables and payables approximates carrying value. Fair value of long-term debt is disclosed in the indebtedness footnote.Note 7. Fair values for investment securities are based on quoted market prices, where available. Otherwise, fair values for investment securities are based on quoted market prices of comparable instruments.Level 2 or Level 3 inputs detailed in Note 3.
Investment Securities and Investments in Affiliated MutualSponsored Funds
Our investments are comprised of United States, state and government obligations, corporate debt securities and investments in affiliated mutualsponsored funds. InvestmentsSponsored funds, which include the Funds, the IGI Funds and the LLCs, are investments we have made for both general corporate investment purposes and to provide seed capital for new investment products. The Company has classified its investments in certain sponsored funds as either equity method investments (when the Company owns between 20% and 50% of the fund) or as available for sale investments (when the Company owns less than 20% of the fund) as described in Note 3. Investments held by our broker/dealer entities or certain investments that are anticipated to be purchased and sold on a more frequent basis are classified as trading.
Unrealized holding gains and losses on securities available for sale, net of related tax effects, are excluded from earnings until realized and are reported as a separate component of comprehensive income. For trading securities, unrealized holding gains and losses are included in earnings. Realized gains and losses are computed using the specific identification method for investment securities, other than mutualsponsored funds. For mutualsponsored funds, realized gains and losses are computed using the average cost method. Substantially all of the Company's equity method investees are investment companies which record their underlying investments at fair value. Therefore, under the equity method of accounting, our share of the investee's underlying net income or loss is predominantly representative of fair value adjustments in the investments held by the equity method investee. Our share of the investee's net income or loss is based on the most current information available and is recorded as a net gain or loss on investments within investment and other income (loss).
WADDELL & REED FINANCIAL, INC.
NOTES TO CONSOLIDATED FINANCIAL STATEMENTS (Continued)
December 31, 2015, 2014 and 2013
Our available for sale investments are reviewed each quarter and adjusted for other than temporary declines in value. We consider factors affecting the issuer and the industry in which the issuer operates, in, general market trends including interest rates, and our ability and intent to hold an investment until it has recovered. Consideration is given to the length of time an investment's market value has been below carrying value and prospects for recovery to carrying value. When a decline in the fair value of equity securities is determined to be other than temporary, the unrealized loss recorded net of tax in other comprehensive income is realized as a charge to net income, and a new cost basis is established for financial reporting purposes. When a decline in the fair value of debt securities is determined to be other than temporary, the amount of the impairment recognized in earnings depends on whether the Company intends to sell the security or more likely than not will be required to sell the security before recovery of its amortized cost basis less any current-period credit loss. If so, the other than temporary impairment recognized in earnings is equal to the entire difference between the investment's amortized cost basis and its fair value at the balance sheet date. If not, the portion of the impairment related to the credit loss is recognized in earnings while the portion of the impairment related to other factors is recognized in other comprehensive income, net of tax.
Property and Equipment
Property and equipment are carried at cost. The costs of improvements that extend the life of a fixed asset are capitalized, while the costs of repairs and maintenance are expensed as incurred. Depreciation and amortization are calculated and recorded using the straight-line method over the estimated useful life of the related asset (or lease term if shorter), generally three to 10 years for furniture and fixtures; one to 10 years for computer software; twoone to five years for data processing equipment; 10one to 3040 years for buildings; three to 26 years for other equipment; and up to 15 years for leasehold improvements, which is the lesser of the lease term or expected life.
WADDELL & REED FINANCIAL, INC.
NOTES TO CONSOLIDATED FINANCIAL STATEMENTS (Continued)
December 31, 2012, 2011 and 2010
Software Developed for Internal Use
Certain internal costs incurred in connection with developing or obtaining software for internal use are capitalized in accordance with ASC 350,"Intangibles – Intangibles—Goodwill and Other Topic,Topic." ASC 350. Internal costs capitalized are included in property and equipment, net in the consolidated balance sheets, and were $9.6$13.9 million and $12.5$13.5 million as of December 31, 20122015 and 2011,2014, respectively. Amortization begins when the software project is complete and ready for its intended use and continues over the estimated useful life, generally one to 10 years.
Goodwill and Identifiable Intangible Assets
Goodwill represents the excess of the cost of the Company's investment in the net assets of acquired companies over the fair value of the underlying identifiable net assets at the dates of acquisition. Goodwill is not amortized, but is reviewed annually for impairment in the second quarter of each year and when events or circumstances occur that indicate that goodwill might be impaired. Factors that the Company considers important in determining whether an impairment of goodwill or intangible assets might exist include significant continued underperformance compared to peers, the likelihood of termination or non-renewal of a mutual fund advisory or subadvisory contract or substantial changes in revenues earned from such contracts, significant changes in our business and products, material and ongoing negative industry or economic trends, or other factors specific to each asset being evaluated.
During the period covered by these financial statements, the Company had two reporting units for goodwill: (i) investment managementTable of Contents
WADDELL & REED FINANCIAL, INC.
NOTES TO CONSOLIDATED FINANCIAL STATEMENTS (Continued)
December 31, 2015, 2014 and related services and (ii) Legend. The investment management and related services reporting unit's goodwill was recorded as part of the spin-off of the Company from its former parent, and to a lesser extent, was recorded as part of subsequent business combinations that were merged into existing investment management operations. Legend, our second reporting unit for goodwill, was a stand-alone investment management subsidiary and goodwill associated with Legend could be assessed separately from other investment management operations. During the third quarter of 2012, the Company committed to a plan to sell Legend. Additional information is included below in Notes 6 and 7.2013
To determine the fair valuesvalue of the Company's reporting units,unit, our review process uses the market and income approaches. In performing the analyses, the Company uses the best information available under the circumstances, including reasonable and supportable assumptions and projections.
The market approach employs market multiples for comparable publicly-traded companies in the financial services industry. Estimates of fair values of the reporting units are established using multiples of earnings before interest, taxes, depreciation and amortization ("EBITDA"). The Company believes that fair values calculated based on multiples of EBITDA are an accurate estimation of fair value.
If the fair value coverage margin calculated under the market approach is not considered significant, the Company utilizes a second approach, the income approach, to estimate fair values and averages the results under both methodologies. The income approach employs a discounted free cash flow approach that takes into account current actual results, projected future results, and the Company's estimated weighted average cost of capital.
The Company compares the fair values of the reporting unitsunit to theirits carrying amounts,amount, including goodwill. If the carrying amount of the reporting unit exceeds its impliedcalculated fair value, goodwill is considered impaired and a second step is performed to measure the amount of impairment loss, if any.
WADDELL & REED FINANCIAL, INC.
NOTES TO CONSOLIDATED FINANCIAL STATEMENTS (Continued)
December 31, 2012, 2011 and 2010
Indefinite-lifeIndefinite-lived intangible assets represent advisory and subadvisory management contracts for managed assets obtained in acquisitions. The Company considers these contracts to be indefinite-lifeindefinite-lived intangible assets as they are expected to be renewed without significant cost or modification of terms. The Company also tests these assets for impairment annually by comparing theirand when events or circumstances occur that indicate that the indefinite-lived intangible asset might be impaired. If the carrying value of a management contract acquired exceeds its fair valuesvalue, an impairment loss is recognized equal to that excess. Additional information related to the carrying amount of the assets.indefinite-lived intangible assets is included in Note 6.
Deferred Sales Commissions
We defer certain costs, principally sales commissions and related compensation, which are paid to financial advisors and broker/dealers in connection with the sale of certain mutual fund shares sold without a front-end load sales charge. The costs incurred at the time of the sale of Class B shares sold prior to January 1, 2014 are amortized on a straight-line basis over five years, which approximates the expected life of the shareholders' investments. Effective January 1, 2014, the Company suspended sales of Class B shares. The costs incurred at the time of the sale of Class C shares are amortized on a straight-line basis over 12 months. In addition,Prior to June 16, 2014, the costs incurred at the time of the sale of shares for certain fee-based asset allocation products arewere deferred and amortized on a straight-line basis, not to exceed three years. We recover these deferred costssales commissions and related compensation through Rule 12b-1 and other distribution fees, which are paid on the Class B and Class C shares of the Advisors Funds and Ivy Funds, along with contingent deferred sales charges ("CDSCs") paid by shareholders who redeem their shares prior to completion of the specified holding period (three years for shares of certain fee-based asset allocation products sold prior to June 16, 2014, six years for a Class B share and 12 months for a Class C share), as well as through client fees paid on the asset allocation products.products sold prior to June 16, 2014. Effective June 16, 2014 we no longer assess a CDSC to investors upon early redemption of fee-based asset allocation products and amounts deferred for sales commissions and related compensation are classified in the prepaid and other current asset and other non-current assets in our consolidated balance sheet. Should we lose our ability to recover suchdeferred sales commissions through distribution fees or CDSCs, the value of these assets would immediately decline, as would future cash flows. We periodically review the recoverability of the deferred sales commission assets as events or changes in circumstances indicate that
WADDELL & REED FINANCIAL, INC.
NOTES TO CONSOLIDATED FINANCIAL STATEMENTS (Continued)
December 31, 2015, 2014 and 2013
their carrying amount may not be recoverable and adjust them accordingly. Impairment adjustments are recognized in operating income as a component of amortization of deferred sales commissions.
Revenue Recognition
Investment Management and Advisory Fees
We recognize investment management fees as earned over the period in which services are rendered. We charge the Funds daily based upon average daily net assets under management in accordance with investment management agreements between the Funds and the Company. The majority of investment managementand/or advisory fees earned from the IGI Funds and from institutional and separate accounts are charged either monthly or quarterly based upon an average of net assets under management in accordance with such investment management agreements. The Company may waive certain fees for investment management services at its discretion, or in accordance with contractual expense limitations, and these waivers are reflected as a reduction to investment management fees on the consolidated statements of income.
Our investment advisory business receives research products and services from broker/dealers through "soft dollar" arrangements. Consistent with the "soft dollar" safe harbor established by Section 28(e) of the Securities Exchange Act of 1934, as amended, the investment advisory business does not have any contractual obligation requiring it to pay for research products and services obtained through soft dollar arrangements with brokers. As a result, we present "soft dollar" arrangements on a net basis.
The Company has contractual arrangements with third parties to provide subadvisory services. Investment advisory fees are recorded gross of any subadvisory payments and are included in investment management fees based on management's determination that the Company is acting in the capacity of principal service provider with respect to its relationship with the Funds. Any corresponding fees paid to subadvisors are included in operating expenses.
Distribution, Underwriter and Shareholder Service Fees
Underwriting and distribution commission revenues resulting from the sale of investment products are recognized on the trade date. When a client purchases Class A or Class E shares (front-end load), the client pays an initial sales charge of up to 5.75% of the amount invested. The sales charge for Class A or Class E shares typically declines as the investment amount increases. In addition, investors may combine their purchases of all fund shares to qualify for a reduced sales charge. When a client invests in a fee-based asset allocation product, Class A shares are purchased at net asset value, and we do not charge an initial sales charge.
Under a Rule 12b-1 service plan, the Funds may charge a maximum fee of 0.25% of the average daily net assets under management for Class B, C, E and Ivy Funds Y shares for expenses paid to broker/dealers and other sales professionals in connection with providing ongoing services to the Funds' shareholders and/or maintaining the Funds' shareholder accounts, with the exception of the Funds' Class R shares, for which the maximum fee is 0.50% and for the Class I, R6 and Advisors Funds Y shares, which do not charge a service fee. The Funds' Class B and Class C shares may charge a maximum of 0.75% of the average daily net assets under management under a Rule 12b-1 distribution plan to broker/dealers and other sales professionals for their services in connection with distributing shares of that class. The Funds' Class A shares may charge a maximum fee of 0.25% of the average daily net assets under management under a Rule 12b-1 service and distribution plan for expenses detailed previously. The Rule 12b-1 plans are subject to annual approval by the Funds' board of trustees, including a majority of the disinterested members, by
WADDELL & REED FINANCIAL, INC.
NOTES TO CONSOLIDATED FINANCIAL STATEMENTS (Continued)
December 31, 2015, 2014 and 2013
votes cast in person at a meeting called for the purpose of voting on such approval. All Funds may terminate the service and distribution plans at any time with approval of fund trustees or portfolio shareholders (a majority of either) without penalty.
Fee-based asset allocation revenues are charged quarterly based upon average daily net assets under management. We also recognize distribution revenues monthly forFor certain types of investment products, primarily variable annuity products thatannuities, distribution revenues are generally calculated based upon average daily net assets under management.management and are recognized monthly. Fees collected from advisors for services related to technology and errors and omissions insurance are recorded in underwriting and distribution fees on a gross basis, as the Company is the primary obligor in these arrangements.
Shareholder service fees are recognized monthly and are calculated based on the number of accounts or assets under management as applicable. Other administrative service fee revenues are recognized when contractual obligations are fulfilled or as services are provided.
Advertising and Promotion
We expense all advertising and promotion costs as incurred.the advertising or event takes place. Advertising expense was $9.9$15.7 million, $10.0$15.7 million and $5.4$13.3 million for the years ended December 31, 2012, 20112015, 2014 and 2010,2013, respectively, and is
WADDELL & REED FINANCIAL, INC.
NOTES TO CONSOLIDATED FINANCIAL STATEMENTS (Continued)
December 31, 2012, 2011 and 2010
classified in both underwriting and distribution expense and general and administrative expense in the consolidated statements of income.
Leases
The Company leases office space under various leasing arrangements. Most lease agreements contain renewal options, rent escalation clauses and/or other inducements provided by the landlord. As leases expire, they are typically renewed or replaced in the ordinary course of business. Rent expense is recorded on a straight-line basis, including escalations and inducements, over the term of the lease.
Share-Based Compensation
We account for share-based compensation expense using the fair value method. Under the fair value method, share-based compensation expense reflects the fair value of share-based awards measured at grant date, is recognized over the service period, and is adjusted each period for anticipated forfeitures. The Company also issues share-based awards to our financial advisors (our sales force) who are independent contractors.contractors and to our Board of Directors. Changes in the Company's share price result in variable compensation expense over the vesting period. The fair value of options granted are calculated using a Black-Scholes option-pricing model. The Black-Scholes model incorporates assumptions as to dividend yield, risk-free interest rate, expected volatility and expected life of the option.
Accounting for Income Taxes
Income tax expense is based on pre-tax financial accounting income, including adjustments made for the recognition or derecognition related to uncertain tax positions. The recognition or derecognition of income tax expense related to uncertain tax positions is determined under the guidance as prescribed by ASC 740,"Income Taxes Topic, Topic." ASC 740. Deferred tax assets and liabilities are recognized for the future tax attributable to differences between the financial statement carrying amounts of existing assets and liabilities and their respective tax basis. A valuation allowance is recognized for deferred tax assets if, based on available evidence, it is more likely than not that all or some portion of the asset will not be realized. Deferred tax assets and liabilities are measured using enacted tax rates expected to be recovered or settled. The effect on deferred tax assets and liabilities of a change in tax rates is recognized in earnings in the period that includes the enactment date.
3. Accounting Pronouncements Not Yet Adopted
In July 2011, the Financial Accounting Standards Board ("FASB") issued Accounting Standards Update ("ASU") 2011-06, "Other Topics (Topic 720): Fees Paid to the Federal Government by Health Insurers"("ASU 2011-06"). This ASU was issued to address questions about how health insurers should recognize and classify in their income statements fees mandated by the Patient Protection and Affordable Care Act as amended by the Health Care and Education Reconciliation Act (the "Acts"). The Acts impose an annual fee on health insurers for each calendar year beginning on or after January 1, 2014. A health insurer's portion of the annual fee is payable no later than September 30 of the applicable calendar year and is not tax deductible. The ASU specifies that the liability for the fee should be estimated and recorded in full once the entity provides qualifying health insurance in the applicable calendar year in which the fee is payable with a corresponding deferred cost that is amortized to expense using a straight-line method of allocation unless another method better allocates the fee over the calendar year that it is payable. ASU 2011-06 is effective for calendar years beginning after December 31, 2013. The Company is evaluating the impact the adoption of ASU 2011-06 in 2014 will have on its consolidated financial statements.
In July 2012, the FASB issued ASU 2012-02,"Intangibles – Goodwill and Other (Topic 350): Testing Indefinite-Lived Intangible Assets for Impairment" ("ASU 2012-02"). This ASU permits an entity to make a qualitative assessment of whether it is more likely than not that an indefinite-lived intangible asset is impaired as a basis for determining whether it is necessary to perform the quantitative impairment test in accordance with Subtopic 350-30, "Intangibles—Goodwill and Other—General Intangibles Other than Goodwill." ASU 2012-02 is effective for annual and interim impairment tests performed for fiscal years beginning after September 15, 2012. The Company will comply with this standard upon adoption in 2013.
WADDELL & REED FINANCIAL, INC.
NOTES TO CONSOLIDATED FINANCIAL STATEMENTS (Continued)
December 31, 2012, 20112015, 2014 and 20102013
4.2. New Accounting Guidance
Accounting Guidance Adopted During Fiscal Year 2015
During the fourth quarter of 2015, the Company adopted ASU 2015-07,"Fair Value Measurement," which eliminates the requirement to categorize investments in the fair value hierarchy if their fair value is measured at net asset value ("NAV") per share (or its equivalent) using the practical expedient. Previously, the Company reported $3.8 million of sponsored privately offered funds in the fair value hierarchy for the period ended December 31, 2014. After implementation of ASU 2015-07, the $3.8 million of sponsored privately offered funds have been removed from the fair value hierarchy for the period ended December 31, 2014 to be consistent with the presentation of the fair value hierarchy as of December 31, 2015.
During the fourth quarter of 2015, the Company adopted ASU 2015-17,"Income Taxes," which requires an entity to classify all deferred tax assets and liabilities as noncurrent on the balance sheet. Prior to implementation of this ASU, the Company classified deferred tax assets and liabilities as either current or non-current assets and liabilities. Previously, the Company reported $7.5 million of deferred tax assets as current assets and $20.0 million of deferred tax assets as non-current on the balance sheet for the period ended December 31, 2014. After implementation of ASU 2015-17, the current deferred tax assets have been reclassified to non-current deferred tax assets, so that non-current deferred tax assets are presented as $27.5 million on the balance sheet as of December 31, 2014, to be consistent with the presentation of December 31, 2015 balances.
New Accounting Guidance Not Yet Adopted
In May 2014, the Financial Accounting Standards Board ("FASB") issued ASU 2014-09, "Revenue from Contracts with Customers." ASU 2014-09 requires an entity to recognize the amount of revenue to which it expects to be entitled for the transfer of promised goods or services to customers. This standard also specifies the accounting for certain costs to obtain or fulfill a contract with a customer. This ASU will supersede much of the existing revenue recognition guidance in accounting principles generally accepted in the United States and is effective for annual reporting periods beginning after December 15, 2017, including interim periods within that reporting period; early application is permitted for the first interim period within annual reporting periods beginning after December 15, 2016. ASU 2014-09 permits the use of either the retrospective or cumulative effect transition method. The Company is evaluating which transition method to apply and the estimated impact the adoption of this ASU will have on our consolidated financial statements and related disclosures.
In February 2015, the FASB issued ASU 2015-02, "Amendments to the Consolidation Analysis." The amendments in this ASU will affect all companies that are required to evaluate whether they should consolidate another entity. Additionally, the amendments in this ASU rescind the indefinite deferral of FASB Statement 167, "Amendments to FASB Interpretation No. 46(r)" included in ASU 2010-10. ASU 2015-02 will be effective for annual reporting periods beginning after December 15, 2015, including interim periods within that reporting period. This standard permits the use of either a full retrospective or a modified retrospective approach. The Company believes that the adoption of this ASU on January 1, 2016, will result in an immaterial impact to our consolidated financial statements and related disclosures regarding our seeded investments in the 1940 Act Funds, Canadian Mutual Fund and LLCs. The Company has concluded that the SICAV will be deemed a VIE due to the lack of equity investment at risk at the SICAV legal entity level. The sub-funds of the SICAV are deemed silos and evaluated individually for
WADDELL & REED FINANCIAL, INC.
NOTES TO CONSOLIDATED FINANCIAL STATEMENTS (Continued)
December 31, 2015, 2014 and 2013
consolidation. Because the decisions regarding key activities of the sub-fund reside at the SICAV level, the shareholders of the sub-funds lack the ability to control the key decision-making processes that most directly affect the performance of the sub-funds. As such, each sub-fund is a VIE with the primary beneficiary evaluation being an analysis of economic interest. The Company will be the primary beneficiary and will consolidate any sub-fund of the SICAV in which it owns a majority interest.
In April 2015, the FASB issued ASU 2015-03, "Simplifying the Presentation of Debt Issuance Costs." This ASU requires that debt issuance costs related to a recognized debt liability be presented in the balance sheet as a direct deduction from the carrying amount of that debt liability, consistent with debt discounts. The recognition and measurement guidance for debt issuance costs is not affected by the amendments in this ASU. ASU 2015-03 is effective for annual reporting periods beginning after December 15, 2015, including interim periods within that reporting period; early adoption is permitted. The Company believes that the adoption of this ASU in 2016 will result in an immaterial impact to our consolidated financial statements.
3. Investment Securities
Investment securities at December 31, 20122015 and 20112014 are as follows:
2012 | Amortized cost | Unrealized gains | Unrealized losses | Fair value | ||||||||
|---|---|---|---|---|---|---|---|---|---|---|---|---|
| | (in thousands) | |||||||||||
Available for sale securities: | ||||||||||||
Mortgage-backed securities | $ | 9 | 1 | - | 10 | |||||||
Corporate bonds | 30,408 | 248 | (3) | 30,653 | ||||||||
Affiliated mutual funds | 73,443 | 3,749 | (1,090) | 76,102 | ||||||||
| $ | 103,860 | 3,998 | (1,093) | 106,765 | ||||||||
Trading securities: | ||||||||||||
Mortgage-backed securities | 44 | |||||||||||
Municipal bonds | 501 | |||||||||||
Corporate bonds | 12,112 | |||||||||||
Common stock | 37 | |||||||||||
Affiliated mutual funds | 56,683 | |||||||||||
| 69,377 | ||||||||||||
Total investment securities | 176,142 | |||||||||||
2011 | Amortized cost | Unrealized gains | Unrealized losses | Fair value | ||||||||
|---|---|---|---|---|---|---|---|---|---|---|---|---|
| | (in thousands) | |||||||||||
Available for sale securities: | ||||||||||||
Mortgage-backed securities | $ | 9 | 2 | - | 11 | |||||||
Municipal bonds | 2,549 | - | (13) | 2,536 | ||||||||
Corporate bonds | 45,893 | 170 | (89) | 45,974 | ||||||||
Affiliated mutual funds | 51,456 | 2,738 | (5,379) | 48,815 | ||||||||
| $ | 99,907 | 2,910 | (5,481) | 97,336 | ||||||||
Trading securities: | ||||||||||||
Mortgage-backed securities | 63 | |||||||||||
Municipal bonds | 500 | |||||||||||
Corporate bonds | 17,319 | |||||||||||
Common stock | 37 | |||||||||||
Affiliated mutual funds | 19,007 | |||||||||||
| 36,926 | ||||||||||||
Total investment securities | 134,262 | |||||||||||
2015 | | ||
|---|---|---|---|
Available for sale securities: | |||
Sponsored funds | $ | 40,552 | |
Sponsored privately offered funds | 825 | ||
| | | | |
Total available for sale securities | 41,377 | ||
Trading securities: | |||
Mortgage-backed securities | 20 | ||
Corporate bond | 5 | ||
Common stock | 87 | ||
Sponsored funds | 29,701 | ||
| | | | |
Total trading securities | 29,813 | ||
Equity method securities: | |||
Sponsored funds | 217,380 | ||
Sponsored privately offered funds | 3,173 | ||
| | | | |
Total equity method securities | 220,553 | ||
| | | | |
Total securities | $ | 291,743 | |
| | | | |
| | | | |
| | | | |
WADDELL & REED FINANCIAL, INC.
NOTES TO CONSOLIDATED FINANCIAL STATEMENTS (Continued)
December 31, 2012, 20112015, 2014 and 20102013
AThe following is a summary of the gross unrealized gains (losses) related to securities classified as available for sale debt securities and affiliated mutual funds with fair values below carrying values at December 31, 2012 is as follows:2015:
| | Less than 12 months | 12 months or longer | Total | |||||||||||||||
|---|---|---|---|---|---|---|---|---|---|---|---|---|---|---|---|---|---|---|
| | Fair value | Unrealized losses | Fair value | Unrealized losses | Fair value | Unrealized losses | ||||||||||||
| | (in thousands) | |||||||||||||||||
Corporate bonds | $ | 997 | (3) | - | - | 997 | (3) | |||||||||||
Affiliated mutual funds | 23,478 | (469) | 5,604 | (621) | 29,082 | (1,090) | ||||||||||||
Total temporarily impaired securities | $ | 24,475 | (472) | 5,604 | (621) | 30,079 | (1,093) | |||||||||||
Available for sale securities: | Amortized cost | Unrealized gains | Unrealized losses | Fair value | ||||||||
|---|---|---|---|---|---|---|---|---|---|---|---|---|
| | (in thousands) | |||||||||||
Sponsored funds | $ | 46,800 | 434 | (6,682) | 40,552 | |||||||
Sponsored privately offered funds | 500 | 325 | — | 825 | ||||||||
| | | | | | | | | | | | | |
| $ | 47,300 | 759 | (6,682) | 41,377 | ||||||||
| | | | | | | | | | | | | |
| | | | | | | | | | | | | |
| | | | | | | | | | | | | |
Based upon our assessment
2014 | | ||
|---|---|---|---|
Available for sale securities: | |||
Sponsored funds | $ | 157,460 | |
Sponsored privately offered funds | 3,810 | ||
| | | | |
Total available for sale securities | 161,270 | ||
| | | | |
Trading securities: | |||
Mortgage-backed securities | 28 | ||
Common stock | 72 | ||
Sponsored funds | 81,913 | ||
| | | | |
Total trading securities | 82,013 | ||
| | | | |
Total securities | $ | 243,283 | |
| | | | |
| | | | |
| | | | |
The following is a summary of these corporate bonds and affiliated mutual funds, the time frame investments have been in a loss position, our intentgross unrealized gains (losses) related to hold affiliated mutual funds until they have recovered and our history of holding bonds until maturity, we determined that a write-down was not necessary at December 31, 2012.
Mortgage-backed securities and corporate bonds accounted forclassified as available for sale at December 31, 2014:
Available for sale securities: | Amortized cost | Unrealized gains | Unrealized losses | Fair value | ||||||||
|---|---|---|---|---|---|---|---|---|---|---|---|---|
Sponsored funds | $ | 160,675 | 2,177 | (5,392) | 157,460 | |||||||
Sponsored privately offered funds | 1,750 | 2,060 | — | 3,810 | ||||||||
| | | | | | | | | | | | | |
| $ | 162,425 | 4,237 | (5,392) | 161,270 | ||||||||
| | | | | | | | | | | | | |
| | | | | | | | | | | | | |
| | | | | | | | | | | | | |
Sponsored Funds
The Company has classified its investments in certain sponsored funds as either equity method investments (when the Company owns between 20% and held50% of the fund) or as available for sale investments (when the Company owns less than 20% of the fund). We did not hold a majority interest in any of our sponsored funds as of December 31, 2012 mature2015 and 2014. As a result, there are no sponsored funds consolidated in our financial statements.
During 2015, $160.2 million of investments previously classified as follows:
| | Amortized cost | Fair value | ||||
|---|---|---|---|---|---|---|
| | (in thousands) | |||||
Within one year | $ | 15,488 | 15,529 | |||
After one year but within 10 years | 14,929 | 15,134 | ||||
| $ | 30,417 | 30,663 | ||||
Mortgage-backed securities, municipal bonds and corporate bonds accounted for as trading and held as of December 31, 2012 mature as follows:
| | Fair value | | ||||
|---|---|---|---|---|---|---|
| | (in thousands) | |||||
Within one year | $ | 2,531 | ||||
After one year but within 10 years | 10,126 | |||||
| $ | 12,657 | |||||
Investment securities with fair values of $79.9 million, $55.7 million and $45.1 million were sold during 2012, 2011 and 2010, respectively. During 2012, net realized gains of $3.2 million and $5.3 million were recognized from the sale of $32.9 million in available for sale securities were classified as equity method securities, representing seed investments in which the Company owned between 20% and 50% of the salefund. As a result, during the third quarter of $47.02015, $2.1 million in trading securities, respectively. During 2011, net realized gains of $2.3 million and $1.4 million were recognized from the sale of $22.1 million in available for sale securities and the sale of $33.6 million in trading securities, respectively. During 2010, net gains of $2.9 million and $2.9 million were recognizedunrealized
WADDELL & REED FINANCIAL, INC.
NOTES TO CONSOLIDATED FINANCIAL STATEMENTS (Continued)
December 31, 2012, 20112015, 2014 and 20102013
losses were reclassified from other comprehensive income and recognized in the consolidated statement of income.
Sponsored privately offered funds
The Company holds voting interests in certain sponsored privately offered funds that are structured as investment companies in the legal form of LLCs. The Company held investments in these funds totaling $4.0 million and $3.8 million as of December 31, 2015 and December 31, 2014, respectively, which is our maximum loss exposure.
A summary of available for sale sponsored funds with fair values below carrying values at December 31, 2015 is as follows:
| | Less than 12 months | 12 months or longer | Total | |||||||||||||||
|---|---|---|---|---|---|---|---|---|---|---|---|---|---|---|---|---|---|---|
| | Fair value | Unrealized losses | Fair value | Unrealized losses | Fair value | Unrealized losses | ||||||||||||
| | (in thousands) | |||||||||||||||||
Sponsored funds | $ | 3,476 | (166) | 33,619 | (6,516) | 37,095 | (6,682) | |||||||||||
| | | | | | | | | | | | | | | | | | | |
| | | | | | | | | | | | | | | | | | | |
| | | | | | | | | | | | | | | | | | | |
Based upon our assessment of these sponsored funds, the time frame the sponsored funds have been in a loss position and our intent to hold the sponsored funds until they have recovered, we determined that a write-down of fair value was not necessary at December 31, 2015.
The corporate bond accounted for as trading matures in 2018. Mortgage-backed securities accounted for as trading and held as of December 31, 2015 mature in 2022.
Investment securities with fair values of $102.2 million, $301.0 million and $442.0 million were sold during 2015, 2014 and 2013, respectively. During 2015, net realized gains of $3.0 million and $0.6 million were recognized from the sale of $24.2$31.6 million in available for sale securities and the sale of $20.9$65.9 million in trading securities, respectively.
The aggregate carrying amountrespectively, and net realized losses of our$0.5 million were recognized from the sale of $5.3 million in equity method investments, classified in other assets, was $4.6securities. During 2014, net realized gains of $5.1 million and $5.6$4.1 million at December 31, 2012were recognized from the sale of $149.8 million in available for sale securities and 2011,the sale of $151.2 million in trading securities, respectively. At December 31, 2012, our investments consistDuring 2013, net realized gains of limited partnership interests$14.4 million and $7.7 million were recognized from the sale of $247.0 million in venture capital funds.available for sale securities and the sale of $195.0 million in trading securities, respectively.
Accounting standards establish a framework for measuring fair value and a three-level hierarchy for fair value measurements based upon the transparency of inputs to the valuation of the asset. Inputs may be observable or unobservable and refer broadly to the assumptions that market participants would use in pricing the asset. An individual investment's fair value measurement is assigned a level based upon the observability of the inputs that are significant to the overall valuation. The three-tierthree-level hierarchy of inputs is summarized as follows:
WADDELL & REED FINANCIAL, INC.
NOTES TO CONSOLIDATED FINANCIAL STATEMENTS (Continued)
December 31, 2015, 2014 and 2013
Assets classified as Level 2 can have a variety of observable inputs. These observable inputs are collected and utilized, primarily by an independent pricing service, in different evaluated pricing approaches depending upon the specific asset to determine a value. The fair value of municipal bonds is measured based on pricing models that take into account, among other factors, information received from market makers and broker/dealers, current trades, bid-wants lists, offerings, market movements, the callability of the bond, state of issuance and benchmark yield curves. The fair value of corporate bonds is measured using various techniques, which consider recently executed transactions in securities of the issuer or comparable issuers, market price quotations (where observable), bond spreads and fundamental data relating to the issuer. The fair value of equity derivatives is measured based on active market broker quotes, evaluated broker quotes and evaluated prices from vendors.
Securities' values classified as Level 3 are primarily determined through the use of a single quote (or multiple quotes) from dealers in the securities using proprietary valuation models. These quotes involve significant unobservable inputs, and thus, the related securities are classified as Level 3 securities.
The following tables summarize our investment securities as of December 31, 20122015 and 20112014 that are recognized in our consolidated balance sheets using fair value measurements based on the differing levels of inputs. There were no transfers between levels for the years ended December 31, 20122015 or 2011.2014.
| 2012 | Level 1 | Level 2 | Level 3 | Total | ||||||||||||||||||||
|---|---|---|---|---|---|---|---|---|---|---|---|---|---|---|---|---|---|---|---|---|---|---|---|---|
| 2015 | Level 1 | Level 2 | Level 3 | Total | ||||||||||||||||||||
| | (in thousands) | (in thousands) | ||||||||||||||||||||||
Available for sale securities: | ||||||||||||||||||||||||
Sponsored funds | $ | 40,552 | — | — | 40,552 | |||||||||||||||||||
Sponsored privately offered funds measured at net asset value (2) | — | — | — | 825 | ||||||||||||||||||||
Trading securities: | ||||||||||||||||||||||||
Mortgage-backed securities | $ | - | 54 | - | 54 | — | 20 | — | 20 | |||||||||||||||
Municipal bonds | - | 501 | - | 501 | ||||||||||||||||||||
Corporate bonds | - | 42,765 | - | 42,765 | — | 5 | — | 5 | ||||||||||||||||
Common stock | 37 | - | - | 37 | 87 | — | — | 87 | ||||||||||||||||
Affiliated mutual funds | 132,785 | - | - | 132,785 | ||||||||||||||||||||
Sponsored funds | 29,701 | — | — | 29,701 | ||||||||||||||||||||
Equity method securities: (1) | ||||||||||||||||||||||||
Sponsored funds | 217,380 | — | — | 217,380 | ||||||||||||||||||||
Sponsored privately offered funds measured at net asset value (2) | — | — | — | 3,173 | ||||||||||||||||||||
| | | | | | | | | | | | | | ||||||||||||
Total | $ | 132,822 | $ | 43,320 | $ | - | $ | 176,142 | $ | 287,720 | 25 | — | 291,743 | |||||||||||
| | | | | | | | | | | | | | ||||||||||||
| | | | | | | | | | ||||||||||||||||
| | | | | | | | | | | | | | ||||||||||||
WADDELL & REED FINANCIAL, INC.
NOTES TO CONSOLIDATED FINANCIAL STATEMENTS (Continued)
December 31, 2012, 20112015, 2014 and 20102013
| 2014 | Level 1 | Level 2 | Level 3 | Total | ||||||||
|---|---|---|---|---|---|---|---|---|---|---|---|---|
| | (in thousands) | |||||||||||
Available for sale securities: | ||||||||||||
Sponsored funds | $ | 157,460 | — | — | 157,460 | |||||||
Sponsored privately offered funds measured at net asset value (2) | — | — | — | 3,810 | ||||||||
Trading securities: | ||||||||||||
Mortgage-backed securities | — | 28 | — | 28 | ||||||||
Common stock | 72 | — | — | 72 | ||||||||
Sponsored funds | 81,913 | — | — | 81,913 | ||||||||
| | | | | | | | | | | | | |
Total | $ | 239,445 | 28 | — | 243,283 | |||||||
| | | | | | | | | | | | | |
| | | | | | | | | | | | | |
| | | | | | | | | | | | | |
| 2011 | Level 1 | Level 2 | Level 3 | Total | ||||||||
|---|---|---|---|---|---|---|---|---|---|---|---|---|
| | (in thousands) | |||||||||||
Mortgage-backed securities | - | 74 | - | 74 | ||||||||
Municipal bonds | - | 3,036 | - | 3,036 | ||||||||
Corporate bonds | - | 63,293 | - | 63,293 | ||||||||
Common stock | 37 | - | - | 37 | ||||||||
Affiliated mutual funds | 67,822 | - | - | 67,822 | ||||||||
Total | $ | 67,859 | $ | 66,403 | $ | - | $ | 134,262 | ||||
5.4. Property and Equipment
A summary of property and equipment at December 31, 20122015 and 20112014 is as follows:
| | 2012 | 2011 | Estimated useful lives | 2015 | 2014 | Estimated useful lives | ||||||||||||
|---|---|---|---|---|---|---|---|---|---|---|---|---|---|---|---|---|---|---|
| | (in thousands) | | (in thousands) | | ||||||||||||||
Leasehold improvements | $ | 19,610 | 19,345 | 1 - 15 years | $ | 21,741 | 21,039 | 1 - 15 years | ||||||||||
Furniture and fixtures | 30,670 | 30,590 | 3 - 10 years | 29,462 | 29,462 | 3 - 10 years | ||||||||||||
Equipment | 19,660 | 18,482 | 3 - 26 years | 20,901 | 20,829 | 3 - 26 years | ||||||||||||
Computer software | 74,081 | 72,184 | 1 - 10 years | 96,310 | 74,506 | 1 - 10 years | ||||||||||||
Data processing equipment | 20,207 | 19,692 | 2 - 5 years | 20,335 | 23,684 | 1 - 5 years | ||||||||||||
Buildings | 5,284 | 3,765 | 10 - 30 years | 12,860 | 11,905 | 1 - 40 years | ||||||||||||
Land | 1,940 | 1,940 | 3,804 | 3,804 | ||||||||||||||
| | | | | | | | | | ||||||||||
Property and equipment, at cost | 171,452 | 165,998 | 205,413 | 185,229 | ||||||||||||||
Accumulated depreciation | (102,124) | (92,855) | (99,979) | (92,925) | ||||||||||||||
| | | | | | | | | | ||||||||||
Property and equipment, net | $ | 69,328 | 73,143 | $ | 105,434 | 92,304 | ||||||||||||
| | | | | | | | | | ||||||||||
| | | | | | | | ||||||||||||
| | | | | | | | | | ||||||||||
Depreciation expense was $13.2$16.0 million, $14.8$14.6 million and $13.5$12.8 million during the years ended December 31, 2012, 20112015, 2014 and 2010,2013, respectively.
At December 31, 2012, we had property and equipment under capital leases with a cost of $1.9 million and accumulated depreciation of $0.8 million. At December 31, 2011, we had property and equipment under capital leases with a cost of $1.8 million and accumulated depreciation of $1.0 million.
6. Discontinued Operations
During the third quarter of 2012, the Company committed to a plan to sell Legend. On October 29, 2012, the Company signed a definitive agreement with First Allied Holdings Inc. to sell all of the common interests of Legend Group Holdings, LLC and the sale closed effective January 1, 2013. Based on the value of the consideration the Company expected to receive upon closing, which is less than the carrying value of net assets to be sold, the Company recorded a non-cash impairment charge of $42.4 million, which is reflected in income (loss) from discontinued operations on the statement of income. The consideration received was subject to working capital and regulatory capital adjustments through the closing date. The Company retained $7.7 million of Legend's excess working capital as part of the agreement. The
WADDELL & REED FINANCIAL, INC.
NOTES TO CONSOLIDATED FINANCIAL STATEMENTS (Continued)
December 31, 2012, 2011 and 2010
agreement also includes an earnout provision based on asset retention for a period of two years following the closing date.
The operational results of Legend have been presented as discontinued operations in the consolidated financial statements for all periods presented. Legend's revenues and income (loss) before provision for income taxes follow:
| | 2012 | 2011 | 2010 | ||||||
|---|---|---|---|---|---|---|---|---|---|
| | (in thousands) | ||||||||
Revenues | $ | 74,033 | 72,644 | 66,619 | |||||
Income (loss) before provision for income taxes | $ | (40,518) | 5,810 | 6,123 | |||||
For income tax purposes, the sale will result in a $48.3 million capital loss that may only be utilized to offset future capital gains. Due to the character of the loss and the limited carry forward period permitted by law, the Company may not realize the full tax benefit of the capital loss.
The assets and liabilities of Legend, classified as discontinued operations held for sale in the consolidated balance sheets are as follows:
| | December 31, 2012 | December 31, 2011 | ||||
|---|---|---|---|---|---|---|
| | (in thousands) | |||||
Assets | ||||||
Cash and cash equivalents | $ | 2,303 | 3,167 | |||
Cash and cash equivalents - restricted | 401 | 13 | ||||
Investment securities | 1,352 | 1,235 | ||||
Receivables | 10,345 | 9,871 | ||||
Prepaid expenses and other current assets | 749 | 615 | ||||
Total current assets | 15,150 | 14,901 | ||||
Property and equipment, net | 992 | 885 | ||||
Goodwill | 16,868 | 59,241 | ||||
Other non-current assets | 150 | 148 | ||||
Total non-current assets | 18,010 | 60,274 | ||||
Total assets | 33,160 | 75,175 | ||||
Liabilities | ||||||
Accounts payable | 464 | - | ||||
Accrued compensation | 6,243 | 5,812 | ||||
Other current liabilities | 880 | 738 | ||||
Total current liabilities | 7,587 | 6,550 | ||||
Non-current liabilities | 281 | 207 | ||||
Total liabilities | 7,868 | 6,757 | ||||
Assets less liabilities | $ | 25,292 | 68,418 | |||
WADDELL & REED FINANCIAL, INC.
NOTES TO CONSOLIDATED FINANCIAL STATEMENTS (Continued)
December 31, 2012, 20112015, 2014 and 20102013
At December 31, 2015, we had property and equipment under capital leases with a cost of $2.1 million and accumulated depreciation of $1.1 million. At December 31, 2014, we had property and equipment under capital leases with a cost of $2.0 million and accumulated depreciation of $0.9 million.
7.5. Discontinued Operations
During 2012, the Company signed a definitive agreement with First Allied Holdings Inc. to sell all of the common interests of its Legend group of subsidiaries ("Legend") and the sale closed effective January 1, 2013. The agreement included an earnout provision based on asset retention for a period of two years following the closing date. An earnout receivable of $4.1 million was accrued as of December 31, 2014 and we received payment in February of 2015.
For income tax purposes, the sale resulted in a $47.8 million capital loss. As of December 31, 2015, $15.8 million remains as a capital loss carryforward available to offset future capital gains for federal income tax purposes. The Company may not realize the full tax benefit of the capital loss carryforward if it does not generate sufficient future capital gains. The capital loss carryforward, if not utilized, will expire in 2018. Additional information related to the capital loss carryforward is included in Note 8.
6. Goodwill and Identifiable Intangible Assets
Goodwill represents the excess of purchase price over the tangible assets and identifiable intangible assets of an acquired business. Our goodwill is not deductible for tax purposes. Goodwill and identifiable intangible assets (all considered indefinite lived)indefinite-lived) at December 31, 20122015 and 20112014 are as follows:
| | 2012 | 2011 | 2015 | 2014 | ||||||||
|---|---|---|---|---|---|---|---|---|---|---|---|---|
| | (in thousands) | (in thousands) | ||||||||||
Goodwill | $ | 138,947 | 138,947 | $ | 106,970 | 106,970 | ||||||
Accumulated amortization | (31,977) | (31,977) | ||||||||||
Total goodwill | 106,970 | 106,970 | ||||||||||
Mutual fund management advisory contracts | 38,699 | 38,699 | 42,748 | 42,753 | ||||||||
Mutual fund management subadvisory contracts | 16,300 | 16,300 | 8,400 | 8,400 | ||||||||
| | | | | | | | ||||||
Total identifiable intangible assets | 54,999 | 54,999 | 51,148 | 51,153 | ||||||||
| | | | | | | | ||||||
Total | $ | 161,969 | 161,969 | $ | 158,118 | 158,123 | ||||||
| | | | | | | | ||||||
| | | | | | ||||||||
| | | | | | | | ||||||
The mutual fund management subadvisory contracts in the table above represents our indefinite-lived intangible asset balance related to our subadvisory agreement to manage certain mutual fund products for Mackenzie Financial Corporation ("MFC"). This intangible asset was recorded in connection with our purchase of Mackenzie Investment Management, Inc. in 2002, and a deferred tax liability was established related to this intangible asset.
We performed a review of the intangible asset associated with the MFC subadvisory agreement during the third quarter of 2014 due to a decline in the related assets under management. The decline was attributed to a realignment of MFC's fund offerings and additional asset reductions. We recorded an impairment charge of $7.9 million in the third quarter of 2014 to this intangible asset as a result of the reduction in assets and associated cash flows, and reduced the associated deferred tax liability by $2.9 million.
During the third quarter of 2012, $59.22014, we recorded a $4.1 million of goodwillintangible asset and established a tax deferred asset related to Legend was allocated to assetsa fund adoption transaction agreement with Emerging Managers Group, L.P., which became effective in August 2014, through which Ivy Investment Management Company assumed
Table of discontinued operations held for sale. Amounts at Contents
WADDELL & REED FINANCIAL, INC.
NOTES TO CONSOLIDATED FINANCIAL STATEMENTS (Continued)
December 31, 2011 have been adjusted to reflect this change.2015, 2014 and 2013
As of June 30, 2012, the Company's annual impairment test indicated that the fair valueresponsibility as investment adviser and global distributor of the Legend reporting unit exceeded its carrying value, which resulted in no goodwill impairment. During preliminary due diligence conducted in the third quarter regarding a possible sale of Legend, several significant issues arose regarding executive leadership, advisor retention and employee morale. As due diligence discussions progressed into formal negotiations throughout the third quarter, the Company's concerns regarding these matters escalated, the depth and consequence of which led us to determine that a change in the strategic direction of Legend was necessary, and as a result, the Company decided to move forward with a sale of Legend at a price lower than the fair value utilized in the annual impairment analysis in the second quarter. During the third quarter of 2012, $42.4 million of goodwill related to Legend was written down andIGI Funds. This asset is included in the loss from discontinued operationsmutual fund management advisory contracts line in the statement of income.table above.
8.7. Indebtedness
On January 13, 2006, the Company issued $200.0 million in principal amount 5.60% senior notes due 2011 (the "Notes") resulting in net proceeds of approximately $198.2 million (net of discounts, commissions and estimated expenses). Interest was payable semi-annually on January 15 and July 15 at a fixed rate of 5.60% per annum. Upon issuance of these Notes, the Company terminated two forward interest rate swap agreements entered into in 2005. In connection with the termination, we received a net cash settlement of $1.1 million. The Company's gain was amortized into earnings as a reduction to interest expense over the five year term of the Notes and was fully amortized as of December 31, 2010. During the first quarter of 2010, we repurchased $10.0 million of the Notes.
On August 31, 2010, the Company entered into an agreement to complete a $190.0 million private placement of senior unsecured notes that were issued and sold in two tranches: $95.0 million bearing interest at 5.0% and maturing January 13, 2018, Series A, and $95.0 million bearing interest of 5.75% and
WADDELL & REED FINANCIAL, INC.
NOTES TO CONSOLIDATED FINANCIAL STATEMENTS (Continued)
December 31, 2012, 2011 and 2010
maturing January 13, 2021, Series B.B (collectively, the "Senior Notes"). The agreement contained a delayed funding provision that allowed the Company to draw down the proceeds in January 2011 when the Notes5.6% senior notes (the "Notes") matured. The Company used the proceeds of the issuance and sale of the Senior Notes to repay the Notes in full the Notes.full. Interest is payable semi-annually in January and July of each year. The most restrictive provisions of the agreement require the Company to maintain a consolidated leverage ratio not to exceed 3.0 to 1.0 for four consecutive quarters and a consolidated interest coverage ratio of not less than 4.0 to 1.0 for four consecutive quarters. The Company was in compliance with these covenants and similar covenants in prior facilities for all periods presented. As of December 31, 2015, the Company's consolidated leverage ratio was 0.4 to 1.0, and consolidated interest coverage ratio was 42.9 to 1.0.
The Company entered into a threefive year revolving credit facility (the "Credit Facility") with various lenders, effective August 31, 2010,June 28, 2013, which provides for initial borrowings of up to $125.0 million and replaced the Company's previous revolving credit facility. Lenders could, at their option upon the Company's request, expand the Credit Facility to $200.0 million. At December 31, 20122015 and 2011,2014, there were no borrowings outstanding under the facility. Borrowings under the Credit Facility bear interest at various rates including adjusted LIBOR or an alternative base rate plus, in each case, an incremental margin based on the Company's credit rating. The Credit Facility also provides for a facility fee on the aggregate amount of commitments under the revolving facility (whether or not utilized). The facility fee is also based on the Company's credit rating level. The Credit Facility's covenants match those outlined above for the Senior Notes.
Debt is reported at its carrying amount in the consolidated balance sheet.sheets. The fair value of the Company's outstanding indebtedness is approximately $208.8$202.5 million at December 31, 20122015 compared to the carrying value of $190.0 million. The followingFair value is a summary of long-term debt at December 31, 2012 and 2011:calculated based on Level 2 inputs.
| | 2012 | 2011 | ||||
|---|---|---|---|---|---|---|
| | (in thousands) | |||||
Principal amount unsecured 5.0% senior notes due in 2018 | $ | 95,000 | $ | 95,000 | ||
Principal amount unsecured 5.75% senior notes due in 2021 | 95,000 | 95,000 | ||||
Total | $ | 190,000 | 190,000 | |||
9.8. Income Taxes
The provision for income taxes from continuing operations for the years ended December 31, 2012, 20112015, 2014 and 20102013 consists of the following:
| | 2012 | 2011 | 2010 | 2015 | 2014 | 2013 | ||||||||||||
|---|---|---|---|---|---|---|---|---|---|---|---|---|---|---|---|---|---|---|
| | (in thousands) | (in thousands) | ||||||||||||||||
Currently payable: | ||||||||||||||||||
Current taxes: | ||||||||||||||||||
Federal | $ | 104,922 | 93,677 | 85,394 | $ | 142,576 | 161,863 | 131,000 | ||||||||||
State | 9,335 | 9,033 | 6,730 | 12,800 | 14,206 | 12,197 | ||||||||||||
Foreign | 38 | 35 | 37 | |||||||||||||||
| | | | | | | | | | | |||||||||
| 114,257 | 102,710 | 92,124 | 155,414 | 176,104 | 143,234 | |||||||||||||
Deferred taxes | (5,782) | 2,004 | (5,191) | (1,410) | 728 | (3,001) | ||||||||||||
| | | | | | | | | | | |||||||||
Provision for income taxes | $ | 108,475 | 104,714 | 86,933 | $ | 154,004 | 176,832 | 140,233 | ||||||||||
| | | | | | | | | | | |||||||||
| | | | | | | | ||||||||||||
| | | | | | | | | | | |||||||||
WADDELL & REED FINANCIAL, INC.
NOTES TO CONSOLIDATED FINANCIAL STATEMENTS (Continued)
December 31, 2012, 20112015, 2014 and 20102013
The following table reconciles the statutory federal income tax rate with our effective income tax rate from continuing operations for the years ended December 31, 2012, 20112015, 2014 and 2010:2013:
| | 2012 | 2011 | 2010 | 2015 | 2014 | 2013 | ||||||||||||
|---|---|---|---|---|---|---|---|---|---|---|---|---|---|---|---|---|---|---|
Statutory federal income tax rate | 35.0% | 35.0% | 35.0% | 35.0% | 35.0% | 35.0% | ||||||||||||
State income taxes, net of federal tax benefits | 2.2 | 2.4 | 1.9 | 2.0 | 2.1 | 2.2 | ||||||||||||
State tax incentives | (0.2) | (0.2) | (0.2) | (0.1) | (0.2) | (0.1) | ||||||||||||
Valuation allowance on losses capital in nature | (0.8) | (0.2) | (1.1) | 0.9 | (1.0) | (1.8) | ||||||||||||
Other items | (0.2) | 0.8 | 0.6 | 0.7 | 0.2 | 0.4 | ||||||||||||
| | | | | | | | | | | |||||||||
Effective income tax rate | 36.0% | 37.8% | 36.2% | 38.5% | 36.1% | 35.7% | ||||||||||||
| | | | | | | | | | | |||||||||
| | | | | | | | ||||||||||||
| | | | | | | | | | | |||||||||
The tax effect of temporary differences that give rise to significant portions of deferred tax liabilities and deferred tax assets at December 31, 20122015 and 20112014 are as follows:
| | 2012 | 2011 | 2015 | 2014 | ||||||||
|---|---|---|---|---|---|---|---|---|---|---|---|---|
| | (in thousands) | (in thousands) | ||||||||||
Deferred tax liabilities: | ||||||||||||
Deferred sales commissions | $ | (7,405) | (7,861) | $ | (2,337) | (4,285) | ||||||
Property and equipment | (8,010) | (13,017) | (9,775) | (10,335) | ||||||||
Benefit plans | (9,723) | (9,617) | (14,058) | (11,452) | ||||||||
Identifiable intangible assets | (8,583) | (8,523) | (13,705) | (12,562) | ||||||||
Unrealized gains on investment securities | (1,084) | - | ||||||||||
Purchase of fund assets | (7,458) | (6,631) | ||||||||||
Prepaid expenses | (2,138) | (2,430) | (2,231) | (2,150) | ||||||||
| | | | | | | | ||||||
Total gross deferred liabilities | (44,401) | (48,079) | (42,106) | (40,784) | ||||||||
| | | | | | | | ||||||
Deferred tax assets: | ||||||||||||
Acquisition lease liability | 953 | 1,108 | ||||||||||
Accrued compensation | 11,015 | 9,098 | ||||||||||
Additional pension and postretirement liability | 28,935 | 26,403 | 32,183 | 28,389 | ||||||||
Accrued expenses | 12,705 | 13,285 | ||||||||||
Unrealized losses on investment securities | 843 | 2,318 | ||||||||||
Unrealized losses on investment in partnerships | 789 | 196 | ||||||||||
Other accrued expenses | 5,851 | 5,789 | ||||||||||
Unrealized losses on investment securities and partnerships | 7,426 | 1,043 | ||||||||||
Capital loss carryforwards | 169 | 3,022 | 5,919 | 6,849 | ||||||||
Excess tax basis on investment in subsidiary | 17,921 | - | ||||||||||
Nonvested stock | 21,070 | 19,051 | 20,608 | 20,300 | ||||||||
Unused state tax credits | 972 | 1,123 | 1,470 | 992 | ||||||||
State net operating loss carryforwards | 6,284 | 5,893 | 5,666 | 5,718 | ||||||||
Other | 4,230 | 3,817 | 3,463 | 3,572 | ||||||||
| | | | | | | | ||||||
Total gross deferred assets | 94,871 | 76,216 | 93,601 | 81,750 | ||||||||
Valuation allowance | (24,695) | (11,191) | (18,803) | (13,476) | ||||||||
| | | | | | | | ||||||
Net deferred tax asset | $ | 25,775 | 16,946 | $ | 32,692 | 27,490 | ||||||
| | | | | | | | ||||||
| | | | | | ||||||||
| | | | | | | | ||||||
In 2013, a capital loss was realized on the sale of Legend. By law, the portion of this capital loss in excess of capital gains was carried forward to offset potential capital gains recognized in future years. The deferred tax asset, net of federal tax effect, relating to this capital loss carryforward as of December 31, 2015 and 2014 is $5.9 million and $6.8 million, respectively. The capital loss carryforward, if not utilized, will expire in 2018. Other deferred tax assets that could generate potential future capital losses if realized include unrealized losses on investment securities and partnerships of $7.4 million and $1.1 million as of December 31, 2015 and 2014, respectively. Due to the character of the losses and the limited carryforward
WADDELL & REED FINANCIAL, INC.
NOTES TO CONSOLIDATED FINANCIAL STATEMENTS (Continued)
December 31, 2012, 20112015, 2014 and 20102013
In 2009, the Company sold one of its subsidiaries, Austin Calvert & Flavin, Inc., which generated a capital loss available to offset potential future capital gains. Due to the character of the loss and the limited carryforward period permitted by law upon realization, the Company may not realize the full tax benefit of the capital loss. The capital loss carryforward, if not utilized, will expire in 2014. As of December 31, 2012, the Company had a deferred tax asset, net of federal tax effect, for a capital loss carryforward of $0.2 million, excess tax basis in Legend of $17.9 million, and other net deferred tax assets that were capital in nature of $0.5 million. As of December 31, 2011, the Company had a deferred tax asset, net of federal tax effect, for a capital loss carryforward of $3.0 million and other net deferred tax liabilities which were capital in nature of approximately $2.5 million.losses. Management believes it is not more likely than not that the Company will generate sufficient future capital gains to realize the full benefit of these capital losses and accordingly, a valuation allowance in the amount of $18.6$13.3 million and $5.5$7.9 million has been recorded at December 31, 20122015 and 2011,2014, respectively. During 2012, a non-cash impairment charge to Legend resulted in an increase in the valuation allowance of $17.9 million. Losses from partnership investments also increased the valuation allowance by $0.6 million. These increases were partially offset by realized capital gains on securities classified as available for sale and appreciation in the fair value of the Company's investment portfolios, which reduced the valuation allowance by $3.4 million. The remaining $2.0 million decrease in the valuation allowance resulted from appreciation in the fair value of the Company's available for sale securities portfolio, which was recorded as an increase to accumulated other comprehensive income.
Certain subsidiaries of the Company have net operating loss carryforwards in certain states in which these companies file on a separate company basis. The deferred tax asset, net of federal tax effect, relating to thethese carryforwards as of December 31, 20122015 and 20112014 is approximately $6.3 million and $5.9 million, respectively.$5.7 million. The carryforwards, if not utilized, will expire between 20132016 and 2032.2035. Management believes it is not more likely than not that these subsidiaries will generate sufficient future taxable income in these states to realize the benefit of the net operating loss carryforwards and, accordingly, a valuation allowance in the amount of $6.1$5.5 million and $5.7$5.6 million has been recorded at December 31, 20122015 and 2011,2014, respectively.
During 2015, the valuation allowance increased $5.3 million. Unrealized losses on equity method investments and the trading securities portfolio increased the valuation allowance and income tax expense by $5.9 million. Depreciation in the fair value of the Company's available for sale securities portfolio increased the valuation allowance and accumulated other comprehensive loss by $1.8 million. These increases were partially offset by capital gain distributions from investments and realized capital gains on the sale of securities in the Company's investment portfolios, which decreased the valuation allowance and income tax expense by $2.4 million.
The Company has state tax credit carryforwards of $1.0$1.5 million and $1.1$1.0 million as of December 31, 20122015 and 2011,2014, respectively. Of these state tax credit carryforwards, $0.7$1.3 million will expire between 2024 and 20282031 if not utilized and $0.3$0.2 million will expire in 2026 if not utilized. The Company anticipates these credits will be fully utilized prior to their expiration date.
As of January 1, 2012,2015, the Company had unrecognized tax benefits, including penalties and interest, of $9.8$11.6 million ($6.98.3 million net of federal benefit) that, if recognized, would impact the Company's effective tax rate. As of December 31, 2012,2015, the Company had unrecognized tax benefits, including penalties and interest, of $10.8$11.9 million ($7.58.7 million net of federal benefit) that, if recognized, would impact the Company's effective tax rate. The unrecognized tax benefits that are not expected to be settled within the next 12 months are included in other liabilities in the accompanying consolidated balance sheets; unrecognized tax benefits that are expected to be settled within the next 12 months are included in income taxes payable.payable; and unrecognized tax benefits that reduce a net operating loss, similar tax loss, or tax credit carryforward are presented as a reduction to noncurrent deferred income taxes.
The Company's accounting policy with respect to interest and penalties related to income tax uncertainties is to classify these amounts as income taxes. As of January 1, 2012,2015, the total amount of accrued interest and penalties related to uncertain tax positions recognized in the consolidated balance sheet was $2.3$3.5 million ($1.82.9 million net of federal benefit). The total amountA settlement in 2015 allowed for the reduction of penalties and interest, net of federal benefit, related to tax uncertainties recognizedof $ 0.1 million in the consolidated statement of income for the period ended December 31, 2012 was $0.2 million.2015. The total amount of accrued penalties and interest related to uncertain tax positions at December 31, 20122015 of $2.5$3.4 million ($2.02.8 million net of federal benefit) is included in the total unrecognized tax benefits described above.
WADDELL & REED FINANCIAL, INC.
NOTES TO CONSOLIDATED FINANCIAL STATEMENTS (Continued)
December 31, 2012, 20112015, 2014 and 20102013
The following table summarizes the Company's reconciliation of unrecognized tax benefits, excluding penalties and interest, for the years ended December 31, 2012, 20112015, 2014 and 2010:2013:
| | 2012 | 2011 | 2010 | 2015 | 2014 | 2013 | ||||||||||||
|---|---|---|---|---|---|---|---|---|---|---|---|---|---|---|---|---|---|---|
| | (in thousands) | (in thousands) | ||||||||||||||||
Balance at January 1 | $ | 7,467 | 4,759 | 4,857 | $ | 8,105 | 9,013 | 8,322 | ||||||||||
Increases during the year: | ||||||||||||||||||
Gross increases - tax positions in prior period | 275 | 1,684 | 189 | |||||||||||||||
Gross increases - current-period tax positions | 2,215 | 1,844 | 981 | |||||||||||||||
Gross increases—tax positions in prior period | 1,401 | 433 | 644 | |||||||||||||||
Gross increases—current-period tax positions | 700 | 656 | 1,355 | |||||||||||||||
Decreases during the year: | ||||||||||||||||||
Gross decreases - tax positions in prior period | (429) | (183) | (490) | |||||||||||||||
Gross decreases—tax positions in prior period | (308) | (192) | (71) | |||||||||||||||
Decreases due to settlements with taxing authorities | - | - | (629) | (486) | (877) | (154) | ||||||||||||
Decreases due to lapse of statute of limitations | (1,206) | (637) | (149) | (964) | (928) | (1,083) | ||||||||||||
| | | | | | | | | | | |||||||||
Balance at December 31 | $ | 8,322 | 7,467 | 4,759 | $ | 8,448 | 8,105 | 9,013 | ||||||||||
| | | | | | | | | | | |||||||||
| | | | | | | | ||||||||||||
| | | | | | | | | | | |||||||||
In the ordinary course of business, many transactions occur for which the ultimate tax outcome is uncertain. In addition, respective tax authorities periodically audit our income tax returns. These audits examine our significant tax filing positions, including the timing and amounts of deductions and the allocation of income among tax jurisdictions. During 2012,2015, the Company settled three open tax years that were undergoing audit by a state jurisdiction in which the Company operates. No audits were settled in 2011. During 2010,2014, the Company settled ninesix open tax years that were undergoing auditsaudit by state jurisdictions in which the Company operates. The Company also received notification of a favorable outcome on a tax position thatDuring 2013, the Company had previously considered partially uncertain, and therefore, had not previously recognizedsettled four open tax years that were undergoing audit by a state jurisdiction in which the full tax benefit.Company operates. The 2009, 2010 and 20112012 through 2015 federal income tax returns are open tax years that remain subject to potential future audit. The 2006 and 2007 federal tax years also remain open to a limited extent due to capital loss carryback claims. State income tax returns for all years after 20082011 and, in certain states, income tax returns prior to 2009,for 2011, are subject to potential future audit by tax authorities in the Company's major state tax jurisdictions.
The Company is currently being audited in various state jurisdictions. It is reasonably possible that the Company will settle the audits in these jurisdictions within the next 12-month period. It is estimated that the Company's liability for unrecognized tax benefits, including penalties and interest, could decrease by approximately $0.4 million to $2.5 million ($0.3 million to $1.6 million net of federal benefit) upon settlement of these audits. Such settlements are not anticipated to have a significant impact on the results of operations.
10.9. Pension Plan and Postretirement Benefits Other Than Pension
We provide a non-contributory retirement plan that covers substantially all employees and certain vested employees of our former parent company (the "Pension Plan"). Benefits payable under the Pension Plan are based on employees' years of service and compensation during the final ten years of employment. We also sponsor an unfunded defined benefit postretirement medical plan that covers substantially all employees, including Waddell & Reed and Legend advisors.as well as our financial advisors, who are independent contractors. The medical plan is contributory with retiree
WADDELL & REED FINANCIAL, INC.
NOTES TO CONSOLIDATED FINANCIAL STATEMENTS (Continued)
December 31, 2012, 2011 and 2010
contributions adjusted annually. The medical plan does not provide for post age 65 benefits with the exception of a small group of employees that were grandfathered when such plan was established.
A reconciliation of the funded status of these plans and the assumptions related to the obligations at December 31, 2012, 2011 and 2010 follows:
| | Pension Benefits | Other Postretirement Benefits | ||||||||||||||||
|---|---|---|---|---|---|---|---|---|---|---|---|---|---|---|---|---|---|---|
| | 2012 | 2011 | 2010 | 2012 | 2011 | 2010 | ||||||||||||
| | (in thousands) | |||||||||||||||||
| Change in projected benefit obligation: | ||||||||||||||||||
Net benefit obligation at beginning of year | $ | 148,412 | 118,860 | 110,962 | 8,145 | 6,850 | 5,945 | |||||||||||
Service cost | 9,373 | 7,101 | 6,140 | 693 | 558 | 443 | ||||||||||||
Interest cost | 7,570 | 7,195 | 6,596 | 400 | 402 | 364 | ||||||||||||
Benefits paid | (5,760) | (6,522) | (6,589) | (560) | (554) | (528) | ||||||||||||
Actuarial (gain) loss | 24,570 | 21,778 | 1,751 | (223) | 530 | 389 | ||||||||||||
Retiree contributions | — | — | — | 337 | 359 | 237 | ||||||||||||
Net benefit obligation at end of year | $ | 184,165 | 148,412 | 118,860 | 8,792 | 8,145 | 6,850 | |||||||||||
The accumulated benefit obligation for the Pension Plan was $150.8 million and $124.7 million at December 31, 2012 and 2011, respectively.
As part of the agreement to sell Legend, the Company retained the liability for pension and other postretirement benefits related to Legend, and these liabilities are included in the tables above.
| | Pension Benefits | Other Postretirement Benefits | ||||||||||||||||
|---|---|---|---|---|---|---|---|---|---|---|---|---|---|---|---|---|---|---|
| | 2012 | 2011 | 2010 | 2012 | 2011 | 2010 | ||||||||||||
| | (in thousands) | |||||||||||||||||
| Change in plan assets: | ||||||||||||||||||
Fair value of plan assets at beginning of year | $ | 103,404 | 106,568 | 91,551 | — | — | — | |||||||||||
Actual return on plan assets | 21,267 | (6,642) | 9,106 | — | — | — | ||||||||||||
Employer contributions | 15,000 | 10,000 | 12,500 | 223 | 195 | 291 | ||||||||||||
Retiree contributions | — | — | — | 337 | 359 | 237 | ||||||||||||
Benefits paid | (5,760) | (6,522) | (6,589) | (560) | (554) | (528) | ||||||||||||
Fair value of plan assets at end of year | $ | 133,911 | 103,404 | 106,568 | — | — | — | |||||||||||
| Funded status at end of year | $ | (50,254) | (45,008) | (12,292) | (8,792) | (8,145) | (6,850) | |||||||||||
WADDELL & REED FINANCIAL, INC.
NOTES TO CONSOLIDATED FINANCIAL STATEMENTS (Continued)
December 31, 2012, 20112015, 2014 and 20102013
A reconciliation of the funded status of these plans and the assumptions related to the obligations at December 31, 2015, 2014 and 2013 are as follows:
| | Pension Benefits | Other Postretirement Benefits | ||||||||||||||||
|---|---|---|---|---|---|---|---|---|---|---|---|---|---|---|---|---|---|---|
| | 2012 | 2011 | 2010 | 2012 | 2011 | 2010 | ||||||||||||
| | (in thousands, except percentage data) | |||||||||||||||||
| Amounts recognized in the statement of financial position: | ||||||||||||||||||
Current liabilities | $ | - | - | - | (304) | (289) | (303) | |||||||||||
Noncurrent liabilities | (50,254) | (45,008) | (12,292) | (8,488) | (7,856) | (6,547) | ||||||||||||
Net amount recognized at end of year | $ | (50,254) | (45,008) | (12,292) | (8,792) | (8,145) | (6,850) | |||||||||||
Amounts not yet reflected in net periodic benefit cost and included in accumulated other comprehensive income: | ||||||||||||||||||
Transition obligation | $ | (32) | (37) | (42) | - | - | - | |||||||||||
Prior service cost | (2,377) | (2,932) | (3,486) | (127) | (183) | (238) | ||||||||||||
Accumulated loss | (74,286) | (66,747) | (31,369) | (765) | (999) | (469) | ||||||||||||
Accumulated other comprehensive loss | (76,695) | (69,716) | (34,897) | (892) | (1,182) | (707) | ||||||||||||
Cumulative employer contributions in excess of net periodic benefit cost | 26,441 | 24,708 | 22,605 | (7,900) | (6,963) | (6,143) | ||||||||||||
Net amount recognized at end of year | $ | (50,254) | (45,008) | (12,292) | (8,792) | (8,145) | (6,850) | |||||||||||
Weighted average assumptions used to determine benefit obligation at December 31: | ||||||||||||||||||
Discount rate | 4.22% | 4.99% | 6.00% | 4.18% | 5.00% | 6.00% | ||||||||||||
Rate of compensation increase | 3.99% | 4.04% | 3.86% | Not applicable | ||||||||||||||
| | Pension Benefits | Other Postretirement Benefits | ||||||||||||||||
|---|---|---|---|---|---|---|---|---|---|---|---|---|---|---|---|---|---|---|
| | 2015 | 2014 | 2013 | 2015 | 2014 | 2013 | ||||||||||||
| | (in thousands) | |||||||||||||||||
| Change in projected benefit obligation: | ||||||||||||||||||
Net benefit obligation at beginning of year | $ | 208,085 | 172,105 | 184,165 | 9,902 | 8,172 | 8,792 | |||||||||||
Service cost | 12,080 | 10,084 | 11,011 | 910 | 719 | 788 | ||||||||||||
Interest cost | 8,420 | 8,395 | 7,711 | 397 | 397 | 361 | ||||||||||||
Benefits paid | (10,184) | (8,733) | (19,283) | (505) | (527) | (283) | ||||||||||||
Actuarial (gain) loss | (7,618) | 26,410 | (11,499) | (2,632) | 760 | (1,807) | ||||||||||||
Plan amendments | — | (176) | — | — | — | — | ||||||||||||
Retiree contributions | — | — | — | 349 | 381 | 321 | ||||||||||||
| | | | | | | | | | | | | | | | | | | |
Net benefit obligation at end of year | $ | 210,783 | 208,085 | 172,105 | 8,421 | 9,902 | 8,172 | |||||||||||
| | | | | | | | | | | | | | | | | | | |
| | | | | | | | | | | | | | | | | | | |
| | | | | | | | | | | | | | | | | | | |
In 2012The accumulated benefit obligation for the Pension Plan was $177.1 million and 2011, the$171.3 million at December 31, 2015 and 2014, respectively.
| | Pension Benefits | Other Postretirement Benefits | ||||||||||||||||
|---|---|---|---|---|---|---|---|---|---|---|---|---|---|---|---|---|---|---|
| | 2015 | 2014 | 2013 | 2015 | 2014 | 2013 | ||||||||||||
| | (in thousands) | |||||||||||||||||
| Change in plan assets: | ||||||||||||||||||
Fair value of plan assets at beginning of year | $ | 175,548 | 170,430 | 133,911 | — | — | — | |||||||||||
Actual return on plan assets | (11,479) | (6,149) | 38,802 | — | — | — | ||||||||||||
Employer contributions | 20,000 | 20,000 | 17,000 | 156 | 146 | (38) | ||||||||||||
Retiree contributions | — | — | — | 349 | 381 | 321 | ||||||||||||
Benefits paid | (10,184) | (8,733) | (19,283) | (505) | (527) | (283) | ||||||||||||
| | | | | | | | | | | | | | | | | | | |
Fair value of plan assets at end of year | $ | 173,885 | 175,548 | 170,430 | — | — | — | |||||||||||
| | | | | | | | | | | | | | | | | | | |
| | | | | | | | | | | | | | | | | | | |
| | | | | | | | | | | | | | | | | | | |
| Funded status at end of year | $ | (36,898) | (32,537) | (1,675) | (8,421) | (9,902) | (8,172) | |||||||||||
| | | | | | | | | | | | | | | | | | | |
| | | | | | | | | | | | | | | | | | | |
| | | | | | | | | | | | | | | | | | | |
WADDELL & REED FINANCIAL, INC.
NOTES TO CONSOLIDATED FINANCIAL STATEMENTS (Continued)
December 31, 2015, 2014 and 2013
| | Pension Benefits | Other Postretirement Benefits | ||||||||||||||||
|---|---|---|---|---|---|---|---|---|---|---|---|---|---|---|---|---|---|---|
| | 2015 | 2014 | 2013 | 2015 | 2014 | 2013 | ||||||||||||
| | (in thousands, except percentage data) | |||||||||||||||||
| Amounts recognized in the statement of financial position: | ||||||||||||||||||
Current liabilities | $ | — | — | — | (316) | (279) | (260) | |||||||||||
Noncurrent liabilities | (36,898) | (32,537) | (1,675) | (8,105) | (9,623) | (7,912) | ||||||||||||
| | | | | | | | | | | | | | | | | | | |
Net amount recognized at end of year | $ | (36,898) | (32,537) | (1,675) | (8,421) | (9,902) | (8,172) | |||||||||||
| | | | | | | | | | | | | | | | | | | |
| | | | | | | | | | | | | | | | | | | |
| | | | | | | | | | | | | | | | | | | |
Amounts not yet reflected in net periodic benefit cost and included in accumulated other comprehensive income: | ||||||||||||||||||
Transition obligation | $ | (16) | (21) | (27) | — | — | — | |||||||||||
Prior service credit (cost) | (720) | (1,179) | (1,822) | 2 | (17) | (72) | ||||||||||||
Accumulated gain (loss) | (88,882) | (75,681) | (30,602) | 2,897 | 265 | 1,041 | ||||||||||||
| | | | | | | | | | | | | | | | | | | |
Accumulated other comprehensive income (loss) | (89,618) | (76,881) | (32,451) | 2,899 | 248 | 969 | ||||||||||||
Cumulative employer contributions in excess of (less than) net periodic benefit cost | 52,720 | 44,344 | 30,776 | (11,320) | (10,150) | (9,141) | ||||||||||||
| | | | | | | | | | | | | | | | | | | |
Net amount recognized at end of year | $ | (36,898) | (32,537) | (1,675) | (8,421) | (9,902) | (8,172) | |||||||||||
| | | | | | | | | | | | | | | | | | | |
| | | | | | | | | | | | | | | | | | | |
| | | | | | | | | | | | | | | | | | | |
Weighted average assumptions used to determine benefit obligation at December 31: | ||||||||||||||||||
Discount rate | 4.60% | 4.13% | 4.97% | 4.44% | 4.07% | 4.94% | ||||||||||||
Rate of compensation increase | 5.12% | 5.12% | 5.12% | Not applicable | ||||||||||||||
The discount rate assumption used to determine the pension and other postretirement benefits obligations was based on the Aon Hewitt AA Only Above Median Yield Curve. This discount rate was determined separately for each plan by plotting the expected benefit payments from each plan against a yield curve of high quality, zero coupon bonds and calculating the single rate that would produce the same present value of liabilities as the yield curve. Prior to 2011, the discount rate assumption was based on the Mercer Bond Model, which calculated the yield on a theoretical portfolio of high-grade corporate bonds with cash flows that generally matched our expected benefit payments. To the extent scheduled bond proceeds exceeded the estimated benefit payments in a given period, the yield calculation assumed those excess proceeds were reinvested at the one-year forward rates implied by the Citigroup Pension Discount Curve.
WADDELL & REED FINANCIAL, INC.
NOTES TO CONSOLIDATED FINANCIAL STATEMENTS (Continued)
December 31, 2012, 2011 and 2010
Our Pension Plan asset allocation at December 31, 20122015 and 20112014 is as follows:
Plan assets by category | Percentage of Plan Assets at December 31, 2012 | Percentage of Plan Assets at December 31, 2011 | Percentage of Plan Assets at December 31, 2015 | Percentage of Plan Assets at December 31, 2014 | ||||||||
|---|---|---|---|---|---|---|---|---|---|---|---|---|
Cash | 11% | 7% | 24% | 23% | ||||||||
Equity securities: | ||||||||||||
Domestic | 38% | 43% | 53% | 51% | ||||||||
International | 40% | 38% | 15% | 17% | ||||||||
Fixed income securities | 5% | 1% | ||||||||||
Private equity | 1% | - | — | 1% | ||||||||
Gold bullion | 10% | 12% | 3% | 7% | ||||||||
| | | | | | | | ||||||
Total | 100% | 100% | 100% | 100% | ||||||||
| | | | | | | | ||||||
| | | | | | ||||||||
| | | | | | | | ||||||
The primary investment objective is to maximize growth of the Pension Plan assets to meet the projected obligations to the beneficiaries over a long period of time and to do so in a manner that is
WADDELL & REED FINANCIAL, INC.
NOTES TO CONSOLIDATED FINANCIAL STATEMENTS (Continued)
December 31, 2015, 2014 and 2013
consistent with the Company's earnings strength and risk tolerance. Asset allocation is the most important decision in managing the assets and it is reviewed regularly. The asset allocation policy considers the Company's financial strength and long-term asset class risk/return expectations since the obligations are long-term in nature. As of December 31, 2012,2015, our Pension Plan assets were invested in our Asset Strategy investment style and are managed by our in-house investment professionals.
Asset Strategy invests in the domestic or foreign market that is believed to offer the greatest probability of return or, alternatively, that provides the highest degree of safety in uncertain times. This style may allocate its assets among stocks, bonds and short-term investments and since the allocation is dynamically managed and able to take advantage of opportunities as they are presented by the market, there is not a predetermined asset allocation. Dependent on the outlook for the U.S. and global economies, our investment managers make top-down allocations among stocks, bonds, cash, precious metals and currency markets around the globe. After determining allocations, we seek the best opportunities within each market. Derivative instruments play an important role in this style's investment process to manage risk and maximize stability of the assets in the portfolio.
At December 31, 2012,2015, the Pension Plan had multiple investment concentrations that are not typical of a classic pension plan, including a significant weighting of plan assets invested in equity securities, including 40% international equities,a concentration not typical of which a third was invested in Chinese equities. The Pension Plan also had 10% of plan assets invested in gold bullion.classic pension plan.
Risk management is primarily the responsibility of the investment portfolio manager, who incorporates it with day-to-day research and management. Although investment flexibility is essential to this style's investment process, the Pension Plan does not invest in a number of asset classes that are commonly referred to as alternative investments,investments; namely venture capital, private equity funds, direct real estate properties, timber, or oil, gas or other mineral explorations or development programs or leases. The Pension Plan also has a number of specific guidelines that serve to manage investment risk by placing limits on net securities exposure and concentration of assets within specific companies or industries.
WADDELL & REED FINANCIAL, INC.
NOTES TO CONSOLIDATED FINANCIAL STATEMENTS (Continued)
December 31, 2012, 20112015, 2014 and 20102013
We determine the fair value of our Pension Plan assets using broad levels of inputs as defined by related accounting standards and categorized as Level 1, Level 2 or Level 3, as previously defined abovedescribed in Note 4.3. The following tables summarize our Pension Plan assets as of December 31, 20122015 and 2011.2014. There were no transfers between levels for the years ended December 31, 20122015 or 2011.2014.
| 2012 | Level 1 | Level 2 | Level 3 | Total | ||||||||||||||||||||
|---|---|---|---|---|---|---|---|---|---|---|---|---|---|---|---|---|---|---|---|---|---|---|---|---|
| 2015 | Level 1 | Level 2 | Level 3 | Total | ||||||||||||||||||||
| | (in thousands) | (in thousands) | ||||||||||||||||||||||
Equity securities: | ||||||||||||||||||||||||
Domestic | $ | 51,289 | - | - | 51,289 | $ | 92,037 | — | — | 92,037 | ||||||||||||||
International | 53,291 | - | - | 53,291 | 25,822 | — | — | 25,822 | ||||||||||||||||
Equity derivatives | — | 280 | — | 280 | ||||||||||||||||||||
Fixed income securities: | ||||||||||||||||||||||||
Mortgage-backed securities | - | 50 | - | 50 | — | 11 | — | 11 | ||||||||||||||||
Private equity | - | - | 1,772 | 1,772 | ||||||||||||||||||||
U.S. treasuries | — | 8,113 | — | 8,113 | ||||||||||||||||||||
Gold bullion | 13,452 | - | - | 13,452 | 5,226 | — | — | 5,226 | ||||||||||||||||
| | | | | | | | | | | | | | ||||||||||||
Total investment securities | 118,032 | 50 | 1,772 | 119,854 | 123,085 | 8,404 | — | 131,489 | ||||||||||||||||
Cash and other | 14,057 | 42,396 | ||||||||||||||||||||||
| | | | | | | | | | | |||||||||||||||
Total | $ | 133,911 | $ | 173,885 | ||||||||||||||||||||
| | | | | | | | | | | |||||||||||||||
| | | | | | | | | | ||||||||||||||||
| | | | | | | | | | | |||||||||||||||
| 2011 | Level 1 | Level 2 | Level 3 | Total | ||||||||||||||||||||
|---|---|---|---|---|---|---|---|---|---|---|---|---|---|---|---|---|---|---|---|---|---|---|---|---|
| 2014 | Level 1 | Level 2 | Level 3 | Total | ||||||||||||||||||||
| | (in thousands) | (in thousands) | ||||||||||||||||||||||
Equity securities: | ||||||||||||||||||||||||
Domestic | $ | 44,818 | - | - | 44,818 | $ | 90,061 | — | — | 90,061 | ||||||||||||||
International | 38,942 | - | - | 38,942 | 29,351 | — | — | 29,351 | ||||||||||||||||
Equity derivatives | — | 116 | — | 116 | ||||||||||||||||||||
Fixed income securities: | ||||||||||||||||||||||||
Mortgage-backed securities | - | 98 | - | 98 | — | 14 | — | 14 | ||||||||||||||||
Corporate bond | — | — | 1,884 | 1,884 | ||||||||||||||||||||
Private equity | — | — | 1,518 | 1,518 | ||||||||||||||||||||
Gold bullion | 12,857 | - | - | 12,857 | 12,209 | — | — | 12,209 | ||||||||||||||||
| | | | | | | | | | | | | | ||||||||||||
Total investment securities | 96,617 | 98 | - | 96,715 | 131,621 | 130 | 3,402 | 135,153 | ||||||||||||||||
Cash and other | 6,689 | 40,395 | ||||||||||||||||||||||
| | | | | | | | | | | |||||||||||||||
Total | $ | 103,404 | $ | 175,548 | ||||||||||||||||||||
| | | | | | | | | | | |||||||||||||||
| | | | | | | | | | ||||||||||||||||
| | | | | | | | | | | |||||||||||||||
The fair value of the private equity investment classified as Level 3 as of December 31, 2012 was determined to be the investment cost. As a result, this investment's valuation had no effect on the plan's asset value in 2012. There was no Level 3 activity during the year ended December 31, 2011.
WADDELL & REED FINANCIAL, INC.
NOTES TO CONSOLIDATED FINANCIAL STATEMENTS (Continued)
December 31, 2012, 20112015, 2014 and 20102013
The following table summarizes the activity of plan assets categorized as Level 3 for the yearyears ended December 31, 2012:2015 and 2014:
| | Private Equity | |||
|---|---|---|---|---|
| | (in thousands) | |||
Balance at December 31, 2011 | $ | - | ||
Purchases, issuances and settlements | 1,772 | |||
Actual return on plan assets, sold during the period | - | |||
Proceeds from sales | - | |||
Balance at December 31, 2012 | $ | 1,772 | ||
| | 2015 | 2014 | ||||
|---|---|---|---|---|---|---|
| | (in thousands) | |||||
Level 3 plan assets at beginning of year | $ | 3,402 | 4,019 | |||
Sales | (3,432) | — | ||||
Valuation change | 30 | (617) | ||||
| | | | | | | |
Level 3 plan assets at end of year | $ | — | 3,402 | |||
| | | | | | | |
| | | | | | | |
| | | | | | | |
The 7.75% expected long-term rate of return on Pension Plan assets reflects management's expectations of long-term average rates of return on funds invested to provide for benefits included in the projected benefit obligations. The expected return is based on the outlook for inflation, fixed income returns and equity returns, while also considering historical returns, asset allocation and investment strategy. The plan expects a relatively high return because of the types of investmentinvestments the portfolio incorporates, the long-term success the portfolio managers have had with generating returns in excess of passive management in those types of investments, and the past history of returns. The ability to use a high concentration of equities, especially international equities, within the plan's investment policy presents portfolio managers the opportunity to earn higher returns than other investment strategies that are restricted to owning lower returning asset classes.
The components of net periodic pension and other postretirement costs and the assumptions related to those costs consisted of the following for the years ended December 31, 2012, 20112015, 2014 and 2010:2013:
| | Pension Benefits | Other Postretirement Benefits | Pension Benefits | Other Postretirement Benefits | ||||||||||||||||||||||||||||||||
|---|---|---|---|---|---|---|---|---|---|---|---|---|---|---|---|---|---|---|---|---|---|---|---|---|---|---|---|---|---|---|---|---|---|---|---|---|
| | 2012 | 2011 | 2010 | 2012 | 2011 | 2010 | 2015 | 2014 | 2013 | 2015 | 2014 | 2013 | ||||||||||||||||||||||||
| | (in thousands) | (in thousands) | ||||||||||||||||||||||||||||||||||
Components of net periodic benefit cost: | ||||||||||||||||||||||||||||||||||||
Service cost | $ | 9,373 | 7,101 | 6,140 | 693 | 558 | 443 | $ | 12,080 | 10,084 | 11,011 | 910 | 719 | 788 | ||||||||||||||||||||||
Interest cost | 7,570 | 7,195 | 6,596 | 400 | 402 | 364 | 8,420 | 8,395 | 7,711 | 397 | 397 | 361 | ||||||||||||||||||||||||
Expected return on plan assets | (8,799) | (8,764) | (7,499) | — | — | — | (14,510) | (14,016) | (11,185) | — | — | — | ||||||||||||||||||||||||
Actuarial loss amortization | 4,563 | 1,805 | 1,617 | 12 | — | — | ||||||||||||||||||||||||||||||
Actuarial (gain) loss amortization | 5,171 | 1,496 | 4,567 | — | (17) | — | ||||||||||||||||||||||||||||||
Prior service cost amortization | 555 | 555 | 555 | 55 | 55 | 45 | 459 | 468 | 555 | 19 | 55 | 55 | ||||||||||||||||||||||||
Transition obligation amortization | 5 | 5 | 5 | — | — | — | 5 | 5 | 5 | — | — | — | ||||||||||||||||||||||||
| | | | | | | | | | | | | | | | | | | | ||||||||||||||||||
Net periodic benefit cost | $ | 13,267 | 7,897 | 7,414 | 1,160 | 1,015 | 852 | $ | 11,625 | 6,432 | 12,664 | 1,326 | 1,154 | 1,204 | ||||||||||||||||||||||
| | | | | | | | | | | | | | | | | | | | ||||||||||||||||||
| | | | | | | | | | | | | | ||||||||||||||||||||||||
| | | | | | | | | | | | | | | | | | | | ||||||||||||||||||
The estimated net actuarial loss, prior service cost and net transition obligation for the Pension Plan that will be amortized from accumulated other comprehensive income into net periodic pension benefit cost related to discontinued operations and included in the table above was $738 thousand, $5252016 are $6.1 million, $374 thousand and $489$5 thousand, for the years ended December 31, 2012, 2011respectively. The estimated net actuarial gain and 2010, respectively. Net periodicprior service cost for the postretirement medical plan related to discontinued operations and includedthat will be amortized from accumulated other comprehensive income into net periodic benefit cost in the table above was $11 thousand, $182016 are $153 thousand and $20$4 thousand, for the years ended December 31, 2012, 2011 and 2010, respectively.
WADDELL & REED FINANCIAL, INC.
NOTES TO CONSOLIDATED FINANCIAL STATEMENTS (Continued)
December 31, 2012, 20112015, 2014 and 20102013
The estimated net loss, prior service cost and transition obligation for the Pension Plan that will be amortized from accumulated other comprehensive income intoweighted average assumptions used to determine net periodic benefit cost infor the years ended December 31, 2015, 2014 and 2013 are $4.4 million, $555 thousand and $5 thousand, respectively. The estimated prior service cost for the postretirement medical plan that will be amortized from accumulated other comprehensive income into net periodic benefit cost in 2013 is $55 thousand.as follows:
| | Pension Benefits | Other Postretirement Benefits | Pension Benefits | Other Postretirement Benefits | ||||||||||||||||||||||||||||||||
|---|---|---|---|---|---|---|---|---|---|---|---|---|---|---|---|---|---|---|---|---|---|---|---|---|---|---|---|---|---|---|---|---|---|---|---|---|
| | 2012 | 2011 | 2010 | 2012 | 2011 | 2010 | 2015 | 2014 | 2013 | 2015 | 2014 | 2013 | ||||||||||||||||||||||||
| Weighted average assumptions used to determine net periodic benefit cost for the years ended December 31: | ||||||||||||||||||||||||||||||||||||
Discount rate | 4.99% | 6.00% | 6.25% | 5.00% | 6.00% | 6.25% | 4.13% | 4.97% | 4.22% | 4.07% | 4.94% | 4.18% | ||||||||||||||||||||||||
Expected return on plan assets | 7.75% | 7.75% | 7.75% | Not applicable | 7.75% | 7.75% | 7.75% | Not applicable | ||||||||||||||||||||||||||||
Rate of compensation increase | 4.04% | 3.86% | 3.86% | Not applicable | 5.12% | 5.12% | 3.99% | Not applicable | ||||||||||||||||||||||||||||
We expect the following benefit payments to be paid, which reflect future service as appropriate:
| | Pension Benefits | Other Postretirement Benefits | ||||
|---|---|---|---|---|---|---|
| | (in thousands) | |||||
2013 | $ | 7,985 | 304 | |||
2014 | 9,567 | 317 | ||||
2015 | 8,022 | 349 | ||||
2016 | 10,691 | 377 | ||||
2017 | 10,147 | 402 | ||||
2018 through 2022 | 60,647 | 2,961 | ||||
| $ | 107,059 | 4,710 | ||||
| | Pension Benefits | Other Postretirement Benefits | ||||
|---|---|---|---|---|---|---|
| | (in thousands) | |||||
2016 | $ | 7,654 | 316 | |||
2017 | 8,274 | 343 | ||||
2018 | 9,557 | 397 | ||||
2019 | 10,518 | 454 | ||||
2020 | 13,115 | 487 | ||||
2021 through 2025 | 78,851 | 3,253 | ||||
| | | | | | | |
| $ | 127,969 | 5,250 | ||||
| | | | | | | |
| | | | | | | |
| | | | | | | |
Our policy with respect to funding the Pension Plan is to fund at least the minimum required by the Employee Retirement Income Security Act of 1974, as amended, and not more than the maximum amount deductible for tax purposes. All contributions made to the Pension Plan for 2012, 20112015, 2014 and 20102013 were voluntary. Contributions are not expected to exceed $20 million for 2013. A contribution of $10$20 million was made to the Pension Plan in January 2013.2016 and no further contributions are planned for 2016.
All Company contributions to other postretirement medical benefits are voluntary, as the postretirement medical plan is not funded and is not subject to any minimum regulatory funding requirements. The contributions for each year represent claims paid for medical expenses, and we anticipate making the 20132016 expected contribution with cash generated from operations. Contributions by participants to the postretirement plan were $337$349 thousand, $359$381 thousand and $237$321 thousand for the years ended December 31, 2012, 20112015, 2014 and 2010,2013, respectively.
For measurement purposes, the initial health care cost trend rate was 9.01%7.55% for 2012, 9.51%2015, 8.04% for 20112014 and 10%8.52% for 2010.2013. The health care cost trend rate reflects anticipated increases in health care costs. The initial assumed growth rate of 7.55% for 2015 is assumed to gradually decline over the next 12 years to a rate of 4.5%. The effect of a 1% annual increase in assumed cost trend rates would increase the December 31, 2015, accumulated postretirement benefit obligation by approximately $1.0 million, and the aggregate of the service and interest cost components of net periodic postretirement benefit cost for the year ended December 31, 2015, by approximately $205 thousand. The effect of a 1% annual decrease in assumed cost trend rates would decrease the December 31, 2015, accumulated postretirement benefit obligation by approximately $874 thousand, and the aggregate of the service and interest cost components of net periodic postretirement benefit cost for the year ended December 31, 2015, by approximately $173 thousand.
WADDELL & REED FINANCIAL, INC.
NOTES TO CONSOLIDATED FINANCIAL STATEMENTS (Continued)
December 31, 2012, 20112015, 2014 and 20102013
initial assumed growth rate of 9.01% for 2012 is assumed to gradually decline over the next 15 years to a rate of 4.5%. The effect of a 1% annual increase in assumed cost trend rates would increase the December 31, 2012 accumulated postretirement benefit obligation by approximately $1.2 million, and the aggregate of the service and interest cost components of net periodic postretirement benefit cost for the year ended December 31, 2012 by approximately $180 thousand. The effect of a 1% annual decrease in assumed cost trend rates would decrease the December 31, 2012 accumulated postretirement benefit obligation by approximately $985 thousand, and the aggregate of the service and interest cost components of net periodic postretirement benefit cost for the year ended December 31, 2012 by approximately $150 thousand.
We also sponsor the Waddell & Reed Financial, Inc. Supplemental Executive Retirement Plan, as amended and restated (the "SERP"), a non-qualified deferred compensation plan covering eligible employees. The SERP provides certain benefits for Company officers that the Pension Plan is prevented from providing because of compensation and benefit limits in the Internal Revenue Code.Code (the "IRC").
The SERP was adopted to supplement the annual pension paid to certain senior executive officers. Each calendar year, the Compensation Committee of the Board of Directors (the "Compensation Committee") credits participants' SERP accounts with (i) an amount equal to 4% of the executive's base salary, less the amount of the maximum employer matching contribution available under our 401(k) plan, and (ii) a non-formula award, if any, as determined by the Compensation Committee in its discretion. There were no discretionary awards made to participants during 2012, 20112015, 2014 or 2010.2013. Additionally, each calendar year, participants' accounts are credited (or charged) with an amount equal to the performance of certain hypothetical investment vehicles since the last preceding year. Upon a participant's separation, or at such other time based on a pre-existing election by a participant, benefits accumulated under the SERP are payable in installments or in a lump sum. As of December 31, 20122015 and 2011,2014, the aggregate liability to participants was $3.7$3.8 million.
At December 31, 2012,2015, the accrued pension and postretirement liability recorded in the consolidated balance sheet was comprised of accrued pension costs of $50.3$36.9 million, a liability for postretirement benefits in the amount of $8.5$8.1 million and an accrued liability for SERP benefits of $3.7$3.8 million. The current portion of postretirement liability of $0.3 million is included in other current liabilities on the consolidated balance sheet. At December 31, 2011,2014, the accrued pension and postretirement liability recorded on the consolidated balance sheet was comprised of accrued pension costs of $45.0$32.5 million, a liability for postretirement benefits in the amount of $7.8$9.6 million and an accrued liability for SERP benefits of $3.7$3.8 million. The current portion of postretirement liability of $0.3 million is included in other current liabilities on the consolidated balance sheet.
11.10. Employee Savings Plan
We sponsor a defined contribution plan that qualifies under Section 401(k) of the Internal Revenue CodeIRC to provide retirement benefits to substantially all of our employees following the completion of an eligibility period.employees. As allowed under Section 401(k), the plan provides tax-deferred salary deductions for eligible employees. Our matching contributions to the plan for the years ended December 31, 2012, 20112015, 2014 and 20102013 were $4.7$6.6 million, $4.5$6.4 million and $4.1$5.1 million, respectively.
11. Stockholders' Equity
Earnings per Share
For the years ended December 31, 2015, 2014 and 2013, earnings per share were computed as follows:
| | 2015 | 2014 | 2013 | ||||||
|---|---|---|---|---|---|---|---|---|---|
| | (in thousands, except per share amounts) | ||||||||
Net income | $ | 245,536 | 313,331 | 252,998 | |||||
Weighted average shares outstanding, basic and diluted | 83,499 | 84,485 | 85,589 | ||||||
Earnings per share, basic and diluted | $ | 2.94 | 3.71 | 2.96 | |||||
WADDELL & REED FINANCIAL, INC.
NOTES TO CONSOLIDATED FINANCIAL STATEMENTS (Continued)
December 31, 2012, 20112015, 2014 and 20102013
12. Stockholders' Equity
Earnings per Share
For the years ended December 31, 2012, 2011 and 2010, earnings per share from continuing operations were computed as follows:
| | 2012 | 2011 | 2010 | ||||||
|---|---|---|---|---|---|---|---|---|---|
| | (in thousands, except per share amounts) | ||||||||
Net income from continuing operations | $ | 192,528 | 172,205 | 153,428 | |||||
Weighted average shares outstanding — basic | 85,726 | 85,783 | 85,618 | ||||||
Dilutive potential shares from stock options | 2 | 10 | 29 | ||||||
Weighted average shares outstanding — diluted | 85,728 | 85,793 | 85,647 | ||||||
Earnings per share from continuing operations, basic and diluted | $ | 2.25 | 2.01 | 1.79 | |||||
Anti-dilutive Securities
There were no anti-dilutive options for the year ended December 31, 2012. Options to purchase 16 thousand shares and 203 thousand shares of Class A common stock ("common stock") were excluded from the diluted earnings per share calculation for the years ended December 31, 2011 and 2010, respectively, because they were anti-dilutive.
Dividends
We declared dividends on our common stock of $2.03$1.75 per share, $0.85$1.45 per share and $0.77$1.18 per share for the years ended December 31, 2012, 20112015, 2014 and 2010,2013, respectively. The Board of Directors approved a special cash dividend on our common stock of $1.00 per share (included in the 2012 total above) that was paid on December 6, 2012, and an increase in the quarterly dividend on our common stock from $0.25$0.43 per share to $0.28$0.46 per share beginning with ourthe dividend declared in the fourth quarter 2012 dividend,2015 and paid on February 1, 2013.2016, to stockholders of record on January 11, 2016. As of December 31, 20122015 and 2011,2014, other current liabilities included $24.0$38.1 million and $21.4$36.0 million, respectively, for dividends payable to stockholders.
Common Stock Repurchases
The Board of Directors has authorized the repurchase of our common stock in the open market and/or private purchases. The acquired shares may be used for corporate purposes, including shares issued to employees in our stock-based compensation programs. There were 1,536,9681,955,509 shares, 1,951,3312,252,152 shares and 2,043,5451,492,535 shares repurchased in the open market or privately during the years ended December 31, 2012, 20112015, 2014 and 2010,2013, respectively, which includes 568,568432,353 shares, 494,207599,340 shares and 426,665665,035 shares repurchased from employees who elected to tender shares to cover their minimum tax withholdings with respect to vesting of stock awards during the years ended December 31, 2012, 20112015, 2014 and 2010,2013, respectively.
13.Accumulated Other Comprehensive Loss
The following table summarizes other comprehensive income (loss) activity for the years ended December 31, 2015 and 2014.
Year ended December 31, 2015 | Unrealized (gains) losses on investment securities | Change in valuation allowance for unrealized gains (losses) on investment securities | Pension and postretirement benefits | Total accumulated other comprehensive income (loss) | ||||||||
|---|---|---|---|---|---|---|---|---|---|---|---|---|
| | (in thousands) | |||||||||||
Balance at December 31, 2014 | $ | (727) | (1,471) | (48,245) | (50,443) | |||||||
Other comprehensive loss before reclassification | (2,464) | (1,463) | (9,897) | (13,824) | ||||||||
Amount reclassified from accumulated other comprehensive income | (538) | (306) | 3,606 | 2,762 | ||||||||
| | | | | | | | | | | | | |
Net current period other comprehensive loss | (3,002) | (1,769) | (6,291) | (11,062) | ||||||||
| | | | | | | | | | | | | |
Balance at December 31, 2015 | $ | (3,729) | $ | (3,240) | (54,536) | (61,505) | ||||||
| | | | | | | | | | | | | |
| | | | | | | | | | | | | |
| | | | | | | | | | | | | |
WADDELL & REED FINANCIAL, INC.
NOTES TO CONSOLIDATED FINANCIAL STATEMENTS (Continued)
December 31, 2015, 2014 and 2013
Year ended December 31, 2014 | Unrealized (gains) losses on investment securities | Change in valuation allowance for unrealized gains (losses) on investment securities | Pension and postretirement benefits | Total accumulated other comprehensive income (loss) | ||||||||
|---|---|---|---|---|---|---|---|---|---|---|---|---|
| | (in thousands) | |||||||||||
Balance at December 31, 2013 | $ | 3,150 | 810 | (19,819) | (15,859) | |||||||
Other comprehensive loss before reclassification | (636) | (381) | (29,689) | (30,706) | ||||||||
Amount reclassified from accumulated other comprehensive income | (3,241) | (1,900) | 1,263 | (3,878) | ||||||||
| | | | | | | | | | | | | |
Net current period other comprehensive loss | (3,877) | (2,281) | (28,426) | (34,584) | ||||||||
| | | | | | | | | | | | | |
Balance at December 31, 2014 | $ | (727) | $ | (1,471) | (48,245) | (50,443) | ||||||
| | | | | | | | | | | | | |
| | | | | | | | | | | | | |
| | | | | | | | | | | | | |
Reclassifications from accumulated other comprehensive income and included in net income are summarized in the table that follows for the years ended December 31, 2015 and 2014.
| | For the year ended December 31, 2015 | | |||||||||
|---|---|---|---|---|---|---|---|---|---|---|---|
| | Pre-tax | Tax (expense) benefit | Net of tax | Statement of income line item | |||||||
| | (in thousands) | | |||||||||
Reclassifications included in net income: | |||||||||||
Sponsored funds investment gains | $ | 850 | (312) | 538 | Investment and other income (loss) | ||||||
Valuation allowance | — | 306 | 306 | Provision for income taxes | |||||||
Amortization of pension and postretirement benefits | (5,654) | 2,048 | (3,606) | Underwriting and distribution expense and Compensation and related costs | |||||||
| | | | | | | | | | | | |
Total | $ | (4,804) | 2,042 | (2,762) | |||||||
| | | | | | | | | | | | |
| | | | | | | | | | | | |
| | | | | | | | | | | | |
WADDELL & REED FINANCIAL, INC.
NOTES TO CONSOLIDATED FINANCIAL STATEMENTS (Continued)
December 31, 2015, 2014 and 2013
| | For the year ended December 31, 2014 | | |||||||||
|---|---|---|---|---|---|---|---|---|---|---|---|
| | Pre-tax | Tax (expense) benefit | Net of tax | Statement of income line item | |||||||
| | (in thousands) | | |||||||||
Reclassifications included in net income: | |||||||||||
Realized gain on sale of sponsored investment securities | $ | 5,146 | (1,905) | 3,241 | Investment and other income (loss) | ||||||
Valuation allowance | — | 1,900 | 1,900 | Provision for income taxes | |||||||
Amortization of pension and postretirement benefits | (2,007) | 744 | (1,263) | Underwriting and distribution expense and Compensation and related costs | |||||||
| | | | | | | | | | | | |
Total | $ | 3,139 | 739 | 3,878 | |||||||
| | | | | | | | | | | | |
| | | | | | | | | | | | |
| | | | | | | | | | | | |
12. Share-Based Compensation
TheDuring 2015 the Company hashad three stock-based compensation plans: the Company 1998 Stock Incentive Plan, as amended and restated (the "SI Plan"), the Company 1998 Executive Stock Award Plan, as amended and
WADDELL & REED FINANCIAL, INC.
NOTES TO CONSOLIDATED FINANCIAL STATEMENTS (Continued)
December 31, 2012, 2011 and 2010
restated (the "ESA Plan") and the Company 1998 Non-Employee Director Stock Award Plan, as amended and restated (the "NED Plan") (collectively, the "Stock Plans"). There are no outstanding awards under the ESA Plan or the NED Plan and in February 2016, the Board of Directors terminated both plans.
The SI Plan allows us to grant equity compensation awards, including, among other awards, non-qualified stock options and nonvested stock as part of our overall compensation program to attract and retain key personnel and encourage a greater personal financial investment in the Company. All of the Stock Plans also allow us to grant non-qualified stock options and/or nonvested stock to promoteCompany, thereby promoting the long-term growth of the Company. A maximum of 30.0 million shares of common stock are authorized for issuance under the SI Plan. A maximum of 3.75 million and 1.2 million shares of common stock arewere authorized for issuance under the ESA Plan and NED Plan, respectively. In total, 8,811,3183,684,157 shares of common stock arewere available for issuance as of December 31, 20122015, under these plans.plans, including 294,658 shares under the SI Plan. In addition, we may make incentive payments under the Company 2003 Executive Incentive Plan, as amended and restated (the "EIP") in the form of cash, stock options, nonvested stock or a combination thereof. Incentive awards paid under the EIP in the form of stock options or nonvested stock or granted following the conversion of cash bonus amounts into stock options and/or nonvested stock, are issued out of shares reserved for issuance under the SI and ESA Plans.Plan. Generally, shares of common stock covered by terminated, surrendered or cancelled options, by forfeited nonvested stock, or by the forfeiture of other awards that do not result in issuance of shares of common stock are again available for awards under the plan from which they were terminated, surrendered, cancelled or forfeited.
Under our Stock Plans,SI Plan, the exercise price of a stock option is equal to the closing market price of Company common stock on the date of grant. The maximum term of non-qualified options granted under the SI Plan is ten10 years and two days and the options generally vest in 331/3% increments on the second, third and fourth anniversaries of the grant date. The maximum term of non-qualified options granted under the ESA Plan and NED Plan is 11 years and the options generally vest 10% each year, beginning on the first anniversary of the grant date. Our Stock Plans include a Stock Option Restoration Program feature (the "SORP") that allows, on the first trading day of August, a holder to pay the exercise price on vested in-the-money options by surrendering common stock of the Company that has been owned for at least six months. This feature also permits a holder exercising an option to be granted new options in an amount equal to the number of common shares used to satisfy both the exercise price and withholding taxes due upon exercise. New options are granted with an expiration date equal to that of the original option and vest six months after the grant date. The SORP results in a net issuance of shares of common stock and fewer stock options outstanding. We receive a current income tax benefit for stock option exercises.
WADDELL & REED FINANCIAL, INC.
NOTES TO CONSOLIDATED FINANCIAL STATEMENTS (Continued)
December 31, 2015, 2014 and 2013
Nonvested stock awards are valued on the date of grant, have no purchase price and generally vest over four years in 331/3% increments on the second, third and fourth anniversaries of the grant date. The Company also issues nonvested stock awards to our financial advisors (our sales force) who are independent contractors. These awards have the same terms as awards issued to employees; however, changes in the Company's share price result in variable compensation expense over the vesting period. Under the Stock Plans,SI Plan, nonvested shares are forfeited upon the termination of employment with or service to the Company, as applicable, or service on the Board of Directors, dependent upon the circumstances of termination. Except for restrictions placed on the transferability of nonvested stock, holders of nonvested stock have full stockholders' rights during the term of restriction, including voting rights and the rights to receive cash dividends.
Table of ContentsStock Options
WADDELL & REED FINANCIAL, INC.
NOTES TO CONSOLIDATED FINANCIAL STATEMENTS (Continued)
December 31, 2012, 2011 and 2010
A summary of stock option activity and related information for the year ended December 31, 2012 is presented in the table below. All There are no options outstanding expire in 2013.
| | Options | Weighted average exercise price | Weighted average remaining contractual term (in years) | ||||||
|---|---|---|---|---|---|---|---|---|---|
Outstanding at December 31, 2011 | 27,595 | $ | 28.64 | 0.62 | |||||
Granted | — | — | |||||||
Exercised | (5,000) | 21.09 | |||||||
Terminated/Canceled | (16,224) | 33.94 | |||||||
Outstanding at December 31, 2012 | 6,371 | $ | 21.09 | 0.50 | |||||
Exercisable at December 31, 2012 | 6,371 | $ | 21.09 | 0.50 | |||||
The aggregate intrinsic value of outstanding options and exercisable options as of December 31, 2012 was $87 thousand.2015. The total intrinsic value (on date of exercise) of options exercised during the yearsyear ended December 31, 2012, 2011 and 20102013 was $72 thousand, $1.4 million and $2.0 million, respectively.$139 thousand. The related income tax benefit recognized in 2013 was $26 thousand, $0.5 million and $0.6 million for the years ended December 31, 2012, 2011 and 2010, respectively.$51 thousand.
Nonvested Stock
A summary of nonvested share activity and related fair value for the year ended December 31, 20122015 follows:
| | Nonvested Stock Shares | Weighted Average Grant Date Fair Value | Nonvested Stock Shares | Weighted Average Grant Date Fair Value | ||||||||
|---|---|---|---|---|---|---|---|---|---|---|---|---|
Nonvested at December 31, 2011 | 4,868,017 | $ | 31.52 | |||||||||
Nonvested at December 31, 2014 | 3,442,202 | $ | 48.37 | |||||||||
Granted | 1,739,775 | 33.43 | 1,406,569 | 44.72 | ||||||||
Vested | (1,600,553) | 27.89 | (1,188,908) | 38.90 | ||||||||
Forfeited | (93,159) | 33.69 | (254,656) | 49.39 | ||||||||
Nonvested at December 31, 2012 | 4,914,080 | $ | 33.34 | |||||||||
| | | | | | | |||||||
Nonvested at December 31, 2015 | 3,405,207 | $ | 50.09 | |||||||||
| | | | | | | |||||||
| | | | | | ||||||||
| | | | | | | |||||||
For the years ended December 31, 2012, 20112015, 2014 and 2010,2013, compensation expense for continuing operations related to nonvested stock totaled $48.7$47.5 million, $45.4$54.1 million and $39.1$53.2 million, respectively. For
The income tax benefit from the years ended December 31, 2012, 2011, and 2010, compensation expense for discontinued operations related to nonvested stock totaled $1.2was $17.6 million, $1.1$20.1 million and $1.2 million, respectively.
WADDELL & REED FINANCIAL, INC.
NOTES TO CONSOLIDATED FINANCIAL STATEMENTS (Continued)
December 31, 2012, 2011 and 2010
The related income tax benefit was $17.9 million, $16.7 million and $14.4$19.6 million for the years ended December 31, 2012, 20112015, 2014 and 2010,2013, respectively. These benefits will be recognized upon vesting and may increase or decrease depending on the fair value of the shares on the date of vesting. As of December 31, 2012,2015, the remaining unamortized expense of $107.2$115.3 million is expected to be recognized over a weighted average period of 2.32.4 years.
The total fair value of shares vested (at vest date) during the years ended December 31, 2012, 20112015, 2014 and 20102013, was $53.5$53.9 million, $52.5$104.8 million and $46.5$80.5 million, respectively. The Company permits employees the right to tender a portion of their vested shares to the Company to satisfy the minimum tax withholding obligations of the Company with respect to vesting of the shares. During 2013, we expect to repurchase approximately 670 thousand shares from employees who elect to tender shares to cover their minimum tax withholdings.
WADDELL & REED FINANCIAL, INC.
NOTES TO CONSOLIDATED FINANCIAL STATEMENTS (Continued)
December 31, 2015, 2014 and 2013
13. Uniform Net Capital Rule Requirements
Two of our subsidiaries, Waddell & Reed, Inc. ("W&R") and Ivy Funds Distributor, Inc. ("IFDI") are registered broker/dealers and members of the Financial Industry Regulatory Authority. A third broker/dealer subsidiary, Legend Equities Corporation ("LEC"), was sold as part of the Legend transaction, effective January 1, 2013.Authority, Inc.. Broker/dealers are subject to the SEC's Uniform Net Capital Rule (Rule 15c3-1), which requires the maintenance of minimum net capital and requires that the ratio of aggregate indebtedness to net capital, both as defined, shall not exceed 15.0 to 1.0. The primary difference between net capital and stockholders' equity is the non-allowable assets that are excluded from net capital.
A broker/dealer may elect not to be subject to the Aggregate Indebtedness Standard of paragraph (a)(1)(i) of Rule 15c3-1, in which case net capital must exceed the greater of $250 thousand or 2% of aggregate debit items computed in accordance with the Formula for Determination of Reserve Requirements for broker/dealers. W&R made this election and thus is not subject to the aggregate indebtedness ratio as of December 31, 20122015 or 2011.2014.
Net capital and aggregated indebtedness information for our broker/dealer subsidiaries is presented in the following table as of December 31, 20122015 and 2011:2014:
| | 2012 | 2011 | 2015 | 2014 | ||||||||||||||||||||||||||
|---|---|---|---|---|---|---|---|---|---|---|---|---|---|---|---|---|---|---|---|---|---|---|---|---|---|---|---|---|---|---|
| | (in thousands) | (in thousands) | ||||||||||||||||||||||||||||
| | W&R | LEC | IFDI | W&R | LEC | IFDI | W&R | IFDI | W&R | IFDI | ||||||||||||||||||||
Net capital | $ | 24,690 | 782 | 19,681 | 34,524 | 1,654 | 45,579 | $ | 21,719 | 17,310 | 10,965 | 19,455 | ||||||||||||||||||
Required capital | 250 | 268 | 2,648 | 250 | 251 | 2,353 | 250 | 2,956 | 250 | 3,995 | ||||||||||||||||||||
| | | | | | | | | | | | | | ||||||||||||||||||
Excess of required capital | $ | 24,440 | 514 | 17,033 | 34,274 | 1,403 | 43,226 | $ | 21,469 | 14,354 | 10,715 | 15,460 | ||||||||||||||||||
| | | | | | | | | | | | | | ||||||||||||||||||
| | | | | | | | | | ||||||||||||||||||||||
| | | | | | | | | | | | | | ||||||||||||||||||
Ratio of aggregate indebtedness to net capital | Not | 5.14 to 1.0 | 2.02 to 1.0 | Not | 2.28 to 1.0 | 0.77 to 1.0 | Not | 2.56 to 1.0 | Not | 3.08 to 1.0 | ||||||||||||||||||||
WADDELL & REED FINANCIAL, INC.
NOTES TO CONSOLIDATED FINANCIAL STATEMENTS (Continued)
December 31, 2012, 2011 and 2010
15.14. Rental Expense and Lease Commitments
We lease ourcertain home office buildings, certain sales and other office space and equipment under long-term operating leases. Rent expense was $21.9$23.7 million, $21.6$22.6 million and $21.5$22.5 million, for the years ended December 31, 2012, 20112015, 2014 and 2010,2013, respectively. Future minimum rental commitments under non-cancelable operating leases are as follows:
Year | Commitments | Commitments | ||||
|---|---|---|---|---|---|---|
| | (in thousands) | (in thousands) | ||||
2013 | $ | 20,498 | ||||
2014 | 16,749 | |||||
2015 | 13,249 | |||||
2016 | 10,164 | $ | 22,564 | |||
2017 | 7,149 | 18,042 | ||||
2018 | 13,622 | |||||
2019 | 8,971 | |||||
2020 | 4,606 | |||||
Thereafter | 21,577 | 12,195 | ||||
| | | | | |||
| $ | 80,000 | |||||
| $ | 89,386 | |||||
| | | | | |||
| | | | ||||
| | | | | |||
New leases are expected to be executed as existing leases expire. Thus, future minimum lease commitments are not expected to be materially different than those in 2012.2015.
16.
WADDELL & REED FINANCIAL, INC.
NOTES TO CONSOLIDATED FINANCIAL STATEMENTS (Continued)
December 31, 2015, 2014 and 2013
15. Related Party Transactions
We earn investment management fee revenues from the Funds and IGI Funds for which we also act as an investment adviser, pursuant to an investment management agreement with each Fund. In addition, we have agreements with the Funds pursuant to Rule 12b-1 under the Investment Company Act of 1940, as amended, pursuant to which distribution and service fees are collected from the Funds for distribution of mutual fund shares, for costs such as advertising and commissions paid to broker/dealers, and for providing ongoing services to shareholders of the Funds and/or maintaining shareholder accounts. We also earn service fee revenues by providing various services to the Funds and their shareholders pursuant to a shareholder servicing agreement with each Fund (except the Ivy Funds VIP) and an accounting service agreement with each Fund. Certain of our officers and directors are also officers and/or trustees for the various Funds for which we act as an investment adviser. These agreements are approved or renewed on an annual basis by each Fund's board of trustees, including a majority of the disinterested members.
Revenues for services provided or related to the Funds and IGI Funds for the years ended December 31, 2015, 2014 and 2013 are as follows:
| | 2015 | 2014 | 2013 | |||||||
|---|---|---|---|---|---|---|---|---|---|---|
| | (in thousands) | |||||||||
Investment management fees | $ | 654,727 | 709,179 | 602,120 | ||||||
Rule 12b-1 service and distribution fees | 303,046 | 338,846 | 299,442 | |||||||
Shareholder service fees | 143,071 | 150,979 | 137,093 | |||||||
| | | | | | | | | | | |
Total revenues | $ | 1,100,844 | 1,199,004 | 1,038,655 | ||||||
| | | | | | | | | | | |
| | | | | | | | | | | |
| | | | | | | | | | | |
Included in Funds and separate accounts receivable includes amountsat December 31, 2015 and 2014 are receivables due from the Funds for aforementioned services.of $26.7 and $30.3 million respectively.
17.16. Contingencies
The Company is involved from time to time in various legal proceedings, regulatory investigations and claims incident to the normal conduct of business, which may include proceedings that are specific to us and others generally applicable to business practices within the industries in which we operate. A substantial legal liability or a significant regulatory action against us could have an adverse effect on our business, financial condition and on the results of operations in a particular quarter or year.
The Company accrues an undiscounted liabilityestablishes reserves for litigation and similar matters when those matters present material loss contingencies where the incurrence of a loss isthat management determines to be both probable and the amount can be reasonably estimated.estimable in accordance with ASC 450,"Contingencies Topic." These amounts are not reduced by amounts that may be recovered under insurance or claims against third parties, but undiscounted receivables from insurers or other third parties may be accrued separately. The Company regularly revises such accruals in
WADDELL & REED FINANCIAL, INC.
NOTES TO CONSOLIDATED FINANCIAL STATEMENTS (Continued)
December 31, 2012, 2011 and 2010
light of new information. For contingencies where an unfavorable outcome is reasonably possible and that are significant, theThe Company discloses the nature of the contingency when management believes it is reasonably possible the outcome may be significant to the Company's consolidated financial statements and, where feasible, an estimate of the possible loss. For purposes of our litigation contingency disclosures, "significant" includes material matters as well as other items that management believes should be disclosed. ManagementManagement's judgment is required related to contingent liabilities andbecause the outcome of litigation because bothoutcomes are difficult to predict.
Michael E. Taylor, Kenneth B. Young, individuals, on behalf of themselves individually and on behalf of others similarly situated v. Waddell & Reed, Inc., a Delaware Corporation; and DOES 1 through 10 inclusive; Case No. 09-CV-2909 DMS WVG; in the United States District Court for the Southern District of California.
In this action filed December 28, 2009, the Company was sued in an individual action, class action and Fair Labor Standards Act ("FLSA") nationwide collective action by two former advisors asserting misclassification of financial advisors as independent contractors instead of employees. Plaintiffs, on behalf of themselves and a purported class of Waddell & Reed, Inc. financial advisors, assert claims under the FLSA for minimum wages and overtime wages, and under California Labor Code Statutes for timely payment of wages, minimum wages, overtime compensation, meal periods, reimbursement of losses and business expenses and itemized wage statements and a claim for Unfair Business Practices under §17200 of the California Business & Professions Code. Plaintiffs seek declaratory and injunctive relief and monetary damages.
Plaintiffs moved for conditional collective action certification under the FLSA. The Company opposed this motion and additionally moved for summary judgment on Plaintiffs' individual FLSA claims. The Court issued an order on January 3, 2012 granting the Company's summary judgment motions, holding that Plaintiffs' individual FLSA claims fail as a matter of law, and denying Plaintiffs' motion for conditional collective action certification under the FLSA as moot. This ruling effectively removes all nationwide FLSA claims from the case.
Subsequently, the Company moved for summary judgment on Plaintiffs' individual California claims. The Court issued an order on August 20, 2012 granting the Company's summary judgment motions, holding that Plaintiffs' individual California claims fail as a matter of law. This order effectively dismissed Plaintiffs from the case, both individually and as putative class representatives.
However, in its August 20, 2012 order, the Court also granted Plaintiffs' motion to add a new individual and putative class representative to the action, effectively replacing the originally named Plaintiffs. The newly named Plaintiff continued to pursue the California claims referenced above on behalf of the putative class, as well as newly added representative derivative claims under the California Private Attorney General Act.
The Company moved for summary judgment, asking the Court to dismiss the newly named Plaintiff's individual claims. The arguments made in support of this request were the same as those that prevailed in the Taylor and Young motions for summary judgment. On February 1, 2013, the Court issued an order granting the Company's summary judgment motion. This ruling effectively dismisses all remaining claims in the case in their entirety, pending appeal. No appeal has yet been filed. The Company intends to continue to vigorously defend the matter at appeal, if any.
WADDELL & REED FINANCIAL, INC.
NOTES TO CONSOLIDATED FINANCIAL STATEMENTS (Continued)
December 31, 2012, 20112015, 2014 and 20102013
In an action filed on February 18, 2016 in the United States District Court for the District of Kansas,Saket Kapor(sic), Peter Brockett and Hieu Phan v. Ivy Investment Management Company, et. al. (Case No. 2:16-cv-02106-JWL-TJJ), the Company's registered investment advisor subsidiaries, the trustees of two of the Company's affiliated mutual funds, and an officer of a Company subsidiary were sued in a putative derivative action by three mutual fund shareholders alleging breach of fiduciary duty and breach of contract claims relating to investments held in the affiliated mutual funds. On behalf of the mutual funds, Plaintiffs seek monetary damages and demand a jury trial. To date, no responsive pleading has been filed and no discovery has taken place.
In the opinion of management, the ultimate resolution and outcome of this matter is uncertain. Given the preliminary nature of the proceedings and the Company's dispute over the merits of the claims, the Company is unable to estimate a range of reasonably possible loss, if any, that such matter may represent. While the ultimate resolution of this matter is uncertain, an adverse determination against the Company could have a material adverse impact on our business, financial condition and results of operations.
17. Concentrations of Credit Risk
Financial instruments that potentially subject the Company to concentrations of credit risk consist primarily of cash and cash equivalents held. The Company maintains cash and cash equivalents with various financial institutions. Cash deposits maintained at financial institutions may exceed the federally insured limit.
18. Selected Quarterly Information (Unaudited)
| | Quarter | ||||||||||||
|---|---|---|---|---|---|---|---|---|---|---|---|---|---|
| | First | Second | Third | Fourth | |||||||||
| | (in thousands) | ||||||||||||
2012 | |||||||||||||
Total revenues | $ | 287,871 | 289,686 | 293,365 | 302,883 | ||||||||
Income from continuing operations | 46,837 | 41,225 | 52,116 | 52,350 | |||||||||
Income (loss) from discontinued operations | 550 | 493 | (43,590) | (1) | 971 | ||||||||
Net income | $ | 47,387 | 41,718 | 8,526 | 53,321 | ||||||||
Net income per share, basic and diluted: | |||||||||||||
Income from continuing operations | $ | 0.55 | 0.48 | 0.61 | 0.61 | ||||||||
Income (loss) from discontinued operations | — | — | (0.51) | 0.01 | |||||||||
Net income | $ | 0.55 | 0.48 | 0.10 | 0.62 | ||||||||
| | Quarter | ||||||||||||
|---|---|---|---|---|---|---|---|---|---|---|---|---|---|
| | First | Second | Third | Fourth | |||||||||
| | (in thousands) | ||||||||||||
2015 | |||||||||||||
Total revenues | $ | 385,458 | 393,990 | 376,109 | 361,074 | ||||||||
Net income | $ | 67,113 | 67,445 | 48,058 | 62,920 | ||||||||
Net income per share, basic and diluted | $ | 0.80 | 0.80 | 0.58 | 0.76 | ||||||||
| | Quarter | ||||||||||||
|---|---|---|---|---|---|---|---|---|---|---|---|---|---|
| | First | Second | Third | Fourth | |||||||||
| | (in thousands) | ||||||||||||
2011 | |||||||||||||
Total revenues | $ | 278,435 | 291,195 | 280,341 | 272,561 | ||||||||
Income from continuing operations | 44,369 | 49,094 | 39,371 | 39,371 | |||||||||
Income from discontinued operations | 1,264 | 876 | 463 | 651 | |||||||||
Net income | $ | 45,633 | 49,970 | 39,834 | 40,022 | ||||||||
Net income per share, basic and diluted: | |||||||||||||
Income from continuing operations | $ | 0.52 | 0.57 | 0.46 | 0.46 | ||||||||
Income from discontinued operations | 0.01 | 0.01 | — | 0.01 | |||||||||
Net income | $ | 0.53 | 0.58 | 0.46 | 0.47 | ||||||||
| | Quarter | ||||||||||||
|---|---|---|---|---|---|---|---|---|---|---|---|---|---|
| | First | Second | Third | Fourth | |||||||||
| | (in thousands) | ||||||||||||
2014 | |||||||||||||
Total revenues | $ | 390,416 | 400,634 | 409,558 | 397,151 | ||||||||
Net income | $ | 74,864 | 82,988 | 74,586 | 80,893 | ||||||||
Net income per share, basic and diluted | $ | 0.88 | 0.98 | 0.89 | 0.97 | ||||||||
WADDELL & REED FINANCIAL, INC.
| Exhibit No. | Exhibit Description | |
|---|---|---|
| 3.1 | Restated Certificate of Incorporation of Waddell & Reed Financial, Inc. Filed as Exhibit 3.1 to the Company's Quarterly Report on Form 10-Q, File No. 333-43687, for the quarter ended June 30, 2006 and incorporated herein by reference. | |
3.2 | Amended and Restated Bylaws of Waddell & Reed Financial, Inc. Filed as Exhibit 3.1 to the Company's Current Report on Form 8-K, File No. 001-13913, filed | |
4.1 | Specimen of Class A Common Stock Certificate, par value $0.01 per share. Filed as Exhibit 4.1 to the Company's Registration Statement on Form S-1/A, File No. 333-43687, on February 27, 1998 and incorporated herein by reference. | |
4.2 | Certificate of Designation, Preferences and Rights of Series B Junior Participating Preferred Stock of Waddell & Reed Financial, Inc., as filed on April 9, 2009 with the Secretary of State of the State of Delaware. Filed as Exhibit 4.1 to the Company's Current Report on Form 8-K, File No. 333-43687, on April 10, 2009 and incorporated herein by reference. | |
4.3 | Rights Agreement, dated as of April 8, 2009, by and between Waddell & Reed Financial, Inc. and Computershare Trust Company, N.A., which includes the Certificate of Designation, Preferences and Rights of Series A Junior Participating Preferred Stock of the Company, as filed on April 9, 2009 with the Secretary of State of Delaware, as Exhibit A and the form of Rights Certificate as Exhibit B. Filed as Exhibit 4.2 to the Company's Current Report on Form 8-K, File No. 333-43687, on April 10, 2009 and incorporated herein by reference. | |
Form of Indenture to be used in connection with the Senior Debt Securities. Filed as Exhibit | ||
4.5 | Form of Indenture to be used in connection with the Subordinated Debt Securities. Filed as Exhibit 4.7 to the Company's Form S-3ASR, File No. 333-201536, on January 16, 2015 and incorporated herein by reference. | |
10.1 | General Agent Contract, dated as of October 20, 2000, by and among Nationwide Life Insurance Company, Nationwide Life and Annuity Insurance Company and Waddell & Reed, Inc. and its affiliated insurance companies. Filed as Exhibit 10.5 to the Company's Annual Report on Form 10-K, File No. 001-13913, for the year ended December 31, 2000 and incorporated herein by reference. | |
10.2 | Administrative and Marketing Services Agreement, dated as of January 1, 2012, by and among Nationwide Life Insurance Company, Nationwide Life and Annuity Insurance Company and Waddell & Reed, Inc. and its affiliated insurance companies. Filed as Exhibit 10.2 to the Company's Annual Report on Form 10-K, File No. 001-13913, for the year ended December 31, 2012 and incorporated herein by reference. | |
10.3 | Fund Participation Agreement, dated as of December 1, 2000, by and among Nationwide Life Insurance Company and/or Nationwide Life and Annuity Insurance Company, Waddell & Reed Services Company and Waddell & Reed, Inc. Filed as Exhibit 10.6 to the Company's Annual Report on Form 10-K, File No. 001-13913, for the year ended December 31, 2000 and incorporated herein by reference. |
| Exhibit No. | Exhibit Description | |
|---|---|---|
| 10.4 | Fund Participation Agreement, dated as of September 19, 2003, by and among Minnesota Life Insurance Company, Waddell & Reed, Inc. and Ivy Funds VIP. Filed as Exhibit 10.3 to the Company's Annual Report on Form 10-K, File No. 333-43687, for the year ended December 31, 2007 and incorporated herein by reference. |
10.5 | ||
| Variable Products Distribution Agreement, dated as of December 12, 2003, by and among Minnesota Life Insurance Company, Securian Financial Services, Inc. and Waddell & Reed, Inc. and its affiliated insurance companies. Filed as Exhibit 10.4 to the Company's Annual Report on Form 10-K, File No. 333-43687, for the year ended December 31, 2004 and incorporated herein by reference. | ||
10.6 | Waddell & Reed Financial, Inc. 1998 Stock Incentive Plan, as amended and restated. Filed as Exhibit 10.6 to the Company's Annual Report on Form 10-K, File No. 333-43687, for the year ended December 31, 2008 and incorporated herein by reference.* | |
10.7 | Waddell & Reed Financial, Inc. 1998 Stock Incentive Plan, as amended and restated. Filed as Exhibit 10.7 to the Company's Annual Report on Form 10-K, File No. 001-13913, for the year ended December 31, 2011 and incorporated herein by reference.* | |
10.8 | Waddell & Reed Financial, Inc. 1998 Executive Stock Award Plan, as amended and restated. Filed as Exhibit | |
Waddell & Reed Financial, Inc. 1998 Non-Employee Director Stock Award Plan, as amended and restated. Filed as Exhibit 10.2 to the Company's Quarterly Report on Form 10-Q, File No. 001-13913, for the quarter ended September 30, 2012 and incorporated herein by reference.* | ||
Credit Agreement, dated | ||
Note Purchase Agreement, dated August 31, 2010, by and among Waddell & Reed Financial, Inc. and the purchasers party thereto. Filed as Exhibit 10.2 to the Company's Current Report on Form 8-K, File No. 001-13913, on September 7, 2010 and incorporated herein by reference. | ||
Waddell & Reed Financial, Inc. Supplemental Executive Retirement Plan, as amended and restated. Filed as Exhibit 10.11 to the Company's Annual Report on Form 10-K, File No. 333-43687, for the year ended December 31, 2008 and incorporated herein by reference.* |
10.13 | ||
| Waddell & Reed Financial, Inc. 2003 Executive Incentive Plan, as amended and restated. Filed as Exhibit 10.1 to the Company's Current Report on Form 8-K, File No. 333-43687, on April 11, 2008 and incorporated herein by reference.* | ||
10.14 | Waddell & Reed Financial, Inc. 2003 Executive Incentive Plan, as amended and restated. Filed as Exhibit 10.17 to the Company's Annual Report on Form 10-K, File No. 001-13913, for the year ended December 31, 2013 and incorporated herein by reference.* |
| Exhibit No. | Exhibit Description | |
|---|---|---|
| 10.15 | Waddell & Reed Financial, Inc. 2003 Executive Incentive Plan, as amended and restated. Filed as Exhibit 10.1 to the Company's Current Report on Form 8-K, File No. 001-13913, on April 17, 2014 and incorporated herein by reference.* | |
10.16 | Investment Management Agreement, dated January 30, 2009, by and between the Advisors Funds and Waddell & Reed Investment Management Company. Filed as Exhibit 10.21 to the Company's Annual Report on Form 10-K, File No. 001-13913, for the year ended December 31, 2009 and incorporated herein by reference. | |
Investment Management Agreement, dated April 10, 2009, by and between Ivy Funds VIP and Waddell & Reed Investment Management Company. Filed as Exhibit 10.26 to the Company's Annual Report on Form 10-K, File No. 001-13913, for the year ended December 31, 2009 and incorporated herein by reference. | ||
Investment Management Agreement, dated April 10, 2009, by and between Ivy Funds VIP and Waddell & Reed Investment Management Company. Filed as Exhibit 10.27 to the Company's Annual Report on Form 10-K, File No. 001-13913, for the year ended December 31, 2009 and incorporated herein by reference. | ||
Investment Management Agreement, dated November 13, 2008, by and between Ivy Funds and Ivy Investment Management Company. Filed as Exhibit 10.18 to the Company's Annual Report on Form 10-K, File No. 001-13913, for the year ended December 31, 2011 and incorporated herein by reference. | ||
Investment Management Agreement, dated April 30, 2009, by and between | ||
Form of Change in Control Employment Agreement, dated December 14, 2001, by and between Henry J. Herrmann and Waddell & Reed Financial, Inc. Filed as Exhibit 10.30 to the Company's Annual Report on Form 10-K, File No. 333-43687, for the year ended December 31, 2001 and incorporated herein by reference.* | ||
First Amendment to Change in Control Employment Agreement, dated December 17, 2008, by and between Henry J. Herrmann and Waddell & Reed Financial, Inc. Filed as Exhibit 10.26 to the Company's Annual Report on Form 10-K, File No. 333-43687, for the year ended December 31, 2008 and incorporated herein by reference.* | ||
Second Amendment to Change in Control Employment Agreement, dated December 17, 2009, by and between Henry J. Herrmann and Waddell & Reed Financial, Inc. Filed as Exhibit 10.52 to the Company's Annual Report on Form 10-K, File No. 001-13913, for the year ended December 31, 2009 and incorporated herein by reference.* |
Form of Restricted Stock Award Agreement for awards pursuant to the Waddell & Reed Financial, Inc. 1998 Stock Incentive Plan, as amended and restated. Filed as Exhibit 10.28 to the Company's Annual Report on Form 10-K, File No. 001-13913, for the year ended December 31, 2011 and incorporated herein by reference.* |
| Exhibit No. | Exhibit Description | |
|---|---|---|
| 10.26 | Form of Restricted Stock Award Agreement for awards pursuant to the Waddell & Reed Financial, Inc. 1998 Stock Incentive Plan, as amended and restated.* | |
Form of Restricted Stock Award Agreement for awards to Non-Employee Directors pursuant to the Waddell & Reed Financial, Inc. 1998 Stock Incentive Plan, as amended and restated. Filed as Exhibit 10.2 to the Company's Quarterly Report on Form 10-Q, File No. 333-43687, for the quarter ended September 30, 2007 and incorporated herein by reference.* | ||
Form of Restricted Stock Award Agreement for awards to Non-Employee Directors pursuant to the Waddell & Reed Financial, Inc. 1998 Stock Incentive Plan, as amended and restated.* | ||
10.29 | Form of Restricted Stock Award Agreement for awards pursuant to the Waddell & Reed Financial, Inc. 1998 Executive Stock Award Plan, as amended and restated. Filed as Exhibit 10.3 to the Company's Quarterly Report on Form 10-Q, File No. 001-13913, for the quarter ended September 30, 2012 and incorporated herein by reference.* | |
Form of Restricted Stock Award Agreement for awards pursuant to the Waddell & Reed Financial, Inc. 1998 | ||
Form of Restricted Stock Award Agreement for awards pursuant to the Waddell & Reed Financial, Inc. 1998 Non-Employee Director Stock Award Plan, as amended and restated. Filed as Exhibit 10.4 to the Company's Quarterly Report on Form 10-Q, File No. 001-13913, for the quarter ended September 30, 2012 and incorporated herein by reference.* | ||
Form of Restricted Stock Award Agreement for awards pursuant to the Waddell & Reed Financial, Inc. 1998 Non-Employee Director Stock Award Plan, as amended and restated.* | ||
10.33 | Portfolio Managers Revenue Sharing Plan for Flow Accounts. Filed as Exhibit 10.64 to the Company's Annual Report on Form 10-K, File No. 001-13913, for the year ended December 31, 2010 and incorporated herein by reference.* | |
Portfolio Managers Revenue Sharing Schedule. Filed as Exhibit 10.65 to the Company's Annual Report on Form 10-K, File No. 001-13913, for the year ended December 31, 2010 and incorporated herein by reference.* | ||
Portfolio Managers Revenue Sharing Schedule—Large Cap Growth. Filed as Exhibit 10.36 to the Company's Annual Report on Form 10-K, File No. 001-13913, for the year ended December 31, 2011 and incorporated herein by reference.* |
10.36 | ||
| Form of Indemnification Agreement. Filed as Exhibit 10.1 to the Company's Current Report on Form 8-K, File No. 001-13913, on November 16, 2009 and incorporated herein by reference.* | ||
10.37 | Release of All Claims, dated June 17, 2014, by and between Daniel P. Connealy and Waddell & Reed Financial, Inc. Filed as Exhibit 10.1 to the Company's Current Report on Form 8-K, File No. 001-13913, on June 19, 2014 and incorporated herein by reference.* | |
10.38 | Confidential Separation Agreement and Release of All Claims, dated July 22, 2015, by and between Michael D. Strohm and W&R Corporate LLC.* | |
10.39 |
| Exhibit No. | Exhibit Description | |
|---|---|---|
| 10.40 | Form of Employment Agreement by and between Waddell & Reed | |
10.41 | Offer of Settlement. Filed as Exhibit 10.1 to the Company's Current Report on Form 8-K, File No. 333-43687, on July 24, 2006 and incorporated herein by reference. | |
10.42 | Assurance of Discontinuance. Filed as Exhibit 10.2 to the Company's Current Report on Form 8-K, File No. 333-43687, on July 24, 2006 and incorporated herein by reference. | |
10.43 | Stipulation for Consent Order. Filed as Exhibit 10.3 to the Company's Current Report on Form 8-K, File No. 333-43687, on July 24, 2006 and incorporated herein by reference. | |
12 | Statement re computation of ratios of earnings to fixed charges | |
21 | Subsidiaries of Waddell & Reed Financial, Inc. | |
23 | Consent of KPMG LLP | |
24 | Powers of Attorney | |
31.1 | Rule 13a-14(a)/15d-14(a) Certification of the Chief Executive Officer | |
31.2 | Rule 13a-14(a)/15d-14(a) Certification of the Chief Financial Officer | |
32.1 | Section 1350 Certification of the Chief Executive Officer | |
32.2 | Section 1350 Certification of the Chief Financial Officer | |
101 | Materials from the Waddell & Reed Financial, Inc. Annual Report on Form 10-K for the year ended December 31, |