| Page No. | ||||||||
PART I
| |||||||||
PART II
| |||||||||
| |||||||||
|
| ||||||||
|
| ||||||||
|
| ||||||||
|
| ||||||||
| |||||||||
Item 5 | Market for | ||||||||
Selected Financial Data | |||||||||
| |||||||||
Quantitative and Qualitative Disclosures About Market Risk | |||||||||
Financial Statements and Supplementary Data | |||||||||
Changes in and Disagreements with Accountants on Accounting and Financial Disclosure | |||||||||
| |||||||||
|
| ||||||||
| |||||||||
Item 10 | Directors, Executive Officers and Corporate Governance | ||||||||
Executive Compensation | |||||||||
Security Ownership of Certain Beneficial Owners and Management and Related Stockholder Matters | |||||||||
Certain Relationships and Related Transactions and Director Independence | |||||||||
Principal Accountant Fees and Services | |||||||||
Item 15 | Exhibits, Financial Statement Schedules | ||||||||
| |||||||||
Pandora is the leader in internet radio in the United States, offering a personalized experience for each of our Listeners also have the ability to add variety to and rename stations, which further allows for the personalization of our service. Once we select music to become part of our catalog, our music analysts genotype music theory, composition or performance, and we provide them with intensive training in the Music Genome Project's precise methodology. Pandora Mobile Streaming. We have designed a sophisticated system for streaming music content to mobile devices. This system involves a combination of music coding programs that are optimized for mobile devices as well as algorithms designed to address the intricacies of reliable delivery over diverse mobile network technologies. For example, these algorithms are designed to maintain a continuous stream to a listener even in circumstances where the mobile data network may be unreliable. For spoken word comedy, the underlying literary works are not currently entitled to eligibility for licensing by any performing rights organization ("PRO") for the United States. Rather, pursuant to industry-wide custom and practice, this content is performed absent a specific license from any such PRO or the copyright owner of such content. designated by the Copyright Royalty Board audit. The table below sets forth the per performance rates for the calendar years 2012 2013 2014 2015 through a rate court proceeding conducted by the United States District Court for the Southern District of New York. We elected to terminate our prior agreements with ASCAP as of December 31, 2010 and with BMI as of December 31, 2012 because, among other things, we believed that the royalty rates sought by ASCAP and BMI were in excess of rates paid by our largest radio competitors, broadcast radio stations and satellite radio. Notwithstanding our termination of these agreements, the musical works administered by each of ASCAP and BMI continued to be licensed to us pursuant to the provisions of their respective consent decrees. In November 2012, we filed a petition requesting that the ASCAP rate court determine reasonable license fees and terms for the ASCAP consent decree license applicable to the period January 1, 2011 through December 31, 2015. In June 2013, BMI filed a petition requesting that the BMI rate court determine reasonable license fees and terms for the BMI consent decree license applicable to the period January 1, 2013 through December 31, 2017. A trial to determine the royalty rates we will pay ASCAP concluded in February 2014 and the court issued its opinion establishing final fees in March 2014, but ASCAP has appealed the decision and such appeal is pending. The BMI rate court proceeding commenced on February 10, 2015. Pending the Court’s determination of final fees for Pandora’s BMI license, Pandora is operating under an interim license with BMI. For additional details regarding such proceedings, please see the sections entitled “Risk Factors” and “Legal Proceedings.” works. We do not expect this agreement to have a material effect on our consolidated financial condition or operating results. various closing conditions. These include, but are not limited to, regulatory approval by the Federal Communications Commission. had a material effect on our results of operations to date. protection, the laws in several states require companies to implement specific information security controls to protect certain types of information. Likewise, all but a few states have laws in place requiring companies to notify users if there is a security breach that compromises certain categories of their information. We are also subject to federal and state laws regarding privacy of listener fourth fiscal quarter. In December 2014, we purchased certain patents covering technologies used in internet radio from Allied Security Trust. In June 2013, we purchased certain patents covering technologies used in internet radio from Yahoo! Inc. for $8.0 million in cash. We intend to hold these patents purchased from Allied Security Trust and Yahoo! Inc. as part of our strategy to protect and defend Pandora in patent-related litigation. names and marks. As of growth potential of our business is uncertain. expenses; and hours on mobile demographics such as young adults, we will be unable to grow advertising revenue, and our business will be materially and adversely affected. products; If we fail to accurately predict and play music or comedy content that our listeners enjoy, we may fail to retain existing and attract new listeners. Further, many of our competitors currently have larger catalogs than we offer and they may be more effective in providing their listeners with a more appealing listener experience. agreement by us, and to suspend provision of the services if DoubleClick determines that our use of its service violates certain security, technology or content standards. song selection technology or obtain and use our trade secrets and other confidential information. Moreover, policing our intellectual property rights is difficult, costly and may not always be effective. together effectively in a non-hierarchical environment designed to promote openness, honesty, mutual respect and pursuit of common goals. As we continue to develop the infrastructure of a artists. advertisers. or any profiles that we develop using such data, If we are unable to maintain our chargeback rate or refund rates at acceptable levels, credit card and debit card companies may increase our transaction fees or terminate their relationships with us. Any increases in our credit card and debit card fees could adversely affect our results of operations, particularly if we elect not to raise our rates for our service to offset the increase. The termination of our ability to process payments on any major credit or debit card would significantly impair our ability to operate our business. tampering with our computer systems, which could lead to interruptions, delays, loss of critical data or the unauthorized disclosure of confidential customer data. We currently have very limited disaster recovery capability, and our business interruption insurance may be insufficient to compensate us for losses that may occur. As we rely heavily on our servers, computer and communications systems and the internet to conduct our business and provide high quality service to our listeners, such disruptions could negatively impact our ability to run our business, result in loss of existing or potential listeners and advertisers and increased maintenance costs, which would adversely affect our operating results and financial condition. actual results. These projections may vary widely from one another and may not accurately predict the results we actually achieve. Our stock price may decline if we fail to meet securities and industry analysts' projections. throughout the United States and in Australia and New Zealand. Fiscal Year Ended January 31, 2012 Second quarter (June 15, 2011 - July 31, 2011) Third quarter (August 1, 2011 - October 31, 2011) Fourth quarter (November 1, 2011 - January 31, 2012) Fiscal Year Ended January 31, 2013 First quarter (February 1, 2012 - April 30, 2012) Second quarter (May 1, 2012 - July 31, 2012) Third quarter (August 1, 2012 - October 31, 2012) Fourth quarter (November 1, 2012 - January 31, 2013) The historical results presented below are not necessarily indicative of financial results to be achieved in future periods. Statement of Operations Data: Revenue: Advertising Subscription services and other Total revenue Costs and expenses: Cost of revenue—content acquisition costs Cost of revenue—other(1) Product development(1) Marketing and sales(1) General and administrative(1) Total costs and expenses Loss from operations Other income (expense), net Loss before provision for income taxes Provision for income taxes Net loss Deemed dividend on Series D and Series E Accretion of redeemable convertible preferred stock Increase in cumulative dividends payable upon conversion of liquidation of redeemable convertible preferred stock Net loss attributable to common stockholders Basic and diluted net loss per share Weighted-average number of shares used in per share amounts—basic and diluted Listener hours (in billions)(3) Active users (as of period end, in millions)(4) Balance Sheet Data: Cash and cash equivalents Working capital (deficit) Total assets Preferred stock warrant liability Convertible preferred stock Common stock and additional paid-in capital Total stockholders' equity (deficit) Cost of revenue—other Product development Marketing and sales General and administrative Total stock-based compensation (MD&A) Listener hours (in billions)(1) Active users (end of period, in millions) Total Traditional computer Mobile and other connected devices We calculate listener hours based on the total bytes served for each track that is requested and served from our servers, as measured by our internal analytics systems, whether or not a listener listens to the entire track. an increase in ad capacity per hour of approximately 10%. The increase in the average price per ad was due primarily to changes in the sales distribution mix amongst direct sales, third-party network sales, and other channels and the platform mix between computer and mobile and other connected devices. revenue, respectively. For royalty arrangements under negotiation, we accrue for estimated royalties based on the available facts and circumstances and adjust these estimates as more information becomes available. The results of any finalized negotiation may be materially different from our estimates. Revenue: Advertising Subscription services and other Total revenue Costs and expenses: Cost of revenue—Content acquisition costs Cost of revenue—Other(1) Product development(1) Marketing and sales(1) General and administrative(1) Total costs and expenses Loss from operations Other income (expense): Interest income Interest expense Other expense, net Loss before provision for income taxes Provision for income taxes Net loss Accretion of redeemable convertible preferred stock Increase in cumulative dividends payable upon conversion of liquidation of redeemable convertible preferred stock Net loss attributable to common stockholders Basic and diluted loss per share Weighted-average number of shares used in per share amounts (in thousands): Cost of revenue—other Product development Marketing and sales General and administrative Total stock-based compensation Revenue: Advertising Subscription services and other Total revenue Costs and expenses: Cost of revenue—Content acquisition costs Cost of revenue—Other(1) Product and development(1) Marketing and sales(1) General and administrative(1) Total costs and expenses Loss from operations Other income (expense): Interest income Interest expense Other expense, net Loss before provision for income taxes Provision for income taxes Net loss Cost of revenue—other Product development Marketing and sales General and administrative Advertising Subscription services and other Total revenues Total ad RPMs Cost of Revenue—Content acquisition costs Traditional computer Mobile and other connected devices that comparing disaggregated content acquisition costs and revenues across our delivery platforms may provide directional insight for evaluating our efforts to monetize the rapid adoption of our service on mobile and other connected devices, we do not validate such disaggregated metrics to the level of financial statement reporting. We continue to refine our systems and methodologies used to categorize such metrics across our delivery platforms and the period-to-period comparisons of results are not necessarily indicative of results for future periods. Cost of revenue—Other Product development Marketing and sales General and administrative Interest income Interest expense Other income (expense) Total other income (expense) be realized. 2014. Net cash provided by (used in) operating activities Net cash provided by (used in) investing activities Net cash provided by financing activities activities the purchases of investments. proceeds from the issuance of common stock. Purchase obligation Operating lease obligations Total sublease agreement to increase our leased space at our corporate headquarters in Oakland, California. This agreement is expected to result in an additional operating lease obligation of approximately $7.6 million through 2020. This obligation is not included in the table above. first calendar quarter. revenue pricing and do not establish or maintain the relationship with the advertisers. other revenue related employee reports. We measure stock-based compensation credit. changes. Our We also have audited, in accordance with the standards of the Public Company Accounting Oversight Board (United States), Pandora Media, Inc.'s internal control over financial reporting as of Assets Current assets: Cash and cash equivalents Short-term investments Accounts receivable, net of allowances of $590 and $761 at January 31, 2012 and 2013, respectively Prepaid expenses and other current assets Total current assets Property and equipment, net Other assets Total assets Liabilities and stockholders' equity Current liabilities: Accounts payable Accrued liabilities Accrued royalties Deferred revenue Accrued compensation Total current liabilities Other long-term liabilities Total liabilities Commitments and contingencies (note 5) Stockholders' equity: Preferred stock, $0.0001 par value; zero and 10,000,000 shares authorized as of January 31, 2012 and 2013, respectively; no shares issued and outstanding as of January 31, 2012 and 2013 Common stock, $0.0001 par value: 1,000,000,000 shares authorized as of January 31, 2012 and 2013, respectively;163,569,361 and 172,506,051 shares issued and outstanding as of January 31, 2012 and 2013, respectively Additional paid-in capital Accumulated deficit Accumulated other comprehensive loss Total stockholders' equity Total liabilities, redeemable convertible preferred stock and stockholders' equity Revenue: Advertising Subscription services and other Total revenue Costs and expenses: Cost of revenue—Content acquisition costs Cost of revenue—Other Product development Marketing and sales General and administrative Total costs and expenses Loss from operations Other income (expense): Interest income Interest expense Other expense, net Loss before provision for income taxes Provision for income taxes Net loss Accretion of redeemable convertible preferred stock Increase in cumulative dividends payable upon conversion or liquidation of redeemable convertible preferred stock Net loss attributable to common stockholders Basic and diluted net loss per share attributable to common stockholders Weighted-average number of shares used in computing per share amounts Net loss Other comprehensive income (loss): Change in foreign currency translation adjustment Change in unrealized loss on marketable securities net of taxes Other comprehensive loss Comprehensive loss Balances as of January 31, 2010 Issuance of Series��G redeemable convertible preferred stock for cash Issuance of Series B redeemable convertible preferred stock upon exercise of warrant Issuance of common stock upon exercise of stock options Issuance of common stock to directors for cash Issuance of common stock in exchange for non-employee services Stock-based compensation Reversals of dividends on redeemable convertible preferred stock, net of accruals Excess tax benefit from stock-based compensation plans Accretion of redeemable convertible preferred stock issuance costs Net loss Balances as of January 31, 2011 Issuance of common stock upon exercise of stock options Stock-based compensation Dividends on redeemable convertible preferred stock Accretion of redeemable convertible preferred stock issuance costs Payment of preferred dividends in connection with initial public offering Conversion of preferred stock to common stock in connection with initial public offering Issuance of common stock in connection with initial public offering Issuance of common stock in connection with preferred stock warrant exercise Net loss Other comprehensive loss Balances as of January 31, 2012 Issuance of common stock upon exercise of stock options Stock-based compensation Vesting of restricted stock units Share cancellations to satisfy tax withholding on vesting of restricted stock units Issuance of common stock in connection with preferred stock warrant exercise Components of comprehensive loss: Net loss Other comprehensive loss Balances as of January 31, 2013 Operating Activities Net loss Adjustments to reconcile net loss to net cash provided by operating activities: Depreciation and amortization (Gain) loss on disposition of assets Stock-based compensation Remeasurement of preferred stock warrants Amortization of premium on investments Amortization of debt issuance cost and debt discount Changes in assets and liabilities: Accounts receivable Prepaid expenses and other assets Accounts payable and accrued liabilities Accrued royalties Accrued compensation Deferred revenue Reimbursement of cost of leasehold improvements Net cash provided by (used in) operating activities Investing Activities Purchases of property and equipment Purchases of short-term investments Maturities of short-term investments Net cash provided by (used in) investing activities Financing Activities Borrowings under debt arrangements Repayments of debt Proceeds from issuance of common stock Tax withholdings related to net share settlements of restricted stock units Proceeds from issuance of common stock to directors for cash Proceeds from early exercise of stock options Proceeds from exercise of preferred stock warrants Proceeds from issuance of redeemable convertible preferred stock, net of issuance costs Proceeds from initial public offering net of offering costs Payment of dividends to preferred stockholders at initial public offering Proceeds from buyers in investor offer Payments to sellers in investor offer Excess tax benefit from stock-based compensation plans Net cash provided by financing activities Effects of foreign currency translation activities on cash and cash equivalents Net increase in cash and cash equivalents Cash and cash equivalents at beginning of year Cash and cash equivalents at end of year Supplemental disclosures of noncash financing activities Conversion of preferred stock warrants into common stock warrants Conversion of preferred stock into common stock Issuance of Series B redeemable convertible preferred stock upon exercise of warrant Accruals of preferred stock dividends, net of reversals Accretion of preferred stock issuance cost Supplemental disclosures of cash flow information Cash paid during the period for income taxes Cash paid during the period for interest The accompanying notes are an integral part of the consolidated financial statements. context indicates otherwise. cash flows. statements could be affected. In many cases, the accounting treatment of a particular transaction is specifically dictated by U.S. GAAP and does not require unaudited consolidated financial statements include all adjustments of a normal recurring nature necessary for the fair presentation of our results of operations and our cash flows for the eleven months ended December 31, 2012. Collectability is assessed based on a number of factors, including transaction history and the creditworthiness of a customer. If it is determined that collection is not reasonably assured, revenue is not recognized until collection becomes reasonably assured, which is generally upon receipt of cash. We record cash received in advance of revenue recognition as deferred revenue. revenue derived from direct sales to listeners is recognized on a straight-line basis over the duration of the subscription period. Subscription revenue derived from sales through some mobile operating systems may be subject to refund or cancellation terms which may affect the timing or amount of the subscription revenue recognition. When refund rights exist, Beginning in January 2014, we had sufficient historic transactional information which enabled us to estimate future returns. Accordingly, in January 2014, we began recording revenue related to these mobile subscriptions net of estimated returns. This change resulted in a one-time increase in subscription revenue in the three months ended March 31, 2014 of approximately $14.2 million, as the previously deferred revenue was recognized. As of December 31, 2014, the deferred revenue related to the return reserve was not significant. we require that a substantial majority of the selling prices for these services fall within a reasonably narrow pricing range. $0.5 million, $0.4 million and $1.1 million, respectively. net Stock Options effects of stock-based awards on other tax attributes, such as the research tax credit, through the statement of operations. the available facts and circumstances and adjust these estimates as more information becomes available. Employee-related costs include salaries and benefits associated with supporting hosting and ad serving functions. Other costs of ad sales include costs related to music events that are sold as part of advertising arrangements. administrative personnel. In addition, general and administrative expenses include professional services costs for outside legal and accounting services, Diluted net loss per share is computed by giving effect to all potential shares of common stock, including stock options statements. Cash and cash equivalents: Cash Money market funds Commercial paper Corporate debt securities Total cash and cash equivalents Short-term investments: Commercial paper Corporate debt securities U.S. agency notes Total short-term investments Cash, cash equivalents and short-term investments available-for-sale. Money market funds Commercial paper Corporate debt securities U.S. agency notes Total cash equivalents and marketable securities Money market funds Commercial paper Corporate debt securities Total cash equivalents and marketable securities recovery of the Accounts receivable Allowance for doubtful accounts Accounts receivable, net For fiscal year ended January 31, 2011 For fiscal year ended January 31, 2012 For fiscal year ended January 31, 2013 Software developed for internal use Servers, computers and other related equipment Office furniture and equipment Construction in progress Leasehold improvements Less accumulated depreciation and amortization Property and equipment, net 2013, the eleven months ended December 31, 2013 or the twelve months ended December 31, 2014. difference between rent expense and rent payments is recorded as deferred rent. Fair value is an exit price, representing the amount that would be received from the sale of an asset or paid to transfer a liability in an orderly transaction between market participants. As such, fair value is a market-based measurement that should be determined based on assumptions that market participants would use in pricing an asset or liability. Fair value measurements are required to be disclosed by level within the following fair value hierarchy: Fair values as of January 31, 2012 Assets: Money market funds Commercial paper Corporate debt securities U.S. agency notes Total assets measured at fair value Fair values as of January 31, 2013 Assets: Money market funds Commercial paper Corporate debt securities U.S. agency notes Total assets measured at fair value twelve months ended December 31, 2014 was $0.4 million and $0.7 million. The following is a schedule of future minimum lease payments and future minimum sublease income under noncancelable operating leases as of 2014 2015 2016 2017 2018 Thereafter Total minimum lease payments $15.3 million. 19, 2015. Court. ordinary course of business, we are party to certain contractual agreements under which we may provide indemnifications of varying scope, terms and duration to customers, vendors, lessors, business partners and other parties with respect to certain matters, including, but not limited to, losses arising out of breach of such agreements, services to be provided by us or from intellectual property infringement claims made by third parties. In addition, we have entered into indemnification agreements with directors and certain officers and employees that will require us, among other things, to indemnify them against certain liabilities that may arise by reason of their status or service as directors, officers or employees. Such indemnification provisions are accounted for in accordance with guarantor’s accounting and disclosure requirements for guarantees, including indirect guarantees of indebtedness of others. To date, we have not incurred, do not anticipate incurring and therefore have not accrued for, any costs related to such indemnification provisions. Current Federal State and local International Total current income tax expense Deferred Federal State and local Valuation allowance Total deferred income tax expense Total income tax expense - Continued U.S. federal taxes at statutory rate State taxes, net of federal benefit Permanent differences Foreign rate differential Federal and state credits (net of reserve) Change in valuation allowance Change in rate Other Effective tax rate Deferred tax assets: Net operating loss carryforwards Tax credit carryforwards Allowances and other Stock options Depreciation and amortization Total deferred tax assets Deferred tax liabilities: Depreciation and amortization Total deferred tax liabilities Valuation allowance Net deferred tax assets expire and approximately $3.7 million of credits that will expire beginning in 2024. operating loss carryforwards and other pre-change tax attributes, such as research tax credits, to offset its post-change income may be limited. In general, an "ownership change" will occur if there is a cumulative change in our ownership by "5-percent shareholders" that exceeds 50 percentage points over a rolling three-year period. Similar rules may apply under state tax laws. Utilization of based on our monthly accounts receivable balance at such time and the amounts borrowed are collateralized by our personal property, including such accounts receivable but excluding intellectual property. The credit facility contains customary events of default, conditions to borrowing and covenants, including restrictions on Pandora. In stock subject to such awards will instead be available for future issuance under the 2011 Plan. Each estimated forfeitures. Expected life (in years) Risk-free interest rate Expected volatility Expected dividend yield Balance as of January 31, 2012 Additional shares authorized Granted Restricted stock Exercised Cancelled/Forfeited Balance as of January 31, 2013 Exercisable as of January 31, 2013 Vested as of January 31, 2013 and expected to vest thereafter(2) Unvested at January 31, 2012 Granted Vested Canceled Unvested at January 31, 2013 Expected to vest after January 31, 2013(1) Stock-based compensation expenses: Cost of revenue—other Product development Marketing and sales General and administrative Total stock-based compensation, recorded in costs and expenses Series A Series B Series C Series D Series E Series F Series G Numerator Net loss Accretion of redeemable convertible preferred stock Increase in cumulative dividends payable upon conversion or liquidation of redeemable convertible preferred stock Net loss attributable to common stockholders Denominator Weighted-average common shares outstanding used in computing basic and diluted net loss per share Net loss per share, basic and diluted - Continued Options to purchase common stock Warrants to purchase convertible preferred stock Warrants to purchase common stock Restricted stock units Convertible preferred stock Total common stock equivalents Total revenue Costs and expenses: Cost of Revenue—Content acquisition costs Cost of revenue—Other Product development Marketing and sales General and administrative Total costs and expenses Income (loss) from operations Net income (loss) attributable to common stockholders Basic and diluted net income (loss) per share 2014 2014 Consolidated Balance Sheets Consolidated Statements of Operations Consolidated Statements of Comprehensive Loss Consolidated Statements of Consolidated Statements of Cash Flows Notes to Consolidated Financial Statements Schedules Pursuant to the requirements Section 13 or 15(d) of the Securities Exchange Act of 1934, the Registrant has duly caused this report to be signed on its behalf by the undersigned, thereunto duly authorized on Calendar 2014 (12-month) Results Compared With Calendar 2013 (11-month) Calendar 2013 (11-month) Calendar 2014 (12-month) February 2013 - December 2013 January 2014 - December 2014 Calendar 2013 (11-month) Results Compared With Calendar 2012 (11-month recast, unaudited) Calendar 2012 (11-month recast, unaudited) Calendar 2013 (11-month) February 2012 - December 2012 February 2013 - December 2013 I.IOverviewlisteners.listeners wherever and whenever they want to listen to radio on a wide range of smartphones, tablets, computers and car audio systems, as well as a range of other internet-connected devices. Our vision is to be the effortless source of personalized music entertainment and discovery for billions. The majority of our listener hours occur on mobile devices, with the majority of our revenue generated from advertising on these devices. We have pioneered a new form of radio—one that uses intrinsic qualities of music to initially create stations and then adapts playlists in real-time based on the individual feedback of each listener. We offer local and national advertisers an opportunity to deliver targeted messages to our listeners using a combination of audio, display and video advertisements.JanuaryDecember 31, 2013,2014, we had approximately 175more than 250 million registered users, which we define as the total number of accounts that have been created for our service at period end. As of JanuaryDecember 31, 2013 approximately 1402014, more than 225 million registered users havehad accessed Pandora through smartphones and tablets. For the fiscal yeartwelve months ended JanuaryDecember 31, 2013,2014, we streamed 14.0120.03 billion hours of internet radio, and as of JanuaryDecember 31, 2013,2014, we had 65.681.5 million active users during the prior 30 day period. According to a December 2012 report by Triton, we have more than a 70% share of internet radioamong the top 20 stations and networks in the United States. Since we launched our free, advertising-supported radio service in 2005 our listeners have created over 4.07 billion stations. In June 2012, we entered into or activated agreements which allow Pandora to launch in New Zealand, Australia and the territories associated with the two countries. The arrangements with PPNZ Music Licensing Limited, which represents recording artists and record companies, and APRA/AMCOS, which represents songwriters, composers and publishers, have not had a material effect on our results of operations to date.• In September 2011, we effectively eliminated the 40 hour per month listening cap on desktop and laptop computers by increasing the cap to 320 hours of listening per month, which almost none of our listeners exceed. We have the right to assess a $0.99 fee to listeners who exceed the new cap, but this has not generated, and is not expected to generate any meaningful revenue. In fiscal years 2010, 2011 and 2012 listeners on other platforms had access to unlimited hours of free music and comedy. Starting in March 2013, we instituted a 40 hour per month listening cap on mobile and other connected devices. Listeners who reach this limit may continue to use our ad supported service on these devices by paying $0.99 for the remainder of the month, may listen to our ad supported service on their desktop or laptop computers, or may purchase annual or monthly Pandora One subscriptions for $36 per year or approximately $4 per month, respectively.•currently eliminates all external advertising fromis a paid subscription service without any device used to access our service.advertising. Pandora One allows unlimited listening time and provides accessalso enables listeners to have more daily skips, enjoy higher quality 192 kbps audio on supported devices. In fiscal years 2011, 2012devices and 2013, subscription services and other revenue accounted for approximately 13%, 13% and 12%, respectively, of our total revenue.enjoy longer timeout-free listening. researching song lyrics, reading the history of their favorite artists, viewing artist photos and buying albums and songs from Amazon or iTunes. Our service also incorporates community social networking features. Listeners can create and customize personal listener profile pages to connect with other listeners. Our music feed feature enables a real-time, centralized stream for listeners to view the music that their social connections are experiencing and to provide and receive recommendations for songs, albums and artists. Listeners can also share their stations across other social media outlets and through email by using our share feature or by distributing our individualized station URLs. In addition, our website is integrated with Facebook's instant personalization capability, allowing our listeners to share their stations and music preferences with their Facebook friends and enabling us to make additional music recommendations. In October 2012, we announcedredesigncore of our mobileservice is our set of proprietary personalization technologies, including the Music Genome Project and our playlist generating algorithms. When a listener interface,Pandora 4.0, on both IOS and Android smartphones which included expanding listening functionality,enters a single song, artist pages, personal music profiles and sharing capabilities.Distribution and Partnerships One key element of our strategy isor genre to makestart a station, the Pandora service available everywhereinstantly generates a station that there is internet connectivity. To this end,plays music we makethink that listener will enjoy. Based on listener reactions to the Pandora service available through a variety of distribution channels. In additionsongs we stream, we further tailor the station to streaming our service to traditional computers, we have developed Pandora mobile device applications or "apps" for smartphones such as Android, Blackberry andmatch the iPhone, and for tablets including the iPad, Android tablets, and Amazon Kindle Fire tablets. We distribute those mobile apps free to listeners via app stores. Pandora is now available on more than 1,000 integrations, including automobiles, automotive aftermarket devices and consumer electronic devices. In the consumer electronics space, more than 760 consumer electronics devices from third-party distribution partners such as Samsung, Roku and DirecTV make Pandora availablelistener's preferences in the home. Many automotive partners, including Alpine Electronics, Audiovox, Clarion, JVC, Kenwood, Pioneer Sony, incorporate our application into aftermarket radios. We have also developed relationships with major automobile manufacturers and are currently available on vehicle models sold by Acura, BMW, Buick, Cadillac, Chevrolet, Ford, GMC, Honda, Hyundai, Lexus, Lincoln, Mazda, Mercedes-Benz, MINI, Nissan, Scion, Suzuki and Toyota. Additionally, Chrysler, Infiniti and Kia have publicly announced their plans to offer Pandora integration on future vehicles. Holden Ltd., a subsidiary of General Motors, has also launched the first in-car system in Australia to offer full compatibility with Pandora. Under the arrangements, we receive no financial compensation and recognize no revenue from these automotive distribution partners.Advertising We generate revenue primarily from advertising. In fiscal 2011, 2012 and 2013, advertising revenue accounted for approximately 87%, 87% and 88% of our total revenue, respectively, and we expect that advertising will comprise a substantial majority of revenue for the foreseeable future. We offer a comprehensive suite of display, audio and video advertising products across our traditional computer, mobile and connected device platforms. Our advertising products allow both national and local advertisers to target and connect with listeners based on attributes including age, gender, zip code and content preferences, and we provide analytics for our advertisers detailing campaign performance.•Display Advertising. Our display products offer advertisers opportunities to maximize exposure to our listeners through our desktop and mobile service interfaces, which are divided between our tuner containing our player and "now playing" information, and the information space surrounding our tuner. Our display ads include industry standard banner ads of various sizes and placements depending on platform and listener interaction.•Audio Advertising. Our audio advertising products allow custom audio messages to be delivered between songs during short ad interludes. Audio ads are available across all of our delivery platforms. On supported platforms, the audio ads can be accompanied by display ads to further enhance advertisers' messages.•Video Advertising. Our video advertising products allow delivery of rich branded messages to further engage listeners through in-banner click-initiated videos, videos that automatically play when a listener changes stations or skips a song and opt-in videos that pause the music and cover the tuner. Our advertising strategy focuses on developing our core suite of display, audio and video advertising products and marketing these products to advertisers for delivery across traditionalcomputer, mobile and other connected device platforms such as automobiles and consumer electronics. We believe that our ability to run multi-platform ad campaigns enables advertisers to deliver their advertising messages to listeners anytime and anywhere they enjoy music and comedy, providing a unique advertising opportunity that is central to our achieving and sustaining profitability. As listenership on our mobile platforms has grown more rapidly than on our other platforms, we have sought to improve our advertising products for the mobile environment to better enable us to develop and market multi-platform advertising solutions. For example, our introduction of audio ads was driven by the growth of mobile listenership. In addition, our banner advertising products for display on mobile devices include standard banner ads displayed on the Pandora app "now-playing" screen, "welcome" screen banners which are the first to display upon launch of the app, and other multi-functional banners of different shapes and sizes. Further, advertisers can create "drag-and-drop" stations where listeners select among branded icons and drag and drop the selected icon to automatically launch a station. We have also incorporated rich media touch screen initiated functionality, or "tap-to" technology, to enhance connections between our mobile listeners and advertisers. "Tap-to" technology allows mobile listeners to expand banner ads, launch videos, receive advertiser emails, dial advertiser phone numbers, download applications and access links to advertiser websites, offering increased listener and advertiser engagement. Our display, audio and video advertising products can be designed and modified by us and advertisers to create advertising campaigns tailored across all of our high volume delivery platforms to fit specific advertiser needs. For example, our advertisers can create custom "branded" stations from our music library that can be accessed by our listeners, as well as engage listeners by allowing them to personalize the branded stations through listener-controlled variables.Sales and Marketing We organize our sales force into multiple teams that are each focused on selling advertising across our traditional computer, mobile and other connected device platforms. Teams are located in our Oakland, California headquarters, in regional sales offices in Chicago, Illinois; Santa Monica, California; and New York, New York and local sales offices throughout the country. Our marketing team is charged with amplifying Pandora's brand message to grow awareness and drive listening hours. We organize the marketing team into three groups focused on communications, marketing analytics, and brand marketing.Our Technologiesthe foundationa database of our personalized playlist generating systemover 1,000,000 uniquely analyzed songs from over 125,000 artists, spanning over 600 genres and has been built by our music analysts to select songs tailored to an individual's music tastes. The Music Genome Project database was developedsub-genres, which we develop one song at a time by evaluating and cataloging each song's particular attributes. Our music catalog currently consists of over 1,000,000 uniquely analyzed songs from over 100,000 artists, spanning over 500 genres and sub-genres ranging from classical, jazz, rock, pop and hip hop to post punk, Celtic and flamenco. Our musical catalog includes both well-known and little-known music and incorporates listener suggestions and independent submissions. Music is assessed on the basis of value to our catalog and we do not accept money or any form of consideration from artists or their representatives for inclusion in the Music Genome Project.itthe music by examining up to 450the technologythat underlying the Music Genome Project, allowing a listener to choose a favorite comedian or a genre as a seed to start a station and then give feedback to personalize that station. Our comedy collection includes content from more than 1,5002,000 comedians with more than 20,00030,000 tracks.listeners to play musicaudience anytime, anywhere that they love as quickly as possible.enjoy music. To this end, we have developed a number of innovative approaches, including our autocomplete station creation feature, which predicts and generates a list of the most likely musical starting points as a listener begins to enter a favorite station, song or artist. Pandora Streaming Network. We have developed our own infrastructure for streaming music content to a diverse network of devices and destinations. Our streaming network is hosted from Pandora owned and operated infrastructure in data centers across the country. This network has allowed us to deliver a high quality streaming experience to a broad collection of devices at significant cost savings relative to outsourced third-party solutions.competeview the integration of the Pandora service into automobiles as key area of potential growth for the time and attentionservice, as a large portion of terrestrial radio listening occurs in automobiles.listeners withrevenue from the sale of audio, display and video advertising for delivery across our computer, mobile and other content providers onconnected device platforms. We generate the basis of a number of factors, including quality of experience, relevance, acceptance and diversity of content, ease of use, price, accessibility, perceptions of ad load, brand awareness and reputation. We also compete for listeners on the basismajority of our presence and visibility as compared with other providers that deliver content through the internet, mobile devices and consumer products. We believe that we compete favorably on these factors. For additional details on risks related to competition for listeners, please refer to the section entitled "Risk Factors." We offer our service at no cost or through a low cost subscription plan through web,revenue from mobile and consumer electronic platforms however, many ofother connected devices, which presents an opportunity for us to reach our audience anytime, anywhere that they enjoy music and therefore offer additional distribution channels to current and potential future competitors enjoyadvertisers for delivery of their advertising messages.competitive advantages, such as greater name recognition, longer operating historiesmajority of revenue for the foreseeable future.larger marketing budgets,mobile service graphical interfaces, which are divided between our tuner containing our player and "now playing" information, and the information space surrounding our tuner. Our display ads include industry standard banner ads of various sizes and placements depending on platform and listener interaction.substantially greater financial, technicalengage listeners by allowing them to personalize the branded stations through listener-controlled variables. In addition to branded stations, we offer advertisers our sponsored listening product, in which advertisers sponsor ad-free listening for consumers in exchange for the consumer’s active brand interaction, such as watching a video advertisement, interacting with rich media or visiting the advertiser's landing page.resources. Our competitors include: Other Radio Providers. We compete for listeners with broadcast radio providers, including terrestrial radio providers such as Clear Channel and CBS and satellite radio providers such as Sirius XM. Many broadcast radio companies own large numbersrevenue is generated primarily through the sale of radio stations or other media properties. Many terrestrial radio stations have begun broadcasting digital signals, which provide high quality audio transmission. In addition, unlike participants in the emerging internet radio market, terrestrial and satellite radio providers, as aggregate entitiesPandora One, a premium version of their subsidiary providers, generally enjoy larger established audiences and longer operating histories. Broadcast and satellite radio companies enjoy a significant cost advantage because they pay a much lower percentage of revenue for transmissions of sound recordings. Broadcast radio pays no royalties for its terrestrial use of sound recordings, and satellite radio pays only 9% of revenue for its satellite transmissions of sound recordings. By contrast, Pandora incurred content acquisition costs representing 55.9% of revenue for our internet transmissions of sound recordings during the fiscal year ending January 31, 2013. We also compete directly with other emerging non-interactive online radio providers such as CBS's Last.fm, Clear Channel's iheartradio and Slacker Personal Radio. We could face additional competition if known incumbents in the digital media space choose to enter the internet radio market. Other Audio Entertainment Providers. We face competition from providers of interactive on-demand audio content and pre-recorded entertainment, such as Apple's iTunes Music Store, RDIO, Rhapsody, Spotify, and Amazon that allow listeners to select the audio content that they stream or purchase. This interactive on-demand content, is accessible in automobiles and homes, using portable players, mobile phones and other wireless devices. The audio entertainment marketplace continues to rapidly evolve, providing our listeners with a growing number of alternatives and new media platforms. Other Forms of Media. We compete for the time and attention of our listeners with providers of other forms of in-home and mobile entertainment. To the extent existing or potential listeners choose to watch cable television, stream video from on-demand services such as Hulu, VEVO or YouTube or play interactive video games on their home-entertainment system, computer or mobile phone rather than listen to the Pandora service, these content services pose a competitive threat.Competitionwhich currently includes advertisement-free access and higher audio quality on the devices that support it. Pandora One is primarily available for Advertiserspurchase through major app stores and through the Pandora website. For the We compete withtwelve months endedJanuary 31, 2013, the eleven months ended December 31, 2012 and 2013 and the twelve months endedDecember 31, 2014, subscription and other content providersrevenue accounted for a share12%, 12%, 18% and 20% of our advertising customers' overall marketing budgets. We compete on the basis of a number of factors, including perceived return on investment, effectiveness and relevance of our advertising products, pricing structure and ability to deliver large volumes or precise types of ads to targeted demographics. We believe that our ability todeliver targeted and relevant ads across a wide range of platforms allows us to compete favorably on the basis of these factors and justify a long-term profitable pricing structure. However, the market for online advertising solutions is intensely competitive and rapidly changing, and with the introduction of new technologies and market entrants, we expect competition to intensify in the future. For additional details on risks related to competition for advertisers, please refer to the section entitled "Risk Factors." Our competitors include: Other Internet Companies. The market for online advertising is becoming increasingly competitive as advertisers are allocating increasing amounts of their overall marketing budgets to web-based advertising. We compete for online advertisers with other internet companies, including major internet portals, search engine companies and social media sites. Large internet companies with greater brand recognition, such as Facebook, Google, MSN and Yahoo! have large direct sales staffs, substantial proprietary advertising technology and extensive web traffic and consequently enjoy significant competitive advantages. Broadcast Radio. Terrestrial broadcast and to a lesser extent satellite radio are significant sources of competition for advertising dollars. These radio providers deliver ads across platforms that are more familiar to traditional advertisers than the internet might be. Advertisers may be reluctant to migrate advertising dollars to our internet-based platform. Other Traditional Media Providers. We compete for advertising dollars with other traditional media companies in television and print, such as ABC, CBS, FOX and NBC, cable television channel providers, national newspapers such as The New York Times and the Wall Street Journal and some regional newspapers. These traditional outlets present us with a number of competitive challenges in attracting advertisers, including large established audiences, longer operating histories, greater brand recognition and a growing presence on the internet.of bothor their agents, for the sound recordings that we perform, as well as the musical works embodied in each of those sound recordings, subject to certain exclusions. These licensing and musical compositions. These royalty and licensing arrangements strongly influence our business operations. We stream spoken word comedy content for which the underlying literary works are not currently entitled to eligibility for licensing by any performing rights organization for the United States. Rather, pursuant to industry-wide custom and practice, this content is performed absent a specific license from any such performing rights organization. We do, however, obtain licenses to stream the sound recordings of comedy content under federal statutory licenseslicense, as more fully described under the section captioned "Sound Recordings" below, which in some instances we have opted to augment with direct agreements with the licensors of such sound recordings. Our largest royalty expense arises from our userecordings.recordings we transmit to users of the Pandora service, as generally reflected by our listener hours, drives the vast majority of our content acquisition costs. We obtain performance rights licenses and pay performance rights royalties tofor the benefit of the copyright owners of such sound recordings typically performingand the recording artists, both featured and recording companies,non-featured, on such recordings, mainly pursuant to the Digital Performance Right in Sound Recordings Act of 1995 (the "DPRA") and the Digital Millennium Copyright Act of 1998 (the "DMCA"). Under federal statutory licenses created by the Digital Performance Right in Sound Recordings Act of 1995, (the "DPRA"),DPRA and the DMCA, we are permitted to stream any lawfully released sound recordings and to make reproductions of these recordings on our computer servers, without having to separately negotiate and obtain direct licenses with each individual sound recording copyright owner. These statutory licenses are granted to us on the condition that we operate in compliance with the rules of the statutory licenses and pay the applicable royalty rates to SoundExchange, the non-profit organizationor CRB,(the “CRB”), a tribunal established within the U.S. Library of Congress, to collect and distribute royalties under these statutory licenses. We believe we are not an "interactive service" as defined in the U.S. Copyright Act of 1976 (the "U.S. Copyright Act"). As a non-interactive service, we are not allowed to stream a particular song "on-demand" and are otherwise obliged to limit the ways in which we stream music to our listeners. As such we are required, among other things, to restrict the number of songs that are played on a particular station from a particular artist or album within certain time periods.to SoundExchange for non-interactive streaming of sound recordings pursuant to thesethe federal statutory licenses are privately negotiatedcan be established by either negotiation or setthrough a rate proceeding conducted by the CRB. In 2007, the CRB set royalty rates for non-interactive, online streaming of music that were extremely high. In response to the lobbying efforts of internet webcasters, including Pandora, Congress passed the Webcaster Settlement Acts of 2008 and 2009, which permitted webcasters to negotiate alternative royalty rates directly with SoundExchange outside of the scope of the CRB process. In July 2009, certain webcasters reached a settlement agreement with SoundExchange establishing a royalty structure more favorablealternative rates and rate structures to us thatthose eventually established by its terms will apply through 2015.the CRB for services not qualifying for the settlement rates. This settlement agreement is commonly known as the "Pureplay Settlement." OnceSettlement" that applies through the rates and termsend of 2015. We have elected since 2009 to avail ourselves of the Pureplay Settlement came into effectSettlement. Proceedings to establish rates that will be applicable to our service for the 2016-2020 period, known as the Webcasting IV proceedings, were commenced in July 2009, any qualifying commercial webcaster could electJanuary 2014. There can be no assurances that the Webcasting IV proceedings will not result in significantly higher royalties than we currently pay. Further, federal copyright law does not recognize a public performance right for sound recordings created prior to avail itselfFebruary 15, 1972, and we face additional risks related to pre-1972 sound recording licensing. For additional details on risks related to the rate-setting process and pre-1972 sound recordings, please refer to the section entitled “Risk Factors.”those ratessound recordings are calculated using a per performance rate and terms by filing an initial notice, followed by annual notices, of election with SoundExchange through 2015. In July 2009, we elected to beare subject to the Pureplay Settlement and timely filed notices of election with SoundExchange for 2010, 2011, 2012 and 2013. We currently intend to continue to make such elections through 2015.20122014 to 2015 (1) as (i) established by the CRB, which we have opted not to pay, (2)(ii) under the Pureplay Settlement applicable to our non-subscription, ad-supported service and (3)(iii) under the Pureplay Settlement applicable to our subscription service. CRB Rate Pureplay Rate
(non-subscription)* Pureplay Rate
(subscription) $ 0.00210 $ 0.00110 $ 0.00200 0.00210 0.00120 0.00220 0.00230 0.00130 0.00230 0.00230 0.00140 0.00250 *The rate applicable to our non-subscription service is the greater of the per performance rates set forth in this column or 25% of our U.S. gross revenue. Pureplay Rate Pureplay Rate Year CRB Rate (non-subscription)* (subscription) 2014 $ 0.00230 $ 0.00130 $ 0.00230 2015 $ 0.00230 $ 0.00140 $ 0.00250 currently pay per-performance rates for streaming of sound recordings via our Pandora One subscription service that are higher than the per-performance rates for our free, non-subscription service. As a result, we may incur higher royalty expenses to SoundExchange for a listener that subscribes to Pandora One as compared to a listener that uses our free, non-subscription service, even if both listeners listen to the same number of performances.same amountindependent label sector. This partnership is designed to help independent labels and artists increase the audiences they reach. Participating labels, and the artists they represent, can also take advantage of time. Proceedings to establish rates that will be applicablethe marketing capabilities of our connected platform by obtaining direct access to our service after 2015, known as Webcasting IV proceedings,metadata to help make data-driven business decisions. We do not expect this partnership to have a material effect on our consolidated financial condition or operating results.expected to commence in January 2014. Whilealso comprised of the royalties we did not participate in the prior proceedings to establish royalty rates for non-interactive webcasting services, we currently expect to participate in the Webcasting IV proceedings. At that time, webcasters, including us, will have the opportunity to enter into voluntary settlement negotiations with SoundExchange, and failing that, will participate in formal hearings before the CRB to establish rates. We believe that our participation in the Webcasting IV proceedings as a mature player in an industry that will have evolved significantly since the prior proceedings may enhance our ability to negotiate rates on economically favorable terms. However, if we are unable to successfully negotiate rates for the 2016-2020 period, we will be forced to litigate those rates before the CRB. Any such litigation would be costly, and the outcome of such litigation would be uncertain. If the Webcasting IVproceedings establish rates applicable to us that represent incremental increases in the per performance rates set forth as "CRB Rates" in the table above for the 2016-2020 period and there is no percentage of revenue option available to us, then our content acquisition costs could substantially increase, which could materially and adversely affect our operating results. For additional details on risks related to the rate-setting process, please refer to the section entitled "Risk Factors." We are unable to estimate the direct and indirect costs of participating in the Webcaster IV proceedings, but we expect those costs to be significant. The existing laws and regulations governing performance royalties applicable to commercial webcasters are subject to change. For example, there is no guarantee that the royalty structure that emerged from the Pureplay Settlement will be available upon its expiration. In addition, performers and owners of sound recordings are seeking compensationpay for the public performance of sound recordings from terrestrial broadcasters who are not currently required to pay royalties for non-subscription broadcast transmissions. If these performers and owners are successful, terrestrial radio broadcasters will, for the first time, be subject to payment of sound recording performance royalties, a development that could potentially have a positive impact on our ability to compete with terrestrial radio broadcasters. Further, the Copyright Office has issued a report with respect to whether sound recordings released in the United States prior to January 1972 (the time at which federal copyright protection was first afforded to sound recordings), should be covered under federal copyright law. The report recommended that federal copyright protection should apply to sound recordings fixed before February 15, 1972. It proposed special provisions to address issues such as copyright ownership, term of protection, termination of transfers and copyright registration. We do not expect any potential resulting legislation to have a material impact on our business, financial condition or results of operations. We are not aware of any other proposed or pending changes to laws and regulations relating to performance royalties applicable to commercial webcasters such as us.Musical Works We also incur royalty expenses from our use of musical works embodied in the sound recordings with respect to whichthat we must obtain public performance licenses and pay performance rights royalties to copyright owners of those musical works (typically, songwriters and music publishers) or their agents.stream. Copyright owners of musical works, most often relytypically, songwriters and music publishers, have traditionally relied on intermediaries known as performance rights organizationsPROs to negotiate so-called "blanket" licenses with copyright users, collect royalties under such licenses, and distribute them to copyright owners. We have obtained public performance licenses from, and pay license fees to, the three major performance rights organizationsPROs in the United States: the American Society of Composers, Authors and Publishers or ASCAP,(“ASCAP”), Broadcast Music, Inc., or BMI (“BMI”) and SESAC, Inc., (“SESAC”).SESAC.a finalan agreement with SESAC, which automatically renews yearly, but is subject to termination by either party in accordance with its terms at the end of each yearly term. The SESAC rate is subject to small annual increases. There is no guaranteelicense and associated royalty rate availablefees to us now with respect to SESAC will be available to us in the future. In 2012, we elected to terminate our prior agreement with BMI effective aswriters or composers of December 31, 2012 because we believed the royalty rates sought by BMI were excessive. Notwithstanding our termination of this BMI agreement, the musical works administered byworks. Between 2012 and 2014, certain publishers purported to partially withdraw portions of their repertoires from each of ASCAP and BMI are licensed to us pursuant to the provisions of a consent decree which BMI entered into with the U.S. Department of Justice. Ratesintent that each performing rights organization would be unable to be paid to BMI can be set, inlicense the absence of a negotiated agreement, by the rate court established pursuant to such consent decree in the U.S. District Court for the Southern District of New York. The rates to be paid to BMI may be adjusted retroactively, either by mutual agreement or order of the rate court. In 2010, we elected to terminate our prior agreement with ASCAP as of December 31, 2010 because we believed that the royalty rates sought by ASCAP were excessive. Notwithstanding our termination of this ASCAP agreement, thewithdrawn musical works administered by ASCAP are licensed to us pursuant to the provisions of a consent decree which ASCAP entered into with the U.S. Department of Justice. Rates to be paid to ASCAP can be set, in the absence of a negotiated settlement, by the rate court established pursuant to such consent decree in the U.S. District Court for the Southern District of New York. In September 2011, we changed the method we used to calculate royalties due to ASCAP following the execution of an interim arrangement for the period commencing January 1, 2011, pending a final determination of new rates. The rates to be paid to ASCAP may be adjusted retroactively, either by mutual agreement or order of the rate court. In November 2012, we filed a petition in the rate court to determine final, reasonable rates and terms with ASCAP. Rate court proceedings could take years to complete, could be very costly, and there are no guarantees that the rate court will establish royalty rates more favorable to us than those we previously paid pursuant to our terminated agreement with ASCAP or those we pay pursuant to our interim arrangement with ASCAP. We also obtain licenses directly from music publishers. In May 2011, EMI Music Publishing, or EMI, announced its decision to withdraw from ASCAP certain portions of its musical works catalog that ASCAP had been administering on its behalf. As a result, ASCAP may no longer be able to license those musical works, and new media licensees such as Pandora, who were previously ablePandora. Our position is that attempted partial withdrawals violate the ASCAP and BMI consent decrees. However, from time to secure licenses from ASCAP for those musical works, may nowtime, we have entered, and will continue to enter, into direct licensing arrangementsagreements with EMI. some purported withdrawing publishers to enable Pandora to continue to perform those publishers’ works amidst the current legal uncertainty. For additional details regarding such purported withdrawals, please see the sections entitled “Risk Factors” andMarch 2012,July 2014, we entered intosigned a licensingmulti-year agreement with EMI covering the public performanceBMG Rights Management US LLC (“BMG”) for a U.S. license for BMG's complete catalogs of the EMI musical works purportedly withdrawn from the ASCAP repertory.late 2012, Sony ATV Music Publishing or Sony ATV, which led a consortium in the acquisition of EMI in June 2012, announced its intention to withdraw from ASCAP and BMI certain portions of its musical works catalog that ASCAP and BMI had been administering on its behalf. As a result, ASCAP and BMI may no longer be able to license those musical works, and new media licensees, such as Pandora, who were previously able to secure licenses from ASCAP and BMI for those musical works, may now have to enter into direct licensing arrangements with Sony ATV. In January 2013, we entered into a licensinglocal marketing agreement with Sony ATV and EMI coveringto program KXMZ-FM, a Rapid City, South Dakota-area terrestrial radio station. In addition, we entered into an agreement to purchase the assets of KXMZ-FM for a total purchase price of approximately $0.6 million in cash, subject to certain closing conditions. These agreements were made in part to allow us to qualify for certain settlement agreements concerning royalties for the public performance of musical works between the works purportedly withdrawn fromRadio Music Licensing Committee (“RMLC”) and ASCAP and BMI. Other music publishers We believe that we qualify for the RMLC royalty rates, which have signaled their intentprovided and will continue to withdraw from ASCAP and BMI all or a portionprovide us with savings of less than 1% of revenue in cost of revenue—content acquisition costs compared with the latest contractual rates.musical works catalogs that ASCAP and BMI administer on their behalf. Itpurchase price, which is unclear whetherincluded in the other music publishers will be ablelong-term assets line item of our balance sheets. Completion of the KXMZ-FM acquisition is subject to withdraw their catalogs from ASCAP or BMI and, if so, what specific effect those withdrawals will have on us.performance-rightsperforming rights organizations and copyright collection societies from which licenses must be obtained. We have obtained licenses to operate in Australia and New Zealand for the communication of sound recordings and the musical compositions embodied in those sound recordings. As yet, werecordings, which have not identified economically suitable licensing arrangements in other countries. and privacy, among other things. Many of these laws and regulations are still evolving and could be interpreted in ways that could harm our business. In the area of information security and dataAny failure on our part to comply with these laws may subject us to significant liabilities.data.data, among other things. Our privacy policy and terms of use describe our practices concerning the use, transmission and disclosure of listener information and are posted on our website. Any failurecomplygrow awareness and drive listener hours. We organize the marketing team into three groups focused on communications, marketing analytics and brand marketing. While we have historically relied on the success of viral marketing to expand consumer awareness of our service, in 2014 we began to launch marketing campaigns to increase consumer awareness and expand our listener base. We anticipate that we will continue to utilize these types of marketing campaigns in the future.posted privacy policymusic industry initiatives into a single product suite,privacy-related lawsother media properties. Many terrestrial radio stations have begun broadcasting digital signals, which provide high quality audio transmission. In addition, unlike participants in the emerging internet radio market, terrestrial and regulationssatellite radio providers, as aggregate entities of their subsidiary providers, generally enjoy larger established audiences and legacy operating histories. Broadcast and satellite radio companies enjoy a significant cost advantage because they pay a much lower percentage of revenue for transmissions of sound recordings. Broadcast radio pays no royalties for its terrestrial use of sound recordings, and satellite radio paid only 9.5% of revenue in 2014 and only 10% of revenue in 2015 for its satellite transmissions of sound recordings. By contrast, Pandora incurred content acquisition costs representing 44% of revenue for our internet transmissions of sound recordings during the twelve months ended December 31, 2014. We also compete directly with other emerging non-interactive internet radio providers, which may offer more extensive content libraries than we offer and some of which may be accessed internationally. We could resultface additional competition if known incumbents in proceedings against us by governmental authoritiesthe digital media space choose to enter the internet radio market.others, which could harmpurchase. This interactive on-demand content is accessible in automobiles and homes, using portable players, mobile phones and other wireless and consumer electronic devices. The audio entertainment marketplace continues to rapidly evolve, providing our business. Further, any failure bylisteners with a growing number of alternatives and new media platforms.adequately protectcompete favorably on the privacy or securitybasis of these factors and justify a long-term profitable pricing structure. However, the market for online advertising solutions is intensely competitive and rapidly changing, and with the introduction of new technologies and market entrants, we expect competition to intensify in the future. Our competitors include Facebook, Google, MSN, Yahoo!, ABC, CBS, FOX, NBC, The New York Times and the Wall Street Journal. We directly compete against iHeartRadio, Entercom, Cumulus and other companies of the traditional broadcast radio market. For additional details on risks related to competition for advertisers, please refer to the section entitled "Risk Factors."listeners' information could result in a lossfinancial results.confidenceour fiscal quarters prior to 2014 (three months ended April 30, July 31, October 31 and January 31 of each year) reflect the same effects of the seasonal trends on advertising revenue discussed above for calendar periods, except that the impact of these advertising sales-related trends on our fiscal results was not as pronounced due to the inclusion of January instead of October in our service among existing and potential listeners, and ultimately, in a loss of listeners and advertising customers, which could adversely affect our business.three11 patents that have been issued in the United States and 11 that have been issued outside of the United States, and we continue to pursue additional patent protection, both in the United States and abroad where appropriate and cost effective."Pandora,""Pandora" and the "Music Genome Project," and "QUICKMIX," in addition to a number of Pandora logos.logos and other Pandora marks. "Pandora" is also registered in Australia, Canada, Chile, the European Union, India, Israel, Korea, Mexico, New Zealand, Switzerland, Taiwan and other countries. "Music Genome Project" is also registered in Australia, Canada, China and New Zealand. "QUICKMIX" is also registered in China. We have pending trademark applications in the United States and in certain other countries including applications for Pandora logos.pandora.de,pandora.rocks, among others. We own rights to proprietary processes and trade secrets, including those underlying the Pandora service. No single customertwelve months endedJanuary 31, 2013, the eleven months ended December 31, 2012 and 2013 and the twelve months endedDecember 31, 2014, we had no customers that accounted for 10% or more of our total revenues in fiscal 2011, 2012 or 2013.Seasonalityrevenue. Our results may reflect the effects of some seasonal trends in listener behavior due to increased internet usage and sales of media-streaming devices during certain vacation and holiday periods. For example, we expect to experience increased usage during the fourth quarter of each calendar year due to the holiday season, and in the first quarter of each calendar year due to increased use of media-streaming devices received as gifts during the holiday season. We may also experience higher advertising sales during the fourth quarter of each calendar year due to greater advertiser demand during the holiday season and lower advertising sales in the first quarter of the following year due toTable of Contentsreduced advertiser demand. See the section entitled "Quarterly Trends" in Item 7 of this Annual Report on Form 10-K for a more complete description of the seasonality of our financial results.EmployeesJanuaryDecember 31, 2013,2014, we had approximately 7401,414 employees. None of our employees are covered by collective bargaining agreements, and we consider our relations with our employees to be good.have a January 31changed our fiscal year end. Accordingly, into the calendar twelve months ending December 31, effective beginning with the period ended on December 31, 2013. As a result, our prior fiscal year was shortened from twelve months to an eleven-month transition period ended December 31, 2013. In this Annual Report on Form 10-K, all references to a fiscal year prior to December 31, 2013 refer to the 12twelve months ended January 31 of such year, and references to the first, second, third and fourth fiscal quarters ended prior to November 1, 2013 refer to the three months ended April 30, July 31, October 31 and January 31, respectively.the Companyus with the SEC, could adversely affect the Company'sour business, financial condition, results of operations and the trading price of our common stock. Additional risks and uncertainties that are not currently known to the Companyus or that are not currently believed by the Companyus to be material may also harm the Company'sour business operations and financial results. Because of the following factors, as well as other factors affecting the Company'sour financial condition and operating results, past financial performance should not be considered to be a reliable indicator of future performance, and investors should not use historical trends to anticipate results or trends in future periods.emerging market,evolving industry, which makes it difficult to evaluate our current business and future prospects.iscontinues to develop as an emerging marketindustry and our current business and future prospects are difficult to evaluate. The marketmarketplace for internet radio has undergone rapid and dramatic changes in its relatively short history and is subject toincomeYouInvestors should consider our business and prospects in light of the risks and difficulties we encounter in this new and rapidly evolving market,business, which risks and difficulties include, among others:
••
••markets;industries;
••
••and•compulsoryconsent decree licenses that may change or cease to exist, which in turn may result in a significant increase in our operating expenses.a new and emerging market,an evolving marketplace, could inhibit the implementation of our business plan, significantly harm our financial condition, operating results and liquidity and prevent us from achieving or sustaining profitability.We have incurred significant operating losses in the past and may not be able to generate sufficient revenue to be profitable. Since our inception in 2000, we have incurred significant net operating losses and, as of January 31, 2013, we had an accumulated deficit of $139.6 million. A key element of our strategy is to increase the number of listeners and listener hours to increase our market penetration, including the number of listener hours on mobile and other connected devices, such as automobiles and consumer electronics. However, as our number of listener hours increases, the royalties we pay for content acquisition also increase. We have not in the past generated, and may not in the future generate, sufficient revenue from the sale of advertising and subscriptions to offset our expenses. While we have generated revenue from our advertising products at a rate that exceeds the growth in listener hours in certain fiscal years for traditional computers and for the fiscal year ending January 31, 2013 for mobile and other connected devices, to date we have not been able to grow our total advertising revenue at a rate that exceeds the growth in our listener hours. Part of the challenge that we face in increasing sales to monetize inventory generated by mobile devices is that radio advertising has traditionally attracted primarily local advertisers and we are still at an early stage of building our sales capability and penetrating local advertising markets. In addition, to the extent that our listener base on mobile platforms may skew to different demographics than we have historically sold on our traditional computer platform, we must identify such demographics and convince advertisers of the capabilities of mobile advertising to maximize advertising inventory utilization across our multi-platform ad campaigns. If we cannot successfully earn revenue at a rate that exceeds the operational costs associated with increased listener hours, we may not be able to achieve or sustain profitability. In addition, we expect to invest heavily in our operations to support anticipated future growth. As a result of these factors, we expect to continue to incur annual losses on a U.S. GAAP basis in the near term. Our revenue increased rapidly in each of the fiscal years ended January 31, 2007 through January 31, 2013; however, we expect our revenue growth rate to decline in the future as a result of a variety of factors, including increased competition and the maturation of our business, and we cannot assure you that our revenue will continue to grow or will not decline. You should not consider our historical revenue growth or operating expenses as indicative of our future performance. If our revenue growth rate declines or our operating expenses exceed our expectations, our financial performance will be adversely affected. Further, if our future growth and operating performance fail to meet investor or analyst expectations, it could have a materially negative effect on our stock price. In addition, in our efforts to increase revenue as the number of listener hours has grown, we have expanded and expect to continue to expand our sales force. If our hiring of additional sales personnel does not result in a sufficient increase in revenue, the cost of this additional headcount will not be offset, which would harm our operating results and financial condition.Our failure to convince advertisers of the benefits of our service in the future could harm our business. For our fiscal year ended January 31, 2013 we derived 88% of our revenue from the sale of advertising and expect to continue to derive a substantial majority of our revenue from the sale of advertising in the future. Our ability to attract and retain advertisers, and ultimately to sell our advertising inventory to generate advertising revenue, depends on a number of factors, including:•increasing the number of listener hours;•keeping pace with changes in technology and our competitors;•competing effectively for advertising dollars from other online marketing and media companies;•penetrating the market for local radio advertising;•demonstrating the value of advertisements to reach targeted audiences across all of our delivery platforms, including the value of mobile digital advertising;•continuing to develop and diversify our advertisement platform, which currently includes delivery of display, audio and video advertising products through multiple delivery channels, including traditional computers, mobile and other connected devices, including automobiles; and•coping with ad blocking technologies that have been developed and are likely to continue to be developed that can block the display of our ads. Our agreements with advertisers are generally short term or may be terminated at any time by the advertiser. Advertisers that are spending only a small amount of their overall advertising budget on our service may view advertising with us as experimental and unproven and may leave us for competing alternatives at any time. We may never succeed in capturing a greater share of our advertisers' core advertising spending, particularly if we are unable to achieve the scale and market penetration necessary to demonstrate the effectiveness of our advertising platforms, or if our advertising model proves ineffective or not competitive when compared to alternatives. Failure to demonstrate the value of our service would result in reduced spending by, or loss of, existing or potential future advertisers, which would materially harm our revenue and business. traditional computers, and we expect that this trend will continue. Our mobile listenership has experienced significant growth since we introduced the first mobile version of our service in May 2007. Listener devices and other connected devices constituted approximately 5%77%, 26%76%, 54%, 69%80% and 77%83% of our total listener hours for fiscal years 2009, 2010, 2011,the twelve months ended January 31, 2013, the eleven months ended December 31, 2012 and 2013 and the twelve months ended December 31, 2014, respectively. We expect this growth to continue, though at a less rapid pace. Digital advertising on mobile devices is an emerging phenomenon, and the percentage of advertising spending allocated to digital advertising on mobile devices ishas historically been lower than that allocated to traditional online advertising. According to IDC,eMarketer, the percentage of U.S. advertising spending allocated to advertising on mobile devices was less than 1%approximately 11% in 2010,2014, compared to 13%approximately 30% for all online advertising. We must therefore convince advertisers of the capabilities of mobile digital advertising opportunities so that they migrate their advertising spend toward demographics and ad solutions that more effectively utilize mobile inventory. Our cost of content acquisition, or royalty fees for public performances is currently calculated on the same basis whether a listening hour is consumed on a traditional computer or a mobile device. To date, we have not been able to generate revenue from our advertising products delivered to mobile and other connected devices, such as automobiles and consumer electronics, as effectively as we have for our advertising products served on traditional computers. Radio advertising has traditionally attracted primarily local advertisers, and weBy contrast, audio ads are better-suited for delivery on smartphones connected to or installed in automobiles and across mobile and connected device platforms and video ads can be optimized for a variety of platforms. However, ourOur audio and video advertising products are relatively new and have not been as widely accepted by advertisers as our traditional display ads. In addition, the introduction of audio advertising places us in more direct competition with terrestrial radio, as many advertisers that purchase audio ads focus their spending on terrestrial radio stations who traditionally have strong connections with local advertisers. that, that, if successfully implemented, would increase our number of listener hours on mobile and other connected devices, including efforts to expand the reach of our service by making it available on an increasing number of devices, such as smartphones and devices connected to or installed in automobiles. In order to effectively monetize such increased listener hours, we must, among other things, convince advertisers to migrate spending to nascent advertising markets, penetrate local advertising markets and develop compelling ad product solutions. We cannot assureguarantee you that we will be ableWe may fail to do so. Some of these challenges include:•
•• and•products.If we are unableIn addition to maintain or increase the efficacy of our viral marketing strategy, or if we otherwise decideare beginning to expand the reach of our marketing through use oflaunch more costly marketing campaigns we may experience anand this increase in marketing expenses which could have an adverse effect on our results of operations. We cannot assureguarantee you that we will be successful in maintaining or expanding our listener base and failure to do so would materially reduce our revenue and adversely affect our business, operating results and financial condition.We have experienced rapid growthboth listener hours and advertising revenue. Wepart on our ability to consistently provide our subscribers with a quality experience through Pandora One. If Pandora One subscribers do not expectperceive that offering to be of value, or if we introduce new or adjust existing features or pricing in a manner that is not favorably received by them, we may not be able to sustain these growth rates inattract and retain subscribers. Subscribers may cancel their subscription to our service for many reasons, including a perception that they do not use the future and our business and operating results may suffer. We have experienced rapid growth rates in both listener hours and advertising revenueservice sufficiently, the need to cut household expenses, competitive services provide a better value or experience or as a result ofin changes in pricing, if any. If our growth strategyefforts to commit substantial financial, operational and technical resources to build the Company. As we grow larger and increase our listener base and usage, we expect it will become increasingly difficult to maintain the rate of growth we currently experience. Slower growth could negatively impact our stock price, our ability to hireattract and retain employees or harm our business in other ways.If we fail to effectively manage our growth, our business and operating results may suffer. Our rapid growth has placed, and will continue to place, significant demands on our management and our operational and financial infrastructure. In order to attain and maintain profitability, we will need to recruit, integrate and retain skilled and experienced sales personnel who can demonstrate our value proposition to advertisers and increase the monetization of listener hours, particularly on mobile devices, by developing relationships with both national and local advertisers to convince them to migrate advertising spending to online and mobile digital advertising markets and utilize our advertising product solutions. Continued growth could also strain our ability to maintain reliable service levels for our listeners, effectively monetize our listener hours, develop and improve our operational, financialand management controls, enhance our reporting systems and procedures and recruit, train and retain highly skilled personnel. If our systems dosubscribers are not evolve to meet the increased demands placed on us by an increasing number of advertisers, we may also be unable to meet our obligations under advertising agreements with respect to the timing of our delivery of advertising or other performance obligations. As our operations grow in size, scope and complexity, we will need to improve and upgrade our systems and infrastructure, which will require significant expenditures and allocation of valuable management resources. If we fail to maintain the necessary level of discipline and efficiency and allocate limited resources effectively in our organization as it grows,successful, our business, operating results and financial condition may suffer.We face and will continue to face competition for both listener hours and advertising spending.We compete with other content providers for listener hours. We compete for the time and attention of our listeners with other content providers on the basis of a number of factors, including quality of experience, relevance, acceptance and diversity of content, ease of use, price, accessibility, perception of ad load, brand awareness and reputation. Many of our competitors may leverage their existing infrastructure, brand recognition and content collections to augment their services by offering competing internet radio features to provide listeners with more comprehensive music service delivery choices. We face increasing competition for listeners from a growing variety of businesses that deliver audio media content through mobile phones and other wireless devices. Our competitors include terrestrial radio, satellite radio, and online radio. Terrestrial radio providers such as CBS and Clear Channel offer their content for free, are well-established and accessible to listeners and offer content, such as news, sports, traffic, weather and talk that we currently do not offer. In addition, many terrestrial radio stations have begun broadcasting digital signals, which provide high quality audio transmission. Satellite radio providers, such as Sirius XM, may offer extensive and oftentimes exclusive news, comedy, sports and talk content, national signal coverage, and long established automobile integration. In addition, terrestrial radio pays no royalties for its use of sound recordings and satellite radio pays a much lower percentage of revenue, currently 9.0%, than internet radio providers for use of sound recordings, giving broadcast and satellite radio companies a significant cost advantage. Other online radio providers may offer more extensive content libraries than we offer and some may be accessed internationally. We also compete with providers of on-demand audio media and entertainment which are purchased or available for free and playable on mobile devices, automobiles and in the home. These forms of media may be purchased, downloaded and owned such as iTunes audio files, MP3s, CDs, or accessed from subscription or free online on-demand offerings by music providers such as RDIO, Spotify, and Rhapsody or content streams from other online services such as Hulu, VEVO, turntable fm and YouTube. We believe that companies with a combination of financial resources, technical expertise and digital media experience also pose a significant threat of developing competing internet radio and digital audio entertainment technologies in the future. In particular, if known incumbents in the digital media space such as Amazon, Apple, Facebook or Google choose to offer competing services, they may devote greater resources than we have available, have a more accelerated time frame for deployment and leverage their existing user base and proprietary technologies to provide products and services that our listeners and advertisers may view as superior. Our current and future competitors may have more well-established brand recognition, more established relationships with consumer product manufacturers, greater financial, technical, and other resources, more sophisticated technologies or more experience in the markets in which we compete. We also compete for listeners on the basis of our presence and visibility as compared with other businesses and software that deliver audio and other content through the internet, mobile devices and consumer products. We face significant competition for listeners from companies promoting their own digital music and content online or through application stores, including several large, well-funded and seasoned participants in the digital media market. Search engines, such as Google, and mobile device application stores, such as the iTunes Store, rank responses to search queries based on the popularity of a website or mobile application, as well as other factors that are outside of our control. Additionally, mobile device application stores often offer users the ability to browse applications by various criteria, such as the number of downloads in a given time period, the length of time since a mobile app was released or updated, or the category in which the application is placed. The websites and mobile applications of our competitors may rank higher than our website and our Pandora app, and our app may be difficult to locate in mobile device application stores, which could draw potential listeners away from our service and toward those of our competitors. In addition, our competitors' products may be pre-loaded into consumer electronics products or automobiles, creating an initial visibility advantage. If we are unable to compete successfully for listeners against other digital media providers by maintaining and increasing our presence and visibility online, in application stores and in consumer electronics products and automobiles, our listener hours may fail to increase as expected or decline and our advertising sales may suffer. To compete effectively, we must continue to invest significant resources in the development of our service to enhance the user experience of our listeners. There can be no assurance that we will be able to compete successfully for listeners in the future against existing or new competitors, and failure to do so could result in loss of existing or potential listeners, reduced revenue, increased marketing expenses or diminished brand strength, any of which could harm our business.We compete for advertising spending with other content providers. We compete for a share of advertisers' overall marketing budgets with other content providers on a variety of factors including perceived return on investment, effectiveness and relevance of our advertising products, pricing structure and ability to deliver large volumes or precise types of ads to targeted demographics. We face significant competition for advertising dollars from terrestrial and, to a lesser extent, satellite radio providers. As many of the advertisers we target have traditionally advertised on terrestrial radio and have less experience with internet radio providers, they may be reluctant to spend for advertising on traditional computers, mobile or other connected device platforms. In addition, terrestrial radio providers as well as other traditional media companies in television and print, such as broadcast television networks such as ABC, CBS, FOX and NBC, cable television channel providers, national newspapers such as the New York Times and the Wall Street Journal and some regional newspapers, enjoy a number of competitive advantages over us in attracting advertisers, including large established audiences, longer operating histories, greater brand recognition and a growing presence on the internet. Although advertisers are allocating an increasing amount of their overall marketing budgets to web and mobile-based ads, such spending lags behind growth in internet and mobile usage, and the market for online and mobile advertising is intensely competitive. As a result, we also compete for advertisers with a range of internet companies, including major internet portals, search engine companies and social media sites. Large internet companies with greater brand recognition, such as Facebook, Google, MSN and Yahoo! have significant numbers of direct sales personnel and substantial proprietary advertising inventory and web traffic that provide a significant competitive advantage and have a significant impact on pricing for internet advertising and web traffic. The trend toward consolidation among online marketing and media companies may also affect pricing and availability of advertising inventory. In order to compete successfully for advertisers against new and existing competitors, we must continue to invest resources in developing and diversifying our advertisement platform, harnessing listener data and ultimately proving the effectiveness and relevance of our advertising products. Failure to compete successfully against our current or future competitors could result in loss of current or potential advertisers or a reduced share of our advertisers' overall marketing budget, which could adversely affect our pricing and margins, lower our revenue, increase our research and development and marketing expenses and prevent us from achieving or maintaining profitability.Our ability to increase the number of our listeners will depend in part on our ability to establish and maintain relationships with automakers, automotive suppliers and consumer electronics manufacturers with products that integrate our service. A key element of our strategy to expand the reach of our service and increase the number of our listeners and listener hours is to establish and maintain relationships with automakers, automotive suppliers and consumer electronics manufacturers that integrate our service into and with their products. Working with certain third-party distribution partners, we currently offer listeners the ability to access our service through a variety of consumer electronics products used in the home and devices connected to or installed in automobiles. We intend to broaden our ability to reach additional listeners, and increase current listeners hours, through other platforms and partners over time. However, reaching agreements with distribution partners can be time consuming, and once an agreement is reached, product design cycles can be lengthy. If we are not successful in maintaining existing and creating new relationships, or if we encounter technological, content licensing or other impediments, our ability to grow our business could be adversely impacted. Our existing agreements with partners in the automobile and consumer electronics industries generally do not obligate those partners to launch our service in their products. In addition, some automobile manufacturers or their supplier partners may terminate their agreements with us for convenience. Our business could be adversely affected if our automobile partners and consumer electronics partners do not continue to provide access to our service or are unwilling to do so on terms acceptable to us. If we are forced to amend the business terms of our distribution agreements as a result of competitive pressure, our ability to maintain and expand the reach of our service and increase listener hours would be adversely affected, which would reduce our revenue and harm our operating results. Additionally, we distribute our mobile applications via smartphone application download stores managed by Apple, Google, Amazon, Palm and Research In Motion, or RIM, and such distribution is subject to an application developer license agreement in each case. Should any of these parties amend the terms of their license in such a way that inhibits our ability to distribute the Pandora apps via their application store, or negatively impacts our economics in such distribution, our ability to increase listener hours and sell advertising would be adversely affected, which would reduce our revenue and harm our operating results.If we are unable to continue to make our technology compatible with the technologies of third-party distribution partners who make our service available to our listeners through mobile devices, consumer electronic products and automobiles, we may not remain competitive and our business may fail to grow or decline. In order to deliver music everywhere our listeners want to hear it, our service must be compatible with mobile, consumer electronic, automobile and website technologies. Our service is accessible in part through Pandora-developed or third-party developed applications that hardware manufacturers embed in, and distribute through, their devices. Connected devices and their underlying technology are constantly evolving. As internet connectivity of automobiles, mobile devices, and other consumer electronic products expands and as new internet-connected products are introduced, we must constantlyadapt our technology. It is difficult to keep pace with the continual release of new devices and technological advances in digital media delivery and predict the problems we may encounter in developing versions of our applications for these new devices and delivery channels. It may become increasingly challenging to do so in the future. In particular, the technology used for streaming the Pandora service in automobiles remains at an early stage and may not result in a seamless customer experience. If automobile and consumer electronic makers fail to make products that are compatible with our technology or we fail to adapt our technology to evolving requirements, our ability to grow or sustain the reach of our service, increase listener hours and sell advertising could be adversely affected. Consumer tastes and preferences can change in rapid and unpredictable ways and consumer acceptance of these products depends on the marketing, technical and other efforts of third-party manufacturers, which is beyond our control. If consumers fail to accept the products of the companies with whom we partner or if we fail to establish relationships with makers of leading consumer products, our business could be adversely affected.Unavailability of, or fluctuations in, third-party measurements of our audience may adversely affect our ability to grow advertising revenue. Selling ads requires that we demonstrate to advertisers that our service has substantial reach and usage, and we rely on third parties to quantify the reach and usage of our service. These third-party measurements may not reflect our true listening audience and their underlying methodologies are subject to change at any time. In addition, the methodologies we apply to measure the key metrics that we use to monitor and manage our business may differ from the methodologies used by third-party measurement service providers. For example, we calculate listener hours based on the total bytes served for each track that is requested and served from our servers, as measured by our internal analytics systems, whether or not a listener listens to the entire track. By contrast, certain third-party measurement service providers may calculate and report the number of listener hours using a client-based approach, which measures time elapsed during listening sessions. Measurement technologies for mobile and consumer electronic devices may be even less reliable in quantifying the reach and usage of our service, and it is not clear whether such technologies will integrate with our systems or uniformly and comprehensively reflect the reach and usage of our service. While we have been working with third-party measurement service providers, these providers have not yet developed uniform measurement systems that comprehensively measure the reach and usage of our service. We expect that in the future these providers will begin to publish increasingly reliable information about the reach and usage of our service. However, until then, in order to demonstrate to potential advertisers the benefits of our service, we must supplement third-party measurement data with our internal research, which may be perceived as less valuable than third-party numbers. If such third-party measurement providers report lower metrics than we do, or if there is wide variance among reported metrics, our ability to convince advertisers of the benefits of our service could be adversely affected.Our success depends upon the continued acceptance of online advertising as an alternative or supplement to offline advertising. The percentage of the advertising market allocated to online advertising lags the percentage of consumer online consumption by a significant degree. Growth of our business will depend in large part on the reduction or elimination of this gap between online and offline advertising spending, which may not happen in a way or to the extent that we currently expect. Many advertisers still have limited experience with online advertising and may continue to devote significant portions of their advertising budgets to traditional, offline advertising media. Accordingly, we continue to compete for advertising dollars with traditional media, including broadcast radio. Although advertisers as a whole are spending an increasing amount of their overall advertising budget on online advertising, we face a number of challenges in growing our advertising revenue. Wecompete for advertising dollars with significantly larger and more established online marketing and media companies such as Facebook, Google, MSN and Yahoo!. We believe that the continued growth and acceptance of our online advertising products will depend on the perceived effectiveness and the acceptance of online advertising models generally, which is outside of our control. Any lack of growth in the market for online advertising could result in reduced revenue or increased marketing expenses, which would harm our operating results and financial condition.We operate under and pay royalties pursuant to statutory licensing structures for the reproduction and public performance of sound recordings that could change or cease to exist, which would adversely affect our business. We currently operate under statutory and compulsory licensing regimes and structures that may change or cease to exist. We must pay performance rights royalties for the digital audio transmission of sound recordings. Subject to our ongoing compliance with numerous statutory conditions and regulatory requirements for a non-interactive service, we are permitted to operate under a statutory license that allows the streaming in the U.S. of any sound recording lawfully released to the public. We are also permitted to make reproductions of sound recordings on computer servers pursuant to a separate statutory license designed to facilitate the making of transmissions. There is no guarantee that we will continue to be eligible to operate under these statutory licenses. For example, if a court were to determine that we operate an interactive streaming service or make reproductions of sound recordings outside the statutory license, we would have to negotiate license agreements with sound recording copyright owners individually, a time consuming and expensive undertaking that would jeopardize our ability to stream all music currently in our library and could result in royalty costs that are prohibitively expensive. In addition, if copyright owners object to the functionality or transmission methods of our service, we could lose our eligibility to operate under the statutory licenses. Our ability to avoid negotiating separate agreements with the many copyright owners of sound recordings depends on these two statutory licenses, and if we were to no longer qualify for operation under, or violate the provisions of the statutory licenses, we could be subject to significant liability for copyright infringement and may no longer be able to operate under our existing licensing regime. For our fiscal year ended January 31, 2013 we incurred SoundExchange related content acquisition costs representing 55.9% of our total revenue for that period. The rates to be paid for the streaming of sound recordings pursuant to the statutory licenses can be established by either negotiation or through a rate proceeding conducted by the CRB, a tribunal established within the U.S. Library of Congress. In 2007, the CRB set royalty rates for the online streaming of sound recordings for 2006 through 2010 that were so high that the cost for streaming sound recordings alone would have been unsustainable under our current business model. In response to the lobbying efforts of internet webcasters, including us, Congress passed the Webcaster Settlement Acts of 2008 and 2009, which permitted webcasters and SoundExchange, the sole entity designated by the CRB to collect and distribute the statutory royalties paid by internet webcasters such as us, to negotiate alternative rates to those established by the CRB for the years 2006 through 2015. In July 2009, certain webcasters reached an agreement with SoundExchange, establishing a more favorable royalty structure that we have elected to accept and that by its terms will apply through 2015. We do not know what rates will be available to us following that period and there is no guarantee that the royalty structure that emerged from the negotiations with SoundExchange pursuant to the Webcaster Settlement Acts will be available after 2015. The CRB, which still has rate-making authority over us upon expiration of our agreement with SoundExchange, has consistently established royalty rates that would, if paid by us, consume an unsustainable percentage of our revenue. If we are unable to reach a new agreement with SoundExchange for the period after 2015, our operating costs may significantly increase, which could harm our financial condition and inhibit the implementation of our business plan. In addition, the royalties that we pay to SoundExchange for the streaming of sound recordings are calculated using a per performance rate. While we believe that the mechanisms we use to track performances are sufficient to ensure that we are accurately reporting and paying royalties, our ability to do so depends in part on our ability to maintain these mechanisms as new devices are introduced and incumbent technologies evolve. Any understatement or overstatement of performances could result in our paying lower or higher royalties to SoundExchange than we actually owed, which could in turn affect our financial condition and results of operations.We depend upon third-party licenses for the right to publicly perform musical works and a change to or loss of these licenses could increase our operating costs or adversely affect our ability to retain and expand our listener base, and therefore could adversely affect our business. To secure the rights to stream musical works embodied in sound recordings over the internet, we obtain licenses from or for the benefit of copyright owners and pay royalties to copyright owners or their agents. Those who own copyrights in musical works are vigilant in protecting their rights and seek royalties that are very high in relation to the revenue that can be generated from the public performance of such works. There is no guarantee that the licenses available to us now will continue to be available in the future or that such licenses will be available at the royalty rates associated with the current licenses. If we are unable to secure and maintain rights to stream musical works or if we cannot do so on terms that are acceptable to us, our ability to stream music content to our listeners, and consequently our ability to attract and retain advertisers, will be adversely impacted. Copyright owners of musical works most often rely on intermediaries known as performance rights organizations to negotiate so-called "blanket" licenses with copyright users, collect royalties under such licenses and distribute them to copyright owners. We have obtained public performance licenses from, and pay license fees to, the three major performance rights organizations in the United States: the American Society of Composers, Authors and Publishers, or ASCAP, Broadcast Music, Inc., or BMI and SESAC, Inc., or SESAC. These organizations represent the rights of songwriters and music publishers, negotiate with copyright users such as us, collect royalties and distribute those royalties to the copyright owners they represent. Performing rights organizations have the right to audit our playlists and royalty payments, and any such audit could result in disputes over whether we have paid the proper royalties. If such a dispute were to occur, we could be required to pay additional royalties and the amounts involved could be material. We currently operate under a final agreement with SESAC, however, this agreement is subject to termination by either party in accordance with its terms at the end of each yearly term, and there is no guarantee that the associated royalty rate available to us now will be available to us in the future. We currently operate under interim agreements with BMI and ASCAP, which pursuant to their respective consent decrees entered into with the U.S. Department of Justice cannot refuse to grant us licenses for the public performance of the musical works they administer. The rates to be paid to BMI and ASCAP can be set, in the absence of a negotiated agreement, by the respective rate courts established pursuant to such decrees in the U.S. District Court for the Southern District of New York. SESAC is not subject to a mandatory licensing obligation and could withhold the rights to all of the musical works which it administers. The loss of the musical works represented by ASCAP, BMI and SESAC could diminish the appeal of our service to listeners. In 2010, we elected to terminate our prior agreement with ASCAP as of December 31, 2010 and in 2012 we elected to terminate our prior agreement with BMI as of December 31, 2012 because we believed that the royalty rates sought by ASCAP and BMI were excessive. Notwithstanding our termination of these agreements, the musical works administered by ASCAP and BMI are licensed to us pursuant to the provisions of their respective consent decrees. In September 2011, we changed the method we used to calculate royalties due to ASCAP following the execution of an interim arrangement for the period commencing January 1, 2011, pending a final determination of new rates. In November 2012, we filed suit in the rate court to resolve the royalty dispute with ASCAP. The ratecourt proceedings can take years to complete and can be very costly. There is no guarantee that final rates established by mutual agreement or by a rate court determination would establish royalty rates more favorable to us than those we previously paid pursuant our terminated agreements with ASCAP and/or BMI or those that we pay pursuant to our interim arrangements with ASCAP and/or BMI. In addition, we could be liable for both increased royalty rates going forward and a potential true-up of royalty payments in excess of any interim royalties paid for the period following December 31, 2010 with respect to ASCAP and/or for the period following December 31, 2012 with respect to BMI. For our fiscal year ended January 31, 2013, we incurred BMI, SESAC, ASCAP, EMI and Sony ATV related content acquisition costs representing 4.3% of our total revenue for that period. We do not currently pay so-called "mechanical royalties" to music publishers for the reproduction and distribution of musical works embodied in transitory copies used to make streams audible to our listeners. Although not currently a matter of dispute, if music publishers were to change their position and seek to be paid mechanical royalties by us, and a final judgment were entered by a court requiring that payment, our royalty obligations could increase significantly, which would increase our operating expenses and harm our business and financial interests. In May 2011, we started streaming spoken word comedy content, for which the underlying literary works are not currently entitled to eligibility for licensing by any performing rights organization for the United States. While pursuant to industry-wide custom and practice this content is performed absent a specific license from any such performing rights organization, there can be no assurance that this will not change or that we will not otherwise become subject to additional licensing costs for spoken word comedy content imposed by performing rights organizations in the future.If music publishers withdraw all or a portion of their music works from performing rights organizations for public performances by means of digital transmissions, we may be forced to enter into direct licensing agreements with these publishers at rates higher than those we currently pay, or we may be unable to reach agreement with these publishers at all, which could adversely affect our business, financial condition and results of operations. If music publishers withdraw all or a portion of their catalogs from performing rights organizations (or "PROs") such as ASCAP, BMI or SESAC, we may no longer be able to obtain licenses for such publisher's withdrawn catalogs. Under these circumstances, we would need to enter into direct licensing arrangements with such music publishers. For example, EMI purportedly withdrew its catalog from ASCAP in May 2011, and as a result we entered into a separate license agreement with EMI in March 2012. Sony ATV, which led a consortium to acquire EMI in June 2012, announced its intention to withdraw certain rights from ASCAP and BMI to license the performance of its works effective December 31, 2012 and, as a result, we entered into a separate license agreement with Sony ATV in January 2013. Other publishers have signaled their intent to withdraw all or a portion of their catalogs from ASCAP and BMI. Although we continue to be licensed by the PROs, it is currently unclear what specific effect a publisher's limited withdrawal of rights to public performances by means of digital transmissions from a PRO would have on us. If we are unable to reach an agreement with respect to the repertoire of any music publisher who withdraws all or a portion of its catalog(s) from a PRO, or if we are forced to enter into direct licensing agreements with publishers at rates higher than those currently set by the PROs (or higher than those set by the U.S. District Court having supervisory authority over ASCAP and BMI) for the performance of musical works, or if there is uncertainty as to what rights are administered by any particular PRO or publisher, our ability to stream music content to our listeners may be limited or our operating costs may significantly increase, and this could adversely affect our business, financial condition and results of operations.assureguarantee you that such investments will yield an attractive return or that such refinements will be effective. The effectiveness of our personalized playlist generating system depends in part on our ability to gather and effectively analyze large amounts of listener data and listener feedback and we have no assurance that we will continue to be successful in enticing listeners to give a thumbs-up or thumbs-down to enough songs for our database to effectively predict and select new and existing songs. In addition, our ability to offer listeners songs that they have not previously heard and impart a sense of discovery depends on our ability to acquire and appropriately categorize additional tracks that will appeal to our listeners' diverse and changing tastes. While we have more than 1,000,000 songs in our catalog, we must continuously identify and analyze additional tracks that our listeners will enjoy and we may not effectively do so.recently launchedalso provide comedy content on Pandora, an offering whichthat is designed to predict comedy content thatwhat our listeners will enjoy using technology similar to the technology that we use to generate personalized playlists for music. The risks that apply to predicting our listeners' musical tastes apply to comedy to an even greater extent, particularly as we lack experience with content other than music, do not yet have as large a largedata set of data on listener preferences for comedy, and have a much smaller comedy catalog as compared to music. Our ability to predict and select music or comedy content that our listeners enjoy is critical to the perceived value of our service among listeners and failure to make accurate predictions would adversely affect our ability to attract and retain listeners, increase listener hours and sell advertising.RIMGoogle and Google,Microsoft, are short termshort-term or can be cancelledcanceled at any time with little or no prior notice or penalty. The loss of these agreements, or the renegotiation of these agreements on less favorable economic or other terms, could limit the reach of our service and its attractiveness to advertisers. Some of these mobile device makers, including Apple, are now, or may in the future become, competitors of ours, and could stop allowing or supporting access to our service through their products for competitive reasons. Furthermore, because devices providing access to our service are not manufactured and sold by us, we cannot guarantee that these companies will ensure that their devices perform reliably, and any faulty connection between these devices and our service may result in consumer dissatisfaction toward us, which could damage our brand.the end of our fiscal year,year-end, including a statement as to whether or not our internal control over financial reporting is effective. This assessment must include disclosure of any material weaknesses in our internal control over financial reporting identified by management.JanuaryDecember 31, 2013,2014, as indicated in our Management's Annual Report on Internal Control over Financial Reporting included in this Annual Report on Form 10-K for the twelve months ended December 31, 2014, we must continue to monitor and assess our internal control over financial reporting. If our management identifies one or more material weaknesses in our internal control over financial reporting and such weakness remains uncorrected at fiscal year-end, we will be unable to assert that such internal control is effective at fiscal year-end. If we are unable to assert that our internal control over financial reporting is effective at fiscal year-end, (oror if our independent registered public accounting firm is unable to express an opinion on the effectiveness of our internal controls or concludes that we have a material weakness in our internal controls),controls, we could lose investor confidence in the accuracy and completeness of our financial reports, which could have a material adverse effect on our business and the price of our common stock.Further,In addition, if our partners fail to maintain high standards for products that integrate our service, fail to display our trademarks on their products in breach of our agreements with them, or use our trademarks incorrectly or in an unauthorized manner or if we partner with manufacturers of products that our listeners reject, the strength of our brand could be adversely affected. Further, our efforts to achieve a more equitable royalty structure for our business may have an adverse impact on our relationship with songwriters, performers, and other artists, which could in turn diminish the perception of our brand. In addition, there is a risk that the word "Pandora" could become so commonly used that we lose protection for this trademark, which could result in other people using the word "Pandora" to refer to their own products, thus diminishing the strength of our brand.been required to spend considerable resourcesincurred significant expenses to establish and maintain our brand. However, if we are unable to maintain the growth rate in the number of our listeners, we may be required to expend greater resources on advertising, marketing and other brand-building efforts to preserve and enhance consumer awareness of our brand which would adversely affect our operating results and may not be effective.Californiathe United States and Virginia,New Zealand, to enable listeners to receive our content in a dependable, timely and efficient manner. We have experienced and expect to continue to experience periodic service interruptions and delays involving our own systems and those of our third-party vendors. In the event of a service outage at our main site, we maintain a backup site that can function in read-only capacity. We do not currently maintain a live fail-over capability that would allow us to instantaneous switch our streaming operations from one facility to another in the event of a service outage. In the event of an extended service outage at our main site, we do maintain and test fail-over capabilities that should allow us to switch our live streaming operations from one facility to another. Both our own facilities and those of our third-party vendors are vulnerable to damage or interruption from earthquakes, floods, fires, power loss, telecommunications failures and similar events. They also are subject to break-ins, hacking, denial of service attacks, sabotage, intentional acts of vandalism, the failure of physical, administrative, technical and cyber security measures, terrorist acts, natural disasters, human error, the financial insolvency of our third-party vendors and other unanticipated problems or events. The occurrence of any of these events could result in interruptions in our service and to unauthorized access to, or alteration of, the content and data contained on our systems and that these third-party vendors store and deliver on our behalf.because ofdue to a variety of factors, many of which are outside our control. As a result, comparing our operating results on a period to periodperiod-to-period basis may not be meaningful. In addition to other risk factors discussed in this "Risk Factors" section, factors that may contribute to the variability of our quarterly and annual results include:•our ability to retain our current listenership, build our listener base and increase listener hours;Table of Contents••our ability to more effectively monetize mobile listener hours by increasing the sale of mobile advertising inventory as the number of listener hours on mobile devices grow;•our ability to attract and retain existing advertisers and prove that our advertising products are effective enough to justify a pricing structure that is profitable for us;•our ability to effectively manage our growth;•our ability to continue to operate under the statutory licenses set forth in the Digital Millennium Copyright Act ("DMCA") and the Digital Performance Right in Sound Recordings Act ("DPRA");•our ability to enjoy the benefit of rates negotiated below those established by the CRB in 2007;•our ability to enjoy the benefits of collective licensing available through performing rights organizations;•the effects of increased competition in our business;•our ability to keep pace with changes in technology and our competitors;•interruptions in service, whether or not we are responsible for such interruptions, and any related impact on our reputation;•
••
•••increased internet usagehigher advertising sales during the fourth quarter of each calendar year due to greater advertiser demand during the holiday season and lower advertising sales in the first three months of media-streaming devices during certain vacationthe following calendar year due to reduced advertiser demand. Expenditures by advertisers tend to be cyclical and holiday periods. For example,discretionary in nature, reflecting overall economic conditions, the economic prospects of specific advertisers or industries, budgeting constraints and buying patterns and a variety of other factors, many of which are outside our control. In addition, we expect to experience increased usage during the fourth quarter of each calendar year due to the holiday season, and in the first quarter of each calendar year due to increased use of media-streaming devices received as gifts during the holiday season. We may also experience higher advertising sales during the fourth quarter We believe that our business may become more seasonal in the future and that such seasonal variations in listener behavior may result in fluctuations in our financial results.applications.applications and we have purchased portfolios of internet radio-related patents from third parties. It is possible, however, that these innovations may not be protectable. In addition, given the cost, effort, risks and downside of obtaining patent protection, including the requirement to ultimately disclose the invention to the public, we may choose not to seek patent protection for certain innovations. However, such patent protection could later prove to be important to our business. Furthermore, there is always the possibility that our patent applications may not issue as granted patents, that the scope of the protection gained will be insufficient or that an issued patent may be deemed invalid or unenforceable. We also cannot guarantee the following:abandoned, abandoned;us, us;parties, parties;sought, sought;weak,weak; orsolutionsservice within that country or to elect not to sell solutions in that country. Either result could harm our business and operating results. The regulation of domain names in the United States and in foreign countries is subject to change. Regulatory bodies could establish additional top-level domains, appoint additional domain name registrars or modify the requirements for holding domain names. As a result, we may not be able to acquire or maintain the domain names that utilize our brand names in the United States or other countries in which we may conduct business in the future. Although we take steps to protect our intellectual property as discussed above, there can be no assurance, however, that changes in law will not be implemented, or changes in interpretation of such laws will occur, that will affect our ability to protect and enforce our patents and other intellectual property, including as a result of the 2011 passage of the America Invents Act of 2011 (which codifies several significant changes to the U.S. patent laws and will remain subject to certain rule-making and interpretation, including changing from a "first to invent" to a "first inventor to file" system, limiting where a patentee may file a patent suit, requiring the apportionment of patent damages, replacing interference proceedings with derivation actions, and creating a post-grant opposition process to challenge patents after they have issued).rights, and as we face increasing competition, the possibility of intellectual property rights claims against us grows.rights. In addition, various federal and state laws and regulations govern the intellectual property and related rights associated with sound recordings and musical works. Existing laws and regulations are evolving and subject to different interpretations, and various federal and state legislative or regulatory bodies may expand current or enact new laws or regulations. We cannot assureguarantee you that we are not infringing or violating any third-party intellectual property rights.whether they are with or without merit, are settled out of court, or are determined in our favor, we may be required to expend significant time and financial resources on the defense of such claims.claims, even if without merit, settled out of court, or determined in our favor. Furthermore, an adverse outcome of a dispute may require us toto: pay damages, potentially including treble damages and attorneys' fees, if we are found to have willfully infringed a party's intellectual property; cease making, licensing or using solutionsproducts or services that are alleged to infringe or misappropriate the intellectual property of others; expend additional development resources to redesign our solutions;services; enter into potentially unfavorable royalty or license agreements in order to obtain the right to use necessary technologies, content or materials; andor to indemnify our partners and other third parties. Royalty or licensing agreements, if required or desirable, may be unavailable on terms acceptable to us, or at all, and may require significant royalty payments and other expenditures. In addition, we do not carry broadly applicable patent liability insurance and any lawsuits regarding intellectual propertypatent rights, regardless of their success, could be expensive to resolve and would divert the time and attention of our management and technical personnel.do not have anylimited experience in acquiring other businesses. If we acquire additional businesses, we may not be able to integrate the acquired personnel, operations and technologies successfully, or effectively manage the combined business following the acquisition. We also may not achieve the anticipated benefits from the acquired business due to a number of factors, including:
••
•••
••
••
•••stream music and other content on favorable terms.recently began streaming music to web-based devices and engaging with listenersproviding our service in New Zealand, Australia and thetheir associated territories. However, offering our service outside of the United States involves numerous risks and challenges. Most importantly, while United States copyright law provides a statutory licensing regime for the streamingpublic performance of sound recordings to listeners within the United States, there is no equivalent statutory licensing regime available outside of the United States, and many of the other licensing alternatives currently available in other countries are not commercially viable. Currently, the licensing terms offered by rights organizations and individual copyright owners in most countries outside the United States are prohibitively expensive. Addressing licensing structure and royalty rate issues in the United States required us to make very substantial investments of time, capital and other resources, and our business could have failed if such investments had not succeeded. Addressing these issues in foreign jurisdictions may require a commensurate investment by us, and there can be no assurance that we would succeed or achieve any return on this investment.
•••
••operatedoperate internationally;
••
••
••
••• Further,Expansion of our operations into non-music content, including our recent launch of comedy, subjects us to additional business, legal, financial and competitive risks. Expansion of our operations into delivery of non-music content stations involves numerous risks and challenges, including increased capital requirements, new competitors and the need to develop new strategic relationships. For example, in May 2011, we started streaming spoken word comedy content, for which the underlying literary works are not currently entitled to eligibility for licensing by any performing rights organization for the United States. Rather, pursuant to industry-wide custom andpractice, this content is performed absent a specific license from any such performing rights organization. Further, growth into this new area may require changes to our existing business model and cost structure, modifications to our infrastructure and exposure to new regulatory and legal risks, any of which may require expertise in which we have little or no experience. There is no guarantee that we will be able to generate sufficient revenue from advertising sales associated with comedy content to offset the costs of maintaining comedy stations. For example, many of the mainstream advertisers that choose to place ads on our music stations may choose not to advertise on our comedy stations because of the sometimes explicit nature of comedy content. Further, we have established a reputation as an online music provider and our ability to gain acceptance and listenership for comedy content stations, and thus our ability to attract advertisers on comedy stations, is not certain. Failure to obtain or retain rights to comedy content on acceptable terms, or at all, to successfully monetize and generate revenues from such content, or to effectively manage the numerous risks and challenges associated with such expansion could adversely affect our revenues and profitability. To the extent we choose, in the future, to offer additional types of content beyond music and comedy, such as news, talk and sports programming, we will be subject to many of these same risks.JanuaryDecember 31, 2013,2014, we had federal net operating loss carryforwards of approximately $180.8$447 million and tax credit carryforwards of approximately $2.5$7.9 million. At JanuaryDecember 31, 2013,2014, we had state net operating loss carryforwards of approximately $203.8$496 million and tax credit carryforwards of approximately of $4.3$8.3 million. Under Sections 382 and 383 of the Internal Revenue Code of 1986, as amended, or ("the Code,Code"), if a corporation undergoes an "ownership change," the corporation's ability to use its pre-change net operating loss carryforwards and other pre-change tax attributes, such as research tax credits, to offset its post-change income may be limited. In general, an "ownership change" will occur if there is a cumulative change in our ownership by "5-percent shareholders" that exceeds 50 percentage points over a rolling three-year period. Similar rules may apply under state tax laws. As a result of prior equity issuances and other transactions in our stock, we have previously experienced "ownership changes" under section 382 of the Code and comparable state tax laws. We may also experience ownership changes in the future as a result of future transactions in our stock. As a result, if we earn net taxable income, our ability to use our pre-change net operating loss carryforwards or other pre-change tax attributes to offset United States federal and state taxable income is subject to limitations.tax provisiontaxes and accruals for these taxes. For example, our effective tax rates could be adversely affected by earnings being lower than anticipated in countries where we have lower statutory tax rates and higher than anticipated in countries where we have higher statutory tax rates, by losses incurred in jurisdictions for which we are not able to realize the related tax benefit, by changes in foreign currency exchange rates, by changes in the valuation of our deferred tax assets and liabilities, or by changes in the relevant tax, accounting and other laws, regulations, principles and interpretations. We are also subject to tax audits in various jurisdictions, and such jurisdictions may assess additional income tax liabilities against us.illegallyor in violation of contractual prohibitions, obtain, transmit or utilize our listeners' or artists' personally identifiable information, or data associated with particular users, devices or devices.bodiesauthorities have increasingly scrutinized the ways in which companies link personal identities and data associated with particular users or devices with data collected through the internet, and we expect such scrutiny to continue to increase. Alleged violations of laws and regulations relating to privacy and data security, and any relevant claims, may expose us to potential liability and may require us to expend significant resources in responding to and defending such allegations and claims. Claims or allegations that we have violated laws and regulations relating to privacy and data security have resulted and could in the future result in negative publicity and a loss of confidence in us by our listeners and our advertisers, and may subject us to fines by credit card companies and loss of our ability to accept credit and debit card payments.wouldcould in turn limit our ability to stream personalized music content to our listeners and offer targeted advertising opportunities to our advertising customers, each of which are critical to the success of our business.viruses, internetmalware, Trojans, worms, break-ins, phishing attacks, attempts to overload servers with denial-of-service, attempts to access our servers to stream music or acquire playlists, or other attacks and similar ofon our systems or a vendor's systems, we may face civil liability and public perception of our security measures could be diminished,reputational damage, either of which would negatively affect our ability to attract and retain listeners, which in turn would harm our efforts to attract and retain advertisers. We also would be required to expend significant resources to mitigate the breach of security and to address related matters. Unauthorized access to music or playlists would potentially create additional royalty obligations with no corresponding revenue.applicationsapps provided by third parties represents a significant growth opportunity for us, but we may not be able to control such third parties' use of listeners' data, ensure their compliance with the terms of our privacy policies, or prevent unauthorized access to, or use or disclosure of, listener information, any of which could hinder or prevent our efforts with respect to growth opportunity. In addition, these third partythird-party vendors may become the victim of security breaches, or have practices that may result in a breach and we may be responsible for those third partythird-party acts or failures to act. exclusively through credit and debit card transactions. For credit and debit card payments, we pay interchange and other fees, which may increase over time. An increase in those fees would require us to either increase the prices we charge for our products, which could cause us to lose subscribers and subscription revenue, or sufferabsorb an increase in our operating expenses, either of which could harm our operating results.subscribers'subscribers’ credit cards on a timely basis or at all, or there are issues with financial insolvency of our third-party vendors or other unanticipated problems or events, we could lose subscription revenue, which would harm our operating results.Currently, weWe are implementing the steps that are required for us to become fully compliantcurrently accredited against, and in compliance with, the Payment Card Industry or PCI, Data Security Standard, or PCI DSS, athe payment card industry’s security standard with whichfor companies that collect, store or transmit certain data regarding credit and debit cards, credit and debit card holders and credit and debit card transactions are required to comply.transactions. Currently we comply with PCI DSS version 2.0 as a Level 3 merchant. In our subsequent PCI DSS compliance cycle, we will comply against PCI DSS version 3.0 as a Level 2 merchant. Although Pandora is PCI DSS compliant, there is no guarantee that we will maintain PCI DSS compliance. Our failure to comply fully with PCI DSS mayin the future could violate payment card association operating rules, federal and state laws and regulations and the terms of our contracts with payment processors and merchant banks. Such failure to comply fully also maycould subject us to fines, penalties, damages and civil liability, and maycould result in the loss of our ability to accept credit and debit card payments. Further, there is no guarantee that even if PCI DSS compliance is achieved, we will maintain PCI DSS compliance or that such compliance will prevent illegal or improper use of our payment systems or the theft, loss, or misuse of data pertaining to credit and debit cards, credit and debit card holders and credit and debit card transactions.Our success depends upon the continued acceptance of online advertising as an alternative or supplement to offline advertising. The percentage of the advertising market allocated to online advertising lags the percentage of consumer offline consumption by a significant degree. Growth of our business will depend in large part on the reduction or elimination of this gap between online and offline advertising spending, which may not happen. Many advertisers still have limited experience with online advertising and may continue todevote significant portions of their advertising budgets to traditional, offline advertising media. Accordingly, we continue to compete for advertising dollars with traditional media, including broadcast radio. Although advertisers as a whole are spending an increasing amount of their overall advertising budget on online advertising, we face a number of challenges in growing our advertising revenue. We compete for advertising dollars with significantly larger and more established online marketing and media companies such as Facebook, Google, MSN and Yahoo!. We believe that the continued growth and acceptance of our online advertising products will depend on the perceived effectiveness and the acceptance of online advertising models generally, which is outside of our control. Any lack of growth in the market for online advertising could result in reduced revenue or increased marketing expenses, which would harm our operating results and financial condition.ourall such programmers and we cannot be certain that our programmersthey have not incorporated open source software into our proprietary products and technologies or that they will not do so in the future. In the event that portions of our proprietary technology are determined to be subject to an open source license, we could be required to publicly release the affected portions of our source code, re-engineer all or a portion of our technologies, or otherwise be limited in the licensing of our technologies, each of which could reduce or eliminate the value of our services and technologies and materially and adversely affect our ability to sustain and grow our business.affecteffect on our operating results.are possiblearising from use of such devices while driving.February 2012,April 2013, the National Highway Traffic Safety Administration (the "NHTSA") proposedreleased new voluntary guidelines for visual-manual devices not related to the driving task that are integrated into motor vehicles. NHTSA also intends to propose guidelines applicable to after-market and portable devices that may be used in motor vehicles. Regulatory restrictions onand enforcement actions related to how drivers and passengers in motor vehicles may engage with devices on which our service is broadcast could inhibit our ability to increase listener hours and generate ad revenue, which would harm our operating results. In addition, concerns over driver distraction due to use of mobile and other electronic devices to access our service in motor vehicles could result in product liability or personal injury litigation and negative publicity.applicationsapps and service offerings and expect to continue to do so. The operation of our applicationsapps and service offerings could be impaired if errors occur in the third-party software that we use. It may be more difficult for us to correct any defects in third-party software because the development and maintenance of the to the extent that the economy continues to stagnate, reductions in spending by advertisers could have a serious adverse impact on our business. In addition, we provide an entertainment service, and payment for our Pandora One subscription service may be considered discretionary on the part of some of our current and prospective subscribers or listeners who may choose to use a competing free service or to listen to Pandora without subscribing. To the extent that overall economic conditions reduce spending on discretionary activities, our ability to retain current and obtain new subscribers could be hindered, which could reduce our subscription revenue and negatively impact our business.•
••
••
••
••
••
••
••very substantial costs, divert our management's attention and resources and harm our business, operating results and financial condition.do not publishcease publishing research, publish inaccurate or unfavorable research about our business or make projections that exceed our actual results, our stock price and trading volume could decline.Concentration of ownership among our officers, directors, large stockholders and their affiliates may prevent new investors from influencing corporate decisions. Our officers, directors, greater than 5% stockholders and their affiliates beneficially own or control, directly or indirectly, a majority of our outstanding common stock. As a result, if some of these persons or entities act together, they will have significant influence over the outcome of matters submitted to our stockholders for approval, including the election of directors and approval of significant corporate transactions, such as a merger or other sale of our company or its assets. This concentration of ownership could limit the ability of other stockholders to influence corporate matters and may have the effect of delaying an acquisition or cause the market price of our stock to decline.
••
••
••
••
••
••3%3% of the voting power of all of the then outstanding shares of the voting stock, voting together as a single class, to amend the provisions of our certificate of incorporation relating to the issuance of preferred stock and management of our business or our bylaws, which may inhibit the ability of an acquiror to effect such amendments to facilitate an unsolicited takeover attempt;
••Table of Contents••a 73,674 square-foot facility,an office building with 134,308 square-feet, under a lease expiring on September 30, 2017.2020. We also lease regional offices in Chicago, Illinois; Santa Monica, California; and New York, New York and local sales offices at various locations within those regions. primary data centers are hostedlocated in colocation facilities operated by providers of hosting services, Equinix in San Jose, California and Ashburn, Virginia as well as by Digital Realty Trust in Chicago, Illinois and are designed to be fault tolerant.fault-tolerant and operate at maximum uptime. Backup systems in California and Virginia can be brought online in the event of a failure at the primaryother data center. The backup sitescenters. These redundancies enable additional fault tolerance and will also support our continued growth.56 of Notes to Consolidated Financial Statements in Part II, Item 8 of this Annual Report on Form 10-K is incorporated herein by reference. High Low $ 26.00 $ 12.16 $ 16.70 $ 9.33 $ 15.89 $ 9.15 $ 15.25 $ 7.83 $ 12.30 $ 8.50 $ 12.57 $ 7.38 $ 11.90 $ 7.08 High Low Twelve Months Ended December 31, 2014 First quarter (January 1, 2014 - March 31, 2014) $ 39.43 $ 26.76 Second quarter (April 1, 2014 - June 30, 2014) $ 31.74 $ 22.17 Third quarter (July 1, 2014 - September 30, 2014) $ 29.82 $ 24.16 Fourth quarter (October 1, 2014 - December 31, 2014) $ 24.70 $ 16.90 Eleven Months Ended December 31, 2013 First quarter (February 1, 2013 - April 30, 2013) $ 14.27 $ 11.36 Second quarter (May 1, 2013 - July 31, 2013) $ 20.52 $ 13.94 Third quarter (August 1, 2013 - October 31, 2013) $ 28.17 $ 18.16 Fourth quarter (November 1, 2013 - December 31, 2013) (1) $ 31.56 $ 25.67 (1) The fourth quarter of calendar 2013 (11 months) included two months (November 1, 2013 - December 31, 2013) as a result of the change in our fiscal year-end. JanuaryDecember 31, 2013,2014, the closing price per share of our common stock as reported on the NYSE was $11.52.$17.83. As of March 13, 2013,December 31, 2014, there were approximately 8560 holders of record of our common stock. The number of beneficial stockholders is substantially greater than the number of holders of record because a large portion of our common stock is held through brokerage firms.ususe in the operation and expansion of our business. Any future determination relating to dividend policy will be made at the discretion of our board of directors and will depend on our future earnings, capital requirements, financial condition, future prospects, applicable Delaware law, which provides that dividends are only payable out of surplus or current net profits, and other factors that our board of directors deems relevant. In addition, our credit facility restricts our ability to pay dividends. See "Management's Discussion and Analysis of Financial Condition and Results of Operations—LiquidityOperations-Liquidity and Capital Resources—Our Indebtedness—CreditResources-Our Indebtedness-Credit Facility" and note 7Note 8 to our financial statements included elsewhere in this Annual Report on Form 10-K.(thethe date our common stock commenced trading on the NYSE)NYSE, through JanuaryDecember 31, 20132014 of the total cumulative return of our common stock with the total cumulative return of the New York Stock Exchange Composite Index (the "NYA Composite"), the Global X Social Media Index (the "SOCL") and the SPDR Morgan Stanley Technology MTK Index (the "MTK"). The figures represented below assume an investment of $100 in our common stock at the closing price of $17.42 on June 15, 2011 and in the NYA Composite and MTK on the same date. The SOCL was modeled from the inception of the index on November 15, 2011. Data for the NYA Composite, MTK and SOCL assume reinvestment of dividends. The comparisons in the graph are historical and are not intended to forecast or be indicative of possible future performance of our common stock.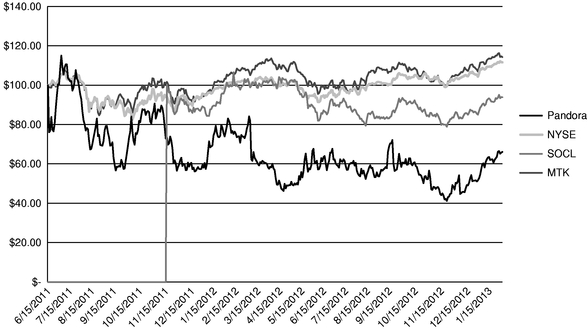
Recent Sales of Unregistered Securities Between February 1, 2011 and July 6, 2011 (the date of the filing of our registration statement on Form S-8, No. 333-175378), we (i) granted to our directors, officers, employees and consultants options to purchase 6,534,825 shares of our common stock with per share exercise prices ranging from $3.14 to $16.00 under our 2004 Stock Plan, as amended and (ii) issued and sold an aggregate of 2,695,771 shares of common stock that were not registered under the Securities Act to our directors, officers, employees and consultants pursuant to the exercise of stock options for cash consideration with aggregate exercise proceeds of approximately $0.6 million. These issuances were undertaken in reliance upon the exemption from registration requirements of Rule 701 of the Securities Act. The recipients of these shares of common stock represented their intentions to acquire the shares for investment only and not with a view to or for sale in connection with any distribution, and appropriate legends were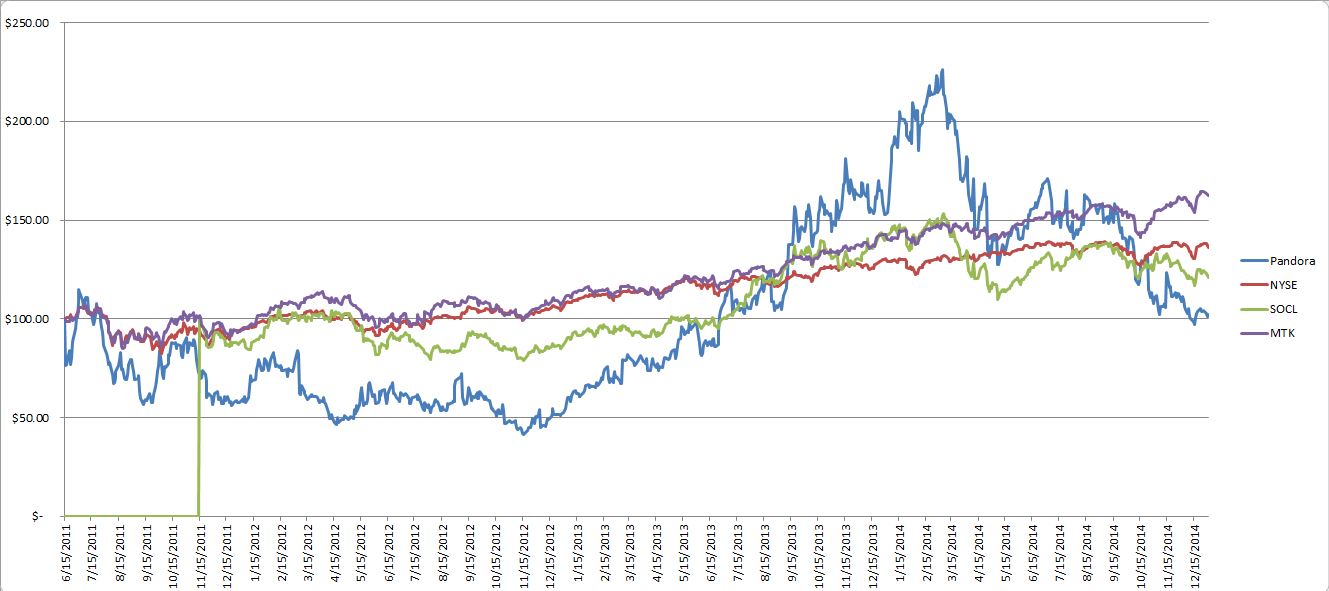
affixed to the share book entry records issued in these transactions. All recipients had adequate access, through their relationships with us, to information about us.Use of Proceeds On June 14, 2011, our registration statement on Form S-1 (No. 333-172215) was declared effective for our IPO, and on June 20, 2011 we consummated the IPO consisting of 14,684,000 shares of our common stock for $16.00 per share, including 6,000,682 shares issued and sold by us. On July 19, 2011, we settled the underwriters' exercise of their IPO over-allotment option for an additional 350,000 shares issued and sold by us for $16.00 per share. The underwriters of the offering were Morgan Stanley & Co. LLC, J.P. Morgan Securities LLC, Citigroup Global Markets, Inc., William Blair & Company, L.L.C., Stifel, Nicolaus & Company, Incorporated and Wells Fargo Securities, LLC. Following the sale of the shares in connection with the closing of the IPO, the offering terminated. As a result of the offering, including the underwriters' over-allotment option, we received total net proceeds of approximately $90.6 million, after deducting total expenses of $11.0 million, consisting of underwriting discounts and commissions of $7.1 million and offering-related expenses of approximately $3.9 million. No payments for such expenses were made directly or indirectly to (i) any of our officers or directors or their associates, (ii) any persons owning 10% or more of any class of our equity securities, or (iii) any of our affiliates other than the payment of certain legal expenses on behalf of our selling stockholders. Approximately $31.0 million of the net proceeds to us from the IPO, including the over-allotment, were used to pay accrued dividends on our preferred stock. The remaining net offering proceeds have been used for working capital.statementsstatement of operations and balance sheet data for the fiscal yearstwelve months ended January 31, 20092011 and 20102012 and the consolidated balance sheet data as of January 31, 2009, 20102011, 2012 and 20112013 were derived from our audited consolidated financial statements not included in this report. The consolidated statements of operations data for the fiscal yearstwelve months ended January 31, 2011, 20122013, for the eleven months ended December 31, 2013 and 2013for the twelve months ended December 31, 2014 and the consolidated balance sheet data as of JanuaryDecember 31, 20122013 and 20132014 were derived from our audited consolidated financial statements included in this report. The consolidated statement of operations data for the eleven months ended December 31, 2012 is unaudited. Our unaudited consolidated financial statements were prepared on a basis consistent with our audited consolidated financial statements and include, in our opinion, all adjustments, consisting of normal recurring adjustments that we consider necessary for a fair presentation of the financial information set forth in those statements included elsewhere in this report.Table of Contents Fiscal Year Ended January 31, 2009 2010 2011 2012 2013 (in thousands, except per share data) $ 18,247 $ 50,147 $ 119,333 $ 239,957 $ 375,218 1,086 5,042 18,431 34,383 51,927 19,333 55,189 137,764 274,340 427,145 15,771 32,946 69,357 148,708 258,748 7,398 7,892 11,559 22,759 32,019 6,116 6,026 6,736 13,425 18,118 13,265 17,426 36,250 65,010 107,715 4,190 6,358 14,183 35,428 48,247 46,740 70,648 138,085 285,330 464,847 (27,407 ) (15,459 ) (321 ) (10,990 ) (37,702 ) (821 ) (1,294 ) (1,309 ) (5,042 ) (441 ) (28,228 ) (16,753 ) (1,630 ) (16,032 ) (38,143 ) — — (134 ) (75 ) (5 ) (28,228 ) (16,753 ) (1,764 ) (16,107 ) (38,148 ) — (1,443 ) — — — (58 ) (218 ) (300 ) (110 ) — (3,751 ) (6,461 ) (8,978 ) (3,648 ) — $ (32,037 ) $ (24,875 ) $ (11,042 ) $ (19,865 ) $ (38,148 ) $ (5.45 ) $ (3.84 ) $ (1.03 ) $ (0.19 ) $ (0.23 ) 5,881 6,482 10,761 105,955 168,294 Twelve months ended
January 31, Eleven months ended
December 31, Twelve months ended
December 31, 2011 2012 2013 2012 2013 2014 (in thousands, except per share data) Total revenue $ 137,764 $ 274,340 $ 427,145 $ 389,484 $ 600,233 $ 920,802 Net loss attributable to common stockholders (11,042 ) (19,865 ) (38,148 ) (24,462 ) (27,017 ) (30,406 ) Net loss per share, basic and diluted (1.03 ) (0.19 ) (0.23 ) (0.15 ) (0.15 ) (0.15 ) Weighted-average common shares outstanding used in computing basic and diluted net loss per share 10,761 105,955 168,294 167,956 180,968 205,273 (2)(1) Fiscal Year Ended
January 31, 2010 2011 2012 2013 1.80 3.83 8.23 14.01 Twelve months ended
January 31, Eleven months ended
December 31, Twelve months ended
December 31, 2011 2012 2013 2012 2013 2014 (in billions) Listener hours 3.83 8.23 14.01 12.56 15.31 20.03 As of January 31, 2010 2011 2012 2013 16 29.3 47.6 65.6 As of January 31, As of December 31, 2011 2012 2013 2013 2014 (in millions) Active users 29.3 47.6 65.6 76.2 81.5 (1) Listener hours and active users are defined in the section entitled "Key Metrics" in Item 7 of this Annual Report on Form 10-K. As of January 31, 2009 2010 2011 2012 2013 (in thousands) $ 9,608 $ 16,164 $ 43,048 $ 44,126 $ 65,725 (3,114 ) 18,929 36,715 89,218 82,644 16,685 40,277 99,209 178,015 218,832 49 300 1,027 — — 62,560 104,806 126,662 — — 726 1 2,309 205,971 238,569 (63,510 ) (87,771 ) (83,010 ) 104,540 98,989 (1)Includes stock-based compensation as follows: Fiscal Year Ended January 31, 2009 2010 2011 2012 2013 (in thousands) $ 14 $ 18 $ 85 $ 582 $ 1,214 54 125 329 1,638 7,462 188 225 549 4,866 12,294 77 109 492 2,101 4,530 $ 333 $ 477 $ 1,455 $ 9,187 $ 25,500 As of January 31, As of December 31, 2011 2012 2013 2013 2014 (in thousands) Balance Sheet Data: Cash and cash equivalents $ 43,048 $ 44,126 $ 65,725 $ 245,755 $ 175,957 Working capital 36,715 89,218 82,644 362,777 439,254 Total assets 99,209 178,015 218,832 673,335 749,290 Long-term liabilities 3,496 2,568 3,873 9,098 16,773 Preferred stock warrant liability 1,027 — — — — Convertible preferred stock 126,662 — — — — Common stock and additional paid-in capital 2,309 205,971 238,569 675,123 781,030 Total stockholders' equity (deficit) (83,010 ) 104,540 98,989 508,231 583,357 (2)Listener hours and active users are defined in the section entitled "Key Metrics" in Item 7Calendar 2014 (12-month) Results Compared With Calendar 2013 (11-month) Calendar 2013 (11-month) Calendar 2014 (12-month) February 2013 - December 2013 January 2014 - December 2014 Calendar 2013 (11-month) Results Compared With Calendar 2012 (11-month recast, unaudited) Calendar 2012 (11-month recast, unaudited) Calendar 2013 (11-month) February 2012 - December 2012 February 2013 - December 2013 listeners.listeners wherever and whenever they want to listen to radio on a wide range of smartphones, tablets, computers and car audio systems, as well as a range of other internet-connected devices. The majority of our listener hours occur on mobile devices, with the majority of our revenue generated from advertising on these devices. We have pioneered a new form of radio—one that uses intrinsic qualities of music to initially create stations and then adapts playlists in real-time based on the individual feedback of each listener. We offer local and national advertisers an opportunity to deliver targeted messages to our listeners using a combination of audio, display and video advertisements.JanuaryDecember 31, 2013,2014, we had approximately 175more than 250 million registered users, which we define as the total number of accounts that have been created for our service at period end. As of JanuaryDecember 31, 2013 approximately 1402014, more than 225 million registered users havehad accessed Pandora through smartphones and tablets. For the fiscal yeartwelve months ended JanuaryDecember 31, 2013,2014, we streamed 14.0120.03 billion hours of internet radio, and as of JanuaryDecember 31, 2013,2014, we had 65.681.5 million active users during the prior 30 day period. According to a December 2012 report by Triton, we have more than a 70% share of internet radio among the top 20 stations and networks in the United States. Since we launched our free, advertising-supported radio service in 2005 our listeners have created over 4.07 billion stations. We derive the substantial majority Our free service is advertising-based and allows listeners access to our music and comedy catalogs and personalized playlist generating system for free across all of our revenue fromdelivery platforms.salePandora service available everywhere that there is internet connectivity. To this end, we make the Pandora service available through a variety of display, audiodistribution channels. In addition to streaming our service to computers, we have developed Pandora mobile device applications (“apps”) for smartphones such as iPhone, Android and videothe Windows Phone and for tablets including the iPad and Android tablets. We distribute those mobile apps free to listeners via app stores. In addition, Pandora is now integrated with more than 1,000 connected devices, including automobiles, automotive aftermarket devices and consumer electronic devices.across our traditional computer-based,on mobile and other connected device platforms and monetizing inventory generated by listeners using these platforms. We also offerThe mobile digital advertising industry is at an early stage of development, with lower overall spending levels than traditional online advertising markets, and faces technical challenges due to fragmented platforms and a paid subscription service to listeners, which we call Pandora One. While historically our revenue growth was principally attributable to selling display advertising through our traditional computer-based platform, we now generatelack of standard audience measurement protocols. As a majoritygreater share of our revenue fromlistener hours is consumed on mobile devices, our ability to monetize increased mobile streaming may not achieve the levels of monetization of streaming we have achieved on computers.devicesdevice platforms sold to local advertisers, placing us in more direct competition with broadcast radio for advertiser spending, especially for audio advertisements. By contrast, historically our display advertisers have been predominantly national brands. To successfully monetize our growing listener hours, a key strategy is to convince a substantial base of local advertisers of the benefits of advertising on the Pandora service including demonstrating the effectiveness and relevance of our advertising includes a mix ofproducts, and in particular, audio display and video. This expansionadvertising products, across the range of our services also presents an opportunity for us to reach our audience anytime, anywhere they enjoy music, and therefore offer additional distribution channels to current and potential advertisers for delivery platforms.operating expenses:••(oror their agents)agents, of each sound recording that we stream and to the copyright owner (orowners, or their agents) ofagents, for the sound recordings that we perform, as well as the musical work that underlies thatworks embodied in each of those sound recording,recordings, subject to certain exclusions. We record these royalties as content acquisition costs. Under U.S. law, we are granted the right to stream any lawfully released sound recordings, subject to compliance with certain statutory and regulatory requirements. Royalties for sound recordings are negotiated with and paid to record labels, rights organizations or to SoundExchange, a performance rights organization ("PRO") authorized to collect royalties on behalf of all sound recording copyright owners.SoundExchange. Royalties for musical works are most often negotiated with and paid to publishing companiesperforming rights organizations (“PROs") such as Sony ATV and Entertainment World Inc. or EMI; or PROs such as the American Society of Composers, Authors and Publishers, or ASCAP; Broadcast Music, Inc., or BMI;ASCAP, BMI and SESAC, Inc. (“SESAC”) or SESAC.directly to publishing companies. Royalties are calculated based on the number of sound recordings streamed, revenue earned or other usage measures. If we cannot agree on royalty rates, the dispute will be resolved by the Copyright Royalty Board, or CRB, in the case of SoundExchange, and by the rate court in the U.S. District Court for the Southern District of New York in the case of ASCAP and BMI. In November 2012, we filed a petition in rate court to request a determination of reasonable fees and terms with ASCAP. In May 2011, we started streamingperforming rights organization.PRO or the copyright owner of such content. However, we pay royalties to SoundExchange at federallyrates negotiated ratesbetween representatives of online music services and SoundExchange for the right to stream this spoken word comedy content.salesrevenue across all of our delivery platforms. Whilehave generated revenue frominstituted a 40 hour per month listening limit for our advertising products at a rate that exceeds the growth in listener hours insupported service on certain fiscal years for traditional computers and for the fiscal year ending January 31, 2013 for mobileand other connected devices, to date we have not been able to grow our total advertising revenue at a rate that exceeds the growth in our listener hours. As our mobile listenership increases, we face new challenges in optimizing our advertising products for delivery on mobile and other connected device platforms and monetizing inventory generateddevices. Listeners who reached this limit could continue to use our ad supported service on these devices by listeners using these platforms. The mobile digital advertising market is at an early stagepaying $0.99 for the remainder of development, with lower overall spending levels than traditional online advertising markets, and faces technical challengesthe month, could listen to our ad supported service on their computers, or could purchase Pandora One annual subscriptions for $36 per year or monthly subscriptions for $4 per month, which were the rates then in effect. Effective September 2013, we eliminated this limit primarily due to fragmented platforms and lackour improved ability to monetize mobile listener hours. Although we have removed the broad 40 hour per month mobile listening limit, we have implemented other more precise measures that we believe will allow us to better manage the growth of standard audience measurement protocols. In addition, our strategy includes increasingmobile content acquisition costs while minimizing adverse effects on the listener experience, such as adjusting the number of ad campaigns for traditional computer, mobile and other connected device platforms sold to local advertisers, placing us in more direct competitiontimes users can skip songs during a given listening session, as well as optimizing time-based thresholds whereby music will stop playing after a certain length of user inactivity with broadcast radio for advertiser spending, especially for audio advertisements. By contrast, historically our display advertisers have been predominantly national brands. To successfully monetize our growing listener hours, we may have to convince a substantial basethe service.marketindustry leadership in internet radio, which we believe will strengthen our brand and help us to convince advertisers to allocate spending towards our ad products. As such, a central focus is adding, retaining and engaging listeners to build market share and grow our listener hours. For the foreseeable future, we expect that there will be periods during which our ability to monetize listener hours will lag the growth of listener hours. As our business matures, we expect that our revenue growth will exceed the growth rate in our listener hours will decline relative to our increased ability to monetize listener hours. However, we expect to incur annual net losses on a U.S. GAAP basis in the near term.Key Metrics: The tables below set forthterm because our current strategy is to leverage improvements in gross profit by investing in broadening distribution channels, developing innovative and scalable advertising products, increasing utilization of advertising inventory and building our sales force. These investments are intended to drive further growth in our business through both increased listener hours for fiscal 2011, 2012 and 2013monetization of those hours, and our active users as a result we are targeting gradual improvements in gross profit over time. Our planned reinvestment of the endresulting incremental gross profit will continue to depress the growth of each of those periods along with our total, traditional computer and mobile and other connected devices ad RPMs for those periods. Fiscal Year Ended
January 31, 2011 2012 2013 3.83 8.23 14.01 As of January 31, 2011 2012 2013 29.3 47.6 65.6 Advertising revenue per thousand listener hours Fiscal year ended January 31, 2011 2012 2013 $ 33.65 $ 32.22 $ 29.13 61.60 62.68 53.73 13.70 21.05 22.53 Listener Hours.We track listener hours because it is a key indicator of the growth of our business. We also track the number of active users as an additional indicator of the breadth of audience we are reaching at a given time, which is particularly important to potential advertisers.We believe this server-based approach is the best methodology to forecast advertising inventory given that advertisements are frequently served in between tracks and are often served upon triggers such as a listener clicking thumbs-down or choosing to skip a track. To the extent that third-party measurements of listener hours are not calculated using a similar server-based approach, the third-party measurements may differ from our measurements. Twelve months ended
January 31, Eleven months ended
December 31, Twelve months ended
December 31, 2013 2012 2013 2014 (in billions) Listener hours 14.01 12.56 15.31 20.03 Users.ActiveUsers Ad RPMs.December 31, 2013 We track advertisingand 2014. As of December 31, 2013 2014 (in millions) Active users 76.2 81.5 As of December 31, 2013 2014 User type Users (in millions) Ad-based active users 73.4 78.5 Subscribers* 3.3 3.6 Total 76.7 82.1 * Includes subscribers that have not used our service within the trailing 30 days to the end of the final calendar month of the period. Twelve months ended
January 31, Eleven months ended
December 31, Twelve months ended December 31, 2013 2012 2013 2014 User type Listener hours (in billions) Ad-based active users 12.88 11.55 13.34 17.58 Subscribers 1.13 1.01 1.97 2.45 Total 14.01 12.56 15.31 20.03 advertising supportedadvertising-supported service ("ad RPMs") because it is a key indicator of our ability to monetize advertising inventory created by our listener hours. We focus on total ad RPMs across all of our delivery platforms. RPMs compare advertising revenue generated in a given period to advertising supported listener hours in the period and weWe believe such total ad RPMs to be the central top-line indicator for evaluating the results of our monetization efforts. We calculate total adAd RPMs are calculated by dividing advertising revenue we generate by the number of thousands of listener hours of our advertising-based service.total and ad RPMs, subscription RPMs, total RPMs and related LPMs for our traditional computer platform as well as our mobile and other connected devices platforms, which we calculate by dividing the estimated advertising revenue and costs generated through the respective platforms by the number of thousands of listener hours of our advertising-based serviceservices delivered through such platforms. While we believe that such disaggregated RPMs providedata provides directional insight for evaluating our efforts to monetize our service, by platform, we do not validate such disaggregated RPMsdata to the level of financial statement reporting. Such metricsdata should be seen as indicative only and as management's best estimate. We continue to refine our systems and methodologies used to categorize RPMs across our delivery platforms. Total ad RPMs. 2011 Compared to 2012The table below sets forth our RPMs and 2012 Compared to 2013. Total ad RPMs decreased compared to the respective prior year periods due to the continuing shift in the platform mix between traditionalLPMs, including total, computer and mobile and other connected devices, as well ason an advertising (“ad”), subscription and total basis for the twelve months endedJanuary 31, 2013, the eleven months ended December 31, 2012 and 2013 and the twelve months endedDecember 31, 2014. Twelve months ended
January 31, Eleven months ended
December 31, Twelve months ended December 31, 2013 2012 2013 2014 RPM LPM* RPM LPM* RPM LPM* RPM LPM* Advertising Computer $ 53.73 $ 18.11 $ 54.51 $ 17.98 $ 56.79 $ 18.94 $ 62.00 $ 20.76 Mobile and other connected devices 22.53 17.35 22.80 17.17 31.97 18.63 37.84 20.23 Total advertising $ 29.13 $ 17.51 $ 29.60 $ 17.35 $ 36.70 $ 18.69 $ 41.66 $ 20.31 Subscription Computer $ 45.52 $ 29.74 $ 45.39 $ 29.49 $ 52.38 $ 31.83 $ 60.56 $ 33.37 Mobile and other connected devices 46.52 29.03 45.77 28.72 57.77 33.87 82.25 37.41 Total subscription $ 46.03 $ 29.37 $ 45.59 $ 29.10 $ 56.27 $ 33.30 $ 76.89 $ 36.41 Total Total computer $ 52.36 $ 20.05 $ 52.98 $ 19.90 $ 56.01 $ 21.23 $ 61.74 $ 23.02 Total mobile and other connected devices 23.83 17.98 24.03 17.79 34.98 20.41 42.77 22.14 Total $ 30.49 $ 18.47 $ 30.88 $ 18.30 $ 39.22 $ 20.57 $ 45.97 $ 22.28 * Under the Pureplay Settlement, we pay per-performance rates for the streaming of sound recordings for our Pandora One subscription service that are higher than the per-performance rates for our free, advertising-supported service. which wasas a result of an increase in the average price per ad sold on that platform, due in part to our increase in relative volume of local ad sales.result of the effective elimination of the 40 hour per month free listening cap on traditional computers in September 2011 which created increased advertising inventory not fully offset by advertising sales. Traditional computer ad RPMs. 2011 Comparedeleven months ended December 31, 2013 compared to 2012, Traditional computer total ad RPMs increased compared to the respective prior year period as advertising sales growth outpaced the growth in advertising-supported listener hours primarily due to revenue growing at a faster pace than listener hours duean increase in the number of ads delivered, as well as an increase in the average price per ad. In addition, total ad RPMs benefited from measures we implemented in 2013 to better manage the growth of mobile content acquisition costs while minimizing adverse effects on the sales force as well aslistener experience.maturation of the underlying market. Traditional computer ad RPMs. 2012 Compared to 2013. Traditional computer ad RPMs decreasedtwelve months ended December 31, 2014 compared to the respective prior year period, primarily due toeleven months ended December 31, 2013, total subscription RPMs increased as the growth in subscription and other revenue outpaced the growth in subscription listener hours growing at a faster pace than revenue due in part toon both the effective elimination ofcomputer and the 40 hour per month free listening cap which created increased listener hours not fully offset by increased advertising sales and to our sales force's increased focus on improving mobile advertising sales. Mobile and other connected device ad RPMs. 2011 Compared to 2012 and 2012 Compared to 2013. Mobile and other connected device ad RPMs increased compared to the respective prior year periods primarily due to mobile and connected device revenue growing at a faster pace than listening hours. Faster relative growth in revenue was driven by our continued focus on monetizing our mobile inventory including the introduction of new advertising products, particularly audio advertising, for these devices. The increase in RPMs for the fiscal year ended January 31, 2013 was partially offset by the effect of direct advertising sales to one customer which accounted for 9% of revenue in the fiscal year ended January 31, 2012. Specific to the revenue component of the RPM ratio, total advertising revenue increased by approximately 101% during the fiscal year ended January 31, 2012 compared to the prior year period, with advertising revenue on mobile and other connected devices increasing approximately 305% and advertisingplatforms, primarily due to an increase in the average price per subscriber as a result of the increase in the Pandora One pricing structure. In addition, the changes in subscription RPMs for the twelve months ended December 31, 2014 reflect a $14.2 million increase in subscription revenue on traditional computers increasing by approximately 38%. Total advertisingin connection with the one-time recognition of the accumulation of deferred revenue increased by approximately 56% duringrelated to certain subscriptions purchased through mobile app stores. Refer to “Deferred Revenue” below for further details regarding these mobile subscriptions.fiscal yeareleven months ended JanuaryDecember 31, 2013 compared to 2012, total subscription RPMs increased as the prior year period, with advertisinggrowth in subscription and other revenue outpaced the growth in subscription listener hours on both the computer and the mobile and other connected devices increasing by approximately 99% and advertising revenue on traditional computers increasing by approximately 17% respectively. In addition toplatforms.RPMs, we also track total RPMs, which measure total revenue, including both advertising and subscription services and other revenue,LPMstotal listener hours. We calculate total RPMs by dividing the estimated total revenue generated througheleven months ended December 31, 2013 increased primarily due to scheduled rate increases for sound recording royalties paid to SoundExchange.respective platforms byeleven months ended December 31, 2013 compared to 2012 increased primarily due to scheduled rate increases for sound recording royalties paid to SoundExchange.total number of thousands of listener hours delivered through such platforms. While we believe that such disaggregated total RPMs provide directional insight for evaluating our efforts to monetize our service by platform, we do not validate disaggregated total RPMstwelve months ended December 31, 2014 compared to the leveleleven months ended December 31, 2013 increased primarily due to scheduled rate increases for sound recording royalties paid to SoundExchange.as management's best estimate. Total RPMsResults of Operationsfiscal years ended January 31, 2011, 2012 and 2013 were to $34.95, $33.32 and $30.49, respectively. Within this, mobile and other connected deviceperiods indicated as a percentage of total RPMsrevenue. The period-to-period comparisons of results are not necessarily indicative of results for the fiscal years ended January 31, 2011, 2012 and 2013, were $14.65, $21.93 and $23.83 respectively. Traditional computer RPMs for the fiscal years ended January 31, 2011, 2012 and 2013, were $58.93, $58.84 and $52.36, respectively. These changes were driven by the same factors mentioned above within the discussionfuture periods. Twelve months ended
January 31, Eleven months ended
December 31, Twelve months ended
December 31, 2013 2012 2013 2014 Revenue Advertising 88 % 88 % 82 % 80 % Subscription and other 12 12 18 20 Total revenue 100 100 100 100 Cost of revenue Cost of revenue—Content acquisition costs 61 59 52 48 Cost of revenue—Other(1) 8 7 7 7 Total cost of revenue 68 67 59 55 Gross profit 32 33 41 45 Operating expenses Product development(1) 4 4 5 6 Sales and marketing(1) 25 24 28 30 General and administrative(1) 11 11 12 12 Total operating expenses 41 39 45 48 Loss from operations (9 ) (6 ) (4 ) (3 ) Other income (expense), net — — — — Loss before provision for income taxes (9 ) (6 ) (4 ) (3 ) Provision for income taxes — — — — Net loss (9 )% (6 )% (5 )% (3 )% (1) Includes stock-based compensation as follows: 0.3 % 0.3 % 0.3 % 0.5 % Product development 1.1 1.1 1.5 1.9 Sales and marketing 2.9 2.9 3.4 4.6 General and administrative 1.7 1.8 1.5 2.5 Note: Amounts may not recalculate due to rounding Eleven months ended
December 31, Eleven months ended
December 31, Twelve months ended
December 31, 2012 2013 $ Change 2013 2014 $ Change (in thousands) (in thousands) Revenue Advertising $ 343,318 $ 489,340 $ 146,022 $ 489,340 $ 732,338 $ 242,998 Subscription and other 46,166 110,893 64,727 110,893 188,464 77,571 Total revenue $ 389,484 $ 600,233 $ 210,749 $ 600,233 $ 920,802 $ 320,569 Basis of PresentationRevenue Advertising Revenue.We generate advertising revenue primarily from audio, display audio and video advertising, which is typically sold on a cost-per-thousand impressions, or CPM, basis. Advertising campaigns typically range from 1one to 12twelve months, and advertisers generally pay us based on a minimumthe number of delivered impressions or the satisfaction of other criteria, such as click-throughs. We may earn referral revenue when, for example, a listener clicks on an advertisement and signs up for membership with an advertiser. We also have arrangements with advertising agencies and brokers pursuant tounder which we provide the ability tothese agencies sell advertising inventory on our service directly to advertisers. We report revenue under these arrangements net of amounts due to agenciesagencies. For the twelve months endedJanuary 31, 2013, the eleven months ended December 31, 2012 and brokers. In fiscal 2011, 2012 and 2013,the twelve months endedDecember 31, 2014, advertising revenue accounted for 87%88%, 87%88%, 82% and 88%80%, of our total revenue, respectively, and werespectively. We expect that advertising will comprise a substantial majority of revenue for the foreseeable future. Our abilityattract advertisers, and ultimately generatethe eleven months ended December 31, 2013, advertising revenue is criticalincreased $243.0 million or 50%, primarily due to an approximate 25% increase in the average price per ad sold, due in part to our financial success. We believe that we provide a uniqueincrease in relative volume of local ad sales and commercially attractive advertising opportunity for our advertisers, includingfocus on monetizing mobile inventory, and an approximate 15% increase in the ability to run multi-platform ad campaigns and to present ads while our listeners actively engage with our service. Although advertisers as a whole are spending an increasing amount of their advertising budget on online advertising, we face a number of challenges. Specifically, we compete forads sold, primarily due to an increase in advertising dollars with significantly larger and more established online marketing and media companies, such as Facebook, Google, MSN and Yahoo!.listener hours. In addition, the remaining increase in advertising revenue was due to the twelve months ended December 31, 2014 having one additional month as compared to the eleven months ended December 31, 2013.audiosales force year-over-year to sell such advertising products target advertisers that traditionally advertise on broadcast radioinventory and are less familiar with internet radio advertising media.Services and Other Revenue.other revenue We generate subscriptionSubscription and other revenue is generated primarily through the sale and activation of access toPandora One, a premium version of the Pandora service, for annual or monthly subscription fees of $36 per year or approximately $4 per month, respectively, which currently includes an ad free environmentadvertisement-free access and higher audio quality on the devices that support it, higher quality audio. We receive the full amount of the subscription payment at the time of sale.it. Subscription revenue derived from direct sales to listeners is recognized on a straight-line basis over the duration of the subscription period. Subscription revenue derived from sales through some mobile operating systems may be subject to refund or cancellation terms which may affectFor the timing or amount oftwelve months endedJanuary 31, 2013, the subscription revenue recognition. When refund rights exist, we recognize revenue when services have been providedeleven months ended December 31, 2012 and 2013 and the rights lapse or when we have developed sufficient transaction history to estimate a reserve. As of Januarytwelve months endedDecember 31, 2013, we deferred revenue of approximately $5.1 million related to refund rights.2014 Until September 2011, for listeners who are not subscribers, we limited usage of our advertising-supported service on desktop and laptop computers to 40 hours per month. Listeners who reached this limit could continue to use this service by paying $0.99 for the remainder of the month. We included this revenue in, subscription services and other revenue. In September 2011, we effectively eliminated the 40 hour per month listening cap on desktop and laptop computers by increasing the cap to 320 hours of listening per month, which almost none of our listeners exceed. In fiscal 2013, subscription services and other revenue accounted for 12%, 12%, 18% and 20% of our total revenue. Deferred Revenue.For the twelve months endedDecember 31, 2014 compared to the eleven months ended December 31, 2013, subscription revenue increased $77.6 million or 70%, primarily due to an approximate 25% increase in the average price per subscription as a result of the change in the Pandora One pricing structure and due to an approximate 10% increase in the number of subscribers. The increase in subscription revenue for the twelve months ended December 31, 2014 was also due to a $14.2 million increase in subscription revenue in connection with the one-time recognition of the accumulation of deferred revenue related to certain subscriptions purchased through mobile app stores. Refer to “Deferred Revenue” below for further details regarding these mobile subscriptions. In addition, the remaining increase in subscription revenue was due to the twelve months ended December 31, 2014 having one additional month as compared to the eleven months ended December 31, 2013. Costscost of revenue, product development, sales and marketing and sales, general and administrative and content acquisition costs. ContentCost of revenue—content acquisition costs are the most significant component of our costs and expenses, followed by employee-related costs, which includesinclude stock-based compensation expenses. We expect to continue to hire additional employees in order to support our anticipated growth and our product development initiatives. In any particular period, the timing of additional hires could materially affect our cost of revenue and operating expenses, both in absolute dollars and as a percentage of revenue. We anticipate that our costs and expenses will increase in the future.Revenue—revenue—Content Acquisition Costs.acquisition costs Eleven months ended
December 31, Eleven months ended
December 31, Twelve months ended
December 31, 2012 2013 $ Change 2013 2014 $ Change (in thousands) (in thousands) $ 230,731 $ 314,866 $ 84,135 $ 314,866 $ 446,377 $ 131,511 Twelve months ended
January 31, Eleven months ended
December 31, Twelve months ended
December 31, 2013 2012 2013 2014 Computer 35 % 34 % 34 % 34 % Mobile and other connected devices 76 % 75 % 58 % 53 % master royalty agreements andagreements. The majority of our royalties are payable based on both percentage of revenue and listening metrics. For example in fiscal 2012 and 2013, under some royalty arrangementswe paid a fee per track,public performance of a sound recording, while in other cases we paidour royalties are payable based on a percentage of our revenue. In still other cases we pay royalties based onrevenue or a formula that involves a combination of theseper performance and revenue metrics. In fiscal 2010 and 2011 we also paid royalties on a fee per session basis. We periodically test our royalty calculation methods to ensure we are accurately reporting and paying royalties. The performance rights organizations have the right to audit our playlist and payment records, and any such audit could result in disputes over whether we have paid the proper royalties. If such a dispute were to occur, we could be required to pay additional royalties and the amounts involved could be material. In July 2009 we, together with other webcasters, negotiated new royalty rates on performances with SoundExchange for calendar years 2006 to 2015. The agreement reduced rates originally established by the Copyright Royalty Board for calendar years 2006 to 2010 and established new rates for calendar years 2011 to 2015. Cost of Revenue—Other. Cost of revenue consists of hosting costs, infrastructure and the employee and employee-related costs associated with supporting those functions. Hosting costs consist of content streaming, maintaining our internet radio service and creating and serving advertisements through third-party ad servers. Infrastructure costs consist of equipment, software, facilities and depreciation. We make payments to third-party ad servers for the period the advertising impressions or click-through actions are delivered or occur, and accordingly, we record this as a cost of revenue in the related period. Product Development. Product development expenses consist of employee compensation, information technology, consulting, facilities-related expenses and costs associated with supporting consumer connected-device manufacturers in implementing our service in their products. We incur product development expenses primarily for improvements to our website and the Pandora app, development of new advertising products and development and enhancement of our personalized station(s) generating system. We have generally expensed product development as incurred. Certain website development and internal use software development costs may be capitalized when specific criteria are met. In such cases, the capitalized amounts are amortized over the useful life of the related application once the application is placed in service. We intend to continue making significant investments in developing new products and enhancing the functionality of our existing products. Marketing and Sales. Marketing and sales expenses consist of employee and employee-related costs including salaries, commissions and benefits related to employees in sales, marketing and advertising departments. In addition, marketing and sales expenses include external sales and marketing expenses such as third-party marketing, branding, advertising, and public relations expenses, transactional subscription processing fees on mobile platforms, and infrastructure costs such as facility and other supporting overhead costs. We expect marketing and sales expenses to increase as we hire additional personnel to build out our sales force and ad operations team and expand our business development team to establish relationships with manufacturers of an increasing number of connected devices. General and Administrative. General and administrative expenses include employee and employee-related costs consisting of salaries and benefits for finance, accounting, legal, internal information technology and other administrative personnel. In addition, general and administrative expenses include professional services costs for outside legal and accounting services, and infrastructure costs for facility, supporting overhead costs and merchant and other transaction costs, such as credit card fees. Weexpect to incur significant additional expenses in future periods as we continue to invest in corporate infrastructure, including adding personnel and systems to our finance and administrative functions. Provision for Income Taxes. We have historically been subject to income taxes only in the United States. As we expand our operations outside the United States, we have become subject to taxation based on the foreign statutory rates and our effective tax rate could fluctuate accordingly. Income taxes are computed using the asset and liability method, under which deferred tax assets and liabilities are determined based on the difference between the financial statement and tax bases of assets and liabilities using enacted statutory income tax rates in effect for the year in which the differences are expected to affect taxable income. Valuation allowances are established when necessary to reduce net deferred tax assets to the amount expected to be realized.Results of Operations The following tables present our results of operations for the periods indicated and as a percentage of total revenue. The period-to-period comparisons of results are not necessarily indicative of results for future periods. Fiscal Year Ended January 31, 2011 2012 2013 (in thousands) $ 119,333 $ 239,957 $ 375,218 18,431 34,383 51,927 137,764 274,340 427,145 69,357 148,708 258,748 11,559 22,759 32,019 6,736 13,425 18,118 36,250 65,010 107,715 14,183 35,428 48,247 138,085 285,330 464,847 (321 ) (10,990 ) (37,702 ) 31 59 95 (612 ) (616 ) (535 ) (728 ) (4,485 ) (1 ) (1,630 ) (16,032 ) (38.143 ) 134 75 5 (1,764 ) (16,107 ) (38,148 ) (300 ) (110 ) — (8,978 ) (3,648 ) — $ (11,042 ) $ (19,865 ) $ (38,148 ) $ (1.03 ) $ (0.19 ) $ (0.23 ) 10,761 105,955 168,294 (1)Includes stock-based compensation as follows: $ 85 $ 582 $ 1,214 329 1,638 7,462 549 4,866 12,294 492 2,101 4,530 $ 1,455 $ 9,187 $ 25,500 Fiscal Year Ended
January 31, 2011 2012 2013 87 % 87 % 88 % 13 13 12 100 100 100 50 54 61 8 8 7 5 �� 5 4 26 24 25 10 13 11 100 104 108 — (4 ) (8 ) — — — — — — (1 ) (2 ) — (1 ) (6 ) (8 ) — — — (1 )% (6 )% (8 )% (1)Includes stock-based compensation as follows: 0.1 % 0.2 % 0.3 % 0.2 0.6 1.7 0.4 1.8 2.9 0.4 0.8 1.1 Comparison of Fiscal 2011, 2012 and 2013Revenue Fiscal Year Ended January 31, FY 2011 to
FY 2012
$ Change FY 2012 to
FY 2013
$ Change 2011 2012 2013 (in thousands) $ 119,333 $ 239,957 $ 375,218 $ 120,624 $ 135,261 18,431 34,383 51,927 15,952 17,544 $ 137,764 $ 274,340 $ 427,145 $ 136,576 $ 152,805 Fiscal year ended January 31, 2011 2012 2013 $ 33.65 $ 32.22 $ 29.13 2012 Compared to 2013. Advertising revenue increased $135.3 million or approximately 56% primarily due to an approximate 101% increase in the number of ads delivered, partially offset by a decrease in the average price per ad of approximately 22% due to fluctuations in the sales distribution mix amongst direct sales, third-party network sales, and other channels and the platform mix betweentraditional computer and mobile and other connected devices. The increase in the number of ads delivered was primarily due to an increase in total listener hours of approximately 70% which increased the volume of advertising inventory, as well as an increase in our sales force by approximately 55% year-over-year to sell such advertising inventory. Subscription revenue increased $17.5 million due to an increase in the number of subscribers. 2011 Compared to 2012. Advertising revenue increased $120.6 million or approximately 101% in primarily due to an approximate 107% increase in the number of ads delivered, partially offset by a decrease in the average price per ad of approximately 3% due to fluctuations in the sales distribution mix amongst direct sales, third-party network sales, and other channels and the platform mix between traditional computer and mobile and other connected devices. The increase in the number of ads delivered was primarily due to an increase in total listener hours of approximately 115% which increased the volume of advertising inventory, as well as an increase in our sales force by approximately 53% year-over-year to sell such advertising inventory. Subscription revenue increased $16.0 million due to an increase in the number of subscribers. Total ad RPMs 2012 Compared to 2013. Total ad RPMs decreased compared to the respective prior year period due to the continuing shift in the platform mix between traditional computer and mobile and other connected devices as well as an increase in listener hours, in part the result of the effective elimination of the 40 hour per month free listening cap on traditional computers in September 2011 which created increased advertising inventory not fully offset by advertising sales. Total ad RPMs 2011 Compared to 2012. Total ad RPMs decreased compared to the respective prior year period due to the continuing shift in the platform mix between traditional computer and mobile and other connected devices as well as an increase in listener hours, in part the result of the effective elimination of the 40 hour per month free listening cap on traditional computers in September 2011 which created increased advertising inventory not fully offset by advertising sales.Cost and ExpensesCost of Revenue—Content Acquisition Costs Fiscal Year Ended January 31, FY 2011 to
FY 2012
$ Change FY 2012 to
FY 2013
$ Change 2011 2012 2013 (in thousands) $ 69,357 $ 148,708 $ 258,748 $ 79,351 $ 110,040 The following table presents our estimated content acquisition costs for our advertising-based service attributable to our traditional computer platform and our mobile and other connected device platforms as percentages of the estimated advertising revenue attributable to such platforms. Fiscal year ended
January 31, 2011 2012 2013 27 % 29 % 35 % 109 % 78 % 76 % The majority of our royalties are payable based on a fee per track, while in other cases our royalties are payable based on a percentage of our revenue or a combination of per track and revenue metrics. We estimate our advertising-based content acquisition costs attributable to specific platforms by allocating costs from royalties payable based on a fee per track to the platform for which the track is served and by allocating costs from royalties based on a percentage of our revenue in accordance with the overall percentage of our revenue estimated to be attributable to such platforms. While we believe 2012For the twelve months endedDecember 31, 2014 compared to 2013. Contentthe eleven months ended December 31, 2013, content acquisition costs increased $110.0$131.5 million or 42%, primarily due to increased royalty payments driven by increasedan approximate 20% increase in listener hours and higherscheduled royalty ratesrate increases of 8%. In addition, the remaining increase in content acquisition costs was due to scheduled rate increases and higher revenue.the twelve months ended December 31, 2014 having one additional month as compared to the eleven months ended December 31, 2013. Content acquisition costs as a percentage of total revenue increaseddecreased from 54%52% to 61%48%, primarily due to an increase in advertising revenue and a $14.2 million increase in subscription revenue in connection with the growthone-time recognition of the accumulation of deferred revenue related to certain subscriptions purchased through mobile app stores. Refer to “Deferred Revenue” above for further details regarding these mobile subscriptions. Estimated content acquisition costs as a percentage of the advertising revenue attributable to our computer platform were 34% in listener hoursboth the eleven months ended December 31, 2013 and the twelve months ended December 31, 2014, primarily due to an increase in advertising revenue on mobile devices for which we have not been able tothe computer platform as effectively generate revenue as compared to listener hours on traditional computers, and toa result of an increase in the average price per ad sold, offset by scheduled rate increases. Estimated content acquisition costs as a percentage of the advertising revenue attributable to our traditional computermobile and other connected devices platform increaseddecreased from 29%58% to 35%53%, primarily due to an increase in advertising revenue on the effective eliminationmobile and other connected devices platform as a result of an increase in the average price per ad sold and an increase in the number of ads sold. The decrease in estimated content acquisition costs as a percentage of the 40 hour per month freeadvertising revenue attributable to our mobile and other connected devices platform was also due to the effect of measures we have adopted to manage the growth of mobile content acquisition costs while minimizing adverse effects on the listener experience, such as adjusting the number of times users can skip songs during a given listening cap on traditional computers, which createdsession, as well as optimizing time-based thresholds whereby music will stop playing after a certain length of user inactivity with the service, partially offset by scheduled rate increases.not fullyhigher royalty rates due to scheduled rate increases and increased revenue. Content acquisition costs as a percentage of total revenue decreased from 59% to 52%, primarily due to an increase in advertising sales and the effect of measures we have adopted to manage the growth of mobile content acquisition costs while minimizing adverse effects on the listener experience, partially offset by increased advertising sales as well as thescheduled rate increases. Estimated content acquisition costs as a percentage of the advertising revenue attributable to our computer platform were 34% in both the eleven months ended December 31, 2012 and 2013, primarily due to increases in advertising sales on that platform that were offset by scheduled rate increases. Estimated content acquisition costs as a percentage of the advertising revenue attributable to our mobile and other connected devices platforms decreased from 78%75% to 76%58%, primarily due to the an increase in advertising sales on those platforms.platforms and the effect of measures we have adopted to manage the growth of mobile content acquisition costs while minimizing adverse effects on the listener experience, partially offset by scheduled rate increases. Eleven months ended
December 31, Eleven months ended
December 31, Twelve months ended
December 31, 2012 2013 $ Change 2013 2014 $ Change (in thousands) (in thousands) Cost of revenue—Other $ 28,988 $ 42,217 $ 13,229 $ 42,217 $ 61,627 $ 19,410 2011twelve months endedDecember 31, 2014 compared to 2012. Content acquisition coststhe eleven months ended December 31, 2013, cost of revenue—other increased $79.4$19.4 million due to increased royalty payments driven by increased listener hours and higher royalty rates due to scheduled rate increases and higher revenue. Content acquisition costs as a percentage of total revenue increased from 50% to 54%or 46%, primarily due to the growtha $5.6 million increase in employee-related costs and a $1.7 million increase in facilities and equipment expenses, both of which were driven by an approximate 20% increase in headcount, a $4.2 million increase in ad serving and hosting costs driven by an increase in listener hours on mobile devices for which we have not been ableand a $2.3 million increase in other costs of ad sales related to events sold as effectively generate revenuepart of advertising arrangements. In addition, the remaining increase in cost of revenue—other was due to the twelve months ended December 31, 2014 having one additional month as compared to listener hours on traditional computers. Estimated content acquisition costs as a percentagethe eleven months ended December 31, 2013.the revenue attributable to our traditional computer platformrevenue—other increased from 27% to 29%, primarily due to the effective elimination of the 40 hour per month free listening cap on traditional computers, which created increased listener hours not fully offset by increased advertising sales. Estimated content acquisition costs as a percentage of the revenue attributable to our mobile and other connected devices platforms decreased from 109% to 78%$13.2 million or 46%, primarily due to an improvement$8.5 million increase in our abilityad serving costs and hosting costs driven by an increase in advertising revenue and listener hours, a $2.8 million increase in employee-related costs and a $2.2 million increase in facilities and equipment expenses, both of which were driven by an increase in headcount. Eleven months ended
December 31, Eleven months ended
December 31, Twelve months ended
December 31, 2012 2013 $ Change 2013 2014 $ Change (in thousands) (in thousands) Gross profit Total revenue $ 389,484 $ 600,233 $ 210,749 $ 600,233 $ 920,802 $ 320,569 Total cost of revenue 259,719 357,083 97,364 357,083 508,004 150,921 Gross profit $ 129,765 $ 243,150 $ 113,385 $ 243,150 $ 412,798 $ 169,648 Gross margin 33 % 41 % 41 % 45 % monetizethe eleven months ended December 31, 2013, gross profit increased by $169.6 million or 70%, primarily due to an increase in advertising revenue as a result of an increase in the average price per ad sold and an increase in the number of ads sold. In addition, the remaining increase in gross profit was due to the twelve months ended December 31, 2014 having one additional month as compared to the eleven months ended December 31, 2013. Gross margin increased from 41% to 45% as the growth in revenue outpaced the growth in content acquisition costs primarily due to an increase in advertising revenue and the effect of measures we have adopted to manage the growth of mobile content acquisition costs while minimizing adverse effects on the listener experience, such as adjusting the number of times users can skip songs during a given listening session, as well as optimizing time-based thresholds whereby music will stop playing after a certain length of user inactivity with the service. The increase in gross margin was also due to an increase in subscription and other connected device inventoryrevenue driven by a $14.2 million increase in partconnection with the one-time recognition of the accumulation of deferred revenue related to certain subscriptions purchased through mobile app stores. Refer to “Deferred Revenue” above for further details regarding these mobile subscriptions.introductionnumber of ads delivered. Gross margin increased from 33% to 41% as the growth in advertising revenue outpaced the growth in content acquisition costs primarily due to an increase in the number of ads delivered and the effect of the measures we adopted to manage the growth of mobile content acquisition costs. Eleven months ended
December 31, Eleven months ended
December 31, Twelve months ended
December 31, 2012 2013 $ Change 2013 2014 $ Change (in thousands) (in thousands) Product development $ 16,901 $ 31,294 $ 14,393 $ 31,294 $ 53,153 $ 21,859 for these devicesand development and enhancement of our personalized station generating system. We have generally expensed product development as well asincurred. Certain website development and internal use software development costs are capitalized when specific criteria are met. In such cases, the effectcapitalized amounts are amortized over the useful life of direct advertising salesthe related application once the application is placed in service. We intend to one customer which accounted for 9%continue making significant investments in developing new products and enhancing the functionality of revenue inour existing products.fiscal yeartwelve months ended JanuaryDecember 31, 2012. Cost of Revenue—Other Fiscal Year Ended January 31, FY 2011 to
FY 2012
$ Change FY 2012 to
FY 2013
$ Change 2011 2012 2013 (in thousands) $ 11,559 $ 22,759 $ 32,019 $ 11,200 $ 9,260 2012 Compared2014 compared to 2013. Cost of revenuethe eleven months ended December 31, 2013, product development expenses increased $9.3$21.9 million or 70%, primarily due to a $5.3 million increase in hosting services costs as a result of a 70% increase in listener hours, a $2.0$17.0 million increase in employee-related costs and a $1.1 million increase in facilities and equipment expenses, both of which were driven by a 24%an approximate 35% increase in headcount and $1.8headcount. In addition, the remaining increase in product development expenses was due to the twelve months ended December 31, 2014 having one additional month as compared to the eleven months ended December 31, 2013.in higher infrastructure costs. 2011 Compared to 2012. Cost of revenue increased $11.2 millionor 85%, primarily due to a $5.8 million increase in hosting services costs as a result of a 109% increase in listener hours, a $2.7$13.2 million increase in employee-related costs and a $1.3 million increase in facilities and equipment expenses, both of which were driven by a 78% increase in headcount and $2.4 million in higher infrastructure costs.Product Development Fiscal Year Ended January 31, FY 2011 to
FY 2012
$ Change FY 2012 to
FY 2013
$ Change 2011 2012 2013 (in thousands) $ 6,736 $ 13,425 $ 18,118 $ 6,689 $ 4,693 2012 Compared to 2013. Product development expenses increased $4.7 million primarily due to $5.0 million higher employee-related expenses driven by a 24% increase in headcount, partially offset by lower professional fees. 2011 Compared to 2012. Product development expenses increased $6.7 million primarily due to $6.0 million higher employee-related expenses driven by a 46% increase in headcount.Marketing and Sales Fiscal Year Ended January 31, FY 2011 to
FY 2012
$ Change FY 2012 to
FY 2013
$ Change 2011 2012 2013 (in thousands) $ 36,250 $ 65,010 $ 107,715 $ 28,760 $ 42,705 2012 Compared to 2013. Marketing and sales expenses increased $42.7 million primarily due to $33.2 million higher employee-related costs, driven by a 43% increase in headcount, an increase in headcount. Eleven months ended
December 31, Eleven months ended
December 31, Twelve months ended
December 31, 2012 2013 $ Change 2013 2014 $ Change (in thousands) (in thousands) Sales and marketing $ 94,212 $ 169,005 $ 74,793 $ 169,005 $ 277,330 $ 108,325 of $5.6 million primarily related to a $4.8 million increase in transactionalinclude transaction processing commissions on subscription processing fees onpurchases through mobile platforms and marketing research and event costs and $3.0 million in higher infrastructure costs related to facilities and equipment. 2011 Compared to 2012. Marketing and sales expenses increased $28.8 million primarily due to $22.5 million higher employee-related costs, driven by a 95% increase in headcount, an increase inapp stores, external sales and marketing expenses of $3.9 million related to search enginesuch as brand marketing marketing research and eventcustomer acquisition costs, and $2.0 million in higher infrastructurepublic relations expenses, costs related to music events, agency platform and media measurement expenses, facilities-related expenses and infrastructure costs. We expect sales and marketing expenses to increase as we hire additional personnel to build out our sales and sales support teams, particularly as we continue to build out our local market sales team. While we have historically relied on the success of viral marketing to expand consumer awareness of our service, in 2014 we began to launch marketing campaigns to increase consumer awareness and expand our listener base. We anticipate that we will continue to utilize these types of marketing campaigns in the future.equipment.equipment expenses, both of which were driven by an approximate 30% increase in headcount, a $10.3 million increase in brand marketing and customer acquisition costs, a $9.0 million increase in transaction processing commissions on subscription purchases through mobile app stores, a $2.3 million increase in agency platform and media measurement expenses, a $1.9 million increase in music events expenses and a $1.2 million increase in public relations expenses. In addition, the remaining increase in sales and marketing expenses was due to the twelve months ended December 31, 2014 having one additional month as compared to the eleven months ended December 31, 2013.Administrativeadministrative Fiscal Year Ended January 31, FY 2011 to
FY 2012
$ Change FY 2012 to
FY 2013
$ Change 2011 2012 2013 (in thousands) $ 14,183 $ 35,428 $ 48,247 $ 21,245 $ 12,819 Eleven months ended
December 31, Eleven months ended
December 31, Twelve months ended
December 31, 2012 2013 $ Change 2013 2014 $ Change (in thousands) (in thousands) General and administrative $ 42,716 $ 69,300 $ 26,584 $ 69,300 $ 112,443 $ 43,143 2012 Compared2013.increase in future periods as we continue to invest in corporate infrastructure, including adding personnel and systems to our administrative functions.Generalcompared to the eleven months ended December 31, 2013, general and administrative expenses increased $12.8$43.1 million or 62%, primarily due to a $10.4$23.1 million increase in employee-related expenses driven by a 38% increase in headcountcosts and a $1.4$3.3 million increase in infrastructure costs. 2011 Compared to 2012. Generalfacilities and administrativeequipment expenses, increased $21.2 million primarily due to a $9.7 million increase in employee-related expensesboth of which were driven by a 64%an approximate 40% increase in headcount, a $7.7$5.5 million increase in professional services costs primarily due to royalty-related legal matters, a $1.2 million increase in credit card fees and a $2.9$1.0 million increase in infrastructure costs. In addition, the remaining increase in general and administrative expenses was due to the twelve months ended December 31, 2014 having one additional month as compared to the eleven months ended December 31, 2013.TableContentsOther Income (Expense) Fiscal Year Ended January 31, FY 2011 to
FY 2012
$ Change FY 2012 to
FY 2013
$ Change 2011 2012 2013 (in thousands) $ 31 $ 59 $ 95 $ 28 $ 36 (612 ) (616 ) (535 ) (4 ) 81 (728 ) (4,485 ) (1 ) (3,757 ) 4,484 $ (1,309 ) $ (5,042 ) $ (441 ) $ (3,733 ) $ 4,601 2012 Compared to 2013. Total other income (expense) decreased $4.6 millionwhich were primarily driven by a $4.5 million decreasean increase in expenses relatedheadcount.increase in fair value of our preferred stock warrants liability in the prior year. The liability was eliminated in June 2011. 2011 Comparedamount expected to 2012. Total other income (expense) increased $3.7 million primarily driven by a $3.6 million increase in expenses due to the increase in the fair value of our preferred stock warrants liability.Provision for Income Taxes 2012 Compared to 2013. The income tax provision decreased by $70,000 from $75,000 to $5,000 as a result of changes in state tax statutes which resulted in lower tax obligations in some states. 2011 Compared to 2012. The income tax provision decreased by $59,000 from $134,000 to $75,000 as a result of generating tax losses during fiscal year 2012.JanuaryDecember 31, 20132014, we had cash, cash equivalents and short-term investments totaling $89.0$458.8 million, which consisted of cash and money market funds held at major financial institutions, commercial paper, and investment-grade corporate debt securities and U.S. government and government agency debt securities.fiscal year ending Januarytwelve months ended December 31, 20132014 were funding our operations, as described below, and capital expenditures.12twelve months. Credit Facility. On 13, 2011, we entered into a $30$30.0 million credit facility with a syndicate of financial institutions. In September 2013, we amended this credit facility. The amendment increased the aggregate commitment amount of borrowings available underfrom $30.0 million to $60.0 million, extended the maturity date from May 12, 2015 to September 12, 2018 and decreased the interest rate on borrowings. Refer to Note 8 “Debt Instruments” in the Notes to Consolidated Financial Statements for further details regarding our credit facility.at any time is based onto enhance our monthly accounts receivable balance at such time, and the amounts borrowed are collateralized by our personal property (including such accounts receivable but excluding intellectual property). At our option, drawn amounts under the credit facility will bear an interest rateworking capital position. This amount was paid off in full in August 2013. We had no outstanding borrowings as of either (i) an adjustedLondon Interbank offered, or LIBO, rate plus (A) 3.00% (if the debt outstanding is greater than or equal to $15 million) or (B) 2.75% (if the debt outstanding is less than $15 million) or (ii) an alternate base rate plus (x) 2.00% (if the debt outstanding is greater than or equal to $15 million) or (y) 1.75% (if the debt outstanding is less than $15 million). The adjusted LIBO rate is the LIBO rate for a particular interest period multiplied by the statutory reserve rate. The alternate base rate is the greatest of the prime rate, the federal funds effective rate plus 0.5% and the adjusted LIBO rate plus 1%. In addition, we are obligated to pay a non-usage charge on the available balance. The non-usage charge is 0.5% if the debt outstanding is greater than or equal to $15 million or 0.625% if the debt outstanding is less than $15 million. Under the credit facility, we can request up to $5 million in letters of credit be issued by the financial institutions. The annual charge for any outstanding letters of credit is 2.75% (if the debt/letters of credit outstanding is less than $15 million) or 3.00% (if the debt/letters of credit outstanding is greater than or equal to $15 million). The credit facility contains customary events of default, conditions to borrowing and covenants, including restrictions on our ability to dispose of assets, make acquisitions, incur debt, incur liens and make distributions to stockholders. The credit facility also includes a financial covenant requiring the maintenance of minimum liquidity of at least $5 million. During the continuance of an event of a default, the lenders may accelerate amounts outstanding, terminate the credit facility and foreclose on all collateral. Any inability to meet our debt service obligation could have material consequences on our security holders. As of JanuaryDecember 31, 2013, the Company had $828,000 in letters of credit outstanding and had $29.17 million of available borrowing capacity under the credit facility. On December 30, 2011, the Company entered into a cash collateral agreement in connection with the issuance of letters of credit which were used to satisfy deposit requirements under facility leases. As of January 31, 2013, the $828,000 cash collateral was considered to be restricted cash. The amount is included in other assets on the Company's balance sheet.Based on current estimates, we believe thatOur access to capital is adequate to meet our anticipated capital expenditures will be adequate to implementfor our current plans.fiscal 2011,the twelve months ended January 31, 2013, the eleven months ended December 31, 2012 and 2013.2013 and the twelve months ended December 31, 2014. Fiscal Year Ended January 31, Twelve months ended
January 31, Eleven months ended
December 31, Twelve months ended
December 31, 2011 2012 2013 2013 2012 2013 2014 (In thousands) (in thousands) $ 3,540 $ 5,358 $ (250 ) $ (250 ) $ 1,702 $ (2,986 ) $ 21,029 (8,211 ) (58,550 ) 15,185 15,185 8,235 (211,919 ) (112,200 ) 31,555 54,270 6,669 6,669 5,877 394,997 21,661 Activitiesfiscalthe twelve months ended December 31, 2014, net cash provided by operating activities was $21.0 million and primarily consisted of non-cash charges of $105.3 million, primarily related to $87.1 million in stock-based compensation charges, offset by an increase in accounts receivable of $54.4 million driven by an increase in revenue and our net loss of $30.4 million. Net cash provided by operating activities also included a $28.2 million decrease in deferred revenue from December 31, 2013, primarily due to the one-time recognition of the accumulation of deferred revenue related to certain subscriptions purchased through mobile app stores of $14.2 million and due to a decrease in deferred revenue as a result of the elimination of the annual subscription option from March through December 2014, as we collected less cash upfront under the one-month subscription period as opposed to the twelve-month subscription period under the annual subscription option. Cash provided by operating activities increased $24.0 million from the eleven months ended December 31, 2013, primarily due to a $47.0 million increase in stock-based compensation expense as a result of an increase in headcount, offset by a $3.4 million increase in our net loss.andoffset by non-cash charges of $33.2 million primarily related to stock-based compensation charges.expense. Net cash used in operating activities benefited from changes in operating assets and liabilities including an increase in accrued royalties of $19.3 million due to an increase in listening hours,schedule rate increases and an increase in deferred revenue of $10.0 million primarily due to an increase in customers purchasing subscriptions for Pandora One, an increase in accrued compensation of $9.6 million due to headcount increases and the timing of these payments and $5.0 million in higher accounts payable primarily dueto costs related to expanding our Oakland office facilities and higher ad serving fees. These increases were offset by an increase in accounts receivable of $36.7 million primarily due to increased billings and higher prepaid expenses and other assets. In fiscal 2012, net cash provided by operating activities was $5.4 million, including our net loss of $16.1 million and non-cash charges of $18.9 million. In addition, cash provided by operating activities from changes in operating assets and liabilities included an increase in accrued royalties of $15.7 million due to an increase in listening hours and an increase in accrued compensation of $8.1 million related to higher employee bonus compensation due to the timing of payments. Cash provided by operating activities also included $3.3 million higher deferred revenue primarily related to an increase in customers purchasing subscriptions for Pandora One, largely offsetdriven by an increase in accounts receivable of $24.5revenue.increased billings. In fiscal 2011, net cash provided by operating activities was $3.5$340.7 million including our net loss of $1.8 million and non-cash chargespurchases of $4.1 million. In addition, cash outflows from changes in operating assets and liabilities included an increase in accounts receivable of $23.0 million related to higher advertising sales. Cash inflows from changes in operating assets and liabilities included an increase in deferred revenue of $9.8 million primarily related to an increase in customers purchasing subscriptions for Pandora One and an increase in accrued royalties of $9.0 million due to the timing of royalty payments and increase in the number of listeners.Investing Activities Cash provided by investing activities in fiscal 2013 was $15.2 million consisting of $87.9 million in maturities of short-term investments partially offset by $65.2 million for the purchase of short-term investments and $7.6$30.0 million for capital expenditures primarily for server equipment and leasehold improvements. Cash used in investing activities in fiscal 2012 was $58.6 million consisting of $66.9 million for the purchase of short-term investments and $11.6 million primarily for capital expenditures for leasehold improvements and server equipment, partially offset by $20.0$258.5 million in maturities of investments. Cash used in in fiscal 2011 was $8.2 million, primarily consisting of $79.6 million in maturities of short-term investments offset by $59.6 million for the purchases of investments.capital expenditures$87.9 million in maturities of short-term investments, offset by $65.2 million for server equipment.Activities Cashactivitiesin fiscal 2013 was $6.7$21.7 million, primarily consisting of cash$16.9 million in proceeds from issuancethe exercise of common stock pursuant to incentive awards. Cashoptions and $6.4 million in proceeds from our employee stock purchase plan.in fiscal 2012 was $54.3$395.0 million, primarily consisting of cash proceeds of $90.6 million from issuance of common stock in our IPO, net of cash paid for issuance costs partially offset by the payment of $31.0 million in dividends upon conversion of the redeemable convertible preferred stock concurrent with the closing of our IPO, and repayment of all outstanding debt for $7.6 million. Cash provided by financing activities in fiscal 2011 was $31.6 million consisting primarily of net proceeds of $22.2 million from the issuancefollow-on public equity offering of 8.1$378.7 million shares of Series G redeemable convertible preferred stock and cash proceeds from the issuance of both vested and unvested common stock of $6.1$16.8 million.TableContentsJanuaryDecember 31, 2013:2014: Payments Due by Period Total Less Than
1 Year 1 - 3 Years 4 - 5 Years More Than
5 Year Payments Due by Period (in thousands) Less Than More Than $ 750 $ 750 $ — $ — $ — Total 1 Year 1 - 3 Years 4 - 5 Years 5 Years (in thousands) Purchase obligations $ 9,950 $ 8,050 $ 1,900 $ — $ — 20,833 4,160 8,876 7,479 318 72,837 11,130 22,048 19,119 20,540 $ 21,583 $ 4,910 $ 8,876 $ 7,479 $ 318 $ 82,787 $ 19,180 $ 23,948 $ 19,119 $ 20,540 Purchase obligation representsJanuaryDecember 31, 2013 related2014 whichbranding agreement.JanuaryDecember 31, 2011, 20122013 and 2013,2014, we did not have any off-balance sheet arrangements. may reflect the effects of some seasonal trends in listener behaviorand advertising behavior. We expect to experience both higher advertising sales due to greater advertiser demand during the holiday season and increased internet usage and salesdue to the popularity of media-streaming devicesholiday music during certain vacation and holiday periods. For example,the last three months of each calendar year. In addition, we expect to experience increased usage duringlower advertising sales in the fourth quarterfirst three months of each calendar year due to the holiday season,reduced advertiser demand and in the first quarter of each calendar yearincreased usage due to increased use of media-streaming devices received as gifts during the holiday season. We may also experience higher advertising sales during the fourth quarter of each calendar year due to greater advertiser demand during the holiday season and lower advertising sales during the first quarter of each calendar year due to seasonally adjusted advertising demand. While we believe these seasonal trends have affected, and will continue to affect our operating results, our trajectory of rapid growth may have overshadowed these effects to date. We believe that our business may become more seasonalparticularly as increases in content acquisition costs from increased usage are not offset by increases in advertising sales in the future and that such seasonal variations in listener behavior may result in fluctuations in our financial results.For example, an advertiser which accounted for more than 10% of our advertising revenue for the first two quarters of fiscal 2012 did not meet this threshold for the third and fourth quarters of fiscal 2012. As a result of these and other factors, the results of any prior quarterly or annual periods should not be relied upon as indications of our future operating performance. Growthlisteningour fourth fiscal quarter.continues to outpace growthwas tempered in the eleven months ended December 31, 2013 by the implementation of the mobile listening on traditional computer-based devices. While historically we have not limited the usage oflimit for our advertising-supported service on mobile devices, in March 2013 we instituted a 40 hour listening cap on these devices. Listeners who reach this limit may continue to use our adadvertising supported service on certain mobile and other connected devices. Effective September 2013, we eliminated this limit primarily due to our improved ability to monetize mobile listener hours. Although we have removed the broad 40 hour per month mobile listening limit, we have implemented other more precise measures that we believe will allow us to better manage the growth of mobile content acquisition costs while minimizing adverse effects on the listener experience. In addition, the mobile listening limit drove significant growth in subscribers to our ad-free service, and since removing the limit we do not expect to experience similar growth in subscriptions in the near term. To the extent we take steps such as these devices by paying $0.99to affect usage on a particular platform, trends in usage may be obscured or changed and comparisons across periods may not be meaningful.remainder of the month, may listen to our ad supported service on their desktop or laptop computers or may purchase annual or monthly Pandora One subscriptions for $36 per year or approximately $4 per month, respectively.foreseeable future.arewhich have been prepared in accordance with generally accepted accounting principles in the United States, or U.S. GAAP. The preparation of these consolidated financial statements requires us to make estimates, judgments and assumptions that affect the reported amounts of assets, liabilities, revenue and expenses and the related disclosures.disclosure of contingent assets and liabilities. We evaluatebase our estimates and assumptions on an ongoing basis. Our estimates are based on historical experience and on various other assumptions that we believe to beare reasonable under the circumstances. Our actualestimatescouldmay differ from these estimates.recognition,subscription and other revenue and stock based compensation and the valuation of stock option grants and common stock valuations, and accounting for income taxes have the greatest potential impact on our financial statements. Therefore, we consider these to be our critical accounting policies and estimates.Revenuerecordalso generate advertising revenue frompursuant to arrangements with advertising agencies and brokers. Under these performance-based actions whenarrangements, we receive third-party verification reports supportingprovide the numberagencies and brokers the ability to sell advertising inventory on our service directly to advertisers. We report this revenue net of actions performed inamounts due to agencies and brokers because we are not the period. We generally have audit rights toprimary obligor under these arrangements, we do not set the underlying data summarized in these reports.Services and Other Revenueand advertisement-free access.on supported devices. Subscription revenue derived from direct sales to listeners is recognized on a straight-line basis over the duration of the subscription period. Subscription revenue derived from sales through some mobile operating systems may be subject to refund or cancellation terms which may affect the timing or amount of the subscription revenue recognition. When refund rights exist, we recognize revenueJanuaryDecember 31, 2013, we had deferred all revenue of approximately $5.1 million related to these mobile subscriptions subject to refund rights. Until September 2011, a small portion of subscription revenue was also generated from usage-based fees when a listener whorights totaling approximately $14.2 million, as we did not have accesssufficient history to estimate a premium versionreturn reserve. Beginning in January 2014, we had sufficient historic transactional information which enabled us to estimate future returns. Accordingly, in January 2014, we began recording revenue related to these mobile subscriptions net of the Pandora service reached a maximum number of listening hours on traditional computersestimated returns. This change resulted in a given month. The listener was required to pay a nominal fee to continue the advertising-supported listening experience on traditional computers for the remainder of the month. Revenue from usage-based fees was recognizedone-time increase in subscription revenue in the month the maximum numberthree months ended March 31, 2014 of listening hours was exceeded. In September 2011, we effectively eliminated the 40 hour per month listening cap on desktop and laptop computers by increasing the cap to 320 hours of listening per month, which almost none of our listeners exceed.Revenue Recognition for Multiple-Element Arrangements We enter into arrangements with customers to sell advertising packages that include different media placements or ad services that are delivered at the same time, or within close proximity of one another. Because we had not yet established the fair value for each element and our agreements contain mid-campaign cancellation clauses, advertising sales revenue prior to February 1, 2011 was recognizedapproximately $14.2 million, as the lowestpreviously deferred revenue was recognized. As of (1)December 31, 2014, the deferred revenue calculated on a time-based straight-line basis overrelated to the termreturn reserve was not significant.the contract, (2) revenue calculated on a proportional performance basis, based on CPM for the entire campaign multiplied by the number of impressions delivered to date and (3) revenueoperations based on the delivered media and price as specified ondepartment to which the applicable insertion order. Significant creative or engineering professional services provided adjunct to a campaign are not considered to have standalone value. As a result, we recognized revenue for all elements of multiple-element arrangements as a single unit of accounting over the delivery period. Beginning on February 1, 2011, we adopted new authoritative guidance on multiple element arrangements using the prospective method for all arrangements entered into or materially modified from the date of adoption. Under this new guidance we allocate arrangement consideration in multiple-deliverable revenue arrangements at the inception of an arrangement to all deliverables or those packages in which all components of the package are delivered at the same time, based on the relative selling price method in accordance with the selling price hierarchy, which includes: (1) vendor-specific objective evidence, or VSOE, if available; (2) third-party evidence, or TPE, if VSOE is not available; and (3) best estimate of selling price, or BESP, if neither VSOE nor TPE is available. BESP is generally used to allocate the selling price to deliverables in our multiple element arrangements. We determine BESP for deliverables by considering multiple factors including, but not limited to, prices we charge for similar offerings, sales volume, market conditions, competitive landscape and pricing practices. We recognize the relative fair value of the media placements or ad services as they are delivered assuming all other revenue recognition criteria are met. As a result of implementing this recent authoritative guidance, we recognized $3.0 million as revenue in the fiscal year ended January 31, 2012 that would have been deferred under the previous guidance for multiple element arrangements.Stock-Based Compensationexpensesexpense for employees at the grant date fair value of the award, and recognize expensesexpense on a straight-line basis over the requisite service period, which is generally the vesting period. period, net of estimated forfeitures.account for stock options issued to non-employees in accordance withgenerally estimate the guidance for equity-based payments to non-employees. We believe that thegrant date fair value of stock options is more reliably measured than the fair value of the services received. As such, the fair value of the unvested portion of the options granted to non-employees is re-measured each period. The resulting increase in value, if any, is recognized as expense during the period the related services are rendered. We generally estimate the fair value of stock-based payment awards using the Black-Scholes option-pricing model. The determination of the fair value of a stock-based award on the date of grant using the Black-Scholes option-pricing model is affected by our stock price on the date of grant, as well as assumptions regarding a number of complex and subjective variables. These variables include ourthe expected stock price volatility over the expected term of the award, actual andwhich is based on projected employee stock option exercise behaviors, the risk-free interest rate for the expected term of the award and expected dividends. The value of the portion of the award that is ultimately expected to vest is recognized as expense in our statements of operations. Prior to our IPO, our board of directors considered numerous objective and subjective factors to determine the fair market value of our common stock at each meeting at which stock options were granted and approved.expenses are classifiedexpense is recorded net of estimated forfeitures in the statement of operations for only those stock-based awards that we expect to vest. We estimate the forfeiture rate based on historical forfeitures of equity awards and adjust the departmentrate to which the related employee reports. Our stock-based awards are comprised principally of stock options and restricted stock unit awards.Accounting for Income Taxes We account for our income taxes using the asset and liability method, which requires the recognition of deferred tax assets and liabilities for the expected future tax consequences of events that have been recognizedreflect changes in our financial statements or in our income tax returns. Deferred income taxes are recognized for differences between financial reporting and tax bases of assets and liabilities at the enacted statutory income tax rates in effect for the years in which the temporary differences are expected to reverse. The effect on deferred taxes of a change in income tax rates is recognized in income in the period that includes the enactment date. We evaluate the realizability of our deferred tax assets and valuation allowances are provided when necessary to reduce net deferred tax assets to the amounts expected to be realized. We recognize a tax benefit from an uncertain tax position only if it is more likely than not that the tax position will be sustained on examination by the taxing authorities, based on the technical merits of the position. The tax benefits recognized in the financial statements from such positions are then measured based on the largest benefit that has a greater than 50% likelihood of being realized upon settlement. We will recognize interest and penalties related to unrecognized tax benefits in our income tax provision in the accompanying statement of operations. We calculate our current and deferred income tax provision based on estimates and assumptions that could differ from the actual results reflected in income tax returns filed in subsequent years. Adjustments based on filed income tax returns are recorded when identified. The amount of income taxes we pay is subject to examination by U.S. federal, state and international tax authorities. Our estimate of the potential outcome of any uncertain tax issue is subject to management's assessment of relevant risks, facts and circumstances, existing at that time. To the extent thatif any. We will revise our assessmentestimated forfeiture rate if actual forfeitures differ from our initial estimates.ItemJanuaryDecember 31, 2013,2014, we had notno amounts drawn any amounts under the credit facility butand had $828,000 of$1.1 million in outstanding letters of credit outstanding.half27% of our portfolio consists of cash and cash equivalents that have a relatively short maturity, and a fair value relatively insensitive to interest ratefixed-income marketableavailable-for-sale investments consist of corporate debt securities, commercial paper and U.S. government and government agency debt securities which may be subject to market risk due to changes in prevailing interest rates that may cause the fair values of our investments to fluctuate. Based on a sensitivity analysis, we have maturities of less than six months, but do carry some degree of interest rate risk and may have their fair market values adversely impacted by higher interest rates. We do not believedetermined that a hypothetical 10%100 basis points increase in interest rates would have resulted in a decrease in the fair values of our investments of approximately $2.3 million as of JanuaryDecember 31, 20132014. Such losses would have had a material impact on our investment portfolio. We have currently determined, consistent with our investment objectives, thatonly be realized if we sold the potential increase in yield would not warrant investing our excess cash in longer-term investments.investments prior to maturity. In future periods, we will continue to evaluate our investment policy in order to ensure that we continue to meet our overall objectives.JanuaryDecember 31, 20122013 and 2013,2014, and the related consolidated statements of operations, and comprehensive loss, redeemable convertible preferred stock and stockholders' equity (deficit), and cash flows for each of the three years in the periodtwelve months ended January 31, 2013.2013, the eleven months ended December 31, 2013 and the twelve months ended December 31, 2014. These financial statements are the responsibility of the Company's management. Our responsibility is to express an opinion on these financial statements based on our audits.JanuaryDecember 31, 20122013 and 2013,2014, and the consolidated results of its operations and its cash flows for each of the three years in the periodtwelve months ended January 31, 2013, the eleven months ended December 31, 2013 and the twelve months ended December 31, 2014, in conformity with U.S. generally accepted accounting principles. As discussed in Note 1 to the consolidated financial statements, under the heading Revenue Recognition, the Company changed its method of accounting for revenue recognition as a result of the adoption of amendments to the FASB Accounting Standards Codification resulting from Accounting Standards Update No. 2009-13,Multiple-Deliverable Revenue Arrangements, effective February 1, 2011.JanuaryDecember 31, 2013,2014, based on criteria established in Internal Control—IntegratedControl-Integrated Framework issued by the Committee of Sponsoring Organizations of the Treadway Commission (2013 framework) and our report dated March 18, 2013February 11, 2015 expressed an unqualified opinion thereon. /s/ Ernst & Young LLP San Francisco, California March 18, 2013
February 11, 2015 Ofof Independent Registered Public Accounting FirmJanuaryDecember 31, 2013,2014, based on criteria established in Internal Control—IntegratedControl-Integrated Framework issued by the Committee of Sponsoring Organizations of the Treadway Commission (2013 framework) (the COSO criteria). Pandora Media, Inc.'s management is responsible for maintaining effective internal control over financial reporting, and for its assessment of the effectiveness of internal control over financial reporting included in the accompanying Management's Annual Report on Internal Control Over Financial Reporting. Our responsibility is to express an opinion on the Company's internal control over financial reporting based on our audit.JanuaryDecember 31, 2013,2014, based on the COSO criteria.balance sheets of Pandora Media, Inc. as of January 31, 2012 and 2013, and the related consolidatedfinancial statements of operations and comprehensive loss, redeemable convertible preferred stock and stockholders' equity (deficit), and cash flows for each of the three years in the period ended January 31, 2013 of Pandora Media, Inc. and our report dated March 18, 2013February 11, 2015 expressed an unqualified opinion thereon. /s/ Ernst & Young LLP San Francisco, California March 18, 2013
February 11, 2015 Inin thousands, except share and per share amounts)As of December 31, As of
January 31,
2012 As of
January 31,
2013 2013 2014 Current assets $ 44,126 $ 65,725 $ 245,755 $ 175,957 46,455 23,247 98,662 178,631 66,738 103,410 Accounts receivable, net of allowance of $1,272 at December 31, 2013 and $1,218 at December 31, 2014 164,023 218,437 2,806 6,232 10,343 15,389 160,125 198,614 518,783 588,414 Long-term investments 105,686 104,243 15,576 17,758 35,151 42,921 2,314 2,460 Other long-term assets 13,715 13,712 $ 178,015 $ 218,832 $ 673,335 $ 749,290 Liabilities and stockholders’ equity Current liabilities $ 2,053 $ 4,471 $ 14,413 $ 10,825 3,838 7,590 14,881 15,754 33,822 53,083 66,110 73,693 19,232 29,266 42,650 14,412 11,962 21,560 17,952 34,476 70,907 115,970 156,006 149,160 2,568 3,873 9,098 16,773 73,475 119,843 165,104 165,933 — — 16 17 Stockholders’ equity Common stock, $0.0001 par value, 1,000,000,000 shares authorized: 195,395,940 shares issued and outstanding at December 31, 2013 and 209,071,488 at December 31, 2014 20 21 205,955 238,552 675,103 781,009 (101,426 ) (139,574 ) (166,591 ) (196,997 ) (5 ) (6 ) (301 ) (676 ) 104,540 98,989 $ 178,015 $ 218,832 Total stockholders’ equity 508,231 583,357 Total liabilities and stockholders’ equity $ 673,335 $ 749,290 Inin thousands, except per share amounts) Fiscal Year Ended January 31, 2011 2012 2013 $ 119,333 $ 239,957 $ 375,218 18,431 34,383 51,927 137,764 274,340 427,145 69,357 148,708 258,748 11,559 22,759 32,019 6,736 13,425 18,118 36,250 65,010 107,715 14,183 35,428 48,247 138,085 285,330 464,847 (321 ) (10,990 ) (37,702 ) 31 59 95 (612 ) (616 ) (535 ) (728 ) (4,485 ) (1 ) (1,630 ) (16,032 ) (38,143 ) (134 ) (75 ) (5 ) (1,764 ) (16,107 ) (38,148 ) (300 ) (110 ) — (8,978 ) (3,648 ) — $ (11,042 ) $ (19,865 ) $ (38,148 ) $ (1.03 ) $ (0.19 ) $ (0.23 ) 10,761 105,955 168,294 Twelve months ended
January 31, Eleven months ended
December 31, Twelve months ended
December 31, 2013 2012 2013 2014 (unaudited) Revenue Advertising $ 375,218 $ 343,318 $ 489,340 $ 732,338 Subscription and other 51,927 46,166 110,893 188,464 Total revenue 427,145 389,484 600,233 920,802 Cost of revenue Cost of revenue—Content acquisition costs 258,748 230,731 314,866 446,377 Cost of revenue—Other 32,282 28,988 42,217 61,627 Total cost of revenue 291,030 259,719 357,083 508,004 Gross profit 136,115 129,765 243,150 412,798 Operating expenses Product development 18,901 16,901 31,294 53,153 Sales and marketing 107,373 94,212 169,005 277,330 General and administrative 47,543 42,716 69,300 112,443 Total operating expenses 173,817 153,829 269,599 442,926 Loss from operations (37,702 ) (24,064 ) (26,449 ) (30,128 ) Other income (expense), net (441 ) (401 ) (474 ) 306 Loss before provision for (benefit from) income taxes (38,143 ) (24,465 ) (26,923 ) (29,822 ) Provision for (benefit from) income taxes (5 ) 3 (94 ) (584 ) Net loss $ (38,148 ) $ (24,462 ) $ (27,017 ) $ (30,406 ) Weighted-average common shares outstanding used in computing basic and diluted net loss per share 168,294 167,956 180,968 205,273 Net loss per share, basic and diluted $ (0.23 ) $ (0.15 ) $ (0.15 ) $ (0.15 ) (In thousands)Twelve months ended
January 31, Eleven months ended
December 31, Twelve months ended
December 31, Year Ended January 31, 2013 2013 2014 2011 2012 2013 $ (1,764 ) $ (16,107 ) $ (38,148 ) $ (38,148 ) $ (27,017 ) $ (30,406 ) — — (3 ) (3 ) (42 ) (184 ) — (5 ) 2 Change in net unrealized losses on marketable securities 2 (253 ) (191 ) — (5 ) (1 ) (1 ) (295 ) (375 ) $ (1,764 ) $ (16,112 ) $ (38,149 ) Total comprehensive loss $ (38,149 ) $ (27,312 ) $ (30,781 ) Redeemable Convertible Preferred Stock and Stockholders' Equity (Deficit)Inin thousands, except share amounts) Redeemable
Convertible Preferred
Stock Common Stock Accumulated
Other
Comprehensive
Income (loss) Total
Stockholders'
Equity
(Deficit) Common Stock Additional Paid-in Capital Accumulated Other Comprehensive Loss Accumulated Deficit Total Stockholders' Equity Additional
Paid-in
Capital Accumulated
Deficit Shares Amount Shares Amount Total
Stockholders'
Equity
(Deficit) 125,280,526 104,806 7,102,336 1 — — (87,772 ) (87,771 8,129,338 22,206 — — — — — — 124,470 142 — — — — — — — — 6,148,128 — 577 — — 577 — — 1,210,191 — 3,800 — — 3,800 — — 50,000 — 157 — — 157 — — — — 1,455 — — 1,455 — (792 ) — — (3,725 ) — 4,517 792 — — — — 44 — — 44 — 300 — — — — (300 ) (300 ) (1,764 ) (1,764 ) 133,534,334 $ 126,662 14,510,655 $ 1 $ 2,308 $ — $ (85,319 ) $ (83,010 ) 5,165,112 1 2,515 2,516 9,187 9,187 25,200 (25,218 ) (25,218 ) 110 (110 ) (110 ) (31,005 ) (133,534,334 ) (120,967 ) 137,294,552 13 126,477 126,490 6,350,682 1 90,631 90,632 248,360 165 165 (16,107 ) (16,107 ) (5 ) (5 ) Shares Par Amount Additional Paid-in Capital Accumulated Other Comprehensive Loss Accumulated Deficit Total Stockholders' Equity $ 163,569,361 $ 16 $ 205,955 $ (5 ) $ (101,426 ) $ 104,540 163,569,361 $ 16 8,408,842 1 7,305 7,306 8,408,842 1 7,305 — — 7,306 25,500 25,500 — — 25,500 — — 25,500 400,112 400,112 — — — — — (18,340 ) (208 ) (208 ) (18,340 ) — (208 ) — — (208 ) 146,076 146,076 — — — — — — (38,148 ) (38,148 ) — — — — (38,148 ) (38,148 ) (1 ) (1 ) — — — (1 ) — (1 ) $ 172,506,051 $ 17 $ 238,552 $ (6 ) $ (139,574 ) $ 98,989 172,506,051 $ 17 $ 238,552 $ (6 ) $ (139,574 ) $ 98,989 Issuance of common stock upon exercise of stock options 5,659,377 1 18,355 — — 18,356 Issuance of common stock in connection with secondary offering, net issuance costs 15,730,000 2 378,635 — — 378,637 Stock-based compensation — — 40,041 — — 40,041 Vesting of restricted stock units 1,520,516 — — — — — Share cancellations to satisfy tax withholding on vesting of restricted stock units (20,004 ) — (480 ) — — (480 ) Components of comprehensive loss: — Net loss — — — — (27,017 ) (27,017 ) Other comprehensive loss — — — (295 ) — (295 ) Balances as of December 31, 2013 195,395,940 $ 20 $ 675,103 $ (301 ) $ (166,591 ) $ 508,231 Issuance of common stock upon exercise of stock options 10,437,509 1 17,115 — — 17,116 Stock-based compensation — — 87,055 — — 87,055 Vesting of restricted stock units 3,169,456 — — — — — Share cancellations to satisfy tax withholding on vesting of restricted stock units (73,682 ) — (2,019 ) — — (2,019 ) Stock issued under employee stock purchase plan 142,265 — 3,407 — — 3,407 Excess tax benefit from stock-based awards — — 348 — — 348 Components of comprehensive loss: Net loss — — — — (30,406 ) (30,406 ) Other comprehensive loss — — — (375 ) — (375 ) Balances as of December 31, 2014 209,071,488 $ 21 $ 781,009 $ (676 ) $ (196,997 ) $ 583,357 The accompanying notes are an integral part of the financial statements.Pandora Media, Inc.Consolidated Statements of Cash Flows(In thousands) Fiscal Year Ended January 31, 2011 2012 2013 $ (1,764 ) $ (16,107 ) $ (38,148 ) 1,578 4,455 7,076 (15 ) 296 23 1,612 9,187 25,500 869 4,499 — — 246 360 4 190 264 (22,979 ) (24,526 ) (36,672 ) (2,421 ) 156 (3,752 ) 5,482 (865 ) 4,963 9,036 15,742 19,261 2,375 8,147 9,598 9,763 3,322 10,034 — 616 1,243 3,540 5,358 (250 ) (8,211 ) (11,644 ) (7,580 ) — (66,890 ) (65,168 ) — 19,984 87,933 (8,211 ) (58,550 ) 15,185 3,644 — — (392 ) (7,596 ) — 548 2,074 6,877 — — (208 ) 3,800 — — 1,705 — — — 165 — 22,206 — — — 90,632 — — (31,005 ) — 7,908 — — (7,908 ) — — 44 — — 31,555 54,270 6,669 — — (5 ) 26,884 1,078 21,599 16,164 43,048 44,126 $ 43,048 $ 44,126 $ 65,725 $ — $ (2,151 ) $ — $ — $ (124,341 ) $ — $ 142 $ — $ — $ (792 ) $ 25,218 $ — $ 300 $ 110 $ — $ — $ 125 $ — $ 371 $ 887 $ 289 Twelve months ended
January 31, Eleven months ended
December 31, Twelve months ended
December 31, 2013 2012 2013 2014 (unaudited) Operating activities Net loss $ (38,148 ) $ (24,462 ) $ (27,017 ) $ (30,406 ) Adjustments to reconcile net loss to net cash provided by (used in) operating activities Depreciation and amortization 7,076 6,406 10,112 15,431 Loss on retirement of fixed assets 23 23 — 105 Stock-based compensation 25,500 23,283 40,041 87,055 Amortization of premium on investments 360 329 237 2,833 Amortization of debt issuance costs 264 242 220 197 Excess tax benefit from stock-based awards — — — (348 ) Changes in assets and liabilities Accounts receivable (36,672 ) (43,487 ) (60,613 ) (54,414 ) Prepaid expenses and other assets (3,752 ) (2,189 ) (7,891 ) (9,219 ) Accounts payable and accrued liabilities 4,963 10,419 17,352 12,520 Accrued royalties 19,261 17,525 13,027 7,608 Accrued compensation 9,598 2,085 (3,393 ) 13,736 Deferred revenue 10,034 10,285 13,384 (28,238 ) Reimbursement of cost of leasehold improvements 1,243 1,243 1,555 4,169 Net cash provided by (used in) operating activities (250 ) 1,702 (2,986 ) 21,029 Investing activities Purchases of property and equipment (7,580 ) (11,809 ) (21,180 ) (30,039 ) Purchases of patents — — (8,000 ) — Purchases of investments (65,168 ) (59,559 ) (224,549 ) (340,679 ) Proceeds from maturities of investments 87,933 79,603 42,210 258,518 Payments related to acquisition — — (400 ) — Net cash provided by (used in) investing activities 15,185 8,235 (211,919 ) (112,200 ) Financing activities Borrowings under debt arrangements — — 10,000 — Repayments of debt — — (10,000 ) — Payment of debt issuance costs in connection with the debt refinancing — — (450 ) — Proceeds from follow-on offering, net of issuance costs — — 378,654 — Proceeds from exercise of stock options 6,669 5,877 17,273 16,894 Tax payments from net share settlements of restricted stock units — — (480 ) (2,019 ) Excess tax benefit from stock-based awards — — — 348 Proceeds from employee stock purchase plan — — — 6,438 Net cash provided by financing activities 6,669 5,877 394,997 21,661 Effect of exchange rate changes on cash and cash equivalents (5 ) (1 ) (62 ) (288 ) Net increase (decrease) in cash and cash equivalents 21,599 15,813 180,030 (69,798 ) Cash and cash equivalents at beginning of period 44,126 44,126 65,725 245,755 Cash and cash equivalents at end of period $ 65,725 $ 59,939 $ 245,755 $ 175,957 Supplemental disclosures of cash flow information Cash paid during the period for income taxes $ — $ — $ 26 $ 164 Cash paid during the period for interest $ 289 $ 283 $ 18 $ 314 Purchases of property and equipment recorded in accounts payable and accrued liabilities $ 1,952 $ 726 $ 7,910 $ 751 the Business and Basis of Presentation (the "Company" or "Pandora") provides an internet radio service in the United States, Australia and New Zealand, offering a personalized experience for each listener wherever and whenever they want to listen to radio on a wide range of its listeners. The Company has developedsmartphones, tablets, computers and car audio systems, as well as a range of other internet-connected devices. We have pioneered a new form of radioradio—one that uses intrinsic qualities of music to initially create stations thatand then adaptadapts playlists in real-time based on the individual feedback of each listener. The Company was We generate a majority of our revenue by offering local and national advertisers an opportunity to deliver targeted messages to our listeners using a combination of audio, display and video advertisements. We also generate revenue by offering a paid subscription service which we call Pandora One. We were incorporated as a California corporation in January 2000 and reincorporated as a Delaware corporation in December 2010.Initial Public Offering In June 2011, Our principal operations are located in the Company completedUnited States; we also operate in Australia and New Zealand.initial public offering ("IPO") whereby 14,684,000 shares of common stock were sold tosubsidiaries, unless the public at a price of $16.00 per share. The Company sold 6,000,682 common shares and selling stockholders sold 8,683,318 common shares. In July 2011, in connection with the exercise of the underwriters' overallotment option, 350,000 additional shares of common stock were sold to the public at the initial offering price of $16.00 per share. The Company received aggregate proceeds of $94.5 million from the initial public offering and the underwriters' overallotment option, net of underwriters' discounts and commissions but before deducting offering expenses of $3.9 million. Upon the closing of the IPO, all shares of the Company's outstanding redeemable convertible preferred stock automatically converted into 137,542,912 shares of common stock and outstanding warrants to purchase redeemable convertible preferred stock automatically converted into warrants to purchase 154,938 shares of common stock.. The consolidated financial statements and include the accounts of the CompanyPandora and itsour wholly-owned subsidiaries. All intercompany balances and transactions have been eliminated in consolidation. In the opinion of the Company's management, the consolidated financial statements include all adjustments, which include only normal recurring adjustments, necessary for the fair presentation of the Company's financial position for the periods presented.The Company's content acquisition costs areOur statements of operations now includedinclude the presentation of gross profit, which is calculated as a separatetotal revenue less cost of revenue. In addition, we have reclassified certain software license fees, facilities-related expenses and depreciation expenses among the general and administrative, cost of revenue—other, sales and marketing and product development lines in our consolidated statements of operations. Furthermore, we have reclassified certain compensation-related amounts from the accrued liabilities line item component of Cost of Revenue into the Company's Statement of Operations and changes in restricted cash are now included in theaccrued compensation line item Prepaid Expensesof our consolidated balance sheets and Other Assets in the Company's Statementsour consolidated statements of Cash Flows.forin several areas including, but not limited to determining accrued royalties, selling prices for elements sold in multiple-element arrangements, the allowance for doubtful accounts, the fair market value of common stock throughoptions and the dateimpact of the IPO,forfeitures on stock-based compensation, fair values of investments andthe provision for (benefit from) income taxes and accrued royalties.the subscription return reserve. To the extent there are material differences between these estimates, judgments, or assumptions and actual results, the Company'sour financialPandora Media, Inc.Notes to Consolidated Financial Statements (Continued)1. Description of the Business and Basis of Presentation (Continued)management'smanagement’s judgment in its application. There are also areas in which management'smanagement’s judgment in selecting among available alternatives would not produce a materially different result. The CompanyThe Company'sOur chief operating decision maker (the "CODM"), itsour Chief Executive Officer, manages the Company'sour operations on a consolidated basis for purposes of allocating resources. When evaluating the Company'sour financial performance, the CODM reviews separate revenue information for the Company'sour advertising, subscription services and other offerings, while all other financial information is reviewed on a consolidated basis. AllCompany's principalnotes thereto, the current year financial results ended December 31, 2014 are for a twelve-month period. Audited results for the periods endedare locatedand consolidated statements of cash flows include unaudited comparative amounts for the eleven-month period ended December 31, 2012. These unaudited consolidated financial statements have been prepared in accordance with U.S. GAAP. In our opinion, the United States.Fiscal year12twelve months ended January 31 of such year, and references to the first, second, third and fourth fiscal quarters ended prior to November 1, 2013 refer to the three months ended April 30, July 31, October 31 and January 31, respectively. The Company'sis principally derived from advertising services and subscription fees. The Company recognizes revenue when:when four basic criteria are met: (1) persuasive evidence exists of an arrangement with the customer reflecting the terms and conditions under which the products or services will be provided; (2) delivery has occurred or services have been provided; (3) the fee is fixed or determinable; and (4) collection is reasonably assured. For all revenue transactions, the Company considersWe consider a signed agreement, a binding insertion order or other similar documentation to be persuasive evidence of an arrangement.Revenue.revenue. The Company generatesWe generate advertising revenue primarily from audio, display audio and video advertising. The Company generatesWe generate the majority of itsour advertising revenue through the delivery of advertising impressions sold on a cost per thousand, or CPM, basis. In determining whether an arrangement exists, the Company ensureswe ensure that a binding arrangement, such as an insertion order or a fully executed customer-specific agreement, is in place. The CompanyWe generally recognizesrecognize revenue based on delivery information from itsour campaign trafficking systems. The Companygeneratesgenerate advertising revenue pursuant to arrangements with advertising agencies and brokers. Under these arrangements, the Company provideswe provide the agencies and brokers the ability to sell advertising inventory on the Company'sour service directly to advertisers. The Company reportsWe report this revenue net of amounts due to agencies and brokers because the Company iswe are not the primary obligor under these arrangements, the Company doeswe do not set the pricing and doesdo not establish or maintain the relationship with the advertisers.Other Revenue.other revenue. The Company generates subscription servicesSubscription and other revenue is generated primarily through the sale of access to a premium version of the Pandora internet radio, or Pandora One.service which currently includes advertisement-free access and higher audio quality on supported devices. We offer both an annual and a monthly subscription option. SubscriptionPandora Media, Inc.Notes to Consolidated Financial Statements (Continued)2. Summary of Significant Accounting Policies (Continued)the Company recognizeswe recognize revenue when the service hasservices have been provided and the rights lapse or when we have developed sufficient transaction history has been developed to estimate a reserve.JanuaryDecember 31, 2013, the Companywe had deferred all revenue of approximately $5.1 million related to these mobile subscriptions subject to refund rights. Until September 2011, a small portion of subscription revenue was also generated from usage-based fees when a listener whorights totaling approximately $14.2 million, as we did not have access to a premium version of the Pandora service reached a maximum number of listening hours on traditional computers in a given month. The listener was required to pay a nominal fee to continue the advertising-supported listening experience on traditional computers for the remainder of the month. Revenue from usage based fees was recognized in the month the maximum number of listening hours was exceeded. In September 2011, the Company effectively eliminated the 40 hour per month listening cap on desktop and laptop computers by increasing the cap to 320 hours of listening per month, which almost none of our listeners exceed. Deferred Revenue. Deferred revenue consists of both prepaid but unrecognized subscription revenue and advertising fees received or billed in advance of the delivery or completion of the services or in instances when revenue recognition criteria have not been met. Deferred revenue is recognized when the services are provided and all revenue recognition criteria have been met. When refund rights exist, the Company recognizes revenue when the rights lapse or when sufficient transaction history has been developed to estimate a return reserve. Multiple-Element Arrangements .Multiple-element arrangements. The Company entersWe enter into arrangements with customers to sell advertising packages that include different media placements or ad services that are delivered at the same time, or within close proximity of one another. For We recognize the fiscal year ended January 31, 2011, because the Company had not yet established therelative fair value for each element and the Company's agreements contained mid-campaign cancellation clauses, advertising sales revenue was recognized as the lesser of (1) revenue calculated on a time-based straight-line basis over the term of the contract, (2)media placements or ad services as they are delivered assuming all other revenue calculated on a proportional performance basis, based on an average CPM rate for the entire campaign multiplied by the number of impressions delivered to date, and (3) revenue earned on the delivered media and price as specified on the applicable insertion order. Beginning on February 1, 2011, the Company adopted new authoritative guidance on multiple element arrangements, using the prospective method for all arrangements entered into or materially modified from the date of adoption. Under this new guidance, the Company allocatesrecognition criteria are met.The Company determinesWe determine VSOE based on itsour historical pricing and discounting practices for the specific product or service when sold separately. In determining VSOE, the Company requiresPandora Media, Inc.Notes to Consolidated Financial Statements (Continued)2. Summary of Significant Accounting Policies (Continued)The Company hasWe have not historically priced itsour advertising products within a narrow range. As a result, the Company haswe have not been able to establish VSOE for any of itsour advertising products.the Company applieswe apply judgment with respect to whether it can establish a selling price based on TPE. TPE is determined based on competitor prices for similar deliverables when sold separately. Generally, the Company'sour go-to-market strategy differs from that of itsour peers and itsour offerings contain a significant level of differentiation such that the comparable pricing of services cannot be obtained. Furthermore, the Company iswe are unable to reliably determine what similar competitor services' selling prices are on a stand-alone basis. As a result, the Company haswe have not been able to establish selling price based on TPE.it iswe are unable to establish selling price using VSOE or TPE, the Company useswe use BESP in itsour allocation of arrangement consideration. The objective of BESP is to determine the price at which the Companywe would transact a sale if the service were sold on a stand-alone basis. BESP is generally used to allocate the selling price to deliverables in the Company'sour multiple element arrangements. The Company determinesWe determine BESP for deliverables by considering multiple factors including, but not limited to, prices it chargeswe charge for similar offerings, market conditions, competitive landscape and pricing practices. The Company limitsWe limit the amount of allocable arrangement consideration to amounts that are fixed or determinable and that are not contingent on future performance or future deliverables. The CompanyWe regularly reviewsreview BESP. Changes in assumptions or judgments or changes to the elements in the arrangement may cause an increase or decrease in the amount of revenue that the Company reportswe report in a particular period. The Company recognizes the relative fair value of the media placements or ad services as they are delivered assuming all other revenue recognition criteria are met.the Companyus to concentrations of credit risk consist principally of cash and cash equivalents, short-term investments and trade accounts receivable. The Company maintainsWe maintain cash and cash equivalents with domestic financial institutions of high credit quality. The Company performsWe perform periodic evaluations of the relative credit standing of all of such institutions. The Company performsThe CompanyWe generally doesdo not require collateral. The Company maintainsWe maintain reserves for potential credit losses on customer accounts when deemed necessary. Actual credit losses during the fiscal yearstwelve months ended January 31, 2011, 20122013, the eleven months ended December 31, 2013 and 2013the twelve months ended December 31, 2014 were not significant.fiscal yearstwelve months ended January 31, 2011, 2012 and 2013, the Companyeleven months ended December 31, 2013 and the twelve months ended December 31, 2014, we had no customers that accounted for 10% or more of total revenue. As of JanuaryDecember 31, 20122013 and 20132014, there were no customers that accounted for 10% or more of the Company'sour total accounts receivable.Pandora Media, Inc.Notes to Consolidated Financial Statements (Continued)2. Summary of Significant Accounting Policies (Continued)Short-term Investments The Company classifies itsThe Company's short-termOur investments consist of commercial paper, corporate debt securities and U.S. government and government agency notes.debt securities. These investments are classified as available-for-sale securities and are carried at fair value with the unrealized gains and losses reported as a component of stockholders' equity. Management determines the appropriate classification of itsour investments at the time of purchase and reevaluates the available-for-sale designations as of each balanceThe Company classifies itsWe classify our investments as either short-term or long-term based on each instrument's underlying contractual maturity date. Investments with maturities of twelve months or less than 12 months are classified as short-term and those with maturities greater than 12twelve months are classified as long-term. The cost ofbasis for investments sold is based upon the specific identification method.The Company'sOur allowance for doubtful accounts is based upon historical loss patterns, the number of days that billings are past due and an evaluation of the potential risk of loss associated with delinquent accounts. The CompanyWe also considersconsider any changes to the financial condition of itsour customers and any other external market factors that could impact the collectability of itsour receivables in the determination of itsour allowance for doubtful accounts.as follows:Servers, computers and other related equipment3 yearsOffice furniture and equipment3 to 5 yearsLeasehold improvementsShorter of the estimated useful life of 5 years or the lease termInternal Use Software and Website Development Costsdesign or maintenance of internal-use softwarepreliminary project activities and post implementation activities are expensed as incurred. The Company evaluatesWe evaluate the costs incurred during the application development stage of website development to determine whether the costs meet the criteria for capitalization. Costs related to preliminary project activities and post implementation activities are expensed as incurred. As of JanuaryDecember 31, 20122013 and 2013, the Company2014, we hadTable approximately $1.5 million and $2.8 million of ContentsPandora Media, Inc.Notes to Consolidated Financial Statements (Continued)2. Summary of Significant Accounting Policies (Continued)incurred and capitalized approximately $100,000 and $1.1 million respectively, related to internal use software and website development costs, whichnet of accumulated amortization. These costs are being amortized over their three-year estimated useful lives. Internal use software and website development costs are included in property and equipment.PreferredWarrant Prior to the Company's IPO, warrants to purchase the Company's redeemable convertible preferred stock were classified as liabilities on the Company's balance sheet. The Company measured these warrants at fair value at each balance sheet dateUnits and any changes in fair value were recognized as a component of other income (expense) in the Company's statements of operations. The Company's preferred stock warrants were categorized as Level 3 within the fair value hierarchy because the fair value was estimated using an option valuation model, which included the estimated fair value of the underlying preferred stock at the valuation measurement date, the remaining contractual term of the warrant, risk-free interest rates, and expected dividends on, and expected volatility of the price of the underlying preferred stock. These assumptions are inherently subjective and involve significant management judgment. The Company performed the final remeasurement of the warrants at the fair value at the closing date of the Company's IPO on June 20, 2011 because the preferred stock warrants were either exercised or converted to common stock warrants on that date. The Company recorded losses of approximately $0.9 million and $4.5 million arising from the revaluation of the convertible preferred stock warrant liability for the fiscal years ended January 31, 2011 and 2012.Stock-Based Compensationpayments madeawards granted to employees, including grants of employee stock options and restricted stock units (“RSUs”) and stock options, are recognized as expense in theour statements of operations based on their grant date fair values. The Company recognizesvalue. We recognize stock-based compensation for awards granted that are expected to vest,expense on a straight-line basis using the single-option attribution method over the service period of the award, which is generally four years. Because stock-basedWe estimate the fair value of RSUs at our stock price on the grant date. We generally estimate the grant date fair value of stock options using the Black-Scholes option-pricing model. The Black-Scholes option-pricing model is affected by our stock price on the date of grant, the expected stock price volatility over the expected term of the award, which is based on projected employee stock option exercise behaviors, the risk-free interest rate for the expected term of the award and expected dividends.expenses recognizedexpense is recorded net of estimated forfeitures in the statementsstatement of operations arefor only those stock-based awards that we expect to vest. We estimate the forfeiture rate based on historical forfeitures of equity awards ultimately expectedand adjust the rate to vest, they have been reduced forreflect changes in facts and circumstances, if any. We revise our estimated forfeitures. Forfeitures are required to be estimated at the time of grant and revised, if necessary, in subsequent periodsforfeiture rate if actual forfeitures differ from thoseour initial estimates. The forfeiture rates used for valuing stock-based compensation payments were estimated based on historical experience. The Company generally estimates the fair value of employee stock options using the Black-Scholes valuation model. The determination of the fair value of a stock-based award is affected by the deemed fair value of the underlying stock price on the grant date, as well as other assumptions including the risk-free interest rate, the estimated volatility of the Company's stock price over the term of the award, the estimated period of time that the Company expects employees to hold their stock options and the expected dividend rate. The Company hasWe have elected to use the "with and without" approach as described in Accounting Standards Codification 740 - Tax ProvisionsIncome Taxes in determining the order in which tax attributes are utilized. As a result, the Companywe will only recognize a tax benefit from stock-based awards in additional paid-in capital if an incremental tax benefit is realized after all other tax attributes currently available to the Companyus have been utilized. In addition, the Company haswe have elected to account for the indirectPandora Media, Inc.Notes to Consolidated Financial Statements (Continued)2. Summary of Significant Accounting Policies (Continued)Revenue—Revenue—Content Acquisition Coststhe rightstreaming music or other content to stream music to the Company'sour listeners. Royalties are most oftencurrently calculated using negotiated rates documented in master royalty agreements andagreements. The majority of our royalties are payable based on usage measures ora fee per public performance of a sound recording, while in other cases our royalties are payable based on a percentage of our revenue earned or a formula that involves a combination thereof. Theof per performance rights organizations to whichand revenue metrics. For royalty arrangements under negotiation, we accrue for estimated royalties are paid have the right to audit the Company's playlist and payment records. The Company may also recognize content acquisition costs based on estimated rates during periods of contract negotiation with performance rights organizations.Revenue—Revenue—Otherthe infrastructurehosting and ad serving costs, related toemployee-related costs and other costs of ad sales. Hosting and ad serving costs consist of content streaming, maintaining the Company'sour internet radio service and creating and serving advertisements through third partythird-party ad serving technology providers, including the employee costs associated with supporting these functions. The Company makesservers. We make payments to third-party ad servers for the period the advertising impressions are delivered or click-through actions are delivered or occur, and accordingly, the Company recordswe record this as a cost of revenue in the related period. The Company incursdevelopmentmanagement departments, facilities-related expenses, consisting of employee compensation, information technology consulting, facilities-related expenses and costs associated with supporting consumer connected-device manufacturers in implementing itsour service in their products. The Company incursWe incur product development expenses primarily for improvements to itsour website and the Pandora app, development of new advertising products and development and enhancement of the Music Genome Project and infrastructure costs such as facility and other overhead costs. The Companyour personalized station generating system. We have generally expensesexpensed product development costs as incurred, but has capitalized certain costs related toincurred.website development costs. (See "Internal Use SoftwareMarketingWebsite Development Costs.")Marketing and Sales Marketing and sales expenses consistmarketing consists primarily of employee and employee-related costs, including salaries, commissions and benefits related to employees in sales, marketingsales support and advertisingmarketing departments. In addition, marketingsales and salesmarketing expenses include transaction processing commissions on subscription purchases through mobile app stores, external sales and marketing expenses such as third-partybrand marketing branding, advertising and customer acquisition costs, public relations expenses, transactional subscription processing fees on mobile platforms,costs related to music events, agency platform and media measurement expenses, facilities-related expenses and infrastructure costs such as facility and other supporting overhead costs. Advertising expenses are expensed as incurred. Total advertising expenses incurred were $3.0 million, $6.9 million and $ 7.6 million for the years ended January 31, 2011, 2012 and 2013, respectively.expenses include employee andconsists primarily of employee-related costs, consisting ofincluding salaries and benefits for finance, accounting, legal, internal information technology and otherPandora Media, Inc.Notes to Consolidated Financial Statements (Continued)2. Summary of Significant Accounting Policies (Continued)andfacilities-related expenses, infrastructure costs for facility, supporting overhead costs and merchant and other transaction costs, such as credit card fees. The Company accounts requires the recognition of deferred tax assets and liabilities forare determined based on the expected future tax consequences of events that have been recognized indifference between the financial statements or in the Company's tax returns. Deferred income taxes are recognized for differences between financial reportingstatement and tax bases of assets and liabilities at theusing enacted statutory income tax rates in effect for the yearsyear in which the temporary differences are expected to reverse. The effect on deferred taxes of a change in tax rates is recognized in income in the period that includes the enactment date. The Company evaluates the realizability of deferred tax assets and valuationaffect taxable income. Valuation allowances are providedestablished when necessary to reduce net deferred tax assets to the amountsamount expected to be realized. The Company recognizesThe CompanyWe will recognize interest and penalties related to unrecognized tax benefits in the provision for (benefit from) income tax provisiontaxes in the accompanying statement of operations. The Company calculatesconvertible preferred stock warrants,and restricted stock units, and redeemable convertible preferred stock, to the extent dilutive. Basic and diluted net loss per share waswere the same for each period presented as the inclusion of all potential common shares outstanding would have been anti-dilutive.Pandora Media, Inc.Notes to Consolidated Financial Statements (Continued)2. Summary of Significant Accounting Policies (Continued) Effective February 1, 2012,Company adoptedFinancial Accounting Standards Update ("ASU") No. 2011-04, "Amendments to Achieve Common Fair Value Measurement and Disclosure Requirements in U.S. GAAP and International Financial Reporting Standards ("IFRS")." The ASU updates the accounting guidance to clarify and align Fair Value Measurement within U.S. GAAP and International Financial Reporting Standards. In addition, the ASU updates certain requirements for measuring fair value and for disclosure around fair value measurement. It does not require additional fair value measurements and the ASU was not intended to establish valuation standards or affect valuation practices outside of financial reporting. The adoption of ASU 2011-04 did not have a significant impact on the Company's consolidated balance sheets or statements of operations. Effective February 1, 2012, the Company adopted ASU No. 2011-05, "Presentation of Comprehensive Income." The adoption of ASU 2011-05 concerns presentation and disclosure only and did not have an impact on the Company's consolidated balance sheets or results of operations. ASU 2011-05 requires retrospective application and separate consolidated statements of comprehensive income (loss) are included in these financial statements. Effective February 1, 2012, the Company adopted ASU No. 2011-12, "Deferral of the Effective Date for Amendments to the Presentation of Reclassification of Items Out of Accumulated Other Comprehensive Income inBoard (FASB) issued Accounting Standards Update No. 2011-05."2014-9, ASU 2011-12 concerns presentation and disclosure only and did notthis guidance to have an impacta material effect on the Company'sour consolidated financial position or results of operations.Short-term Investments short-term investments consisted of the following: As of
January 31,
2012 As of
January 31,
2013 (in thousands) $ 6,604 $ 22,703 31,614 32,522 2,893 10,500 3,015 — $ 44,126 $ 65,725 $ 27,587 $ 13,592 17,968 9,655 900 — $ 46,455 $ 23,247 $ 90,581 $ 88,972 (Continued)3. Composition of Certain Financial Statement Captions (Continued) �� The Company's- Continued As of December 31, 2013 2014 (in thousands) Cash and cash equivalents Cash $ 89,176 $ 72,487 Money market funds 98,437 89,113 Commercial paper 54,247 9,349 Corporate debt securities 3,895 5,008 Total cash and cash equivalents $ 245,755 $ 175,957 Short-term investments Commercial paper $ 47,526 $ 45,443 Corporate debt securities 50,436 128,691 U.S. government and government agency debt securities 700 4,497 Total short-term investments $ 98,662 $ 178,631 Long-term investments Corporate debt securities $ 100,690 $ 100,998 U.S. government and government agency debt securities 4,996 3,245 Total long-term investments $ 105,686 $ 104,243 Total cash, cash equivalents and investments $ 450,103 $ 458,831 12twelve months and are classified as available for sale. As of January 31, 2012 and 2013 the cost basis of the Company's cash and cash equivalents approximated their fair values and as a result, no unrealized gains or losses were recorded as of January 31, 2012 and 2013.tabletables summarizes the Company'sour available-for-sale securities'securities’ adjusted cost, gross unrealized gains, gross unrealized losses and fair value by significant investment category as of JanuaryDecember 31, 20122013 and 2013.2014. As of January 31, 2012 Adjusted
Cost Unrealized
Gains Unrealized
Losses Fair
Value As of December 31, 2013 (in thousands) (in thousands) Cash equivalents and marketable securities $ 31,614 $ — $ — $ 31,614 $ 98,437 $ — $ — $ 98,437 30,481 — (1 ) 30,480 101,773 — — 101,773 20,987 1 (5 ) 20,983 155,273 6 (258 ) 155,021 900 — — 900 U.S. government and government agency debt securities 5,700 — (4 ) 5,696 $ 83,982 $ 1 $ (6 ) $ 83,977 $ 361,183 $ 6 $ (262 ) $ 360,927 As of January 31, 2013 Adjusted
Cost Unrealized
Gains Unrealized
Losses Fair
Value As of December 31, 2014 (in thousands) (in thousands) Cash equivalents and marketable securities $ 32,522 $ — $ — $ 32,522 $ 89,113 $ — $ — $ 89,113 24,093 — (1 ) 24,092 54,792 — — 54,792 9,657 — (2 ) 9,655 235,135 6 (444 ) 234,697 U.S. government and government agency debt securities 7,751 — (9 ) 7,742 $ 66,272 $ — $ (3 ) $ 66,269 $ 386,791 $ 6 $ (453 ) $ 386,344 Company'sfollowing tables present available-for-sale investments by contractual maturity date as of December 31, 2013 and 2014. As of December 31, 2013 Fair Value (in thousands) Due in one year or less $ 255,278 $ 255,241 Due after one year through three years 105,905 105,686 Total $ 361,183 $ 360,927 As of December 31, 2014 Fair Value (in thousands) Due in one year or less $ 282,206 $ 282,101 Due after one year through three years 104,585 104,243 Total $ 386,791 $ 386,344 As of December 31, 2013 Twelve Months or Less More than Twelve Months Total Fair
Value Gross Unrealized Losses Fair
Value Gross Unrealized Losses Fair
Value Gross Unrealized Losses (in thousands) Money market funds $ — $ — $ — $ — $ — $ — Commercial paper — — — — — — Corporate debt securities 130,308 (258 ) — — 130,308 (258 ) U.S. government and government agency debt securities 5,697 (4 ) — — 5,697 (4 ) Total $ 136,005 $ (262 ) $ — $ — $ 136,005 $ (262 ) As of December 31, 2014 Twelve Months or Less More than Twelve Months Total Fair
Value Gross Unrealized Losses Fair
Value Gross Unrealized Losses Fair
Value Gross Unrealized Losses (in thousands) Money market funds $ — $ — $ — $ — $ — $ — Commercial paper — — — — — — Corporate debt securities 192,699 (422 ) 12,148 (22 ) 204,847 (444 ) U.S. government and government agency debt securities 5,240 (9 ) — — 5,240 (9 ) Total $ 197,939 $ (431 ) $ 12,148 $ (22 ) $ 210,087 $ (453 ) "A1"“A1” by Standard & Poor'sPoor’s or "P1"“P1” by Moody'sMoody’s or better for short-term investments and rated “A” by Standard & Poor’s or “A2” by Moody’s or better for long-term investments, with the objective of minimizing the potential risk of principal loss. In addition, the investment policy limits the amount of credit exposure to any one issuer.the Company'sour available-for-sale securities as of December 31, 2014 were primarily a result of unfavorable changes in interest rates subsequent to the initial purchase of these securities. As of JanuaryDecember 31, 2013, the Company2014, we owned 22151 securities that were in an unrealized loss position. The Company doesWe do not intend nor expect to need to sell these securities before recovering the associated unrealized losses. It expectsWe expect to recover the full carrying value of these securities. As a result, no portion of the unrealized losses at JanuaryDecember 31, 20132014 is deemed to be other-than-temporary and the unrealized losses are not deemed to be credit losses. No available-for-sale securities have been in an unrealized loss position for 12 months or more. When evaluating the investments for other-than-temporary impairment, the Company reviewswe review factors such as the length of time and extent to which fair value has been below cost basis, the financial condition of the issuer and any changes thereto, and the Company'sour intent to sell, or whether it is more likely than not itwe will be required to sell, the investment beforePandora Media, Inc.Notes to Consolidated Financial Statements (Continued)3. Composition of Certain Financial Statement Captions (Continued)investment'sinvestment’s amortized cost basis. During the fiscal yeartwelve months ended Januarymonths ended December 31, 2013, the Company2014, we did not recognize any impairment charges. Accounts receivable, net consisted of the following: As of January 31, 2012 2013 As of December 31, (in thousands) 2013 2014 (in thousands) Accounts receivable, net $ 67,328 $ 104,171 $ 165,295 $ 219,655 (590 ) (761 ) (1,272 ) (1,218 ) $ 66,738 $ 103,410 Total accounts receivable, net $ 164,023 $ 218,437 Balance at
Beginning of
Fiscal Year Additions Write-offs,
net of
recoveries Balance at
End of
Fiscal Year (in thousands) $ 36 $ 485 $ (18 ) $ 503 503 492 (405 ) 590 590 659 (488 ) 761 Allowance for Doubtful Accounts Balance at Beginning of Period Additions Write-offs, Net of Recoveries Balance at End of Period (in thousands) For the twelve months ended January 31, 2013 $ 590 659 (488 ) $ 761 For the eleven months ended December 31, 2013 $ 761 948 (437 ) $ 1,272 For the twelve months ended December 31, 2014 $ 1,272 1,064 (1,118 ) $ 1,218 Property and equipment consisted of the following: As of January 31, 2012 2013 As of December 31, (in thousands) 2013 2014 $ — $ 1,095 (in thousands) Property and equipment 15,313 19,461 $ 27,361 $ 39,890 Leasehold improvements 11,314 25,893 1,411 1,722 2,248 2,721 234 2,264 13,575 5,075 5,122 6,142 22,080 30,684 Software developed for internal use 2,173 4,519 Total property and equipment $ 56,671 $ 78,098 (6,504 ) (12,926 ) (21,520 ) (35,177 ) $ 15,576 $ 17,758 Total property and equipment, net $ 35,151 $ 42,921 and amortization expenses totaled $1.6$7.1 million, $4.5$9.7 million and $7.1$14.7 million for the yearstwelve months ended January 31, 2011, 20122013, the eleven months ended December 31, 2013 and 2013,the twelve months ended December 31, 2014, respectively. The Company wrote off net assets due to asset retirement totaling $0.3 million for the fiscal year ended January 31, 2012. There were no material write-offs during the fiscal yearstwelve months ended January 31, 2011 and 2013.JanuaryDecember 31, 2013 and 2014 the net carrying amount was $1.0$1.5 million and $2.8 million, including accumulated amortization of $144 thousand.$0.7 million and $1.7 million. Amortization expense for the yeartwelve months ended January 31, 2013, the eleven months ended December 31, 2013 and the twelve months ended December 31, 2014 was $0.1 million, $0.6 million and $1.1 million, respectively. As of December 31, 2013 2014 (in thousands) Other long-term liabilities Long-term deferred rent $ 8,352 $ 15,068 Other 746 1,705 Total other long-term liabilities $ 9,098 $ 16,773 (Continued)3. Composition- ContinuedCertain Financial Statement Captions (Continued)$144 thousand.the lease, tenant improvement reimbursements and rent abatement periods, we recognize rent expense on a straight-line basis over the lease term including expected renewal periods. The Company held no material software developed for internal use assets during the years ended January 31, 2011 or 2012. The Company recordsshort-termand investments and its preferred stock warrant liability at fair value.1—1 — Inputs are unadjusted, quoted prices in active markets for identical assets or liabilities at the measurement date.2—2 — Inputs (other than quoted prices included in Level 1) are either directly or indirectly observable for the asset or liability through correlation with market data at the measurement date and for the duration of the instrument'sinstrument’s anticipated life.3—3 — Inputs lack observable market data to corroborate management'smanagement’s estimate of what market participants would use in pricing the asset or liability at the measurement date. Consideration is given to the risk inherent in the valuation technique and the risk inherent in the inputs to the model.the Company useswe use observable market data and reliesrely on unobservable inputs only when observable market data is not available.Pandora Media, Inc.Notes to Consolidated Financial Statements (Continued)4. Fair Value (Continued)JanuaryDecember 31, 20122013 and 2013:2014: Fair Value Measurement Using Quoted Prices in
Active Markets
for Identical
Instruments
(Level 1) Significant
Other
Observable
Inputs
(Level 2) Total As of December 31, 2013 (in thousands) Fair Value Measurement Using Total (in thousands) Assets $ 31,614 $ — $ 31,614 $ 98,437 $ — $ 98,437 — 30,480 30,480 — 101,773 101,773 — 20,983 20,983 — 155,021 155,021 — 900 900 U.S. government and government agency debt securities — 5,696 5,696 $ 31,614 $ 52,363 $ 83,977 $ 98,437 $ 262,490 $ 360,927 $ 32,522 $ — $ 32,522 — 24,092 24,092 — 9,655 9,655 — — — $ 32,522 $ 33,747 $ 66,269 The Company's As of December 31, 2014 Fair Value Measurement Using Total (in thousands) Assets Money market funds $ 89,113 $ — $ 89,113 Commercial paper — 54,792 54,792 Corporate debt securities — 234,697 234,697 U.S. government and government agency debt securities — 7,742 7,742 Total assets measured at fair value $ 89,113 $ 297,231 $ 386,344 The Company'sOur other cash equivalents and short-term investments are classified as Level 2 within the fair value hierarchy because they are valued using professional pricing sources for identical or comparable instruments, rather than direct observations of quoted prices in active markets. Until their exercise or conversion on June 20, 2011, the Company's preferred stock warrants were classified asAs of December 31, 2013 and 2014, we held no Level 3 withinassets or liabilities. As of December 31, 2013 2014 (in thousands) Other long-term assets Patents, net of amortization $ 7,636 $ 6,939 Long-term security deposits 4,736 4,947 Other 1,343 1,826 Total other long-term assets $ 13,715 $ 13,712 fair value hierarchy because they were valued using unobservable inputsestimated useful life of the patents of eleven years. As of December 31, 2013 and management's judgment due to2014, the absencenet carrying amount of quoted market prices, inherent lackthese patents was $7.6 million and $6.9 million, including accumulated amortization of liquidity$0.4 million and $1.1 million. Amortization expense for the eleven months ended December 31, 2013 and the long-term nature of such financial instruments.table providesis a roll-forwardschedule of the fair valuefuture amortization expense related to patents as of the preferred stock warrants categorized as Level 3 for the year ended JanuaryDecember 31, 2012. During the year ended January 31, 2013 the Company held no level three assets. (in thousands)2014:Balance at January 31, 20111,027Remeasurement of preferred stock warrants4,499Exercise of preferred stock warrants(3,374)Conversion of preferred stock warrants to common stock warrants(2,152)Balance at January 31, 2012$—(Continued)- Continued As of
December 31,
2014 (in thousands) 2015 $ 733 2016 733 2017 733 2018 733 2019 733 Thereafter 3,275 Total future amortization expense $ 6,940 5. Commitments and ContingenciesLeases The Company conducts its operations using leased office facilities in various locations.JanuaryDecember 31, 2013 (in thousands)2014: $ 4,160 As of December 31, 2014 Future Minimum Lease Payments Future Minimum Sublease Income (in thousands) 4,498 $ 11,130 $ 1,216 4,378 11,092 1,246 4,215 10,956 1,277 3,264 10,256 541 2019 8,863 — 318 20,540 — $ 20,833 Total $ 72,837 $ 4,280 The Company leases2018.2024. Rent expenses for the yearstwelve months ended January 31, 2011, 20122013, the eleven months ended December 31, 2013 and 2013the twelve months ended December 31, 2014 were $1.3$3.2 million, $2.5$5.7 million and $3.2$8.6 million, respectively.the Company recognizeswe recognize rent expense on a straight-line basis over the lease term including expected renewal periods. The difference between rent expense and rent payments is recorded as deferred rent in current and long-term liabilities. DeferredAs of December 31, 2013 and 2014 deferred rent totaled $1.3was $9.4 million and $3.6 million as of January 31, 2012 and 2013, respectively.JanuaryDecember 31, 2013, the Company2014, we had a $0.8non-cancelable royalty-related contractual obligation, which is recoupable against future royalty payments in the amount of $5.0 million and a non-cancelable purchaseroyalty-related contractual obligation, related to a branding agreement.Letterswhich is not recoupable against future royalty payments in the amount of Credit and Restricted Cash As of January 31, 2012 and 2013, the Company had $520,000 and $828,000, respectively in letters of credit outstanding that were used to satisfy deposit requirements under facility leases. On December 30, 2011, the Company entered into a cash collateral agreement in connection with the issuance of letters of credit. As of January 31, 2012 and 2013, the $520,000 and $828,000 cash collateral amounts were considered to be restricted cash. The amounts are included in other assets on the Company's balance sheet.Indemnification Agreements, Guarantees and Contingencies In the ordinary course of business, the Company is party to certain contractual agreements under which it may provide indemnifications of varying scope, terms and duration to customers, vendors, lessors, business partners, and other parties with respect to certain matters, including, but not limited to, losses arising out of breach of such agreements, services to be provided by the Company or from intellectual property infringement claims made by third parties. In addition, the Company has entered into indemnification agreements with directors and certain officers and employees that will require thePandora Media, Inc.Notes to Consolidated Financial Statements (Continued)5. Commitments and Contingencies (Continued)Company, among other things, to indemnify them against certain liabilities that may arise by reason of their status or service as directors, officers or employees. Such indemnification provisions are accounted for in accordance with guarantor's accounting and disclosure requirements for guarantees, including indirect guarantees of indebtedness of others. To date, the Company has not incurred, does not anticipate incurring and therefore has not accrued for, any costs related to such indemnification provisions. While the outcome of these matters cannot be predicted with certainty, the Company does not believe that the outcome of any claims under indemnification arrangements will have a material adverse effect on the Company's financial position, results of operations, or cash flows. Pandora hascontinuescontinue to be, a party to privacy and patent infringement litigationvarious legal proceedings, which hashave consumed, and may continue to consume, financial and managerial resources. The Company is also from time to time subject to various other legal proceedings and claims arising in the ordinary course of its business. The Company recordsWe record a liability when it believeswe believe that it is both probable that a loss has been incurred and the amount can be reasonably estimated. CompanyOur management periodically evaluates developments that could affect the amount, if any, of liability that it haswe have previously accrued and makesmake adjustments as appropriate. Determining both the likelihood and the estimated amount of a loss requires significant judgment, and management'smanagement’s judgment may be incorrect. The Company doesWe do not believe the ultimate resolution of any pending legal matters is likely to have a material adverse effect on itsour business, financial position, results of operations or cash flows. In June 2011,putative class action lawsuit was filed against Pandorapetition in the United States District Court forrate court established by the Northern Districtconsent decree between the American Society of California alleging that it unlawfully accessedComposers, Authors and transmitted personally identifiable information of the plaintiffs in connection with their use of the Company's Android mobile application. In addition to civil liability, the amended complaint includes allegations of violations of statutes under which criminal penalties could be imposed if the Company were found liable. Pandora's motion to dismiss the first amended complaint was filed on March 23, 2012. No hearing date is currently set. In September 2011, a putative class action lawsuit was filed against Pandora in the United States District Court for the Northern District of California alleging that it violated Michigan's video rental privacy law and consumer protection statute by allowing Pandora listeners' listening history to be visible to the public. Pandora's motion to dismiss the complaint was granted with leave to amend on September 28, 2013. Plaintiff consented to entry of judgment. Judgment was entered on November 14, 2012Publishers (“ASCAP”) and the plaintiff filed a noticeU.S. Department of appeal on December 14, 2012. In April 2011, Augme Technologies, Inc. filed a complaint in the United States District Court for the District of Delaware against Pandora alleging patent infringement. The complaint sought injunctive relief and monetary damages. The parties negotiated a full and final settlement of the dispute effective March 11, 2013. On September 10, 2012, B.E. Technology, LLC filed suit against Pandora in the United States District Court for the Western District of Tennessee alleging that Pandora infringes a B.E. Technology patent and seeking injunctive relief and monetary damages. Pandora filed its answer on December 31,Pandora Media, Inc.Notes to Consolidated Financial Statements (Continued)5. Commitments and Contingencies (Continued)2012. The court has stayed the action pending its decision on the Company's pending motion to transfer the action to the United States District Court for the Northern District of California. On November 16, 2012, 1st Technology, LLC filed suit against Pandora in the United States District Court for the Northern District of Illinois alleging that Pandora infringes three 1st Technology patents and seeking injunctive relief and monetary damages. The complaint has not been served upon Pandora. On January 15, 2012, Unified Messaging Solutions, LLC filed suit against PandoraJustice in the U.S. District Court for the Southern District of Delaware allegingNew York for the determination of reasonable license fees and terms for the ASCAP consent decree license applicable to the period January 1, 2011 through December 31, 2015. On June 11, 2013 we filed a motion for partial summary judgment seeking a determination that Pandora infringes four UMS patentsas a matter of law the publishers alleged to have withdrawn certain rights of public performance by digital audio transmission from the scope of grant of rights ASCAP could license on behalf of such publishers subsequent to the date of our request for a license from ASCAP were not valid as to our ASCAP consent decree license. On September 17, 2013, our motion for partial summary judgment was granted, alleviating the need to negotiate direct licenses for such purportedly withdrawn performance rights. A trial to determine the royalty rates we will pay ASCAP concluded in February 2014 and seeking injunctive reliefthe court issued its opinion in March 2014. On April 14, 2014, ASCAP, Sony/ATV, EMI Music Publishing, and monetary damages. Pandora's response is currently dueUniversal Publishing Group filed notices of appeal of the District Court’s decision with the Second Circuit Court of Appeals. Oral arguments have been scheduled for March 29, 2013.February 26,June 13, 2013, Macrosolve,Broadcast Music, Inc. (“BMI”) filed suit against Pandoraa petition in the rate court established by the consent decree between BMI and the U.S. Department of Justice in the U.S. District Court for the EasternSouthern District of Texas allegingNew York for the determination of reasonable fees and terms for the BMI consent decree license applicable to the period January 1, 2013 through December 31, 2014. We filed our response on July 19, 2013. On November 1, 2013, we filed a motion for partial summary judgment seeking a determination that as a matter of law the publishers alleged to have withdrawn certain rights of public performance by digital audio transmission from the scope of grant of rights BMI could license on behalf of such publishers subsequent to the date of our request for a license from BMI were not valid as to our BMI consent decree license. On December 18, 2013, our motion for summary judgment was denied based on the Court’s determination that an attempted partial withdrawal, although inconsistent with BMI’s obligations under its consent decree, would result in a publisher’s complete withdrawal from BMI. This rate proceeding commenced on February 10, 2015.infringesowes royalties for the public performance of sound recordings recorded prior to February 15, 1972.Macrosolve, Inc. patent and seeks injunctive relief and monetary damages. Pandora's responsemotion to strike Plaintiffs’ complaint in the Flo & Eddie case pursuant to California’s Anti-Strategic Lawsuit Against Public Participation (“Anti-SLAPP”) statute. This motion is currently due March 27, 2013. The Company currently believes that it has substantial and meritorious defenses topending before the claims in the lawsuits discussed above and intends to vigorously defend its position.the Company'sour current knowledge it believeswe believe that the final outcome of the matters discussed above will not likely, individually or in the aggregate, have a material adverse effect on itsour business, financial position, results of operations or cash flows; however, in light of the uncertainties involved in such matters, there can be no assurance that the outcome of each case or the costs of litigation, regardless of outcome, will not have a material adverse effect on our business. In particular, rate court proceedings could take years to complete, could be very costly and may result in royalty rates that are materially less favorable than rates we currently pay.Company's business.6.7.Provision for Income Taxes Twelve months ended
January 31, Eleven months ended
December 31, Twelve months ended
December 31, 2013 2013 2014 (in thousands) Jurisdiction Domestic $ (39,891 ) $ (24,005 ) $ (24,230 ) Foreign 1,748 (2,918 ) (5,592 ) Loss before provision for income taxes $ (38,143 ) $ (26,923 ) $ (29,822 ) tax expensetaxes consists of the following: Fiscal Year Ended January 31, 2011 2012 2013 (in thousands) $ — $ — $ — 134 75 (4 ) — — 9 134 75 5 $ 244 $ (403 ) $ (10,098 ) 1,203 (1,457 ) (1,573 ) (1,447 ) 1,860 11,671 — — — $ 134 $ 75 $ 5 The income tax provision decreased by $70,000 from $75,000 to $5,000 as a result of changes in state tax statutes which resulted in lower tax obligations in some states.(Continued)6. Income Taxes (Continued) Twelve months ended
January 31, Eleven months ended
December 31, Twelve months ended
December 31, 2013 2013 2014 (in thousands) Current Federal $ — $ — $ — State and local (4 ) 7 353 International 9 87 231 Total current income tax expense $ 5 $ 94 $ 584 Deferred Federal (10,098 ) (10,166 ) (9,996 ) State and local (1,573 ) (2,027 ) (6,238 ) Valuation allowance 11,671 12,193 16,234 Total deferred income tax expense $ — $ — $ — Total provision for income taxes $ 5 $ 94 $ 584 the Company'sour effective tax rate for the periods presented.rate: Fiscal Year Ended
January 31, 2011 2012 2013 Twelve months ended
January 31, Eleven months ended
December 31, Twelve months ended
December 31, (in thousands) 2013 2013 2014 34 % 34 % 34 % 34 % 34 % 34 % 15 — — — — (1 ) (55 ) (24 ) (2 ) (2 ) 5 4 — — (2 ) (2 ) (4 ) (7 ) 7 2 2 Federal and state credits, net of reserve 2 8 11 86 (16 ) (30 ) (30 ) (46 ) (55 ) (93 ) 1 (2 ) (2 ) — 6 (2 ) 3 — Deferred adjustments — 3 6 (8 )% 0 % 0 % — % — % (2 )% were as follows:consist of the following: As of January 31, 2012 2013 As of December 31, (in thousands) 2013 2014 (in thousands) Deferred tax assets $ 31,314 $ 36,056 $ 34,525 $ 27,487 1,881 3,027 5,745 10,839 1,960 3,371 7,037 13,832 859 4,313 10,159 24,215 297 257 323 255 36,311 47,024 $ 57,789 $ 76,628 Deferred tax liabilities (2,427 ) (1,469 ) (41 ) (2,645 ) (2,427 ) (1,469 ) $ (41 ) $ (2,645 ) (33,884 ) (45,555 ) (57,748 ) (73,983 ) $ — $ — $ — $ — JanuaryDecember 31, 2013, the Company2014, we had federal net operating loss carryforwards of approximately $180.8$447.0 million and tax credit carryforwards of approximately $2.5$7.9 million. If realized, $92.0approximately $378.0 million of the net operating loss carryforwards will be recognized as a benefit through additional paid in capital. The federal net operating losses and tax credits expire in years beginning in 2021. At JanuaryDecember 31, 2013, the Company2014, we had state net operating loss carryforwards of approximately $203.8$496.0 million which expire in years beginning in 2014.2015. In addition, the Companywe had state tax credit carryforwards of approximately $4.3$8.3 million that do not expire.Pandora Media, Inc.Notes to Consolidated Financial Statements (Continued)6. Income Taxes (Continued)the Company'sour net operating loss and tax credit carryforwards may be subject to annual limitations due to ownership changes. Such annual limitations could result in the expiration of the Company'sour net operating loss and tax credit carryforwards before they are utilized.fiscal yeartwelve months ended JanuaryDecember 31, 2013 the Company's2014, our valuation allowance increased by approximately $11.7$16.2 million. At JanuaryDecember 31, 20122013 and 2013, the Company2014, we maintained a full valuation allowance on itsour net deferred tax assets. The valuation allowance was determined in accordance with the provisions of ASCAccounting Standards Codification 740 Accounting for - Income Taxes, which requires an assessment of both positive and negative evidence when determining whether it is more likely than not that deferred tax assets are recoverable. Such assessment is required on a jurisdiction by jurisdiction basis. The Company'sOur history of cumulative losses, along with expected future U.S. losses required that a full valuation allowance be recorded against all net deferred tax assets. The Company intendsWe intend to maintain a full valuation allowance on net deferred tax assets until sufficient positive evidence exists to support reversal of the valuation allowance.JanuaryDecember 31, 2013 and 2014 we have unrecognized tax benefits of approximately $2.6$5.2 million and $5.8 million. The increase in our unrecognized tax benefits was primarily attributable to current year activities. A reconciliation of the beginning and ending amounts of unrecognized tax benefits (excluding interest and penalties) is as follows: Eleven months ended
December 31, Twelve months ended
December 31, 2013 2014 (in thousands) Beginning balance $ 2,633 $ 5,220 Increases related to tax positions taken during a prior year 108 1,161 Decreases related to tax positions taken during a prior year — (1,924 ) Increases related to tax positions taken during the current year 2,479 1,336 Ending balance $ 5,220 $ 5,793 the Company'sour effective tax rate as the tax benefit would increase a deferred tax asset, which is currently offset with a full valuation allowance. The Company doesWe do not anticipate that the amount of existing unrecognized tax benefitbenefits will significantly increase or decrease within the next 12twelve months. Accrued interest and penalties related to unrecognized tax benefits are recorded asin the provision for income tax expenses. The Companytaxes. We did not recognize anyhave such interest, penalties or tax benefits during the fiscal yeartwelve months ended January 31, 2013. The Company files2013, the eleven months ended December 31, 2013 or the twelve months ended December 31, 2014.20122014 remain subject to examination for U.S. federal, state and international purposes. All net operating losses and tax credits generated to date are subject to adjustment for U.S. federal and state purposes. The Company isWe are not currently under examination in any federal, state or international jurisdictions.7. 8.Debt Instruments On13, 2011, the Companywe entered into a $30$30.0 million credit facility with a syndicate of financial institutions. The amount of borrowings available under the credit facility at any time is based on the Company's monthly accounts receivable balance at such time, and the amounts borrowed are collateralized by the Company's personal property (including such accounts receivable but excluding intellectual property). At theour option, of the Company, drawn amounts under the credit facility will bearbore an interest rate of either (i) an adjusted London Interbank offered,Offered Rate, or LIBO, rateLIBOR, plus (A)2.75% - 3.00% (if the debt outstanding is greater than or equal to $15 million) or (B) 2.75% (if the debt outstanding is less than $15 million) or (ii) an alternate base rate plus (x)1.75% - 2.00% (if the debt, both of which were per annum rates based on outstanding borrowings. Adjusted LIBOR is greater than or equal to $15 million) or (y) 1.75% (if the debt outstanding is less than $15 million). The adjusted LIBO rate is the LIBO rateLIBOR for a particular interest period multiplied by the statutory reserve rate. The alternate base rate is the greatest of the prime rate, the federal funds effective rate plus 0.5% and the adjusted LIBO rateLIBOR plus 1%. In addition, the Company payscredit facility included a non-usage charge on theTable available balance of ContentsPandora Media, Inc.Notes to Consolidated Financial Statements (Continued)7. Debt Instruments (Continued)available balance. The non-usage charge is 0.5% if the debt- 0.625% per annum based on outstanding is greater than or equal to $15 million and 0.625% if the debt outstanding is less than $15 million.borrowings. Under the credit facility, we could request the Company can requestissuance of up to $5$5.0 million in letters of credit be issued by the financial institutions. The annual charge for any outstanding letters of credit iswas 2.75% (if- 3.00% per annum based on outstanding borrowings.debt/aggregate commitment amount from $30.0 million to $60.0 million and extended the maturity date from May 12, 2015 to September 12, 2018. The amendment further decreased the interest rate on borrowings by 0.75% to either LIBOR plus 2.00% - 2.25% or an alternate base rate plus 1.00% - 1.25%, both of which are per annum rates based on outstanding borrowings. In addition, the amendment decreased the non-usage fee to 0.375% per annum. The amount of available letters of credit under the amended credit facility was increased from $5.0 million to $15.0 million, and the annual charge for outstanding is less than $15 million) or 3.00% (if the debt/letters of credit was reduced by 0.75% to 2.00% - 2.25% per annum based on outstanding borrowings.greater than or equal to $15 million).the Company'sour ability to dispose of assets, make acquisitions, incur debt, incur liens and make distributions to stockholders. The credit facility also includes a financial covenant requiring the maintenance of minimum liquidity of at least $5$5.0 million. During the continuance of an event of a default, the lenders may accelerate amounts outstanding, terminate the credit facility and foreclose on all collateral. On December 30, 2011,Companyoriginal credit facility, we had entered into a cash collateral agreement in connection with the issuance of letters of credit whichthat were used to satisfy deposit requirements under facility leases. Under the amended credit facility, the cash collateral agreement was terminated and, as a result, letters of credit no longer require cash collateral. In connection with the termination of the cash collateral agreement, all cash collateral that was considered restricted cash was returned to us in September 2013.JanuaryDecember 31, 2012, the Company2013 and 2014, we had $520,000no outstanding borrowings, $1.1 million in letters of credit outstanding and had $29.48$58.9 million of available borrowing capacity under the credit facility. As of January 31, 2013, the Company had $828,000 in letters of credit outstanding and had $29.17 million of available borrowing capacity under the credit facility. As of January 31, 2012 and 2013, respectively, the $520,000 and $828,000 cash collateral were considered to be restricted cash. The amounts are included in other assets on the Company's balance sheets.are beingwere amortized as interest expense over the four-year term of the May 2011 credit facility agreement. As part of the amendment, the amortization period for the remaining unamortized costs incurred in connection with the May 2011 credit facility was adjusted to reflect the amended term of the credit facility. We further incurred $0.5 million in debt issuance costs in connection with the amendment, which are being amortized over the term of the amended credit facility. For the fiscal yearstwelve months ended January 31, 2011, 20122013, the eleven months ended December 31, 2013 and 2013, $0the twelve months ended December 31, 2014, $0.3 million, $0.2 million and $0.3$0.2 million respectively of debt issuance costs, respectively, were amortized and included in interest expense.8. 9.Stock-based Compensation Plans and AwardsFebruary 2000, theour board of directors of the Company adopted the 2000 Stock Incentive Plan, as amended (the "2000 Plan"). In March 2004, theour board of directors of the Company adopted the 2004 Stock Option Plan (the "2004 Plan"), which replaced the 2000 Plan and provided for the issuance of incentive and non-statutory stock options to employees and other service providers of the Company.May 2011, theour board of directors of the Company adopted the Pandora Media, Inc. 2011 Equity Incentive Plan (the "2011 Plan" and, together with the 2000 Plan and the 2004 Plan, the "Plans"). The 2011 Plan was the successor to, which replaced the 2004 Plan and was available for grants starting on June 14, 2011. Plan. The Plans are administered by the compensation committee of our board of directors (the "Plan Administrator").(a) 12,000,000 shares of common stock reserved for issuance under the 2011 Plan as of June 14, 2011 plus (b)and 1,506,424 shares of common stock previously reserved but unissued under the 2004 Plan as of June 14, 2011 that are now available for issuance under the 2011 Plan.2011. To the extent awards outstanding as of June 14, 2011 under the 2004 Plan expire or terminate for any reason prior to exercise or would otherwise return to the share reserve under the 2004 Plan, the shares of commonPandora Media, Inc.Notes to Consolidated Financial Statements (Continued)8. Stock-based Compensation Plans and Awards (Continued)fiscal year, (beginning with the fiscal year that commenced February 1, 2012 and ending with the fiscal year commencing February 1, 2021), the number of shares in the reserve under the Plan may be increased by the lesser of (x) 10,000,000 shares, (y) 4.0% of the outstanding shares of common stock on the last day of the prior fiscal year or (z) another amount determined by the Company'sour board of directors. For the fiscal year beginning February 1, 2012, 4.0% of the outstanding shares of common stock as of January 31, 2012 were added to the number of shares in the reserve. The 2011 Plan is scheduled to terminate in 2021, unless theour board of directors determines otherwise. Plans are administered by the compensation committee of the board of directors (the "Plan Administrator") of the Company., and payment terms. For stock option grants the exercise price is determined by the Plan Administrator, but generally may not be less than 100% of the fair market value of the common stock subject to the option on the date of grant. Certain Shares Available for Grant Equity Awards ESPP Total Balance as of December 31, 2013 9,048,200 — 9,048,200 Additional shares authorized 7,815,837 4,000,000 11,815,837 Options granted (349,500 ) — (349,500 ) Restricted stock granted (4,909,360 ) — (4,909,360 ) ESPP shares issued — (142,265 ) (142,265 ) Options forfeited 1,639,935 — 1,639,935 Restricted stock forfeited 1,081,348 — 1,081,348 Balance as of December 31, 2014 14,326,460 3,857,735 18,184,195 Company's options granted priorlower of the fair market value of our common stock on the first trading day of the offering period or on the last day of the offering period.IPO providedESPP is recognized on a straight-line basis over the right to exercise those options before they are vested. The Company has a right to repurchase any unvested shares at a repurchase price equal to the exercise price during the 90-dayoffering period, following the terminationnet of an individual's service with the Company for any reason.Valuation of Awardseach stock option wasshares to be granted under the ESPP is determined on the datefirst day of grantthe offering period using the Black-Scholes option pricing model using the following assumptions: Fiscal Year Ended January 31, 2011 2012 2013 5.91 - 6.09 5.72 - 7.02 6.02 - 6.67 1.41% - 2.92% 1.10% - 2.77% 0.99% - 1.52% 57% - 58% 54% - 57% 56% - 57% 0% 0% 0% Twelve months ended
December 31,2014 Expected life (in years) 0.5 Risk-free interest rate 0.06 % Expected volatility 42 % Expected dividend yield 0 % Options Outstanding Outstanding
Stock Options Weighted-Average Exercise Price Weighted-Average Remaining Contractual Term (in years) Aggregate Intrinsic Value (1) (in thousands, except share and per share data) Balance as of December 31, 2013 22,708,200 $ 4.85 5.76 $ 493,866 Granted 349,500 35.61 Exercised (10,437,509 ) 1.62 Forfeited (1,639,935 ) 11.49 Balance as of December 31, 2014 10,980,256 7.91 1.08 120,033 Exercisable as of December 31, 2014 7,958,775 4.39 0.40 108,296 Expected to vest as of December 31, 2014 (2) 2,719,853 $ 17.05 2.82 $ 10,822 (1)Amounts represent the difference between the exercise price and the fair value of common stock at each period end for all in the money options outstanding based on the fair value per share of common stock of $26.60 and $17.83 as of December 31, 2013 and 2014. (2)Options expected to vest reflect an estimated forfeiture rate. Twelve months ended
January 31, Eleven months ended
December 31, Twelve months ended
December 31, 2013 2013 2014 Expected life (in years) 6.02 - 6.67 5.99 - 6.32 6.08 Risk-free interest rate 0.99% - 1.52% 1.00% - 2.04% 1.71% - 1.93% Expected volatility 56% - 57% 58% - 59% 58% - 59% Expected dividend yield 0 % 0 % 0 % The CompanyWe determined the expected term assumption based on the Company'sour historical exercise behavior combined with estimates of the post-vesting holding period. Expected volatility is based on historical volatility of peer companies in the Company'sour industry that have similar vesting and contractual terms. The risk free interest rate is based on the implied yield currently available on U.S. Treasury issues with terms approximately equal to the expected life of the option. The CompanyWe currently hashave no history or expectation of paying cash dividends on itsour common stock. Number of RSUs Weighted-Average Grant Date Fair Value Unvested as of December 31, 2013 10,365,512 $ 14.31 Granted 4,909,360 32.29 Vested (3,169,456 ) 13.85 Forfeited (1,081,348 ) 19.06 Unvested as of December 31, 2014 11,024,068 21.99 Expected to vest as of December 31, 2014 (1) 9,914,453 $ 21.88 (1) RSUs expected to vest reflect an estimated forfeiture rate. Twelve months ended
January 31, Eleven months ended
December 31, Twelve months ended
December 31, 2013 2013 2014 (in thousands) Stock-based compensation expense $ 1,214 $ 1,946 $ 4,414 Product development 4,530 8,802 17,546 Sales and marketing 12,294 20,222 42,165 General and administrative 7,462 9,071 22,930 Total stock-based compensation expense $ 25,500 $ 40,041 $ 87,055 theour board of directors, of the Company, whenever funds are legally available. These rights are subordinatedividend rightsexercise by the underwriters of holders of all classes of stock outstanding at the time.Pandora Media, Inc.Notes to Consolidated Financial Statements (Continued)8. Stock-based Compensation Plans and Awards (Continued) Early Exercise Liability. In connection with the early exercise of stock options, the Company has the right, but not the obligation, to repurchase unvested shares of common stock upon termination of the individual's service to the Company at the original purchase price per share. During the fiscal years ended January 31, 2012 and 2013 there were no early exercises. During the fiscal year ended January 31, 2011, employees early exercised a total of 691,667 shares of common stock subject to these terms. As of January 31, 2012 and 2013, 483,334, and 308,334 unvested restricted shares, respectively, of common stock were subject to repurchase. Repurchase rights with respect to the restricted shares outstanding as of January 31, 2013 will expire ratably between February 1, 2011 and January 31, 2015. Stock Options. Stock option activity during the year ended January 31, 2013 was as follows: Options Outstanding Shares Available
for Grant Outstanding
Stock Options Weighted-
Average
Exercise
Price Weighted-
Average
Remaining
Contractual
Term
(in years) Aggregate(1)
Intrinsic Value (in thousands, except share and per share data) 10,259,069 34,810,926 $ 2.43 7.04 $ 379,355 11,717,956 (1,450,000 ) 1,450,000 10.65 (4,484,846 ) — (8,408,842 ) 0.82 1,749,135 (1,749,135 ) 5.25 17,791,314 26,102,949 $ 3.22 6.40 $ 224,736 17,434,514 $ 1.48 5.58 $ 178,135 25,432,481 $ 3.07 6.34 $ 222,779 (1)Amounts represent the difference between the exercise price and the fair value of common stock at each period end for all in the money options outstanding based on the fair value per share of common stock of $3.14, $13.19 and $11.52 as of January 31, 2011, 2012 and 2013, respectively.(2)Options expected to vest reflect an estimated forfeiture rate. As of January 31, 2013, there was $31.0 million of unrecognized compensation cost related to outstanding employee stock options. This amount is expected to be recognized over a weighted-average period of 2.4 years. To the extent the actual forfeiture rate is different from what we have estimated, stock-based compensation related to these awards will be different from our expectations. Options to Non-Employees. The per-share fair value of stock options granted to non-employees is determined on the date of grant using the Black-Scholes option pricing model with the same assumptions as those used for employee awards with the exception of expected term. The expected term for non-employee awards is the contractual term of 10 years.Pandora Media, Inc.Notes to Consolidated Financial Statements (Continued)8. Stock-based Compensation Plans and Awards (Continued) As of January 31, 2011, 2012 and 2013, respectively, a total of 431,359, 59,375 and 52,000 common stock options, issued to non-employees were vested and outstanding. During the years ended January 31, 2011, 2012 and 2013, the Company recorded $15,500, $0.3 million and $0.2 million, respectively, in stock-based compensation expenses related to stock option grants made to non-employees. As of January 31, 2013, total compensation cost related to stock options granted to non-employees but not yet recognized, was $0.4 million which the Company expects to recognize over a weighted-average period of 1.8 years. The fair value of these options will be remeasured on each vesting date and as of each reporting date until the options vest. The remeasured fair value will be recognized as compensation expense over the remaining vesting term of the options.Option Granted to Related Party During January of 2011, the Company entered into a consulting arrangement with a spouse of one of the Company's executive officers, pursuant to which the consultant will provide consulting services to the Company for a period of four years. Pursuant to this arrangement, the Company granted the consultant options to purchase 40,000 shares of its common stock at $3.14 per share, to vest over four years at a rate of1/48th per month. Using the Black-Scholes option pricing model, the initial grant date fair value of these options was determined to be $60,000. During the fiscal year ended January 31, 2013 the executive officer terminated her employment with the Company; her spouse continues to provide consulting services. For the fiscal year ended January 31, 2013, $0.1 million compensation cost has been recognized related to these options due to the remeasured fair value at the reporting date.Stock Option Awards with Both a Service Period and a Market Condition On March 22, 2012, Mr. Joseph Kennedy, the Company's Chief Executive Officer, was granted a non-statutory stock option to purchase 800,000additional shares, of common stock. This option grant to Mr. Kennedy was intended to be in lieu of an annual equity grant for fiscal 2014. This option includes bothat a service period and a market vesting condition. The stock option will vest if the 60-day trailing volume weighted averagepublic offering price of $25.00 per share. In addition, another 5,200,000 shares were sold by certain selling stockholders. We received aggregate net proceeds of $378.7 million, after deducting underwriting discounts and commissions and offering expenses from sales of our shares in the Company's common stock exceeds $21.00 per share, or if there is a saleoffering. We did not receive any of the Company for at least $21.00 per share, in each case prior to July 6, 2017. If the market condition is met, the performance option will vest ratably over four years, beginning on July 6, 2013, subject to severance and change of control acceleration. To the extent that the market condition is not met, the option will not vest and will be cancelled. The Company used a binomial model to value the option with a market condition. The Company used Monte Carlo simulation techniques that incorporate assumptions as provided by management for the term of option from grant date (in years), risk-free interest rate, stock price volatility and beginning stock price. The Company does not adjust compensation cost recognition for subsequent changes in the expected outcome of the market-vesting conditions. The following assumptions were used to value the grant using the Monte-Carlo simulation option pricing model: 10-year term, risk-free interest rate of 2.33%, expected volatility of 70% and a beginning stock price of $10.63. The grant-date fair value for the option was $6.08 per share. As of January 31, 2013, the remaining unrecognized compensation expense of approximately $3.6 million related to this grant is expected to be recognized over a period of 4.43 years.Pandora Media, Inc.Notes to Consolidated Financial Statements (Continued)8. Stock-based Compensation Plans and Awards (Continued)Modification of Award During the year ended January 31 2012, the Company revised its employment policies for certain eligible officers, resulting in a modification of approximately 3.6 million stock options held by these employees. As a result, upon an involuntary termination, any unvested options or other stock awards scheduled to vest within a defined time frame would be accelerated. The modification of these stock options resulted in approximately $0 and $2.3 million incremental stock-based compensation expense for the years ended January 31, 2012 and January 31, 2013 respectively.Restricted Stock Units During the fiscal year ended January 31, 2013, Pandora granted 4,864,000 restricted stock units ("RSUs"), respectively, under the 2011 Plan at a weighted average fair value of $10.37 per share. The fair value of the restricted stock units is expensed ratably over the vesting period. RSUs vest annually on a cliff basis over the service period, generally four years. The Company recorded stock-based compensation expense related to restricted stock units of approximately $10.4 million during the fiscal year ended January 31, 2013. As of January 31, 2013, total compensation cost not yet recognized of approximately $51.7 million related to non-vested restricted stock units, is expected to be recognized over a weighted average period of 3.30 years. The following table summarizes the activities for our RSUs for the year ended January 31, 2013: Number of
Shares Weighted-
Average
Grant-Date
Fair Value 1,426,975 $ 12.03 4,864,000 10.37 (400,112 ) 12.20 (379,154 ) 11.77 5,511,709 $ 10.57 5,002,948 $ 10.59 (1)Options expected to vest reflect an estimated forfeiture rate.Stock-based Compensation Expenses The weighted-average fair value of stock option grants made during the fiscal years ended January 31, 2011, 2012 and 2013 was $1.17, $4.83 and $5.91 per share, respectively. As of January 31, 2013, total compensation cost related to stock options granted, but not yet recognized, was $31.35 million which the Company expects to recognize over a weighted-average period of approximately 2.4 years. The total grant date fair value of stock options vested during fiscal years ended January 31, 2011, 2012 and 2013 was not material, $5.0 million and $13.0 million, respectively. The aggregate intrinsic value of options and warrants exercised during the years ended January 31, 2011, 2012 and 2013 was $5.8 million, $51.9 million, $84.9 million, respectively. The total fair value ofPandora Media, Inc.Notes to Consolidated Financial Statements (Continued)8. Stock-based Compensation Plans and Awards (Continued)options vested during the years ended January 31, 2011, 2012 and 2013 was $909,000, $5.2 million and $13.1 million, respectively. Stock-based compensation expenses related to all employee and non-employee stock-based awards for fiscal 2011, 2012 and 2013 was as follows: Fiscal Year Ended January 31, 2011 2012 2013 (in thousands) $ 85 $ 582 $ 1,214 329 1,638 4,530 549 4,866 12,294 492 2,101 7,462 $ 1,455 $ 9,187 $ 25,500 9. Redeemable Convertible Preferred StockRedeemable Convertible Series G Preferred Stock During the fiscal year ended January 31, 2011, the Company issued 8,129,338 shares of redeemable convertible Series G preferred stock ("Series G") for approximately $22.2 million in cash, net of issuance costs of approximately $44,000. Redeemable convertible preferred stock was as follows as of the closing date of the Company's IPO: Shares
Authorized Shares Issued
and
Outstanding Carrying Value Aggregate
Liquidation
Preference Accumulated
Dividends Cumulative
Aggregate
Liquidation
Preference (in thousands, except share data) 375,000 375,000 $ 1,500 $ 1,500 $ — $ 1,500 24,859,899 24,859,899 14,777 9,362 5,356 14,718 24,060,786 23,884,315 17,561 12,181 5,398 17,579 21,878,271 21,812,963 35,601 25,050 9,961 35,011 8,639,737 8,639,737 18,257 14,694 2,849 17,543 45,988,020 45,833,082 40,131 35,498 5,509 41,007 8,250,000 8,129,338 24,145 22,250 1,932 24,182 134,051,713 133,534,334 $ 151,972 $ 120,535 $ 31,005 $ 151,540 During the period from February 1, 2011 through the closing date of the Company's IPO, the Company accrued dividends of $3.6 million on its redeemable convertible preferred stock. Upon the closing of the IPO on June 20, 2011, all outstanding redeemable convertible preferred stock was converted into shares of common stock at the contractual conversion ratios per the relevant redeemable preferred stock purchase agreements. Subsequent to the Company's IPO, there are no further convertible preferred share dividends as all outstanding convertible preferred stock has been converted. On the closing date of the IPO the Company paid $30.6 million in dividends to the holders of redeemable convertible preferred stock.Pandora Media, Inc.Notes to Consolidated Financial Statements (Continued)9. Redeemable Convertible Preferred Stock (Continued)Accretion of Redeemable Convertible Preferred Stock Stock issuance costs were being accreted via a charge to accumulated deficit over the periodproceeds from the datesales of issuance ofshares by the redeemable convertible preferred stock to the date at which the redeemable convertible preferred stock became redeemable at the option of the holders of the redeemable convertible preferred stock, the date of the Company's IPO.10. selling stockholders.Perper Share attributable to common stockholders by the weighted-average number of shares of common stock outstanding during the period.convertible preferredand restricted stock warrants and redeemable convertible preferred stock,units, to the extent dilutive. Basic and diluted net loss per share waswere the same for each year presentedthe twelve months ended January 31, 2013, the eleven months ended December 31, 2013 and the twelve months ended December 31, 2014, as the inclusion of all potential common shares outstanding would have been anti-dilutive.share.share: Fiscal Year Ended January 31, 2011 2012 2013 (in thousands) $ (1,764 ) $ (16,107 ) $ (38,148 ) (300 ) (110 ) — (8,978 ) (3,648 ) — $ (11,042 ) $ (19,865 ) $ (38,148 ) Twelve months ended
January 31, Eleven months ended
December 31, Twelve months ended
December 31, 2013 2013 2014 (in thousands except per share amounts) Numerator Net loss $ (38,148 ) $ (27,017 ) $ (30,406 ) Denominator Weighted-average common shares outstanding used in computing basic and diluted net loss per share 168,294 180,968 205,273 Net loss per share, basic and diluted $ (0.23 ) $ (0.15 ) $ (0.15 ) Fiscal Year Ended January 31, 2011 2012 2013 (in thousands) 10,761 105,955 168,294 $ (1.03 ) $ (0.19 ) $ (0.23 ) Net loss is increased by the cumulative dividends payable upon conversion or liquidation of redeemable convertible preferred shares earned each year to arrive at net loss attributable to common stockholders. The reversal of dividends on redeemable convertible preferred stock recorded on the statement of redeemable convertible preferred stock and shareholders' deficit for the fiscal year ended January 31, 2011 reflects the reversal of previously recorded accretion of the redemption value of the redeemable convertible preferred stock in connection with the issuance of Series G and the reversal of previously recorded incremental dividends recorded for the portion of the cumulative dividends for which the Company did not have sufficient authorized shares of common stock as of January 31, 2010 while the(Continued)10. Net Loss Per Share (Continued)amount of dividends reflected in the net loss per share calculation above represents the total increase in cumulative dividends during the fiscal year ended January 31, 2011. Net loss was increased by the cumulative dividends payable upon conversion or liquidation of redeemable convertible preferred shares earned during the period to arrive at net loss attributable to common stockholders for the fiscal year ended January 31, 2011. For the fiscal year ended January 31, 2012 dividends were accrued up through the conversion at the close of the IPO. As of January 31, 2011 2012 2013 As of January 31, 2013 As of December 31, 2013 As of December 31, 2014 (in thousands) (in thousands) 33,408 34,811 26,103 26,103 22,708 10,980 403 — — — 155 — — 1,427 5,512 5,512 10,366 11,024 137,295 — — 171,106 36,393 31,615 31,615 33,074 22,004 Three months ended Two months ended Three months ended Three Months Ended April 30, July 31, October 31, December 31, March 31, June 30, September 30, December 31, April 30,
2011 July 31,
2011 Oct 31,
2011 Jan 31,
2012 April 30,
2012 July 31,
2012 Oct 31,
2012 Jan 31,
2013 2013 2013 2013 2013 (1) 2014 2014 2014 2014 (in thousands, except per share data) (in thousands, except per share data) $ 51,040 $ 66,966 $ 75,008 $ 81,326 $ 80,784 $ 101,267 $ 120,005 $ 125,089 $ 125,510 $ 157,355 $ 180,376 $ 136,992 $ 194,315 $ 218,894 $ 239,593 $ 268,000 Cost of revenue 29,158 33,723 37,658 48,169 55,818 60,522 65,713 76,695 82,853 81,880 86,989 63,144 108,275 111,461 111,315 115,326 4,360 5,460 6,260 6,679 6,917 7,514 8,338 9,250 9,845 11,141 12,532 8,699 14,979 13,989 15,453 17,206 Total cost of revenue 92,698 93,021 99,521 71,843 123,254 125,450 126,768 132,532 Gross profit 32,812 64,334 80,855 65,149 71,061 93,444 112,825 135,468 Operating expenses 2,731 3,426 3,685 3,583 4,119 4,475 4,371 5,153 7,312 8,301 9,244 6,437 11,831 13,076 13,381 14,865 12,964 14,502 16,628 20,916 23,460 23,457 26,714 34,084 Sales and marketing 40,075 45,606 50,285 33,039 61,864 66,232 72,320 76,914 6,943 8,410 10,021 10,054 10,612 10,602 12,700 14,333 13,872 18,061 22,823 14,544 26,361 25,865 29,143 31,074 56,156 65,521 74,252 89,401 100,926 106,570 117,836 139,515 Total operating expenses 61,259 71,968 82,352 54,020 100,056 105,173 114,844 122,853 (5,116 ) 1,455 756 (8,075 ) (20,142 ) (5,303 ) 2,169 (14,426 ) (28,447 ) (7,634 ) (1,497 ) 11,129 (28,995 ) (11,729 ) (2,019 ) 12,615 $ (9,144 ) $ (3,180 ) $ 638 $ (8,179 ) $ (20,228 ) $ (5,415 ) $ 2,052 $ (14,557 ) (28,587 ) (7,787 ) (1,700 ) 11,057 (28,931 ) (11,728 ) (2,025 ) 12,278 $ (0.61 ) $ (0.04 ) $ 0.00 $ (0.05 ) $ (0.12 ) $ (0.03 ) $ 0.01 $ (0.09 ) Net income (loss) per share, basic (0.16 ) (0.04 ) (0.01 ) 0.06 (0.14 ) (0.06 ) (0.01 ) 0.06 Net income (loss) per share, diluted $ (0.16 ) $ (0.04 ) $ (0.01 ) $ 0.05 $ (0.14 ) $ (0.06 ) $ (0.01 ) $ 0.06 (1) We changed our fiscal year from the twelve months ending January 31 to the calendar twelve months ending December 31, effective beginning with the year ended December 31, 2013. Therefore, for financial reporting purposes our fourth quarter of the prior fiscal year was shortened from the three months ended January 31 to the two months ended December 31. (1) We changed our fiscal year from the twelve months ending January 31 to the calendar twelve months ending December 31, effective beginning with the year ended December 31, 2013. Therefore, for financial reporting purposes our fourth quarter of the prior fiscal year was shortened from the three months ended January 31 to the two months ended December 31. its judgment in evaluating the cost-benefit relationship of possible disclosure controls and procedures. Based on their evaluation at the end of the period covered by this Annual Report on Form 10-K, our chief executive officer and chief financial officer have concluded that our disclosure controls and procedures were effective at the reasonable assurance level as of JanuaryDecember 31, 2013. Annual Report on Internal Control Over Financial ReportingJanuaryDecember 31, 2013.2014. In making this assessment, our management used the criteria set forth by the Committee of Sponsoring Organizations of the Treadway Commission ("COSO") in Internal Control—Integrated Framework.Control-Integrated Framework (2013 framework). Based on this evaluation, our management has concluded that our internal control over financial reporting was effective as of JanuaryDecember 31, 2013.JanuaryDecember 31, 20132014 has been audited by Ernst & Young LLP, an independent registered public accounting firm, as stated in their report which is included in this Annual Report on Form 10-K.fiscal quarterannual period that has materially affected, or is reasonably likely to materially affect, our internal control over financial reporting. None.Item20132015 annual meeting of stockholders (the "Proxy Statement") entitled "Election of Class IIIII Directors" and "Management."ItemItemItemGovernance—DirectorGovernance-Director Independence."ItemItemReportReports of Independent Registered Public Accounting Firm as of January 31, 2012 and 2013 for the fiscal years ended January 31, 2011, 2012, and 2013 for the fiscal years ended January 31, 2011, 2012, and 2013Redeemable Convertible Preferred Stock and Stockholders' Equity (Deficit) for the fiscal years ended January 31, 2011, 2012, and 2013 for the fiscal years ended January 31, 2011, 2012, and 2013Schedule3.Exhibits The documents set forth below are filed herewith or incorporated by reference to the location indicated. Incorporated by Reference Exhibit No. Exhibit Description Form File No. Exhibit Filing
Date Filed
Herewith 3.01 Amended and Restated Certificate of Incorporation S-1/A 333-172215 3.1 05/04/11 3.02 Amended and Restated Bylaws S-1/A 333-172215 3.2 05/04/11 4.01 Fifth Amended and Restated Investor Rights Agreement, by and among Pandora Media, Inc. and the investors listed on Exhibit A thereto, dated May 20, 2010, as amended S-1/A 333-172215 4.2 02/22/11 10.01 † 2011 Long Term Incentive Plan and Form of Stock Option Agreement under 2011 Long Term Incentive Plan S-1/A 333-172215 10.1 05/26/11 10.02 † 2011 Corporate Incentive Plan S-1/A 333-172215 10.2 05/04/11 10.03 † 2004 Stock Plan, as amended, and Forms of Stock Option Agreement and Restricted Stock Purchase Agreement under 2004 Stock Plan S-1/A 333-172215 10.3 02/22/11 Incorporated by Reference Exhibit No. Exhibit Description Form File No. Exhibit Filing
Date Filed
Herewith 10.04 † 2000 Stock Incentive Plan, as amended, and Forms of NSO Stock Option Agreement and ISO Stock Option Agreement under 2000 Stock Plan S-1/A 333-172215 10.4 02/22/11 10.05 † Form of Indemnification Agreement by and between Pandora Media, Inc. and each of its executive officers and its directors not affiliated with an investment fund S-1/A 333-172215 10.5 02/22/11 10.06 † Form of Indemnification Agreement by and between Pandora Media, Inc. and each of its directors affiliated with an investment fund S-1/A 333-172215 10.5A 02/22/11 10.7 † Offer Letter with Joseph Kennedy, dated July 7, 2004. S-1/A 333-172215 10.6 02/22/11 10.8 † Employment Agreement with Tim Westergren, dated April 28, 2004 S-1/A 333-172215 10.7 02/22/11 10.9 † Offer Letter with Steven Cakebread, dated February 23, 2010 S-1/A 333-172215 10.8 02/22/11 10.10 † Offer Letter with Thomas Conrad, dated November 12, 2004 S-1/A 333-172215 10.9 02/22/11 10.11 † Offer Letter with John Trimble, dated February 18, 2009 S-1/A 333-172215 10.10 02/22/11 10.12 Office Lease between CIM/Oakland Center 21, LP and Pandora Media, Inc., dated July 23, 2009 S-1/A 333-172215 10.12 02/22/11 10.12A First Amendment to Lease between CIM/Oakland Center 21, LP and Pandora Media, Inc., dated April 13, 2010 S-1/A 333-172215 10.12A 02/22/11 10.12B Second Amendment to Lease between CIM/Oakland Center 21, LP and Pandora Media, Inc., dated June 16, 2010 S-1/A 333-172215 10.12B 02/22/11 10.12C Third Amendment to Lease between CIM/Oakland Center 21, LP and Pandora Media, Inc., dated December 15, 2010 10-Q 001-35198 10.12C 09/04/12 10.12D Fourth Amendment to Lease between CIM/Oakland Center 21, LP and Pandora Media, Inc., dated March 10, 2011 10-Q 001-35198 10.12D 09/04/12 Table of Contents Incorporated by Reference Exhibit No. Exhibit Description Form File No. Exhibit Filing
Date Filed
Herewith 10.12E Fifth Amendment to Lease between CIM/Oakland Center 21, LP and Pandora Media, Inc., dated July 1, 2011 10-Q 001-35198 10.12E 09/04/12 10.12F Sixth Amendment to Lease between CIM/Oakland Center 21, LP and Pandora Media, Inc., dated September 27, 2011 10-Q 001-35198 10.12F 09/04/12 10.12G Seventh Amendment to Lease between CIM/Oakland Center 21, LP and Pandora Media, Inc., dated July 12, 2012 10-Q 001-35198 10.12G 09/04/12 10.13 Web Site Performance Agreement by and between Broadcast Music, Inc. and Savage Beast Technologies, Inc., dated June 30, 2005 S-1/A 333-172215 10.13 02/22/11 10.14 License Agreement by and between SESAC and Pandora Media, Inc., dated July 1, 2007 S-1/A 333-172215 10.14 02/22/11 10.15 Credit Agreement among Pandora Media, Inc., the Lenders party thereto and JPMorgan Chase Bank, N.A. as Administrative Agent, dated as of May 13, 2011 S-1/A 333-172215 10.17 06/10/11 10.16 † Form of Restricted Stock Unit Agreement under the 2011 Equity Incentive Plan 10-Q 001-35198 10.01 09/02/11 10.17 † Amended Executive Severance and Change in Control Policy 10-K 001-35198 10.18 03/19/12 10.18 † Offer Letter with Simon Fleming-Wood, dated August 5, 2012 10-Q 001-35198 10.19 06/4/12 10.19 † 2013 Corporate Incentive Plan 10-Q 001-35198 10.20 06/4/12 10.20 † Stock Option Agreement with Joseph Kennedy, dated March 22, 2012 10-Q 001-35198 10.21 06/4/12 10.21 † Transition Agreement with Steven Cakebread, dated August 29, 2012 10-Q 001-35198 10.22 12/7/12 10.22 † Australian Form of Restricted Stock Unit Agreement under the 2011 Equity Incentive Plan X 10.23 † Offer Letter with Michael Herring, dated December 21, 2012 X Incorporated by ReferenceExhibit No.Exhibit DescriptionFormFile No.ExhibitFilingDateFiledHerewith23.01Consent of Independent Registered Public Accounting FirmX24.01Power of Attorney (included on signature page of this Annual Report on Form 10-K)X31.01Certification of the Principal Executive Officer Pursuant to Section 302 of the Sarbanes-Oxley ActX31.02Certification of the Principal Financial Officer Pursuant to Section 302 of the Sarbanes-Oxley ActX32.01Certification of the Principal Executive Officer and Principal Financial Officer Pursuant to Section 906 of the Sarbanes-Oxley ActX101Interactive Data Files Pursuant to Rule 405 of Regulation S-T: (i) Consolidated Balance Sheets as of January 31, 2013 and 2012, (ii) Consolidated Statements of Operations for the fiscal years ended January 31, 2013, 2012 and 2011, (iii) Consolidated Statements of Redeemable Convertible Preferred Stock and Stockholders' Deficit for the fiscal years ended January 31, 2013, 2012 and 2011, (iv) Consolidated Statements of Cash Flows for the fiscal years ended January 31, 2013, 2012 and 2011 and (v) Notes to Consolidated Financial Statements.X†Indicates management contract or compensatory plan.March 18, 2013. PANDORA MEDIA, INC. By:By: /s/ JOSEPH KENNEDY
BRIAN MCANDREWS Name: Joseph KennedyBrian McAndrews Title: Chief Executive Officer, President and Chairman of the Board Joseph Kennedy, MikeBrian McAndrews, Michael S. Herring and Delida CostinStephen Bené and each of them, his or her true and lawful attorneys-in-fact and agents, with full power to act separately and full power of substitution and resubstitution, for him or her and in his or her name, place and stead, in any and all capacities, to sign any and all amendments to this Annual Report on Form 10-K, and to file the same, with all exhibits thereto, and all other documents in connection therewith, with the Securities and Exchange Commission, granting unto each said attorney-in-fact and agent full power and authority to do and perform each and every act in person, hereby ratifying and confirming all that said attorneys-in-fact and agents or either of them or his or her or their substitute or substitutes may lawfully do or cause to be done by virtue hereof.Signature TitleDate
Title
Date/s/ JOSEPH KENNEDYJoseph KennedyBRIAN MCANDREWS Chief Executive Officer, President and Chairman of the Board (Principal Executive Officer) March 18, 2013February 11, 2015
Brian McAndrews/s/ MICHAEL S. HERRING Michael S. Herring
Chief Financial Officer (Principal Financial and Accounting Officer)
March 18, 2013February 11, 2015
Michael S. Herring/s/ PETER CHERNIN Peter CherninDirectorMarch 18, 2013/s/ JAMES M. P. FEUILLEJames M. P. FeuilleDirectorMarch 18, 2013SignatureTitleDate/s/ PETER GOTCHERPeter Gotcher Director March 18, 2013February 11, 2015
Peter Chernin/s/ JAMES M. P. FEUILLE Director February 11, 2015 James M. P. Feuille /s/ PETER GOTCHER Director February 11, 2015 Peter Gotcher /s/ ROBERT KAVNER Robert Kavner
Director
March 18, 2013February 11, 2015/s/ BARRY MCCARTHYBarry McCarthyRobert Kavner
Director
March 18, 2013/s/ ELIZABETH A. NELSON Director February 11, 2015 Elizabeth A. Nelson /s/ DAVID SZE David Sze
Director
March 18, 2013February 11, 2015
David Sze/s/ TIM WESTERGREN Director February 11, 2015 Tim Westergren
Director
March 18, 2013 Incorporated by Reference Exhibit No. Exhibit Description Form File No. Exhibit Filing
Date Filed
Herewith 3.01 Amended and Restated Certificate of Incorporation S-1/A 333-172215 3.1 05/04/11 3.02 Amended and Restated Bylaws S-1/A 333-172215 3.2 05/04/11 4.01 Fifth Amended and Restated Investor Rights Agreement, by and among Pandora Media, Inc. and the investors listed on Exhibit A thereto, dated May 20, 2010, as amended S-1/A 333-172215 4.2 02/22/11 10.01 † 2011 Long Term Incentive Plan and Form of Stock Option Agreement under 2011 Long Term Incentive Plan S-1/A 333-172215 10.1 05/26/11 10.02 † 2011 Corporate Incentive Plan S-1/A 333-172215 10.2 05/04/11 10.03 † 2004 Stock Plan, as amended, and Forms of Stock Option Agreement and Restricted Stock Purchase Agreement under 2004 Stock Plan S-1/A 333-172215 10.3 02/22/11 10.04 † 2000 Stock Incentive Plan, as amended, and Forms of NSO Stock Option Agreement and ISO Stock Option Agreement under 2000 Stock Plan S-1/A 333-172215 10.4 02/22/11 10.05 † Form of Indemnification Agreement by and between Pandora Media, Inc. and each of its executive officers and its directors not affiliated with an investment fund S-1/A 333-172215 10.5 02/22/11 10.06 † Form of Indemnification Agreement by and between Pandora Media, Inc. and each of its directors affiliated with an investment fund S-1/A 333-172215 10.5A 02/22/11 10.7 † Offer Letter with Joseph Kennedy, dated July 7, 2004. S-1/A 333-172215 10.6 02/22/11 10.8 † Employment Agreement with Tim Westergren, dated April 28, 2004 S-1/A 333-172215 10.7 02/22/11 10.9 † Offer Letter with Steven Cakebread, dated February 23, 2010 S-1/A 333-172215 10.8 02/22/11 10.10 † Offer Letter with Thomas Conrad, dated November 12, 2004 S-1/A 333-172215 10.9 02/22/11 10.11 † Offer Letter with John Trimble, dated February 18, 2009 S-1/A 333-172215 10.10 02/22/11 Incorporated by Reference Exhibit Description Form File No. Exhibit Filed By 3.01 Amended and Restated Certificate of Incorporation S-1/A 333-172215 3.1 5/4/2011 3.02 Amended and Restated Bylaws S-1/A 333-172215 3.2 5/4/2011 4.01 Fifth Amended and Restated Investor Rights Agreement, by and among Pandora Media, Inc. and the investors listed on Exhibit A thereto, dated May 20, 2010, as amended S-1/A 333-172215 4.2 2/22/2011 2011 Long Term Incentive Plan and Form of Stock Option Agreement under 2011 Long Term Incentive Plan S-1/A 333-172215 10.1 5/26/2011 2011 Corporate Incentive Plan S-1/A 333-172215 10.2 5/4/2011 2004 Stock Plan, as amended, and Forms of Stock Option Agreement and Restricted Stock Purchase Agreement under 2004 Stock Plan S-1/A 333-172215 10.3 2/22/2011 2000 Stock Incentive Plan, as amended, and Forms of NSO Stock Option Agreement and ISO Stock Option Agreement under 2000 Stock Plan S-1/A 333-172215 10.4 2/22/2011 Form of Indemnification Agreement by and between Pandora Media, Inc. and each of its executive officers and its directors not affiliated with an investment fund S-1/A 333-172215 10.5 2/22/2011 Form of Indemnification Agreement by and between Pandora Media, Inc. and each of its directors affiliated with an investment fund S-1/A 333-172215 10.5A 2/22/2011 Employment Agreement with Tim Westergren, dated April 28, 2004 S-1/A 333-172215 10.7 2/22/2011 Offer Letter with Thomas Conrad, dated November 12, 2004 S-1/A 333-172215 10.9 2/22/2011 Offer Letter with John Trimble, dated February 18, 2009 S-1/A 333-172215 10.1 2/22/2011 10.10 Office Lease between CIM/Oakland Center 21, LP and Pandora Media, Inc., dated July 23, 2009 S-1/A 333-172215 10.12 2/22/2011 10.10A First Amendment to Lease between CIM/Oakland Center 21, LP and Pandora Media, Inc., dated April 13, 2010 S-1/A 333-172215 10.12A 2/22/2011 10.10B Second Amendment to Lease between CIM/Oakland Center 21, LP and Pandora Media, Inc., dated June 16, 2010 S-1/A 333-172215 10.12B 2/22/2011 10.10C Third Amendment to Lease between CIM/Oakland Center 21, LP and Pandora Media, Inc., dated December 15, 2010 10-Q 001-35198 10.12C 9/4/2012 10.10D Fourth Amendment to Lease between CIM/Oakland Center 21, LP and Pandora Media, Inc., dated March 10, 2011 10-Q 001-35198 10.12D 9/4/2012 10.10E Fifth Amendment to Lease between CIM/Oakland Center 21, LP and Pandora Media, Inc., dated July 1, 2011 10-Q 001-35198 10.12E 9/4/2012 10.10F Sixth Amendment to Lease between CIM/Oakland Center 21, LP and Pandora Media, Inc., dated September 27, 2011 10-Q 001-35198 10.12F 9/4/2012 10.10G Seventh Amendment to Lease between CIM/Oakland Center 21, LP and Pandora Media, Inc., dated July 12, 2012 10-Q 001-35198 10.12G 9/4/2012 10.10H Eighth Amendment to Lease between CIM/Oakland Center 21, LP and Pandora Media, Inc., dated February 1, 2013 10-Q 001-35198 10.12H 5/29/2013 Incorporated by Reference Exhibit No. Exhibit Description Form File No. Exhibit Filing
Date Filed
Herewith 10.12 Office Lease between CIM/Oakland Center 21, LP and Pandora Media, Inc., dated July 23, 2009 S-1/A 333-172215 10.12 02/22/11 10.12A First Amendment to Lease between CIM/Oakland Center 21, LP and Pandora Media, Inc., dated April 13, 2010 S-1/A 333-172215 10.12A 02/22/11 10.12B Second Amendment to Lease between CIM/Oakland Center 21, LP and Pandora Media, Inc., dated June 16, 2010 S-1/A 333-172215 10.12B 02/22/11 10.12C Third Amendment to Lease between CIM/Oakland Center 21, LP and Pandora Media, Inc., dated December 15, 2010 10-Q 001-35198 10.12C 09/04/12 10.12D Fourth Amendment to Lease between CIM/Oakland Center 21, LP and Pandora Media, Inc., dated March 10, 2011 10-Q 001-35198 10.12D 09/04/12 10.12E Fifth Amendment to Lease between CIM/Oakland Center 21, LP and Pandora Media, Inc., dated July 1, 2011 10-Q 001-35198 10.12E 09/04/12 10.12F Sixth Amendment to Lease between CIM/Oakland Center 21, LP and Pandora Media, Inc., dated September 27, 2011 10-Q 001-35198 10.12F 09/04/12 10.12G Seventh Amendment to Lease between CIM/Oakland Center 21, LP and Pandora Media, Inc., dated July 12, 2012 10-Q 001-35198 10.12G 09/04/12 10.13 Web Site Performance Agreement by and between Broadcast Music, Inc. and Savage Beast Technologies, Inc., dated June 30, 2005 S-1/A 333-172215 10.13 02/22/11 10.14 License Agreement by and between SESAC and Pandora Media, Inc., dated July 1, 2007 S-1/A 333-172215 10.14 02/22/11 10.15 Credit Agreement among Pandora Media, Inc., the Lenders party thereto and JPMorgan Chase Bank, N.A. as Administrative Agent, dated as of May 13, 2011 S-1/A 333-172215 10.17 06/10/11 10.10I Ninth Amendment to Lease between CIM/Oakland Center 21, LP and Pandora Media, Inc., dated August 15, 2013 10-Q 001-35198 10.12I 10/27/2014 10.10J Tenth Amendment to Lease between CIM/Oakland Center 21, LP and Pandora Media, Inc., dated October 1, 2014 10-Q 001-35198 10.12J 10/27/2014 10.10K Sublease between Cerexa, Inc. and Pandora Media, Inc. dated January 1, 2015 X 10.11 Web Site Performance Agreement by and between Broadcast Music, Inc. and Savage Beast Technologies, Inc., dated June 30, 2005 S-1/A 333-172215 10.13 2/22/2011 10.12 License Agreement by and between SESAC and Pandora Media, Inc., dated July 1, 2007 S-1/A 333-172215 10.14 2/22/2011 10.13 Credit Agreement among Pandora Media, Inc., the Lenders party thereto and JPMorgan Chase Bank, N.A. as Administrative Agent, dated as of May 13, 2011 S-1/A 333-172215 10.17 6/10/2011 10.13A Amendment and Restatement Agreement to Credit Agreement among Pandora Media, Inc., the Lenders party thereto and JPMorgan Chase Bank, N.A. as Administrative Agent, dated as of September 12, 2013 10-Q 001-35198 10.15 11/26/2013 Form of Restricted Stock Unit Agreement under the 2011 Equity Incentive Plan 10-Q 001-35198 10.01 9/2/2011 Amended Executive Severance and Change in Control Policy 10-K 001-35198 10.18 3/19/2012 Offer Letter with Simon Fleming-Wood, dated August 5, 2012 10-Q 001-35198 10.19 6/4/2012 2013 Corporate Incentive Plan 10-Q 001-35198 10.20 6/4/2012 10.17B† 2014 Corporate Incentive Plan 10-Q 001-35198 10.19B 8/26/2013 10.17C† Calendar 2014 Corporate Incentive Plan 10-Q 001-35198 10.19C 4/29/2014 Australian Form of Restricted Stock Unit Agreement under the 2011 Equity Incentive Plan 10-K 001-35198 10.22 3/18/2013 Offer Letter with Michael Herring, dated December 21, 2012 10-K 001-35198 10.23 3/18/2013 10.22† New Zealand Form of Restricted Stock Unit Agreement under the 2011 Equity Incentive Plan 10-Q 001-35198 10.24 5/29/2013 10.23† Offer Letter with Brian McAndrews, dated September 11, 2013 10-Q 001-35198 10.25 11/26/2013 10.24A† 2014 Employee Stock Purchase Plan S-8 333-193612 99.2 1/28/2014 23.01 Consent of Independent Registered Public Accounting Firm X 24.01 Power of Attorney (included on signature page of this Annual Report on Form 10-K) X 31.01 Certification of the Principal Executive Officer Pursuant to Section 302 of the Sarbanes-Oxley Act X 31.02 Certification of the Principal Financial Officer Pursuant to Section 302 of the Sarbanes-Oxley Act X 32.01 Certification of the Principal Executive Officer and Principal Financial Officer Pursuant to Section 906 of the Sarbanes-Oxley Act X Incorporated by Reference Exhibit No. Exhibit Description Form File No. Exhibit Filing
Date Filed
Herewith 10.16 † Form of Restricted Stock Unit Agreement under the 2011 Equity Incentive Plan 10-Q 001-35198 10.01 09/02/11 10.17 † Amended Executive Severance and Change in Control Policy 10-K 001-35198 10.18 03/19/12 10.18 † Offer Letter with Simon Fleming-Wood, dated August 5, 2012 10-Q 001-35198 10.19 06/4/12 10.19 † 2013 Corporate Incentive Plan 10-Q 001-35198 10.20 06/4/12 10.20 † Stock Option Agreement with Joseph Kennedy, dated March 22, 2012 10-Q 001-35198 10.21 06/4/12 10.21 † Transition Agreement with Steven Cakebread, dated August 29, 2012 10-Q 001-35198 10.22 12/7/12 10.22 † Australian Form of Restricted Stock Unit Agreement under the 2011 Equity Incentive Plan X 10.23 † Offer Letter with Michael Herring, dated December 21, 2012 X 23.01 Consent of Independent Registered Public Accounting Firm X 24.01 Power of Attorney (included on signature page of this Annual Report on Form 10-K) X 31.01 Certification of the Principal Executive Officer Pursuant to Section 302 of the Sarbanes-Oxley Act X 31.02 Certification of the Principal Financial Officer Pursuant to Section 302 of the Sarbanes-Oxley Act X 32.01 Certification of the Principal Executive Officer and Principal Financial Officer Pursuant to Section 906 of the Sarbanes-Oxley Act X Incorporated by ReferenceExhibit No.Exhibit DescriptionFormFile No.ExhibitFilingDateFiledHerewith101 101 Interactive Data Files Pursuant to Rule 405 of Regulation S-T: (i) Consolidated Balance Sheets as of JanuaryDecember 31, 2014 and December 31, 2013, and 2012, (ii) Consolidated Statements of Operations for the fiscal yearsTwelve months ended December 31, 2014, the Eleven months ended December 31, 2013 and 2012 and the Twelve months ended January 31, 2013 2012 and 2011, (iii) Consolidated Statements of Redeemable Convertible Preferred Stock and Stockholders' DeficitComprehensive Loss for the fiscal yearsTwelve months ended December 31, 2014, the Eleven months Ended December 31, 2013 and the Twelve months ended January 31, 2013, 2012 and 2011, (iv) Consolidated Statements of Cash Flows for the fiscal yearsTwelve months ended December 31, 2014, the Eleven months ended December 31, 2013 and 2012 and the Twelve months ended January 31, 2013 2012 and 2011 and (v) Notes to Consolidated Financial Statements.Statements X † Indicates management contract or compensatory plan. †Indicates management contract or compensatory plan.