Use these links to rapidly review the document
FORM 10-K FOR THE YEAR ENDED DECEMBER 31, 20132014 TABLE OF CONTENTS
TABLE OF CONTENTS
PART IV
Table of Contents
UNITED STATES
SECURITIES AND EXCHANGE COMMISSION
Washington, D.C. 20549
FORM 10-K
| | |
ý |
|
Annual Report Pursuant to Section 13 or 15(d) of the Securities Exchange Act of 1934 |
For the fiscal year ended December 31, 20132014 |
o |
|
Transition Report Pursuant to Section 13 or 15(d) of the Securities Exchange Act of 1934 |
| | | | |
| Commission File Number | | Exact name of registrant as specified in their charters, its charter,
addresses of principal executive offices,
telephone numbers
and states or other jurisdictions of incorporation or organization | | I.R.S. Employer
Identification Number |
|---|
814-00839 | | New Mountain Finance Holdings, L.L.C.
787 Seventh Avenue, 48th Floor
New York, New York 10019
Telephone: (212) 720-0300
State of Incorporation: Delaware | | 26-3633318 |
| 814-00832 | | New Mountain Finance Corporation
787 Seventh Avenue, 48th Floor
New York, New York 10019
Telephone: (212) 720-0300
State of Incorporation: Delaware | | 27-2978010 |
814-00902 | | New Mountain Finance AIV Holdings Corporation
787 Seventh Avenue, 48th Floor
New York, New York 10019
Telephone: (212) 720-0300
State of Incorporation: Delaware | | 80-0721242 |
Securities registered pursuant to Section 12(b) of the Act:
| | | | |
Registrant
| | Title of each class | | Name of each exchange on which registered |
|---|
New Mountain Finance Holdings, L.L.C. | | None | | None |
New Mountain Finance Corporation | | Common stock, $0.01 par value | | The New York Stock Exchange |
New Mountain Finance AIV Holdings Corporation | | None | | None |
Securities registered pursuant to Section 12(g) of the Act:
| | | | |
Registrant
| | Title of each class | |
|
|---|
New Mountain Finance Holdings, L.L.C. | | Common membership units |
New Mountain Finance CorporationNone | | None |
New Mountain Finance AIV Holdings Corporation | | Common stock, $0.01 par value |
Indicate by check mark if the registrant is a well-known seasoned issuer, as defined in Rule 405 of the Securities Act. Yes o No ý
| | | | |
New Mountain Finance Holdings, L.L.C. | | Yes o No ý | | |
New Mountain Finance Corporation | | Yes o No ý | | |
New Mountain Finance AIV Holdings Corporation | | Yes o No ý | | |
Indicate by check mark if the registrant is not required to file reports pursuant to Section 13 or Section 15(d) of the Act. Yes o No ý
| | | | |
New Mountain Finance Holdings, L.L.C. | | Yes o No ý | | |
New Mountain Finance Corporation | | Yes o No ý | | |
New Mountain Finance AIV Holdings Corporation | | Yes o No ý | | |
Indicate by check mark whether the registrant (1) has filed all reports required to be filed by Section 13 or 15(d) of the Securities Exchange Act of 1934 during the preceding 12 months (or for such shorter period that the registrant was required to file such reports), and (2) has been subject to such filing requirements for the past 90 days. Yes ý No o
| | | | |
New Mountain Finance Holdings, L.L.C. | | Yes ý No o | | |
New Mountain Finance Corporation | | Yes ý No o | | |
New Mountain Finance AIV Holdings Corporation | | Yes ý No o | | |
Indicate by check mark whether the registrant has submitted electronically and posted on its corporate Web site, if any, every Interactive Data File required to be submitted and posted pursuant to Rule 405 of Regulation S-T (§ 232.405 of this chapter) during the preceding 12 months (or for such shorter period that the registrant was required to submit and post such files). Yes o No o
| | | | |
New Mountain Finance Holdings, L.L.C. | | Yes o No o | | |
New Mountain Finance Corporation | | Yes o No o | | |
New Mountain Finance AIV Holdings Corporation | | Yes o No o | | |
Indicate by check mark if disclosure of delinquent filers pursuant to Item 405 of Regulation S-K (§ 229.405 of this chapter) is not contained herein, and will not be contained, to the best of registrant's knowledge, in definitive proxy or information statements incorporated by reference in Part III of this Form 10-K or any amendment to this Form 10-K.ý
| | | | |
New Mountain Finance Holdings, L.L.C. | | ý | | |
New Mountain Finance Corporation | | ý | | |
New Mountain Finance AIV Holdings Corporation | | ý | | |
Indicate by check mark whether the registrant is a large accelerated filer, an accelerated filer, a non-accelerated filer, or a smaller reporting company. See the definitions of "large accelerated filer", "accelerated filer" and "smaller reporting company" in Rule 12b-2 of the Exchange Act:
| | | | |
New Mountain Finance Holdings, L.L.C. | | Large accelerated filer oý | | Accelerated filer ýo |
| | Non-accelerated filer o
| | Smaller(Do not check if a
smaller reporting company o |
New Mountain Finance Corporation | | Large accelerated filer o | | Accelerated filer ý |
| | Non-accelerated filer o | | Smaller reporting company o |
New Mountain Finance AIV Holdings Corporation | | Large accelerated filer o | | Accelerated filer ý |
| | Non-accelerated filer ocompany) | | Smaller reporting company o |
Indicate by check mark whether the registrant is a shell company (as defined in Rule 12b-2 of the Exchange Act).
| | | | |
New Mountain Finance Holdings, L.L.C. | | Yes o No ý | | |
New Mountain Finance Corporation | | Yes o No ý | | |
New Mountain Finance AIV Holdings Corporation | | Yes o No ý | | |
There is no established market for New Mountain Finance AIV Holdings Corporation's shares of common stock. Additionally, there is no established market for New Mountain Finance Holdings, L.L.C.'s common membership units.
The aggregate market value of common stock held by non-affiliates of the publicly traded registrant, New Mountain Finance Corporation on June 28, 201330, 2014, based on the closing price on that date of $14.16$14.86, on the New York Stock Exchange was $501.7$728.3 million. For the purposes of calculating this amount only, all directors and executive officers of the registrant have been treated as affiliates.
| | | | | | |
Registrant
| | Description | | Shares / Units as of March 5, 20142, 2015 | |
|---|
New Mountain Finance Holdings, L.L.C.
| | Common membership units | | | 47,896,693 | |
New Mountain Finance Corporation
| | Common stock, $0.01 par value | | | 47,896,693 | |
New Mountain Finance AIV Holdings Corporation
| | Common stock, $0.01 par value | | | 100 | 57,997,890 |
This combined Form 10-K is filed separately by three registrants: New Mountain Finance Holdings, L.L.C., New Mountain Finance Corporation and New Mountain Finance AIV Holdings Corporation (collectively, the "New Mountain Finance Registrants"). Information contained herein relating to any New Mountain Finance Registrant is filed by such registrant solely on its own behalf. Each New Mountain Finance Registrant makes no representation as to information relating exclusively to the other registrants.
Portions of the New Mountain Finance Registrants' Joint Proxy Statement for their joint 2014its 2015 Annual Meeting of Stockholders to be filed not later than 120 days after the end of the fiscal year covered by this Annual Report on this combined Form 10-K are incorporated by reference into Part III on this combined Form 10-K.
Table of Contents
FORM 10-K FOR THE YEAR ENDED DECEMBER 31, 20132014
TABLE OF CONTENTS
| | | | | | |
| |
| | PAGE | |
|---|
PART I | |
Item 1. | | Business | | | 1 | |
Item 1A. | | Risk Factors | | | 2529 | |
Item 1B. | | Unresolved Staff Comments | | | 61 | |
Item 2. | | Properties | | | 61 | |
Item 3. | | Legal Proceedings | | | 61 | |
Item 4. | | Mine Safety Disclosures | | | 61 | |
PART II | |
Item 5. | | Market for Registrants' Common Equity, Related Stockholder Matters and Issuer Purchases of Equity Securities | | | 62 | |
Item 6. | | Selected Financial Data | | | 6766 | |
Item 7. | | Management's Discussion and Analysis of Financial Condition and Results of Operations | | | 7270 | |
Item 7A. | | Quantitative and Qualitative Disclosures About Market Risk | | | 98103 | |
Item 8. | | Financial Statements and Supplementary Data | | | 99105 | |
Item 9. | | Changes in and Disagreements with Accountants on Accounting and Financial Disclosure | | | 172170 | |
Item 9A. | | Controls and Procedures | | | 172170 | |
Item 9B. | | Other Information | | | 174173 | |
PART III | |
Item 10. | | Directors, Executive Officers and Corporate Governance | | | 175174 | |
Item 11. | | Executive Compensation | | | 175174 | |
Item 12. | | Security Ownership of Certain Beneficial Owners and Management and Related Stockholder Matters | | | 175174 | |
Item 13. | | Certain Relationships and Related Transactions, and Director Independence | | | 175174 | |
Item 14. | | Principal Accountant Fees and Services | | | 175174 | |
PART IV | |
Item 15. | | Exhibits and Financial Statement Schedules | | | 176175 | |
Table of Contents
PART I
The information in this combined Form 10-K relates to each of the three separate registrants: New Mountain Finance Holdings, L.L.C., New Mountain Finance Corporation and New Mountain Finance AIV Holdings Corporation (collectively, "we", "us", "our" or the "Companies"). Information that relates to an individual registrant will be specifically referenced to the respective company. None of the Companies make any representation as to the information related solely to the other registrants other than itself.
Item 1. Business
New Mountain Finance Holdings, L.L.C.Corporation
New Mountain Finance Holdings, L.L.C. (the "Operating Company"Corporation ("NMFC", the "Company", "we", "us" or the "Master Fund""our") is a Delaware limited liability company. The Operating Companycorporation that was originally incorporated on June 29, 2010. NMFC is externally managed anda closed-end, non-diversified management investment company that has elected to be treatedregulated as a business development company ("BDC") under the Investment Company Act of 1940, as amended (the "1940 Act"). As such, the Operating CompanyNMFC is obligated to comply with certain regulatory requirements. The Operating CompanyNMFC has elected to be treated, and intends to becomply with the requirements to continue to qualify annually, as a regulated investment company ("RIC") under Subchapter M of the Internal Revenue Code of 1986, as amended, (the "Code"). NMFC is also registered as an investment adviser under the Investment Advisers Act of 1940, as amended (the "Advisers Act").
On May 19, 2011, NMFC priced its initial public offering (the "IPO") of 7,272,727 shares of common stock at a public offering price of $13.75 per share. Concurrently with the closing of the IPO and at the public offering price of $13.75 per share, NMFC sold an additional 2,172,000 shares of its common stock to certain executives and employees of, and other individuals affiliated with, New Mountain Capital (defined as New Mountain Capital Group, L.L.C. and its affiliates) in a concurrent private placement (the "Concurrent Private Placement"). Additionally, 1,252,964 shares were issued to the partners of New Mountain Guardian Partners, L.P. at that time for their ownership interest in the Predecessor Entities (as defined below). In connection with NMFC's IPO and through a series of transactions, New Mountain Finance Holdings, L.L.C. ("NMF Holdings" or the "Predecessor Operating Company") acquired all of the operations of the Predecessor Entities, including all of the assets and liabilities related to such operations.
New Mountain Finance Holdings, L.L.C.
NMF Holdings is a Delaware limited liability company. Until May 8, 2014, NMF Holdings was externally managed and was regulated as a BDC under the 1940 Act. As such, NMF Holdings was obligated to comply with certain regulatory requirements. NMF Holdings was treated as a partnership for United States ("U.S.") federal income tax purposes for so long as it hashad at least two members. With the completion of the underwritten secondary offering on February 3, 2014, NMF Holdings' existence as a partnership for U.S. federal income tax purposes terminated and NMF Holdings became an entity that is disregarded as a separate entity from its owner for U.S. federal tax purposes. For additional information on the Company's organizational structure prior to May 8, 2014, see "—Restructuring".
The Operating Company isUntil May 8, 2014, NMF Holdings was externally managed by New Mountain Finance Advisers BDC, L.L.C. (the "Investment Adviser"). As of May 8, 2014, the Investment Adviser serves as the external investment adviser to NMFC. New Mountain Finance Administration, L.L.C. (the "Administrator") provides the administrative services necessary for operations. The Investment Adviser and Administrator are wholly-owned subsidiaries of New Mountain Capital (defined as New Mountain Capital Group, L.L.C. and its affiliates).Capital. New Mountain Capital is a firm with a track record of investing in the middle market and with assets under management (which includes amounts committed, not all of which have been drawn down and invested to date) totaling more than $12.0 billion as of December 31, 2013,$15.0 billion(1), which includes total assets held by the Operating Company. New Mountain Capital focuses on investing in defensive growth companies across its private equity, public equity and credit investment vehicles. The Operating Company,NMF Holdings, formerly known as New Mountain Guardian (Leveraged), L.L.C., was originally formed as a subsidiary of New Mountain Guardian AIV, L.P. ("Guardian AIV") by New Mountain Capital in October 2008. Guardian AIV was formed through an allocation of approximately $300.0
- (1)
- Includes amounts committed, not all of which have been drawn down and invested to date, as of December 31, 2014.
Table of Contents
$300.0 million of the $5.1 billion of commitments supporting New Mountain Partners III, L.P., a private equity fund managed by New Mountain Capital. In February 2009, New Mountain Capital formed a co-investment vehicle, New Mountain Guardian Partners, L.P., comprising $20.4 million of commitments. New Mountain Guardian (Leveraged), L.L.C. and New Mountain Guardian Partners, L.P., together with their respective direct and indirect wholly-owned subsidiaries, are defined as the "Predecessor Entities".
Prior to December 18, 2014, New Mountain Finance Corporation
New Mountain Finance CorporationSPV Funding, L.L.C. ("NMFC"NMF SLF") iswas a Delaware corporation thatlimited liability company. NMF SLF was originally incorporated on June 29, 2010. NMFC is a closed-end, non-diversified management investment company that has elected to be treated aswholly-owned subsidiary of NMF Holdings and thus a BDC under the 1940 Act. As such, NMFC is obligated to comply with certain regulatory requirements. NMFC has elected to be treated, and intends to comply with the requirements to continue to qualify annually, as a regulated investment company ("RIC") under Subchapter Mwholly-owned indirect subsidiary of the Internal Revenue CodeCompany. NMF SLF was bankruptcy-remote and non-recourse to NMFC. As part of 1986, as amended, (the "Code").
On May 19, 2011, NMFC priced its initial public offering (the "IPO") of 7,272,727 shares of common stock at a public offering price of $13.75 per share. Concurrently with the closing of the IPO and at the public offering price of $13.75 per share, NMFC sold an additional 2,172,000 shares of its common stock to certain executives and employees of, and other individuals affiliated with, New Mountain Capital in a concurrent private placement (the "Concurrent Private Placement"). Additionally, 1,252,964 shares were issuedamendment to the partners of New Mountain Guardian Partners, L.P. at that timeCompany's existing credit facilities with Wells Fargo Bank, National Association, NMF SLF merged with and into NMF Holdings on December 18, 2014. SeeItem 8.—Financial Statements and Supplementary Data—Note 7, Borrowings for their ownership interest inadditional information on the Predecessor Entities.
Table of ContentsCompany's credit facilities.
New Mountain Finance AIV Holdings Corporation
Until April 25, 2014, New Mountain Finance AIV Holdings Corporation ("AIV Holdings") iswas a Delaware corporation that was originally incorporated on March 11, 2011. AIV Holdings was dissolved on April 25, 2014. Guardian AIV, a Delaware limited partnership, iswas AIV Holdings' sole stockholder. AIV Holdings iswas a closed-end, non-diversified management investment company that has elected to be treatedwas regulated as a BDC under the 1940 Act. As such, AIV Holdings iswas obligated to comply with certain regulatory requirements. AIV Holdings has elected to bewas treated, and intends to complycomplied with the requirements to continue to qualify annually, as a RIC under the Code.
Structure
Prior to the Restructuring (as defined below) on May 8, 2014, NMFC and AIV Holdings were holding companies with no direct operations of their own, and their sole asset was their ownership in NMF Holdings. In connection with NMFC'sthe IPO, NMFC and AIV Holdings each entered into a joinder agreement with respect to the Limited Liability Company Agreement, as amended and restated (the "Operating Agreement"), of NMF Holdings, pursuant to which NMFC and AIV Holdings were admitted as members of NMF Holdings. NMFC acquired from NMF Holdings, with the gross proceeds of the IPO and throughthe Concurrent Private Placement, common membership units ("units") of NMF Holdings (the number of units were equal to the number of shares of NMFC's common stock sold in the IPO and the Concurrent Private Placement). Additionally, NMFC received units of NMF Holdings equal to the number of shares of common stock of NMFC issued to the partners of New Mountain Guardian Partners, L.P. Guardian AIV was the parent of NMF Holdings prior to the IPO and, as a series of transactions, the Operating Company acquired allresult of the operationstransactions completed in connection with the IPO, obtained units in NMF Holdings. Guardian AIV contributed its units in NMF Holdings to its newly formed subsidiary, AIV Holdings, in exchange for common stock of AIV Holdings. AIV Holdings had the Predecessor Entities, includingright to exchange all or any portion of the assets and liabilities related to such operations.its units in NMF Holdings for shares of NMFC's common stock on a one-for-one basis at any time.
The currentoriginal structure was designed to generally prevent NMFC from being allocated taxable income with respect to unrecognized gains that existed at the time of the IPO in the Predecessor Entities' assets, and rather such amounts would be allocated generally to AIV Holdings. The result iswas that any distributions made to NMFC's stockholders that arewere attributable to such gains generally willwere not be treated as taxable dividends but rather as return of capital.
As a result of the transactions completed in connection with the IPO, Guardian AIV obtained units in the Operating Company. Guardian AIV contributed its units in the Operating Company to its newly formed subsidiary, AIV Holdings, in exchange for common stock of AIV Holdings. AIV Holdings has the right to exchange all or any portion of its units in the Operating Company for shares of NMFC's common stock on a one-for-one basis at any time.
NMFC and AIV Holdings are holding companies with no direct operations of their own, and their sole asset is their ownership in the Operating Company. NMFC and AIV Holdings each entered into a joinder agreement with respect to the Limited Liability Company Agreement, as amended and restated, of the Operating Company, pursuant to which NMFC and AIV Holdings were admitted as members of the Operating Company. NMFC acquired from the Operating Company, with the gross proceeds of the IPO and the Concurrent Private Placement, common membership units ("units") of the Operating Company (the number of units are equal to the number of shares of NMFC's common stock sold in the IPO and the Concurrent Private Placement). Additionally, NMFC received units of the Operating Company equal to the number of shares of common stock of NMFC issued to the partners of New Mountain Guardian Partners, L.P.
Since NMFC's IPO, and through December 31, 2013,2014, NMFC raised approximately $233.4$374.6 million in net proceeds from additional offerings of common stock and issued shares of its common stock valued at approximately $249.6$288.4 million on behalf of AIV Holdings for exchanged units. NMFC
Table of Contents
acquired from the Operating CompanyNMF Holdings units of the Operating CompanyNMF Holdings equal to the number of shares of NMFC's common stock sold in the additional offerings. With the completion of the final secondary offering on February 3, 2014, NMFC owned 100.0% of the units of NMF Holdings, which became a wholly-owned subsidiary of NMFC.
Restructuring
As a BDC, AIV Holdings had been subject to the 1940 Act, including certain provisions applicable only to BDCs. Accordingly, and after careful consideration of the 1940 Act requirements applicable to BDCs, the cost of 1940 Act compliance and a thorough assessment of AIV Holdings' business model, AIV Holdings' board of directors determined that continuation as a BDC was not in the best interests of AIV Holdings and Guardian AIV. Specifically, given that AIV Holdings was formed for the sole purpose of holding units of NMF Holdings and AIV Holdings had disposed of all of the units of NMF Holdings that it was holding as of February 3, 2014, the board of directors of AIV Holdings approved and declared advisable at an in-person meeting held on March 25, 2014 the withdrawal of AIV Holdings' election to be regulated as a BDC under the 1940 Act. In addition, the board of directors of AIV Holdings approved and declared advisable for AIV Holdings to terminate its registration under Section 12(g) of the Securities Exchange Act of 1934, as amended (the "Exchange Act") and to dissolve AIV Holdings under the laws of the State of Delaware.
Upon receipt of the necessary stockholder consent to authorize the board of directors of AIV Holdings to withdraw AIV Holdings' election to be regulated as a BDC, the withdrawal was filed and became effective upon receipt by the U.S. Securities and Exchange Commission ("SEC") of AIV Holdings' notification of withdrawal on Form N-54C on April 15, 2014. The board of directors of AIV Holdings believed that AIV Holdings met the requirements for filing the notification to withdraw its election to be regulated as a BDC, upon the receipt of the necessary stockholder consent. After the notification of withdrawal of AIV Holdings' BDC election was filed with the SEC, AIV Holdings was no longer subject to the regulatory provisions of the 1940 Act applicable to BDCs generally, including regulations related to insurance, custody, composition of its board of directors, affiliated transactions and any compensation arrangements.
In addition, on April 15, 2014, AIV Holdings filed a Form 15 with the SEC to terminate AIV Holdings' registration under Section 12(g) of the Exchange Act. After these SEC filings and any other federal or state regulatory or tax filings were made, AIV Holdings proceeded to dissolve under Delaware law by filing a certificate of dissolution in Delaware on April 25, 2014.
Until May 8, 2014, as a BDC, NMF Holdings had been subject to the 1940 Act, including certain provisions applicable only to BDCs. Accordingly, and after careful consideration of the 1940 Act requirements applicable to BDCs, the cost of 1940 Act compliance and a thorough assessment of NMF Holdings' current business model, NMF Holdings' board of directors determined at an in-person meeting held on March 25, 2014 that continuation as a BDC was not in the best interests of NMF Holdings.
At the 2014 joint annual meeting of the stockholders of NMFC and the sole unit holder of NMF Holdings held on May 6, 2014, the stockholders of NMFC and the sole unit holder of NMF Holdings approved a proposal which authorized the board of directors of NMF Holdings to withdraw NMF Holdings' election to be regulated as a BDC. Additionally, the stockholders of NMFC approved a new investment advisory and management agreement between NMFC and the Investment Adviser. Upon receipt of the necessary stockholder/unit holder approval to authorize the board of directors of NMF Holdings to withdraw NMF Holdings' election to be regulated as a BDC, the withdrawal was filed and became effective upon receipt by the SEC of NMF Holdings' notification of withdrawal on Form N-54C on May 8, 2014.
Table of Contents
Effective May 8, 2014, NMF Holdings amended and restated its Operating Agreement such that the board of directors of NMF Holdings was dissolved and NMF Holdings remained a wholly-owned subsidiary of NMFC with the sole purpose of serving as a special purpose vehicle for NMF Holdings' credit facility, and NMFC assumed all other operating activities previously undertaken by NMF Holdings under the management of the Investment Adviser (collectively, the "Restructuring"). After the Restructuring, all wholly-owned direct and indirect subsidiaries of NMFC are consolidated with NMFC for both 1940 Act and financial statement reporting purposes, subject to any financial statement adjustments required in accordance with accounting principles generally accepted in the United States of America ("GAAP"). NMFC continues to remain a BDC under the 1940 Act.
Also, on May 8, 2014, NMF Holdings filed Form 15 with the SEC to terminate NMF Holdings' registration under Section 12(g) of the Exchange Act. As a special purpose entity, NMF Holdings is bankruptcy-remote and non-recourse to NMFC. In addition, the assets held at NMF Holdings will continue to be used to secure NMF Holdings' credit facility.
Current Organization
During the year ended December 31, 2014, the Company established wholly-owned subsidiaries, NMF Ancora Holdings Inc. ("NMF Ancora") and NMF YP Holdings Inc. ("NMF YP"), which are structured as Delaware entities that serve as tax blocker corporations which hold equity or equity-like investments in portfolio companies organized as limited liability companies (or other forms of pass-through entities). Tax blocker corporations are not consolidated for income tax purposes and may incur income tax expense as a result of their ownership of portfolio companies. Additionally, the Company has a wholly-owned subsidiary, New Mountain Finance Servicing, L.L.C. ("NMF Servicing") that serves as the administrative agent on certain investment transactions. New Mountain Finance SBIC, L.P. ("SBIC LP"), and its general partner, New Mountain Finance SBIC G.P., L.L.C. ("SBIC GP"), were organized in Delaware as a limited partnership and limited liability company, respectively. SBIC LP and SBIC GP are consolidated wholly-owned direct and indirect subsidiaries of the Company. SBIC LP received a license from the U.S. Small Business Association (the "SBA") to operate as a small business investment company ("SBIC") under Section 301(c) of the Small Business Investment Act of 1958, as amended (the "1958 Act").
Table of Contents
The diagram below depicts the Companies'Company's organizational structure as of December 31, 2013.2014.
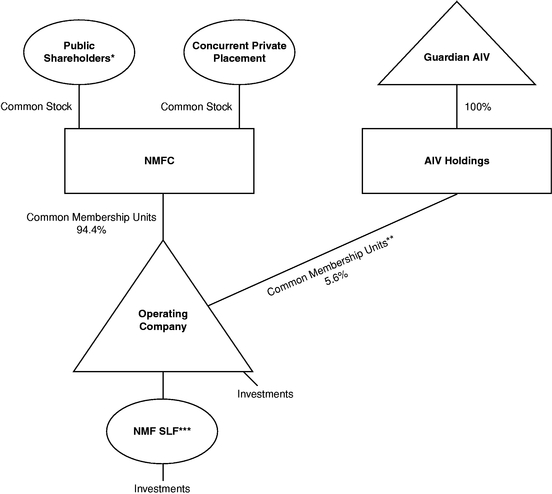

- *
- Includes partners of New Mountain Guardian Partners, L.P.
- **
These common membership units are exchangeable into sharesNMFC is the sole limited partner of SBIC LP. NMFC, common stock on a one-for-one basis.
***New Mountain Finance SPV Funding, L.L.C. ("NMF SLF").directly or indirectly through SBIC GP, wholly-owns SBIC LP. NMFC owns 100.0% of SBIC GP which owns 1.0% of SBIC LP. NMFC owns 99.0% of SBIC LP.
The Operating Company consolidates its wholly-owned subsidiary, New Mountain Finance SPV Funding, L.L.C. ("NMF SLF"). NMFC and AIV Holdings do not consolidate the Operating Company. NMFC and AIV Holdings apply investment company master-feeder financial statement presentation, as described in Accounting Standards Codification 946,Financial Services—Investment Companies, ("ASC 946") to their interest in the Operating Company. NMFC and AIV Holdings observe that it is industry practice to follow the presentation prescribed for a master fund-feeder fund structure in ASC 946 in instances in which a master fund is owned by more than one feeder fund and that such presentation provides stockholders of NMFC and AIV Holdings with a clearer depiction of their investment in the Master Fund.
New Mountain Finance Advisers BDC, L.L.C.
The Investment Adviser manages the Operating Company's day-to-day operations and provides it with investment advisory and management services. In particular, the Investment Adviser is responsible for identifying attractive investment opportunities, conducting research and due diligence on
Table of Contents
prospective investments, structuring the Operating Company's investments and monitoring and servicing the Operating Company's investments. The Investment Adviser is managed by a five member investment committee, which is responsible for approving purchases and sales of the Operating Company's investments above $5.0$10.0 million in aggregate by issuer. For additional information on the investment committee, see "Investment Committee" section.
New Mountain Finance Administration, L.L.C.
The Administrator provides the administrative services necessary to conduct our day-to-day operations. The Administrator also performs, or oversees the performance of, our financial records, our reports to stockholders and reports filed with the Securities and Exchange Commission.SEC. The Administrator performs the calculation and publication of our net asset values, the payment of our expenses and oversees the performance of various third-party service providers and the preparation and filing of our tax returns. The Administrator may also provide, on the Operating Company's behalf, managerial assistance to its portfolio companies.
Competition
The Operating Company competes for investments with a number of BDCs and investment funds (including private equity and hedge funds), as well as traditional financial services companies such as commercial
Table of Contents
banks and other sources of financing. Many of these entities have greater financial and managerial resources than we do. We believe the Operating Company is able to be competitive with these entities primarily on the basis of the experience and contacts of its management team, the Operating Company's responsive and efficient investment analysis and decision-making processes, the investment terms the Operating Company offers, the leveraged model that the Operating Company employs to perform its due diligence with the broader New Mountain Capital team and the Operating Company's model of investing in companies and industries it knows well.
We believe that some of the Operating Company's competitors may make investments with interest rates and returns that are comparable to or lower than the rates and returns that the Operating Company targets. Therefore, the Operating Company does not seek to compete solely on the interest rates and returns that it offers to potential portfolio companies. For additional information concerning the competitive risks we face, seeItem 1A.—Risk Factors.
Investment Objectives and Portfolio
The Operating Company's investment objective is to generate current income and capital appreciation through the sourcing and origination of debt securities at all levels of the capital structure, including first and second lien debt, notes, bonds and mezzanine securities. In some cases, the Operating Company's investments may also include equity interests such as preferred stock, common stock, warrants or options received in connection with the Operating Company's debt investments or may include a direct investment in the equity of private companies.
The Operating Company makes investments through both primary originations and open-market secondary purchases. The Operating Company primarily targets loans to, and invests in, United States ("U.S.") middle market businesses, a market segment we believe continues to be underserved by other lenders. We define middle market businesses as those businesses with annual earnings before interest, taxes, depreciation, and amortization ("EBITDA") between $20.0 million and $200.0 million. The primary focus is in the debt of defensive growth companies, which are defined as generally exhibiting the following characteristics: (i) sustainable secular growth drivers, (ii) high barriers to competitive entry, (iii) high free cash flow after capital expenditure and working capital needs, (iv) high returns on assets and (v) niche market dominance. Similar to the Company, SBIC LP's investment objective is to generate current income and capital appreciation under the investment criteria used by the Company, however, SBIC LP's investments must be SBA eligible companies. The OperatingCompany's portfolio may be concentrated in a limited number of industries. As of December 31, 2014, the Company's top five industry concentrations were software, business services, education, federal services and healthcare services. The Company's targeted investments typically have maturities of between five and ten years and generally range in size between $10.0 million and
Table of Contents
$50.0 $50.0 million. This investment size may vary proportionately as the size of the Operating Company's capital base changes. At December 31, 2013,2014, the Operating Company's portfolio consisted of 5971 portfolio companies and was invested 47.6% in first lien loans, 42.4% in second lien loans, 4.3% in subordinated debt and 5.7% in equity and other, as measured at fair value versus the Predecessor Operating Company's portfolio which consisted of 59 portfolio companies invested 49.6% in first lien loans, 42.0% in second lien loans, 2.4% in subordinated debt and 6.0% in equity and other as measured at fair value versus 63 portfolio companies invested 49.8% in first lien loans, 44.6% in second lien loans, 4.6% in subordinated debt and 1.0% in equity and other at December 31, 2012.2013.
The fair value of the Company's investments was approximately $1,424.7 million in 71 portfolio companies at December 31, 2014. At December 31, 2013 and December 31, 2012, the Company's only investment was its investment in the Predecessor Operating Company. The fair value of the Predecessor Operating Company's investments was approximately $1,115.7 million in 59 portfolio companies at December 31, 2013 and $989.8 million in 63 portfolio companies at December 31, 2012 and $703.5 million in 55 portfolio companies at December 31, 2011.2012.
Table of Contents
The following table shows the Company's portfolio and investment activity for the year ended December 31, 2014 and the Predecessor Operating Company's portfolio and investment activity for the years ended December 31, 2013 December 31, 2012 and December 31, 2011:2012:
| | | | | | | | | | |
| | Years ended December 31, | |
|---|
(in millions)
| | 2014(1) | | 2013 | | 2012 | |
|---|
New investments in 43, 34 and 45 portfolio companies, respectively | | $ | 720.9 | | $ | 529.3 | | $ | 673.2 | |
Debt repayments in existing portfolio companies | | | 267.5 | | | 395.4 | | | 299.2 | |
Sales of securities in 14, 12 and 22 portfolio companies, respectively | | | 117.0 | | | 31.2 | | | 124.7 | |
Change in unrealized appreciation on 20, 45 and 48 portfolio companies, respectively | | | 21.2 | | | 27.9 | | | 27.0 | |
Change in unrealized depreciation on 60, 29 and 30 portfolio companies, respectively | | | (63.9 | ) | | (19.9 | ) | | (17.1 | ) |
| | | | | | | | | | |
| | Years ended December 31, | |
|---|
(in millions)
| | 2013 | | 2012 | | 2011 | |
|---|
New investments in 34, 45 and 37 portfolio companies, respectively | | $ | 529.3 | | $ | 673.2 | | $ | 493.3 | |
Debt repayments in existing portfolio companies | | | 395.4 | | | 299.2 | | | 146.4 | |
Sales of securities in 12, 22 and 17 portfolio companies, respectively | | | 31.2 | | | 124.7 | | | 85.6 | |
Change in unrealized appreciation on 45, 48 and 17 portfolio companies, respectively | | | 27.9 | | | 27.0 | | | 6.1 | |
Change in unrealized depreciation on 29, 30 and 48 portfolio companies, respectively | | | (19.9 | ) | | (17.1 | ) | | (29.2 | ) |
- (1)
- For the year ended December 31, 2014, amounts represent the investment activity of the Predecessor Operating Company through and including May 7, 2014 and the investment activity of the Company from May 8, 2014 through December 31, 2014.
At December 31, 2013 and2014, the Company's weighted average Yield to Maturity at Cost was approximately 10.7%. At December 31, 2012,2013, the Predecessor Operating Company's weighted average Yield to Maturity was approximately 10.6%at Cost and 10.1%, respectively. Thisweighted average Yield to Maturity was approximately 11.0% and 10.6%, respectively. The Yield to Maturity at Cost ("Yield to Maturity at Cost") calculation assumes that all investments, including secured collateralized agreements, not on non-accrual are purchased at fair valuethe adjusted cost on December 31, 2013 and December 31, 2012, respectively,the quarter end date and held until their respective maturities with no prepayments or losses and exited at par at maturity. Adjusted cost reflects the GAAP cost for post-IPO investments and a stepped up cost basis of pre-IPO investments (assuming a step-up to fair market value occurred on the IPO date). This calculation excludes the impact of existing leverage. Yield to Maturity at Cost uses the London Interbank Offered Rate ("LIBOR") curves at each quarter's end date. The actual yield to maturity may be higher or lower due to the future selection of the London Interbank Offered Rate ("LIBOR")LIBOR contracts by the individual companies in the Operating Company's portfolio or other factors. The Yield to Maturity calculation used in prior years for the Predecessor Operating Company assumed that all investments not on non-accrual were purchased at fair value on December 31, 2013 and held until their respective maturities with no prepayments or losses and exited at par at maturity.
The following summarizes the Operating Company's ten largest portfolio company investments and top ten industries in which the Operating Company was invested as of December 31, 2013,2014, calculated as a percentage of total assets as of December 31, 2013.2014.
| | | | |
Portfolio Company | | Percent of
Total Assets | |
|---|
Global Knowledge Training LLC | | | 3.4 | % |
Ascend Learning, LLC | | | 2.9 | % |
TIBCO Software Inc. | | | 2.9 | % |
Tenawa Resource Holdings LLC | | | 2.8 | % |
Deltek, Inc. | | | 2.7 | % |
Kronos Incorporated | | | 2.5 | % |
McGraw-Hill Global Education Holdings, LLC | | | 4.02.4 | % |
Global Knowledge Training LLC
| | | 3.9 | % |
Deltek,Tolt Solutions, Inc.
| | | 3.6 | % |
UniTek Global Services, Inc.
| | | 3.5 | % |
Edmentum, Inc. (fka Plato, Inc.).
| | | 3.32.4 | % |
Crowley Holdings Preferred, LLC | | | 3.12.4 | % |
SRA International, Inc. Acrisure, LLC
| | | 3.0 | % |
Kronos Incorporated
| | | 2.8 | % |
Rocket Software, Inc.
| | | 2.7 | % |
Pinnacle Holdco S.à r.l. / Pinnacle (US) Acquisition Co Limited
| | | 2.62.3 | % |
Table of Contents
| | | | |
Industry | | Percent of
Total Assets | |
|---|
Software | | | 21.7 | % |
Education
| | | 20.519.0 | % |
Business Services | | | 12.717.2 | % |
Education | | | 16.6 | % |
Federal Services | | | 8.2 | % |
Healthcare Services | | | 7.6 | % |
Distribution & Logistics | | | 10.5 | % |
Federal Services
| | | 7.3 | % |
Healthcare Services
| | | 7.06.4 | % |
Energy | | | 6.05.5 | % |
Media | | | 4.0 | % |
Healthcare Products
| | | 3.6 | % |
Consumer Services | | | 1.43.5 | % |
Business Products | | | 1.7 | % |
Investment Criteria
The Investment Adviser has identified the following investment criteria and guidelines for use in evaluating prospective portfolio companies. However, not all of these criteria and guidelines were, or will be, met in connection with each of the Operating Company's investments.
- •
- Defensive growth industries. The
Operating Company seeks to invest in industries that can succeed in both robust and weak economic environments but which are also sufficiently large and growing to achieve high valuations providing enterprise value cushion for ourthe Company's targeted debt securities.
- •
- High barriers to competitive entry. The
Operating Company targets industries and companies that have well defined industries and well established, understandable barriers to competitive entry.
- •
- Recurring revenue. Where possible, the
Operating Company focuses on companies that have a high degree of predictability in future revenue.
- •
- Flexible cost structure. The
Operating Company seeks to invest in businesses that have limited fixed costs and therefore modest operating leverage.
- •
- Strong free cash flow and high return on assets. The
Operating Company focuses on businesses with a demonstrated ability to produce meaningful free cash flow from operations. The Operating Company typically targets companies that are not asset intensive and that have minimal capital expenditure and minimal working capital growth needs.
- •
- Sustainable business and niche market dominance. The
Operating Company seeks to invest in businesses that exert niche market dominance in their industry and that have a demonstrated history of sustaining market leadership over time.
- •
- Established companies. The
Operating Company seeks to invest in established companies with sound historical financial performance. The Operating Company does not intend to invest in start-up companies or companies with speculative business plans.
- •
- Private equity sponsorship. The
Operating Company generally seeks to invest in companies in conjunction with private equity sponsors who it knows and trusts and who have proven capabilities in building value.
- •
- Seasoned management team. The
Operating Company generally requires that its portfolio companies have a seasoned management team with strong corporate governance. Oftentimes the Operating Company has a historical relationship with or direct knowledge of key managers from previous investment experience.
Table of Contents
Investment Selection and Process
The Investment Adviser believes it has developed a proven, consistent and replicable investment process to execute the Operating Company's investment strategy. The Investment Adviser seeks to identify the most attractive investment sectors from the top down and then works to become the most advantaged investor in these sectors. The steps in the Investment Adviser's process include:
- •
- Identifying attractive investment sectors top down;
- •
- Creating competitive advantages in the selected industry sectors; and
- •
- Targeting companies with leading market share and attractive business models in its chosen sectors.
Investment Committee
The Investment Adviser's investment committee (the "Investment Committee") currently consists of Steven B. Klinsky, Robert A. Hamwee, Adam Collins, Douglas LondalB. Weinstein, Michael B. Ajouz and John R. Kline. In addition, the executive officers and certain investment professionals are invited to all Investment Committee meetings. The Investment Committee is responsible for approving all of the Operating Company's investment purchases above $5.0$10.0 million. The Investment Committee also approves all asset dispositions above $5.0$10.0 million. Purchases and dispositions below $5.0$10.0 million may be approved by the Operating Company's Chief Executive Officer. These approval thresholds are subject to change over time. We expect to benefit from the extensive and varied relevant experience of the investment professionals serving on the Investment Committee, which includes expertise in private equity, primary and secondary leveraged credit, private mezzanine finance and distressed debt.
The purpose of the Investment Committee is to evaluate and approve, as deemed appropriate, all investments by the Investment Adviser, subject to certain thresholds. The Investment Committee process is intended to bring the diverse experience and perspectives of the Investment Committee's members to the analysis and consideration of every investment. The Investment Committee also serves to provide investment consistency and adherence to the Investment Adviser's investment philosophies and policies. The Investment Committee also determines appropriate investment sizing.
In addition to reviewing investments, the Investment Committee meetings serve as a forum to discuss credit views and outlooks. Potential transactions and investment opportunities are also reviewed on a regular basis. Members of the Operating Company's investment team are encouraged to share information and views on credits with the committee early in their analysis. This process improves the quality of the analysis and assistsenables the deal team members to work more efficiently.
Investment Structure
The Operating Company targets debt investments that will yield meaningful current income and occasionally provide the opportunity for capital appreciation through equity securities. The Operating Company's debt investments are typically structured with the maximum seniority and collateral that the Operating Company can reasonably obtain while seeking to achieve its total return target.
Debt Investments
The terms of the Operating Company's debt investments are tailored to the facts and circumstances of the transaction and prospective portfolio company and structured to protect its rights and manage its risk while creating incentives for the portfolio company to achieve its business plan. A substantial source of return is the cash interest that the Operating Company collects on its debt investments.
Table of Contents
- •
- First Lien Loans and Bonds. First lien loans and bonds generally have terms of four to seven years, provide for a variable or fixed interest rate, may contain prepayment penalties and are
Table of Contents
In addition, from time to time the Operating Company may also enter into revolving credit facilities, bridge financing commitments, delayed draw commitments or other commitments which can result in providing future financing to a portfolio company.
Equity Investments
When the Operating Company makes a debt investment, it may be granted equity in the portfolio company in the same class of security as the sponsor receives upon funding. In addition, the Operating Company may from time to time make non-control, equity co-investments in conjunction with private equity sponsors. The Operating Company generally seeks to structure its equity investments, such as direct equity co-investments, to provide it with minority rights provisions and event-driven put rights. The Operating Company also seeks to obtain limited registration rights in connection with these investments, which may include "piggyback" registration rights.
Portfolio Company Monitoring
The Operating Company monitors the performance and financial trends of its portfolio companies on at least a quarterly basis. The Operating Company attempts to identify any developments within the portfolio company, the industry or the macroeconomic environment that may alter any material element of its original investment strategy. The Operating Company uses several methods of evaluating and monitoring the performance of its investments, including but not limited to, the following:
- •
- review of monthly
andand/or quarterly financial statements and financial projections for portfolio companies provided by its management;
- •
- ongoing dialogue with and review of original diligence sources;
- •
- periodic contact with portfolio company management (and, if appropriate, the private equity sponsor) to discuss financial position, requirements and accomplishments; and
- •
- assessment of business development success, including product development, profitability and the portfolio company's overall adherence to its business plan.
The Operating Company uses an investment rating system to characterize and monitor the credit profile and expected level of returns on each investment in the portfolio. The Operating Company uses a four-level numeric rating scale as follows:
- •
- Investment Rating 1—Investment is performing materially above expectations;
Table of Contents
- •
- Investment Rating 2—Investment is performing materially in-line with expectations. All new loans are rated 2 at initial purchase;
Table of Contents
- •
- Investment Rating 3—Investment is performing materially below expectations and risk has increased materially since the original investment; and
- •
- Investment Rating 4—Investment is performing substantially below expectations and risks have increased substantially since the original investment. Payments may be delinquent. There is meaningful possibility that the
Operating Company will not recoup its original cost basis in the investment and may realize a substantial loss upon exit.
The following table shows the distribution of the Operating Company's investments on the 1 to 4 investment rating scale at fair value as of December 31, 2013:2014:
|
| | As of December 31, 2013 | | | As of December 31, 2014 | |
|---|
(in millions)
Investment Rating | | Par Value(1) | | Percent | | Fair Value | | Percent | | | Par Value(1) | | Percent | | Fair Value | | Percent | |
|---|
Investment Rating 1 | | $ | 169.6 | | 15.8 | % | $ | 178.1 | | 16.0 | % | | $ | 255.7 | | 18.1 | % | $ | 277.4 | | 19.5 | % |
Investment Rating 2 | | 883.6 | | 82.7 | % | | 929.9 | | 83.3 | % | | 1,061.6 | | 75.0 | % | | 1,089.7 | | 76.5 | % |
Investment Rating 3 | | 13.6 | | 1.3 | % | | 7.3 | | 0.7 | % | | 82.9 | | 5.9 | % | | 48.3 | | 3.4 | % |
Investment Rating 4 | | 1.8 | | 0.2 | % | | 0.4 | | — | %(2) | | 14.2 | | 1.0 | % | | 9.3 | | 0.6 | % |
| | | | | | | | | | | |
| | | | | | | | | | | | | | | | | | | | | | | |
| | $ | 1,068.6 | | 100.0 | % | $ | 1,115.7 | | 100.0 | % | | $ | 1,414.4 | | 100.0 | % | $ | 1,424.7 | | 100.0 | % |
- (1)
- Excludes shares and warrants.
(2)Percent was less than 0.05%.
Exit Strategies/Refinancing
The Operating Company exits its investments typically through one of four scenarios: (i) the sale of the portfolio company itself resulting in repayment of all outstanding debt, (ii) the recapitalization of the portfolio company in which the Operating Company's loan is replaced with debt or equity from a third party or parties (in some cases, the Operating Company may choose to participate in the newly issued loan(s)), (iii) the repayment of the initial or remaining principal amount of the Operating Company's loan then outstanding at maturity or (iv) the sale of the debt investment by the Operating Company. In some investments, there may be scheduled amortization of some portion of the Operating Company's loan which would result in a partial exit of its investment prior to the maturity of the loan.
Valuation
At all times consistent with accounting principles generally accepted in the United States of America ("GAAP")GAAP and the 1940 Act, the Operating Company conducts a valuation of assets, which impacts its net asset value, and, consequently, the net asset values of NMFC and AIV Holdings. NMFC and AIV Holdings value their ownership interest on a quarterly basis, or more frequently if required under the 1940 Act.value.
The Operating Company applies fair value accounting in accordance with GAAP. The Operating Company values its assets on a quarterly basis, or more frequently if required under the 1940 Act. In all cases, the Operating Company's board of directors is ultimately and solely responsible for determining the fair value of theits portfolio investments on a quarterly basis in good faith, including investments that are not publicly traded, those whose market prices are not readily available and any other situation where its portfolio investments require a fair value determination. Security transactions
Table of Contents
are accounted for on a trade date basis. The Operating Company's quarterly valuation procedures are set forth in more detail below:
- (1)
- Investments for which market quotations are readily available on an exchange are valued at such market quotations based on the closing price indicated from independent pricing services.
- (2)
- Investments for which indicative prices are obtained from various pricing services and/or brokers or dealers are valued through a multi-step valuation process, as described below, to determine whether the quote(s) obtained is representative of fair value in accordance with GAAP.
Table of Contents
- a.
- Bond quotes are obtained through independent pricing services. Internal reviews are performed by the investment professionals of the Investment Adviser to ensure that the quote obtained is representative of fair value in accordance with GAAP and if so, the quote is used. If the Investment Adviser is unable to sufficiently validate the quote(s) internally and if the investment's par value or its fair value exceeds the materiality threshold, the investment is valued similarly to those assets with no readily available quotes (see (3) below); and
- b.
- For investments other than bonds, the
Operating Company looks at the number of quotes readily available and performs the following:
- i.
- Investments for which two or more quotes are received from a pricing service are valued using the mean of the mean of the bid and ask of the quotes obtained;
- ii.
- Investments for which one quote is received from a pricing service are validated internally. The investment professionals of the Investment Adviser analyze the market quotes obtained using an array of valuation methods (further described below) to validate the fair value. If the Investment Adviser is unable to sufficiently validate the quote internally and if the investment's par value or its fair value exceeds the materiality threshold, the investment is valued similarly to those assets with no readily available quotes (see (3) below).
- (3)
- Investments for which quotations are not readily available through exchanges, pricing services, brokers, or dealers are valued through a multi-step valuation process:
- a.
- Each portfolio company or investment is initially valued by the investment professionals of the Investment Adviser responsible for the credit monitoring;
- b.
- Preliminary valuation conclusions will then be documented and discussed with the
Operating Company's senior management;
- c.
- If an investment falls into (3) above for four consecutive quarters and if the investment's par value or its fair value exceeds the materiality threshold, then at least once each fiscal year, the valuation for each portfolio investment for which the
Operating Company does not have a readily available market quotation will be reviewed by an independent valuation firm engaged by the Companies'Company's board of directors; and
- d.
- When deemed appropriate by the
Operating Company's management, an independent valuation firm may be engaged to review and value investment(s) of a portfolio company, without any preliminary valuation being performed by the Investment Adviser. The investment professionals of the Investment Adviser will review and validate the value provided.
For investments in revolving credit facilities and delayed draw commitments, the cost basis of the funded investments purchased is offset by any costs/netbacks received for any unfunded portion on the total balance committed. The fair value is also adjusted for the price appreciation or depreciation on the
Table of Contents
unfunded portion. As a result, the purchase of commitments not completely funded may result in a negative fair value until it is called and funded.
The values assigned to investments are based upon available information and do not necessarily represent amounts which might ultimately be realized, since such amounts depend on future circumstances and cannot be reasonably determined until the individual positions are liquidated. Due to the inherent uncertainty of determining the fair value of investments that do not have a readily available market value, the fair value of the Operating Company's investments may fluctuate from period to period and the fluctuations could be material.
Table of Contents
Operating and Regulatory Environment
As with other companies regulated by the 1940 Act, a BDC must adhere to certain regulatory requirements. The 1940 Act contains prohibitions and restrictions relating to investments by a BDC in another investment company as well as transactions between BDCs and their affiliates, principal underwriters and affiliates of those affiliates or underwriters. A BDC must be organized in the U.S. for the purpose of investing in or lending to primarily private companies and making significant managerial assistance available to them. A BDC may use capital provided by public stockholders and from other sources to make long-term, private investments in businesses. A BDC provides stockholders the ability to retain the liquidity of a publicly traded stock while sharing in the possible benefits, if any, of investing in primarily privately owned companies.
The Operating Company NMFC and AIV Holdings each havehas a board of directors. A majority of the Companies'Company's board of directors must be persons who are not interested persons, as that term is defined in the 1940 Act. As BDCs,a BDC, we are prohibited from protecting any director or officer against any liability to us or ourthe Company's stockholders arising from willful misfeasance, bad faith, gross negligence or reckless disregard of the duties involved in the conduct of such person's office. Additionally, we are required to provide and maintain a bond issued by a reputable fidelity insurance company to protect the BDC.
As a BDC, each of the CompaniesCompany is required to meet a coverage ratio of the value of total assets to total senior securities, which include all of its borrowings, excluding SBA-guaranteed debentures, and any preferred stock we may issue in the future, of at least 200.0% (i.e., the amount of debt may not exceed 50.0% of the value of the Operating Company's total assets or the Operating Company may borrow an amount equal to 100.0% of net assets). The Operating Company monitors its compliance with this coverage ratio on a regular basis, however, NMFC and AIV Holdings have no material long-term liabilities themselves and their only business and sole asset is their ownership of the Operating Company. NMFC and AIV Holdings are relying on the provisions of Section 12(d)(1)(E) of the 1940 Act, which requires, among other things, that their respective investment in the Operating Company be their only asset and that their respective stockholders are entitled to vote on a "pass-through" basis with the Operating Company's other voting security holders.basis.
NMFCThe Company may, to the extent permitted under the 1940 Act, issue additional equity capital, which would in turn increase the equity capital available to the Operating Company. NMFCcapital. The Company is generally not able to issue and sell its common stock at a price below net asset value per share. NMFCThe Company may, however, sell its common stock, or warrants, options or rights to acquire its common stock, at a price below the then-current net asset value of its common stock if its board of directors determines that such sale is in the best interests of NMFCthe Company and the best interests of its stockholders, and its stockholders approve such sale. In addition, NMFCthe Company may generally issue new shares of its common stock at a price below net asset value in rights offerings to existing stockholders and in certain other limited circumstances.
As a BDC, the Operating Company is generally not permitted to invest in any portfolio company in which the Investment Adviser or any of its affiliates currently have an investment or to make any
Table of Contents
co-investments with the Investment Adviser or its affiliates without an exemptive order from the Securities and Exchange Commission.SEC.
We may not change the nature of our business so as to cease to be, or withdraw our election as, a BDC unless authorized by vote of a majority of the outstanding voting securities, as required by the 1940 Act. A majority of the outstanding voting securities of a company is defined under the 1940 Act as the lesser of: (a) 67.0% or more of such company's voting securities present at a meeting if more than 50.0% of the outstanding voting securities of such company are present or represented by proxy, or (b) more than 50.0% of the outstanding voting securities of such company. We do not anticipate any substantial change in the nature of our business.
In addition, as BDCs,a BDC, the Companies areCompany is not permitted to issue stock or units in consideration for services.
NMFC's and AIV Holdings' Table of Contents
Taxation as a Regulated Investment Company
NMFC and AIV Holdings haveThe Company has elected to be treated, and intendintends to comply with the requirements to continue to qualify annually, as RICsa RIC under Subchapter M of the Code. As RICs, NMFC and AIV Holdingsa RIC, the Company generally will not pay corporate-level U.S. federal income taxes on any net ordinary income or capital gains that theyit timely distributedistributes to theirits stockholders as dividends. Rather, dividends distributed by NMFC or AIV Holdingsthe Company generally will be taxable to NMFC's or AIV Holdings'its stockholders, and any net operating losses, foreign tax credits and other tax attributes of NMFC or AIV Holdingsthe Company generally will not pass through to NMFC's or AIV Holdings'its stockholders, subject to special rules for certain items such as net capital gains and qualified dividend income recognized by NMFC and AIV Holdings.the Company.
To qualify as RICs, NMFC and AIV Holdingsa RIC, the Company must, among other things, meet certain source-of-income and asset diversification requirements. In addition, to qualify as RICs, NMFC and AIV Holdingsa RIC, the Company must distribute to theirits stockholders, for each taxable year, at least 90.0% of theirits "investment company taxable income", which is generally theirits net ordinary income plus the excess of realized net short-term capital gains over realized net long-term capital losses (the "Annual Distribution Requirement").
NMFC and AIV HoldingsThe Company will be subject to a 4.0% nondeductible federal excise tax on certain undistributed income unless they distributeit distributes in a timely manner an amount at least equal to the sum of (1) 98.0% of theirits respective net ordinary income for each calendar year, (2) 98.2% of theirits respective capital gain net income for the one-year period ending October 31 in that calendar year and (3) any income recognized, but not distributed, in preceding years (the "Excise Tax Avoidance Requirement"). While NMFC and AIV Holdings intendthe Company intends to make distributions to theirits stockholders in each taxable year that will be sufficient to avoid any federal excise tax on theirits earnings, there can be no assurance that NMFC or AIV Holdingsthe Company will be successful in entirely avoiding this tax. For the year ended December 31, 2013, NMFC and AIV Holdings accrued federal excise taxes of $2.3 thousand and zero, respectively.
In order to qualify as RICs for U.S. federal income tax purposes, NMFC and AIV Holdingsthe Company must, among other things:
- •
- continue to qualify as
BDCsa BDC under the 1940 Act at all times during each taxable year;
- •
- derive in each taxable year at least 90.0% of
theirits respective gross income from dividends, interest, payments with respect to loans of certain securities, gains from the sale of stock or other securities, net income from certain "qualified publicly traded partnerships", or other income derived with respect to NMFC's or AIV Holdings'the Company's business of investing in such stock or securities (the "90.0% Income Test"); and
Table of Contents
- •
- diversify
theirits holdings so that at the end of each quarter of the taxable year:
- •
- at least 50.0% of the
respective valuesvalue of NMFC's or AIV Holdings'the Company's assets consists of cash, cash equivalents, U.S. government securities, securities of other RICs, and other securities if such other securities of any one issuer do not represent more than 5.0% of the respective valuesvalue of NMFC's or AIV Holdings'the Company's assets or more than 10.0% of the outstanding voting securities of the issuer; and
- •
- no more than 25.0% of the
respective valuesvalue of NMFC's or AIV Holdings'the Company's assets is invested in the securities, other than U.S. government securities or securities of other RICs, of one issuer, of two or more issuers that are controlled, as determined under applicable Code rules, by NMFC or AIV Holdingsthe Company and that are engaged in the same or similar or related trades or businesses or of certain "qualified publicly traded partnerships" (the "Diversification Tests").
A RIC is limited in its ability to deduct expenses in excess of its "investment company taxable income" (which is, generally, net ordinary income plus the excess of realized net short-term capital gains over realized net long-term capital losses). If the Company's expenses in a given year exceed its investment company taxable income, the Company would experience a net operating loss for that year. However, a RIC is not permitted to carry forward net operating losses to subsequent years and such net operating losses do not pass through to its stockholders. In addition, expenses can be used only to
Table of Contents
offset investment company taxable income, not net capital gain. A RIC may not use any net capital losses (that is, realized capital losses in excess of realized capital gains) to offset the RIC's investment company taxable income, but may carry forward such losses, and use them to offset capital gains, indefinitely. Due to these limits on the deductibility of expenses and net capital losses, the Company may for tax purposes have aggregate taxable income for several years that it is required to distribute and that is taxable to its stockholders even if such income is greater than the aggregate net income the Company actually earned during those years.
Failure to Qualify as a Regulated Investment Company
If NMFC or AIV Holdingsthe Company fails to satisfy the 90.0% Income Test or the Diversification Tests for any taxable year or quarter of such taxable year, theyit may nevertheless continue to qualify as a RIC for such year if certain relief provisions of the Code apply (which may, among other things, require it to pay certain corporate-level U.S. federal income taxes or to dispose of certain assets). If NMFC or AIV Holdingsthe Company fails to qualify for treatment as a RIC and such relief provisions do not apply, to NMFC or AIV Holdings, NMFC or AIV Holdingsthe Company will be subject to U.S. federal income tax on all of its taxable income at regular corporate rates (and also will be subject to any applicable state and local taxes), regardless of whether NMFC or AIV Holdingsthe Company makes any distributions to its stockholders. Distributions would not be required. However, if distributions were made, any such distributions would be taxable to its stockholders as ordinary dividend income and, subject to certain limitations under the Code, any such distributions would be eligible for the 20.0% maximum rate applicable to non-corporate taxpayers to the extent of NMFC's or AIV Holdings'the Company's current or accumulated earnings and profits. Subject to certain limitations under the Code, corporate distributees would be eligible for the dividends-received deduction. Distributions in excess of NMFC's or AIV Holdings'the Company's current and accumulated earnings and profits would be treated first as a return of capital to the extent of the stockholder's tax basis, and any remaining distributions would be treated as a capital gain.
Subject to a limited exception applicable to RICs that qualified as such under Subchapter M of the Code for at least one year prior to disqualification and that requalify as a RIC no later than the second year following the non-qualifying year, NMFC and AIV Holdingsthe Company could be subject to tax on any unrealized net built-in gains in the assets held by NMFC or AIV Holdingsthe Company during the period in which NMFC or AIV Holdingsit failed to qualify as a RIC that are recognized during the ten-year period (or five-year period for taxable years beginning during 2013) after its requalification as a RIC, unless NMFC or AIV Holdingsthe Company made a special election to pay corporate-level U.S. federal income tax on such built-in gain at the time of NMFC's or AIV Holdings'the Company's requalification as a RIC. NMFC or AIV HoldingsThe Company may decide to be taxed as a regular corporation even if NMFC or AIV Holdingsit would otherwise qualify as a RIC if NMFC or AIV Holdingsthe Company determines that treatment as a corporation for a particular year would be in its best interests.
SBA Regulation
On August 1, 2014, the Company's wholly-owned direct and indirect subsidiary, SBIC LP received a license from the SBA to operate as a SBIC under Section 301(c) of the 1958 Act. SBIC LP has an investment strategy and philosophy substantially similar to the Company and makes similar types of investments in accordance with SBA regulations.
A license allows SBIC LP to incur leverage by issuing SBA-guaranteed debentures, subject to the issuance of a capital commitment and certain approvals by the SBA and customary procedures. SBA-guaranteed debentures carry long-term fixed rates that are generally lower than rates on comparable bank and other debt. Under the regulations applicable to SBICs, a standard debenture licensed SBIC is eligible for two tiers of leverage capped at $150.0 million, where each tier is equivalent to the SBIC's regulatory capital, which generally equates to the amount of equity capital in the SBIC. Debentures guaranteed by the SBA have a maturity of ten years, require semi-annual payments of interest and do not require any principal payments prior to maturity. As of December 31, 2014, SBIC LP had $37.5 million of outstanding SBA-guaranteed debentures. SBIC LP is subject to
Table of Contents
regulation and oversight by the SBA, including requirements with respect to reporting financial information, such as the extent of capital impairment if applicable, on a regular basis and annual examinations conducted by the SBIC. The SBA, as a creditor, will have a superior claim to SBIC LP's assets over the Company's stockholders in the event SBIC LP is liquidated or the SBA exercises its remedies under the SBA-guaranteed debentures issued by SBIC LP upon an event of default.
On November 5, 2014, the Company received exemptive relief from the SEC to permit the Company to exclude the SBA-guaranteed debentures of SBIC LP from the Company's 200.0% asset coverage test under the 1940 Act. As such, the Company's ratio of total consolidated assets to outstanding indebtedness may be less than 200.0%. This provides the Company with increased investment flexibility but also increases the Company's risks related to leverage.
SBICs are designed to stimulate the flow of private investor capital to eligible small businesses as defined by the SBA. Under SBA regulations, SBICs may make loans to eligible small businesses, invest in the equity securities of such businesses and provide them with consulting and advisory services. Under present SBA regulations, eligible small businesses generally include businesses that (together with their affiliates) have a tangible net worth not exceeding $19.5 million for the most recent fiscal year and have average annual net income after U.S. federal income taxes not exceeding $6.5 million (average net income to be computed without benefit of any carryover loss) for the two most recent fiscal years. In addition, an SBIC must invest 25.0% of its investment capital to "smaller business", as defined by the SBA. The definition of a smaller business generally includes businesses that have a tangible net worth not exceeding $6.0 million for the most recent fiscal year and have average annual net income after U.S. federal income taxes not exceeding $2.0 million (average net income to be computed without benefit of any net carryover loss) for the two most recent fiscal years. SBA regulations also provide alternative size standard criteria to determine eligibility for designation as an eligible small business or smaller concern, which criteria depend on the primary industry in which the business is engaged and is based on such factors as the number of employees and gross revenue. However, once an SBIC has invested in an eligible small business, it may continue to make follow on investments in the company, regardless of the size of the company at the time of the follow on investment.
The SBA prohibits an SBIC from providing funds to small businesses with certain characteristics, such as businesses with the majority of their employees located outside the U.S., or from investing in project finance, real estate, farmland, financial intermediaries or "passive" (i.e. non-operating) businesses. Without prior SBA approval, an SBIC may not invest an amount equal to more than approximately 30.0% of the SBIC's regulatory capital in any one company and its affiliates.
The SBA places certain limitations on the financing terms of investments by SBICs in portfolio companies (such as limiting the permissible interest rate on debt securities held by an SBIC in a portfolio company). An SBIC may exercise control over a small business for a period of up to seven years from the date on which the SBIC initially acquires its control position. This control period may be extended for an additional period of time with the SBA's prior written approval.
The SBA restricts the ability of an SBIC to lend money to any of its officers, directors and employees or to invest in associates thereof. The SBA also prohibits, without prior SBA approval, a "change of control" of an SBIC or transfers that would result in any person (or a group of persons acting in concert) owning 10.0% or more of a class of capital stock of a licensed SBIC. A "change of control" is any event which would result in the transfer of the power, direct or indirect, to direct the management and policies of a SBIC, whether through ownership, contractual arrangements or otherwise.
The SBA regulations require, among other things, an annual periodic examination of a licensed SBIC by an SBA examiner to determine the SBIC's compliance with the relevant SBA regulations, and the performance of a financial audit by an independent auditor.
Table of Contents
Investment Management Agreement
The Companies areCompany is a closed-end, non-diversified management investment companiescompany that havehas elected to be treatedregulated as BDCsa BDC under the 1940 Act. NMFC and AIV Holdings are holding companies with no direct operations of their own, and their only business and sole asset are their ownership of units of the Operating Company. As a result, NMFC and AIV Holdings do not pay any external investment advisory or management fees. However, the OperatingThe Company is externally managed by
Table of Contents
the Investment Adviser and pays the Investment Adviser a fee for its services. The following summarizes the arrangements between the Operating Company and the Investment Adviser pursuant to an investment advisory and management agreement as amended and restated (the "Investment Management Agreement").
Management Services
The Investment Adviser is registered as an Investment Adviser under the Investment Advisers Act of 1940 (the "Advisers Act").Act. The Investment Adviser serves pursuant to the Investment Management Agreement in accordance with the 1940 Act. Subject to the overall supervision of the Operating Company's board of directors, the Investment Adviser manages the Operating Company's day-to-day operations and provides it with investment advisory and management services. Under the terms of the Investment Management Agreement, the Investment Adviser:
- •
- determines the composition of the
Operating Company's portfolio, the nature and timing of the changes to its portfolio and the manner of implementing such changes;
- •
- determines the securities and other assets that the
Operating Company will purchase, retain or sell;
- •
- identifies, evaluates and negotiates the structure of the
Operating Company's investments that the Operating Company makes;
- •
- executes, monitors and services the investments the
Operating Company makes;
- •
- performs due diligence on prospective portfolio companies;
- •
- votes, exercises consents and exercises all other rights appertaining to such securities and other assets on behalf of the
Operating Company; and
- •
- provides the
Operating Company with such other investment advisory, research and related services as the Operating Company may, from time to time, reasonably require.
The Investment Adviser's services under the Investment Management Agreement are not exclusive, and the Investment Adviser (so long as its services to the Operating Company are not impaired) and/or other entities affiliated with New Mountain Capital are permitted to furnish similar services to other entities.
Management Fees
Pursuant to the Investment Management Agreement, the Operating Company has agreed to pay the Investment Adviser a fee for investment advisory and management services consisting of two components—a base management fee and an incentive fee. The cost of both the base management fee payable to the Investment Adviser and any incentive fees paid in cash to the Investment Adviser are borne by the Operating Company's members, including NMFC and AIV HoldingsCompany and, as a result, are indirectly borne by NMFC's and AIV Holdings'common stockholders.
Base Management Fees
The base management fee is calculated at an annual rate of 1.75% of the Operating Company's gross assets less (i) the borrowings under the Operating Company's senior loan fund's Loan and Security Agreement with Wells Fargo Bank, National Association, dated October 27, 2010, as amended, (the "SLF Credit Facility") and (ii) cash and cash equivalents. The base management fee is payable quarterly in arrears, and is calculated based on the average value of the Operating Company's gross assets, borrowings under the SLF Credit Facility, and cash and cash equivalents at the end of each of the two most recently completed calendar quarters, and appropriately adjusted on a pro rata basis for any equity capital raises or repurchases during the current calendar quarter. The Company has not invested, and currently is not
Table of Contents
invested, in derivatives. To the extent the Company invests in derivatives in the future, the Company will use the actual value of the derivatives, as reported on its Consolidated Statements of Assets and Liabilities, for purposes of calculating its base management fee.
Since IPO, the base management fee calculation has deducted the borrowings under the SLF Credit Facility. The SLF Credit Facility has historically consisted of primarily lower yielding assets at higher advance rates. As part of an amendment to the Company's existing credit facilities with Wells Fargo Bank, National Association, the SLF Credit Facility merged with NMF Holdings' Loan and Security Agreement with Wells Fargo Bank, National Association, dated May 19, 2011, as amended and restated, (the "Predecessor Holdings Credit Facility") and into the Second Amended and Restated Loan and Security Agreement with Wells Fargo Bank, National Association (the "Holdings Credit Facility") on December 18, 2014. SeeItem 8.—Financial Statements and Supplementary Data—Note 7, Borrowings for additional information on the Company's credit facilities. Post credit facility merger and to be consistent with the methodology since IPO, the Investment Advisor will waive management fees on the leverage associated with those assets that share the same underlying yield characteristics with investments leveraged under the legacy SLF Credit Facility. The Investment Advisor cannot recoup management fees that the Investment Advisor has previously waived. For the year ended December 31, 2014, total management fees waived were approximately $0.7 million.
Incentive Fees
The incentive fee consists of two parts. The first part is calculated and payable quarterly in arrears and equals 20.0% of the Operating Company's "Pre-Incentive Fee Adjusted Net Investment Income" for the immediately preceding quarter, subject to a "preferred return", or "hurdle", and a "catch-up" feature. "Pre-Incentive Fee Net Investment Income" means interest income, dividend income and any other income (including any other fees (other than fees for providing managerial assistance), such as commitment, origination, structuring, diligence and consulting fees or other fees that the Operating Company receives from portfolio companies) accrued during the calendar quarter, minus the Operating Company's operating expenses for the quarter (including the base management fee, expenses payable under an administration agreement, as amended and restated (the "Administration Agreement"), with the Administrator, and any interest expense and distributions paid on any issued and outstanding preferred membership unitsstock (of which there are none as of December 31, 2013)2014), but excluding the incentive fee). Pre-Incentive Fee Net Investment Income includes, in the case of investments with a deferred interest feature (such as original issue discount, debt instruments with PIK interest and zero coupon securities), accrued income that the Operating Company has not yet received in cash. Pre-Incentive Fee Net Investment Income does not include any realized capital gains, realized capital losses or unrealized capital appreciation or depreciation.
Under GAAP, NMFC's IPO did not step-up the cost basis of the Predecessor Operating Company's existing investments to fair market value at the IPO date. Since the total value of the Predecessor Operating Company's investments at the time of the IPO was greater than the investments' cost basis, a larger amount of amortization of purchase or original issue discount, as well as different amounts in realized gain and unrealized appreciation, may be recognized under GAAP in each period than if the step-up had occurred. This will remain until such predecessor investments are sold, repaid or mature in the future. The Operating Company tracks the transferred (or fair market) value of each of its investments as of the time of the IPO and, for purposes of the incentive fee calculation, adjusts Pre-Incentive Fee Net Investment Income to reflect the amortization of purchase or original issue discount on the Operating Company's investments as if each investment was purchased at the date of the IPO, or stepped up to fair market value. This is defined as "Pre-Incentive Fee Adjusted Net Investment Income". The Operating Company also uses the transferred (or fair market) value of each of its investments as of the time of the IPO to adjust capital gains ("Adjusted Realized Capital Gains") or losses ("Adjusted
Table of Contents
Realized Capital Losses") and unrealized capital appreciation ("Adjusted Unrealized Capital Appreciation") and unrealized capital depreciation ("Adjusted Unrealized Capital Depreciation").
Pre-Incentive Fee Adjusted Net Investment Income, expressed as a rate of return on the value of the Operating Company's net assets at the end of the immediately preceding calendar quarter, will be compared to a "hurdle rate" of 2.0% per quarter (8.0% annualized), subject to a "catch-up" provision measured as of the end of each calendar quarter. The hurdle rate is appropriately pro-rated for any partial periods. The calculation of the Operating Company's incentive fee with respect to the Pre-Incentive Fee Adjusted Net Investment Income for each quarter is as follows:
- •
- No incentive fee is payable to the Investment Adviser in any calendar quarter in which the
Operating Company's Pre-Incentive Fee Adjusted Net Investment Income does not exceed the hurdle rate of 2.0% (the "preferred return" or "hurdle").
- •
- 100.0% of the
Operating Company's Pre-Incentive Fee Adjusted Net Investment Income with respect to that portion of such Pre-Incentive Fee Adjusted Net Investment Income, if any, that exceeds the hurdle rate but is less than or equal to 2.5% in any calendar quarter (10.0% annualized) is payable to the Investment Adviser. This portion of the Operating Company's Pre-Incentive Fee Adjusted Net Investment Income (which exceeds the hurdle rate but is less than or equal to 2.5%) is referred to as the "catch-up". The catch-up provision is intended to provide the Investment Adviser with an incentive fee of 20.0% on all of the Operating
Table of Contents
The second part will be determined and payable in arrears as of the end of each calendar year (or upon termination of the Investment Management Agreement) and will equal 20.0% of the Operating Company's Adjusted Realized Capital Gains, if any, on a cumulative basis from inception through the end of each calendar year, computed net of all Adjusted Realized Capital Losses and Adjusted Unrealized Capital Depreciation on a cumulative basis, less the aggregate amount of any previously paid capital gain incentive fee.
In accordance with GAAP, the Operating Company accrues a hypothetical capital gains incentive fee based upon the cumulative net Adjusted Realized Capital Gains and Adjusted Realized Capital Losses and the cumulative net Adjusted Unrealized Capital Appreciation and Adjusted Unrealized Capital Depreciation on investments held at the end of each period. Actual amounts paid to the Investment Adviser are consistent with the Investment Management Agreement and are based only on actual Adjusted Realized Capital Gains computed net of all Adjusted Realized Capital Losses and Adjusted Unrealized Capital Depreciation on a cumulative basis from inception through the end of each calendar year as if the entire portfolio was sold at fair value.
Example 1: Income Related Portion of Incentive Fee for Each Calendar Quarter*:
Alternative 1
Assumptions
Investment income (including interest, dividends, fees, etc.) = 1.25%
Hurdle rate(1) = 2.00%
Management fee(2) = 0.44%
Other expenses (legal, accounting, safekeeping agent, transfer agent, etc.)(3) = 0.20%
Table of Contents
Pre-Incentive Fee Adjusted Net Investment Income does not exceed the hurdle rate, therefore there is no income-relatedincome related incentive fee.
Alternative 2
Assumptions
Investment income (including interest, dividends, fees, etc.) = 2.90%
Hurdle rate(1) = 2.00%
Management fee(2) = 0.44%
Other expenses (legal, accounting, safekeeping agent, transfer agent, etc.)(3) = 0.20%
Pre-Incentive Fee Adjusted Net Investment Income
(investment income -– (management fee + other expenses)) = 2.26%
Incentive fee = 100.00% × Pre-Incentive Fee Adjusted Net Investment Income (subject to "catch-up")(4)
Table of Contents
Pre-Incentive Fee Adjusted Net Investment Income exceeds the hurdle rate, but does not fully satisfy the "catch-up" provision, therefore the income related portion of the incentive fee is 0.26%.
Alternative 3
Assumptions
Investment income (including interest, dividends, fees, etc.) = 3.50%
Hurdle rate(1) = 2.00%
Management fee(2) = 0.44%
Other expenses (legal, accounting, safekeeping agent, transfer agent, etc.)(3) = 0.20%
Pre-Incentive Fee Adjusted Net Investment Income
(investment income -– (management fee + other expenses)) = 2.86%
Incentive fee = 100.00% × Pre-Incentive Fee Adjusted Net Investment Income (subject to "catch-up")(4)
Incentive fee = 100.00% × "catch-up" + (20.00% × (Pre-Incentive Fee Adjusted Net Investment Income -– 2.50%))
Catch-up = 2.50% -– 2.00%
= 0.50%
Incentive fee = (100.00% × 0.50%) + (20.00% × (2.86% -– 2.50%))
= 0.50% + (20.00% × 0.36%)
= 0.50% + 0.07%
= 0.57%
Pre-Incentive Fee Adjusted Net Investment Income exceeds the hurdle rate, and fully satisfies the "catch-up" provision, therefore the income related portion of the incentive fee is 0.57%.
- *
- The hypothetical amount of pre-incentive fee net investment income shown is based on a percentage of total net assets and assumes, for the
Operating Company's investments held prior to the IPO,
Table of Contents
interest income has been adjusted to reflect the amortization of purchase or original issue discount as if each investment was purchased at the date of the IPO, or stepped up to fair market value.
- (1)
- Represents 8.00% annualized hurdle rate.
- (2)
- Assumes 1.75% annualized base management fee.
- (3)
- Excludes organizational and offering expenses.
- (4)
- The "catch-up" provision is intended to provide the Investment Adviser with an incentive fee of 20.00% on all Pre-Incentive Fee Adjusted Net Investment Income as if a hurdle rate did not apply when the
Operating Company's net investment income exceeds 2.50% in any calendar quarter.
Table of Contents
Example 2: Capital Gains Portion of Incentive Fee*:
Alternative 1:
Assumptions
Year 1: $20.0 million investment made in Company A ("Investment A"), and $30.0 million investment made in Company B ("Investment B")
Year 2: Investment A sold for $50.0 million and fair market value ("FMV") of Investment B determined to be $32.0 million
Year 3: FMV of Investment B determined to be $25.0 million
Year 4: Investment B sold for $31.0 million
The capital gains portion of the incentive fee would be:
Year 1: None
Year 2: Capital gains incentive fee of $6.0 million—($30.0 million realized capital gains on sale of Investment A multiplied by 20.0%)
Year 3: None—$5.0 million (20.0% multiplied by ($30.0 million cumulative capital gains less $5.0 million cumulative capital depreciation)) less $6.0 million (previous capital gains fee paid in Year 2)
Year 4: Capital gains incentive fee of $0.2 million—$6.2 million ($31.0 million cumulative realized capital gains multiplied by 20.0%) less $6.0 million (capital gains incentive fee taken in Year 2)
Alternative 2
Assumptions
Year 1: $20.0 million investment made in Company A ("Investment A"), $30.0 million investment made in Company B ("Investment B") and $25.0 million investment made in Company C ("Investment C")
Year 2: Investment A sold for $50.0 million, FMV of Investment B determined to be $25.0 million and FMV of Investment C determined to be $25.0 million
Year 3: FMV of Investment B determined to be $27.0 million and Investment C sold for $30.0 million
Year 4: FMV of Investment B determined to be $35.0 million
Year 5: Investment B sold for $20.0 million
Table of Contents
The capital gains incentive fee, if any, would be:
Year 1: None
Year 2: $5.0 million capital gains incentive fee—20.0% multiplied by $25.0 million ($30.0 million realized capital gains on Investment A less $5.0 million unrealized capital depreciation on Investment B)
Year 3: $1.4 million capital gains incentive fee—$6.4 million (20.0% multiplied by $32.0 million ($35.0 million cumulative realized capital gains less $3.0 million unrealized capital depreciation)) less $5.0 million capital gains incentive fee received in Year 2
Table of Contents
Year 4: $0.6 million capital gains incentive fee—$7.0 million (20.0% multiplied by $35.0 million cumulative realized capital gains) less cumulative $6.4 million capital gains incentive fee received in Year 2 and Year 3
Year 5: None—$5.0 million (20.0% multiplied by $25.0 million (cumulative realized capital gains of $35.0 million less realized capital losses of $10.0 million)) less $7.0 million cumulative capital gains incentive fee paid in Year 2, Year 3 and Year 4(1)
- *
- The hypothetical amounts of returns shown are based on a percentage of the
Operating Company's total net assets and assume no leverage. There is no guarantee that positive returns will be realized and actual returns may vary from those shown in this example. The capital gains incentive fees are calculated on an "adjusted" basis for the Operating Company's investments held prior to the IPO and assumes those investments have been adjusted to reflect the amortization of purchase or original issue discount as if each investment was purchased at the date of the IPO, or stepped up to fair market value.
- (1)
- As noted above, it is possible that the cumulative aggregate capital gains fee received by the Investment Adviser ($7.0 million) is effectively greater than $5.0 million (20.0% of cumulative aggregate realized capital gains less net realized capital losses or net unrealized depreciation ($25.0 million)).
Payment of Expenses
The Operating Company's primary operating expenses are the payment of a base management fee and any incentive fees under the Investment Management Agreement and the allocable portion of overhead and other expenses incurred by the Administrator in performing its obligations to the CompaniesCompany under the Administration Agreement. The Operating Company bears all other expenses of the Companies'its operations and transactions, including (without limitation) fees and expenses relating to:
- •
- organizational and offering expenses;
- •
- the investigation and monitoring of the
Operating Company's investments;
- •
- the cost of calculating net asset value;
- •
- interest payable on debt, if any, to finance its investments;
- •
- the cost of effecting sales and repurchases of shares of NMFC's common stock and other securities;
- •
- management and incentive fees payable pursuant to the Investment Management Agreement;
- •
- fees payable to third parties relating to, or associated with, making investments and valuing investments (including third-party valuation firms);
- •
- transfer agent and custodial fees;
Table of Contents
- •
- fees and expenses associated with marketing efforts (including attendance at investment conferences and similar events);
- •
- federal and state registration fees;
- •
- any exchange listing fees;
- •
- federal, state, local and foreign taxes;
- •
- independent directors' fees and expenses;
- •
- brokerage commissions;
Table of Contents
- •
- costs of proxy statements, stockholders' reports and notices;
- •
- costs of preparing government filings, including periodic and current reports with the
Securities and Exchange Commission;SEC;
- •
- fees and expenses associated with independent audits and outside legal costs;
- •
- costs associated with reporting and compliance obligations under the 1940 Act and applicable federal and state securities laws;
- •
- fidelity bond, liability insurance and other insurance premiums; and
- •
- printing, mailing and all other direct expenses incurred by either the Investment Adviser or the
CompaniesCompany in connection with administering our business, including payments under the Administration Agreement that is based upon the CompaniesCompany's allocable portion of overhead and other expenses incurred by the Administrator in performing its obligations to the CompaniesCompany under the Administration Agreement, including the allocable portion of the compensation of the Companies'Company's chief financial officer and chief compliance officer and their respective staffs.
Qualifying Assets
Under the 1940 Act, a BDC may not acquire any asset other than assets of the type listed in Section 55(a) of the 1940 Act, which are referred to as qualifying assets, unless, at the time the acquisition is made, qualifying assets represent at least 70.0% of the BDC's total assets. Since NMFC and AIV Holdings have no assets other than their ownership of units of the Operating Company and have no material long-term liabilities, NMFC and AIV Holdings look to the Operating Company's assets for purposes of satisfying these requirements. The principal categories of qualifying assets relevant to our business are any of the following:
- 1)
- Securities purchased in transactions not involving any public offering from the issuer of such securities, which issuer (subject to certain limited exceptions) is an eligible portfolio company, or from any person who is, or has been during the preceding 13 months, an affiliated person of an eligible portfolio company, or from any other person, subject to such rules as may be prescribed by the
Securities and Exchange Commission.SEC. An eligible portfolio company is defined in the 1940 Act as any issuer which:
- (a)
- is organized under the laws of, and has its principal place of business in, the U.S.;
- (b)
- is not an investment company (other than a small business investment company
wholly ownedwholly-owned by the BDC) or a company that would be an investment company but for certain exclusions under the 1940 Act; and
- (c)
- satisfies any of the following:
- (i)
- does not have any class of securities that is traded on a national securities exchange;
- (ii)
- has a class of securities listed on a national securities exchange, but has an aggregate market value of outstanding voting and non-voting common equity of less than $250.0 million;
Table of Contents
- (iii)
- is controlled by a BDC or a group of companies including a BDC and the BDC has an affiliated person who is a director of the eligible portfolio company; or
- (iv)
- is a small and solvent company having total assets of not more than $4.0 million and capital and surplus of not less than $2.0 million.
- 2)
- Securities of any eligible portfolio company that the
Operating Company controls.
Table of Contents
- 3)
- Securities purchased in a private transaction from a U.S. issuer that is not an investment company or from an affiliated person of the issuer, or in transactions incident thereto, if the issuer is in bankruptcy and subject to reorganization or if the issuer, immediately prior to the purchase of its securities was unable to meet its obligations as they came prior to the purchase of its securities was unable to meet its obligations as they came due without material assistance other than conventional lending or financing arrangements.
- 4)
- Securities of an eligible portfolio company purchased from any person in a private transaction if there is no ready market for such securities and the
Operating Company already owns 60.0% of the outstanding equity of the eligible portfolio company.
- 5)
- Securities received in exchange for or distributed on or with respect to securities described in (1) through (4) above, or pursuant to the exercise of warrants or rights relating to such securities.
- 6)
- Cash, cash equivalents, U.S. government securities or high-quality debt securities maturing in one year or less from the time of investment.
In addition, a BDC must have been organized and have its principal place of business in the U.S. and must be operated for the purpose of making investments in the types of securities described in (1), (2) or (3) above.
As of December 31, 2013, 3.7%2014, 9.4% of the Operating Company's total assets were not qualifying assets.
Managerial Assistance to Portfolio Companies
In order to count portfolio securities as qualifying assets for the purpose of the 70.0% test, the Operating Company must either control the issuer of the securities orBDCs generally must offer to make available to the issuer of the securities (other than small and solvent companies described above) significant managerial assistance, except that,in circumstances where either (i) the Operating CompanyBDC controls such issuer of securities or (ii) the BDC purchases such securities in conjunction with one or more other persons acting together and one of the other persons in the group may makemakes available such managerial assistance. Making available managerial assistance means, among other things, any arrangement whereby the BDC offers to provide, and, if accepted, does so provide, significant guidance and counsel concerning the management, operations or business objectives and policies of a portfolio company. The Administrator or its affiliate provides such managerial assistance on the Operating Company's behalf to portfolio companies that request this assistance.
Temporary Investments
Pending investments in other types of qualifying assets, the Operating Company's investments may consist of cash, cash equivalents, U.S. government securities or high-quality debt securities maturing in one year or less from the time of investment (collectively, as "temporary investments"), so that 70.0% of the Operating Company's assets are qualifying assets. Typically, the Operating Company will invest in U.S. Treasury bills or in repurchase agreements, provided that such agreements are fully collateralized by cash or securities issued by the U.S. government or its agencies. A repurchase agreement involves the purchase by an investor, such as the Operating Company, of a specified security and the simultaneous agreement by the seller to repurchase it at an agreed-upon future date and at a price that is greater than the purchase price by an amount that reflects an agreed-upon interest rate. There is no percentage restriction on the proportion of the Operating Company's assets that may be invested in such repurchase agreements. However, if more than
Table of Contents
25.0% of the Operating Company's total assets constitute repurchase agreements from a single counterparty, NMFC and AIV Holdingsthe Company would not meet the Diversification Tests in order to qualify as a RIC for U.S. federal income tax purposes. Thus, the Operating Company does not intend to enter into repurchase agreements with a single counterparty in
Table of Contents
excess of this limit. The Investment Adviser will monitor the creditworthiness of the counterparties with which the Operating Company enters into repurchase agreement transactions.
Senior Securities
The Operating Company is permitted, under specified conditions, to issue multiple classes of debt and one class of membership units senior to its common membership units if the Operating Company's asset coverage, as defined in the 1940 Act, is at least equal to 200.0% immediately after each such issuance. In addition, while any senior securities remain outstanding (other than any indebtedness issued in consideration of a privately arranged loan, such as any indebtedness outstanding under the Operating Company's Amended and Restated Loan and SecurityHoldings Credit Facility, or the Senior Secured Revolving Credit Agreement with Wells FargoGoldman Sachs Bank USA and Morgan Stanley, N.A., dated June 4, 2014, as amended (together with the related guarantee and security agreement) (the "NMFC Credit Facility") or the convertible notes issued on June 3, 2014 under an indenture between the Company and U.S. Bank National Association dated May 19, 2011, as amended (the "Holdings Credit Facility""Convertible Notes"), or the SLF Credit Facility)), the CompaniesCompany must make provisions to prohibit any distribution to theirits stockholders or unit holders, as applicable, or the repurchase of theirits equity securities unless the Operating Company meets the applicable asset coverage ratios at the time of the distribution or repurchase. The Operating Company may also borrow amounts up to 5.0% of the value of its total assets for temporary or emergency purposes without regard to its asset coverage. The Operating Company will include the assets and liabilities of NMF SLFNMFC and all of its wholly-owned direct and indirect subsidiaries for purposes of calculating the asset coverage ratio. The Company received exemptive relief from the SEC on November 5, 2014, allowing the Company to modify the asset coverage requirement to exclude SBA-guaranteed debentures from this calculation. For a discussion of the risks associated with leverage, seeItem 1A.—Risk Factors.
Code of Ethics
The Companies haveCompany has adopted a code of ethics pursuant to Rule 17j-1 under the 1940 Act that establishes procedures for personal investments and restricts certain personal securities transactions. Personnel subject to the code may invest in securities for their personal investment accounts, including securities that may be purchased or held by the Operating Company so long as such investments are made in accordance with the code's requirements. You may read and copy the code of ethics at the Securities and Exchange Commission'sSEC's Public Reference Room located at 100 F Street, N.E., Washington, D.C. 20549. You may obtain information on the operation of the Public Reference Room by calling the Securities and Exchange CommissionSEC at 1-800-SEC-0330, and copies of the code of ethics may be obtained, after paying a duplication fee, by electronic request at the following e-mail address: publicinfo@sec.gov. In addition, the code of ethics is available on the Securities and Exchange Commission'sSEC's Internet site athttp://www.sec.gov.
Compliance Policies and Procedures
The CompaniesCompany and the Investment Adviser have adopted and implemented written policies and procedures reasonably designed to prevent violation of the federal securities laws and the Companies areCompany is required to review these compliance policies and procedures annually for their adequacy and the effectiveness of their implementation. The Companies'Company's chief compliance officer is responsible for administering these policies and procedures.
Proxy Voting Policies and Procedures
The Operating Company has delegated its proxy voting responsibility to the Investment Adviser. The proxy voting policies and procedures of the Investment Adviser are set forth below. The guidelines will be reviewed periodically by the Investment Adviser and the Operating Company's non-interested directors, and, accordingly, are subject to change.
Table of Contents
Introduction
As an investment adviser registered under the Advisers Act, the Investment Adviser has a fiduciary duty to act solely in the best interests of its clients. As part of this duty, it recognizes that it must vote
Table of Contents
the Operating Company's securities in a timely manner free of conflicts of interest and in the best interests of the Companies.Company.
The policies and procedures for voting proxies for the investment advisory clients of the Investment Adviser are intended to comply with Section 206 of, and Rule 206(4)-6 under, the Advisers Act.
Proxy policies
The Investment Adviser will vote proxies relating to the Operating Company's securities in the best interest of the Companies.Company. It will review on a case-by-case basis each proposal submitted for a stockholder vote to determine its impact on the portfolio securities held by the Operating Company. Although the Investment Adviser will generally vote against proposals that may have a negative impact on its clients' portfolio securities, it may vote for such a proposal if there exists compelling long-term reasons to do so.
The proxy voting decisions of the Investment Adviser are made by the senior officers who are responsible for monitoring each of its clients' investments. To ensure that its vote is not the product of a conflict of interest, it will require that: (a) anyone involved in the decision making process disclose to its chief compliance officer any potential conflict that he or she is aware of and any contact that he or she has had with any interested party regarding a proxy vote; and (b) employees involved in the decision making process or vote administration are prohibited from revealing how the Investment Adviser intends to vote on a proposal in order to reduce any attempted influence from interested parties.
Proxy voting records
You may obtain, without charge, information regarding how the Operating Company voted proxies with respect to the Operating Company's portfolio securities by making a written request for proxy voting information to: Chief Compliance Officer, 787 Seventh Avenue, 48th Floor, New York, New York 10019.
Staffing
The Companies doCompany does not have any employees. Day-to-day investment operations that are conducted by the Operating Company are managed by the Investment Adviser. See "Investment Management Agreement". The Operating Company reimburses the Administrator for the allocable portion of overhead and other expenses incurred by it in performing its obligations to the CompaniesCompany under the Administration Agreement, including the compensation of the Companies'Company's chief financial officer and chief compliance officer, and their respective staffs. For a more detailed discussion of the Administration Agreement, seeItem 8.—Financial Statements and Supplementary Data—Note 5, Agreements.
Sarbanes-Oxley Act of 2002
The Sarbanes-Oxley Act of 2002 imposes a variety of regulatory requirements on publicly-held companies and their insiders. Many of these requirements affect the Companies.Company. For example:
- •
- pursuant to Rule 13a-14 of the Exchange Act, the chief executive officer and chief financial officer of the
CompaniesCompany are required to certify the accuracy of the financial statements contained in the Companies'Company's periodic reports;
- •
- pursuant to Item 307 of Regulation S-K, the
Companies'Company's periodic reports are required to disclose theirits respective conclusions about the effectiveness of theirits disclosure controls and procedures;
Table of Contents
- •
- pursuant to Rule 13a-15 of the Exchange Act, the
Companies'Company's management is required to prepare a report regarding their assessment of their respective internal control over financial reporting and is required to obtain an audit of the effectiveness of internal control over financial reporting performed by theirthe Company's independent registered public accounting;accounting firm; and
- •
- pursuant to Item 308 of Regulation S-K and Rule 13a-15 of the Exchange Act, the
Companies'Company's periodic reports are required to disclose whether there were significant changes in theirits respective internal controls over financial reporting or in other factors that could significantly affect these controls subsequent to the date of theirits evaluation, including any corrective actions with regard to significant deficiencies and material weaknesses.
The Sarbanes-Oxley Act of 2002 requires the CompaniesCompany to review theirits current policies and procedures to determine whether they comply with the Sarbanes-Oxley Act of 2002 and the regulations promulgated thereunder. The Companies intendCompany intends to monitor theirits compliance with all regulations that are adopted under the Sarbanes-Oxley Act of 2002 and will take actions necessary to ensure that they areit is in compliance therewith.
Available Information
We file with or submit to the Securities and Exchange CommissionSEC annual, quarterly and current periodic reports, proxy statements and other information as required by the 1940 Act. You may inspect and copy any materials we file with the Securities and Exchange CommissionSEC at the Public Reference Room of the Securities and Exchange CommissionSEC at 100 F Street, N.E., Washington, D.C. 20549 or by calling the Securities and Exchange CommissionSEC at 1-800-SEC-0330. The Securities and Exchange CommissionSEC maintains an internet site that contains reports, proxy and information statements and other information filed electronically by us with the Securities and Exchange CommissionSEC athttp://www.sec.gov.
We make available free of charge on our website,http://www.newmountainfinance.com, our reports, proxies and information statements and other information as soon as reasonably practicable after we electronically file such materials with, or furnish to, the Securities and Exchange Commission.SEC. Information contained on our website or on the Securities and Exchange Commission'sSEC's website about us is not incorporated into this annual report and should not be considered to be a part of this annual report.
Privacy Notice
Your privacy is very important to us. This Privacy Notice sets forth our policies with respect to non-public personal information about our stockholders and prospective and former stockholders. These policies apply to stockholders of the CompaniesCompany and may be changed at any time, provided a notice of such change is given to you. This notice supersedes any other privacy notice you may have received from us.
We will safeguard, according to strict standards of security and confidentiality, all information we receive about you. The only information we collect from you is your name, address, number of shares you hold and your social security number. This information is used only so that we can send you annual reports and other information about us, and send you proxy statements or other information required by law.
We do not share this information with any non-affiliated third party except as described below.
- •
- Authorized Employees of the Investment Adviser. It is our policy that only authorized employees of our investment adviser who need to know your personal information will have access to it.
Table of Contents
- •
- Service Providers. We may disclose your personal information to companies that provide services on our behalf, such as recordkeeping, processing your trades, and mailing you information. These companies are required to protect your information and use it solely for the purpose for which they received it.
Table of Contents
- •
- Courts and Government Officials. If required by law, we may disclose your personal information in accordance with a court order or at the request of government regulators. Only that information required by law, subpoena, or court order will be disclosed.
We seek to carefully safeguard your private information and, to that end, restrict access to non-public personal information about you to those employees and other persons who need to know the information to enable us to provide services to you. We maintain physical, electronic and procedural safeguards to protect your non-public personal information.
If you have any questions regarding this policy or the treatment of your non-public personal information, please contact our Chief Compliance Officer at (212) 655-0024.
Table of Contents
Item 1A. Risk Factors
You should carefully consider the significant risks described below, together with all of the other information included in this combined Form 10-K, including our consolidated financial statements and the related combined notes, before making an investment decision in any of the Companies.Company. The risks set forth below are not the only risks that we face. Additional risks and uncertainties not currently known to us or that we currently deem to be immaterial may materially affect our business, our structure, the Operating Company'sour financial condition, the Operating Company'sour investments and/or operating results. If any of the following events occur, our business, financial condition and results of operations could be materially and adversely affected. In such case, our net asset valuesvalue and the trading price of NMFC's common stock could decline. There can be no assurance that we will achieve the Operating Company'sour investment objective and you may lose all or part of your investment.
RISKS IN THE CURRENT ECONOMIC ENVIRONMENT
Uncertainty about the financial stability of the United States and of several countries in the European Union (EU) could have a significant adverse effect on the Operating Company's business, results of operations and financial condition, thus affecting the financial condition and earnings of NMFC and AIV Holdings.
Due to federal budget deficit concerns, S&P downgraded the federal government's credit rating from AAA to AA+ for the first time in history on August 5, 2011. Further, Moody's and Fitch have warned that they may downgrade the federal government's credit rating. Further downgrades or warnings by S&P or other rating agencies, and the government's credit and deficit concerns in general, could cause interest rates and borrowing costs to rise, which may negatively impact both the perception of credit risk associated with the Operating Company's debt portfolio and the Operating Company's ability to access the debt markets on favorable terms. In addition, a decreased credit rating could create broader financial turmoil and uncertainty, which may weigh heavily on the Companies' financial performance and the value of NMFC's common stock.
In 2010, a financial crisis emerged in Europe, triggered by high budget deficits and rising direct and contingent sovereign debt in Greece, Ireland, Italy, Portugal and Spain, which created concerns about the ability of these nations to continue to service their sovereign debt obligations. Risks and ongoing concerns resulting from the debt crisis in Europe could have a detrimental impact on the global economic recovery, sovereign and non-sovereign debt in these countries and the financial condition of European financial institutions. Market and economic disruptions have affected, and may continue to affect, consumer confidence levels and spending, personal bankruptcy rates, levels of incurrence and default on consumer debt and home prices, among other factors. We cannot assure you
Table of Contents
that the market disruptions in Europe, including the increased cost of funding for certain governments and financial institutions, will not spread, and we cannot assure you that future assistance packages will be available, or if available, sufficient to stabilize the affected countries and markets in Europe or elsewhere. To the extent uncertainty regarding any economic recovery in Europe continues to negatively impact consumer confidence and consumer credit factors, the Companies' business and results of operations could be significantly and adversely affected.
On December 18, 2013, the U.S. Federal Reserve announced that it would scale back its bond-buying program, or quantitative easing, which is designed to stimulate the economy and expand the Federal Reserve's holdings of long-term securities until key economic indicators, such as the unemployment rate, show signs of improvement. The Federal Reserve signaled it would reduce its purchases of long-term Treasury bonds and would scale back on its purchases of mortgage-backed securities. It is unclear what effect, if any, the incremental reduction in the rate of the Federal Reserve's monthly purchases will have on the value of the Operating Company's investments. However, it is possible that absent continued quantitative easing by the Federal Reserve, these developments, along with the European sovereign debt crisis, could cause interest rates and borrowing costs to rise, which may negatively impact the Operating Company's ability to access the debt markets on favorable terms.
A failure or the perceived risk of a failure to raise the statutory debt limit of the United States could have a material adverse effect on the Companies' business, financial condition and results of operations.
As has been widely reported, the United States Treasury Secretary has stated that the federal government may not be able to meet its debt payments in the relatively near future unless the federal debt ceiling is raised. If legislation increasing the debt ceiling is not enacted and the debt ceiling is reached, the federal government may stop or delay making payments on its obligations. A failure by Congress to raise the debt limit would increase the risk of default by the United States on its obligations, as well as the risk of other economic dislocations.
If the U.S. government fails to complete its budget process or to provide for a continuing resolution before the expiration of the current continuing resolution, another federal government shutdown may result. Such a failure or the perceived risk of such a failure, consequently, could have a material adverse effect on the financial markets and economic conditions in the United States and throughout the world. It could also limit the Operating Company's ability and the ability of its portfolio companies to obtain financing, and it could have a material adverse effect on the valuation of the Operating Company's portfolio companies. Consequently, the continued uncertainty in the general economic environment, including the recent government shutdown and potential debt ceiling implications, as well in specific economies of several individual geographic markets in which the Operating Company's portfolio companies operate, could adversely affect the Companies' business, financial condition and results of operations.
RISKS RELATED TO OUR BUSINESS AND STRUCTURE
WeUncertainty about the financial stability of the United States (U.S.) and of several countries in the European Union (EU) could have a limited operating history.significant adverse effect on the Company's business, results of operations and financial condition, thus affecting the Company's financial condition and earnings.
NMFCDue to federal budget deficit concerns, S&P downgraded the federal government's credit rating from AAA to AA+ for the first time in history on August 5, 2011. Further, Moody's and AIV Holdings were formedFitch have warned that they may downgrade the federal government's credit rating. Further downgrades or warnings by S&P or other rating agencies, and the government's credit and deficit concerns in 2010general, could cause interest rates and 2011, respectively, whileborrowing costs to rise, which may negatively impact both the Operating Company commenced operations in October 2008, owning allperception of the operations, including all of the assets and liabilities, of the Predecessor Entities. NMFC and AIV Holdings are holding companies with no direct operations of their own, and their only business and sole asset are their ownership of units of the Operating Company. As a result, we are subject to many of the business risks and uncertaintiescredit risk associated with any new business, including the risk that weCompany's debt portfolio and the Company's ability to access the debt markets on favorable terms. In addition, a decreased credit rating could create broader financial turmoil and uncertainty, which may not achieveweigh heavily on the Operating Company's investment objectivefinancial performance and that, as a result, the value of NMFC's common stockstock.
In 2010, a financial crisis emerged in Europe, triggered by high budget deficits and rising direct and contingent sovereign debt in Greece, Ireland, Italy, Portugal and Spain, which created concerns about the ability of these nations to continue to service their sovereign debt obligations. Risks and ongoing concerns resulting from the debt crisis in Europe could have a detrimental impact on the global economic recovery, sovereign and non-sovereign debt in these countries and the Operatingfinancial condition of European financial institutions. Market and economic disruptions have affected, and may continue to affect, consumer confidence levels and spending, personal bankruptcy rates, levels of incurrence and default on consumer debt and home prices, among other factors. We cannot assure you that the market disruptions in Europe, including the increased cost of funding for certain governments and financial institutions, will not spread, and we cannot assure you that future assistance packages will be available, or if available, sufficient to stabilize the affected countries and markets in Europe or elsewhere. To the extent uncertainty regarding any economic recovery in Europe continues to negatively impact consumer confidence and consumer credit factors, the Company's unitsbusiness and results of operations could decline substantially.be significantly and adversely affected.
In October 2014, the U.S. Federal Reserve announced that it has terminated its bond-buying program, or quantitative easing, which was designed to stimulate the economy and expand the Federal Reserve's holdings of long-term securities until key economic indicators, such as the unemployment rate, showed signs of improvement. It is unclear what effect, if any, the Federal Reserve's termination of quantitative easing will have on the value of the Company's investments. However, it is possible that without quantitative easing by the Federal Reserve, these developments, along with the European sovereign debt crisis, could cause interest rates and borrowing costs to rise, which may negatively impact the Company's ability to access the debt markets on favorable terms.
Table of Contents
The Operating Company may suffer credit losses.
Investments in small and middle market businesses are highly speculative and involve a high degree of risk of credit loss. These risks are likely to increase during volatile economic periods, such as the U.S. and many other economies have recently been experiencing.
The Operating Company does not expect to replicate the Predecessor Entities' historical performance or the historical performance of other entities managed or supported by New Mountain Capital.
The Operating Company does not expect to replicate the Predecessor Entities' historical performance or the historical performance of New Mountain Capital's investments. The Operating Company's investment returns may be substantially lower than the returns achieved by the Predecessor Entities. Although the Predecessor Entities commenced operations during otherwise unfavorable economic conditions, this was a favorable environment in which the Predecessor Operating Company could conduct its business in light of its investment objectives and strategy. In addition, the Operating Company's investment strategies may differ from those of New Mountain Capital or its affiliates. The Companies,Company, as BDCs,a BDC and NMFC and AIV Holdings, as RICs, area RIC, is subject to certain regulatory restrictions that do not apply to New Mountain Capital or its affiliates.
The Operating Company is generally not permitted to invest in any portfolio company in which New Mountain Capital or any of its affiliates currently have an investment or to make any co-investments with New Mountain Capital or its affiliates, except to the extent permitted by the 1940 Act. This may adversely affect the pace at which the Operating Company makes investments. Moreover, the Operating Company may operate with a different leverage profile than the Predecessor Entities. Furthermore, none of the prior results from the Predecessor Entities were from public reporting companies, and all or a portion of these results were achieved in particularly favorable market conditions for the Predecessor Operating Company's investment strategy which may never be repeated. Finally, we can offer no assurance that the Operating Company's investment team will be able to continue to implement its investment objective with the same degree of success as it has had in the past.
There is uncertainty as to the value of the Operating Company's portfolio investments because most of its investments are, and may continue to be in private companies and recorded at fair value. In addition, because NMFC and AIV Holdings are holding companies, the fair values of the Operating Company's investments are determined by the Operating Company's board of directors in accordance with the Operating Company's valuation policy.
Some of the Operating Company's investments are and may be in the form of securities or loans that are not publicly traded. The fair value of these investments may not be readily determinable. Under the 1940 Act, the Operating Company is required to carry its portfolio investments at market value or, if there is no readily available market value, at fair value as determined in good faith by its board of directors, including to reflect significant events affecting the value of its securities. The Operating Company values its investments for which it does not have readily available market quotations quarterly, or more frequently as circumstances require, at fair value as determined in good faith by its board of directors in accordance with its valuation policy, which is at all times consistent with GAAP. SeeItem 8.—Financial Statements and Supplementary Data—Note 2, Summary of Significant Accounting Policies orNote 4, Fair Value for additional information on around valuations.
The Operating Company's board of directors utilizes the services of one or more independent third-party valuation firms to aid it in determining the fair value with respect to its material unquoted assets in accordance with its valuation policy. The inputs into the determination of fair value of these investments may require significant management judgment or estimation. Even if observable market data is available, such information may be the result of consensus pricing information or broker quotes,
Table of Contents
which include a disclaimer that the broker would not be held to such a price in an actual transaction. The non-binding nature of consensus pricing and/or quotes accompanied by disclaimers materially reduces the reliability of such information.
Table of Contents
The types of factors that the board of directors takes into account in determining the fair value of its investments generally include, as appropriate: available market data, including relevant and applicable market trading and transaction comparables, applicable market yields and multiples, security covenants, call protection provisions, information rights, the nature and realizable value of any collateral, the portfolio company's ability to make payments, its earnings and discounted cash flows and the markets in which it does business, comparisons of financial ratios of peer companies that are public, comparable merger and acquisition transactions and the principal market and enterprise values. Since these valuations, and particularly valuations of private securities and private companies, are inherently uncertain, may fluctuate over short periods of time and may be based on estimates, the Operating Company's determinations of fair value may differ materially from the values that would have been used if a ready market for these securities existed.
Due to this uncertainty, the Operating Company's fair value determinations may cause its net asset value, and, consequently, NMFC's and AIV Holdings' net asset value, on any given date, to be materially understateunderstated or overstate the value that the Operating Company may ultimately realize upon the sale of one or more of our investments.overstated. In addition, investors purchasing NMFC's common stock based on an overstated net asset value would pay a higher price than the realizable value of ourthat the Company's investments might warrant. Since NMFC and AIV Holdings are holding companies and their only business and sole asset are their ownership of units of the Operating Company, NMFC's and AIV Holdings' net asset values are based on the Operating Company's valuation and their percentage interest in the Operating Company.
Although the Operating Company's current board of directors is comprised of the same individuals as NMFC's and AIV Holdings' board of directors, there can be no assurances that the Operating Company's board composition will remain the same as NMFC and AIV Holdings. As a result, the value of your investment in NMFC or AIV Holdings could be similarly understated or overstated based on the Operating Company's fair value determinations. However, in the event that NMFC and/or AIV Holdings' board of directors believes that a different fair value for the Operating Company's investments is appropriate, NMFC and/or AIV Holdings' board of directors may discuss the differences in the valuations with the Operating Company's board of directors for the purposes of resolving the differences in valuation. The valuation procedures of NMFC and AIV Holdings are substantially similar to those utilized by the Operating Company described above.
The Operating Company may adjust quarterly the valuation of its portfolio to reflect its board of directors' determination of the fair value of each investment in its portfolio. Any changes in fair value are recorded in the Operating Company's statement of operations as net change in unrealized appreciation or depreciation.
The Operating Company's ability to achieve its investment objective depends on key investment personnel of the Investment Adviser. If the Investment Adviser were to lose any of its key investment personnel, the Operating Company's ability to achieve its investment objective could be significantly harmed.
The Operating Company depends on the investment judgment, skill and relationships of the investment professionals of the Investment Adviser, particularly Steven B. Klinsky and Robert A. Hamwee, as well as other key personnel to identify, evaluate, negotiate, structure, execute, monitor and service its investments. The Investment Adviser, as an affiliate of New Mountain Capital, is supported by New Mountain Capital's team, which as of December 31, 20132014 consisted of approximately 100 staff members of New Mountain Capital and its affiliates to fulfill its obligations to the Operating Company under the Investment Management Agreement. The Investment Adviser may also depend upon New
Table of Contents
Mountain Capital to obtain access to investment opportunities originated by the professionals of New Mountain Capital and its affiliates. The Operating Company's future success depends to a significant extent on the continued service and coordination of the key investment personnel of the Investment Adviser. The departure of any of these individuals could have a material adverse effect on the Operating Company's ability to achieve its investment objective.
The Investment Committee, which provides oversight over the Operating Company's investment activities, is provided by the Investment Adviser. The Investment Committee currently consists of five members. The loss of any member of the Investment Committee or of other senior professionals of the Investment Adviser and its affiliates without suitable replacement could limit the Operating Company's ability to achieve its investment objective and operate as we anticipate. This could have a material adverse effect on our financial condition, results of operation and cash flows. To achieve the Operating Company's investment objective, the Investment Adviser may hire, train, supervise and manage new investment professionals to participate in its investment selection and monitoring process. If the Investment Adviser is unable to find investment professionals or do so in a timely manner, our business, financial condition and results of operations could be adversely affected.
Table of Contents
The Investment Adviser has limited experience managing a BDC or a RIC, which could adversely affect our business.
Other than the Companies,Company, the Investment Adviser has not previously managed a BDC or a RIC. The 1940 Act and the Code impose numerous constraints on the operations of BDCs and RICs that do not apply to the other investment vehicles previously managed by the investment professionals of the Investment Adviser. For example, under the 1940 Act, BDCs are required to invest at least 70.0% of their total assets primarily in securities of qualifying U.S. private or thinly traded companies, cash, cash equivalents, U.S. government securities and other high quality debt investments that mature in one year or less. Moreover, qualification for taxation as a RIC under subchapter M of the Code requires satisfaction of source-of-income, asset diversification and annual distribution requirements. NMFC and AIV Holdings have no assets other than their ownership of units of the Operating Company and have no material long-term liabilities. As a result, NMFC and AIV Holdings look to the Operating Company's assets and income for purposes of satisfying the requirements under the 1940 Act applicable to BDCs and the requirements under the Code applicable to RICs. The failure to comply with these provisions in a timely manner could prevent NMFC, AIV Holdings and the Operating Company from qualifying as BDCsa BDC or NMFC and AIV Holdings from qualifying as RICsa RIC and could force us to pay unexpected taxes and penalties, which would have a material adverse effect on our performance. The Investment Adviser's lack of experience in managing a portfolio of assets under the constraints applicable to BDCs and RICs may hinder its ability to take advantage of attractive investment opportunities and, as a result, achieve the Operating Company's investment objective. If the Operating Company fails to maintain its status as a BDC or operate inas a manner consistent with NMFC's and AIV Holdings' status as RICs,RIC, its operating flexibility could be significantly reduced and NMFC and AIV Holdings may be unable to maintain their status as BDCs or RICs.reduced.
The Operating Company operates in a highly competitive market for investment opportunities and may not be able to compete effectively.
The Operating Company competes for investments with other BDCs and investment funds (including private equity and hedge funds), as well as traditional financial services companies such as commercial banks and other sources of funding. Many of its competitors are substantially larger and have considerably greater financial, technical and marketing resources than it does. For example, some competitors may have a lower cost of capital and access to funding sources that are not available to the Operating Company. In addition, some of the Operating Company's competitors may have higher risk tolerances or different risk assessments than the Operating Company has. Furthermore, many of the
Table of Contents
Operating Company's competitors have greater experience operating under, or are not subject to, the regulatory restrictions that the 1940 Act imposes on the CompaniesCompany as BDCsa BDC or the source-of-income, asset diversification and distribution requirements that NMFC and AIV Holdingsit must satisfy to maintain theirits RIC status. These characteristics could allow the Operating Company's competitors to consider a wider variety of investments, establish more relationships and offer better pricing and more flexible structuring than the Operating Company is able to do. There are a number of new BDCs that have recently completed their initial public offeringsIPO or that have filed registration statements with the Securities and Exchange Commission,SEC, which could create increased competition for investment opportunities.
The Operating Company may lose investment opportunities if it does not match its competitors' pricing, terms and structure. With respect to the investments the Operating Company makes, it does not seek to compete based primarily on the interest rates it may offer, and we believe that some of the Operating Company's competitors may make loans with interest rates that may be lower than the rates it offers. In the secondary market for acquiring existing loans, we expect the Operating Company to compete generally on the basis of pricing terms. If the Operating Company matches its competitors' pricing, terms and structure, it may experience decreased net interest income, lower yields and increased risk of credit loss. If the Operating Company is forced to match its competitors' pricing, terms and structure, it may not be able to achieve acceptable returns on its investments or may bear substantial risk of capital loss. Part of the Operating Company's competitive advantage stems from the fact that we believe the market for middle-market lending is underserved by traditional bank lenders and other financial sources. A significant increase in the number and/or the size of the Operating Company's competitors in this target market could force it to accept less attractive investment terms. The Operating Company may also compete for investment opportunities with accounts managed by the Investment Adviser or its affiliates. Although the Investment Adviser allocates opportunities in accordance with its policies and procedures, allocations to such other accounts reduces the amount and frequency of opportunities available to the Operating Company and may not be in the best
Table of Contents
interests of the Operating Company and, consequently, NMFC's and AIV Holdings' stockholders. Moreover, the performance of investment opportunities is not known at the time of allocation. If the Operating Company is not able to compete effectively, its business, financial condition and results of operations may be adversely affected, thus affecting the business, financial condition and results of operations of NMFC and AIV Holdings.operations. Because of this competition, there can be no assurance that the Operating Company will be able to identify and take advantage of attractive investment opportunities that it identifies or that it will be able to fully invest its available capital.
Our business, results of operations and financial condition depends on the Operating Company's ability to manage future growth effectively.
The Operating Company's ability to achieve its investment objective and to grow depends on the Investment Adviser's ability to identify, invest in and monitor companies that meet the Operating Company's investment criteria. Accomplishing this result on a cost-effective basis is largely a function of the Investment Adviser's structuring of the investment process, its ability to provide competent, attentive and efficient services to the Operating Company and its ability to access financing on acceptable terms. The Investment Adviser has substantial responsibilities under the Investment Management Agreement and may also be called upon to provide managerial assistance to the Operating Company's portfolio companies. These demands on the time of the Investment Adviser and its investment professionals may distract them or slow the Operating Company's rate of investment. In order to grow, the Operating Company and the Investment Adviser may need to retain, train, supervise and manage new investment professionals. However, these investment professionals may not be able to contribute effectively to the work of the Investment Adviser. If the Operating Company is unable to manage its future growth effectively, our business, results of operations and financial condition could be materially adversely affected.
Table of Contents
The incentive fee may induce the Investment Adviser to make speculative investments.
The incentive fee payable to the Investment Adviser may create an incentive for the Investment Adviser to pursue investments that are risky or more speculative than would be the case in the absence of such compensation arrangement, which could result in higher investment losses, particularly during cyclical economic downturns. The incentive fee payable to the Investment Adviser is calculated based on a percentage of the Operating Company's return on investment capital. This may encourage the Investment Adviser to use leverage to increase the return on the Operating Company's investments. In addition, because the base management fee is payable based upon the Operating Company's gross assets, which includes any borrowings for investment purposes, but excludes borrowings under the SLF Credit Facility and cash and cash equivalents for investment purposes, the Investment Adviser may be further encouraged to use leverage to make additional investments. Under certain circumstances, the use of leverage may increase the likelihood of default, which would impair the value of NMFC's and AIV Holdings' units of the Operating Company and, consequently, the value of NMFC's and AIV Holdings' common stock.
The incentive fee payable to the Investment Adviser also may create an incentive for the Investment Adviser to invest in instruments that have a deferred interest feature, even if such deferred payments would not provide the cash necessary for the Operating Company to make distributions to NMFC and AIV Holdings that enable NMFC and AIV Holdings to pay current distributions to theirNMFC's stockholders. Under these investments, the Operating Company would accrue the interest over the life of the investment but would not receive the cash income from the investment until the end of the investment's term, if at all. The Operating Company's net investment income used to calculate the income portion of the incentive fee, however, includes accrued interest. Thus, a portion of the incentive fee would be based on income that the Operating Company has not yet received in cash and may never receive in cash if the portfolio company is unable to satisfy such interest payment obligations. In addition, the "catch-up" portion of the incentive fee may encourage the Investment Adviser to accelerate or defer interest payable by portfolio companies from one calendar quarter to another, potentially resulting in fluctuations in timing and dividend amounts.
Table of Contents
The Operating Company may be obligated to pay the Investment Adviser incentive compensation even if the Operating Company incurs a loss.
The Investment Adviser is entitled to incentive compensation for each fiscal quarter in an amount equal to a percentage of the excess of the Operating Company's Pre-Incentive Fee Adjusted Net Investment Income for that quarter (before deducting incentive compensation) above a performance threshold for that quarter. Accordingly, since the performance threshold is based on a percentage of the Operating Company's net asset value, decreases in the Operating Company's net asset value makes it easier to achieve the performance threshold. The Operating Company's Pre-Incentive Fee Adjusted Net Investment Income for incentive compensation purposes excludes realized and unrealized capital losses or depreciation that it may incur in the fiscal quarter, even if such capital losses or depreciation result in a net loss on the Operating Company's statement of operations for that quarter. Thus, the Operating Company may be required to pay the Investment Adviser incentive compensation for a fiscal quarter even if there is a decline in the value of its portfolio or the Operating Company incurs a net loss for that quarter.
The Operating Company borrows money, which could magnify the potential for gain or loss on amounts invested in us and increase the risk of investing in us.
The Operating Company borrows money as part of its business plan. Borrowings, also known as leverage, magnify the potential for gain or loss on invested equity capital and may, consequently, increase the risk of investing in us. We expect the Operating Company to continue to use leverage to finance its investments. The Operating Company is generally prohibited from or subject to limitations
Table of Contents
on incurring additional indebtedness, including issuing any debtinvestments through senior securities under the Holdings Credit Facilityissued by banks and the SLF Credit Facility (the "Credit Facilities"), without obtaining any necessary approvals, consents, amendments or waivers from the lenders thereto. SeeItem 8.—Financial Statements and Supplementary Data—Note 7, Borrowing Facilities for a detailed discussion on the Credit Facilities.other lenders. Lenders of these senior securities have fixed dollar claims on the Operating Company's assets that are superior to NMFC's and AIV Holdings' claim as members of the Operating Company, and, consequently, superior to claims of NMFC's and AIV Holdings' common stockholders. If the value of the Operating Company's assets decreases, leveraging would cause its net asset value and, consequently, NMFC's and AIV Holdings' net asset value to decline more sharply than it otherwise would have had it not leveraged. Similarly, any decrease in the Operating Company's income would cause its net income and consequently NMFC's and AIV Holdings' net income to decline more sharply than they would have had it not borrowed. Such a decline could adversely affect the Operating Company's ability to make distributions to its members and, consequently, NMFC's and AIV Holdings' ability to make common stock dividend payments. In addition, because the Operating Company's investments may be illiquid, the Operating Company may be unable to dispose of them or to do so at a favorable price in the event it needs to do so if it is unable to refinance any indebtedness upon maturity and, as a result, we may suffer losses. Leverage is generally considered a speculative investment technique.
The Operating Company's ability to service any debt that it incurs depends largely on its financial performance and is subject to prevailing economic conditions and competitive pressures. Moreover, as the Investment Adviser's management fee is payable to the Investment Adviser based on gross assets, including those assets acquired through the use of leverage, the Investment Adviser may have a financial incentive to incur leverage which may not be consistent with NMFC's and AIV Holdings'the Company's interests and the interests of theirits common stockholders. In addition, holders of NMFC's and AIV Holdings' common stock will, indirectly, bear the burden of any increase in the Operating Company's expenses as a result of leverage, including any increase in the management fee payable to the Investment Adviser.
At December 31, 2013,2014, the Operating Company had $221.8$468.1 million, $50.0 million, $115.0 million and $214.7$37.5 million of indebtedness outstanding under the Holdings Credit Facility, the NMFC Credit Facility, the Convertible Notes and the SLF Credit Facility,SBA-guaranteed debentures, respectively. The Holdings Credit Facility had a weighted average interest rate of 2.9% for the year ended December 31, 20132014 and the SLFNMFC Credit Facility had a weighted average interest rate of 2.3%2.7% for the year ended December 31, 2013.2014. The interest rate on the Convertible Notes is 5.0% per year.
We may need to raise additional capital to grow the Operating Company.
All of the proceeds from the IPO, the Concurrent Private Placement and subsequent offerings by NMFC were contributed to the Operating Company in exchange for NMFC's and AIV Holdings' acquisition of units of the Operating Company. The Operating Company may need additional capital to fund new investments and grow its portfolio of investments once the Operatinggrow. The Company has fully invested these proceeds. NMFC may access the capital markets periodically to issue equity securities, which would in turn increase the equity capital available to the Operating Company.securities. In addition, the Operating Company may also issue debt securities or borrow from financial institutions in order to obtain such additional capital. AIV Holdings does not intend to raise any additional equity or debt capital. However, the Operating Company is generally prohibited from or subject to limitations on incurring additional indebtedness, including issuing any debt securities, under the Credit Facilities, without obtaining any necessary approvals, consents, amendments or waivers from the lenders thereto. NMFC is not permitted to own any securities other than its units of the Operating Company. As a result, any proceeds from offerings by NMFC of equity securities would be contributed to the Operating Company. Unfavorable economic conditions could increase NMFC and the Operating Company's funding costs and as a result AIV Holdings' funding costs, and limit theirits access to the
Table of Contents
capital markets or result in a decision by lenders not to extend credit to the Operating Company. A
Table of Contents
reduction in the availability of new capital could limit the Operating Company's ability to grow. In addition, each of NMFC and AIV Holdings arethe Company is required to distribute at least 90.0% of theirits net ordinary income and net short-term capital gains in excess of net long-term capital losses, if any, to theirits stockholders to maintain theirits RIC status. As a result, these earnings will not be available to fund new investments. If NMFC or the Operating Company is unable to access the capital markets or if the Operating Company is unable to borrow from financial institutions, the Operating Company may be unable to grow its business and execute its business strategy fully, and our earnings, if any, could decrease, which could have an adverse effect on the value of NMFC's and AIV Holdings'the Company's securities.
If the Operating Company is unable to comply with the covenants or restrictions in the Credit Facilities,its borrowings, our business could be materially adversely affected.
The Holdings Credit FacilitiesFacility include covenants that, subject to exceptions, among other things, generally prohibit the Operating Company from or subject it to limitations on incurring additional indebtedness (including issuing any debt securities) and restrict the Operating Company's ability to pay distributions, create liens on assets, make investments, make acquisitions and engage in mergers or consolidations. The Holdings Credit FacilitiesFacility also includeincludes a change of control provisionsprovision that accelerateaccelerates the indebtedness under the facility in the event of certain change of control events. Complying with these restrictions may prevent the Operating Company from taking actions that we believe would help it to grow its business or are otherwise consistent with its investment objective. These restrictions could also limit the Operating Company's ability to plan for or react to market conditions or meet extraordinary capital needs or otherwise restrict corporate activities. For example, these restrictions, as currently in effect, would prohibit the Operating Company from or subject it to limitations on incurring any additional indebtedness, which would include issuing any debt securities. However, in the event that the Operating Company obtains any necessary approvals, consents, amendments or waivers from the lenders under the Credit Facilities to permit the issuance of debt securities, the Operating Company may issue debt securities in one or more series. In addition, the restrictions contained in the Holdings Credit FacilitiesFacility could limit the Operating Company's ability to make distributions to its membersstockholders in certain circumstances, which could result in NMFC and AIV Holdingsthe Company failing to qualify as RICsa RIC and thus becoming subject to corporate-level U.S. federal income tax (and any applicable state and local taxes).
The NMFC Credit Facility includes customary covenants, including certain financial covenants related to asset coverage and liquidity and other maintenance covenants, as well as customary events of default.
The Company's Convertible Notes are subject to certain covenants, including covenants requiring the Company to provide financial information to the holders of the Convertible Notes and the trustee if the Company ceases to be subject to the reporting requirements of the Exchange Act. These covenants are subject to limitations and exceptions.
The breach of any of the covenants or restrictions, unless cured within the applicable grace period, would result in a default under the applicable Credit Facilitiescredit facility that would permit the lenders thereunder to declare all amounts outstanding to be due and payable. In such an event, the Operating Company may not have sufficient assets to repay such indebtedness. As a result, any default could have serious consequences to our financial condition. An event of default or an acceleration under the Credit Facilitiescredit facilities could also cause a cross-default or cross- accelerationcross-acceleration of another debt instrument or contractual obligation, which would adversely impact the Operating Company's liquidity. An event of default under the Holdings Credit Facility will trigger an event of default under the SLF Credit Facility. The Operating Company may not be granted waivers or amendments to the Credit Facilitiescredit facilities if for any reason it is unable to comply with it, and the Operating Company may not be able to refinance the Credit Facilitiescredit facilities on terms acceptable to it, or at all.
The Operating Company may enter into reverse repurchase agreements, which are another form of leverage.
Subject to limitations in the Credit Facilities, the OperatingThe Company may enter into reverse repurchase agreements as part of its management of its investment portfolio. Under a reverse repurchase agreement, the Operating Company will effectively pledge its assets as collateral to secure a short-term loan. Generally, the other party to the agreement makes the loan in an amount equal to a percentage of the fair value of the pledged collateral. At the maturity of the reverse repurchase agreement, the payor will be required to repay the loan and correspondingly receive back its collateral.
Table of Contents
While used as collateral, the assets continue to pay principal and interest which are for the benefit of the Operating Company.
The Operating Company's use of reverse repurchase agreements, if any, involves many of the same risks involved in its use of leverage, as the proceeds from reverse repurchase agreements generally will be
Table of Contents
invested in additional securities. There is a risk that the market value of the securities acquired with the proceeds of a reverse repurchase agreement may decline below the price of the securities that it has sold but remains obligated to repurchase under the reverse repurchase agreement. In addition, there is a risk that the market value of the securities effectively pledged by the Operating Company may decline. If a buyer of securities under a reverse repurchase agreement were to file for bankruptcy or experience insolvency, the Operating Company may be adversely affected. Also, in entering into reverse repurchase agreements, the Operating Company would bear the risk of loss to the extent that the proceeds of such agreements at settlement are more than the fair value of the underlying securities being pledged. In addition, due to the interest costs associated with reverse repurchase agreements transactions, the Operating Company's net asset value would decline, and, in some cases, we may be worse off than if such instruments had not been used.
If the Operating Company is unable to obtain additional debt financing, or if its borrowing capacity is materially reduced, our business could be materially adversely affected.
The Operating Company may want to obtain additional debt financing, or need to do so upon maturity of its Credit Facilities,credit facilities, in order to obtain funds which may be made available for investments. The Operating Company is generally prohibited from or subject to limitations on incurring additional indebtedness, including issuing any debt securities, under the Credit Facilities without obtaining any necessary approvals, consents, amendments or waivers from the lenders thereto. The revolving period under the Holdings Credit Facility ends on October 27, 2014,December 18, 2017, and the Holdings Credit Facility matures on October 27, 2016.December 18, 2019. The revolving period under the SLFNMFC Credit Facility, ends on October 27, 2014,the Convertible Notes and the SLF Credit Facility maturesSBA-guaranteed debentures mature on October 27, 2016.June 4, 2019, June 15, 2019 and March 1, 2025, respectively. If the Operating Company is unable to increase, renew or replace any such facilityfacilities and enter into a new debt financing facilityfacilities or other debt financing on commercially reasonable terms, its liquidity may be reduced significantly. Further, if the Operating Company is unable to obtain any necessary approvals, consents, amendments or waivers from the lenders under the Credit Facilities to permit the issuance of debt securities, the Operating Company would be prohibited from or subject to limitations on incurring any additional indebtedness, including issuing debt securities. In addition, if the Operating Company is unable to repay amounts outstanding under any such facilities and is declared in default or is unable to renew or refinance these facilities, it may not be able to make new investments or operate our business in the normal course. These situations may arise due to circumstances that the Operating Company may be unable to control, such as lack of access to the credit markets, a severe decline in the value of the U.S. dollar, a further economic downturn or an operational problem that affects third parties or the Operating Company, and could materially damage the Operating Company's business operations, and, consequently, NMFC's and AIV Holdings' business, results of operations and financial condition.
A renewed disruption in the capital markets and the credit markets could adversely affect our business.
As BDCs, NMFC anda BDC, the Operating Company must maintain its ability to raise additional capital for investment purposes. If NMFC or the Operating Company is unable to access the capital markets or credit markets, the Operating Company may be forced to curtail its business operations and may be unable to pursue new investment opportunities. The capital markets and the credit markets have experienced extreme volatility in recent periods, and, as a result, there has been and will likely continue to be uncertainty in the financial markets in general. Disruptions in the capital markets in recent years increased the spread between the yields realized on risk-free and higher risk securities, resulting in illiquidity in parts of the capital markets. In addition, a prolonged period of market illiquidity may
Table of Contents
cause the Operating Company to reduce the volume of loans it originates and/or funds and adversely affect the value of our portfolio investments. Unfavorable economic conditions could also increase the Operating Company's funding costs, limit its access to the capital markets or result in a decision by lenders not to extend credit to the Operating Company. These events could limit the Operating Company's investment originations, limit its ability to grow and negatively impact our operating results. Ongoing disruptive conditions in the financial industry and the impact of new legislation in response to those conditions could restrict the Operating Company's business operations and, consequently, could adversely impact NMFC's and AIV Holdings'the Company's business, results of operations and financial condition.
If the fair value of the Operating Company's assets declines substantially, it may fail to maintain the asset coverage ratios imposed upon it by the 1940 Act and contained in its Holding Credit Facilities.Facility and NMFC Credit Facility. Any such failure would affect the Operating Company's ability to issue senior securities, including borrowings, draw on its Holdings Credit FacilitiesFacility and NMFC Credit Facility and pay
Table of Contents
distributions, which could materially impair its business operations. The Operating Company's liquidity could be impaired further by NMFC, AIV Holdings or the Operating Company's inability to access the capital or credit markets. For example, we cannot be certain that the Operating Company will be able to renew its credit facilities as they mature, or to consummate new borrowing facilities to provide capital for normal operations, including new originations.originations, or reapply for SBIC licenses. In recent years, reflecting concern about the stability of the financial markets, many lenders and institutional investors have reduced or ceased providing funding to borrowers. This market turmoil and tightening of credit have led to increased market volatility and widespread reduction of business activity generally in recent years. In addition, adverse economic conditions due to these disruptive conditions could materially impact the Operating Company's ability to comply with the financial and other covenants in any existing or future credit facilities. If the Operating Company is unable to comply with these covenants, its businessthis could be materially adversely affected, which could, as a result, materially adversely affect NMFC's and AIV Holdings'the Company's business, results of operations and financial condition.
Changes in interest rates may affect the Operating Company's cost of capital and net investment income.
To the extent the Operating Company borrows money to make investments, the Operating Company's net investment income depend,depends, in part, upon the difference between the rate at which it borrows funds and the rate at which it invests those funds. As a result, a significant change in market interest rates may have a material adverse effect on the Operating Company's net investment income in the event it uses debt to finance its investments. In periods of rising interest rates, the Operating Company's cost of funds would increase, which could reduce its net investment income. The Operating Company may use interest rate risk management techniques in an effort to limit its exposure to interest rate fluctuations. These techniques may include various interest rate hedging activities to the extent permitted by the 1940 Act.
The incentive fee the Operating Company pays to the Investment Adviser with respect to capital gains may be effectively greater than 20.0%.
As a result of the operation of the cumulative method of calculating the capital gains portion of the incentive fee the Operating Company pays to the Investment Adviser, the cumulative aggregate capital gains fee received by the Investment Adviser could be effectively greater than 20.0%, depending on the timing and extent of subsequent net realized capital losses or net unrealized depreciation. We cannot predict whether, or to what extent, this payment calculation would affect your investment in NMFCNMFC's common stock.
SBIC LP is licensed by the SBA and is subject to SBA regulations.
On August 1, 2014, the Company's wholly-owned direct and indirect subsidiary, SBIC LP, received its license to operate as an SBIC under the 1958 Act and is regulated by the SBA. The SBA places certain limitations on the financing terms of investments by SBICs in portfolio companies, regulates the types of financings, prohibits investing in small businesses with certain characteristics or AIV Holdings' common stock.in certain industries and requires capitalization thresholds that limit distributions to the Company. Compliance with SBIC requirements may cause SBIC LP to invest at less competitive rates in order to find investments that qualify under the SBA regulations.
The SBA regulations require, among other things, an annual periodic examination of a licensed SBIC by an SBA examiner to determine the SBIC's compliance with the relevant SBA regulations, and the performance of a financial audit by an independent auditor. If SBIC LP fails to comply with applicable regulations, the SBA could, depending on the severity of the violation, limit or prohibit SBIC LP's use of the debentures, declare outstanding debentures immediately due and payable, and/or limit SBIC LP from making new investments. In addition, the SBA could revoke or suspend SBIC LP's license for willful or repeated violation of, or willful or repeated failure to observe, any provision of the 1958 Act or any rule or regulation promulgated thereunder. These actions by the SBA would, in turn, negatively affect the Company because SBIC LP is a wholly-owned direct and indirect subsidiary of the Company.
Table of Contents
There SBA-guaranteed debentures are non-recourse to the Company, have a ten year maturity, and may be prepaid at any time without penalty. Pooling of issued SBA-guaranteed debentures occurs in March and September of each year. The interest rate of SBA-guaranteed debentures is no assurancefixed at the time of pooling at a market-driven spread over ten year U.S. Treasury Notes. The interest rate on debentures issued prior to the next pooling date is LIBOR plus 30 basis points. Leverage through SBA-guaranteed debentures is subject to required capitalization thresholds. Current SBA regulations limit the amount that any SBIC may borrow to two tiers of leverage capped at $150.0 million, where each tier is equivalent to the U.S. Small Business Administration will issueSBIC's regulatory capital, which generally equates to us a license to form and operate a Small Business Investment Company subsidiary.
The U.S. Small Business Administration ("SBA") has issued a "green light" letter inviting NMFC to continue its application process to obtain a license to form and operate a Small Business Investment Company ("SBIC") subsidiary. If approved, an SBIC license would provide NMFC with an incremental sourcethe amount of attractive long-term capital. Receipt of a green light letter fromequity capital in the SBA does not assure an applicant that the SBA will ultimately issue an SBIC license, and NMFC has received no assurance or indication from the SBA that it will receive an SBIC license, or of the timeframe in which NMFC would receive a license, should one ultimately be granted.SBIC.
RISKS RELATED TO OUR OPERATIONS
Because the Operating Company intends to make distributions to its members that will be sufficient to enable NMFC and AIV Holdings to maintain their status as RICs, and because NMFC and AIV Holdings intend to distribute substantially all of theirits income to theirits stockholders to maintain theirits status as RICs,a RIC, the Operating Company will continue to need additional capital to finance its growth. If additional funds are unavailable or not available on favorable terms, the Operating Company's ability to grow may be impaired.
In order for NMFC and AIV Holdingsthe Company to qualify for the tax benefits available to RICs and to avoid payment of excise taxes, the Operating Company intends to make distributionsdistribute to its members that will be sufficient to enable NMFC and AIV Holdings to maintain their status as RICs, and NMFC and AIV Holdings intend to distribute to their stockholders substantially all of theirits annual taxable income, except that NMFC may retain certain net capital gains for reinvestment in units of the Operating Company, and treat such amounts as deemed distributions to its stockholders. If NMFC elects to treat any amounts as deemed distributions, NMFC must pay income taxes at the corporate rate on such deemed distributions on behalf of its stockholders.income. As a result of these requirements, NMFC and the Operating Company may need to raise capital from other sources to grow its business.
As a BDC, the Operating Company is required to meet a coverage ratio of total assets, less liabilities and indebtedness not represented by senior securities and excluding SBA-guaranteed debentures as permitted by exemptive relief obtained from the SEC, to total senior securities, which includes all of the Operating Company's borrowings and any outstanding preferred membership units,with the exception of SBA-guaranteed debentures, of at least 200.0% (i.e., the amount of debt may not exceed 50.0% of the value of the Operating Company's total assets or the Operating Company may borrow an amount equal to 100.0% of net assets). The Operating Company consolidates the assets and liabilities of NMF SLF for the purposes of its financial statements and calculating compliance with the 200.0% asset coverage ratio. Since NMFC and AIV Holdings have no assets other than their ownership of units of the Operating Company and have no material long-term liabilities, NMFC and AIV Holdings look to the Operating Company's assets for purposes of satisfying this test. These requirements limitThis requirement limits the amount that the Operating Company may borrow. BecauseSince the Operating Company continues to need capital to grow its investment portfolio, these limitations may prevent the Operating Company from incurring debt and require NMFCthe Company to raise additional equity at a time when it may be disadvantageous to do so. While we expect the Operating Company will be able to borrow and to issue additional debt securities and expect that NMFCthe Company will be able to issue additional equity securities, which would in turn increase the equity capital available to the Operating Company, we cannot assure you that debt and equity financing will be available to the Operating Company on favorable terms, or at all. In addition, as a BDC, NMFCthe Company generally is not permitted to issue equity securities priced below net asset value without stockholder approval. AIV Holdings does not intend to raise any additional debt or equity capital. If additional funds are not available to NMFC or the Operating Company, the Operating Company may be forced to curtail or cease new investment activities, and the Operating Company's net asset value and, consequently, NMFC's and AIV Holdings' net asset value could decline.
SBIC LP may be unable to make distributions to the Company that will enable the Company to meet or maintain RIC status.
In order for the Company to continue to qualify for tax benefits available to RICs and to minimize corporate-level U.S. federal income tax, the Company must distribute to its stockholders, for each taxable year, at least 90.0% of its "investment company taxable income", which is generally its net ordinary income plus the excess of realized net short-term capital gains over realized net long-term capital losses, including investment company taxable income from SBIC LP. The Company will be partially dependent on SBIC LP for cash distributions to enable the Company to meet the RIC distribution requirements. SBIC LP may be limited by SBA regulations governing SBICs from making certain distributions to the Company that may be necessary to maintain the Company's status as a RIC. The Company may have to request a waiver of the SBA's restrictions for SBIC LP to make certain distributions to maintain the Company's RIC status. The Company cannot assure you that the SBA will grant such waiver and if SBIC LP is unable to obtain a waiver, compliance with the SBA regulations may result in corporate-level U.S. federal income tax on the Company.
Table of Contents
Our ability to enter into transactions with our affiliates is restricted.
As BDCs,a BDC, the Companies areCompany is prohibited under the 1940 Act from participating in certain transactions with theirits respective affiliates without the prior approval of theirits respective independent directors and, in some cases, the Securities and Exchange Commission.SEC. Any person that owns, directly or indirectly, 5.0% or more of NMFC's or AIV Holdings'the Company's outstanding voting securities is an affiliate of the CompaniesCompany for purposes of the 1940 Act. The Companies areCompany is generally prohibited from buying or selling any securities (other than theirits respective securities) from or to an affiliate. The 1940 Act also prohibits certain "joint" transactions with an affiliate, which could include investments in the same portfolio company (whether at the same or different times), without prior approval of independent directors and, in some cases, the Securities and Exchange Commission.SEC. If a person acquires more than 25.0% of NMFC's or AIV Holdings'the Company's voting securities, the Companies areCompany is prohibited from buying or selling any security (other than theirits respective securities) from or to such person or certain of that person's affiliates, or entering into prohibited joint transactions with such persons, absent the prior approval of the Securities and Exchange Commission.SEC. Similar restrictions limit the Companies'Company's ability to transact business with theirits respective officers or directors or theirits affiliates. As a result of these restrictions, the Operating Company may be prohibited from buying or selling any security from or to any portfolio company of a private equity fund managed by any affiliate of the Investment Adviser without the prior approval of the Securities and Exchange Commission,SEC, which may limit the scope of investment opportunities that would otherwise be available to the Operating Company.
The Investment Adviser has significant potential conflicts of interest with NMFC, AIV Holdings and the Operating Company and, consequently, your interests as stockholders which could adversely impact our investment returns.
The Companies'Company's executive officers and directors, as well as the current or future investment professionals of the Investment Adviser, serve or may serve as officers, directors or principals of entities that operate in the same or a related line of business as we do or of investment funds managed by the Companies'Company's affiliates. Accordingly, they may have obligations to investors in those entities, the fulfillment of which might not be in your interests as stockholders. Although we are currently New Mountain Capital's only vehicle focused primarily on investing in the investments that we target, in the future, the investment professionals of the Investment Adviser and/or New Mountain Capital employees that provide services pursuant to the Investment Management Agreement may manage other funds which may from time to time have overlapping investment objectives with our own and, accordingly, may invest in, whether principally or secondarily, asset classes similar to those targeted by us. If this occurs, the Investment Adviser may face conflicts of interest in allocating investment opportunities to the Operating Company and such other funds. Although the investment professionals endeavor to allocate investment opportunities in a fair and equitable manner, it is possible that the Operating Company may not be given the opportunity to participate in certain investments made by the Investment Adviser or persons affiliated with the Investment Adviser or that certain of these investment funds may be favored over the Operating Company. When these investment professionals identify an investment, they may be forced to choose which investment fund should make the investment.
If the Investment Adviser forms other affiliates in the future, the Operating Company may co-invest on a concurrent basis with such other affiliate, subject to compliance with applicable regulations and regulatory guidance or an exemptive order from the SecuritiesSEC and Exchange Commission and the Operating Company's allocation procedures. In addition, the Operating Company pays management and incentive fees to the Investment Adviser and reimburses the Investment Adviser for certain expenses it incurs. As a result, investors in NMFC'sthe Company's common stock invest in NMFC and indirectly in the Operating Company on a "gross" basis and receive distributions on a "net" basis after NMFC's pro rata share of the Operating Company's expenses. Also, the incentive fee payable to the Investment Adviser may create an incentive for the Investment Adviser to pursue investments that are
Table of Contents
riskier or more speculative than would be the case in the absence of such compensation arrangements. Any potential conflict of interest arising as a result of the arrangements with the Investment Adviser could have a material adverse effect on our business, results of operations and financial condition.
Table of Contents
The Investment Committee, the Investment Adviser or its affiliates may, from time to time, possess material non-public information, limiting the Operating Company's investment discretion.
The Investment Adviser's investment professionals, Investment Committee or their respective affiliates may serve as directors of, or in a similar capacity with, companies in which we invest through the Operating Company, the securities of which are purchased or sold on the Operating Company's behalf.invest. In the event that material non-public information is obtained with respect to such companies, or we become subject to trading restrictions under the internal trading policies of those companies or as a result of applicable law or regulations, the Operating Company could be prohibited for a period of time from purchasing or selling the securities of such companies, and this prohibition may have an adverse effect on the Operating Company and consequently, your interests as stockholders of NMFC and AIV Holdings.stockholders.
The valuation process for certain of the Operating Company's portfolio holdings creates a conflict of interest.
Some of the Operating Company's portfolio investments are made in the form of securities that are not publicly traded. As a result, the Operating Company's board of directors determines the fair value of these securities in good faith. In connection with this determination, investment professionals from the Investment Adviser may provide the Operating Company's board of directors with portfolio company valuations based upon the most recent portfolio company financial statements available and projected financial results of each portfolio company. In addition, Steven B. Klinsky, a member of the Companies'Company's board of directors, has an indirect pecuniary interest in the Investment Adviser. The participation of the Investment Adviser's investment professionals in the Operating Company's valuation process, and the indirect pecuniary interest in the Investment Adviser by a member of the Companies'Company's board of directors, could result in a conflict of interest as the Investment Adviser's management fee is based, in part, on the Operating Company's gross assets and incentive fees are based, in part, on unrealized gains and losses.
Conflicts of interest may exist related to other arrangements with the Investment Adviser or its affiliates.
The Companies haveCompany has entered into a royalty-free license agreement with New Mountain Capital under which New Mountain Capital has agreed to grant the CompaniesCompany a non-exclusive, royalty-free license to use the name "New Mountain". In addition, the Operating Company reimburses the Administrator for the allocable portion of overhead and other expenses incurred by the Administrator in performing its obligations to the CompaniesCompany under the Administration Agreement, such as rent and the allocable portion of the cost of the Companies'Company's chief financial officer and chief compliance officer and their respective staffs. This could create conflicts of interest that the Operating Company's board of directors must monitor.
The Investment Management Agreement with the Investment Adviser and the Administration Agreement with the Administrator were not negotiated on an arm's length basis.
The Investment Management Agreement and the Administration Agreement were negotiated between related parties. In addition, the CompaniesCompany may choose not to enforce, or to enforce less vigorously, theirits respective rights and remedies under these agreements because of theirits desire to maintain theirits ongoing relationship with the Investment Adviser, the Administrator and theirits respective affiliates. Any such decision, however, could cause NMFC and AIV Holdingsthe Company to breach its fiduciary obligations to its stockholders.
Table of Contents
The Investment Adviser's liability is limited under the Investment Management Agreement, and the Operating Company has agreed to indemnify the Investment Adviser against certain liabilities, which may lead the Investment Adviser to act in a riskier manner than it would when acting for its own account.
Under the Investment Management Agreement, the Investment Adviser does not assume any responsibility other than to render the services called for under that agreement, and it is not responsible for any action of the Operating Company's board of directors in following or declining to follow the Investment Adviser's advice or recommendations. Under the terms of the Investment Management Agreement, the Investment Adviser, its officers, members, personnel, any person controlling or
Table of Contents
controlled by the Investment Adviser are not liable to the Companies, their subsidiaries or any of their respective directors, members or stockholders or any subsidiary's stockholders or partners for acts or omissions performed in accordance with and pursuant to the Investment Management Agreement, except those resulting from acts constituting gross negligence, willful misconduct, bad faith or reckless disregard of the Investment Adviser's duties under the Investment Management Agreement. In addition, the Operating Company has agreed to indemnify the Investment Adviser and each of its officers, directors, members, managers and employees from and against any claims or liabilities, including reasonable legal fees and other expenses reasonably incurred, arising out of or in connection with our business and operations or any action taken or omitted pursuant to authority granted by the Investment Management Agreement, except where attributable to gross negligence, willful misconduct, bad faith or reckless disregard of such person's duties under the Investment Management Agreement. These protections may lead the Investment Adviser to act in a riskier manner than it would when acting for its own account.
The Investment Adviser can resign upon 60 days' notice, and a suitable replacement may not be found within that time, resulting in disruptions in the Operating Company's operations that could adversely affect our business, results of operations and financial condition.
Under the Investment Management Agreement, the Investment Adviser has the right to resign at any time upon 60 days' written notice, whether a replacement has been found or not. If the Investment Adviser resigns, the Operating Company may not be able to find a new investment adviser or hire internal management with similar expertise and ability to provide the same or equivalent services on acceptable terms within 60 days, or at all. If a replacement is not able to be found on a timely basis, our business, results of operations and financial condition and the Operating Company's ability to pay distributions are likely to be materially adversely affected and the market price of NMFC'sits common stock may decline. In addition, if the Operating Company is unable to identify and reach an agreement with a single institution or group of executives having the expertise possessed by the Investment Adviser and its affiliates, the coordination of its internal management and investment activities is likely to suffer. Even if the Operating Company is able to retain comparable management, whether internal or external, their integration into the Operating Company's business and lack of familiarity with the Operating Company's investment objective may result in additional costs and time delays that may materially adversely affect our business, results of operations and financial condition.
The Administrator can resign upon 60 daysdays' notice from its role as Administrator under the Administration Agreement, and a suitable replacement may not be found, resulting in disruptions that could adversely affect our business, results of operations and financial condition.
The Administrator has the right to resign under the Administration Agreement upon 60 days' written notice, whether a replacement has been found or not. If the Administrator resigns, it may be difficult to find a new administrator or hire internal management with similar expertise and ability to provide the same or equivalent services on acceptable terms, or at all. If a replacement is not found quickly, our business, results of operations and financial condition, as well as the Operating Company's ability to pay distributions, are likely to be adversely affected, and the market price of NMFC'sits common
Table of Contents
stock may decline. In addition, the coordination of the Companies'Company's internal management and administrative activities is likely to suffer if they are unable to identify and reach an agreement with a service provider or individuals with the expertise possessed by the Administrator. Even if a comparable service provider or individuals to perform such services are retained, whether internal or external, their integration into the Operating Company's business and lack of familiarity with the Operating Company's investment objective may result in additional costs and time delays that may materially adversely affect our business, results of operations and financial condition.
Table of Contents
If NMFC, AIV Holdings and the Operating Company failfails to maintain theirits status as BDCs,a BDC, our business and operating flexibility could be significantly reduced.
The Companies qualifyCompany qualifys as BDCsa BDC under the 1940 Act. The 1940 Act imposes numerous constraints on the operations of BDCs. For example, BDCs are required to invest at least 70.0% of their total assets in specified types of securities, primarily in private companies or thinly-traded U.S. public companies, cash, cash equivalents, U.S. government securities and other high quality debt investments that mature in one year or less. Failure to comply with the requirements imposed on BDCs by the 1940 Act could cause the Securities and Exchange CommissionSEC to bring an enforcement action against the CompaniesCompany and/or expose the CompaniesCompany to claims of private litigants. In addition, upon approval of a majority of NMFC or AIV Holdings'the Company's stockholders, or, in the Operating Company's case, a majority of its members, the CompaniesCompany may elect to withdraw theirits respective election as a BDC. If the Companies decideCompany decides to withdraw theirits election, or if the CompaniesCompany otherwise failfails to qualify, or maintain theirits qualification, as BDCs,a BDC, the CompaniesCompany may be subject to the substantially greater regulation under the 1940 Act as a closed-end investment company. Compliance with these regulations would significantly decrease our operating flexibility and could significantly increase our cost of doing business.
If the Operating Company does not invest a sufficient portion of its assets in qualifying assets, it could be precluded from investing in certain assets or could be required to dispose of certain assets, which could have a material adverse effect on our business, financial condition and results of operations.
As a BDC, the Operating Company is prohibited from acquiring any assets other than "qualifying assets" unless, at the time of and after giving effect to such acquisition, at least 70.0% of our total assets are qualifying assets. We may acquire in the future other investments that are not "qualifying assets" to the extent permitted by the 1940 Act. If the Operating Company does not invest a sufficient portion of its assets in qualifying assets, it would be prohibited from investing in additional assets, which could have a material adverse effect on our business, financial condition and results of operations. Similarly, these rules could prevent the Operating Company from making follow-on investments in existing portfolio companies (which could result in the dilution of its position) or could require the Operating Company to dispose of investments at inopportune times in order to come into compliance with the 1940 Act. If the Operating Company needs to dispose of these investments quickly, it may be difficult to dispose of such investments on favorable terms. For example, the Operating Company may have difficulty in finding a buyer and, even if a buyer is found, it may have to sell the investments at a substantial loss.
The Operating Company's ability to invest in public companies may be limited in certain circumstances.
To maintain the Operating Company's status and consequently, NMFC's and AIV Holdings' status as BDCs,a BDC, the Operating Company is not permitted to acquire any assets other than "qualifying assets" specified in the 1940 Act unless, at the time the acquisition is made, at least 70.0% of its total assets are qualifying assets (with certain limited exceptions). Subject to certain exceptions for follow-on investments and distressed companies, an investment in an issuer that has outstanding securities listed
Table of Contents
on a national securities exchange may be treated as qualifying assets only if such issuer has a common equity market capitalization that is less than $250.0 million at the time of such investment.
Regulations governing the operations of BDCs will affect NMFC'sthe Company's ability to raise additional equity capital as well as the Operating Company's ability to issue senior securities or borrow for investment purposes, any or all of which could have a negative effect on our investment objectives and strategies.
The Operating Company's business requires a substantial amount of capital. The Operating Company may acquire additional capital from the issuance of senior securities, including borrowing under a credit facility or other indebtedness. In addition, NMFCthe Company may also issue additional equity capital, which would in turn increase the equity capital available to the Operating Company. UnderHowever, the 1940 Act, NMFC is not permitted to own any other securities other than units of the Operating Company. As a result, any proceeds from offerings of NMFC's equity securities would be contributed to the Operating Company and subsequently used by the Operating Company for investment purposes. However, NMFC and the Operating Company may not be able to raise additional capital in the future on favorable terms or at all.
Table of Contents
The Operating Company may issue debt securities, other evidences of indebtedness or preferred membership units,stock, and it may borrow money from banks or other financial institutions, which we refer to collectively as "senior securities", up to the maximum amount permitted by the 1940 Act. The 1940 Act permits the Operating Company to issue senior securities in amounts such that its asset coverage, as defined in the 1940 Act, equals at least 200.0% after each issuance of senior securities. The Operating Company consolidates the assets and liabilities of NMF SLF for purposes of its financial statements and calculating compliance with the 200.0% asset coverage ratio. If the Operating Company's asset coverage ratio is not at least 200.0%, it would be unable to issue senior securities, and if it had senior securities outstanding (other than any indebtedness issued in consideration of a privately arranged loan, such as any indebtedness outstanding under the Holdings Credit Facilities)Facility and NMFC Credit Facility), it would be unable to make distributions to its members and, consequently, NMFC and AIV Holdings would be unable to pay dividends.stockholders. However, at December 31, 2013,2014, the only senior securities outstanding were indebtedness under the Holdings Credit FacilitiesFacility, NMFC Credit Facility and Convertible Notes and therefore at December 31, 2013,2014, the Operating Company would not have been precluded from paying distributions. If the value of the Operating Company's or NMF SLF's assets declines, the Operating Company may be unable to satisfy this test. If that happens, the Operating Company or NMF SLF may be required to liquidate a portion of its investments and repay a portion of its indebtedness at a time when such sales may be disadvantageous.
The Holdings Credit Facility matures on October 27, 2016December 18, 2019 and permits borrowings of $280.0$495.0 million as of December 31, 2013.2014. The Holdings Credit Facility had $221.8$468.1 million in debt outstanding as of December 31, 2013.2014. The SLFNMFC Credit Facility matures on October 27, 2016June 4, 2019 and permits borrowings of $215.0$80.0 million as of December 31, 2013.2014. The SLFNMFC Credit Facility had $214.7$50.0 million in debt outstanding as of December 31, 2013.2014. The Convertible Notes mature on June 15, 2019. The Convertible Notes had $115.0 million in debt outstanding as of December 31, 2014.
In addition, the Operating Company may in the future seek to securitize other portfolio securities to generate cash for funding new investments. To securitize loans, the Operating Company would likely create a wholly-owned subsidiary and contribute a pool of loans to the subsidiary. The Operating Company would then sell interests in the subsidiary on a non-recourse basis to purchasers and it would retain all or a portion of the equity in the subsidiary. If the Operating Company is unable to successfully securitize its loan portfolio, which must be done in compliance with the relevant restrictions in the Holdings Credit Facilities,Facility, its ability to grow its business or fully execute its business strategy could be impaired and our earnings, if any, could decrease. The securitization market is subject to changing market conditions and the Operating Company may not be able to access this market when it would otherwise deem appropriate. Moreover, the successful securitization of the Operating Company's portfolio might expose the Operating Company to losses as the residual investments in which it does not sell interests will tend to be those that are riskier and more apt to generate losses. The 1940 Act also may impose restrictions on the structure of any securitization.
Table of Contents
NMFCThe Company may also obtain capital for use by the Operating Company through the issuance of additional equity capital, which would in turn increase the equity capital available to the Operating Company.capital. As a BDC, NMFCthe Company generally is not able to issue or sell its common stock at a price below net asset value per share. If NMFC'sthe Company's common stock trades at a discount to its net asset value per share, this restriction could adversely affect its ability to raise equity capital. NMFCThe Company may, however, sell its common stock, or warrants, options or rights to acquire its common stock, at a price below its net asset value per share of the common stock if its board of directors and independent directors determine that such sale is in its best interests and the best interests of its stockholders, and its stockholders approve such sale. In any such case, the price at which NMFC'sthe Company's securities are to be issued and sold may not be less than a price that, in the determination of NMFC'sthe Company's board of directors, closely approximates the market value of such securities (less any underwriting commission or discount). If NMFCthe Company raises additional funds by issuing more shares of its common stock or if the Operating Company issues senior securities convertible into, or exchangeable for, NMFC'sthe Company's common stock, the percentage ownership of NMFC's and AIV Holdings'the stockholders may decline and you may experience dilution. Any proceeds from the issuance
Table of additional shares of NMFC's common stock would be contributed to the Operating Company and used to purchase, on a one-for-one basis, additional units of the Operating Company.Contents
The Operating Company's business model in the future may depend to an extent upon our referral relationships with private equity sponsors, and the inability of the investment professionals of the Investment Adviser to maintain or develop these relationships, or the failure of these relationships to generate investment opportunities, could adversely affect its business strategy.
If the investment professionals of the Investment Adviser fail to maintain existing relationships or develop new relationships with other sponsors or sources of investment opportunities, the Operating Company may not be able to grow ourits investment portfolio. In addition, individuals with whom the investment professionals of the Investment Adviser have relationships are not obligated to provide the Operating Company with investment opportunities, and, therefore, there is no assurance that any relationships they currently or may in the future have will generate investment opportunities for the Operating Company.
We may experience fluctuations in our annual and quarterly results due to the nature of our business.
We could experience fluctuations in our annual and quarterly operating results due to a number of factors, some of which are beyond our control, including the ability or inability of the Operating Company to make investments in companies that meet its investment criteria, the interest rate payable on the debt securities acquired and the default rate on such securities, the level of the Operating Company's expenses, variations in and the timing of the recognition of realized and unrealized gains or losses, the degree to which the Operating Company encounters competition in the markets in which it operates and general economic conditions. As a result of these factors, results for any period should not be relied upon as being indicative of performance in future periods.
The Operating Company's board of directors may change its investment objective, operating policies and strategies without prior notice or memberstockholder approval, the effects of which may be adverse to your interest as a stockholder.
The Operating Company's board of directors has the authority, except as otherwise provided in the 1940 Act, to modify or waive certain of its operating policies and strategies without prior notice and without memberstockholder approval. As a result, the Operating Company's board of directors may be able to change its investment policies and objectives without any input from NMFC's and AIV Holdings'its stockholders. However, absent memberstockholder approval, the Operating Company may not change the nature of its business so as to cease to be, or withdraw its election as, a BDC. Under Delaware law, and the
Table of Contents
Operating Company's Limited Liability Company Agreement, the Operating Company also cannot be dissolved without prior memberstockholder approval. We cannot predict the effect any changes to the Operating Company's current operating policies and strategies would have on our business, operating results and the market price of NMFC's common stock. Nevertheless, any such changes could adversely affect our business and impair the Operating Company's ability to make distributions to its members, and, consequently, NMFC's and AIV Holdings' ability to make distributions to its stockholders.
NMFC and AIV HoldingsThe Company will be subject to corporate-level U.S. federal income tax on all of theirits respective income if they areit is unable to maintain RIC status under Subchapter M of the Code, which would have a material adverse effect on their respectiveits financial performance.
Although NMFC and AIV Holdings intendthe Company intends to continue to qualify annually as RICsa RIC under Subchapter M of the Code, no assurance can be given that NMFC and AIV Holdingsthe Company will be able to maintain theirits RIC status. To maintain RIC status and be relieved of U.S. federal income taxes on income and gains distributed to theirits stockholders, NMFC and AIV Holdingsthe Company must meet the annual distribution, source-of-income and asset diversification requirements described below. However, NMFC and AIV Holdings have no assets, other than their direct ownership of units of the Operating Company, and no source of cash flow, other than distributions from the Operating Company. NMFC and AIV Holdings are not permitted to conduct any business or ventures, other than in connection with the acquisition, ownership or disposition of units of the Operating Company and its operation as a public reporting company. Accordingly, NMFC and AIV Holdings look to the assets and income of the Operating Company, and rely on the distributions made by the Operating Company to their members, for purposes of satisfying these requirements.
- •
- The annual distribution requirement for a RIC will be satisfied if
NMFC and AIV Holdings distributethe Company distributes to theirits stockholders on an annual basis at least 90.0% of theirits net ordinary income andplus the excess of realized net short-term capital gains in excess ofover realized net long-termlong term capital losses, if any. Because the Operating Company and NMF SLF useuses debt financing, the Operating Company is subject to an asset coverage ratio requirement under the 1940 Act, and the Operating Company and NMF SLF areis subject to certain financial covenants contained in the
Table of Contents
Holdings Credit FacilitiesFacility and other debt financing agreements (as applicable). This asset coverage ratio requirement and these financial covenants could, under certain circumstances, restrict NMF SLF from making distributions to the Operating Company, and/or restrict the Operating Company from making distributions to its members,stockholders, which distributions are necessary for NMFC and AIV Holdingsthe Company to satisfy the distribution requirement. If the Operating Company is unable to obtain cash from other sources, and thus is unable to make sufficient distributions to its members, NMFC and AIV Holdingsstockholders, the Company could fail to qualify for RIC tax treatment and thus become subject to certain corporate-level U.S. federal income tax (and any applicable state and local taxes).
- •
- The source-of-income requirement will be satisfied if at least 90.0% of
NMFC's and AIV Holdings'the Company's allocable share of the Operating Company'sits gross income for each year is derived from dividends, interest payments with respect to loans of certain securities, gains from the sale of stock or other securities, net income from certain "qualified publicly traded partnerships" or similar sources.other income derived with respect to the Company's business of investing in such stock or securities.
- •
- The asset diversification requirement will be satisfied if
NMFC and AIV Holdings meetthe Company meets certain asset diversification requirements at the end of each quarter of its taxable year. To satisfy this requirement, at least 50.0% of the value of NMFC's and AIV Holdings'the Company's assets must consist of cash, cash equivalents, U.S. government securities, securities of other RICs, and other acceptable securities;such securities if such other securities of any one issuer do not represent more than 5.0% of the value of the Company's assets or more than 10.0% of the outstanding voting securities of the issuer; and no more than 25.0% of the value of NMFC's or AIV Holdings'the Company's assets can be invested in the securities, other than U.S. government securities or securities of other RICs, of one issuer, of two or more issuers that are controlled, as determined under applicable Code rules, by itthe Company and that are engaged in the same or similar or related trades or businesses or of certain "qualified publicly traded partnerships". Failure to meet these requirements may result in the Operating Company having to dispose of certain investments quickly in order to prevent the
Table of Contents
loss of NMFC's and AIV Holdings'the Company's RIC status. Because most of the Operating Company's investments are intended to be in private companies, and therefore may be relatively illiquid, any such dispositions could be made at disadvantageous prices and could result in substantial losses.
Although there is no authority directly applicable to NMFC and AIV Holdings and thus the matter is not free from doubt, it is expected that NMFC and AIV Holdings is treated as if they directly invested in their pro rata share of the Operating Company's assets for purposes of satisfying the asset diversification requirement. However, there can be no assurance that the IRS will not successfully assert that NMFC and AIV Holdings do not meet the asset diversification requirement because they are unable to look to the Operating Company's assets for purpose of that requirement. In that case, NMFC and AIV Holdings would fail to qualify as RICs and thus become subject to corporate- level federal income tax (and any applicable state and local taxes).
If NMFC and AIV Holdings failthe Company fails to qualify for or maintain theirits RIC status for any reason, and NMFC and AIV Holdings doit does not qualify for certain relief provisions under the Code, NMFC and AIV Holdingsthe Company would be subject to corporate- levelcertain corporate-level U.S. federal income tax (and any applicable state and local taxes). In this event, the resulting taxes could substantially reduce NMFC's and AIV Holdings'the Company's net assets, the amount of income available for distribution and the amount of its distributions, which would have a material adverse effect on its financial performance.
You may have current tax liabilities on distributions you reinvest in common stock of NMFC.
Under the dividend reinvestment plan, if you own shares of common stock of NMFC registered in your own name, you will have all cash distributions automatically reinvested in additional shares of common stock of NMFC unless you opt out of the dividend reinvestment plan by delivering notice by phone, internet or in writing to the plan administrator at least three days prior to the payment date of the next dividend or distribution. If you have not "opted out" of the dividend reinvestment plan, you will be deemed to have received, and for U.S. federal income tax purposes will be taxed on, the amount reinvested in common stock of NMFC to the extent the amount reinvested was not a tax-free return of capital. As a result, you may have to use funds from other sources to pay your U.S. federal income tax liability on the value of the common stock received.
Table of Contents
NMFC and AIV HoldingsThe Company may not be able to pay you distributions on theirits common stock, theirits distributions to you may not grow over time and a portion of theirits distributions to you may be a return of capital for U.S. federal income tax purposes.
NMFC and AIV Holdings intendThe Company intends to pay quarterly distributions to theirits stockholders out of assets legally available for distribution. We cannot assure you that we will continue to achieve investment results that will allow NMFCthe Company to make a specified level of cash distributions or year-to-year increases in cash distributions. If the Operating Company is unable to satisfy the asset coverage test applicable to it as a BDC, or if it violates certain covenants under the Holdings Credit Facilities,Facility and the OperatingNMFC Credit Facility, the Company's ability to pay distributions to its membersstockholders could be limited, thereby limiting NMFC's and AIV Holdings' ability to pay distributions to their stockholders.limited. All distributions are paid at the discretion of the Operating Company's board of directors and depend on its earnings, financial condition, maintenance of NMFC and AIV Holdingsthe Company's RIC status, compliance with applicable BDC regulations, compliance with covenants under the Holdings Credit Facilities,Facility and NMFC Credit Facility, and such other factors as the Operating Company's board of directors may deem relevant from time to time. The distributions NMFC and AIV Holdings paythat the Company pays to theirits stockholders in a year may exceed its taxable income for that year and, accordingly, a portion of such distributions may constitute a return of capital for U.S. federal income tax purposes.
In addition, because NMFC and AIV Holdings are holding companies, NMFC and AIV Holdings are only able to pay distributions on their common stock from distributions received from the
Table of Contents
Operating Company. The Operating Company intends to make distributions to its members that will be sufficient to enable NMFC and AIV Holdings to pay quarterly distributions to their stockholders and to maintain their status as RICs. However, there can be no assurances that the Operating Company will make distributions to its members in the future. Accordingly, NMFC and AIV Holdings cannot assure you that they will pay distributions to you in the future.
NMFC and AIV HoldingsThe Company may have difficulty paying theirits required distributions if the Operating Company recognizes taxable income before or without receiving cash representing such income.
For U.S. federal income tax purposes, NMFC and AIV Holdings includethe Company includes in theirits taxable income theirits allocable share of certain amounts that the Operating Company has not yet received in cash, such as original issue discount or accruals on a contingent payment debt instrument, which may occur if the Operating Company receives warrants in connection with the origination of a loan or possibly in other circumstances or contracted PIKpayment-in-kind ("PIK") interest, which generally represents contractual interest added to the loan balance and due at the end of the loan term. NMFC and AIV HoldingsThe Company's allocable share of such original issue discount and PIK interest are included in NMFC and AIV Holdingsits taxable income before the Operating Company receives any corresponding cash payments. NMFC and AIV HoldingsThe Company also may be required to include in theirits taxable income theirits allocable share of certain other amounts that the Operating Company will not receive in cash.
Because in certain cases the Operating Company may recognize taxable income before or without receiving cash representing such income, the Operating Company may have difficulty making distributions to the Operating Company's membersits stockholders that will be sufficient to enable NMFC and AIV Holdingsthe Company to meet the annual distribution requirement necessary for NMFC and AIV Holdings to qualify as RICs.a RIC. Accordingly, the Operating Company may need to sell some of its assets at times and/or at prices that it would not consider advantageous, NMFC or the Operating Company may need to raise additional equity or debt capital, or the Operating Company may need to forego new investment opportunities or otherwise take actions that are disadvantageous to its business (or be unable to take actions that are advantageous to its business) to enable the Operating Company to make distributions to its membersstockholders that will be sufficient to enable NMFC and AIV Holdingsthe Company to meet the annual distribution requirement. If NMFC or the Operating Company areis unable to obtain cash from other sources to enable NMFC and AIV Holdingsit to meet the annual distribution requirement, NMFC and AIV Holdingsthe Company may fail to qualify for the U.S. federal income tax benefits allowable to RICs and, thus, become subject to acertain corporate-level U.S. federal income tax (and any applicable state and local taxes).
It is expected that, if the Operating Company does not make cash distributions to AIV Holdings in amounts sufficient for AIV Holdings to meet the annual distribution requirement necessary for AIV Holdings to qualify as a RIC, Guardian AIV would consent to be treated as if it received distributions from AIV Holdings sufficient to satisfy the annual distribution requirement necessary for AIV Holdings to qualify as a RIC. This would result in phantom (i.e. non-cash) taxable income to Guardian AIV.Table of Contents
Changes in laws or regulations governing the Operating Company's operations may adversely affect our business or cause the Operating Company to alter its business strategy.
Changes in the laws or regulations or the interpretations of the laws and regulations that govern BDCs, RICs or non-depository commercial lenders could significantly affect our operations and our cost of doing business. The Companies and the Operating Company's portfolio companies are subject to U.S. federal, state and local laws and regulations. New legislation may be enacted or new interpretations, rulings or regulations could be adopted, any of which could materially adversely affect our business, including with respect to the types of investments the Operating Company is permitted to make, and your interest as a stockholder potentially with retroactive effect. In addition, any changes to the laws and regulations governing the Operating Company's operations relating to permitted investments may cause the Operating Company to alter its investment strategy in order to avail itself of new or different
Table of Contents
opportunities. These changes could result in material changes to the strategies and plans set forth in this prospectus and may result in the Operating Company's investment focus shifting from the areas of expertise of the Investment Adviser to other types of investments in which the Investment Adviser may have less expertise or little or no experience. Any such changes, if they occur, could have a material adverse effect on our business, results of operations and financial condition and, consequently, the value of your investment in us.
On July 21, 2010, the Wall Street Reform and Consumer Protection Act, or Dodd-Frank Act, was signed into law. Although passage of the Dodd-Frank Act has resulted in extensive rulemaking and regulatory changes that affect the CompaniesCompany and the financial industry as a whole, many of its provisions remain subject to extended implementation periods and delayed effective dates and will require extensive rulemaking by regulatory authorities. While the full impact of the Dodd-Frank Act on the CompaniesCompany and the Operating Company's portfolio companies may not be known for an extended period of time, the Dodd-Frank Act, including future rules implementing its provisions and the interpretation of those rules, along with other legislative and regulatory proposals directed at the financial services industry or affecting taxation that are proposed or pending in the U.S. Congress, may negatively impact the Company's or the Company's portfolio companies operations, cash flows or financial condition, of the Companies or the Operating Company's portfolio companies, impose additional costs on the CompaniesCompany or the Operating Company's portfolio companies, intensify the regulatory supervision of the CompaniesCompany or the Operating Company's portfolio companies or otherwise adversely affect the Companies'Company's business or the business of the Operating Company's portfolio companies.
Over the last several years, there has been an increase in regulatory attention to the extension of credit outside of the traditional banking sector, raising the possibility that some portion of the non-bank financial sector will be subject to new regulation. While it cannot be known at this time whether these regulations will be implemented or what form they will take, increased regulation of non-bank credit extension could negatively impact the Companies'Company's operations, cash flows or financial condition, impose additional costs on the Companies,Company, intensify the regulatory supervision of the CompaniesCompany or otherwise adversely affect the Companies'Company's business.
The affecteffect of global climate change may impact the operations of the Operating Company's portfolio companies.
There may be evidence of global climate change. Climate change creates physical and financial risk and some of the Operating Company's portfolio companies may be adversely affected by climate change. For example, the needs of customers of energy companies vary with weather conditions, primarily temperature and humidity. To the extent weather conditions are affected by climate change, energy use could increase or decrease depending on the duration and magnitude of any changes. Increases in the cost of energy could adversely affect the cost of operations of the Operating Company's portfolio companies if the use of energy products or services is material to their business. A decrease in energy use due to weather changes may affect some of the Operating Company's portfolio companies' financial condition, through decreased revenues. Extreme weather conditions in general require more system backup, adding to costs, and can contribute to increased system stresses, including service interruptions. Energy companies could also be affected by the potential for lawsuits against or taxes or other regulatory costs imposed on greenhouse gas emitters, based on links drawn between greenhouse gas emissions and climate change.
Table of Contents
Pending legislation may allow the Operating Company to incur additional leverage.
As a BDC, under the 1940 Act the Operating Company generally is not permitted to incur indebtedness unless immediately after such borrowing the Operating Company has an asset coverage for total borrowings of at least 200.0% (i.e., the amount of debt may not exceed 50.0% of the value of the Operating Company's total assets or the Operating Company may borrow an amount equal to
Table of Contents
100.0% of net assets). Recent legislationLegislation introduced in the U.S. House of Representatives,Congress, if passed, would modify this section of the 1940 Act and increase the amount of debt that BDCs may incur by modifying the percentage from 200.0% to 150.0%. As a result, the Operating Company may be able to incur additional indebtedness in the future and therefore your risk of an investment in NMFC's and AIV Holdings'the Company's common stock may increase.
NMFCThe Company incurs significant costs as a result of being a publicly traded company.
As a publicly traded company, NMFCthe Company incurs legal, accounting and other expenses, which are paid by the Operating Company, including costs associated with the periodic reporting requirements applicable to a company whose securities are registered under the Exchange Act, as well as additional corporate governance requirements, including requirements under the Sarbanes-Oxley Act of 2002, or the "Sarbanes-Oxley Act",Act," and other rules implemented by the Securities and Exchange Commission.SEC.
Efforts to comply with Section 404 of the Sarbanes-Oxley Act involve significant expenditures, and non-compliance with Section 404 of the Sarbanes-Oxley Act may adversely affect NMFCthe Company and the market price of NMFC'sits common stock.
The Companies areCompany is subject to the Sarbanes-Oxley Act, and the related rules and regulations promulgated by the Securities and Exchange Commission.SEC. Under current Securities and Exchange CommissionSEC rules beginning with oursince its fiscal year endingended December 31, 2012, the Operating Company's management ishas been required to report on theirits internal control over financial reporting pursuant to Section 404 of the Sarbanes-Oxley Act, and rules and regulations of the Securities and Exchange CommissionSEC thereunder. The Companies areCompany is required to review on an annual basis their respectiveits internal control over financial reporting, and on a quarterly and annual basis to evaluate and disclose changes in our respectiveits internal control over financial reporting. As a result, the Companies expectCompany expects to continue to incur significant additional expenses, in the near term, which may negatively impact the Operating Company's financial performance and the Operating Company's ability to make distributions to its members and, consequently, NMFC's and AIV Holdings' ability to make distributions to their stockholders. This process also may result in a diversion of management's time and attention. We cannot be certain as to the timing of completion of any evaluation, testing and remediation actions or the impact of the same on our operations, and neither of the Companies may beCompany is not able to ensure that the process is effective or that ourits internal control over financial reporting is or will continue to be effective in a timely manner. In the event that the Companies areCompany is unable to maintain or achieve compliance with Section 404 of the Sarbanes-Oxley Act and related rules, the Operating Company and, consequently, the market price of NMFC and AIV Holdingsits common stock may be adversely affected.
The Operating Company's business is highly dependent on information systems and systems failures could significantly disrupt our business, which may, in turn, negatively affect the market price of NMFC's and AIV Holdings'the Company's common stock and its ability to pay dividends.
The Operating Company's business is highly dependent on the communications and information systems of the Investment Adviser and its affiliates. Any failure or interruption of such systems could cause delays or other problems in the Operating Company's activities. This, in turn, could have a material adverse effect on the Operating Company's operating results and, consequently, negatively affect the market price of NMFC's and AIV Holdings'its common stock and theirits ability to pay dividends to theirits stockholders. In addition, because many of the Operating Company's portfolio companies operate and rely on network infrastructure and enterprise applications and internal technology systems for development, marketing, operational, support and other business activities, a disruption or failure of any or all of these systems in the event of a major telecommunications failure, cyber-attack, fire, earthquake, severe weather conditions or other catastrophic event could cause system interruptions,
Table of Contents
interruptions, delays in product development and loss of critical data and could otherwise disrupt their business operations.
The failure in cyber security systems, as well as the occurrence of events unanticipated in the Company's disaster recovery systems and management continuity planning could impair the Company's ability to conduct business effectively.
The occurrence of a disaster such as a cyber attack, a natural catastrophe, an industrial accident, a terrorist attack or war, events unanticipated in the Company's disaster recovery systems, or a support failure from external providers, could have an adverse effect on the Company's ability to conduct business and on the Company's results of operations and financial condition, particularly if those events affect the Company's computer-based data processing, transmission, storage, and retrieval systems or destroy data. If a significant number of the Company's managers were unavailable in the event of a disaster, the Company's ability to effectively conduct its business could be severely compromised.
We depend heavily upon computer systems to perform necessary business functions. Despite the Company's implementation of a variety of security measures, its computer systems could be subject to cyber attacks and unauthorized access, such as physical and electronic break-ins or unauthorized tampering. Like other companies, the Company may experience threats to its data and systems, including malware and computer virus attacks, unauthorized access, system failures and disruptions. If one or more of these events occurs, it could potentially jeopardize the confidential, proprietary and other information processed and stored in, and transmitted through, the Company's computer systems and networks, or otherwise cause interruptions or malfunctions in its operations, which could result in damage to the Company's reputation, financial losses, litigation, increased costs, regulatory penalties and/or customer dissatisfaction or loss.
RISKS RELATING TO THE OPERATING COMPANY'S INVESTMENTS
The Operating Company's investments in portfolio companies may be risky, and the Operating Company could lose all or part of any of its investments.
Investments in small and middle market businesses are highly speculative and involve a high degree of risk of credit loss. These risks are likely to increase during volatile economic periods, such as the U.S. and many other economies have recently experienced. Among other things, these companies:
- •
- may have limited financial resources and may be unable to meet their obligations under their debt instruments that the
Operating Company holds, which may be accompanied by a deterioration in the value of any collateral and a reduction in the likelihood of the Operating Company realizing any guarantees from subsidiaries or affiliates of its portfolio companies that the Operating Company may have obtained in connection with its investment, as well as a corresponding decrease in the value of any equity components of its investments;
- •
- may have shorter operating histories, narrower product lines, smaller market shares and/or more significant customer concentrations than larger businesses, which tend to render them more vulnerable to competitors' actions and market conditions, as well as general economic downturns;
- •
- are more likely to depend on the management talents and efforts of a small group of persons; therefore, the death, disability, resignation or termination of one or more of these persons could have a material adverse impact on the
Operating Company's portfolio company and, in turn, on us;
- •
- generally have less predictable operating results, may from time to time be parties to litigation, may be engaged in rapidly changing businesses with products subject to a substantial risk of obsolescence;
Table of Contents
- •
- may require substantial additional capital to support their operations, finance expansion or maintain their competitive position; and
- •
- generally have less publicly available information about their businesses, operations and financial condition.
In addition, in the course of providing significant managerial assistance to certain of the Operating Company's portfolio companies, certain of the Operating Company's officers and directors may serve as directors on the boards of such companies. To the extent that litigation arises out of the Operating Company's investments in these companies, the Operating Company's officers and directors may be named as defendants in such litigation, which could result in an expenditure of funds (through the Operating Company's indemnification of such officers and directors) and the diversion of management time and resources.
The Operating Company's investment strategy, which is focused primarily on privately held companies, presents certain challenges, including the lack of available information about these companies.
The Operating Company invests primarily in privately held companies. There is generally little public information about these companies, and, as a result, the Operating Company must rely on the ability of the Investment Adviser to obtain adequate information to evaluate the potential returns from, and risks related to, investing in these companies. If the Operating Company is unable to uncover all material information about these companies, it may not make a fully informed investment decision, and it may lose money on its investments. Also, privately held companies frequently have less diverse
Table of Contents
product lines and smaller market presence than larger competitors. They are, thus, generally more vulnerable to economic downturns and may experience substantial variations in operating results. These factors could adversely affect the Operating Company's investment returns.
The OperatingCompany's investments in securities rated below investment grade are speculative in nature and are subject to additional risk factors such as increased possibility of default, illiquidity of the security, and changes in value based on changes in interest rates.
The Company's investments are typically rated below investment grade. Securities rated below investment grade are often referred to as "leveraged loans," "high yield" or "junk" securities, and may be considered "high risk" compared to debt instruments that are rated investment grade. High yield securities are regarded as having predominantly speculative characteristics with respect to the issuer's capacity to pay interest and repay principal in accordance with the terms of the obligations and involve major risk exposure to adverse conditions. In addition, high yield securities generally offer a higher current yield than that available from higher grade issues, but typically involve greater risk. These securities are especially sensitive to adverse changes in general economic conditions, to changes in the financial condition of their issuers and to price fluctuation in response to changes in interest rates. During periods of economic downturn or rising interest rates, issuers of below investment grade instruments may experience financial stress that could adversely affect their ability to make payments of principal and interest and increase the possibility of default.
The Company's portfolio may be concentrated in a limited number of industries, which may subject the Operating Company to a risk of significant loss if there is a downturn in a particular industry in which a number of its investments are concentrated.
The Operating Company's portfolio may be concentrated in a limited number of industries. For example, as of December 31, 2013,2014, the Operating Company's investments in the software, the education, the business services and the distribution & logisticseducation industries represented approximately 22.3%20.2%, 21.1%, 13.1%18.3% and 10.8%17.7%, respectively, of the fair value of the Operating Company's portfolio. A downturn in any particular industry in which the Operating Company is invested could significantly impact the portfolio companies operating in that industry, and accordingly, the aggregate returns that the Operating Company realizes from its investment in such portfolio companies.
Table of Contents
Specifically, companies in the software industry often have narrow product lines and small market shares. Because of rapid technological change, the average selling prices of products and some services provided by software companies have historically decreased over their productive lives. As a result, the average selling prices of products and services offered by software companies in which we invest may decrease over time. In addition, companies in the business services industry are subject to general economic downturns and business cycles, and will often suffer reduced revenues and rate pressures during periods of economic uncertainty. Likewise, companies in the education industry are required to comply with extensive regulatory and accreditation requirements, which could be subject to change by Congress, and which can limit their access to federal aid or similar loan programs, or otherwise increase their compliance costs. Likewise, companies in the business services industry are subject to general economic downturns and business cycles, and will often suffer reduced revenues and rate pressures during periods of economic uncertainty. Finally, companies in the distribution & logistics industry are subject to complex and stringent aviation, transportation, environmental, security, labor, employment and other governmental laws and regulations, both in the U.S. and in the other countries. In addition, companies in the distribution & logistics industry may be impacted by global climate change, including severe weather or other natural disasters, changes in regulation in response to climate change and changing prices for energy commodities. If an industry in which the Operating Company has significant investments suffers from adverse business or economic conditions, as these industries have to varying degrees, a material portion of its investment portfolio could be affected adversely, which, in turn, could adversely affect the Operating Company's financial position and results of operations.
Continuation of the current decline in oil and natural gas prices for a prolonged period of time could have a material adverse effect on the Company.
Approximately 5.9% of the Company's portfolio at fair value is invested in energy-related businesses. A decline in oil and natural gas prices would adversely affect the credit quality of these investments. A decrease in credit quality would, in turn, negatively affect the fair value of these investments, which would consequently negatively affect the Company's financial position and results of operations. Should the current decline in oil and natural gas prices persist, it is likely that the Company's energy-related portfolio companies' abilities to satisfy financial or operating covenants imposed by the Company or other lenders will be adversely affected, thereby negatively impacting the Company's financial condition and their ability to satisfy their debt service and other obligations to the Company.
If the Operating Company makes unsecured investments, those investments might not generate sufficient cash flow to service theirits debt obligations to the Operating Company.
The Operating Company may make unsecured investments. Unsecured investments may be subordinated to other obligations of the obligor. Unsecured investments often reflect a greater possibility that adverse changes in the financial condition of the obligor or general economic conditions (including, for example, a substantial period of rising interest rates or declining earnings) or both may impair the ability of the obligor to make payment of principal and interest. If the Operating Company makes an unsecured investment in a portfolio company, that portfolio company may be highly leveraged, and its relatively high debt-to-equity ratio may increase the risk that its operations might not generate sufficient cash to service its debt obligations.
If the Operating Company invests in the securities and obligations of distressed and bankrupt issuers, it might not receive interest or other payments.
From time to time, the Operating Company may invest in other types of investments which are not its primary focus, including investments in the securities and obligations of distressed and bankrupt issuers, including debt obligations that are in covenant or payment default. Such investments generally
Table of Contents
are considered speculative. The repayment of defaulted obligations is subject to significant uncertainties. Defaulted obligations might be repaid only after lengthy workout or bankruptcy proceedings, during which the issuer of those obligations might not make any interest or other payments.
The lack of liquidity in the Operating Company's investments may adversely affect our business.
The Operating Company invests, and will continue to invest, in companies whose securities are not publicly traded and whose securities will be subject to legal and other restrictions on resale or will otherwise be
Table of Contents
less liquid than publicly traded securities. The illiquidity of these investments may make it difficult for the Operating Company to sell these investments when desired. In addition, if the Operating Company is required or otherwise chooses to liquidate all or a portion of its portfolio quickly, it may realize significantly less than the value at which it had previously recorded these investments. The Operating Company's investments are usually subject to contractual or legal restrictions on resale or are otherwise illiquid because there is usually no established trading market for such investments. Because most of the Operating Company's investments are illiquid, the Operating Company may be unable to dispose of them in which case NMFCthe Company could fail to qualify as a RIC and/or a BDC, or the Operating Company may be unable to do so at a favorable price, and, as a result, the Operating Company and NMFC may suffer losses.
Price declines and illiquidity in the corporate debt markets may adversely affect the fair value of the Operating Company's portfolio investments, reducing the Operating Company's net asset value through increased net unrealized depreciation.
As a BDC, the Operating Company is required to carry its investments at market value or, if no market value is ascertainable, at fair value as determined in good faith by its board of directors. Because NMFC is a holding company with no direct operations of its own, and its only business and sole asset is its ownership of units of the Operating Company, NMFC's net asset value will be based on the Operating Company's valuation of its investments and its percentage interest in the Operating Company. As part of the valuation process, the Operating Company may take into account the following types of factors, if relevant, in determining the fair value of its investments:
- •
- a comparison of the portfolio company's securities to publicly traded securities;
- •
- the enterprise value of a portfolio company;
- •
- the nature and realizable value of any collateral;
- •
- the portfolio company's ability to make payments and its earnings and discounted cash flow;
- •
- the markets in which the portfolio company does business; and
- •
- changes in the interest rate environment and the credit markets generally that may affect the price at which similar investments may be made in the future and other relevant factors.
When an external event such as a purchase transaction, public offering or subsequent sale occurs, the Operating Company will use the pricing indicated by the external event to corroborate its valuation. The Operating Company will record decreases in the market values or fair values of its investments as unrealized depreciation. Declines in prices and liquidity in the corporate debt markets may result in significant net unrealized depreciation in its portfolio. The effect of all of these factors on the Operating Company's portfolio may reduce the Operating Company's net asset value and, indirectly, NMFC's and AIV Holdings' net asset value based on their respective percentage interest in the Operating Company, by increasing net unrealized depreciation in the Operating Company's portfolio. Depending on market conditions, the Operating Company could incur substantial realized losses and may suffer additional unrealized losses in future periods, which could have a material adverse effect on its business, financial condition, results of operations and cash flows.
Table of Contents
If the Operating Company is unable to make follow-on investments in its portfolio companies, the value of the Operating Company's investment portfolio could be adversely affected.
Following an initial investment in a portfolio company, the Operating Company may make additional investments in that portfolio company as "follow-on" investments, in order to (i) increase or maintain in whole or in part its equity ownership percentage, (ii) exercise warrants, options or convertible securities that were acquired in the original or subsequent financing or (iii) attempt to preserve or enhance the value of its investment. The Operating Company may elect not to make follow-on investments or may otherwise lack sufficient funds to make these investments. The Operating Company has the discretion to make follow-on investments, subject to the availability of capital resources. If the Operating Company fails to make follow-on investments, the continued viability of a portfolio company and its investment may, in some circumstances, be jeopardized and we could miss an opportunity for the Operating Company to increase its participation in a successful operation. Even if the Operating Company has sufficient capital to make a desired
Table of Contents
follow-on investment, it may elect not to make a follow-on investment because it may not want to increase its concentration of risk, either because it prefers other opportunities or because it is subject to BDC requirements that would prevent such follow-on investments or such follow-on investments would adversely impact NMFC'sits ability to maintain its RIC status.
The Operating Company's portfolio companies may incur debt that ranks equally with, or senior to, its investments in such companies.
The Operating Company invests in portfolio companies at all levels of the capital structure. The Operating Company's portfolio companies may have, or may be permitted to incur, other debt that ranks equally with, or senior to, the debt in which the Operating Company invests. By their terms, these debt instruments may entitle the holders to receive payment of interest or principal on or before the dates on which the Operating Company is entitled to receive payments with respect to the debt instruments in which it invests. In addition, in the event of insolvency, liquidation, dissolution, reorganization or bankruptcy of a portfolio company, holders of debt instruments ranking senior to the Operating Company's investment in that portfolio company would typically be entitled to receive payment in full before it receives any distribution. After repaying the senior creditors, the portfolio company may not have any remaining assets to use for repaying its obligation to the Operating Company. In the case of debt ranking equally with debt instruments in which the Operating Company invests, it would have to share on an equal basis any distributions with other creditors holding such debt in the event of an insolvency, liquidation, dissolution, reorganization or bankruptcy of the relevant portfolio company.
The disposition of the Operating Company's investments may result in contingent liabilities.
Most of the Operating Company's investments will involve private securities. In connection with the disposition of an investment in private securities, the Operating Company may be required to make representations about the business and financial affairs of the portfolio company typical of those made in connection with the sale of a business. The Operating Company may also be required to indemnify the purchasers of such investment to the extent that any such representations turn out to be inaccurate or with respect to certain potential liabilities. These arrangements may result in contingent liabilities that ultimately yield funding obligations that must be satisfied through the Operating Company's return of certain distributions previously made to it.
There may be circumstances where the Operating Company's debt investments could be subordinated to claims of other creditors or the Operating Company could be subject to lender liability claims.
Even though the Operating Company may have structured certain of its investments as senior loans, if one of its portfolio companies were to go bankrupt, depending on the facts and circumstances,
Table of Contents
including the extent to which the Operating Company actually provided managerial assistance to that portfolio company, a bankruptcy court might re-characterize its debt investment and subordinate all or a portion of the Operating Company's claim to that of other creditors. The Operating Company may also be subject to lender liability claims for actions taken by it with respect to a borrower's business or instances where it exercises control over the borrower. It is possible that the Operating Company could become subject to a lender's liability claim, including as a result of actions taken in rendering significant managerial assistance.
Second priority liens on collateral securing loans that the Operating Company makes to its portfolio companies may be subject to control by senior creditors with first priority liens. If there is a default, the value of the collateral may not be sufficient to repay in full both the first priority creditors and the Operating Company.
Certain loans to portfolio companies will be secured on a second priority basis by the same collateral securing senior secured debt of such companies. The first priority liens on the collateral will secure the portfolio company's obligations under any outstanding senior debt and may secure certain other future debt that may be permitted to be incurred by the portfolio company under the agreements
Table of Contents
governing the loans. The holders of obligations secured by the first priority liens on the collateral will generally control the liquidation of and be entitled to receive proceeds from any realization of the collateral to repay their obligations in full before the Operating Company. In addition, the value of the collateral in the event of liquidation will depend on market and economic conditions, the availability of buyers and other factors. There can be no assurance that the proceeds, if any, from the sale or sales of all of the collateral would be sufficient to satisfy the loan obligations secured by the second priority liens after payment in full of all obligations secured by the first priority liens on the collateral. If such proceeds are not sufficient to repay amounts outstanding under the loan obligations secured by the second priority liens, then the Operating Company, to the extent not repaid from the proceeds of the sale of the collateral, will only have an unsecured claim against the portfolio company's remaining assets, if any.
The rights the Operating Company may have with respect to the collateral securing the loans it makes to its portfolio companies with senior debt outstanding may also be limited pursuant to the terms of one or more intercreditor agreements entered into with the holders of first priority senior debt. Under an intercreditor agreement, at any time that obligations that have the benefit of the first priority liens are outstanding, any of the following actions that may be taken in respect of the collateral will be at the direction of the holders of the obligations secured by the first priority liens: the ability to cause the commencement of enforcement proceedings against the collateral, the ability to control the conduct of such proceedings, the approval of amendments to collateral documents; releases of liens on the collateral and waivers of past defaults under collateral documents. The Operating Company may not have the ability to control or direct these actions, even if its rights are adversely affected.
The Operating Company generally does not control its portfolio companies.
The Operating Company does not, and does not expect to, control most of its portfolio companies, even though the Operating Company may have board representation or board observation rights, and its debt agreements may contain certain restrictive covenants that limit the business and operations of its portfolio companies. As a result, the Operating Company is subject to the risk that a portfolio company may make business decisions with which the Operating Company disagrees and the management of such company, in which the Operating Company invests as representatives of the holders of their common equity, may take risks or otherwise act in ways that do not serve the Operating Company's interests as debt investors. Due to the lack of liquidity of the investments that the Operating Company typically holds in its portfolio companies, it may not be able to dispose of its investments in the event that the Operating Company disagrees with the actions of a portfolio company
Table of Contents
as readily as it would otherwise like to or at favorable prices which could decrease the value of its investments.
Economic recessions, downturns or government spending cuts could impair the Operating Company's portfolio companies and harm its operating results.
Many of the Operating Company's portfolio companies may be susceptible to economic slowdowns or recessions and may be unable to repay its debt investments during these periods. Therefore, the Operating Company's non-performing assets are likely to increase, and the value of the Operating Company's portfolio is likely to decrease during these periods. Adverse economic conditions also may decrease the value of collateral securing some of the Operating Company's debt investments and the value of its equity investments. Economic slowdowns or recessions could lead to financial losses in the Operating Company's portfolio and a decrease in revenues, net income and assets. Unfavorable economic conditions also could increase the Operating Company's funding costs, limit NMFC's and the Operating Company's access to the capital markets or result in a decision by lenders not to extend credit to the Operating Company. These events could prevent the Operating Company from increasing investments and harm its operating results.
In addition, levelsTable of the U.S. government's spending in future periods are very difficult to predict and subject to significant risks. Significant budgetary constraints may result in further reductions to projected spending levels. In particular, U.S. government expenditures are subject to the potential for automatic reductions, generally referred to as "sequestration". Sequestration may result in significant additional reductions to spending by the U.S. government on both existing and new contracts as well as disruption of ongoing programs. Also, we expect that budgetary constraints and ongoing concerns regarding the U.S. national debt will continue to place downward pressure on U.S. government spending levels. Due to these and other factors, overall U.S. government spending could decline, which could result in significant reductions to the revenues, cash flow and profits of the Operating Company's portfolio companies.Contents
A number of the Operating Company's portfolio companies provide services to the U.S. government. Changes in the U.S. government's priorities and spending, or significant delays or reductions in appropriations of the U.S. government's funds, could have a material adverse effect on the financial position, results of operations and cash flows of such portfolio companies.
A number of the Operating Company's portfolio companies derive a substantial portion of their revenue from the U.S. government. Levels of the U.S. government's spending in future periods are very difficult to predict and subject to significant risks. In addition, significant budgetary constraints may result in further reductions to projected spending levels. In particular, U.S. government expenditures are subject to the potential for automatic reductions, generally referred to as "sequestration"."sequestration." Sequestration occurred during 2013, and may occur again in the future, resulting in significant additional reductions to spending by the U.S. government on both existing and new contracts as well as disruption of ongoing programs. Even if sequestration does not occur again in the future, we expect that budgetary constraints and ongoing concerns regarding the U.S. national debt will continue to place downward pressure on U.S. government spending levels. Due to these and other factors, overall U.S. government spending could decline, which could result in significant reductions to the revenues, cash flow and profits of the Operating Company's portfolio companies that provide services to the U.S. government.
Defaults by the Operating Company's portfolio companies may harm its operating results.
A portfolio company's failure to satisfy financial or operating covenants imposed by the Operating Company or other lenders could lead to defaults and, potentially, termination of its loans and foreclosure on its secured assets, which could trigger cross-defaults under other agreements and
Table of Contents
jeopardize a portfolio company's ability to meet its obligations under the debt or equity securities that the Operating Company holds.
The Operating Company may incur expenses to the extent necessary to seek recovery upon default or to negotiate new terms, which may include the waiver of certain financial covenants, with a defaulting portfolio company. In addition, lenders in certain cases can be subject to lender liability claims for actions taken by them when they become too involved in the borrower's business or exercise control over a borrower. It is possible that the Operating Company could become subject to a lender's liability claim, including as a result of actions taken if it renders significant managerial assistance to the borrower. Furthermore, if one of the Operating Company's portfolio companies were to file for bankruptcy protection, even though the Operating Company may have structured its investment as senior secured debt, depending on the facts and circumstances, including the extent to which the Operating Company provided managerial assistance to that portfolio company, a bankruptcy court might re-characterize its debt holding and subordinate all or a portion of the Operating Company's claim to claims of other creditors.
Prepayments of the Operating Company's debt investments by its portfolio companies could adversely impact the Operating Company's results of operations and reduce its return on equity.
The Operating Company is subject to the risk that the investments it makes in its portfolio companies may be repaid prior to maturity. When this occurs, subject to maintenance of NMFC'sthe Company's RIC status, the Operating Company will generally reinvest these proceeds in temporary investments, pending theirits future investment in new portfolio companies. These temporary investments will typically have substantially lower yields than the debt being prepaid and the Operating Company could experience significant delays in reinvesting these amounts. Any future investment in a new portfolio company may also be at lower yields than the debt that was repaid. As a result, the Operating Company's results of operations could be materially adversely affected if one or more of its portfolio companies elect to prepay amounts owed to the Operating Company. Additionally, prepayments could negatively impact the Operating Company's return on equity, which could result in a decline in the market price of NMFC'sits common stock.
Table of Contents
The Operating Company may not realize gains from its equity investments.
When the Operating Company invests in portfolio companies, it may acquire warrants or other equity securities of portfolio companies as well. The Operating Company may also invest in equity securities directly. To the extent the Operating Company holds equity investments, it will attempt to dispose of them and realize gains upon its disposition of them. However, the equity interests the Operating Company receives may not appreciate in value and, in fact, may decline in value. As a result, the Operating Company may not be able to realize gains from its equity interests, and any gains that it does realize on the disposition of any equity interests may not be sufficient to offset any other losses it experiences. The Operating Company also may be unable to realize any value if a portfolio company does not have a liquidity event, such as a sale of the business, recapitalization or public offering, which would allow the Operating Company to sell the underlying equity interests.
The performance of the Operating Company's portfolio companies may differ from its historical performance as its current investment strategy includes significantly more primary originations in addition to secondary market purchases.
Historically, the Operating Company's investment strategy consisted primarily of secondary market purchases in debt securities. The Operating Company adjusted its investment strategy to also include significantly more primary originations. While loans the Operating Company originates and loans it purchases in the secondary market face many of the same risks associated with the financing of leveraged companies, the Operating Company may be exposed to different risks depending on specific
Table of Contents
business considerations for secondary market purchases or origination of loans. Primary originations require substantially more time and resources for sourcing, diligencing and monitoring investments, which may consume a significant portion of the Operating Company's resources. Further, the valuation process for primary originations may be more cumbersome and uncertain due to the lack of comparable market quotes for the investment and would likely require more frequent review by a third-party valuation firm. This may result in greater costs for the Operating Company and fluctuations in the quarterly valuations of investments that are primary originations. As a result, this strategy may result in different returns from these investments than the types of returns the Operating Company has historically experienced from secondary market purchases of debt securities.
The Operating Company may be subject to additional risks if it invests in foreign securities and/or engageengages in hedging transactions.
The 1940 Act generally requires that 70.0% of the Operating Company's investments be in issuers each of whom is organized under the laws of, and has its principal place of business in, any state of the United States,U.S., the District of Columbia, Puerto Rico, the Virgin Islands or any other possession of the United States.U.S. The Operating Company's investment strategy does not presently contemplate significant investments in securities of non-U.S. companies. However, the Operating Company may desire to make such investments in the future, to the extent that such transactions and investments are permitted under the 1940 Act. The Operating Company expects that these investments would focus on the same types of investments that it makes in U.S. middle market companies and accordingly would be complementary to its overall strategy and enhance the diversity of its holdings. Investing in foreign companies could expose the Operating Company to additional risks not typically associated with investing in U.S. companies. These risks include changes in exchange control regulations, political and social instability, expropriation, imposition of foreign taxes, less liquid markets and less available information than is generally the case in the United States,U.S., higher transaction costs, less government supervision of exchanges, brokers and issuers, less developed bankruptcy laws, difficulty in enforcing contractual obligations, lack of uniform accounting and auditing standards and greater price volatility. Investments denominated in foreign currencies would be subject to the risk that the value of a particular currency will change in relation to one or more other currencies. Among the factors that may affect currency values are trade balances, the level of short-term interest rates, differences in relative values of similar assets in different currencies, long-term opportunities for
Table of Contents
investment and capital appreciation and political developments. The Operating Company may employ hedging techniques to minimize these risks, but it can offer no assurance that it will, in fact, hedge currency risk, or that if it does, such strategies will be effective.
Engaging in hedging transactions would also, indirectly, entail additional risks to NMFC'sthe Company's stockholders. Although it is not currently anticipated that the Operating Company would engage in hedging transactions as a principal investment strategy, if the Operating Company determined to engage in hedging transactions it generally would seek to hedge against fluctuations of the relative values of its portfolio positions from changes in market interest rates or currency exchange rates. Hedging against a decline in the values of the Operating Company's portfolio positions would not eliminate the possibility of fluctuations in the values of such positions or prevent losses if the values of the positions declined. However, such hedging could establish other positions designed to gain from those same developments, thereby offsetting the decline in the value of such portfolio positions.
These hedging transactions could also limit the opportunity for gain if the values of the underlying portfolio positions increased. Moreover, it might not be possible to hedge against an exchange rate or interest rate fluctuation that was so generally anticipated that the Operating Company would not be able to enter into a hedging transaction at an acceptable price. If the Operating Company chooses to engage in hedging transactions, there can be no assurances that the Operating Company will achieve the intended benefits of such transactions and, depending on the degree of exposure such transactions
Table of Contents
could create, such transactions may expose the Operating Company and, indirectly, NMFC to risk of loss.
While the Operating Company may enter into these types of transactions to seek to reduce currency exchange rate and interest rate risks, unanticipated changes in currency exchange rates or interest rates could result in poorer overall investment performance than if it had not engaged in any such hedging transactions. In addition, the degree of correlation between price movements of the instruments used in a hedging strategy and price movements in the portfolio positions being hedged could vary. Moreover, for a variety of reasons, the Operating Company might not seek to establish a perfect correlation between the hedging instruments and the portfolio holdings being hedged. Any imperfect correlation could prevent the Operating Company from achieving the intended hedge and expose the Operating Company and NMFC to risk of loss. In addition, it might not be possible to hedge fully or perfectly against currency fluctuations affecting the value of securities denominated in non-U.S. currencies because the value of those securities would likely fluctuate as a result of factors not related to currency fluctuations.
Uncertainty relating to the LIBOR calculation process may adversely affect the value of the Operating Company's portfolio of LIBOR-indexed, floating-rate debt securities.
Concerns have been publicized that some of the member banks surveyed by the British Bankers' Association ("BBA") in connection with the calculation of LIBOR across a range of maturities and currencies may have been under-reporting or otherwise manipulating the inter-bank lending rate applicable to them in order to profit on their derivatives positions or to avoid an appearance of capital insufficiency or adverse reputational or other consequences that may have resulted from reporting inter-bank lending rates higher than those they actually submitted. A number of BBA member banks have entered into settlements with their regulators and law enforcement agencies with respect to alleged manipulation of LIBOR, and investigations by regulators and governmental authorities in various jurisdictions are ongoing.
Actions by the BBA, regulators or law enforcement agencies may result in changes to the manner in which LIBOR is determined. Uncertainty as to the nature of such potential changes may adversely affect the market for LIBOR-based securities, including the Operating Company's portfolio of LIBOR-indexed, floating-rate debt securities. In addition, any further changes or reforms to the determination or supervision of LIBOR may result in a sudden or prolonged increase or decrease in reported LIBOR,
Table of Contents
which could have an adverse impact on the market for LIBOR-based securities or the value of ourthe Company's portfolio of LIBOR-indexed, floating-rate debt securities.
RISKS RELATING TO OUR CORPORATE STRUCTURE
NMFC and AIV Holdings are holding companies with no direct operations of their own, and will depend on distributions from the Operating Company to meet their ongoing obligations.
NMFC and AIV Holdings are holding companies with no direct operations of their own, and their only business and sole asset are their respective direct ownership of units of the Operating Company. As a result, all investment decisions relating to the Operating Company's portfolio will be made by the Investment Adviser under the supervision of the Operating Company's board of directors, which may be different from NMFC's or AIV Holdings' board of directors. Although the Operating Company's Limited Liability Company Operating Agreement provides that in accordance with the 1940 Act and to the extent required thereby, NMFC and AIV Holdings will "pass through" their respective votes on all matters subject to a member vote, including with respect to the election of the Operating Company's directors, NMFC and AIV Holdings will not, and indirectly, the stockholders of NMFC and AIV Holdings will not, have any control over the Operating Company's day-to-day operations and investment decisions.
Table of Contents
NMFC and AIV Holdings also do not have any independent ability to generate revenue, and their only sources of cash flow from operations are distributions from the Operating Company. Consequently, NMFC and AIV Holdings rely on the Operating Company to cover the expenses of their day-to-day business, including expenses incident to NMFC's status as a public company. Pursuant to the Administration Agreement, the Operating Company will reimburse the Administrator for NMFC's and AIV Holdings' allocable portion of overhead and other expenses incurred by the Administrator in performing its obligations to NMFC and AIV Holdings under the Administration Agreement. However, if the Operating Company cannot or does not make the payments required pursuant to the Administration Agreement, NMFC and AIV Holdings may be unable to cover these expenses.
In addition, since NMFC and AIV Holdings are holding companies, their ability to pay distributions to their stockholders depends on the prior distribution from the Operating Company of cash in an amount sufficient to pay quarterly distributions and to maintain their statuses as RICs. The distribution of cash flows by the Operating Company to NMFC and AIV Holdings is subject to statutory restrictions under the Delaware Limited Liability Company Act, the 1940 Act and contractual restrictions under the Credit Facilities or any other debt financing facility that may limit the Operating Company's or NMF SLF's ability to make distributions. In addition, any distributions and payments of fees or costs will be based upon the Operating Company's financial performance. Any distributions of cash will be made on a pro rata basis to all of the Operating Company's members, including NMFC and Guardian AIV, indirectly, through AIV Holdings, in accordance with each unit holders' respective percentage interest.
New Mountain Capital or its affiliates may have interests that differ from your interests as stockholders of NMFC.
Guardian AIV indirectly owns, through AIV Holdings, approximately 5.6% of the units of the Operating Company as of December 31, 2013. New Mountain Capital's interests, the interests of the partners in Guardian AIV and the interests of those persons affiliated with New Mountain Capital that participated in the Concurrent Private Placement may differ from, or conflict with, your interests as stockholders of NMFC. For example, conflicts arising under the Registration Rights Agreement will be resolved as set forth therein. Under the Registration Rights Agreement, AIV Holdings and the Operating Company's Chairman and a related entity will have priority over NMFC or any other NMFC stockholder when selling any shares of NMFC common stock pursuant to their exercise of registration rights under that agreement.
Circumstances may arise in the future when the interests of the Operating Company's members conflict with the interests of NMFC's stockholders. The Operating Company's board of directors and the board of directors of NMFC are comprised of the same members. However, the Operating Company's board of directors owes fiduciary duties to its members that could conflict with the fiduciary duties NMFC's board of directors owes to its stockholders.
RISKS RELATING TO NMFC's COMMON STOCKTHE COMPANY'S SECURITIES
The market price of NMFC'sthe Company's common stock may fluctuate significantly.
The market price and liquidity of the market for shares of NMFC'sthe Company's common stock may be significantly affected by numerous factors, some of which are beyond our control and may not be directly related to the Operating Company's operating performance. These factors include:
- •
- price and volume fluctuations in the overall stock market or in the market for BDCs from time to time;
- •
- investor demand for shares of
NMFC'sits common stock;
Table of Contents
- •
- significant volatility in the market price and trading volume of securities of registered closed-end management investment companies, BDCs or other financial services companies, which is not necessarily related to the operating performance of these companies;
- •
- the inability to raise equity capital;
- •
- the
Operating Company's inability to borrow money or deploy or invest its capital;
- •
- fluctuations in interest rates;
- •
- any shortfall in revenue or net income or any increase in losses from levels expected by investors or securities analysts;
- •
- operating performance of companies comparable to the
Operating Company;
- •
- changes in regulatory policies or tax guidelines with respect to RICs or BDCs;
- •
NMFC's or the Operating Company's loss of status as or ability to operate as BDCs;a BDC;
- •
NMFC'sthe Company's failure to qualify as a RIC, loss of RIC status or ability to operate as a RIC;
- •
- actual or anticipated changes in the
Operating Company's earnings or fluctuations in its operating results;
- •
- changes in the value of the
Operating Company's portfolio of investments;
- •
- general economic conditions, trends and other external factors;
- •
- departures of key personnel; or
- •
- loss of a major source of funding.
In addition, NMFCthe Company is required to continue to meet certain listing standards in order for its common stock to remain listed on the New York Stock Exchange ("NYSE"). On January 2, 2013,If the Companies received a letter of public reprimand from the NYSE indicating that NMFC had failed to comply with Section 204.12 of the NYSE Listed Company Manual requiring ten days prior notice of a record date, in connection with the announcement of a special dividend distribution. If NMFC were to be delisted by the NYSE, the liquidity of NMFC'sits common stock would be materially impaired.
Investing in NMFC'sthe Company's common stock may involve an above average degree of risk.
The investments the Operating Company may make may result in a higher amount of risk, volatility or loss of principal than alternative investment options. These investments in portfolio companies may be highly speculative and aggressive, and therefore, an investment in NMFC'sthe Company's common stock may not be suitable for investors with lower risk tolerance.
Table of Contents
Sales of substantial amounts of NMFC'sthe Company's common stock in the public market may have an adverse effect on the market price of its common stock.
Sales of substantial amounts of NMFC'sthe Company's common stock including by itself directly, AIV Holdings, if it exercises its right to exchange its units of the Operating Company for shares of NMFC's common stock on a one-for-one basis, or New Mountain Guardian Partners, L.P. or its transferees or the perception that such sales could occur, could materially adversely affect the prevailing market prices for NMFC'sits common stock. AIV Holdings currently intends to sell its interest in the Operating Company's business as soon as practicable from time to time, depending on market conditions and any applicable contractual or legal restrictions. AIV Holdings, and the Investment Adviser, if applicable with respect to any units received as payment of the incentive fee, have the right, subject to certain conditions, to require NMFC to register under the federal securities laws the sale of any shares of NMFC's common
Table of Contents
stock held by them or that may be issued to and held by them upon exercise by AIV Holdings of the exchange right.
In addition, NMFC has granted AIV Holdings, the Operating Company's Chairman, an entity related to the Operating Company's Chairman and the Investment Adviser, if applicable with respect to any units received as payment of the incentive fee, and their permitted transferees certain "piggyback" registration rights which allow them to include their shares in any future registrations of NMFC equity securities, whether or not that registration relates to a primary offering by NMFC or a secondary offering by or on behalf of any of NMFC's stockholders or AIV Holdings. In particular, these parties will have priority over NMFC and any other of its stockholders in any registration that is an underwritten offering. Any such filing or the perception that such a filing may occur, could cause the prevailing market price of NMFC's common stock to decline and may impact NMFC's ability to sell equity to finance the Operating Company's operations. If substantial amounts of NMFC'sthe Company's common stock were sold, this could impair its ability to raise additional capital through the sale of securities should NMFCthe Company desire to do so.
Certain provisions of NMFC'sthe Company's certificate of incorporation and bylaws, as well as aspects of the Delaware General Corporation Law as well as other aspects of our structure, including Guardian AIV's substantial interest in the Operating Company, could deter takeover attempts and have an adverse impact on the price of NMFC'sthe Company's common stock.
NMFC'sThe Company's certificate of incorporation and bylaws as well as the Delaware General Corporation Law contain provisions that may have the effect of discouraging a third party from making an acquisition proposal for us. Among other things, NMFC'sthe Company's certificate of incorporation and bylaws:
- •
- provide for a classified board of directors, which may delay the ability of
NMFC'sits stockholders to change the membership of a majority of its board of directors;
- •
- authorize the issuance of "blank check" preferred stock that could be issued by
NMFC'sits board of directors to thwart a takeover attempt;
- •
- do not provide for cumulative voting;
- •
- provide that vacancies on the board of directors, including newly created directorships, may be filled only by a majority vote of directors then in office;
- •
- provide that
NMFC'sits directors may be removed only for cause;
- •
- require supermajority voting to effect certain amendments to
NMFC'sits certificate of incorporation and bylaws; and
- •
- require stockholders to provide advance notice of new business proposals and director nominations under specific procedures.
These anti-takeover provisions may inhibit a change in control in circumstances that could give the holders of NMFC'sthe Company's common stock the opportunity to realize a premium over the market price for its common stock. The Holdings Credit FacilitiesFacility and NMFC Credit Facility also include covenants that, among other things, restrict its ability to dispose of assets, incur additional indebtedness, make restricted payments, create liens on assets, make investments, make acquisitions and engage in mergers or consolidations. The Holdings Credit FacilitiesFacility and NMFC Credit Facility also include change of control provisions that accelerate the indebtedness under this facilitythese facilities in the event of certain change of control events. In addition, certain aspects of our structure, including Guardian AIV's substantial interest in the Operating Company may have the effect of discouraging a third party from making an acquisition proposal for NMFC.
Table of Contents
Shares of NMFC'sthe Company's common stock have traded at a discount from net asset value and may do so in the future.
Shares of closed-end investment companies have frequently traded at a market price that is less than the net asset value that is attributable to those shares. In part as a result of adverse economic conditions and increasing pressure within the financial sector of which the Companies areCompany is a part, NMFC'sits common stock has at times traded below its net asset value per share since NMFC'sthe Company's IPO on May 19, 2011. NMFC'sThe Company's shares could once again trade at a discount to net asset value. The possibility that NMFC'sits shares of common stock may trade at a discount from net asset value over the long term is separate and distinct from the risk that the Companies'Company's net asset value will decrease. The CompaniesCompany cannot predict whether shares of NMFC'sits common stock will trade above, at or below its net asset
Table of Contents
value. If NMFC'sits common stock trades below its net asset value, NMFCthe Company will generally not be able to issue additional shares of NMFC'sits common stock at its market price without first obtaining the approval for such issuance from its stockholders and its independent directors. If additional funds are not available to the Operating Company, the CompaniesCompany could be forced to curtail or cease the Operating Company's new lending and investment activities, and the Companies'Company's net asset value could decrease and the Companies'Company's level of distributions could be impacted.
You may not receive dividends or the Companies'Company's dividends may decline or may not grow over time.
The CompaniesCompany cannot assure you that the CompaniesCompany will achieve investment results or maintain a tax status that will allow or require any specified level of cash distributions or year-to-year increases in cash distributions. In particular, the Operating Company's future dividends, and subsequently, NMFC's and AIV Holdings' future dividends are dependent upon the investment income they receiveit receives on the Operating Company's portfolio investments. To the extent such investment income declines, the Companies'Company's ability to pay future dividends may be harmed.
If NMFCthe Company issues preferred stock, the net asset value and market value of NMFC'sits common stock will likely become more volatile.
We cannot assure you that the issuance of preferred stock would result in a higher yield or return to the holders of NMFC'sthe Company's common stock. The issuance of preferred stock would likely cause the net asset value and market value of the common stock to become more volatile. If the dividend rate on the preferred stock were to approach the net rate of return on the Operating Company's investment portfolio, the benefit of leverage to the holders of the common stock would be reduced. If the dividend rate on the preferred stock were to exceed the net rate of return on the Operating Company's portfolio, the leverage would result in a lower rate of return to the holders of common stock than if we had not issued preferred stock. Any decline in the net asset value of the Operating Company's investments would be borne entirely by the holders of common stock. Therefore, if the market value of the Operating Company's portfolio were to decline, the leverage would result in a greater decrease in net asset value to the holders of common stock than if we were not leveraged through the issuance of preferred stock. This greater net asset value decrease would also tend to cause a greater decline in the market price for the common stock. We might be in danger of failing to maintain the required asset coverage of the preferred stock or of losing our ratings, if any, on the preferred stock or, in an extreme case, the Operating Company's current investment income might not be sufficient to meet the dividend requirements on the preferred stock. In order to counteract such an event, we might need to liquidate investments in order to fund a redemption of some or all of the preferred stock. In addition, we would pay (and the holders of common stock would bear) all costs and expenses relating to the issuance and ongoing maintenance of the preferred stock, including higher advisory fees if the Operating Company's total return exceeds the dividend rate on the preferred stock. Holders of preferred stock may have different interests than holders of common stock and may at times have disproportionate influence over our affairs.
Table of Contents
Holders of any preferred stock NMFCthe Company might issue would have the right to elect members of our board of directors and class voting rights on certain matters.
Holders of any preferred stock we might issue, voting separately as a single class, would have the right to elect two members of our board of directors at all times and in the event dividends become two full years in arrears would have the right to elect a majority of the directors until such arrearage is completely eliminated. In addition, preferred stockholders have class voting rights on certain matters, including changes in fundamental investment restrictions and conversion to open-end status, and accordingly can veto any such changes. Restrictions imposed on the declarations and payment of dividends or other distributions to the holders of NMFC'sthe Company's common stock and preferred stock, both by the 1940 Act and by requirements imposed by rating agencies, if any, or the terms of the Operating Company's credit facilities, if any, might impair ourthe Company's ability to maintain ourits qualification as a
Table of Contents
RIC for U.S. federal income tax purposes. While we would intend to redeem NMFC'sthe Company's preferred stock to the extent necessary to enable usthe Company to distribute ourits income as required to maintain our qualification as a RIC, there can be no assurance that such actions could be effected in time to meet the tax requirements.
Item 1B. Unresolved Staff Comments
Not applicable.
Item 2. Properties
We do not own any real estate or other physical properties materially important to our operation.operations. Our principal executive offices are located at 787 Seventh Avenue, 48th Floor, New York, New York 10019, where we occupy our office space pursuant to our Administration Agreement with the Administrator. The office space is shared with our Investment Adviser, our Administrator and New Mountain Capital. We believe that our current office facilities are suitable and adequate for our business as currently conducted.
Item 3. Legal Proceedings
The Companies,Company, the Company's consolidated subsidiaries, the Investment Adviser and the Administrator are not currently subject to any material pending legal proceedings threatened against us as of December 31, 2013.2014. From time to time, we may be a party to certain legal proceedings incidental to the normal course of our business including the enforcement of our rights under contracts with our portfolio companies. While the outcome of these legal proceedings cannot be predicted with certainty, we do not expect that these proceedings will have a material effect upon our business, financial condition or results of operations.
Item 4. Mine Safety Disclosures
Not applicable.
Table of Contents
PART II
The terms "we", "us", "our" and the "Companies" refers to the collective: New Mountain Finance Holdings, L.L.C., New Mountain Finance Corporation and New Mountain Finance AIV Holdings Corporation.
Item 5. Market for Registrants'Registrant's Common Equity, Related Stockholder Matters and Issuer Purchases of Equity Securities
Price Range of Common Stock and Distributions
New Mountain Finance Corporation's ("NMFC", the "Company", "we", "us" or "our") common stock is traded on the New York Stock Exchange ("NYSE") under the symbol "NMFC". The following table sets forth the net asset value ("NAV") per share of NMFC's common stock, the high and low closing sale price for NMFC's common stock, the closing sale price as a percentage of NAV and the quarterly dividend distributions per share for each fiscal quarter since NMFC'sthe Company's initial public offering ("IPO") on May 19, 2011.
|
| |
| | Closing Sales
Price(3) | |
| |
| |
| | | | | | | | | | | | | | | | | | | | |
|---|
| |
| | Premium or
Discount of
High Sales to
NAV(4) | | Premium or
Discount of
Low Sales to
NAV(4) | |
| | |
| | Closing Sales
Price(3) | | Premium or
Discount of
High Closing
Sales to
NAV(4) | | Premium or
Discount of
Low Closing
Sales to
NAV(4) | |
| |
|---|
| | NAV
Per Share(2) | | Declared
Dividends
Per Share(5) | | | NAV Per
Share(2) | | Declared
Dividends
Per Share(5) | |
|---|
Fiscal Year Ended | | High | | Low | Premium or
Discount of
Low Sales to
NAV(4) | | High | | Low | Premium or
Discount of
Low Closing
Sales to
NAV(4) |
|---|
December 31, 2014 | | | | | | | | | | | | | |
Fourth Quarter | | | $ | 13.83 | | $ | 15.09 | | $ | 14.14 | | 9.11 | % | | 2.24 | % | $ | 0.34 |
Third Quarter | | | $ | 14.33 | | $ | 15.39 | | $ | 14.48 | | 7.40 | % | | 1.05 | % | $ | 0.46 | (7) |
Second Quarter | | | $ | 14.65 | | $ | 14.89 | | $ | 13.91 | | 1.64 | % | | (5.05 | )% | $ | 0.34 | |
First Quarter | | | $ | 14.53 | | $ | 15.19 | | $ | 14.46 | | 4.54 | % | | (0.48 | )% | $ | 0.34 | |
December 31, 2013 | | | | | | | | | | | | | | | | | | | | | | | | | | |
Fourth Quarter | | $ | 14.38 | | $ | 15.19 | | $ | 14.05 | | 5.63 | % | | (2.29 | )% | $ | 0.34 | | | $ | 14.38 | | $ | 15.19 | | $ | 14.05 | | 5.63 | % | | (2.29 | )% | $ | 0.34 | |
Third Quarter | | $ | 14.32 | | $ | 14.90 | | $ | 14.21 | | 4.05 | % | | (0.77 | )% | $ | 0.46 | (7) | | $ | 14.32 | | $ | 14.90 | | $ | 14.21 | | 4.05 | % | | (0.77 | )% | $ | 0.46 | (8) |
Second Quarter | | $ | 14.32 | | $ | 15.60 | | $ | 13.82 | | 8.94 | % | | (3.49 | )% | $ | 0.34 | | | $ | 14.32 | | $ | 15.60 | | $ | 13.82 | | 8.94 | % | | (3.49 | )% | $ | 0.34 | |
First Quarter | | $ | 14.31 | | $ | 15.45 | | $ | 14.30 | | 7.97 | % | | (0.07 | )% | $ | 0.34 | | | $ | 14.31 | | $ | 15.45 | | $ | 14.30 | | 7.97 | % | | (0.07 | )% | $ | 0.34 | |
December 31, 2012 | |
| |
| |
| |
| |
| |
| | | | | | | | | | | | | | |
Fourth Quarter | | $ | 14.06 | | $ | 15.18 | | $ | 13.75 | | 7.97 | % | | (2.20 | )% | $ | 0.48 | (8) | | $ | 14.06 | | $ | 15.18 | | $ | 13.75 | | 7.97 | % | | (2.20 | )% | $ | 0.48 | (9) |
Third Quarter | | $ | 14.10 | | $ | 15.50 | | $ | 14.18 | | 9.93 | % | | 0.57 | % | $ | 0.34 | | | $ | 14.10 | | $ | 15.50 | | $ | 14.18 | | 9.93 | % | | 0.57 | % | $ | 0.34 | |
Second Quarter | | $ | 13.83 | | $ | 14.29 | | $ | 13.28 | | 3.33 | % | | (3.98 | )% | $ | 0.57 | (9) | | $ | 13.83 | | $ | 14.29 | | $ | 13.28 | | 3.33 | % | | (3.98 | )% | $ | 0.57 | (10) |
First Quarter | | $ | 14.05 | | $ | 13.75 | | $ | 13.14 | | (2.14 | )% | | (6.48 | )% | $ | 0.32 | | | $ | 14.05 | | $ | 13.75 | | $ | 13.14 | | (2.14 | )% | | (6.48 | )% | $ | 0.32 | |
December 31, 2011(1) | |
| |
| |
| |
| |
| |
| | | | | | | | | | | | | | |
Fourth Quarter | | $ | 13.60 | | $ | 13.41 | | $ | 12.27 | | (1.40 | )% | | (9.78 | )% | $ | 0.30 | | | $ | 13.60 | | $ | 13.41 | | $ | 12.27 | | (1.40 | )% | | (9.78 | )% | $ | 0.30 | |
Third Quarter | | $ | 13.32 | | $ | 13.37 | | $ | 10.77 | | 0.38 | % | | (19.14 | )% | $ | 0.29 | | | $ | 13.32 | | $ | 13.37 | | $ | 10.77 | | 0.38 | % | | (19.14 | )% | $ | 0.29 | |
Second Quarter(6) | | $ | 14.25 | | $ | 13.55 | | $ | 12.35 | | (4.91 | )% | | (13.33 | )% | $ | 0.27 | | | $ | 14.25 | | $ | 13.55 | | $ | 12.35 | | (4.91 | )% | | (13.33 | )% | $ | 0.27 | |
- (1)
NMFCThe Company was not unitized until the IPO date of May 19, 2011.
- (2)
- NAV is determined as of the last date in the relevant quarter and therefore may not reflect the NAV per share on the date of the high and low sales prices. The NAVs shown are based on outstanding shares at the end of each period.
- (3)
- Closing sales price is determined as the high or low closing sales price noted within the respective quarter, not adjusted for dividends.
- (4)
- Calculated as of the respective high or low closing sales price divided by the quarter end NAV.
- (5)
- Represents the dividend
paiddeclared for the specified quarter.
- (6)
- Period from May 19, 2011 through June 30, 2011 (excludes IPO price of $13.75).
- (7)
- Includes a special dividend of $0.12 per share
payablepaid on September 3, 2014 and a third quarter dividend of $0.34 per share paid on September 30, 2014.
Table of Contents
- (8)
- Includes a special dividend of $0.12 per share paid on August 30, 2013 and a third quarter dividend of $0.34 per share
payablepaid on September 30, 2013.
(8)(9)- Includes a fourth quarter dividend of $0.34 per share
payablepaid on December 28, 2012 and a special dividend of $0.14 per share payablepaid on January 31, 2013.
Table of Contents
(9)(10)- Includes a special dividend of $0.23 per share
payablepaid on May 31, 2012 and a second quarter dividend of $0.34 per share payablepaid on June 29, 2012.
New Mountain Finance Holdings, L.L.C. (the "Operating Company") and New Mountain Finance AIV Holdings Corporation ("AIV Holdings") are not publicly traded entities.
On March 4, 2014,February 27, 2015, the last reported sales price of NMFC's common stock was $14.79$14.89 per share. As of March 4, 2014,February 27, 2015, the Operating Company had one record holder, which was NMFC, whereas NMFC had approximately 1127 stockholders of record and approximately twoone beneficial ownersowner whose shares are held in the names of brokers, dealers, funds, trusts and clearing agencies. AIV Holdings had one record holder, which was New Mountain Guardian AIV, L.P. ("Guardian AIV").
Dividends
Since NMFC and AIV Holdings are holding companies, distributions will be paid on their common stock from distributions received from the Operating Company. The Operating Company intends to make distributions to its unit holders that will be sufficient to enable NMFC and AIV Holdings to pay quarterly distributions to theirits stockholders and to maintain theirits status as a regulated investment companiescompany ("RIC"). NMFC and AIV Holdings intendThe Company intends to distribute approximately theirits entire portion of the Operating Company's Adjusted Net Investment Income (defined as net investment income adjusted to reflect income as if the cost basis of investments held at the IPO date had stepped-up to fair market value as of the IPO date) on a quarterly basis and substantially their entire portionall of the Operating Company'sits taxable income on an annual basis, except that theythe Company may retain certain net capital gains for reinvestment.
NMFC has adoptedThe Company maintains an "opt out" dividend reinvestment plan on behalf offor its stockholders, whereas NMFCcommon stockholders. As a result, the Company's stockholders' cash dividends will be automatically reinvested in additional shares of NMFC's common stock, unless the stockholder elects to receive cash. Cash dividends reinvested in additional shares of NMFC'sthe Company's common stock will be automatically reinvested by NMFCthe Company into additional unitsshares of the Operating Company.Company's common stock.
NMFCThe Company applies the following in implementing the dividend reinvestment plan. If the price at which newly issued shares are to be credited to stockholders' accounts is greater than 110.0% of the last determined net asset valueNAV of the shares, NMFCthe Company will use only newly issued shares to implement its dividend reinvestment plan. Under such circumstances, the number of shares to be issued to a stockholder is determined by dividing the total dollar amount of the distribution payable to such stockholder by the market price per share of NMFC'sthe Company's common stock on the NYSE on the distribution payment date. Market price per share on that date will be the closing price for such shares on the NYSE or, if no sale is reported for such day, the average of their electronically reported bid and asked prices. If NMFC uses newly issued shares to implement the plan, NMFC will receive, on a one-for-one basis, additional units of the Operating Company in exchange for cash distributions that are reinvested in shares of NMFC's common stock under the dividend reinvestment plan.
If the price at which newly issued shares are to be credited to stockholders' accounts is less than 110.0% of the last determined net asset valueNAV of the shares, NMFCthe Company will either issue new shares or instruct the plan administrator to purchase shares in the open market to satisfy the additional shares required. Shares purchased in open market transactions by the plan administrator will be allocated to a stockholder based on the average purchase price, excluding any brokerage charges or other charges, of all shares of common stock purchased in the open market. The number of shares of NMFC'sthe Company's common stock to be outstanding after giving effect to payment of the distribution cannot be established until the value per share at which additional shares will be issued has been determined and elections of NMFC'sits stockholders have been tabulated. AIV Holdings does not intend to reinvest any distributions received from the Operating Company in additional shares of the Operating Company. SeeItem 8.—Financial Statements and Supplementary Data—Note 2, Summary of Significant Accounting Policies for additional information.
Table of Contents
The following table reflects the Company's cash distributions, including dividends and returns of capital, if any, per unit/share that have been declared by the Operating Company's board of directors and subsequently NMFC's board of directors, since NMFC'sthe Company's IPO:
| Date Declared | | Record Date | | Payment Date | | Amount | | | Record Date | | Payment Date | | Amount | |
|---|
November 4, 2014 | | | December 16, 2014 | | December 30, 2014 | | $ | 0.34 | |
August 5, 2014 | | | September 16, 2014 | | September 30, 2014 | | | 0.34 | |
July 30, 2014 | | | August 20, 2014 | | September 3, 2014 | | | 0.12 | (1) |
May 6, 2014 | | | June 16, 2014 | | June 30, 2014 | | | 0.34 | |
March 4, 2014 | | | March 17, 2014 | | March 31, 2014 | | | 0.34 | |
| | | | | | | | | | |
| | | | | | | $ | 1.48 | |
November 8, 2013 | | December 17, 2013 | | December 31, 2013 | | $ | 0.34 | | | December 17, 2013 | | December 31, 2013 | |
$ |
0.34 | |
August 7, 2013 | | September 16, 2013 | | September 30, 2013 | | 0.34 | | | September 16, 2013 | | September 30, 2013 | | | 0.34 | |
August 7, 2013 | | August 20, 2013 | | August 30, 2013 | | 0.12 | (1) | | August 20, 2013 | | August 30, 2013 | | | 0.12 | (2) |
May 6, 2013 | | June 14, 2013 | | June 28, 2013 | | 0.34 | | | June 14, 2013 | | June 28, 2013 | | | 0.34 | |
March 6, 2013 | | March 15, 2013 | | March 28, 2013 | | 0.34 | | | March 15, 2013 | | March 28, 2013 | | | 0.34 | |
| | | | | | | | | |
| | | | | | | | | | | | | | | | |
| | | | | | $ | 1.48 | | | | | | | $ | 1.48 | |
December 27, 2012 | | December 31, 2012 | | January 31, 2013 | |
$ |
0.14 |
(2) | | December 31, 2012 | | January 31, 2013 | |
$ |
0.14 |
(3) |
November 6, 2012 | | December 14, 2012 | | December 28, 2012 | | 0.34 | | | December 14, 2012 | | December 28, 2012 | | | 0.34 | |
August 8, 2012 | | September 14, 2012 | | September 28, 2012 | | 0.34 | | | September 14, 2012 | | September 28, 2012 | | | 0.34 | |
May 8, 2012 | | June 15, 2012 | | June 29, 2012 | | 0.34 | | | June 15, 2012 | | June 29, 2012 | | | 0.34 | |
May 8, 2012 | | May 21, 2012 | | May 31, 2012 | | 0.23 | (3) | | May 21, 2012 | | May 31, 2012 | | | 0.23 | (4) |
March 7, 2012 | | March 15, 2012 | | March 30, 2012 | | 0.32 | | | March 15, 2012 | | March 30, 2012 | | | 0.32 | |
| | | | | | | | | |
| | | | | | | | | | | | | | | | |
| | | | | | $ | 1.71 | | | | | | | $ | 1.71 | |
November 8, 2011 | | December 15, 2011 | | December 30, 2011 | |
$ |
0.30 | | | December 15, 2011 | | December 30, 2011 | |
$ |
0.30 | |
August 10, 2011 | | September 15, 2011 | | September 30, 2011 | | 0.29 | | | September 15, 2011 | | September 30, 2011 | | | 0.29 | |
August 10, 2011 | | August 22, 2011 | | August 31, 2011 | | 0.27 | | | August 22, 2011 | | August 31, 2011 | | | 0.27 | |
| | | | | | | | | |
| | | | | | | | | | | | | | | | |
| | | | | | $ | 0.86 | | |
| | | | | | | | | | | | | | $ | 0.86 | |
| | | | | | | | | | | | | | | | |
Total | | | | | | $ | 4.05 | | | | | | | $ | 5.53 | |
| | | | | | | | | |
| | | | | | | | | | | | | | | | |
| | | | | | | | | | |
| | | | | | | | | | |
- (1)
- Special dividend related to realized capital gains attributable to the Company's warrant investments in Learning Care Group (US), Inc.
- (2)
- Special dividend related to a distribution received attributable to New Mountain Finance Holdings, L.L.C.'s ("NMF Holdings" or the "Predecessor Operating
Company'sCompany") investment in YP Equity Investors LLC.
(2)(3)- Special dividend intended to minimize to the greatest extent possible
NMFC'sthe Company's U.S. federal income or excise tax liability.
(3)(4)- Special dividend related to estimated realized capital gains attributable to the Predecessor Operating Company's investments in Lawson Software, Inc. and Infor Lux Bond Company.
Table of Contents
The following table reflects the cash distributions, including dividends and returns of capital, if any, that have been declared by the Operating Company's board of directors on a per share/unit basis, and subsequently AIV Holdings' board of directors, since NMFC's IPO:
| | | | | | | | |
Date Declared | | Record Date | | Payment Date | | Amount (in millions) | |
|---|
November 8, 2013 | | December 17, 2013(1) | | December 31, 2013 | | $ | 0.9 | (2) |
August 7, 2013 | | September 16, 2013(3) | | September 30, 2013 | | | 2.2 | |
August 7, 2013 | | August 20, 2013(3) | | August 30, 2013 | | | 0.8 | (4) |
May 6, 2013 | | June 14, 2013(5) | | June 28, 2013 | | | 3.8 | (6) |
March 6, 2013 | | March 15, 2013(7) | | March 28, 2013(8) | | | 5.5 | (9) |
| | | | | | | | |
| | | | | | | | | |
| | | | | | $ | 13.2 | |
December 27, 2012 | | December 31, 2012(7) | | January 31, 2013 | |
$ |
2.3 |
(10) |
November 6, 2012 | | December 14, 2012(7) | | December 28, 2012(11) | | | 5.5 | |
August 8, 2012 | | September 14, 2012(12) | | September 28, 2012 | | | 6.9 | (13) |
May 8, 2012 | | June 15, 2012(12) | | June 29, 2012(14) | | | 6.9 | |
May 8, 2012 | | May 21, 2012(12) | | May 31, 2012 | | | 4.6 | (15) |
March 7, 2012 | | March 15, 2012(12) | | March 30, 2012(16) | | | 6.5 | |
| | | | | | | | |
| | | | | | | | | |
| | | | | | $ | 32.7 | |
November 8, 2011 | | December 15, 2011(12) | | December 30, 2011 | |
$ |
6.1 | |
August 10, 2011 | | September 15, 2011(12) | | September 30, 2011 | | | 5.9 | |
August 10, 2011 | | August 22, 2011(12) | | August 31, 2011 | | | 5.4 | |
| | | | | | | | |
| | | | | | | | | |
| | | | | | $ | 17.4 | |
| | | | | | | | |
| | | | | | | | | |
Total | | | | | | $ | 63.3 | |
| | | | | | | | |
| | | | | | | | | |
| | | | | | | | | |
| | | | | | | | |
(1)As of the record date, AIV Holdings owned 2,671,938 units of the Operating Company. AIV Holdings received a total dividend for the amounts and subsequently AIV Holdings' board of directors declared total dividends in the same amounts payable to the holders of record as of the record date.
(2)This amount does not include the distribution to Guardian AIV of $54.2 million in connection with net proceeds from the October 17, 2013 underwritten secondary public offering of NMFC's common stock on behalf of AIV Holdings.
(3)As of the record date, AIV Holdings owned 6,571,938 units of the Operating Company. AIV Holdings received a total dividend for the amounts and subsequently AIV Holdings' board of directors declared total dividends in the same amounts payable to the holders of record as of the record date.
(4)Special dividend related to a distribution received attributable to the Operating Company's investment in YP Equity Investors LLC.
(5)As of the record date, AIV Holdings owned 11,321,938 units of the Operating Company. AIV Holdings received a total dividend for the amounts and subsequently AIV Holdings' board of directors declared total dividends in the same amounts payable to the holders of record as of the record date.
(6)This amount does not include the distribution to Guardian AIV of $66.9 million in connection with net proceeds from the June 21, 2013 underwritten secondary public offering of NMFC's common stock on behalf of AIV Holdings.
Table of Contents
(7)As of the respective record dates, AIV Holdings owned 16,221,938 units of the Operating Company. AIV Holdings received a total dividend for the respective amounts and subsequently AIV Holdings' board of directors declared total dividends in the same amounts payable to the holders of record as of the respective record dates.
(8)Actual cash payment was made on April 5, 2013.
(9)This amount does not include the distribution to Guardian AIV of $67.8 million in connection with net proceeds from the March 25, 2013 underwritten secondary public offering of NMFC's common stock on behalf of AIV Holdings.
(10)Special dividend intended to minimize to the greatest extent possible NMFC's federal income or excise tax liability.
(11)Actual cash payment was made on January 7, 2013.
(12)As of the respective record dates, AIV Holdings owned 20,221,938 units of the Operating Company. AIV Holdings received a total dividend for the respective amounts and subsequently AIV Holdings' board of directors declared total dividends in the same amounts payable to the holders of record as of the respective record dates.
(13)This amount does not include the distribution to Guardian AIV of $58.2 million in connection with net proceeds from the September 28, 2012 underwritten secondary public offering of NMFC's common stock on behalf of AIV Holdings.
(14)Actual cash payment was made on July 9, 2012.
(15)Special dividend related to estimated realized capital gains attributable to the Operating Company's investments in Lawson Software, Inc. and Infor Lux Bond Company.
(16)Actual cash payment was made on April 4, 2012.
Tax characteristics of all dividends paid by NMFC and AIV Holdingsthe Company were reported to stockholders on Form 1099 after the end of the calendar year. Future quarterly dividends, if any, for the CompaniesCompany will be determined by their respectivethe board of directors.
Table of Contents
Unregistered Sales of Equity Securities
We did not engage in unregistered sales of securities during the year ended December 31, 2013.2014.
Issuer Purchases of Equity Securities
For the quarteryear ended December 31, 2013, NMFC2014, the Company did not purchase any of its common stock in the open market.
Table of Contents
Stock Performance Graph
This graph compares the return on NMFC'sthe Company's common stock with that of the Standard & Poor's 500 Total Return Index ("S&P 500 TR") and the Russell 2000 Index Total Return ("Russell 2000 TR") as we do not believe that there is an appropriate index of companies with an investment strategy similar to our own with which to compare the return on NMFC'sthe Company's common stock, for the period May 19, 2011 (commencement of operations) to December 31, 2013.2014. The graph assumes that, on May 19, 2011, a person invested $100 in each of NMFC'sthe Company's common stock, the S&P 500 TR and the Russell 2000 TR. The graph measures total stockholder return, which takes into account both changes in stock price and dividends. It assumes that dividends paid are invested in like securities.
Comparison of Cumulative Total Return Among NMFC, S&P 500 TR and Russell 2000 TR

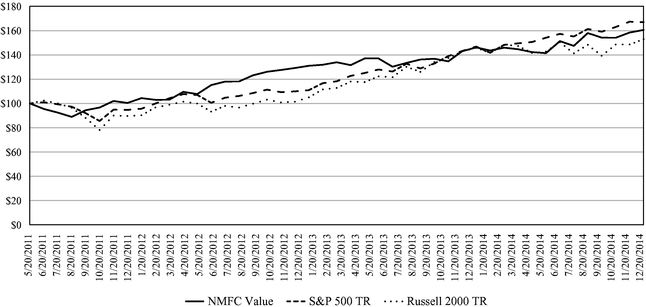
The graph and other information furnished under this Part II Item 5 of this combined Form 10-K shall not be deemed to be "soliciting material" or to be filed with the United States Securities and Exchange Commission or subject to Regulation 14A or 14C, or to the liabilities of Section 18 of the "1934" Act. The stock price performance included in the above graph is not necessarily indicative of future stock performance.
Table of Contents
Item 6. Selected Financial Data
The selected financial data should be read in conjunction with the respectiveconsolidated financial statements and related combined notes thereto andItem 7.—Management's Discussion and Analysis of Financial Condition and Results of Operations included in this report. Financial information for the years ended December 31, 2014, December 31, 2013, December 31, 2012, December 31, 2011, December 31, 2010 and December 31, 2009, has been derived from the Operating Company's consolidated financial statements that were audited by Deloitte & Touche LLP ("Deloitte"), an independent registered public accounting firm.
Table of Contents
The below selected financial and other data is for the Operating Company.
| | | | | | | | | | | | | | | | |
| | Years ended December 31, | |
|---|
New Mountain Finance Holdings, L.L.C. | | 2013 | | 2012 | | 2011 | | 2010 | | 2009 | |
|---|
Statement of Operations Data: | | | | | | | | | | | | | | | | |
Total investment income | | $ | 114,912 | | $ | 85,786 | | $ | 56,523 | | $ | 41,375 | | $ | 21,767 | |
Net expenses | | | 51,235 | | | 40,569 | | | 17,998 | | | 3,911 | | | 1,359 | |
Net investment income | | | 63,677 | | | 45,217 | | | 38,525 | | | 37,464 | | | 20,408 | |
Net realized and unrealized gains (losses) | | | 15,247 | | | 28,779 | | | (6,848 | ) | | 26,328 | | | 105,272 | |
Net increase (decrease) in net assets resulting from operations | | | 78,924 | | | 73,996 | | | 31,677 | | | 63,792 | | | 125,680 | |
Per unit data: | | | | | | | | | | | | | | | | |
Net asset value | | $ | 14.38 | | $ | 14.06 | | $ | 13.60 | | | N/A | | | N/A | |
Net increase (decrease) in net assets resulting from operations (basic and diluted) | | | 1.79 | | | 2.18 | | | 1.02 | | | N/A | | | N/A | |
Dividends declared(1) | | | 1.48 | | | 1.71 | | | 0.86 | | | N/A | | | N/A | |
Balance sheet data: | | | | | | | | | | | | | | | | |
Total assets | | $ | 1,147,841 | | $ | 1,025,564 | | $ | 730,579 | | $ | 460,224 | | $ | 330,558 | |
Holdings Credit Facility | | | 221,849 | | | 206,938 | | | 129,038 | | | 59,697 | | | 77,745 | |
SLF Credit Facility | | | 214,668 | | | 214,262 | | | 165,928 | | | 56,936 | | | — | |
Total net assets | | | 688,516 | | | 569,939 | | | 420,502 | | | 241,927 | | | 239,441 | |
Other data: | | | | | | | | | | | | | | | | |
Total return at net asset value(2) | | | 13.27 | % | | 16.61 | % | | 10.09 | % | | 26.54 | % | | 76.38 | % |
Number of portfolio companies at year end | | | 59 | | | 63 | | | 55 | | | 43 | | | 24 | |
Total new investments for the year | | $ | 529,307 | | $ | 673,218 | | $ | 493,331 | | $ | 332,708 | | $ | 268,382 | |
Investment sales and repayments for the year | | $ | 426,561 | | $ | 423,874 | | $ | 231,962 | | $ | 258,202 | | $ | 125,430 | |
Weighted average Yield to Maturity on debt portfolio at year end (unaudited)(3) | | | 10.6 | % | | 10.1 | % | | 10.7 | % | | — | (4) | | — | (4) |
Weighted average Adjusted Yield to Maturity on debt portfolio at year end (unaudited) | | | — | (5) | | — | (5) | | 13.1 | % | | 12.5 | % | | 12.7 | % |
Weighted average common membership units outstanding for the year | | | 44,021,920 | | | 34,011,738 | | | 30,919,629 | (6) | | N/A | | | N/A | |
Portfolio turnover | | | 40.52 | % | | 52.02 | % | | 42.13 | % | | 76.69 | % | | 57.50 | % |
N/A—Fund was not unitized as of December 31, 2010 and December 31, 2009.
(1)Dividends declared in the year ended December 31, 2013 include a $0.12 per unit special dividend related to a distribution received attributable to the Operating Company's investment in YP Equity Investors LLC. Dividends declared in the year ended December 31, 2012 include a $0.23 per unit special dividend related to estimated realized capital gains attributable to the Operating Company's investments in Lawson Software, Inc. and Infor Lux Bond Company and a $0.14 per unit special dividend intended to minimize to the greatest extent possible NMFC's federal income or excise tax
Table of Contents
liability. Actual cash payments on the dividends declared to AIV Holdings only, for the quarters ended March 31, 2012, June 30, 2012, December 31, 2012 and March 31, 2013, were made on April 4, 2012, July 9, 2012, January 7, 2013 and April 5, 2013 respectively.
(2)For the years ended December 31, 2013 and December 31, 2012, total return is calculated assuming a purchase at net asset value on the opening of the first day of the year and a sale at net asset value on the last day of the respective year. Dividends and distributions, if any, are assumed for purposes of this calculation, to be reinvested at the net asset value on the last day of the respective quarter. For the year ended December 31, 2011, total return is calculated in two parts: (1) from the opening of the first day of the year to NMFC's IPO date, total return is calculated based on net income over weighted average net assets and (2) from NMFC's IPO date to the last day of the year, total return is calculated assuming a purchase at net asset value on NMFC's IPO date and a sale at net asset value on the last day of the year. Dividends and distributions, if any, are assumed for purposes of this calculation, to be reinvested at the net asset value on the last day of the respective quarter. For the years ended December 31, 2010 and December 31, 2009, total return is the ratio of net income compared to capital, adjusted for capital contributions and distributions.
(3)The Operating Company's weighted average Yield to Maturity calculation assumes that all investments not on non-accrual are purchased at fair value on the respective period ends and held until their respective maturities with no prepayments or losses and exited at par at maturity.
(4)Prior to NMFC's IPO, for yield calculation purposes, New Mountain Finance SPV Funding, L.L.C. ("NMF SLF") was treated as a fully levered asset of the Operating Company with NMF SLF's net asset value being included in the yield to maturity calculations. Since NMF SLF is consolidated in accordance with GAAP, at the time of the IPO, the Operating Company began using the weighted average Yield to Maturity concept instead of the "Adjusted Yield to Maturity" concept for yield calculation purposes.
(5)"Adjusted Yield to Maturity" assumes that the investments in the Operating Company's portfolio are purchased at fair value on the respective period ends and held until their respective maturities with no prepayments or losses and exited at par at maturity. This calculation excludes the impact of existing leverage, except for the non-recourse debt of NMF SLF. NMF SLF is treated as a fully levered asset of the Operating Company, with NMF SLF's net asset value being included for yield calculation purposes.
(6)Weighted average common membership units outstanding presented from May 19, 2011 to December 31, 2011, as the fund became unitized on May 19, 2011, the IPO date.
Table of Contents
The below selected financial and other data is for NMFC.
| | | | | | | | | | |
| |
| |
| | Period from
May 19, 2011
(commencement of
operations) to
December 31, 2011 | |
|---|
| | Years ended December 31, | |
|---|
| | | | | | | | | | | | | |
| |
| |
| |
| | Period from
May 19, 2011
(commencement
of operations)
to December 31,
2011 | |
|---|
| | Years ended December 31, | |
|---|
New Mountain Finance Corporation | | 2014 | | 2013 | | 2012 | |
|---|
Statement of Operations Data: | | | | | | | | | | | | | | Total investmentInvestment income allocated from the Operating Company
| | $ | 91,923 | | $ | — | | $ | — | | $ | — | | Investment income allocated from NMF Holdings | | | 43,678 | | | 90,876 | | $ | 37,511 | | $ | 13,669 | | Net expenses | | | 34,727 | | | — | | | — | | | — | | Net expenses allocated from the Operating CompanyNMF Holdings | | | 20,808 | | | 40,355 | | | 17,719 | | | 5,324 | | Net investment income allocated from the Operating Company | | | 80,066 | | | 50,521 | | | 19,792 | | | 8,345 | | Net realized gains on investments | | | 357 | | | — | | | — | | | — | | Net realized and unrealized gains (losses) allocated from the Operating CompanyNMF Holdings | | | 9,508 | | | 11,443 | | | 12,087 | | | (4,235 | ) | Net change in unrealized (depreciation) appreciation of investments | | | (43,863 | ) | | — | | | — | | | — | | Provision for taxes | | | (493 | ) | | — | | | — | | | — | | Net change in unrealized (depreciation) appreciation of investment in the Operating CompanyNMF Holdings | | | — | | | (44 | ) | | (95 | ) | | 6,221 | | Net increase (decrease) in net assets resulting from operations | | | 45,575 | | | 61,920 | | | 31,784 | | | 10,331 | | Per share data: | | | | | | | | | | | | | | Net asset value | | $ | 13.83 | | $ | 14.38 | | $ | 14.06 | | $ | 13.60 | | Net increase (decrease) in net assets resulting from operations (basic) | | | 0.88 | | | 1.76 | | | 2.14 | | | 0.97 | | Net increase (decrease) in net assets resulting from operations (diluted)(1) | | | 1.790.86 | | | 2.181.76 | | | 2.14 | | | 0.38 | | Dividends declared(1)declared(2) | | | 1.48 | | | 1.48 | | | 1.71 | | | 0.86 | | Balance sheet data: | | | | | | | | | | | | | | Total assets | | $ | 1,514,920 | | $ | 650,107 | | $ | 345,331 | | $ | 145,487 | | Holdings Credit Facility | | | 468,108 | | | N/A | | | N/A | | | N/A | | Convertible Notes | | | 115,000 | | | N/A | | | N/A | | | N/A | | NMFC Credit Facility | | | 50,000 | | | N/A | | | N/A | | | N/A | | SBA-guaranteed debentures | | | 37,500 | | | N/A | | | N/A | | | N/A | | Total net assets | | | 802,170 | | | 650,107 | | | 341,926 | | | 145,487 | | Other data: | | | | | | | | | | | | | | Total return at market value(2)value(3) | | | 9.66 | % | | 11.62 | % | | 24.84 | % | | 4.16 | % | Total return at net asset value(3)value(4) | | | 6.56 | % | | 13.27 | % | | 16.61 | % | | 2.82 | % | Number of portfolio companies at period end | | | 71 | | | N/A | | | N/A | | | N/A | | Total new investments for the period(5) | | $ | 720,871 | | | N/A | | | N/A | | | N/A | | Investment sales and repayments for the period(5) | | $ | 384,568 | | | N/A | | | N/A | | | N/A | | Weighted average Yield to Maturity at Cost on debt portfolio at period end (unaudited)(6) | | | 10.70 | % | | N/A | | | N/A | | | N/A | | Weighted average shares outstanding for the period (basic) | | | 51,846,164 | | | 35,092,722 | | | 14,860,838 | | | 10,697,691 | | Portfolio turnover(5) | | | 29.51 | % | | N/A | | | N/A | | | N/A | |
- (1)
- In applying the if-converted method, conversion is not assumed for purposes of computing diluted earnings per share if the effect would be anti-dilutive. For the year ended December 31, 2014, there was no anti-dilution. For the years ended December 31, 2013 and December 31, 2012, due to reflecting earnings for the full year of operations of the Predecessor Operating Company assuming 100.0% NMFC ownership of Predecessor Operating Company and assuming all of New Mountain Finance AIV Holdings Corporation's ("AIV Holdings") units in the Predecessor Operating Company were
Table of Contents exchanged for public shares of NMFC during the years then ended, the earnings per share would be $1.79 and $2.18, respectively.
- (2)
- Dividends declared in the year ended December 31, 2014 include a $0.12 per share special dividend related to realized capital gains attributable to the Company's warrant investments in Learning Care Group (US), Inc. Dividends declared in the year ended December 31, 2013 include a $0.12 per share special dividend related to a distribution received attributable to the Predecessor Operating Company's investment in YP Equity Investors LLC. Dividends declared in the year ended December 31, 2012 include a $0.23 per share special dividend related to estimated realized capital gains attributable to the Predecessor Operating Company's investments in Lawson Software, Inc. and Infor Lux Bond Company and a $0.14 per share special dividend intended to minimize to the greatest extent possible NMFC's U.S. federal income or excise tax liability.
(2)(3)- For the years ended December 31, 2014, December 31, 2013, December 31, 2012 and for the period May 19, 2011 to December 31, 2011, total return is calculated assuming a purchase of common stock at the opening of the first day of the
years ended 2013 and 2012year and assuming a purchase of common stock at IPO,initial purchase offering ("IPO"), respectively, and a sale on the closing of the last day of the respective year.period ends. Dividends and distributions, if any, are assumed for purposes of this calculation, to be reinvested at prices obtained under NMFC'sthe Company's dividend reinvestment plan.
(3)(4)- Total return is calculated assuming a purchase at net asset value on the opening of the first day of the period and a sale at net asset value on the last day of the period. Dividends and distributions,
Table of Contents
if any, are assumed for purposes of this calculation, to be reinvested at the net asset value on the last day of the respective quarter.
| | | | | | | | | | |
| |
| |
| | Period from
May 19, 2011
(commencement of
operations) to
December 31, 2011 | |
|---|
| | Years ended December 31, | |
|---|
New Mountain Finance AIV Holdings Corporation | | 2013 | | 2012 | |
|---|
Statement of Operations Data: | | | | | | | | | | | Total investment income allocated from the Operating Company | | $ | 24,036 | | $ | 48,276 | | $ | 25,838 | | Net expenses allocated from the Operating Company | | | 10,881 | | | 22,850 | | | 10,063 | | Net investment income allocated from the Operating Company | | | 13,155 | | | 25,426 | | | 15,775 | | Net realized and unrealized gains (losses) allocated from the Operating Company | | | 3,804 | | | 16,692 | | | (8,005 | ) | Net change in unrealized (depreciation) appreciation of investment in the Operating Company | | | (4,349 | ) | | 1,997 | | | (6,212 | ) | Net increase (decrease) in net assets resulting from operations | | | 12,610 | | | 44,115 | | | 1,558 | | Balance sheet data: | | | | | | | | | | | Total assets | | $ | 38,409 | | $ | 235,799 | | $ | 275,015 | | Total net assets | | | 38,409 | | | 228,013 | | | 275,015 | | Other data: | | | | | | | | | | | Total return at net asset value(1) | | | 7.69 | % | | 18.04 | % | | (5.44 | )% | Weighted average shares outstanding for the period | | | 100 | | | 100 | | | 100 | | Dividends declared(2) | | $ | 13,296 | | $ | 32,660 | | $ | 17,391 | |
(1)For the years ended December 31, 2013, December 31, 2012 and for the period May 19, 2011 to December 31, 2011, total return is calculated assuming a purchase at net asset value on the opening of the first day of the respective period and a sale of net asset value on the last day of the respective year. Dividends and distributions, if any, are assumed for purposes of this calculation, to be reinvested at the net asset value on the last day of the respective quarter.
(2)(5)- For the year ended December 31, 2014, amounts include the investment activity of the Predecessor Operating Company and the Company.
- (6)
- The weighted average Yield to Maturity at Cost calculation assumes that all investments, including secured collateralized agreements, not on non-accrual are purchased at the adjusted cost on the respective period ends and held until their respective maturities with no prepayments or losses and exited at par at maturity. Adjusted cost reflects the cost for post-IPO investments in accordance with accounting principles generally accepted in the United States of America ("GAAP") and a stepped up cost basis of pre-IPO investments (assuming a step-up to fair market value occurred on the IPO date).
Table of Contents As of May 8, 2014, NMFC assumed all operating activities previously undertaken by NMF Holdings. The following table sets forth selected financial and other data for NMF Holdings when it was the Predecessor Operating Company. | | | | | | | | | | | | | | | | |
| | Years ended December 31, | |
|---|
New Mountain Finance Holdings, L.L.C. | | 2013 | | 2012 | | 2011 | | 2010 | | 2009 | |
|---|
Statement of Operations Data: | | | | | | | | | | | | | | | | | Total investment income | | $ | 114,912 | | $ | 85,786 | | $ | 56,523 | | $ | 41,375 | | $ | 21,767 | | Net expenses | | | 51,235 | | | 40,569 | | | 17,998 | | | 3,911 | | | 1,359 | | Net investment income | | | 63,677 | | | 45,217 | | | 38,525 | | | 37,464 | | | 20,408 | | Net realized and unrealized gains (losses) | | | 15,247 | | | 28,779 | | | (6,848 | ) | | 26,328 | | | 105,272 | | Net increase (decrease) in net assets resulting from operations | | | 78,924 | | | 73,996 | | | 31,677 | | | 63,792 | | | 125,680 | | Per unit data: | | | | | | | | | | | | | | | | | Net asset value | | $ | 14.38 | | $ | 14.06 | | $ | 13.60 | | | N/A | | | N/A | | Net increase (decrease) in net assets resulting from operations (basic and diluted) | | | 1.79 | | | 2.18 | | | 1.02 | | | N/A | | | N/A | | Dividends declared(1) | | | 1.48 | | | 1.71 | | | 0.86 | | | N/A | | | N/A | | Balance sheet data: | | | | | | | | | | | | | | | | | Total assets | | $ | 1,147,841 | | $ | 1,025,564 | | $ | 730,579 | | $ | 460,224 | | $ | 330,558 | | Holdings Credit Facility | | | 221,849 | | | 206,938 | | | 129,038 | | | 59,697 | | | 77,745 | | SLF Credit Facility | | | 214,668 | | | 214,262 | | | 165,928 | | | 56,936 | | | — | | Total net assets | | | 688,516 | | | 569,939 | | | 420,502 | | | 241,927 | | | 239,441 | | Other data: | | | | | | | | | | | | | | | | | Total return at net asset value(2) | | | 13.27 | % | | 16.61 | % | | 10.09 | % | | 26.54 | % | | 76.38 | % | Number of portfolio companies at period end | | | 59 | | | 63 | | | 55 | | | 43 | | | 24 | | Total new investments for the period | | $ | 529,307 | | $ | 673,218 | | $ | 493,331 | | $ | 332,708 | | $ | 268,382 | | Investment sales and repayments for the period | | $ | 426,561 | | $ | 423,874 | | $ | 231,962 | | $ | 258,202 | | $ | 125,430 | | Weighted average Yield to Maturity at Cost on debt portfolio at period end (unaudited)(3) | | | 11.0 | % | | 10.3 | % | | 10.3 | % | | — | | | — | | Weighted average Yield to Maturity on debt portfolio at period end (unaudited)(4) | | | 10.6 | % | | 10.1 | % | | 10.7 | % | | — | (5) | | — | (5) | Weighted average Adjusted Yield to Maturity on debt portfolio at period end (unaudited) | | | — | (6) | | — | (6) | | 13.1 | % | | 12.5 | % | | 12.7 | % | Weighted average common membership units outstanding for the period | | | 44,021,920 | | | 34,011,738 | | | 30,919,629 | (7) | | N/A | | | N/A | | Portfolio turnover | | | 40.52 | % | | 52.02 | % | | 42.13 | % | | 76.69 | % | | 57.50 | % |
N/A—Fund was not unitized as of December 31, 2010 and December 31, 2009.
- (1)
- Dividends declared in the year ended December 31, 2013 include a
$0.8 million$0.12 per unit special dividend related to a distribution received attributable to the Operating Company'sNMF Holdings' investment in YP Equity Investors LLC. Dividends declared in the year ended December 31, 2012 include a $4.6 million$0.23 per unit special dividend related to estimated realized capital gains attributable to the Operating Company'sNMF Holdings' investments in Lawson Software, Inc. and Infor Lux Bond Company and a $2.3 million$0.14 per unit special dividend intended to minimize to the greatest extent possible NMFC's U.S. federal income or excise tax liability. Actual cash
Table of Contents payments on the dividends declared to AIV Holdings only, for the quarters ended March 31, 2012, June 30, 2012, December 31, 2012 and March 31, 2013, were made on April 4, 2012, July 9, 2012, January 7, 2013 and April 5, 2013 respectively. This amount does not include
- (2)
- For the years ended December 31, 2013 and December 31, 2012, total return is calculated assuming a purchase at net asset value on the opening of the first day of the year and a sale at net asset value on the last day of the respective period ends. Dividends and distributions, if any, are assumed for purposes of this calculation, to
Guardian AIVbe reinvested at the net asset value on the last day of $58.2 million, $67.8 million, $66.9 million and $54.2 millionthe respective quarter. For the year ended December 31, 2011, total return is calculated in connection with net proceeds before offering coststwo parts: (1) from the September 28, 2012, March 25, 2013, June 21, 2013opening of the first day of the year to NMFC's IPO date, total return is calculated based on net income over weighted average net assets and October 17, 2013 underwritten secondary public offerings.(2) from NMFC's IPO date to the last day of the year, total return is calculated assuming a purchase at net asset value on NMFC's IPO date and a sale at net asset value on the last day of the year. Dividends and distributions, if any, are assumed for purposes of this calculation, to be reinvested at the net asset value on the last day of the respective quarter. For the years ended December 31, 2010 and December 31, 2009, total return is the ratio of net income compared to capital, adjusted for capital contributions and distributions.
- (3)
- The weighted average Yield to Maturity at Cost calculation assumes that all investments not on non-accrual are purchased at the adjusted cost on the respective period ends and held until their respective maturities with no prepayments or losses and exited at par at maturity. Adjusted cost reflects the GAAP cost for post-IPO investments and a stepped up cost basis of pre-IPO investments (assuming a step-up to fair market value occurred on the IPO date). The weighted average Yield to Maturity at Cost was not calculated prior to NMFC's IPO.
- (4)
- The weighted average Yield to Maturity calculation assumes that all investments not on non-accrual are purchased at fair value on the respective period ends and held until their respective maturities with no prepayments or losses and exited at par at maturity. The weighted average Yield to Maturity was not calculated subsequent to December 31, 2013.
- (5)
- Prior to NMFC's IPO, for yield calculation purposes, New Mountain Finance SPV Funding, L.L.C. ("NMF SLF") was treated as a fully levered asset of NMF Holdings with NMF SLF's net asset value being included in the yield to maturity calculations. Since NMF SLF is consolidated in accordance with GAAP, at the time of the IPO, NMF Holdings began using the weighted average Yield to Maturity concept instead of the "Adjusted Yield to Maturity" concept for yield calculation purposes.
- (6)
- "Adjusted Yield to Maturity" assumes that the investments in NMF Holdings' portfolio are purchased at fair value on the respective period ends and held until their respective maturities with no prepayments or losses and exited at par at maturity. This calculation excludes the impact of existing leverage, except for the non-recourse debt of NMF SLF. NMF SLF is treated as a fully levered asset of NMF Holdings, with NMF SLF's net asset value being included for yield calculation purposes.
- (7)
- Weighted average common membership units outstanding presented from May 19, 2011 to December 31, 2011, as the fund became unitized on May 19, 2011, the IPO date.
Table of Contents Item 7. Management's Discussion and Analysis of Financial Condition and Results of Operations
The information in management's discussion and analysis of financial condition and results of operations relates to each of the three separate registrants: New Mountain Finance Holdings, L.L.C., New Mountain Finance Corporation, including its wholly-owned direct and New Mountain Finance AIV Holdings Corporationindirect subsidiaries (collectively, "we", "us", "our", "NMFC" or the "Companies""Company"). Information that relates to an individual registrant will be specifically referenced by the respective company. None of the Companies makes any representation as to the information related solely to the other registrants other than itself. The following analysis of our financial condition and results of operations should be read in conjunction with our financial data and our financial statements and the combined notes thereto contained inItem 8.—Financial Statements and Supplementary Data, in this report. SeeItem 1A.—Risk Factors for a discussion of the uncertainties, risks and assumptions associated with these statements. Forward-Looking Statements The information contained in this section should be read in conjunction with the financial data and consolidated financial statements and combined notes thereto appearing inItem 8.—Financial Statements and Supplementary Data, containedelsewhere in this annual report. Some of the statements in this report (including in the following discussion) constitute forward-looking statements, which relate to future events or the future performance or financial condition of New Mountain Finance Holdings, L.L.C. (the "Operating Company" or the "Master Fund"), New Mountain Finance Corporation ("NMFC") or New Mountain Finance AIV Holdings Corporation ("AIV Holdings").Company. The forward-looking statements contained in this section involve a number of risks and uncertainties, including: - •
- statements concerning the impact of a protracted decline in the liquidity of credit markets;
- •
- the general economy, including interest and inflation rates, and its impact on the industries in which the
Operating Company invests;
- •
- the ability of the
Operating Company's portfolio companies to achieve their objectives;
- •
- the
Operating Company's ability to make investments consistent with its investment objectives, including with respect to the size, nature and terms of its investments;
- •
- the ability of New Mountain Finance Advisers BDC, L.L.C. (the "Investment Adviser") or its affiliates to attract and retain highly talented professionals;
- •
- actual and potential conflicts of interest with the Investment Adviser and other affiliates of New Mountain Capital Group, L.L.C.; and
- •
- the risk factors set forth inItem 1A.—Risk Factors.
Forward-looking statements are identified by their use of such terms and phrases such as "anticipate", "believe", "continue", "could", "estimate", "expect", "intend", "may", "plan", "potential", "project", "seek", "should", "target", "will", "would" or similar expressions. Actual results could differ materially from those projected in the forward-looking statements for any reason, including the factors set forth inItem 1A.—Risk Factors contained in this annual report. We have based the forward-looking statements included in this report on information available to us on the date of this report. We assume no obligation to update or revise publicly any forward-looking statements, whether as a result of new information, future events or otherwise, except as required by law. Although we undertake no obligation to revise or update any forward-looking statements, you are advised to consult any additional disclosures that we may make directly to you or through reports that we have filed or in the future may file with the United States Securities and Exchange Commission ("SEC"), including annual reports on Form 10-K, registration statements on Form N-2, or Form 10, quarterly reports on Form 10-Q and current reports on Form 8-K. Overview NMFC is a Delaware corporation that was originally incorporated on June 29, 2010. NMFC is a closed-end, non-diversified management investment company that has elected to be regulated as a BDC
Table of Contents Overview
The Operating Company is a Delaware limited liability company. The Operating Company is externally managed and has elected to be treated as a business development company ("BDC") under the Investment Company Act of 1940, as amended (the "1940 Act"). As such, the Operating CompanyNMFC is obligated to comply with certain regulatory requirements. The Operating CompanyNMFC has elected to be treated, and intends to becomply with the requirements to continue to qualify annually, as a regulated investment company ("RIC") under Subchapter M of the Internal Revenue Code of 1986, as amended, (the "Code"). NMFC is also registered as an investment adviser under the Investment Advisers Act of 1940, as amended (the "Advisers Act").
On May 19, 2011, NMFC priced its initial public offering (the "IPO") of 7,272,727 shares of common stock at a public offering price of $13.75 per share. Concurrently with the closing of the IPO and at the public offering price of $13.75 per share, NMFC sold an additional 2,172,000 shares of its common stock to certain executives and employees of, and other individuals affiliated with, New Mountain Capital (defined as New Mountain Capital Group, L.L.C. and its affiliates) in a concurrent private placement (the "Concurrent Private Placement"). Additionally, 1,252,964 shares were issued to the partners of New Mountain Guardian Partners, L.P. at that time for their ownership interest in the Predecessor Entities (as defined below). In connection with NMFC's IPO and through a series of transactions, New Mountain Finance Holdings, L.L.C. ("NMF Holdings" or the "Predecessor Operating Company") acquired all of the operations of the Predecessor Entities, including all of the assets and liabilities related to such operations. NMF Holdings is a Delaware limited liability company. Until May 8, 2014, NMF Holdings was externally managed and was regulated as a BDC under the 1940 Act. As such, NMF Holdings was obligated to comply with certain regulatory requirements. NMF Holdings was treated as a partnership for United States ("U.S.") federal income tax purposes for so long as it hashad at least two members. With the completion of the underwritten secondary offering on February 3, 2014, NMF Holdings' existence as a partnership for U.S. federal income tax purposes terminated and NMF Holdings became an entity that is disregarded as a separate entity from its owner for U.S. federal tax purposes. For additional information on our organizational structure prior to May 8, 2014, see "—Restructuring". The Operating Company isUntil May 8, 2014, NMF Holdings was externally managed by the Investment Adviser. As of May 8, 2014, the Investment Adviser serves as the external investment adviser to NMFC. New Mountain Finance Administration, L.L.C. (the "Administrator") provides the administrative services necessary for operations. The Investment Adviser and Administrator are wholly-owned subsidiaries of New Mountain Capital (defined as New Mountain Capital Group, L.L.C. and its affiliates).Capital. New Mountain Capital is a firm with a track record of investing in the middle market and with assets under management (which includes amounts committed, not all of which have been drawn down and invested to date) totaling more than $12.0 billion as of December 31, 2013,$15.0 billion(1), which includes total assets held by the Operating Company. New Mountain Capital focuses on investing in defensive growth companies across its private equity, public equity and credit investment vehicles. The Operating Company,NMF Holdings, formerly known as New Mountain Guardian (Leveraged), L.L.C., was originally formed as a subsidiary of New Mountain Guardian AIV, L.P. ("Guardian AIV") by New Mountain Capital in October 2008. Guardian AIV was formed through an allocation of approximately $300.0 million of the $5.1 billion of commitments supporting New Mountain Partners III, L.P., a private equity fund managed by New Mountain Capital. In February 2009, New Mountain Capital formed a co-investment vehicle, New Mountain Guardian Partners, L.P., comprising $20.4 million of commitments. New Mountain Guardian (Leveraged), L.L.C. and New Mountain Guardian Partners, L.P., together with their respective direct and indirect wholly-owned subsidiaries, are defined as the "Predecessor Entities". NMFC isPrior to December 18, 2014, New Mountain Finance SPV Funding, L.L.C. ("NMF SLF") was a Delaware corporation thatlimited liability company. NMF SLF was originally incorporated on June 29, 2010. NMFC is a closed-end, non-diversified management investment company that has elected to be treated aswholly-owned subsidiary of NMF Holdings and thus a BDC under the 1940 Act. As such, NMFC is obligated to comply with certain regulatory requirements. NMFC has elected to be treated, and intends to comply with the requirements to continue to qualify annually, as a regulated investment company ("RIC") under Subchapter Mwholly-owned indirect subsidiary of the Internal Revenue CodeCompany. NMF SLF was bankruptcy-remote and non-recourse to NMFC. As part of 1986,an amendment to the Company's exisiting credit facilities with Wells Fargo Bank, National Association, NMF SLF merged with and into NMF Holdings on
- (1)
- Includes amounts committed, not all of which have been drawn down and invested to date, as
amended, (the "Code").of December 31, 2014.
Table of Contents December 18, 2014. SeeItem 8.—Financial Statements and Supplementary Data—Note 7, Borrowings for additional information on the Company's credit facilities. Until April 25, 2014, New Mountain Finance AIV Holdings isCorporation ("AIV Holdings") was a Delaware corporation that was originally incorporated on March 11, 2011. AIV Holdings was dissolved on April 25, 2014. Guardian AIV, a Delaware limited partnership, iswas AIV Holdings' sole stockholder. AIV Holdings iswas a closed-end, non-diversified management investment company that has elected to be treatedwas regulated as a BDC under the 1940 Act. As such, AIV Holdings iswas obligated to comply with certain regulatory requirements. AIV Holdings has elected to bewas treated, and intends to complycomplied with the requirements to continue to qualify annually, as a RIC under the Code. On May 19, 2011, NMFC priced its initial public offering (the "IPO") of 7,272,727 shares of common stock at a public offering price of $13.75 per share. Concurrently with the closing of the IPO and at the public offering price of $13.75 per share, NMFC sold an additional 2,172,000 shares of its common stock to certain executives and employees of, and other individuals affiliated with, New Mountain Capital in a concurrent private placement (the "Concurrent Private Placement"). Additionally, 1,252,964 shares were issuedPrior to the partners of New Mountain Guardian Partners, L.P. at that time for their ownership interest in the Predecessor Entities. In connection with NMFC's IPO and through a series of transactions, the Operating Company owns all of the operations of the Predecessor Entities, including all of the assets and liabilities related to such operations. Restructuring (as defined below) on May 8, 2014, NMFC and AIV Holdings arewere holding companies with no direct operations of their own, and their sole asset iswas their ownership in NMF Holdings. In connection with the Operating Company.IPO, NMFC and AIV Holdings each entered into a joinder agreement with respect to the Limited Liability Company Agreement, as amended and restated (the "Operating Agreement"), of the Operating Company,NMF Holdings, pursuant to which NMFC and AIV Holdings were admitted as members of
Table of Contents
the Operating Company. NMF Holdings. NMFC acquired from the Operating Company,NMF Holdings, with the gross proceeds of the IPO and the Concurrent Private Placement, common membership units ("units") of the Operating CompanyNMF Holdings (the number of units arewere equal to the number of shares of NMFC's common stock sold in the IPO and the Concurrent Private Placement). Additionally, NMFC received units of the Operating CompanyNMF Holdings equal to the number of shares of common stock of NMFC issued to the partners of New Mountain Guardian Partners, L.P. Guardian AIV was the parent of the Operating CompanyNMF Holdings prior to the IPO and, as a result of the transactions completed in connection with the IPO, obtained units in the Operating Company.NMF Holdings. Guardian AIV contributed its units in the Operating CompanyNMF Holdings to its newly formed subsidiary, AIV Holdings, in exchange for common stock of AIV Holdings. AIV Holdings hashad the right to exchange all or any portion of its units in the Operating CompanyNMF Holdings for shares of NMFC's common stock on a one-for-one basis at any time.
Since NMFC's IPO, and through December 31, 2013, NMFC raised approximately $233.4 million in net proceeds from additional offerings of common stock and issued shares of its common stock valued at approximately $249.6 million on behalf of AIV Holdings for exchanged units. NMFC acquired from the Operating Company units of the Operating Company equal to the number of shares of NMFC's common stock sold in additional offerings. As of December 31, 2013, NMFC and AIV Holdings owned approximately 94.4% and 5.6%, respectively, of the units of the Operating Company. The currentoriginal structure was designed to generally prevent NMFC from being allocated taxable income with respect to unrecognized gains that existed at the time of the IPO in the Predecessor Entities' assets, and rather such amounts would be allocated generally to AIV Holdings. The result iswas that any distributions made to NMFC's stockholders that arewere attributable to such gains generally willwere not be treated as taxable dividends but rather as return of capital. Since NMFC's IPO, and through December 31, 2014, NMFC raised approximately $374.6 million in net proceeds from additional offerings of common stock and issued shares of its common stock valued at approximately $288.4 million on behalf of AIV Holdings for exchanged units. NMFC acquired from NMF Holdings units of NMF Holdings equal to the number of shares of NMFC's common stock sold in additional offerings. With the completion of the final secondary offering on February 3, 2014, NMFC owned 100.0% of the units of NMF Holdings, which became a wholly-owned subsidiary of NMFC. Restructuring As a BDC, AIV Holdings had been subject to the 1940 Act, including certain provisions applicable only to BDCs. Accordingly, and after careful consideration of the 1940 Act requirements applicable to BDCs, the cost of 1940 Act compliance and a thorough assessment of AIV Holdings' business model, AIV Holdings' board of directors had determined that continuation as a BDC was not in the best interests of AIV Holdings and Guardian AIV at the present time. Specifically, given that AIV Holdings was formed for the sole purpose of holding units of NMF Holdings and AIV Holdings had disposed of all of the units of NMF Holdings that it was holding as of February 3, 2014, the board of directors of AIV Holdings approved and declared advisable at an in-person meeting held on March 25, 2014 the withdrawal of AIV Holdings' election to be regulated as a BDC under the 1940 Act. In addition, the
Table of Contents board of directors of AIV Holdings approved and declared advisable for AIV Holdings to terminate its registration under Section 12(g) of the Securities Exchange Act of 1934, as amended (the "Exchange Act") and to dissolve AIV Holdings under the laws of the State of Delaware. Upon receipt of necessary stockholder consent to authorize the board of directors of AIV Holdings to withdraw AIV Holdings' election to be regulated as a BDC, the withdrawal was filed and became effective upon receipt by the U.S. SEC of AIV Holdings' notification of withdrawal on Form N-54C on April 15, 2014. The board of directors of AIV Holdings believed that AIV Holdings met the requirements for filing the notification to withdraw its election to be regulated as a BDC, upon the receipt of the necessary stockholder consent. After the notification of withdrawal of AIV Holdings' BDC election was filed with the SEC, AIV Holdings was no longer subject to the regulatory provisions of the 1940 Act applicable to BDCs generally, including regulations related to insurance, custody, composition of its board of directors, affiliated transactions and any compensation arrangements. In addition, on April 15, 2014, AIV Holdings filed a Form 15 with the SEC to terminate AIV Holdings' registration under Section 12(g) of the Exchange Act. After these SEC filings and any other federal or state regulatory or tax filings were made, AIV Holdings proceeded to dissolve under Delaware law by filing a certificate of dissolution in Delaware on April 25, 2014. Until May 8, 2014, as a BDC, NMF Holdings had been subject to the 1940 Act, including certain provisions applicable only to BDCs. Accordingly, and after careful consideration of the 1940 Act requirements applicable to BDCs, the cost of 1940 Act compliance and a thorough assessment of NMF Holdings' current business model, NMF Holdings' board of directors determined at an in-person meeting held on March 25, 2014 that continuation as a BDC was not in the best interests of NMF Holdings at the present time. At the 2014 joint annual meeting of the stockholders of NMFC and the sole unit holder of NMF Holdings held on May 6, 2014, the stockholders of NMFC and the sole unit holder of NMF Holdings approved a proposal which authorized the board of directors of NMF Holdings to withdraw NMF Holdings' election to be regulated as a BDC. Additionally, the stockholders of NMFC approved a new investment advisory and management agreement between NMFC and the Investment Adviser. Upon receipt of the necessary stockholder/unit holder approval to authorize the board of directors of NMF Holdings to withdraw NMF Holdings' election to be regulated as a BDC, the withdrawal was filed and became effective upon receipt by the SEC of NMF Holdings' notification of withdrawal on Form N-54C on May 8, 2014. Effective May 8, 2014, NMF Holdings amended and restated its Operating Agreement such that the board of directors of NMF Holdings was dissolved and NMF Holdings remained a wholly-owned subsidiary of NMFC with the sole purpose of serving as a special purpose vehicle for NMF Holdings' credit facility, and NMFC assumed all other operating activities previously undertaken by NMF Holdings under the management of the Investment Adviser (collectively, the "Restructuring"). After the Restructuring, all wholly-owned direct and indirect subsidiaries of NMFC are consolidated with NMFC for both 1940 Act and financial statement reporting purposes, subject to any financial statement adjustments required in accordance with accounting principles generally accepted in the United States of America ("GAAP"). NMFC continues to remain a BDC under the 1940 Act. Also, on May 8, 2014, NMF Holdings filed Form 15 with the SEC to terminate NMF Holdings' registration under Section 12(g) of the Exchange Act. As a special purpose entity, NMF Holdings is bankruptcy-remote and non-recourse to NMFC. In addition, the assets held at NMF Holdings will continue to be used to secure NMF Holdings' credit facility.
Table of Contents Current Organization During the year ended December 31, 2014, the Company established wholly-owned subsidiaries, NMF Ancora Holdings Inc. ("NMF Ancora") and NMF YP Holdings Inc. ("NMF YP"), which are structured as Delaware entities that serve as tax blocker corporations which hold equity or equity-like investments in portfolio companies organized as limited liability companies (or other forms of pass-through entities). Tax blocker corporations are not consolidated for income tax purposes and may incur income tax expense as a result of their ownership of portfolio companies. Additionally, the Company has a wholly-owned subsidiary, New Mountain Finance Servicing, L.L.C. ("NMF Servicing") that serves as the administrative agent on certain investment transactions. New Mountain Finance SBIC, L.P. ("SBIC LP"), and its general partner, New Mountain Finance SBIC G.P., L.L.C. ("SBIC GP"), were organized in Delaware as a limited partnership and limited liability company, respectively. SBIC LP and SBIC GP are consolidated wholly-owned direct and indirect subsidiaries of the Company. SBIC LP received a license from the U.S. Small Business Administration (the "SBA") to operate as a small business investment company ("SBIC") under Section 301(c) of the Small Business Investment Act of 1958, as amended (the "1958 Act"). The diagram below depicts the Companies'Company's organizational structure as of December 31, 2013.2014. - *
- Includes partners of New Mountain Guardian Partners, L.P.
- **
These common membership units are exchangeable into sharesNMFC is the sole limited partner of SBIC LP. NMFC, common stock on a one-for-one basis.
***New Mountain Finance SPV Funding, L.L.C. ("NMF SLF").directly or indirectly through SBIC GP, wholly-owns SBIC LP. NMFC owns 100.0% of SBIC GP which owns 1.0% of SBIC LP. NMFC owns 99.0% of SBIC LP.
The Operating Company's investment objective is to generate current income and capital appreciation through the sourcing and origination of debt securities at all levels of the capital structure, including first and second lien debt, notes, bonds and mezzanine securities. In some cases, the Operating Company's investments may also include equity interests. The primary focus is in the debt of defensive growth companies, which are defined as generally exhibiting the following characteristics: (i) sustainable secular growth drivers, (ii) high barriers to competitive entry, (iii) high free cash flow after capital expenditure and working capital needs, (iv) high returns on assets and (v) niche market dominance. Similar to the Company, SBIC LP's investment objective is to generate current income and capital appreciation under
Table of Contents the investment criteria used by the Company, however, SBIC LP's investments must be SBA eligible companies. Our portfolio may be concentrated in a limited number of industries. As of December 31, 2014, our top five industry concentrations were software, business services, education, federal services and healthcare services. As of December 31, 2013,2014, the Operating Company's net asset value was $688.5$802.2 million and its portfolio had a fair value of approximately $1,115.7$1,424.7 million in 5971 portfolio companies, with a weighted average Yield to Maturity at Cost of approximately 10.6%10.7%. This Yield to Maturity at Cost ("Yield to Maturity at Cost") calculation assumes that all
Table of Contents
investments, including secured collateralized agreements, not on non-accrual are purchased at fair valuethe adjusted cost on December 31, 2013the quarter end date and held until their respective maturities with no prepayments or losses and exited at par at maturity. Adjusted cost reflects the GAAP cost for post-IPO investments and a stepped up cost basis of pre-IPO investments (assuming a step-up to fair market value occurred on the IPO date). This calculation excludes the impact of existing leverage. Yield to Maturity at Cost uses the London Interbank Offered Rate ("LIBOR") curves at each quarter's end date. The actual yield to maturity may be higher or lower due to the future selection of the London Interbank Offered Rate ("LIBOR")LIBOR contracts by the individual companies in the Operating Company's portfolio or other factors. Recent Developments On January 27,December 31, 2014 NMFC announced thatand continuing subsequent to the U.S. Small Business Administration ("SBA") issuedyear then ended, the Company's portfolio investment in Edmentum, Inc. disclosed its projected substantial financial deterioration. The Company reflects this information in the valuation of this portfolio investment as of December 31, 2014. All interest due to the Company through the year ended December 31, 2014 has been paid. As more information becomes available, the Company may experience a "green light" letter inviting NMFC to continue its application process to obtain a license to form and operate a Small Business Investment Company ("SBIC") subsidiary. If approved, a SBIC license would provide NMFC with an incremental source of attractive long-term capital. Receipt of a green light letter from the SBA does not assure an applicant that the SBA will ultimately issue an SBIC license, and NMFC has received no assurance or indication from the SBA that it will receive a SBIC license, orfurther mark down of the timeframefair value of this investment. This investment may be placed on non-accrual status in which it would receive a license, should one ultimately be granted.the future. The investment represents 1.1% of the total portfolio at fair value as of December 31, 2014.
In January 2015, UniTek emerged from "Pre-Packaged" Chapter 11 Bankruptcy and completed its restructuring. On February 3, 2014, NMFC completed an underwritten secondary public offering of 2,325,000 shares of its common stock on behalf of a selling stockholder, AIV Holdings, at a public offering price of $14.70 per share. In connection with23, 2015, the underwritten secondary public offering, the underwriters purchased an additional 346,938 shares of NMFC's common stock from AIV Holdings with the exercise of the overallotment option to purchase up to an additional 346,938 shares of common stock. NMFC did not receive any proceeds from the sale of shares of NMFC's common stock by AIV Holdings. The Operating Company and NMFC did not bear any expenses in connection with this offering. The offering expenses were borne by the selling stockholder, AIV Holdings. As of February 3, 2014, AIV Holdings no longer owns any units of the Operating Company and NMFC owns 100.0% of the outstanding units of the Operating Company. As a result, the Companies' current organizational structure may be collapsed or simplified in the future. On March 4, 2014, the Operating Company's board of directors, and subsequently NMFC's board of directors declared a first quarter 20142015 distribution of $0.34 per unit/share payable on March 31, 20142015 to holders of record as of March 17, 2014.2015.
Critical Accounting Policies The preparation of financial statements and related disclosures in conformity with generally accepted accounting principles in the United States ("GAAP")GAAP requires management to make estimates and assumptions that affect the reported amounts of assets and liabilities, disclosure of contingent assets and liabilities at the date of the financial statements, and revenues and expenses during the periods reported. Actual results could materially differ from those estimates. We have identified the following items as critical accounting policies. Basis of Accounting The Operating Company consolidates its wholly-owned direct and indirect subsidiaries: NMF Holdings, NMF Servicing, SBIC LP, SBIC GP, NMF Ancora and NMF YP. Previously, the Company consolidated its wholly-owned indirect subsidiary NMF SLF. NMFCSLF until it merged with and AIVinto NMF Holdings do not consolidateon December 18, 2014. SeeItem 8.—Financial Statements and Supplementary Data—Note 7, Borrowings for additional information on the Operating Company. NMFC and AIV Holdings applyCompany's credit facilities. The Company is an investment company master-feeder financial statement presentation,following accounting and reporting guidance as described in Accounting Standards Codification Topic 946,Financial Services—Investment Companies, ("ASC 946"). Prior to the Restructuring, the Predecessor Operating Company consolidated its wholly-owned subsidiary, NMF SLF. NMFC and AIV Holdings did not consolidate the Predecessor Operating Company. Prior to the Restructuring, NMFC and AIV Holdings applied investment company master-feeder financial statement presentation, as described in ASC 946 to their interest in the Predecessor Operating Company. NMFC and AIV
Table of Contents Holdings observeobserved that it is also industry practice to follow the presentation prescribed for a master fund-feeder fund structure in ASC 946 in instances in which a master fund is owned by more than one feeder fund and that such presentation providesprovided stockholders of NMFC and AIV Holdings with a clearer depiction of their investment in the master fund.
Table of Contents
Valuation and Leveling of Portfolio Investments At all times consistent with GAAP and the 1940 Act, the Operating Company conducts a valuation of assets, which impacts its net asset value, and, consequently, the net asset values of NMFC and AIV Holdings.value. The Operating Company values its assets on a quarterly basis, or more frequently if required under the 1940 Act. In all cases, the Operating Company's board of directors is ultimately and solely responsible for determining the fair value of theits portfolio investments on a quarterly basis in good faith, including investments that are not publicly traded, those whose market prices are not readily available and any other situation where its portfolio investments require a fair value determination. Security transactions are accounted for on a trade date basis. The Operating Company's quarterly valuation procedures are set forth in more detail below: - (1)
- Investments for which market quotations are readily available on an exchange are valued at such market quotations based on the closing price indicated from independent pricing services.
- (2)
- Investments for which indicative prices are obtained from various pricing services and/or brokers or dealers are valued through a multi-step valuation process, as described below, to determine whether the quote(s) obtained is representative of fair value in accordance with GAAP.
- a.
- Bond quotes are obtained through independent pricing services. Internal reviews are performed by the investment professionals of the Investment Adviser to ensure that the quote obtained is representative of fair value in accordance with GAAP and if so, the quote is used. If the Investment Adviser is unable to sufficiently validate the quote(s) internally and if the investment's par value or its fair value exceeds the materiality threshold, the investment is valued similarly to those assets with no readily available quotes (see (3) below); and
- b.
- For investments other than bonds, the
Operating Company looks at the number of quotes readily available and performs the following:
- i.
- Investments for which two or more quotes are received from a pricing service are valued using the mean of the mean of the bid and ask of the quotes obtained;
- ii.
- Investments for which one quote is received from a pricing service are validated internally. The investment professionals of the Investment Adviser analyze the market quotes obtained using an array of valuation methods (further described below) to validate the fair value. If the Investment Adviser is unable to sufficiently validate the quote internally and if the investment's par value or its fair value exceeds the materiality threshold, the investment is valued similarly to those assets with no readily available quotes (see (3) below).
- (3)
- Investments for which quotations are not readily available through exchanges, pricing services, brokers, or dealers are valued through a multi-step valuation process:
- a.
- Each portfolio company or investment is initially valued by the investment professionals of the Investment Adviser responsible for the credit monitoring;
- b.
- Preliminary valuation conclusions will then be documented and discussed with the
Operating Company's senior management;
Table of Contents - c.
- If an investment falls into (3) above for four consecutive quarters and if the investment's par value or its fair value exceeds the materiality threshold, then at least once each fiscal year, the valuation for each portfolio investment for which the
Operating Company does
Table of Contents
For investments in revolving credit facilities and delayed draw commitments, the cost basis of the funded investments purchased is offset by any costs/netbacks received for any unfunded portion on the total balance committed. The fair value is also adjusted for the price appreciation or depreciation on the unfunded portion. As a result, the purchase of commitments not completely funded may result in a negative fair value until it is called and funded. The values assigned to investments are based upon available information and do not necessarily represent amounts which might ultimately be realized, since such amounts depend on future circumstances and cannot be reasonably determined until the individual positions are liquidated. Due to the inherent uncertainty of determining the fair value of investments that do not have a readily available market value, the fair value of the Operating Company's investments may fluctuate from period to period and the fluctuations could be material. GAAP fair value measurement guidance classifies the inputs used in measuring fair value into three levels as follows: Level I—Quoted prices (unadjusted) are available in active markets for identical investments and the Operating Company has the ability to access such quotes as of the reporting date. The type of investments which would generally be included in Level I include active exchange-traded equity securities and exchange-traded derivatives. As required by Accounting Standards Codification Topic 820,Fair Value Measurements and Disclosures ("ASC 820"), the Operating Company, to the extent that it holds such investments, does not adjust the quoted price for these investments, even in situations where the Operating Company holds a large position and a sale could reasonably impact the quoted price. Level II—Pricing inputs are observable for the investments, either directly or indirectly, as of the reporting date, but are not the same as those used in Level I. Level II inputs include the following: - •
- Quoted prices for similar assets or liabilities in active markets;
- •
- Quoted prices for identical or similar assets or liabilities in non-active markets (examples include corporate and municipal bonds, which trade infrequently);
- •
- Pricing models whose inputs are observable for substantially the full term of the asset or liability (examples include most over-the-counter derivatives, including foreign exchange forward contracts); and
- •
- Pricing models whose inputs are derived principally from or corroborated by observable market data through correlation or other means for substantially the full term of the asset or liability.
Level III—Pricing inputs are unobservable for the investment and include situations where there is little, if any, market activity for the investment.
The inputs used to measure fair value may fall into different levels. In all instances when the inputs fall within different levels of the hierarchy, the level within which the fair value measurement is categorized is based on the lowest level of input that is significant to the fair value measurement in its entirety. As such, a Level III fair value measurement may include inputs that are both observable
Table of Contents
(Levels (Levels I and II) and unobservable (Level III). Gains and losses for such assets categorized within the Level III table below may include changes in fair value that are attributable to both observable inputs (Levels II and III) and unobservable inputs (Level III).
Table of Contents The inputs into the determination of fair value require significant judgment or estimation by management and consideration of factors specific to each investment. A review of the fair value hierarchy classifications is conducted on a quarterly basis. Changes in the observability of valuation inputs may result in the transfer of certain investments within the fair value hierarchy from period to period. Reclassifications impacting the fair value hierarchy are reported as transfers in/out of the respective leveling categories as of the beginning of the quarter in which the reclassifications occur. The following table summarizes the levels in the fair value hierarchy that the Operating Company's portfolio investments fall into as of December 31, 2013:2014: | (in thousands)
| | Total | | Level I | | Level II | | Level III | | | Total | | Level I | | Level II | | Level III | |
|---|
First lien | | $ | 553,549 | | $ | — | | $ | 525,138 | | $ | 28,411 | | | $ | 677,901 | | $ | — | | $ | 508,721 | | $ | 169,180 | | Second lien | | 468,945 | | — | | 413,407 | | 55,538 | | | 604,158 | | — | | 469,752 | | 134,406 | | Subordinated | | 26,863 | | — | | 21,692 | | 5,171 | | | 61,987 | | — | | 26,517 | | 35,470 | | Equity and other | | 66,294 | | 1,694 | | — | | 64,600 | | | 80,625 | | — | | — | | 80,625 | | | | | | | | | | | | | | | | | | | | | | | | | | | | | | | | | | | | | | Total investments | | $ | 1,115,651 | | $ | 1,694 | | $ | 960,237 | | $ | 153,720 | | | $ | 1,424,671 | | $ | — | | $ | 1,004,990 | | $ | 419,681 | | | | | | | | | | | | | | | | | | | | | | | | | | | | | | | | | | | | | | | | | | | | | | | | | | | | | | | | | | | | | | | | | | |
NMFC and AIV Holdings are holding companies with no direct operations of their own, and their sole asset is their ownership in the Operating Company. NMFC's and AIV Holdings' investments in the Operating Company are carried at fair value and represent the pro-rata interest in the net assets of the Operating Company as of the applicable reporting date. NMFC and AIV Holdings value their ownership interest on a quarterly basis, or more frequently if required under the 1940 Act. The Operating Company generally uses the following framework when determining the fair value of investments where there are little, if any, market activity or observable pricing inputs. The Company typically determines the fair value of its performing debt investments utilizing an income approach. Additional consideration is given using a market based approach, as well as reviewing the overall underlying portfolio company's performance and associated financial risks. The following outlines additional details on the approaches considered: Company Performance, Financial Review, and Analysis: Prior to investment, as part of its due diligence process, the Operating Company evaluates the overall performance and financial stability of the portfolio company. Post investment, the Operating Company analyzes each portfolio company's current operating performance and relevant financial trends versus prior year and budgeted results, including, but not limited to, factors affecting its revenue and earnings before interest, taxes, depreciation, and amortization ("EBITDA") growth, margin trends, liquidity position, covenant compliance and changes to its capital structure. The Operating Company also attempts to identify and subsequently track any developments at the portfolio company, within its customer or vendor base or within the industry or the macroeconomic environment, generally, that may alter any material element of its original investment thesis. This analysis is specific to each portfolio company. The Operating Company leverages the knowledge gained from its original due diligence process, augmented by this subsequent monitoring, to continually refine its outlook for each of its portfolio companies and ultimately form the valuation of its investment in each portfolio company. When an external event such as a purchase transaction, public offering or subsequent sale occurs, the Operating Company will consider the pricing indicated by the external event to corroborate the private valuation. Market Based Approach: The Operating Company typically estimatesmay estimate the total enterprise value of each portfolio company by utilizing market value cash flow (EBITDA) multiples of publicly traded comparable companies. The Operating Company considers numerous factors when selecting the appropriate companies whose trading multiples are used to value its portfolio companies. These factors include, but are not limited to, the type of organization, similarity to the business being valued, relevant risk factors, as well as size, profitability and growth expectations. The Operating Company generally appliesmay apply an average of various relevant comparable company EBITDA multiples to the portfolio
Table of Contents
company's latest twelve month ("LTM") EBITDA or projected EBITDA to calculate portfolio company enterprise value. Significant increases or decreases in the multiple will result in an increase or decrease in enterprise value, resulting in an increase or decrease in the fair value estimate of the investment. In applying the market based approach as of December 31, 2013,2014, the Operating Company used the relevant EBITDA multiple ranges set forth in the table below to determine the enterprise value of investments in sixtwelve of its portfolio companies.
Table of Contents The Operating Company believes this was a reasonable range in light of current comparable company trading levels and the specific companies involved. Income Based Approach: The Operating Company also typically usesmay use a discounted cash flow analysis to estimate the fair value of the investment. Projected cash flows represent the relevant security's contractual interest, fee and principal payments plus the assumption of full principal recovery at the investment's expected maturity date. These cash flows are discounted at a rate established utilizing a yield calibration approach, which incorporates changes in the credit quality (as measured by relevant statistics) of the portfolio company, as compared to changes in the yield associated with comparable credit quality market indices, between the date of origination and the valuation date. Significant increases or decreases in the discount rate would result in a decrease or increase in the fair value measurement. In applying the income based approach as of December 31, 2013,2014, the Operating Company used the discount ranges set forth in the table below to value investments in eightseventeen of its portfolio companies. | | | | | | | | | | | | | | | | | |
| |
| |
| |
| | Range | |
|---|
(in thousands)
Type | | Fair Value | | Approach | | Unobservable Input | | Low | | High | | Weighted
Average | |
|---|
First lien | | $ | 169,180 | | Market approach | | EBITDA multiple | | | 6.5x | | | 12.0x | | | 8.6x | | | | | | | Income approach | | Discount rate | | | 8.2 | % | | 16.5 | % | | 12.0 | % | Second lien | | | 134,406 | | Market approach | | EBITDA multiple | | | 5.5x | | | 15.5x | | | 10.6x | | | | | | | Income approach | | Discount rate | | | 11.0 | % | | 16.0 | % | | 12.7 | % | | | | | | Other | | N/A(1) | | | N/A | (1) | | N/A | (1) | | N/A | (1) | Subordinated | | | 35,470 | | Market approach | | EBITDA multiple | | | 8.0x | | | 12.0x | | | 10.0x | | | | | | | Income approach | | Discount rate | | | 10.7 | % | | 17.7 | % | | 14.7 | % | Equity and other | | | 80,625 | | Market approach | | EBITDA multiple | | | 7.0x | | | 12.0x | | | 8.1x | | | | | | | Income approach | | Discount rate | | | 8.0 | % | | 15.0 | % | | 12.9 | % | | | | | | Other | | N/A(1) | | | N/A | (1) | | N/A | (1) | | N/A | (1) | | | | | | Black Scholes analysis | | Expected life in years | | | 11.3 | | | 11.3 | | | 11.3 | | | | | | | | | Volatility | | | 31.6 | % | | 31.6 | % | | 31.6 | % | | | | | | | | Discount rate | | | 2.3 | % | | 2.3 | % | | 2.3 | % | | | | | | | | | | | | | | | | | | | | | | $ | 419,681 | | | | | | | | | | | | | | | | | | | | | | | | | | | | | | | | | | | | | | | | | | | | | | | | | | | | | | | | | | | | | | | | | | | | | | | |
| | | | | | | | | | | | | | | | | |
| |
| |
| |
| | Range | |
|---|
Type | | Fair Value | | Approach | | Unobservable Input | | Low | | High | | Weighted
Average | |
|---|
First lien | | $ | 28,411 | | Market approach | | EBITDA multiple | | | 7.0 | x | | 10.0 | x | | 8.5 | x | | | | | | Income approach | | Discount rate | | | 9.2 | % | | 10.2 | % | | 9.7 | % | Second lien | | | 55,538 | | Market approach | | EBITDA multiple | | | 5.0 | x | | 7.5 | x | | 6.2 | x | | | | | | Income approach | | Discount rate | | | 10.1 | % | | 11.7 | % | | 11.1 | % | Subordinated | | | 5,171 | | Market approach | | EBITDA multiple | | | 7.0 | x | | 9.0 | x | | 8.0 | x | | | | | | Income approach | | Discount rate | | | 13.0 | % | | 15.0 | % | | 14.0 | % | Equity and other | | | 64,600 | | Market approach | | EBITDA multiple | | | 1.3 | x | | 7.5 | x | | 4.7 | x | | | | | | Income approach | | Discount rate | | | 8.0 | % | | 20.0 | % | | 13.6 | % | | | | | | | | | | | | | | | | | | | | | | | | | | | | | | | | | | | | | | | | $ | 153,720 | | Black Scholes analysis | | Expected life in years | | | 2.0 | | | 4.0 | | | 2.6 | | | | | | | | | | | | | | | | | | | | | | | | | | | | | | | | | | | | | | | | | | | | | | | | | | | | | | | | | | | | | | | | | | | | | | | | | | | | | | | | | | | Volatility | | | 21.0 | % | | 36.6 | % | | 27.9 | % | | | | | | | | Discount rate | | | 0.3 | % | | 3.0 | % | | 0.8 | % |
- (1)
- Fair value was determined based on transaction pricing or recent acquisition or sale as the best measure of fair value with no material changes in operations of the related portfolio company since the transaction date.
NMFC Senior Loan Program I, LLC On June 10, 2014, NMFC Senior Loan Program I, LLC ("SLP I") was formed as a Delaware limited liability company. SLP I is a portfolio company held by the Company. SLP I is structured as a private investment fund, in which all of the investors are qualified purchasers, as such term is defined under the 1940 Act. Transfer of interests in SLP I is subject to restrictions, and as a result, such interests are not readily marketable. SLP I operates under a limited liability company agreement (the "Agreement") and will continue in existence until June 10, 2019, subject to earlier termination pursuant to certain terms of the Agreement. The term may be extended for up to one year pursuant to certain terms of the Agreement. SLP I has a three year re-investment period. SLP I is capitalized with $93.0 million of capital commitments, $275.0 million of debt from a revolving credit facility and is managed by the Company. The Company's capital commitment is $23.0 million, representing less than 25.0% ownership, with third party investors representing the remaining capital commitment. As of December 31, 2014, SLP I had total investments with an
Table of Contents aggregate fair value of approximately $369.2 million, debt outstanding of $266.9 million and capital that had been called and funded of $93.0 million. The Company's investment in SLP I is disclosed on the December 31, 2014 Consolidated Schedule of Investments. The Company, as an investment adviser registered under the Advisers Act, acts as the collateral manager to SLP I and is entitled to receive a management fee for its investment management services provided to SLP I. As a result, SLP I is classified as an affiliate of the Company. For the year ended December 31, 2014, the Company earned approximately $0.5 million in management fees related to SLP I which is included in other income. As of December 31, 2014, approximately $0.5 million of management fees related to SLP I was included in receivable from affiliates. For the year ended December 31, 2014, the Company earned approximately $1.1 million of dividend income related to SLP I, which is included in dividend income. As of December 31, 2014, approximately $0.8 million of dividend income related to SLP I was included in interest and dividend receivable. SLP I invests in senior secured loans issued by companies within the Company's core industry verticals. These investments are typically broadly syndicated first lien loans. Collateralized agreements or repurchase financings The Company follows the guidance in Accounting Standards Codification Topic 860, Transfers and Servicing—Secured Borrowing and Collateral, (``ASC 860") when accounting for transactions involving the purchases of securities under collateralized agreements to resell (resale agreements). These transactions are treated as collateralized financing transactions and are recorded at their contracted resale or repurchase amounts, as specified in the respective agreements. Interest on collateralized agreements is accrued and recognized over the life of the transaction and included in interest income. As of December 31, 2014, the Company held one collateralized agreement to resell with a carrying value of $30.0 million, collateralized by a security with a fair value of $30.0 million and guaranteed by the counterparty. The counterparty has the option to repurchase the collateral from the Company at the par value of the collateralized agreement within a year. The collateralized agreement earns interest at a rate of 15.0% per annum as of December 31, 2014. The Predecessor Operating Company did not have any collateralized agreements as of the year ended December 31, 2013. Revenue Recognition The Operating Company's revenue recognition policies are as follows: Sales and paydowns of investments:Realized gains and losses on investments are determined on the specific identification method. Interest income:Interest income, including amortization of premium and discount using the effective interest method, is recorded on the accrual basis and periodically assessed for collectability. Interest income also includes interest earned from cash on hand. Upon the prepayment of a loan or debt security, any prepayment penalties are recorded as part of interest income. The Operating Company has loans in the portfolio that contain a payment-in-kind ("PIK") provision. PIK represents interest that is accrued and recorded as interest income at the contractual rates, if deemed collectible, added to the loan principal on the respective capitalization dates, and generally due at maturity. Non-accrual income:Loans are placed on non-accrual status when principal or interest payments are past due 30 days or more and when there is reasonable doubt that principal or interest will be collected. Accrued cash and un-capitalized PIK interest is generally reversed when a loan is placed on non-accrual status. Previously capitalized PIK interest is not reversed when an
Table of Contents
investment is placed on non-accrual status. Interest payments received on non-accrual loans may be recognized as income or applied to principal depending upon management's judgment of the ultimate outcome. Non-accrual
Table of Contents loans are restored to accrual status when past due principal and interest is paid and, in management's judgment, are likely to remain current. Dividend income:Dividend income is recorded on the record date for private portfolio companies or on the ex-dividend date for publicly traded portfolio companies. Other income:Other income represents delayed compensation, consent or amendment fees, revolver fees, structuring fees, management fees from a non-controlled/affiliated investment and other miscellaneous fees received.received and are typically non-recurring in nature. Delayed compensation is income earned from counterparties on trades that do not settle within a set number of business days after trade date. Other income may also include fees from bridge loans. The Operating Company may from time to time enter into bridge financing commitments, an obligation to provide interim financing to a counterparty until permanent credit can be obtained. These commitments are short-term in nature and may expire unfunded. A fee is received by the Operating Company for providing such commitments. Structuring fees are recognized as income when earned, usually when paid at the closing of the investment and are non-refundable.
Prior to the Restructuring, NMFC's and AIV Holdings' revenue recognition policies arewere as follows: Revenue, expenses, and capital gains (losses):At each quarterly valuation date, the Predecessor Operating Company's investment income, expenses, net realized gains (losses), and net increase (decrease) in unrealized appreciation (depreciation) arewere allocated to NMFC and AIV Holdings based on theirits pro-rata interest in the net assets of the Predecessor Operating Company. This iswas recorded on NMFC's and AIV Holdings' Statements of Operations. Realized gains and losses are recorded upon sales of NMFC's and AIV Holdings' investments in the Predecessor Operating Company. Net change in unrealized appreciation (depreciation) of investment in New Mountain Finance Holdings, L.L.C. is the difference between the net asset value per share and the closing price per share for shares issued as part of the dividend reinvestment plan on the dividend payment date. This net change in unrealized appreciation (depreciation) of investment in New Mountain Finance Holdings, L.L.C. includes the unrealized appreciation (depreciation) from the IPO. NMFC used the proceeds from its IPO and Concurrent Private Placement to purchase units in the Predecessor Operating Company at $13.75 per unit (its IPO price per share). At the IPO date, $13.75 per unit represented a discount to the actual net asset value per unit of the Predecessor Operating Company. As a result, NMFC experienced immediate unrealized appreciation on its investment. Concurrently, AIV Holdings experienced immediate unrealized depreciation on its investment in the Operating Company equal to the difference between NMFC's IPO price of $13.75 per unit and the actual net asset value per unit. All expenses, including those of NMFC, and AIV Holdings, arewere paid and recorded by the Predecessor Operating Company. Expenses arewere allocated to NMFC and AIV Holdings based on pro-rata ownership interest. In addition, the Predecessor Operating Company paid all of the offering costs related to the IPO and subsequent offerings. NMFC and AIV Holdings have recorded theirits portion of the offering costs as a direct reduction to net assets and the cost of their investment in the Predecessor Operating Company. With respect to the expenses incident to any registration of shares of NMFC's common stock issued in exchange for AIV Holdings' units of the Operating Company, AIV Holdings is directly responsible for the expenses of any demand registration (including underwriters' discounts or commissions) and their pro-rata share of any "piggyback" registration expenses.
Monitoring of Portfolio Investments The Operating Company monitors the performance and financial trends of its portfolio companies on at least a quarterly basis. The Operating Company attempts to identify any developments within the portfolio company, the industry or the macroeconomic environment that may alter any material element of its original investment strategy.
Table of Contents
The Operating Company uses an investment rating system to characterize and monitor the credit profile and expected level of returns on each investment in the portfolio. The Operating Company uses a four-level numeric rating scale as follows: - •
- Investment Rating 1—Investment is performing materially above expectations;
Table of Contents
- •
- Investment Rating 2—Investment is performing materially in-line with expectations. All new loans are rated 2 at initial purchase;
- •
- Investment Rating 3—Investment is performing materially below expectations and risk has increased materially since the original investment; and
- •
- Investment Rating 4—Investment is performing substantially below expectations and risks have increased substantially since the original investment. Payments may be delinquent. There is meaningful possibility that the
Operating Company will not recoup its original cost basis in the investment and may realize a substantial loss upon exit.
As of December 31, 2013,2014, all investments in the Operating Company's portfolio had an Investment Rating of 1 or 2 with the exception of twofive portfolio company names; onefour portfolio companies with an Investment Rating of 3 and the othertwo portfolio companies with an Investment Rating of 4. During the quarter ended December 31, 2013, the Operating Company sold its first lien position in ATI Acquisition Company, resulting in a realized loss of $4.3 million. Prior to the sale, this investment had a cost basis of $4.3 million, a zero fair value and total unearned interest income of $0.6 million for the year ended. As of December 31, 2013,2014, a portion of the OperatingCompany's investment in one portfolio company had an Investment Rating of 3 and a portion had an Investment Rating of 4. As of December 31, 2014, the Company's two super priority first lien positions in ATI Acquisition Company and related equity positions in Ancora Acquisition LLC had an Investment Rating of 4 due to the underlying business encountering significant regulatory constraints which have led to the portfolio company's underperformance. As of December 31, 2013,2014, the Operating Company's two super priority first lien positions in ATI Acquisition Company remained on non-accrual status due to the inability of the portfolio company to service its interest payments for the year then ended and uncertainty about its ability to pay such amounts in the future. During the third quarter of 2013, the Operating Company received preferred shares and warrants in Ancora Acquisition LLC, in relation to the two super priority first lien positions in ATI Acquisition Company. As of December 31, 2013,2014, the Operating Company's investment in ATI Acquisition Company and Ancora Acquisition LLC had an aggregate cost basis of $1.6 million, an aggregate fair value of $0.4 million and total unearned interest income of $0.3 million for the year then ended. Unrealized gains (losses) include a fee that the Operating Company would receive upon maturity of the two super priority first lien debt investments. During the third quarter of 2014, the Company placed a portion of its first lien position in UniTek Global Services, Inc. ("UniTek") on non-accrual status in anticipation of a voluntary petition for a "Pre-Packaged" Chapter 11 Bankruptcy in the U.S. Bankruptcy Court for the District of Delaware which was filed on November 3, 2014. As of December 31, 2014, the portion of the UniTek first lien position placed on non-accrual status represented an aggregate cost basis of $12.1 million, an aggregate fair value of $8.8 million and total unearned interest income of $1.0 million for the year then ended. Portfolio and Investment Activity The fair value of the Company's investments was approximately $1,424.7 million in 71 portfolio companies at December 31, 2014. At December 31, 2013 and December 31, 2012, the Company's only investment was its investment in the Predecessor Operating Company. The fair value of the Predecessor Operating Company's investments was approximately $1,115.7 million in 59 portfolio companies at December 31, 2013 and $989.8 million in 63 portfolio companies at December 31, 2012 and $703.5 million in 55 portfolio companies at December 31, 2011.2012.
Table of Contents The following table shows the Company's portfolio and investment activity for the year ended December 31, 2014 and the Predecessor Operating Company's portfolio and investment activity for the years ended December 31, 2013 December 31, 2012 and December 31, 2011:2012: | | | | | | | | | | |
| | Years ended December 31, | |
|---|
(in millions)
| | 2014(1) | | 2013 | | 2012 | |
|---|
New investments in 43, 34 and 45 portfolio companies, respectively | | $ | 720.9 | | $ | 529.3 | | $ | 673.2 | | Debt repayments in existing portfolio companies | | | 267.5 | | | 395.4 | | | 299.2 | | Sales of securities in 14, 12 and 22 portfolio companies, respectively | | | 117.0 | | | 31.2 | | | 124.7 | | Change in unrealized appreciation on 20, 45 and 48 portfolio companies, respectively | | | 21.2 | | | 27.9 | | | 27.0 | | Change in unrealized depreciation on 60, 29 and 30 portfolio companies, respectively | | | (63.9 | ) | | (19.9 | ) | | (17.1 | ) |
| | | | | | | | | | |
| | Years ended December 31, | |
|---|
(in millions)
| | 2013 | | 2012 | | 2011 | |
|---|
New investments in 34, 45 and 37 portfolio companies, respectively | | $ | 529.3 | | $ | 673.2 | | $ | 493.3 | | Debt repayments in existing portfolio companies | | | 395.4 | | | 299.2 | | | 146.4 | | Sales of securities in 12, 22 and 17 portfolio companies, respectively | | | 31.2 | | | 124.7 | | | 85.6 | | Change in unrealized appreciation on 45, 48 and 17 portfolio companies, respectively | | | 27.9 | | | 27.0 | | | 6.1 | | Change in unrealized depreciation on 29, 30 and 48 portfolio companies, respectively | | | (19.9 | ) | | (17.1 | ) | | (29.2 | ) |
Table- (1)
- For the year ended December 31, 2014, amounts represent the investment activity of
Contents
the Predecessor Operating Company through and including May 7, 2014 and the investment activity of the Company from May 8, 2014 through December 31, 2014. At December 31, 2013 and2014, the Company's weighted average Yield to Maturity at Cost was approximately 10.7%. At December 31, 2012,2013, the Predecessor Operating Company's weighted average Yield to Maturity at Cost and weighted average Yield to Maturity was approximately 10.6%11.0% and 10.1%10.6%, respectively. The Yield to Maturity calculation used in prior years for the Predecessor Operating Company assumed that all investments not on non-accrual were purchased at fair value on December 31, 2013 and held until their respective maturities with no prepayments or losses and exited at par at maturity. Recent Accounting Standards Updates In June 2013, the Financial Accounting Standards Board ("FASB") issued Accounting Standards Update No. 2013-08,Financial Services—Investment Companies (Topic 946)—Topic 946—Amendments to the Scope, Measurement and Disclosure Requirements ("ASU 2013-08"), which contains new guidance on assessing whether an entity is an investment company, requiring non-controlling ownership interests in investment companies to be measured at fair value and requiring certain additional disclosures. ASU 2013-08 is effective for interim and annual periods beginning after December 15, 2013. The Company is an investment company that is applying the specialized guidance in Topic 946 as of January 1, 2014. In May 2014, the FASB issued Accounting Standards Update No. 2014-09,Revenue from Contracts with Customers Topic 606—Summary and Amendments that Create Revenue from Contracts with Customers and Other Assets and Deferred Costs ('ASU 2014-09"). ASU 2014-09 establishes a comprehensive and converged standard on revenue recognition to enable financial statement users to better understand and consistently analyze an entity's revenue across industries, transactions and geographies. The core principle of the new guidance is that an entity should recognize revenue to depict the transfer of promised goods or services to customers in an amount that reflects the consideration to which the entity expects to be entitled in exchange for those goods or services. To achieve that core principle, an entity should apply the following steps: (1) identify the contract(s) with a customer, (2) identify the performance obligations in the contract, (3) determine the transaction price, (4) allocate the transaction price to the performance obligations in the contract, and (5) recognize revenue when (or as) the entity satisfies a performance obligation. The new guidance also specifies the accounting for certain costs to obtain or fulfill a contract with a customer. The new guidance requires improved disclosures to help users of financial statements better understand the nature, amount, timing, and uncertainty of revenue that is recognized. Qualitative and quantitative information is
Table of Contents required to be disclosed about: (1) contracts with customers, (2) significant judgments and changes in judgments, and (3) assets recognized from costs to obtain or fulfill a contract. The new guidance will apply to all entities. The guidance is effective for interim and annual reporting periods in fiscal years beginning after December 15, 2016. Early application is not permitted. The Company is in the process of evaluating the impact that this guidance will have on its consolidated financial statements and disclosures. In June 2014, the FASB issued Accounting Standards Update No. 2014-11,Transfers and Servicing Topic 860—Repurchase-to-Maturity Transactions, Repurchase Financings, and Disclosures ("ASU 2014-11"). ASU 2014-11 changes the accounting for repurchase- and resale-to-maturity agreements by requiring that such agreements be recognized as financing arrangements, and requires that a transfer of a financial asset and a repurchase agreement entered into contemporaneously be accounted for separately. ASU 2014-11 requires additional disclosures about certain transferred financial assets accounted for as sales and certain securities financing transactions. The accounting changes and additional disclosures about certain transferred financial assets accounted for as sales are effective for the first interim and annual reporting periods beginning after December 15, 2014. The additional disclosures for securities financing transactions are required for annual reporting periods beginning after December 15, 2014 and for interim reporting periods beginning after March 15, 2015. The Company is in the process of evaluating the impact that this guidance will have on its consolidated financial statements and disclosures. In August 2014, the FASB issued Accounting Standards Update No. 2014-15,Presentation of Financial Statements—Going Concern Subtopic 205-40—Disclosure of Uncertainties about an Entity's Ability to Continue as a Going Concern ("ASU 2014-15"). ASU 2014-15 will explicitly require management to assess an entity's ability to continue as a going concern, and to provide related footnote disclosure in certain circumstances. The new standard will be effective for all entities in the first annual period ending after December 15, 2016. Earlier adoption is permitted. The adoption of ASU 2013-082014-15 is not expected to have a material impact on the Companies'Company's consolidated financial statements.statements and disclosures. Results of Operations Since NMFC and AIV Holdings are holding companies with no direct operations of their own, and their only business and sole asset are their ownership of common membership units of the Operating Company, NMFC's and AIV Holdings' results of operations are based on the Operating Company's results of operations.
Under GAAP, NMFC's IPO did not step-up the cost basis of the Predecessor Operating Company's existing investments to fair market value at the IPO date. Since the total value of the Predecessor Operating Company's investments at the time of the IPO was greater than the investments' cost basis, a larger amount of amortization of purchase or original issue discount, and different amounts in realized gain and unrealized appreciation, may be recognized under GAAP in each period than if the step-up had occurred. This will remain until such predecessor investments are sold, repaid or mature in the future. The Operating Company tracks the transferred (or fair market) value of each of its investmentthe Predecessor Operating Company's investments as of the time of the IPO and, for purposes of the incentive fee calculation, adjusts income as if each investment was purchased at the date of the IPO (or stepped up to fair market value). The respective "Adjusted Net Investment Income" (defined as net investment income adjusted to reflect income as if the cost basis of investments held at the IPO date had stepped-up to fair market value as of the IPO date) is used in calculating both the incentive fee and dividend payments. SeeItem 8.—Financial Statements and Supplementary Data—Note 5, Agreements for additional details.
Table of Contents The following table for the Company for the year ended December 31, 2014 is adjusted to reflect the step-up to fair market value and the allocation of the incentive fees related to hypothetical capital gains out of the adjusted post-incentive fee net investment income. | | | | | | | | | | | | | | (in thousands) | | Year Ended
December 31,
2014 | | Stepped-up
Cost Basis
Adjustments | | Incentive Fee
Adjustments(1) | | Adjusted
Year Ended
December 31,
2014 | |
|---|
Investment income | | | | | | | | | | | | | | Interest income | | $ | 85,123 | | $ | (193 | ) | $ | — | | $ | 84,930 | | Dividend income | | | 2,309 | | | — | | | — | | | 2,309 | | Other income | | | 4,491 | | | — | | | — | | | 4,491 | | Investment income allocated from NMF Holdings | | | | | | | | | | | | | | Interest income | | | 40,515 | | | — | | | — | | | 40,515 | | Dividend income | | | 2,368 | | | — | | | — | | | 2,368 | | Other income | | | 795 | | | — | | | — | | | 795 | | | | | | | | | | | | | | | | | Total investment income(2) | | | 135,601 | | | (193 | ) | | — | | | 135,408 | | | | | | | | | | | | | | | | | Total expenses pre-incentive fee(3) | | | 43,766 | | | — | | | — | | | 43,766 | | | | | | | | | | | | | | | | | Pre-Incentive Fee Net Investment Income | | | 91,835 | | | (193 | ) | | — | | | 91,642 | | | | | | | | | | | | | | | | | Incentive fee | | | 11,769 | | | — | | | 6,549 | | | 18,318 | | | | | | | | | | | | | | | | | Post-Incentive Fee Net Investment Income | | | 80,066 | | | (193 | ) | | (6,549 | ) | | 73,324 | | | | | | | | | | | | | | | | | Net realized gains (losses) on investments | | | 357 | | | (456 | ) | | — | | | (99 | ) | Net realized gains on investments allocated from NMF Holdings | | | 8,568 | | | — | | | — | | | 8,568 | | Net change in unrealized (depreciation) appreciation of investments(4) | | | (43,863 | ) | | 649 | | | — | | | (43,214 | ) | Net change in unrealized appreciation (depreciation) of investments allocated from NMF Holdings | | | 940 | | | — | | | — | | | 940 | | Provision for taxes | | | (493 | ) | | — | | | — | | | (493 | ) | Capital gains incentive fees | | | — | | | — | | | 6,549 | | | 6,549 | | | | | | | | | | | | | | | | | Net increase in net assets resulting from operations | | $ | 45,575 | | | | | | | | $ | 45,575 | | | | | | | | | | | | | | | | | | | | | | | | | | | | | | | | | | | | | | | | | | | | | | |
- (1)
- For the year ended December 31, 2014, the Company incurred total incentive fees of $11.8 million, of which $(6.5) million related to the reduction of the capital gains incentive fee accrual on a hypothetical liquidation basis.
- (2)
- Includes income from non-controlled/non-affiliated investments and non-controlled/affiliated investments.
- (3)
- Includes expense waivers and reimbursements of $1.1 million and management fee waivers of $0.7 million.
- (4)
- Includes net change in unrealized (depreciation) appreciation of investments from non-controlled/non-affiliated investments and non-controlled/affiliated investments.
Table of Contents For the year ended December 31, 2014, the Company had a $0.2 million adjustment to interest income for amortization, a decrease of $0.5 million to net realized gains and an increase of $0.7 million to net change in unrealized depreciation to adjust for the stepped-up cost basis of the transferred investments as discussed above. For the year ended December 31, 2014, total adjusted investment income of $135.4 million consisted of approximately $114.5 million in cash interest from investments, approximately $4.6 million in PIK interest from investments, approximately $3.9 million in prepayment fees, net amortization of purchase premiums and discounts and origination fees of approximately $2.5 million, approximately $4.6 million in dividend income and approximately $5.3 million in other income. The Company's Adjusted Net Investment Income was $73.3 million for the year ended December 31, 2014. In accordance with GAAP, for the year ended December 31, 2014, the Company decreased its hypothetical capital gains incentive fee accrual by $6.5 million based upon the cumulative net Adjusted Realized Capital Gains and Adjusted Realized Capital Losses and the cumulative net Adjusted Unrealized Capital Appreciation and Adjusted Unrealized Capital Depreciation on investments held at the end of each period. Actual amounts paid to the Investment Adviser are consistent with the Investment Management Agreement and are based only on actual Adjusted Realized Capital Gains computed net of all Adjusted Realized Capital Losses and Adjusted Unrealized Capital Depreciation on a cumulative basis from inception through the end of each calendar year as if the entire portfolio was sold at fair value. As of December 31, 2014, no actual capital gains incentive fee was owed under the Investment Management Agreement by the Company, as cumulative net Adjusted Realized Gains did not exceed cumulative Adjusted Unrealized Depreciation. At December 31, 2013, the Company's only investment was its investment in the Predecessor Operating Company. The following table for the Predecessor Operating Company for the year ended December 31, 2013 is adjusted to reflect the step-up to fair market value and the allocation of the incentive fees related to hypothetical capital gains out of the adjusted post-incentive fee net investment income. | (in thousands)
| | Year ended
December 31,
2013 | | Stepped-up
Cost Basis
Adjustments | | Incentive Fee
Adjustments(1) | | Adjusted
year ended
December 31,
2013 | | | Year Ended
December 31,
2013 | | Stepped-up
Cost Basis
Adjustments | | Incentive Fee
Adjustments(1) | | Adjusted
Year Ended
December 31,
2013 | |
|---|
Investment income | | | | | | | | | | | | | | | | | | | Interest income | | $ | 107,027 | | $ | (896 | ) | $ | — | | $ | 106,131 | | | $ | 107,027 | | $ | (896 | ) | $ | — | | $ | 106,131 | | Dividend income | | 5,049 | | — | | — | | 5,049 | | | 5,049 | | — | | — | | 5,049 | | Other income | | 2,836 | | — | | — | | 2,836 | | | 2,836 | | — | | — | | 2,836 | | | | | | | | | | | | | | | | | | | | | | | | | | | | | | | | | | | | | | Total investment income | | 114,912 | | (896 | ) | | — | | 114,016 | | | 114,912 | | (896 | ) | | — | | 114,016 | | | | | | | | | | | | | | | | | | | | | | | | | | | | | | | | | | | | | | Total expenses pre-incentive fee(2) | | 31,504 | | — | | — | | 31,504 | | | 31,504 | | — | | — | | 31,504 | | | | | | | | | | | | | | | | | | | | | | | | | | | | | | | | | | | | | | Pre-Incentive Fee Net Investment Income | | 83,408 | | (896 | ) | | — | | 82,512 | | | 83,408 | | (896 | ) | | — | | 82,512 | | | | | | | | | | | | | | | | | | | | | | | | | | | | | | | | | | | | | | Incentive fee | | 19,731 | | — | | (3,229 | ) | | 16,502 | | | 19,731 | | — | | (3,229 | ) | | 16,502 | | | | | | | | | | | | | | | | | | | | | | | | | | | | | | | | | | | | | | Post-Incentive Fee Net Investment Income | | 63,677 | | (896 | ) | | 3,229 | | 66,010 | | | 63,677 | | (896 | ) | | 3,229 | | 66,010 | | | | | | | | | | | | | | | | | | | | | | | | | | | | | | | | | | | | | | Net realized gains (losses) on investments | | 7,253 | | (3,158 | ) | | — | | 4,095 | | | 7,253 | | (3,158 | ) | | — | | 4,095 | | Net change in unrealized appreciation of investments | | 7,994 | | 4,054 | | — | | 12,048 | | | Net change in unrealized appreciation (depreciation) of investments | | | 7,994 | | 4,054 | | — | | 12,048 | | Capital gains incentive fees | | — | | — | | (3,229 | ) | | (3,229 | ) | | — | | — | | (3,229 | ) | | (3,229 | ) | | | | | | | | | | | | | | | | | | | | | | | | | | | | | | | | | | | Net increase in members' capital resulting from operations | | $ | 78,924 | | | | | | $ | 78,924 | | | $ | 78,924 | | | | | | $ | 78,924 | | | | | | | | | | | | | | | | | | | | | | | | | | | | | | | | | | | | | | | | | | | | | | | | | | | | | | | | | | | | | | |
- (1)
- For the year ended December 31, 2013, the Predecessor Operating Company incurred total incentive fees of $19.7 million, of which $3.2 million related to capital gains incentive fees on a hypothetical liquidation basis.
- (2)
- Includes expense waivers and reimbursements of $3.2 million.
Table of Contents For the year ended December 31, 2013, the Predecessor Operating Company had a $0.9 million adjustment to interest income for amortization, a decrease of $3.2 million to net realized gains and an increase of $4.1 million to net change in unrealized appreciation to adjust for the stepped-up cost basis of the transferred investments as discussed above. For the year ended December 31, 2013, total adjusted investment income of $114.0 million consisted of approximately $94.5 million in cash interest from investments, approximately $3.4 million in PIK interest from investments, approximately $5.8 million in prepayment fees, net amortization of purchase premiums and discounts and origination fees of approximately $2.5 million, approximately $5.0 million in dividend income and approximately $2.8 million in other income. The Predecessor Operating Company's Adjusted Net Investment Income was $66.0 million for the year ended December 31, 2013. In accordance with GAAP, for the year ended December 31, 2013, the Predecessor Operating Company accrued $3.2 million of hypothetical capital gains incentive fee based upon the cumulative net Adjusted Realized Capital Gains and Adjusted Realized Capital Losses and the cumulative net Adjusted Unrealized Capital Appreciation and Adjusted Unrealized Capital Depreciation on investments held at the end of each period. Actual amounts paid to the Investment Adviser are consistent with the Investment Management Agreement and are based only on actual Adjusted Realized Capital Gains computed net of all Adjusted Realized Capital Losses and Adjusted Unrealized Capital Depreciation on a cumulative basis from inception through the end of each calendar year as if the entire portfolio was sold at fair value. As of December 31, 2013, approximately $1.1 million of capital gains incentive fees was owed under the Investment Management Agreement by the Predecessor Operating Company, as cumulative net Adjusted Realized
Table of Contents
Gains exceeded cumulative Adjusted Unrealized Depreciation. As ofDepreciation and was paid during the year ended December 31, 2013, no payments have been made relating to2014. At December 31, 2012, the capital gains incentive fee. Company's only investment was its investment in the Predecessor Operating Company. The following table for the Predecessor Operating Company for the year ended December 31, 2012 is adjusted to reflect the step-up to fair market value and the allocation of the
Table of Contents incentive fees related to hypothetical capital gains out of the adjusted post-incentive fee net investment income. | (in thousands)
| | Year ended
December 31,
2012 | | Stepped-up
Cost Basis
Adjustments | | Incentive Fee
Adjustments(1) | | Adjusted
year ended
December 31,
2012 | | | Year Ended
December 31,
2012 | | Stepped-up
Cost Basis
Adjustments | | Incentive Fee
Adjustments(1) | | Adjusted
Year Ended
December 31,
2012 | |
|---|
Investment income | | | | | | | | | | | | | | | | | | | Interest income | | $ | 83,646 | | $ | (3,476 | ) | $ | — | | $ | 80,170 | | | $ | 83,646 | | $ | (3,476 | ) | $ | — | | $ | 80,170 | | Dividend income | | 812 | | — | | — | | 812 | | | 812 | | — | | — | | 812 | | Other income | | 1,328 | | — | | — | | 1,328 | | | 1,328 | | — | | — | | 1,328 | | | | | | | | | | | | | | | | | | | | | | | | | | | | | | | | | | | | | | Total investment income | | 85,786 | | (3,476 | ) | | — | | 82,310 | | | 85,786 | | (3,476 | ) | | — | | 82,310 | | | | | | | | | | | | | | | | | | | | | | | | | | | | | | | | | | | | | | Total expenses pre-incentive fee(2) | | 24,625 | | — | | — | | 24,625 | | | 24,625 | | — | | — | | 24,625 | | | | | | | | | | | | | | | | | | | | | | | | | | | | | | | | | | | | | | Pre-Incentive Fee Net Investment Income | | 61,161 | | (3,476 | ) | | — | | 57,685 | | | 61,161 | | (3,476 | ) | | — | | 57,685 | | | | | | | | | | | | | | | | | | | | | | | | | | | | | | | | | | | | | | Incentive fee | | 15,944 | | — | | (4,407 | ) | | 11,537 | | | 15,944 | | — | | (4,407 | ) | | 11,537 | | | | | | | | | | | | | | | | | | | | | | | | | | | | | | | | | | | | | | Post-Incentive Fee Net Investment Income | | 45,217 | | (3,476 | ) | | 4,407 | | 46,148 | | | 45,217 | | (3,476 | ) | | 4,407 | | 46,148 | | | | | | | | | | | | | | | | | | | | | | | | | | | | | | | | | | | | | | Net realized gains (losses) on investments | | 18,851 | | (6,958 | ) | | — | | 11,893 | | | 18,851 | | (6,958 | ) | | — | | 11,893 | | Net change in unrealized appreciation of investments | | 9,928 | | 10,434 | | — | | 20,362 | | | Net change in unrealized appreciation (depreciation) of investments | | | 9,928 | | 10,434 | | — | | 20,362 | | Capital gains incentive fees | | — | | — | | (4,407 | ) | | (4,407 | ) | | — | | — | | (4,407 | ) | | (4,407 | ) | | | | | | | | | | | | | | | | | | | | | | | | | | | | | | | | | | | Net increase in members' capital resulting from operations | | $ | 73,996 | | | | | | $ | 73,996 | | | $ | 73,996 | | | | | | $ | 73,996 | | | | | | | | | | | | | | | | | | | | | | | | | | | | | | | | | | | | | | | | | | | | | | | | | | | | | | | | | | | | | | |
- (1)
- For the year ended December 31, 2012, the Predecessor Operating Company incurred total incentive fees of $15.9 million, of which $4.4 million related to capital gains incentive fees on a hypothetical liquidation basis.
- (2)
- Includes expense waivers and reimbursements of $2.5 million.
For the year ended December 31, 2012, the Predecessor Operating Company had a $3.5 million adjustment to interest income for amortization, a decrease of $6.9 million to net realized gains and an increase of $10.4 million to net change in unrealized appreciation to adjust for the stepped-up cost basis of the transferred investments as discussed above. For the year ended December 31, 2012, total adjusted interest income of $80.2 million consisted of approximately $71.9 million in cash interest from investments, approximately $2.2 million in PIK interest from investments, approximately $3.6 million in prepayment fees and net amortization of purchase premiums and discounts and origination fees of approximately $2.5 million. The Predecessor Operating Company's Adjusted Net Investment Income was $46.1 million for the year ended December 31, 2012.
Table of Contents The following table for the Operating Company for the period May 19, 2011 (effective date of the Investment Management Agreement) to December 31, 2011 is adjusted to reflect the step-up to fair market value.
| | | | | | | | | | | (in thousands)
| | Period from
May 19, 2011
to December 31,
2011 | | Stepped-up
Cost Basis
Adjustments | | Adjusted
period from
May 19, 2011
to December 31,
2011 | |
|---|
Investment income | | | | | | | | | | | Interest income | | $ | 38,836 | | $ | (2,019 | ) | $ | 36,817 | | Other income | | | 670 | | | — | | | 670 | | | | | | | | | | | | | | | | | | | | | | | Total investment income | | | 39,506 | | | (2,019 | ) | | 37,487 | | | | | | | | | | | | | | | | | | | | | | | Total expenses pre-incentive fee(1) | | | 11,863 | | | — | | | 11,863 | | | | | | | | | | | | | | | | | | | | | | | Pre-Incentive Fee Net Investment Income | | | 27,643 | | | (2,019 | ) | | 25,624 | | | | | | | | | | | | | | | | | | | | | | | Incentive fee(2) | | | 3,522 | | | — | | | 3,522 | | | | | | | | | | | | | | | | | | | | | | | Post-Incentive Fee Net Investment Income | | | 24,121 | | | (2,019 | ) | | 22,102 | | | | | | | | | | | | | | | | | | | | | | | Net realized gains (losses) on investments | | | 3,298 | | | (2,422 | ) | | 876 | | Net change in unrealized (depreciation) appreciation of investments | | | (15,538 | ) | | 4,441 | | | (11,097 | ) | | | | | | | | | | | | | | | | | | | | | | | Net increase in members' capital resulting from operations | | $ | 11,881 | | | | | $ | 11,881 | | | | | | | | | | | | | | | | | | | | | | | | | | | | | | | | | | | | | | | | | | | | | |
(1)Includes expense waivers and reimbursements of $2.2 million.
(2)For the year ended December 31, 2011, the Operating Company had no incentive fees related to capital gains incentive fees on a hypothetical liquidation basis.
For the period May 19, 2011 (effective date of the Investment Management Agreement) to December 31, 2011, the Operating Company had a $2.0 million adjustment to interest income for amortization, a decrease of $2.4 million to realized gains and an increase of $4.4 million to unrealized depreciation to adjust for the stepped-up cost basis of the transferred investments as discussed above. The Operating Company's Adjusted Net Investment Income was $22.1 million for the period May 19, 2011 (effective date of the Investment Management Agreement) to December 31, 2011.
Results of Operations for the Company for the Year Ended December 31, 2014 and the Predecessor Operating Company for the Years Ended December 31, 2013 December 31, 2012 and December 31, 20112012 Revenue |
| | Years ended December 31, | | | Years ended December 31, | |
|---|
(in thousands)
| | 2013 | | 2012 | | 2011 | | | 2014 | | 2013 | | 2012 | |
|---|
Interest income | | $ | 107,027 | | $ | 83,646 | | $ | 55,809 | | | $ | 85,123 | | $ | 107,027 | | $ | 83,646 | | Interest income allocated from the Predecessor Operating Company | | | 40,515 | | — | | — | | | | | | | | | | | | | | | Total interest income | | | 125,638 | | 107,027 | | 83,646 | | Dividend income | | 5,049 | | 812 | | — | | |
2,309 | |
5,049 | |
812 | | Dividend income allocated from the Predecessor Operating Company | | | 2,368 | | — | | — | | | | | | | | | | | | | | | Total dividend income | | | 4,677 | | 5,049 | | 812 | | Other income | | 2,836 | | 1,328 | | 714 | | |
4,491 | |
2,836 | |
1,328 | | | | | | | | | | | | Other income allocated from the Predecessor Operating Company | | | 795 | | — | | — | | | | | | | | | | | | | | | Total other income | | | 5,286 | | 2,836 | | 1,328 | | | | | | | | | | | | | | | | | | | | | Total investment income | | $ | 114,912 | | $ | 85,786 | | $ | 56,523 | | | $ | 135,601 | | $ | 114,912 | | $ | 85,786 | | | | | | | | | | | | | | | | | | | | | | | | | | | | | | | | | | | | | | | | | | | | | | | | | | | | | | |
The Company's total investment income increased by approximately $20.7 million for the year ended December 31, 2014 as compared to the Predecessor Operating Company's total investment income for the year ended December 31, 2013. The 18.0% increase in total investment income primarily results from an increase in interest income of approximately $18.6 million from the year ended December 31, 2013 to the year ended December 31, 2014 which is attributable to larger invested balances, driven by the proceeds from the October 2013, April 2014 and October 2014 primary offerings of the Company's common stock and the June 2014 offering of the Company's convertible notes, the Company's use of leverage from its revolving credit facilities to originate new investments and prepayment fees received associated with the early repayments or partial repayments of ten different portfolio companies held by the Predecessor Operating Company as of December 31, 2013. The increase in other income of approximately $2.5 million during the year ended December 31, 2014 as compared to the year ended December 31, 2013, which represents fees that are non-recurring in nature, was primarily attributable to structuring, amendment and consent fees received from twenty different portfolio companies and management fees from a non-controlled affiliated portfolio company. The decrease in dividend income during the year ended December 31, 2014 as compared to the year ended December 31, 2013 was primarily attributable to a large distribution from one of the Predecessor Operating Company's warrant investments in the prior year. The Predecessor Operating Company's total investment income increased by $29.1 million for the year ended December 31, 2013 as compared to the year ended December 31, 2012. The 34.0% increase in investment income results from the increase in interest and other income for the year ended December 31, 2013, which was primarily attributable to larger invested balances, driven by the proceeds
Table of Contents
from the 2012 and 2013 primary offerings of NMFC's common stock, the Predecessor Operating Company's use of leverage for its revolving credit facilities to originate new investments and prepayment fees received associated with the early repayments or partial repayments of 20twenty different portfolio companies held by the Predecessor Operating Company as of December 31, 2012. Additionally, the Predecessor Operating Company's other income, which represents fees that are non-recurring in nature, increased due to commitment fees received from three bridge facilities and
Table of Contents consent, amendment and forbearance fees received associated with 10ten different portfolio companies held by the Predecessor Operating Company as of December 31, 2012. The increase in dividend income for the year ended December 31, 2013 was attributable to distributions received from two portfolio companies, which was recorded as dividend income. The Operating Company's total investment income increased by $29.3 million for the year ended December 31, 2012 as compared to the year ended December 31, 2011. The 51.8% increase in investment income from the year ended 2011 to the year ended 2012 was primarily attributable to larger invested balances, mainly driven by the proceeds from the July 2012 and December 2012 equity offerings, and the Operating Company's use of leverage from its revolving credit facilities to originate new investments. In the year ended December 31, 2012, the Operating Company's other income increased due to commitment fees received from three bridge facilities and fees received associated with amendments of 14 different portfolio companies. Additionally, during the year ended December 31, 2012, the Operating Company received distributions from two portfolio companies, which was recorded as dividend income.
Operating Expenses |
| | Years ended December 31, | | | Years ended December 31, | |
|---|
(in thousands)
| | 2013 | | 2012 | | 2011 | | | 2014 | | 2013 | | 2012 | |
|---|
Management fee | | $ | 14,905 | | $ | 11,109 | | $ | 4,938 | | | $ | 13,593 | | $ | 14,905 | | $ | 11,109 | | Management fee allocated from Predecessor Operating Company | | | 5,983 | | — | | — | | Less: management fee waiver | | | (686 | ) | | — | | — | | | | | | | | | | | | | | | Total Management fee | | | 18,890 | | 14,905 | | 11,109 | | Incentive fee | | 16,502 | | 11,537 | | 3,522 | | |
12,070 | |
16,502 | |
11,537 | | Incentive fee allocated from Predecessor Operating Company | | | 6,248 | | — | | — | | | | | | | | | | | | | | | Total Incentive fee | | | 18,318 | | 16,502 | | 11,537 | | Capital gains incentive fee(1) | | 3,229 | | 4,407 | | — | | |
(8,573 |
) | |
3,229 | |
4,407 | | Interest and other credit facility expenses | | 12,470 | | 10,085 | | 7,086 | | | Capital gains incentive fee allocated from Predecessor Operating Company(1) | | | 2,024 | | — | | — | | | | | | | | | | | | | | | Total Capital gains incentive fee(1) | | | (6,549 | ) | | 3,229 | | 4,407 | | Interest and other financing expenses | | |
13,269 | |
12,470 | |
10,085 | | Interest and other financing expenses allocated from Predecessor Operating Company | | | 4,764 | | — | | — | | | | | | | | | | | | | | | Total Interest and other financing expenses | | | 18,033 | | 12,470 | | 10,085 | | Professional fees | | |
2,390 | |
2,349 | |
2,091 | | Professional fees allocated from Predecessor Operating Company | | | 1,238 | | — | | — | | | | | | | | | | | | | | | Total Professional fees | | | 3,628 | | 2,349 | | 2,091 | | Administrative fees | | 3,429 | | 2,426 | | 1,615 | | |
1,470 | |
3,429 | |
2,426 | | Professional fees | | 2,349 | | 2,091 | | 2,037 | | | Other expenses | | 1,584 | | 1,374 | | 986 | | | | | | | | | | | | | Administrative expenses allocated from Predecessor Operating Company | | | 761 | | — | | — | | | | | | | | | | | | | | | Total Administrative expenses | | | 2,231 | | 3,429 | | 2,426 | | Other general and administrative expenses | | |
1,138 | |
1,584 | |
1,374 | | Other general and administrative expenses allocated from Predecessor Operating Company | | | 555 | | — | | — | | | | | | | | | | | | | | | Total other general and administrative expenses | | | 1,693 | | 1,584 | | 1,374 | | | | | | | | | | | | | | | | | | | | | Total expenses | | 54,468 | | 43,029 | | 20,184 | | | 56,244 | | 54,468 | | 43,029 | | | | | | | | | | | | | | | | | | | | | | | | | | | | | | | Less: expenses waived and reimbursed | | (3,233 | ) | | (2,460 | ) | | (2,186 | ) | | (1,145 | ) | | (3,233 | ) | | (2,460 | ) | | | | | | | | | | | | | | | | | | | | | | | | | | | | | | Net expenses | | $ | 51,235 | | $ | 40,569 | | $ | 17,998 | | | | | | | | | | | | | Net expenses before income taxes | | | 55,099 | | 51,235 | | 40,569 | | Income tax expense | | | 436 | | — | | — | | | | | | | | | | | | | | | Net expenses after income taxes | | | $ | 55,535 | | $ | 51,235 | | $ | 40,569 | | | | | | | | | | | | | | | | | | | | | | | | | | | | | | | | | | | | | | | �� | | | | | |
- (1)
- Capital gains incentive fee accrual assumes a hypothetical liquidation basis.
The Company's total net operating expenses increased by approximately $4.3 million for the year ended December 31, 2014 as compared to the Predecessor Operating Company's year ended December 31, 2013. The Company's management fee increased by approximately $4.0 million, net of a management fee waiver, and incentive fees increased by approximately $1.8 million for the year ended December 31, 2014 as compared to the Predecessor Operating Company's year ended December 31,
Table of Contents 2013. The increase in management fee and incentive fee from the Predecessor Operating Company's year ended December 31, 2013 to the Company's year ended December 31, 2014 was attributable to larger invested balances, driven by the proceeds from the October 2013, April 2014 and October 2014 primary offerings of NMFC's common stock, the June 2014 offering of NMFC's convertible notes and the Company's use of leverage from its revolving credit facilities to originate new investments. The Company's capital gains incentive fee accrual decreased by approximately $9.8 million for the year ended December 31, 2014 as compared to the Predecessor Operating Company's year ended December 31, 2013, which was attributable to lower net Adjusted Realized Capital Gains (Losses) and net Adjusted Unrealized Capital Depreciation of investments during the period due to lower marks on the broader portfolio. As of December 31, 2014, no actual capital gains incentive fee was owed under the Investment Management Agreement by the Company, as cumulative net Adjusted Realized Gains did not exceed cumulative Adjusted Unrealized Depreciation. Interest and other financing expenses increased by approximately $5.6 million during the year ended December 31, 2014, primarily due to the increase of average debt outstanding from $184.1 million to $244.6 million for the Holdings Credit Facility (as defined below) for the year ended December 31, 2013 compared to December 31, 2014. In addition, during the year ended December 31, 2014, the Company issued $115.0 million of convertible notes, closed the NMFC Credit Facility (as defined below) and began to draw on SBA-guaranteed debentures. The Company's total professional fees, total administrative expenses and total other general and administrative expenses marginally increased by approximately $0.2 million for the year ended December 31, 2014 as compared to the Predecessor Operating Company's year ended December 31, 2013. During the year ended December 31, 2014, the Company incurred $10.9 thousand in other expenses that were not subject to the expense cap pursuant to the administration agreement, as amended and restated (the "Administration Agreement"), with the Administrator, and further restricted by the Company. For the year ended December 31, 2014, approximately $1.4 million of indirect administrative expenses were included in administrative expenses, of which $0.8 million were waived by the Administrator. The Company's expenses waived and reimbursed decreased by approximately $2.1 million for the year ended December 31, 2014 as compared to the Predecessor Operating Company's year ended December 31, 2013 due to the expiration of the expense cap on March 31, 2014 and the decrease of waived indirect administrative expenses by the Administrator during the year ended December 31, 2014. The Predecessor Operating Company's total net operating expenses increased by approximately $10.7 million for the year ended December 31, 2013 as compared to the year ended December 31, 2012. The Predecessor Operating Company's management fees increased by approximately $3.8 million and incentive fees increased by approximately $5.0 million for the year ended December 31, 2013 as compared to the year ended December 31, 2012. The increase in management and incentive fees from the year ended December 31, 2012 to the year ended December 31, 2013 was attributable to larger invested balances, driven by the proceeds from the 2012 and 2013 primary offerings of NMFC's common stock, the Predecessor Operating Company's use of leverage from its revolving credit facilities to originate new investments and the receipt of a dividend distribution from one of the Predecessor Operating Company's warrant investments. The Predecessor Operating Company's capital gains incentive fees decreased approximately $1.2 million for the year ended December 31, 2013 as compared to the year ended December 31, 2012, which was attributable to lower net Adjusted Realized Capital Gains (Losses) and Adjusted Unrealized Capital Appreciation (Depreciation) of investments during the period. As of December 31, 2013, approximately $1.1 million of capital gains incentive fees was owed
Table of Contents
under the Investment Management Agreement by the Predecessor Operating Company, as cumulative net Adjusted Realized Gains exceeded cumulative Adjusted Unrealized Depreciation. As ofDepreciation and was paid during the year ended December 31, 2013, no payments have been made relating to the capital gains incentive fee.2014.
Table of Contents Interest and other credit facility expenses increased by approximately $2.4 million during the year ended December 31, 2013, primarily due to the increase of average debt outstanding from $133.6 million to $184.1 million for the Holdings Credit Facility and from $181.4 million to $214.3 million for the SLF Credit Facility for the year ended December 31, 2012 compared to December 31, 2013. For the year ended December 31, 2013, the Predecessor Operating Company incurred $0.1 million in other expenses that were not subject to the expense cap pursuant to an administration agreement, as amended and restated (the "Administration Agreement"), with the Administrator, and further restricted by the Operating Company. The Operating Company's total net operating expenses increased by $22.6 million for the year ended December 31, 2012 as compared to the year ended December 31, 2011. The Operating Company's management fees increased by $6.2 million and incentive fees increased by $8.0 million, respectively, for the year ended December 31, 2012 as compared to the year ended December 31, 2011. The increase in management and incentive fees from the year ended December 31, 2011 to the year ended December 31, 2012 was attributable to larger invested balances, driven by the proceeds from the July 2012 and December 2012 primary offerings of NMFC's common stock and the Operating Company's use of leverage from its revolving credit facilities to originate new investments. As a result of the net increase in Adjusted Realized Capital Gains (Losses) and Adjusted Unrealized Capital Appreciation (Depreciation), a capital gains incentive fees accrual of $4.4 million was booked for the year ended December 31, 2012. No capital gains incentive fees were booked for the year ended December 31, 2011. As a result of the IPO on May 19, 2011, the Operating Company pays management fees and incentive fees under its Investment Management Agreement, which provides a different basis for the calculation of these fees as compared to amounts previously paid prior to the completion of the IPO. As such, management and incentive fees were calculated in accordance with this agreement for a full year in 2012 as compared to a partial year in 2011. Prior to the IPO, an affiliate of the Predecessor Entities paid a majority of the management and incentive fees.
Interest and other credit facility expenses increased by $3.0 million during the year ended December 31, 2012, primarily due to the increase of average debt outstanding from $61.6 million to $133.6 million for the Holdings Credit Facility and from $133.8 million to $181.4 million for the SLF Credit Facility for the year ended December 31, 2011 compared to December 31, 2012. For the year ended December 31, 2012, the Operating Company incurred less thanapproximately $0.1 million in other expenses that were not subject to the expense cap pursuant to the Administration Agreement with the Administrator and further restricted by the Predecessor Operating Company. No expenses were incurred by the Operating Company outside the expense cap for the year ended December 31, 2011.
Net Realized Gains and Net Change in Unrealized Appreciation (Depreciation) |
| | Years ended December 31, | | | Years ended December 31, | |
|---|
(in thousands)
| | 2013 | | 2012 | | 2011 | | | 2014 | | 2013 | | 2012 | |
|---|
Net realized gains on investments | | $ | 7,253 | | $ | 18,851 | | $ | 16,252 | | | $ | 357 | | $ | 7,253 | | $ | 18,851 | | Net change in unrealized appreciation (depreciation) of investments | | 7,994 | | 9,928 | | (23,100 | ) | | | | | | | | | | | | Net realized gains on investments allocated from Predecessor Operating Company | | | 8,568 | | — | | — | | | | | | | | | | | | | | | | | | | | | Total net realized gains and net change in unrealized appreciation (depreciation) of investments | | $ | 15,247 | | $ | 28,779 | | $ | (6,848 | ) | | | | | | | | | | | | Total realized gains on investments | | | 8,925 | | 7,253 | | 18,851 | | Net change in unrealized (depreciation) appreciation of investments | | |
(43,863 |
) | |
7,994 | |
9,928 | | Net change in unrealized appreciation (depreciation) of investments allocated from Predecessor Operating Company | | | 940 | | — | | — | | | | | | | | | | | | | | | Total change in unrealized (depreciation) appreciation of investments | | | (42,923 | ) | | 7,994 | | 9,928 | | Provision for taxes | | |
(493 |
) | |
— | |
— | | | | | | | | | | | | | | | Total net realized gains and net change in unrealized (depreciation) appreciation of investments | | | $ | (34,491 | ) | $ | 15,247 | | $ | 28,779 | | | | | | | | | | | | | | | | | | | | | | | | | | | | | | | | | | | | | | | | | | | | |
The Company's net realized and unrealized losses resulted in a net loss of approximately $34.5 million for the year ended December 31, 2014 compared to the Predecessor Operating Company's net realized and unrealized gains or losses resultedresulting in a net gain of approximately $15.2 million for the year ended December 31, 2013 compared to a net gain of $28.8 million for the year ended December 31, 2012, and a net loss of $6.8 million for the same period in 2011.2013. We look at
Table of Contents
net realized and unrealized gains or losses together as movement in unrealized appreciation or depreciation can be the result of realizations. The net loss for the year ended December 31, 2014 was primarily driven by the overall decrease in the market prices of the Company's investments during the period and the partial write-down related to two portfolio companies. These losses were partially offset by a $5.6 million gain from the sale of the Company's warrant investments in one portfolio company and sales or repayments of investments with fair values in excess of December 31, 2013 valuations resulting in net realized gains being greater than the reversal of the cumulative net unrealized gains for those investments. The provision for income taxes was attributable to one warrant investment that is held as of December 31, 2014 in one of the Company's corporate subsidiaries. The net gain for the year ended December 31, 2013 was primarily driven by sales or repayment of investments with fair values in excess of December 31, 2012 valuations, resulting in net realized gains being greater than the reversal of the cumulative net unrealized gains for those investments. Additionally, during the year ended December 31, 2013, a distribution from a warrant investment resulted in a realized gain of approximately $1.1 million, the modification of terms on one debt investment that was accounted for as an extinguishment resulted in a realized gain of $1.7 million and the sale of the first lien position in ATI Acquisition Company resulted in a realized loss of $4.3 million. The total net gain for the year ended December 31, 2012 was primarily related to the overall increase in the market and the quality of the Predecessor Operating Company's portfolio, directly impacting the prices of the Predecessor Operating Company's portfolio. The appreciation of the Predecessor Operating Company's portfolio and the sale or repayment of investments with fair values
Table of Contents in excess of December 31, 2011 valuations, resulted in net realized gains being greater than the reversal of the cumulative net unrealized gains for those investments. The total net loss for the year ended December 31, 2011 was primarily related to the overall market decline, directly impacting the prices of the Operating Company's portfolio. Liquidity and Capital Resources The primary use of existing funds and any funds raised in the future is expected to be for the Operating Company's repayment of indebtedness, the Operating Company's investments in portfolio companies, cash distributions to the Operating Company's unit holdersstockholders or for other general corporate purposes. Since NMFC's IPO, and through December 31, 2013,2014, NMFC raised approximately $233.4$374.6 million in net proceeds from additional offerings of common stock and issued shares valued at approximately $249.6$288.4 million on behalf of AIV Holdings for exchanged units. NMFC acquired from the Predecessor Operating Company units of the Predecessor Operating Company equal to the number of shares of NMFC's common stock sold in the additional offerings. On March 25, 2013,February 3, 2014, NMFC completed a public offering of 2,000,000 shares of its common stock and an underwritten secondary public offering of 4,000,0002,325,000 shares of its common stock on behalf of a selling stockholder, AIV Holdings, at a public offering price of $14.30$14.70 per share. In connection with the underwritten secondary public offering, the underwriters purchased an additional 900,000346,938 shares of NMFC's common stock from AIV Holdings with the exercise of the overallotment option to purchase up to an additional 900,000346,938 shares of common stock. The Operating Company received net proceeds of $28.4 million in connection with the sale of 2,000,000 shares by NMFC of its common stock. NMFC did not receive any proceeds from the sale of shares of NMFC's common stock by AIV Holdings. The Predecessor Operating Company and NMFC bore only their allocable portion of offering expenses related to the public offering of 2,000,000 shares, and did not bear any expenses in connection with the secondary publicthis offering. The offering of the 4,900,000 shares of NMFC's common stock on behalf of AIV Holdings, whichexpenses were borne by the selling stockholder, AIV Holdings. As of February 3, 2014, AIV Holdings no longer owns any units of the Predecessor Operating Company and NMFC owns 100.0% of the outstanding units of the Predecessor Operating Company, which is now a wholly-owned subsidiary of NMFC. On June 21, 2013,April 15, 2014, NMFC completed a public offering of 2,000,0003,500,000 shares of its common stock and an underwritten secondary public offering of 4,000,000 shares of its common stock on behalf of a selling stockholder, AIV Holdings, at a public offering price of $14.55$14.30 per share, which resulted in net proceeds of $51.0 million, or $14.57 per share. NMFC's Investment Adviser agreed to pay the underwriting discounts and commissions in connection with this offering and an additional supplemental payment to the underwriters of $0.9 million, or $0.27 per share, which reflects the difference between the public offering price and the proceeds per share received by NMFC. In connection with the underwritten secondary public offering, the underwriters purchased an additional 750,000525,000 shares of NMFC's common stock from AIV Holdings with the exercise of the overallotment option to purchase up to an additional 900,000 shares of common stock. The Operating Company received net proceeds of $28.6 million in connection with the sale of 2,000,000 shares by NMFC of its common stock. NMFC did not receive any proceeds from the sale of525,000 shares of NMFC's common stock, by AIV Holdings. The Operating Companyresulting in additional net proceeds of $7.6 million. NMFC's Investment Adviser agreed to pay the underwriting discounts and NMFC bore only their allocable portioncommissions in connection with this exercise of offering expenses relatedthe overallotment option and an additional supplemental payment to the underwriters of $0.1 million, or $0.27 per share, which reflects the difference between the public offering of 2,000,000 shares,price and did not bear any expensesthe proceeds per share received by NMFC in connection with the secondary public offeringthis exercise of the 4,750,000 shares of NMFC's common stock on behalf of AIV Holdings, which were borne by AIV Holdings.
Table of Contentsoverallotment option.
On October 17, 2013, NMFC28, 2014, the Company completed a public offering of 3,000,0005,000,000 shares of its common stock and an underwritten secondary public offering of 3,000,000 shares of its common stock on behalf of a selling stockholder, AIV Holdings, at a public offering price of $14.34$14.53 per share.share, which resulted in net proceeds of $71.8 million. In connection with the underwritten secondary public offering, the underwriters purchased an additional 900,000750,000 shares of NMFC'sthe Company's common stock from AIV Holdings with the exercise of the overallotment option to purchase up to an additional 900,000750,000 shares of the Company's common stock. The Operating Company receivedstock, which resulted in additional net proceeds of $43.0 million in connection with the sale of 3,000,000 shares by NMFC of its common stock. NMFC did not receive any proceeds from the sale of shares of NMFC's common stock by AIV Holdings. The Operating Company and NMFC bore only their allocable portion of offering expenses related to the public offering of 3,000,000 shares, and did not bear any expenses in connection with the secondary public offering of the 3,900,000 shares of NMFC's common stock on behalf of AIV Holdings, which were borne by AIV Holdings.$10.8 million. The Operating Company's liquidity is generated and generally available through advances from the revolving credit facilities, from cash flows from operations, and, we expect, through periodic follow-on equity offerings of NMFC.offerings. In addition, we may from time to time enter into additional debt facilities, increase the size of existing facilities or issue additional debt securities, including unsecured debt and/or debt securities convertible into common stock. Any such incurrence or issuance would be subject to prevailing market conditions, our liquidity requirements, contractual and regulatory restrictions and other factors. In
Table of Contents accordance with the 1940 Act, with certain limited exceptions, we are only allowed to borrow amounts such that our asset coverage, calculated pursuant to the 1940 Act, is at least 200.0% after such borrowing. At December 31, 2014, the Company had cash and cash equivalents of approximately $23.4 million and at December 31, 2013 and December 31, 2012, and December 31, 2011, the Predecessor Operating Company had cash and cash equivalents of approximately $15.0 million $12.8 million and $15.3$12.8 million, respectively. Cash used in operating activities for the Company during the year ended December 31, 2014 was approximately $(289.6) million, which includes the activity allocated from NMF Holdings, and cash used in operating activities for the Predecessor Operating Company for the years ended December 31, 2013 December 31, 2012 and December 31, 20112012 was approximately $(40.4) million and $(212.6) million, and $(316.3) million, respectively. Refer to the Predecessor Operating Company's Consolidated Statements of Cash Flows for the period January 1, 2014 to May 7, 2014 included in an exhibit attached hereto. We expect that all current liquidity needs by the Operating Company will be met with cash flows from operations and other activities. Credit FacilitiesBorrowings
Holdings Credit Facility—On December 18, 2014 the Company entered into the Second Amended and Restated Loan and Security Agreement (the "Holdings Credit Facility"), among the Company, as the Collateral Manager, NMF Holdings as the Borrower, Wells Fargo Securities, LLC as the Administrative Agent and Wells Fargo Bank, National Association, as the Lender and Collateral Custodian, which is structured as a revolving credit facility and matures on December 18, 2019. Immediately prior to amending the Holdings Credit Facility, NMF SPV merged with and into NMF Holdings. The Holdings Credit Facility effectively amended and restated the Predecessor Holdings Credit Facility (as defined below), merged with the SLF Credit Facility (as defined below), and combined the amount of borrowings previously available. The maximum amount of revolving borrowings available under the Holdings Credit Facility is $495.0 million, which is the aggregate of the $280.0 million previously available under the Predecessor Holdings Credit Facility (as defined below) and the $215.0 million previously available under the SLF Credit Facility (as defined below). Under the Holdings Credit Facility, NMF Holdings is still permitted to borrow up to 25.0%, 45.0% or 70.0% of the purchase price of pledged assets, subject to approval by the Wells Fargo Securities, LLC. The Holdings Credit Facility is non-recourse to the Company and is collateralized by all of the investments of NMF Holdings on an investment by investment basis. All fees associated with the origination or upsizing of the Holdings Credit Facility are capitalized on the Company's Consolidated Statement of Assets and Liabilities and charged against income as other financing expenses over the life of the Holdings Credit Facility. The Holdings Credit Facility contains certain customary affirmative and negative covenants and events of default. In addition, the Holdings Credit Facility requires the Company to maintain a minimum asset coverage ratio. The covenants are generally not tied to mark to market fluctuations in the prices of NMF Holdings investments, but rather to the performance of the underlying portfolio companies. The Holdings Credit Facility bears interest at a rate of the LIBOR plus 2.00% per annum for Broadly Syndicated Loans (as defined in the Loan and Security Agreement) and LIBOR plus 2.75% per annum for all other investments. The Holdings Credit Facility also charges a non-usage fee, based on the unused facility amount multiplied by the Non-Usage Fee Rate (as defined in the Loan and Security Agreement). Prior to December 18, 2014, the Loan and Security Agreement, as amended and restated, dated May 19, 2011 (the "Holdings"Predecessor Holdings Credit Facility") among the Operating CompanyNMF Holdings as the Borrower and Collateral Administrator, Wells Fargo Securities, L.L.C.LLC as the Administrative Agent, and Wells Fargo Bank, National Association, as the Collateral Custodian, iswas structured as a revolving credit facility and matureswould mature on October 27, 2016, as amended on May 8, 2012.2016.
Table of Contents The maximum amount of revolving borrowings available under the Predecessor Holdings Credit Facility iswas $280.0 million, as amended on October 28, 2013. As ofmillion. Until December 31, 2013, the Operating Company18, 2014, NMF Holdings was permitted to borrow up to 45.0% or 25.0% of the purchase price of pledged first lien or non-first lien debt securities, and up to 70.0% and 45.0% of the purchase price of specified first lien debt securities and specified non-first lien debt securities, respectively, subject to approval by Wells Fargo Bank, National Association. The Predecessor Holdings Credit Facility iswas amended and restated on May 6, 2014 and as a result, it was non-recourse to the Company and was collateralized by all of the investments of the Operating CompanyNMF Holdings on an investment by investment basis. All fees associated with the origination or upsizing of the Predecessor Holdings Credit Facility arewere capitalized on the Operating Company's Consolidated Statement of Assets Liabilities, and Members' CapitalLiabilities and charged against income as other credit facilityfinancing expenses over the life of the Predecessor Holdings Credit Facility. The Predecessor Holdings Credit Facility containscontained certain customary affirmative and negative covenants and events of default, including the occurrence of a change in control. In addition, the Predecessor Holdings Credit Facility requiresrequired the Operating Company to maintain a minimum asset coverage ratio. However, the covenants arewere generally not tied to mark to market fluctuations in the prices of the Operating Company'sNMF Holdings' investments, but rather to the performance of the underlying portfolio companies.
Table of Contents
The Predecessor Holdings Credit Facility bearsbore interest at a rate of the London Interbank Offered Rate ("LIBOR")LIBOR plus 2.75% per annum as amended on May 8, 2012, and chargescharged a non-usage fee, based on the unused facility amount multiplied by the Non-Usage Fee Rate (as defined in the credit agreement)Loan and Security Agreement). The following table summarizes the interest expense and non-usage fees incurred, bytogether, on the Operating Company onHoldings Credit Facility and the Predecessor Holdings Credit Facility for the years ended December 31, 2013,2014, December 31, 20122013 and December 31, 2011.2012. |
| | Years ended December 31, | | | Years ended December 31, | |
|---|
(in millions)
| | 2013 | | 2012 | | 2011 | | | 2014 | | 2013 | | 2012 | |
|---|
Interest expense | | $ | 5.5 | | $ | 4.2 | | $ | 2.0 | | | $ | 7.1 | | $ | 5.5 | | $ | 4.2 | | Non-usage fee | | $ | 0.4 | | $ | 0.3 | | $ | 0.6 | | | $ | 0.2 | | $ | 0.4 | | $ | 0.3 | | Amortization of financing costs | | | $ | 0.9 | | $ | 0.7 | | $ | 0.4 | | Weighted average interest rate | | 2.9 | % | | 3.1 | % | | 3.2 | % | | 2.9 | % | | 2.9 | % | | 3.1 | % | Effective interest rate | | | 3.4 | % | | 3.6 | % | | 3.6 | % | Average debt outstanding | | $ | 184.1 | | $ | 133.6 | | $ | 61.6 | | | $ | 244.6 | | $ | 184.1 | | $ | 133.6 | |
The outstanding balance of Holdings Credit Facility as of December 31, 2013, December 31, 2012 and December 31, 20112014 was $221.8 million, $206.9$468.1 million and $129.0 million, respectively. Asthe outstanding balance of the Predecessor Holdings Credit Facility as of December 31, 2013 and December 31, 2012 was $221.8 million and December 31, 2011,$206.9 million, respectively and NMF Holdings was in compliance with the Operating Company was not aware of any instances of non-compliance related toapplicable covenants in the Holdings Credit Facility or Predecessor Holdings Credit Facility on such dates. SLF Credit Facility—NMF SLF's Loan and Security Agreement, as amended and restated, dated October 27, 2010 (the "SLF Credit Facility") among NMF SLF as the Borrower, the Operating CompanyNMF Holdings as the Collateral Administrator, Wells Fargo Securities, L.L.C.LLC as the Administrative Agent, and Wells Fargo Bank, National Association, as the Collateral Custodian, iswas structured as a revolving credit facility and matureswould mature on October 27, 2016, as amended on May 8, 2012.2016. The maximum amount of revolving borrowings available under the SLF Credit Facility iswas $215.0 million, as amended on December 18, 2012.million. The loan isSLF Credit Facility was non-recourse to the Operating Company and secured by all assets owned by the borrowerof NMF SLF on an investment by investment basis. All fees associated with the origination or upsizing of the SLF Credit Facility arewere capitalized on the Company's Consolidated Statement of Assets Liabilities, and Members' CapitalLiabilities and charged against income as other credit facilityfinancing expenses over the life of the SLF Credit Facility. The SLF Credit Facility containscontained certain customary affirmative and negative covenants and events of default, including the occurrence of a change in control. The covenants arewere generally not tied to mark to market fluctuations in the prices of the Operating Company'sNMF SLF's investments, but rather to the performance of the underlying portfolio companies. Due to an amendment to the SLF Credit Facility on October 27, 2011, NMF SLF is no longer was not
Table of Contents restricted from the purchase or sale of loans with an affiliate. Therefore, specified first lien loans cancould be moved as collateral between the Holdings Credit Facility and the SLF Credit Facility. The SLF Credit Facility merged with the Holdings Credit Facility on December 18, 2014. As ofUntil December 31, 2013,18, 2014, the SLF Credit Facility permitspermitted borrowings of up to 70.0% of the purchase price of pledged first lien debt securities and up to 25.0% of the purchase price of specified second lien loans, of which, up to 25.0% of the aggregate outstanding loan balance of all pledged debt securities in the SLF Credit Facility iswas allowed to be derived from second lien loans, subject to approval by Wells Fargo Bank, National Association, as amended on March 11, 2013.Association. The SLF Credit Facility bearsbore interest at a rate of LIBOR plus 2.00% per annum for first lien loans and LIBOR plus 2.75% per annum for second lien loans, respectively, as amended on March 11, 2013. A non-usage fee iswas paid, based on the unused facility amount multiplied by the Non-Usage Fee Rate (as defined in the credit agreement)Loan and Security Agreement).
Table of Contents
The following table summarizes the interest expense and non-usage fees incurred by the Operating Company on the SLF Credit Facility for the period January 1, 2014 to December 17, 2014 (date of SLF Credit Facility merger with and into the Holdings Credit Facility) and for the years ended December 31, 2013 December 31, 2012 and December 31, 2011.2012. |
| | Years ended December 31, | | | January 1,
2014 to
December 17,
2014 (date of
merger) | | Years ended
December 31, | |
|---|
(in millions)
| | 2013 | | 2012 | | 2011 | | | 2013 | | 2012 | |
|---|
Interest expense | | $ | 4.9 | | $ | 4.2 | | $ | 3.4 | | | $ | 4.5 | | $ | 4.9 | | $ | 4.2 | | Non-usage fee | | $ | — | (1) | $ | — | (1) | $ | 0.1 | | | $ | — | (1) | $ | — | (1) | $ | — | (1) | Amortization of financing costs | | | $ | 0.8 | | $ | 0.9 | | $ | 0.7 | | Weighted average interest rate | | 2.3 | % | | 2.3 | % | | 2.5 | % | | 2.2 | % | | 2.3 | % | | 2.3 | % | Effective interest rate | | | 2.6 | % | | 2.7 | % | | 2.8 | % | Average debt outstanding | | $ | 214.3 | | $ | 181.4 | | $ | 133.8 | | | $ | 209.3 | | $ | 214.3 | | $ | 181.4 | |
- (1)
- For the
yearyears ended December 31, 2014, December 31, 2013 and December 31, 2012, the total non-usage fee was less than $50 thousand.
The SLF Credit Facility merged with the Holdings Credit Facility on December 18, 2014. The outstanding balance as of December 31, 2013 and December 31, 2012 and December 31, 2011 was $214.7 million and $214.3 million, respectively, and $165.9 million, respectively. As of December 31, 2013, December 31, 2012 and December 31, 2011, NMF SLF was not aware of any instances of non-compliance related toin compliance with the applicable covenants in the SLF Credit Facility on such dates. NMFC Credit Facility—The Senior Secured Revolving Credit Agreement, as amended, dated June 4, 2014 (together with the related guarantee and security agreement, the "NMFC Credit Facility"), among the Company as the Borrower and Goldman Sachs Bank USA as the Administrative Agent and Collateral Agent, and Goldman Sachs Bank USA and Morgan Stanley, N.A. as Lenders, is structured as a senior secured revolving credit facility and matures on June 4, 2019. The NMFC Credit Facility is guaranteed by certain domestic subsidiaries of the Company and proceeds from the NMFC Credit Facility may be used for general corporate purposes, including the funding of portfolio investments. The maximum amount of revolving borrowings available under the NMFC Credit Facility is $80.0 million, as amended on December 29, 2014. The Company is permitted to borrow at various advance rates depending on the type of portfolio investment as outlined in the Senior Secured Revolving Credit Agreement. All fees associated with the origination of the NMFC Credit Facility are capitalized on the Company's Consolidated Statement of Assets and Liabilities and charged against income as other financing expenses over the life of the NMFC Credit Facility. The NMFC Credit Facility contains certain customary affirmative and negative covenants and events of default, including certain financial covenants related to asset coverage and liquidity and other maintenance covenants.
Table of Contents The NMFC Credit Facility will generally bear interest at a rate of LIBOR plus 2.50% per annum or the prime rate plus 1.50% per annum, and charges a commitment fee, based on the unused facility amount multiplied by 0.375% (as defined in the Senior Secured Revolving Credit Agreement). The following table summarizes the interest expense and non-usage fees incurred on the NMFC Credit Facility for the period June 4, 2014 (commencement of the NMFC Credit Facility) to December 31, 2014 and for the years ended December 31, 2013 and December 31, 2012. | | | | | | | | | | |
| |
| | Years ended December 31, | |
|---|
| | June 4, 2014
(commencement of
facility) to
December 31, 2014 | |
|---|
(in millions)
| | 2013(1) | | 2012(1) | |
|---|
Interest expense | | $ | 0.2 | | $ | — | | $ | — | | Non-usage fee | | $ | 0.1 | | $ | — | | $ | — | | Amortization of financing costs | | $ | 0.1 | | $ | — | | $ | — | | Weighted average interest rate | | | 2.7 | % | | — | % | | — | % | Effective interest rate | | | 3.4 | % | | — | % | | — | % | Average debt outstanding | | $ | 11.2 | | $ | — | | $ | — | |
- (1)
- Not applicable, as the NMFC Credit Facility commenced on June 4, 2014.
As of December 31, 2014, the outstanding balance on the NMFC Credit Facility was $50.0 million and NMFC was in compliance with the applicable covenants in the NMFC Credit Facility on such dates. Convertible Notes—On June 3, 2014, the Company closed a private offering of $115.0 million aggregate principal amount of senior unsecured convertible notes (the "Convertible Notes"), pursuant to an indenture, dated June 3, 2014 (the "Indenture"). The Convertible Notes were issued in a private placement only to qualified institutional buyers pursuant to Rule 144A under the Securities Act of 1933. The Convertible Notes bear interest at an annual rate of 5.0%, payable semi-annually in arrears on June 15 and December 15 of each year, commencing on December 15, 2014. The Convertible Notes will mature on June 15, 2019 unless earlier converted or repurchased at the holder's option. The Convertible Notes will be convertible by the holders into shares of common stock, initially at a conversion rate of 62.7746 shares of the Company's common stock per $1.0 thousand principal amount of Convertible Notes (7,219,083 common shares) corresponding to an initial conversion price per share of approximately $15.93, which represents a premium of 12.5% to the $14.16 per share closing price of the Company's common stock on May 28, 2014. The conversion rate will be subject to adjustment upon certain events, such as stock splits and combinations, mergers, spin-offs, increases in dividends in excess of $0.34 per share per quarter and certain changes in control. Certain of these adjustments, including adjustments for increases in dividends, are subject to a conversion price floor of $14.16 per share. In no event will the total number of shares of common stock issuable upon conversion exceed 70.6214 per $1.0 thousand principal amount of the Convertible Notes. The Company has determined that the embedded conversion option in the Convertible Notes is not required to be separately accounted for as a derivative under GAAP. The Convertible Notes are senior unsecured obligations and rank senior in right of payment to our existing and future indebtedness that is expressly subordinated in right of payment to the Convertible Notes; equal in right of payment to our existing and future unsecured indebtedness that is not so subordinated; effectively junior in right of payment to any of our secured indebtedness (including existing unsecured indebtedness that the Company later secures) to the extent of the value of the assets securing such indebtedness; and structurally junior to all existing and future indebtedness (including trade payables) incurred by our subsidiaries and financing vehicles. The issuance is considered part of the if-converted method for calculation of diluted earnings per share.
Table of Contents The Company may not redeem the Convertible Notes prior to maturity. No sinking fund is provided for the Convertible Notes. In addition, if certain corporate events occur in respect of the Company, holders of the Convertible Notes may require the Company to repurchase for cash all or part of their Convertible Notes at a repurchase price equal to 100.0% of the principal amount of the Convertible Notes to be repurchased, plus accrued and unpaid interest through, but excluding, the repurchase date. The Indenture contains certain covenants, including covenants requiring the Company to provide financial information to the holders of the Convertible Note and the Trustee if the Company ceases to be subject to the reporting requirements of the Exchange Act. These covenants are subject to limitations and exceptions that are described in the Indenture. As of December 31, 2014, the Company was in compliance with the terms of the Indenture. Interest expense and amortization of financing costs incurred on the Convertible Notes for the year ended December 31, 2014 was $3.3 million and $0.4 million, respectively. The effective interest rate for the year ended December 31, 2014 was 5.6%. SBA-guaranteed debentures—On August 1, 2014, SBIC LP received an SBIC license from the SBA. The SBIC license allows SBIC LP to obtain leverage by issuing SBA-guaranteed debentures, subject to the issuance of a capital commitment by the SBA and other customary procedures. SBA-guaranteed debentures are non-recourse, interest only debentures with interest payable semi-annually and have a ten year maturity. The principal amount of SBA-guaranteed debentures is not required to be paid prior to maturity but may be prepaid at any time without penalty. The interest rate of SBA-guaranteed debentures is fixed on a semi-annual basis at a market-driven spread over U.S. Treasury Notes with ten year maturities. The SBA, as a creditor, will have a superior claim to the assets of SBIC LP over the Company's stockholders in the event SBIC LP is liquidated or the SBA exercises remedies upon an event of default. The maximum amount of borrowings available under current SBA regulations is $150.0 million as long as the licensee has at least $75.0 million in regulatory capital, receives a capital commitment from the SBA and has been through an examination by the SBA subsequent to licensing. As of December 31, 2014, SBIC LP had regulatory capital of $42.2 million and SBA-guaranteed debentures outstanding of $37.5 million. The SBA-guaranteed debentures incur upfront fees of 3.43%, which consists of a 1.00% commitment fee and a 2.43% issuance discount, which are amortized over the life of the SBA-guaranteed debentures. As of December 31, 2014, SBIC LP's SBA-guaranteed debentures are set to pool in March 2015 and until pooling bear interest at an interim floating rate of LIBOR plus 0.30%. Interest expense and amortization of financing costs incurred on the SBA-guaranteed debentures for the year ended December 31, 2014 was $34 thousand and $12 thousand, respectively. The SBIC program is designed to stimulate the flow of private investor capital into eligible small businesses, as defined by the SBA. Under SBA regulations, SBIC LP is subject to regulatory requirements, including making investments in SBA-eligible businesses, investing at least 25.0% of its investment capital in eligible smaller businesses, as defined under the 1958 Act, placing certain limitations on the financing terms of investments, regulating the types of financing, prohibiting investments in small businesses with certain characteristics or in certain industries and requiring capitalization thresholds that limit distributions to the Company. SBIC LP is subject to an annual periodic examination by an SBA examiner to determine SBIC LP's compliance with the relevant SBA regulations and an annual financial audit of its financial statements that are prepared on a basis of accounting other than GAAP (such as ASC 820) by an independent auditor. As of December 31, 2014, SBIC LP was in compliance with SBA regulatory requirements.
Table of Contents Off-Balance Sheet Arrangements The Operating Company may become a party to financial instruments with off-balance sheet risk in the normal course of business to meet the financial needs of its portfolio companies. These instruments may include commitments to extend credit and involve, to varying degrees, elements of liquidity and credit risk in excess of the amount recognized in the balance sheet. As of December 31, 20132014, the Company had outstanding commitments to third parties to fund investments totaling $27.4 million and as of December 31, 2012,2013, the Predecessor Operating Company had outstanding commitments to third parties to fund investments totaling $15.5 million, and $10.5 million, respectively, under various undrawn revolving credit facilities, delayed draw commitments or other future funding commitments. The Operating Company may from time to time enter into financing commitment letters or bridge financing commitments, which could require funding in the future. As of December 31, 2013 and2014, the Company did not enter into any commitment letters to purchase debt investments. As of December 31, 2012,2013, the Predecessor Operating Company did not enter into any commitment letters to purchase debt investments. As of December 31, 2013 and2014, the Company had not entered into any bridge financing commitments which could require funding in the future. As of December 31, 2012,2013, the Predecessor Operating Company had not entered into any bridge financing commitments which could require funding in the future. Borrowings
The Operating Company had borrowings of $221.8 million and $206.9 million outstanding as of December 31, 2013 and December 31, 2012, respectively, under the Holdings Credit Facility. The Operating Company had borrowings of $214.7 million and $214.3 million outstanding as of December 31, 2013 and December 31, 2012, respectively, under the SLF Credit Facility.
Table of Contents
Contractual Obligations A summary of the Operating Company's significant contractual payment obligations as of December 31, 20132014 is as follows: |
| |
| | Contractual Obligations
Payments Due by Period
(in millions) | | |
| | Contractual Obligations Payments
Due by Period (in millions) | |
| |
|---|
| | Total | | Less than
1 Year | | 1 - 3
Years | | 3 - 5
Years | | More than
5 Years | | | Total | | Less than
1 Year | | 1 - 3 Years | | 3 - 5 Years | | More than
5 Years | |
|---|
Holdings Credit Facility(1) | | $ | 221.8 | | $ | — | | $ | 221.8 | | $ | — | | $ | — | | | $ | 468.1 | | $ | — | | $ | — | | $ | 468.1 | | $ | — | | SLF Credit Facility(2) | | 214.7 | | — | | 214.7 | | — | | — | | | | | | | | | | | | | | | | | Convertible Notes(2) | | | 115.0 | | — | | — | | 115.0 | | — | | NMFC Credit Facility(3) | | | 50.0 | | — | | — | | 50.0 | | — | | SBA-guaranteed debentures(4) | | | 37.5 | | — | | — | | — | | 37.5 | | | | | | | | | | | | | | | | | | | | | | | | | | | | | | | Total Contractual Obligations | | $ | 436.5 | | $ | — | | $ | 436.5 | | $ | — | | $ | — | | | $ | 670.6 | | $ | — | | $ | — | | $ | 633.1 | | $ | 37.5 | |
- (1)
- Under the terms of the
$280.0$495.0 million Holdings Credit Facility, all outstanding borrowings under that facility ($221.8468.1 million as of December 31, 2013)2014) must be repaid on or before October 27, 2016.December 18, 2019. As of December 31, 2013,2014, there was approximately $58.2$26.9 million of possible capacity remaining under the Holdings Credit Facility.
- (2)
- The $115.0 million Convertible Notes will mature on June 15, 2019 unless earlier converted or repurchased at the holder's option.
- (3)
- Under the terms of the
$215.0$80.0 million SLFNMFC Credit Facility, all outstanding borrowings under that facility ($214.750.0 million as of December 31, 2013)2014) must be repaid on or before October 27, 2016.June 4, 2019. As of December 31, 2013,2014, there was approximately $0.3$30.0 million of possible capacity remaining under the SLFNMFC Credit Facility.
- (4)
- The SBA-guaranteed debentures will mature on March 1, 2025.
The Operating Company has certain contracts under which it has material future commitments. The Operating Company has $15.5$27.4 million of undrawn funding commitments as of December 31, 20132014 related to its participation as a lender in revolving credit facilities, delayed draw commitments or other future funding commitments of the Operating Company's portfolio companies. As of December 31, 2013,2014, the Operating Company did not enter into any bridge financing commitments which could require funding in the future.
Table of Contents We have entered into the Investment Management Agreement with the Investment Adviser in accordance with the 1940 Act. Under the Investment Management Agreement, the Investment Adviser has agreed to provide the Operating Company with investment advisory and management services. We have agreed to pay for these services (1) a management fee and (2) an incentive fee based on its performance. We have also entered into an Administration Agreement with the Administrator. Under the Administration Agreement, the Administrator has agreed to arrange office space for us and provide office equipment and clerical, bookkeeping and record keeping services and other administrative services necessary to conduct our respective day-to-day operations. The Administrator has also agreed to perform, or oversee the performance of, our financial records, our reports to stockholders / unit holders and reports filed with the Securities and Exchange Commission.SEC. If any of the contractual obligations discussed above are terminated, our costs under any new agreements that are entered into may increase. In addition, we would likely incur significant time and expense in locating alternative parties to provide the services we expect to receive under the Investment Management Agreement and the Administration Agreement. Distributions and Dividends Dividends declared and paid to stockholders / unit holders of the CompaniesCompany for the year ended December 31, 20132014 totaled $65.1$77.6 million.
Table of Contents The following table summarizes the Operating Company's and NMFC's quarterly cash distributions, including dividends and returns of capital, if any, per unit/share that have been declared by the Operating Company's board of directors and subsequently NMFC's board of directors, since NMFC'sthe Company's IPO: | Fiscal Year Ended | | Date Declared | | Record Date | | Payment Date | | Per Share/
Unit
Amount | | | Date Declared | | Record Date | | Payment Date | | Per Share
Amount | |
|---|
December 31, 2014 | | | | | | | | | | | Fourth Quarter | | | November 4, 2014 | | December 16, 2014 | | December 30, 2014 | | $ | 0.34 | | Third Quarter | | | August 5, 2014 | | September 16, 2014 | | September 30, 2014 | | 0.34 | | Third Quarter | | | July 30, 2014 | | August 20, 2014 | | September 3, 2014 | | 0.12 | (1) | Second Quarter | | | May 6, 2014 | | June 16, 2014 | | June 30, 2014 | | 0.34 | | First Quarter | | | March 4, 2014 | | March 17, 2014 | | March 31, 2014 | | 0.34 | | | | | | | | | | | | | | | | | | | | | | | | $ | 1.48 | | December 31, 2013 | | | | | | | | | | | | | | | | | | | Fourth Quarter | | November 8, 2013 | | December 17, 2013 | | December 31, 2013 | | $ | 0.34 | | | November 8, 2013 | | December 17, 2013 | | December 31, 2013 | | $ | 0.34 | | Third Quarter | | August 7, 2013 | | September 16, 2013 | | September 30, 2013 | | 0.34 | | | August 7, 2013 | | September 16, 2013 | | September 30, 2013 | | 0.34 | | Third Quarter | | August 7, 2013 | | August 20, 2013 | | August 30, 2013 | | 0.12 | (1) | | August 7, 2013 | | August 20, 2013 | | August 30, 2013 | | 0.12 | (2) | Second Quarter | | May 6, 2013 | | June 14, 2013 | | June 28, 2013 | | 0.34 | | | May 6, 2013 | | June 14, 2013 | | June 28, 2013 | | 0.34 | | First Quarter | | March 6, 2013 | | March 15, 2013 | | March 28, 2013 | | 0.34 | | | March 6, 2013 | | March 15, 2013 | | March 28, 2013 | | 0.34 | | | | | | | | | | | | | | | | | | | | | | | | | | | | | | | | | | | | | | | | | | | $ | 1.48 | | | | | | | | | $ | 1.48 | | December 31, 2012 | | | | | | | |
| | | | | | | | | | | Fourth Quarter | | December 27, 2012 | | December 31, 2012 | | January 31, 2013 | | $ | 0.14 | (2) | | December 27, 2012 | | December 31, 2012 | | January 31, 2013 | | $ | 0.14 | (3) | Fourth Quarter | | November 6, 2012 | | December 14, 2012 | | December 28, 2012 | | 0.34 | | | November 6, 2012 | | December 14, 2012 | | December 28, 2012 | | 0.34 | | Third Quarter | | August 8, 2012 | | September 14, 2012 | | September 28, 2012 | | 0.34 | | | August 8, 2012 | | September 14, 2012 | | September 28, 2012 | | 0.34 | | Second Quarter | | May 8, 2012 | | June 15, 2012 | | June 29, 2012 | | 0.34 | | | May 8, 2012 | | June 15, 2012 | | June 29, 2012 | | 0.34 | | Second Quarter | | May 8, 2012 | | May 21, 2012 | | May 31, 2012 | | 0.23 | (3) | | May 8, 2012 | | May 21, 2012 | | May 31, 2012 | | 0.23 | (4) | First Quarter | | March 7, 2012 | | March 15, 2012 | | March 30, 2012 | | 0.32 | | | March 7, 2012 | | March 15, 2012 | | March 30, 2012 | | 0.32 | | | | | | | | | | | | | | | | | | | | | | | | | | | | | | | | | | | | | | | | | | | $ | 1.71 | | | | | | | | | $ | 1.71 | | December 31, 2011 | | | | | | | |
| | | | | | | | | | | Fourth Quarter | | November 8, 2011 | | December 15, 2011 | | December 30, 2011 | | $ | 0.30 | | | November 8, 2011 | | December 15, 2011 | | December 30, 2011 | | $ | 0.30 | | Third Quarter | | August 10, 2011 | | September 15, 2011 | | September 30, 2011 | | 0.29 | | | August 10, 2011 | | September 15, 2011 | | September 30, 2011 | | 0.29 | | Second Quarter | | August 10, 2011 | | August 22, 2011 | | August 31, 2011 | | 0.27 | | | August 10, 2011 | | August 22, 2011 | | August 31, 2011 | | 0.27 | | | | | | | | | | | | | | | | | | | | | | | | | | | | | | | | | | | | | | | | | | | $ | 0.86 | | | | | | | | | | | | | | | | | | | | | $ | 0.86 | | | | | | | | | | | | | | | | | | | | | | | Total | | | | | | | | $ | 4.05 | | | | | | | | | $ | 5.53 | | | | | | | | | | | | | | | | | | | | | | | | | | | | | | | | | | | | | | | | | | | | | | | | | | | | | | | | | | | | |
- (1)
- Special dividend related to realized capital gains attributable to the Company's warrant investments in Learning Care Group (US), Inc.
- (2)
- Special dividend related to a distribution received attributable to the Predecessor Operating Company's investment in YP Equity Investors LLC.
(2)(3)- Special dividend intended to minimize to the greatest extent possible
NMFC'sthe Company's U.S. federal income or excise tax liability.
(3)(4)- Special dividend related to estimated realized capital gains attributable to the Predecessor Operating Company's investments in Lawson Software, Inc. and Infor Lux Bond Company.
Table of Contents
The following table summarizes AIV Holdings' quarterly cash distributions, including dividends and returns of capital, if any, that have been declared by the Operating Company's board of directors on a per share/unit basis, and subsequently AIV Holdings' board of directors, since NMFC's IPO:
| | | | | | | | | | | Fiscal Year Ended | | Date Declared | | Record Date | | Payment Date | | Amount
(in millions) | |
|---|
December 31, 2013 | | | | | | | | | | | Fourth Quarter | | November 8, 2013 | | December 17, 2013(1) | | December 31, 2013 | | $ | 0.9 | (2) | Third Quarter | | August 7, 2013 | | September 16, 2013(3) | | September 30, 2013 | | | 2.2 | | Third Quarter | | August 7, 2013 | | August 20, 2013(3) | | August 30, 2013 | | | 0.8 | (4) | Second Quarter | | May 6, 2013 | | June 14, 2013(5) | | June 28, 2013 | | | 3.8 | (6) | First Quarter | | March 6, 2013 | | March 15, 2013(7) | | March 28, 2013(8) | | | 5.5 | (9) | | | | | | | | | | | | | | | | | | | | | | | | | | | | | | | | $ | 13.2 | | December 31, 2012 | | | | | | | | |
| | Fourth Quarter | | December 27, 2012 | | December 31, 2012(7) | | January 31, 2013 | | $ | 2.3 | (10) | Fourth Quarter | | November 6, 2012 | | December 14, 2012(7) | | December 28, 2012(11) | | | 5.5 | | Third Quarter | | August 8, 2012 | | September 14, 2012(12) | | September 28, 2012 | | | 6.9 | (13) | Second Quarter | | May 8, 2012 | | June 15, 2012(12) | | June 29, 2012(14) | | | 6.9 | | Second Quarter | | May 8, 2012 | | May 21, 2012(12) | | May 31, 2012 | | | 4.6 | (15) | First Quarter | | March 7, 2012 | | March 15, 2012(12) | | March 30, 2012(16) | | | 6.5 | | | | | | | | | | | | | | | | | | | | | | | | | | | | | | | | | $ | 32.7 | | December 31, 2011 | | | | | | | | |
| | Fourth Quarter | | November 8, 2011 | | December 15, 2011(12) | | December 30, 2011 | | $ | 6.1 | | Third Quarter | | August 10, 2011 | | September 15, 2011(12) | | September 30, 2011 | | | 5.9 | | Second Quarter | | August 10, 2011 | | August 22, 2011(12) | | August 31, 2011 | | | 5.4 | | | | | | | | | | | | | | | | | | | | | | | | | | | | | | | | | $ | 17.4 | | | | | | | | | | | | | | | | | | | | | | | | | Total | | | | | | | | $ | 63.3 | | | | | | | | | | | | | | | | | | | | | | | | | | | | | | | | | | | | | | | | | | | | | | | |
(1)As of the record date, AIV Holdings owned 2,671,938 units of the Operating Company. AIV Holdings received a total dividend for the amounts and subsequently AIV Holdings' board of directors declared total dividends in the same amounts payable to the holders of record as of the record date.
(2)This amount does not include the distribution to Guardian AIV of $54.2 million in connection with net proceeds from the October 17, 2013 underwritten secondary public offering of NMFC's common stock on behalf of AIV Holdings.
(3)As of the record date, AIV Holdings owned 6,571,938 units of the Operating Company. AIV Holdings received a total dividend for the amounts and subsequently AIV Holdings' board of directors declared total dividends in the same amounts payable to the holders of record as of the record date.
(4)Special dividend related to a distribution received attributable to the Operating Company's investment in YP Equity Investors LLC.
(5)As of the record date, AIV Holdings owned 11,321,938 units of the Operating Company. AIV Holdings received a total dividend for the amounts and subsequently AIV Holdings' board of directors declared total dividends in the same amounts payable to the holders of record as of the record date.
(6)This amount does not include the distribution to Guardian AIV of $66.9 million in connection with net proceeds from the June 21, 2013 underwritten secondary public offering of NMFC's common stock on behalf of AIV Holdings.
(7)As of the respective record dates, AIV Holdings owned 16,221,938 units of the Operating Company. AIV Holdings received a total dividend for the respective amounts and subsequently AIV Holdings' board of directors declared total dividends in the same amounts payable to the holders of record as of the respective record dates.
(8)Actual cash payment was made on April 5, 2013.
Table of Contents
(9)This amount does not include the distribution to Guardian AIV of $67.8 million in connection with net proceeds from the March 25, 2013 underwritten secondary public offering of NMFC's common stock on behalf of AIV Holdings.
(10)Special dividend intended to minimize to the greatest extent possible NMFC's federal income or excise tax liability.
(11)Actual cash payment was made on January 7, 2013.
(12)As of the respective record dates, AIV Holdings owned 20,221,938 units of the Operating Company. AIV Holdings received a total dividend for the respective amounts and subsequently AIV Holdings' board of directors declared total dividends in the same amounts payable to the holders of record as of the respective record dates.
(13)This amount does not include the distribution to Guardian AIV of $58.2 million in connection with net proceeds from the September 28, 2012 underwritten secondary public offering of NMFC's common stock on behalf of AIV Holdings.
(14)Actual cash payment was made on July 9, 2012.
(15)Special dividend related to estimated realized capital gains attributable to the Operating Company's investments in Lawson Software, Inc. and Infor Lux Bond Company.
(16)Actual cash payment was made on April 4, 2012.
Tax characteristics of all dividends paid by NMFC and AIV Holdingsthe Company were reported to stockholders on Form 1099 after the end of the calendar year. Future quarterly dividends, if any, for the CompaniesCompany will be determined by their respectivethe board of directors. Since NMFC and AIV Holdings are holding companies, all distributions on their common stock will be paid from distributions received from the Operating Company. The Operating Company intends to make distributions to its unit holders that will be sufficient to enable NMFC and AIV Holdings to pay quarterly distributions to theirits stockholders and to maintain theirits status as RICs. Under certain circumstances, the distributions that the Operating Company makes to its members may not be sufficient for AIV Holdings to satisfy the annual distribution requirement necessary for AIV Holdings to qualify as a RIC. In that case, it is expected that Guardian AIV would consent to be treated as if it received distributions from AIV Holdings sufficient to satisfy the annual distribution requirement. Guardian AIV would be required to include the consent dividend in its taxable income as a dividend from AIV Holdings, which would result in phantom (i.e., non-cash) taxable income to Guardian AIV. AIV Holdings intends to make quarterly distributions to Guardian AIV out of assets legally available for distribution each quarter. NMFCThe Company intends to distribute approximately its entire portion of the Operating Company's Adjusted Net Investment Income on a quarterly basis and substantially its entire portion of the Operating Company's taxable income on an annual basis, except that it may retain certain net capital gains for reinvestment.
Table of Contents NMFCThe Company maintains an "opt out" dividend reinvestment plan for its common stockholders. As a result, if the Operating Company declares a dividend, then NMFCCompany's stockholders' cash dividends will be automatically reinvested in additional shares of NMFC's common stock, unless they specifically "opt out" of the dividend reinvestment plan so asstockholder elects to receive cash dividends.cash. Cash dividends reinvested in additional shares of NMFC'sthe Company's common stock will be automatically reinvested by NMFC in the Operating Company in exchange forinto additional unitsshares of the Operating Company.Company's common stock. SeeItem 8—Financial Statements and Supplementary Data—Note 2, Summary of Significant Accounting Policies for additional details regarding NMFC'sthe Company's dividend reinvestment plan. AIV Holdings does not intend to reinvest any distributions received in additional units of the Operating Company.
Table of Contents
Related Parties The Companies haveCompany has entered into a number of business relationships with affiliated or related parties, including the following: - •
Together, NMFC and AIV Holdings own all the outstanding units of the Operating Company. As of December 31, 2013, NMFC and AIV Holdings own approximately 94.4% and 5.6%, respectively, of the units of the Operating Company.
•- The
Operating Company has entered into the Investment Management Agreement with the Investment Adviser, a wholly-owned subsidiary of New Mountain Capital. Therefore, New Mountain Capital is entitled to any profits earned by the Investment Adviser, which includes any fees payable to the Investment Adviser under the terms of the Investment Management Agreement, less expenses incurred by the Investment Adviser in performing its services under the Investment Management Agreement.
- •
- The
Companies haveCompany has entered into an Administration Agreement with the Administrator, a wholly-owned subsidiary of New Mountain Capital. The Administrator arranges office space for the CompaniesCompany and provides office equipment and administrative services necessary to conduct their respective day-to-day operations pursuant to the Administration Agreement. The Operating Company reimburses the Administrator for the allocable portion of overhead and other expenses incurred by it in performing its obligations to the CompaniesCompany under the Administration Agreement, including rent,which includes the fees and expenses associated with performing administrative, finance, and compliance functions, and the compensation of the Operating Company's chief financial officer and chief compliance officer and their respective staffs. Pursuant to the Administration Agreement and further restricted by the Operating Company, expenses payable to the Administrator by the Operating Company as well as other direct and indirect expenses (excluding interest, other credit facilityfinancing expense, trading expenses and management and incentive fees) hashad been capped at $3.5 million for the time period from April 1, 2012 to March 31, 2013 and capped at $4.25 million for the time period from April 1, 2013 to March 31, 2014. The expense cap will expireexpired on March 31, 2014. Thereafter, the Administrator may, in its own discretion, submit to the Operating Company for reimbursement some or all of the expenses that the Administrator has incurred on behalf of the Operating Company during any quarterly period. As a result, the amount of expenses for which the Operating Company will have to reimburse the Administrator may fluctuate in future quarterly periods and there can be no assurance given as to when, or if, the Administrator may determine to limit the expenses that the Administrator submits to the Operating Company for reimbursement in the future. However, it is expected that the Administrator will continue to support part of the expense burden of the Operating Company in the near future.future and may decide to not calculate and charge through certain overhead related amounts as well as continue to cover some of the indirect costs. The Administrator cannot recoup any expenses that the Administrator has previously waived. For the year ended December 31, 2014, approximately $1.4 million of indirect administrative expenses were included in administrative expenses, of which $0.8 million were waived by the Administrator. As of December 31, 2014, approximately $0.3 million were payable to the Administrator.
- •
- The
Companies,Company, the Investment Adviser and the Administrator have entered into a royalty-free Trademark License Agreement, as amended, with New Mountain Capital, pursuant to which New Mountain Capital has agreed to grant the Companies,Company, the Investment Adviser and the
Table of Contents In addition, NMFC and the Operating Company havehas adopted a formal code of ethics that governs the conduct of their respective officers and directors. These officers and directors also remain subject to the duties imposed by the 1940 Act, the Delaware General Corporation Law and the Delaware Limited Liability Company Act. The Investment Adviser and its affiliates may also manage other funds in the future that may have investment mandates that are similar, in whole and in part, with the Operating Company's investment mandates. The Investment Adviser and its affiliates may determine that an investment is appropriate
Table of Contents
for the Operating Company and for one or more of those other funds. In such event, depending on the availability of such investment and other appropriate factors, the Investment Adviser or its affiliates may determine that we should invest side-by-side with one or more other funds. Any such investments will be made only to the extent permitted by applicable law and interpretive positions of the Securities and Exchange CommissionSEC and its staff, and consistent with the Investment Adviser's allocation procedures. Concurrently with the IPO, NMFC sold an additional 2,172,000 shares of its common stock to certain executives and employees of, and other individuals affiliated with, New Mountain Capital in the Concurrent Private Placement. Item 7A. Quantitative and Qualitative Disclosures About Market Risk
The Operating Company is subject to certain financial market risks, such as interest rate fluctuations. During the year ended December 31, 2013,2014, certain of the loans held in the Operating Company's portfolio had floating interest rates. As of December 31, 2013,2014, approximately 85%87.7% of investments at fair value (excluding investments on non-accrual, revolvers, delayed draws and non-interest bearing equity investments) represent floating-rate investments with a LIBOR floor (includes investments bearing prime interest rate contracts) and approximately 15%12.3% of investments at fair value represent fixed-rate investments. Additionally, the Operating Company's senior secured revolving credit facilities are also subject to floating interest rates and are currently paid based on one-month floating LIBOR rates. The following table estimates the potential changes in net cash flow generated from interest income and expenses, should interest rates increase by 100, 200 or 300 basis points, or decrease by 25 basis points. Interest income is calculated as revenue from interest generated from the Operating Company's portfolio of investments held on December 31, 2013.2014. Interest expense is calculated based on the terms of the Operating Company's two outstanding revolving credit facilities.facilities and convertible notes. For the Operating Company's floating rate credit facilities, the Operating Company uses the outstanding balance as of December 31, 2013.2014. Interest expense on the Operating Company's floating rate credit facilities are calculated using the interest rate as of December 31, 20132014, adjusted for the hypothetical changes in rates, as shown below. The base interest rate case assumes the rates on the Operating Company's portfolio investments remain unchanged from the actual effective interest rates as of December 31, 2013.2014. These hypothetical calculations are based on a model of the investments in our portfolio, held as of December 31, 2013,2014, and are only adjusted for assumed changes in the underlying base interest rates.
Table of Contents Actual results could differ significantly from those estimated in the table. | Change in Interest Rates | | Estimated
Percentage
Change in
Interest Income
Net of Interest
Expense
(unaudited) | | | Estimated Percentage
Change in Interest
Income Net of
Interest Expense
(unaudited) | |
|---|
-25 Basis Points | | 0.76 | %(1) | | –25 Basis Points | | | 0.69 | %(1) | Base Interest Rate | | — | % | | — | % | +100 Basis Points | | (4.34 | )% | | (2.98 | )% | +200 Basis Points | | 0.17 | % | | 2.73 | % | +300 Basis Points | | 5.60 | % | | 9.16 | % |
- (1)
- Limited to the lesser of the December 31,
20132014 LIBOR rates or a decrease of 25 basis points.
The Operating Company was not exposed to any foreign currency exchange risks as of December 31, 2013.2014.
Table of Contents
Item 8. Financial Statements and Supplementary Data
TABLE OF CONTENTS
| | | | |
| | PAGE | |
|---|
AUDITED FINANCIAL STATEMENTS | | | | | Report of Independent Registered Public Accounting Firm | | | 100106 | | New Mountain Finance Holdings, L.L.C.Corporation | | | | | Consolidated Statements of Assets Liabilities and Members' CapitalLiabilities as of December 31, 20132014 and December 31, 20122013 | | | 102107 | | Consolidated Statements of Operations for the years ended December 31, 2013,2014, December 31, 20122013 and December 31, 20112012 | | | 103108 | | Consolidated Statements of Changes in Members' CapitalNet Assets for the years ended December 31, 2013,2014, December 31, 20122013 and December 31, 20112012 | | | 104109 | | Consolidated Statements of Cash Flows for the years ended December 31, 2013,2014, December 31, 20122013 and December 31, 20112012 | | | 105110 | | Consolidated Schedule of Investments as of December 31, 2014 | | | 111 | | Consolidated Schedule of Investments as of December 31, 2013 | | | 106 | | Consolidated Schedule of Investments as of December 31, 2012
| | | 113 | | New Mountain Finance Corporation
| | | | | Statements of Assets and Liabilities as of December 31, 2013 and December 31, 2012
| | | 118 | | Statements of Operations for the years ended December 31, 2013, December 31, 2012 and from May 19, 2011 (commencement of operations) to December 31, 2011
| | | 119 | | Statements of Changes in Net Assets for the years ended December 31, 2013, December 31, 2012 and from May 19, 2011 (commencement of operations) to December 31, 2011
| | | 120 | | Statements of Cash Flows for the years ended December 31, 2013, December 31, 2012 and from May 19, 2011 (commencement of operations) to December 31, 2011
| | | 121 | | New Mountain Finance AIV Holdings Corporation
| | | | | Statements of Assets and Liabilities as of December 31, 2013 and December 31, 2012
| | | 122 | | Statements of Operations for the years ended December 31, 2013, December 31, 2012 and from May 19, 2011 (commencement of operations) to December 31, 2011
| | | 123 | | Statements of Changes in Net Assets for the years ended December 31, 2013, December 31, 2012 and from May 19, 2011 (commencement of operations) to December 31, 2011
| | | 124 | | Statements of Cash Flows for the years ended December 31, 2013, December 31, 2012 and from May 19, 2011 (commencement of operations) to December 31, 2011
| | | 125 | | Combined Notes to the Consolidated Financial Statements of New Mountain Finance Holdings, L.L.C., the Financial Statements of New Mountain Finance Corporation and the Financial Statements of New Mountain Finance AIV Holdings Corporation
| | | 126
123 | |
Table of Contents  
REPORT OF INDEPENDENT REGISTERED PUBLIC ACCOUNTING FIRM To the Boards of Directors and investorsStockholders of
New Mountain Finance Holdings, L.L.C.,
New Mountain Finance Corporation and
New Mountain Finance AIV Holdings Corporation
New York, New York We have audited the accompanying consolidated statement of assets, liabilities and members' capital of New Mountain Finance Holdings, L.L.C., including the consolidated schedules of investments as of December 31, 2013 and 2012, and the related consolidated statements of operations, consolidated statements of changes in members' capital, and cash flows for the three years in the period ended December 31, 2013 and the financial highlights for each of the five years in the period ended December 31, 2013. Also, we have audited the statements of assets and liabilities of New Mountain Finance Corporation and New Mountain Finance AIV Holdings Corporationsubsidiaries (the "Company") including the consolidated schedules of investments as of December 31, 20132014 and 2012,2013, and the related consolidated statements of operations, changes in net assets, and cash flows for each of the three years in the period ended December 31, 2014 and the consolidated financial highlights for the period from May 19, 2011(commencement2011 (commencement of operations) to December 31, 2011 and for the years ended December 31, 2014, 2013 and 2012. These financial statements and financial highlights are the responsibility of the management of New Mountain Finance Holdings, L.L.C., New Mountain Finance Corporation and New Mountain Finance AIV Holdings Corporation.the Company. Our responsibility is to express an opinion on these financial statements and financial highlights based on our audits. We conducted our audits in accordance with the standards of the Public Company Accounting Oversight Board (United States). TheseThose standards require that we plan and perform the audit to obtain reasonable assurance about whether the financial statements are free of material misstatement. New Mountain Finance Holdings, L.L.C. and New Mountain Finance AIV Holdings Corporation are not required to have, nor were we engaged to perform, an audit of their internal control over financial reporting. Our audits of New Mountain Finance Holdings, L.L.C. and New Mountain Finance AIV Holdings Corporation included consideration of their internal control over financial reporting as a basis for designing audit procedures that are appropriate in the circumstances, but not for the purpose of expressing an opinion on the effectiveness of their internal control over financial reporting. Accordingly we express no such opinion for New Mountain Finance Holdings, L.L.C. and New Mountain Finance AIV Holdings Corporation. An audit includes examining, on a test basis, evidence supporting the amounts and disclosures in the financial statements. An audit also includes assessing the accounting principles used and significant estimates made by management, as well as evaluating the overall financial statement presentation. Our procedures included confirmation of investments as of December 31, 2013 and 2012, by correspondence with the custodian, loan agent or borrower; where replies were not received, we performed other auditing procedures. We believe that our audits provide a reasonable basis for our opinion. In our opinion, such consolidated financial statements and consolidated financial highlights referred to above present fairly, in all material respects, the consolidated financial position of New Mountain Finance Holdings, L.L.C.Corporation and subsidiaries as of December 31, 2014 and 2013, and 2012, and the consolidated results of itstheir operations, its consolidatedthe changes in members' capital,their net assets, and its consolidatedtheir cash flows for each of the three years in the period ended December 31, 2013 and the financial highlights for the each of the five years in the period ended December 31,2013; and the financial positions of New Mountain Finance Corporation and New Mountain Finance AIV Holdings Corporation as of December 31, 2013 and 2012 and the results of their operations, changes in their net assets, their cash flows,2014 and the financial highlights for the period from May 19, 2011(commencement2011 (commencement of operations) to December 31, 2011 and for the years ended
Table of Contents
December 31, 2014, 2013 and 2012 in conformity with accounting principles generally accepted in the United States of America. As discussed in Note 16, on February 3, 2014, New Mountain Finance AIV Holdings sold its remaining units in New Mountain Finance Holdings, L.L.C. (the "Operating Company") and no longer owns any units of1 to the Operating Company.consolidated financial statements, the Company completed a restructuring during the year ended December 31, 2014. We have also audited, in accordance with the standards of the Public Company Accounting Oversight Board (United States), New Mountain Finance Corporation'sthe Company's internal control over financial reporting as of December 31, 2013,2014, based on the criteria established inInternal Control—Integrated Framework (1992) (2013) issued by the Committee of Sponsoring Organizations of the Treadway Commission and our report dated March 5, 2014,2, 2015, expressed an unqualified opinion on New Mountain Finance Corporation'sthe Company's internal control over financial reporting. /s/ DELOITTE & TOUCHE LLP New York, New York
March 5, 20142, 2015
Table of Contents
New Mountain Finance Holdings, L.L.C.
Consolidated Statements of Assets, Liabilities and Members' Capital
(in thousands, except units and per unit data)
| | | | | | | |
| | December 31,
2013 | | December 31,
2012 | |
|---|
Assets | | | | | | | | Investments at fair value (cost of $1,094,080 and $976,243, respectively) | | $ | 1,115,651 | | $ | 989,820 | | Cash and cash equivalents | | | 14,981 | | | 12,752 | | Interest and dividend receivable | | | 10,531 | | | 6,340 | | Deferred credit facility costs (net of accumulated amortization of $3,562 and $2,016, respectively) | | | 4,727 | | | 5,490 | | Receivable from affiliate | | | 459 | | | 534 | | Receivable from unsettled securities sold | | | — | | | 9,962 | | Other assets | | | 1,492 | | | 666 | | | | | | | | | | | | | | | | | | Total assets | | $ | 1,147,841 | | $ | 1,025,564 | | | | | | | | | | | | | | | | | | | | | | | | | | | | | | | | | | Liabilities | | | | | | | | Holdings Credit Facility | | | 221,849 | | | 206,938 | | SLF Credit Facility | | | 214,668 | | | 214,262 | | Capital gains incentive fee payable | | | 7,636 | | | 4,407 | | Incentive fee payable | | | 4,104 | | | 3,390 | | Management fee payable | | | 3,856 | | | 3,222 | | Payable for unsettled securities purchased | | | 3,690 | | | 9,700 | | Interest payable | | | 814 | | | 712 | | Payable to affiliate | | | 80 | | | — | | Dividends payable | | | — | | | 11,192 | | Other liabilities | | | 2,628 | | | 1,802 | | | | | | | | | | | | | | | | | | Total liabilities | | | 459,325 | | | 455,625 | | Members' Capital | | | 688,516 | | | 569,939 | | | | | | | | | | | | | | | | | | Total liabilities and members' capital | | $ | 1,147,841 | | $ | 1,025,564 | | | | | | | | | | | | | | | | | | | | | | | | | | | | | | | | | | Outstanding common membership units | | | 47,896,693 | | | 40,548,189 | | Capital per unit | | $ | 14.38 | | $ | 14.06 | |
The accompanying notes are an integral part of these consolidated financial statements.
Table of Contents
New Mountain Finance Holdings, L.L.C.
Corporation
Consolidated Statements of Operations Assets and Liabilities
(in thousands)thousands, except shares and per share data)
| | | | | | | | | | |
| | Years ended December 31, | |
|---|
| | 2013 | | 2012 | | 2011 | |
|---|
Investment income | | | | | | | | | | | Interest income | | $ | 107,027 | | $ | 83,646 | | $ | 55,809 | | Dividend income | | | 5,049 | | | 812 | | | — | | Other income | | | 2,836 | | | 1,328 | | | 714 | | | | | | | | | | | | | | | | | | | | | | | Total investment income | | | 114,912 | | | 85,786 | | | 56,523 | | | | | | | | | | | | | | | | | | | | | | | Expenses | | | | | | | | | | | Incentive fee | | | 16,502 | | | 11,537 | | | 3,522 | | Capital gains incentive fee | | | 3,229 | | | 4,407 | | | — | | | | | | | | | | | | | | | | | | | | | | | Total incentive fees | | | 19,731 | | | 15,944 | | | 3,522 | | Management fee | | | 14,905 | | | 11,109 | | | 4,938 | | Interest and other credit facility expenses | | | 12,470 | | | 10,085 | | | 7,086 | | Administrative expenses | | | 3,429 | | | 2,426 | | | 1,615 | | Professional fees | | | 2,349 | | | 2,091 | | | 2,037 | | Other general and administrative expenses | | | 1,584 | | | 1,374 | | | 986 | | | | | | | | | | | | | | | | | | | | | | | Total expenses | | | 54,468 | | | 43,029 | | | 20,184 | | Less: expenses waived and reimbursed (see Note 5) | | | (3,233 | ) | | (2,460 | ) | | (2,186 | ) | | | | | | | | | | | | | | | | | | | | | | Net expenses | | | 51,235 | | | 40,569 | | | 17,998 | | | | | | | | | | | | | | | | | | | | | | | Net investment income | | | 63,677 | | | 45,217 | | | 38,525 | | Net realized gains on investments | | | 7,253 | | | 18,851 | | | 16,252 | | Net change in unrealized appreciation (depreciation) of investments | | | 7,994 | | | 9,928 | | | (23,100 | ) | | | | | | | | | | | | | | | | | | | | | | Net increase in members' capital resulting from operations | | $ | 78,924 | | $ | 73,996 | | $ | 31,677 | | | | | | | | | | | | | | | | | | | | | | | | | | | | | | | | | | | | | | | | | | | |
The accompanying notes are an integral part of these consolidated financial statements.
Table of Contents
New Mountain Finance Holdings, L.L.C.
Consolidated Statements of Changes in Members' Capital
(in thousands)
| | | | | | | | | | |
| | Years ended December 31, | |
|---|
| | 2013 | | 2012 | | 2011 | |
|---|
Increase (decrease) in members' capital resulting from operations: | | | | | | | | | | | Net investment income | | $ | 63,677 | | $ | 45,217 | | $ | 38,525 | | Net realized gains on investments | | | 7,253 | | | 18,851 | | | 16,252 | | Net change in unrealized appreciation (depreciation) of investments | | | 7,994 | | | 9,928 | | | (23,100 | ) | | | | | | | | | | | | | | | | | | | | | | Net increase in members' capital resulting from operations | | | 78,924 | | | 73,996 | | | 31,677 | | Contributions | | | 100,040 | | | 133,428 | | | 195,295 | | Distributions | | | — | | | — | | | (10,249 | ) | Dividends declared | | | (65,140 | ) | | (59,378 | ) | | (26,591 | ) | Offering costs | | | (331 | ) | | (564 | ) | | (11,557 | ) | Reinvestment of dividends | | | 5,084 | | | 1,955 | | | — | | | | | | | | | | | | | | | | | | | | | | | Net increase in members' capital | | | 118,577 | | | 149,437 | | | 178,575 | | Members' capital at the beginning of the period | | | 569,939 | | | 420,502 | | | 241,927 | | | | | | | | | | | | | | | | | | | | | | | Members' capital at the end of the period | | $ | 688,516 | | $ | 569,939 | | $ | 420,502 | | | | | | | | | | | | | | | | | | | | | | | | | | | | | | | | | | | | | | | | | | | |
| | | | | | | |
| | December 31,
2014 | | December 31,
2013 | |
|---|
Assets | | | | | | | | Investments at fair value | | | | | | | | Non-controlled/non-affiliated investments (cost of $1,422,891 and $0, respectively) | | $ | 1,402,210 | | $ | — | | Non-controlled/affiliated investments (cost $23,000 and $0, respectively) | | | 22,461 | | | — | | Investment in New Mountain Finance Holdings, L.L.C. (cost of $0 and $633,835, respectively) | | | — | | | 650,107 | | | | | | | | | | | Total investments at fair value (cost $1,445,891 and $633,835, respectively) | | | 1,424,671 | | | 650,107 | | Securities purchased under collateralized agreements to resell | | | 30,000 | | | — | | Cash and cash equivalents | | | 23,445 | | | — | | Deferred financing costs (net of accumulated amortization of $5,867 and $0, respectively) | | | 14,052 | | | — | | Interest and dividend receivable | | | 11,744 | | | — | | Receivable from unsettled securities sold | | | 8,912 | | | — | | Receivable from affiliates | | | 490 | | | — | | Other assets | | | 1,606 | | | — | | | | | | | | | | | Total assets | | $ | 1,514,920 | | $ | 650,107 | | | | | | | | | | | | | | | | | | | | | | | | | | | | | Liabilities | | | | | | | | Holdings Credit Facility | | $ | 468,108 | | $ | — | | Convertible Notes | | | 115,000 | | | — | | NMFC Credit Facility | | | 50,000 | | | — | | SBA-guaranteed debentures | | | 37,500 | | | — | | Payable for unsettled securities purchased | | | 26,460 | | | — | | Management fee payable | | | 5,144 | | | — | | Incentive fee payable | | | 4,803 | | | — | | Interest payable | | | 1,352 | | | — | | Payable to affiliates | | | 822 | | | — | | Deferred tax liability | | | 493 | | | — | | Other liabilities | | | 3,068 | | | — | | | | | | | | | | | Total liabilities | | | 712,750 | | | — | | Commitments and contingencies (See Note 9) | | | | | | | | Net assets | | | | | | | | Preferred stock, par value $0.01 per share, 2,000,000 shares authorized, none issued | | | — | | | — | | Common stock, par value $0.01 per share 100,000,000 shares authorized, and 57,997,890 and 45,224,755 shares issued and outstanding, respectively | | | 580 | | | 452 | | Paid in capital in excess of par | | | 817,129 | | | 633,383 | | Accumulated undistributed net investment income | | | 2,530 | | | — | | Accumulated undistributed net realized gains on investments | | | 14,131 | | | 5,056 | | Net unrealized (depreciation) appreciation of investments (net of provision for taxes of $493 and $0, respectively) | | | (32,200 | ) | | 11,216 | | | | | | | | | | | Total net assets | | $ | 802,170 | | $ | 650,107 | | | | | | | | | | | Total liabilities and net assets | | $ | 1,514,920 | | $ | 650,107 | | | | | | | | | | | | | | | | | | | | | | | | | | | | | Number of shares outstanding | | | 57,997,890 | | | 45,224,755 | | Net asset value per share | | $ | 13.83 | | $ | 14.38 | |
The accompanying notes are an integral part of these consolidated financial statements.
Table of Contents
New Mountain Finance Holdings, L.L.C.
Corporation
Consolidated Statements of Cash Flows Operations
(in thousands)thousands, except shares and per share data)
| | | | | | | | | | |
| | Years ended December 31, | |
|---|
| | 2014 | | 2013 | | 2012 | |
|---|
Investment income(1) | | | | | | | | | | | From non-controlled/non-affiliated investments: | | | | | | | | | | | Interest income | | $ | 85,123 | | $ | — | | $ | — | | Dividend income | | | 1,243 | | | — | | | — | | Other income | | | 4,023 | | | — | | | — | | From non-controlled/affiliated investments: | | | | | | | | | | | Dividend income | | | 1,066 | | | — | | | — | | Other income | | | 468 | | | — | | | — | | Investment income allocated from New Mountain Finance Holdings, L.L.C.(2) | | | | | | | | | | | Interest income | | | 40,515 | | | 84,925 | | | 36,439 | | Dividend income | | | 2,368 | | | 3,567 | | | 455 | | Other income | | | 795 | | | 2,384 | | | 617 | | | | | | | | | | | | | | Total investment income | | | 135,601 | | | 90,876 | | | 37,511 | | | | | | | | | | | | | | Expenses | | | | | | | | | | | Incentive fee(1) | | | 12,070 | | | — | | | — | | Capital gains incentive fee(1) | | | (8,573 | ) | | — | | | — | | | | | | | | | | | | | | Total incentive fees(1) | | | 3,497 | | | — | | | — | | Management fee(1) | | | 13,593 | | | — | | | — | | Interest and other financing expenses(1) | | | 13,269 | | | — | | | — | | Professional fees(1) | | | 2,390 | | | — | | | — | | Administrative expenses(1) | | | 1,470 | | | — | | | — | | Other general and administrative expenses(1) | | | 1,138 | | | — | | | — | | Net expenses allocated from New Mountain Finance Holdings, L.L.C.(2) | | | 20,808 | | | 40,355 | | | 17,719 | | | | | | | | | | | | | | Total expenses | | | 56,165 | | | 40,355 | | | 17,719 | | Less: management fee waived (see Note 5)(1) | | | (686 | ) | | — | | | — | | Less: expenses waived and reimbursed (see Note 5)(1) | | | (380 | ) | | — | | | — | | | | | | | | | | | | | | Net expenses | | | 55,099 | | | 40,355 | | | 17,719 | | | | | | | | | | | | | | Net investment income before income taxes | | | 80,502 | | | 50,521 | | | 19,792 | | Income tax expense(1) | | | 436 | | | — | | | — | | | | | | | | | | | | | | Net investment income | | | 80,066 | | | 50,521 | | | 19,792 | | Net realized gains (losses): | | | | | | | | | | | Non-controlled/non-affiliated investments(1) | | | 357 | | | — | | | — | | Investments allocated from New Mountain Finance Holdings, L.L.C.(2) | | | 8,568 | | | 5,427 | | | 7,593 | | Net change in unrealized (depreciation) appreciation: | | | | | | | | | | | Non-controlled/non-affiliated investments(1) | | | (43,324 | ) | | — | | | — | | Non-controlled/affiliated investments(1) | | | (539 | ) | | — | | | — | | Investments allocated from New Mountain Finance Holdings, L.L.C.(2) | | | 940 | | | 6,016 | | | 4,494 | | Investment in New Mountain Finance Holdings, L.L.C.(2) | | | — | | | (44 | ) | | (95 | ) | Provision for taxes(1) | | | (493 | ) | | — | | | — | | | | | | | | | | | | | | Net increase in net assets resulting from operations | | $ | 45,575 | | $ | 61,920 | | $ | 31,784 | | | | | | | | | | | | | | | | | | | | | | | | | | | | | | | | | | | | | | Basic earnings per share | | $ | 0.88 | | $ | 1.76 | | $ | 2.14 | | Weighted average shares of common stock outstanding—basic (See Note 12) | | | 51,846,164 | | | 35,092,722 | | | 14,860,838 | | Diluted earnings per share | | $ | 0.86 | | $ | 1.76 | | $ | 2.14 | | Weighted average shares of common stock outstanding—diluted (See Note 12) | | | 56,157,835 | | | 35,092,722 | | | 14,860,838 | | Dividends declared and paid per share | | $ | 1.48 | | $ | 1.48 | | $ | 1.71 | |
| | | | | | | | | | |
| | Years ended December 31, | |
|---|
| | 2013 | | 2012 | | 2011 | |
|---|
Cash flows from operating activities | | | | | | | | | | | Net increase in members' capital resulting from operations | | $ | 78,924 | | $ | 73,996 | | $ | 31,677 | | Adjustments to reconcile net (increase) decrease in members' capital resulting from operations to net cash (used in) provided by operating activities: | | | | | | | | | | | Net realized gains on investments | | | (7,253 | ) | | (18,851 | ) | | (16,252 | ) | Net change in unrealized (appreciation) depreciation of investments | | | (7,994 | ) | | (9,928 | ) | | 23,100 | | Amortization of purchase discount | | | (3,365 | ) | | (5,996 | ) | | (5,862 | ) | Amortization of deferred credit facility costs | | | 1,546 | | | 1,160 | | | 786 | | Non-cash investment income | | | (4,473 | ) | | (2,187 | ) | | (1,538 | ) | (Increase) decrease in operating assets: | | | | | | | | | | | Purchase of investments | | | (529,695 | ) | | (673,355 | ) | | (494,694 | ) | Proceeds from sales and paydowns of investments | | | 426,561 | | | 423,874 | | | 231,962 | | Cash received for purchase of undrawn portion of revolving credit or delayed draw facilities | | | 388 | | | 137 | | | 1,363 | | Cash paid for drawn revolver | | | — | | | (12,705 | ) | | (535 | ) | Cash repayments on drawn revolvers | | | — | | | 12,705 | | | — | | Interest and dividend receivable | | | (4,191 | ) | | 967 | | | (4,299 | ) | Receivable from affiliate | | | 75 | | | (165 | ) | | (369 | ) | Receivable from unsettled securities sold | | | 9,962 | | | (9,962 | ) | | — | | Other assets | | | (225 | ) | | (50 | ) | | (351 | ) | Increase (decrease) in operating liabilities: | | | | | | | | | | | Capital gains incentive fee payable | | | 3,229 | | | 4,407 | | | — | | Incentive fee payable | | | 714 | | | 1,073 | | | 2,317 | | Management fee payable | | | 634 | | | 1,021 | | | 2,200 | | Payable for unsettled securities purchased | | | (6,010 | ) | | 2,095 | | | (86,857 | ) | Interest payable | | | 102 | | | (1,035 | ) | | 934 | | Payable to affiliate | | | 80 | | | — | | | (394 | ) | Other liabilities | | | 639 | | | 151 | | | 534 | | | | | | | | | | | | | | | | | | | | | | | Net cash flows used in operating activities | | | (40,352 | ) | | (212,648 | ) | | (316,278 | ) | | | | | | | | | | | | | | | | | | | | | | Cash flows from financing activities | | | | | | | | | | | Contributions | | | 100,040 | | | 133,428 | | | 195,295 | | Distributions | | | — | | | — | | | (10,249 | ) | Dividends paid | | | (71,248 | ) | | (46,231 | ) | | (26,591 | ) | Offering costs paid | | | (720 | ) | | (268 | ) | | (11,557 | ) | Proceeds from Holdings Credit Facility | | | 457,978 | | | 523,099 | | | 336,508 | | Repayment of Holdings Credit Facility | | | (443,067 | ) | | (445,199 | ) | | (267,168 | ) | Proceeds from SLF Credit Facility | | | 23,306 | | | 112,993 | | | 172,060 | | Repayment of SLF Credit Facility | | | (22,900 | ) | | (64,659 | ) | | (63,068 | ) | Deferred credit facility costs paid | | | (808 | ) | | (3,082 | ) | | (4,377 | ) | | | | | | | | | | | | | | | | | | | | | | Net cash flows provided by financing activities | | | 42,581 | | | 210,081 | | | 320,853 | | | | | | | | | | | | | | | | | | | | | | | Net increase (decrease) in cash and cash equivalents | | | 2,229 | | | (2,567 | ) | | 4,575 | | Cash and cash equivalents at the beginning of the period | | | 12,752 | | | 15,319 | | | 10,744 | | | | | | | | | | | | | | | | | | | | | | | Cash and cash equivalents at the end of the period | | $ | 14,981 | | $ | 12,752 | | $ | 15,319 | | | | | | | | | | | | | | | | | | | | | | | | | | | | | | | | | | | | | | | | | | | | Supplemental disclosure of cash flow information | | | | | | | | | | | Cash interest paid | | $ | 10,323 | | $ | 9,433 | | $ | 4,358 | | Non-cash operating activities: | | | | | | | | | | | Non-cash activity on investments | | $ | 1,986 | | $ | — | | $ | — | | Non-cash financing activities: | | | | | | | | | | | Dividends declared and payable | | $ | — | | $ | 11,192 | | $ | — | | Value of members' capital issued in connection with dividend reinvestment plan | | | 5,084 | | | 1,955 | | | — | | Accrual for offering costs | | | 768 | | | 556 | | | — | | Accrual for deferred credit facility costs | | | 21 | | | 46 | | | 192 | |
- (1)
- For the year ended December 31, 2014, the amounts reported relate to the period from May 8, 2014 to December 31, 2014.
- (2)
- For the year ended December 31, 2014, the amounts reported relate to the period from January 1, 2014 to May 7, 2014.
The accompanying notes are an integral part of these consolidated financial statements.
Table of Contents
New Mountain Finance Corporation
Consolidated Statements of Changes in Net Assets
(in thousands)
| | | | | | | | | | |
| | Years ended December 31, | |
|---|
| | 2014 | | 2013 | | 2012 | |
|---|
Increase (decrease) in net assets resulting from operations: | | | | | | | | | | | Net investment income(1) | | $ | 57,196 | | $ | — | | $ | — | | Net investment income allocated from New Mountain Finance Holdings, L.L.C.(2) | | | 22,870 | | | 50,521 | | | 19,792 | | Net realized gains on investments(1) | | | 357 | | | — | | | — | | Net realized gains on investments allocated from New Mountain Finance Holdings, L.L.C.(2) | | | 8,568 | | | 5,427 | | | 7,593 | | Net change in unrealized (depreciation) appreciation of investments(1) | | | (43,863 | ) | | — | | | — | | Net change in unrealized appreciation (depreciation) of investments allocated from New Mountain Finance Holdings, L.L.C.(2) | | | 940 | | | 6,016 | | | 4,494 | | Net change in unrealized (depreciation) appreciation of investment in New Mountain Finance Holdings, L.L.C.(2) | | | — | | | (44 | ) | | (95 | ) | Provision for taxes(1) | | | (493 | ) | | — | | | — | | | | | | | | | | | | | | Net increase in net assets resulting from operations | | | 45,575 | | | 61,920 | | | 31,784 | | Capital transactions | | | | | | | | | | | Net proceeds from shares sold | | | 141,157 | | | 100,040 | | | 133,428 | | Deferred offering costs allocated from New Mountain Finance Holdings, L.L.C.(2) | | | (250 | ) | | (281 | ) | | (323 | ) | Deferred offering costs(1) | | | (476 | ) | | — | | | — | | Value of shares issued for exchanged units | | | 38,840 | | | 193,262 | | | 56,314 | | Dividends declared to stockholders from net investment income | | | (71,365 | ) | | (50,521 | ) | | (19,792 | ) | Dividends declared to stockholders from net realized gains | | | (6,247 | ) | | (1,323 | ) | | (6,927 | ) | Reinvestment of dividends | | | 4,829 | | | 5,084 | | | 1,955 | | | | | | | | | | | | | | Total net increase in net assets resulting from capital transactions | | | 106,488 | | | 246,261 | | | 164,655 | | | | | | | | | | | | | | Net increase in net assets | | | 152,063 | | | 308,181 | | | 196,439 | | Net assets at the beginning of the period | | | 650,107 | | | 341,926 | | | 145,487 | | | | | | | | | | | | | | Net assets at the end of the period | | $ | 802,170 | | $ | 650,107 | | $ | 341,926 | | | | | | | | | | | | | | | | | | | | | | | | | | | | | | | | | | | | | |
- (1)
- For the year ended December 31, 2014, the amounts reported relate to the period from May 8, 2014 to December 31, 2014.
- (2)
- For the year ended December 31, 2014, the amounts reported relate to the period from January 1, 2014 to May 7, 2014.
The accompanying notes are an integral part of these consolidated financial statements.
Table of Contents
New Mountain Finance Corporation
Consolidated Statements of Cash Flows
(in thousands)
| | | | | | | | | | |
| | Years ended December 31, | |
|---|
| | 2014 | | 2013 | | 2012 | |
|---|
Cash flows from operating activities | | | | | | | | | | | Net increase in net assets resulting from operations | | $ | 45,575 | | $ | 61,920 | | $ | 31,784 | | Adjustments to reconcile net (increase) decrease in net assets resulting from operations to net cash (used in) provided by operating activities: | | | | | | | | | | | Net investment income allocated from New Mountain Finance Holdings, L.L.C.(2) | | | (22,870 | ) | | (50,521 | ) | | (19,792 | ) | Net realized gains on investments(1) | | | (357 | ) | | — | | | — | | Net realized gains on investments allocated from New Mountain Finance Holdings, L.L.C.(2) | | | (8,568 | ) | | (5,427 | ) | | (7,593 | ) | Net change in unrealized depreciation (appreciation) of investments(1) | | | 43,863 | | | — | | | — | | Net change in unrealized (appreciation) depreciation of investments allocated from New Mountain Finance Holdings, L.L.C.(2) | | | (940 | ) | | (6,016 | ) | | (4,494 | ) | Net change in unrealized depreciation (appreciation) in New Mountain Finance Holdings, L.L.C.(2) | | | — | | | 44 | | | 95 | | Amortization of purchase discount(1) | | | (1,721 | ) | | — | | | — | | Amortization of deferred financing costs(1) | | | 1,713 | | | — | | | — | | Non-cash investment income(1) | | | (3,479 | ) | | — | | | — | | (Increase) decrease in operating assets: | | | | | | | | | | | Cash and cash equivalents from New Mountain Finance Holdings, L.L.C.(3) | | | 957 | | | — | | | — | | Purchase of investments and delayed draw facilities(1) | | | (529,540 | ) | | — | | | — | | Proceeds from sales and paydowns of investments(1) | | | 261,747 | | | — | | | — | | Cash received for purchase of undrawn portion of revolving credit or delayed draw facilities(1) | | | 29 | | | — | | | — | | Cash paid for purchase of drawn portion of revolving credit facilities(1) | | | (2,548 | ) | | — | | | — | | Cash repayments on drawn revolvers(1) | | | 380 | | | — | | | — | | Cash paid for securities purchased under collateralized agreements to resell(1) | | | (30,000 | ) | | — | | | — | | Interest and dividend receivable(1) | | | (207 | ) | | — | | | — | | Receivable from unsettled securities sold(1) | | | (8,912 | ) | | — | | | — | | Receivable from affiliates(1) | | | (106 | ) | | — | | | — | | Other assets(1) | | | 196 | | | — | | | — | | Purchase of investment in New Mountain Finance Holdings, L.L.C.(2) | | | (58,644 | ) | | (100,040 | ) | | (133,428 | ) | Distributions from New Mountain Finance Holdings, L.L.C.(2) | | | 15,247 | | | 50,165 | | | 23,314 | | Increase (decrease) in operating liabilities(1): | | | | | | | | | | | Payable for unsettled securities purchased | | | 17,054 | | | — | | | — | | Management fee payable | | | (911 | ) | | — | | | — | | Incentive fee payable | | | (1,522 | ) | | — | | | — | | Capital gains incentive fee payable | | | (8,573 | ) | | — | | | — | | Interest payable | | | 1,259 | | | — | | | — | | Payable to affiliates | | | 589 | | | — | | | — | | Deferred tax liability | | | 493 | | | — | | | — | | Other liabilities | | | 225 | | | — | | | — | | | | | | | | | | | | | | Net cash flows used in operating activities | | | (289,571 | ) | | (49,875 | ) | | (110,114 | ) | | | | | | | | | | | | | Cash flows from financing activities | | | | | | | | | | | Net proceeds from shares sold | | | 141,157 | | | 100,040 | | | 133,428 | | Dividends paid | | | (72,783 | ) | | (50,165 | ) | | (23,314 | ) | Offering costs paid(1) | | | (478 | ) | | — | | | — | | Proceeds from Holdings Credit Facility(1) | | | 384,721 | | | — | | | — | | Repayment of Holdings Credit Facility(1) | | | (314,400 | ) | | — | | | — | | Proceeds from SLF Credit Facility(1) | | | 21,255 | | | — | | | — | | Repayment of SLF Credit Facility(1) | | | (37,700 | ) | | — | | | — | | Proceeds from Convertible Notes(1) | | | 115,000 | | | — | | | — | | Proceeds from NMFC Credit Facility(1) | | | 72,000 | | | — | | | — | | Repayment of NMFC Credit Facility(1) | | | (22,000 | ) | | — | | | — | | Proceeds from SBA-guaranteed debentures(1) | | | 37,500 | | | — | | | — | | Deferred financing costs paid(1) | | | (11,256 | ) | | — | | | — | | | | | | | | | | | | | | Net cash flows provided by financing activities | | | 313,016 | | | 49,875 | | | 110,114 | | | | | | | | | | | | | | Net increase (decrease) in cash and cash equivalents | | | 23,445 | | | — | | | — | | Cash and cash equivalents at the beginning of the period | | | — | | | — | | | — | | | | | | | | | | | | | | Cash and cash equivalents at the end of the period | | $ | 23,455 | | $ | — | | $ | — | | | | | | | | | | | | | | | | | | | | | | | | | | | | | | | | | | | | | | Supplemental disclosure of cash flow information | | | | | | | | | | | Cash interest paid | | $ | 9,924 | | $ | — | | $ | — | | Income taxes paid | | | 437 | | | — | | | — | | Distribution receivable from New Mountain Finance Holdings, L.L.C. | | | — | | | — | | | 3,405 | | Non-cash financing activities: | | | | | | | | | | | Dividends declared and payable | | $ | — | | $ | — | | $ | (3,405 | ) | New Mountain Finance AIV Holdings Corporation exchange of New Mountain Finance Holdings, L.L.C. units for shares | | | 38,840 | | | 193,262 | | | 56,314 | | Value of shares issued in connection with dividend reinvestment plan | | | 4,829 | | | 5,084 | | | 1,955 | | Accrual for offering costs(1) | | | 516 | | | — | | | — | | Accrual for deferred financing costs(1) | | | 375 | | | — | | | — | | Deferred offering costs allocated from New Mountain Finance Holdings, L.L.C(2) | | | (250 | ) | | (281 | ) | | (323 | ) | SLF Credit Facility merger with the Holdings Credit Facility(1) | | | 198,555 | | | — | | | — | |
- (1)
- For the year ended December 31, 2014, the amounts reported relate to the period from May 8, 2014 to December 31, 2014.
- (2)
- For the year ended December 31, 2014, the amounts reported relate to the period from January 1, 2014 to May 7, 2014.
- (3)
- Represents the cash and cash equivalent balance of New Mountain Finance Holdings, L.L.C.'s at the date of restructuring. See Note 1,Formation and Business Purpose.
The accompanying notes are an integral part of these consolidated financial statements.
Table of Contents
New Mountain Finance Corporation
Consolidated Schedule of Investments
December 31, 2013
2014
(in thousands, except shares)
| Portfolio Company, Location and
Industry(1) | | Type of
Investment | | Interest Rate | | Maturity
Date | | Principal
Amount,
Par Value
or Shares | | Cost | | Fair Value | | Percent of
Members'
Capital | | | Type of
Investment | | Interest Rate | | Maturity
Date | | Principal
Amount,
Par Value
or Shares | | Cost | | Fair Value | | Percent of
Net
Assets | |
|---|
Funded Debt Investments—Bermuda | | | | | | | | | | | | | Stratus Technologies Bermuda Holdings Ltd.(4)** | | | | | | | | | | | | | Stratus Technologies Bermuda Ltd. / Stratus Technologies, Inc. | | | | | | | | | | | | | Information Technology | | First lien(2)(7) | | 12.00% | | 3/29/2015 | | $ | 6,497 | | $ | 6,335 | | $ | 6,529 | | 0.95 | % | | | | | | | | | | | | | | | | Non-Controlled/Non-Affiliated Investments | | | | | | | | | | | | | Funded Debt Investments—Australia | | | | | | | | | | | | | Project Sunshine IV Pty Ltd** | | | | | | | | | | | | | Media | | | First lien(2) | | 8.00% (Base Rate + 7.00%) | | 9/23/2019 | | $ | 17,689 | | $ | 17,594 | | $ | 17,888 | | 2.23 | % | | | | | | | | | | | | | | | | | | | | | | | | | | | | Total Funded Debt Investments—Bermuda | | | | $ | 6,497 | | $ | 6,335 | | $ | 6,529 | | 0.95 | % | | | | | | | | | | | | | | | | Total Funded Debt Investments—Australia | | | | | $ | 17,689 | | $ | 17,594 | | $ | 17,888 | | 2.23 | % | | | | | | | | | | | | | | | | | | | | | | | | | | | | Funded Debt Investments—Cayman Islands | | | | | | | | | | | | | Pinnacle Holdco S.à r.l. / Pinnacle (US) Acquisition Co Limited** | | | | | | | | | | | | | Funded Debt Investments—Luxembourg | | | | | | | | | | | | | Pinnacle Holdco S.à.r.l. / Pinnacle (US) Acquisition Co Limited** | | | | | | | | | | | | | Software | | Second lien(2) | | 10.50% (Base Rate + 9.25%) | | 7/30/2020 | | $ | 30,000 | | $ | 29,472 | | $ | 30,362 | | 4.41 | % | | Second lien(2) | | 10.50% (Base Rate + 9.25%) | | 7/30/2020 | | $ | 24,630 | | $ | 24,319 | | $ | 22,905 | | | | | | | | | | | | | | | | | | Second lien(3) | | 10.50% (Base Rate + 9.25%) | | 7/30/2020 | | 8,204 | | 8,317 | | 7,629 | | | | | | | | | | | | | | | | | | | | | | | | | | | | | | | Total Funded Debt Investments—Cayman Islands | | | | $ | 30,000 | | $ | 29,472 | | $ | 30,362 | | 4.41 | % | | | | | | | | | | | | | | | | | | 32,834 | | 32,636 | | 30,534 | | 3.80 | % | | | | | | | | | | | | | | | | | | | | | | | | | | | | Evergreen Skills Lux S.À.R.L.** | | | | | | | | | | | | | Education | | | Second lien(3) | | 9.25% (Base Rate + 8.25%) | | 4/28/2022 | | 5,000 | | 4,877 | | 4,737 | | 0.59 | % | | | | | | | | | | | | | | | | | | Total Funded Debt Investments—Luxembourg | | | | | $ | 37,834 | | $ | 37,513 | | $ | 35,271 | | 4.39 | % | | | | | | | | | | | | | | | | | | Funded Debt Investments—United States | | | | | | | | | | | | | | | | | | | | | | | Ascend Learning, LLC | | | | | | | | | | | | | Education | | | First lien(2) | | 6.00% (Base Rate + 5.00%) | | 7/31/2019 | | $ | 14,888 | | $ | 14,824 | | $ | 14,813 | | | | | | | Second lien(3) | | 9.50% (Base Rate + 8.50%) | | 11/30/2020 | | 29,000 | | 28,881 | | 28,855 | | | | | | | | | | | | | | | | | | | | | | | | | | 43,888 | | 43,705 | | 43,668 | | 5.44 | % | | | | | | | | | | | | | | | | | | TIBCO Software Inc**. | | | | | | | | | | | | | Software | | | First lien(2) | | 6.50% (Base Rate + 5.50%) | | 12/4/2020 | | 30,000 | | 28,512 | | 29,100 | | | | | | | Subordinated(3) | | 11.38% | | 12/1/2021 | | 15,000 | | 14,567 | | 14,550 | | | | | | | | | | | | | | | | | | | | | | | | | | 45,000 | | 43,079 | | 43,650 | | 5.44 | % | | | | | | | | | | | | | | | | | | Global Knowledge Training LLC | | | | | | | | | | | | | Education | | | Second lien(2) | | 12.00% (Base Rate + 8.75%) | | 10/21/2018 | | 41,450 | | 41,137 | | 41,786 | | 5.21 | % | Deltek, Inc. | | | | | | | | | | | | | Software | | | Second lien(2) | | 10.00% (Base Rate + 8.75%) | | 10/10/2019 | | 40,000 | | 39,989 | | 40,300 | | | | | | | Second lien(3) | | 10.00% (Base Rate + 8.75%) | | 10/10/2019 | | 1,000 | | 990 | | 1,008 | | | | | | | | | | | | | | | | | | | | | | | | | | 41,000 | | 40,979 | | 41,308 | | 5.15 | % | | | | | | | | | | | | | | | | | | Tenawa Resource Holdings LLC(16) | | | | | | | | | | | | | Tenawa Resource Management LLC | | | | | | | | | | | | | Energy | | | First lien(3) | | 10.50% (Base Rate + 8.00%) | | 5/12/2019 | | 40,000 | | 39,838 | | 39,820 | | 4.96 | % | Kronos Incorporated | | | | | | | | | | | | | Software | | | Second lien(2) | | 9.75% (Base Rate + 8.50%) | | 4/30/2020 | | 32,641 | | 32,407 | | 33,355 | | | | | | | Second lien(3) | | 9.75% (Base Rate + 8.50%) | | 4/30/2020 | | 5,000 | | 4,955 | | 5,109 | | | | | | | | | | | | | | | | | | | | | | | | | | 37,641 | | 37,362 | | 38,464 | | 4.80 | % | | | | | | | | | | | | | | | | | | McGraw-Hill Global Education Holdings, LLC | | | | | | | | | | | | | | | | | | | | | | | Education | | First lien(2) | | 9.75% | | 4/1/2021 | | $ | 24,500 | | $ | 24,348 | | $ | 27,195 | | | | | First lien(2)(9) | | 9.75% | | 4/1/2021 | | 24,500 | | 24,362 | | 27,195 | | | | | | First lien(3) | | 9.00% (Base Rate + 7.75%) | | 3/22/2019 | | 17,850 | | 17,367 | | 18,225 | | | | | First lien(2) | | 5.75% (Base Rate + 4.75%) | | 3/22/2019 | | 9,863 | | 9,641 | | 9,830 | | | | | | | | | | | | | | | | | | | | | | | | | | 34,363 | | 34,003 | | 37,025 | | 4.62 | % | | | | | | | | | | | | | | | | | | Tolt Solutions, Inc.(15) | | | | | | | | | | | | | Business Services | | | First lien(2) | | 7.00% (Base Rate + 6.00%) | | 3/7/2019 | | 18,537 | | 18,538 | | 18,075 | | | | | | | | | | | | | | | | | | First lien(2) | | 12.00% (Base Rate + 11.00%) | | 3/7/2019 | | 18,800 | | 18,800 | | 18,540 | | | | | | | | | | | | | | | | | | | | | | | | | | | | | | | | | | | 42,350 | | 41,715 | | 45,420 | | 6.60 | % | | | | 37,337 | | 37,338 | | 36,615 | | 4.56 | % | | | | | | | | | | | | | | | | | | | | | | | | | | | | | | | | | | | | | | | | | | Deltek, Inc. | | | | | | | | | | | | | Software | | Second lien(2) | | 10.00% (Base Rate + 8.75%) | | 10/10/2019 | | 41,000 | | 40,977 | | 41,820 | | 6.07 | % | | Global Knowledge Training LLC | | | | | | | | | | | | | Education | | Second lien(2) | | 11.00% (Base Rate + 9.75%) | | 10/21/2018 | | 41,450 | | 41,070 | | 41,450 | | 6.02 | % | | UniTek Global Services, Inc. | | | | | | | | | | | | | Acrisure, LLC | | | | | | | | | | | | | Business Services | | First lien(2) | | 15.00% (Base Rate + 9.50% +
4.00% PIK)* | | 4/15/2018 | | 26,382 | | 25,508 | | 26,382 | | | | | Second lien(2) | | 11.50% (Base Rate + 10.50%) | | 3/31/2020 | | 35,175 | | 34,848 | | 35,471 | | 4.42 | % | | | First lien(2) | | 15.00% (Base Rate + 9.50% +
4.00% PIK)* | | 4/15/2018 | | 6,387 | | 6,176 | | 6,387 | | | | | | | First lien(2) | | 15.00% (Base Rate + 9.50% +
4.00% PIK)* | | 4/15/2018 | | 5,309 | | 5,133 | | 5,309 | | | | | | | | | | | | | | | | | | | | | | | | | | | | | | | | | | | | 38,078 | | 36,817 | | 38,078 | | 5.53 | % | | | | | | | | | | | | | | | | | | | | | | | | | | | | | Edmentum, Inc.(fka Plato, Inc.) | | | | | | | | | | | | | Education | | First lien(3) | | 5.50% (Base Rate + 4.50%) | | 5/17/2018 | | 6,433 | | 6,240 | | 6,465 | | | | | | | Second lien(2) | | 11.25% (Base Rate + 9.75%) | | 5/17/2019 | | 31,150 | | 30,685 | | 31,578 | | | | | | | | | | | | | | | | | | | | | | | | | | | | | | | | | | | | 37,583 | | 36,925 | | 38,043 | | 5.52 | % | | | | | | | | | | | | | | | | | | | | | | | | | | | | | SRA International, Inc. | | | | | | | | | | | | | Federal Services | | First lien(2) | | 6.50% (Base Rate + 5.25%) | | 7/20/2018 | | 34,750 | | 33,784 | | 34,475 | | 5.01 | % | | Kronos Incorporated | | | | | | | | | | | | | Software | | Second lien(2) | | 9.75% (Base Rate + 8.50%) | | 4/30/2020 | | 31,341 | | 31,055 | | 32,542 | | 4.73 | % | | Rocket Software, Inc. | | | | | | | | | | | | | Software | | Second lien(2) | | 10.25% (Base Rate + 8.75%) | | 2/8/2019 | | 30,875 | | 30,731 | | 31,029 | | 4.51 | % | | Novell, Inc. (fka Attachmate Corporation, NetIQ Corporation) | | | | | | | | | | | | | Software | | First lien(3) | | 7.25% (Base Rate + 5.75%) | | 11/22/2017 | | 6,951 | | 6,847 | | 7,080 | | | | | | | Second lien(2) | | 11.00% (Base Rate + 9.50%) | | 11/22/2018 | | 23,353 | | 22,780 | | 22,876 | | | | | | | | | | | | | | | | | | | | | | | | | | | | | | | | | | | | 30,304 | | 29,627 | | 29,956 | | 4.35 | % | | | | | | | | | | | | | | | | | | | | | | | | | | | | |
The accompanying notes are an integral part of these consolidated financial statements.
Table of Contents
New Mountain Finance Holdings, L.L.C.Corporation
Consolidated Schedule of Investments (Continued) December 31, 20132014 (in thousands, except shares) | | | | | | | | | | | | | | | | | | | | | Portfolio Company, Location and
Industry(1) | | Type of
Investment | | Interest Rate | | Maturity
Date | | Principal
Amount,
Par Value
or Shares | | Cost | | Fair Value | | Percent of
Members'
Capital | |
|---|
JHCI Acquisition, Inc. | | | | | | | | | | | | | | | | | | | | | Distribution & Logistics | | First lien(3) | | 7.00% (Base Rate + 5.75%) | | | 7/11/2019 | | $ | 19,536 | | $ | 19,262 | | $ | 19,548 | | | | | | | Second lien(3) | | 11.00% (Base Rate + 9.75%) | | | 7/11/2020 | | | 10,000 | | | 9,705 | | | 9,898 | | | | | | | | | | | | | | | | | | | | | | | | | | | | | | | | | | | | | | | | | | | | | | | | | | | | | | | | 29,536 | | | 28,967 | | | 29,446 | | | 4.28 | % | | | | | | | | | | | | | | | | | | | | | | | | | | | | | | | | | | | | | | | | | | CompassLearning, Inc.(12) | | | | | | | | | | | | | | | | | | | | | Education | | First lien(2) | | 8.00% (Base Rate + 6.75%) | | | 11/26/2018 | | | 30,000 | | | 29,261 | | | 29,250 | | | 4.25 | % | Transtar Holding Company | | | | | | | | | | | | | | | | | | | | | Distribution & Logistics | | Second lien(2) | | 9.75% (Base Rate + 8.50%) | | | 10/9/2019 | | | 28,300 | | | 27,842 | | | 27,168 | | | 3.95 | % | KeyPoint Government Solutions, Inc. | | | | | | | | | | | | | | | | | | | | | Federal Services | | First lien(3) | | 7.25% (Base Rate + 6.00%) | | | 11/13/2017 | | | 16,784 | | | 16,448 | | | 16,616 | | | | | | | First lien(2) | | 7.25% (Base Rate + 6.00%) | | | 11/13/2017 | | | 10,116 | | | 9,953 | | | 10,015 | | | | | | | | | | | | | | | | | | | | | | | | | | | | | | | | | | | | | | | | | | | | | | | | | | | | | | | | 26,900 | | | 26,401 | | | 26,631 | | | 3.87 | % | | | | | | | | | | | | | | | | | | | | | | | | | | | | | | | | | | | | | | | | | | Meritas Schools Holdings, LLC | | | | | | | | | | | | | | | | | | | | | Education | | First lien(3) | | 7.00% (Base Rate + 5.75%) | | | 6/25/2019 | | | 19,950 | | | 19,763 | | | 20,087 | | | | | | | First lien(2) | | 7.00% (Base Rate + 5.75%) | | | 6/25/2019 | | | 5,920 | | | 5,865 | | | 5,961 | | | | | | | | | | | | | | | | | | | | | | | | | | | | | | | | | | | | | | | | | | | | | | | | | | | | | | | | 25,870 | | | 25,628 | | | 26,048 | | | 3.78 | % | | | | | | | | | | | | | | | | | | | | | | | | | | | | | | | | | | | | | | | | | | Sierra Hamilton LLC / Sierra Hamilton Finance, Inc. | | | | | | | | | | | | | | | | | | | | | Energy | | First lien(2) | | 12.25% | | | 12/15/2018 | | | 25,000 | | | 25,000 | | | 25,000 | | | 3.63 | % | Permian Tank & Manufacturing, Inc. | | | | | | | | | | | | | | | | | | | | | Energy | | First lien(2) | | 10.50% | | | 1/15/2018 | | | 24,500 | | | 24,757 | | | 24,255 | | | 3.52 | % | Aderant North America, Inc. | | | | | | | | | | | | | | | | | | | | | Software | | Second lien(2) | | 10.00% (Base Rate + 8.75%) | | | 6/20/2019 | | | 22,500 | | | 22,201 | | | 23,203 | | | 3.37 | % | YP Holdings LLC(8) | | | | | | | | | | | | | | | | | | | | | YP LLC | | | | | | | | | | | | | | | | | | | | | Media | | First lien(2) | | 8.04% (Base Rate + 6.71%) | | | 6/4/2018 | | | 22,400 | | | 21,892 | | | 22,722 | | | 3.30 | % | McGraw-Hill School Education Holdings, LLC | | | | | | | | | | | | | | | | | | | | | Education | | First lien(3) | | 6.25% (Base Rate + 5.00%) | | | 12/18/2019 | | | 13,000 | | | 12,870 | | | 12,870 | | | | | | | First lien(2) | | 6.25% (Base Rate + 5.00%) | | | 12/18/2019 | | | 9,000 | | | 8,910 | | | 8,910 | | | | | | | | | | | | | | | | | | | | | | | | | | | | | | | | | | | | | | | | | | | | | | | | | | | | | | | | 22,000 | | | 21,780 | | | 21,780 | | | 3.16 | % | | | | | | | | | | | | | | | | | | | | | | | | | | | | | | | | | | | | | | | | | | Aspen Dental Management, Inc. | | | | | | | | | | | | | | | | | | | | | Healthcare Services | | First lien(3) | | 7.00% (Base Rate + 5.50%) | | | 10/6/2016 | | | 21,077 | | | 20,820 | | | 20,813 | | | 3.02 | % | LM U.S. Member LLC (and LM U.S. Corp Acquisition Inc.) | | | | | | | | | | | | | | | | | | | | | Business Services | | Second lien(3) | | 9.50% (Base Rate + 8.25%) | | | 10/26/2020 | | | 20,000 | | | 19,731 | | | 20,308 | | | 2.95 | % | Envision Acquisition Company, LLC | | | | | | | | | | | | | | | | | | | | | Healthcare Services | | Second lien(2) | | 9.75% (Base Rate + 8.75%) | | | 11/4/2021 | | | 20,000 | | | 19,605 | �� | | 20,075 | | | 2.91 | % | ARSloane Acquisition, LLC | | | | | | | | | | | | | | | | | | | | | Business Services | | First lien(3) | | 7.50% (Base Rate + 6.25%) | | | 10/1/2019 | | | 19,950 | | | 19,754 | | | 19,992 | | | 2.90 | % | eResearchTechnology, Inc. | | | | | | | | | | | | | | | | | | | | | Healthcare Services | | First lien(3) | | 6.00% (Base Rate + 4.75%) | | | 5/2/2018 | | | 19,750 | | | 19,047 | | | 19,874 | | | 2.89 | % | Distribution International, Inc. | | | | | | | | | | | | | | | | | | | | | Distribution & Logistics | | First lien(2) | | 7.50% (Base Rate + 6.50%) | | | 7/16/2019 | | | 19,900 | | | 19,527 | | | 19,813 | | | 2.88 | % |
The accompanying notes are an integral part of these consolidated financial statements.
Table of Contents
New Mountain Finance Holdings, L.L.C.
Consolidated Schedule of Investments (Continued)
December 31, 2013
(in thousands, except shares)
| | | | | | | | | | | | | | | | | | | | | Portfolio Company, Location
and Industry(1) | | Type of
Investment | | Interest Rate | | Maturity
Date | | Principal
Amount,
Par Value
or Shares | | Cost | | Fair Value | | Percent of
Members'
Capital | |
|---|
First American Payment Systems, L.P. | | | | | | | | | | | | | | | | | | | | | Business Services | | Second lien(3) | | 10.75% (Base Rate + 9.50%) | | | 4/12/2019 | | $ | 20,000 | | $ | 19,654 | | $ | 19,800 | | | 2.88 | % | Merrill Communications LLC | | | | | | | | | | | | | | | | | | | | | Business Services | | First lien(3) | | 7.25% (Base Rate + 6.25%) | | | 3/8/2018 | | | 19,425 | | | 19,246 | | | 19,759 | | | 2.87 | % | Insight Pharmaceuticals LLC | | | | | | | | | | | | | | | | | | | | | Healthcare Products | | Second lien(3) | | 13.25% (Base Rate + 11.75%) | | | 8/25/2017 | | | 19,310 | | | 18,766 | | | 19,021 | | | 2.76 | % | St. George's University Scholastic Services LLC | | | | | | | | | | | | | | | | | | | | | Education | | First lien(3) | | 8.50% (Base Rate + 7.00%) | | | 12/20/2017 | | | 17,379 | | | 17,082 | | | 17,530 | | | 2.55 | % | Sotera Defense Solutions, Inc. (Global Defense Technology & Systems, Inc.) | | | | | | | | | | | | | | | | | | | | | Federal Services | | First lien(3) | | 7.50% (Base Rate + 6.00%) | | | 4/21/2017 | | | 18,316 | | | 18,127 | | | 16,118 | | | 2.34 | % | Confie Seguros Holding II Co. | | | | | | | | | | | | | | | | | | | | | Consumer Services | | Second lien(3) | | 10.25% (Base Rate + 9.00%) | | | 5/8/2019 | | | 14,886 | | | 14,762 | | | 15,034 | | | 2.18 | % | OpenLink International, Inc. | | | | | | | | | | | | | | | | | | | | | Software | | First lien(3) | | 7.75% (Base Rate + 6.25%) | | | 10/30/2017 | | | 14,700 | | | 14,496 | | | 14,774 | | | 2.15 | % | Smile Brands Group Inc. | | | | | | | | | | | | | | | | | | | | | Healthcare Services | | First lien(3) | | 7.50% (Base Rate + 6.25%) | | | 8/16/2019 | | | 14,464 | | | 14,261 | | | 14,307 | | | 2.08 | % | Brock Holdings III, Inc. | | | | | | | | | | | | | | | | | | | | | Industrial Services | | Second lien(2) | | 10.00% (Base Rate + 8.25%) | | | 3/16/2018 | | | 14,000 | | | 13,858 | | | 14,263 | | | 2.07 | % | Vision Solutions, Inc. | | | | | | | | | | | | | | | | | | | | | Software | | Second lien(2) | | 9.50% (Base Rate + 8.00%) | | | 7/23/2017 | | | 14,000 | | | 13,957 | | | 14,140 | | | 2.05 | % | Packaging Coordinators, Inc.(10) | | | | | | | | | | | | | | | | | | | | | Healthcare Products | | Second lien(2) | | 9.50% (Base Rate + 8.25%) | | | 11/10/2020 | | | 14,000 | | | 13,868 | | | 14,088 | | | 2.05 | % | Lonestar Intermediate Super Holdings, LLC | | | | | | | | | | | | | | | | | | | | | Business Services | | Subordinated(2) | | 11.00% (Base Rate + 9.50%) | | | 9/2/2019 | | | 12,000 | | | 11,701 | | | 12,419 | | | 1.80 | % | Van Wagner Communications, LLC | | | | | | | | | | | | | | | | | | | | | Media | | First lien(2) | | 6.25% (Base Rate + 5.00%) | | | 8/3/2018 | | | 11,761 | | | 11,583 | | | 11,997 | | | 1.74 | % | Vertafore, Inc. | | | | | | | | | | | | | | | | | | | | | Software | | Second lien(2) | | 9.75% (Base Rate + 8.25%) | | | 10/29/2017 | | | 10,000 | | | 9,937 | | | 10,198 | | | 1.48 | % | TransFirst Holdings, Inc. | | | | | | | | | | | | | | | | | | | | | Business Services | | Second lien(3) | | 11.00% (Base Rate + 9.75%) | | | 6/27/2018 | | | 10,000 | | | 9,741 | | | 10,138 | | | 1.47 | % | MailSouth, Inc. | | | | | | | | | | | | | | | | | | | | | Media | | First lien(3) | | 6.76% (Base Rate + 4.96%) | | | 12/14/2016 | | | 9,410 | | | 9,333 | | | 9,269 | | | 1.35 | % | Vitera Healthcare Solutions, LLC | | | | | | | | | | | | | | | | | | | | | Software | | First lien(3) | | 6.00% (Base Rate + 5.00%) | | | 11/4/2020 | | | 2,000 | | | 1,980 | | | 2,000 | | | | | | | Second lien(2) | | 9.25% (Base Rate + 8.25%) | | | 11/4/2021 | | | 7,000 | | | 6,897 | | | 7,070 | | | | | | | | | | | | | | | | | | | | | | | | | | | | | | | | | | | | | | | | | | | | | | | | | | | | | | | | 9,000 | | | 8,877 | | | 9,070 | | | 1.32 | % | | | | | | | | | | | | | | | | | | | | | | | | | | | | | | | | | | | | | | | | | | Harley Marine Services, Inc. | | | | | | | | | | | | | | | | | | | | | Distribution & Logistics | | Second lien(2) | | 10.50% (Base Rate + 9.25%) | | | 12/20/2019 | | | 9,000 | | | 8,820 | | | 8,820 | | | 1.28 | % | Consona Holdings, Inc. | | | | | | | | | | | | | | | | | | | | | Software | | First lien(3) | | 7.25% (Base Rate + 6.00%) | | | 8/6/2018 | | | 8,394 | | | 8,326 | | | 8,457 | | | 1.23 | % | Physio-Control International, Inc. | | | | | | | | | | | | | | | | | | | | | Healthcare Products | | First lien(2) | | 9.88% | | | 1/15/2019 | | | 6,651 | | | 6,651 | | | 7,482 | | | 1.09 | % | Virtual Radiologic Corporation | | | | | | | | | | | | | | | | | | | | | Healthcare Information Technology | | First lien(3) | | 7.25% (Base Rate + 5.50%) | | | 12/22/2016 | | | 13,563 | | | 13,454 | | | 7,324 | | | 1.06 | % |
| | | | | | | | | | | | | | | | | | | | Portfolio Company, Location and Industry(1) | | Type of
Investment | | Interest Rate | | Maturity
Date | | Principal
Amount,
Par Value
or Shares | | Cost | | Fair Value | | Percent of
Net
Assets | |
|---|
UniTek Global Services, Inc. | | | | | | | | | | | | | | | | | | | | Business Services | | First lien(2) | | 15.00% PIK (Base Rate + 13.50% PIK)(7)* | | 4/15/2018 | | $ | 20,596 | | $ | 20,104 | | $ | 14,706 | | | | | | | First lien(3) | | 15.00% PIK (Base Rate + 13.50% PIK)(7)* | | 4/15/2018 | | | 7,772 | | | 7,552 | | | 5,550 | | | | | | | First lien(2) | | 15.00% PIK (Base Rate + 13.50% PIK)(7)* | | 4/15/2018 | | | 6,271 | | | 6,116 | | | 4,478 | | | | | | | First lien(3) | | 15.00% PIK (Base Rate + 13.50% PIK)(7)* | | 4/15/2018 | | | 597 | | | 580 | | | 426 | | | | | | | First lien(2) | | 15.00% PIK (Base Rate + 13.50% PIK)(7)* | | 4/15/2018 | | | 5,213 | | | 5,083 | | | 3,722 | | | | | | | First lien(3) | | 15.00% PIK (Base Rate + 13.50% PIK)(7)* | | 4/15/2018 | | | 496 | | | 482 | | | 354 | | | | | | | First lien(3)(11)—Drawn | | 9.50% (Base Rate + 7.50% + 1.00% PIK)* | | 1/21/2015 | | | 3,381 | | | 3,381 | | | 3,381 | | | | | | | First lien(3)(11)—Drawn | | 10.25% (Base Rate + 4.00% + 5.25% PIK)* | | 4/15/2016 | | | 2,610 | | | 2,610 | | | 2,610 | | | | | | | | | | | | | | | | | | | | | | | | | | | | | | | | | | | 46,936 | | | 45,908 | | | 35,227 | | | 4.39 | % | | | | | | | | | | | | | | | | | | | | | | Envision Acquisition Company, LLC | | | | | | | | | | | | | | | | | | | | Healthcare Services | | Second lien(2) | | 9.75% (Base Rate + 8.75%) | | 11/4/2021 | | | 26,000 | | | 25,603 | | | 25,772 | | | | | | | Second lien(3) | | 9.75% (Base Rate + 8.75%) | | 11/4/2021 | | | 9,250 | | | 9,305 | | | 9,169 | | | | | | | | | | | | | | | | | | | | | | | | | | | | | | | | | | | 35,250 | | | 34,908 | | | 34,941 | | | 4.37 | % | | | | | | | | | | | | | | | | | | | | | | Hill International, Inc. | | | | | | | | | | | | | | | | | | | | Business Services | | First lien(2) | | 7.75% (Base Rate + 6.75%) | | 9/26/2020 | | | 34,913 | | | 34,574 | | | 34,215 | | | 4.27 | % | Meritas Schools Holdings, LLC | | | | | | | | | | | | | | | | | | | | Education | | First lien(2) | | 7.00% (Base Rate + 5.75%) | | 6/25/2019 | | | 21,658 | | | 21,487 | | | 21,549 | | | | | | | Second lien(2) | | 10.00% (Base Rate + 9.00%) | | 1/23/2021 | | | 12,000 | | | 11,943 | | | 11,820 | | | | | | | | | | | | | | | | | | | | | | | | | | | | | | | | | | | 33,658 | | | 33,430 | | | 33,369 | | | 4.16 | % | | | | | | | | | | | | | | | | | | | | | | TASC, Inc. | | | | | | | | | | | | | | | | | | | | Federal Services | | First lien(2) | | 6.50% (Base Rate + 5.50%) | | 5/22/2020 | | | 30,860 | | | 30,454 | | | 30,108 | | | | | | | Second lien(3) | | 12.00% | | 5/21/2021 | | | 2,000 | | | 1,960 | | | 1,960 | | | | | | | | | | | | | | | | | | | | | | | | | | | | | | | | | | | 32,860 | | | 32,414 | | | 32,068 | | | 4.00 | % | | | | | | | | | | | | | | | | | | | | | | SRA International, Inc. | | | | | | | | | | | | | | | | | | | | Federal Services | | First lien(2) | | 6.50% (Base Rate + 5.25%) | | 7/20/2018 | | | 31,765 | | | 31,059 | | | 31,805 | | | 3.96 | % | Navex Global,Inc. | | | | | | | | | | | | | | | | | | | | Software | | First lien(4) | | 5.75% (Base Rate + 4.75%) | | 11/19/2021 | | | 10,547 | | | 10,442 | | | 10,441 | | | | | | | First lien(2) | | 5.75% (Base Rate + 4.75%) | | 11/19/2021 | | | 4,453 | | | 4,409 | | | 4,409 | | | | | | | Second lien(4) | | 9.75% (Base Rate + 8.75%) | | 11/18/2022 | | | 11,953 | | | 11,834 | | | 11,775 | | | | | | | Second lien(3) | | 9.75% (Base Rate + 8.75%) | | 11/18/2022 | | | 5,047 | | | 4,997 | | | 4,970 | | | | | | | | | | | | | | | | | | | | | | | | | | | | | | | | | | | 32,000 | | | 31,682 | | | 31,595 | | | 3.94 | % | | | | | | | | | | | | | | | | | | | | | | Rocket Software, Inc. | | | | | | | | | | | | | | | | | | | | Software | | Second lien(2) | | 10.25% (Base Rate + 8.75%) | | 2/8/2019 | | | 30,875 | | | 30,756 | | | 30,875 | | | 3.85 | % | KeyPoint Government Solutions, Inc. | | | | | | | | | | | | | | | | | | | | Federal Services | | First lien(2) | | 7.75% (Base Rate + 6.50%) | | 11/13/2017 | | | 29,342 | | | 28,937 | | | 29,359 | | | 3.66 | % | CompassLearning, Inc.(14) | | | | | | | | | | | | | | | | | | | | Education | | First lien(2) | | 8.00% (Base Rate + 6.75%) | | 11/26/2018 | | | 30,000 | | | 29,391 | | | 29,184 | | | 3.64 | % | Aderant North America, Inc. | | | | | | | | | | | | | | | | | | | | Software | | Second lien(2) | | 10.00% (Base Rate + 8.75%) | | 6/20/2019 | | | 24,000 | | | 23,767 | | | 23,940 | | | | | | | Second lien(3) | | 10.00% (Base Rate + 8.75%) | | 6/20/2019 | | | 5,000 | | | 5,070 | | | 4,988 | | | | | | | | | | | | | | | | | | | | | | | | | | | | | | | | | | | 29,000 | | | 28,837 | | | 28,928 | | | 3.61 | % | | | | | | | | | | | | | | | | | | | | | | Transtar Holding Company | | | | | | | | | | | | | | | | | | | | Distribution & Logistics | | Second lien(2) | | 10.00% (Base Rate + 8.75%) | | 10/9/2019 | | | 28,300 | | | 27,906 | | | 27,946 | | | 3.48 | % | Pelican Products, Inc. | | | | | | | | | | | | | | | | | | | | Business Products | | Second lien(3) | | 9.25% (Base Rate + 8.25%) | | 4/9/2021 | | | 15,500 | | | 15,531 | | | 15,306 | | | | | | | Second lien(2) | | 9.25% (Base Rate + 8.25%) | | 4/9/2021 | | | 10,000 | | | 10,123 | | | 9,875 | | | | | | | | | | | | | | | | | | | | | | | | | | | | | | | | | | | 25,500 | | | 25,654 | | | 25,181 | | | 3.14 | % | | | | | | | | | | | | | | | | | | | | | |
The accompanying notes are an integral part of these consolidated financial statements.
Table of Contents
New Mountain Finance Holdings, L.L.C.Corporation
Consolidated Schedule of Investments (Continued) December 31, 20132014 (in thousands, except shares) | Portfolio Company, Location
and Industry(1) | | Type of
Investment | | Interest Rate | | Maturity
Date | | Principal
Amount,
Par Value
or Shares | | Cost | | Fair Value | | Percent of
Members'
Capital | | | Type of
Investment | | Interest Rate | | Maturity
Date | | Principal
Amount,
Par Value
or Shares | | Cost | | Fair Value | | Percent of
Net
Assets | |
|---|
Alion Science and Technology Corporation | | | | | | | | | | | | | YP Holdings LLC(10) | | | | | | | | | | | | | YP LLC | | | | | | | | | | | | | Media | | | First lien(2) | | 8.00% (Base Rate + 6.75%) | | 6/4/2018 | | $ | 24,936 | | $ | 24,678 | | $ | 25,029 | | 3.12 | % | CRGT Inc. | | | | | | | | | | | | | Federal Services | | First lien(2)(7) | | 12.00% (10.00% + 2.00% PIK)* | | 11/1/2014 | | $ | 6,447 | | $ | 6,360 | | $ | 6,570 | | 0.95 | % | | First lien(2) | | 7.50% (Base Rate + 6.50%) | | 12/19/2020 | | 25,000 | | 24,750 | | 24,750 | | 3.09 | % | Immucor, Inc. | | | | | | | | | | | | | Healthcare Services | | Subordinated(2)(7) | | 11.13% | | 8/15/2019 | | 5,000 | | 4,950 | | 5,650 | | 0.82 | % | | Learning Care Group (US), Inc. | | | | | | | | | | | | | Education | | Subordinated(2) | | 15.00% PIK* | | 5/8/2020 | | 4,371 | | 4,253 | | 4,371 | | | | | | | Subordinated(2) | | 15.00% PIK* | | 5/8/2020 | | 800 | | 746 | | 800 | | | | | Confie Seguros Holding II Co. | | | | | | | | | | | | | Consumer Services | | | Second lien(2) | | 10.25% (Base Rate + 9.00%) | | 5/8/2019 | | 18,886 | | 18,786 | | 18,877 | | | | | | | | | | | | | | | | | | Second lien(3) | | 10.25% (Base Rate + 9.00%) | | 5/8/2019 | | 5,571 | | 5,647 | | 5,569 | | | | | | | | | | | | | | | | | | | | | | | | | | | | | | | | | | | 5,171 | | 4,999 | | 5,171 | | 0.75 | % | | | | 24,457 | | 24,433 | | 24,446 | | 3.05 | % | | | | | | | | | | | | | | | | | | | | | | | | | | | | | | | | | | | | | | | | | | Education Management LLC** | | | | | | | | | | | | | Education | | First lien(3) | | 8.25% (Base Rate + 7.00%) | | 3/30/2018 | | 5,003 | | 4,888 | | 5,028 | | 0.73 | % | | GCA Services Group, Inc. | | | | | | | | | | | | | PetVet Care Centers LLC | | | | | | | | | | | | | Consumer Services | | | Second lien(3) | | 9.75% (Base Rate + 8.75%) | | 6/17/2021 | | 24,000 | | 23,761 | | 23,760 | | 2.96 | % | Sierra Hamilton LLC / Sierra Hamilton Finance, Inc. | | | | | | | | | | | | | Energy | | | First lien(2) | | 12.25% | | 12/15/2018 | | 25,000 | | 25,000 | | 23,250 | | 2.90 | % | Aricent Technologies | | | | | | | | | | | | | Business Services | | Second lien(2) | | 9.25% (Base Rate + 8.00%) | | 11/1/2020 | | 4,000 | | 3,964 | | 4,064 | | 0.59 | % | | Second lien(2) | | 9.50% (Base Rate + 8.50%) | | 4/14/2022 | | 20,000 | | 19,871 | | 20,162 | | | | Sophia Holding Finance LP / Sophia Holding Finance Inc. | | | | | | | | | | | | | Software | | Subordinated(2) | | 9.63% | | 12/1/2018 | | 3,500 | | 3,502 | | 3,623 | | 0.53 | % | | ATI Acquisition Company (fka Ability Acquisition, Inc.)(11) | | | | | | | | | | | | | Education | | First lien(2) | | 17.25% (Base Rate + 10.00% + 4.00% PIK)(5)* | | 6/30/2012—
Past Due | | 1,665 | | 1,434 | | 233 | | | | | | | First lien(2) | | 17.25% (Base Rate + 10.00% + 4.00% PIK)(5)* | | 6/30/2012—
Past Due | | 103 | | 94 | | 103 | | | | | | | | | | | | | | | | | | | Second lien(3) | | 9.50% (Base Rate + 8.50%) | | 4/14/2022 | | 2,550 | | 2,556 | | 2,571 | | | | | | | | | | | | | | | | | | | | | | | | | | | | | | | | | | | 1,768 | | 1,528 | | 336 | | 0.05 | % | | | | 22,550 | | 22,427 | | 22,733 | | 2.83 | % | | | | | | | | | | | | | | | | | | | | | | | | | | | | | | | | | | | | | | | | | | Total Funded Debt Investments—United States | | | | $ | 1,016,562 | | $ | 1,001,605 | | $ | 1,013,641 | | 147.22 | % | | | | | | | | | | | | | | | | | | | | | | | | | | | | | Total Funded Debt Investments | | | | $ | 1,053,059 | | $ | 1,037,412 | | $ | 1,050,532 | | 152.58 | % | | | | | | | | | | | | | | | | | | | | | | | | | | | | | Equity—Bermuda | | | | | | | | | | | | | Stratus Technologies Bermuda Holdings Ltd.(4)** | | | | | | | | | | | | | Information Technology | | Ordinary shares(2) | | — | | — | | 156,247 | | $ | 65 | | $ | 46 | | | | | | | Preferred shares(2) | | — | | — | | 35,558 | | 15 | | 10 | | | | | McGraw-Hill School Education Holdings, LLC | | | | | | | | | | | | | Education | | | First lien(2) | | 6.25% (Base Rate + 5.00%) | | 12/18/2019 | | 21,780 | | 21,594 | | 21,771 | | 2.71 | % | Weston Solutions, Inc. | | | | | | | | | | | | | Business Services | | | Subordinated(4) | | 16.00% (11.50% + 4.50% PIK)* | | 7/3/2019 | | 20,458 | | 20,458 | | 20,828 | | 2.60 | % | Aspen Dental Management, Inc. | | | | | | | | | | | | | Healthcare Services | | | First lien(2) | | 7.00% (Base Rate + 5.50%) | | 10/6/2016 | | 20,862 | | 20,697 | | 20,732 | | 2.58 | % | TWDiamondback Holdings Corp.(18) | | | | | | | | | | | | | Diamondback Drugs of Delaware, L.L.C.(TWDiamondback II Holdings LLC) | | | | | | | | | | | | | Distribution & Logistics | | | First lien(4) | | 9.75% (Base Rate + 8.75%) | | 11/19/2019 | | 19,895 | | 19,895 | | 19,895 | | 2.48 | % | American Pacific Corporation** | | | | | | | | | | | | | Specialty Chemicals and Materials | | | First lien(2) | | 7.00% (Base Rate + 6.00%) | | 2/27/2019 | | 19,850 | | 19,722 | | 19,825 | | 2.47 | % | Novitex Acquisition, LLC (fka ARSloane Acquisition, LLC) | | | | | | | | | | | | | Business Services | | | First lien(2) | | 7.50% (Base Rate + 6.25%) | | 7/7/2020 | | 19,950 | | 19,592 | | 19,152 | | 2.39 | % | eResearchTechnology, Inc. | | | | | | | | | | | | | Healthcare Services | | | First lien(2) | | 6.00% (Base Rate + 4.75%) | | 5/2/2018 | | 19,059 | | 18,521 | | 19,083 | | 2.38 | % | First American Payment Systems, L.P. | | | | | | | | | | | | | Business Services | | | Second lien(2) | | 10.75% (Base Rate + 9.50%) | | 4/12/2019 | | 18,643 | | 18,369 | | 18,457 | | 2.30 | % | Permian Tank & Manufacturing, Inc. | | | | | | | | | | | | | Energy | | | First lien(2) | | 10.50% | | 1/15/2018 | | 24,357 | | 24,555 | | 18,390 | | 2.29 | % | AgKnowledge Holdings Company, Inc. | | | | | | | | | | | | | Business Services | | | Second lien(2) | | 9.25% (Base Rate + 8.25%) | | 7/23/2020 | | 18,500 | | 18,326 | | 17,814 | | 2.22 | % | Vertafore, Inc. | | | | | | | | | | | | | Software | | | Second lien(2) | | 9.75% (Base Rate + 8.25%) | | 10/27/2017 | | 13,855 | | 13,852 | | 13,959 | | | | | | | | | | | | | | | | | | Second lien(3) | | 9.75% (Base Rate + 8.25%) | | 10/27/2017 | | 2,000 | | 2,017 | | 2,015 | | | | | | | | | | | | | | | | | | | | | | | | | | | | | | | | | | | | | 80 | | 56 | | 0.01 | % | | | | 15,855 | | 15,869 | | 15,974 | | 1.99 | % | | | | | | | | | | | | | | | | | | | | | | | | | | | | | | | | | | | | | | | | | | Total Shares—Bermuda | | | | | | $ | 80 | | $ | 56 | | 0.01 | % | | | | | | | | | | | | | | | | | | | | | | | | | | | | | Equity—United States | | | | | | | | | | | | | Crowley Holdings Preferred, LLC | | | | | | | | | | | | | Distribution & Logistics | | Preferred shares(2) | | 12.00% (10.00% + 2.00% PIK)* | | — | | 35,000 | | $ | 35,000 | | $ | 35,000 | | 5.08 | % | | Black Elk Energy Offshore Operations, LLC | | | | | | | | | | | | | Energy | | Preferred shares(2) | | 17.00% | | — | | 20,000,000 | | 20,000 | | 20,000 | | 2.91 | % | | Global Knowledge Training LLC | | | | | | | | | | | | | MailSouth, Inc. (d/b/a Mspark) | | | | | | | | | | | | | Media | | | First lien(2) | | 6.75% (Base Rate + 4.99%) | | 12/14/2016 | | 16,778 | | 16,190 | | 15,771 | | 1.97 | % | Edmentum, Inc.(fka Plato, Inc.) | | | | | | | | | | | | | Education | | Ordinary shares(2) | | — | | — | | 2 | | — | | 3 | | | | | Second lien(2) | | 11.25% (Base Rate + 9.75%) | | 5/17/2019 | | 25,000 | | 24,713 | | 12,500 | | | | | | Preferred shares(2) | | — | | — | | 2,423 | | — | | 3,006 | | | | | | | | | | | | | | | | | | | Second lien(3) | | 11.25% (Base Rate + 9.75%) | | 5/17/2019 | | 6,150 | | 6,040 | | 3,075 | | | | | | | | | | | | | | | | | | | | | | | | | | | | | | | | | | | | | — | | 3,009 | | 0.44 | % | | | | 31,150 | | 30,753 | | 15,575 | | 1.94 | % | | | | | | | | | | | | | | | | | | GSDM Holdings Corp. | | | | | | | | | | | | | Healthcare Services | | | Subordinated(4) | | 10.00% | | 6/23/2020 | | 15,000 | | 14,860 | | 14,642 | | 1.83 | % | Smile Brands Group Inc. | | | | | | | | | | | | | Healthcare Services | | | First lien(2) | | 7.50% (Base Rate + 6.25%) | | 8/16/2019 | | 14,319 | | 14,154 | | 13,746 | | 1.71 | % | Vision Solutions, Inc. | | | | | | | | | | | | | Software | | | Second lien(2) | | 9.50% (Base Rate + 8.00%) | | 7/23/2017 | | 14,000 | | 13,966 | | 13,580 | | 1.69 | % | Harley Marine Services, Inc. | | | | | | | | | | | | | Distribution & Logistics | | | Second lien(2) | | 10.50% (Base Rate + 9.25%) | | 12/20/2019 | | 9,000 | | 8,843 | | 8,910 | | 1.11 | % | Vitera Healthcare Solutions, LLC | | | | | | | | | | | | | Software | | | First lien(2) | | 6.00% (Base Rate + 5.00%) | | 11/4/2020 | | 1,980 | | 1,964 | | 1,970 | | | | | | | | | | | | | | | | | | Second lien(2) | | 9.25% (Base Rate + 8.25%) | | 11/4/2021 | | 7,000 | | 6,906 | | 6,825 | | | | | | | | | | | | | | | | | | | | | | | | | | | | | | | Packaging Coordinators, Inc.(10) | | | | | | | | | | | | | Packaging Coordinators Holdings, LLC | | | | | | | | | | | | | Healthcare Products | | Ordinary shares(2) | | — | | — | | 19,427 | | 1,000 | | 1,181 | | 0.17 | % | | | | | | | 8,980 | | 8,870 | | 8,795 | | 1.10 | % | | | | | | | | | | | | | | | | | |
The accompanying notes are an integral part of these consolidated financial statements.
Table of Contents
New Mountain Finance Holdings, L.L.C.Corporation
Consolidated Schedule of Investments (Continued) December 31, 20132014 (in thousands, except shares) | | | | | | | | | | | | | | | | | | | | | | Portfolio Company, Location
and Industry(1) | | Type of
Investment | | Interest Rate | | Maturity
Date | | Principal
Amount,
Par Value
or Shares | | Cost | | Fair Value | | Percent of
Members'
Capital | |
|---|
Ancora Acquisition LLC(11) | | | | | | | | | | | | | | | | | | | | | | Education | | Preferred shares(2) | | | — | | | — | | | 372 | | $ | 83 | | $ | 83 | | | 0.01 | % | | | | | | | | | | | | | | | | | | | | | | | | | | | | | | | | | | | | | | | | | | | | | Total Shares—United States | | | | | | | | | | | | | $ | 56,083 | | $ | 59,273 | | | 8.61 | % | | | | | | | | | | | | | | | | | | | | | | | | | | | | | | | | | | | | | | | | | | | | | Total Shares | | | | | | | | | | | | | $ | 56,163 | | $ | 59,329 | | | 8.62 | % | | | | | | | | | | | | | | | | | | | | | | | | | | | | | | | | | | | | | | | | | | | | | Warrants—United States | | | | | | | | | | | | | | | | | | | | | | Learning Care Group (US), Inc. | | | | | | | | | | | | | | | | | | | | | | Education | | Warrants(2) | | | — | | | — | | | 844 | | $ | 194 | | $ | 503 | | | | | | | Warrants(2) | | | — | | | — | | | 3,589 | | | 61 | | | 2,136 | | | | | | | | | | | | | | | | | | | | | | | | | | | | | | | | | | | | | | | | | | | | | | | | | | | | | | | | | | | | | | | 255 | | | 2,639 | | | 0.38 | % | | | | | | | | | | | | | | | | | | | | | | | | | | | | | | | | | | | | | | | | | | | | | YP Holdings LLC(8) | | | | | | | | | | | | | | | | | | | | | | YP Equity Investors LLC | | | | | | | | | | | | | | | | | | | | | | Media | | Warrants(2) | | | — | | | — | | | 5 | | | — | | | 1,944 | | | 0.28 | % | UniTek Global Services, Inc. | | | | | | | | | | | | | | | | | | | | | | Business Services | | Warrants(2) | | | — | | | — | | | 1,014,451 | (6) | | 1,449 | | | 1,694 | | | 0.25 | % | Storapod Holding Company, Inc. | | | | | | | | | | | | | | | | | | | | | | Consumer Services | | Warrants(2) | | | — | | | — | | | 360,129 | | | 156 | | | 594 | | | 0.09 | % | Alion Science and Technology Corporation | | | | | | | | | | | | | | | | | | | | | | Federal Services | | Warrants(2) | | | — | | | — | | | 6,000 | | | 293 | | | 94 | | | 0.01 | % | Ancora Acquisition LLC(11) | | | | | | | | | | | | | | | | | | | | | | Education | | Warrants(2) | | | — | | | — | | | 20 | | | — | | | — | | | — | % | | | | | | | | | | | | | | | | | | | | | | | | | | | | | | | | | | | | | | | | | | | | | Total Warrants—United States | | | | | | | | | | | | | $ | 2,153 | | $ | 6,965 | | | 1.01 | % | | | | | | | | | | | | | | | | | | | | | | | | | | | | | | | | | | | | | | | | | | | | | Total Funded Investments | | | | | | | | | | | | | $ | 1,095,728 | | $ | 1,116,826 | | | 162.21 | % | | | | | | | | | | | | | | | | | | | | | | | | | | | | | | | | | | | | | | | | | | | | | Unfunded Debt Investments—United States | | | | | | | | | | | | | | | | | | | | | | Aspen Dental Management, Inc. | | | | | | | | | | | | | | | | | | | | | | Healthcare Services | | First lien(2)(9)—Undrawn | | | — | | | 4/6/2016 | | $ | 5,000 | | $ | (388 | ) | $ | (388 | ) | | (0.06 | )% | Advantage Sales & Marketing Inc. | | | | | | | | | | | | | | | | | | | | | | Business Services | | First lien(2)(9)—Undrawn | | | — | | | 12/17/2015 | | | 10,500 | | | (1,260 | ) | | (787 | ) | | (0.11 | )% | | | | | | | | | | | | | | | | | | | | | | | | | | | | | | | | | | | | | | | | | | | | Total Unfunded Debt Investments | | | | | | | | | | $ | 15,500 | | $ | (1,648 | ) | $ | (1,175 | ) | | (0.17 | )% | | | | | | | | | | | | | | | | | | | | | | | | | | | | | | | | | | | | | | | | | | | | Total Investments | | | | | | | | | | | | | $ | 1,094,080 | | $ | 1,115,651 | | | 162.04 | % | | | | | | | | | | | | | | | | | | | | | | | | | | | | | | | | | | | | | | | | | | | | |
| | | | | | | | | | | | | | | | | | | | Portfolio Company, Location and Industry(1) | | Type of
Investment | | Interest Rate | | Maturity
Date | | Principal
Amount,
Par Value
or Shares | | Cost | | Fair Value | | Percent of
Net
Assets | |
|---|
McKissock, LLC | | | | | | | | | | | | | | | | | | | | QC McKissock Investment, LLC | | | | | | | | | | | | | | | | | | | | Education | | First lien(2) | | 7.50% (Base Rate + 6.50%) | | 8/5/2019 | | $ | 4,923 | | $ | 4,877 | | $ | 4,844 | | | | | | | First lien(2) | | 7.50% (Base Rate + 6.50%) | | 8/5/2019 | | | 3,178 | | | 3,149 | | | 3,127 | | | | | | | First lien(2)(11)—Drawn | | 7.50% (Base Rate + 6.50%) | | 8/5/2019 | | | 576 | | | 570 | | | 567 | | | | | | | | | | | | | | | | | | | | | | | | | | | | | | | | | | | 8,677 | | | 8,596 | | | 8,538 | | | 1.06 | % | | | | | | | | | | | | | | | | | | | | | | Asurion, LLC (fka Asurion Corporation) | | | | | | | | | | | | | | | | | | | | Business Services | | Second lien(3) | | 8.50% (Base Rate + 7.50%) | | 3/3/2021 | | | 5,000 | | | 4,934 | | | 4,987 | | | | | | | Second lien(2) | | 8.50% (Base Rate + 7.50%) | | 3/3/2021 | | | 3,000 | | | 2,957 | | | 2,993 | | | | | | | | | | | | | | | | | | | | | | | | | | | | | | | | | | | 8,000 | | | 7,891 | | | 7,980 | | | 0.99 | % | | | | | | | | | | | | | | | | | | | | | | Physio-Control International, Inc. | | | | | | | | | | | | | | | | | | | | Healthcare Products | | First lien(2) | | 9.88% | | 1/15/2019 | | | 6,651 | | | 6,651 | | | 7,083 | | | 0.88 | % | Sotera Defense Solutions, Inc. (Global Defense Technology & Systems, Inc.) | | | | | | | | | | | | | | | | | | | | Federal Services | | First lien(2) | | 9.00% (Base Rate + 7.50%) | | 4/21/2017 | | | 7,445 | | | 7,387 | | | 6,626 | | | 0.83 | % | Brock Holdings III, Inc. | | | | | | | | | | | | | | | | | | | | Industrial Services | | Second lien(2) | | 10.00% (Base Rate + 8.25%) | | 3/16/2018 | | | 7,000 | | | 6,934 | | | 5,548 | | | 0.69 | % | Immucor, Inc. | | | | | | | | | | | | | | | | | | | | Healthcare Services | | Subordinated(2)(9) | | 11.13% | | 8/15/2019 | | | 5,000 | | | 4,957 | | | 5,425 | | | 0.68 | % | Virtual Radiologic Corporation | | | | | | | | | | | | | | | | | | | | Healthcare Information Technology | | First lien(2) | | 7.25% (Base Rate + 5.50%) | | 12/22/2016 | | | 5,963 | | | 5,931 | | | 4,979 | | | 0.62 | % | Packaging Coordinators, Inc.(12) | | | | | | | | | | | | | | | | | | | | Healthcare Products | | Second lien(3) | | 9.00% (Base Rate + 8.00%) | | 8/1/2022 | | | 5,000 | | | 4,952 | | | 4,925 | | | 0.61 | % | LM U.S. Member LLC (and LM U.S. Corp Acquisition Inc.) | | | | | | | | | | | | | | | | | | | | Business Services | | Second lien(2) | | 8.25% (Base Rate + 7.25%) | | 1/25/2021 | | | 5,000 | | | 4,940 | | | 4,867 | | | 0.61 | % | Learning Care Group (US) Inc.(17) | | | | | | | | | | | | | | | | | | | | Learning Care Group (US) No. 2 Inc. | | | | | | | | | | | | | | | | | | | | Education | | First lien(2) | | 5.50% (Base Rate + 4.50%) | | 5/5/2021 | | | 4,465 | | | 4,424 | | | 4,476 | | | 0.56 | % | CRC Health Corporation | | | | | | | | | | | | | | | | | | | | Healthcare Services | | Second lien(3) | | 9.00% (Base Rate + 8.00%) | | 9/28/2021 | | | 4,000 | | | 3,925 | | | 4,098 | | | 0.51 | % | GCA Services Group, Inc. | | | | | | | | | | | | | | | | | | | | Business Services | | Second lien(3) | | 9.25% (Base Rate + 8.00%) | | 11/1/2020 | | | 4,000 | | | 3,968 | | | 3,955 | | | 0.49 | % | Sophia Holding Finance LP / Sophia Holding Finance Inc. | | | | | | | | | | | | | | | | | | | | Software | | Subordinated(3) | | 9.63% | | 12/1/2018 | | | 3,500 | | | 3,502 | | | 3,531 | | | 0.44 | % | York Risk Services Holding Corp. | | | | | | | | | | | | | | | | | | | | Business Services | | Subordinated(3) | | 8.50% | | 10/1/2022 | | | 3,000 | | | 3,000 | | | 3,011 | | | 0.38 | % | Winebow Holdings, Inc. (Vinter Group, Inc., The) | | | | | | | | | | | | | | | | | | | | Distribution & Logistics | | Second lien(3) | | 8.50% (Base Rate + 7.50%) | | 1/2/2022 | | | 3,000 | | | 2,979 | | | 2,910 | | | 0.36 | % | Synarc-Biocore Holdings, LLC | | | | | | | | | | | | | | | | | | | | Healthcare Services | | Second lien(3) | | 9.25% (Base Rate + 8.25%) | | 3/10/2022 | | | 2,500 | | | 2,477 | | | 2,250 | | | 0.28 | % | Education Management LLC** | | | | | | | | | | | | | | | | | | | | Education | | First lien(2) | | 9.25% PIK (Base Rate + 8.00% PIK)* | | 3/30/2018 | | | 1,944 | | | 1,902 | | | 880 | | | | | | | First lien(3) | | 9.25% PIK (Base Rate + 8.00% PIK)* | | 3/30/2018 | | | 1,097 | | | 1,085 | | | 496 | | | | | | | | | | | | | | | | | | | | | | | | | | | | | | | | | | | 3,041 | | | 2,987 | | | 1,376 | | | 0.17 | % | | | | | | | | | | | | | | | | | | | | | | ATI Acquisition Company (fka Ability Acquisition, Inc.)(13) | | | | | | | | | | | | | | | | | | | | Education | | First lien(2) | | 17.25% (Base Rate + 10.00% + 4.00% PIK)(7)* | | 6/30/2012—Past Due | | | 1,665 | | | 1,434 | | | 216 | | | | | | | First lien(2) | | 17.25% (Base Rate + 10.00% + 4.00% PIK)(7)* | | 6/30/2012—Past Due | | | 103 | | | 94 | | | 103 | | | | | | | | | | | | | | | | | | | | | | | | | | | | | | | | | | | 1,768 | | | 1,528 | | | 319 | | | 0.04 | % | | | | | | | | | | | | | | | | | | | | | | Total Funded Debt Investments—United States | | | | | | | | $ | 1,338,642 | | $ | 1,325,057 | | $ | 1,291,305 | | | 160.98 | % | | | | | | | | | | | | | | | | | | | | | | Total Funded Debt Investments | | | | | | | | $ | 1,394,165 | | $ | 1,380,164 | | $ | 1,344,464 | | | 167.60 | % | | | | | | | | | | | | | | | | | | | | | |
The accompanying notes are an integral part of these consolidated financial statements.
Table of Contents
New Mountain Finance Corporation
Consolidated Schedule of Investments (Continued) December 31, 2014 (in thousands, except shares) | | | | | | | | | | | | | | | | | | | | Portfolio Company, Location and Industry(1) | | Type of
Investment | | Interest Rate | | Maturity
Date | | Principal
Amount,
Par Value
or Shares | | Cost | | Fair Value | | Percent of
Net
Assets | |
|---|
Equity—United Kingdom | | | | | | | | | | | | | | | | | | | | Packaging Coordinators, Inc.(12) | | | | | | | | | | | | | | | | | | | | PCI Pharma Holdings UK Limited** | | | | | | | | | | | | | | | | | | | | Healthcare Products | | Ordinary shares(2) | | — | | — | | | 19,427 | | $ | 580 | | $ | 1,193 | | | 0.15 | % | | | | | | | | | | | | | | | | | | | | | | Total Shares—United Kingdom | | | | | | | | | | | $ | 580 | | $ | 1,193 | | | 0.15 | % | | | | | | | | | | | | | | | | | | | | | | Equity—United States | | | | | | | | | | | | | | | | | | | | Crowley Holdings Preferred, LLC | | | | | | | | | | | | | | | | | | | | Distribution & Logistics | | Preferred shares(3) | | 12.00% (10.00% + 2.00% PIK)* | | — | | | 35,721 | | $ | 35,721 | | $ | 35,721 | | | 4.45 | % | Global Knowledge Training LLC | | | | | | | | | | | | | | | | | | | | Education | | Ordinary shares(2) | | — | | — | | | 2 | | | — | | | 8 | | | | | | | Preferred shares(2) | | — | | — | | | 2,423 | | | — | | | 9,739 | | | | | | | | | | | | | | | | | | | | | | | | | | | | | | | | | | | | | | — | | | 9,747 | | | 1.22 | % | | | | | | | | | | | | | | | | | | | | | | Tenawa Resource Holdings LLC(16) | | | | | | | | | | | | | | | | | | | | QID NGL LLC | | | | | | | | | | | | | | | | | | | | Energy | | Ordinary shares(3) | | — | | — | | | 3,000,000 | | | 3,000 | | | 2,430 | | | 0.30 | % | TWDiamondback Holdings Corp.(18) | | | | | | | | | | | | | | | | | | | | Distribution & Logistics | | Preferred shares(4) | | — | | — | | | 200 | | | 2,000 | | | 2,000 | | | 0.25 | % | Ancora Acquisition LLC(13) | | | | | | | | | | | | | | | | | | | | Education | | Preferred shares(6) | | — | | — | | | 372 | | | 83 | | | 83 | | | 0.01 | % | | | | | | | | | | | | | | | | | | | | | | Total Shares—United States | | | | | | | | | | | $ | 40,804 | | $ | 49,981 | | | 6.23 | % | | | | | | | | | | | | | | | | | | | | | | Total Shares | | | | | | | | | | | $ | 41,384 | | $ | 51,174 | | | 6.38 | % | | | | | | | | | | | | | | | | | | | | | | Warrants—United States | | | | | | | | | | | | | | | | | | | | Storapod Holding Company, Inc. | | | | | | | | | | | | | | | | | | | | Consumer Services | | Warrants(3) | | — | | — | | | 360,129 | | $ | 156 | | $ | 4,142 | | | 0.51 | % | YP Holdings LLC(10) | | | | | | | | | | | | | | | | | | | | YP Equity Investors LLC | | | | | | | | | | | | | | | | | | | | Media | | Warrants(5) | | — | | — | | | 5 | | | — | | | 2,549 | | | 0.32 | % | Learning Care Group (US) Inc.(17) | | | | | | | | | | | | | | | | | | | | ASP LCG Holdings, Inc. | | | | | | | | | | | | | | | | | | | | Education | | Warrants(3) | | — | | — | | | 622 | | | 37 | | | 299 | | | 0.04 | % | UniTek Global Services, Inc. | | | | | | | | | | | | | | | | | | | | Business Services | | Warrants(3) | | — | | — | | | 1,014,451 | (8) | | 1,449 | | | — | | | — | % | Alion Science and Technology Corporation | | | | | | | | | | | | | | | | | | | | Federal Services | | Warrants(3) | | — | | — | | | 6,000 | | | 293 | | | — | | | — | % | Ancora Acquisition LLC(13) | | | | | | | | | | | | | | | | | | | | Education | | Warrants(6) | | — | | — | | | 20 | | | — | | | — | | | — | % | | | | | | | | | | | | | | | | | | | | | | Total Warrants—United States | | | | | | | | | | | $ | 1,935 | | $ | 6,990 | | | 0.87 | % | | | | | | | | | | | | | | | | | | | | | | Total Funded Investments | | | | | | | | | | | $ | 1,423,483 | | $ | 1,402,628 | | | 174.85 | % | | | | | | | | | | | | | | | | | | | | | | Unfunded Debt Investments—United States | | | | | | | | | | | | | | | | | | | | TWDiamondback Holdings Corp.(18) | | | | | | | | | | | | | | | | | | | | Diamondback Drugs of Delaware, L.L.C. (TWDiamondback II Holdings LLC) | | | | | | | | | | | | | | | | | | | | Distribution & Logistics | | First lien(4)(11)—Undrawn | | — | | 5/19/2015 | | $ | 2,763 | | $ | — | | $ | — | | | — | % | UniTek Global Services, Inc. | | | | | | | | | | | | | | | | | | | | Business Services | | First lien(3)(11)—Undrawn | | — | | 1/21/2015 | | | 5,425 | | | — | | | — | | | | | | | First lien(3)(11)—Undrawn | | — | | 1/21/2015 | | | 2,048 | | | — | | | — | | | | | | | First lien(3)(11)—Undrawn | | — | | 1/21/2015 | | | 758 | | | — | | | — | | | | | | | | | | | | | | | | | | | | | | | | | | | | | | | | | | | | | | — | | | — | | | — | % | | | | | | | | | | | | | | | | | | | | | | McKissock, LLC | | | | | | | | | | | | | | | | | | | | Education | | First lien(2)(11)—Undrawn | | — | | 8/5/2019 | | | 2,304 | | | (23 | ) | | (37 | ) | | — | % | MailSouth, Inc. (d/b/a Mspark) | | | | | | | | | | | | | | | | | | | | Media | | First lien(3)(11)—Undrawn | | — | | 12/14/2015 | | | 1,900 | | | (181 | ) | | (156 | ) | | (0.02 | )% |
The accompanying notes are an integral part of these consolidated financial statements.
Table of Contents
New Mountain Finance Corporation
Consolidated Schedule of Investments (Continued) December 31, 2014 (in thousands, except shares) | | | | | | | | | | | | | | | | | | | | Portfolio Company, Location and Industry(1) | | Type of
Investment | | Interest Rate | | Maturity
Date | | Principal
Amount,
Par Value
or Shares | | Cost | | Fair Value | | Percent of
Net
Assets | |
|---|
Aspen Dental Management, Inc. | | | | | | | | | | | | | | | | | | | | Healthcare Services | | First lien(3)(11)—Undrawn | | — | | 4/6/2016 | | $ | 5,000 | | $ | (388 | ) | $ | (225 | ) | | (0.03 | )% | | | | | | | | | | | | | | | | | | | | | | Total Unfunded Debt Investments | | | | | | | | $ | 20,198 | | $ | (592 | ) | $ | (418 | ) | | (0.05 | )% | | | | | | | | | | | | | | | | | | | | | | Total Non-Controlled/Non-Affiliated Investments | | | | | | | | | | | $ | 1,422,891 | | $ | 1,402,210 | | | 174.80 | % | | | | | | | | | | | | | | | | | | | | | | Non-Controlled/Affiliated Investments(19) | | | | | | | | | | | | | | | | | | | | Equity—United States | | | | | | | | | | | | | | | | | | | | NMFC Senior Loan Program I LLC** | | | | | | | | | | | | | | | | | | | | Investment in Fund | | Membership interest(3) | | — | | — | | | — | | $ | 23,000 | | $ | 22,461 | | | 2.80 | % | | | | | | | | | | | | | | | | | | | | | | Total Non-Controlled/Affiliated Investments | | | | | | | | | | | $ | 23,000 | | $ | 22,461 | | | 2.80 | % | | | | | | | | | | | | | | | | | | | | | | Total Investments | | | | | | | | | | | $ | 1,445,891 | | $ | 1,424,671 | | | 177.60 | % | | | | | | | | | | | | | | | | | | | | | |
- (1)
- New Mountain Finance
Holdings, L.L.C.Corporation (the "Operating Company""Company") generally acquires its investments in private transactions exempt from registration under the Securities Act of 1933, as amended (the "Securities Act"). These investments are generally subject to certain limitations on resale, and may be deemed to be "restricted securities" under the Securities Act.
- (2)
- Investment is pledged as collateral for the Holdings Credit Facility, a revolving credit facility among the
Operating Company as Collateral Manager, New Mountain Finance Holdings, L.L.C. ("NMF Holdings") as the Borrower, Wells Fargo Securities, LLC as the Administrative Agent, and Wells Fargo Bank, National Association, as the Lender and Collateral Custodian. See Note 7,Borrowings, for details.
- (3)
- Investment is pledged as collateral for the NMFC Credit Facility, a revolving credit facility among the Company as the Borrower and Goldman Sachs Bank USA as the Administrative Agent and the Collateral Agent and Goldman Sachs Bank USA and Morgan Stanley, N.A. as Lenders. See Note 7,Borrowings, for details.
- (4)
- Investment is held in New Mountain Finance SBIC, L.P.
- (5)
- Investment is held in NMF YP Holdings, Inc.
- (6)
- Investment is held in NMF Ancora Holdings, Inc.
- (7)
- Investment or a portion of the investment is on non-accrual status. See Note 3,Investments, for details.
- (8)
- The Company holds 1,014,451 warrants in UniTek Global Services, Inc., which represents a 4.41% equity ownership on a fully diluted basis.
- (9)
- Securities are registered under the Securities Act.
- (10)
- The Company holds investments in two related entities of YP Holdings LLC. The Company directly holds warrants to purchase a 4.96% membership interest of YP Equity Investors, LLC (which at closing represented an indirect 1.0% equity interest in YP Holdings LLC) and holds an investment in the Term Loan B loans issued by YP LLC, a subsidiary of YP Holdings LLC.
- (11)
- Par Value amounts represent the drawn or undrawn (as indicated in type of investment) portion of revolving credit facilities or delayed draws. Cost amounts represent the cash received at settlement date net the impact of paydowns and cash paid for drawn revolvers or delayed draws.
- (12)
- The Company holds investments in Packaging Coordinators, Inc. and one related entity of Packaging Coordinators, Inc. The Company has a debt investment in Packaging Coordinators, Inc. and holds ordinary equity in PCI Pharma Holdings UK Limited, a wholly-owned subsidiary of Packaging Coordinators, Inc.
- (13)
- The Company holds investments in ATI Acquisition Company and Ancora Acquisition LLC. The Company has debt investments in ATI Acquisition Company and preferred equity and warrants to purchase units of common membership interests of Ancora Acquisition LLC. The Company received its investments in Ancora Acquisition LLC as a result of its investments in ATI Acquisition Company.
- (14)
- The Company holds an investment in CompassLearning, Inc. that is structured as a first lien last out term loan.
- (15)
- The Company holds two first lien investments in Tolt Solutions, Inc. The debt investment with an interest rate at base rate + 6.00% is structured as a first lien first out debt investment. The debt investment with an interest rate at base rate + 11.00% is structured as a first lien last out debt investment.
- (16)
- The Company holds investments in two related entities of Tenawa Resource Holdings LLC. The Company holds 4.76% of the common units in QID NGL LLC (which at closing represented 98.1% of the ownership in the common units in Tenawa Resource Holdings LLC) and holds a first lien investment in Tenawa Resource Management LLC, a wholly-owned subsidiary of Tenawa Resource Holdings LLC.
- (17)
- The Company holds investments in two wholly-owned subsidiaries of Learning Care Group (US) Inc. The Company has a debt investment in Learning Care Group (US) No. 2 Inc. and holds warrants to purchase common stock of ASP LCG Holdings, Inc.
- (18)
- The Company holds investments in TWDiamondback Holdings Corp. and one related entity of TWDiamondback Holdings Corp. The Company holds preferred equity in TWDiamondback Holdings Corp. and holds a first lien last out term loan and a delayed draw term loan in Diamondback Drugs of Delaware LLC, a wholly-owned subsidiary of TWDiamondback Holdings Corp.
- (19)
- Denotes investments in which the Company is an "Affiliated Person", as defined in the Investment Company Act of 1940, as amended, due to owning or holding the power to vote 5.0% or more of the outstanding voting securities of the investment but not controlling the company.
- *
- All or a portion of interest contains payments-in-kind ("PIK").
- **
- Indicates assets that the Company deems to be "non-qualifying assets" under Section 55(a) of the Investment Company Act of 1940, as amended. Qualifying assets must represent at least 70.00% of the Company's total assets at the time of acquisition of any additional non-qualifying assets.
The accompanying notes are an integral part of these consolidated financial statements.
Table of Contents
New Mountain Finance Corporation
Consolidated Schedule of Investments (Continued)
December 31, 2014
| | | | |
| | December 31, 2014 | |
|---|
Investment Type | | Percent of Total
Investments at Fair Value | |
|---|
First lien | | | 47.58 | % | Second lien | | | 42.41 | % | Subordinated | | | 4.35 | % | Equity and other | | | 5.66 | % | | | | | | | Total investments | | | 100.00 | % | | | | | | | | | | | | | | | | | | |
| | | | |
| | December 31, 2014 | |
|---|
Industry Type | | Percent of Total
Investments at Fair Value | |
|---|
Software | | | 20.16 | % | Business Services | | | 18.27 | % | Education | | | 17.68 | % | Federal Services | | | 8.75 | % | Healthcare Services | | | 8.05 | % | Distribution & Logistics | | | 6.83 | % | Energy | | | 5.89 | % | Media | | | 4.29 | % | Consumer Services | | | 3.67 | % | Business Products | | | 1.77 | % | Investment in Fund | | | 1.58 | % | Specialty Chemicals and Materials | | | 1.39 | % | Healthcare Products | | | 0.93 | % | Industrial Services | | | 0.39 | % | Healthcare Information Technology | | | 0.35 | % | | | | | | | Total investments | | | 100.00 | % | | | | | | | | | | | | | | | | | | |
| | | | |
| | December 31, 2014 | |
|---|
Interest Rate Type | | Percent of Total
Investments at Fair Value | |
|---|
Floating rates | | | 12.32 | % | Fixed rates | | | 87.68 | % | | | | | | | Total investments | | | 100.00 | % | | | | | | | | | | | | | | | | | | |
The accompanying notes are an integral part of these consolidated financial statements.
Table of Contents
New Mountain Finance Corporation
Consolidated Schedule of Investments
December 31, 2013
(in thousands, except shares)
| | | | | | | | | | |
| | Cost | | Fair Value | | Percent of
Net Assets | |
|---|
Investments | | | | | | | | | | | Investment in New Mountain Finance Holdings, L.L.C.(1) | | $ | 633,835 | | $ | 650,107 | | | 100.00 | % | | | | | | | | | | | | | Total Investments | | $ | 633,835 | | $ | 650,107 | | | 100.00 | % | | | | | | | | | | | | | | | | | | | | | | | | | | | | | | | | | | | | |
- (1)
- At December 31, 2013, New Mountain Finance Corporation's only investment was its investment in New Mountain Finance Holdings, L.L.C. Refer below for New Mountain Finance Holdings, L.L.C.'s Consolidated Schedule of Investments as of December 31, 2013.
New Mountain Finance Holdings, L.L.C.
Consolidated Schedule of Investments
December 31, 2013
(in thousands, except shares)
| | | | | | | | | | | | | | | | | | | | Portfolio Company, Location and Industry(1) | | Type of
Investment | | Interest Rate | | Maturity
Date | | Principal
Amount,
Par Value
or Shares | | Cost | | Fair Value | | Percent of
Members'
Capital | |
|---|
Funded Debt Investments—Bermuda | | | | | | | | | | | | | | | | | | | | Stratus Technologies Bermuda Holdings Ltd.(4)** | | | | | | | | | | | | | | | | | | | | Stratus Technologies Bermuda Ltd. / Stratus Technologies, Inc. | | | | | | | | | | | | | | | | | | | | Information Technology | | First lien(2)(7) | | 12.00% | | 3/29/2015 | | $ | 6,497 | | $ | 6,335 | | $ | 6,529 | | | 0.95 | % | | | | | | | | | | | | | | | | | | | | | | Total Funded Debt Investments—Bermuda | | | | | | | | $ | 6,497 | | $ | 6,335 | | $ | 6,529 | | | 0.95 | % | | | | | | | | | | | | | | | | | | | | | | Funded Debt Investments—Cayman Islands | | | | | | | | | | | | | | | | | | | | Pinnacle Holdco S.à r.l. / Pinnacle (US) Acquisition Co Limited** | | | | | | | | | | | | | | | | | | | | Software | | Second lien(2) | | 10.50% (Base Rate + 9.25%) | | 7/30/2020 | | $ | 30,000 | | $ | 29,472 | | $ | 30,362 | | | 4.41 | % | | | | | | | | | | | | | | | | | | | | | | Total Funded Debt Investments—Cayman Islands | | | | | | | | $ | 30,000 | | $ | 29,472 | | $ | 30,362 | | | 4.41 | % | | | | | | | | | | | | | | | | | | | | | | Funded Debt Investments—United States | | | | | | | | | | | | | | | | | | | | McGraw-Hill Global Education Holdings, LLC | | | | | | | | | | | | | | | | | | | | Education | | First lien(2) | | 9.75% | | 4/1/2021 | | $ | 24,500 | | $ | 24,348 | | $ | 27,195 | | | | | | | First lien(3) | | 9.00% (Base Rate + 7.75%) | | 3/22/2019 | | | 17,850 | | | 17,367 | | | 18,225 | | | | | | | | | | | | | | | | | | | | | | | | | | | | | | | | | | | 42,350 | | | 41,715 | | | 45,420 | | | 6.60 | % | | | | | | | | | | | | | | | | | | | | | | Deltek, Inc. | | | | | | | | | | | | | | | | | | | | Software | | Second lien(2) | | 10.00% (Base Rate + 8.75%) | | 10/10/2019 | | | 41,000 | | | 40,977 | | | 41,820 | | | 6.07 | % | Global Knowledge Training LLC | | | | | | | | | | | | | | | | | | | | Education | | Second lien(2) | | 11.00% (Base Rate + 9.75%) | | 10/21/2018 | | | 41,450 | | | 41,070 | | | 41,450 | | | 6.02 | % | UniTek Global Services, Inc. | | | | | | | | | | | | | | | | | | | | Business Services | | First lien(2) | | 15.00% (Base Rate + 9.50% + 4.00% PIK)* | | 4/15/2018 | | | 26,382 | | | 25,508 | | | 26,382 | | | | | | | First lien(2) | | 15.00% (Base Rate + 9.50% + 4.00% PIK)* | | 4/15/2018 | | | 6,387 | | | 6,176 | | | 6,387 | | | | | | | First lien(2) | | 15.00% (Base Rate + 9.50% + 4.00% PIK)* | | 4/15/2018 | | | 5,309 | | | 5,133 | | | 5,309 | | | | | | | | | | | | | | | | | | | | | | | | | | | | | | | | | | | 38,078 | | | 36,817 | | | 38,078 | | | 5.53 | % | | | | | | | | | | | | | | | | | | | | | | Edmentum, Inc.(fka Plato, Inc.) | | | | | | | | | | | | | | | | | | | | Education | | First lien(3) | | 5.50% (Base Rate + 4.50%) | | 5/17/2018 | | | 6,433 | | | 6,240 | | | 6,465 | | | | | | | Second lien(2) | | 11.25% (Base Rate + 9.75%) | | 5/17/2019 | | | 31,150 | | | 30,685 | | | 31,578 | | | | | | | | | | | | | | | | | | | | | | | | | | | | | | | | | | | 37,583 | | | 36,925 | | | 38,043 | | | 5.52 | % | | | | | | | | | | | | | | | | | | | | | | SRA International, Inc. | | | | | | | | | | | | | | | | | | | | Federal Services | | First lien(2) | | 6.50% (Base Rate + 5.25%) | | 7/20/2018 | | | 34,750 | | | 33,784 | | | 34,475 | | | 5.01 | % | Kronos Incorporated | | | | | | | | | | | | | | | | | | | | Software | | Second lien(2) | | 9.75% (Base Rate + 8.50%) | | 4/30/2020 | | | 31,341 | | | 31,055 | | | 32,542 | | | 4.73 | % |
The accompanying notes are an integral part of these consolidated financial statements.
Table of Contents
New Mountain Finance Holdings, L.L.C.
Consolidated Schedule of Investments (Continued) December 31, 2013 (in thousands, except shares) | | | | | | | | | | | | | | | | | | | | Portfolio Company, Location and Industry(1) | | Type of
Investment | | Interest Rate | | Maturity
Date | | Principal
Amount,
Par Value
or Shares | | Cost | | Fair Value | | Percent of
Members'
Capital | |
|---|
Rocket Software, Inc. | | | | | | | | | | | | | | | | | | | | Software | | Second lien(2) | | 10.25% (Base Rate + 8.75%) | | 2/8/2019 | | $ | 30,875 | | $ | 30,731 | | $ | 31,029 | | | 4.51 | % | Novell, Inc. (fka Attachmate Corporation, NetIQ Corporation) | | | | | | | | | | | | | | | | | | | | Software | | First lien(3) | | 7.25% (Base Rate + 5.75%) | | 11/22/2017 | | | 6,951 | | | 6,847 | | | 7,080 | | | | | | | Second lien(2) | | 11.00% (Base Rate + 9.50%) | | 11/22/2018 | | | 23,353 | | | 22,780 | | | 22,876 | | | | | | | | | | | | | | | | | | | | | | | | | | | | | | | | | | | 30,304 | | | 29,627 | | | 29,956 | | | 4.35 | % | | | | | | | | | | | | | | | | | | | | | | JHCI Acquisition, Inc. | | | | | | | | | | | | | | | | | | | | Distribution & Logistics | | First lien(3) | | 7.00% (Base Rate + 5.75%) | | 7/11/2019 | | | 19,536 | | | 19,262 | | | 19,548 | | | | | | | Second lien(3) | | 11.00% (Base Rate + 9.75%) | | 7/11/2020 | | | 10,000 | | | 9,705 | | | 9,898 | | | | | | | | | | | | | | | | | | | | | | | | | | | | | | | | | | | 29,536 | | | 28,967 | | | 29,446 | | | 4.28 | % | | | | | | | | | | | | | | | | | | | | | | CompassLearning, Inc.(12) | | | | | | | | | | | | | | | | | | | | Education | | First lien(2) | | 8.00% (Base Rate + 6.75%) | | 11/26/2018 | | | 30,000 | | | 29,261 | | | 29,250 | | | 4.25 | % | Transtar Holding Company | | | | | | | | | | | | | | | | | | | | Distribution & Logistics | | Second lien(2) | | 9.75% (Base Rate + 8.50%) | | 10/9/2019 | | | 28,300 | | | 27,842 | | | 27,168 | | | 3.95 | % | KeyPoint Government Solutions, Inc. | | | | | | | | | | | | | | | | | | | | Federal Services | | First lien(3) | | 7.25% (Base Rate + 6.00%) | | 11/13/2017 | | | 16,784 | | | 16,448 | | | 16,616 | | | | | | | First lien(2) | | 7.25% (Base Rate + 6.00%) | | 11/13/2017 | | | 10,116 | | | 9,953 | | | 10,015 | | | | | | | | | | | | | | | | | | | | | | | | | | | | | | | | | | | 26,900 | | | 26,401 | | | 26,631 | | | 3.87 | % | | | | | | | | | | | | | | | | | | | | | | Meritas Schools Holdings, LLC | | | | | | | | | | | | | | | | | | | | Education | | First lien(3) | | 7.00% (Base Rate + 5.75%) | | 6/25/2019 | | | 19,950 | | | 19,763 | | | 20,087 | | | | | | | First lien(2) | | 7.00% (Base Rate + 5.75%) | | 6/25/2019 | | | 5,920 | | | 5,865 | | | 5,961 | | | | | | | | | | | | | | | | | | | | | | | | | | | | | | | | | | | 25,870 | | | 25,628 | | | 26,048 | | | 3.78 | % | | | | | | | | | | | | | | | | | | | | | | Sierra Hamilton LLC / Sierra Hamilton Finance, Inc. | | | | | | | | | | | | | | | | | | | | Energy | | First lien(2) | | 12.25% | | 12/15/2018 | | | 25,000 | | | 25,000 | | | 25,000 | | | 3.63 | % | Permian Tank & Manufacturing, Inc. | | | | | | | | | | | | | | | | | | | | Energy | | First lien(2) | | 10.50% | | 1/15/2018 | | | 24,500 | | | 24,757 | | | 24,255 | | | 3.52 | % | Aderant North America, Inc. | | | | | | | | | | | | | | | | | | | | Software | | Second lien(2) | | 10.00% (Base Rate + 8.75%) | | 6/20/2019 | | | 22,500 | | | 22,201 | | | 23,203 | | | 3.37 | % | YP Holdings LLC(8) | | | | | | | | | | | | | | | | | | | | YP LLC | | | | | | | | | | | | | | | | | | | | Media | | First lien(2) | | 8.04% (Base Rate + 6.71%) | | 6/4/2018 | | | 22,400 | | | 21,892 | | | 22,722 | | | 3.30 | % | McGraw-Hill School Education Holdings, LLC | | | | | | | | | | | | | | | | | | | | Education | | First lien(3) | | 6.25% (Base Rate + 5.00%) | | 12/18/2019 | | | 13,000 | | | 12,870 | | | 12,870 | | | | | | | First lien(2) | | 6.25% (Base Rate + 5.00%) | | 12/18/2019 | | | 9,000 | | | 8,910 | | | 8,910 | | | | | | | | | | | | | | | | | | | | | | | | | | | | | | | | | | | 22,000 | | | 21,780 | | | 21,780 | | | 3.16 | % | | | | | | | | | | | | | | | | | | | | | | Aspen Dental Management, Inc. | | | | | | | | | | | | | | | | | | | | Healthcare Services | | First lien(3) | | 7.00% (Base Rate + 5.50%) | | 10/6/2016 | | | 21,077 | | | 20,820 | | | 20,813 | | | 3.02 | % | LM U.S. Member LLC (and LM U.S. Corp Acquisition Inc.) | | | | | | | | | | | | | | | | | | | | Business Services | | Second lien(3) | | 9.50% (Base Rate + 8.25%) | | 10/26/2020 | | | 20,000 | | | 19,731 | | | 20,308 | | | 2.95 | % | Envision Acquisition Company, LLC | | | | | | | | | | | | | | | | | | | | Healthcare Services | | Second lien(2) | | 9.75% (Base Rate + 8.75%) | | 11/4/2021 | | | 20,000 | | | 19,605 | | | 20,075 | | | 2.91 | % | ARSloane Acquisition, LLC | | | | | | | | | | | | | | | | | | | | Business Services | | First lien(3) | | 7.50% (Base Rate + 6.25%) | | 10/1/2019 | | | 19,950 | | | 19,754 | | | 19,992 | | | 2.90 | % | eResearchTechnology, Inc. | | | | | | | | | | | | | | | | | | | | Healthcare Services | | First lien(3) | | 6.00% (Base Rate + 4.75%) | | 5/2/2018 | | | 19,750 | | | 19,047 | | | 19,874 | | | 2.89 | % | Distribution International, Inc. | | | | | | | | | | | | | | | | | | | | Distribution & Logistics | | First lien(2) | | 7.50% (Base Rate + 6.50%) | | 7/16/2019 | | | 19,900 | | | 19,527 | | | 19,813 | | | 2.88 | % | First American Payment Systems, L.P. | | | | | | | | | | | | | | | | | | | | Business Services | | Second lien(3) | | 10.75% (Base Rate + 9.50%) | | 4/12/2019 | | | 20,000 | | | 19,654 | | | 19,800 | | | 2.88 | % | Merrill Communications LLC | | | | | | | | | | | | | | | | | | | | Business Services | | First lien(3) | | 7.25% (Base Rate + 6.25%) | | 3/8/2018 | | | 19,425 | | | 19,246 | | | 19,759 | | | 2.87 | % | Insight Pharmaceuticals LLC | | | | | | | | | | | | | | | | | | | | Healthcare Products | | Second lien(3) | | 13.25% (Base Rate + 11.75%) | | 8/25/2017 | | | 19,310 | | | 18,766 | | | 19,021 | | | 2.76 | % | St. George's University Scholastic Services LLC | | | | | | | | | | | | | | | | | | | | Education | | First lien(3) | | 8.50% (Base Rate + 7.00%) | | 12/20/2017 | | | 17,379 | | | 17,082 | | | 17,530 | | | 2.55 | % | Sotera Defense Solutions, Inc. (Global Defense Technology & Systems, Inc.) | | | | | | | | | | | | | | | | | | | | Federal Services | | First lien(3) | | 7.50% (Base Rate + 6.00%) | | 4/21/2017 | | | 18,316 | | | 18,127 | | | 16,118 | | | 2.34 | % | Confie Seguros Holding II Co. | | | | | | | | | | | | | | | | | | | | Consumer Services | | Second lien(3) | | 10.25% (Base Rate + 9.00%) | | 5/8/2019 | | | 14,886 | | | 14,762 | | | 15,034 | | | 2.18 | % |
The accompanying notes are an integral part of these consolidated financial statements.
Table of Contents
New Mountain Finance Holdings, L.L.C.
Consolidated Schedule of Investments (Continued) December 31, 2013 (in thousands, except shares) | | | | | | | | | | | | | | | | | | | | Portfolio Company, Location and Industry(1) | | Type of
Investment | | Interest Rate | | Maturity
Date | | Principal
Amount,
Par Value
or Shares | | Cost | | Fair Value | | Percent of
Members'
Capital | |
|---|
OpenLink International, Inc. | | | | | | | | | | | | | | | | | | | | Software | | First lien(3) | | 7.75% (Base Rate + 6.25%) | | 10/30/2017 | | $ | 14,700 | | $ | 14,496 | | $ | 14,774 | | | 2.15 | % | Smile Brands Group Inc. | | | | | | | | | | | | | | | | | | | | Healthcare Services | | First lien(3) | | 7.50% (Base Rate + 6.25%) | | 8/16/2019 | | | 14,464 | | | 14,261 | | | 14,307 | | | 2.08 | % | Brock Holdings III, Inc. | | | | | | | | | | | | | | | | | | | | Industrial Services | | Second lien(2) | | 10.00% (Base Rate + 8.25%) | | 3/16/2018 | | | 14,000 | | | 13,858 | | | 14,263 | | | 2.07 | % | Vision Solutions, Inc. | | | | | | | | | | | | | | | | | | | | Software | | Second lien(2) | | 9.50% (Base Rate + 8.00%) | | 7/23/2017 | | | 14,000 | | | 13,957 | | | 14,140 | | | 2.05 | % | Packaging Coordinators, Inc.(10) | | | | | | | | | | | | | | | | | | | | Healthcare Products | | Second lien(2) | | 9.50% (Base Rate + 8.25%) | | 11/10/2020 | | | 14,000 | | | 13,868 | | | 14,088 | | | 2.05 | % | Lonestar Intermediate Super Holdings, LLC | | | | | | | | | | | | | | | | | | | | Business Services | | Subordinated(2) | | 11.00% (Base Rate + 9.50%) | | 9/2/2019 | | | 12,000 | | | 11,701 | | | 12,419 | | | 1.80 | % | Van Wagner Communications, LLC | | | | | | | | | | | | | | | | | | | | Media | | First lien(2) | | 6.25% (Base Rate + 5.00%) | | 8/3/2018 | | | 11,761 | | | 11,583 | | | 11,997 | | | 1.74 | % | Vertafore, Inc. | | | | | | | | | | | | | | | | | | | | Software | | Second lien(2) | | 9.75% (Base Rate + 8.25%) | | 10/29/2017 | | | 10,000 | | | 9,937 | | | 10,198 | | | 1.48 | % | TransFirst Holdings, Inc. | | | | | | | | | | | | | | | | | | | | Business Services | | Second lien(3) | | 11.00% (Base Rate + 9.75%) | | 6/27/2018 | | | 10,000 | | | 9,741 | | | 10,138 | | | 1.47 | % | MailSouth, Inc. | | | | | | | | | | | | | | | | | | | | Media | | First lien(3) | | 6.76% (Base Rate + 4.96%) | | 12/14/2016 | | | 9,410 | | | 9,333 | | | 9,269 | | | 1.35 | % | Vitera Healthcare Solutions, LLC | | | | | | | | | | | | | | | | | | | | Software | | First lien(3) | | 6.00% (Base Rate + 5.00%) | | 11/4/2020 | | | 2,000 | | | 1,980 | | | 2,000 | | | | | | | Second lien(2) | | 9.25% (Base Rate + 8.25%) | | 11/4/2021 | | | 7,000 | | | 6,897 | | | 7,070 | | | | | | | | | | | | | | | | | | | | | | | | | | | | | | | | | | | 9,000 | | | 8,877 | | | 9,070 | | | 1.32 | % | | | | | | | | | | | | | | | | | | | | | | Harley Marine Services, Inc. | | | | | | | | | | | | | | | | | | | | Distribution & Logistics | | Second lien(2) | | 10.50% (Base Rate + 9.25%) | | 12/20/2019 | | | 9,000 | | | 8,820 | | | 8,820 | | | 1.28 | % | Consona Holdings, Inc. | | | | | | | | | | | | | | | | | | | | Software | | First lien(3) | | 7.25% (Base Rate + 6.00%) | | 8/6/2018 | | | 8,394 | | | 8,326 | | | 8,457 | | | 1.23 | % | Physio-Control International, Inc. | | | | | | | | | | | | | | | | | | | | Healthcare Products | | First lien(2) | | 9.88% | | 1/15/2019 | | | 6,651 | | | 6,651 | | | 7,482 | | | 1.09 | % | Virtual Radiologic Corporation | | | | | | | | | | | | | | | | | | | | Healthcare Information Technology | | First lien(3) | | 7.25% (Base Rate + 5.50%) | | 12/22/2016 | | | 13,563 | | | 13,454 | | | 7,324 | | | 1.06 | % | Alion Science and Technology Corporation | | | | | | | | | | | | | | | | | | | | Federal Services | | First lien(2)(7) | | 12.00% (10.00% + 2.00% PIK)* | | 11/1/2014 | | | 6,447 | | | 6,360 | | | 6,570 | | | 0.95 | % | Immucor, Inc. | | | | | | | | | | | | | | | | | | | | Healthcare Services | | Subordinated(2)(7) | | 11.13% | | 8/15/2019 | | | 5,000 | | | 4,950 | | | 5,650 | | | 0.82 | % | Learning Care Group (US), Inc. | | | | | | | | | | | | | | | | | | | | Education | | Subordinated(2) | | 15.00% PIK* | | 5/8/2020 | | | 4,371 | | | 4,253 | | | 4,371 | | | | | | | Subordinated(2) | | 15.00% PIK* | | 5/8/2020 | | | 800 | | | 746 | | | 800 | | | | | | | | | | | | | | | | | | | | | | | | | | | | | | | | | | | 5,171 | | | 4,999 | | | 5,171 | | | 0.75 | % | | | | | | | | | | | | | | | | | | | | | | Education Management LLC** | | | | | | | | | | | | | | | | | | | | Education | | First lien(3) | | 8.25% (Base Rate + 7.00%) | | 3/30/2018 | | | 5,003 | | | 4,888 | | | 5,028 | | | 0.73 | % | GCA Services Group, Inc. | | | | | | | | | | | | | | | | | | | | Business Services | | Second lien(2) | | 9.25% (Base Rate + 8.00%) | | 11/1/2020 | | | 4,000 | | | 3,964 | | | 4,064 | | | 0.59 | % | Sophia Holding Finance LP / Sophia Holding Finance Inc. | | | | | | | | | | | | | | | | | | | | Software | | Subordinated(2) | | 9.63% | | 12/1/2018 | | | 3,500 | | | 3,502 | | | 3,623 | | | 0.53 | % | ATI Acquisition Company (fka Ability Acquisition, Inc.)(11) | | | | | | | | | | | | | | | | | | | | Education | | First lien(2) | | 17.25% (Base Rate + 10.00% + 4.00% PIK)(5)* | | 6/30/2012—Past Due | | | 1,665 | | | 1,434 | | | 233 | | | | | | | First lien(2) | | 17.25% (Base Rate + 10.00% + 4.00% PIK)(5)* | | 6/30/2012—Past Due | | | 103 | | | 94 | | | 103 | | | | | | | | | | | | | | | | | | | | | | | | | | | | | | | | | | | 1,768 | | | 1,528 | | | 336 | | | 0.05 | % | | | | | | | | | | | | | | | | | | | | | | Total Funded Debt Investments—United States | | | | | | | | $ | 1,016,562 | | $ | 1,001,605 | | $ | 1,013,641 | | | 147.22 | % | | | | | | | | | | | | | | | | | | | | | | Total Funded Debt Investments | | | | | | | | $ | 1,053,059 | | $ | 1,037,412 | | $ | 1,050,532 | | | 152.58 | % | | | | | | | | | | | | | | | | | | | | | |
The accompanying notes are an integral part of these consolidated financial statements.
Table of Contents
New Mountain Finance Holdings, L.L.C.
Consolidated Schedule of Investments (Continued) December 31, 2013 (in thousands, except shares) | | | | | | | | | | | | | | | | | | | | Portfolio Company, Location and Industry(1) | | Type of
Investment | | Interest Rate | | Maturity
Date | | Principal
Amount,
Par Value
or Shares | | Cost | | Fair Value | | Percent of
Members'
Capital | |
|---|
Equity—Bermuda | | | | | | | | | | | | | | | | | | | | Stratus Technologies Bermuda Holdings Ltd.(4)** | | | | | | | | | | | | | | | | | | | | Information Technology | | Ordinary shares(2) | | — | | — | | | 156,247 | | $ | 65 | | $ | 46 | | | | | | | Preferred shares(2) | | — | | — | | | 35,558 | | | 15 | | | 10 | | | | | | | | | | | | | | | | | | | | | | | | | | | | | | | | | | | | | | 80 | | | 56 | | | 0.01 | % | | | | | | | | | | | | | | | | | | | | | | Total Shares—Bermuda | | | | | | | | | | | $ | 80 | | $ | 56 | | | 0.01 | % | | | | | | | | | | | | | | | | | | | | | | Equity—United States | | | | | | | | | | | | | | | | | | | | Crowley Holdings Preferred, LLC | | | | | | | | | | | | | | | | | | | | Distribution & Logistics | | Preferred shares(2) | | 12.00% (10.00% + 2.00% PIK)* | | — | | | 35,000 | | $ | 35,000 | | $ | 35,000 | | | 5.08 | % | Black Elk Energy Offshore Operations, LLC | | | | | | | | | | | | | | | | | | | | Energy | | Preferred shares(2) | | 17.00% | | — | | | 20,000,000 | | | 20,000 | | | 20,000 | | | 2.91 | % | Global Knowledge Training LLC | | | | | | | | | | | | | | | | | | | | Education | | Ordinary shares(2) | | — | | — | | | 2 | | | — | | | 3 | | | | | | | Preferred shares(2) | | — | | — | | | 2,423 | | | — | | | 3,006 | | | | | | | | | | | | | | | | | | | | | | | | | | | | | | | | | | | | | | — | | | 3,009 | | | 0.44 | % | | | | | | | | | | | | | | | | | | | | | | Packaging Coordinators, Inc.(10) | | | | | | | | | | | | | | | | | | | | Packaging Coordinators Holdings, LLC | | | | | | | | | | | | | | | | | | | | Healthcare Products | | Ordinary shares(2) | | — | | — | | | 19,427 | | | 1,000 | | | 1,181 | | | 0.17 | % | Ancora Acquisition LLC(11) | | | | | | | | | | | | | | | | | | | | Education | | Preferred shares(2) | | — | | — | | | 372 | | | 83 | | | 83 | | | 0.01 | % | | | | | | | | | | | | | | | | | | | | | | Total Shares—United States | | | | | | | | | | | $ | 56,083 | | $ | 59,273 | | | 8.61 | % | | | | | | | | | | | | | | | | | | | | | | Total Shares | | | | | | | | | | | $ | 56,163 | | $ | 59,329 | | | 8.62 | % | | | | | | | | | | | | | | | | | | | | | | Warrants—United States | | | | | | | | | | | | | | | | | | | | Learning Care Group (US), Inc. | | | | | | | | | | | | | | | | | | | | Education | | Warrants(2) | | — | | — | | | 844 | | $ | 194 | | $ | 503 | | | | | | | Warrants(2) | | — | | — | | | 3,589 | | | 61 | | | 2,136 | | | | | | | | | | | | | | | | | | | | | | | | | | | | | | | | | | | | | | 255 | | | 2,639 | | | 0.38 | % | | | | | | | | | | | | | | | | | | | | | | YP Holdings LLC(8) | | | | | | | | | | | | | | | | | | | | YP Equity Investors LLC | | | | | | | | | | | | | | | | | | | | Media | | Warrants(2) | | — | | — | | | 5 | | | — | | | 1,944 | | | 0.28 | % | UniTek Global Services, Inc. | | | | | | | | | | | | | | | | | | | | Business Services | | Warrants(2) | | — | | — | | | 1,014,451 | (6) | | 1,449 | | | 1,694 | | | 0.25 | % | Storapod Holding Company, Inc. | | | | | | | | | | | | | | | | | | | | Consumer Services | | Warrants(2) | | — | | — | | | 360,129 | | | 156 | | | 594 | | | 0.09 | % | Alion Science and Technology Corporation | | | | | | | | | | | | | | | | | | | | Federal Services | | Warrants(2) | | — | | — | | | 6,000 | | | 293 | | | 94 | | | 0.01 | % | Ancora Acquisition LLC(11) | | | | | | | | | | | | | | | | | | | | Education | | Warrants(2) | | — | | — | | | 20 | | | — | | | — | | | — | % | | | | | | | | | | | | | | | | | | | | | | Total Warrants—United States | | | | | | | | | | | $ | 2,153 | | $ | 6,965 | | | 1.01 | % | | | | | | | | | | | | | | | | | | | | | | Total Funded Investments | | | | | | | | | | | $ | 1,095,728 | | $ | 1,116,826 | | | 162.21 | % | | | | | | | | | | | | | | | | | | | | | | Unfunded Debt Investments—United States | | | | | | | | | | | | | | | | | | | | Aspen Dental Management, Inc. | | | | | | | | | | | | | | | | | | | | Healthcare Services | | First lien(2)(9)—Undrawn | | — | | 4/6/2016 | | $ | 5,000 | | $ | (388 | ) | $ | (388 | ) | | (0.06 | )% | Advantage Sales & Marketing Inc. | | | | | | | | | | | | | | | | | | | | Business Services | | First lien(2)(9)—Undrawn | | — | | 12/17/2015 | | | 10,500 | | | (1,260 | ) | | (787 | ) | | (0.11 | )% | | | | | | | | | | | | | | | | | | | | | | Total Unfunded Debt Investments | | | | | | | | $ | 15,500 | | $ | (1,648 | ) | $ | (1,175 | ) | | (0.17 | )% | | | | | | | | | | | | | | | | | | | | | | Total Investments | | | | | | | | | | | $ | 1,094,080 | | $ | 1,115,651 | | | 162.04 | % | | | | | | | | | | | | | | | | | | | | | |
- (1)
- New Mountain Finance Holdings, L.L.C. ("NMF Holdings") generally acquires its investments in private transactions exempt from registration under the Securities Act of 1933, as amended (the "Securities Act"). These investments are generally subject to certain limitations on resale, and may be deemed to be "restricted securities" under the Securities Act.
The accompanying notes are an integral part of these consolidated financial statements.
Table of Contents
New Mountain Finance Holdings, L.L.C.
Consolidated Schedule of Investments (Continued) December 31, 2013 (in thousands, except shares) - (2)
- Investment is pledged as collateral for the Holdings Credit Facility, a revolving credit facility among NMF Holdings as the Borrower and Collateral Administrator, Wells Fargo Securities,
L.L.C.LLC as the Administrative Agent, and Wells Fargo Bank, National Association, as the Collateral Custodian. See Note 7,Borrowing FacilitiesBorrowings, for details.
- (3)
- Investment is pledged as collateral for the SLF Credit Facility, a revolving credit facility among New Mountain Finance SPV Funding, L.L.C. as the Borrower,
the Operating CompanyNMF Holdings as the Collateral Administrator, Wells Fargo Securities, L.L.C.LLC as the Administrative Agent, and Wells Fargo Bank, National Association, as the Collateral Custodian. See Note 7,Borrowing FacilitiesBorrowings, for details.
- (4)
The Operating CompanyNMF Holdings holds investments in two related entities of Stratus Technologies Bermuda Holdings, Ltd. ("Stratus Holdings"). The Operating CompanyNMF Holdings directly holds ordinary and preferred equity in Stratus Holdings and has a credit investment in the joint issuers of Stratus Technologies Bermuda Ltd. ("Stratus Bermuda") and Stratus Technologies, Inc. ("Stratus U.S."), collectively, the "Stratus Notes". Stratus U.S. is a wholly-owned subsidiary of Stratus Bermuda, which in turn is a wholly-owned subsidiary of Stratus Holdings. Stratus Holdings is the parent guarantor of the credit investment of the Stratus Notes.
- (5)
- Investment is on non-accrual status.
The accompanying notes are an integral part of these consolidated financial statements.
Table of Contents
New Mountain Finance Holdings, L.L.C.
Consolidated Schedule of Investments (Continued)
December 31, 2013
(in thousands, except shares)
- (6)
The Operating CompanyNMF Holdings holds 1,014,451 warrants in UniTek Global Services, Inc., which represents a 4.46% equity ownership on a fully diluted basis.
- (7)
- Securities are registered under the Securities Act.
- (8)
The Operating CompanyNMF Holdings holds investments in two related entities of YP Holdings LLC. The Operating CompanyNMF Holdings directly holds warrants to purchase a 4.96% membership interest of YP Equity Investors, LLC (which at closing represented an indirect 1.0% equity interest in YP Holdings LLC) and holds an investment in the Term Loan B loans issued by YP LLC, a subsidiary of YP Holdings LLC.
- (9)
- Par Value amounts represent the drawn or undrawn (as indicated in type of investment) portion of revolving credit facilities. Cost amounts represent the cash received at settlement date net the impact of paydowns and cash paid for drawn revolvers.
- (10)
The Operating CompanyNMF Holdings holds investments in Packaging Coordinators, Inc. and one related entity of Packaging Coordinators, Inc. The Operating CompanyNMF Holdings has a credit investment in Packaging Coordinators, Inc. and holds ordinary equity in Packaging Coordinators Holdings, LLC, a wholly-owned subsidiary of Packaging Coordinators, Inc.Inc
- (11)
The Operating CompanyNMF Holdings holds investments in ATI Acquisition Company and Ancora Acquisition LLC. The Operating CompanyNMF Holdings has credit investments in ATI Acquisition Company and preferred equity and warrants to purchase units of common membership interests of Ancora Acquisition LLC. The Operating CompanyNMF Holdings received its investments in Ancora Acquisition LLC as a result of its investments in ATI Acquisition Company.
- (12)
The Operating CompanyNMF Holdings holds an investment in CompassLearning, Inc. that is structured as a first lien last out term loan.
- *
- All or a portion of interest contains payments-in-kind ("PIK").
- **
- Indicates assets that
the Operating CompanyNMF Holdings deems to be "non-qualifying assets" under Section 55(a) of the Investment Company Act of 1940, as amended. Qualifying assets must represent at least 70.00% of the Operating Company'sNMF Holdings' total assets at the time of acquisition of any additional non-qualifying assets.
The accompanying notes are an integral part of these consolidated financial statements.
Table of Contents
New Mountain Finance Holdings, L.L.C.
Consolidated Schedule of Investments (Continued)
December 31, 2013
| | | | |
| | December 31, 2013 | |
|---|
Investment Type
| | Percent of
Total Investments
at Fair Value | |
|---|
First lien
| | | 49.62 | % | Second lien
| | | 42.03 | % | Subordinated
| | | 2.41 | % | Equity and other
| | | 5.94 | % | | | | | | | | | | Total investments
| | | 100.00 | % | | | | | | | | | | | | | | | | | | |
| | | | |
| | December 31, 2013 | |
|---|
Industry Type
| | Percent of
Total Investments
at Fair Value | |
|---|
Software
| | | 22.33 | % | Education
| | | 21.13 | % | Business Services
| | | 13.04 | % | Distribution & Logistics
| | | 10.78 | % | Federal Services
| | | 7.52 | % | Healthcare Services
| | | 7.20 | % | Energy
| | | 6.21 | % | Media
| | | 4.12 | % | Healthcare Products
| | | 3.74 | % | Consumer Services
| | | 1.40 | % | Industrial Services
| | | 1.28 | % | Healthcare Information Technology
| | | 0.66 | % | Information Technology
| | | 0.59 | % | | | | | | | | | | Total investments
| | | 100.00 | % | | | | | | | | | | | | | | | | | | |
| | | | |
| | December 31, 2013 | |
|---|
Interest Rate Type
| | Percent of
Total Investments
at Fair Value | |
|---|
Floating rates
| | | 85.08 | % | Fixed rates
| | | 14.92 | % | | | | | | | | | | Total investments
| | | 100.00 | % | | | | | | | | | | | | | | | | | | |
The accompanying notes are an integral part of these consolidated financial statements.
Table of Contents
New Mountain Finance Holdings, L.L.C.
Consolidated Schedule of Investments (Continued)
December 31, 2012
(in thousands, except shares)
| | | | | | | | | | | | | | | | | | | | | Portfolio Company, Location and Industry(1) | | Type of
Investment | | Interest Rate | | Maturity
Date | | Principal
Amount,
Par Value
or Shares | | Cost | | Fair Value | | Percent of
Members'
Capital | |
|---|
Funded Debt Investments—Bermuda | | | | | | | | | | | | | | | | | | | | | Stratus Technologies Bermuda Holdings Ltd.(4)** | | | | | | | | | | | | | | | | | | | | | Stratus Technologies Bermuda Ltd. / Stratus Technologies, Inc. | | | | | | | | | | | | | | | | | | | | | Information Technology | | First lien(2)(7) | | 12.00% | | | 3/29/2015 | | $ | 6,664 | | $ | 6,396 | | $ | 6,631 | | | 1.16 | % | | | | | | | | | | | | | | | | | | | | | | | | | | | | | | | | | | | | | | | | | | Total Funded Debt Investments—Bermuda | | | | | | | | | $ | 6,664 | | $ | 6,396 | | $ | 6,631 | | | 1.16 | % | | | | | | | | | | | | | | | | | | | | | | | | | | | | | | | | | | | | | | | | | | Funded Debt Investments—Cayman Islands | | | | | | | | | | | | | | | | | | | | | Pinnacle Holdco S.à r.l. / Pinnacle (US) Acquisition Co Limited** | | | | | | | | | | | | | | | | | | | | | Software | | First lien(3) | | 6.50% (Base Rate + 5.25%) | | | 7/30/2019 | | $ | 2,992 | | $ | 2,971 | | $ | 2,999 | | | | | | | Second lien(2) | | 10.50% (Base Rate + 9.25%) | | | 7/30/2020 | | | 30,000 | | | 29,420 | | | 30,488 | | | | | | | | | | | | | | | | | | | | | | | | | | | | | | | | | | | | | | | | | | | | | | | | | | | | | | | | 32,992 | | | 32,391 | | | 33,487 | | | 5.88 | % | | | | | | | | | | | | | | | | | | | | | | | | | | | | | | | | | | | | | | | | | | Total Funded Debt Investments—Cayman Islands | | | | | | | | | $ | 32,992 | | $ | 32,391 | | $ | 33,487 | | | 5.88 | % | | | | | | | | | | | | | | | | | | | | | | | | | | | | | | | | | | | | | | | | | | Funded Debt Investments—United Kingdom | | | | | | | | | | | | | | | | | | | | | Magic Newco, LLC** | | | | | | | | | | | | | | | | | | | | | Software | | First lien(3) | | 7.25% (Base Rate + 6.00%) | | | 12/12/2018 | | $ | 14,963 | | $ | 14,543 | | $ | 15,105 | | | 2.65 | % | | | | | | | | | | | | | | | | | | | | | | | | | | | | | | | | | | | | | | | | | | Total Funded Debt Investments—United Kingdom | | | | | | | | | $ | 14,963 | | $ | 14,543 | | $ | 15,105 | | | 2.65 | % | | | | | | | | | | | | | | | | | | | | | | | | | | | | | | | | | | | | | | | | | | Funded Debt Investments—United States | | | | | | | | | | | | | | | | | | | | | Edmentum, Inc.(fka Plato, Inc.) | | | | | | | | | | | | | | | | | | | | | Education | | First lien(3) | | 7.50% (Base Rate + 6.00%) | | | 5/17/2018 | | $ | 11,700 | | $ | 11,378 | | $ | 11,744 | | | | | | | Second lien(2) | | 11.25% (Base Rate + 9.75%) | | | 5/17/2019 | | | 29,150 | | | 28,604 | | | 28,567 | | | | | | | | | | | | | | | | | | | | | | | | | | | | | | | | | | | | | | | | | | | | | | | | | | | | | | | | 40,850 | | | 39,982 | | | 40,311 | | | 7.07 | % | | | | | | | | | | | | | | | | | | | | | | | | | | | | | | | | | | | | | | | | | | Novell, Inc. (fka Attachmate Corporation, NetIQ Corporation) | | | | | | | | | | | | | | | | | | | | | Software | | First lien(3) | | 7.25% (Base Rate + 5.75%) | | | 11/22/2017 | | | 7,700 | | | 7,560 | | | 7,785 | | | | | | | Second lien(2) | | 11.00% (Base Rate + 9.50%) | | | 11/22/2018 | | | 24,000 | | | 23,326 | | | 23,560 | | | | | | | | | | | | | | | | | | | | | | | | | | | | | | | | | | | | | | | | | | | | | | | | | | | | | | | | 31,700 | | | 30,886 | | | 31,345 | | | 5.50 | % | | | | | | | | | | | | | | | | | | | | | | | | | | | | | | | | | | | | | | | | | | Rocket Software, Inc. | | | | | | | | | | | | | | | | | | | | | Software | | Second lien(2) | | 10.25% (Base Rate + 8.75%) | | | 2/8/2019 | | | 30,875 | | | 30,711 | | | 30,933 | | | 5.43 | % | Pharmaceutical Research Associates, Inc. | | | | | | | | | | | | | | | | | | | | | Healthcare Services | | Second lien(2) | | 10.50% (Base Rate + 9.25%) | | | 6/10/2019 | | | 30,000 | | | 29,402 | | | 30,319 | | | 5.32 | % | UniTek Global Services, Inc. | | | | | | | | | | | | | | | | | | | | | Business Services | | First lien(2) | | 9.00% (Base Rate + 7.50%) | | | 4/16/2018 | | | 19,650 | | | 19,202 | | | 19,331 | | | | | | | First lien(2) | | 9.00% (Base Rate + 7.50%) | | | 4/16/2018 | | | 5,970 | | | 5,798 | | | 5,873 | | | | | | | First lien(2) | | 9.00% (Base Rate + 7.50%) | | | 4/16/2018 | | | 4,963 | | | 4,781 | | | 4,882 | | | | | | | | | | | | | | | | | | | | | | | | | | | | | | | | | | | | | | | | | | | | | | | | | | | | | | | | 30,583 | | | 29,781 | | | 30,086 | | | 5.28 | % | | | | | | | | | | | | | | | | | | | | | | | | | | | | | | | | | | | | | | | | | | KeyPoint Government Solutions, Inc. | | | | | | | | | | | | | | | | | | | | | Federal Services | | First lien(3) | | 7.25% (Base Rate + 6.00%) | | | 11/13/2017 | | | 20,000 | | | 19,608 | | | 19,900 | | | | | | | First lien(2) | | 7.25% (Base Rate + 6.00%) | | | 11/13/2017 | | | 10,000 | | | 9,703 | | | 9,950 | | | | | | | | | | | | | | | | | | | | | | | | | | | | | | | | | | | | | | | | | | | | | | | | | | | | | | | | 30,000 | | | 29,311 | | | 29,850 | | | 5.24 | % | | | | | | | | | | | | | | | | | | | | | | | | | | | | | | | | | | | | | | | | | | Global Knowledge Training LLC | | | | | | | | | | | | | | | | | | | | | Education | | First lien(3) | | 6.50% (Base Rate + 4.99%) | | | 4/21/2017 | | | 4,776 | | | 4,718 | | | 4,705 | | | | | | | First lien(3) | | 7.25% (Base Rate + 4.00%) | | | 4/21/2017 | | | 1,174 | | | 1,159 | | | 1,156 | | | | | | | Second lien(2) | | 11.50% (Base Rate + 9.75%) | | | 10/21/2018 | | | 24,250 | | | 23,814 | | | 23,755 | | | | | | | | | | | | | | | | | | | | | | | | | | | | | | | | | | | | | | | | | | | | | | | | | | | | | | | | 30,200 | | | 29,691 | | | 29,616 | | | 5.20 | % | | | | | | | | | | | | | | | | | | | | | | | | | | | | | | | | | | | | | | | | | | Managed Health Care Associates, Inc. | | | | | | | | | | | | | | | | | | | | | Healthcare Services | | First lien(2) | | 3.47% (Base Rate + 3.25%) | | | 8/1/2014 | | | 14,756 | | | 13,240 | | | 14,276 | | | | | | | Second lien(2) | | 6.72% (Base Rate + 6.50%) | | | 2/1/2015 | | | 15,000 | | | 12,790 | | | 14,475 | | | | | | | | | | | | | | | | | | | | | | | | | | | | | | | | | | | | | | | | | | | | | | | | | | | | | | | | 29,756 | | | 26,030 | | | 28,751 | | | 5.05 | % | | | | | | | | | | | | | | | | | | | | | | | | | | | | | | | | | | | | | | | | | | Transtar Holding Company | | | | | | | | | | | | | | | | | | | | | Distribution & Logistics(10) | | Second lien(2) | | 9.75% (Base Rate + 8.50%) | | | 10/9/2019 | | | 28,300 | | | 27,787 | | | 28,654 | | | 5.03 | % | Meritas Schools Holdings, LLC | | | | | | | | | | | | | | | | | | | | | Education | | First lien(3) | | 7.50% (Base Rate + 6.00%) | | | 7/29/2017 | | | 8,150 | | | 8,084 | | | 8,171 | | | | | | | Second lien(2) | | 11.50% (Base Rate + 10.00%) | | | 1/29/2018 | | | 20,000 | | | 19,747 | | | 20,000 | | | | | | | | | | | | | | | | | | | | | | | | | | | | | | | | | | | | | | | | | | | | | | | | | | | | | | | | 28,150 | | | 27,831 | | | 28,171 | | | 4.94 | % | | | | | | | | | | | | | | | | | | | | | | | | | | | | | | | | | | | | | | | | | | Kronos Incorporated | | | | | | | | | | | | | | | | | | | | | Software | | Second lien(2) | | 9.75% (Base Rate + 8.50%) | | | 4/30/2020 | | | 25,000 | | | 24,753 | | | 25,125 | | | 4.41 | % |
The accompanying notes are an integral part of these consolidated financial statements.
Table of Contents
New Mountain Finance Holdings, L.L.C.
Consolidated Schedule of Investments (Continued)
December 31, 2012
(in thousands, except shares)
| | | | | | | | | | | | | | | | | | | | | Portfolio Company, Location and Industry(1) | | Type of
Investment | | Interest Rate | | Maturity
Date | | Principal
Amount,
Par Value
or Shares | | Cost | | Fair Value | | Percent of
Members'
Capital | |
|---|
St. George's University Scholastic Services LLC | | | | | | | | | | | | | | | | | | | | | Education | | First lien(2) | | 8.50% (Base Rate + 7.00%) | | | 12/20/2017 | | $ | 25,000 | | $ | 24,501 | | $ | 24,500 | | | 4.30 | % | SRA International, Inc. | | | | | | | | | | | | | | | | | | | | | Federal Services | | First lien(3) | | 6.50% (Base Rate + 5.25%) | | | 7/20/2018 | | | 20,436 | | | 19,741 | | | 19,542 | | | | | | | First lien(2) | | 6.50% (Base Rate + 5.25%) | | | 7/20/2018 | | | 4,315 | | | 4,225 | | | 4,126 | | | | | | | | | | | | | | | | | | | | | | | | | | | | | | | | | | | | | | | | | | | | | | | | | | | | | | | | 24,751 | | | 23,966 | | | 23,668 | | | 4.15 | % | | | | | | | | | | | | | | | | | | | | | | | | | | | | | | | | | | | | | | | | | | Aderant North America, Inc. | | | | | | | | | | | | | | | | | | | | | Software | | Second lien(2) | | 11.00% (Base Rate + 7.75%) | | | 6/20/2019 | | | 22,500 | | | 22,163 | | | 23,062 | | | 4.05 | % | LM U.S. Member LLC (and LM U.S. Corp Acquisition Inc.) | | | | | | | | | | | | | | | | | | | | | Business Services | | Second lien(2) | | 9.50% (Base Rate + 8.25%) | | | 10/26/2020 | | | 20,000 | | | 19,704 | | | 20,150 | | | 3.54 | % | Learning Care Group (US), Inc. | | | | | | | | | | | | | | | | | | | | | Education | | First lien(2) | | 12.00% | | | 4/27/2016 | | | 17,369 | | | 17,174 | | | 16,696 | | | | | | | Subordinated(2) | | 15.00% PIK* | | | 6/30/2016 | | | 3,782 | | | 3,639 | | | 3,434 | | | | | | | | | | | | | | | | | | | | | | | | | | | | | | | | | | | | | | | | | | | | | | | | | | | | | | | | 21,151 | | | 20,813 | | | 20,130 | | | 3.53 | % | | | | | | | | | | | | | | | | | | | | | | | | | | | | | | | | | | | | | | | | | | Six3 Systems, Inc. | | | | | | | | | | | | | | | | | | | | | Federal Services | | First lien(2) | | 7.00% (Base Rate + 5.75%) | | | 10/4/2019 | | | 20,000 | | | 19,805 | | | 20,025 | | | 3.51 | % | First American Payment Systems, L.P. | | | | | | | | | | | | | | | | | | | | | Business Services | | Second lien(2) | | 10.75% (Base Rate + 9.50%) | | | 4/12/2019 | | | 20,000 | | | 19,609 | | | 19,900 | | | 3.49 | % | eResearchTechnology, Inc. | | | | | | | | | | | | | | | | | | | | | Healthcare Services | | First lien(3) | | 8.00% (Base Rate + 6.50%) | | | 5/2/2018 | | | 19,950 | | | 19,202 | | | 19,850 | | | 3.48 | % | Insight Pharmaceuticals LLC | | | | | | | | | | | | | | | | | | | | | Healthcare Products | | Second lien(2) | | 13.25% (Base Rate + 11.75%) | | | 8/25/2017 | | | 19,310 | | | 18,659 | | | 19,503 | | | 3.42 | % | Transplace Texas, L.P. | | | | | | | | | | | | | | | | | | | | | Distribution & Logistics(10) | | Second lien(2) | | 11.00% (Base Rate + 9.00%) | | | 4/12/2017 | | | 20,000 | | | 19,586 | | | 19,500 | | | 3.42 | % | PODS, Inc.(6) | | | | | | | | | | | | | | | | | | | | | Consumer Services | | | | | | | | | | | | | | | | | | | | | PODS Funding Corp. II | | First lien(3) | | 7.25% (Base Rate + 6.00%) | | | 11/29/2016 | | | 14,007 | | | 13,668 | | | 13,972 | | | | | Storapod Holding Company, Inc. | | Subordinated(2) | | 21.00% PIK* | | | 11/29/2017 | | | 5,296 | | | 5,156 | | | 5,113 | | | | | | | | | | | | | | | | | | | | | | | | | | | | | | | | | | | | | | | | | | | | | | | | | | | | | | | | 19,303 | | | 18,824 | | | 19,085 | | | 3.35 | % | | | | | | | | | | | | | | | | | | | | | | | | | | | | | | | | | | | | | | | | | | Smile Brands Group Inc. | | | | | | | | | | | | | | | | | | | | | Healthcare Services | | First lien(3) | | 7.00% (Base Rate + 5.25%) | | | 12/21/2017 | | | 19,859 | | | 19,598 | | | 18,767 | | | 3.29 | % | Ascensus, Inc. | | | | | | | | | | | | | | | | | | | | | Business Services | | First lien(2) | | 8.00% (Base Rate + 6.75%) | | | 12/21/2018 | | | 8,500 | | | 8,330 | | | 8,330 | | | | | | | First lien(3) | | 8.00% (Base Rate + 6.75%) | | | 12/21/2018 | | | 8,500 | | | 8,330 | | | 8,330 | | | | | | | | | | | | | | | | | | | | | | | | | | | | | | | | | | | | | | | | | | | | | | | | | | | | | | | | 17,000 | | | 16,660 | | | 16,660 | | | 2.92 | % | | | | | | | | | | | | | | | | | | | | | | | | | | | | | | | | | | | | | | | | | | Sotera Defense Solutions, Inc. (Global Defense Technology & Systems, Inc.) | | | | | | | | | | | | | | | | | | | | | Federal Services | | First lien(3) | | 7.50% (Base Rate + 6.00%) | | | 4/21/2017 | | | 15,758 | | | 15,644 | | | 15,600 | | | 2.74 | % | IG Investments Holdings, LLC | | | | | | | | | | | | | | | | | | | | | Business Services | | Second lien(2) | | 10.25% (Base Rate + 9.00%) | | | 10/31/2020 | | | 15,000 | | | 14,852 | | | 14,925 | | | 2.62 | % | OpenLink International, Inc. | | | | | | | | | | | | | | | | | | | | | Software | | First lien(3) | | 7.75% (Base Rate + 6.25%) | | | 10/30/2017 | | | 14,850 | | | 14,600 | | | 14,850 | | | 2.61 | % | Landslide Holdings, Inc. (Crimson Acquisition Corp.) | | | | | | | | | | | | | | | | | | | | | Software | | First lien(3) | | 7.00% (Base Rate + 5.75%) | | | 6/19/2018 | | | 14,625 | | | 14,353 | | | 14,671 | | | 2.57 | % | KPLT Holdings, Inc. (Centerplate, Inc., et al.) | | | | | | | | | | | | | | | | | | | | | Consumer Services | | Subordinated(2) | | 11.75% (10.25% + 1.50% PIK)* | | | 4/16/2019 | | | 14,637 | | | 14,351 | | | 14,344 | | | 2.52 | % | Sabre Inc. | | | | | | | | | | | | | | | | | | | | | Software | | First lien(3) | | 7.25% (Base Rate + 6.00%) | | | 12/29/2017 | | | 13,965 | | | 13,918 | | | 14,186 | | | 2.49 | % | Brock Holdings III, Inc. | | | | | | | | | | | | | | | | | | | | | Industrial Services | | Second lien(2) | | 10.00% (Base Rate + 8.25%) | | | 3/16/2018 | | | 14,000 | | | 13,825 | | | 14,105 | | | 2.48 | % | Triple Point Technology, Inc. | | | | | | | | | | | | | | | | | | | | | Software | | First lien(3) | | 6.25% (Base Rate + 5.00%) | | | 10/27/2017 | | | 12,968 | | | 12,549 | | | 13,021 | | | 2.28 | % | Lonestar Intermediate Super Holdings, LLC | | | | | | | | | | | | | | | | | | | | | Business Services | | Subordinated(2) | | 11.00% (Base Rate + 9.50%) | | | 9/2/2019 | | | 12,000 | | | 11,666 | | | 12,765 | | | 2.24 | % | Aspen Dental Management, Inc | | | | | | | | | | | | | | | | | | | | | Healthcare Services | | First lien(3) | | 7.00% (Base Rate + 5.50%) | | | 10/6/2016 | | | 12,870 | | | 12,652 | | | 12,210 | | | 2.14 | % |
The accompanying notes are an integral part of these consolidated financial statements.
Table of Contents
New Mountain Finance Holdings, L.L.C.
Consolidated Schedule of Investments (Continued)
December 31, 2012
(in thousands, except shares)
| | | | | | | | | | | | | | | | | | | | Portfolio Company, Location and Industry(1) | | Type of
Investment | | Interest Rate | | Maturity
Date | | Principal
Amount,
Par Value
or Shares | | Cost | | Fair Value | | Percent of
Members'
Capital | |
|---|
Van Wagner Communications, LLC | | | | | | | | | | | | | | | | | | | | Media | | First lien(2) | | 8.25% (Base Rate + 7.00%) | | 8/3/2018 | | $ | 12,000 | | $ | 11,772 | | $ | 12,160 | | | 2.13 | % | Supervalu Inc.** | | | | | | | | | | | | | | | | | | | | Retail | | First lien(2) | | 8.00% (Base Rate + 6.75%) | | 8/30/2018 | | | 11,940 | | | 11,597 | | | 12,146 | | | 2.13 | % | Vision Solutions, Inc. | | | | | | | | | | | | | | | | | | | | Software | | Second lien(2) | | 9.50% (Base Rate + 8.00%) | | 7/23/2017 | | | 12,000 | | | 11,913 | | | 11,700 | | | 2.05 | % | Merrill Communications LLC | | | | | | | | | | | | | | | | | | | | Business Services | | First lien(2) | | 10.75% (Base Rate + 7.50%) | | 3/10/2013 | | | 11,422 | | | 11,421 | | | 11,279 | | | 1.98 | % | MailSouth, Inc. | | | | | | | | | | | | | | | | | | | | Media | | First lien(3) | | 6.75% (Base Rate + 5.00%) | | 12/14/2016 | | | 11,136 | | | 11,018 | | | 11,025 | | | 1.94 | % | Immucor, Inc. | | | | | | | | | | | | | | | | | | | | Healthcare Services | | First lien(3) | | 5.75% (Base Rate + 4.50%) | | 8/19/2018 | | | 4,938 | | | 4,772 | | | 5,006 | | | | | | | Subordinated(2)(7) | | 11.13% | | 8/15/2019 | | | 5,000 | | | 4,943 | | | 5,650 | | | | | | | | | | | | | | | | | | | | | | | | | | | | | | | | | | | | | | | | | | | | | | | | | | | | | 9,938 | | | 9,715 | | | 10,656 | | | 1.87 | % | | | | | | | | | | | | | | | | | | | | | | | | | | | | | | | | | | | | | | | | Virtual Radiologic Corporation | | | | | | | | | | | | | | | | | | | | Healthcare Information Technology | | First lien(3) | | 7.75% (Base Rate + 4.50%) | | 12/22/2016 | | | 14,702 | | | 14,550 | | | 10,291 | | | 1.81 | % | Permian Tank & Manufacturing, Inc. | | | | | | | | | | | | | | | | | | | | Energy | | First lien(3) | | 9.00% (Base Rate + 7.25%) | | 3/15/2017 | | | 10,072 | | | 9,852 | | | 10,072 | | | 1.77 | % | Vertafore, Inc. | | | | | | | | | | | | | | | | | | | | Software | | Second lien(2) | | 9.75% (Base Rate + 8.25%) | | 10/29/2017 | | | 10,000 | | | 9,924 | | | 10,050 | | | 1.76 | % | Merge Healthcare Inc.** | | | | | | | | | | | | | | | | | | | | Healthcare Services | | First lien(2)(7) | | 11.75% | | 5/1/2015 | | | 9,000 | | | 8,916 | | | 9,709 | | | 1.70 | % | TransFirst Holdings, Inc. | | | | | | | | | | | | | | | | | | | | Business Services | | Second lien(2) | | 11.00% (Base Rate + 9.75%) | | 6/27/2018 | | | 10,000 | | | 9,700 | | | 9,700 | | | 1.70 | % | Consona Holdings, Inc. | | | | | | | | | | | | | | | | | | | | Software | | First lien(3) | | 7.25% (Base Rate + 6.00%) | | 8/6/2018 | | | 8,479 | | | 8,398 | | | 8,511 | | | 1.49 | % | Confie Seguros Holding II Co. | | | | | | | | | | | | | | | | | | | | Consumer Services | | Second lien(2) | | 10.25% (Base Rate + 9.00%) | | 5/8/2019 | | | 8,000 | | | 7,842 | | | 8,040 | | | 1.41 | % | Physio-Control International, Inc. | | | | | | | | | | | | | | | | | | | | Healthcare Products | | First lien(2) | | 9.88% | | 1/15/2019 | | | 7,000 | | | 7,000 | | | 7,717 | | | 1.35 | % | Surgery Center Holdings, Inc. | | | | | | | | | | | | | | | | | | | | Healthcare Services | | First lien(3) | | 6.50% (Base Rate + 5.00%) | | 2/6/2017 | | | 6,834 | | | 6,809 | | | 6,800 | | | 1.19 | % | Research Pharmaceutical Services, Inc. | | | | | | | | | | | | | | | | | | | | Healthcare Services | | First lien(3) | | 6.75% (Base Rate + 5.25%) | | 2/18/2017 | | | 7,125 | | | 7,046 | | | 6,662 | | | 1.17 | % | Alion Science and Technology Corporation | | | | | | | | | | | | | | | | | | | | Federal Services | | First lien(2)(7) | | 12.00% (10.00% + 2.00% PIK)* | | 11/1/2014 | | | 6,320 | | | 6,131 | | | 6,093 | | | 1.07 | % | GCA Services Group, Inc. | | | | | | | | | | | | | | | | | | | | Business Services | | Second lien(2) | | 9.25% (Base Rate + 8.00%) | | 11/1/2020 | | | 5,000 | | | 4,951 | | | 4,900 | | | 0.86 | % | Education Management LLC** | | | | | | | | | | | | | | | | | | | | Education | | First lien(3) | | 8.25% (Base Rate + 7.00%) | | 3/30/2018 | | | 5,058 | | | 4,921 | | | 4,232 | | | 0.74 | % | Brickman Group Holdings, Inc. | | | | | | | | | | | | | | | | | | | | Business Services | | Subordinated(2) | | 9.13% | | 11/1/2018 | | | 3,650 | | | 3,342 | | | 3,842 | | | 0.68 | % | Ozburn-Hessey Holding Company LLC | | | | | | | | | | | | | | | | | | | | Distribution & Logistics(10) | | Second lien(2) | | 11.50% (Base Rate + 9.50%) | | 10/10/2016 | | | 4,000 | | | 3,947 | | | 3,680 | | | 0.65 | % | YP Holdings LLC(8) | | | | | | | | | | | | | | | | | | | | YP Intermediate Holdings Corp. / YP Intermediate Holdings II LLC | | | | | | | | | | | | | | | | | | | | Media | | Second lien(2) | | 15.00% (12.00% + 3.00% PIK)* | | 5/18/2017 | | | 3,559 | | | 3,326 | | | 3,586 | | | 0.63 | % | Mach Gen, LLC | | | | | | | | | | | | | | | | | | | | Power Generation | | Second lien(2) | | 7.82% PIK (Base Rate + 7.50%)* | | 2/22/2015 | | | 3,676 | | | 3,474 | | | 2,396 | | | 0.42 | % | ATI Acquisition Company (fka Ability Acquisition, Inc.) | | | | | | | | | | | | | | | | | | | | Education | | First lien(2) | | 12.25% (Base Rate + 5.00% + 4.00% PIK)(5)* | | 12/30/2014 | | | 4,432 | | | 4,306 | | | — | | | | | | | First lien(2) | | 17.25% (Base Rate + 10.00% + 4.00% PIK)(5)* | | 6/30/2012
—Past Due | | | 1,665 | | | 1,517 | | | 649 | | | | | | | First lien(2) | | 17.25% (Base Rate + 10.00% + 4.00% PIK)(5)* | | 6/30/2012
—Past Due | | | 103 | | | 94 | | | 103 | | | | | | | | | | | | | | | | | | | | | | | | | | | | | | | | | | | | | | | | | | | | | | | | | | | | | 6,200 | | | 5,917 | | | 752 | | | 0.13 | % | | | | | | | | | | | | | | | | | | | | | | | | | | | | | | | | | | | | | | | | Airvana Network Solutions Inc. | | | | | | | | | | | | | | | | | | | | Software | | First lien(2) | | 10.00% (Base Rate + 8.00%) | | 3/25/2015 | | | 648 | | | 640 | | | 650 | | | 0.11 | % | | | | | | | | | | | | | | | | | | | | | | | | | | | | | | | | | | | | | | | | Total Funded Debt Investments—United States | | | | | | | | $ | 942,670 | | $ | 921,787 | | $ | 925,287 | | | 162.35 | % | | | | | | | | | | | | | | | | | | | | | | | | | | | | | | | | | | | | | | | | Total Funded Debt Investments | | | | | | | | $ | 997,289 | | $ | 975,117 | | $ | 980,510 | | | 172.04 | % | | | | | | | | | | | | | | | | | | | | | | | | | | | | | | | | | | | | | | | |
The accompanying notes are an integral part of these consolidated financial statements.
Table of Contents
New Mountain Finance Holdings, L.L.C.
Consolidated Schedule of Investments (Continued)
December 31, 2012
(in thousands, except shares)
| | | | | | | | | | | | | | | | | | | | Portfolio Company, Location and Industry(1) | | Type of
Investment | | Interest Rate | | Maturity
Date | | Principal
Amount,
Par Value
or Shares | | Cost | | Fair Value | | Percent of
Members'
Capital | |
|---|
Equity—Bermuda | | | | | | | | | | | | | | | | | | | | Stratus Technologies Bermuda Holdings Ltd.(4)** | | | | | | | | | | | | | | | | | | | | Information Technology | | Ordinary shares(2) | | — | | — | | | 144,270 | | $ | 65 | | $ | 65 | | | | | | | Preferred shares(2) | | — | | — | | | 32,830 | | | 15 | | | 15 | | | | | | | | | | | | | | | | | | | | | | | | | | | | | | | | | | | | | | | | | | | | | | | | | | | | | | | | | 80 | | | 80 | | | 0.01 | % | | | | | | | | | | | | | | | | | | | | | | | | | | | | | | | | | | | | | | | | | Total Shares—Bermuda | | | | | | | | | | | $ | 80 | | $ | 80 | | | 0.01 | % | | | | | | | | | | | | | | | | | | | | | | | | | | | | | | | | | | | | | | | | | Equity—United States | | | | | | | | | | | | | | | | | | | | Global Knowledge Training LLC | | | | | | | | | | | | | | | | | | | | Education | | Ordinary shares(2) | | — | | — | | | 2 | | $ | 2 | | $ | 2 | | | | | | | Preferred shares(2) | | — | | — | | | 2,423 | | | 1,195 | | | 2,423 | | | | | | | | | | | | | | | | | | | | | | | | | | | | | | | | | | | | | | | | | | | | | | | | | | | | | | | | | 1,197 | | | 2,425 | | | 0.43 | % | | | | | | | | | | | | | | | | | | | | | | | | | | | | | | | | | | | | | | | | | Total Shares—United States | | | | | | | | | | | $ | 1,197 | | $ | 2,425 | | | 0.43 | % | | | | | | | | | | | | | | | | | | | | | | | | | | | | | | | | | | | | | | | | | Total Shares | | | | | | | | | | | $ | 1,277 | | $ | 2,505 | | | 0.44 | % | | | | | | | | | | | | | | | | | | | | | | | | | | | | | | | | | | | | | | | | | Warrants—United States | | | | | | | | | | | | | | | | | | | | YP Holdings LLC(8) | | | | | | | | | | | | | | | | | | | | YP Equity Investors LLC | | | | | | | | | | | | | | | | | | | | Media | | Warrants(2) | | — | | — | | | 5 | | $ | 466 | | $ | 7,230 | | | 1.27 | % | Alion Science and Technology Corporation | | | | | | | | | | | | | | | | | | | | Federal Services | | Warrants(2) | | — | | — | | | 6,000 | | | 293 | | | 192 | | | 0.03 | % | PODS, Inc.(6) | | | | | | | | | | | | | | | | | | | | Storapod Holding Company, Inc. | | | | | | | | | | | | | | | | | | | | Consumer Services | | Warrants(2) | | — | | — | | | 360,129 | | | 156 | | | 156 | | | 0.03 | % | Learning Care Group (US), Inc. | | | | | | | | | | | | | | | | | | | | Education | | Warrants(2) | | — | | — | | | 844 | | | 194 | | | 14 | | | 0.00 | % | | | | | | | | | | | | | | | | | | | | | | | | | | | | | | | | | | | | | | | | | Total Warrants—United States | | | | | | | | | | | $ | 1,109 | | $ | 7,592 | | | 1.33 | % | | | | | | | | | | | | | | | | | | | | | | | | | | | | | | | | | | | | | | | | | Total Funded Investments | | | | | | | | | | | $ | 977,503 | | $ | 990,607 | | | 173.81 | % | | | | | | | | | | | | | | | | | | | | | | | | | | | | | | | | | | | | | | | | | Unfunded Debt Investments—United States | | | | | | | | | | | | | | | | | | | | Advantage Sales & Marketing Inc. | | | | | | | | | | | | | | | | | | | | Business Services | | First lien(2)(9)—Undrawn | | — | | 12/17/2015 | | $ | 10,500 | | $ | (1,260 | ) | $ | (787 | ) | | (0.14 | )% | | | | | | | | | | | | | | | | | | | | | | | | | | | | | | | | | | | | | | | | Total Unfunded Debt Investments | | | | | | | | $ | 10,500 | | $ | (1,260 | ) | $ | (787 | ) | | (0.14 | )% | | | | | | | | | | | | | | | | | | | | | | | | | | | | | | | | | | | | | | | | Total Investments | | | | | | | | | | | $ | 976,243 | | $ | 989,820 | | | 173.67 | % | | | | | | | | | | | | | | | | | | | | | | | | | | | | | | | | | | | | | | | | | | | | | | | | | | | | | | | | | | | | | | | | | | | | | | | | | | | | | | | | |
(1)New Mountain Finance Holdings, L.L.C. (the "Operating Company") generally acquires its investments in private transactions exempt from registration under the Securities Act of 1933, as amended (the "Securities Act"). These investments are generally subject to certain limitations on resale, and may be deemed to be "restricted securities" under the Securities Act.
(2)The Holdings Credit Facility is collateralized by the indicated investments.
(3)The SLF Credit Facility is collateralized by the indicated investments.
(4)The Operating Company holds investments in two related entities of Stratus Technologies Bermuda Holdings, Ltd. ("Stratus Holdings"). The Operating Company directly holds ordinary and preferred equity in Stratus Holdings and has a credit investment in the joint issuers of Stratus Technologies Bermuda Ltd. ("Stratus Bermuda") and Stratus Technologies, Inc. ("Stratus U.S."), collectively, the "Stratus Notes". Stratus U.S. is a wholly-owned subsidiary of Stratus Bermuda, which in turn is a wholly-owned subsidiary of Stratus Holdings. Stratus Holdings is the parent guarantor of the credit investment of the Stratus Notes.
(5)Investment is on non-accrual status.
(6)The Operating Company holds investments in two related entities of PODS, Inc. The Operating Company directly holds warrants in Storapod Holding Company, Inc. ("Storapod") and has a credit investment in Storapod through Storapod WCF II Limited ("Storapod WCF II"). Storapod WCF II is a special purpose entity used to enter into a Shari'ah-compliant financing arrangement with Storapod. Additionally, the Operating Company has a credit investment in PODS Funding Corp. II ("PODS II"). PODS, Inc. is a wholly-owned subsidiary of PODS Holding, Inc., which in turn is a majority-owned subsidiary of Storapod. PODS II is a special purpose entity used to enter into a Shari'ah-compliant financing arrangement with PODS, Inc. and its subsidiary, PODS Enterprises, Inc.
(7)Securities are registered under the Securities Act.
(8)The Operating Company holds investments in two related entities of YP Holdings LLC. The Operating Company directly holds warrants to purchase a 4.96% membership interest of YP Equity Investors, LLC (which at closing represented an indirect 1.0% equity interest in YP Holdings LLC) and holds an investment in the Term Loan B loans issued by YP Intermediate Holdings Corp. and YP Intermediate Holdings II LLC (together "YP Intermediate"), a subsidiary of YP Holdings LLC.
(9)Par Value amounts represent the drawn or undrawn (as indicated in type of investment) portion of revolving credit facilities. Cost amounts represent the cash received at settlement date net the impact of paydowns and cash paid for drawn revolvers.
(10)Industries were disclosed separately in previously issued financial statements.
*All or a portion of interest contains payments-in-kind ("PIK").
**Indicates assets that the Operating Company deems to be "non-qualifying assets" under Section 55(a) of the Investment Company Act of 1940, as amended. Qualifying assets must represent at least 70.00% of the Operating Company's total assets at the time of acquisition of any additional non-qualifying assets.
The accompanying notes are an integral part of these consolidated financial statements.
Table of Contents
New Mountain Finance Holdings, L.L.C.
Consolidated Schedule of Investments (Continued)
December 31, 2012
| | | | |
| | December 31, 2012 | |
|---|
Investment Type
| | Percent of
Total Investments
at Fair Value | |
|---|
First lien
| | | 49.86 | % | Second lien
| | | 44.56 | % | Subordinated
| | | 4.56 | % | Equity and other
| | | 1.02 | % | | | | | | | | | | Total investments
| | | 100.00 | % | | | | | | | | | | | | | | | | | | |
| | | | |
| | December 31, 2012 | |
|---|
Industry Type
| | Percent of
Total Investments
at Fair Value | |
|---|
Software
| | | 24.92 | % | Education
| | | 15.17 | % | Healthcare Services
| | | 14.52 | % | Business Services
| | | 14.49 | % | Federal Services
| | | 9.64 | % | Distribution & Logistics(1)
| | | 5.23 | % | Consumer Services
| | | 4.21 | % | Media
| | | 3.44 | % | Healthcare Products
| | | 2.75 | % | Industrial Services
| | | 1.42 | % | Retail
| | | 1.23 | % | Healthcare Information Technology
| | | 1.04 | % | Energy
| | | 1.02 | % | Information Technology
| | | 0.68 | % | Power Generation
| | | 0.24 | % | | | | | | | | | | Total investments
| | | 100.00 | % | | | | | | | | | | | | | | | | | | |
(1)Industries were disclosed separately in previously issued financial statements.
The accompanying notes are an integral part of these consolidated financial statements.
Table of Contents
New Mountain Finance Corporation
Statements of Assets and Liabilities
(in thousands, except shares and per share data)
| | | | | | | |
| | December 31, 2013 | | December 31, 2012 | |
|---|
Assets | | | | | | | | Investment in New Mountain Finance Holdings, L.L.C., at fair value (cost of $633,835 and $335,730, respectively) | | $ | 650,107 | | $ | 341,926 | | Distribution receivable from New Mountain Finance Holdings, L.L.C. | | | — | | | 3,405 | | | | | | | | | | | | | | | | | | Total assets | | $ | 650,107 | | $ | 345,331 | | | | | | | | | | | | | | | | | | Liabilities | | | | | | | | Dividends payable | | | — | | | 3,405 | | | | | | | | | | | | | | | | | | Total liabilities | | | — | | | 3,405 | | | | | | | | | | | | | | | | | | Net assets | | | | | | | | Preferred stock, par value $0.01 per share, 2,000,000 shares authorized, none issued | | | — | | | — | | Common stock, par value $0.01 per share 100,000,000 shares authorized, and 45,224,755 and 24,326,251 shares issued and outstanding, respectively | | | 452 | | | 243 | | Paid in capital in excess of par | | | 633,383 | | | 335,487 | | Accumulated undistributed net realized gains | | | 5,056 | | | 952 | | Net unrealized appreciation | | | 11,216 | | | 5,244 | | | | | | | | | | | | | | | | | | Total net assets | | $ | 650,107 | | $ | 341,926 | | | | | | | | | | | | | | | | | | Total liabilities and net assets | | $ | 650,107 | | $ | 345,331 | | | | | | | | | | | | | | | | | | | | | | | | | | | | | | | | | | Number of shares outstanding | | | 45,224,755 | | | 24,326,251 | | Net asset value per share | | $ | 14.38 | | $ | 14.06 | |
The accompanying notes are an integral part of these financial statements.
Table of Contents
New Mountain Finance Corporation
Statements of Operations
(in thousands, except shares and per share data)
| | | | | | | | | | |
| | Years ended December 31, | | From May 19, 2011
(commencement of
operations) to
December 31, 2011 | |
|---|
| | 2013 | | 2012 | |
|---|
Net investment income allocated from New Mountain Finance Holdings, L.L.C. | | | | | | | | | | | Interest income | | $ | 84,925 | | $ | 36,439 | | $ | 13,437 | | Dividend income | | | 3,567 | | | 455 | | | — | | Other income | | | 2,384 | | | 617 | | | 232 | | Total expenses | | | (40,355 | ) | | (17,719 | ) | | (5,324 | ) | | | | | | | | | | | | | | | | | | | | | | Net investment income allocated from New Mountain Finance Holdings, L.L.C. | | | 50,521 | | | 19,792 | | | 8,345 | | Net realized and unrealized gain (loss) allocated from New Mountain Finance Holdings, L.L.C. | | | | | | | | | | | Net realized gains on investment | | | 5,427 | | | 7,593 | | | 1,141 | | Net change in unrealized appreciation (depreciation) of investments | | | 6,016 | | | 4,494 | | | (5,376 | ) | | | | | | | | | | | | | | | | | | | | | | Net realized and unrealized gain (loss) allocated from New Mountain Finance Holdings, L.L.C. | | | 11,443 | | | 12,087 | | | (4,235 | ) | | | | | | | | | | | | | | | | | | | | | | Total net increase in net assets resulting from operations allocated from New Mountain Finance Holdings, L.L.C. | | | 61,964 | | | 31,879 | | | 4,110 | | | | | | | | | | | | | | | | | | | | | | | Net change in unrealized (depreciation) appreciation of investment in New Mountain Finance Holdings, L.L.C. | | | (44 | ) | | (95 | ) | | 6,221 | | | | | | | | | | | | | | | | | | | | | | | Net increase in net assets resulting from operations | | $ | 61,920 | | $ | 31,784 | | $ | 10,331 | | | | | | | | | | | | | | | | | | | | | | | | | | | | | | | | | | | | | | | | | | | | Basic earnings per share | | $ | 1.76 | | $ | 2.14 | | $ | 0.97 | | Weighted average shares of common stock outstanding—basic (See Note 12) | | | 35,092,722 | | | 14,860,838 | | | 10,697,691 | | Diluted earnings per share | | $ | 1.79 | | $ | 2.18 | | $ | 0.38 | | Weighted average shares of common stock outstanding—diluted (See Note 12) | | | 44,021,920 | | | 34,011,738 | | | 30,919,629 | |
The accompanying notes are an integral part of these financial statements.
Table of Contents
New Mountain Finance Corporation
Statements of Changes in Net Assets
(in thousands)
| | | | | | | | | | |
| | Years ended December 31, | | From May 19, 2011
(commencement of
operations) to
December 31, 2011 | |
|---|
| | 2013 | | 2012 | |
|---|
Increase (decrease) in net assets resulting from operations: | | | | | | | | | | | Net investment income allocated from New Mountain Finance Holdings, L.L.C. | | $ | 50,521 | | $ | 19,792 | | $ | 8,345 | | Net realized gains on investments allocated from New Mountain Finance Holdings, L.L.C. | | | 5,427 | | | 7,593 | | | 1,141 | | Net change in unrealized appreciation (depreciation) of investments allocated from New Mountain Finance Holdings, L.L.C. | | | 6,016 | | | 4,494 | | | (5,376 | ) | Net change in unrealized (depreciation) appreciation of investment in New Mountain Finance Holdings, L.L.C. | | | (44 | ) | | (95 | ) | | 6,221 | | | | | | | | | | | | | | | | | | | | | | | Net increase in net assets resulting from operations | | | 61,920 | | | 31,784 | | | 10,331 | | | | | | | | | | | | | | | | | | | | | | | Capital transactions | | | | | | | | | | | Net proceeds from shares sold | | | 100,040 | | | 133,428 | | | 129,865 | | Deferred offering costs allocated from New Mountain Finance Holdings, L.L.C. | | | (281 | ) | | (323 | ) | | (3,998 | ) | Value of shares issued for exchanged units | | | 193,262 | | | 56,314 | | | 18,489 | | Dividends declared | | | (51,844 | ) | | (26,719 | ) | | (9,200 | ) | Reinvestment of dividends | | | 5,084 | | | 1,955 | | | — | | | | | | | | | | | | | | | | | | | | | | | Total net increase in net assets resulting from capital transactions | | | 246,261 | | | 164,655 | | | 135,156 | | | | | | | | | | | | | | | | | | | | | | | Net increase in net assets | | | 308,181 | | | 196,439 | | | 145,487 | | Net assets at the beginning of the period | | | 341,926 | | | 145,487 | | | — | | | | | | | | | | | | | | | | | | | | | | | Net assets at the end of the period | | | 650,107 | | $ | 341,926 | | $ | 145,487 | | | | | | | | | | | | | | | | | | | | | | | | | | | | | | | | | | | | | | | | | | | |
The accompanying notes are an integral part of these financial statements.
Table of Contents
New Mountain Finance Corporation
Statements of Cash Flows
(in thousands)
| | | | | | | | | | |
| | Years ended December 31, | | From May 19, 2011
(commencement of
operations) to
December 31, 2011 | |
|---|
| | 2013 | | 2012 | |
|---|
Cash flows from operating activities: | | | | | | | | | | | Net increase in net assets resulting from operations | | $ | 61,920 | | $ | 31,784 | | $ | 10,331 | | Adjustments to reconcile net (increase) decrease in net assets resulting from operations to net cash (used in) provided by operating activities: | | | | | | | | | | | Net investment income allocated from New Mountain Finance Holdings, L.L.C. | | | (50,521 | ) | | (19,792 | ) | | (8,345 | ) | Net realized and unrealized (gains) losses allocated from New Mountain Finance Holdings, L.L.C. | | | (11,443 | ) | | (12,087 | ) | | 4,235 | | Net change in unrealized depreciation (appreciation) in New Mountain Finance Holdings, L.L.C. | | | 44 | | | 95 | | | (6,221 | ) | (Increase) decrease in operating assets: | | | | | | | | | | | Purchase of investment | | | (100,040 | ) | | (133,428 | ) | | (129,865 | ) | Distributions from New Mountain Finance Holdings, L.L.C. | | | 50,165 | | | 23,314 | | | 9,200 | | | | | | | | | | | | | | | | | | | | | | | Net cash flows used in by operating activities | | | (49,875 | ) | | (110,114 | ) | | (120,665 | ) | | | | | | | | | | | | | | | | | | | | | | Cash flows from financing activities: | | | | | | | | | | | Net proceeds from shares sold | | | 100,040 | | | 133,428 | | | 129,865 | | Dividends declared | | | (50,165 | ) | | (23,314 | ) | | (9,200 | ) | | | | | | | | | | | | | | | | | | | | | | Net cash flows provided by financing activities | | | 49,875 | | | 110,114 | | | 120,665 | | | | | | | | | | | | | | | | | | | | | | | Net increase (decrease) in cash and cash equivalents | | | — | | | — | | | — | | Cash and cash equivalents at the beginning of the period | | | — | | | — | | | — | | | | | | | | | | | | | | | | | | | | | | | Cash and cash equivalents at the end of the period | | $ | — | | $ | — | | $ | — | | | | | | | | | | | | | | | | | | | | | | | | | | | | | | | | | | | | | | | | | | | | Non-cash operating activities: | | | | | | | | | | | Distribution receivable from New Mountain Finance Holdings, L.L.C. | | $ | — | | $ | 3,405 | | $ | — | | Non-cash financing activities: | | | | | | | | | | | Dividends declared and payable | | $ | — | | $ | (3,405 | ) | $ | — | | New Mountain Guardian Partners, L.P. exchange of New Mountain Finance Holdings, L.L.C. units for shares | | | — | | | — | | | 18,489 | | New Mountain Finance AIV Holdings Corporation exchange of New Mountain Finance Holdings, L.L.C. units for shares | | | 193,262 | | | 56,314 | | | — | | Value of shares issued in connection with dividend reinvestment plan | | | 5,084 | | | 1,955 | | | — | | Deferred offering costs allocated from New Mountain Finance Holdings, L.L.C. | | | (281 | ) | | (323 | ) | | (3,998 | ) |
The accompanying notes are an integral part of these financial statements.
Table of Contents
New Mountain Finance AIV Holdings Corporation
Statements of Assets and Liabilities
(in thousands, except shares)
| | | | | | | |
| | December 31, 2013 | | December 31, 2012 | |
|---|
Assets | | | | | | | | Investment in New Mountain Finance Holdings, L.L.C., at fair value (cost of $61,993 and $244,015, respectively) | | $ | 38,409 | | $ | 228,013 | | Distributions receivable from New Mountain Finance Holdings, L.L.C. | | | — | | | 7,786 | | | | | | | | | | | | | | | | | | Total assets | | $ | 38,409 | | $ | 235,799 | | | | | | | | | | | | | | | | | | | | | | | | | | | | | | | | | | Liabilities | | | | | | | | Dividends payable | | | — | | | 7,786 | | | | | | | | | | | | | | | | | | Total liabilities | | | — | | | 7,786 | | | | | | | | | | | | | | | | | | Net assets | | | | | | | | Common stock, par value $0.01 per share 100 shares issued and outstanding | | | — | (1) | | — | (1) | Paid in capital in excess of par | | | 61,993 | | | 244,015 | | Distributions in excess of net realized gains | | | (26,812 | ) | | (6,676 | ) | Net unrealized appreciation (depreciation) | | | 3,228 | | | (9,326 | ) | | | | | | | | | | | | | | | | | Total net assets | | | 38,409 | | | 228,013 | | | | | | | | | | | | | | | | | | Total liabilities and net assets | | $ | 38,409 | | $ | 235,799 | | | | | | | | | | | | | | | | | | | | | | | | | | | | | | | | | |
(1)As of December 31, 2013 and December 31, 2012, the par value of the total common stock was $1.
The accompanying notes are an integral part of these financial statements.
Table of Contents
New Mountain Finance AIV Holdings Corporation
Statements of Operations
(in thousands)
| | | | | | | | | | |
| |
| |
| | From May 19, 2011
(commencement of
operations) to
December 31,
2011 | |
|---|
| | Years ended December 31, | |
|---|
| | 2013 | | 2012 | |
|---|
Net investment income allocated from New Mountain Finance Holdings, L.L.C. | | | | | | | | | | | Interest income | | $ | 22,102 | | $ | 47,207 | | $ | 25,399 | | Dividend income | | | 1,482 | | | 357 | | | — | | Other income | | | 452 | | | 712 | | | 439 | | Total expenses | | | (10,881 | ) | | (22,850 | ) | | (10,063 | ) | | | | | | | | | | | | | | | | | | | | | | Net investment income allocated from New Mountain Finance Holdings, L.L.C. | | | 13,155 | | | 25,426 | | | 15,775 | | Net realized and unrealized gain (loss) allocated from New Mountain Finance Holdings, L.L.C. | | | | | | | | | | | Net realized gains on investments | | | 1,826 | | | 11,259 | | | 2,158 | | Net change in unrealized appreciation (depreciation) of investments | | | 1,978 | | | 5,433 | | | (10,163 | ) | | | | | | | | | | | | | | | | | | | | | | Net realized and unrealized gain (loss) allocated from New Mountain Finance Holdings, L.L.C. | | | 3,804 | | | 16,692 | | | (8,005 | ) | | | | | | | | | | | | | | | | | | | | | | Total net increase in net assets resulting from operations allocated from New Mountain Finance Holdings, L.L.C. | | | 16,959 | | | 42,118 | | | 7,770 | | | | | | | | | | | | | | | | | | | | | | | Net realized (losses) gains on investment in New Mountain Finance Holdings, L.L.C. | | | (14,925 | ) | | 381 | | | — | | Net change in unrealized appreciation (depreciation) on investment in New Mountain Finance Holdings, L.L.C. | | | 10,576 | | | 1,616 | | | (6,212 | ) | | | | | | | | | | | | | | | | | | | | | | Net increase in net assets resulting from operations | | $ | 12,610 | | $ | 44,115 | | $ | 1,558 | | | | | | | | | | | | | | | | | | | | | | | | | | | | | | | | | | | | | | | | | | | |
The accompanying notes are an integral part of these financial statements.
Table of Contents
New Mountain Finance AIV Holdings Corporation
Statements of Changes in Net Assets
(in thousands)
| | | | | | | | | | |
| |
| |
| | From May 19, 2011
(commencement of
operations) to
December 31,
2011 | |
|---|
| | Years ended December 31, | |
|---|
| | 2013 | | 2012 | |
|---|
Increase (decrease) in net assets resulting from operations: | | | | | | | | | | | Net investment income allocated from New Mountain Finance Holdings, L.L.C. | | $ | 13,155 | | $ | 25,426 | | $ | 15,775 | | Net realized gains on investments allocated from New Mountain Finance Holdings, L.L.C. | | | 1,826 | | | 11,259 | | | 2,158 | | Net change in unrealized appreciation (depreciation) of investments allocated from New Mountain Finance Holdings, L.L.C. | | | 1,978 | | | 5,433 | | | (10,163 | ) | Net realized (losses) gains on investment in New Mountain Finance Holdings, L.L.C. | | | (14,925 | ) | | 381 | | | — | | Net change in unrealized appreciation (depreciation) on investment in New Mountain Finance Holdings, L.L.C. | | | 10,576 | | | 1,616 | | | (6,212 | ) | | | | | | | | | | | | | | | | | | | | | | Net increase in net assets resulting from operations | | | 12,610 | | | 44,115 | | | 1,558 | | | | | | | | | | | | | | | | | | | | | | | Capital transactions | | | | | | | | | | | Distribution to New Mountain Guardian AIV, L.P. | | | (188,868 | ) | | (58,216 | ) | | — | | Deferred offering costs allocated from New Mountain Finance Holdings, L.L.C. | | | (50 | ) | | (241 | ) | | (7,559 | ) | Contributions from exchanged shares | | | — | | | — | | | 298,407 | | Dividends declared | | | (13,296 | ) | | (32,660 | ) | | (17,391 | ) | | | | | | | | | | | | | | | | | | | | | | Total net (decrease) increase in net assets resulting from capital transactions | | | (202,214 | ) | | (91,117 | ) | | 273,457 | | | | | | | | | | | | | | | | | | | | | | | Net (decrease) increase in net assets | | | (189,604 | ) | | (47,002 | ) | | 275,015 | | Net assets at the beginning of the period | | | 228,013 | | | 275,015 | | | — | | | | | | | | | | | | | | | | | | | | | | | Net assets at the end of the period | | $ | 38,409 | | $ | 228,013 | | $ | 275,015 | | | | | | | | | | | | | | | | | | | | | | | | | | | | | | | | | | | | | | | | | | | |
The accompanying notes are an integral part of these financial statements.
Table of Contents
New Mountain Finance AIV Holdings Corporation
Statements of Cash Flows
(in thousands)
| | | | | | | | | | |
| | Years ended December 31, | | From May 19, 2011
(commencement of
operations) to
December 31, 2011 | |
|---|
| | 2013 | | 2012 | |
|---|
Cash flows from operating activities: | | | | | | | | | | | Net increase in net assets resulting from operations | | $ | 12,610 | | $ | 44,115 | | $ | 1,558 | | Adjustments to reconcile net (increase) decrease in net assets resulting from operations to net cash (used in) provided by operating activities: | | | | | | | | | | | Net investment income allocated from New Mountain Finance Holdings, L.L.C. | | | (13,155 | ) | | (25,426 | ) | | (15,775 | ) | Net realized and unrealized (gains) losses allocated from New Mountain Finance Holdings, L.L.C. | | | (3,804 | ) | | (16,692 | ) | | 8,005 | | Net realized losses (gains) on investment in New Mountain Finance Holdings, L.L.C. | | | 14,925 | | | (381 | ) | | — | | Net change in unrealized (appreciation) depreciation in New Mountain Finance Holdings, L.L.C. | | | (10,576 | ) | | (1,616 | ) | | 6,212 | | (Increase) decrease in operating assets: | | | | | | | | | | | Distributions from New Mountain Finance Holdings, L.L.C. | | | 21,082 | | | 24,874 | | | 17,391 | | | | | | | | | | | | | | | | | | | | | | | Net cash flows provided by operating activities | | | 21,082 | | | 24,874 | | | 17,391 | | | | | | | | | | | | | | | | | | | | | | | Cash flows from financing activities: | | | | | | | | | | | Net proceeds from shares sold | | | 188,868 | | | 58,216 | | | — | | Distribution to New Mountain Guardian AIV, L.P. | | | (188,868 | ) | | (58,216 | ) | | — | | Dividends declared | | | (21,082 | ) | | (24,874 | ) | | (17,391 | ) | | | | | | | | | | | | | | | | | | | | | | Net cash flows used in financing activities | | | (21,082 | ) | | (24,874 | ) | | (17,391 | ) | | | | | | | | | | | | | | | | | | | | | | Net increase (decrease) in cash and cash equivalents | | | — | | | — | | | — | | Cash and cash equivalents at the beginning of the period | | | — | | | — | | | — | | | | | | | | | | | | | | | | | | | | | | | Cash and cash equivalents at the end of the period | | $ | — | | $ | — | | $ | — | | | | | | | | | | | | | | | | | | | | | | | | | | | | | | | | | | | | | | | | | | | | Non-cash operating activities: | | | | | | | | | | | Distribution receivable from New Mountain Finance Holdings, L.L.C. | | $ | — | | $ | 7,786 | | $ | — | | Non-cash financing activities: | | | | | | | | | | | Dividends declared and payable | | $ | — | | $ | (7,786 | ) | $ | — | | New Mountain Guardian AIV, L.P. contribution of New Mountain Finance Holdings, L.L.C units for shares of New Mountain Finance AIV Holdings, L.L.C. | | | — | | | — | | | 298,407 | | Deferred offering costs allocated from New Mountain Finance Holdings, L.L.C. | | | (50 | ) | | (241 | ) | | (7,559 | ) |
The accompanying notes are an integral part of these financial statements.
Table of Contents
Combined Notes to the Consolidated Financial Statements of New Mountain Finance Holdings, L.L.C.,
the Financial Statements of New Mountain Finance Corporation and the Financial Statements
of New Mountain Finance AIV Holdings Corporation
December 31, 2013
2014
(in thousands, except units/shares and per unit/share data) The information in these combined notes to the financial statements relates to each of the three separate registrants: New Mountain Finance Holdings, L.L.C., New Mountain Finance Corporation and New Mountain Finance AIV Holdings Corporation (collectively, the "Companies"). Information that relates to an individual registrant will be specifically referenced by the respective company. None of the Companies makes any representation as to the information related solely to the other registrants other than itself.
Note 1. Formation and Business Purpose New Mountain Finance Holdings, L.L.C. (the "Operating Company"Corporation ("NMFC" or the "Master Fund""Company") is a Delaware limited liability company. The Operating Companycorporation that was originally incorporated on June 29, 2010. NMFC is externally managed anda closed-end, non-diversified management investment company that has elected to be treatedregulated as a business development company ("BDC") under the Investment Company Act of 1940, as amended (the "1940 Act"). As such, the Operating CompanyNMFC is obligated to comply with certain regulatory requirements. The Operating CompanyNMFC has elected to be treated, and intends to becomply with the requirements to continue to qualify annually, as a regulated investment company ("RIC") under Subchapter M of the Internal Revenue Code of 1986, as amended, (the "Code"). NMFC is also registered as an investment adviser under the Investment Advisers Act of 1940, as amended (the "Advisers Act"). On May 19, 2011, NMFC priced its initial public offering (the "IPO") of 7,272,727 shares of common stock at a public offering price of $13.75 per share. Concurrently with the closing of the IPO and at the public offering price of $13.75 per share, NMFC sold an additional 2,172,000 shares of its common stock to certain executives and employees of, and other individuals affiliated with, New Mountain Capital (defined as New Mountain Capital Group, L.L.C. and its affiliates) in a concurrent private placement (the "Concurrent Private Placement"). Additionally, 1,252,964 shares were issued to the partners of New Mountain Guardian Partners, L.P. at that time for their ownership interest in the Predecessor Entities (as defined below). In connection with NMFC's IPO and through a series of transactions, New Mountain Finance Holdings, L.L.C. ("NMF Holdings" or the "Predecessor Operating Company") acquired all of the operations of the Predecessor Entities, including all of the assets and liabilities related to such operations. NMF Holdings is a Delaware limited liability company. Until May 8, 2014, NMF Holdings was externally managed and was regulated as a BDC under the 1940 Act. As such, NMF Holdings was obligated to comply with certain regulatory requirements. NMF Holdings was treated as a partnership for United States ("U.S.") federal income tax purposes for so long as it hashad at least two members. With the completion of the underwritten secondary offering on February 3, 2014, NMF Holdings' existence as a partnership for U.S. federal income tax purposes terminated and NMF Holdings became an entity that is disregarded as a separate entity from its owner for U.S. federal tax purposes. For additional information on the Company's organizational structure prior to May 8, 2014, see "—Restructuring". The Operating Company isUntil May 8, 2014, NMF Holdings was externally managed by New Mountain Finance Advisers BDC, L.L.C. (the "Investment Adviser"). As of May 8, 2014, the Investment Adviser serves as the external investment adviser to NMFC. New Mountain Finance Administration, L.L.C. (the "Administrator") provides the administrative services necessary for operations. The Investment Adviser and Administrator are wholly-owned subsidiaries of New Mountain Capital (defined as New Mountain Capital Group, L.L.C. and its affiliates).Capital. New Mountain Capital is a firm with a track record of investing in the middle market and with assets under management (which includes amounts committed, not all of which have been drawn down and invested to date) totaling more than $12.0 billion as of December 31, 2013, which includes total assets held by the Operating Company.market. New Mountain Capital focuses on investing in defensive growth companies across its private equity, public equity and credit investment vehicles. The Operating Company,NMF Holdings, formerly known as New Mountain Guardian (Leveraged), L.L.C., was originally formed as a subsidiary of New Mountain Guardian AIV, L.P. ("Guardian AIV") by New Mountain Capital in October 2008. Guardian AIV was formed through an allocation of approximately $300.0 million of the $5.1 billion of commitments supporting New Mountain Partners III, L.P., a private equity fund managed by New Mountain Capital. In February 2009, New Mountain Capital formed a co-investment vehicle, New Mountain Guardian Partners, L.P., comprising $20.4 million of commitments. New Mountain
Table of Contents
Notes to the Consolidated Financial Statements of
New Mountain Finance Corporation (Continued)
December 31, 2014
(in thousands, except share data) Note 1. Formation and Business Purpose (Continued) Guardian (Leveraged), L.L.C. and New Mountain Guardian Partners, L.P., together with their respective direct and indirect wholly-owned subsidiaries, are defined as the "Predecessor Entities". Prior to December 18, 2014, New Mountain Finance CorporationSPV Funding, L.L.C. ("NMFC"NMF SLF") iswas a Delaware corporation thatlimited liability company. NMF SLF was originally incorporated on June 29, 2010. NMFC is a closed-end, non-diversified management investment company that has elected to be treated aswholly-owned subsidiary of NMF Holdings and thus a BDC under the 1940 Act. As such, NMFC is obligated to comply with certain regulatory requirements. NMFC has elected to be treated, and intends to comply with the requirements to continue to qualify annually, as a regulated investment company ("RIC") under Subchapter Mwholly-owned indirect subsidiary of the Internal Revenue CodeCompany. NMF SLF was bankruptcy-remote and non-recourse to NMFC. As part of 1986, as amended, (the "Code").an amendment to the Company's existing credit facilities with Wells Fargo Bank, National Association, NMF SLF merged with and into NMF Holdings on December 18, 2014. See Note 7,Borrowings, for details. Until April 25, 2014, New Mountain Finance AIV Holdings Corporation ("AIV Holdings") iswas a Delaware corporation that was originally incorporated on March 11, 2011. AIV Holdings was dissolved on April 25, 2014. Guardian AIV, a Delaware limited partnership, iswas AIV Holdings' sole stockholder. AIV Holdings iswas a closed-end, non-diversified management investment company that has elected to be treatedwas regulated as a BDC under the 1940 Act. As such, AIV Holdings is
Table of Contents
Combined Notes to the Consolidated Financial Statements of New Mountain Finance Holdings, L.L.C.,
the Financial Statements of New Mountain Finance Corporation and the Financial Statements
of New Mountain Finance AIV Holdings Corporation (Continued)
December 31, 2013
(in thousands, except units/shares and per unit/share data)
Note 1. Formation and Business Purpose (Continued)
was obligated to comply with certain regulatory requirements. AIV Holdings has elected to bewas treated, and intends to complycomplied with the requirements to continue to qualify annually, as a RIC under the Code. On May 19, 2011, NMFC priced its initial public offering (the "IPO") of 7,272,727 shares of common stock at a public offering price of $13.75 per share. Concurrently with the closing of the IPO and at the public offering price of $13.75 per share, NMFC sold an additional 2,172,000 shares of its common stock to certain executives and employees of, and other individuals affiliated with, New Mountain Capital in a concurrent private placement (the "Concurrent Private Placement"). Additionally, 1,252,964 shares were issuedPrior to the partners of New Mountain Guardian Partners, L.P. at that time for their ownership interest in the Predecessor Entities. In connection with NMFC's IPO and through a series of transactions, the Operating Company owns all of the operations of the Predecessor Entities, including all of the assets and liabilities related to such operations. Restructuring (as defined below) on May 8, 2014, NMFC and AIV Holdings arewere holding companies with no direct operations of their own, and their sole asset iswas their ownership in NMF Holdings. In connection with the Operating Company.IPO, NMFC and AIV Holdings each entered into a joinder agreement with respect to the Limited Liability Company Agreement, as amended and restated (the "Operating Agreement"), of the Operating Company,NMF Holdings, pursuant to which NMFC and AIV Holdings were admitted as members of the Operating Company.NMF Holdings. NMFC acquired from the Operating Company,NMF Holdings, with the gross proceeds of the IPO and the Concurrent Private Placement, common membership units ("units") of the Operating CompanyNMF Holdings (the number of units arewere equal to the number of shares of NMFC's common stock sold in the IPO and the Concurrent Private Placement). Additionally, NMFC received units of the Operating CompanyNMF Holdings equal to the number of shares of common stock of NMFC issued to the partners of New Mountain Guardian Partners, L.P. Guardian AIV was the parent of the Operating CompanyNMF Holdings prior to the IPO and, as a result of the transactions completed in connection with the IPO, obtained units in the Operating Company.NMF Holdings. Guardian AIV contributed its units in the Operating CompanyNMF Holdings to its newly formed subsidiary, AIV Holdings, in exchange for common stock of AIV Holdings. AIV Holdings hashad the right to exchange all or any portion of its units in the Operating CompanyNMF Holdings for shares of NMFC's common stock on a one-for-one basis at any time. Since NMFC's IPO, and through December 31, 2013, NMFC raised approximately $233,468 in net proceeds from additional offerings of common stock and issued shares of its common stock valued at approximately $249,576 on behalf of AIV Holdings for exchanged units. NMFC acquired from the Operating Company units of the Operating Company equal to the number of shares of NMFC's common stock sold in the additional offerings. As of December 31, 2013, NMFC and AIV Holdings owned approximately 94.4% and 5.6%, respectively, of the units of the Operating Company. The currentoriginal structure was designed to generally prevent NMFC from being allocated taxable income with respect to unrecognized gains that existed at the time of the IPO in the Predecessor Entities' assets, and rather such amounts would be allocated generally to AIV Holdings. The result iswas that any distributions made to NMFC's stockholders that arewere attributable to such gains generally willwere not be treated as taxable dividends but rather as return of capital. Since NMFC's IPO, and through December 31, 2014, NMFC raised approximately $374,625 in net proceeds from additional offerings of common stock and issued shares of its common stock valued at approximately $288,416 on behalf of AIV Holdings for exchanged units. NMFC acquired from NMF Holdings units of NMF Holdings equal to the number of shares of NMFC's common stock sold in the
Table of Contents
Combined Notes to the Consolidated Financial Statements of New Mountain Finance Holdings, L.L.C.,
the Financial Statements of New Mountain Finance Corporation (Continued)
December 31, 2014
(in thousands, except share data) Note 1. Formation and Business Purpose (Continued) additional offerings. With the completion of the final secondary offering on February 3, 2014, NMFC owned 100.0% of the units of NMF Holdings, which became a wholly-owned subsidiary of NMFC. Restructuring As a BDC, AIV Holdings had been subject to the 1940 Act, including certain provisions applicable only to BDCs. Accordingly, and after careful consideration of the 1940 Act requirements applicable to BDCs, the cost of 1940 Act compliance and a thorough assessment of AIV Holdings' business model, AIV Holdings' board of directors determined that continuation as a BDC was not in the best interests of AIV Holdings and Guardian AIV. Specifically, given that AIV Holdings was formed for the sole purpose of holding units of NMF Holdings and AIV Holdings had disposed of all of the units of NMF Holdings that it was holding as of February 3, 2014, the board of directors of AIV Holdings approved and declared advisable at an in-person meeting held on March 25, 2014 the withdrawal of AIV Holdings' election to be regulated as a BDC under the 1940 Act. In addition, the board of directors of AIV Holdings approved and declared advisable for AIV Holdings to terminate its registration under Section 12(g) of the Securities Exchange Act of 1934, as amended (the "Exchange Act") and to dissolve AIV Holdings under the laws of the State of Delaware. Upon receipt of the necessary stockholder consent to authorize the board of directors of AIV Holdings to withdraw AIV Holdings' election to be regulated as a BDC, the withdrawal was filed and became effective upon receipt by the U.S. Securities and Exchange Commission ("SEC") of AIV Holdings' notification of withdrawal on Form N-54C on April 15, 2014. The board of directors of AIV Holdings believed that AIV Holdings met the requirements for filing the notification to withdraw its election to be regulated as a BDC, upon the receipt of the necessary stockholder consent. After the notification of withdrawal of AIV Holdings' BDC election was filed with the SEC, AIV Holdings was no longer subject to the regulatory provisions of the 1940 Act applicable to BDCs generally, including regulations related to insurance, custody, composition of its board of directors, affiliated transactions and any compensation arrangements. In addition, on April 15, 2014, AIV Holdings filed a Form 15 with the SEC to terminate AIV Holdings' registration under Section 12(g) of the Exchange Act. After these SEC filings and any other federal or state regulatory or tax filings were made, AIV Holdings proceeded to dissolve under Delaware law by filing a certificate of dissolution in Delaware on April 25, 2014. Until May 8, 2014, as a BDC, NMF Holdings had been subject to the 1940 Act, including certain provisions applicable only to BDCs. Accordingly, and after careful consideration of the 1940 Act requirements applicable to BDCs, the cost of 1940 Act compliance and a thorough assessment of NMF Holdings' current business model, NMF Holdings' board of directors determined at an in-person meeting held on March 25, 2014 that continuation as a BDC was not in the best interests of NMF Holdings. At the 2014 joint annual meeting of the stockholders of NMFC and the sole unit holder of NMF Holdings held on May 6, 2014, the stockholders of NMFC and the sole unit holder of NMF Holdings approved a proposal which authorized the board of directors of NMF Holdings to withdraw NMF Holdings' election to be regulated as a BDC. Additionally, the stockholders of NMFC approved a new investment advisory and management agreement between NMFC and the Investment Adviser. Upon
Table of Contents
Notes to the Consolidated Financial Statements of
of New Mountain Finance AIV Holdings Corporation (Continued)
December 31, 2013 2014
(in thousands, except units/sharesshare data) Note 1. Formation and per unit/Business Purpose (Continued) receipt of the necessary stockholder/unit holder approval to authorize the board of directors of NMF Holdings to withdraw NMF Holdings' election to be regulated as a BDC, the withdrawal was filed and became effective upon receipt by the SEC of NMF Holdings' notification of withdrawal on Form N-54C on May 8, 2014. Effective May 8, 2014, NMF Holdings amended and restated its Operating Agreement such that the board of directors of NMF Holdings was dissolved and NMF Holdings remained a wholly-owned subsidiary of NMFC with the sole purpose of serving as a special purpose vehicle for NMF Holdings' credit facility, and NMFC assumed all other operating activities previously undertaken by NMF Holdings under the management of the Investment Adviser (collectively, the "Restructuring"). After the Restructuring, all wholly-owned direct and indirect subsidiaries of NMFC are consolidated with NMFC for both 1940 Act and financial statement reporting purposes, subject to any financial statement adjustments required in accordance with accounting principles generally accepted in the United States of America ("GAAP"). NMFC continues to remain a BDC under the 1940 Act. Also, on May 8, 2014, NMF Holdings filed Form 15 with the SEC to terminate NMF Holdings' registration under Section 12(g) of the Exchange Act. As a special purpose entity, NMF Holdings is bankruptcy-remote and non-recourse to NMFC. In addition, the assets held at NMF Holdings will continue to be used to secure NMF Holdings' credit facility. Current Organization During the year ended December 31, 2014, the Company established wholly-owned subsidiaries, NMF Ancora Holdings Inc. ("NMF Ancora") and NMF YP Holdings Inc. ("NMF YP"), which are structured as Delaware entities that serve as tax blocker corporations which hold equity or equity-like investments in portfolio companies organized as limited liability companies (or other forms of pass-through entities). Tax blocker corporations are not consolidated for income tax purposes and may incur income tax expense as a result of their ownership of portfolio companies. Additionally, the Company has a wholly-owned subsidiary, New Mountain Finance Servicing, L.L.C. ("NMF Servicing") that serves as the administrative agent on certain investment transactions. New Mountain Finance SBIC, L.P. ("SBIC LP"), and its general partner, New Mountain Finance SBIC G.P., L.L.C. ("SBIC GP"), were organized in Delaware as a limited partnership and limited liability company, respectively. SBIC LP and SBIC GP are consolidated wholly-owned direct and indirect subsidiaries of the Company. SBIC LP received a license from the U.S. Small Business Association (the "SBA") to operate as a small business investment company ("SBIC") under Section 301(c) of the Small Business Investment Act of 1958, as amended (the "1958 Act").
Table of Contents
Notes to the Consolidated Financial Statements of
New Mountain Finance Corporation (Continued)
December 31, 2014
(in thousands, except share data) Note 1. Formation and Business Purpose (Continued) The diagram below depicts the Companies'Company's organizational structure as of December 31, 2013.2014. 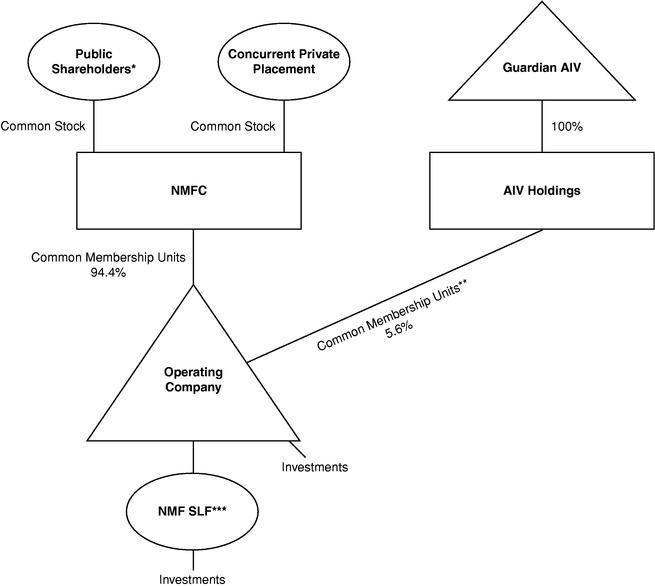
- *
- Includes partners of New Mountain Guardian Partners, L.P.
- **
These common membership units are exchangeable into sharesNMFC is the sole limited partner of SBIC LP. NMFC, common stock on a one-for-one basis.
***New Mountain Finance SPV Funding, L.L.C. ("NMF SLF").directly or indirectly through SBIC GP, wholly-owns SBIC LP. NMFC owns 100.0% of SBIC GP which owns 1.0% of SBIC LP. NMFC owns 99.0% of SBIC LP.
Table of Contents
Combined Notes to the Consolidated Financial Statements of New Mountain Finance Holdings, L.L.C.,
the Financial Statements of New Mountain Finance Corporation and the Financial Statements
of New Mountain Finance AIV Holdings Corporation (Continued)
December 31, 2013
(in thousands, except units/shares and per unit/share data)
Note 1. Formation and Business Purpose (Continued)
The Operating Company's investment objective is to generate current income and capital appreciation through the sourcing and origination of debt securities at all levels of the capital structure, including first and second lien debt, notes, bonds and mezzanine securities. In some cases, the Operating Company's investments may also include equity interests. The primary focus is in the debt of defensive growth companies, which are defined as generally exhibiting the following characteristics: (i) sustainable secular growth drivers, (ii) high barriers to competitive entry, (iii) high free cash flow after capital expenditure and working capital needs, (iv) high returns on assets and (v) niche market dominance. Similar to the Company, SBIC LP's investment objective is to generate current income and capital appreciation under the investment criteria used by the Company, however, SBIC LP's investments must be SBA eligible companies. The Company's portfolio may be concentrated in a limited number of industries. As of December 31, 2014, the Company's top five industry concentrations were software, business services, education, federal services and healthcare services. Note 2. Summary of Significant Accounting Policies Basis of accounting—The Companies'Company's consolidated financial statements have been prepared in conformity with accounting principles generally accepted in the United States of America ("GAAP").GAAP. The Operating Company consolidates its wholly-owned subsidiary, NMF SLF. NMFC and AIV Holdings do not consolidate the Operating Company. NMFC and AIV Holdings applyis an investment company master-feeder financial statement presentation, as describedfollowing accounting and reporting
Table of Contents
Notes to the Consolidated Financial Statements of
New Mountain Finance Corporation (Continued)
December 31, 2014
(in thousands, except share data) Note 2. Summary of Significant Accounting Policies (Continued) guidance in Accounting Standards Codification Topic 946,Financial Services—Investment Companies, ("ASC 946"). NMFC consolidates its wholly-owned direct and indirect subsidiaries: NMF Holdings, NMF Servicing, SBIC LP, SBIC GP, NMF Ancora and NMF YP. Previously, the Company consolidated its wholly-owned indirect subsidiary NMF SLF until it merged with and into NMF Holdings on December 18, 2014. See Note 7,Borrowings, for details. Prior to the Restructuring, the Predecessor Operating Company consolidated its wholly-owned subsidiary, NMF SLF. NMFC and AIV Holdings did not consolidate the Predecessor Operating Company. Prior to the Restructuring, NMFC and AIV Holdings applied investment company master-feeder financial statement presentation, as described in ASC 946 to their interest in the Predecessor Operating Company. NMFC and AIV Holdings observeobserved that it iswas also industry practice to follow the presentation prescribed for a master fund-feeder fund structure in ASC 946 in instances in which a master fund iswas owned by more than one feeder fund and that such presentation providesprovided stockholders of NMFC and AIV Holdings with a clearer depiction of their investment in the master fund. The Companies'Company's consolidated financial statements reflect all adjustments and reclassifications which, in the opinion of management, are necessary for the fair presentation of the results of operations and financial condition for all periods presented. All intercompany transactions have been eliminated. Revenues are recognized when earned and expenses when incurred. The financial results of the Operating Company's portfolio investments are not consolidated in the financial statements. Prior to the IPO, an affiliate of the Predecessor Entities paid a majority of the management and incentive fees. Historical operating expenses do not reflect the allocation of certain professional fees, administrative and other expenses that have been incurred following the completion of the IPO. Accordingly, the Predecessor Operating Company's historical operating expenses are not comparable to its operating expenses after the completion of the IPO. The Companies'Company's consolidated financial statements are prepared in accordance with GAAP and pursuant to the requirements for reporting on Form 10-K and Article 6 of Regulation S-X. In the opinion of management, all adjustments, consisting solely of normal recurring accruals considered necessary for the fair presentation of financial statements have been included. Investments—The Operating Company applies fair value accounting in accordance with GAAP. Fair value is the amount that would be received to sell an asset or paid to transfer a liability in an orderly transaction between market participants at the measurement date. Investments are reflected on the Operating Company's Consolidated Statements of Assets Liabilities and Members' CapitalLiabilities at fair value, with changes in unrealized gains and losses resulting from changes in fair value reflected in the Operating Company's Consolidated Statements of Operations as "Net change in unrealized
Table of Contents
Combined Notes to the Consolidated Financial Statements of New Mountain Finance Holdings, L.L.C.,
the Financial Statements of New Mountain Finance Corporation and the Financial Statements
of New Mountain Finance AIV Holdings Corporation (Continued)
December 31, 2013
(in thousands, except units/shares and per unit/share data)
Note 2. Summary of Significant Accounting Policies (Continued)
appreciation (depreciation) of investments" and realizations on portfolio investments reflected in the Operating Company's Consolidated Statements of Operations as "Net realized gains (losses) on investments". The Operating Company values its assets on a quarterly basis, or more frequently if required under the 1940 Act. In all cases, the Operating Company's board of directors is ultimately and solely responsible for determining the fair value of the portfolio investments on a quarterly basis in good faith, including investments that are not publicly traded, those whose market prices are not readily available and any other situation where its portfolio investments require a fair value determination. Security transactions
Table of Contents
Notes to the Consolidated Financial Statements of
New Mountain Finance Corporation (Continued)
December 31, 2014
(in thousands, except share data) Note 2. Summary of Significant Accounting Policies (Continued) are accounted for on a trade date basis. The Operating Company's quarterly valuation procedures are set forth in more detail below: - (1)
- Investments for which market quotations are readily available on an exchange are valued at such market quotations based on the closing price indicated from independent pricing services.
- (2)
- Investments for which indicative prices are obtained from various pricing services and/or brokers or dealers are valued through a multi-step valuation process, as described below, to determine whether the quote(s) obtained is representative of fair value in accordance with GAAP.
- a.
- Bond quotes are obtained through independent pricing services. Internal reviews are performed by the investment professionals of the Investment Adviser to ensure that the quote obtained is representative of fair value in accordance with GAAP and if so, the quote is used. If the Investment Adviser is unable to sufficiently validate the quote(s) internally and if the investment's par value or its fair value exceeds the materiality threshold, the investment is valued similarly to those assets with no readily available quotes (see (3) below); and
- b.
- For investments other than bonds, the
Operating Company looks at the number of quotes readily available and performs the following:
- i.
- Investments for which two or more quotes are received from a pricing service are valued using the mean of the mean of the bid and ask of the quotes obtained.
- ii.
- Investments for which one quote is received from a pricing service are validated internally. The investment professionals of the Investment Adviser analyze the market quotes obtained using an array of valuation methods (further described below) to validate the fair value. If the Investment Adviser is unable to sufficiently validate the quote internally and if the investment's par value or its fair value exceeds the materiality threshold, the investment is valued similarly to those assets with no readily available quotes (see (3) below).
Table of Contents
Combined Notes to the Consolidated Financial Statements of New Mountain Finance Holdings, L.L.C.,
the Financial Statements of New Mountain Finance Corporation and the Financial Statements
of New Mountain Finance AIV Holdings Corporation (Continued)
December 31, 2013
(in thousands, except units/shares and per unit/share data)
Note 2. Summary of Significant Accounting Policies (Continued)
- (3)
- Investments for which quotations are not readily available through exchanges, pricing services, brokers, or dealers are valued through a multi-step valuation process:
- a.
- Each portfolio company or investment is initially valued by the investment professionals of the Investment Adviser responsible for the credit monitoring;
- b.
- Preliminary valuation conclusions will then be documented and discussed with the
Operating Company's senior management;
- c.
- If an investment falls into (3) above for four consecutive quarters and if the investment's par value or its fair value exceeds the materiality threshold, then at least once each fiscal year, the valuation for each portfolio investment for which the
Operating Company does not have a readily available market quotation will be reviewed by an independent valuation firm engaged by the Companies'Company's board of directors; and
- d.
- When deemed appropriate by the
Operating Company's management, an independent valuation firm may be engaged to review and value investment(s) of a portfolio company, without any
Table of Contents
Notes to the Consolidated Financial Statements of
New Mountain Finance Corporation (Continued)
December 31, 2014
(in thousands, except share data) Note 2. Summary of Significant Accounting Policies (Continued) For investments in revolving credit facilities and delayed draw commitments, the cost basis of the funded investments purchased is offset by any costs/netbacks received for any unfunded portion on the total balance committed. The fair value is also adjusted for the price appreciation or depreciation on the unfunded portion. As a result, the purchase of commitments not completely funded may result in a negative fair value until it is called and funded. The values assigned to investments are based upon available information and do not necessarily represent amounts which might ultimately be realized, since such amounts depend on future circumstances and cannot be reasonably determined until the individual positions are liquidated. Due to the inherent uncertainty of determining the fair value of investments that do not have a readily available market value, the fair value of the Operating Company's investments may fluctuate from period to period and the fluctuations could be material. Prior to the Restructuring, NMFC and AIV Holdings arewas a holding companiescompany with no direct operations of theirits own, and theirits sole asset is theirwas its ownership in the Predecessor Operating Company. Prior to the completion of the underwritten secondary public offering on February 3, 2014, AIV Holdings was a holding company with no direct operations of its own, and its sole asset was its ownership in the Predecessor Operating Company. NMFC's and AIV Holdings' investments in the Predecessor Operating Company arewere carried at fair value and representrepresented the respective pro-rata interest in the net assets of the Predecessor Operating Company as of the applicable reporting date. NMFC and AIV Holdings valuevalued their ownership interest on a quarterly basis, or more frequently if required under the 1940 Act. See Note 3,Investments, for further discussion relating to investments. Collateralized agreements or repurchase financings—The Company follows the guidance in Accounting Standards Codification Topic 860,Transfers and Servicing—Secured Borrowing and Collateral, ("ASC 860") when accounting for transactions involving the purchases of securities under collateralized agreements to resell (resale agreements). These transactions are treated as collateralized financing transactions and are recorded at their contracted resale or repurchase amounts, as specified in the respective agreements. Interest on collateralized agreements is accrued and recognized over the life of the transaction and included in interest income. As of December 31, 2014, the Company held one collateralized agreement to resell with a carrying value of $30,000, collateralized by a security with a fair value of $30,000 and guaranteed by the counterparty. The counterparty has the option to repurchase the collateral from the Company at the par value of the collateralized agreement within a year. The collateralized agreement earns interest at a rate of 15.0% per annum as of December 31, 2014. The Predecessor Operating Company did not have any collateralized agreements as of the year ended December 31, 2013. Cash and cash equivalents—Cash and cash equivalents include cash and short-term, highly liquid investments. The Companies defineCompany defines cash equivalents as securities that are readily convertible into known amounts of cash and so near maturity that there is insignificant risk of changes in value. Generally, theseThese securities have original maturities of three months or less.
Table of Contents
Combined Notes to the Consolidated Financial Statements of New Mountain Finance Holdings, L.L.C.,
the Financial Statements of New Mountain Finance Corporation and the Financial Statements
of New Mountain Finance AIV Holdings Corporation (Continued)
December 31, 2013 2014
(in thousands, except units/shares and per unit/share data) Note 2. Summary of Significant Accounting Policies (Continued) Revenue recognition The Operating Company's revenue recognition policies are as follows: Sales and paydowns of investments:Realized gains and losses on investments are determined on the specific identification method. Interest income:Interest income, including amortization of premium and discount using the effective interest method, is recorded on the accrual basis and periodically assessed for collectability. Interest income also includes interest earned from cash on hand. Upon the prepayment of a loan or debt security, any prepayment penalties are recorded as part of interest income. The Operating Company has loans in the portfolio that contain a payment-in-kind ("PIK") provision. PIK represents interest that is accrued and recorded as interest income at the contractual rates, if deemed collectible, added to the loan principal on the respective capitalization dates, and generally due at maturity. Non-accrual income:Loans are placed on non-accrual status when principal or interest payments are past due 30 days or more and when there is reasonable doubt that principal or interest will be collected. Accrued cash and un-capitalized PIK interest is generally reversed when a loan is placed on non-accrual status. Previously capitalized PIK interest is not reversed when an investment is placed on non-accrual status. Interest payments received on non-accrual loans may be recognized as income or applied to principal depending upon management's judgment of the ultimate outcome. Non-accrual loans are restored to accrual status when past due principal and interest is paid and, in management's judgment, are likely to remain current. Dividend income:Dividend income is recorded on the record date for private portfolio companies or on the ex-dividend date for publicly traded portfolio companies. Other income:Other income represents delayed compensation, consent or amendment fees, revolver fees, structuring fees, management fees from a non-controlled/affiliated investment and other miscellaneous fees received.received and are typically non-recurring in nature. Delayed compensation is income earned from counterparties on trades that do not settle within a set number of business days after trade date. Other income may also include fees from bridge loans. The Operating Company may from time to time enter into bridge financing commitments, an obligation to provide interim financing to a counterparty until permanent credit can be obtained. These commitments are short-term in nature and may expire unfunded. A fee is received by the Operating Company for providing such commitments. Structuring fees are recognized as income when earned, usually when paid at the closing of the investment and are non-refundable.
Prior to the Restructuring, NMFC's and AIV Holdings' revenue recognition policies arewere as follows: Revenue, expenses, and capital gains (losses):At each quarterly valuation date, the Predecessor Operating Company's investment income, expenses, net realized gains (losses), and net increase (decrease) in unrealized appreciation (depreciation) arewere allocated to NMFC and AIV Holdings based on theirits pro-rata interest in the net assets of the Predecessor Operating Company. This iswas recorded on NMFC's and AIV Holdings' Statements of Operations. Realized gains and losses arewere recorded upon sales of NMFC's and AIV Holdings' investments in the Predecessor Operating Company. Net change in unrealized appreciation (depreciation) of
Table of Contents
Combined Notes to the Consolidated Financial Statements of New Mountain Finance Holdings, L.L.C.,
the Financial Statements of New Mountain Finance Corporation and the Financial Statements
of New Mountain Finance AIV Holdings Corporation (Continued)
December 31, 2013 2014
(in thousands, except units/shares and per unit/share data) Note 2. Summary of Significant Accounting Policies (Continued) appreciation (depreciation) of investment in New Mountain Finance Holdings, L.L.C. iswas the difference between the net asset value per share and the closing price per share for shares issued as part of the dividend reinvestment plan on the dividend payment date. This net change in unrealized appreciation (depreciation) of investment in New Mountain Finance Holdings, L.L.C. includesincluded the unrealized appreciation (depreciation) from the IPO. NMFC used the proceeds from its IPO and Concurrent Private Placement to purchase units in the Predecessor Operating Company at $13.75 per unit (its IPO price per share). At the IPO date, $13.75 per unit represented a discount to the actual net asset value per unit of the Predecessor Operating Company. As a result, NMFC experienced immediate unrealized appreciation on its investment. Concurrently, AIV Holdings experienced immediate unrealized depreciation on its investment in the Operating Company equal to the difference between NMFC's IPO price of $13.75 per unit and the actual net asset value per unit.
All expenses, including those of NMFC, and AIV Holdings, arewere paid and recorded by the Predecessor Operating Company. Expenses arewere allocated to NMFC and AIV Holdings based on its pro-rata ownership interest. In addition, the Predecessor Operating Company paid all of the offering costs related to the IPO and subsequent offerings. NMFC and AIV Holdings have recorded theirits portion of the offering costs as a direct reduction to net assets and the cost of theirits investment in the Predecessor Operating Company. With respect to the expenses incident to any registration of shares of NMFC's common stock issued in exchange for AIV Holdings' units of the Operating Company, AIV Holdings is directly responsible for the expenses of any demand registration (including underwriters' discounts or commissions) and their pro-rata share of any "piggyback" registration expenses.
Interest and other credit facilityfinancing expenses—Interest and other credit facilityfinancing fees are recorded on an accrual basis by the Operating Company. See Note 7,Borrowing FacilitiesBorrowings, for details. Deferred credit facilityfinancing costs—The deferred credit facilityfinancing costs of the Operating Company consistconsists of capitalized expenses related to the origination and amending of the Operating Company's existing credit facilities.borrowings. The Operating Company amortizes these costs into expense using the straight-line method over the stated life of the related credit facility.borrowing. See Note 7,Borrowing FacilitiesBorrowings, for details. Income taxes—The Operating Company is treated as a partnership for federal income tax purposes and as such is generally not subject to federal or state and local income taxes except with respect to state source income received from underlying investments. The partners are individually responsible for reporting income or loss based on their respective share of the revenues and expenses. The Operating Company files United States ("U.S.") federal, state, and local income tax returns. NMFC and AIV Holdings havehas elected to be treated, and intendintends to comply with the requirements to qualify annually, as RICsa RIC under subchapter M of the Code. As RICs, NMFC and AIV Holdings area RIC, the Company is not subject to U.S. federal income tax on the portion of taxable income and gains timely distributed to stockholders; therefore, no provision for income taxes has been recorded.its stockholders.
To continue to qualify as RICs, NMFC and AIV Holdings area RIC, the Company is required to meet certain income and asset diversification tests in addition to distributing at least 90.0% of their respectiveits investment
Table of Contents
Combined Notes to the Consolidated Financial Statements of New Mountain Finance Holdings, L.L.C.,
the Financial Statements of New Mountain Finance Corporation and the Financial Statements
of New Mountain Finance AIV Holdings Corporation (Continued)
December 31, 2013
(in thousands, except units/shares and per unit/share data)
Note 2. Summary of Significant Accounting Policies (Continued)
company taxable income, as defined by the Code. Since U.S. federal income tax regulations differ from GAAP, distributions in accordance with tax regulations may differ from net investment income and realized gains recognized for financial reporting purposes. Differences between taxable income and the results of operations for financial reporting purposes may be permanent or temporary in nature. Permanent differences are reclassified among capital accounts in the financial statements to reflect their tax character. Differences in classification may also result from the treatment of short-term gains as ordinary income for tax purposes. For U.S. federal income tax purposes, distributions paid to stockholders of NMFC and AIV Holdingsthe Company are reported as ordinary income, return of capital, long term capital gains or a combination thereof. NMFC and AIV HoldingsThe Company will be subject to a 4.0% nondeductible federal excise tax on certain undistributed income unless NMFC and AIV Holdings distribute,the Company distributes, in a timely manner as required by the Code, an amount at least equal to the sum of (1) 98.0% of theirits respective net ordinary income earned for the calendar year
Table of Contents
Notes to the Consolidated Financial Statements of
New Mountain Finance Corporation (Continued)
December 31, 2014
(in thousands, except share data) Note 2. Summary of Significant Accounting Policies (Continued) and (2) 98.2% of theirits respective capital gain net income for the one-year period ending October 31 in the calendar year. Certain consolidated subsidiaries of the Company are subject to U.S. federal and state income taxes. These taxable entities are not consolidated for income tax purposes and may generate income tax liabilities or assets from permanent and temporary differences in the recognition of items for financial reporting and income tax purposes. For the year ended December 31, 2014, the Company recognized a total provision for income taxes of $929, for the Company's consolidated subsidiaries. The Companies haveCompany did not recognize a benefit or provision for taxes during the year ended December 31, 2013. As of December 31, 2014 and December 31, 2013, the Company had $493 and $0, respectively, of deferred tax liabilities primarily relating to deferred taxes attributable to certain differences between the computation of income for U.S. federal income tax purposes as compared to GAAP. For the year ended December 31, 2014, the Company recorded current income tax expense of approximately $436. The Company did not recognize any income tax expense for the year ended December 31, 2013. The Company has adopted the Income Taxes topic of the Accounting Standards Codification Topic 740 ("ASC 740"). ASC 740 provides guidance for income taxes, including how uncertain income tax positions should be recognized, measured, and disclosed in the financial statements. Based on their analyses,its analysis, the Companies haveCompany has determined that there were no material uncertain income tax positions through December 31, 2013.2014. The 2011, 2012, 2013 and 20132014 tax years remain subject to examination by the U.S. federal, state, and local tax authorities. Dividends—Distributions to common unit holdersstockholders of the Operating Company and common stockholders of NMFC and AIV Holdings are recorded on the record date as set by the respective board of directors. In order for NMFC and AIV Holdings to pay a dividend or other distribution to holders of their common stock, it must be accompanied by a prior distribution by the Operating Company to all of its unit holders. The Operating Company intends to make distributions to its unit holdersstockholders that will be sufficient to enable NMFC and AIV Holdings to pay quarterly distributions to their stockholders andthe Company to maintain theirits status as RICs. NMFC and AIV Holdings intenda RIC. The Company intends to distribute approximately all of their portion of the Operating Company'sits adjusted net investment income (see Note 5,Agreements) on a quarterly basis and substantially all of their portion of the Operating Company'sits taxable income on an annual basis, except that NMFCthe Company may retain certain net capital gains for reinvestment. Under certain circumstances, the distributions that the OperatingThe Company makes to its members may not be sufficient for AIV Holdings to satisfy the annual distribution requirement necessary for AIV Holdings to continue to qualify as a RIC. In that case, it is expected that Guardian AIV would consent to be treated as if it received distributions from AIV Holdings sufficient to satisfy the annual distribution requirement. Guardian AIV would be required to include the consent dividend in its taxable income as a dividend from AIV Holdings, which would result in phantom (i.e., non-cash) taxable income to Guardian AIV. AIV Holdings intends to make quarterly distributions to Guardian AIV, its sole stockholder, out of assets legally available for distribution each quarter.
Table of Contents
Combined Notes to the Consolidated Financial Statements of New Mountain Finance Holdings, L.L.C.,
the Financial Statements of New Mountain Finance Corporation and the Financial Statements
of New Mountain Finance AIV Holdings Corporation (Continued)
December 31, 2013
(in thousands, except units/shares and per unit/share data)
Note 2. Summary of Significant Accounting Policies (Continued)
The Operating Company and NMFC are required to take certain actions in order to maintain, at all times, a one-to-one ratio between the number of units held by NMFC and the number of shares of NMFC's common stock outstanding. NMFC has adopted a dividend reinvestment plan that provides on behalf of its stockholders for reinvestment of any distributions declared, unless a stockholder elects to receive cash. Cash distributions reinvested in additional shares of NMFC's common stock will be automatically reinvested by NMFC into additional units of the Operating Company. In addition, AIV Holdings does not intend to reinvest any distributions received from the Operating Company in additional units of the Operating Company.
NMFCThe Company applies the following in implementing the dividend reinvestment plan. If the price at which newly issued shares are to be credited to stockholders' accounts is greater than 110.0% of the last determined net asset value of the shares, NMFCthe Company will use only newly issued shares to implement its dividend reinvestment plan. Under such circumstances, the number of shares to be issued to a stockholder is determined by dividing the total dollar amount of the distribution payable to such stockholder by the market price per share of NMFC'sthe Company's common stock on the New York Stock Exchange ("NYSE") on the distribution payment date. Market price per share on that date will be the closing price for such shares on the NYSE or, if no sale is reported for such day, the average of their electronically reported bid and asked prices. If NMFC uses newly issued shares to implement the plan, NMFC will receive, on a one-for-one basis, additional units of the Operating Company in exchange for cash distributions that are reinvested in shares of NMFC's common stock under the dividend reinvestment plan. If the price at which newly issued shares are to be credited to stockholders' accounts is less than 110.0% of the last determined net asset value of the shares, NMFCthe Company will either issue new shares
Table of Contents
Notes to the Consolidated Financial Statements of
New Mountain Finance Corporation (Continued)
December 31, 2014
(in thousands, except share data) Note 2. Summary of Significant Accounting Policies (Continued) or instruct the plan administrator to purchase shares in the open market to satisfy the additional shares required. Shares purchased in open market transactions by the plan administrator will be allocated to a stockholder based on the average purchase price, excluding any brokerage charges or other charges, of all shares of common stock purchased in the open market. The number of shares of NMFC'sthe Company's common stock to be outstanding after giving effect to payment of the distribution cannot be established until the value per share at which additional shares will be issued has been determined and elections of NMFC'sthe Company's stockholders have been tabulated. Earnings per share—The Company's earnings per share ("EPS") amounts have been computed based on the weighted-average number of shares of common stock outstanding for the period. Basic EPS is computed by dividing net increase (decrease) in net assets resulting from operations by the weighted average number of shares of common stock outstanding during the period of computation. Diluted EPS is computed by dividing net increase (decrease) in net assets resulting from operations by the weighted average number of shares of common stock assuming all potential shares had been issued, and its related net impact to net assets accounted for, and the additional shares of common stock were dilutive. Diluted EPS reflects the potential dilution, using the as-if-converted method for convertible debt, which could occur if all potentially dilutive securities were exercised. Foreign securities—The accounting records of the Operating Company are maintained in U.S. dollars. Investment securities denominated in foreign currencies are translated into U.S. dollars based on the rate of exchange of such currencies on the date of valuation. Purchases and sales of investment securities and income and expense items denominated in foreign currencies are translated into U.S. dollars based on the rate of exchange of such currencies on the respective dates of the transactions. The Operating Company does not isolate that portion of the results of operations resulting from changes in foreign exchange rates on investments from the fluctuations arising from changes in market prices of securities held. Such fluctuations are included with "Net change in unrealized appreciation (depreciation) of investments" and "Net realized gains (losses) on investments" in the Operating Company's Consolidated Statements of Operations.
Table of Contents
Combined Notes to the Consolidated Financial Statements of New Mountain Finance Holdings, L.L.C.,
the Financial Statements of New Mountain Finance Corporation and the Financial Statements
of New Mountain Finance AIV Holdings Corporation (Continued)
December 31, 2013
(in thousands, except units/shares and per unit/share data)
Note 2. Summary of Significant Accounting Policies (Continued)
Investments denominated in foreign currencies may be negatively affected by movements in the rate of exchange between the U.S. dollar and such foreign currencies. This movement is beyond the control of the Operating Company and cannot be predicted. Use of estimates—The preparation of the Companies'Company's consolidated financial statements in conformity with GAAP requires management to make estimates and assumptions that affect the reported amounts of assets and liabilities at the date of the Companies'Company's consolidated financial statements and the reported amounts of revenues and expenses during the reporting periods. Changes in the economic environment, financial markets, and other metrics used in determining these estimates could cause actual results to differ from the estimates used, and the differences could be material. Dividend income recorded related to distributions received from flow-through investments is an accounting estimate based on the most recent estimate of the tax treatment of the distribution. During the three months ended March 31, 2014, the Predecessor Operating Company adjusted an accounting estimate related to the classification of dividend income for a distribution received from one of the Predecessor Operating Company's warrant investments. Based on updated tax projections received
Table of Contents
Notes to the Consolidated Financial Statements of
New Mountain Finance Corporation (Continued)
December 31, 2014
(in thousands, except share data) Note 2. Summary of Significant Accounting Policies (Continued) during the quarter ended March 31, 2014, the Predecessor Operating Company increased dividend income by $214 and reduced the realized gain by $214 to agree to the tax treatment on the investment. This resulted in a reclass from capital gains incentive fee to incentive fee of $43 for the quarter ended March 31, 2014. Based on updated tax projections received during the three months ended June 30, 2014, the Company increased dividend income by $472 and reduced the realized gain by $472 to agree to the tax treatment of a distribution received in the first quarter of 2014 from one of the Company's warrant investments. This resulted in a reclass from capital gains incentive fee to incentive fee of $94 for the quarter ended June 30, 2014. During the quarter ended September 30, 2013, the Predecessor Operating Company changed an accounting estimate related to the classification of dividend income for a distribution recorded in the prior quarter from one of the Predecessor Operating Company's warrant investments. Based on tax projections received during the quarter ended September 30, 2013, the Predecessor Operating Company reduced the warrant cost basis by $466 and corresponding dividend income previously recorded by $1,799, and recorded a realized gain of $1,333 to agree to the tax treatment on the investment. This resulted in a reclass of $360 from incentive fee to capital gains incentive fee. Based on updated tax projections received during the quarter ended December 31, 2013, the Predecessor Operating Company increased dividend income previously recorded by $224 and reduced the realized gain previously recorded by $224 to agree to the tax treatment on the investment. This resulted in a reclass of $45 from capital gains incentive fee to incentive fee. Note 3. Investments At December 31, 2014, the Company's investments consisted of the following: | | | | | | | |
| | Cost | | Fair Value | |
|---|
First lien | | $ | 696,994 | | $ | 677,901 | | Second lien | | | 621,234 | | | 604,158 | | Subordinated | | | 61,344 | | | 61,987 | | Equity and other | | | 66,319 | | | 80,625 | | | | | | | | | | | Total investments | | $ | 1,445,891 | | $ | 1,424,671 | | | | | | | | | | | | | | | | | | | | | | | | | | | | |
Table of Contents
Notes to the Consolidated Financial Statements of
New Mountain Finance Corporation (Continued)
December 31, 2014
(in thousands, except share data) Note 3. Investments (Continued) | | | | | | | |
| | Cost | | Fair Value | |
|---|
Software | | $ | 287,538 | | $ | 287,234 | | Business Services | | | 273,088 | | | 260,325 | | Education | | | 256,522 | | | 251,916 | | Federal Services | | | 124,840 | | | 124,608 | | Healthcare Services | | | 114,111 | | | 114,692 | | Distribution & Logistics | | | 97,344 | | | 97,382 | | Energy | | | 92,393 | | | 83,890 | | Media | | | 58,281 | | | 61,081 | | Consumer Services | | | 48,350 | | | 52,348 | | Business Products | | | 25,654 | | | 25,181 | | Investment in Fund | | | 23,000 | | | 22,461 | | Specialty Chemicals and Materials | | | 19,722 | | | 19,825 | | Healthcare Products | | | 12,183 | | | 13,201 | | Industrial Services | | | 6,934 | | | 5,548 | | Healthcare Information Technology | | | 5,931 | | | 4,979 | | | | | | | | | | | Total investments | | $ | 1,445,891 | | $ | 1,424,671 | | | | | | | | | | | | | | | | | | | | | | | | | | | | |
At December 31, 2013, NMFC's only investment was its investment in the Predecessor Operating Company. At December 31, 2013, the Predecessor Operating Company's investments consisted of the following: |
| | Cost | | Fair Value | | | Cost | | Fair Value | |
|---|
First lien | | $ | 550,534 | | $ | 553,549 | | | $ | 550,534 | | $ | 553,549 | | Second lien | | 460,078 | | 468,945 | | | 460,078 | | 468,945 | | Subordinated | | 25,152 | | 26,863 | | | 25,152 | | 26,863 | | Equity and other | | 58,316 | | 66,294 | | | 58,316 | | 66,294 | | | | | | | | | | | | | | | | | | | | | | | | Total investments | | $ | 1,094,080 | | $ | 1,115,651 | | | $ | 1,094,080 | | $ | 1,115,651 | | | | | | | | | | | | | | | | | | | | | | | | | | | | | | | | | | | | | | | | | | |
Table of Contents
Combined Notes to the Consolidated Financial Statements of New Mountain Finance Holdings, L.L.C.,
the Financial Statements of New Mountain Finance Corporation and the Financial Statements
of New Mountain Finance AIV Holdings Corporation (Continued)
December 31, 2013 2014
(in thousands, except units/shares and per unit/share data) Note 3. Investments (Continued) |
| | Cost | | Fair Value | | | Cost | | Fair Value | |
|---|
Software | | $ | 243,158 | | $ | 249,174 | | | $ | 243,158 | | $ | 249,174 | | Education | | 225,214 | | 235,787 | | | 225,214 | | 235,787 | | Business Services | | 140,797 | | 145,465 | | | 140,797 | | 145,465 | | Distribution & Logistics | | 120,156 | | 120,247 | | | 120,156 | | 120,247 | | Federal Services | | 84,965 | | 83,888 | | | 84,965 | | 83,888 | | Healthcare Services | | 78,295 | | 80,331 | | | 78,295 | | 80,331 | | Energy | | 69,757 | | 69,255 | | | 69,757 | | 69,255 | | Media | | 42,808 | | 45,932 | | | 42,808 | | 45,932 | | Healthcare Products | | 40,285 | | 41,772 | | | 40,285 | | 41,772 | | Consumer Services | | 14,918 | | 15,628 | | | 14,918 | | 15,628 | | Industrial Services | | 13,858 | | 14,263 | | | 13,858 | | 14,263 | | Healthcare Information Technology | | 13,454 | | 7,324 | | | 13,454 | | 7,324 | | Information Technology | | 6,415 | | 6,585 | | | 6,415 | | 6,585 | | | | | | | | | | | | | | | | | | | | | | | | Total investments | | $ | 1,094,080 | | $ | 1,115,651 | | | $ | 1,094,080 | | $ | 1,115,651 | | | | | | | | | | | | | | | | | | | | | | | | | | | | | | | | | | | | | | | | | | |
At December 31, 2012 the Operating Company's investments consisted of the following:
| | | | | | | |
| | Cost | | Fair Value | |
|---|
First lien | | $ | 496,931 | | $ | 493,502 | | Second lien | | | 433,829 | | | 441,073 | | Subordinated | | | 43,097 | | | 45,148 | | Equity and other | | | 2,386 | | | 10,097 | | | | | | | | | | | | | | | | | | Total investments | | $ | 976,243 | | $ | 989,820 | | | | | | | | | | | | | | | | | | | | | | | | | | | | | | | | | |
Table of Contents
Combined Notes to the Consolidated Financial Statements of New Mountain Finance Holdings, L.L.C.,
the Financial Statements of New Mountain Finance Corporation and the Financial Statements
of New Mountain Finance AIV Holdings Corporation (Continued)
December 31, 2013
(in thousands, except units/shares and per unit/share data)
Note 3. Investments (Continued)
| | | | | | | |
| | Cost | | Fair Value | |
|---|
Software | | $ | 241,742 | | $ | 246,696 | | Education | | | 155,047 | | | 150,151 | | Healthcare Services | | | 139,370 | | | 143,724 | | Business Services | | | 140,426 | | | 143,420 | | Federal Services | | | 95,150 | | | 95,428 | | Distribution & Logistics(1) | | | 51,320 | | | 51,834 | | Consumer Services | | | 41,173 | | | 41,625 | | Media | | | 26,582 | | | 34,001 | | Healthcare Products | | | 25,659 | | | 27,220 | | Industrial Services | | | 13,825 | | | 14,105 | | Retail | | | 11,597 | | | 12,146 | | Healthcare Information Technology | | | 14,550 | | | 10,291 | | Energy | | | 9,852 | | | 10,072 | | Information Technology | | | 6,476 | | | 6,711 | | Power Generation | | | 3,474 | | | 2,396 | | | | | | | | | | | | | | | | | | Total investments | | $ | 976,243 | | $ | 989,820 | | | | | | | | | | | | | | | | | | | | | | | | | | | | | | | | | |
(1)Industries were disclosed separately in previously issued financial statements.
During the quarter ended December 31, 2013, the Operating Company sold its first lien position in ATI Acquisition Company, resulting in a realized loss of $4,306. Prior to the sale, this investment had a cost basis of $4,306, a zero fair value and total unearned interest income of $611 for the year ended. As of December 31, 2013,2014, the Operating Company's two super priority first lien positions in ATI Acquisition Company remained on non-accrual status due to the inability of the portfolio company to service its interest payment for the yearquarter then ended and uncertainty about its ability to pay such amounts in the future. During the third quarter of 2013, the Predecessor Operating Company received preferred shares and warrants in Ancora Acquisition LLC, in relation to the two super priority first lien positions in ATI Acquisition Company. As of December 31, 2014, the Company's investment had an aggregate cost basis of $1,611, an aggregate fair value of $402 and total unearned interest income of $329 for the year then ended. As of December 31, 2013, the Predecessor Operating Company's total investment in ATI Acquisition Company and Ancora Acquisition LLC had an aggregate cost basis of $1,611, an aggregate fair value of $419 and total unearned interest income of $316 for the year then ended. As of December 31, 2012, the Operating Company's original first lien position in ATI Acquisition Company was put on non-accrual status, with a cost basis of $4,306, a fair value of zero and total unearned interest income of $653 for the year then ended. The Operating Company's two super priority first lien debt investments in ATI Acquisition Company had a combined cost basis of $1,611 and a combined fair value of $752 as of December 31, 2012. During the third quarter of 2012, the Operating Company placed the super priority first lien positions on non-accrual status as well, resulting in total unearned interest income of $310 for the year ended December 31, 2012. As of December 31, 2012, the Operating Company's total investment in ATI Acquisition Company had an aggregate cost basis of
Table of Contents
Combined Notes to the Consolidated Financial Statements of New Mountain Finance Holdings, L.L.C.,
the Financial Statements of New Mountain Finance Corporation and the Financial Statements
of New Mountain Finance AIV Holdings Corporation (Continued)
December 31, 2013
(in thousands, except units/shares and per unit/share data)
Note 3. Investments (Continued)
$5,917 and an aggregate fair value of $752. As of December 31, 20132014 and December 31, 2012,2013, unrealized gains (losses) include a fee that the Operating Company would receive upon maturity of the two super priority first lien debt investments.
During the third quarter of 2014, the Company placed a portion of its first lien position in UniTek Global Services, Inc. ("UniTek") on non-accrual status in anticipation of a voluntary petition for a "Pre-Packaged" Chapter 11 Bankruptcy in the U.S. Bankruptcy Court for the District of Delaware which was filed on November 3, 2014. As of December 31, 2014, the portion of the UniTek first lien position placed on non-accrual status represented an aggregate cost basis of $12,078, an aggregate fair value of $8,846 and total unearned interest income of $975 for the year then ended. As of December 31, 2014, the Company had unfunded commitments on revolving credit facilities and bridge facilities of $8,948 and $0, respectively. The Company had unfunded commitments in the form of a delayed draw or other future funding commitments of $18,475 as of December 31, 2014. The unfunded commitments on revolving credit facilities and a delayed draw are disclosed on the Company's Consolidated Schedule of Investments as of December 31, 2014.
Table of Contents
Notes to the Consolidated Financial Statements of
New Mountain Finance Corporation (Continued)
December 31, 2014
(in thousands, except share data) Note 3. Investments (Continued) At December 31, 2013, NMFC's only investment was its investment in the Predecessor Operating Company. As of December 31, 2013, the Predecessor Operating Company had unfunded commitments on revolving credit facilities and bridge facilities of $15,500 and $0, respectively. The Predecessor Operating Company did not have any unfunded commitments in the form of a delayed draw or other future funding commitments as of December 31, 2013. The unfunded commitments on revolving credit facilities are disclosed on the Predecessor Operating Company's Consolidated Schedule of Investments as of December 31, 2013. NMFC Senior Loan Program I, LLC On June 10, 2014, NMFC Senior Loan Program I, LLC ("SLP I") was formed as a Delaware limited liability company. SLP I is a portfolio company held by the Company. SLP I is structured as a private investment fund, in which all of the investors are qualified purchasers, as such term is defined under the 1940 Act. Transfer of interests in SLP I is subject to restrictions, and as a result, such interests are not readily marketable. SLP I operates under a limited liability company agreement (the "Agreement") and will continue in existence until June 10, 2019, subject to earlier termination pursuant to certain terms of the Agreement. The term may be extended for up to one year pursuant to certain terms of the Agreement. SLP I has a three year re-investment period. SLP I is capitalized with $93,000 of capital commitments, $275,000 of debt from a revolving credit facility and is managed by the Company. The Company's capital commitment is $23,000, representing less than 25.0% ownership, with third party investors representing the remaining capital commitment. As of December 31, 2012,2014, SLP I had total investments with an aggregate fair value of approximately $369,194, debt outstanding of $266,916 and capital that had been called and funded of $93,000. The Company's investment in SLP I is disclosed on the OperatingDecember 31, 2014 Consolidated Schedule of Investments. The Company, had unfunded commitments on revolving credit facilitiesas an investment adviser registered under the Advisers Act, acts as the collateral manager to SLP I and bridge facilitiesis entitled to receive a management fee for its investment management services provided to SLP I. As a result, SLP I is classified as an affiliate of $10,500 and $0, respectively. The Operatingthe Company. For the year ended December 31, 2014, the Company did not have any unfunded commitmentsearned approximately $468 in the form of a delayed draw ormanagement fees related to SLP I which is included in other future funding commitments asincome. As of December 31, 2012. The unfunded commitments on revolving credit facilities are disclosed on2014, approximately $468 of management fees related to SLP I was included in receivable from affiliates. For the Operating Company's Consolidated Scheduleyear ended December 31, 2014, the Company earned approximately $1,066 of Investments asdividend income related to SLP I, which is included in dividend income. As of December 31, 2012.2014, approximately $828 of dividend income related to SLP I was included in interest and dividend receivable. SLP I invests in senior secured loans issued by companies within the Company's core industry verticals. These investments are typically broadly syndicated first lien loans.
Table of Contents
Notes to the Consolidated Financial Statements of
New Mountain Finance Corporation (Continued)
December 31, 2014
(in thousands, except share data) Note 3. Investments (Continued) Investment risk factors—First and second lien debt that the Operating Company invests in is entirely, or almost entirely, rated below investment grade or may be unrated. Debt investments rated below investment grade are often referred to as "leveraged loans," "high yield" or "junk" debt investments, and may be considered "high risk" compared to debt investments that are rated investment grade. These loansdebt investments are considered speculative because of the credit risk of the issuers. Such issuers are considered more likely than investment grade issuers to default on their payments of interest and principal and such defaultsrisk of default could reduce the net asset value and income distributions of the Operating Company. In addition, some of the Company's debt investments will not fully amortize during their lifetime, which could result in a loss or a substantial amount of unpaid principal and interest due upon maturity. First and second lien debt may also lose significant market value before a default occurs. Furthermore, an active trading market may not exist for these first and second lien loans.debt investments. This illiquidity may make it more difficult to value the debt. Subordinated debt is generally subject to similar risks as those associated with first and second lien debt, except that such debt is subordinated in payment and /or lower in lien priority. Subordinated debt is subject to the additional risk that the cash flow of the borrower and the property securing the debt, if any, may be insufficient to meet scheduled payments after giving effect to the senior secured and unsecured obligations of the borrower. The Company may directly invest in the equity of private companies or in some cases, equity investments could be made in connection with a debt investment. Equity investments may or may not appreciate in value. As a result the Company may or may not be able to recognize realized gains upon disposition. Note 4. Fair Value Fair value is the amount that would be received to sell an asset or paid to transfer a liability in an orderly transaction between market participants at the measurement date. Accounting Standards Codification Topic 820,Fair Value Measurements and Disclosures ("ASC 820"), establishes a fair value hierarchy that prioritizes and ranks the inputs to valuation techniques used in measuring investments at fair value. The hierarchy classifies the inputs used in measuring fair value into three levels as follows: Level I—Quoted prices (unadjusted) are available in active markets for identical investments and the Operating Company has the ability to access such quotes as of the reporting date. The type of investments which would generally be included in Level I include active exchange-traded equity securities and exchange-traded derivatives. As required by ASC 820, the Operating Company, to the extent that it holds such investments, does not adjust the quoted price for these investments,
Table of Contents
Combined Notes to the Consolidated Financial Statements of New Mountain Finance Holdings, L.L.C.,
the Financial Statements of New Mountain Finance Corporation and the Financial Statements
of New Mountain Finance AIV Holdings Corporation (Continued)
December 31, 2013
(in thousands, except units/shares and per unit/share data)
Note 4. Fair Value (Continued)
even in situations where the Operating Company holds a large position and a sale could reasonably impact the quoted price. Level II—Pricing inputs are observable for the investments, either directly or indirectly, as of the reporting date, but are not the same as those used in Level I. Level II inputs include the following: - •
- Quoted prices for similar assets or liabilities in active markets;
- •
- Quoted prices for identical or similar assets or liabilities in non-active markets (examples include corporate and municipal bonds, which trade infrequently);
Table of Contents
Notes to the Consolidated Financial Statements of
New Mountain Finance Corporation (Continued)
December 31, 2014
(in thousands, except share data) Note 4. Fair Value (Continued) - •
- Pricing models whose inputs are observable for substantially the full term of the asset or liability (examples include most over-the-counter derivatives, including foreign exchange forward contracts); and
- •
- Pricing models whose inputs are derived principally from or corroborated by observable market data through correlation or other means for substantially the full term of the asset or liability.
Level III—Pricing inputs are unobservable for the investment and include situations where there is little, if any, market activity for the investment.
The inputs used to measure fair value may fall into different levels. In all instances when the inputs fall within different levels of the hierarchy, the level within which the fair value measurement is categorized is based on the lowest level of input that is significant to the fair value measurement in its entirety. As such, a Level III fair value measurement may include inputs that are both observable (Levels I and II) and unobservable (Level III). Gains and losses for such assets categorized within the Level III table below may include changes in fair value that are attributable to both observable inputs (Levels II and III) and unobservable inputs (Level III). The inputs into the determination of fair value require significant judgment or estimation by management and consideration of factors specific to each investment. A review of the fair value hierarchy classifications is conducted on a quarterly basis. Changes in the observability of valuation inputs may result in the transfer of certain investments within the fair value hierarchy from period to period. Reclassifications impacting the fair value hierarchy are reported as transfers in/out of the respective leveling categories as of the beginning of the quarter in which the reclassifications occur.
Table of Contents
Combined Notes to the Consolidated Financial Statements of New Mountain Finance Holdings, L.L.C.,
the Financial Statements of New Mountain Finance Corporation and the Financial Statements
of New Mountain Finance AIV Holdings Corporation (Continued)
December 31, 2013
(in thousands, except units/shares and per unit/share data)
Note 4. Fair Value (Continued)
The following table summarizes the levels in the fair value hierarchy that the Company's portfolio investments fall into as of December 31, 2014: | | | | | | | | | | | | | |
| | Total | | Level I | | Level II | | Level III | |
|---|
First lien | | $ | 677,901 | | $ | — | | $ | 508,721 | | $ | 169,180 | | Second lien | | | 604,158 | | | — | | | 469,752 | | | 134,406 | | Subordinated | | | 61,987 | | | — | | | 26,517 | | | 35,470 | | Equity and other | | | 80,625 | | | — | | | — | | | 80,625 | | | | | | | | | | | | | | | | | Total investments | | $ | 1,424,671 | | $ | — | | $ | 1,004,990 | | $ | 419,681 | | | | | | | | | | | | | | | | | | | | | | | | | | | | | | | | | | | | | | | | | | | | | | |
Table of Contents
Notes to the Consolidated Financial Statements of
New Mountain Finance Corporation (Continued)
December 31, 2014
(in thousands, except share data) Note 4. Fair Value (Continued) At December 31, 2013, NMFC's only investment was its investment in the Predecessor Operating Company. The following table summarizes the levels in the fair value hierarchy that the Predecessor Operating Company's portfolio investments fall into as of December 31, 2013: |
| | Total | | Level I | | Level II | | Level III | | | Total | | Level I | | Level II | | Level III | |
|---|
First lien | | $ | 553,549 | | $ | — | | $ | 525,138 | | $ | 28,411 | | | $ | 553,549 | | $ | — | | $ | 525,138 | | $ | 28,411 | | Second lien | | 468,945 | | — | | 413,407 | | 55,538 | | | 468,945 | | — | | 413,407 | | 55,538 | | Subordinated | | 26,863 | | — | | 21,692 | | 5,171 | | | 26,863 | | — | | 21,692 | | 5,171 | | Equity and other | | 66,294 | | 1,694 | | — | | 64,600 | | | 66,294 | | 1,694 | | — | | 64,600 | | | | | | | | | | | | | | | | | | | | | | | | | | | | | | | | | | | | | | Total investments | | $ | 1,115,651 | | $ | 1,694 | | $ | 960,237 | | $ | 153,720 | | | $ | 1,115,651 | | $ | 1,694 | | $ | 960,237 | | $ | 153,720 | | | | | | | | | | | | | | | | | | | | | | | | | | | | | | | | | | | | | | | | | | | | | | | | | | | | | | | | | | | | | | | | | | |
The following table summarizes the levelschanges in the fair value hierarchy that the Operating Company'sof Level III portfolio investments fall intofor the year ended December 31, 2014, as well as the portion of appreciation (depreciation) included in income attributable to unrealized appreciation (depreciation) related to those assets and liabilities still held by the Company at December 31, 2014: | | | | | | | | | | | | | | | | |
| | Total | | First Lien | | Second Lien | | Subordinated | | Equity and
other | |
|---|
Fair value, December 31, 2013 | | $ | 153,720 | | $ | 28,411 | | $ | 55,538 | | $ | 5,171 | | $ | 64,600 | | Total gains or losses included in earnings: | | | | | | | | | | | | | | | | | Net realized gains on investments | | | 7,329 | | | 1,260 | | | 581 | | | 196 | | | 5,292 | | Net change in unrealized (depreciation) appreciation | | | (20,922 | ) | | (12,451 | ) | | (16,043 | ) | | (33 | ) | | 7,605 | | Purchases, including capitalized PIK and revolver fundings | | | 265,112 | | | 114,940 | | | 85,719 | | | 35,695 | | | 28,758 | | Proceeds from sales and paydowns of investments | | | (74,968 | ) | | (1,233 | ) | | (42,130 | ) | | (5,559 | ) | | (26,046 | ) | Transfers into Level III(1)(2) | | | 109,610 | | | 38,253 | | | 70,941 | | | — | | | 416 | | Transfers out of Level III(1) | | | (20,200 | ) | | — | | | (20,200 | ) | | — | | | — | | | | | | | | | | | | | | | | | | | | Fair value, December 31, 2014 | | $ | 419,681 | | $ | 169,180 | | $ | 134,406 | | $ | 35,470 | | $ | 80,625 | | | | | | | | | | | | | | | | | | | | | | | | | | | | | | | | | | | | | | | | | | | | | | | | | | | | | | | | Unrealized (depreciation) appreciation for the period relating to those Level III assets that were still held by the Company at the end of the period: | | $ | (17,254 | ) | $ | (11,978 | ) | $ | (15,404 | ) | $ | 163 | | $ | 9,965 | | | | | | | | | | | | | | | | | | | |
- (1)
- As of December 31,
2012: | | | | | | | | | | | | | |
| | Total | | Level I | | Level II | | Level III | |
|---|
First lien | | $ | 493,502 | | $ | — | | $ | 450,617 | | $ | 42,885 | | Second lien | | | 441,073 | | | — | | | 397,818 | | | 43,255 | | Subordinated | | | 45,148 | | | — | | | 22,257 | | | 22,891 | | Equity and other | | | 10,097 | | | — | | | — | | | 10,097 | | | | | | | | | | | | | | | | | | | | | | | | | | | | Total investments | | $ | 989,820 | | $ | — | | $ | 870,692 | | $ | 119,128 | | | | | | | | | | | | | | | | | | | | | | | | | | | | | | | | | | | | | | | | | | | | | | | | | | | | | |
- (2)
- During the year ended December 31, 2014, the valuation methodology for two portfolio companies changed due to the portfolio companies deterioration in operating results and as such, these portfolio companies were transferred into Level III from Level II during the year then ended.
Table of Contents
Combined Notes to the Consolidated Financial Statements of New Mountain Finance Holdings, L.L.C.,
the Financial Statements of New Mountain Finance Corporation and the Financial Statements
of New Mountain Finance AIV Holdings Corporation (Continued)
December 31, 2013 2014
(in thousands, except units/shares and per unit/share data) Note 4. Fair Value (Continued) At December 31, 2013, NMFC's only investment was its investment in the Predecessor Operating Company. The following table summarizes the changes in fair value of Level III portfolio investments for the year ended December 31, 2013, as well as the portion of appreciation (depreciation) included in income attributable to unrealized appreciation (depreciation) related to those assets and liabilities still held by the Predecessor Operating Company at December 31, 2013: |
| | Total | | First Lien | | Second Lien | | Subordinated | | Equity and
other(3) | | | Total | | First Lien | | Second Lien | | Subordinated | | Equity and
other(3) | |
|---|
Fair value, December 31, 2012 | | $ | 119,128 | | $ | 42,885 | | $ | 43,255 | | $ | 22,891 | | $ | 10,097 | | | $ | 119,128 | | $ | 42,885 | | $ | 43,255 | | $ | 22,891 | | $ | 10,097 | | Total gains or losses included in earnings: | | | | | | | | | | | | | | | | | | | | | | | Net realized (losses) gains on investments | | (1,623 | ) | | (3,986 | ) | | 380 | | 380 | | 1,603 | | | (1,623 | ) | | (3,986 | ) | | 380 | | 380 | | 1,603 | | Net change in unrealized appreciation (depreciation) | | 5,251 | | 4,319 | | 843 | | 506 | | (417 | ) | | 5,251 | | 4,319 | | 843 | | 506 | | (417 | ) | Purchases, including capitalized PIK and revolver fundings | | 120,147 | | 28,874 | | 31,060 | | 2,620 | | 57,593 | | | 120,147 | | 28,874 | | 31,060 | | 2,620 | | 57,593 | | Proceeds from sales and paydowns of investments | | (85,910 | ) | | (41,417 | ) | | (20,000 | ) | | (21,226 | ) | | (3,267 | ) | | (85,910 | ) | | (41,417 | ) | | (20,000 | ) | | (21,226 | ) | | (3,267 | ) | Transfers into Level III | | 6,574 | | 6,574 | (1) | | — | | — | | — | | | 6,574 | | 6,574 | (1) | | — | | — | | — | | Transfers out of Level III | | (9,847 | ) | | (8,838 | )(1) | | — | | — | | (1,009 | )(2) | | (9,847 | ) | | (8,838) | (1) | | — | | — | | (1,009) | (2) | | | | | | | | | | | | | | | | | | | | | | | | | | | | | | | | | | | | | | | | | | | | Fair value, December 31, 2013 | | $ | 153,720 | | $ | 28,411 | | $ | 55,538 | | $ | 5,171 | | $ | 64,600 | | | $ | 153,720 | | $ | 28,411 | | $ | 55,538 | | $ | 5,171 | | $ | 64,600 | | | | | | | | | | | | | | | | | | | | | | | | | | | | | | | | | | | | | | | | | | | | | | | | | | | | | | | | | | | | Unrealized appreciation (depreciation) for the period relating to those Level III assets that were still held by the Operating Company at the end of the period: | | $ | 821 | | $ | (333 | ) | $ | 722 | | $ | 409 | | $ | 23 | | | | | | | | | | | | | | | | | | | | | | | | | | | | | | | | | | | | | | | | | | | | | | Unrealized appreciation (depreciation) for the period relating to those Level III assets that were still held by the Predecessor Operating Company at the end of the period: | | | $ | 821 | | $ | (333 | ) | $ | 722 | | $ | 409 | | $ | 23 | | | | | | | | | | | | | | | | | | | | |
- (1)
- As of December 31, 2013, the portfolio investments were transferred into Level III from Level II and out of Level III into Level II at fair value as of the beginning of the quarter in which the reclassifications occurred.
- (2)
- As of December 31, 2013, the portfolio investments were transferred out of Level III into Level I at fair value as of the beginning of the quarter in which the reclassifications occurred.
- (3)
- During the year ended December 31, 2013, the Predecessor Operating Company received dividends of $5,049 from its equity and other investments, which were recorded as dividend income. Estimates related to the tax characterization of these distributions were provided as of December 31, 2013.
Table of Contents
Combined Notes to the Consolidated Financial Statements of New Mountain Finance Holdings, L.L.C.,
the Financial Statements of New Mountain Finance Corporation and the Financial Statements
of New Mountain Finance AIV Holdings Corporation (Continued)
December 31, 2013
(in thousands, except units/shares and per unit/share data)
Note 4. Fair Value (Continued)
The following table summarizes the changes in fair value of Level III portfolio investments for the year ended December 31, 2012, as well as the portion of appreciation (depreciation) included in income attributable to unrealized appreciation (depreciation) related to those assets and liabilities still held by the Operating Company at December 31, 2012:
| | | | | | | | | | | | | | | | |
| | Total | | First Lien | | Second Lien | | Subordinated | | Equity and
other | |
|---|
Fair value, December 31, 2011 | | $ | 90,967 | | $ | 33,141 | | $ | 48,405 | | $ | 6,571 | | $ | 2,850 | | Total gains or losses included in earnings: | | | | | | | | | | | | | | | | | Net realized gains (losses) on investments | | | 4,950 | | | 4,927 | | | 23 | | | — | | | — | | Net change in unrealized (depreciation) appreciation | | | (185 | ) | | (7,918 | ) | | (173 | ) | | (75 | ) | | 7,981 | | Purchases, including capitalized PIK and revolver fundings | | | 75,647 | | | 49,205 | | | 10,020 | | | 16,395 | | | 27 | | Proceeds from sales and paydowns of investments | | | (36,555 | ) | | (30,328 | ) | | (5,000 | ) | | — | | | (1,227 | ) | Transfers into Level III(1) | | | 20,347 | | | 19,881 | | | — | | | — | | | 466 | (2) | Transfers out of Level III(1) | | | (36,043 | ) | | (26,023 | ) | | (10,020 | ) | | — | | | — | | | | | | | | | | | | | | | | | | | | | | | | | | | | | | | | | Fair value, December 31, 2012 | | $ | 119,128 | | $ | 42,885 | | $ | 43,255 | | $ | 22,891 | | $ | 10,097 | | | | | | | | | | | | | | | | | | | | | | | | | | | | | | | | | | | | | | | | | | | | | | | | | | | | | | | | | | | | | | | | Unrealized appreciation (depreciation) for the period relating to those Level III assets that were still held by the Operating Company at the end of the period: | | $ | 3,689 | | $ | (4,216 | ) | $ | (1 | ) | $ | (75 | ) | $ | 7,981 | | | | | | | | | | | | | | | | | | | | | | | | | | | | | | | | |
(1)As of December 31, 2012, the portfolio investments were transferred into Level III from Level II and out of Level III into Level II at fair value as of the beginning of the quarter in which the reclassifications occurred.
(2)This Level III transfer relates to the Operating Company's investment in warrants of YP Equity Investors LLC, which was valued with YP Holdings LLC's second lien debt as of June 30, 2012.
Except as noted in the tables above, there were no other transfers in or out of Level I, II, or III during the years ended December 31, 20132014 and December 31, 2012.2013. Transfers into Level III occurred as quotations obtained through pricing services were not deemed representative of fair value as of the balance sheet date and such assets were internally valued. As quotations obtained through pricing services were substantiated through additional market sources, investments were transferred out of
Table of Contents
Notes to the Consolidated Financial Statements of
New Mountain Finance Corporation (Continued)
December 31, 2014
(in thousands, except share data) Note 4. Fair Value (Continued) Level III. The Operating Company invests in revolving credit facilities. These investments are categorized as Level III investments as these assets are not actively traded and their fair values are often implied by the term loans of the respective portfolio companies.
Table of Contents
Combined Notes to the Consolidated Financial Statements of New Mountain Finance Holdings, L.L.C.,
the Financial Statements of New Mountain Finance Corporation and the Financial Statements
of New Mountain Finance AIV Holdings Corporation (Continued)
December 31, 2013
(in thousands, except units/shares and per unit/share data)
Note 4. Fair Value (Continued)
The Operating Company generally uses the following framework when determining the fair value of investments where there are little, if any, market activity or observable pricing inputs. The Company typically determines the fair value of its performing debt investments utilizing an income approach. Additional consideration is given using a market based approach, as well as reviewing the overall underlying portfolio company's performance and associated financial risks. The following outlines additional details on the approaches considered: Company Performance, Financial Review, and Analysis: Prior to investment, as part of its due diligence process, the Operating Company evaluates the overall performance and financial stability of the portfolio company. Post investment, the Operating Company analyzes each portfolio company's current operating performance and relevant financial trends versus prior year and budgeted results, including, but not limited to, factors affecting its revenue and earnings before interest, taxes, depreciation, and amortization ("EBITDA") growth, margin trends, liquidity position, covenant compliance and changes to its capital structure. The Operating Company also attempts to identify and subsequently track any developments at the portfolio company, within its customer or vendor base or within the industry or the macroeconomic environment, generally, that may alter any material element of its original investment thesis. This analysis is specific to each portfolio company. The Operating Company leverages the knowledge gained from its original due diligence process, augmented by this subsequent monitoring, to continually refine its outlook for each of its portfolio companies and ultimately form the valuation of its investment in each portfolio company. When an external event such as a purchase transaction, public offering or subsequent sale occurs, the Operating Company will consider the pricing indicated by the external event to corroborate the private valuation. Market Based Approach: The Operating Company typically estimatesmay estimate the total enterprise value of each portfolio company by utilizing market value cash flow (EBITDA) multiples of publicly traded comparable companies. The Operating Company considers numerous factors when selecting the appropriate companies whose trading multiples are used to value its portfolio companies. These factors include, but are not limited to, the type of organization, similarity to the business being valued, relevant risk factors, as well as size, profitability and growth expectations. The Operating Company generally appliesmay apply an average of various relevant comparable company EBITDA multiples to the portfolio company's latest twelve month ("LTM") EBITDA or projected EBITDA to calculate portfolio company enterprise value. Significant increases or decreases in the multiple will result in an increase or decrease in enterprise value, resulting in an increase or decrease in the fair value estimate of the investment. In applying the market based approach as of December 31, 2013,2014, the Operating Company used the relevant EBITDA multiple ranges set forth in the table below to determine the enterprise value of investments in sixtwelve of its portfolio companies. The Operating Company believes this was a reasonable range in light of current comparable company trading levels and the specific companies involved. Income Based Approach: The Operating Company also typically usesmay use a discounted cash flow analysis to estimate the fair value of the investment. Projected cash flows represent the relevant security's contractual interest, fee and principal payments plus the assumption of full principal recovery at the investment's
Table of Contents
Notes to the Consolidated Financial Statements of
New Mountain Finance Corporation (Continued)
December 31, 2014
(in thousands, except share data) Note 4. Fair Value (Continued) expected maturity date. These cash flows are discounted at a rate established utilizing a yield calibration approach, which incorporates changes in the credit quality (as measured by relevant statistics) of the portfolio company, as compared to changes in the yield associated with comparable credit quality market indices, between the date of origination and the valuation date. In
Table of Contents
Combined Notes toSignificant increases or decreases in the Consolidated Financial Statements of New Mountain Finance Holdings, L.L.C.,
discount rate would result in a decrease or increase in the Financial Statements of New Mountain Finance Corporation and the Financial Statements
of New Mountain Finance AIV Holdings Corporation (Continued)
December 31, 2013
(in thousands, except units/shares and per unit/share data)
Note 4. Fair Value (Continued)
fair value measurement. In applying the income based approach as of December 31, 2013,2014, the Operating Company used the discount ranges set forth in the table below to value investments in eightseventeen of its portfolio companies. | | | | | | | | | | | | | | | | | |
| |
| |
| |
| | Range | |
|---|
Type | | Fair Value | | Approach | | Unobservable Input | | Low | | High | | Weighted
Average | |
|---|
First lien | | $ | 169,180 | | Market approach | | EBITDA multiple | | | 6.5x | | | 12.0x | | | 8.6x | | | | | | | Income approach | | Discount rate | | | 8.2 | % | | 16.5 | % | | 12.0 | % | Second lien | | | 134,406 | | Market approach | | EBITDA multiple | | | 5.5x | | | 15.5x | | | 10.6x | | | | | | | Income approach | | Discount rate | | | 11.0 | % | | 16.0 | % | | 12.7 | % | | | | | | Other | | N/A(1) | | | N/A | (1) | | N/A | (1) | | N/A | (1) | Subordinated | | | 35,470 | | Market approach | | EBITDA multiple | | | 8.0x | | | 12.0x | | | 10.0x | | | | | | | Income approach | | Discount rate | | | 10.7 | % | | 17.7 | % | | 14.7 | % | Equity and other | | | 80,625 | | Market approach | | EBITDA multiple | | | 7.0x | | | 12.0x | | | 8.1x | | | | | | | Income approach | | Discount rate | | | 8.0 | % | | 15.0 | % | | 12.9 | % | | | | | | Other | | N/A(1) | | | N/A | (1) | | N/A | (1) | | N/A | (1) | | | | | | Black Scholes analysis | | Expected life in years | | | 11.3 | | | 11.3 | | | 11.3 | | | | | | | | | Volatility | | | 31.6 | % | | 31.6 | % | | 31.6 | % | | | | | | | | Discount rate | | | 2.3 | % | | 2.3 | % | | 2.3 | % | | | | | | | | | | | | | | | | | | | | | | $ | 419,681 | | | | | | | | | | | | | | | | | | | | | | | | | | | | | | | | | | | | | | | | | | | | | | | | | | | | | | | | | | | | | | | | | | | | | | | |
| | | | | | | | | | | | | | | | | |
| |
| |
| |
| | Range | |
|---|
Type | | Fair Value | | Approach | | Unobservable Input | | Low | | High | | Weighted
Average | |
|---|
First lien | | $ | 28,411 | | Market approach | | EBITDA multiple | | | 7.0 | x | | 10.0 | x | | 8.5 | x | | | | | | Income approach | | Discount rate | | | 9.2 | % | | 10.2 | % | | 9.7 | % | Second lien | | | 55,538 | | Market approach | | EBITDA multiple | | | 5.0 | x | | 7.5 | x | | 6.2 | x | | | | | | Income approach | | Discount rate | | | 10.1 | % | | 11.7 | % | | 11.1 | % | Subordinated | | | 5,171 | | Market approach | | EBITDA multiple | | | 7.0 | x | | 9.0 | x | | 8.0 | x | | | | | | Income approach | | Discount rate | | | 13.0 | % | | 15.0 | % | | 14.0 | % | Equity and other | | | 64,600 | | Market approach | | EBITDA multiple | | | 1.3 | x | | 7.5 | x | | 4.7 | x | | | | | | Income approach | | Discount rate | | | 8.0 | % | | 20.0 | % | | 13.6 | % | | | | | | | | | | | | | | | | | | | | | | | | | | | | | | | | | | | | | | | | $ | 153,720 | | Black Scholes analysis | | Expected life in years | | | 2.0 | | | 4.0 | | | 2.6 | | | | | | | | | | | | | | | | | | | | | | | | | | | | | | | | | | | | | | | | | | | | | | | | | | | | | | | | | | | | | | | | | | | | | | | | | | | | | | | | | | | Volatility | | | 21.0 | % | | 36.6 | % | | 27.9 | % | | | | | | | | Discount rate | | | 0.3 | % | | 3.0 | % | | 0.8 | % |
- (1)
- Fair value was determined based on transaction pricing or recent acquisition or sale as the best measure of fair value with no material changes in operations of the related portfolio company since the transaction date.
Based on a comparison to similar BDC credit facilities, the terms and conditions of the Holdings Credit Facility and the SLFNMFC Credit Facility (as defined in Note 7,Borrowing FacilitiesBorrowings) are representative of market. The carrying values of the Holdings Credit Facility and SLFNMFC Credit Facility approximate fair value as of December 31, 2013,2014, as boththe facilities are continually monitored and examined by both the borrower and the lender. Both facilities were amended and restated duringThe carrying value of the year endedSBA-guaranteed debentures approximate fair value as of December 31, 2012 to lower the applicable2014 based on a comparision of market interest rate spread by 0.25% and to increase the maximum amount of revolving borrowings available under the respective facilities. Additionallyrates for the year ended December 31, 2013,Company's borrowings and similar entities. The fair value of the Holdings Credit Facility, NMFC Credit Facility and SBA-guaranteed debentures are considered Level III. The fair value of the Convertible Notes (as defined in Note 7,Borrowings) as of December 31, 2014 was amended$117,803, which was based on quoted prices and restated to further increase the maximum amount of revolving borrowings available.considered Level II. See Note 7,Borrowing FacilitiesBorrowings, for details. The carrying value of the collateralized agreement approximates fair value as of December 31, 2014 and is considered Level III. The fair value of other financial assets and liabilities approximates their carrying value based on the short termshort-term nature of these items. The fair value disclosures discussed
Table of Contents
Notes to the Consolidated Financial Statements of
New Mountain Finance Corporation (Continued)
December 31, 2014
(in this paragraph are considered Level III.thousands, except share data) Note 4. Fair Value (Continued) Fair value risk factors—The Operating Company seeks investment opportunities that offer the possibility of attaining substantial capital appreciation. Certain events particular to each industry in which the Operating Company's portfolio companies conduct their operations, as well as general economic and political conditions, may have a significant negative impact on the operations and profitability of the Operating Company's investments and/or on the fair value of the Operating Company's investments. The Operating Company's investments are subject to the risk of non-payment of scheduled interest or principal, resulting in a reduction in income to the Operating Company and thus the income of NMFC and AIV Holdings, and their corresponding fair valuations. Also, there may be risk associated with the concentration of investments in one geographic region or in certain industries. These events are beyond the control of the Operating Company and cannot be predicted. Furthermore, the ability to liquidate investments and realize value is subject to uncertainties.
Table of Contents
Combined Notes to the Consolidated Financial Statements of New Mountain Finance Holdings, L.L.C.,
the Financial Statements of New Mountain Finance Corporation and the Financial Statements
of New Mountain Finance AIV Holdings Corporation (Continued)
December 31, 2013
(in thousands, except units/shares and per unit/share data)
Note 5. Agreements On May 19, 2011, NMFC entered into a joinder agreement with respect to the Limited Liability Company Agreement, as amended and restated, of the Operating Company pursuant to which NMFC was admitted as a member of the Operating Company and agreed to acquire from the Operating Company a number of units of the Operating Company equal to the number of shares of common stock outstanding of NMFC. Additionally on May 19, 2011, in connection with the contribution by Guardian AIV of its units to AIVNMF Holdings AIV Holdings entered into a joinder agreement with respect to the Limited Liability Company Agreement, as amended and restated, of the Operating Company pursuant to which AIV Holdings was also admitted as a member of the Operating Company. The Operating Company entered into an investment advisory and management agreement, as amended and restated with the Investment Adviser on May 19, 2011. Until May 8, 2014, under the investment advisory and management agreement, the Investment Adviser managed the day-to-day operations of, and provided investment advisory services to, NMF Holdings. For providing these services, the Investment Adviser received a fee from NMF Holdings, consisting of two components—a base management fee and an incentive fee.
On May 6, 2014, the stockholders of NMFC approved a new investment advisory and management agreement (the "Investment Management Agreement") with the Investment Adviser.Adviser which became effective on May 8, 2014. Under the Investment Management Agreement, the Investment Adviser manages the day-to-day operations of, and provides investment advisory services to, the Operating Company. For providing these services, the Investment Adviser receives a fee from the Operating Company, consisting of two components—a base management fee and an incentive fee. The base management fee is calculated at an annual rate of 1.75% of the Operating Company's gross assets, which equals the Company's total assets on the Consolidated Statements of Assets and Liabilities, less (i) the borrowings under the SLF Credit Facility (as defined in Note 7,Borrowing FacilitiesBorrowings) and (ii) cash and cash equivalents. The base management fee is payable quarterly in arrears, and is calculated based on the average value of the Operating Company's gross assets, which equals the Company's total assets, as determined in accordance with GAAP, borrowings under the SLF Credit Facility, and cash and cash equivalents at the end of each of the two most recently completed calendar quarters, and appropriately adjusted on a pro rata basis for any equity capital raises or repurchases during the current calendar quarter. The Company has not invested, and currently is not invested, in derivatives. To the extent the Company invests in derivatives in the future, the Company will use the actual value of the derivatives, as reported on the Consolidated Statements of Assets and Liabilities, for purposes of calculating its base management fee. Since IPO, the base management fee calculation has deducted the borrowings under the SLF Credit Facility. The SLF Credit Facility has historically consisted of primarily lower yielding assets at higher advance rates. As part of an amendment to the Company's existing credit facilities with Wells Fargo Bank, National Association, the SLF Credit Facility merged with the Predecessor Holdings Credit Facility and into the Holdings Credit Facility on December 18, 2014 (as defined in Note 7,Borrowings).
Table of Contents
Notes to the Consolidated Financial Statements of
New Mountain Finance Corporation (Continued)
December 31, 2014
(in thousands, except share data) Note 5. Agreements (Continued) Post credit facility merger and to be consistent with the methodology since IPO, the Investment Advisor will waive management fees on the leverage associated with those assets that share the same underlying yield characteristics with investments leveraged under the legacy SLF Credit Facility. The Investment Advisor cannot recoup management fees that the Investment Advisor has previously waived. For the year ended December 31, 2014, management fees waived were approximately $686. The incentive fee consists of two parts. The first part is calculated and payable quarterly in arrears and equals 20.0% of the Operating Company's "Pre-Incentive Fee Adjusted Net Investment Income" for the immediately preceding quarter, subject to a "preferred return", or "hurdle", and a "catch-up" feature. "Pre-Incentive Fee Net Investment Income" means interest income, dividend income and any other income (including any other fees (other than fees for providing managerial assistance), such as commitment, origination, structuring, diligence and consulting fees or other fees that the Operating Company receives from portfolio companies) accrued during the calendar quarter, minus the Operating Company's operating expenses for the quarter (including the base management fee, expenses payable under an administration agreement, as amended and restated (the "Administration Agreement"), with the Administrator, and any interest expense and distributions paid on any issued and outstanding preferred membership unitsstock (of which there are none as of December 31, 2013)2014), but excluding the incentive fee). Pre-Incentive Fee Net Investment Income includes, in the case of investments with a deferred interest feature (such as original issue discount, debt instruments with PIK interest and zero coupon securities), accrued income that the Operating Company has not yet received in cash. Pre-Incentive Fee Net Investment Income does not include any realized capital gains, realized capital losses or unrealized capital appreciation or depreciation. Under GAAP, NMFC's IPO did not step-up the cost basis of the Predecessor Operating Company's existing investments to fair market value at the IPO date. Since the total value of the Predecessor Operating Company's investments at the time of the IPO was greater than the investments' cost basis, a larger amount of
Table of Contents
Combined Notes to the Consolidated Financial Statements of New Mountain Finance Holdings, L.L.C.,
the Financial Statements of New Mountain Finance Corporation and the Financial Statements
of New Mountain Finance AIV Holdings Corporation (Continued)
December 31, 2013
(in thousands, except units/shares and per unit/share data)
Note 5. Agreements (Continued)
amortization of purchase or original issue discount, as well as different amounts in realized gain and unrealized appreciation, may be recognized under GAAP in each period than if the step-up had occurred. This will remain until such predecessor investments are sold, repaid or mature in the future. The Operating Company tracks the transferred (or fair market) value of each of its investments as of the time of the IPO and, for purposes of the incentive fee calculation, adjusts Pre-Incentive Fee Net Investment Income to reflect the amortization of purchase or original issue discount on the Operating Company's investments as if each investment was purchased at the date of the IPO, or stepped up to fair market value. This is defined as "Pre-Incentive Fee Adjusted Net Investment Income". The Operating Company also uses the transferred (or fair market) value of each of its investments as of the time of the IPO to adjust capital gains ("Adjusted Realized Capital Gains") or losses ("Adjusted Realized Capital Losses") and unrealized capital appreciation ("Adjusted Unrealized Capital Appreciation") and unrealized capital depreciation ("Adjusted Unrealized Capital Depreciation"). Pre-Incentive Fee Adjusted Net Investment Income, expressed as a rate of return on the value of the Operating Company's net assets at the end of the immediately preceding calendar quarter, will be compared to a "hurdle rate" of 2.0% per quarter (8.0% annualized), subject to a "catch-up" provision measured as of the end of each calendar quarter. The hurdle rate is appropriately pro-rated for any partial
Table of Contents
Notes to the Consolidated Financial Statements of
New Mountain Finance Corporation (Continued)
December 31, 2014
(in thousands, except share data) Note 5. Agreements (Continued) periods. The calculation of the Operating Company's incentive fee with respect to the Pre-Incentive Fee Adjusted Net Investment Income for each quarter is as follows: - •
- No incentive fee is payable to the Investment Adviser in any calendar quarter in which the
Operating Company's Pre-Incentive Fee Adjusted Net Investment Income does not exceed the hurdle rate of 2.0% (the "preferred return" or "hurdle").
- •
- 100.0% of the
Operating Company's Pre-Incentive Fee Adjusted Net Investment Income with respect to that portion of such Pre-Incentive Fee Adjusted Net Investment Income, if any, that exceeds the hurdle rate but is less than or equal to 2.5% in any calendar quarter (10.0% annualized) is payable to the Investment Adviser. This portion of the Operating Company's Pre-Incentive Fee Adjusted Net Investment Income (which exceeds the hurdle rate but is less than or equal to 2.5%) is referred to as the "catch-up". The catch-up provision is intended to provide the Investment Adviser with an incentive fee of 20.0% on all of the Operating Company's Pre-Incentive Fee Adjusted Net Investment Income as if a hurdle rate did not apply when the Operating Company's Pre-Incentive Fee Adjusted Net Investment Income exceeds 2.5% in any calendar quarter.
- •
- 20.0% of the amount of the
Operating Company's Pre-Incentive Fee Adjusted Net Investment Income, if any, that exceeds 2.5% in any calendar quarter (10.0% annualized) is payable to the Investment Adviser once the hurdle is reached and the catch-up is achieved.
The second part will be determined and payable in arrears as of the end of each calendar year (or upon termination of the Investment Management Agreement) and will equal 20.0% of the Operating Company's Adjusted Realized Capital Gains, if any, on a cumulative basis from inception through the end of each calendar year, computed net of all Adjusted Realized Capital Losses and Adjusted
Table of Contents
Combined Notes to the Consolidated Financial Statements of New Mountain Finance Holdings, L.L.C.,
the Financial Statements of New Mountain Finance Corporation and the Financial Statements
of New Mountain Finance AIV Holdings Corporation (Continued)
December 31, 2013
(in thousands, except units/shares and per unit/share data)
Note 5. Agreements (Continued)
Unrealized Capital Depreciation on a cumulative basis, less the aggregate amount of any previously paid capital gain incentive fee. In accordance with GAAP, the Operating Company accrues a hypothetical capital gains incentive fee based upon the cumulative net Adjusted Realized Capital Gains and Adjusted Realized Capital Losses and the cumulative net Adjusted Unrealized Capital Appreciation and Adjusted Unrealized Capital Depreciation on investments held at the end of each period. Actual amounts paid to the Investment Adviser are consistent with the Investment Management Agreement and are based only on actual Adjusted Realized Capital Gains computed net of all Adjusted Realized Capital Losses and Adjusted Unrealized Capital Depreciation on a cumulative basis from inception through the end of each calendar year as if the entire portfolio was sold at fair value.
The Operating Company has revised its presentationTable of incentive fees onContents
Notes to the Consolidated Financial Statements of Assets, Liabilities and Members' Capital and the Consolidated Statements of Operations to disclose the two parts of the incentive fee incurred by the Operating Company for net investment income related incentive fees and capital gains related incentive fees.
New Mountain Finance Corporation (Continued)
December 31, 2014
(in thousands, except share data) Note 5. Agreements (Continued) The following table summarizes the management fees and incentive fees incurred by the Operating Company for the years ended December 31, 2013,2014, December 31, 20122013 and December 31, 2011.2012. |
| | Years ended December 31, | | | Years ended December 31, | |
|---|
| | 2013 | | 2012 | | 2011(1) | | | 2014 | | 2013 | | 2012 | |
|---|
Management fee | | $ | 14,905 | | $ | 11,109 | | $ | 4,938 | | | $ | 13,593 | | $ | — | | $ | — | | Management fee allocated from NMF Holdings(2) | | | 5,983 | | 11,812 | | 4,849 | | Less: management fee waiver | | | (686 | ) | | — | | — | | | | | | | | | | | | | | | Total Management fee | | | 18,890 | | 11,812 | | 4,849 | | Incentive fee, excluding accrued capital gains incentive fees | | 16,502 | | 11,537 | | 3,522 | | |
$ |
12,070 | |
$ |
— | |
$ |
— | | Accrued capital gains incentive fees(2) | | 3,229 | | 4,407 | | — | | | Incentive fee, excluding accrued capital gains incentive fees allocated from NMF Holdings(2) | | | 6,248 | | 13,050 | | 5,056 | | | | | | | | | | | | | | | Total Incentive fee | | | 18,318 | | 13,050 | | 5,056 | | Accrued capital gains incentive fees(1) | | |
$ |
(8,573 |
) |
$ |
— | |
$ |
— | | Accrued capital gains incentive fees allocated from NMF Holdings(1)(2) | | | 2,024 | | 2,351 | | 1,977 | | | | | | | | | | | | | | | Total Accrued capital gains incentive fees | | | (6,549 | ) | | 2,351 | | 1,977 | |
- (1)
For the period from May 19, 2011 (effective date of the Investment Management Agreement) to December 31, 2011.
(2)- As of December 31,
2013, approximately $1,113 of capital gains incentive fees was owed under the Investment Management Agreement, as cumulative net Adjusted Realized Capital Gains exceeded cumulative Adjusted Unrealized Capital Depreciation. As of December 31, 2012 and December 31, 2011,2014, no actual capital gains incentive fee was owed under the Investment Management Agreement by the Company, as cumulative net Adjusted Realized Capital Gains did not exceed cumulative Adjusted Unrealized Capital Depreciation. As of December 31, 2013, approximately $1,113 of capital gains incentive fees was owed under the Investment Management Agreement by the Predecessor Operating Company, as cumulative net Adjusted Realized Capital Gains exceeded cumulative Adjusted Unrealized Capital Depreciation and was paid during the year ended December 31, 2014. As of December 31, 2012, no actual capital gains incentive fee was owed under the Investment Management Agreement by the Predecessor Operating Company, as cumulative net Adjusted Realized Capital Gains did not exceed cumulative Adjusted Unrealized Capital Depreciation.
- (2)
- For the years ended December 31, 2013 and December 31,
2011, no payments have been made relating to2012, the Company is reflecting its proportionate share of the Predecessor Operating Company's management, incentive and capital gains incentive fee.fees. For the years ended December 31, 2013 and December 31, 2012, the management fees at NMF Holdings were $14,905 and $11,109, respectively. For the years ended December 31, 2013 and December 31, 2012, the incentive fee, excluding accrued capital gains incentive fees, at NMF Holdings was $16,502 and $11,537, respectively. For the years ended December 31, 2013, and December 31, 2012 the accrued capital gains incentive fees at NMF Holdings were $3,229 and $4,407, respectively.
The Operating Company's Consolidated Statements of Operations below are adjusted as if the step-up in cost basis to fair market value had occurred at the IPO date, May 19, 2011.
Table of Contents
Combined Notes to the Consolidated Financial Statements of New Mountain Finance Holdings, L.L.C.,
the Financial Statements of New Mountain Finance Corporation and the Financial Statements
of New Mountain Finance AIV Holdings Corporation (Continued)
December 31, 2013 2014
(in thousands, except units/shares and per unit/share data) Note 5. Agreements (Continued) The following Consolidated Statements of Operations for the year ended December 31, 2014 is adjusted to reflect this step-up to fair market value. | | | | | | | | | | |
| | Year Ended
December 31, 2014 | | Stepped-up
Cost Basis
Adjustments | | Adjusted Year
Ended December 31, 2014 | |
|---|
Investment income | | | | | | | | | | | Interest income(1) | | $ | 85,123 | | $ | (193 | ) | $ | 84,930 | | Dividend income | | | 2,309 | | | — | | | 2,309 | | Other income | | | 4,491 | | | — | | | 4,491 | | Investment income allocated from NMF Holdings | | | | | | | | | | | Interest income(1) | | | 40,515 | | | — | | | 40,515 | | Dividend income | | | 2,368 | | | — | | | 2,368 | | Other income | | | 795 | | | — | | | 795 | | | | | | | | | | | | | | Total investment income(2) | | | 135,601 | | | (193 | ) | | 135,408 | | | | | | | | | | | | | | Total expenses pre-incentive fee(3) | | | 43,766 | | | — | | | 43,766 | | | | | | | | | | | | | | Pre-Incentive Fee Net Investment Income | | | 91,835 | | | (193 | ) | | 91,642 | | | | | | | | | | | | | | Incentive fee(4) | | | 11,769 | | | — | | | 11,769 | | | | | | | | | | | | | | Post-Incentive Fee Net Investment Income | | | 80,066 | | | (193 | ) | | 79,873 | | | | | | | | | | | | | | Net realized gains (losses) on investments | | | 357 | | | (456 | ) | | (99 | ) | Net realized gains on investments allocated from NMF Holdings | | | 8,568 | | | — | | | 8,568 | | Net change in unrealized (depreciation) appreciation of investments(5) | | | (43,863 | ) | | 649 | | | (43,214 | ) | Net change in unrealized appreciation (depreciation) of investments allocated from NMF Holdings | | | 940 | | | — | | | 940 | | Provision for taxes | | | (493 | ) | | — | | | (493 | ) | | | | | | | | | | | | | Net increase in net assets resulting from operations | | $ | 45,575 | | | | | $ | 45,575 | | | | | | | | | | | | | | | | | | | | | | | | | | | | | | | | | | | | | |
- (1)
- Includes $4,644 in payment-in-kind interest from investments.
- (2)
- Includes income from non-controlled/non-affiliated investments and non-controlled/affiliated investments.
- (3)
- Includes expense waivers and reimbursements of $1,145 and management fee waivers of $686.
- (4)
- For the year ended December 31, 2014, the Company and Predecessor Operating Company incurred total incentive fees of $11,769, of which $(6,549) is related to a decrease of the capital gains incentive fee accrual on a hypothetical liquidation basis.
- (5)
- Includes net change in unrealized (deprecation) appreciation of investments from non-controlled/non-affiliated investments and non-controlled/affiliated investments.
Table of Contents
Notes to the Consolidated Financial Statements of
New Mountain Finance Corporation (Continued)
December 31, 2014
(in thousands, except share data) Note 5. Agreements (Continued) At December 31, 2013, NMFC's only investment was its investment in the Predecessor Operating Company. The following Consolidated Statement of Operations of the Predecessor Operating Company for the year ended December 31, 2013 is adjusted to reflect this step-up to fair market value. |
| | Year ended
December 31,
2013 | | Stepped-up
Cost Basis
Adjustments | | Adjusted
year ended
December 31,
2013 | | | Year Ended
December 31, 2013 | | Stepped-up
Cost Basis
Adjustments | | Adjusted
Year Ended
December 31, 2013 | |
|---|
Investment income | | | | | | | | | | | | | | | Interest income(1) | | $ | 107,027 | | $ | (896 | ) | $ | 106,131 | | | $ | 107,027 | | $ | (896 | ) | $ | 106,131 | | Dividend income | | 5,049 | | — | | 5,049 | | | 5,049 | | — | | 5,049 | | Other income | | 2,836 | | — | | 2,836 | | | 2,836 | | — | | 2,836 | | | | | | | | | | | | | | | | | | | | | | | | | | | | | | | Total investment income | | 114,912 | | (896 | ) | | 114,016 | | | 114,912 | | (896 | ) | | 114,016 | | | | | | | | | | | | | | | | | | | | | | | | | | | | | | | Total net expenses pre-incentive fee(2) | | 31,504 | | — | | 31,504 | | | 31,504 | | — | | 31,504 | | | | | | | | | | | | | | | | | | | | | | | | | | | | | | | Pre-Incentive Fee Net Investment Income | | 83,408 | | (896 | ) | | 82,512 | | | 83,408 | | (896 | ) | | 82,512 | | | | | | | | | | | | | | | | | | | | | | | | | | | | | | | Incentive fee(3) | | 19,731 | | — | | 19,731 | | | 19,731 | | — | | 19,731 | | | | | | | | | | | | | | | | | | | | | | | | | | | | | | | Post-Incentive Fee Net Investment Income | | 63,677 | | (896 | ) | | 62,781 | | | 63,677 | | (896 | ) | | 62,781 | | | | | | | | | | | | | | | | | | | | | | | | | | | | | | | Net realized gains (losses) on investments | | 7,253 | (4) | | (3,158 | ) | | 4,095 | | | 7,253 | (4) | | (3,158 | ) | | 4,095 | | Net change in unrealized appreciation of investments | | 7,994 | | 4,054 | | 12,048 | | | | | | | | | | | | | Net change in unrealized appreciation (depreciation) of investments | | | 7,994 | | 4,054 | | 12,048 | | | | | | | | | | | | | | | | | | | | Net increase in members' capital resulting from operations | | $ | 78,924 | | | | $ | 78,924 | | | $ | 78,924 | | | | $ | 78,924 | | | | | | | | | | | | | | | | | | | | | | | | | | | | | | | | | | | | | | | | | | | | | | | | | | | | |
- (1)
- Includes $3,428 in payment-in-kind interest from investments.
- (2)
- Includes expense waivers and reimbursements of $3,233.
- (3)
- For the year ended December 31, 2013, the Predecessor Operating Company incurred total incentive fees of $19,731, of which $3,229 related to capital gains incentive fees on a hypothetical liquidation basis.
- (4)
- Includes $1,722 of realized gains on investments resulting from the modification of terms on one debt investment that was accounted for as an extinguishment.
Table of Contents
Combined Notes to the Consolidated Financial Statements of New Mountain Finance Holdings, L.L.C.,
the Financial Statements of New Mountain Finance Corporation and the Financial Statements
of New Mountain Finance AIV Holdings Corporation (Continued)
December 31, 2013 2014
(in thousands, except units/shares and per unit/share data) Note 5. Agreements (Continued) At December 31, 2012, NMFC's only investment was its investment in the Predecessor Operating Company. The following Consolidated Statement of Operations of the Predecessor Operating Company for the year ended December 31, 2012 is adjusted to reflect this step-up to fair market value. |
| | Year ended
December 31,
2012 | | Stepped-up
Cost Basis
Adjustments | | Adjusted
year ended
December 31,
2012 | | | Year Ended
December 31, 2012 | | Stepped-up
Cost Basis
Adjustments | | Adjusted
Year Ended
December 31, 2012 | |
|---|
Investment income | | | | | | | | | | | | | | | Interest income | | $ | 83,646 | | $ | (3,476 | ) | $ | 80,170 | | | $ | 83,646 | | $ | (3,476 | ) | $ | 80,170 | | Dividend income | | 812 | | — | | 812 | | | 812 | | — | | 812 | | Other income | | 1,328 | | — | | 1,328 | | | 1,328 | | — | | 1,328 | | | | | | | | | | | | | | | | | | | | | | | | | | | | | | | Total investment income | | 85,786 | | (3,476 | ) | | 82,310 | | | 85,786 | | (3,476 | ) | | 82,310 | | | | | | | | | | | | | | | | | | | | | | | | | | | | | | | Total expenses pre-incentive fee(1) | | 24,625 | | — | | 24,625 | | | | | | | | | | | | | Total expenses pre-incentive fee(2) | | | 24,625 | | — | | 24,625 | | | | | | | | | | | | | | | | | | | | | Pre-Incentive Fee Net Investment Income | | 61,161 | | (3,476 | ) | | 57,685 | | | 61,161 | | (3,476 | ) | | 57,685 | | | | | | | | | | | | | | | | | | | | | | | | | | | | | | | Incentive fee(2) | | 15,944 | | — | | 15,944 | | | | | | | | | | | | | Incentive fee(3) | | | 15,944 | | — | | 15,944 | | | | | | | | | | | | | | | | | | | | | Post-Incentive Fee Net Investment Income | | 45,217 | | (3,476 | ) | | 41,741 | | | 45,217 | | (3,476 | ) | | 41,741 | | | | | | | | | | | | | | | | | | | | | | | | | | | | | | | Net realized gains (losses) on investments | | 18,851 | | (6,958 | ) | | 11,893 | | | 18,851 | | (6,958 | ) | | 11,893 | | Net change in unrealized appreciation of investments | | 9,928 | | 10,434 | | 20,362 | | | | | | | | | | | | | Net change in unrealized appreciation (depreciation) of investments | | | 9,928 | | 10,434 | | 20,362 | | | | | | | | | | | | | | | | | | | | Net increase in members' capital resulting from operations | | $ | 73,996 | | | | $ | 73,996 | | | $ | 73,996 | | | | $ | 73,996 | | | | | | | | | | | | | | | | | | | | | | | | | | | | | | | | | | | | | | | | | | | | | | | | | | | | |
- (1)
- Includes $2,240 in payment-in-kind interest from investments.
- (2)
- Includes expense waivers and reimbursements of $2,460.
(2)(3)- For the year ended December 31, 2012, the Predecessor Operating Company incurred total incentive fees of $15,944, of which $4,407 related to capital gains incentive fees on a hypothetical liquidation basis.
Table of Contents
Combined Notes to the Consolidated Financial Statements of New Mountain Finance Holdings, L.L.C.,
the Financial Statements of New Mountain Finance Corporation and the Financial Statements
of New Mountain Finance AIV Holdings Corporation (Continued)
December 31, 2013
(in thousands, except units/shares and per unit/share data)
Note 5. Agreements (Continued)
The following Statement of Operations for the Operating Company for the period May 19, 2011 (effective date of the Investment Management Agreement) to December 31, 2011 is adjusted to reflect this step-up to fair market value. | | | | | | | | | | |
| | Period from
May 19, 2011
to December 31,
2011 | | Stepped-up
Cost Basis
Adjustments | | Adjusted
period from
May 19, 2011
to December 31,
2011 | |
|---|
Investment income | | | | | | | | | | | Interest income | | $ | 38,836 | | $ | (2,019 | ) | $ | 36,817 | | Other income | | | 670 | | | — | | | 670 | | | | | | | | | | | | | | | | | | | | | | | Total investment income | | | 39,506 | | | (2,019 | ) | | 37,487 | | | | | | | | | | | | | | | | | | | | | | | Total expenses pre-incentive fee(1) | | | 11,863 | | | — | | | 11,863 | | | | | | | | | | | | | | | | | | | | | | | Pre-Incentive Fee Net Investment Income | | | 27,643 | | | (2,019 | ) | | 25,624 | | | | | | | | | | | | | | | | | | | | | | | Incentive fee(2) | | | 3,522 | | | — | | | 3,522 | | | | | | | | | | | | | | | | | | | | | | | Post-Incentive Fee Net Investment Income | | | 24,121 | | | (2,019 | ) | | 22,102 | | | | | | | | | | | | | | | | | | | | | | | Net realized gains (losses) on investments | | | 3,298 | | | (2,422 | ) | | 876 | | Net change in unrealized (depreciation) appreciation of investments | | | (15,538 | ) | | 4,441 | | | (11,097 | ) | | | | | | | | | | | | | | | | | | | | | | | Net increase in members' capital resulting from operations | | $ | 11,881 | | | | | $ | 11,881 | | | | | | | | | | | | | | | | | | | | | | | | | | | | | | | | | | | | | | | | | | | | | |
(1)Includes expense waivers and reimbursements of $2,186.
(2)For the year ended December 31, 2011, the Operating Company had no incentive fees related to capital gains incentive fees on a hypothetical liquidation basis.
The Companies havehas entered into an Administration Agreement with the Administrator under which the Administrator provides administrative services. The Administrator performs, or oversees the performance of, the Companies'Company's consolidated financial records, prepares reports filed with the Securities and Exchange Commission,SEC, generally monitors the payment of the Companies'Company's expenses and watches the performance of administrative and professional services rendered by others. The Operating Company will reimburse the Administrator for the Companies'Company's allocable portion of overhead and other expenses incurred by the Administrator in performing its obligations to the CompaniesCompany under the Administration Agreement. Pursuant to the Administration Agreement and further restricted by the Operating Company, expenses payable to the Administrator by the Operating Company as well as other direct and indirect expenses (excluding interest, other credit facilityfinancing expenses, trading expenses and management and incentive fees) havehad been capped at $3,500 for the time period from April 1, 2012 to March 31, 2013 and capped at $4,250 for the time period from April 1, 2013 to March 31, 2014. The expense cap expired on March 31, 2014. Thereafter,
Table of Contents
Combined Notes to the Consolidated Financial Statements of New Mountain Finance Holdings, L.L.C.,
the Financial Statements of New Mountain Finance Corporation and the Financial Statements
of New Mountain Finance AIV Holdings Corporation (Continued)
December 31, 2013 2014
(in thousands, except units/shares and per unit/share data) Note 5. Agreements (Continued) the Administrator may, in its own discretion, submit to the Company for reimbursement some or all of the expenses that the Administrator has incurred on behalf of the Company during any quarterly period. As a result, the amount of expenses for which the Company will have to reimburse the Administrator may fluctuate in future quarterly periods and there can be no assurance given as to when, or if, the Administrator may determine to limit the expenses that the Administrator submits to the Company for reimbursement in the future. However, it is expected that the Administrator will continue to support part of the expense burden of the Company in the near future and may decide to not calculate and charge through certain overhead related amounts as well as continue to cover some of the indirect costs. The Administrator cannot recoup any expenses that the Administrator has previously waived. For the year ended December 31, 2014, approximately $1,395 of indirect administrative expenses were included in administrative expenses of which $770 of indirect administrative expenses were waived by the Administrator. As of December 31, 2014, $326 of indirect administrative expenses were included in payable to affiliates as the expenses were payable to the Administrator. The Predecessor Operating Company hashad revised its presentation of expenses and expense waivers and reimbursements for the yearsyear ended December 31, 2012 and December 31, 2011.2012. Expenses were previously presented net of waivers and reimbursements, which had been included parenthetically. The revised presentation shows total gross expenses with a separate reduction for expense waivers and reimbursements. The Operating Company incurred the following expenses, which were waived by the Administrator or were in excess of the expense cap, for the years ended December 31, 2013,2014, December 31, 20122013 and December 31, 2011:2012: |
| | Years ended December 31, | | | Years ended December 31, | |
|---|
| | 2013 | | 2012 | | 2011 | | | 2014 | | 2013 | | 2012 | |
|---|
Administrative expenses | | | $ | 380 | | $ | — | | $ | — | | Administrative expenses allocated from NMF Holdings | | | 390 | | 1,180 | | 554 | | Professional fees | | $ | 1,773 | | $ | 1,070 | | $ | 1,315 | | | — | | — | | — | | Administrative expenses | | 1,460 | | 1,390 | | 871 | | | Professional fees allocated from NMF Holdings | | | 375 | | 1,360 | | 583 | | Other general and administrative expenses | | — | | — | | — | | | — | | — | | — | | | | | | | | | | | | Other general and administrative expenses allocated from NMF Holdings | | | — | | — | | — | | | | | | | | | | | | | | | | | | | | | Total expense waivers and reimbursements | | $ | 3,233 | | $ | 2,460 | | $ | 2,186 | | | | | | | | | | | | | Total expense reimbursement | | | $ | 1,145 | | $ | 2,540 | | $ | 1,137 | | | | | | | | | | | | | | | | | | | | | | | | | | | | | | | | | | | | | | | | | | | | |
As of December 31, 2014, no expense waivers and reimbursements were receivable from an affiliate. As of December 31, 2013 and December 31, 2012, $459$399 and $534,$305, respectively, of the expense waivers and reimbursements waswere allocated from NMF Holdings and were receivable by NMF Holdings from an affiliate. The Companies,Company, the Investment Adviser and the Administrator have also entered into a Trademark License Agreement, as amended, with New Mountain Capital, L.L.C., pursuant to which New Mountain Capital L.L.C. has agreed to grant the Companies,Company, the Investment Adviser and the Administrator, a non-exclusive, royalty-free license to use the "New Mountain" and the "New Mountain Finance"
Table of Contents
Notes to the Consolidated Financial Statements of
New Mountain Finance Corporation (Continued)
December 31, 2014
(in thousands, except share data) Note 5. Agreements (Continued) names. Under the Trademark License Agreement, as amended, subject to certain conditions, the Companies,Company, the Investment Adviser and the Administrator will have a right to use the "New Mountain" and "New Mountain Finance" names, for so long as the Investment Adviser or one of its affiliates remains the investment adviser of the Operating Company. Other than with respect to this limited license, the Companies,Company, the Investment Adviser and the Administrator will have no legal right to the "New Mountain" or the "New Mountain Finance" names. NMFC entered into a Registration Rights Agreement with AIV Holdings, Steven B. Klinsky (the Chairman of the Companies'Company's board of directors), an entity related to Steven B. Klinsky and the Investment Adviser. Subject to several exceptions, AIV Holdings and the Investment Adviser havehas the right to require NMFC to register for public resale under the Securities Act of 1933, as amended (the "Securities Act of 1933"), all registerable securities that are held by any of them and that they request to be registered. Registerable securities subject to the Registration Rights Agreement are shares of NMFC's common stock issued or issuable in exchange for units and any other shares of NMFC's common stock held by AIV Holdings, the Investment Adviser and any of their transferees. The rights under the Registration Rights Agreement can be conditionally exercised by AIV Holdings or the Investment Adviser, meaning that prior to the effectiveness of the registration statement related to the shares, AIV Holdings or the Investment Adviser can withdraw theirits request to have the shares registered. AIV Holdings and the Investment Adviser may each assign theirits rights to any person that acquires registerable securities subject to the Registration Rights Agreement and who agrees to be
Table of Contents
Combined Notes to the Consolidated Financial Statements of New Mountain Finance Holdings, L.L.C.,
the Financial Statements of New Mountain Finance Corporation and the Financial Statements
of New Mountain Finance AIV Holdings Corporation (Continued)
December 31, 2013
(in thousands, except units/shares and per unit/share data)
Note 5. Agreements (Continued)
bound by the terms of the Registration Rights Agreement. Steven B. Klinsky and a related entity will have the right to "piggyback", or include their own registerable securities in such a registration. Shares held by AIV Holdings and Steven B. Klinsky were registered on a shelf registration statement on Form N-2. AIV Holdings and theThe Investment Adviser may require NMFC to use its reasonable best efforts to register under the Securities Act of 1933 all or any portion of these registerable securities upon a "demand request". The demand registration rights are subject to certain limitations. The Registration Rights Agreement includes limited blackout and suspension periods. In addition, AIV Holdings and the Investment Adviser may also require NMFC to file a shelf registration statement on Form N-2 for the resale of their registerable securities if NMFC is eligible to use Form N-2 at that time. Holders of registerable securities have "piggyback" registration rights, including AIV Holdings, which means that these holders may include their respective shares in any future registrations of NMFC's equity securities, whether or not that registration relates to a primary offering by NMFC or a secondary offering by or on behalf of any of NMFC's stockholders. AIV Holdings, theThe Investment Adviser and Steven B. Klinsky (and a related entity) have priority over NMFC in any registration that is an underwritten offering. AIV Holdings, theThe Investment Adviser and Steven B. Klinsky (and a related entity) will be responsible for the expenses of any demand registration (including underwriters' discounts or commissions) and their pro-rata share of any "piggyback" registration. NMFC has agreed to indemnify AIV Holdings, the Investment Adviser and Steven B. Klinsky (and a related entity) with respect to liabilities resulting from untrue statements or omissions in any registration statement filed pursuant to the Registration Rights Agreement, other than untrue statements or omissions resulting from information furnished to NMFC by such parties. AIV Holdings, theThe Investment Adviser and Steven B. Klinsky (and a related entity) have also agreed to indemnify NMFC with respect to liabilities resulting from untrue statements or omissions furnished by them to NMFC relating to them in any registration statement.
Table of Contents
Notes to the Consolidated Financial Statements of
New Mountain Finance Corporation (Continued)
December 31, 2014
(in thousands, except share data) Note 6. Related Parties The Companies haveCompany has entered into a number of business relationships with affiliated or related parties. NMFC and AIV Holdings own all the outstanding units of the Operating Company. As of December 31, 2013, NMFC and AIV Holdings own approximately 94.4% and 5.6%, respectively, of the units of the Operating Company. The Operating Company has entered into the Investment Management Agreement with the Investment Adviser, a wholly-owned subsidiary of New Mountain Capital. Therefore, New Mountain Capital is entitled to any profits earned by the Investment Adviser, which includes any fees payable to the Investment Adviser under the terms of the Investment Management Agreement, less expenses incurred by the Investment Adviser in performing its services under the Investment Management Agreement.
Table of Contents
Combined Notes to the Consolidated Financial Statements of New Mountain Finance Holdings, L.L.C.,
the Financial Statements of New Mountain Finance Corporation and the Financial Statements
of New Mountain Finance AIV Holdings Corporation (Continued)
December 31, 2013
(in thousands, except units/shares and per unit/share data)
Note 6. Related Parties (Continued)
The Companies haveCompany has entered into an Administration Agreement with the Administrator, a wholly-owned subsidiary of New Mountain Capital. The Administrator arranges office space for the CompaniesCompany and provides office equipment and administrative services necessary to conduct their respective day-to-day operations pursuant to the Administration Agreement. The Operating Company reimburses the Administrator for the allocable portion of overhead and other expenses incurred by it in performing its obligations to the CompaniesCompany under the Administration Agreement including rent,which includes the fees and expenses associated with performing administrative, finance and compliance functions, and the compensation of the Companies'Company's chief financial officer and chief compliance officer and their respective staffs. Pursuant to the Administration Agreement and further restricted by the Operating Company, expenses payable to the Administrator by the Operating Company as well as other direct and indirect expenses (excluding interest, other credit facilityfinancing expenses, trading expenses and management and incentive fees) havehad been capped at $3,500 for the time period from April 1, 2012 to March 31, 2013 and capped at $4,250 for the time period from April 1, 2013 to March 31, 2014. The expense cap will expireexpired on March 31, 2014. Thereafter, the Administrator may, in its own discretion, submit to the Operating Company for reimbursement some or all of the expenses that the Administrator has incurred on behalf of the Operating Company during any quarterly period. As a result, the amount of expenses for which the Operating Company will have to reimburse the Administrator may fluctuate in future quarterly periods and there can be no assurance given as to when, or if, the Administrator may determine to limit the expenses that the Administrator submits to the Operating Company for reimbursement in the future. However, it is expected that the Administrator will continue to support part of the expense burden of the Operating Company in the near future.future and may decide to not calculate and charge through certain overhead related amounts as well as continue to cover some of the indirect costs. The Administrator cannot recoup any expenses that the Administrator has previously waived. For the year ended December 31, 2014, approximately $1,395 of indirect administrative expenses were included in administrative expenses of which $770 of indirect administrative expenses were waived by the Administrator. As of December 31, 2014, $326 of indirect administrative expenses were included in payable to affiliates as the expenses were payable to the Administrator. The Companies,Company, the Investment Adviser and the Administrator have entered into a royalty-free Trademark License Agreement, as amended, with New Mountain Capital, L.L.C., pursuant to which New Mountain Capital L.L.C. has agreed to grant the Companies,Company, the Investment Adviser and the Administrator, a non-exclusive, royalty-free license to use the name "New Mountain" and "New Mountain Finance". The Companies haveCompany has adopted a formal code of ethics that governs the conduct of their respective officers and directors. These officers and directors also remain subject to the duties imposed by the 1940 Act, the Delaware General Corporation Law and the Delaware Limited Liability Company Act. The Investment Adviser and its affiliates may also manage other funds in the future that may have investment mandates that are similar, in whole and in part, with the Operating Company'Company's investment mandates.
Table of Contents
Notes to the Consolidated Financial Statements of
New Mountain Finance Corporation (Continued)
December 31, 2014
(in thousands, except share data) Note 6. Related Parties (Continued) The Investment Adviser and its affiliates may determine that an investment is appropriate for the Operating Company andor for one or more of those other funds. In such event, depending on the availability of such investment and other appropriate factors, the Investment Adviser or its affiliates may determine that the Operating Company should invest side-by-side with one or more other funds. Any such investments will be made only to the extent permitted by applicable law and interpretive positions of the Securities and Exchange CommissionSEC and its staff and consistent with the Investment Adviser's allocation procedures.
Table of Contents
Combined Notes to the Consolidated Financial Statements of New Mountain Finance Holdings, L.L.C.,
the Financial Statements of New Mountain Finance Corporation and the Financial Statements
of New Mountain Finance AIV Holdings Corporation (Continued)
December 31, 2013
(in thousands, except units/shares and per unit/share data)
Note 6. Related Parties (Continued)
Concurrently with the IPO, NMFC sold an additional 2,172,000 shares of its common stock to certain executives and employees of, and other individuals affiliated with, New Mountain Capital in the Concurrent Private Placement. Note 7. Borrowing FacilitiesBorrowings Holdings Credit Facility—On December 18, 2014 the Company entered into the Second Amended and Restated Loan and Security Agreement (the "Holdings Credit Facility"), among the Company, as the Collateral Manager, NMF Holdings as the Borrower, Wells Fargo Securities, LLC as the Administrative Agent and Wells Fargo Bank, National Association, as the Lender and Collateral Custodian, which is structured as a revolving credit facility and matures on December 18, 2019. Immediately prior to amending the Holdings Credit Facility, NMF SPV merged with and into NMF Holdings. The Holdings Credit Facility effectively amended and restated the Predecessor Holdings Credit Facility (as defined below), merged with the SLF Credit Facility (as defined below), and combined the amount of borrowings previously available. The maximum amount of revolving borrowings available under the Holdings Credit Facility is $495,000, which is the aggregate of the $280,000 previously available under the Predecessor Holdings Credit Facility (as defined below) and the $215,000 previously available under the SLF Credit Facility (as defined below). Under the Holdings Credit Facility, NMF Holdings is still permitted to borrow up to 25.0%, 45.0% or 70.0% of the purchase price of pledged assets, subject to approval by the Wells Fargo Securities, LLC. The Holdings Credit Facility is non-recourse to the Company and is collateralized by all of the investments of NMF Holdings on an investment by investment basis. All fees associated with the origination or upsizing of the Holdings Credit Facility are capitalized on the Company's Consolidated Statement of Assets and Liabilities and charged against income as other financing expenses over the life of the Holdings Credit Facility. The Holdings Credit Facility contains certain customary affirmative and negative covenants and events of default. In addition, the Holdings Credit Facility requires the Company to maintain a minimum asset coverage ratio. The covenants are generally not tied to mark to market fluctuations in the prices of NMF Holdings investments, but rather to the performance of the underlying portfolio companies. The Holdings Credit Facility bears interest at a rate of the LIBOR plus 2.00% per annum for Broadly Syndicated Loans (as defined in the Loan and Security Agreement) and LIBOR plus 2.75% per annum for all other investments. The Holdings Credit Facility also charges a non-usage fee, based on the unused facility amount multiplied by the Non-Usage Fee Rate (as defined in the Loan and Security Agreement).
Table of Contents
Notes to the Consolidated Financial Statements of
New Mountain Finance Corporation (Continued)
December 31, 2014
(in thousands, except share data) Note 7. Borrowings (Continued) Prior to December 18, 2014, the Loan and Security Agreement, as amended and restated, dated May 19, 2011 (the "Holdings"Predecessor Holdings Credit Facility") among the Operating CompanyNMF Holdings as the Borrower and Collateral Administrator, Wells Fargo Securities, L.L.C.LLC as the Administrative Agent, and Wells Fargo Bank, National Association, as the Collateral Custodian, iswas structured as a revolving credit facility and matureswould mature on October 27, 2016, as amended on May 8, 2012. The Operating Company2016. NMF Holdings became a party to the Predecessor Holdings Credit Facility upon the IPO of NMFC. The Predecessor Holdings Credit Facility amendsamended and restatesrestated the credit facility of the Predecessor Entities (the "Predecessor Credit Facility"). The maximum amount of revolving borrowings available under the Predecessor Holdings Credit Facility is $280,000, as amended on October 28, 2013. As ofwas $280,000. Until December 31, 2013, the Operating Company18, 2014, NMF Holdings was permitted to borrow up to 45.0% or 25.0% of the purchase price of pledged first lien or non-first lien debt securities, and up to 70.0% and 45.0% of the purchase price of specified first lien debt securities and specified non-first lien debt securities, respectively, subject to approval by Wells Fargo Bank, National Association. The Predecessor Holdings Credit Facility iswas amended and restated on May 6, 2014 and as a result, it was non-recourse to the Company and was collateralized by all of the investments of the Operating CompanyNMF Holdings on an investment by investment basis. All fees associated with the origination or upsizing of the Predecessor Holdings Credit Facility arewas capitalized on the Operating Company's Consolidated Statement of Assets Liabilities, and Members' CapitalLiabilities and charged against income as other credit facilityfinancing expenses over the life of the Predecessor Holdings Credit Facility. The Predecessor Holdings Credit Facility containscontained certain customary affirmative and negative covenants and events of default, including the occurrence of a change in control. In addition, the Predecessor Holdings Credit Facility requiresrequired the Operating Company to maintain a minimum asset coverage ratio. However, the covenants arewere generally not tied to mark to market fluctuations in the prices of the Operating Company'sNMF Holdings' investments, but rather to the performance of the underlying portfolio companies. The Predecessor Holdings Credit Facility bearsbore interest at a rate of the London Interbank Offered Rate ("LIBOR") plus 2.75% per annum as amended on May 8, 2012, and chargescharged a non-usage fee, based on the unused facility amount multiplied by the Non-Usage Fee Rate (as defined in the credit agreement).
Table of Contents
Combined Notes to the Consolidated Financial Statements of New Mountain Finance Holdings, L.L.C.,
the Financial Statements of New Mountain Finance CorporationLoan and the Financial Statements
of New Mountain Finance AIV Holdings Corporation (Continued)
December 31, 2013
(in thousands, except units/shares and per unit/share data)
Note 7. Borrowing Facilities (Continued)Security Agreement).
The following table summarizes the interest expense and non-usage fees incurred, bytogether, on the Operating Company onHoldings Credit Facility and the Predecessor Holdings Credit Facility for the years ended December 31, 2013,2014, December 31, 20122013 and December 31, 2011.2012. |
| | Years ended December 31, | | | Years ended December 31, | |
|---|
| | 2013 | | 2012 | | 2011 | | | 2014 | | 2013 | | 2012 | |
|---|
Interest expense | | $ | 5,487 | | $ | 4,172 | | $ | 2,043 | | | $ | 7,147 | | $ | 5,487 | | $ | 4,172 | | Non-usage fee | | $ | 367 | | $ | 281 | | $ | 608 | | | $ | 243 | | $ | 367 | | $ | 281 | | Amortization of financing costs | | | $ | 893 | | $ | 682 | | $ | 413 | | Weighted average interest rate | | 2.9 | % | | 3.1 | % | | 3.2 | % | | 2.9 | % | | 2.9 | % | | 3.1 | % | Effective interest rate | | | 3.4 | % | | 3.6 | % | | 3.6 | % | Average debt outstanding | | $ | 184,124 | | $ | 133,600 | | $ | 61,561 | | | $ | 244,598 | | $ | 184,124 | | $ | 133,600 | |
TheAs of December 31, 2014 the outstanding balance ofon the Holdings Credit Facility was $468,108 and as of December 31, 2013 and December 31, 2012, the outstanding balance on the Predecessor Holdings Credit Facility was $221,849 and $206,938, respectively, and NMF Holdings was in compliance
Table of Contents
Notes to the Consolidated Financial Statements of
New Mountain Finance Corporation (Continued)
December 31, 2011 was $221,849, $206,9382014
(in thousands, except share data) Note 7. Borrowings (Continued) with the applicable covenants in the Holdings Credit Facility and $129,038, respectively, and the Operating Company was not aware of any instances of non-compliance related to thePredecessor Holdings Credit Facility on such dates. SLF Credit Facility—NMF SLF's Loan and Security Agreement, as amended and restated, dated October 27, 2010 (the "SLF Credit Facility") among NMF SLF as the Borrower, the Operating CompanyNMF Holdings as the Collateral Administrator, Wells Fargo Securities, L.L.C.LLC as the Administrative Agent, and Wells Fargo Bank, National Association, as the Collateral Custodian, iswas structured as a revolving credit facility and matureswould mature on October 27, 2016, as amended on May 8, 2012.2016. The maximum amount of revolving borrowings available under the SLF Credit Facility is $215,000, as amended on December 18, 2012.was $215,000. The loan isSLF Credit Facility was non-recourse to the Operating Company and secured by all assets owned by the borrowerof NMF SLF on an investment by investment basis. All fees associated with the origination or upsizing of the SLF Credit Facility arewere capitalized on the Company's Consolidated Statement of Assets Liabilities, and Members' CapitalLiabilities and charged against income as other credit facilityfinancing expenses over the life of the SLF Credit Facility. The SLF Credit Facility containscontaind certain customary affirmative and negative covenants and events of default, including the occurrence of a change in control. The covenants arewere generally not tied to mark to market fluctuations in the prices of ourNMF SLF's investments, but rather to the performance of the underlying portfolio companies. Due to an amendment to the SLF Credit Facility on October 27, 2011, NMF SLF is no longerwas not restricted from the purchase or sale of loans with an affiliate. Therefore, specified loans cancould be moved as collateral between the Holdings Credit Facility and the SLF Credit Facility. The SLF Credit Facility merged with the Holdings Credit Facility on December 18, 2014. As ofUntil December 31, 2013,18, 2014, the SLF Credit Facility permitspermitted borrowings of up to 70.0% of the purchase price of pledged first lien debt securities and up to 25.0% of the purchase price of specified second lien loans, of which, up to 25.0% of the aggregate outstanding loan balance of all pledged debt securities in the SLF Credit Facility iswas allowed to be derived from second lien loans, subject to approval by Wells Fargo Bank, National Association, as amended on March 11, 2013.Association. The SLF Credit Facility bearsbore interest at a rate of LIBOR plus 2.00% per annum for first lien loans and LIBOR plus 2.75% per annum for second lien loans, respectively, as amended on March 11, 2013.respectively. A non-usage fee iswas paid, based on the unused facility amount multiplied by the Non-Usage Fee Rate (as defined in the credit agreement).
Table of Contents
Combined Notes to the Consolidated Financial Statements of New Mountain Finance Holdings, L.L.C.,
the Financial Statements of New Mountain Finance CorporationLoan and the Financial Statements
of New Mountain Finance AIV Holdings Corporation (Continued)
December 31, 2013
(in thousands, except units/shares and per unit/share data)
Note 7. Borrowing Facilities (Continued)Security Agreement).
The following table summarizes the interest expense and non-usage fees incurred by the Operating Company on the SLF Credit Facility for the period January 1, 2014 to December 17, 2014 (date of SLF Credit Facility merger with and into the Holdings Credit Facility) and for the years ended December 31, 2013 December 31, 2012 and December 31, 2011.2012. |
| | Years ended December 31, | | | January 1,
2014 to
December 17,
2014 (date of
merger) | | Years ended
December 31, | |
|---|
| | 2013 | | 2012 | | 2011 | | | 2013 | | 2012 | |
|---|
Interest expense | | $ | 4,891 | | $ | 4,274 | | $ | 3,369 | | | $ | 4,549 | | $ | 4,891 | | $ | 4,274 | | Non-usage fee | | $ | 3 | | $ | 22 | | $ | 94 | | | $ | 28 | | $ | 3 | | $ | 22 | | Amortization of financing costs | | | $ | 846 | | $ | 864 | | $ | 747 | | Weighted average interest rate | | 2.3 | % | | 2.3 | % | | 2.5 | % | | 2.2 | % | | 2.3 | % | | 2.3 | % | Effective interest rate | | | 2.6 | % | | 2.7 | % | | 2.8 | % | Average debt outstanding | | $ | 214,317 | | $ | 181,395 | | $ | 133,825 | | | $ | 209,333 | | $ | 214,317 | | $ | 181,395 | |
Table of Contents
Notes to the Consolidated Financial Statements of
New Mountain Finance Corporation (Continued)
December 31, 2014
(in thousands, except share data) Note 7. Borrowings (Continued) The outstanding balance asAs of December 31, 2014, the SLF Credit Facility had merged with the Holdings Credit Facility. As of December 31, 2013 and December 31, 2012, and December 31, 2011the outstanding balance on the SLF Credit Facility was $214,668 $214,262 and $165,928,$214,262, respectively, and NMF SLF was not aware of any instances of non-compliance related toin compliance with the applicable covenants in the SLF Credit Facility on such dates. NMFC Credit Facility—The Senior Secured Revolving Credit Agreement, as amended, dated June 4, 2014 (together with the related guarantee and security agreement, the "NMFC Credit Facility"), among the Company as the Borrower and Goldman Sachs Bank USA as the Administrative Agent and Collateral Agent, and Goldman Sachs Bank USA and Morgan Stanley, N.A. as Lenders, is structured as a senior secured revolving credit facility and matures on June 4, 2019. The NMFC Credit Facility is guaranteed by certain domestic subsidiaries of the Company and proceeds from the NMFC Credit Facility may be used for general corporate purposes, including the funding of portfolio investments. The maximum amount of revolving borrowings available under the NMFC Credit Facility is $80,000, as amended on December 29, 2014. The Company is permitted to borrow at various advance rates depending on the type of portfolio investment as outlined in the Senior Secured Revolving Credit Agreement. All fees associated with the origination of the NMFC Credit Facility are capitalized on the Company's Consolidated Statement of Assets and Liabilities and charged against income as other financing expenses over the life of the NMFC Credit Facility. The NMFC Credit Facility contains certain customary affirmative and negative covenants and events of default, including certain financial covenants related to asset coverage and liquidity and other maintenance covenants. The NMFC Credit Facility will generally bear interest at a rate of LIBOR plus 2.50% per annum or the prime rate plus 1.50% per annum, and charges a commitment fee, based on the unused facility amount multiplied by 0.375% (as defined in the Senior Secured Revolving Credit Agreement). The following table summarizes the interest expense and non-usage fees incurred on the NMFC Credit Facility for the period June 4, 2014 (commencement of the NMFC Credit Facility) to December 31, 2014 and for the years ended December 31, 2013 and December 31, 2012. | | | | | | | | | | |
| |
| | Years ended
December 31, | |
|---|
| | June 4, 2014
(commencement of
facility) to
December 31, 2014 | |
|---|
| | 2013(1) | | 2012(1) | |
|---|
Interest expense | | $ | 175 | | $ | — | | $ | — | | Non-usage fee | | $ | 86 | | $ | — | | $ | — | | Amortization of financing costs | | $ | 121 | | $ | — | | $ | — | | Weighted average interest rate | | | 2.7 | % | | — | % | | — | % | Effective interest rate | | | 3.4 | % | | — | % | | — | % | Average debt outstanding | | $ | 11,227 | | $ | — | | $ | — | |
- (1)
- Not applicable, as the NMFC Credit Facility commenced on June 4, 2014.
As of December 31, 2014, the outstanding balance on the NMFC Credit Facility was $50,000, and NMFC was in compliance with the applicable covenants in the NMFC Credit Facility on such dates.
Table of Contents
Notes to the Consolidated Financial Statements of
New Mountain Finance Corporation (Continued)
December 31, 2014
(in thousands, except share data) Note 7. Borrowings (Continued) Convertible Notes—On June 3, 2014, the Company closed a private offering of $115,000 aggregate principal amount of senior unsecured convertible notes (the "Convertible Notes"), pursuant to an indenture, dated June 3, 2014 (the "Indenture"). The Convertible Notes were issued in a private placement only to qualified institutional buyers pursuant to Rule 144A under the Securities Act of 1933. The Convertible Notes bear interest at an annual rate of 5.0%, payable semi-annually in arrears on June 15 and December 15 of each year, commencing on December 15, 2014. The Convertible Notes will mature on June 15, 2019 unless earlier converted or repurchased at the holder's option. The Convertible Notes will be convertible by the holders into shares of common stock, initially at a conversion rate of 62.7746 shares of the Company's common stock per $1 principal amount of Convertible Notes (7,219,083 common shares) corresponding to an initial conversion price per share of approximately $15.93, which represents a premium of 12.5% to the $14.16 per share closing price of the Company's common stock on May 28, 2014. The conversion rate will be subject to adjustment upon certain events, such as stock splits and combinations, mergers, spin-offs, increases in dividends in excess of $0.34 per share per quarter and certain changes in control. Certain of these adjustments, including adjustments for increases in dividends, are subject to a conversion price floor of $14.16 per share. In no event will the total number of shares of common stock issuable upon conversion exceed 70.6214 per $1 principal amount of the Convertible Notes. The Company has determined that the embedded conversion option in the Convertible Notes is not required to be separately accounted for as a derivative under GAAP. The Convertible Notes are senior unsecured obligations and rank senior in right of payment to the Company's existing and future indebtedness that is expressly subordinated in right of payment to the Convertible Notes; equal in right of payment to the Company's existing and future unsecured indebtedness that is not so subordinated; effectively junior in right of payment to any of the Company's secured indebtedness (including existing unsecured indebtedness that the Company later secures) to the extent of the value of the assets securing such indebtedness; and structurally junior to all existing and future indebtedness (including trade payables) incurred by the Company's subsidiaries and financing vehicles. As more reflected in Note 12,Earnings Per Share, the issuance is to be considered as part of the if-converted method for calculation of diluted earnings per share. The Company may not redeem the Convertible Notes prior to maturity. No sinking fund is provided for the Convertible Notes. In addition, if certain corporate events occur in respect of the Company, holders of the Convertible Notes may require the Company to repurchase for cash all or part of their Convertible Notes at a repurchase price equal to 100.0% of the principal amount of the Convertible Notes to be repurchased, plus accrued and unpaid interest through, but excluding, the repurchase date. The Indenture contains certain covenants, including covenants requiring the Company to provide financial information to the holders of the Convertible Note and the Trustee if the Company ceases to be subject to the reporting requirements of the Exchange Act. These covenants are subject to limitations and exceptions that are described in the Indenture. As of December 31, 2014, the Company was in compliance with the terms of the Indenture. Interest expense and amortization of financing costs incurred on the Convertible Notes for the year ended December 31, 2014 was $3,322 and $432, respectively. The effective interest rate for the year ended December 31, 2014 was 5.6%.
Table of Contents
Notes to the Consolidated Financial Statements of
New Mountain Finance Corporation (Continued)
December 31, 2014
(in thousands, except share data) Note 7. Borrowings (Continued) SBA-guaranteed debentures—On August 1, 2014, SBIC LP received an SBIC license from the SBA. The SBIC license allows SBIC LP to obtain leverage by issuing SBA-guaranteed debentures, subject to the issuance of a capital commitment by the SBA and other customary procedures. SBA-guaranteed debentures are non-recourse to the Company, interest only debentures with interest payable semi-annually and have a ten year maturity. The principal amount of SBA-guaranteed debentures is not required to be paid prior to maturity but may be prepaid at any time without penalty. The interest rate of SBA-guaranteed debentures is fixed on a semi-annual basis at a market-driven spread over U.S. Treasury Notes with ten year maturities. The SBA, as a creditor, will have a superior claim to the assets of SBIC LP over the Company's stockholders in the event SBIC LP is liquidated or the SBA exercises remedies upon an event of default. The maximum amount of borrowings available under current SBA regulations is $150,000 as long as the licensee has at least $75,000 in regulatory capital, receives a capital commitment from the SBA and has been through an examination by the SBA subsequent to licensing. As of December 31, 2014, SBIC LP had regulatory capital of $42,168 and SBA-guaranteed debentures outstanding of $37,500. The SBA-guaranteed debentures incur upfront fees of 3.43%, which consists of a 1.00% commitment fee and a 2.43% issuance discount, which are amortized over the life of the SBA-guaranteed debentures. As of December 31, 2014, SBIC LP's SBA-guaranteed debentures are set to pool in March 2015 and until pooling bear interest at an interim floating rate of LIBOR plus 0.30%. Interest expense and amortization of financing costs incurred on the SBA-guaranteed debentures for the year ended December 31, 2014 was $34 and $12, respectively. The SBIC program is designed to stimulate the flow of private investor capital into eligible small businesses, as defined by the SBA. Under SBA regulations, SBIC LP is subject to regulatory requirements, including making investments in SBA-eligible businesses, investing at least 25.0% of its investment capital in eligible smaller businesses, as defined under the 1958 Act, placing certain limitations on the financing terms of investments, regulating the types of financing, prohibiting investments in small businesses with certain characteristics or in certain industries and requiring capitalization thresholds that limit distributions to the Company. SBIC LP is subject to an annual periodic examination by an SBA examiner to determine SBIC LP's compliance with the relevant SBA regulations and an annual financial audit of its financial statements that are prepared on a basis of accounting other than GAAP (such as ASC 820) by an independent auditor. As of December 31, 2014, SBIC LP was in compliance with SBA regulatory requirements. Leverage risk factors—The Operating Company utilizes and may utilize leverage to the maximum extent permitted by the law for investment and other general business purposes. The Operating Company's lenders will have fixed dollar claims on certain assets that are superior to the claims of the Operating Company's unit holders, and therefore NMFC's common stockholders, and the Operating Company would expect such lenders to seek recovery against these assets in the event of a default. The use of leverage also magnifies the potential for gain or loss on amounts invested. Leverage may magnify interest rate risk (particularly on the Operating Company's fixed-rate investments), which is the risk that the prices of portfolio investments will fall or rise if market interest rates for those types of securities rise or fall. As a result, leverage may cause greater changes in the Operating Company's net asset value. Similarly, leverage may cause a sharper decline in the Operating Company's income
Table of Contents
Notes to the Consolidated Financial Statements of
New Mountain Finance Corporation (Continued)
December 31, 2014
(in thousands, except share data) Note 7. Borrowings (Continued) than if the Operating Company had not borrowed. Such a decline could negatively affect the Operating Company's ability to make dividend payments to its unit holders.stockholders. Leverage is generally considered a speculative investment technique. The Operating Company's ability to service any debt incurred will depend largely on financial performance and will be subject to prevailing economic conditions and competitive pressures. Note 8. Regulation NMFC and AIV Holdings haveThe Company has elected to be treated, and intendintends to comply with the requirements to continue to qualify annually, as RICsa RIC under Subchapter M of the Code. In order to continue to qualify as RICs,a RIC, among other things, NMFC and AIV Holdings arethe Company is required to timely distribute to theirits stockholders at least 90.0% of investment company taxable income, as defined by the Code, for each year. NMFC and AIV Holdings,The Company, among other things, intendintends to make and continue to make the requisite distributions to theirits stockholders, which will generally relieve NMFC and AIV Holdingsthe Company from U.S. federal, state, and local income taxes (excluding excise taxes which may be imposed under the Code). However, under certain circumstances, the distributions that the Operating Company makes to its members may not be sufficient for AIV Holdings to satisfy the annual distribution requirement necessary for AIV Holdings to continue to qualify as a RIC. In that case, it is expected that Guardian
Table of Contents
Combined Notes to the Consolidated Financial Statements of New Mountain Finance Holdings, L.L.C.,
the Financial Statements of New Mountain Finance Corporation and the Financial Statements
of New Mountain Finance AIV Holdings Corporation (Continued)
December 31, 2013
(in thousands, except units/shares and per unit/share data)
Note 8. Regulation (Continued)
AIV would consent to be treated as if it received distributions from AIV Holdings sufficient to satisfy the annual distribution requirement. Guardian AIV would be required to include the consent dividend in its taxable income as dividend from AIV Holdings, which would result in phantom (i.e., non-cash) taxable income to Guardian AIV.
Additionally as BDCs,a BDC, the CompaniesCompany must not acquire any assets other than "qualifying assets" specified in the 1940 Act unless, at the time the acquisition is made, at least 70.0% of its total assets are qualifying assets (with certain limited exceptions). Note 9. Commitments and Contingencies In the normal course of business, the CompaniesCompany may enter into contracts that contain a variety of representations and warranties and which provide general indemnifications. The Operating Company may also enter into future funding commitments such as revolving credit facilities, bridge financing commitments or delayed draw commitments. As of December 31, 2014, the Company had unfunded commitments on revolving credit facilities of $8,948, no outstanding bridge financing commitments and other future funding commitments of $18,475. The unfunded commitments on revolving credit facilities and a delayed draw are disclosed on the Company's Consolidated Schedule of Investments. As of December 31, 2013, the Company's only investment was its investment in the Predecessor Operating Company. As of December 31, 2013, the Predecessor Operating Company had unfunded commitments on revolving credit facilities of $15,500 and no outstanding bridge financing commitments or other future funding commitments. The unfunded commitments on revolving credit facilities are disclosed on the Operating Company's Consolidated Schedule of Investments. As of December 31, 2012, the Operating Company had unfunded commitments on revolving credit facilities of $10,500 and no outstanding bridge financing commitments or other future funding commitments, all of which arewere disclosed on the Operating Company'sNMF Holdings' Consolidated Schedule of Investments. The Operating Company also has revolving borrowings available under the Holdings Credit Facility and the SLFNMFC Credit Facility as of December 31, 2013.2014. See Note 7,Borrowing FacilitiesBorrowings, for details. The Operating Company may from time to time enter into financing commitment letters. As of December 31, 2013 and2014, the Company did not enter into any commitment letters to purchase debt investments, which could require funding in the future. As of December 31, 2012,2013, the Company's only investment was its investment in the Predecessor Operating Company. As of December 31, 2013, the Predecessor Operating Company did not enter into any commitment letters to purchase debt investments, which could require funding in the future.
Table of Contents
Notes to the Consolidated Financial Statements of
New Mountain Finance Corporation (Continued)
December 31, 2014
(in thousands, except share data) Note 10. Distributions Differences between taxable income and the results of operations for financial reporting purposes may be permanent or temporary in nature. Permanent differences are reclassified among capital accounts in the financial statements to reflect their tax character. Differences in classification may also result from the treatment of short-term gains as ordinary income for tax purposes. During the years ended December 31, 2014, December 31, 2013 and December 31, 2012, and December 31, 2011, NMFC did not have any reclassifications of amounts for book purposes arising from permanent book/tax differences. During the years ended December 31, 2013, December 31, 2012 and December 31, 2011, AIV Holdings had
Table of Contents
Combined Notes to the Consolidated Financial Statements of New Mountain Finance Holdings, L.L.C.,
the Financial Statements of New Mountain Finance Corporation and the Financial Statements
of New Mountain Finance AIV Holdings Corporation (Continued)
December 31, 2013
(in thousands, except units/shares and per unit/share data)
Note 10. Distributions (Continued)
Company's reclassifications of amounts for book purposes arising from permanent book/tax differences related to return of capital distributions and consent dividends, respectively.were as follows: |
| | December 31, 2013 | | December 31, 2012 | | December 31, 2011 | | | Years ended December 31, | |
|---|
| | NMFC | | AIV
Holdings | | NMFC | | AIV
Holdings | | NMFC | | AIV
Holdings | | | 2014 | | 2013 | | 2012 | |
|---|
Undistributed net investment income | | $ | — | | $ | — | | $ | — | | $ | — | | $ | — | | $ | — | | | $ | (6,171 | ) | $ | — | | $ | — | | Distributions in excess of net realized gains | | — | | (21,821 | ) | | — | | (9,707 | ) | | — | | (1,536 | ) | | 6,397 | | — | | — | | Additional paid-in-capital | | — | | 21,821 | | — | | 9,707 | | — | | 1,536 | | | (226 | ) | | — | | — | |
For U.S. federal income tax purposes, distributions paid to stockholders of NMFC and AIV Holdingsthe Company are reported as ordinary income, return of capital, long term capital gains or a combination thereof. The tax character of distributions paid by NMFC and AIV Holdingsthe Company for the years ended December 31, 2013,2014, December 31, 20122013 and December 31, 20112012 were estimated to be as follows: |
| | Years ended December 31, | | | Years ended December 31, | |
|---|
| |
| |
| | 2012 | | 2011 | | | 2014 | | 2013 | | 2012 | |
|---|
| | 2013 | | |
|---|
| |
| | AIV Holdings | |
| | AIV Holdings | | |
|---|
| | NMFC | | AIV Holdings | | NMFC | | NMFC | | |
|---|
Ordinary income(non-qualified) | | $ | 44,778 | | $ | 19,972 | | $ | 26,218 | | $ | 40,692 | | $ | 8,944 | | $ | 14,694 | | | Ordinary income (non-qualified) | | | $ | 73,968 | | $ | 44,778 | | $ | 26,218 | | Ordinary income (qualified) | | 2,742 | | 716 | | — | | — | | — | | — | | | 664 | | 2,742 | | — | | Capital gains | | 4,324 | | — | | 501 | | 2,056 | | 256 | | 2,697 | | | 2,754 | | 4,324 | | 501 | | Return of capital | | — | | 181,476 | | — | | 48,128 | | — | | — | | | 226 | | — | | — | | | | | | | | | | | | | | | | | | | | | | | | | | | | | | | | | | | | | | | | | | | Total | | $ | 51,844 | | $ | 202,164 | | $ | 26,719 | | $ | 90,876 | | $ | 9,200 | | $ | 17,391 | | | $ | 77,612 | | $ | 51,844 | | $ | 26,719 | |
Table of Contents
Combined Notes to the Consolidated Financial Statements of New Mountain Finance Holdings, L.L.C.,
the Financial Statements of New Mountain Finance Corporation and the Financial Statements
of New Mountain Finance AIV Holdings Corporation (Continued)
December 31, 2013
(in thousands, except units/shares and per unit/share data)
Note 10. Distributions (Continued)
As of December 31, 2014, December 31, 2013 the costs of investments for NMFC and AIV Holdings for tax purposes were $642,704 and $68,547, respectively. As of December 31, 2012, the costs of investments for NMFC and AIV Holdingsthe Company for tax purposes were $343,248$1,474,075, $642,704 and $245,659, respectively. As of December 31, 2013, NMFC and AIV Holdings had capital loss carryforwards of approximately zero and $15,772,$343,248, respectively. At December 31, 2013,2014, December 31, 20122013 and December 31, 2011,2012, the components of distributable earnings on a tax basis differ from the amounts reflected per NMFC's and AIV Holdings' respectivethe Company's Consolidated Statements of Assets and Liabilities by temporary book/tax differences primarily arising from differences between the tax and book basis of NMFC's and AIV Holdings' respectivethe Company's investment in securities held directly as well as through the Predecessor Operating Company and undistributed income.
Table of Contents
Notes to the Consolidated Financial Statements of
New Mountain Finance Corporation (Continued)
December 31, 2014
(in thousands, except share data) Note 10. Distributions (Continued) As of December 31, 2014, December 31, 2013 and December 31, 2012, and December 31, 2011, the Company's components of accumulated earnings / (deficit) on a tax basis were as follows: | | | | | | | | | | |
| | Years ended December 31, | |
|---|
| | 2014 | | 2013 | | 2012 | |
|---|
Accumulated capital gains / (losses) | | $ | — | | $ | — | | $ | — | | Other temporary differences | | | 4,775 | | | 10,070 | | | 7,942 | | Undistributed ordinary income | | | — | | | 3,856 | | | 528 | | Unrealized (appreciation) / depreciation | | | (30,383 | )(1) | | 2,346 | | | (2,274 | ) | | | | | | | | | | | | | Components of distributable earnings | | $ | (25,608 | ) | $ | 16,272 | | $ | 6,196 | |
| | | | | | | | | | | | | | | | | | | |
| | Years ended December 31, | |
|---|
| | 2013 | | 2012 | | 2011 | |
|---|
| | NMFC | | AIV Holdings | | NMFC | | AIV Holdings | | NMFC | | AIV Holdings | |
|---|
Accumulated capital gains / (losses) | | $ | — | | $ | (15,772 | ) | $ | — | | $ | — | | $ | — | | $ | — | | Other temporary differences | | | 10,070 | | | (4,982 | ) | | 7,942 | | | (5,032 | ) | | — | | | — | | Undistributed ordinary income | | | 3,856 | | | — | | | 528 | | | — | | | 66 | | | 1,778 | | Unrealized (appreciation) / depreciation | | | 2,346 | | | (2,830 | ) | | (2,274 | ) | | (10,970 | ) | | 823 | | | (886 | ) | | | | | | | | | | | | | | | | | | | | | | | | | | | | | | | | | | | | | Components of distributable earnings | | $ | 16,272 | | $ | (23,584 | ) | $ | 6,196 | | $ | (16,002 | ) | $ | 889 | | $ | 892 | |
- (1)
- Prior to the Restructuring, the Company's only investment was its investment in the Predecessor Operating Company. After the Restructuring, the Company directly holds the Predecessor Operating Company's investments. As a result, included in unrealized (appreciation) / depreciation is $(10,069) of timing differences attributable to deferred offering costs, built-in gains and other book/tax differences impacting the tax basis of the Predecessor Operating Company's investments. These differences were carried over to the Company, as the new operating company, from the Predecessor Operating Company.
NMFC and AIV Holdings areThe Company is subject to a 4.0% nondeductible federal excise tax on certain undistributed income unless NMFC and AIV Holdings distribute,the Company distributes, in a timely manner as required by the Code, an amount at least equal to the sum of (1) 98.0% of their respectiveits net ordinary income earned for the calendar year and (2) 98.2% of their respectiveits capital gain net income for the one-year period ending October 31 in the calendar year. For the year ended December 31, 2012, both NMFC and AIV Holdings2014, the Company had no accrued estimated excise taxes. For the year ended December 31, 2013, NMFC and AIV Holdingsthe Company accrued estimated excise taxes of $2.3 and zero, respectively.$2.3. For the year ended December 31, 2012, the Company had no accrued estimated excise taxes.
Table of Contents
Combined Notes to the Consolidated Financial Statements of New Mountain Finance Holdings, L.L.C.,
the Financial Statements of New Mountain Finance Corporation and the Financial Statements
of New Mountain Finance AIV Holdings Corporation (Continued)
December 31, 2013 2014
(in thousands, except units/shares and per unit/share data) Note 11. Stockholders' EquityNet Assets The table below illustrates the effect of certain transactions on the capitalnet asset accounts of NMFC:the Company: | | | | | | | | | | | | | | | | | | | | | | |
| | Common Stock | |
| |
| |
| |
| |
| |
|---|
| | Paid in Capital
in Excess
of Par | | Undistributed
Net Investment
Income | | Accumulated
Undistributed Net
Realized Gains | | Net Unrealized
Appreciation
(Depreciation) | | Total
Stockholders'
Equity | |
|---|
| | Shares | | Par Amount | |
|---|
Balance at December 31, 2010 | | | — | | $ | — | | $ | — | | $ | — | | $ | — | | $ | — | | $ | — | | Issuances of common stock in the IPO(1) | | | 7,272,727 | | | 73 | | | 99,927 | | | — | | | — | | | — | | | 100,000 | | Issuances of common stock in private placement(2) | | | 2,172,000 | | | 22 | | | 29,843 | | | — | | | — | | | — | | | 29,865 | | Issuances of common stock to New Mountain Guardian(3) | | | 1,252,964 | | | 12 | | | 18,477 | | | — | | | — | | | — | | | 18,489 | | Deferred offering costs allocated from New Mountain Finance Holdings, L.L.C. | | | — | | | — | | | (3,998 | ) | | — | | | — | | | — | | | (3,998 | ) | Dividends declared | | | — | | | — | | | — | | | (8,345 | ) | | (855 | ) | | — | | | (9,200 | ) | Net increase in stockholders' equity resulting from operations | | | — | | | — | | | — | | | 8,345 | | | 1,141 | | | 845 | | | 10,331 | | | | | | | | | | | | | | | | | | | | | | | | | | | | | | | | | | | | | | | | | | | Balance at December 31, 2011 | | | 10,697,691 | | $ | 107 | | $ | 144,249 | | $ | — | | $ | 286 | | $ | 845 | | $ | 145,487 | | Issuances of common stock | | | 13,628,560 | | | 136 | | | 191,561 | | | — | | | — | | | — | | | 191,697 | | Deferred offering costs allocated from New Mountain Finance Holdings, L.L.C. | | | — | | | — | | | (323 | ) | | — | | | — | | | — | | | (323 | ) | Dividends declared | | | — | | | — | | | — | | | (19,792 | ) | | (6,927 | ) | | — | | | (26,719 | ) | Net increase in stockholders' equity resulting from operations | | | — | | | — | | | — | | | 19,792 | | | 7,593 | | | 4,399 | | | 31,784 | | | | | | | | | | | | | | | | | | | | | | | | | | | | | | | | | | | | | | | | | | | Balance at December 31, 2012 | | | 24,326,251 | | $ | 243 | | $ | 335,487 | | $ | — | | $ | 952 | | $ | 5,244 | | $ | 341,926 | | Issuances of common stock | | | 20,898,504 | | | 209 | | | 298,177 | | | — | | | — | | | — | | | 298,386 | | Deferred offering costs allocated from New Mountain Finance Holdings, L.L.C. | | | — | | | — | | | (281 | ) | | — | | | — | | | — | | | (281 | ) | Dividends declared | | | — | | | — | | | — | | | (50,521 | ) | | (1,323 | ) | | — | | | (51,844 | ) | Net increase in stockholders' equity resulting from operations | | | — | | | — | | | — | | | 50,521 | | | 5,427 | | | 5,972 | | | 61,920 | | | | | | | | | | | | | | | | | | | | | | | | | | | | | | | | | | | | | | | | | | | Balance at December 31, 2013 | | | 45,224,755 | | $ | 452 | | $ | 633,383 | | $ | — | | $ | 5,056 | | $ | 11,216 | | $ | 650,107 | | | | | | | | | | | | | | | | | | | | | | | | | | | | | | | | | | | | | | | | | | | | | | | | | | | | | | | | | | | | | | | | | | | | | | | | | | | | | | | | | | | |
(1)On May 19, 2011, NMFC priced its IPO of 7,272,727 shares of common stock at a public offering price of $13.75 per share.
(2)Concurrently with the closing of the IPO and at the public offering price of $13.75 per share, NMFC sold an additional 2,172,000 shares of its common stock to certain executives and employees of, and other individuals affiliated with, New Mountain Capital in the Concurrent Private Placement.
(3)On May 19, 2011, NMFC issued 1,252,964 share of common stock to New Mountain Guardian Partners, L.P. for their respective ownership interest in the Predecessor Entities.
Table of Contents
Combined Notes to the Consolidated Financial Statements of New Mountain Finance Holdings, L.L.C.,
the Financial Statements of New Mountain Finance Corporation and the Financial Statements
of New Mountain Finance AIV Holdings Corporation (Continued)
December 31, 2013
(in thousands, except units/shares and per unit/share data)
Note 11. Stockholders' Equity (Continued)
The table below illustrates the effect of certain transactions on the capital accounts of AIV Holdings:
| | | | | | | | | | | | | | | | | | | | | | |
| | Common Stock | |
| |
| |
| |
| |
| |
|---|
| | Paid in Capital
in Excess
of Par | | Undistributed
Net Investment
Income | | Distributions
In Excess of Net
Realized Gains | | Net Unrealized
(Depreciation)
Appreciation | | Total
Stockholder's
Equity | |
|---|
| | Shares | | Par Amount | |
|---|
Balance at December 31, 2010 | | | — | | $ | — | | $ | — | | $ | — | | $ | — | | $ | — | | $ | — | | Issuance of common stock to New Mountain Guardian AIV, L.P.(2) | | | 100 | | | — | (1) | | 298,407 | | | — | | | — | | | — | | | 298,407 | | Deferred offering costs allocated from New Mountain Finance Holdings, L.L.C. | | | — | | | — | | | (7,559 | ) | | — | | | — | | | — | | | (7,559 | ) | Dividends declared | | | — | | | — | | | — | | | (15,775 | ) | | (1,616 | ) | | — | | | (17,391 | ) | Net increase (decrease) in stockholder's equity resulting from operations | | | — | | | — | | | — | | | 15,775 | | | 2,158 | | | (16,375 | ) | | 1,558 | | Tax reclassifications related to consent dividends (See Note 10) | | | — | | | — | | | 1,536 | | | — | | | (1,536 | ) | | — | | | — | | | | | | | | | | | | | | | | | | | | | | | | | | | | | | | | | | | | | | | | | | | Balance at December 31, 2011 | | | 100 | | $ | — | (1) | $ | 292,384 | | $ | — | | $ | (994 | ) | $ | (16,375 | ) | $ | 275,015 | | Deferred offering costs allocated from New Mountain Finance Holdings, L.L.C. | | | — | | | — | | | (241 | ) | | — | | | — | | | — | | | (241 | ) | Dividends declared | | | — | | | — | | | — | | | (25,426 | ) | | (7,234 | ) | | — | | | (32,660 | ) | Distribution to New Mountain Guardian AIV, L.P. | | | — | | | — | | | (57,835 | ) | | — | | | (381 | ) | | — | | | (58,216 | ) | Net increase in stockholder's equity resulting from operations | | | — | | | — | | | — | | | 25,426 | | | 11,640 | | | 7,049 | | | 44,115 | | Tax reclassifications related to return of capital distributions (See Note 10) | | | — | | | — | | | 9,707 | | | — | | | (9,707 | ) | | — | | | — | | | | | | | | | | | | | | | | | | | | | | | | | | | | | | | | | | | | | | | | | | | Balance at December 31, 2012 | | | 100 | | $ | — | (1) | $ | 244,015 | | $ | — | | $ | (6,676 | ) | $ | (9,326 | ) | $ | 228,013 | | Deferred offering costs allocated from New Mountain Finance Holdings, L.L.C. | | | — | | | — | | | (50 | ) | | — | | | — | | | — | | | (50 | ) | Dividends declared | | | — | | | — | | | — | | | (13,155 | ) | | (141 | ) | | — | | | (13,296 | ) | Distribution to New Mountain Guardian AIV, L.P. | | | — | | | — | | | (203,793 | ) | | — | | | 14,925 | | | — | | | (188,868 | ) | Net increase (decrease) in stockholder's equity resulting from operations | | | — | | | — | | | — | | | 13,155 | | | (13,099 | ) | | 12,554 | | | 12,610 | | Tax reclassifications related to return of capital distributions (See Note 10) | | | — | | | — | | | 21,821 | | | — | | | (21,821 | ) | | — | | | — | | | | | | | | | | | | | | | | | | | | | | | | | | | | | | | | | | | | | | | | | | | Balance at December 31, 2013 | | | 100 | | $ | — | (1) | $ | 61,993 | | $ | — | | $ | (26,812 | ) | $ | 3,228 | | $ | 38,409 | | | | | | | | | | | | | | | | | | | | | | | | | | | | | | | | | | | | | | | | | | | | | | | | | | | | | | | | | | | | | | | | | | | | | | | | | | | | | | | | | | | |
(1)As of December 31, 2013, December 31, 2012 and December 31, 2011, the par amount of the total common stock was $1.
(2)On May 19, 2011, AIV Holdings issued 100 shares of common stock to New Mountain Guardian AIV, L.P. for their respective ownership interest in the Predecessor Entities.
| | | | | | | | | | | | | | | | | | | | | | |
| | Common Stock | |
| |
| |
| |
| |
| |
|---|
| | Paid in
Capital in
Excess
of Par | | Undistributed
Net
Investment
Income | | Accumulated
Undistributed
Net Realized
Gains | | Net
Unrealized
Appreciation
(Depreciation) | |
| |
|---|
| | Shares | | Par
Amount | | Total
Net Assets | |
|---|
Balance at December 31, 2011 | | | 10,697,691 | | $ | 107 | | $ | 144,249 | | $ | — | | $ | 286 | | $ | 845 | | $ | 145,487 | | Issuances of common stock | | | 13,628,560 | | | 136 | | | 191,561 | | | — | | | — | | | — | | | 191,697 | | Deferred offering costs allocated from New Mountain Finance Holdings, L.L.C. | | | — | | | — | | | (323 | ) | | — | | | — | | | — | | | (323 | ) | Dividends declared | | | — | | | — | | | — | | | (19,792 | ) | | (6,927 | ) | | — | | | (26,719 | ) | Net increase in net assets resulting from operations | | | — | | | — | | | — | | | 19,792 | | | 7,593 | | | 4,399 | | | 31,784 | | | | | | | | | | | | | | | | | | | | | | | | | | Balance at December 31, 2012 | | | 24,326,251 | | $ | 243 | | $ | 335,487 | | $ | — | | $ | 952 | | $ | 5,244 | | $ | 341,926 | | Issuances of common stock | | | 20,898,504 | | | 209 | | | 298,177 | | | — | | | — | | | — | | | 298,386 | | Deferred offering costs allocated from New Mountain Finance Holdings, L.L.C. | | | — | | | — | | | (281 | ) | | — | | | — | | | — | | | (281 | ) | Dividends declared | | | — | | | — | | | — | | | (50,521 | ) | | (1,323 | ) | | — | | | (51,844 | ) | Net increase in net assets resulting from operations | | | — | | | — | | | — | | | 50,521 | | | 5,427 | | | 5,972 | | | 61,920 | | | | | | | | | | | | | | | | | | | | | | | | | | Balance at December 31, 2013 | | | 45,224,755 | | $ | 452 | | $ | 633,383 | | $ | — | | $ | 5,056 | | $ | 11,216 | | $ | 650,107 | | Issuances of common stock | | | 12,773,135 | | | 128 | | | 184,698 | | | — | | | — | | | — | | | 184,826 | | Deferred offering costs allocated from New Mountain Finance Holdings, L.L.C. | | | — | | | — | | | (250 | ) | | — | | | — | | | — | | | (250 | ) | Deferred offering costs | | | — | | | — | | | (476 | ) | | — | | | — | | | — | | | (476 | ) | Dividends declared | | | — | | | — | | | — | | | (71,365 | ) | | (6,247 | ) | | — | | | (77,612 | ) | Net increase (decrease) in net assets resulting from operations | | | — | | | — | | | — | | | 80,066 | | | 8,925 | | | (43,416 | ) | | 45,575 | | Tax reclassifications related to return of capital distributions (See Note 10) | | | — | | | — | | | (226 | ) | | (6,171 | ) | | 6,397 | | | — | | | — | | | | | | | | | | | | | | | | | | | | | | | | | | Balance at December 31, 2014 | | | 57,997,890 | | $ | 580 | | $ | 817,129 | | $ | 2,530 | | $ | 14,131 | | $ | (32,200 | ) | $ | 802,170 | | | | | | | | | | | | | | | | | | | | | | | | | | | | | | | | | | | | | | | | | | | | | | | | | | | | | | | | | | | | | | | | | | | | | | | | | |
Table of Contents
Combined Notes to the Consolidated Financial Statements of New Mountain Finance Holdings, L.L.C.,
the Financial Statements of New Mountain Finance Corporation and the Financial Statements
of New Mountain Finance AIV Holdings Corporation (Continued)
December 31, 2013 2014
(in thousands, except units/shares and per unit/share data) Note 12. Earnings Per Share The following information sets forth the computation of basic and diluted net increase in NMFC'sthe Company's net assets per share resulting from operations for the years ended December 31, 2014, December 31, 2013 and December 31, 2012: | | | | | | | | | | |
| | Years ended December 31, | |
|---|
| | 2014 | | 2013 | | 2012 | |
|---|
Earnings per share—basic | | | | | | | | | | | Numerator for basic earnings per share: | | $ | 45,575 | | $ | 61,920 | | $ | 31,784 | | Denominator for basic weighted average share: | | | 51,846,164 | | | 35,092,722 | | | 14,860,838 | | | | | | | | | | | | | | Basic earnings per share: | | $ | 0.88 | | $ | 1.76 | | $ | 2.14 | | | | | | | | | | | | | | Earnings per share—diluted(1) | | | | | | | | | | | Numerator for increase in net assets per share | | $ | 45,575 | | $ | 61,920 | | $ | 31,784 | | Adjustment for interest on Convertible Notes and incentive fees, net | | | 2,658 | | | — | | | — | | | | | | | | | | | | | | Numerator for diluted earnings per share: | | $ | 48,233 | | $ | 61,290 | | $ | 31,784 | | Denominator for basic weighted average share | | |
51,846,164 | | |
35,092,722 | | |
14,860,838 | | Adjustment for dilutive effect of Convertible Notes | | | 4,311,671 | | | — | | | — | | | | | | | | | | | | | | Denominator for diluted weighted average share | | | 56,157,835 | | | 35,092,722 | | | 14,860,838 | | | | | | | | | | | | | | Diluted earnings per share | | $ | 0.86 | | $ | 1.76 | | $ | 2.14 | | | | | | | | | | | | | |
- (1)
- In applying the if-converted method, conversion is not assumed for purposes of computing diluted earnings per share if the effect would be anti-dilutive. For the year ended December 31, 2014, there was no anti-dilution. For the years ended December 31, 2013 and December 31, 2012,
and the period from May 19, 2011 (commencement of operations)due to December 31, 2011: | | | | | | | | | | |
| |
| |
| | May 19, 2011
(commencement of
operations) to
December 31,
2011 | |
|---|
| | Years ended December 31, | |
|---|
| | 2013 | | 2012 | |
|---|
Numerator for basic earnings per share: | | $ | 61,920 | | $ | 31,784 | | $ | 10,331 | | Denominator for basic weighted average share: | | | 35,092,722 | | | 14,860,838 | | | 10,697,691 | | | | | | | | | | | | | | | | | | | | | | | Basic earnings per share: | | $ | 1.76 | | $ | 2.14 | | $ | 0.97 | | | | | | | | | | | | | | | | | | | | | | | Numerator for diluted earnings per share(a): | | $ | 78,924 | | $ | 73,996 | | $ | 11,881 | | Denominator for diluted weighted average share(b): | | | 44,021,920 | | | 34,011,738 | | | 30,919,629 | | | | | | | | | | | | | | | | | | | | | | | Diluted earnings per share: | | $ | 1.79 | | $ | 2.18 | | $ | 0.38 | | | | | | | | | | | | | | | | | | | | | | |
(a)Includesreflecting earnings for the full income atyear of operations of the Predecessor Operating Company for the period. For the period May 19, 2011 (commencementassuming 100.0% NMFC ownership of operations) to December 31, 2011, NMFC's unrealized appreciationPredecessor Operating Company and assuming all of AIV Holdings' units in the Operating Company resulting from the IPO is netted against AIV Holdings' unrealized depreciation in the Operating Company resulting from the IPO.
(b)Assumes all AIV Holdings units in thePredecessor Operating Company were exchanged for public shares of NMFC during the years then ended, December 31, 2013, December 31, 2012the earnings per share would be $1.79 and for the period from May 19, 2011 to December 31, 2011, respectively (see Note 1,Formation and Business Purpose).$2.18, respectively.
Table of Contents
Combined Notes to the Consolidated Financial Statements of New Mountain Finance Holdings, L.L.C.,
the Financial Statements of New Mountain Finance Corporation and the Financial Statements
of New Mountain Finance AIV Holdings Corporation (Continued)
December 31, 2013 2014
(in thousands, except units/shares and per unit/share data) Note 13. Financial Highlights The following information sets forth the financial highlights for the Operating Company for the respective years ended December 31st. | | | | | | | | | | | | | | | | |
| | Years ended December 31, | |
|---|
| | 2013 | | 2012 | | 2011 | | 2010 | | 2009 | |
|---|
Total return based on net asset value(a) | | | 13.27 | % | | 16.61 | % | | 10.09 | % | | 26.54 | % | | 76.38 | % | Average net assets for the period | | $ | 630,156 | | $ | 474,561 | | $ | 361,031 | | $ | 245,951 | | $ | 195,467 | | Ratio to average net assets: | | | | | | | | | | | | | | | | | Net investment income | | | 10.10 | % | | 9.53 | % | | 10.67 | % | | 15.23 | % | | 10.44 | % | Total expenses (gross) | | | 8.64 | % | | 9.07 | % | | 5.59 | % | | 1.59 | % | | 0.72 | % | Total expenses (net of reimbursable expenses) | | | 8.13 | % | | 8.55 | % | | 4.99 | % | | 1.59 | % | | 0.72 | % | Net assets, end of year | | $ | 688,516 | | $ | 569,939 | | $ | 420,502 | | $ | 241,927 | | $ | 239,441 | | Average debt outstanding—Holdings Credit Facility | | $ | 184,124 | | $ | 133,600 | | $ | 61,561 | | $ | 68,343 | | $ | 65,014 | | Average debt outstanding—SLF Credit Facility | | $ | 214,317 | | $ | 181,395 | | $ | 133,825 | | $ | 27,672 | | | N/A | | Weighted average common membership units outstanding for the year | | | 44,021,920 | | | 34,011,738 | | | 30,919,629 | (b) | | N/A | | | N/A | | Asset coverage ratio | | | 257.73 | % | | 235.31 | % | | 242.56 | % | | 307.43 | % | | 407.98 | % | Portfolio turnover | | | 40.52 | % | | 52.02 | % | | 42.13 | % | | 76.69 | % | | 57.50 | % |
N/A—Not applicable.
(a)For the years ended December 31, 2013 and December 31, 2012, total return is calculated assuming a purchase at net asset value on the opening of the first day of the year and a sale at net asset value on the last day of the respective year. Dividends and distributions, if any, are assumed for purposes of this calculation, to be reinvested at the net asset value on the last day of the respective quarter. For the year ended December 31, 2011, total return is calculated in two parts: (1) from the opening of the first day of the year to NMFC's IPO date, total return is calculated based on net income over weighted average net assets and (2) from NMFC's IPO date to the last day of the year, total return is calculated assuming a purchase at net asset value on NMFC's IPO date and a sale at net asset value on the last day of the year. Dividends and distributions, if any, are assumed for purposes of this calculation, to be reinvested at the net asset value on the last day of the respective quarter. For the years ended December 31, 2010 and December 31, 2009, total return is the ratio of net income compared to capital, adjusted for capital contributions and distributions.
(b)Weighted average common membership units outstanding presented from May 19, 2011 to December 31, 2011, as the fund became unitized on May 19, 2011, the IPO date.
Table of Contents
Combined Notes to the Consolidated Financial Statements of New Mountain Finance Holdings, L.L.C.,
the Financial Statements of New Mountain Finance Corporation and the Financial Statements
of New Mountain Finance AIV Holdings Corporation (Continued)
December 31, 2013
(in thousands, except units/shares and per unit/share data)
Note 13. Financial Highlights (Continued)
| | | | | | | | | | |
| | Years ended December 31, | | May 19, 2011
(commencement of
operations) to
December 31,
2011 | |
|---|
| | 2013 | | 2012 | |
|---|
Per unit data for the Operating Company(a): | | | | | | | | | | | Net asset value, January 1, 2013, January 1, 2012 and May 19, 2011(b), respectively | | $ | 14.06 | | $ | 13.60 | | $ | 14.08 | | Net investment income | | | 1.45 | | | 1.33 | | | 0.78 | | Net realized and unrealized gains (losses) | | | 0.35 | | | 0.84 | | | (0.40 | ) | Dividends from net investment income | | | (1.48 | ) | | (1.71 | ) | | (0.86 | ) | | | | | | | | | | | | | | | | | | | | | | Net increase (decrease) in net assets resulting from operations | | | 0.32 | | | 0.46 | | | (0.48 | ) | Net asset value, December 31, 2013, December 31, 2012 and December 31, 2011, respectively | | $ | 14.38 | | $ | 14.06 | | $ | 13.60 | | | | | | | | | | | | | | | | | | | | | | | | | | | | | | | | | | | | | | | | | | | |
(a)Per unit data is based on weighted average common membership units outstanding.
(b)Data presented from May 19, 2011 to December 31, 2011 as the fund became unitized on May 19, 2011, the IPO date.
Table of Contents
Combined Notes to the Consolidated Financial Statements of New Mountain Finance Holdings, L.L.C.,
the Financial Statements of New Mountain Finance Corporation and the Financial Statements
of New Mountain Finance AIV Holdings Corporation (Continued)
December 31, 2013
(in thousands, except units/shares and per unit/share data)
Note 13. Financial Highlights (Continued)
The following information sets forth the financial highlights for NMFC for the year ended2014, December 31, 2013, December 31, 2012 and the period May 19, 2011 to December 31, 2011. The ratios to average net assets have been annualized for the period May 19, 2011 to December 31, 2011.
| | | | | | | | | | |
| |
| |
| | May 19, 2011
(commencement of
operations) to
December 31,
2011 | |
|---|
| | Years ended December 31, | |
|---|
| | 2013 | | 2012 | |
|---|
Per share data(a): | | | | | | | | | | | Net asset value, January 1, 2013, January 1, 2012 and May 19, 2011(b), respectively | | $ | 14.06 | | $ | 13.60 | | $ | 13.50 | | Net increase (decrease) in net assets resulting from operations allocated from New Mountain Finance Holdings, L.L.C.: | | | | | | | | | | | Net investment income | | | 1.45 | | | 1.33 | | | 0.78 | | Net realized and unrealized gains (losses) | | | 0.35 | | | 0.84 | | | (0.40 | ) | | | | | | | | | | | | | | | | | | | | | | Total net increase | | | 1.80 | | | 2.17 | | | 0.38 | | Net change in unrealized appreciation (depreciation) of investment in New Mountain Finance Holdings, L.L.C. | | | — | | | — | | | 0.58 | | Dividends declared | | | (1.48 | ) | | (1.71 | ) | | (0.86 | ) | | | | | | | | | | | | | | | | | | | | | | Net asset value, December 31, 2013, December 31, 2012 and December 31, 2011, respectively | | $ | 14.38 | | $ | 14.06 | | $ | 13.60 | | | | | | | | | | | | | | | | | | | | | | | | | | | | | | | | | | | | | | | | | | | | Per share market value, December 31, 2013, December 31, 2012 and December 31, 2011, respectively | | $ | 15.04 | | $ | 14.90 | | $ | 13.41 | | | | | | | | | | | | | | | | | | | | | | | | | | | | | | | | | | | | | | | | | | | | Total return based on market value(c) | | | 11.62 | % | | 24.84 | % | | 4.16 | % | Total return based on net asset value(d) | | | 13.27 | % | | 16.61 | % | | 2.82 | % | Shares outstanding at end of period | | | 45,224,755 | | | 24,326,251 | | | 10,697,691 | | Average weighted shares outstanding for the period | | | 35,092,722 | | | 14,860,838 | | | 10,697,691 | | Average net assets for the period | | $ | 502,822 | | $ | 196,312 | | $ | 147,766 | | Ratio to average net assets(e): | | | | | | | | | | | Total expenses allocated from New Mountain Finance Holdings, L.L.C. | | | 8.13 | % | | 8.55 | % | | 5.79 | % | Net investment income allocated from New Mountain Finance Holdings, L.L.C. | | | 10.10 | % | | 9.53 | % | | 9.08 | % |
| | | | | | | | | | | | | |
| | Years ended December 31, | | May 19, 2011
(commencement of
operations) to
December 31, 2011 | |
|---|
| | 2014 | | 2013 | | 2012 | |
|---|
Per share data(1): | | | | | | | | | | | | | | Net asset value, January 1, 2014, January 1, 2013, January 1, 2012 and May 19, 2011(2), respectively | | $ | 14.38 | | $ | 14.06 | | $ | 13.60 | | $ | 13.50 | | Net investment income | | | 1.10 | | | — | | | — | | | — | | Net realized and unrealized gains (losses)(3) | | | (0.80 | ) | | — | | | — | | | — | | Net increase (decrease) in net assets resulting from operations allocated from NMF Holdings: | | | | | | | | | | | | | | Net investment income(4) | | | 0.44 | | | 1.45 | | | 1.33 | | | 0.78 | | Net realized and unrealized gains (losses)(3)(4) | | | 0.19 | | | 0.35 | | | 0.84 | | | (0.40 | ) | | | | | | | | | | | | | | | | Total net increase | | | 0.93 | | | 1.80 | | | 2.17 | | | 0.38 | | Net change in unrealized appreciation (depreciation) of investment in NMF Holdings | | | — | | | — | | | — | | | 0.58 | | Dividends declared to stockholders from net investment income | | | (1.36 | ) | | (1.45 | ) | | (1.28 | ) | | (0.78 | ) | Dividends declared to stockholders from net realized gains | | | (0.12 | ) | | (0.03 | ) | | (0.43 | ) | | (0.08 | ) | | | | | | | | | | | | | | | | Net asset value, December 31, 2014, December 31, 2013, December 31, 2012 and December 31, 2011, respectively | | $ | 13.83 | | $ | 14.38 | | $ | 14.06 | | $ | 13.60 | | | | | | | | | | | | | | | | | | | | | | | | | | | | | | | | | | | | | | | | | | | | | | | Per share market value, December 31, 2014, December 31, 2013, December 31, 2012 and December 31, 2011, respectively | | $ | 14.94 | | $ | 15.04 | | $ | 14.90 | | $ | 13.41 | | | | | | | | | | | | | | | | | | | | | | | | | | | | | | | | | | | | | ��� | | | | | | | | | | Total return based on market value(5) | | | 9.66 | % | | 11.62 | % | | 24.84 | % | | 4.16 | % | Total return based on net asset value(6) | | | 6.56 | % | | 13.27 | % | | 16.61 | % | | 2.82 | % | Shares outstanding at end of period | | | 57,997,890 | | | 45,224,755 | | | 24,326,251 | | | 10,697,691 | | Average weighted shares outstanding for the period | | | 51,846,164 | | | 35,092,722 | | | 14,860,838 | | | 10,697,691 | | Average net assets for the period | | $ | 749,732 | | $ | 502,822 | | $ | 196,312 | | $ | 147,766 | | Ratio to average net assets(7): | | | | | | | | | | | | | | Net investment income | | | 10.68 | % | | 10.10 | % | | 9.53 | % | | 9.08 | % | Total expenses, before waivers/reimbursements | | | 7.65 | % | | 8.53 | % | | 9.61 | % | | 6.62 | % | Total expenses, net of waivers/reimbursements | | | 7.41 | % | | 8.13 | % | | 8.55 | % | | 5.79 | % |
(a)(1)- Per share data is based on weighted average shares outstanding for the respective period (except for dividends declared to stockholders which is based on actual rate per share).
- (2)
- Data presented from May 19, 2011 to December 31, 2011 as the fund became unitized on May 19, 2011, the IPO date.
- (3)
- Includes the accretive effect of common stock issuances per share, which for the years ended December 31, 2014, December 31, 2013 and December 31, 2012 were $0.05, $0.04 and $0.03, respectively. No additional common stock issuances were made during 2011 after the IPO.
- (4)
- For the years ended December 31, 2014, December 31, 2013, December 31, 2012 and December 31, 2011, per share data is based on the summation of the per share results of operations items over the outstanding shares for the period in which the respective line items were realized or earned.
(b)Data presented from May 19, 2011 to December 31, 2011 as the fund became unitized on May 19, 2011, the IPO date.
Table of Contents
Combined Notes to the Consolidated Financial Statements of New Mountain Finance Holdings, L.L.C.,
the Financial Statements of New Mountain Finance Corporation and the Financial Statements
of New Mountain Finance AIV Holdings Corporation (Continued)
December 31, 2013 2014
(in thousands, except units/shares and per unit/share data) Note 13. Financial Highlights (Continued) (c)(5)For the years ended December 31, 2013, December 31, 2012 and for the period May 19, 2011 to December 31, 2011, totalTotal return is calculated assuming a purchase of common stock at the opening of the first day of the years ended 2013 and 2012, and assuming a purchase of common stock at IPO, respectively,year and a sale on the closing of the last business day of the respective year.period. Dividends and distributions, if any, are assumed for purposes of this calculation, to be reinvested at prices obtained under NMFC'sthe Company's dividend reinvestment plan.
(d)(6)- Total return is calculated assuming a purchase at net asset value on the opening of the first day of the period and a sale at net asset value on the last day of the period. Dividends and distributions, if any, are assumed for purposes of this calculation, to be reinvested at the net asset value on the last day of the respective quarter.
(e)(7)- Ratio to average net assets for the years ended December 31, 2014, December 31, 2013 and December 31, 2012 and for the period May 19, 2011 to December 31, 2011, is based on the summation of the results of operations items over the net assets for the period in which the respective line items were realized or earned.
The following information sets forth the financial highlights for AIV Holdings for For the year ended December 31, 2013, December 31, 20122014, the Company is reflecting its net investment income and expenses as well as its proportionate share of the period May 19, 2011 to December 31, 2011. The ratios to averagePredecessor Operating Company's net assets have been annualized for the period May 19, 2011 to December 31, 2011.
| | | | | | | | | | |
| | Years ended
December 31, | | May 19, 2011
(commencement of
operations) to
December 31,
2011 | |
|---|
| | 2013 | | 2012 | |
|---|
Total return based on net asset value(a) | | | 7.69 | % | | 18.04 | % | | (5.44 | )% | Average net assets for the period | | $ | 127,334 | | $ | 270,081 | | $ | 279,323 | | Ratio to average net assets(b): | | | | | | | | | | | Total expenses allocated from New Mountain Finance Holdings, L.L.C. | | | 8.13 | % | | 8.55 | % | | 5.79 | % | Net investment income allocated from New Mountain Finance Holdings, L.L.C. | | | 10.10 | % | | 9.53 | % | | 9.08 | % |
(a)- investment income and expenses. For the years ended December 31, 2013 and December 31, 2012 and for the period May 19, 2011 to December 31, 2011,
total returnthe Company is calculated assuming a purchase at net asset value on the openingreflecting its proportionate share of the first day ofPredecessor Operating Company's net investment income and expenses.
The following information sets forth the periodfinancial highlights for the Company for the year ended December 31, 2014 and a sale at net asset value on the last business day of the period. Dividends and distributions, if any, are assumed for purposes of this calculation, to be reinvested at the net asset value on the last day of the respective quarter.
(b)Ratio to average net assetsNMF Holdings for the years ended December 31, 2013, December 31, 2012, December 31, 2011 and December 31, 2012 is based on2010. | | | | | | | | | | | | | | | | |
| |
| | NMF Holdings
Years ended December 31, | |
|---|
| | NMFC
Year ended
December 31,
2014 | |
|---|
| | 2013 | | 2012 | | 2011 | | 2010 | |
|---|
Average debt outstanding—Holdings Credit Facility(1) | | $ | 243,693 | | $ | 184,124 | | $ | 133,600 | | $ | 61,561 | | $ | 68,343 | | Average debt outstanding—SLF Credit Facility(2) | | $ | 208,377 | | $ | 214,317 | | $ | 181,395 | | $ | 133,825 | | $ | 27,672 | | Average debt outstanding—Convertible Notes(3) | | $ | 115,000 | | $ | — | | $ | — | | $ | — | | $ | — | | Average debt outstanding—SBA-guaranteed debentures(4) | | $ | 29,167 | | $ | — | | $ | — | | $ | — | | $ | — | | Average debt outstanding—NMFC Credit Facility(5) | | $ | 11,227 | | $ | — | | $ | — | | $ | — | | $ | — | | Asset coverage ratio(6) | | | 226.70 | % | | 257.73 | % | | 235.31 | % | | 242.56 | % | | 307.43 | % | Portfolio turnover(7) | | | 29.51 | % | | 40.52 | % | | 52.02 | % | | 42.13 | % | | 76.69 | % |
- (1)
- For the
summationyear ended December 31, 2014, average debt outstanding represents the Company's average debt outstanding as well as the Company's proportionate share of the resultsPredecessor Operating Company's average debt outstanding. The average debt outstanding for the year ended December 31, 2014 at the Holdings Credit Facility was $244,598.
- (2)
- For the year ended December 31, 2014, average debt outstanding represents the Company's average debt outstanding as well as the Company's proportionate share of
operations items over the net assetsPredecessor Operating Comapany's average debt outstanding for the period in whichJanuary 1, 2014 to December 17, 2014 (date of SLF Credit Facility merger with and into the respective line items were realized or earned.Holdings Credit Facility). The average debt outstanding for the period January 1, 2014 to December 17, 2014 at the SLF Credit Facility was $209,333.
- (3)
- For the year ended December 31, 2014, average debt outstanding represents the period from June 3, 2014 (issuance of the Convertible Notes) to December 31, 2014.
- (4)
- For the year ended December 31, 2014, average debt outstanding represents the period from November 17, 2014 (date of initial SBA-guaranteed debenture borrowing) to December 31, 2014.
- (5)
- For the year ended December 31, 2014, average debt outstanding represents the period from June 4, 2014 (commencement of the NMFC Credit Facility) to December 31, 2014.
- (6)
- On November 5, 2014, the Company received exemptive relief from the SEC allowing the Company to modify the asset coverage requirement to exclude the SBA-guaranteed debentures from this calculation.
- (7)
- For the year ended December 31, 2014, portfolio turnover represents the investment activity of the Predecessor Operating Company and the Company.
Table of Contents
Combined Notes to the Consolidated Financial Statements of New Mountain Finance Holdings, L.L.C.,
the Financial Statements of New Mountain Finance Corporation and the Financial Statements
of New Mountain Finance AIV Holdings Corporation (Continued)
December 31, 2013 2014
(in thousands, except units/shares and per unit/share data) Note 14. Selected Quarterly Financial Data (unaudited) The below selected quarterly financial data is for the Operating Company. | | | | | | | | | | | | | | | | | | | | | | | | | |
| | Investment Income | | Net Investment
Income | | Total Net Realized
Gains and
Net Changes in
Unrealized
Appreciation
(Depreciation)
of Investments | | Net Increase
(Decrease) in
Capital Resulting
from Operations | |
|---|
Quarter Ended | | Total | | Per
Unit | | Total | | Per
Unit | | Total | | Per
Unit | | Total | | Per
Unit | |
|---|
December 31, 2013 | | $ | 28,645 | | $ | 0.60 | | $ | 15,848 | | $ | 0.33 | | $ | 3,213 | | $ | 0.07 | | $ | 19,061 | | $ | 0.40 | | September 30, 2013 | | | 25,793 | | | 0.57 | | | 12,659 | | | 0.29 | | | 7,819 | | | 0.17 | | | 20,478 | | | 0.46 | | June 30, 2013 | | | 35,156 | | | 0.82 | | | 23,543 | | | 0.55 | | | (8,719 | ) | | (0.21 | ) | | 14,824 | | | 0.34 | | March 31, 2013 | | | 25,318 | | | 0.62 | | | 11,627 | | | 0.28 | | | 12,934 | | | 0.32 | | | 24,561 | | | 0.60 | | December 31, 2012 | |
$ |
24,713 | |
$ |
0.65 | |
$ |
13,522 | |
$ |
0.36 | |
$ |
3,478 | |
$ |
0.09 | |
$ |
17,000 | |
$ |
0.45 | | September 30, 2012 | | | 21,752 | | | 0.60 | | | 10,136 | | | 0.28 | | | 12,109 | | | 0.34 | | | 22,245 | | | 0.62 | | June 30, 2012 | | | 20,299 | | | 0.66 | | | 11,646 | | | 0.38 | | | (561 | ) | | (0.02 | ) | | 11,085 | | | 0.36 | | March 31, 2012 | | | 19,022 | | | 0.62 | | | 9,913 | | | 0.32 | | | 13,754 | | | 0.45 | | | 23,667 | | | 0.77 | | December 31, 2011 | |
$ |
17,127 | |
$ |
0.55 | |
$ |
9,540 | |
$ |
0.31 | |
$ |
8,317 | |
$ |
0.27 | |
$ |
17,857 | |
$ |
0.58 | | September 30, 2011 | | | 15,069 | | | 0.49 | | | 10,002 | | | 0.32 | | | (21,255 | ) | | (0.68 | ) | | (11,253 | ) | | (0.36 | ) | June 30, 2011 | | | 13,116 | | | 0.42 | | | 9,554 | | | 0.31 | | | (899 | ) | | (0.03 | ) | | 8,655 | | | 0.28 | | March 31, 2011 | | | 11,212 | | | N/A | | | 9,429 | | | N/A | | | 6,990 | | | N/A | | | 16,419 | | | N/A | | December 31, 2010 | |
$ |
9,820 | | |
N/A | |
$ |
8,335 | | |
N/A | |
$ |
7,978 | | |
N/A | |
$ |
16,313 | | |
N/A | | September 30, 2010 | | | 13,881 | | | N/A | | | 13,145 | | | N/A | | | 5,560 | | | N/A | | | 18,705 | | | N/A | | June 30, 2010 | | | 8,597 | | | N/A | | | 7,777 | | | N/A | | | (5,349 | ) | | N/A | | | 2,428 | | | N/A | | March 31, 2010 | | | 9,077 | | | N/A | | | 8,208 | | | N/A | | | 18,138 | | | N/A | | | 26,346 | | | N/A | | December 31, 2009 | |
$ |
7,617 | | |
N/A | |
$ |
6,617 | | |
N/A | |
$ |
1,617 | | |
N/A | |
$ |
8,234 | | |
N/A | | September 30, 2009 | | | 6,148 | | | N/A | | | 6,030 | | | N/A | | | 33,709 | | | N/A | | | 39,739 | | | N/A | | June 30, 2009 | | | 5,092 | | | N/A | | | 4,877 | | | N/A | | | 42,562 | | | N/A | | | 47,439 | | | N/A | | March 31, 2009 | | | 2,910 | | | N/A | | | 2,883 | | | N/A | | | 27,385 | | | N/A | | | 30,268 | | | N/A | |
N/A—Not applicable, as the Operating Company was not unitized until May 19, 2011.
Table of Contents
Combined Notes to the Consolidated Financial Statements of New Mountain Finance Holdings, L.L.C.,
the Financial Statements of New Mountain Finance Corporation and the Financial Statements
of New Mountain Finance AIV Holdings Corporation (Continued)
December 31, 2013
(in thousands, except units/shares and per unit/share data)
Note 14. Selected Quarterly Financial Data (unaudited) (Continued)
The below selected quarterly financial data is for NMFC.
| | | | | | | | | | | | | | | | | | | |
| | Net Investment
Income allocated
from the Operating
Company | | Total Net Realized
and Unrealized Gains
(Losses) | | Net Increase
(Decrease) in Net
Assets Resulting from
Operations | |
|---|
Quarter Ended | | Total | | Per Share | | Total | | Per Share | | Total | | Per Share | |
|---|
December 31, 2013 | | $ | 14,826 | | $ | 0.33 | | $ | 3,119 | | $ | 0.07 | | $ | 17,945 | | $ | 0.40 | | September 30, 2013 | | | 10,803 | | | 0.29 | | | 6,664 | | | 0.17 | | | 17,467 | | | 0.46 | | June 30, 2013 | | | 17,674 | | | 0.55 | | | (6,682 | ) | | (0.21 | ) | | 10,992 | | | 0.34 | | March 31, 2013 | | | 7,218 | | | 0.28 | | | 8,298 | | | 0.33 | | | 15,516 | | | 0.61 | | December 31, 2012 | |
$ |
7,759 | |
$ |
0.36 | |
$ |
2,047 | |
$ |
0.09 | |
$ |
9,806 | |
$ |
0.45 | | September 30, 2012 | | | 4,574 | | | 0.28 | | | 5,381 | | | 0.34 | | | 9,955 | | | 0.62 | | June 30, 2012 | | | 4,029 | | | 0.38 | | | (194 | ) | | (0.02 | ) | | 3,835 | | | 0.36 | | March 31, 2012 | | | 3,430 | | | 0.32 | | | 4,758 | | | 0.45 | | | 8,188 | | | 0.77 | | December 31, 2011 | |
$ |
3,301 | |
$ |
0.31 | |
$ |
2,877 | |
$ |
0.27 | |
$ |
6,178 | |
$ |
0.58 | | September 30, 2011 | | | 3,460 | | | 0.32 | | | (7,353 | ) | | (0.68 | ) | | (3,893 | ) | | (0.36 | ) | June 30, 2011 | | | 1,584 | | | 0.15 | | | 6,462 | | | 0.60 | | | 8,046 | | | 0.75 | | March 31, 2011 | | | N/A | | | N/A | | | N/A | | | N/A | | | N/A | | | N/A | |
N/A—Not applicable, as NMFC did not commence operations until May 19, 2011.
Table of Contents
Combined Notes to the Consolidated Financial Statements of New Mountain Finance Holdings, L.L.C.,
the Financial Statements of New Mountain Finance Corporation and the Financial Statements
of New Mountain Finance AIV Holdings Corporation (Continued)
December 31, 2013
(in thousands, except units/shares and per unit/share data)
Note 14. Selected Quarterly Financial Data (unaudited) (Continued)
The below selected quarterly financial data is for AIV Holdings.
| | | | | | | | | | | Quarter Ended | | Net Investment
Income allocated
from the Operating
Company | | Total Net Realized
and Unrealized Gains
(Losses) | | Net Increase
(Decrease) in Net
Assets Resulting from
Operations | |
|---|
December 31, 2013 | | $ | 1,022 | | $ | (1,614 | ) | $ | (592 | ) | September 30, 2013 | | | 1,855 | | | 1,156 | | | 3,011 | | June 30, 2013 | | | 5,869 | | | (3,078 | ) | | 2,791 | | March 31, 2013 | | | 4,409 | | | 2,991 | | | 7,400 | | December 31, 2012 | |
$ |
5,764 | |
$ |
1,431 | |
$ |
7,195 | | September 30, 2012 | | | 5,562 | | | 8,630 | | | 14,192 | | June 30, 2012 | | | 7,617 | | | (367 | ) | | 7,250 | | March 31, 2012 | | | 6,483 | | | 8,995 | | | 15,478 | | December 31, 2011 | |
$ |
6,240 | |
$ |
5,439 | |
$ |
11,679 | | September 30, 2011 | | | 6,542 | | | (13,902 | ) | | (7,360 | ) | June 30, 2011 | | | 2,994 | | | (5,755 | ) | | (2,761 | ) | March 31, 2011 | | | N/A | | | N/A | | | N/A | |
N/A—Not applicable, as AIV Holdings did not commence operations until May 19, 2011.
| | | | | | | | | | | | | | | | | | | | | | | | | |
| | Total Investment
Income | | Net Investment
Income | | Total Net Realized
and Unrealized
(Losses) Gains | | Net Increase
(Decrease) in Net
Assets Resulting
from Operations | |
|---|
Quarter Ended | | Total | | Per Share | | Total | | Per Share | | Total | | Per Share | | Total | | Per Share | |
|---|
December 31, 2014 | | $ | 36,748 | | $ | 0.65 | | $ | 25,919 | | $ | 0.46 | | $ | (34,865 | ) | $ | (0.62 | ) | $ | (8,946 | ) | $ | (0.16 | ) | September 30, 2014 | | | 34,706 | | | 0.67 | | | 20,800 | | | 0.40 | | | (13,389 | ) | | (0.26 | ) | | 7,411 | | | 0.14 | | June 30, 2014 | | | 33,708 | | | 0.65 | | | 17,289 | | | 0.34 | | | 6,373 | | | 0.12 | | | 23,662 | | | 0.46 | | March 31, 2014 | | | 30,439 | | | 0.65 | | | 16,058 | | | 0.34 | | | 7,390 | | | 0.16 | | | 23,448 | | | 0.50 | | December 31, 2013 | |
$ |
26,783 | |
$ |
0.60 | |
$ |
14,826 | |
$ |
0.33 | |
$ |
3,119 | |
$ |
0.07 | |
$ |
17,945 | |
$ |
0.40 | | September 30, 2013 | | | 22,012 | | | 0.58 | | | 10,803 | | | 0.29 | | | 6,664 | | | 0.17 | | | 17,467 | | | 0.46 | | June 30, 2013 | | | 26,400 | | | 0.82 | | | 17,674 | | | 0.55 | | | (6,682 | ) | | (0.21 | ) | | 10,992 | | | 0.34 | | March 31, 2013 | | | 15,681 | | | 0.62 | | | 7,218 | | | 0.28 | | | 8,298 | | | 0.33 | | | 15,516 | | | 0.61 | | December 31, 2012 | |
$ |
14,165 | |
$ |
0.65 | |
$ |
7,759 | |
$ |
0.36 | |
$ |
2,047 | |
$ |
0.09 | |
$ |
9,806 | |
$ |
0.45 | | September 30, 2012 | | | 9,742 | | | 0.60 | | | 4,574 | | | 0.28 | | | 5,381 | | | 0.34 | | | 9,955 | | | 0.62 | | June 30, 2012 | | | 7,023 | | | 0.66 | | | 4,029 | | | 0.38 | | | (194 | ) | | (0.02 | ) | | 3,835 | | | 0.36 | | March 31, 2012 | | | 6,581 | | | 0.62 | | | 3,430 | | | 0.32 | | | 4,758 | | | 0.45 | | | 8,188 | | | 0.77 | |
Note 15. Recent Accounting Standards Updates In June 2013, the Financial Accounting Standards Board ("FASB") issued Accounting Standards Update No. 2013-08,Financial Services—Services—Investment Companies (Topic 946)—Topic 946—Amendments to the Scope, Measurement and Disclosure Requirements ("ASU 2013-08"), which contains new guidance on assessing whether an entity is an investment company, requiring non-controlling ownership interests in investment companies to be measured at fair value and requiring certain additional disclosures. ASU 2013-08 is effective for interim and annual periods beginning after December 15, 2013. The Company is an investment company that is applying the specialized guidance in Topic 946 as of January 1, 2014. In May 2014, the FASB issued Accounting Standards Update No. 2014-09,Revenue from Contracts with Customers Topic 606—Summary and Amendments that Create Revenue from Contracts with Customers and Other Assets and Deferred Costs ("ASU 2014-09"). ASU 2014-09 establishes a comprehensive and converged standard on revenue recognition to enable financial statement users to better understand and consistently analyze an entity's revenue across industries, transactions and geographies. The core principle of the new guidance is that an entity should recognize revenue to depict the transfer of promised goods or services to customers in an amount that reflects the consideration to which the entity expects to be entitled in exchange for those goods or services. To achieve that core principle, an entity should apply the following steps: (1) identify the contract(s) with a customer, (2) identify the performance obligations in the contract, (3) determine the transaction price, (4) allocate the transaction price to the performance obligations in the contract, and (5) recognize revenue when (or as) the entity satisfies a performance obligation. The new guidance also specifies the
Table of Contents
Notes to the Consolidated Financial Statements of
New Mountain Finance Corporation (Continued)
December 31, 2014
(in thousands, except share data) Note 15. Recent Accounting Standards Updates (Continued) accounting for certain costs to obtain or fulfill a contract with a customer. The new guidance requires improved disclosures to help users of financial statements better understand the nature, amount, timing, and uncertainty of revenue that is recognized. Qualitative and quantitative information is required to be disclosed about: (1) contracts with customers, (2) significant judgments and changes in judgments, and (3) assets recognized from costs to obtain or fulfill a contract. The new guidance will apply to all entities. The guidance is effective for interim and annual reporting periods in fiscal years beginning after December 15, 2016. Early application is not permitted. The Company is in the process of evaluating the impact that this guidance will have on its consolidated financial statements and disclosures. In June 2014, the FASB issued Accounting Standards Update No. 2014-11,Transfers and Servicing Topic 860��Repurchase-to-Maturity Transactions, Repurchase Financings, and Disclosures ("ASU 2014-11"). ASU 2014-11 changes the accounting for repurchase- and resale-to-maturity agreements by requiring that such agreements be recognized as financing arrangements, and requires that a transfer of a financial asset and a repurchase agreement entered into contemporaneously be accounted for separately. ASU 2014-11 requires additional disclosures about certain transferred financial assets accounted for as sales and certain securities financing transactions. The accounting changes and additional disclosures about certain transferred financial assets accounted for as sales are effective for the first interim and annual reporting periods beginning after December 15, 2014. The additional disclosures for securities financing transactions are required for annual reporting periods beginning after December 15, 2014 and for interim reporting periods beginning after March 15, 2015. The Company is in the process of evaluating the impact that this guidance will have on its consolidated financial statements and disclosures. In August 2014, the FASB issued Accounting Standards Update No. 2014-15,Presentation of Financial Statements—Going Concern Subtopic 205-40—Disclosure of Uncertainties about an Entity's Ability to Continue as a Going Concern ("ASU 2014-15"). ASU 2014-15 will explicitly require management to assess an entity's ability to continue as a going concern, and to provide related footnote disclosure in certain circumstances. The new standard will be effective for all entities in the first annual period ending after December 15, 2016. Earlier adoption is permitted. The adoption of ASU 2013-082014-15 is not expected to have a material impact on the Companies'Company's consolidated financial statements.statements and disclosures. Note 16. Subsequent Events On January 27,December 31, 2014 NMFC announced that the U.S. Small Business Administration ("SBA") issued a "green light" letter inviting NMFC to continue its application process to obtain a license to form and operate a Small Business Investment Company ("SBIC") subsidiary. If approved, a SBIC license would provide NMFC with an incremental source of attractive long-term capital. Receipt of a green light letter from the SBA does not assure an applicant that the SBA will ultimately issue an SBIC license, and NMFC has received no assurance or indication from the SBA
Table of Contents
Combined Notescontinuing subsequent to the Consolidated Financial Statementsyear then ended, the Company's portfolio investment in Edmentum, Inc. disclosed its projected substantial financial deterioration. The Company reflects this information in the valuation of New Mountain Finance Holdings, L.L.C.,
the Financial Statementsthis portfolio investment as of New Mountain Finance Corporation and the Financial Statements
of New Mountain Finance AIV Holdings Corporation (Continued)
December 31, 2013 (in thousands, except units/shares and per unit/share data)
Note 16. Subsequent Events (Continued)
that it will receive2014. All interest due to the Company through the year ended December 31, 2014 has been paid. As more information becomes available, the Company may experience a SBIC license, orfurther mark down of the timeframefair value of this investment. This investment may be placed on non-accrual status in which it would receive a license, should one ultimately be granted.the future. The investment represents 1.1% of the total portfolio at fair value as of December 31, 2014.
In January 2015, UniTek emerged from "Pre-Packaged" Chapter 11 Bankruptcy and completed its restructuring. On February 3, 2014, NMFC completed an underwritten secondary public offering of 2,325,000 shares of its common stock on behalf of a selling stockholder, AIV Holdings, at a public offering price of $14.70 per share. In connection with23, 2015, the underwritten secondary public offering, the underwriters purchased an additional 346,938 shares of NMFC's common stock from AIV Holdings with the exercise of the overallotment option to purchase up to an additional 346,938 shares of common stock. NMFC did not receive any proceeds from the sale of shares of NMFC's common stock by AIV Holdings. The Operating Company and NMFC did not bear any expenses in connection with this offering. The offering expenses were borne by the selling stockholder, AIV Holdings. As of February 3, 2014, AIV Holdings no longer owns any units of the Operating Company and NMFC owns 100.0% of the outstanding units of the Operating Company. As a result, the Companies' current organizational structure may be collapsed or simplified in the future. On March 4, 2014, the Operating Company's board of directors, and subsequently NMFC's board of directors declared a first quarter 20142015 distribution of $0.34 per unit/share payable on March 31, 20142015 to holders of record as of March 17, 2014.2015.
Table of Contents The terms "we", "us", "our" and the "Companies""Company" refers to the collective: New Mountain Finance Holdings, L.L.C., New Mountain Finance Corporation and New Mountain Finance AIV Holdings Corporation.its consolidated subsidiaries. Item 9. Changes in and Disagreements with Accountants on Accounting and Financial Disclosure
None. Item 9A. Controls and Procedures
(a) Evaluation of Disclosure Controls and Procedures As of December 31, 20132014 (the end of the period covered by this report), we, including our Chief Executive Officer and Chief Financial Officer, evaluated the effectiveness of the design and operation of our disclosure controls and procedures (as defined in Rule 13a-15(e) of the Securities Act of 1934, as amended). Based on that evaluation, our management, including the Chief Executive Officer and Chief Financial Officer, concluded that our disclosure controls and procedures were effective and provided reasonable assurance that information required to be disclosed in our periodic United States Securities and Exchange Commission filings is recorded, processed, summarized and reported within the time periods specified in the United States Securities and Exchange Commission's rules and forms, and that such information is accumulated and communicated to our management, including our Chief Executive Officer and Chief Financial Officer, as appropriate, to allow timely decisions regarding required disclosure. However, in evaluating the disclosure controls and procedures, management recognized that any controls and procedures, no matter how well designed and operated can provide only reasonable assurance of achieving the desired control objectives, and management necessarily was required to apply its judgment in evaluating the cost-benefit relationship of such possible controls and procedures. (b) Report of Management on Internal Control Over Financial Reporting Management is responsible for establishing and maintaining adequate internal control over financial reporting, and for performing an assessment of the effectiveness of internal control over financial reporting. Internal control over financial reporting is a process designed to provide reasonable assurance regarding the reliability of financial reporting and the preparation of financial statements for external purposes in accordance with generally accepted accounting principles. The Companies'Company's internal control over financial reporting includes those policies and procedures that (i) pertain to assets of the Companies;Company; (ii) provide reasonable assurance that transactions are recorded as necessary to permit preparation of financial statements in accordance with generally accepted accounting principles, and that receipts and expenditures of the CompaniesCompany are being made only in accordance with authorizations of management and directors of the Companies;Company; and (iii) provide reasonable assurance regarding prevention or timely detection of unauthorized acquisition, use, or disposition of the Companies'Company assets that could have a material effect on the financial statements. Management performed an assessment of the effectiveness of the Companies'Company's internal control over financial reporting as of December 31, 20132014 based upon the criteria in the 19922013 Internal Control—Integrated Framework issued by the Committee of Sponsoring Organizations of the Treadway Commission. Based on management's assessment, management determined that the Companies'Company's internal control over financial reporting was effective as of December 31, 2013.2014. (c) Attestation Report of the Registered Public Accounting Firm. Our independent registered public accounting firm, Deloitte & Touche LLP, has issued an attestation report on New Mountain Finance Corporation's internal control over financial reporting, which is set forth on the following page.
Table of Contents  
REPORT OF INDEPENDENT REGISTERED PUBLIC ACCOUNTING FIRM ON
INTERNAL CONTROL OVER FINANCIAL REPORTING
To the Board of Directors and Stockholders of
New Mountain Finance Corporation
New York, New York We have audited the internal control over financial reporting of New Mountain Finance Corporation and subsidiaries (the "Company") as of December 31, 2013,2014, based on criteria established inInternal Control—Integrated Framework (1992)(2013) issued by the Committee of Sponsoring Organizations of the Treadway Commission. The Company's management is responsible for maintaining effective internal control over financial reporting and for its assessment of the effectiveness of internal control over financial reporting, included in the accompanying Report of Management on Internal Control over Financial Reporting. Our responsibility is to express an opinion on the Company's internal control over financial reporting based on our audit. We conducted our audit in accordance with the standards of the Public Company Accounting Oversight Board (United States). Those standards require that we plan and perform the audit to obtain reasonable assurance about whether effective internal control over financial reporting was maintained in all material respects. Our audit included obtaining an understanding of internal control over financial reporting, assessing the risk that a material weakness exists, testing and evaluating the design and operating effectiveness of internal control based on the assessed risk, and performing such other procedures as we considered necessary in the circumstances. We believe that our audit provides a reasonable basis for our opinion. A company's internal control over financial reporting is a process designed by, or under the supervision of, the company's principal executive and principal financial officers, or persons performing similar functions, and effected by the company's board of directors, management, and other personnel to provide reasonable assurance regarding the reliability of financial reporting and the preparation of financial statements for external purposes in accordance with generally accepted accounting principles. A company's internal control over financial reporting includes those policies and procedures that (1) pertain to the maintenance of records that, in reasonable detail, accurately and fairly reflect the transactions and dispositions of the assets of the company; (2) provide reasonable assurance that transactions are recorded as necessary to permit preparation of financial statements in accordance with generally accepted accounting principles, and that receipts and expenditures of the company are being made only in accordance with authorizations of management and directors of the company; and (3) provide reasonable assurance regarding prevention or timely detection of unauthorized acquisition, use, or disposition of the company's assets that could have a material effect on the financial statements. Because of the inherent limitations of internal control over financial reporting, including the possibility of collusion or improper management override of controls, material misstatements due to error or fraud may not be prevented or detected on a timely basis. Also, projections of any evaluation of the effectiveness of the internal control over financial reporting to future periods are subject to the risk that the controls may become inadequate because of changes in conditions, or that the degree of compliance with the policies or procedures may deteriorate. In our opinion, the Company maintained, in all material respects, effective internal control over financial reporting as of December 31, 2013,2014, based on the criteria established inInternal
Table of Contents Control—Integrated Framework (1992)(2013) issued by the Committee of Sponsoring Organizations of the Treadway Commission. We have also audited, in accordance with the standards of the Public Company Accounting Oversight Board (United States), the statement of assets and liabilities,consolidated statements as of December 31, 2013, and the related statements of operations, changes in net assets and cash flows and the financial highlights for the year then ended December 31, 2014 of the Company and our report dated March 5, 20142, 2015 expressed an unqualified opinion on those consolidated financial statements.statements and included an explanatory paragraph regarding the Company's restructuring. /s/ DELOITTE & TOUCHE LLP New York, New York
March 5, 20142, 2015
Table of Contents (d)Changes in Internal Controls Over Financial Reporting Management has not identified any change in the Companies'Company's internal control over financial reporting that occurred during the quarter ended December 31, 20132014 that has materially affected, or is reasonably likely to materially affect, the Companies'Company's internal control over financial reporting. Item 9B. Other Information
None.
Table of Contents The terms "we", "us", "our" and the "Company" refers to New Mountain Finance Corporation and its consolidated subsidiaries.
PART III
The terms "we", "us", "our" and the "Companies" refers to the collective: New Mountain Finance Holdings, L.L.C., New Mountain Finance Corporation and New Mountain Finance AIV Holdings Corporation. We will file a definitive Joint Proxy Statement for the Companies' 2014Company's 2015 Annual Meeting of Stockholders with the United States Securities and Exchange Commission, pursuant to Regulation 14A, not later than 120 days after the end of our fiscal year. Accordingly, certain information required by Part III has been omitted under General Instruction G(3) to Form 10-K. Only those sections of our definitive Proxy Statement that specifically address the items set forth herein are incorporated by reference. Item 10. Directors, Executive Officers and Corporate Governance
The information required by Item 10 is hereby incorporated by reference from the definitive Joint Proxy Statement relating to the Companies' 2014Company's 2015 Annual Meeting of Stockholders, to be filed with the United States Securities and Exchange Commission within 120 days following the end of the Companies'Company's fiscal year. Item 11. Executive Compensation
The information required by Item 11 is hereby incorporated by reference from the definitive Joint Proxy Statement relating to the Companies' 2014Company's 2015 Annual Meeting of Stockholders, to be filed with the United States Securities and Exchange Commission within 120 days following the end of the Companies'Company's fiscal year. Item 12. Security Ownership of Certain Beneficial Owners and Management and Related Stockholder Matters
The information required by Item 12 is hereby incorporated by reference from the definitive Joint Proxy Statement relating to the Companies' 2014Company's 2015 Annual Meeting of Stockholders, to be filed with the United States Securities and Exchange Commission within 120 days following the end of the Companies'Company's fiscal year. Item 13. Certain Relationships and Related Transactions, and Director Independence
The information required by Item 13 is hereby incorporated by reference from the definitive Joint Proxy Statement relating to the Companies' 2014Company's 2015 Annual Meeting of Stockholders, to be filed with the United States Securities and Exchange Commission within 120 days following the end of the Companies'Company's fiscal year. Item 14. Principal Accountant Fees and Services
The information required by Item 14 is hereby incorporated by reference from the definitive Joint Proxy Statement relating to the Companies' 2014Company's 2015 Annual Meeting of Stockholders, to be filed with the United States Securities and Exchange Commission within 120 days following the end of the Companies'Company's fiscal year.
Table of Contents
PART IV
Item 15. Exhibits and Financial Statement Schedules
(a) Documents Filed as Part of this Report The following financial statements are set forth in Item 8:
| | | | | New Mountain Finance Holdings, L.L.C.Corporation | | | | | Consolidated Statements of Assets Liabilities and Members' CapitalLiabilities as of December 31, 20132014 and December 31, 20122013 | | | 102107 | | Consolidated Statements of Operations for the years ended December 31, 2013,2014, December 31, 20122013 and December 31, 20112012 | | | 103108 | | Consolidated Statements of Changes in Members' CapitalNet Assets for the years ended December 31, 2013,2014, December 31, 20122013 and December 31, 20112012 | | | 104109 | | Consolidated Statements of Cash Flows for the years ended December 31, 2013,2014, December 31, 20122013 and December 31, 20112012 | | | 105110 | | Consolidated Schedule of Investments as of December 31, 2014 | | | 111 | | Consolidated Schedule of Investments as of December 31, 2013 | | | 106118 | | Consolidated Schedule of Investments as of December 31, 2012
| | 113 | New Mountain Finance Corporation
| | | Statements of Assets and Liabilities as of December 31, 2013 and December 31, 2012
| | 118 | Statements of Operations for the years ended December 31, 2013, December 31, 2012 and from May 19, 2011 (commencement of operations) to December 31, 2011
| | 119 | Statements of Changes in Net Assets for the years ended December 31, 2013, December 31, 2012 and from May 19, 2011 (commencement of operations) to December 31, 2011
| | 120 | Statements of Cash Flows for the years ended December 31, 2013, December 31, 2012 and from May 19, 2011 (commencement of operations) to December 31, 2011
| | 121 | New Mountain Finance AIV Holdings Corporation
| | | Statements of Assets and Liabilities as of December 31, 2013 and December 31, 2012
| | 122 | Statements of Operations for the years ended December 31, 2013, December 31, 2012 and from May 19, 2011 (commencement of operations) to December 31, 2011
| | 123 | Statements of Changes in Net Assets for the years ended December 31, 2013, December 31, 2012 and from May 19, 2011 (commencement of operations) to December 31, 2011
| | 124 | Statements of Cash Flows for the years ended December 31, 2013, December 31, 2012 and from May 19, 2011 (commencement of operations) to December 31, 2011
| | 125 | Combined Notes to the Consolidated Financial Statements of New Mountain Finance Holdings, L.L.C., the Financial Statements of New Mountain Finance Corporation and the Financial Statements of New Mountain Finance AIV Holdings Corporation
| | | 126
123 | |
Table of Contents (b) Exhibits The following exhibits are filed as part of this report or hereby incorporated by reference to exhibits previously filed with the United States Securities and Exchange Commission: | | | | Exhibit
Number | | Description |
|---|
| | 2.13.1 | | Merger Agreement, dated May 19, 2011 by and between New Mountain Finance Holdings, L.L.C. and New Mountain Guardian Debt Funding, L.L.C.(5) |
|
2.2 |
|
Merger Agreement, dated May 19, 2011 by and between New Mountain Guardian Partners Debt Funding, L.L.C. and New Mountain Guardian Partners (Leveraged), L.L.C.(5) |
|
2.3 |
|
Merger Agreement, dated May 19, 2011 by and between New Mountain Finance Holdings, L.L.C. and New Mountain Guardian Partners (Leveraged), L.L.C.(5) |
|
3.1 |
(a) |
Certificate of Incorporation of New Mountain Guardian Corporation(3) |
|
3.1 |
(b) |
Certificate of Amendment to Certificate of Incorporation of New Mountain Guardian Corporation changing its name to New Mountain Finance Corporation(1) |
|
3.1 |
(c) |
Amended and Restated Certificate of Incorporation of New Mountain Finance Corporation(4)Corporation(2) |
|
3.1 |
(d) |
Certificate of Formation of New Mountain Guardian (Leveraged), L.L.C.(1) |
|
3.1 |
(e) |
Certificate of Amendment to Certificate of Formation of New Mountain Guardian (Leveraged), L.L.C. changing its name to New Mountain Finance Holdings, L.L.C.(5) |
|
3.1 |
(f) |
Certificate of Incorporation of New Mountain Finance AIV Holdings Corporation(6) |
|
3.1 |
(g) |
Amended and Restated Certificate of Incorporation of New Mountain Finance AIV Holdings Corporation(9) |
|
3.1 |
(h)(b) |
Certificate of Change of Registered Agent and/or Registered Office of New Mountain Finance Corporation(7) |
|
3.1 |
(i) |
Certificate of Change of Registered Agent and/or Registered Office of New Mountain Finance AIV Holdings Corporation(7) |
|
3.2 |
(a) |
Bylaws of New Mountain Finance Corporation(3) |
|
3.2 |
(b) |
Amended and Restated Bylaws of New Mountain Finance Corporation(4) |
|
3.3 |
|
Bylaws of New Mountain Finance AIV Holdings Corporation(6)Corporation(2) |
|
4.1 |
|
Form of Stock Certificate of New Mountain Finance Corporation(1) |
|
4.2 |
|
Form of Stock Certificate ofIndenture by and between New Mountain Finance AIV Holdings Corporation(2)Corporation, as Issuer, and U.S. Bank National Association, as Trustee, dated June 3, 2014(7) |
|
4.3 |
|
Form of Global Note 5.00% Convertible Senior Note Due 2019 (included as part of Exhibit 4.2)(7) |
|
10.1 |
|
Amended and Restated Limited Liability Company Agreement of New Mountain Finance Holdings, L.L.C.(5) |
|
10.2 |
|
First Joinder Agreement with Respect to the Amended and Restated Limited Liability Company Agreement of New Mountain Finance Holdings, L.L.C.(5) |
|
10.3 |
|
Second Joinder Agreement with Respect to the Amended and Restated Limited Liability Company Agreement of New Mountain Finance Holdings, L.L.C.(5) |
|
10.4 |
|
Amendment No. 1 to the Amended and Restated Limited Liability Company Agreement of New Mountain Finance Holdings, L.L.C.(8) |
Table of Contents
| | | | Exhibit
Number | | Description |
|---|
| 10.5 | | Letter Agreement relating to entry into Amended and Restated Loan and Security Agreement, dated as of December 18, 2014, by and among New Mountain Finance Corporation, as the collateral manager, New Mountain Finance Holdings, L.L.C., as Borrower and Collateral Administrator, each of the lenders thereto,borrower, Wells Fargo Securities, LLC, as Administrative Agentadministrative agent, and Wells Fargo, Bank, National Association, as Collateral Custodian.(1)lender and custodian(9) |
|
10.610.2 |
|
Form of Variable Funding Note of New Mountain Finance Holdings, L.L.C., as the Borrower(1) |
|
10.710.3 |
|
Form of Amended and Restated Account Control Agreement among New Mountain Finance Holdings, L.L.C., Wells Fargo Securities, LLC as the Administrative Agent and Wells Fargo Bank, National Association, as Securities Intermediary(1) |
|
10.810.4 |
|
First Amendment to Amended and Restated Loan and Security Agreement between New Mountain Finance Holdings, L.L.C., as Borrower, Wells Fargo Securities, LLC, as Administrative Agent and Wells Fargo Bank, N.A., as Lender(8) |
|
10.9 |
|
Second Amendment to Amended and Restated Loan and Security Agreement between New Mountain Finance Holdings, L.L.C., as Borrower, Wells Fargo Securities, LLC, as Administrative Agent and Wells Fargo Bank, N.A., as Lender(8) |
|
10.10 |
|
Third Amendment to Amended and Restated Loan and Security Agreement between New Mountain Finance Holdings, L.L.C., as Borrower, Wells Fargo Securities LLC, As Administrative Agent and Wells Fargo Bank, N.A., as Lender(8) |
|
10.11 |
|
Sixth Amendment to Amended and Restated Loan and Security Agreement between New Mountain Finance Holdings, L.L.C., as Borrower, Wells Fargo Securities LLC, As Administrative Agent and Wells Fargo Bank, N.A., as Lender(11) |
|
10.12 |
|
Seventh Amendment to Amended and Restated Loan and Security Agreement between New Mountain Finance Holdings, L.L.C., as Borrower, Wells Fargo Securities LLC, As Administrative Agent and Wells Fargo Bank, N.A., as Lender(12) |
|
10.13 |
|
Eighth Amendment to Amended and Restated Loan and Security Agreement between New Mountain Finance Holdings, L.L.C., as Borrower, Wells Fargo Securities LLC, As Administrative Agent and Wells Fargo Bank, N.A., as Lender(13) |
|
10.14 |
|
Ninth Amendment to Amended and Restated Loan and Security Agreement between New Mountain Finance Holdings, L.L.C., as Borrower, Wells Fargo Securities LLC, As Administrative Agent and Wells Fargo Bank, N.A., as Lender(15) |
|
10.15 |
|
Tenth Amendment to Amended and Restated Loan and Security Agreement between New Mountain Finance Holdings, L.L.C., as Borrower, Wells Fargo Securities LLC, As Administrative Agent and Wells Fargo Bank, N.A., as Lender(16) |
|
10.16 |
|
Eleventh Amendment to Amended and Restated Loan and Security Agreement between New Mountain Finance Holdings, L.L.C., as Borrower, Wells Fargo Securities LLC, As Administrative Agent and Wells Fargo Bank, N.A., as Lender(17) |
|
10.17 |
|
Loan and Security Agreement by and among New Mountain Guardian (Leveraged), L.L.C., as Collateral Administrator, New Mountain Guardian SPV Funding, L.L.C., as Borrower, eachForm of the lenders party thereto, Wells Fargo Securities, LLC, as Administrative Agent, and Wells Fargo Bank, N.A., as Collateral Custodian(1) |
Table of Contents
| | | | Exhibit
Number | | Description |
|---|
| 10.18 | | First Amendment to Loan and Security Agreement between New Mountain Guardian SPV Funding, L.L.C., as Borrower, Wells Fargo Securities, LLC, as Administrative Agent, and Wells Fargo Bank, N.A., as Lender(1) |
|
10.19 |
|
Second Amendment to Loan and Security Agreement between New Mountain Guardian SPV Funding, L.L.C., as Borrower, Wells Fargo Securities, LLC, as Administrative Agent, and Wells Fargo Bank, N.A., as Lender(1) |
|
10.20 |
|
Third Amendment to Loan and Security Agreement between New Mountain Guardian SPV Funding, L.L.C., as Borrower, Wells Fargo Securities, LLC, as Administrative Agent, and Wells Fargo Bank, N.A., as Lender(8) |
|
10.21 |
|
Fourth Amendment to Loan and Security Agreement between New Mountain Finance SPV Funding, L.L.C., as Borrower, Wells Fargo Securities, LLC, as Administrative Agent, and Wells Fargo Bank, N.A., as Lender(8) |
|
10.22 |
|
Fifth Amendment to Loan and Security Agreement between New Mountain SPV Funding, L.L.C., as Borrower, Wells Fargo Securities, LLC, as Administrative Agent, and Wells Fargo Bank, N.A., as Lender(8) |
|
10.23 |
|
Ninth Amendment to Loan and Security Agreement between New Mountain SPV Funding, L.L.C., as Borrower, Wells Fargo Securities, LLC, as Administrative Agent, and Wells Fargo Bank, N.A., as Lender(11) |
|
10.24 |
|
Tenth Amendment to Loan and Security Agreement between New Mountain SPV Funding, L.L.C., as Borrower, Wells Fargo Securities, LLC, as Administrative Agent, and Wells Fargo Bank, N.A., as Lender(12) |
|
10.25 |
|
Eleventh Amendment to Loan and Security Agreement between New Mountain SPV Funding, L.L.C., as Borrower, Wells Fargo Securities, LLC, as Administrative Agent, and Wells Fargo Bank, N.A., as Lender(13) |
|
10.26 |
|
Twelfth Amendment to Loan and Security Agreement between New Mountain SPV Funding, L.L.C., as Borrower, Wells Fargo Securities, LLC, as Administrative Agent, and Wells Fargo Bank, N.A., as Lender(14) |
|
10.27 |
|
Account ControlSenior Secured Revolving Credit Agreement, by and between New Mountain Guardian SPV Funding, L.L.C.,Finance Corporation, as Pledgor, Wells Fargo Securities, LLC,Borrower, and Goldman Sachs Bank USA, as Administrative Agent on behalf of the Secured Parties, and Wells Fargo Bank, N.A., as Securities Intermediary(1)Syndication Agent, dated June 4, 2014(8) |
|
10.28 |
|
Variable Funding Note of New Mountain Guardian SPV Funding, L.L.C., as the Borrower(1) |
|
10.2910.5 |
|
Form of AmendedGuarantee and Restated Investment AdvisorySecurity Agreement dated June 4, 2014, among New Mountain Finance Corporation, as Borrower, and Management Agreement(10)Goldman Sachs Bank USA, as Administrative Agent(8) |
|
10.3010.6 |
|
Amendment No. 1, dated December 31, 2014, to the Senior Secured Revolving Credit Agreement dated June 4, 2014, by and among New Mountain Finance Corporation, as Borrower, and Goldman Bank USA, as Administrative Agent and Syndication Agent(10) |
|
10.7 |
|
Investment Advisory and Management Agreement by and between New Mountain Finance Corporation and New Mountain Finance Advisers BDC, LLC(6) |
|
10.8 |
|
Form of Safekeeping Agreement among New Mountain Finance Holdings, L.L.C., Wells Fargo Securities, LLC as the Administrative Agent and Wells Fargo Bank, National Association, as Safekeeping Agent(1) |
|
10.3110.9 |
|
Custody Agreement by and between New Mountain Finance Corporation and U.S. Bank National Association(5) |
|
10.10 |
|
Amended and Restated Administration Agreement(8)Agreement(4) |
|
10.3210.11 |
|
Form of Trademark License Agreement(1) |
|
10.33 |
|
Amendment No. 1 to Trademark License Agreement(8) |
|
10.34 |
|
Form of Registration Rights Agreement(1) |
Table of Contents | | | | Exhibit
Number | | Description |
|---|
| | 10.3510.12 | | Form of Indemnification Agreement by and between New Mountain Finance Corporation and each director(1)Amendment No. 1 to Trademark License Agreement(4) |
|
10.3610.13 |
|
Form of Registration Rights Agreement(1) |
|
10.14 |
|
Form of Indemnification Agreement by and between New Mountain Finance Holdings, L.L.C.Corporation and each director(1) |
|
10.3710.15 |
|
Dividend Reinvestment Plan(4)Plan(2) |
|
11.1 |
|
Computation of Per Share Earnings for New Mountain Finance Corporation (included in the combined notes to the financial statements contained in this report) |
|
12.1 |
|
Computation of ratios for New Mountain Finance Holdings, L.L.C., New Mountain Finance Corporation and New Mountain Finance AIV Holdings Corporation (included in the combined notes to the financial statements contained in this report) |
|
14.1 |
|
Code of Ethics(1) |
|
21.1 |
|
Subsidiaries of Registrant and jurisdiction of incorporation/organizations:New Mountain Finance Corporation: |
|
|
|
Consolidated Subsidiaries of Operating Company: New Mountain Finance Holdings, L.L.C. (Delaware) |
|
|
|
New Mountain Finance SPV Funding, L.L.C.—Delaware (Delaware) |
|
|
|
NMF Ancora Holdings, Inc.—Delaware (Delaware) | | | | NMF YP Holdings, Inc. (Delaware) | | | | New Mountain Finance Servicing, L.L.C. (Delaware) | | | | New Mountain Finance SBIC G.P., L.L.C. (Delaware) | | | | New Mountain Finance SBIC, L.P. (Delaware) |
|
31.1 |
|
Certification of Chief Executive Officer pursuant to Rule 13a-14(a) of the Securities Exchange Act of 1934, as amended |
|
31.2 |
|
Certification of Chief Financial Officer pursuant to Rule 13a-14(a) of the Securities Exchange Act of 1934, as amended |
|
32.1 |
|
Certification of Chief Executive Officer pursuant to Section 906 of The Sarbanes-Oxley Act of 2002 (18 U.S.C. 1350) |
|
32.2 |
|
Certification of Chief Financial Officer pursuant to Section 906 of The Sarbanes-Oxley Act of 2002 (18 U.S.C. 1350) |
|
99.1 |
|
Supplemental Financial Information |
- (1)
- Previously filed in connection with New Mountain Finance Holdings, L.L.C.'s registration statement on Form N-2 Pre-Effective Amendment No. 3 (File Nos. 333-168280 and 333-172503) filed on May 9, 2011.
- (2)
- Previously filed in connection with New Mountain Finance
AIV Holdings Corporation's registration statement on Form 10 (File No. 000-54412), filed May 19, 2011.
(3)Previously filed in connection with New Mountain Finance Corporation's registration statement on Form N-2 (File No. 333-168280) filed on July 22, 2010.
(4)Previously filed in connection with New Mountain Finance Corporation's quarterly report on Form 10-Q filed on August 11, 2011.
(5)Previously filed in connection with New Mountain Finance Holdings, L.L.C.'s quarterly report on Form 10-Q filed on August 11, 2011.
(6)Previously filed in connection with New Mountain Finance AIV Holdings Corporation's quarterly report on Form 10-Q filed on August 23, 2011.
(7)(3)- Previously filed in connection with New Mountain Finance Corporation and New Mountain Finance AIV Holdings Corporation report on Form 8-K filed on August 25, 2011.
Table of Contents
(8)(4)- Previously filed in connection with New Mountain Finance Corporation's quarterly report on Form 10-Q filed on November 14, 2011.
(9)Previously filed in connection with New Mountain Finance AIV Holdings Corporation's report on Form 8-K filed on February 29, 2012.
(10)Previously filed as Annex A to New Mountain Finance Corporation's, New Mountain Finance Holdings, L.L.C.'s and New Mountain Finance AIV Holdings Corporation's joint definitive proxy statement on Schedule 14A filed on March 28, 2012.
(11)(5)- Previously filed in connection with New Mountain Finance Corporation's
quarterly reportregistration statement on Form 10-QN-2 Post-Effective Amendment No. 2 (File Nos. 333-189706 and 333-189707) filed on May 8, 2012.April 11, 2014.
(12)(6)- Previously filed in connection with New Mountain Finance Corporation's
quarterly report on Form 10-Q8-K filed on AugustMay 8, 2012.2014.
Table of Contents (13)(7)- Previously filed in connection with New Mountain Finance
Holdings, L.L.C.'sCorporation's report on Form 8-K filed on December 21, 2012.June 4, 2014.
(14)(8)- Previously filed in connection with New Mountain Finance
Holdings, L.L.C.'sCorporation's report on Form 8-K filed on March 13, 2013.June 10, 2014.
(15)(9)- Previously filed in connection with New Mountain Finance
Holdings, L.L.C.'sCorporation's report on Form 8-K filed on April 1, 2013.December 23, 2014.
(16)(10)- Previously filed in connection with New Mountain Finance
Holdings, L.L.C.'sCorporation's report on Form 8-K filed on June 26, 2013.
(17)Previously filed in connection with New Mountain Finance Holdings, L.L.C.'s report on Form 8-K filed on October 29, 2013.January 5, 2015.
(c) Financial Statement Schedules No financial statement schedules are filed herewith because (1) such schedules are not required or (2) the information has been presented in the aforementioned financial statements.
Table of Contents
SIGNATURES
Pursuant to the requirements of Section 13 or 15(d) of the Securities Exchange Act of 1934, the Registrants haveRegistrant has duly caused this report to be signed on its behalf by the undersigned, thereunto duly authorized on March 5, 2014.2, 2015. | | | | | | | | NEW MOUNTAIN FINANCE HOLDINGS, L.L.C.
NEW MOUNTAIN FINANCE CORPORATION
NEW MOUNTAIN FINANCE AIV HOLDINGS
CORPORATION |
|
|
By: |
|
/s/ ROBERT A. HAMWEE
Robert A. Hamwee
Chief Executive Officer
(Principal Executive Officer) |
Pursuant to the requirements of the Securities Exchange Act of 1934, this report has been signed below by the following persons on behalf of the RegistrantsRegistrant and in the capacities and on the dates indicated. | | | | | | |
| | SIGNATURE | | TITLE | | DATE |
|---|
|
|
|
|
|
|
| | By: | | /s/ ROBERT A. HAMWEE
Robert A. Hamwee | | Chief Executive Officer (Principal Executive Officer) and Director | | March 5, 20142, 2015 |
By: |
|
/s/ DAVID M. CORDOVA
David M. Cordova |
|
Chief Financial Officer and Treasurer |
|
March 5, 20142, 2015 |
By: |
|
/s/STEVEN B. KLINSKY
Steven B. Klinsky |
|
Chairman of the Board, Director |
|
March 5, 20142, 2015 |
By: |
|
/s/ ADAM B. WEINSTEIN
Adam B. Weinstein |
|
Executive Vice President, Chief Administrative Officer and Director |
|
March 5, 20142, 2015 |
By: |
|
/s/ ALFRED F. HURLEY, JR.
Alfred F. Hurley, Jr. |
|
Director |
|
March 5, 20142, 2015 |
By: |
|
/s/ DAVID MALPASS
David Malpass |
|
Director |
|
March 5, 20142, 2015 |
Table of Contents
| | | | | | |
| | SIGNATURE
| | TITLE
| | DATE
|
|---|
By: |
|
|
|
|
|
| By: | | /s/ DAVID OGENS
David Ogens |
|
Director |
|
March 5, 20142, 2015 |
By: |
|
/s/ KURT J. WOLFGRUBER
Kurt J. Wolfgruber |
|
Director |
|
March 5, 20142, 2015 |
|
|---|
