UNITED STATES
SECURITIES AND EXCHANGE COMMISSION
Washington, D.C. 20549
Form 10-K10‑K
| | |
ý☒
| | ANNUAL REPORT PURSUANT TO SECTION 13 OR 15(d) OF THE SECURITIES EXCHANGE ACT OF 1934 |
For the fiscal year ended June 30, 20142017 |
o☐
| | TRANSITION REPORT PURSUANT TO SECTION 13 OR 15(d) OF THE SECURITIES EXCHANGE ACT OF 1934 |
For the transition period from to a
|
Commission file number 001-33883001‑33883
K12 Inc.
(Exact name of registrant as specified in its charter)
| | |
Delaware
(State or other jurisdiction of
incorporation or organization) | | 95-477468895‑4774688
(I.R.S. Employer
Identification No.)
|
| |
2300 Corporate Park Drive
Herndon, VA 20171
(Address of principal executive offices) (Zip Code)Principal Executive Offices) |
|
(703) 483-7000483‑7000
(Registrant'sRegistrant’s telephone number, including area code) |
Securities registered pursuant to Section 12(b) of the Act:
| | |
Title of each class | | | | Name of each exchange on which registered |
|---|
Common Stock, $0.0001 par value | | New York Stock Exchange (NYSE) |
Securities registered pursuant to Section 12(g) of the Act:
None
(Title of Class)
Indicate by check mark if the registrant is a well-knownwell‑known seasoned issuer, as defined by Rule 405 of the Securities Act. Yes o☐ No ý☒
Indicate by check mark if the registrant is not required to file reports pursuant to Section 13 or Section 15(d) of the Act. Yes o☐ No ý☒
Indicate by check mark whether the registrant (1) has filed all reports required to be filed by Section 13 or 15(d) of the Securities Exchange Act of 1934 during the preceding 12 months (or for such shorter period that the registrant was required to file such reports), and (2) has been subject to such filing requirements for the past 90 days. Yes ý☒ No o☐
Indicate by check mark whether the registrant has submitted electronically and posted on its corporate Web site, if any, every Interactive Data File required to be submitted and posted pursuant to Rule 405 of Regulation S-TS‑T (§ 232.405 of this chapter) during the preceding 12 months (or for such shorter period that the registrant was required to submit and post such files). Yes ý☒ No o☐
Indicate by check mark if disclosure of delinquent filers pursuant to Item 405 of Regulation S-KS‑K is not contained herein, and will not be contained, to the best of registrant'sregistrant’s knowledge, in definitive proxy or information statements incorporated by reference in Part III of this Form 10-K10‑K or any amendment to this Form 10-K. ý10‑K. ☒
Indicate by check mark whether the registrant is a large accelerated filer, an accelerated filer, a non-accelerated filer, or a smaller reporting company, or an emerging growth company. See the definitions of "large“large accelerated filer," "accelerated filer"” “accelerated filer,” “smaller reporting company,” and "smaller reporting company"“emerging growth company” in Rule 12b-2 of the Exchange Act. (Check one):
| | | | | | |
Large accelerated filer o☐ | | Accelerated filer ý☒ |
| Non-accelerated filer o
☐ | (Do not check if a
smaller reporting company) | | Smaller reporting company o☐ Emerging growth company ☐ |
If an emerging growth company, indicate by check mark if the registrant has elected not to use the extended transition period for complying with any new or revised financial accounting standards provided pursuant to Section 13(a) of the Exchange Act. ☐
Indicate by check mark whether the registrant is a shell company (as defined in Rule 12b-212b‑2 of the Act). Yes o☐ No ý☒
The aggregate market value of the registrant'sregistrant’s voting and non-votingnon‑voting stock held by non-affiliatesnon‑affiliates of the registrant as of December 31, 20132016 was approximately $561,372,000.$483,320,529. Aggregate market value excludes an aggregate of approximately 15,017,00012,508,951 shares of common stock held by officers and directors and by each person known by the registrant to own 5% or more of the outstanding common stock on such date. Exclusion of shares held by any of these persons should not be construed to indicate that such person possesses the power, direct or indirect, to direct or cause the direction of the management or policies of the registrant, or that such person is controlled by or under common control with the registrant.
The number of shares of the registrant'sregistrant’s common stock outstanding as of August 11, 2014July 31, 2017 was 38,411,114.40,771,548.
DOCUMENTS INCORPORATED BY REFERENCE:
Portions of the registrant'sregistrant’s definitive proxy statement for its 20142017 annual meeting of stockholders to be filed pursuant to Regulation 14A with the Securities and Exchange Commission not later than 120 days after the registrant'sregistrant’s fiscal year ended June 30, 2014,2017, are incorporated by reference into Part III of this Form 10-K.10‑K.
TABLE OF CONTENTS
TABLE OF CONTENTS
PART I | | | | | | |
ITEM 1. PART I
| Business | | | 4 |
ITEM 1.1A. | | Risk Factors Business
| | | 5 | 28 |
ITEM 1A.1B. | |
Risk Factors
| | | 35 | |
ITEM 1B.
| | Unresolved Staff Comments | | | 53 | 44 |
ITEM 2.2. | | Properties Properties
| | | 53 | 45 |
ITEM 3. | |
Legal Proceedings | | | 53 | 45 |
ITEM 4 | |
Mine Safety Disclosures | | | 53 | 45 |
PART II | | | | |
ITEM 5.5. | |
Market for Registrant'sRegistrant’s Common Equity, Related Stockholder Matters and Issuer Purchases of Equity Securities | | | 54 | 46 |
ITEM 6.6. | |
Selected Financial Data | | | 57 | 48 |
ITEM 7.7. | |
Management'sManagement’s Discussion and Analysis of Financial Condition and Results of Operations
| | | 60 | 52 |
ITEM 7A.7A. | |
Quantitative and Qualitative Disclosures About Market Risk | | | 82 | 72 |
ITEM 8.8. | |
Financial Statements and Supplementary Data | | | 83 | 73 |
ITEM 9. | |
Changes In and Disagreements with Accountants on Accounting and Financial Disclosure | | | 121 | 115 |
ITEM 9A.9A. | |
Controls and Procedures | | | 121 | 115 |
ITEM 9B. | |
Other Information | | | 124 | 118 |
PART III | | | | |
ITEM 10.10. | |
Directors, Executive Officers and Corporate Governance | | | 124 | 118 |
ITEM 11. | |
Executive Compensation | | | 124 | 118 |
ITEM 12. | |
Security Ownership of Certain Beneficial Owners, Management and Related Stockholder Matters | | | 124 | 118 |
ITEM 13. | |
Certain Relationships, Related Transactions and Director Independence | | | 124 | 118 |
ITEM 14. | |
Principal Accounting Fees and Services | | | 124 | 118 |
PART IV | | | | |
ITEM 15. | |
Exhibits and Financial Statement Schedules | | | 124 | |
INDEX TO EXHIBITS
| | | 127 | 119 |
EX-4.6ITEM 16.
| | K12 Inc. 2007 Equity Incentive Award PlanForm 10-K Summary
| | | | |
EX-21.1
| | Subsidiaries of Registrant
| | | | |
EX-23.1
| | Consent of Independent Registered Public Accounting Firm
| | | | |
EX-31.1
| | Certification of Principal Executive Officer
| | | | |
EX-31.2
| | Certification of Principal Financial Officer
| | | | |
EX-32.1
| | Certification of Principal Executive Officer
| | | | |
EX-32.2
| | Certification of Principal Financial Officer
| | | | |
101.INS
| | XBRL Instance Document
| | | | |
101. SCH
| | XBRL Taxonomy Extension Schema
| | | | |
101. CAL
| | XBRL Taxonomy Extension Calculation
| | | | |
101. LAB
| | XBRL Taxonomy Extension Labels
| | | | |
101. PRE
| | XBRL Taxonomy Extension Presentation
| | | | |
101. DEF
| | XBRL Taxonomy Extension Definition
| | | | 119 |
CERTAIN DEFINITIONS
Unless the context requires otherwise, all references in this Annual Report on Form 10-K10‑K (the "Annual Report"“Annual Report”) to "K12," "K12," "Company," "we," "our"“K12,” “Company,” “we,” “our” and "us"“us” refer to K12 Inc. and its consolidated subsidiaries.
SPECIAL NOTE ON FORWARD-LOOKINGFORWARD‑LOOKING STATEMENTS
This Annual Report contains forward-lookingforward‑looking statements within the meaning of the Private Securities Litigation Reform Act of 1995 that involve substantial risks and uncertainties. All statements other than statements of historical facts contained in this Annual Report on Form 10-K10‑K are forward-lookingforward‑looking statements. We have tried, whenever possible, to identify these forward-lookingforward‑looking statements using words such as "anticipates," "believes," "estimates," "continues," "likely," "may," "opportunity," "potential," "projects," "will," "expects," "plans," "intends"“anticipates,” “believes,” “estimates,” “continues,” “likely,” “may,” “opportunity,” “potential,” “projects,” “will,” “expects,” “plans,” “intends” and similar expressions to identify forward-lookingforward‑looking statements, whether in the negative or the affirmative. These statements reflect our current beliefs and are based upon information currently available to us. Accordingly, such forward-lookingforward‑looking statements involve known and unknown risks, uncertainties and other factors which could cause our actual results, performance or achievements to differ materially from those expressed in, or implied by, such statements. These risks, uncertainties, factors and contingencies include, but are not limited to:
• | · | | reduction of per pupil funding amounts at the schools we serve; |
| · | | inability to achieve a sufficient level of new enrollments to sustain our business model; |
| · | | failure to enter into new managed school contracts or renew existing contracts, in part or in their entirety; |
| · | | failure of the schools we serve or us to comply with federal, state and local regulations, resulting in a loss of funding, an obligation to repay funds previously received, or contractual remedies; |
| · | | governmental investigations that could result in fines, penalties, settlements, or injunctive relief; |
| · | | declines or variations in academic performance outcomes of the students and schools we serve as curriculum and testing standards evolve; |
| · | | harm to our reputation resulting from poor performance or misconduct by operators or us in any school in our industry and/or in any school in which we operate; |
| · | | legal and regulatory challenges from opponents of virtual public education or for‑profit education companies; |
| · | | discrepancies in interpretation of legislation by regulatory agencies that may lead to payment or funding disputes; |
| · | | termination of our contracts with schools due to a loss of authorizing charter; |
| · | | entry of new competitors with superior technologies and lower prices; |
| · | | unsuccessful integration of mergers, acquisitions and joint ventures; |
| · | | failure to further develop, maintain and enhance our technology, products, services and brands; |
| · | | inadequate recruiting, training and retention of effective teachers and employees; |
| · | | infringement of our intellectual property; and |
| · | | disruptions to our Internet‑based learning and delivery systems resulting from cyber‑attacks. |
Forward-looking
Forward‑looking statements reflect our management'smanagement’s expectations or predictions of future conditions, events or results based on various assumptions and management'smanagement’s estimates of trends and economic factors in the markets in which we are active, as well as our business plans. They are not guarantees of future performance. By their nature, forward-lookingforward‑looking statements are subject to risks and uncertainties. Our actual results and financial conditionscondition may differ, possibly materially, from the
Table of Contents
anticipated results and financial conditionscondition indicated in these forward-lookingforward‑looking statements. There are a number of factors that could cause actual conditions, events or results to differ materially from those described in the forward-lookingforward‑looking statements contained in this Annual Report. A discussion of factors that could cause actual conditions, events or results to differ materially from those expressed in any forward-lookingforward‑looking statements appears in "Part“Part 1—Item 1A—Risk Factors."”
Readers are cautioned not to place undue reliance on forward-lookingforward‑looking statements in this Annual Report or that we make from time to time, and to consider carefully the factors discussed in "Part“Part 1—Item 1A—Risk Factors"Factors” of this Annual Report in evaluating these forward-lookingforward‑looking statements. These forward-lookingforward‑looking statements are representative only as of the date they are made, and we undertake no obligation to update any forward-lookingforward‑looking statement as a result of new information, future events or otherwise.
PART I
Table of Contents
PART I
ITEM 1. BUSINESS
Company Overview
We are a technology-basedtechnology‑based education company. Wecompany and offer proprietaryonline curriculum, software systems and educational services designed to facilitate individualized learning for students primarily in kindergarten through 12th grade, or K-12. Our mission is to maximize a child's potential by providing access to an engaging and effective education, regardless of geographic location or socio-economic background.K‑12. We provide a continuum of technology-basedtechnology‑based educational products and solutions to public school districts, public schools, virtual charter schools, private schools and familiesconsumers as we strive to transform a student'sstudent’s learning experience into one that delivers individualized education on a highly scalable basis. In 2013,education. We are accredited by AdvancEd, a non-profit nationwidenon‑profit international accreditation agency for schools, districts, education service agencies, postsecondary institutions, and school systems, renewed its five year quality assurance accreditation of the Company.corporations.
As an innovator in K-12K‑12 online education, we believe we have attained distinctive core competencies that allow us to meet the varied needs of our school customers and students. These core competencies include our ability to create engaging curriculum, train teachers to bein effective in online instruction, provide turn-keyturn‑key management services to online schools, customize online learning programs for school districts, develop innovative new offerings, and assist legislators and policy makers in understanding the many benefitsdynamics of onlinevirtual and blended learning tothat can complement and transform traditional schools. These strengthsfactors enable us to provide a unique set of products and services primarily to three lines of business that share many common attributes, including curriculum, learning systems, management expertise, logistical systems and marketing. These businesseslines of business are: Managed Public Schools (turn-key management services sold toSchool Programs, which is comprised of virtual and blended public schools)schools (as more fully described below), Institutional Salesbusiness (educational products and services sold to school districts, public schools and other educational institutions that we do not manage), and International and Private Pay Schools and Other (private schools, including international, for which we charge student tuition and make direct consumer sales).
| | | | | |
|
|---|
Managed Public Schools | | School Programs | | Institutional Sales | | International and | | Private Pay Schools and Other |
|---|
•
Virtual public schools | | Non‑managed Public School Programs | • K12 curriculum
| | •
Managed private schools —K12 International Academy |
•
Blended public schools | | Institutional software and services | • FuelEd Online Courses
| | —K12 International Academy —George Washington University
|
—Hybrid schools
| | • FuelEd Anywhere Learning System
| | —George Washington University
| Online HSHigh School |
—Flex schools
| | • Middlebury Interactive Languages
| | —The
| —The Keystone School |
—Passport schools
| | • Pre-kindergarten
| | • | Independent course sales (Consumer)
| |
| | | | | |
We continue to make significant capital investments intended to improve student academic outcomes, including the: (i) ongoing development and enhancement of our current and next generation curriculum and software; (ii) implementation of a new learning management platform for our middle and high school students; (iii) strengthening the corporate and school infrastructure to improve scalability, increase data security, and protect student privacy; (iv) procurement and delivery of student computers; and (v) conversion of interactive instructional products to enable delivery through tablets and mobile devices.
Managed Public SchoolsSchool Programs
Our Managed Public School Programs business includes both virtual and blended public schools where a district or independent charter board contracts with K12 for a full‑time program of educational products and services. The Managed Public School Programs are programs in which K12 provides substantially all of the administrative management (e.g., budget proposals, financial reporting and staff recruitment), information technology, academic support services, curriculum, learning systems and instructional services. In contrast, Non‑managed Public School Programs do not provide primary administrative functions. In fiscal year 2017, our Managed Public School Programs accounted for approximately 83% of our revenue.
Virtual Public Schools. In full-timefull‑time virtual managed public schools, students receive online lessons over the Internet, utilize offline learning materials that we supply, and receive instruction from state certified teachers. In addition to providing our course catalog,courses, course materials and, in certain cases, student computers, we also offer these schools a variety of administrative management, technology and academic support services. The majority of our revenue is derived from long-termlong‑term service agreements with the governing authorities of thethese virtual public schools that we manage.schools.
Blended Public Schools. In addition to providing services to full-time virtualBlended public schools we also sell our products and services to blended public schools that combine online learning and face-to-faceface‑to‑face instruction in many different arrangements with varying amounts of time spent in a physical learning center.
For both virtual and blended managed public schools,Managed Public School Programs, the governing authority withthat exercises ultimate control over the schools negotiates contractual terms with us for all aspects of the management of the schools, including the creation and implementation of the academic plan, monitoring academic achievement, teacher recruitment, supervision, and training, student enrollment and marketing, compensation recommendations for school personnel, implementation of student support services, financial management,and regulatory compliance support, procurement of curriculum, computers and other required services and equipment. The scope of
Table of Contents
services we provide variesmay also vary in accordance with applicable state regulations and each governing authority'sauthority’s policies. Funding is provided primarily by state governments. For the 2013-142016-17 school year, we provided turn-keythese turn key management services to managed public schoolsManaged Public Schools Programs in 33 states and the District of Columbia.Columbia, which consisted of 77 Managed Public School Programs. In earlier years, we grew primarily by entering into fully-managed service agreements with schools that offered statewide programs in new states and reported that growth by citing the number of states having these programs and by enrollments. Our Managed Public School Programs now involve the opening of multiple schools within the same state, as well as closures that can occur with contract terminations, non-renewals or charter revocations. Accordingly, we believe a metric based on the number of schools served by our Managed Public School Programs rather than by the number of states will more accurately reflect the status of this business going forward.
•Institutional Sales.
We work closely as partnersa partner with a growing number of school districts and individual schools, enabling them to offer their students an array of online education solutions, including full-timefull‑time virtual and blended programs, semester courses and supplemental solutions.educational products. Institutional business includes Non‑managed Public School Programs and Institutional software and services where K12 provides curriculum and technology, and the school has an option to contract for instruction or other software and services we provide; however, the Institutional business offerings do not include primary administrative oversight to these programs. In addition to curriculum, systems and programs, we also provide teacher training, teaching services and other support services. These institutionsOur Institutional business customers include public schools, school districts, private schools, charter schools, and early childhood learning centers.centers and corporate partners. Additionally, we operate Middlebury Interactive Languages LLC (“MIL”), which was formerly a joint venture with Middlebury College known as Middlebury Interactive Languages LLC ("MIL"), to develop and market online foreign language courses.courses (see Notes to Consolidated Financial Statements, Note 10). On December 27, 2016, we consummated the acquisition of the remaining 40% noncontrolling interest for $9.1 million in cash. As part of that transaction, we retained the right to use the MIL name in its products through April 2028. In addition, we secured the right to use the MIL name in marketing materials through December 2019. For the 2013-142016-17 school year, we served school districts or individual schools in all 50 states and the District of Columbia, including those where the regulatory environment restricts or prohibits statewide online programs.
•International and Private Pay Schools. and Other
We operate three online private schools: The K12K12 International Academy, the George Washington University Online High School and the Keystone School. We also have entered into agreements which enable us to distribute our
products and services to students from more than 100countries. We pursue international opportunities where we believe there is significant demand for a quality online education. Our principal customers are expatriate families and foreignU.S. students, who wish to study in English, as well as U.S. studentsincluding those who reside in states where the online public school option is not available.available, as well as expatriate families with students who seek to continue their studies in English and foreign students who may seek admission into a U.S. college or university. Additionally, our curriculum is sold to end user customers who desire to educate their children outside of the traditional school system or to supplement their child'schild’s traditional education.
We continue to make significant capital investments in our infrastructure, including: (i) the ongoing development and enhancement of our content and learning management systems; (ii) corporate and school infrastructure to improve scalability, increase security, and attain cost savings; and (iii) conversion of interactive instructional products to enable delivery through tablets and mobile devices.
Our History
We were founded in 2000 to utilize advances in technology to provide children with access to a high-qualityhigh‑quality public school education regardless of their geographic location or socioeconomic background. Given the geographic flexibility of technology-basedtechnology‑based education, we believed that the pursuit of this missionwe could help address the growing concerns regarding the regionalized disparity in the quality of public school education, both in the United States and abroad. The convergence of these factors and rapid advances in Internet networks created the opportunity to make a significant impact by deploying online learning software and systems on a flexible, online platform.
In September 2001, we introduced our kindergarten through 2nd grade offering. We launched our initial online learning system in virtual public schoolsoffering in Pennsylvania and Colorado, serving approximately 900 students in the two states combined. We subsequently added new grades and new schools in additional states. We have also launched blended public schools that combine face-to-faceface‑to‑face time in the classroom with online instruction and opened an online private school to reach students worldwide. In school year 2013-14, we managed public2016-17, our customers for Managed Public School Programs consisted of 77 schools in 33 states andthroughout the District of Columbia, specifically: Alaska, Arizona, Arkansas, California, Colorado, Delaware, Florida, Georgia, Hawaii, Idaho, Illinois, Indiana, Iowa, Kansas, Louisiana, Massachusetts, Michigan, Minnesota, Nevada, New Jersey (Flex School only), New Mexico, Ohio, Oklahoma, Oregon, Pennsylvania, South Carolina, Tennessee, Texas, Utah, Virginia,
Table of Contents
Washington, Wisconsin and Wyoming.United States. We also serve schools in all 50 states through our Institutional Sales business.
Our Market
The U.S. market for K-12K‑12 education is large and online learning is gaining greater acceptance. For example:
•According to the National Center for Education Statistics ("NCES"), a division of the U.S. Department of Education, approximately 48 million students were expected to attend K-12 public schools in the fall of 2013. Nearly five million students were expected to enroll in private schools in the fall of 2012. In addition, according to a report by National Home Education Research Institute, approximately two million students were home schooled in 2011. Many of these students took an online course and a small percentage enrolled in a full-time online program. As of 2013, six states mandated the completion of an online course prior to high school graduation (Keeping Pace Report, 2013). Multi-district fully online schools served an estimated 310,000 students in 30 states during the 2012-13 school year.
•According to the NCES, the public school system alone encompassed more than 98,800 schools and approximately 13,600 districts during the 2011-12 school year.
•The NCES estimates that total spending in the K-12 market was projected to be $563 billion for the 2012-13 school year, and that public school spending will increase by 24 percent, to $699 billion, by 2022-23.
•According to the International Association for K-12 Online Learning ("iNACOL"), in 2013, all 50 states had established a significant form of online learning initiative. In addition, according to iNACOL, 1.82 million K-12 students participated in a formal online learning program.
| · | | According to the most recently available data from the 2015 Keeping Pace with K‑12 Digital Learning report (“Keeping Pace”), over 50 million students attend K‑12 public schools, and nearly five million students are enrolled in private schools. Five states mandate the completion of an online course prior to high school graduation. Full‑time virtual charter schools served an estimated 275,000 students who took approximately 3.3 million semester equivalent courses online. Fourteen states have enacted online course choice laws. K12 is a sponsor of Keeping Pace along with 14 other educational organizations, including iNACOL. |
| · | | The 2015 Keeping Pace report further states that 47% of students in grades 9‑12 pursue online learning to access courses not offered at the school, and 43% choose to take courses online to be able to work at their own pace. In addition, 2.2 million K‑12 students participated in a formal online learning program. |
| · | | Additionally, according to a 2016 report by the National Home Education Research Institute, there are approximately 2.3 million home‑educated students in the United States, which has grown at an estimated 2% to 8% per annum over the past few years. Many of these students took an online course and a small percentage enrolled in a full‑time online program. |
Many parents and educators are seeking alternatives to traditional classroom-basedclassroom‑based education for a variety of reasons. Demand for these alternatives is evident in the expanding number of choices available to parents and students. For example, public charter schools emerged in 1988 to provide an alternative to traditional public schools and, according to the Center for Education Reform, have grown by 245% since 2001. As
| · | | According to the National Alliance for Public Charter Schools, enrollment at public charter schools has nearly tripled over the past 10 years, and there were approximately 6,900 public charter schools operating nationwide during the 2016-2017 school year, with an estimated enrollment of approximately 3.1 million students. |
| · | | The 2015 Keeping Pace report indicates that the acceptance of online learning initiatives, including not only virtual and blended public schools, but also online courses, credit recovery, remediation, testing and Internet‑based professional development, has continued to grow. Districts are also rapidly adopting online learning to expand course offerings, provide schedule flexibility, increase graduation rates and lower the cost of delivering education. |
Table of July 2014, more than 1 million students are on waiting lists to attend a charter school, and there are over 6,000 public charter schools operating in 42 states and the District of Columbia with an estimated enrollment of over 2.1 million students. Similarly, acceptance of online learning initiatives, including not only virtual and blended public schools, but also online courses, credit recovery, remediation, testing and Internet-based professional development, has continued to grow. Districts are also rapidly adopting online learning to expand course offerings, provide schedule flexibility, increase graduation rates and lower the cost to deliver education.Contents
Demand for Education Alternatives: The Market Opportunity and the K12 Solutions
As evidenced by the rapid evolution of education technology and varying educational options being utilized by K-12offered to K‑12 students, no single educationallearning model has been found that works equally well for all students.every student. Children today utilize technology in all aspects of their lives, and we expect themthis reality to extend their use of technology to their educational needs and choices.education. Our business is modeledhas been built on the premise that every student, has the rightregardless of geographic location or socioeconomic background, is entitled to ana high quality education that is individualized and available anywhere at any time.adaptable based on the student’s unique needs. We also believe all students can benefit from more rigorous and engaging technology-enriched educational content.
We anticipate that full-time virtualfull‑time online public schools will meet the needs of a small percentage of the overall K-12K‑12 student population, but do represent andthat segment will continue tostill represent a large and growing opportunity for us in absolute terms. Across our educational programs, familiesstudents come from a broad range of social, economic and academic backgrounds. Theybackgrounds, and parents share the desire for individualized instruction to maximize their children'schildren’s potential. Examples of students for whom this solution fitsmay fit include, but are not limited to, families with: (i) students seeking to learn atin a way that better accommodates their own pace;individual needs; (ii) students with safety, social and health
Table of Contents
concerns about their local school;school, including students who are being bullied or are subjected to discrimination; (iii) students with disabilities who are underserved inseeking alternatives to traditional classrooms; (iv) students for whom the local public school is not meeting their needs; (v) students who seek moreor need greater flexibility than traditional brick and mortar schools can provide,other alternatives, such as student-athletesstudent‑athletes and performers who are not able to attend regularly-scheduledregularly‑scheduled classes; (vi) college-boundcollege‑bound students who want to bolster their college readiness and application appeal by taking additional Advanced Placement (“AP”), honors and/or elective courses; (vii) students seeking career and technical skills; (viii) high school dropouts;dropouts who have decided to re‑enroll in school to earn a diploma; and (ix) students of military families who desire high quality, consistent education across moves.as they relocate to new locations. Our individualized learning approach allows students to optimize their educational experience and, therefore, their chances of achieving their goals. The public online and blended schools we manage, which generated
For the majority of our revenue (approximately 88% in fiscal 2014), serve this demand.
Mostforeseeable future, most students in the United States will continue to be educated in traditional school buildings and classrooms. However, we also believe that the academic benefits for certain student segments combined withwill benefit from the significant savingsavailability of a choice for taxpayers, will continue to drivean online public education (including blended learning models), and that states and districts will seek to incorporate online and blended solutions into their school-basedschool‑based programs. One of the challenges traditional schools continue to face is adoption of technologyOur Managed Public School Programs offer a full service, integrated program, and innovative new learning devices. We offer a complete solution for districts and schools that desire a turn‑key option. For public school customers who need less than a turn-key option and also offer, infull service offering, our Institutional Sales business provides online curriculum and services on a solutions-oriented, individualized basis for those customers who need less than a full-service offering.solutions‑oriented, customized basis. We believe this range of options createsthese choices create the opportunity for us to serve the majority of students who will learn within school buildings. Therefore, we continue to invest significant resources, organically and through licensing or acquisitions, in developing product offerings that afford us the flexibility to serve different types of customers with varying value propositions and price points that are adaptable to an institution'sinstitution’s capabilities and needs. Moreover, we have and will continue to pursue selected markets outside the United States where we believe our curriculaproducts and services can address local foreign market needs.
We believe that our core competencies, coupled with the substantial investments we have made in our infrastructure and our prior strategic acquisitions and partnerships, position us to offer educational resources for all types of students. RegardlessOur products and services offer students expanded educational opportunities regardless of whether a student chooses to remain in a classroom or seeks an alternative educational setting, attends public or private school, lives in the United States or abroad, wants to take online classes on a full or part-timepart‑time basis, requires supplemental educational products, seeks career or technical training or is an advanced or remedial student, our products and services offer students expanded educational opportunities.student.
Our Business Lines
Managed Public SchoolsSchool Programs
As previously discussed, in our Managed Public School Programs we typically provide substantially all of the administrative management, technology and academic support services in addition to curriculum, learning systems and instructional services under the terms of a negotiated service agreement. We provide our Managed Public School Programs to both virtual and blended public school customers.
We believe that the acceptance of online education in grades K‑12 continues to grow, and anticipate that this will translate into increased demand for our Managed Public School Programs. The independent governing authorities of the virtual charter schools that contract with us are also taking different approaches to virtual education depending upon their
own charter school goals. This is reflected in the nature of the agreements we have with those boards and the level of management services that meet their needs. For example, due to our experience and expertise in the integration of all the components necessary to operate a Managed Public School Program, such turnkey arrangements are attractive to many charter school boards. Conversely, a school board may decide at renewal to transition to a self‑managed model. While these schools continue to purchase our curriculum and some of our management and technology services, they assume more of the operational and academic accountability obligations. In some Managed Public School Programs, full responsibility for academic performance resides with the governing authority or school board which employs the Head of School.
Virtual Public Schools
The majority of our revenue is derived from long-termlong‑term service agreements with the governing authorities of the virtual public schools we serve. In addition to providing a comprehensive course catalog, related books and physical materials, a learning management system for online learning, and, in certain cases, student computers, we also offer these schools a variety of administrative management, technology and academic support services. In full-timeFull‑time virtual managed public schools,school students receiveaccess online lessons over the Internet and utilize offline learning materials we provide. Students receive assignments, complete lessons, take assessments, and obtain instruction fromare instructed by certified teachers with whom they interact online,via email, telephonically, in synchronous virtual classroom environments, and sometimes face-to-face. Forface‑to‑face (in a non‑managed virtual public school, the level of instructional and/or academic support management, technology services, and academic support services varies or may not be provided depending on the needs of the school). In either case, for parents who believe their child is not thriving in their current public school or for students and families who require time or location flexibility in their schooling, virtual and blended public schools can provide a compelling choice.
Students Virtual public school students are also provided the opportunity to participate in a wide variety of school activities, including outingsfield trips, service learning opportunities, honor societies, and clubs. In addition to school-levelschool‑level activities, we sponsor a wide variety of extracurricular activities on a national basis, such as clubs, contests and college and career planning sessions.
Table of Contents
Virtual public schools managed by K12 managed schools (often named virtual academies) serve K-8 or K-12K‑12 students, principally utilize the K12K12 core curriculum and attract both mainstream and academically at-risk students. In addition to theseother types of learners. These virtual academies, we managepublic schools operate under different brands including Virtual Academies (our original full-time Managed Public School Program), Insight schools which serve middle school and high school students, typically utilize our Fuel Education ("FuelEd") curriculum, and(which tend to focus on academically at-risk students. We also serve iQ Academies, which are forparticular student segments, such as only middle school and high school grade levels, at-risk students primarily utilize the FuelEd curriculum, and generallycareer readiness programs), and iQ Academies (which are typically only partially partially‑managed by K12. Typically,us, with responsibility for the academic program and regulatory compliance ofresting with the iQ Academies rests with their host school or school district.district). We also manage career and technical education‑focused online high schools designed to give students a head start on their career goals by earning college credits and workplace experiences.
In addition to our full-timefull‑time virtual public schools, we also manageoffer a variety of management and support services and sell our products and services to blended public schools, which are public schools that combine online and face-to-faceface‑to‑face instruction for students in a variety of ways with varying amounts of time spent by students in a physical learning center. For the 2013-14 school year, we managed blended public schools in California, Illinois, Indiana and New Jersey.
In contrast to a typical brick and mortar public school, blended public schools can provide a greater selection of available courses, increased opportunities for self-paced,self‑paced, individualized instruction and greater scheduling flexibility. We manage three types of blended public schools—hybrid schools, Flex schools and Passport schools. TheseOur blended schools bring students and teachers physically together more often than a purely online program.
In the hybridsome blended schools we manage, such as the Chicago Virtual Charter School, students attend a learning center on a part-timepart‑time basis, where they receive face-to-faceface‑to‑face instruction, in addition to their online virtual curriculum and instruction.
Institutional
Our Flex school model is a unique blended school model, where middleInstitutional business consists of: (i) Non‑managed Public School Programs; and high school students attend a learning center five full days a week(ii) Institutional software and access and engage in their individualized online lessons in an open study lab while receiving face-to-face direct instruction in areas of particular need from onsite, state certified teachers. Flex schools leverage many of the capabilities of a virtual school with the advantages of a physical school environment. One example of this model is the Silicon Valley Flex School in California.
Another type of blended school option is the Passport school which utilizes a similar instructional model as a Flex school but is especially designed for academically at-risk students, particularly those who have previously dropped out of high school, and therefore includes more counseling and support services. Due to the reality that many Passport students have work and/or child care responsibilities, most students spend half of each day on-site, working on-line and face to face with teachers, and complete the remainder of their daily work away from the learning center. The Hill House Passport Academy, opening in the fall of 2014 in Pennsylvania, is an example of a Passport school.
Institutional Sales
Public schools and school districts are increasingly adopting these online solutions to cost-effectivelylaunch new learning models, cost‑effectively expand course offerings, provide schedule flexibility, improve student engagement, increase graduation rates, replace textbooks and retain students. State education funds traditionally allocated for textbook and print materials are now also being authorized for the purchase of digital content, including online courses, and in some cases mandated for access to online courses. To address these growing needs, we provideour Institutional business provides curriculum and
technology solutions, packaged in a portfolio of flexible learning and delivery models mapped to specific student and/or district needs. This portfolio provides a continuum of delivery models, from full and part-time virtual,full‑time Non‑managed Public School Programs to blended learningindividual course sales and other options that can be used in traditional classrooms to differentiate instruction. Our catalog contains solutions to address specific student needs, including Advanced Placement, honors, world languages, remediation, credit recovery, alternative education, career and technology electives and college readiness. In connection with these solutions, we also offer highly qualified state-certified teachers, professional development and other support services as needed by our customers.
Table of Contents
The goal of the Institutional Sales business is to partner primarily with U.S.‑based public schools and public school districts to provide more options and better tools to empower teachers to improve student achievement through personalized learning. Our FuelEd suite of offerings has grown and includes K12K12 curriculum, FuelEd Online Courses, FuelEd Anywhere Learning Systems, ("ALS") and Middlebury Interactive Languages, LTS Education Systems, LearnBop and Career Pathways curriculum. FuelEd'sOur extensive catalog of online curricula includes full-time schoolcan address specific student needs, including AP, honors programs, individual online courses,world languages, remediation, credit recovery, courses, world languagesalternative education, career and prescriptive learningtechnology electives and remediation curriculum andcollege readiness. In connection with these solutions, we also offers a full range of professional development options includingoffer state‑certified teachers, trainedtraining for school personnel in online instruction methods, and professional development and other support materials,services as needed by our customers.
In addition to our extensive curricula catalog, our Institutional business offers the PEAK platform and training for school personnel.
Beyond an array of online learning solutions, we offerPEAK Library. PEAK is a platform called Personalize, Engage and Achieve ("PEAK"),proprietary software system designed to centrally manage in a single‑user interface, multiple, independent online solutions across a school or district through one application. PEAK enablessolutions. Schools can enroll students, assign courses and teachers, and administratorsthen manage the learning experience with easy to personalize online learning solutions for their students by leveraging all curricula across all supported solutions.use reporting and analytics on student progress. The PEAK Library currently supports the majority of the K12K12 curriculum portfolio and teachers can build and modify assignments, assessments and courses to augment classroom instruction and develop lessons for sharing across the school district. PEAK also has the capability to support other third-partythird‑party solutions, open educational resources and district and teacher-createdteacher‑created content. For students, teachers and administrators, PEAK eliminates the complexity of managing multiple accounts and roles and will provideprovides a consistent online environment for full-time,full‑time, credit recovery, world languages classes or blended classroom programs. We believe increasing ease-of-useease‑of‑use for administrators and teachers is a critical factor in improving student support and therefore, improving student outcomes. PEAK addresses this need by serving all of the online instructional needs of a school or district in an integrated, data-drivendata‑driven manner.
We have continued to expand our direct and indirect sales network and have provided nearly all sales representatives with the ability to sell all solutions in the K12 portfolio, including the original K12 solutions as well as the FuelEd and MIL foreign language product lines. We have also expanded our customer services team to support our growing relationships and employ teachers across the United States to serve students and train school administrators and teachers.
For the 2013-142016-17 school year, we served school districts or individual schools in all 50 states and the District of Columbia inthrough our Institutional Business, including those where the legal framework restricts or prohibits state-wide online public school programs.business. Based upon school districts'districts’ and academic administrators'administrators’ growing acceptance of online learning and desire for cost efficient, integrated and flexible educational solutions, we believe that the direct-to-districtdirect‑to‑district distribution channel offers further significant growth potential.
Private Pay Schools and Other
International and Private Pay Schools
We operate a variety ofthree different private schools that meet the needs of students ranging from simple correspondence courses to challenging college preparatory programs. Beyond our business in the United States, we are pursuing international opportunities where we believe there is significant demand for a quality online education. Our international customers are typically expatriate families who wish to study in English and foreign students who desire a U.S. high school diploma and wish to study in English.diploma. For the 2013-142016-17 school year, we served students in more than 100 countries. In addition, we have entered into agreements whichthat enable us to distribute our products and services to our international school partners who use our courses to provide broad elective offerings and dual diploma programs.
We operate the K12K12 International Academy, an online private school that serves students in both the United States and overseas. Through the K12K12 International Academy, students may study in ana full-time academic program that ultimately leads to an accredited U.S. high school diploma. Students may also enroll in individual courses on a part-timepart‑time basis. The K12K12 International Academy utilizes the same curriculum, systems and teaching practices that we provide to the virtual public schools we manage in the United States. In addition, this school provides a unique international community including online clubs and events that enrich the student experience by allowing students to interact with peers in other countries. The school is accredited by AdvancED, and is recognized by the Commonwealth of Virginia as a degree granting institution of secondary learning.
Table of Contents
The Keystone School ("Keystone"(“Keystone”) is a private school that has been an innovator in homeproviding home‑based education and distance learning for over 35 years. Students attend Keystone for middle and high school on a full or part- part‑time basis. It serves students through online courses with teacher support as well as print correspondence course programs. Keystone primarily uses our FuelEd curriculum and providesoffers a lower-costlower‑cost option to families than either of our other two private schools. Keystone is accredited by the Middle States Association—Commission on Elementary and Secondary Schools and AdvancED.
The George Washington University Online High School is operated in cooperation with the George Washington University. The program, which launched in the 2011-122011‑12 school year, offers K12'sK12’s college preparatory curriculum and is designed for high school students who are seeking a challenging academic experience and aspire to attend top colleges and universities. The school also provides extensive counseling throughout the high school years to help students make academic and extracurricular choices and maximize their future potential. The school is accredited by the Middle States Association—Commission on Elementary and Secondary Schools.
In the United Kingdom, our business included a single school for pre-kindergarten to elementary students that became a K12-managed school on January 1, 2013. We believe that our presence in the United Kingdom presents business development opportunities for additional schools in the country for pre-kindergarten to high school students, and we are pursuing a contract for another managed school for the 2014-15 school year.
We also sell individual K-8 online courses and supplemental educational products directly to familes. Our curriculum is sold directly to customers whofamilies. These purchasers desire to educate their children as homeschoolers, outside of the traditional public school system or to supplement their child'schild’s existing public or private school education without the aid of an online teacher. Customers of our consumer productproducts have the option of purchasing a complete grade-levelgrade‑level curriculum for grades K-8, individual courses, or individuala variety of other supplemental products, covering various subjects depending on their child'schild’s needs. Typical applications include summer school course work, home schooling and educational supplements.
Our GrowthBusiness Strategy
Our growth strategy consistsWe are committed to maximizing every child’s potential by personalizing their educational experience, delivering a quality education to schools and their students, and supporting our customers in their quest to improve academic outcomes and prepare them for college and career readiness. In furtherance of leveraging the investmentsthose objectives, we have already madeplan to continue investing in our curriculum and learning systems. These investments include initiatives to create and deploy a next generation curriculum and learning platform, improve the effectiveness of our school workforce, develop new instructional approaches to increase student and parental engagement, and improve our systems as well as the expertise we have developed in online learning and school management, to serve adjacent markets and to diversify our risk profile.security architecture. This strategy is aligned with the way the education industry is expected to evolve and consists of the following components:key elements:
Deliver better student outcomes. We are committed to improving student outcomes for every student in the schools we serve. To achieve this goal we will: (i) invest in training and professional development for teachers and school leaders; (ii) develop programs and initiatives designed to improve the learning experience, such as our interactive media projects, virtual science labs, AP test prep, specialized cohort academies and Family Academic Support Team (“FAST”) initiatives; (iii) enhance our curriculum to make it more engaging, adaptive and available to all students anywhere; and (iv) update our content as state standards and state assessments change. We will also focus our marketing and enrollment efforts on helping students and families understand the unique demands and challenges of the online learning environment. We believe a better understanding by parents and students will better prepare students for the work and improve their chance at academic success.
Improve student retention in our virtual schools. To ensure the best outcomes for students, we have partnered with the school boards we serve to make a concerted effort to enroll and retain students who are truly engaged and ready to learn. Research shows that students who remain in the same school setting longer generally perform better academically, and retention is especially challenging with virtual schools because families have the option of enrolling their children in a brick and mortar school or another virtual school. We therefore continue to refine our marketing programs to attract students who are most likely to succeed in a non‑classroom based environment with the expectation of increasing academic success and student retention, recognizing that all students are eligible to enroll consistent with state requirements (e.g. enrollment caps, prior public school student). Once students are enrolled, programs such as Strong Start and FAST implement early intervention and focused engagement and retention strategies, which strive to help students stay on track, improve engagement and ultimately give students a better chance at academic success.
Introduce New and Improved Products and Services. We intend to continue to expand our product line and offerings, both internally and through licensing or strategic acquisitions of products that address gaps in our current portfolio, including pursuing development and greater use of curriculum and platforms accessible from tablet and mobile devices and leveraging adaptive learning technologies and solutions. In addition, we are endeavoring to serve new charter schools that attract students who are seeking career and technical education.
Increase Enrollments at Existing Virtual and Blended Public Schools.Schools In the 2014-15 school year, we will manage virtual and blended public schools in 33 states and the District of Columbia. While we plan to increase enrollments at these schools, some. Some state regulations and school governing authorities and districts still limit or cap student enrollment or enrollment growth. We intendAt the direction of our school board and school district customers, we will seek to provide an opportunity for more students to attend these schools, and
support their efforts to work with schools, legislators, state departments of education, educators and parents to find solutions that will remove those enrollment restrictions and allow access for every child who is interested in attending a virtual or blended public school.caps.
Expand Virtual and Blended Public School Presence into Additional States and Cities. The flexibilityAs laws change and comprehensiveness of our learning systems allows us to efficiently adapt our curriculum to meet the individual educational standards of any state or school district with limited capital investment. We will continue toopportunities arise, we work with states and school districts to authorize and establish new virtual and blended public schools and to contract with them to provide our curriculum, online learning platform, management services, and other related offerings.
Accelerate Institutional Sales.Business. The breadth of our FuelEd and FuelEd ALS catalog, now ranging from pre-Kpre‑K to 12th12th grade, our instructional capabilities and our capacity to simplify a school district'sdistrict’s management of multiple digital programs and vendors through our PEAK technology platform, are the key
Table of Contents
drivers for Institutional Salesbusiness growth. We will continue to work to accelerate the market adoption of these solutions and services as school districts partner with us to address a variety of academic needs and personalized learning for their students. We will continue to seek acquisitions of businesses that expand FuelEd’s distribution and product portfolio, improve our platform and capabilities, and allow us to enter new markets to serve every child who is interested in the benefits of digital learning.
Add Enrollments in Our Private Schools. We currently operate three online private schools that we believe appeal to a broad range of students and families. We look to drive increased enrollments in these schools by increasing awareness, through targeted marketing programs and by solicitation of partnerships with traditional brick and mortar private schools.
Pursue International Opportunities to Offer Our Learning Systems. We believe there is strong worldwide demand for high-quality,high‑quality, online education from U.S. families living abroad, and foreign students who seek a U.S.-styleU.S.‑style of education and the schools and school systems that serve them in their local market. Our ability to operate virtually is not constrained by the need for a physical classroom or local teachers, which makes our learning systems ideal for use internationally.
Develop Additional Channels through Which to Deliver Our Learning Systems. We plan to evaluate other delivery channels on a routine basis and to pursue opportunities where we believe there is likely to be significant demand for our offering, such as direct classroom instruction, blended classroom models, career and technical education, supplemental educational offeringsproducts and individual products packaged and sold directly to consumers.
Pursue Strategic Partnerships and Acquisitions. As with our joint venture with Middlebury College, weWe may pursue opportunities with other highly-respected institutions where we can be a valued-added partner or contribute our expertise in curriculum development and educational services to serve more students. We may also pursue selective acquisitions at attractive valuations that complement our existing educational offerings and business capabilities, and that are natural extensions of our core competencies. We may also pursue opportunities with highly‑respected institutions where we can be a valued‑added partner or contribute our expertise in curriculum development and educational services to serve more students.
Introduce New Products and Services. We intend to continue to expand our product line and offerings, both organically and through licensing or strategic acquisitions of product portfolios, including pursuing greater use of and access to tablet and mobile technology and adaptive learning technologies and solutions. In addition, we are endeavoring to open new schools that attract students who are seeking career and technical education and schools with deep science, technology, engineering and math ("STEM") offerings.
Products and Services
Educational Philosophy
TheA primary focus of our educational philosophy is to make the academic performance of students our first priority. We are committed to continuously improving the quality of our curriculum and academic programs, including alignment to alignall state adopted standards and assessments (tests which are designed to measure specific elements of learning) and with states that have adopted the Common Core State Standards ("CCSS"(“CCSS”) and the Common Core Assessments. We also continue to evaluate and use innovative technologies to deliver engaging and effective learning experiences for all students. We seek to leverage our product portfolios across our educational solutions and distribution channels and to invest in our content portfolio to ensure our students receive a meaningful learning experience that is individualized, engaging, accessible and effective.
The design, development and delivery of our products and services are grounded in the following set of guiding principles:
•Apply "Tried and True" Educational Approaches for Instruction through Technology; Employ Technology Appropriately to Deliver and Enhance Those Approaches. Our learning systems are designed to utilize both "tried and true" methods to drive academic success. "Tried" methodologies are those that have been experientially tested and proven to be effective. "True" methodologies are those based on more recent cognitive research regarding the way in which individuals learn. "Tried" methodologies employed by K12 must also pass through the "true" litmus test; the two criteria are
| · | | To deliver learning systems that are designed to help drive academic success and student engagement. Our programs include a wide variety of curriculum and course options, onboarding programs to support our families and schools, as well as tools to support the overall engagement and student management. |
not antagonistic. This "tried and true" philosophy allows us to benefit from both decades of research about learning and over a century of published analysis of effective methods of teaching.
•Employ Technology Appropriately for Learning. All of our courses are delivered primarily through an online platform and generally include a significant amount of online content. We employ technology where we feel it is appropriate and can enhance the learning process, with the offline:online ratio changing appropriately for advancing developmental levels in students. In addition to online content, our curriculum includes a rich mix of course materials, including engaging textbooks and hands-on materials such as instructional kits, scientific and musical instruments, art supplies and science specimens. Furthermore, our teachers utilize telephonic contact as well as email and virtual electronic classrooms. We believe our balanced use of technology and more traditional approaches helps to maximize the effectiveness of our learning systems.
•Base Learning Objectives on "Big Ideas". We use the expression "big ideas" for the key, subconscious frameworks that serve as the foundation to a student's future understanding of a subject matter. For example, an understanding of waves is fundamental to a physicist's understanding of quantum mechanics; for that reason, we teach 1st graders the fundamentals of waves in an age-appropriate form. We use "big ideas" in every subject area to organize the explicit learning objectives for each course we develop.
•Assess Every Objective to Ensure Mastery. Ongoing assessments are the most effective way to evaluate a student's mastery of a lesson or concept. To facilitate effective assessment, our curriculum states clear objectives for each lesson. Throughout a course, every student's progress is assessed at a point when each objective is expected to be mastered, providing direction for appropriate pacing. These periodic and well-timed assessments reinforce learning and promote mastery of a topic before a student moves to the next lesson or course.
•Individualized Learning. We seek to create engaging curriculum content to capture a student's attention to make learning more interesting and effective. It is our fundamental belief that each student learns in a highly individualized manner. Our instructional system allows students to learn from a curriculum that caters to their unique learning style and offers a high degree of program flexibility. Certain adaptive learning features being integrated into some curricular products can individualize lessons based on the level of student comprehension.
•Prioritize Important, Rigorous Objectives. Our content experts have developed a clear understanding of those subjects and concepts that are difficult for students, from both historical and cognitive points of view (that is, from both the "tried" and the "true" perspective described earlier). Greater instructional effort is focused on the most important concepts (the biggest ideas) and on the most challenging concepts and skills (as revealed by experience and research). We use existing research, feedback from parents and students, and experienced teacher judgments to determine these priorities, and to modify our learning systems to guide the allocation of each student's time and effort.
•Facilitate Flexibility to Accommodate Variations in Ability. We believe that each student should be challenged appropriately, where "challenge" is both a matter of the difficulty inherent in the subject matter, and also the pace at which the subject matter is presented. Generally, adequate progress for most students is to complete one academic year's curriculum within a nine-month school year. Each individual student may take greater or fewer instructional hours and make more or less effort than the average student to achieve this progress. Our learning systems are designed to facilitate this flexibility in order to ensure that the appropriate amount of time and effort is allocated to each lesson.
•Ensure Fundamental Content Soundness. Our highly credentialed subject matter experts or "Content Specialists" bring their own scholarly and teaching backgrounds to course design and
| · | | Employ Technology Appropriately for Learning. All of our courses are delivered primarily through an online platform and generally include a significant amount of online content. We employ technology where it is appropriate and can enhance the learning process, with the amount of online content increasing at higher grades. In addition to online content, our curriculum includes a rich mix of courses with and without materials. Furthermore, teachers utilize a variety of collaboration and communication tools to help support student and family communication. We believe our balanced use of technology and more traditional approaches helps to maximize the effectiveness of our learning systems. |
| · | | Assess Objectives to Ensure Mastery. Ongoing assessments are the most effective way to evaluate a student’s mastery of a lesson or concept. To facilitate effective assessment, our curriculum states clear objectives for each lesson. Throughout a course, every student’s progress is assessed at a point when each objective is expected to be mastered, providing direction for appropriate pacing. These periodic and well‑timed assessments reinforce learning and promote mastery of a topic before a student moves to the next lesson or course. |
| · | | Individualized Learning. We seek to create engaging curriculum content to capture a student’s attention to make learning more interesting and effective. It is our fundamental belief that each student learns in a highly individualized manner. Our instructional system allows students to learn from a curriculum that caters to their unique learning style and offers a high degree of program flexibility. Certain adaptive learning features are being integrated into some curricular products, which can individualize lessons based on the level of student comprehension. |
| · | | Prioritize Important, Rigorous Objectives. Our content experts have developed a clear understanding of those subjects and concepts that are difficult for students, from both historical and cognitive points of view. Greater instructional effort is focused on the most important and most challenging concepts (as revealed by experience and research). We use existing research, feedback from parents and students, and experienced teacher judgments to determine these priorities, to modify our learning systems to guide the allocation of each student’s time and effort, and to align with evolving state curriculum and testing blueprints. |
| · | | Facilitate Flexibility to Accommodate Variations in Ability. We believe that each student should have access to a variety of instructional solutions that help challenge each student appropriately. Generally, meaningful progress for most students is to complete one academic year’s curriculum within a traditional school year. Our learning systems are designed to facilitate this flexibility to motivate and challenge each student to master each lesson. |
| · | | Ensure Fundamental Content Soundness. Our highly credentialed subject matter experts or “Content Specialists” bring their own scholarly and teaching backgrounds to course design and development and are required to maintain relationships with and awareness of guidelines from over 65 national and international subject‑area associations. |
| · | | Integrate Curriculum, Teachers and Technology to Maximize Student Learning. We believe students learn better not just with great curriculum, but also great teachers and technology that allows them to access the content and teachers in a way that makes learning more engaging and effective. |
Table of Contents
Academic Performance
Our fundamental goal for every child who enrolls in an onlinea virtual public or private school managed by the Company,us, or a program offered through a school district or a Non‑managed school, is to improve his or her academic performance. In 2014,fiscal year 2017, we published an academic report that examines achievement in our managed public schools measured against both2016 K12 Annual Academic Report (“2016 Academic Report”) which is available at http://k12.com/academic-report. The 2016 Academic Report was expanded to include all Managed Public School Programs with reported state tests (which vary widely) and a nationally normed adaptive test which provides a common measure of achievement across all of the managed schools we serve.results as well as additional results from key high school assessments. By analyzing and communicating the results of our efforts, we aim to provide data for school boards and guidanceparents as they exercise school choice options, and to help educators working to improve academic achievement for every child in our increasingly diverse schools and for parents as they exercise school choice options.schools. The 2014 Annualtest results included in our 2016 Academic Report ("2014 Academic Report"), canthat were aligned to new state standards and based on different definitions of proficiency cannot be found onlinecompared to scores on state tests from previous years. To provide a more meaningful report, we only included year-over-year results for schools that had not experienced a testing program change over the prior year, we organized our analyses into groups according to test type
and we reported data in context by comparing performance at http://k12marketing.http.internapcdn.net/K12marketing/docs/K12-Academic-Report-2014-051614.pdf.
A significant challenge we face with respect toschool and state levels. We believe that none of our competitors serving virtual public schools publishes this volume or depth of academic performance is that eachdata and analytics.
Each of the 33 states and the District of Columbiajurisdictions in which we manage virtual public schools measures academic performance using different state accountability methods. A number of states have adopted the Common Core State Standards for curriculum content and one of the two online assessment methods aligned to those standards, the Smarter Balanced Assessment Consortium (“SBAC”) or the Partnership for Assessment of Readiness for College and Careers (“PARCC”). However, as of school year 2016-17, a majority of the states in which we operate rely on their own state‑developed standards and assessments or commercially available assessments. Some states set proficiencyuse a combination of a state‑developed test and either the PARCC or SBAC test, while other states in which we operate never adopted the CCSS, including Virginia and Texas.
In the 2014‑2015 school year, many states changed their required assessments. Across all K12 public school programs, only eight states did not change their state required tests in 2014‑2015: Iowa, Minnesota, Oklahoma, Tennessee, Texas, Utah, Virginia, and Wyoming. The changes in state tests were in part a consequence of the Common Core State Standards, initially released in 2010. In that year, most states began the process of adopting the Common Core standards, which measure minimum levels of comprehension by grade level for certain subjects (e.g., typically math and reading) that are discerned through year-end testing. These static proficiency measures are generally used to assess Adequate Yearly Progress ("AYP") under the No Child Left Behind Act ("NCLB").
According to a November 2012 reportencouraged by the Center for Education Policy, nearly half offederal grant program called Race to the nation's public schools (48%) did not achieve AYP in 2011, with some states exceedingTop, which favored applicants that AYP failure rateagreed to adopt Common Core. The new content standards required new assessments, so to develop assessments aligned to the Common Core, the federal government funded two testing consortia, the PARCC and others falling below. Recognizing the limitations in the NCLB approach for measuring academic performance, as of July 2014, 42SBAC. At one time, 24 states and the District of Columbia have obtained NCLB waiverswere signed on to administer the PARCC assessments. However, in the 2014‑2015 school year, only the District of Columbia and 10 states fully administered the PARCC assessments. The Education Commission of the States notes that in 2015‑2016, only six states and the District of Columbia used the PARCC assessments. While the SBAC consortium has experienced fewer withdrawals, its members decreased to 15 states that administered the full SBAC assessment in the 2015‑2016 school year. For the 2016-17 school year, 7 states administered the PARCC assessment and 14 states administered the SBAC assessment. Fewer states changed their state-developed assessments from the U.S. Department of Education and eight school districts in California have obtained waivers after the California state application was denied. Iowa and Wyoming are pursuing NCLB waivers, and four states are not seeking waivers (Montana, Nebraska, North Dakota and Vermont). A waiver previously granted2015-16 to Washington has been revoked. In connection with these waivers, most states have moved beyond AYP as a measure of academic performance and are using alternative accountability measures, including various "growth models." While these growth models can have different assumptions, methodologies and analytics from state-to-state, their primary purpose is to determine how much a student learns over the course of a2016-17 school year by measuring actual learning gains and growth. For example, a growth model may reveal that a student who enrolls two years behind grade level in math could realize a full year of improvement but may still fall below a static proficiency model target used with AYP measures.than the previous year.
We share the view taken by the many states granted AYP waivers that assessing a student'sstudent’s academic performance by his or her learning growth is a more accurate measure of a school's effectiveness. Therefore, in addition to state accountability models, we also measure academic performance usingschool’s effectiveness than attaining a nationally normed computer adaptive testing program provided by Scantron, an independent provider of web-based K-12 assessments. With the Scantron testing, we can obtain reliable and comparable pre- and post-test results to assess the efficacystatic proficiency score. Most of our programsschools administer nationally‑recognized interim and/or benchmark assessments to measure student growth during the school year, to prepare students for state assessments and to guide instruction. To ensure all schools are utilizing best practices learned from the successful schools we manage and from other high performing schools across the country, we have implemented a standardized academic framework across all of the Managed Public School Programs that have been implemented across multiple states with different standardsaddresses teacher preparation, delivery of instruction, and accountability systems. The Scantron testing also gives usstudent assessment. Effective instruction is informed by and evaluated based on student‑level data. As part of the academic framework, schools implement plans to collect student‑level data throughout the year from three types of assessments: diagnostic, formative interim, and summative. Baseline assessments are used to determine a better understanding ofstudent’s academic growth for every student, whether below, at or above grade level. As an adaptive test, Scantron also adjusts in real time in response to a student's answers,strengths and thus more accurately reveals the student's level of mastery.
Table of Contents
The Scantron adaptive assessment testsweaknesses and are taken by virtual school students from their homesadministered at the beginning of the school year or when a student enrolls. Formative interim assessments are administered throughout the year to assess student mastery of the state standards and objectives. Summative assessments measure student learning at culminating points in a student’s academic career, such as the end of the school year. Approximately 87% of the students enrolled in our managed public schools during the 2012-13 school year completed the Scantron tests at the beginning andsemester or the end of the school year. While we recognize that students may be unsupervised while taking Scantron tests, the score trends from such tests relative to scores fromIn most cases, state tests (which in mostserve as the summative assessment for schools. We provide recommendations for benchmark and interim formative assessments based on state standards and state assessments. In several cases are closely proctored, including for the students in the managed public schools we serve) are similar, suggesting that the un-proctored approach for the Scantron test does not affect the accuracy of the Scantron results. In addition, the Scantron test results for an individual student are used to measure hischarter authorizers, district partners or her performance over the school year, and thus are given twice each year in the early fall and late spring. Teachers and staff use the test results to develop an education plan for each student, where appropriate, and to guide teachers to tailor their instructions to the student's needs and relative strengths. The test results are not used to grade or "place" students relative to their age group, and thus students and their parents have no incentive to cheat or seek outside help on an un-proctored test. More fundamentally, the Scantron tests are adaptive and proactive. That is, if the program senses that the student is answering questions too rapidly or is answering questions of increasing difficulty well beyond his or her grade level, the program will report the test results as "spoiled" to the teacher assigned to that student, and the test will be administered again with different questions. For these reasons, K12 believes the Scantron test results are a reliable indicator of the student's progress in proficiency in reading and mathematics over the course of a school year.
As we reported in our 2014 Academic Report, pre- and post-test data from the Scantron Performance Series adaptive assessment system showed that, in aggregate, students in the managed public schools we serve achieved greater academic growth than the norm group in both mathematics and reading for the 2012-2013 school year. In addition to measuring a student's academic growth over the course of the school year, the Scantron testing results provide teachers, families and curriculum developers with insights on areas to improve a student's academic growth during a school year.
We recognize that as state-specific growth models using different assessments emerge in the coming years, the virtual public schools we manage in those states will be measured for academic performance against those standards, which may yield different results than the Scantron nationally normed tests. Our 2014 Annual Academic Report contains school proficiency data under each state's accountability standards based upon testing results for K12 managed public schools representing more than 72% of our total enrollment in these schools. State proficiency results are typically available for each of our managed public schools through state departmentdepartments of education websites as well.require specific assessments.
In addition to the complexities involved in measuring academic performance of students, we believe the statewide virtual public schools we serve face unique challenges impacting academic success not necessarily encountered to the same extent by traditional brick and mortar schools. These challenges include high percentages of students who enter behind grade level or under‑credited, high student mobility, high enrollment growth rates, lack of control over the student learning environment and higher than average percentages of students in student populations eligible for free or reduced-price lunch.
Forreduced‑price lunch in many states. With rare exceptions, the data shows that students identified as eligible for free lunch had lower percentages at or above proficiency levels than students eligible for reduced‑price lunch, and both groups usually underperformed students identified as not eligible for subsidized meals. In addition, for decades, educational research has shown that persistence—remaining and proceeding at pace in the same school setting—can benefit academic performance, while mobility—moving from one school setting to another—can have a destabilizing influence, causing students to struggle and lapse in academic performance. In our experience, the longer a student persists with our K12 curriculum in our managed public schools, the greater the likelihood of a better academic outcome for that student as explained further in our 2014 Annual Academic Report. The following table reflects the number (and percentages of
Table of Contents
the total number) of students enrolled in K12-managed public schools and the length of time those students have been enrolled, based on a snapshot of current enrollment data as of May 31, 2014:
| | | | | | | |
Time Enrolled* | | Percentage of All
Enrolled Students | | Number of
Students | |
|---|
Less than One Year | | | 14.8 | % | | 16,909 | |
One to Two Years | | | 46.0 | % | | 52,763 | |
Two to Three Years | | | 20.8 | % | | 23,875 | |
Three or More Years | | | 18.4 | % | | 21,088 | |
| | | | | | |
| | | | | | | | |
Totals | | | 100.0 | % | | 114,635 | |
*Time enrolled is measured in calendar years and computed based on the difference in the calendar year of a student's school enrollment and the calendar year at the date of measurement (May 31, 2014). These persistence calculations do not reflect the average fiscal year 2014 enrollments of 123,259.
While measuring academic performance is necessary, taking meaningful steps to improve student outcomes is an integral part of our mission. Accordingly, we continually strive to achieve that objective by undertaking new initiatives and piloting new programs, such as our Family Academic Support Teams (described below under "Our Products"), while continuing to study and refineimproving existing programs, such as Strong Start our National Math Lab and our Mark12 remedial reading program.FAST. To monitor student learning progress during the school
year, we are addingusing multiple equivalent assessments at the lesson, unit and semester level to ensure that our measurement of mastery is reliable and valid. We are also piloting a diagnostic assessment toolvalid, introducing more synchronous sessions for at risk students, and using data driven instruction that provides for targeted teacher intervention to be ableassist students with lesson challenges.
In furtherance of our goal to develop individualized learning plans for new students who often start school before theirimprove academic records are provided to us from their previous school.
Inperformance, in fiscal year 2014 we established an Academic Committee of the K12 Board of Directors comprised of three members. The primary role of the Academic Committee is to make recommendations and assist management in discharging its responsibility to ensure continuous improvement in academic outcomes for the public and private schools served by the K12.
With input and oversight from the Academic Committee, the education experts who are members of our K12 Educational Advisory Committee ("EAC"(“EAC”), formed in 2013, will further improve our focus on academic achievement and growth goals as well as advising us on specific tactics to be successful in these areas. The EAC met 3 times in fiscal year 2017. The members of our EAC are:
•Dr. Andrew Porter, Dean of the Graduate School of Education, University of Pennsylvania
•Dr. Elanna Yalow, CEO of Knowledge Universe Early Learning Programs
•Dr. Beverly Hutton, Executive Director of the National Association of Secondary School Principals
•Dr. David Driscoll, former Commissioner of Education, Commonwealth of Massachusetts
•Ms. Ann Foster, former Senior Vice President Strategy, Business Development and Connected Learning for Harcourt Education Group
| · | | Dr. David Driscoll, former Commissioner of Education, Commonwealth of Massachusetts |
| · | | Ms. Millie Fornell, former Chief of Staff, Miami‑Dade School District |
| · | | Ms. Ann Foster, former Senior Vice President Strategy, Business Development and Connected Learning for Harcourt Education Group |
| · | | Dr. Beverly Hutton, Executive Director of the National Association of Secondary School Principals |
| · | | Dr. Andrew Porter, former Dean of the Graduate School of Education, University of Pennsylvania |
| · | | Dr. Elanna Yalow, CEO of Knowledge Universe Early Learning Programs |
| · | | Dr. Anne Mendenhall, chair of the Nevada Virtual Academy board |
Our Products
Our mission remainsproduct approach is to investcontinue investing in systemscurriculum and technology to educate students more effectively and efficiently. By keeping abreast of industry trends and innovative technologies, including adaptive learning solutions and mobile and tablet accessibility, it is our expectation that these investments will help states, districts and schools improve the education of their students.
Much of our investment has been in the development of K-12K‑12 online courses and management systems. We are planning specialized courses and programs designed to remediate the rapidly increasing
Table of Contents
number of students who are enrolling in schools behind grade level. Specifically, we are making, licensing or acquiring more individualized learning programs for students using adaptive learning technology, which requires a significant financial commitment to license or acquire, integrate and develop a specialized curriculum and a complex database.
As school districts confront the same issues that we are experiencing in the managed public schools, we believe that our solutionsproducts could gain widespread acceptance. During the past few fiscal years, we builthave applicability across a broader range of schools. We are continuing to develop new K-6 math curriculum, K-3 English language arts curriculum,courses and materials aimed at engaging a remedial reading course, all based on the latest educational research and pedagogical methods. broad spectrum of learners.
In addition, our PEAK system provides school districts and administrators a better way to manage their online education programs and content. In 2014, we entered into an agreement to transition our high school learning management system (“LMS”) to Desire2Learn, a pioneer in next-generationnext‑generation digital education systems. During school year 2015‑16, we migrated the virtual high schools we manage to this new platform, and it is anticipated that the migration for middle school will be completed in time for school year 2017-2018. The Desire2Learn platform is used by over 100 K-12 organizations,new online high school and provides an industry-leading studentmiddle school LMS was designed to empower, engage, and help students achieve better academic results. The new user experience which shouldincludes planning features that help us improve student engagement, retentionstudents advance through their schoolwork, as well as course management tools that allow teachers to tailor a curriculum that best meets the unique needs of their students, and outcomes for our managed schools. It is expected to also significantly advance our efforts to deliver a more mobile-ready curriculum becausehost of its mobile-ready capabilities which exceed the capabilities of our current systems. We expect to complete our transition to the Desire2Learn platform by the fall of 2015.other features.
Just as we pioneered the development of virtual schools, we are resolved to address the most challenging educational needs facing schools and districts. Our goal is to assist teachers, schools and districts in implementing individualized education programs to better serve their students. This can take a variety of forms including turn-keyturn‑key solutions, partnerships, vendor relationships, enterprise licenses, and purchases of curriculum and services.
Our investment strategy is not limited, however, to curriculum and systems. We are also making substantial investments in our service offerings to improve student outcomes. For example, as part
Curriculum
K12 has one of the largest digital curriculum portfolios for the K-12K‑12 online education industry. The K12K12 curriculum consists of a variety of online lessons and resources, offline instructional kits and materials and lesson guides. We offer an extensive catalog of proprietary courses designed to teach concepts to students from pre-kindergarten through 12th grade. A single year-long K12year‑long K12 course generally consists of 120 to 180 unique instructional lessons. Each lesson is designed to last approximately 45 to 60 minutes, although students are able to work at their own pace. We have more than 700a broad‑based curriculum that includes courses across kindergarten, elementary, middle and high school, including world languages. This combined portfolio contains over 107,000 hours of instructional content and over one million visual, audio and interactive instructional elements in our asset repository.
Since our inception, we have built core courses in English language arts, mathematics, science and history on a foundation of rigorous standards, following the guidance and recommendations of leading educational organizations at the national and state levels. For this reason, our K12K12 curriculum was well positioned to satisfy the requirements of the CCSS when they were published in June 2010. Since then, we have been in the process of fully aligning our existing and new courses to the CCSS. As the CCSS landscape is continually changing, we will monitor the decisions that states are making with regard to CCSS adoption and the associated assessments of the CCSS or other standards the states may adopt, which
Table of Contents
in turn may require further adjustments. We have and will continue to invest in and update our curriculum to stay current with emerging and developing standards like CCSS.
Online Lessons. Our K12For school year 2016-17, our K12 online lessons or curricula arewere accessed by K‑5 students through a proprietary learning management platform, which we call our Online School ("OLS"(“OLS”) for K-8 students and the eCollege. Lessons are accessed through a third‑party platform forby high school students, as well as a number of other common industry platforms for students who access our FuelEd Online Courses and our FuelEd ALS.Courses. Each online lesson provides the roadmap for the entire lesson, including direction to specific online and offline materials, summaries of major objectives for the lesson and the actual lesson content with assessments. Digital versions of documents, readings, labs and other activities may also be included. Lessons utilize a combination of innovative technologies, including animations, demonstrations, audio, video and other graphic/digital interactivity, educational games and individualized feedback, all coordinated with offline textbooks and hands-onhands‑on materials, to create an engaging, responsive and highly-effectivehighly‑effective curriculum. The formative and periodic summative, online assessments help ensure that students have mastered the material and are ready to proceed to the next lesson, allowing them to work at their own pace. Pronunciation guides for key words and references to suggested additional resources, specific to each lesson and each student'sstudent’s assignments and assessments, are also included.
Learning Kits. Many of our courses utilize learning kits in conjunction with the online lessons to maximize the effectiveness of our learning systems. In addition to receiving access to our online lessons through the Internet, each K-8K‑8 student receives a shipment of materials, including award-winning textbooks, art supplies, laboratory supplies (e.g., microscopes, scales, science specimens) and other reference materials which are referred to and incorporated in instruction throughout our curriculum. This approach is consistent with our guiding principle to utilize technology where appropriate for our learning systems, and combine it with other effective instructional methods. Most of the textbooks we use are proprietary, written by K12 to be verbally engaging and visually appealing to students, with careful control of reading levels, and to complement the online experience. Through fiscal year 2014, weWe have also created and/or converted additional K12K12 textbooks and resources used across our courses into an electronic format, enabling us to offer options to enhance the student experience without physical books. We believe that our ability to effectively combine online lessons and materials—to develop, deliver and implement them together for instruction—is a competitive advantage.
Lesson Guides. Our courses are generally paired with a lesson guide. Lesson guidesguide and/or teacher resources. These resources are designed to work in coordination with the online lessons and include the following: overview information for learning coaches, lesson objectives, lesson outlines and activities, answer keys to student exercises and suggestions for explaining difficult concepts to students.
Pre‑K and K‑8 Courses
Pre-K and K-8 Courses
From pre-kindergartenpre‑kindergarten through 8th grade, our courses are generally categorized into seven major subject areas: English language arts, mathematics, science, history, art, music and world languages. Our proprietaryonline curriculum includes all of the courses that students need to complete their core kindergarten through 8th grade education; our pre-Kpre‑K offering, which we refer to as EmbarK12, introduces students to core subjects through cross-curricularcross‑curricular thematic units, building initial and fundamental relationships among concepts. Courses focus on developing fundamental skills and teaching the key knowledge building blocks or schemas-the "big ideas"schemas—the “big ideas” that each student will need to master the major subject areas, meet state standards, including those formulated as the CCSS, and complete more advanced coursework. Unlike a traditional classroom education, and in conjunction with school teachers and counselors, our learning systems offer the flexibility for each student to take courses at different grade levels in a single academic year, providing flexibility for students to progress at their own level and pace within each subject area.
Our K12 second generationK12 elementary language arts program is designed to deliver increased interactivity and make instruction even more engaging and efficient while integrating rewards, interactive
Table of Contents
practice and a virtual world. Our Fundamentals of Geometry and Algebra course completes our proprietary K-8 math offering. These courses support students at various skill levels via targeted, timely remediation, embody CCSS and include significant media integration. In addition, the flexibility of our learning systems allows us to tailor our curriculum to state specific requirements. For example, we have developed almost 70a large catalog of courses specifically created for the public school standards in 1320 states; we are aligning our courses to the CCSS and the Common Core Assessments; and in addition to the ongoing evolution of our K-5K‑5 Math+ program, we have also created over 80 custom Math+ sequences to serve specific state needs.
The curriculum available to high school students is much broader and varies from student to student, largely as a result of the increased flexibility in course selection available to high school students. Students also are able to select from a wide range of electives. We have augmented our lab program for lab science courses with the creation of alternate kit-freekit‑free science labs as an augmentation or alternative for our formerly kit-basedkit‑based high school science labs in order to provide a more flexible and robust lab program across our physical science, earth science, biology, chemistry and physics courses. Our overall lab program now includes traditional kit-basedkit‑based labs based on either shipped-inshipped‑in or household materials, virtual labs, video-basedvideo‑based labs, data-collectiondata‑collection and data-manipulationdata‑manipulation labs, and field studies. This array provides schools with additional materials flexibility, and integrates diverse modalities directly into our science curriculum to promote conceptual mastery. Across all subject areas, the K12K12 proprietary core curriculum accounts for approximately 90%more than three quarters of our high school course enrollments. We are aligningAs standards change, we align our courses to the CCSS and the Common Core Assessments.Assessments as well as various evolving state standards. We have already released over 40 new courses to help support our focus on career and technical education, and we are planning to launch another 46 courses for school year 2017-2018.
FuelEd Online Courses. We also offer curriculum to schools and school districts marketed as our FuelEd Online Courses product line. Most FuelEd Online Courses are aligned to state and national standards, including many to the CCSS, and include more than 180a large number of courses for middle and high school students, featuring core, AP, elective and credit recovery courses. FuelEd'sFuelEd’s Online Courses are developed by subject matter experts, designed by multimedia teams and deliveredmay be taught by highly qualified high school instructors.Company‑provided instructors at the customers’ option. FuelEd classes are primarily delivered over the Internet in a classroom or virtual setting, and use a variety of interactive elements to keep students engaged throughout.engaged. A deep understanding of K-12K‑12 pedagogy, as well as the human factors associated with online technology, is integrated into FuelEd'sFuelEd’s courses. New to the FuelEd offerings this year are adaptive credit recovery courses in math, English, physical education, health, and world languages.
FuelEd Anywhere Learning System ("ALS"). Our FuelEd ALS courseware is currently in use in over 5,000 public and private K-12 schools, public charter schools, colleges, correctional institutions, centers of adult literacy, military education programs and after-school learning centers. FuelEd ALS provides an integrated offering of instructional software and assessment for reading, mathematics, language arts, science, writing, history, government, economics and geography for grade levels K-12. In addition, we also provide assessment testing and instructional content for the General Educational Development ("GED") test. These products are designed to provide for LAN, WAN and Internet delivery in schools and support Windows and Macintosh platforms. Spanish-language versions are available for mathematics and language arts in grade levels 1-6.
Middlebury Interactive Languages. We offer digital world language courses and residential summer language academies through MIL, which became a wholly-owned subsidiary in FY 2017 through our MILpurchase of Middlebury College’s interest in the joint venture. This venture offersAs part of that transaction, we retained the right to use the MIL name in its products through April 2028. In addition, we secured the right to use the MIL name in marketing materials through December 2019. These offerings include immersive language courses for K-12K‑12 students based on Middlebury College'sCollege’s pedagogy to help students gain a stronger base of comprehension and accelerate language acquisition. The age-appropriateage‑appropriate language courses, which can be implemented fully online, in a blended learning environment or as supplemental material, use instructional tools such as animation, music, videos and other authentic materials to immerse students in the language and culture of study. We offer Chinese, French, German Spanish and ArabicSpanish courses for elementary, middle and high school students. In addition, MIL has developed a summer English language learner (“ELL”) curriculum and new, digital, supplemental ELL courses for middle and high school students are now available, and additional courses areto be used in development to create a comprehensive suite of world language offerings. The joint ventureblended environment. MIL also operates summer residential
Table of Contents
language academies, an immersive program for middle and high school students. Academy students live in language by taking the Language Pledge, a promise to communicate solely in their language of study for four weeks. Instruction is offered in Arabic, Chinese, French, German and Spanish at multiple college campuses in the United StatesVermont, as well as in France, Spain and China in Beijing, China.their respective local languages.
Innovative Learning Applications
In order to continue to enhance the user experience and instructional methods of our learning systems, we strive to developleverage new technologies and learning applications andto adapt our curriculum to new technology devices and platforms.
•Mobile Learning: We have created a number of mobile toolsplatforms while developing algorithms and applications. Thirty new mobile applications were delivered in fiscal year 2014 for a total of 48 applications now available for download. As of June 30, 2014, these "apps" have been downloaded over 0.8 million times since 2012. We continuemodels to deploy innovative educational tools for the mobile environment. With the increase in the use of mobile devices, we expect our mobile applications will create the ability for a student to learn "on-the-go," allowing for more continuous learning, engagement and mastery of content. We offer certain applications for both phones and tablets available via Apple, Google Play and the Amazon marketplace, adapting many of our award-winning curriculum features for the mobile application space. In addition, we are rolling out our first fully mobile-enabled courseware in the fall of 2014. Nine courses at the middle school level will be available for use utilizing the Blackboard Mobile Learn app. These courses will feature more than 9,000 mobile friendly interactives.
•Interactive Games: An active educational games initiative is delivering new methods for engagement, practice and review of K-12 concepts, including: narrative/immersive styles, rewards, persistent data, and complex algorithms. These games make use of extensive research and educational best practices and address targeted learning objectives. We have delivered a total of nine interactive games andbuild an innovative review and practice portal called Noodleverse. Noodleverse includes approximately 3,000 activities and is designed for K-3 students in conjunction with the K12 language arts program.
•Virtual Labs: We have delivered alternatives for our educational partners who desire materials-freeadaptive curriculum. This includes converting over 60 existing materials-based high school science labs into highly interactive virtual labs and video lab simulations that meet state standards and still maintain teaching the original learning objectives. For example, in high school chemistry we have developed a virtual laboratory on chromatography, in which students separate a number of inks into their component pigments. This laboratory is performed at a virtual lab bench with all the materials and with the same procedures high school students would use in a physical chemistry laboratory.
•eBook and Digital Book Distribution: Through fiscal year 2014, we have created or converted additional K12 textbooks (now totaling 65) used across our courses into an electronic format, including textbooks, reference guides, literature readers and lab manuals. This digital delivery ability enables us to offer options to our customers via interactive online books that enhance the student's reading experience, reinforce the student's learning approach and create a new method for delivering book and print materials. Each offline book is converted into an electronic book format with a custom user interface to be viewed via a standard web browser or a commercially available electronic reader (e.g. Kindle, Nook). Web accessibility features for disabled students are made use of where currently possible.
•Adaptive Learning: We have learning management systems and can now build courses that are adaptive, which enable individualized learning experiences as the course "adapts" at key points to student behavior and input. Based on assessment results or individual activity, these courses can automatically route students to an alternate explanation, additional practice or remediation on a
| · | | Mobile Device Learning: We offer mobile applications that create the ability for a student to learn “on‑the‑go,” allowing for more continuous learning, engagement and mastery of content. In addition, we |
rolled out our first fully mobile‑enabled courseware in the fall of 2014 and have developed a core mobile catalog of courses. |
| · | | Interactive Games: An active educational games initiative is delivering new methods for engagement, practice and review of K‑12 concepts, including: narrative/immersive styles, rewards, persistent data, and complex algorithms. In fiscal year 2016, we acquired a game-based learning system that is designed to help students accelerate learning and practice on state standards. These games make use of extensive research and educational best practices and address targeted learning objectives. |
| · | | Virtual Labs: We have delivered alternatives for our educational partners who desire materials‑free curriculum. This includes converting many of our existing materials‑based high school science labs into highly interactive virtual labs and video lab simulations that meet state standards and still maintain teaching the original learning objectives. For example, in high school chemistry we have developed a virtual laboratory on chromatography, in which students separate a number of inks into their component pigments. This laboratory is performed at a virtual lab bench with all the materials and with the same procedures high school students would use in a physical chemistry laboratory. |
| · | | eBook and Digital Book Distribution: Through fiscal year 2017, we have created or converted additional K12 textbooks used across our courses into an electronic format, including textbooks, reference guides, literature readers and lab manuals. This digital delivery ability enables us to offer options to our customers via interactive online books that enhance the student’s reading experience, reinforce the student’s learning approach and create a new method for delivering book and print materials. Each offline book is converted into an electronic book format with a custom user interface to be viewed via a standard web browser or a commercially available electronic reader (e.g. Kindle, Nook). |
| · | | Adaptive Learning: We offer certain courses that are adaptive, which enable individualized learning experiences as the course “adapts” at key points to student behavior and input. Based on assessment results or individual activity, these courses can automatically route students to an alternate explanation, additional practice or remediation on a prerequisite skill or crucial concept. In addition to remediation, the capability allows students to accelerate past previously mastered concepts, giving skillful students time for more challenging work. Our new Summit curriculum provides differentiated paths to our students depending on the mastery of specific objectives within the curriculum. Our MARK12 reading remediation product captures individual students’ successes and challenges as they practice phonemic awareness, alphabetic principles, accuracy and fluency, vocabulary and comprehension. The program serves the individual student more exercises, practice and review in areas of difficulty. Adaptation in this way tailors the instruction automatically for each student, making learning experiences more efficient and effective by building into the course the logic an expert teacher or tutor uses to differentiate instruction. |
| · | | Engaging Videos: We continue to explore opportunities to enhance student engagement through strategic use of relevant multimedia. For example, we introduce concepts in our Summit math curriculum with a 60 second video that illustrates the application of a specific math concept in practical applications to provide context for students. |
prerequisite skill or crucial concept. In addition to remediation, the capability allows students to accelerate past previously mastered concepts, giving skillful students time for more challenging work. Our MARK12 reading remediation product captures individual students' successes and challenges as they practice phonemic awareness, alphabetic principles, accuracy and fluency, vocabulary and comprehension. The program serves the individual student more exercises, practice and review in areas of difficulty. Adaptation in this way tailors the instruction automatically for each student, making learning experiences more efficient and effective by building into the course the logic an expert teacher or tutor uses to differentiate instruction.
•National Math Lab: The National Math Lab program has been designed to address students' math needs and to help them develop the necessary skills to succeed in math. The program works with students in grades 5 through 10 across all of the K12 network schools, who experience challenges in math and need supplemental support. National Math Lab provides nearly twice the usual amount of math instruction to students and in addition to their regular online math coursework, students attend targeted synchronous mathematical instruction sessions provided by highly-trained math teachers four days per week.
•Engaging Videos: We continue to explore opportunities to enhance student engagement through strategic use of relevant multimedia. Multimedia is specifically used as appropriate for the subject matter. For example, our video on photosynthesis for high school biology allows students to witness the setup, procedure and data in a classic experiment in which an aquatic plant is exposed to light and produces oxygen bubbles. The high definition video and the presentation to the student of real data (which they then use in their analysis) make this video lab a multimedia experience that is coupled with a scientific method. Transcripts and captioning enhance accessibility where currently feasible.
For our K12K12 curriculum users in grades K-8,K‑5 in school year 2016-17, we provideprovided a proprietary learning management system, our OLS platform. The OLS platform is a significant part of our ongoing effort to provide the most engaging anda productive learning experience for students. The OLS platform is an adaptive, intuitive, web-baseda web‑based software platform that provides access to our online lessons, our lesson planning and scheduling tools, and our progress tracking tool which serves a key role in assisting parents and teachers in managing each student'sstudent’s progress. The OLS platform is also the central system through which students, parents, teachers and administrators interact using Kmailan integrated email solution and Class Connect (our integrated synchronous session scheduler).
| · | | Lesson Planning and Scheduling Tools. During a school year, a typical full-time K-5 student will complete hundreds of lessons across six or more subject areas. In the OLS platform, our lesson planning and scheduling tools enable teachers and parents to establish an individualized plan for each student to complete his or her lessons. These tools are designed to dynamically update the lesson plan as a student progresses through each |
lesson and course, allowing flexibility to increase or decrease the pace at which the student advances through the curriculum while ensuring that the student progresses towards completion in the desired time frame. Moreover, changes can be made to the schedule at any point during the school year and the remainder of the student’s schedule will automatically be adjusted in the OLS platform. Unlike a traditional classroom education, our learning systems offer the flexibility for each student to take courses at different grade levels in a single academic year, providing flexibility for students to progress at their own level and pace within each subject area. The curriculum includes assessments built into every lesson to guide and tailor the pace of progress to each child’s needs. |
| · | | Progress Tracking Tools. Once a schedule has been established, the OLS platform delivers lessons based upon the specified parameters of the school and the teacher. Each day, a student is initially directed to a home page listing the schedule for that particular day and begins the school day by selecting one of the listed lessons. As each lesson is completed, the student returns to the day’s schedule to proceed to the next subject. If a student does not complete a lesson by the end of the day on which it was originally scheduled, the lesson will be rescheduled to the next day and will resume at the point where the student left off. Our progress tracking tool allows students, parents, learning coaches and teachers to monitor student progress. In addition, information collected by our tracking tool regarding attendance and other pertinent data are transferred to our proprietary TotalView system for use in providing administrative support services. This instructional program includes several processes and educational techniques that embrace proactive intervention. As a result, we can provide high quality instruction and intervention aligned to student needs. |
In fiscal year 2014, we completed nine major releasesentered into a strategic license agreement with Desire2Learn, a pioneer in next‑generation digital education systems and learning platforms. At the beginning of ourschool year 2015‑16, we implemented this new virtual learning platform intendedat the high schools we serve and we extended the platform to enhance the capabilities availablemiddle schools we serve in school year 2016-17. Similar to our learning coaches, increase teacher efficiency and drive overall academic achievement. We license a third-party learning management system for use in our high school program.
•Lesson Planning and Scheduling Tools. During a school year, a typical student will complete between 800 and 1,200 lessons across six or more subject areas. OurOLS platform, this new platform enables lesson planning, scheduling, tracking student progress and scheduling tools enable teachersconducting assessments. The platform is used by over 50 K‑12 organizations, and parents to establishprovides an individualized plan for eachindustry‑leading student to complete his or her lessons. These tools are designed to dynamically update the lesson plan as aexperience which should help us improve student progresses through each lessonengagement, retention and course, allowing flexibility to increase or decrease the pace at which the student advances through the curriculum while ensuring that the student progresses towards completion in the desired time frame. For example, the schedule can easily be adapted to accommodate a student who desires to attend school six days a week, a student who is interested in studying more during the winter holidays to take time off during the spring, or a student who chooses to complete two math lessons a dayoutcomes for the first month of the school yearManaged Public School Programs we serve.The new platform helps us deliver a more personalized experience to our students and delay art lessons until the second month of the school year. Moreover, changes can be made to the schedule at any point during the school year and the remainder of the student's schedule will automatically be adjusted in the OLS. Unlike a traditional classroom education, our learning systems offer the flexibility for each student to take courses at different grade levels in a single academic year,
Table of Contents
Our Furthermore, our learning systemsprograms make use of a variety of formative and summative assessment instruments:
•Lesson assessments are used | · | | Lesson assessments that verify mastery of the objectives for that lesson and help determine whether further study of the lesson is necessary. |
| · | | Unit assessments that show whether or not the student has retained key learning objectives for the unit, and identify specific objectives students may need to review before progressing. |
| · | | Semester assessments that verify student mastery of key learning objectives for the semester. |
The platform also provides additional tools and reports that enable teachers to verify mastery of the objectives for that lessonhave better insights into students’ progress and enable students to determine whether further study of the lesson is necessary.
•Unit assessments show whether or not the student has retained key learning objectives for the unit, and identify specific objectives students may need to review before progressing.
•Semester assessments verify student mastery of key learning objectives for the semester.
Independent third-party assessments are used in most of our managed schools to pinpoint specific individual student strengths and weaknesses relative to state standards. These results enable the teacher to develop a highly individualized learning plan for each student. Students are tested via an online, adaptive test at the beginning and end of the school year to provide a measure of individual student growth demonstrating the value-added gains of the school program.manage their day more effectively.
School Management SystemsTotalView
SAMSTotalView is our proprietary student information system. SAMSTotalView is integrated with the OLS, the Desire2Learn system, and several other proprietary systems including our online enrollment system that allows parents to complete school enrollment forms online and our Order Management System that generates orders for learning kits and computers to be delivered to students. SAMSTotalView stores student-specificstudent specific data and is used for a variety of functions, including enrolling students in courses, assigning progress marks and grades, tracking student demographic data, and generating student transcripts. Our systems also includeThe TotalView a suite of online applications that provides administrators, teachers, parents and students a unified view of student progress, attendance, communications, and learning kit shipment tracking. TotalView includes a sophisticated means of documenting student engagement in required classroom activities, identification of those students struggling with grade level state content standards, and previous year's performance on
state tests. TotalView also includes Kmail, our internal communications system. Through Kmail, administrators and teachers can communicate electronically with learning coaches and students. TotalView also includes an enrollment processing and tracking tool that allows us to closely monitor and manage the enrollment process for new students. Over the past several years, we have enhanced TotalView with additional functionality to better support the operation of the virtual and blended public schools.
PEAK
In fiscal year 2012, we launchedInstitutional business offers an innovative online learning solutionplatform called PEAK. This solutionPEAK and the PEAK Library. PEAK is a proprietary software system designed to simplifycentrally manage in a district's management ofsingle‑user interface multiple, independent online learning by consolidating multiple solutions on a single platform. It allows administratorsschool‑based functions. Schools can enroll and activate students, assign courses and teachers, and then manage the learning experience with easy to manage enrollments, programsuse reporting and performance tracking, alerts and reporting across multiple online solutions from a single solution.analytics on student progress. In addition, through the PEAK library, districtsLibrary, teachers can quicklybuild and easily search, build, provisionmodify assignments, assessments and publish content or course modifications or new coursecourses and can augment classroom instruction and develop lessons for sharing across the school district. PEAK also has the capability to support other third‑party solutions, using various online learning assets.open educational resources and district and teacher‑created content. In fiscal year 2014,2017, PEAK served nearly 900 school districts and school partners and more than 200,000nearly 400,000 students. As more districts adopt online learning, they are demanding more control and flexibility in runningmanaging their programs. PEAK provides unparalleledextensive capabilities for districts wanting to operate multiple solutions or catalogs from a single application and offers rich personalization features that can be managed at the district, school or teacher level.
Our Services
We offer a comprehensive suite of services to students and their families as well as directly to virtual and blended public schools, traditional schools and school districts. Our services can be categorized broadly intointo: academic support servicesservices; and management and technology services.
Academic Support Services
Teachers and Related Services. Teachers are critical to students'students’ educational success. TeachersMany teachers in the virtual and blended public schools that we manage are typically employed by the school, with the ultimate authority over these teachers residing with the school'sschool’s governing body. Underbody, including final hiring and termination decisions. As part of our service agreements, we oftentypically are engaged to recruit, train and provide management support for these school‑employed teachers. Historically, we have seen significant demand for teaching positions in the virtual and blended public schools that we manage. For our Institutional Salesbusiness customers, we provide instructors as needed using our staff of highly qualified and state-certifiedstate‑certified teachers and trainers.
We use a rigorous evaluation process for making teacher hiring recommendations to the schools we manage. We generally recruit teachers who, at a minimum, are state certified and meet each state'sstate’s requirements for designation as a "Highly“Highly Qualified Teacher," and generally have at least three years of teaching experience.Teacher.” We also seek to recruit teachers who have the skill set necessary to be successful in a virtual environment. Teaching in a virtual or blended public school is characterized by enhanced one-on-one student-teacherone‑on‑one student‑teacher and parent-teacherparent‑teacher interaction, so these teachers must have strong interpersonal communications skills. Additionally, a virtual or blended public school teacher must be creative in finding ways to effectively connect with their students and integrate themselves into the daily lives of the students'students’ families. We assess these teacher characteristics usingby requiring teachers to deliver and record a customizedsample lesson on our online assessmentplatform and answer questions both via video and essay as part of the hiring screening process. Throughout a teacher’s employment in a managed program, we provide tools for teacher management and evaluation. In most managed public schools, we are also piloting an instructional coaching program, where experienced teachers provide coaching to other teachers to help improve the quality of instruction in the schools.
New teachers participate in our comprehensive training program during which, among other things, they are introduced to our educational philosophy, our curriculum and our OLS and other technology applications, and are provided strategies for communicating and connecting with students and their families in a virtual environment. We also provide ongoing professional development opportunities for teachers so that they may stay abreast of changing educational standards, key learning trends, and sound pedagogical strategies which we believe enhance their teaching abilities and effectiveness.
Table of Contents
In addition to our compliance with state-mandated testing programs, we have instituted a student progress testing program in cooperation with Scantron, a third-party provider of standardized testing services. The results of this testing helps us manage the quality of our academic programs using widely recognized services from an industry-leading third party.
Advanced and Special Education Services. We believe that our learning systems are ablecan be appropriate to effectively address the educational needs of both advanced and special education students because they employ flexible teaching methods and students can use them at their own pace. For students requiring special attention, we employ a national director who is an expert on the delivery of special education services in a virtual or blended public school environment and who overseessupports the special education programs at the schools we serve. We directWhile compliance with federal and state special education laws resides primarily with our managed public school customers, we periodically review and, in cooperation with the schools,
may assist and facilitate the development and implementation of "individualized education plans"Individualized Education Plans for students with special needs and each school'sfor English Language Learners (“ELL”). Each student with special education program is designed to be compliant with the federal Individuals with Disabilities Education Act and all state special education requirements. Each special needs student is assigned a certified special education teacher and the school arranges for any required ancillary services, including speech and occupational therapy, and any required assistive technologies, such as special computer displays or speech recognition software. We support advanced and talented students through our advanced learner program. Advanced learners are able to participate in a wide variety of enrichment seminars, clubs, and mentoring opportunities. Advanced students are connected to each other across state boundaries through learning circles, book clubs, and other special-interest activities.
Supporting Academically At-RiskAt‑Risk Learners. Our objective is to narrow the achievement gap for those students who enter our virtual or blended public schools behind their same-agesame‑age peers. To that end, we conductstudents are given both formative and summative assessments during the course of the school year in order to identify those students needing specific remedial support as well asand measure the effectiveness of the support. We also offer the Passport schoola program which is designed for academically at-riskat‑risk students, particularly those who have previously dropped out of high school, and which includes more counseling and support services.
Student Support Services. We provide students attending virtual or blended public schools that we manage and their families with a variety of support services as a means to ensure that we effectivelyhelp them meet their educational needs and goals. We offer supportgoals, and to address any questions or concerns that students and their parents have during the course of their education. We plan and coordinate social events to offer students opportunities to meet and socialize with their school peers.peers where practical. Finally, in connection with our high school offering, each student is assigned a homeroom teacher, and/or an advisor and a guidance counselor who assists them with academic issues, college and career planning and other support as needed.
During school year 2016-17, we completed our two-year nationwide rollout of Students First. Students First is a series of programs that encompass the entire student experience, from on-boarding to personalized outreach to academic and support services for struggling students and surveys for gauging satisfaction and adapting support services.
We are also making substantial investments in our service offerings to improve student outcomes. For example, as part of our Strong Start student onboarding program, we offered a diagnostic assessment tool that a number of Managed Public School Programs have utilized to develop targeted instructional plans for new students who often start school with us before their academic records arrive. In addition, we offer the FAST program in many of the Managed Public School Programs. The purpose of FAST is to help students prepare for their online learning experience by assisting them with non-academic barriers.
Management and Technology Services
Turn-keyTurn‑key Services. For most of our managed statewide virtual and blended public schools,Managed Public School Programs, we provide turn-key management services. In these circumstances,a turn‑key suite of services whereby we take responsibility for all aspects of the management of the schools, including the provision of online curriculum and lesson materials, monitoring academic achievement, teacher hiring recommendations and training, compensation of school personnel, financial management and regulatory compliance, marketing and enrollment processingsupport, and provision of curriculum, equipmentcomputers and other required products and services.
Accreditation. In 2013, AdvancED renewed the Company'sour corporate accreditation for another five years. AdvancED is a non‑profit organization that serves more than 30,000 public and private schools and districts across the United States and isStates. It was created by the parent companymerger of the preK‑12 divisions of the North Central Accreditation Association Commission on Accreditation and School Improvement Northwest Accreditation Commission and the Southern Association of Colleges and Schools CommissionCouncil on Accreditation and School Improvement. TheImprovement, and the subsequent addition of the Northwest Accreditation Commission. Many of the schools we manage also maintain school accreditation through AdvancED and also through regional accreditations with other accrediting associations.
Table of Contents
Compliance and Tracking Services. Operating a virtual or blended public school entails many of the compliance and regulatory requirements of a traditional public school, as well as an applicable charter schoolprovisions or other requirements specifically adopted for online public schools. We have developed management systems and processes designed to track compliance with those requirements, including tracking appropriate student information and meeting various state and federal reporting, record keeping and privacy requirements for the schools we serve. For example, we collect enrollment related information, monitor attendance and administer proctored state tests. Further, as we have expanded into new states, our processes have grown increasingly robust. In fiscal year 2014, we hired acreated the position of Chief School Compliance Officer ("CSCO"(“CSCO”) to supplement and oversee school compliance. Among other responsibilities, our CSCO complements our corporate compliance and ethics function and reviews and advises our managed public schools on applicable regulatory
policies, practices and procedures. The CSCO reports semi-annuallyprovides a school compliance report semi‑annually to the Audit Committee, and annually toor more frequently on various matters as requested by the Board of Directors.Committee.
Financial Management Services. For the schools we manage, we oversee the preparation of the annual budget and coordinate with the school'sschool’s governing body to determine its annual objectives. In addition, we implement an internal control framework, develop policies and procedures, provide accounting services and payroll administration, oversee all federal entitlement programs, and arrange for external audits and ensure allsupport state and local financial compliance reporting is met.by the schools.
Facility, Operations and Technology Support Services. We generally operate administrative offices and all other facilities on behalf of the schools we manage. We provide these schools with a complete technology infrastructure. In addition, we provide a comprehensive help desk solution for students and school staff to address their computer or other technical issues.
Human Resources Support Services. We are actively involved in recruiting virtual and blended public school administrators, teachers and staff, through a thorough interview and orientation process. To better facilitate the hiring process, we review and analyze the profiles of teachers that have been highly effective in our managed public and blended schools learning systems to identify the attributes desired in future new hires. While many schools employ teachers directly, we also help negotiate and secure employment benefits and payroll services for school staff on behalf of the schools and administer employee benefit plans for school employees. Additionally, we assist the schools we serve in drafting and implementing administrative policies and procedures.
Competition
As a general matter, we face varying degrees of competition from a variety of education companies because the scope of our offerings and the customers we serve encompass many separate and distinct segments of the education business. We compete primarily with companies that provide online curriculum and school support services to K-12K‑12 virtual and blended public schools, and school districts. These companies include Pearson PLC (Connections Academy and Advanced Academics), White Hat Management, LLC,Lincoln Learning Solutions, Inspire Charter Schools, and National Network of DigitalCharter Schools Management Foundation Inc.,USA, among others. We also face competition from online and print curriculum developers. The online curriculum providers include Apex Learning Inc., Compass Learning Inc.,Curriculum Associates, Achieve 3000, Edgenuity Inc., Glynlyon, Inc., Edmentum Inc., Renaissance Learning, Inc., Rosetta Stone Inc. and traditional textbook publishers including Houghton Mifflin Harcourt, McGraw-HillMcGraw‑Hill Companies and Pearson PLC. Other competing online curriculum providers, including Khan Academy, Duolingo, IXL Learning, Inc. and LearnZillion, Inc., offer a “freemium” model which provides curriculum at no charge but charges for additional products or services and certain other providers. We also compete with institutions such as The Laurel Springs School (Nobel Learning Communities, Inc.) and Penn Foster Inc. for online private school students. Additionally, we compete with state-administeredstate‑administered online programs such as Florida Virtual School.
We believe that the primary factors on which we compete are:
•extensive experience in, and understanding of, K-12 virtual schooling;
•track record of student academic gains and customer satisfaction;
| · | | extensive experience in, and understanding of, K‑12 virtual schooling; |
| · | | track record of student academic gains and customer satisfaction; |
| · | | quality of integrated curriculum and materials with an online delivery platform; |
| · | | qualifications, experience and training teachers for online instruction; |
| · | | comprehensiveness of school management and student support services; |
| · | | platform designed to allow school district partners to centrally manage multiple online solutions; |
| · | | integrated K‑12 solutions, with components designed and built to work together; |
| · | | ability to scale across our lines of business; and |
| · | | sophisticated government affairs knowledge and experience in virtual school regulatory environments. |
quality of curriculum and online delivery platform;
•qualifications, experience and training teachers for online instruction;
•comprehensiveness of school management and student support services;
•platform designed to allow school district partners to centrally manage multiple online solutions;
•integrated K12 solutions, with components designed and built to work together;
•ability to scale across our lines of business; and
•competitive pricing.Broadly speaking, we participate in the market for K-12K‑12 education. In states where we enter into long-termlong‑term service agreements to manage virtual and blended public schools, we believe that we generally serve less than 1% of the public school students in that state. The customers for Institutional Salesbusiness are schools and school districts seeking individual courses to supplement their course catalogs or school districts seeking to offer an online education program to serve the needs of a small subset of their overall student population. Defining a more precise relevant market upon which to base a share estimate would not be meaningful due to significant limitations on the comparability of data among jurisdictions. For example, some providers to K-12K‑12 virtual public schools serve only high school students; others serve the elementary and middle school students, and a fewsome serve both. There are also providers of online virtual K-12K‑12 education that operate solely within individual states or geographic regions rather than globally as we do. Furthermore, some school districts offer their own virtual programs with which we compete. Parents in search of an alternative to their local public school have a number of alternatives beyond virtual and blended public schools, including private schools, public charter schools and home schooling. In our International and Private Pay schools, we compete for students seeking an English-based K-12English‑based K‑12 education worldwide, and we currently draw students from more than 100countries. In addition, our integrated learning systems consist of components that face competition from many different types of education companies, such as traditional textbook publishers, test and assessment firms and private education management companies. Finally, our learning systems are designed to operate domestically and internationally over the Internet, and thus the geographic market for many of our products and services is global and indeterminate in size.
Key Functional Areas
Public Affairs, School Development, Student Recruitment and Marketing
We seek to increase public awareness of the educational and fiscal benefits of individualizedour online learning options through full-time onlinefull‑time virtual and blended instructional models as well as supplementary course options. We receive numerous inquiries from school districts, legislators, public charter school boards, community leaders, state departments of education, educators and parents who express the desire to have a choice in public school options. Our public affairs and school development teams work together with these interested parties to identify and pursue opportunities to expand the use of our products and services in new and existing jurisdictions.
Our student recruitment and marketing team is responsiblefocused on promoting the K-12 online education category and generating enrollments for promoting our corporate brand, generating new student enrollments, managing the consumer sales business, conductingCompany’s virtual school customers within that category. This is achieved by creating awareness among families with K-12 students through integrated marketing campaigns that include offline and digital media, as well as web assets. These campaigns are continuously optimized using data analytics and market and customer research, defining, packaging and pricing our product offerings to customers, andresearch. In addition, the marketing team assists in enhancing the onboarding experience of new students enrolled in the schools we serve through the development and operation of student clubs and parent support opportunities. This team employs a variety of strategies designed to better understand and address the requirements of our target markets.
Table of Contentsonline schooling.
Operations
The physical learning kits that accompany our online lessons are an essential component of many of our courses. A student enrolling in one of our courses may receive multiple textbooks, art supplies, laboratory supplies (e.g. microscopes and scales) and other reference materials designed to enhance the learning experience. We package these books and materials into course-specificcourse‑specific learning kits. Because each student'sstudent’s curriculum is customized, the combination of kits for each student must also be customized. In fiscal year 2014, we assembled approximately 6.7 million items into more than 675,000 kits.
Over our 1417 years of operation, we believe that we have gained significant experience in the sourcing, assembly and delivery of school supplies and materials. We have developed strong relationships with partners allowing us to source goods at favorable price, quality and service levels. Our fulfillment partner stores our inventory, assembles our learning kits and ships the kits to students. We have invested in systems, including our Order Management System, to automatically translate the curriculum selected by each enrolled student into an order to build the corresponding individualized learning kit. As a result, we believe we have an end-to-endend‑to‑end warehousing and fulfillment operation that will cost-effectivelycost‑effectively scale as the business grows in scope and complexity.
For many of our virtual and blended public school customers, we attempt to reclaim any materials that could be cost-effectively re-utilizedcost‑effectively re‑utilized in the next school year. These items, once returned to our fulfillment centers, are refurbished and included in future learning kits. This reclamation process allows us to maintain lower materials costs. Our fulfillment activities are highly seasonal, and are centered on the start of school in August or September. Accordingly, approximately 65%
77% of our annual materials inventory is received between March and MayJune and approximately 65%73% of shipments to customers occur between June and September. In order to ensure that students in virtual and blended public schools have access to our OLS, we often provide students with a computer, where applicable or required and all necessary support. We source computers and ship them to students when they enroll and reclaim the computers at the end of a school year or upon termination of their enrollment or withdrawal from the school in which they are enrolled.
Technology
Our online learning systems, along with our back office support systems, are built on our proprietary Service Oriented Architecture ("SOA"(“SOA”) to ensure high availability and redundancy. The flexibility and security enabled by our SOA are the core principles of our systems'systems’ foundation.
Service Oriented Architecture. All of our systems leverage our SOA that is built on top of proven Enterprise Java.Technologies. The SOA allows us to develop iterative solutions expeditiously to meet both present and future market needs. Our high availability and scalability are also facilitated by this architecture. The SOA also enables seamless integration with third-partythird‑party solutions in our platform with ease and efficiency.
Availability and Redundancy. Our SOA allows for primary and secondary equipment to be utilized at all network and application tiers. Each application layer is load balanced across multiple servers, which, along with our sophisticated network management capabilities, allows for additional hardware to be inserted into our network providing us with optimal scalability and availability as evidenced by our typically greater than 99% uptime over a growing user base. We regularly backup critical data and store this backup data at an offsite location.
Security.Cybersecurity.Our securitycybersecurity measures and policies include dividing application layers into multiple zones controlled by firewall technology. Sensitive communications are encrypted between client and server and our server-to-serverserver‑to‑server accessibility is strictly controlled and monitored. We also have engaged an outside firm to manage unwantedassist with traffic that may target our services and systems. We protect sensitive information and meet regulatory and contractual commitments through policy and control governance that is validated on a semi‑annual basis. We maintain a layered security architecture and regularly retain third parties to test our networks, servers and applications for vulnerabilities. We manage a business‑centric information security program that is tailored for our constantly changing IT compliance and information security threat landscape.
Physical Infrastructure. We utilize leading vendors to provide a foundation for our SOA. Our systems are housed offsite in data centers that provide a robust, redundant network backbone, power and
Table of Contents
geographically separated disaster recovery. Our second data center, geographically separated from our primary center, operates as a ready business continuity site with secured, near-realnear‑real time data replication from our primary data center. We vigilantlyroutinely monitor our physical infrastructure for security, availability and performance.
Other Information
Intellectual Property
We continue to invest in our intellectual property as we develop more courses for new grades and expand into adjacent education markets, both in the United States and overseas. Through acquisitions, we have also acquired curriculum, patents and trademarks that expand our portfolio of educational products and services. We continue to add features and tools to our proprietary learning platform and support systems to assist teachers and students and improve educational outcomes, such as adaptive learning technologies. These intellectual property assets are critical to our success and we avail ourselves of the full protections provided under the patent, copyright, trademark and trade secrets laws. We also routinely utilize confidentiality and licensing agreements with our employees, the virtual and blended public schools, traditional schools, school districts and private schools that we serve, individual consumers, contractors and other businesses and persons with which we have commercial relationships.
Our patent portfolio includes issued patents and pending applications directed towards various aspects of our educational products and offerings. In particular, the first family of patent applications we filed in the U.S. and in foreign countries was directed towards the first generation of our system and method of virtual schooling and includes two issued patents. Further, two U.S. patents were issued for our systems and methods of online foreign language instruction. We
have submitted patent applicationsbeen issued patents in the United States and in a foreign countriescountry for aspects of the second generation of our virtual school application, and one U.S. patent has been issued.application.
We own and register the copyrightcopyrights to the lessons contained in the courses that comprise our proprietary curriculum and we continue to register this growing lesson portfolio with the U.S. Copyright Office.curriculum. We also have obtained federal and state registrations for numerous trademarks that are related to our offerings and we have applied to the U.S. Patent and Trademark Office to register certain new trademarks. As a result of the acquisitions we have made, we also own U.S. and foreign trademarks and a portfolio of domain names.
We grant licenses to individuals to use our software in order toand access our online learning systems. Similarly, schools are granted a licenselicenses to useutilize our online learning systems in orderand to access SAMSTotalView and our other systems. These licenses are intended to protect our ownership and the confidentiality of the embedded information and technology contained in our software and systems. We also own many of the trademarks and service marks that we use as part of the student recruitment and branding services we provide to schools. Those marks are licensed to the schools for use during the term of the products and services agreements.
Our employees, contractors and other parties with access to our confidential information sign agreements that prohibit the unauthorized use or disclosure of our proprietary rights, information and technology.
Employees
As of June 30, 2014,2017, we had approximately 4,2004,750 employees, including approximately 2,2002,500 teachers. A majoritySubstantially all of these employees are located in the United States. In addition, there are approximately 3,0002,200 teachers who are employed by virtual or blended public schools that we manage under turn-keyturn‑key solution contracts with those schools but are not direct employees of K12. None of our employees are represented by a labor union or covered by a collective bargaining agreement; however, certain managed public schools we serve employ unionized teachers. We believe that our employee relations are good.
Table of Contents
Corporate Information
Our principal executive office is located at 2300 Corporate Park Drive, Herndon, Virginia 20171 and our telephone number is (703) 483-7000.483‑7000. Our website address is www.K12.com.
Available Information
We make available, free of charge through our website, our annual reports on Form 10-K,10‑K, quarterly reports on Form 10-Q,10‑Q, current reports on Form 8-K,8‑K, and amendments to those reports filed pursuant to Section 13(a) or 15(d) of the Securities Exchange Act of 1934, as amended (the "Exchange Act"“Exchange Act”), promptly after they are electronically filed with the Securities and Exchange Commission (the "SEC"“SEC”). Our earnings conference calls are web cast live via our website. In addition to visiting our website, you may read and copy public reports we file with the SEC at the SEC'sSEC’s Public Reference Room at 100 F Street, N.E., Washington D.C. 20549, or at www.sec.gov. You may obtain information on the operation of the Public Reference Room by calling the SEC at 1-800-SEC-0330.1‑800‑SEC‑0330. Information contained on our website is expressly not incorporated by reference into this Annual Report.
REGULATION
Table of Contents
REGULATION
We and the virtual and blended public schools that we serve are subject to regulation by and laws of each of the states in which we operate. The state laws and regulations that impact our business are primarily those that authorize or restrict our ability to operate these schools, as well as the applicable funding mechanisms.mechanisms for the schools. To the extent these schools receive federal funds, such as through a grant program or financial support dedicated for the education of low-incomelow‑income families, these schools also become subject to additional federal regulation.
State Laws Authorizing or Restricting Virtual and Blended Public Schools. The authority to operate a virtual or blended public school is dependent on the laws and regulations of each state. Laws and regulations vary significantly from one state to the next and are constantly evolving. In states that have implemented specific legislation to support virtual and blended public schools, the schools are able to operate under these statutes. Other states provide for virtual and blended public schools under existing public charter school legislation or provide that school districts and/or state education agencies may authorize them. Some states do not currently have legislation that provides for virtual and blended public
schools or have requirements that effectively prohibit such schools and, as a result, may require new legislation before virtual and blended public schools can open in the state. We currently serve
Obtaining new legislation in the remaining states where we do not have virtual and blended public schools or school district-led programs in 33 states plus the District of Columbia.
Obtaining new legislation in these remaining states can be a protracted and uncertain process. When determining whether to pursue expansion into new states in which the laws are ambiguous, we research the relevant legislation and politicalpolicy climate and then make an assessment of the perceived likelihood of success before deciding to commit resources. Specifically, we take into account numerous factors including, but not limited to, the regulations of the state educational authorities, whether the overall politicalpolicy environment is amenable to school choice, whether current funding levels for virtual school and blended schools enrollments are adequate and accessible, and the presence of non-profitnon‑profit and for-profitfor‑profit competitors in the state.
State Laws and Regulations Applicable to Virtual and Blended Public Schools. Virtual and blended public schools that purchase our curriculum and management services are often governed and overseen by a non-profitnon‑profit or a local or state education agency, such as an independent public charter school board, local school district or state education authority. We generally receive funds for products and services rendered to operate virtual public schools or blended schools under detailed service agreements with that governing authority. Virtual and blended public schools are typically funded by state or local governments on a per student basis. A virtual or blended public school that fails to comply with the state laws and regulations applicable to it may be required to repay these funds and could become ineligible for receipt of future state funds.
To be eligible for state funding, some states require that virtual and blended public schools be organized under not-for-profitas not‑for‑profit charters exempt from taxation under Section 501(c)(3) of the Internal Revenue Code of 1986, as amended (the "Code"“Code”). The schools must then be operatedorganized exclusively for charitable educational purposes, and not for the benefit of private, for-profitfor‑profit management companies. The board or governing authority of the not-for-profitnot‑for‑profit virtual or blended public school must retain ultimate accountability and control for the school'sschool’s operations to retain its tax-exempttax‑exempt status. It may not delegate its responsibility and accountability for the school'sschool’s operations. Our service agreements with these virtual and blended public schools are therefore structured to ensure the full independence of the not-for-profitnot‑for‑profit board and preserve its arms-lengtharms‑length ability to exercise its fiduciary obligations to operate a virtual or blended public school.
Laws and regulations affect many aspects of operating a virtual or blended public school. They can dictate the content and sequence of the curriculum, the methods for counting student enrollments for funding purposes, graduation requirements, to earn a diploma, use of approved textbooks, the length of the school year and the school day, the accessibility of curriculum and technology to students with disabilities, teacher:teacher to student ratios, specific credentialing of teachers and administrators, the assessment of student performance and any
Table of Contents
accountability requirements. In addition, a virtual or blended public school may be obligated to comply with states'states’ requirements to offer programs for specific populations, such as students at risk of dropping out of school, advanced and talented students, non-Englishnon‑English speaking students, pre-kindergartenpre‑kindergarten students and students with disabilities. Tutoring services and the use of technology may also be regulated. Other state laws and regulations may affect the school'sschool’s compulsory attendance requirements, treatment of absences and make-upmake‑up work, and access by parents to student records and teaching and testing materials. Additionally, states have various requirements concerning
In addition to federal laws protecting the privacy and reporting of extensivestudent education records, a growing number of states are enacting laws to protect the privacy of student data that may applyand to guard against its misuse. As a general matter these laws are designed to prevent third‑party vendors to schools from using student data for non‑educational purposes and ensuring the school. Asecurity of personally identifiable information. In addition, virtual or blended public schoolschools may have to comply with state requirements that school campuses report various types of data as performance indicators of the success of the program.
States have laws and regulations concerning certification, training, experience and continued professional development of teachers and staff with which a virtual or blended public school may be required to comply. There are also numerous laws pertaining to employee salaries and benefits, statewide teacher retirement systems, workers'workers’ compensation, unemployment benefits and matters related to employment agreements and procedures for termination of school employees. A virtual or blended public school must also comply with requirements for performing criminal background checks on school staff, reporting criminal activity by school staff and reporting suspected child abuse.
As with any public school, virtual and blended public schools must comply with state laws and regulations applicable to governmental entities, such as open meetings or sunshine laws, which may require the board of trustees of a virtual or blended public school to provide advance public notice of and hold its meetings open to the public unless an
exception in the law allows an executive session. Failure to comply with these requirements may lead to personal civil and/or criminal penalties for board members or officers or the invalidation of actions taken during meetings that were not properly noticed and open to the public. Virtual and blended public schools must also comply with public information or open records laws, which require them to make school records available for public inspection, review and copying unless a specific exemption in the law applies. Additionally, laws pertaining to records privacy and retention and to standards for maintenance of records apply to virtual and blended public schools.
Other types of regulation applicable to virtual and blended public schools include restrictions on the use of public funds, the types of investments made with public funds, the collection of and use of student fees, and controlling accounting and financial management, and marketing practices.
There remains uncertainty about the extent to which virtual and blended public schools we serve may be required to comply with state laws and regulations applicable to traditional public schools because the concept of virtual and blended public schools is still relatively new.evolving, especially as technology advances. Although we receive state funds indirectly, according to the terms of each service agreement with the local public school entity, our receipt of state funds subjects us to extensive state regulation and scrutiny. States routinely conduct audits of these schools, to verify enrollment, attendance, information technology security, fiscal accountability, special education services and other regulatory issues. While we may believe that a virtual public school or blended school we serve is compliant with state law, an agency'sagency’s different interpretation of law in a particular state, or the application of facts to such law, could result in findings of non-compliance,non‑compliance, potentially affecting future funding or repayment of past funding.
Regulations Restricting Virtual and Blended Public School Growth and Funding. As a public schooling alternative, some state and regulatory authorities have elected to proceed cautiously with virtual and blended public schools while providing opportunities for taxpayer families seeking this alternative. RegulationsStatutes, regulations or policies that control the growth of virtual and blended public schools range from setting caps on statewide student enrollments, to prescribing the number of schools in a state, to limiting the percentage of time students may receive instruction online. Funding regulations can also have this effect.
RegulationsStatutes or regulations that hinder our ability to serve certain jurisdictions include: restrictions on student eligibility, such as mandating attendance at a traditional public school prior to enrolling in a virtual or blended public school; caps on the total number of students in a virtual or blended public school;
Table of Contents
restrictions on grade levels served; geographic limitations on enrollments; fixing the percentage of per pupil funding that must be paid to teachers; state-specificstate‑specific curriculum requirements; and limits on the number of charters that can be granted in a state.
Funding regulations for virtual public schools and blended schools can take a variety of forms. These regulations include: (i) attendance—some state daily attendance rules were designed for traditional classroom procedures, and applying them to track daily attendance and truancy in an online setting can cause disputes to arise over interpretation and funding; (ii) enrollment eligibility—some states place restrictions on the students seeking to enroll in virtual and blended public schools, resulting in lower aggregate funding levels; and (iii) teacher contact time—some states have regulations that specify minimum levels of teacher-student face-to-face time.teacher‑student face‑to‑face time; and (iv) completion of course work. These regulations can create logistical challenges for statewide virtual and blended public schools, reduce funding and eliminate some of the economic, academic and technological advantages of virtual learning.
Federal and State Grants. We have worked with some entities to secure public and grant funding that flows to virtual and blended public schools that we serve. These grants are awarded to the not-for-profitnot‑for‑profit entity that holds the charter of the virtual or blended public school on a competitive basis in some instances and on an entitlement basis in other instances. Grants awarded to public schools and programs—whether by a federal or state agency or nongovernmental organization—often include reporting requirements, procedures and obligations.
Foreign Laws and Regulations. Schools we operate in other countries are subject to local laws and regulations. We oversee and rely on the administrators in each school on a continuous basis and seek the advice of local legal and regulatory experts as-needed.as‑needed.
Federal Laws Applicable to Virtual Public Schools and Blended Schools
Five primary federal laws are directly applicable to the day-to-dayday‑to‑day provision of educational services we provide to virtual and blended public schools:
No Child Left BehindEvery Student Succeeds Act ("NCLB"(“ESSA”). The Every Student Succeeds Act, which took effect on August 2, 2016 and NCLB Waivers. Throughis authorized through 2020, represents a major change in federal education law by shifting education policy decision making back to the states and by providing most funding ofthrough block grants. Of particular significance to the Title I programs for disadvantaged students underCompany is that the Elementary and Secondary Education Act ("ESEA"), as amended by NCLB,states will now have the federal government requires public schoolsdiscretion to develop a stateand design their own accountability system based on academic standards and assessments developed bysystems. In addition, states have been given the state. Each state must determine a proficiency levelauthority to adopt different types of academic achievement based on the state assessments, and must determine what constitutes adequate yearly progress ("AYP") toward that goal. NCLB set a deadline to ensure that no later than the 2013-14 school year, 100% of students, including those in all identified subgroups (such as economically disadvantaged, limited English proficient and minority students), must meet or exceed the state proficient level of academic achievement on state assessments. If a Title I school does not make adequate yearly progress as defined in the state's plan, the local education agency ("LEA") is required to identify the school as needing school improvement, which triggers a series of mandated consequencesannual accountability frameworks for school improvement, such as an optionperformance, including proficiency and growth standards for all students to transfer to another public school served by the LEA, which may include a virtual or blended public school. If the school does not make adequate yearly progress in subsequent years, other corrective action must be taken including, but not limited to, providing supplemental education services to the students who remain in the school, replacing school staff, implementing a new curriculum, extending the school year or the school day, reopening the school as a public charter school with a private management company or turning over the operation of the school to the state educational agency.
Beginning in 2011, it becameand subgroups. The ESSA makes clear that the NCLB goal of 100% of students reaching proficiency by 2014 was unrealistic, among other learned shortcomings in the law, and the U.S. Department of Education ("DOE") announcedhas a policymore limited role to impose federal mandates, direction or control over the authority given to the states. Finally, there are provisions that would allowprovide significant grants to support the start-up of new charter schools with priority to states that serve at‑risk students through dropout prevention and recovery and other grants to applysupport language instruction for waivers of certain NCLB requirements, including the key accountability provisions,English language learners and immigrant students. Notwithstanding these federal limitations, states are still required under ESSA to test students in exchange for agreeing to new principled-based reforms. To
Table of Contents
qualify for an NCLB waiver, a state must: (i) adopt college and career-ready standards for reading or language arts and math (with assessment standards that measure student achievement growth), (ii) establish annual measurable objectives ("AMOs") that can include different target achievement levels for different districts, schools or student groups, (iii) developannually in grades 3-8 and implement teacheronce in grades 10-12, and principal evaluation and support systems, and (iv) evaluate and remove duplicative and burdensome state reporting requirements.
As of July 2014, 42 states plus the District of Columbia have obtained NCLB waivers, as well as eight school districts in California after their state application was denied. Only four states have not applied for waivers and waivers are pending for two states. Of the 33 states and the District of Columbia where we currently serve studentsscience once in Managed Public Schools, 29 states and the District of Columbia have received waivers from the DOE. Of the remaining four jurisdictions where we manage schools, Wyoming and Iowa are pursuing waivers. California has chosen not to continue pursuing a waiver, and Washington had its waiver revoked in April 2014.
Another provisioneach of the NCLB requires public school programsfollowing grade spans: 3-5, 6-9 and 10-12. States have until September 2017 to ensure that all teachers are highly qualified in core subjects. A highly qualified teacher means one who has: (i) obtained full state certification or licensure as a teacher and who has not had certification or licensure requirements waived on an emergency, temporary or provisional basis; (ii) obtained a bachelor's degree; and (iii) demonstrated competence insubmit plans to the academic subject the teacher teaches. All teacher aides working in a school supportedU.S. Department of Education to demonstrate compliance with Title I funds must be highly qualified which means the person must have a high school diploma or its equivalent and one of the following: completed at least two years of study in an institution of higher education, obtained an associate's or higher degree, or met a rigorous standard of quality demonstrated through a formal state or local assessment. Virtual and blended public schools using our products and services may be required to meet these requirements for any persons who perform instructional services.ESSA.
Under NCLB, even schools that do not receive Title I funding must provide certain notices to parents. For example, schools may be required to provide a school report card and identify whether any school has been identified as needing improvement and for how long. Parents also must be provided data that will be used to determine adequate yearly progress. Virtual and blended public schools may be contacted by military recruiters who have the right to access the names, addresses and telephone numbers of secondary school students for military recruiting purposes. Additionally, virtual public schools and blended schools may be required to notify parents that they have the option to request that this information not be released to military recruiters or to institutions of higher education.
•- Individuals with Disabilities Education Act
("IDEA"(“IDEA”). The IDEA is implemented through regulations governing every aspect of the special education of a child with one or more of the specific disabilities listed in the Act. The IDEA created a responsibility on the part of a school to identify students who may qualify under the IDEA and to perform periodic assessments to determine the students'students’ needs for services. A student who qualifies for services under the IDEA must have in place an individual education plan, which must be updated at least annually, created by a team consisting of school personnel, the student, and the parent. This plan must be implemented in a setting where the child with a disability is educated with non-disablednon‑disabled peers to the maximum extent appropriate. The Act provides the student and parents with numerous due process rights relating to the student'sstudent’s program and education, including the right to seek mediation of disputes and make complaints to the state education agency. The schools we manage are responsible for ensuring the requirements of this Act are met. The virtual public schools and blended schools could beare required to comply with certain requirements in the Act concerning teacher certification and training. We, the virtual public school or the blended school could be required to provide additional staff, related services and supplemental aids and services at our own cost to comply with the requirement to provide a free appropriate public education to each child covered under the IDEA. If we fail to meet this requirement, we, the virtual public school or blended school could lose federal funding and could be liable for compensatory educational services,
Table of Contents
•Communications Decency Act. The Communications Decency Act of 1996 ("CDA"(“CDA”) provides protection for online service providers against legal action being taken against them because of certain actions of others. For example, the CDA states that no provider or user of an interactive computer service shall be treated as the publisher or speaker of any data given by another provider of information content. Further, Section 230 of the CDA grants interactive online services of all types, broad immunity from tort liability so long as the information at issue is provided or posted by a third party. As part of our technology services offering, we provide an online school platform on which teachers and students may communicate. We also conduct live classroom sessions using Internet-basedInternet‑based collaboration software and we may offer certain online community platforms for students and parents. While the CDA affords us with some protection from liability associated with the interactive online services we offer, there are exceptions to the CDA that could result in successful actions against us that give rise to financial liability. If we fail to comply with otherOther Federal Laws. Other federal laws including federal civil rights laws not specificalso apply to virtual managed schools, in some cases depending on the demographics associated with a school. For example, Title VI of the Civil Rights Act of 1964 has been deemed to apply to ELL Students, as further defined in the joint guidance issued by the U.S. Departments of Justice and Education in January 2015. Title IX of the Education Amendments of 1972 also applies, which prohibits discrimination on the basis of gender in education programs, we could be determined ineligibleactivities and employment, applies to all schools that receive funds from federal programs or face criminal or civil penalties. Finally, therefunds. There are also other federal laws and regulations that affect other aspects of our business such as the identify theft rules adopted by the Federal Trade Commission and for which we have adopted policies to ensure compliance.
The Children’s Internet Protection Act requires that school districts that receive certain types of federal funding must ensure that they have technology which blocks or filters certain material from being accessed through the Internet. We have developed procedures by which computers that we ship to students meet this requirement. If we fail to comply with these and other federal laws, we could be determined ineligible to receive funds from federal programs or face penalties.
Table of Contents
ITEM 1A. RISK FACTORS
Risks Related to Government Funding and Regulation of Public Education
MostThe majority of our revenues come from Managed Public School Programs and depend on per pupil funding amounts and payment formulas remaining near the levels existing at the time we execute service agreements with the Managed Public Schoolsmanaged public schools we serve. If those funding levels or formulas are materially reduced or modified due to economic conditions or political opposition, new restrictions adopted or payments delayed, our business, financial condition, results of operations and cash flows could be adversely affected.
The public schools we contract with are financed with government funding from federal, state and local taxpayers.Our business is primarily dependent upon those funds. Budget appropriations for education at all levels of government are determined through the politicala legislative process, which may also be affected by negative views of for‑profit education companies or conditions in the economy at large, such as the recessionary climate in the United States which led to budgetary pressures on state and local governments from 2008-20132008‑13 and significant declines in public school funding. The results of federal and state elections can also result in shifts in education policy and the amount of funding available for various education programs.
The political process and potential variability in general economic conditions create a number of risks that could have an adverse effect on our business including the following:
•Legislative proposals can and have resulted in budget or program cuts for public education, including the virtual and blended public schools and school districts we serve, and therefore have reduced and could potentially limit or eliminate the products and services those schools purchase from us, causing our revenues to decline. From time to time, proposals are introduced in state legislatures that single out virtual and blended public schools for disparate treatment.
•Economic conditions could reduce state education funding for all public schools, and could be disproportionate for the Managed Public Schools we serve. Our annual revenue growth is impacted by changes in federal, state and district per pupil funding levels. For example, due to the budgetary problems arising from the recession, many states reduced per pupil funding for public education affecting many of the public schools we serve, including even abrupt mid-year cuts in certain states, which in some cases were retroactively applied to the start of the school year as a result of formulaic adjustments. In addition, as we enter into service agreements with multiple Managed Public Schools in a single state, the aggregate impact of funding reductions applicable to those schools could be material. We have service agreements with 15 schools in California, for example, and while each school is independent with its own governing authority and no single Managed Public School accounts for more than ten percent of our revenue, regulatory actions that affect the level or timing of payments for all similarly situated schools in that state could adversely affect our financial condition. At this time, many states still have budget issues. The specific level of federal, state and district funding for the coming years is not yet known and, taken as a whole, it is reasonable to believe that a number of the public schools we serve could experience lower per pupil enrollment funding, while others may increase funding as the economic conditions improve.
•As a public company, we are required to file periodic financial and other disclosure reports with the SEC. This information may be referenced in the legislative process, including budgetary considerations, related to the funding of alternative public school options, including virtual public schools and blended schools. The disclosure of this information by a for-profit education company, regardless of parent satisfaction and student performance, may nonetheless be used by opponents of virtual and blended public schools to propose funding reductions or restrictions.
•From time to time, government funding to schools is not provided when due, which sometimes causes the affected schools to delay payments to us for our products and services. These payment delays have occurred in the past and can deprive us of significant working capital until the matter is resolved, which could hinder our ability to implement our growth strategies and conduct our business. For example, in fiscal year 2012, due to shortfalls in its general revenue funds, California
| · | | Legislative proposals can and have resulted in budget or program cuts for public education, including the virtual and blended public schools and school districts we serve, and therefore have reduced and could potentially limit or eliminate the products and services those schools purchase from us, causing our revenues to decline. From time to time, proposals are introduced in state legislatures that single out virtual and blended public schools for disparate treatment. |
| · | | Economic conditions could reduce state education funding for all public schools, the effects of which could be disproportionate for the managed public schools we serve. Our annual revenue growth is impacted by changes in federal, state and district per pupil funding levels. For example, due to the budgetary problems arising from the recession, many states reduced per pupil funding for public education affecting many of the public schools we serve, including even abrupt mid‑year cuts in certain states, which in some cases were retroactively applied to the start of the school year as a result of formulaic adjustments. In addition, as we enter into service agreements with multiple managed public schools in a single state, the aggregate impact |
of funding reductions applicable to those schools could be material. We have management agreements with 14 schools in California, for example, and while each school is independent with its own governing authority and no single school in California accounts for more than 10% of our revenue, regulatory actions that affect the level or timing of payments for all similarly situated schools in that state could adversely affect our financial condition. The specific level of federal, state and local funding for the coming years is not yet known for specific states and, when taken as a whole, it is reasonable to believe that a number of the public schools we serve could experience lower per pupil enrollment funding, while others may increase funding, as economic conditions or political conditions change. |
| · | | As a public company, we are required to file periodic financial and other disclosure reports with the SEC. This information may be referenced in the legislative process, including budgetary considerations, related to the funding of alternative public school options, including virtual public schools and blended schools. The disclosure of this information by a for‑profit education company, regardless of parent satisfaction and student performance, may nonetheless be used by opponents of virtual and blended public schools to propose funding reductions or restrictions. |
| · | | From time to time, government funding to schools and school districts is not provided when due, which sometimes causes the affected schools to delay payments to us for our products and services. These payment delays have occurred in the past and can deprive us of significant working capital until the matter is resolved, which could hinder our ability to implement our growth strategies and conduct our business. For example, in fiscal year 2016, the Commonwealth of Pennsylvania was unable to approve a budget, including funding for public school education, by its deadline of June 30, 2015, and thus the Agora Cyber Charter School received no funds and could not make timely contractual payments to the Company for our products and services, even though we continued to incur the costs to keep the school operating. The Commonwealth’s budget impasse was resolved in March of 2016, resulting in a settlement agreement executed in June 2016, which provided for the payment of overdue invoices in installments. |
announced that it would be deferring its per-student attendance paymentsFailure to all public schools until early fiscal year 2013, which significantly increased our accounts receivable balance.
Thecomply with regulatory requirements, poor academic performance, or misconduct by us or operators of other virtual public schools, public school district virtual learning programs or blended schools could tarnish the reputation of all the school operators in our industry, which could have a negative impact on our business.business or lead to punitive legislation.
As a non-traditionalnon‑traditional form of public education, online public school operators will be subject to scrutiny, perhaps even greater than that applied to traditional brick and mortar public schools or public charter schools. Not all virtual public school, school district virtual learning program or blended school operatorsschools will have successful academic programs or operate efficiently, and new entrants may not perform well either. Such underperformance could create the impression that virtual schooling is not an effective way to educate students, whether or not our learning systems achieve satisfactory performance. Consistently poor academic performance, or the perception of poor performance, could also lead to termination of an approved provider status in some jurisdictions. jurisdictions, or to passage of legislation empowering the state to restructure or close low-performing schools, such as legislation enacted in Tennessee in 2013 with academic performance criteria applying only to virtual schools.
Beyond academic performance issues, some virtual school operators, including us, have been subject to governmental investigations alleging, among other things, false attendance reporting, the misuse of public funds or financial irregularities.failures in regulatory compliance. These allegations have attracted significant adverse media coverage and have prompted legislative hearings and regulatory responses. Although these investigationsInvestigations have focused on specific companies and individuals, or even entire industries, such as the industry‑wide investigation of for‑profit virtual schools initiated by the Attorney General of California in the case of for-profit higher education companies, they may negatively impact public perceptions of virtual public schools, public school district virtual learning programs or blended school providers generally, including us.2015. The precise impact of these negative public perceptionsgovernmental investigations on our current and future business is difficult to discern, in part because of the number of states in which we operate, and the range of particularpurported malfeasance or performance issues involved. We have incurred significant costs in several states advocating against harmful legislation which, in our opinion, was aggravatedinvolved, or interest by negative media coverage about us or other operators.state regulatory authorities. If these few situations, or any additional alleged misconduct, cause all virtual public school, school district virtual learning program and blended school providersschools to be viewed by the public and/or policymakers unfavorably, we may find it difficult to expand into new states or enter into or renew our contracts to operate virtual or blendedmanage these schools. In addition, this perception could serve as the impetus for more restrictive legislation, which could limit our future business opportunities, such as the recent restrictions enacted in Tennessee which cap enrollment growth in schools with weak academic performance.
Opponents of virtual and blended public charter schools have sought to challenge the establishment and expansion of such schools through the judicial process. If these interests prevail, it could damage our ability to sustain or grow our current business or expand in certain jurisdictions.
We have been, and will likely continue to be, subject to public policy lawsuits filed against virtual and blended charter schools by those who do not share our belief in the value of this form of public education.education or the involvement of
for-profit education management companies. Whether or not we are a named party to these lawsuits, legal claims have involved challenges to the constitutionality of authorizing statutes, methods of instructional delivery, funding provisions and the respective roles of parents and teachers. ForAlthough stayed by court order in 2017, for example, in 2014, the New Jersey EducationLouisiana Association of Educators, the state affiliate of a national teachers union, successfully challenged the grantconstitutionality of astate funding to certain types of charter to the Newark Preparatory Charter School that was contracting with us for educational products and services. The court denied the union's challenge and sustained the grant of the charter.In the Matter of the Grant of a Charter to the Merit Preparatory Charter Sch. and in the Matter of the Grant of a Charter to the Newark Preparatory Charter Sch., 435 N.J. Super. 273 (App Div. 2014)
Table of Contentsschools.
Should we fail to comply with the laws and regulations applicable to theour Managed Public SchoolsSchool Programs and the Institutional Sales districts we serve,business, such failures could result in a loss of public funding and an obligation to repay funds previously received, which could adversely affect our business, financial condition and results of operations.
Once authorized by law, virtual and blended public schools are generally subject to extensive regulation, as are the school districts served by our Institutional Sales business. These regulations cover specific program standards and financial requirements including, but not limited to: (i) student eligibility standards; (ii) numeric and geographic limitations or caps on enrollments; (iii) state-specificstate‑specific curriculum requirements;requirements and standards; (iv) restrictions on open-enrollmentopen‑enrollment policies by and among districts; (v) prescribed teacher:teacher to student ratios and teacher funding allocations from per pupil funding; and (vi) teacher certification and reporting requirements. State and federal funding authorities conduct regular program and financial audits of the public schools we serve to ensure compliance with applicable regulations. If a final determination of non-compliancenon‑compliance is made, additional funds may be withheld which could impair that school'sschool’s ability to pay us for services in a timely manner, or the school could be required to repay funds received during the period of non-compliance.non‑compliance. Additionally, the indemnity provisions in our standard service agreements with virtual and blended public schools and school districts may require us to return any contested funds on behalf of the school.
Virtual and blendedAs an emerging form of public schools are relatively new, andeducation with unique attributes, enabling legislation thereforefor online public schools is often ambiguous and subject to discrepancies in interpretation by regulatory authorities, which may lead to disputes over our ability to invoice and receive payments for services rendered.
Statutory language providing for virtual and blended public schools is sometimes interpreted by regulatory authorities in ways that may vary from year to year making compliance subject to uncertainty. More issues normally arise during our first few school years of doing business in a state because thesuch state’s enabling legislation often does not address specific issues, such as what constitutes proper documentation for enrollment eligibility or attendance reporting in a virtual or blended school. From time to time there are changes to the regulators'regulators’ approach to determining the eligibility of virtual or blended school students for funding purposes. Another issue may be differing interpretations on what constitutes a student'sstudent’s substantial completion of a semester in a public school.school or daily attendance requirements. These regulatory uncertainties may lead to disputes over our ability to invoice and receive payments for services rendered or to disputes with auditors of managed public schools, which could adversely affect our business, financial condition and results of operations.
The operation of virtual and blended public charter schools depends on the maintenance of the authorizing charter and compliance with applicable laws. If these charters are not renewed, our contracts with these schools would be terminated.
In many cases, virtual and blended public schools operate under a charter that is granted by a state or local authorizer to the charter holder, such as a community group or an established not-for-profitnot‑for‑profit corporation, which typically is required by state law to qualify for student funding. In fiscal year 2014,2017, approximately 88%83% of our revenue was derived from Managed Public Schools,School Programs, the majority of which were virtual and blended public schools operating under a charter. The service agreement for these schools is with the charter holder or the charter board. Non-profitNon‑profit public charter schools qualifying for exemption from federal taxation under Code Section 501(c)(3) as charitable organizations must also operate on an arms-lengtharms‑length basis in accordance with Internal Revenue Service rules and policies to maintain that status and their funding eligibility. In addition, all state public charter school statutes require periodic reauthorization. If a virtual or blended public school we manage fails to maintain its tax-exempttax‑exempt status and funding eligibility, fails to renew its charter, or if its charter is revoked for non-performancenon‑performance or other reasons that may be due to actions of the independent charter board completely outside of our control, our contract with that school would be terminated. For example, in fiscal year 2017, the State of New Jersey revoked the charter for the Newark Preparatory Charter School, and school boards in Florida decided to close the Florida Cyber Charter Academy at Hillsborough and the Florida Cyber Charter Academy at Pinellas.
Actual or alleged misconduct by our senior management and directors or officials could make it more difficult for us to enter into new contracts or renew existing contracts.
If we or any of our current or former directors, officers, key employees or officials are accused or found to be guilty of serious crimes or civil violations, including the mismanagement or improper accounting of public funds, or violations of the federal securities laws, the schools we serve could be barred or discouraged from entering into or renewing service agreements with us. As a result, our business and revenues would be adversely affected.
New laws or regulations not currently applicable to for-profitfor‑profit education companies in the K-12K‑12 sector could be enacted and negatively impact our operations and financial results.
As the provision of online K-12K‑12 public education matures, novelpolicy or business practice issues may arise that could lead to the enactment of new laws or regulations similar to, or in addition to, laws or regulations applicable to other areas of education and education at different levels.industry sectors. For example, for-profitfor‑profit education companies that own and operate post-secondarypost‑secondary colleges depend in significant respect on student loans provided by the federal government to cover tuition expenses, and federal laws prohibit incentive compensation for success in securing enrollments or financial aid to any person engaged in student recruiting or admission activities. In contrast, while students in virtual or blended public K-12K‑12 schools are entitled to a free public education with no federal or state loans necessary for tuition, laws could be enacted that make for-profitfor‑profit management companies serving such schools subject to similar recruitment or other restrictions.
Risks Related to Our Business and Our Industry
The schools we contract with and serve are governed by independent governing bodies that may shift their priorities or change objectives in ways adverse to us, or react negatively to acquisitions or other transactions.
We contract with and provide a majority of our products and services to virtual and blended public schools governed by independent boards or similar governing bodies. While we typically share a common objective at the outset of our business relationship, over time our interests could diverge resulting in changes adverse to our business. For example, in fiscal year 2013, in connection with a one-year charter renewal of2014, the Colorado Virtual Academy ("COVA") by its school district authorizer, our interests diverged significantly with the COVA governing authority, whichAgora Cyber Charter School expressed its intention to assume management of the school afterbeginning in the 2013-142014‑15 school year while continuing to purchase curriculum and other services from us. IfIn late fiscal year 2016, the Agora board determined to reinstate portions of the management contract it had outsourced to other vendors the prior year. As these independent boards of the schools or school districts we serve subsequently shift their priorities or change objectives, and as a result reduce or modify the scope of services and products we provide, or terminate their relationship with us, our ability to generate revenues consistently over time would be adversely affected.
Our contracts with the Managed Public Schoolsmanaged public schools we serve are subject to periodic renewal, and each year severalsome of these agreements are set to expire. If we are unable to renew several such contracts or if a single significant contract expires during a given year, our business, financial condition, results of operations and cash flow could be adversely affected.
In fiscal year 20142017, we had contracts with 73 Managed Public Schools to provide our full range of products and services in 33 states andto 77 schools throughout the DistrictUnited States under our Managed Public School Programs. A portion of Columbia. Some of these Managed Public School contracts are scheduled to expire in any given year and may not be renewed or may be renewed on terms much less favorable to us. Due toMost of these contracts include auto renewal provisions having significant advance notice deadlines. The advance notice provisions or on the request of a school's charter authority, we usually beginare intended to allow sufficient time to engage in renewal negotiations before and during the final year of these contracts and anycontracts. A renewed contract could involve a restructuring of our services and management arrangements that could lower our revenue or even change how revenue and expenses are recognized. For example, in fiscal year 2014,When the Agora Cyber Charter School ("Agora") electedcustomer prefers the existing contract terms to use a request for proposal process forbe extended, it can elect to disregard the servicesadvance notice provision and products required to operatehave the school for the 2015-16 school year in connection with its charter renewal application. Agora accounted for 13% of the Company's revenue in fiscal year 2014.contract automatically renew. If we
Table of Contents
are unable to renew contracts such as Agora or if contract renewals have significantly less favorable terms or unbundle previously provided services, our business, financial condition, results of operations and cash flow could be adversely affected.
If the schools we serve fail to enroll or reenroll a sufficient number of students, our business, financial condition and results of operations will be adversely affected.
Our revenues are a direct function of how many students are enrolled in theour Managed Public Schools we serve,School Programs, the number of school districts and students who subscribe to the programs offered in our Institutional Sales business, and the enrollments in our three international and private pay schools.
Because families have alternative choices both within and outside the public school system for educating their children, it is typical during each school year that some students withdraw from schools using our online education services and switch to their traditional local public schools, other charter school alternatives or private schools. While themany of our Managed Public Schools we serveSchool Programs also accept new student enrollment throughout the year where permitted, generally our average student enrollment declines as the school year progresses such that we serve on average fewer students at the end of any given school year than at the beginning of the year. If theour Managed Public Schools we serveSchool Programs experience higher withdrawal rates during the year and/or enroll fewer new students as the year progresses than we have experienced in the past, our revenues, result of operations and financial conditionscondition would be adversely affected.
Similarly, at the start of each new school year students who had remained enrolled through the end of the previous year may have graduated from eighth or twelfth grade or have left our Managed Public SchoolsSchool Programs for any number of reasons. To the extent our Managed Public Schools we serveSchool Programs do not retain previously enrolled students from the prior year, they must attract new students at the start of the year to sustain their average student enrollment year over year, as well as to grow their enrollment each year, based upon enrollment objectives determined by the governing authority of those schools. If the schools we serve in the aggregate are able only to sustain prior year enrollment levels, our revenues may not grow from the prior year, absent improved revenue capture or the addition of new schools. More fundamentally, if average student enrollment at the schools we serve declines from one year to the next, our revenues, results of operations and financial condition will be adversely affected.
We also contract with Managed Public Schoolsvirtual public schools and schools districts to provide marketing and enrollment services, to the schools, and we provide similar services directly to our international and private pay schools. However, many of our customers with Non‑managed Public School Programs are responsible for their own marketing and enrollment activities. Efforts on our part to sustain or increase enrollments in the face of higher student withdrawals or fewer returning students at the start of a school year may lead to higher costs for us, and may adversely affect our operating margin. If we or our Non‑managed Program partners are unsuccessful in our marketing planplans or enrollment processes for the schools, the average student enrollment at the schools may not grow as anticipated or could even decline, and adversely affect our revenues, results of operations and financial condition.
The student demographicsBecause the independent governing authorities of our customers may shift priorities or incur new obligations which have financial consequences, we may be exposed to the risk of loss resulting from the nonpayment or nonperformance by our customers and our financial condition, results of operations and cash flows could suffer.
If our customers were to cause or be subjected to situations that lead to a weakened financial condition, dispute our invoices, withhold payments, or file for bankruptcy, we could experience difficulty and prolonged delays in collecting receivables, if at all. Any nonpayment or nonperformance by our customers could adversely affect our business, financial condition, results of operations and cash flows. For example, in fiscal year 2017, as the Agora Cyber Charter School continued to operate as a self-managed charter school, it delayed its payments to us and our accounts receivable from the school have grown significantly.
As we continue to refine our marketing efforts, and support the enrollment activities for our Managed Public School Programs, changes in our marketing efforts and enrollment activities could lead to decline in overall enrollment at the schools we serve.
As parents evaluate public school choices for their children, we are segmenting our marketing efforts to better attract students who are most likely to benefit from and succeed in virtual education programs and who are likely to remain enrolled with a virtual school over several years. Our research leads us to believe that students with parents who are active and regularly engaged in their education are more likely to be successful in a virtual school, although there is no formula that can predict the success of any particular student. Our more segmented marketing efforts, therefore, may not be wholly successful, and could lead to an overall decline in enrollment for our Managed Public School Programs, thus adversely affecting our revenue and results of operations.
The student demographics of the schools we serve have been changing, which can lead to higher costs and affect our ability to sustain or grow our operating income.
The schools we serve are publicly funded and are generally obligated to accept all students meeting state or district criteria for enrollment. Because an online education environment may offer a better educational opportunity for students falling behind grade level, theour Managed Public Schools we serveSchool Programs have experienced in recent years a higher at-risk
academically at‑risk student population, requiring supplemental student and family support services and closer one-on-oneone‑on‑one involvement by teachers and school personnel, leading to higher costs to us in providing full management and curriculum services to the schools. We consider students academically at‑risk if they were not proficient on the previous year’s state assessment, are credit‑deficient, have previously dropped out, have failed courses, or score lower than average on diagnostic or benchmark assessments. Some states have additional or different indicators to determine students who are at risk. These factors are used by the state to identify at‑risk students in several states and have been found through research to impact future student performance. Recent studies have documented that full‑time online charter school students are eligible for free/reduced lunch at higher rates than traditional charter schools and students in online charter schools scored lower on state assessments prior to enrolling in the online school. The schools we serve also enroll a significant percentage of special needs students with learning and/or physical disabilities, which also add to ourthe total costs.costs incurred by the schools.
Education of high school students is generally more costly than K-8K‑8 as more teachers with subject matter expertise (e.g. chemistry, calculus) must be hired to support an expansive curriculum, electives, and
Table of Contents
counseling services. As the relative percentage of high school students increases as part of the total average enrollment in our Managed Public Schools,School Programs, our costs are likely to increase.
As our costscost structure evolves due to the demographics, educational profile and mix of the students enrolled in our Managed Public Schools,School Programs, our profit margins may decline, and we may have increasing difficulty in sustaining or growing our operating income commensurate with our revenues.
If student performance falls, state accountability standards are not achieved, teachers or administrators tamper with state test scoring, or parent and student satisfaction declines, a significant number of students may not remain enrolled in a virtual or blended public school that we serve, or charters may not be renewed or enrollment caps could be put in place, or enrollment practices could be limited and our business, financial condition and results of operations will be adversely affected.
The success of our business depends in part on the choice of a family to have their child begin or continue his or her education in a virtual or blended public school that we serve. This decision is based on many factors, including student performance and parent and student satisfaction. Students may perform significantly below state averages or the virtual or blended public school may fail to meet state accountability standards or the standards of the No Child Left Behind Act ("NCLB") where still applicable, or the conditions of waivers to NCLB requirements granted to states by the U.S. Department of Education.standards. Like many traditional brick and mortar public schools, not all of the Managed Public Schoolsmanaged public schools we serve meet the Adequate Yearly Progress ("AYP") requirements of NCLB, or one of these other benchmarks,their applicable accountability frameworks, as large numbers of new enrollments from students underperforming in traditional schools can lowerdecrease overall results or the underperformance of any one subgroup can lead to the entire school failing to achieve AYPmeet accountability expectations and potentially lead to the school'sschool’s closure. For example, in Tennessee, the Commissioner of Education has statutory authority to close a virtual school if an accountability trigger is met. In addition, although serving academically at-riskat‑risk students is an important aspect of our missionobligation to educate any child regardless of circumstance, the performance of these students can adversely affect a school'sschool’s standing under federal and stateapplicable accountability systems.standards. We expect that, as our enrollments increase and the portion of students that have not used our learning systems for multiple years increases, the average performance of all students using our learning systems may decrease, even if the individual performance of other students improves over time. This effect may also be exacerbated if students enrolled in schools that we provide services to or acquire are predominately below state proficiency standards.standards or experience low graduation rates. Moreover, Congress may amend the NCLB statute orunder ESSA, state authorities may change their testing benchmarksaccountability frameworks in ways that negatively impact the schools we serve.
Students in the Managed Public Schoolsmanaged public schools we serve are required to periodically complete standardized state testing and the results of this testing may have an impact on school funding. Furthermore,More recently, the significant growth of testing undertaken at the state level has led some parents to opt out of state testing, thereby resulting in states granted NCLB waivers to adopt innovative accountability systems that consideran incomplete and potentially inaccurate assessment of school and student growth and school progress, if a school experiences repeated poor test results, those waivers allow such schools to create their own turnaround plans and interventions to address the largest achievement gaps, which in turn could impact our instructional costs. Further, toperformance. To avoid the consequences of failing to meet applicable required proficiency, growth or accountability standards, teachers or school administrators may engage in improperly altering student test scores, especially if teacher performance and compensation isare evaluated on these results. Finally, parent and student satisfaction may decline as not all parents and students are able to devote the substantial time and effort necessary to complete our curriculum. A student'sstudent’s satisfaction may also suffer if his or her relationship with the virtual or blended public school teacher does not meet expectations. If student performance or satisfaction declines, students may decide not to remain enrolled in a virtual or blended public school that we serve and our business, financial condition and results of operations could be adversely affected.
The transition to Common Core State Standardschanging nature of state curriculum standards and Common Core Assessmentsnew state assessments could result in a decline in state test scores that might adversely affect our enrollment and financial conditions.condition, and cause academic performance to decline.
ManyA number of states have adopted the CCSS priorin math and English Language Arts, but are not choosing to selectinguse the Common Core Assessments usedassessments developed by two national testing consortia that align with the CCSS. Instead, these states are electing to use existing or new state‑developed or commercially‑available assessments to evaluate student performance under those new CCSS standards.performance. As a result, it has been reportedteachers are teaching to new standards and students are tested with new assessments which may make initial test results lower than in many states that students learning under the CCSS but continuing to be tested under the existing state proficiency tests have experienced sharp declines in test results.previous years and require additional investments. As the fully-managedmanaged public schools we serve undertake this transition,these transitions, and given the growing number of at-riskat‑risk students enrolling in these schools, academic performance could temporarily or permanently suffer such that these schools may become a less attractive alternative, enrollments could decline, and our financial condition and results of operations could be negatively impacted.
Mergers, acquisitions and joint ventures present many risks, and we may not realize the financial and strategic goals that formed the basis for the transaction.
When strategic opportunities arise to expand our business, we may acquire or invest in other companies using cash, stock, debt, asset contributions or any combination thereof. We may face risks in connection with these or other future transactions, including the possibility that we may not realize the anticipated cost and revenue synergies or further the strategic purpose of any acquisition if our forecasts do not materialize. The pursuit of acquisitions may divert the resources that could otherwise be used to support and grow our existing lines of business. Acquisitions may also create multiple and overlapping product lines that are offered, priced and supported differently, which could cause customer confusion and delays in service. Customers may decline to renew their contracts or the contracts of acquired businesses might not allow us to recognize revenues on the same basis. These transactions may also divert our management'smanagement’s attention and our ongoing business may be disrupted by acquisition, transition or integration activities. In addition, we may have difficulty separating, transitioning and integrating an acquired company'scompany’s systems and the associated costs in doing so may be higher than we anticipate.
There may also be other adverse effects on our business, operating results or financial condition associated with the expansion of our business through acquisitions. We may fail to identify or assess the magnitude of certain liabilities, shortcomings or other circumstances prior to acquiring a company or technology, which could result in unexpected operating expenses, unexpected accounting treatment, unexpected increases in taxes due or a loss of anticipated tax benefits. Our use of cash to pay for acquisitions may limit other potential uses of our cash, including investment in other areas of our business, stock repurchases, dividend payments and retirement of outstanding indebtedness. If we issue a significant amount of equity for future acquisitions, existing stockholders may be diluted and earnings per share may decrease. We may pay more than the acquired company or assets are ultimately worth and we may have underestimated our costs in continuing the support and development of an acquired company'scompany’s products. Our operating results may be adversely impacted by liabilities resulting from a stock or asset acquisition, which may be costly, disruptive to our business, or lead to litigation.
We may be unable to obtain required approvals from governmental authorities on a timely basis, if it all, which could, among other things, delay or prevent us from completing a transaction, otherwise restrict our ability to realize the expected financial or strategic goals of an acquisition or have other adverse effects on our current business and operations. We may face contingencies related to intellectual property, financial disclosures, and accounting practices or internal controls. Finally, we may not be able to retain key executives of an acquired company.
The occurrence of any of these risks could have a material adverse effect on our business, results of operations, financial condition or cash flows, particularly in the case of a larger acquisition or several concurrent acquisitions.
Our business could be negatively affected as a result of actions by activist stockholders, and such activism could impact the trading value of our securities.
Responding to actions by activist stockholders can be costly and time-consuming, disrupting our operations and diverting the attention of management and our employees. If activist stockholders were to emerge, their activities could interfere with our ability to execute our strategic plan. In addition, a proxy contest for the election of directors at our annual meeting would require us to incur significant legal fees and proxy solicitation expenses and require significant time and attention of management and our Board of Directors. Any perceived uncertainties as to our future direction also could affect the market price and volatility of our securities.
If market demand for increasedonline options in public schooling does not increase or continue or if additional states do not authorize or adequately fund virtual or blended public schools, our business, financial condition and results of operations could be adversely affected.
Over the previous five fiscal years, we entered into service agreements for fully-managedmanaged virtual public schools and blended schools in many new states bringing our total to 33 states and the District of Columbia for the 2013-14 school year. Inserved 77 schools in fiscal year 2014, Maine was added to2017 under our Managed Public School Programs throughout the list of states that now permit virtual public schools, although we do not currently operate in that state.United States. Without adding additional states, our Managed Public School Program revenues may become increasingincreasingly dependent on serving more virtual schools in existing states. We also may not be able to fill available enrollment slots as forecasted. If the market demand for virtual and blended public schools does not increase or declines, if the remaining states are hesitant to authorize virtual or blended public schools, if enrollment caps are not removed or raised, or if the funding of such schools is inadequate, our opportunities for growth and our ability to sustain our revenues, results fromof operations and financial conditionscondition would be adversely affected.
Increasing competition in the education industry sectors that we serve could lead to pricing pressures, reduced operating margins, loss of market share, departure of key employees and increased capital expenditures.
As a general matter, we face varying degrees of competition from a variety of education providers because our learning systems integrate all the elements of the education development and delivery process, including curriculum development, textbook publishing, teacher training and support, lesson planning, testing and assessment and school performance and compliance management. In both our Managed Public SchoolsSchool Programs and Institutional Sales businesses, we compete with companies that provide online curriculum and support services. We also compete with public school districts and state departments of education that offer K-12K‑12 online programs of their own or in partnership with other online curriculum vendors. We anticipate intensifying competition from such competitors and by new entrants. Our competitors may adopt similarsuperior curriculum delivery, school support and marketing approaches, with different pricing and service packages that may have greater appeal than our offerings. For example, price competition in the Institutional Sales business has intensified.is vigorous. In addition, some of our Managed Public SchoolsSchool Programs could seek to transition to a self-administeredself‑administered school by seekinginviting competitive alternatives to portions of the products and services now provided entirely by us under our integrated fully managed service agreements. As an example of that type of transition, we recently negotiated a new four-year service agreement with Hawaii Technology Academy that transitioned the school from a fully-managed to a partially-managed program starting in FY 2015. If we are unable to successfully compete for new business, win and renew contracts, including fully managed public school contracts, or students fail to realize sufficient gains in academic performance, our revenues, opportunities for growth and operating margins may decline. Price competition from our current and future competitors could also result in reduced revenues, reduced margins or the failure of our product and service offerings to achieve or maintain more widespread market acceptance.
We may also face competition from publishers of traditional educational materials that are substantially larger than we are and have significantly greater financial, technical and marketing resources, and may enter the field through acquisitions and mergers. Many of these traditional publishers have developed their own online curriculum products and teaching materials that compete directly with our Institutional business products. As a result, they may be able to devote more resources and move quickly to develop products and services that are superior to our platform and technologies. We may not have the resources necessary to acquire or compete with technologies being developed by our competitors, which may render our online delivery format less competitive or obsolete. These new and well-fundedwell‑funded entrants may also seek to attract our key executives as employees based on their acquired expertise in virtual education where such specialized skills are not widely available.
Our future success will depend in large part on our ability to maintain a competitive position with our curriculum and our technology, as well as our ability to increase capital expenditures to sustain the competitive position of our product and retain our talent base. We cannot assure that we will have the financial resources, technical expertise, marketing, distribution or support capabilities to compete effectively.
Table of Contents
Regulatory frameworks on the accessibility of technology and curriculum are continually evolving due to legislative and administrative developments and the rapid evolution of technology, which could result in increased product development costs and compliance risks.
Our online curriculum is made available to students through websites, computers and other display devices connected to the Internet. ThisThe website platforms and online curriculum includesinclude a combination of software applications that include graphics, pictures, videos, animations, sounds and interactive content that may present challenges to peopleindividuals with disabilities. A number of states and federal authorities have considered or are considering how electronic andweb-based information technology procured with state funds should be made accessible to persons with such disabilities. To the extent they enact or interpret laws and
regulations to require greater accessibility than we willcurrently provide, we may have to modify our curriculum offerings to satisfy those requirements. For example,In May 2016, the U.S. Department of Justice issued a supplemental notice of proposed rulemaking soliciting additional public comments on the appropriate standard for determining Web accessibility compliance under Title II of the Americans With Disabilities Act (“ADA”) and extended by two years the deadline for covered entities to come into full compliance after issuance of its final rules, which it anticipated adopting in March 2014,2018. In addition, Section 504 of the OCR entered into an agreement with the South Carolina Charter School District ("District")Rehabilitation Act of 1973 is designed to ensure that the seven internet-based public charter schools in the state provide students with disabilities have an equal opportunity to access each school'sschool’s website and online learning environment by December 31, 2015, in compliance with Section 504 and Title II of the Americans with Disabilities Act. In addition, toenvironment. To the extent that we enter into federal government contracts, or Section 508different standards are adopted by regulators, similar requirementsof compliance could be imposed on us under Section 508 of the Rehabilitation Act, of 1974. If requirements or technology evolves in such a way asby states who apply these federal standards under Section 508 to accelerate or altereducation providers, which standards also recently changed under the need to make all curriculums accessible, we could incurSection 508 refresh process. Beyond the significant product development costs on an accelerated basis. Aassociated with these evolving regulations, a failure to meet required accessibility needssuch requirements could also result in loss or termination of significantmaterial contracts or in potential legal liability.
We generate significant revenues from two virtual public schools, and the termination, revocation, expiration or modification of our contracts with these virtual public schools could adversely affect our business, financial condition and results of operation.
In fiscal year 2014, we derived approximately 10% and 13% of our revenues, respectively, from the Ohio Virtual Academy and the Agora Cyber Charter School in Pennsylvania. As noted above, the Agora School recently commenced a RFP process for the services and products required to operate the school for the 2015-16 school year in connection with its charter renewal application. If our contracts with either of these virtual public schools are terminated, the charters to operate either of these schools are not renewed or are revoked, enrollments decline substantially, funding is reduced, or more restrictive legislation is enacted, our business, financial condition and results of operations could be adversely affected.
Our Managed Public School Programs business revenues are based in part on our estimate of the total funds each school will receive in a particular school year and our estimate of the full year expenses to be incurred by each school. As a result, differences between our quarterly estimates and the actual funds received and expenses incurred could have an adverse impact on our results of operations and cash flows.
We recognize revenues ratably from certain of our fees charged to Managed Public SchoolsSchool Programs over the course of our fiscal year. To determine the pro rata amount of revenues to recognize in a fiscal quarter, we estimate the total funds each school will receive in a particular school year. Additionally, we take responsibility for any operating deficits incurred at most of the Managed Public SchoolsSchool Programs we serve. Because this may impair our ability to collect the full amount invoiced in a period and therefore collection cannot reasonably be assured, we reduce revenues by the estimated pro rata amount of the school'sschool’s operating loss. We review our estimates of total funds and operating expenses periodically, and we revise as necessary, amortizing any adjustments over the remaining portion of the fiscal year. Actual school funding received and school operating expenses incurred may vary from our estimates or revisions and could adversely impact our revenues, results of operations and cash flows.
Table of Contents
Our business is subject to seasonal fluctuations, which may cause our operating results to fluctuate from quarter-to-quarterquarter‑to‑quarter and adversely impact our working capital and liquidity throughout the year.
Our revenues and operating results normally fluctuate as a result of seasonal variations in our business, principally due to the number of months in a fiscal quarter that our school customers are fully operational and serving students. In the typical academic year, our first and fourth fiscal quarters have fewer than three full months of operations, whereas our second and third fiscal quarters will have three complete months of operations. We ship learning kits to students in the beginning of the school year, our first fiscal quarter, generally resulting in higher learning kit revenues and margins in the first fiscal quarter relative to the other quarters. In aggregate, the seasonality of our revenues has generally produced higher revenues in the first quarter of our fiscal year.
Our operating expenses are also seasonal. Instructional costs and services increase in the first fiscal quarter primarily due to the costs incurred to ship learning kits at the beginning of the school year. These instructional costs may increase significantly quarter-to-quarterquarter‑to‑quarter as school operating expenses increase. The majority of our selling and marketing expenses are incurred in the first and fourth fiscal quarters, as our primary enrollment season is JulyApril through September.
We expect quarterly fluctuations in our revenues and operating results to continue. These fluctuations could result in volatility and adversely affect our cash flow. As our business grows, these seasonal fluctuations may become more pronounced. As a result, we believe that sequential quarterly comparisons of our financial results may not provide an accurate assessment of our financial position.
Risks Related to Our Operations
We plan to continue to create new products, expand distribution channels and pilot innovative educational programs to enhance academic performance. If we are unable to effectively manage these initiatives or they fail to gain acceptance, our business, financial condition, results of operations and cash flows would be adversely affected.
As we create and acquire new products, expand our existing customer base and pilot new educational programs, we expect to face challenges distinct from those we currently encounter, including:
•our continued development of public blended schools and individualized learning centers (also known as Flex schools) which has produced different operational challenges than those we previously encountered. In addition to the online component, these schools sometimes require us to lease facilities for classrooms, staff classrooms with teachers, provide meals and kitchen facilities, adhere to local safety and fire codes, purchase additional insurance and fulfill many other responsibilities;
•the acquisition or opening of additional managed public schools in states where we already have a contract with such schools can potentially create customer dissatisfaction, confuse prospective parents in the school selection process, and present marketing differentiation challenges depending on the facts and circumstances in that state;
•our operation of traditional or brick and mortar schools, as well as Flex schools used on a full-time basis by students accessing our curriculum online under the supervision of certified teachers and supporting instructors, has necessitated different management skills and presented additional risks compared to those in our core Managed Public Schools business;
•our efforts to integrate adaptive learning technologies and solutions into our learning management system, which may require significant investment of resources to develop or acquire to continue to improve our educational programs and student outcomes;
| · | | the rollout of our next generation curriculum and transition to third party educational platforms could create certain challenges, including customer dissatisfaction, early withdrawals and declines in re-registrations, and potentially harm our reputation; the acquisition or opening of additional managed public schools in states where we already have a contract with such schools can potentially create customer confusion, complicating the school selection process for prospective parents, and present marketing differentiation challenges depending on the facts and circumstances in that state; |
| · | | our development of public blended schools has produced different operational challenges than those we previously encountered. In addition to the online component, these schools sometimes require us to lease facilities for classrooms, staff classrooms with teachers, provide meals and kitchen facilities, adhere to local safety and fire codes, purchase additional insurance and fulfill many other responsibilities; |
| · | | operating in international markets may require us to conduct our business differently than we do in the United States or in existing countries. Additionally, we may have difficulty training and retaining qualified teachers or generating sufficient demand for our products and services in international markets. International opportunities will also present us with different legal, operational, tax and currency challenges; |
| · | | the use of our curriculum in classrooms will produce challenges with respect to adapting our curriculum for effective use in a traditional classroom setting; |
| · | | our online private school business is dependent on a tuition‑based financial model and may not be able to enroll a sufficient number of students over time to achieve long‑run profitability or deliver a high level of customer satisfaction; |
| · | | our participation in summer foreign language instruction camps through MIL could generate new legal liabilities and financial consequences associated with our responsibility for students housed on leased college campuses on a 24‑hour basis over the duration of the camp; and |
| · | | our continual efforts to innovate and pilot new programs to enhance student learning may not always succeed or may encounter unanticipated opposition. |
Table of Contents
•operating in international markets may require us to conduct our business differently than we do in the United States or in existing countries. Additionally, we may have difficulty training and retaining qualified teachers or generating sufficient demand for our products and services in international markets. International opportunities will also present us with different legal, operational, tax and currency challenges;
•the use of our curriculum in classrooms will produce challenges with respect to adapting our curriculum for effective use in a traditional classroom setting;
•our online private school business is dependent on a tuition-based financial model and may not be able to enroll a sufficient number of students over time to achieve long-run profitability or deliver a high level of customer satisfaction;
•our participation in summer foreign language instruction camps through MIL, our joint venture with Middlebury College, could generate new legal liabilities and financial consequences associated with our responsibility for students housed on leased college campuses on a 24-hour basis over the duration of the camp; and
•our continual efforts to innovate and pilot new programs to enhance student learning may not always succeed or may encounter unanticipated opposition.
Our failure to manage these business expansion programs, or any new business expansion program or new distribution channel we pursue, may have an adverse effect on our business, financial condition, results of operations and cash flows.
High quality teachers are critical to the success of our learning systems. If we are not able to continue to recruit, train and retain quality certified teachers, our curriculum might not be effectively delivered to students, compromising their academic performance and our reputation. As a result, our brand, business and operating results may be adversely affected.
High quality teachers are critical to maintaining the worthvalue of our learning systems and assisting students with their daily lessons. In addition, teachers in the public schools we manage or who provide instruction in connection with the online programs we offer to school districts, must be state certified (with limited exceptions or temporary waiver provisions in various states), and we must implement effective internal controls in each jurisdiction to ensure valid teacher certifications, as well as the proper matching of certifications with student grade levels and subjects to be taught. Teachers must also possess strong interpersonal communications skills to be able to effectively instruct students in a virtual school setting, and the technical skills to use our technology-basedtechnology‑based learning systems. There is a limited pool of teachers with these
specialized attributes and the Managed Public Schoolsmanaged public schools and school districts we serve must provide competitive compensationbenefits packages to attract and retain such qualified teachers.
The teachers in most Managed Public Schoolsmany managed public schools we serve are not our employees and the ultimate authority relating to those teachers resides with an independent not-for-profit thenot‑for‑profit governing body, which oversees the schools. However, under many of our service agreements with virtual and blended public schools, we have responsibility to recruit, train and manage these teachers. The teacher recruitment and student assignment procedures and processes for bothour Managed Public Schools and the Institutional Sales businessesSchool Programs must also ensure full compliancecomply with individual state certification and reporting requirements. We must also provide continuous training to virtual and blended public school teachers so they can stay abreast of changes in student demands, academic standards and other key trends necessary to teach online effectively, including measures of effectiveness. We may not be able to recruit, train and retain enough qualified teachers to keep pace with our growthschool demand while maintaining consistent teaching quality in the various Managed Schoolsmanaged public schools we serve. Shortages of qualified teachers, failures to ensure proper teacher certifications in each state, or decreases in the quality of our instruction, whether actual or perceived, could have an adverse effect on our Managed Public SchoolsSchool Programs and Institutional Sales businesses.
Table of Contents
School teachers are subject to union organizing campaigns, and if the teachers employed by us or at the Managed Pubic Schoolsmanaged public schools we serve join a union, collective bargaining agreements negotiated with union representatives could result in higher operating expenses and the loss of management flexibility and innovation for which charter schools were created.
If the teachers at any one of our Managed Public Schoolsthe public schools we serve were to join a union,unionize, we or the school authority or we would be obligedbecome subject to negotiate a collective bargaining agreement with union representatives. Such anA collective bargaining agreement could impact teacher salaries, benefits, work rules, restrictions on the teaching work-daywork‑day and the time devoted to online instruction delivery or communications with students, teacher tenure, and limitations on our flexibility to reassign or remove teachers for inadequate performance. This could result in higher expenses for school operations and could impede the sustainability of or any growth in enrollment at the school due to the loss of management flexibility and innovation. This could result in higher costs to us in providing management and curriculum services to the school, and adversely affect our operating margins, overall revenues and overall revenues.academic performance results. For example, in June 2016, the California Teachers Association was recognized by the California Public Employee Relations Board to be the exclusive representative for all of the teachers employed by the California Virtual Academies to negotiate a collective bargaining agreement with the governing authorities of those schools.
We rely on third-partythird‑party service providers to host some of our solutions and any interruptions or delays in services from these third parties could impair the delivery of our products and harm our business.
We currently outsource some of our hosting services to third parties. We do not control the operation of any third party facilities. These facilities are vulnerable to damage or interruption from natural disasters, fires, power loss, telecommunications failures and similar events. They are also subject to break-ins,break‑ins, computer viruses, sabotage, intentional acts of vandalism and other misconduct. The occurrence of any of these disasters or other unanticipated problems could result in lengthy interruptions in our service. Furthermore, the availability of our platformproprietary and third‑party LMSs could be interrupted by a number of additional factors, including our customers'customers’ inability to access the Internet, the failure of our network or software systems due to human or other error, security breaches or ability of the infrastructure to handle spikes in customer usage. Interruptions in our service may reduce our revenue, cause us to issue credits or pay penalties, cause customers to terminate their subscriptions and adversely affect our renewal rates and our ability to attract new customers. Our business will also be harmed if our customers and potential customers believe our service is unreliable.
We operate a complex company-widecompany‑wide enterprise resource planning ("ERP"(“ERP”) system and if it were to experience significant operating problems, it could adversely affect our business and results of operations.
We operate a complex company-wide,company‑wide, integrated ERP system to handle various business, operating and financial processes which handles a variety of important functions, such as order entry, invoicing, accounts receivable, accounts payable, financial consolidation and internal and external financial and management reporting matters. If the ERP system experiences significant problems, it could result in operational issues including delayed billing and accounting errors and other operational issues which could adversely affect our business and results of operations. System delays or malfunctioning could also disrupt our ability to timely and accurately process and report results of our operations, financial position and cash flows, which could impact our ability to timely complete important business processes.
Our business is subject to seasonal fluctuations, which may cause our operating results to fluctuate from quarter-to-quarter and adversely impact our working capital and liquidity throughout the year.
Our revenues and operating results normally fluctuate as a result of seasonal variations in our business, principally due to the number of months in a fiscal quarter that our school customers are fully operational and serving students. In the typical academic year, our first and fourth fiscal quarters have fewer than three full months of operations, whereas our second and third fiscal quarters will have three complete months of operations. We ship learning kits to students in the beginning of the school year, our first fiscal quarter, generally resulting in higher learning kit revenues and margins in the first fiscal quarter relative to the other quarters. In aggregate, the seasonality of our revenues has generally produced higher revenues in the first quarter of our fiscal year.
Our operating expenses are also seasonal. Instructional costs and services increase in the first fiscal quarter primarily due to the costs incurred to ship learning kits at the beginning of the school year. These instructional costs may increase significantly quarter-to-quarter as school operating expenses increase. The majority of our selling and marketing expenses are incurred in the first and fourth fiscal quarters, as our primary enrollment season is July through September.
The continued development of our product and service brands is important to our business. If we are not able to maintain and enhance these brands, our business and operating results may suffer.
Enhancing brand awareness is critical to attracting and retaining students, and for serving additional virtual and blended public schools, school districts and online private schools and we intend to spend significant resources to accomplish that objective. These efforts include sales and marketing directed to targeted locations as well as the national marketplace, discreetdiscrete student populations, the educational community at large, key politicalpolicy groups, image-makersimage‑makers and the media. As we continue to seek to increase enrollments and extend our geographic reach and product and service offerings, maintaining quality and consistency across all of our services and products may become more difficult to achieve, and any significant and well-publicizedwell‑publicized failure to maintain this quality and consistency will have a detrimental effect on our brands. We cannot provide assurances that our new sales and marketing efforts will be successful in further promoting our brands in a competitive and cost-effectivecost‑effective manner. For example, in FY 2014 we discontinued the use of our Aventa Learning and A+ brands and introduced a new brand for marketing all of the curriculum and programs we offer to school districts under the FuelEd brand. If we are unable to further enhance our brand recognition and increase awareness of our products and services, or if we incur excessive sales and marketing expenses, our business and results of operations could be adversely affected.
Our intellectual property rights are valuable, and any inability to protect them could reduce the value of our products, services and brand.
Our patent, trademarks, trade secrets, copyrights, domain names and other intellectual property rights are important assets. For example, we have been granted threefive patents relating to the hardware and network infrastructure of our OLS, including the system components for creating and administering assessment tests and our lesson progress tracker and two patents related to foreign language instruction. Additionally, we are the copyright owner of the courses comprising our proprietary curriculum.
Various events outside of our control pose a threat to our intellectual property rights. For instance, effective intellectual property protection may not be available in every country in which our products and services are distributed or made available through the Internet. Also, the efforts we have taken to protect our proprietary rights may not be sufficient or effective. Any significant impairment of our intellectual property rights could harm our business or our ability to compete. Also, protecting our intellectual property rights is costly and time consuming. Any unauthorized use of our intellectual property could make it more expensive to do business and harm our operating results.
It is possible that we may not be able to sufficiently protect our innovations. In addition, given the costs of obtaining patent protection, we may choose not to protect certain innovations that later turn out to be important. Further, there is always the possibility that the scope of the protection gained will be insufficient or that an issued patent be deemed invalid or unenforceable.
We also seek to maintain certain intellectual property as trade secrets. This secrecy could be compromised by outside parties, whether through breach of our network security or otherwise, or by our employees or former employees, intentionally or accidentally, which would cause us to lose the competitive advantage resulting from these trade secrets. Third parties may acquire domain names that are substantially similar to our domain names leading to a decrease in the value of our domain names and trademarks and other proprietary rights.
Table of Contents
Lawsuits against us alleging infringement of the intellectual property rights of others and such actions would be costly to defend, could require us to pay damages or royalty payments and could limit our ability or increase our costs to use certain technologies in the future.
Companies in the Internet, software, technology, education, curriculum and media industries own large numbers of patents, copyrights, trademarks and trade secrets and frequently enter into litigation based on allegations of infringement or other violations of intellectual property rights. We currently face such litigation in the United States District Court for the District of Delaware,IpLearn, LLC v. K12 Inc., Case No. 1:11-1026-RGA. Regardless of the merits, intellectual property claims are time-consumingtime‑consuming and expensive to litigate or settle. For example, a non‑practicing entity sued us alleging that our proprietary learning systems infringed three of its patents although its lawsuit was ultimately dismissed on the merits in 2014. In addition, to the extent claims against us are successful, we may have to pay substantial monetary damages or discontinue certain products, services or practices that are found to be in violation of another party'sparty’s rights. We also may have to seek a license and make royalty payments to continue offering our products and services or following such practices, which may significantly increase our operating expenses.
We may be subject to legal liability resulting from the actions of third parties, including independent contractors, business partners, or teachers, which could cause us to incur substantial costs and damage our reputation.
We may be subject, directly or indirectly, to legal claims associated with the actions of or filed by our independent contractors, business partners, or teachers. In the event of accidents or injuries or other harm to students, we could face claims alleging that we were negligent, provided inadequate supervision or were otherwise liable for their injuries and our insurance may not cover the expenses of litigation or settlement amounts. Additionally, we could face claims alleging that our independent curriculum contractors or teachers infringed the intellectual property rights of third parties. A liability claim against us or any of our independent contractors, business partners, or teachers could adversely affect our reputation, enrollment and revenues. Even if unsuccessful, such a claim could create unfavorable publicity, cause us to incur substantial expenses and divert the time and attention of management.
Unauthorized disclosure or manipulationWe operate in markets that are dependent on Information Technology (IT) systems and technological change. Failure to maintain and support customer facing services, systems, and platforms, including addressing quality issues and execution on time of student, teachernew products and other sensitive data, whether through breach ofenhancements, could negatively impact our networkrevenues and reputation.
We use complex IT systems and products to support our businesses activities, including customer-facing systems, back-office processing and infrastructure. We face several technological risks associated with online product service delivery, information technology security or otherwise,(including virus and cyber-attacks), e-commerce and enterprise resource planning system implementation and upgrades. From time to time we have experienced verifiable attacks on our system by unauthorized parties, and our plans and procedures to reduce such risks may not be successful. Thus, our businesses could expose us to costly litigation or could jeopardize our contracts with virtual public schools or blended schools.
Maintaining our network security and internal controls over access rights is of critical importance becausebe adversely affected if our systems stores proprietary and infrastructure experience a significant failure or interruption in the event of future attacks on our system by unauthorized parties.
Failure to prevent or detect a malicious cyber-attack on our systems and databases could result in a misappropriation of confidential studentinformation or access to highly sensitive information.
Cyber-attacks are becoming more sophisticated and teacherpervasive. Across our business we hold large volumes of personally identifiable information including that of employees, customers, students and parents and legal guardians. Individuals may try to gain unauthorized access to our data in order to misappropriate such as names, addresses,information for potentially fraudulent purposes, and other personal information. Individuals and groups may develop and deploy viruses, worms and other malicious software programs that attack or attempt to infiltrate our systems.
If our security measures may fail to prevent such authorized access. A significant breach could result in a devastating impact on our reputation, financial condition or student experience. In addition, if we were unable to prove that our systems are breached as a result of third-party action, employee error, malfeasance or otherwise, third parties may receive or be ableproperly designed to access student records anddetect an intrusion, we could be subject to liabilitysevere penalties and loss of existing or our business could be interrupted. Penetration of our network security could have a negative impact on our reputation and could lead virtual public schools, blended schools and parents to choose competitive offerings. As a result, we may be required to expend significant resources to provide additional protection from the threat of these security breaches or to alleviate problems caused by these breaches. Additionally, we run the risk that employees or vendors could illegally disclose confidential educational information.
Table of Contentsfuture business.
We rely on the Internet to enroll students and to deliver our products and services to children, which exposes us to a growing number of legal risks and increasing regulation.
We collect information regarding students during the online enrollment process and a significant amount of our curriculum content is delivered over the Internet. As a result, specific federal and state laws that could have an impact on our business include the following:
•the Children's | · | | the Children’s Online Privacy Protection Act, as implemented by regulations of the Federal Trade Commission (revised July 2013), imposes restrictions on the ability of online companies to collect and use personal information from children under the age of 13; |
| · | | the FERPA, which imposes parental or student consent requirements for specified disclosures of student information to third parties, and emerging state student data privacy laws; |
| · | | the CDA, which provides website operators immunity from most claims arising from the publication of third‑party content; |
| · | | numerous state cyberbullying laws which require schools to adopt policies on harassment through the Internet or other electronic communications; |
| · | | rapidly emerging state student data privacy laws which require schools to adopt privacy policies are applicable to virtual schools and can significantly vary from one state to another; and |
| · | | federal and state laws that govern schools’ obligations to ELL students and students with disabilities. |
In addition, the laws applicable to the Internet are still developing. These laws impact pricing, advertising, taxation, consumer protection, quality of products and services, and are in a state of change. New or amended laws may also be enacted, which could increase the costs of regulatory compliance for us or force us to change our business practices. As a result, we may be exposed to substantial liability, including significant expenses necessary to comply with such laws and regulations and indemnification of schools we operate for liabilities resulting from a school’s failure to comply with such laws and regulations.
System disruptions and vulnerability from security risksFailure to comply with data privacy regulations could result in reputational damage to our online computer networksbrands and adversely affect our business, financial condition and results of operations.
Any perceived or actual unauthorized disclosure of personally identifiable information, whether through breach of our network by an unauthorized party, employee theft, misuse or error or otherwise, could impact our ability to generate revenues and damageharm our reputation, limitingimpair our ability to attract and retain students.our customers, or subject us to claims or litigation arising from damages suffered by individuals. Failure to adequately protect personally identifiable information could potentially lead to penalties, significant remediation costs, reputational damage, the cancellation of existing contracts and difficulty in competing for future business. In addition, we could incur significant costs in complying with relevant laws and regulations regarding the unauthorized disclosure of personal information, which may be affected by any changes to data privacy legislation at both the federal and state levels.
The performance and reliability of our technology infrastructure is critical to our reputation and ability to attract and retain virtual public schools, blended schools, school district customers, parents and students. Any sustained system error or failure, or a denial of service ("DNS") attack, could limit our users' access to our online learning systems, and therefore, damage our ability to generate revenues or provide sufficient documentation to comply with state laws requiring proof that students completed the required number of hours of instruction. Our technology infrastructure could be vulnerable to interruption or malfunction due to events beyond our control, including natural disasters, terrorist activities and telecommunications failures.
We utilize a single logistics vendor at two locations for the management, receiving, assembly and shipping of all of our learning kits and printed educational materials. In addition, we utilize the same vendor at a thirdsecond location for the reclamation and redeployment of our student computers. This partnership depends upon execution on the part of us and the vendor. Any material failure to execute properly for any reason, including damage or disruption to any of the vendor'svendor’s facilities would have an adverse effect on our business, financial condition and results of operations.
Substantially all of the inventory for our learning kits and printed materials is located in twoone warehouse facilities, both offacility, which areis operated by a third-partythird‑party logistics vendor whichthat handles receipt, assembly and shipping of all physical learning materials. If this logistics vendor were to fail to meet its obligations to deliver learning materials to students in a timely manner, or if a material number of such shipments are incomplete or contain assembly errors, our business and results of operations could be adversely affected. In addition, we provide computers for a substantial number of our students. Execution or merger integration failures which interfere with the reclamation or redeployment of computers may result in additional costs. Furthermore, a natural disaster, fire, power interruption, work stoppage or other unanticipated catastrophic event, especially during the period from April through June when we are awaiting receipt of most of the curriculum materials for the school year and have not yet shipped such
Table of Contents
materials to students, could significantly disrupt our ability to deliver our products and operate our business. If any of our material inventory items were to experience any significant damage, we would be unable to meet our contractual obligations and our business would suffer.
Any significant interruption in the operation of our data centers could cause a loss of data and disrupt our ability to manage our network hardware and software and technological infrastructure.
We host our products and serve all of our students from third-partythird‑party data center facilities. As part of our risk mitigation plan, we opened a second data center in a different geographic location. Even with such redundancy, we may not be able to prevent a significant interruption in the operation of these facilities or the loss of school and operational data due to a natural disaster, fire, power interruption, act of terrorism or other unanticipated catastrophic event. Any significant interruption in the operation of these facilities, including an interruption caused by our failure to successfully expand or upgrade our systems or manage our transition to utilizing the expansions or upgrades, could reduce our ability to manage our network and technological infrastructure, which could result in lost sales, enrollment terminations and impact our brand reputation.
Additionally, we do not control the operation of these facilities and must rely on another party to provide the physical security, facilities management and communications infrastructure services related to our data centers. Although we believe we would be able to enter into a similar relationship with another party should this relationship fail or terminate for any reason,centers and our reliance on a single vendor exposes us to risks outside of our control. If this vendor encounters financial difficulty such as
bankruptcy or other events beyond our control that causes it to fail to secure adequately and maintain its hosting facilities or provide the required data communications capacity, students of the schools we serve may experience interruptions in our service or the loss or theft of important customer data.
Any significant interruption in the operation of our enrollment centers could disrupt our ability to recommend educational options to parents, respond to service requests and process enrollments.
Our primary enrollment center operations are housed in our corporate headquarters and in a facility located in Knoxville, Tennessee. We are able to reroute calls to the other facility if one facility is unable to temporarily service calls. Rerouting of calls may not be able to prevent a significant interruption in the operation of any of the facilities due to natural disasters, accidents, failures of our fulfillment provider. Any significant interruption in the operation of any primary facility, including an interruption caused by our failure to successfully expand or upgrade our systems or to manage these expansions or upgrades, could reduce our ability to respond to service requests, receive and process orders and provide products and services, which could result in lost and cancelled sales, and damage to our brand reputation.
Capacity limits on some of our technology, transaction processing systems and network hardware and software may be difficult to project and we may not be able to expand and upgrade our systems in a timely manner to meet significant unexpected increased demand.
As the number of schools we serve increases and our student base grows, the traffic on our transaction processing systems and network hardware and software will rise. We may be unable to accurately project the rate of increase in the use of our transaction processing systems and network hardware and software. In addition, we may not be able to expand and upgrade our systems and network hardware and software capabilities to accommodate significant unexpected increased or peak use. If we are unable to appropriately upgrade our systems and network hardware and software in a timely manner, our operations and processes may be temporarily disrupted.
Table of Contents
Our efforts to expand capacity may not produce the operational and financial results for which those investments were intended.
As we have grown to serve more schools, students and families in an increasing number of states and countries, we have invested in infrastructure systems and technology to keep pace such as new telephonycommunication systems, enterprise hardware and software systems, and enrollment centers. In the absence of compatible business processes, adequate employee training, integration with other dependent systems, and sufficient staffing, this expanded capacity alone may not result in improved performance or outcomes.
We may be unable to keep pace with changes in our industry and advancements in technology as our business and market strategy evolves.
As changes in our industry occur or macroeconomic conditions fluctuate we may need to adjust our business strategies or find it necessary to restructure our operations or businesses, which could lead to changes in our cost structure, the need to write down the value of assets, or impact our profitability. We also make investments in existing or new businesses, including investments in technology and expansion of our business lines. These investments may have short‑term returns that are negative or less than expected and the ultimate business prospects of the business may be uncertain.
As our business and market strategy evolves, we also will need to respond to technological advances and emerging industry standards in a cost-effectivecost‑effective and timely manner in order to remain competitive, such as the adventubiquitous use of tablets for public school applications, adaptive learning technologies, and web accessibility standards. The need to respond to technological changes may require us to make substantial, unanticipated expenditures. There can be no assurance that we will be able to respond successfully to technological change.
Pursuant to our joint venture agreement with Middlebury College, there is a risk that Middlebury College might exercise its right to require us to purchase its ownership interest in our joint venture at fair market value which could adversely affect our financial condition.
A key provision in our joint venture agreement with Middlebury College is its right beginning on April 14, 2015 and upon 180 days advance notice, to require us to purchase all, but not a portion of, its ownership interest in our joint venture at fair market value and based on an independent appraisal. We have the right to pay the redemption cost in cash, stock or a combination thereof, at our option. It is uncertain when or whether Middlebury College would elect to exercise this right and therefore, we cannot at this time determine the form of the redemption payment and therefore the exact impact to our financial condition or dilution to stockholders.
We may be unable to attract and retain skilled employees.
Our success depends in large part on continued employment of senior management and key personnel who can effectively operate our business, which is necessary in the highly regulated public education sector involving a publicly-traded for-profitpublicly‑traded for‑profit company. This complexity requires us to attract and retain management and employees with specialized skills and knowledge across many disciplines. If any of these employees leave weus and we fail to effectively
manage a transition to new personnel, or if we fail to attract and retain qualified and experienced professionals on acceptable terms, our business, financial conditionscondition and results of operations could be adversely affected.
Our success also depends on our having highly trained financial, technical, recruiting, sales and marketing personnel. We will need to continue to hire additional personnel as our business grows. A shortage in the number of people with these skills or our failure to attract them to our Company could impede our ability to increase revenues from our existing products and services, ensure full compliance with federal and state regulations, launch new product offerings, and would have an adverse effect on our business and financial results.
In addition, we are subject to the Fair Labor Standards Act and other state and federal employment laws. These laws govern such matters as minimum wage, overtime and other working conditions that can increase our labor costs or subject us to liabilities to our employees. Regulatory changes that increase the number of workers eligible for overtime based on salary levels and other labor costs may increase in the future which could have a material adverse effect on our business, financial condition and results of operations.
Healthcare reform legislation could have a negative impact on our business, financial condition and results of operations.
The Patient Protection and Affordable Care Act, which was adopted in 2010, may significantly affect the provision of both healthcare services and benefits in the U.S. and its current status is in flux. We continually monitor the impact on our business and the steps necessary to mitigate such impact, including potential further modifications to our current benefit plans and operational changes to minimize the effect of the legislation on our cost structure. If we cannot effectively modify our programs and operations in response to these mandates, our business, financial condition and results of operations may be adversely impacted.
We partially self‑insure our group health insurance program and actual claims may differ from our estimates, which could materially impact our results of operations.
Effective January 1, 2016, we modified our group health insurance program and now self‑insure all eligible employees and their family members subject to a stop loss insurance policy with a per person limit of $500,000 ($550,000 as of January 1, 2017) and an aggregate limit of 125% of expected claims based on a formulaic determination of the expected claims. Liabilities associated with the risks that are retained by the Company are estimated, in part, by considering historical claims experience, demographic factors, severity factors and other actuarial assumptions. Our results could be materially impacted by claims and other expenses related to our group health insurance program if future occurrences and claims differ from these assumptions and historical trends and exceed the limitations of liability under the stop loss insurance policy.
We may need additional capital in the future, but there is no assurance that funds will be available on acceptable terms.
We may need to raise additional funds in order to achieve growth or fund other business initiatives. This financing may not be available in sufficient amounts or on terms acceptable to us and may be dilutive to existing stockholders. Additionally, any securities issued to raise funds may have rights, preferences or privileges senior to those of existing stockholders. If adequate funds are not available or are not available
Table of Contents
on acceptable terms, our ability to expand, develop or enhance services or products, or respond to competitive pressures will be limited.
Our curriculum and approach to instruction may not achieve widespread acceptance,satisfy certain state standards, which would limit our growth and profitability.
The curriculum offerings and approach to individualized learning are based onWith the structured delivery, clarification, verification and practicepassage of lesson subject matter. While we believe our curriculum is aligned withthe ESSA, each state standards in the jurisdictions where we manage virtual and blended public schools and these schools offer accredited diplomas, this approach is not accepted by all academics and educators, who may favor less formalistic methods andwill have the abilityauthority to negatively influence the market for our products and services. In addition,adopt its own assessments tied to its curriculum standards. As a result, the acceptance and adoption of the CCSS grade level requirements and proposed common assessments of those standards by individual states is uncertain, and continues to change at the state and district level. As a result, the standardsassessments for measuring student achievementperformance also could vary from state to state, and even from district to district, and therefore,state. At this time we cannot anticipate at this timepredict the impact of these varying standards, which may have in terms of requiringrequire us to make additional investment, on our part, or oncould impede our ability to sustain or expand our operating margins.product offerings into new states in an expeditious manner. In addition, changes to existing state curriculum standards, or our inability to meet existing or new state curriculum standards, could materially and adversely affect our growth, business and results of operations.
ITEM 1B. UNRESOLVED STAFF COMMENTS
None.
ITEM 2. PROPERTIES
Our headquarters are located in approximately 176,000129,000 square feet of office space in Herndon, Virginia. The facilities are under leases that expire between August 2019 andin May 2022. In addition, we lease approximately 131,000317,000 square feet in multiple locations throughout the United States under individual leases that expire between July 20142017 and October 2019.2022.
ITEM 3. LEGAL PROCEEDINGS
In the ordinary conduct of our business, we are subject to lawsuits, arbitrations and administrative proceedings from time to time. We expensevigorously defend these claims; however, no assurances can be given as to the outcome of any pending legal costs as incurred.proceedings. We believe, based on currently available information, that the outcome of any existing or known threatened proceedings, even if determined adversely, should not have a material adverse effect on our business, financial condition, liquidity or results of operations.
IpLearnOn July 20, 2016, a securities class action lawsuit captioned
Babulal Tarapara v. K12 Inc. On October 26, 2011, IpLearn, LLC ("IpLearn")et al was filed a complaint for patent infringement against usthe Company, two of its officers and one of its former officers in the United States District Court for the Northern District of Delaware,IpLearn, LLC v. K12 Inc.,California, Case No. 1:11-1026-RGA, which it subsequently amended on November 18, 2011. IpLearn is a privately-held technology development and licensing company for web and computer-based learning technologies. In its complaint, IpLearn alleges that we have infringed three of its patents for various computer-aided learning methods and systems and it is primarily seeking an injunction enjoining us from any continued infringement as well as an award of unspecified monetary damages. On July 2, 2012, the court granted our motion to dismiss IpLearn's allegations of indirect patent infringement and allowed IpLearn's allegations of direct patent infringement to proceed. On January 15, 2013, the court approved a stay of IpLearn's claims alleging infringement of one of the three patents in the case involving technology licensed to us by a third party and on June 12, 2014, the court approved a stipulation by IpLearn that K12's technology does not infringe the second of the three patents. The Company filed its motion for summary judgment regarding the remaining allegation of infringement on June 25, 2014.
Oklahoma Firefighters Complaint
On January 30, 2014, a securities class-action lawsuit captionedOklahoma Firefighters Pension & Retirement System v. K12 Inc., et al., was filed against us, four of our officers and directors, and a former officer, in the United States District Court for the Eastern District of Virginia,In re K12 Inc. Securities Litigation, Case No. 1:14-CV-108-AJT-JFA. On April 24, 2014 the Court appointed the Oklahoma Firefighters Pension and Retirement System as lead plaintiff, and on May 23, 2014 the lead plaintiff filed an amended class action complaint ("Amended Complaint"3:16-cv-04069 (“Tarapara Case”). The plaintiff purports to represent a class of persons who purchased or otherwise acquired ourthe Company’s common stock between February 5,November 7, 2013 and October 8, 2013,27, 2015, inclusive, and alleges violations by the Company and the individual defendants of SectionsSection 10(b) of the Securities Exchange Act of 1934, as amended (the “Exchange Act”), and Rule 10b-5 promulgated under the Exchange Act, and violations by the individual defendants of Section 20(a) of the Exchange Act, and Rule 10b-5 promulgated thereunder.Act. The Amended Complaint alleges, among other things, that the defendants made false or misleading statements of material fact, or failed to disclose material facts, about (i) our enrollment and revenue growth prospects for fiscal 2014, and (ii) our compliance with state regulations governing enrollment. The plaintiff seekscomplaint sought unspecified monetary damages and other relief. We intendAdditionally, on September 15, 2016, a second securities class action lawsuit captioned Gil Tuinenburg v. K12 Inc. et al was filed against the Company, two of its officers and one of its former officers in the United States District Court for the Northern District of California, Case No. 3:16-cv-05305 (“Tuinenburg Case”). On October 6, 2016, the Court consolidated the Tarapara Case and the Tuinenburg Case, appointed Babul Tarapara and Mark Beadle as lead plaintiffs, and recaptioned the matter as In Re K12 Inc. Securities Litigation. On December 2, 2016, the lead plaintiffs filed an amended complaint against us. The amended complaint named an additional former officer as a defendant and specified a class period start date of October 10, 2013. The amended complaint alleges materially false or misleading statements and omissions regarding the decision of the Agora Cyber Charter School not to renew its managed public school agreement with us, student academic and Scantron results, and other statements regarding student academic performance and K12’s academic services and offerings. On January 30, 2017, the Company filed its motion to dismiss the amended complaint. The lead plaintiffs filed an opposition to the motion to dismiss the amended complaint on March 1, 2017. On March 31, 2017, the Company filed its response to the lead plaintiffs’ opposition to the motion to dismiss. A hearing on the motion to dismiss the amended complaint was held on April 19, 2017 and a decision is pending. The Company intends to continue to defend vigorously against the claims assertedeach and every allegation and claim set forth in the Amended Complaint, and filed a motion to dismiss the Amended Complaint on June 20, 2014. The parties have completed briefing the motion to dismiss and the Court heard oral arguments on the motion on August 8, 2014.amended complaint.
ITEM 4. MINE SAFETY DISCLOSURES
Not applicable.
Not applicable.
PART II
PART II
ITEM 5. MARKET FOR REGISTRANT'SREGISTRANT’S COMMON EQUITY, RELATED STOCKHOLDER MATTERS AND ISSUER PURCHASES OF EQUITY SECURITIES
Our common stock, par value $0.0001 per share, is traded on the New York Stock Exchange (the "NYSE"“NYSE”) under the symbol "LRN."“LRN.” Set forth below are the high and low sales prices for our common stock, as reported on the NYSE. As of August 11, 2014,July 31, 2017, there were 4131 registered holders of our common stock.
| | | | | | | |
| | High | | Low | |
|---|
Quarter ended: | | | | | | | |
June 30, 2014 | | $ | 26.20 | | $ | 21.14 | |
March 31, 2014 | | | 23.55 | | | 19.66 | |
December 31, 2013 | | | 31.66 | | | 17.15 | |
September 30, 2013 | | | 38.14 | | | 25.95 | |
June 30, 2013 | |
$ |
30.89 | |
$ |
23.24 | |
March 31, 2013 | | | 24.54 | | | 17.77 | |
December 31, 2012 | | | 22.40 | | | 15.83 | |
September 30, 2012 | | | 25.39 | | | 17.19 | |
| | | | | | |
| | High | | Low |
Quarter ended: | | | | | | |
June 30, 2017 | | $ | 21.18 | | $ | 17.16 |
March 31, 2017 | | | 20.67 | | | 16.16 |
December 31, 2016 | | | 17.84 | | | 10.17 |
September 30, 2016 | | | 14.41 | | | 10.67 |
| | | | | | |
June 30, 2016 | | | 12.91 | | | 9.16 |
March 31, 2016 | | | 11.19 | | | 7.11 |
December 31, 2015 | | | 14.45 | | | 8.80 |
September 30, 2015 | | | 14.95 | | | 12.15 |
Stock Performance Graph
The graph below matchescompares the cumulative return of holders of K12 Inc.'s’s common stock with the cumulative returns of the S&P 500 index, the NASDAQ Composite index,Index, the Russell 2000 indexIndex and our Peer Group Index, which is composed of American Public Education Inc., Apollo Group Inc., Bridgepoint Education Inc., Capella Education Company, Devry Inc., Grand Canyon Education Inc., ITT Educational Services, Inc., Pearson PLC, Rosetta Stone Inc., Scholastic Corporation, Strayer Education Inc. and Universal Technical Institute. The graph assumes that the value of the investment in the Company'sour common stock, in each index (including reinvestment of dividends) was $100 on June 30, 20092012 and tracks it through June 30, 2014.2017. All prices reflect closing prices on the last day of trading at the end of each calendar quarter.
COMPARISON OF TWENTY QUARTERFIVE-YEAR CUMULATIVE TOTAL RETURN(1)(2)
Among K12 Inc., S&P 500 Index, NASDAQ Composite Index, Russell 2000 Index and Peer Group Index
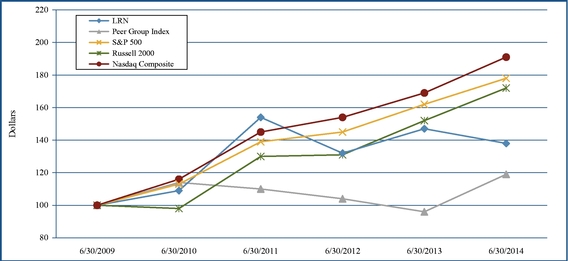
| | | | | | | | | | | | | | | | | | | |
| | 30-Jun-09 | | 30-Jun-10 | | 30-Jun-11 | | 30-Jun-12 | | 30-Jun-13 | | 30-Jun-14 | |
|---|
LRN | | | 100 | | | 109 | | | 154 | | | 132 | | | 147 | | | 138 | |
Peer Group Index | | | 100 | | | 114 | | | 110 | | | 104 | | | 96 | | | 119 | |
S&P 500 | | | 100 | | | 113 | | | 139 | | | 145 | | | 162 | | | 178 | |
Russell 2000 | | | 100 | | | 98 | | | 130 | | | 131 | | | 152 | | | 172 | |
Nasdaq Composite | | | 100 | | | 116 | | | 145 | | | 154 | | | 169 | | | 191 | |
(1)The information presented above in the stock performance graph shall not be deemed "soliciting material" or to be "filed" with the SEC or subject to Regulation 14A or 14C, except to the extent that we subsequently specifically request that such information be treated as soliciting material or specifically incorporate it by reference into a filing under the Securities Act of 1933, as amended (the "Securities Act"), or a filing under the Exchange Act.
(2)The stock price performance shown on the graph is not necessarily indicative of future price performance. Information used in the graph was obtained from a source we believe to be reliable, but we do not assume responsibility for any errors or omissions in such information.
Dividend Policy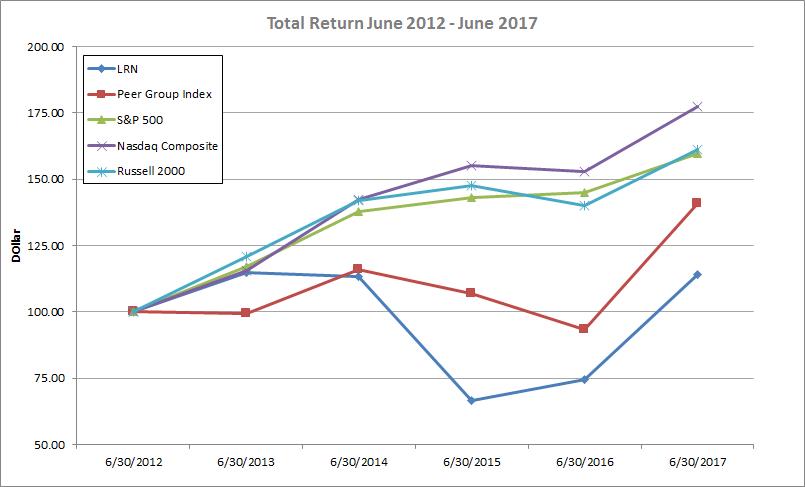
| | | | | | | | | | | | |
| | 30-Jun-12 | | 30-Jun-13 | | 30-Jun-14 | | 30-Jun-15 | | 30-Jun-16 | | 30-Jun-17 |
LRN | | 100 | | 115 | | 113 | | 67 | | 75 | | 114 |
Peer Group Index | | 100 | | 100 | | 116 | | 107 | | 93 | | 141 |
S&P 500 | | 100 | | 117 | | 138 | | 143 | | 145 | | 160 |
Russell 2000 | | 100 | | 115 | | 143 | | 155 | | 153 | | 178 |
Nasdaq Composite | | 100 | | 121 | | 142 | | 148 | | 140 | | 161 |
| (1) | | The information presented above in the stock performance graph shall not be deemed “soliciting material” or to be “filed” with the SEC or subject to Regulation 14A or 14C, except to the extent that we subsequently specifically request that such information be treated as soliciting material or specifically incorporate it by reference into a filing under the Securities Act of 1933, as amended (the “Securities Act”), or a filing under the Exchange Act. |
| (2) | | The stock price performance shown on the graph is not necessarily indicative of future price performance. Information used in the graph was obtained from a source we believe to be reliable, but we do not assume responsibility for any errors or omissions in such information. |
Dividend Policy
We have never declared or paid any cash dividends on our common stock and we currently do not anticipate paying any cash dividends for the foreseeable future. Instead, we anticipate that all of our earnings on our common stock will be used to provide working capital, to support our operations, and to finance the growth and development of our business, including potentially the acquisition of, or investment in, businesses, technologies or products that complement our existing business. Any future determination relating to dividend policy will be made at the discretion of our Board of Directors and will depend on a number of factors, including, but not limited to, our future earnings, capital requirements, financial condition, future prospects, and applicable Delaware law, which provides that dividends are only payable out of surplus or current net profits and other factors our Board of Directors might deem relevant.
Stock-basedStock‑based Incentive Plan Information
The following table provides certain information as of June 30, 2014,2017, with respect to our equity compensation plans under which common stock is authorized for issuance:
Equity Compensation Plan Information
as
As of June 30, 2014
2017
| | | | | | | | |
| | Number of | | | | | Number of Securities | |
| | Securities to be | | | | | Remaining Available for | |
| | Issued Upon | | | | | Future Issuance under | |
| | Exercise of | | Weighted-Average | | Equity Compensation | |
| | Outstanding | | Exercise Price of | | Plans (Excluding Securities | |
| | Options | | Outstanding Options | | Reflected in First Column) | |
Equity compensation plans approved by security holders | | 1,356,528 | (1) | $ | 20.19 | | 4,384,718 | (2) |
| | | | | | | | | | |
| | Number of
Securities to be
Issued Upon
Exercise of
Outstanding
Options | | Weighted-
Average
Exercise
Price of
Outstanding
Options | | Number of Securities
Remaining Available
for Future Issuance
under Equity
Compensation
Plans (Excluding
Securities Reflected
in First Column) | |
|---|
Equity compensation plans approved by security holders(1) | | | 2,578,401 | | $ | 21.44 | | | 2,767,532 | |
| | | | | | | | |
| | | | | | | | | | | |
| | | | | | | | | | | |
| | | | | | | | |
Includes shares under the 2007 Equity Incentive Award Plan.
(1)The 2007 Equity Incentive Award Plan (the "EIP") adopted in October 2007, as amended in 2010 and approved by the stockholders, contains an "evergreen provision" that allows for an annual increase in the number of shares available for issuance under the EIP on July 1 of each year during the ten-year term of the EIP ending October 30, 2017. The annual increase in the number of shares shall be equal to the least of:
•4% of our outstanding common stock on the applicable July 1;
•2,745,098 shares; or
•a lesser number of shares as determined by our Board of Directors.
| (1) | | Includes shares under the 2016 Incentive Award Plan (“2016 Plan”) and the 2007 Equity Incentive Award Plan (“2007 Plan”). |
| (2) | | The 2016 Plan, which became effective upon its approval by the stockholders on December 15, 2016, authorizes the issuance of up to 9,768,550 shares as of the effective date. |
Issuer Purchases of Equity Securities
On November 4, 2013, the Board of Directors authorized the repurchase of up to $75.0 million of the Company'sour outstanding common stock over a two year period. Any purchases under the buyback arewere dependent upon business and market conditions and other factors. The stock purchases arewere made from time to time and may be made through a variety of methods including open market purchases and trading plans that may bewere adopted in accordance with the Rule 10b5-110b‑18 of the Exchange Act. For the three and twelve monthsfiscal year ended June 30, 2014, the Company2015, we paid approximately $21.9$26.5 million and $48.5 million, respectively, in cash to redeem 952,896 and 2,195,196repurchase 1,307,402 shares respectively, of common stock at an average price of $22.99$20.23 per share. There were no repurchases of shares made during the fiscal years ended June 30, 2017 and $22.102016. As of June 30, 2017 and 2016 total shares purchased under the plan were 3,502,598, at an average cost of $21.41 per share, respectively. At June 30, 2014, approximately $26.5 million remained authorized for repurchase.
| | | | | | | | | | | | | |
Monthly Period during the Quarter Ended June 30, 2014 | | Total
Shares
Purchased | | Average
Price Paid
Per Share | | Total Shares
Purchased as
Part of Publically
Announced Plan | | Approximate
Dollar Amount of
Shares Yet To Be
Repurchased Under
Plan (In Millions) | |
|---|
April 1, 2014 - April 30, 2014 | | | 436,400 | | $ | 22.25 | | | | | | | |
May 1, 2014 - May 31, 2014 | | | 281,400 | | $ | 23.37 | | | | | | | |
June 1, 2014 - June 30, 2014 | | | 235,096 | | $ | 23.91 | | | | | | | |
| | | | | | | | | | | | | |
| | | | | | | | | | | | | | |
Total | | | 952,896 | | $ | 22.99 | | | 2,195,196 | | $ | 26.5 | |
Table of Contentsand there were no shares remaining to be repurchased under the plan.
ITEM 6. SELECTED FINANCIAL DATA
The following table sets forth our selected consolidated statement of operations, balance sheet and other data as of the dates and for the periods indicated. You should read this data together with "Item“Item 7—Management'sManagement’s Discussion and Analysis of Financial Condition and Results of Operations"Operations” and our consolidated financial statements and related notes, included elsewhere in this Annual Report. The selected consolidated statementstatements of operations data for each of the years in the three-yearthree year period ended June 30, 2014,2017, and the selected consolidated balance sheet data as of June 30, 20142017 and 2013,2016, have been derived from our audited consolidated financial statements, which are included elsewhere in this Annual Report. The selected consolidated statements of operations data for the years ended June 30, 20112014 and 20102013 and selected consolidated balance sheet data as of June 30, 2012, 20112015, 2014 and 2010,2013, have been derived from our audited
consolidated financial statements not included in this Annual Report. Our historical results are not necessarily indicative of future operating results.
| | | | | | | | | | | | | | | |
| | Year Ended June 30, |
| | 2017 | | 2016 | | 2015 | | 2014 | | 2013 |
| | (In thousands) |
Consolidated Statement of Operations Data: | | | | | | | | | | | | | | | |
Revenues | | $ | 888,519 | | $ | 872,700 | | $ | 948,294 | | $ | 919,553 | | $ | 848,220 |
Cost and expenses | | | | | | | | | | | | | | | |
Instructional costs and services | | | 557,316 | | | 546,510 | | | 607,756 | | | 569,219 | | | 498,398 |
Selling, administrative and other operating expenses | | | 305,617 | | | 302,205 | | | 307,730 | | | 313,258 | | | 283,032 |
Product development expenses | | | 12,457 | | | 10,071 | | | 14,381 | | | 14,220 | | | 21,084 |
Total costs and expenses | | | 875,390 | | | 858,786 | | | 929,867 | | | 896,697 | | | 802,514 |
Income from operations | | | 13,129 | | | 13,914 | | | 18,427 | | | 22,856 | | | 45,706 |
Realized gain on sale of assets | | | — | | | — | | | — | | | 6,404 | | | — |
Impairment of investment in Web International Education Group, Ltd. | | | (10,000) | | | — | | | (3,200) | | | — | | | — |
Interest income (expense), net | | | 1,808 | | | (617) | | | (91) | | | (69) | | | 851 |
Income before income taxes and noncontrolling interest | | | 4,937 | | | 13,297 | | | 15,136 | | | 29,191 | | | 46,557 |
Income tax expense | | | (5,396) | | | (4,746) | | | (5,810) | | | (11,075) | | | (20,023) |
Net income (loss) | | | (459) | | | 8,551 | | | 9,326 | | | 18,116 | | | 26,534 |
Add net loss attributable to noncontrolling interest | | | 910 | | | 484 | | | 1,662 | | | 1,484 | | | 1,577 |
Net income attributable to common stockholders, including Series A stockholders(1) | | $ | 451 | | $ | 9,035 | | $ | 10,988 | | $ | 19,600 | | $ | 28,111 |
| | | | | | | | | | | | | | | |
| | Year Ended June 30, |
| | 2017 | | 2016 | | 2015 | | 2014 | | 2013 |
| | (In thousands except share and per share data) |
Net income attributable to common stockholders, including Series A stockholders, per share: | | | | | | | | | | | | | | | |
Basic | | $ | 0.01 | | $ | 0.24 | | $ | 0.29 | | $ | 0.50 | | $ | 0.72 |
Diluted(1) | | $ | 0.01 | | $ | 0.23 | | $ | 0.29 | | $ | 0.50 | | $ | 0.72 |
Weighted average shares used in computing per share amounts: | | | | | | | | | | | | | | | |
Basic | | | 38,298,581 | | | 37,613,782 | | | 37,330,569 | | | 38,987,470 | | | 36,267,345 |
Diluted(1) | | | 39,500,934 | | | 38,850,388 | | | 37,625,425 | | | 39,230,516 | | | 39,017,345 |
Other Data: | | | | | | | | | | | | | | | |
Net cash provided by operating activities | | $ | 88,728 | | $ | 121,778 | | $ | 120,085 | | $ | 122,873 | | $ | 94,387 |
Depreciation and amortization | | $ | 74,280 | | $ | 68,225 | | $ | 83,801 | | $ | 86,267 | | $ | 65,737 |
Stock-based compensation expense | | $ | 22,598 | | $ | 18,617 | | $ | 21,299 | | $ | 22,828 | | $ | 14,374 |
EBITDA(2) | | $ | 87,409 | | $ | 82,139 | | $ | 102,228 | | $ | 115,527 | | $ | 111,443 |
Capital Expenditures: | | | | | | | | | | | | | | | |
Capitalized curriculum development costs | | $ | 19,132 | | $ | 21,627 | | $ | 18,057 | | $ | 15,411 | | $ | 18,560 |
Purchases of property, equipment and capitalized software development costs | | $ | 29,092 | | $ | 41,273 | | $ | 43,683 | | $ | 33,958 | | $ | 31,785 |
New capital lease obligations(3) | | $ | 14,469 | | $ | 10,878 | | $ | 14,654 | | $ | 24,132 | | $ | 24,703 |
Total capital expenditures | | $ | 62,693 | | $ | 73,778 | | $ | 76,394 | | $ | 73,501 | | $ | 75,048 |
| | | | | | | | | | | | | | | | |
| | Year Ended June 30, | |
|---|
| | 2014 | | 2013 | | 2012 | | 2011 | | 2010 | |
|---|
| | (In thousands)
| |
|---|
Consolidated Statement of Operations Data: | | | | | | | | | | | | | | | | |
Revenues | | $ | 919,553 | | $ | 848,220 | | $ | 708,407 | | $ | 522,434 | | $ | 384,470 | |
| | | | | | | | | | | | |
| | | | | | | | | | | | | | | | | |
Cost and expenses | | | | | | | | | | | | | | | | |
Instructional costs and services | | | 569,219 | | | 498,398 | | | 408,560 | | | 307,111 | | | 222,029 | |
Selling, administrative and other operating expenses | | | 313,258 | | | 283,032 | | | 245,274 | | | 174,762 | | | 117,398 | |
Product development expenses | | | 14,220 | | | 21,084 | | | 25,593 | | | 16,347 | | | 9,576 | |
| | | | | | | | | | | | |
| | | | | | | | | | | | | | | | | |
Total costs and expenses | | | 896,697 | | | 802,514 | | | 679,427 | | | 498,220 | | | 349,003 | |
| | | | | | | | | | | | |
| | | | | | | | | | | | | | | | | |
Income from operations | | | 22,856 | | | 45,706 | | | 28,980 | | | 24,214 | | | 35,467 | |
Realized gain on sale of assets | | | 6,404 | | | — | | | — | | | — | | | — | |
Interest (expense) income, net | | | (69 | ) | | 851 | | | (989 | ) | | (1,207 | ) | | (1,331 | ) |
| | | | | | | | | | | | |
| | | | | | | | | | | | | | | | | |
Income before income tax expense and noncontrolling interest | | | 29,191 | | | 46,557 | | | 27,991 | | | 23,007 | | | 34,136 | |
Income tax expense | | | (11,075 | ) | | (20,023 | ) | | (11,882 | ) | | (11,342 | ) | | (13,249 | ) |
| | | | | | | | | | | | |
| | | | | | | | | | | | | | | | | |
Net income | | | 18,116 | | | 26,534 | | | 16,109 | | | 11,665 | | | 20,887 | |
Add net loss attributable to noncontrolling interest | | | 1,484 | | | 1,577 | | | 1,434 | | | 1,127 | | | 638 | |
| | | | | | | | | | | | |
| | | | | | | | | | | | | | | | | |
Net income attributable to common stockholders, including Series A stockholders(1) | | $ | 19,600 | | $ | 28,111 | | $ | 17,543 | | $ | 12,792 | | $ | 21,525 | |
| | | | | | | | | | | | |
| | | | | | | | | | | | | | | | | |
| | | | | | | | | | | | | | | | | |
| | | | | | | | | | | | |
Table of Contents
| | | | | | | | | | | | | | | | |
| | Year Ended June 30, | |
|---|
| | 2014 | | 2013 | | 2012 | | 2011 | | 2010 | |
|---|
| | (In thousands except share and per share data)
| |
|---|
Net income attributable to common stockholders per share: | | | | | | | | | | | | | | | | |
Basic | | $ | 0.50 | | $ | 0.72 | | $ | 0.46 | | $ | 0.37 | | $ | 0.72 | |
Diluted(1) | | $ | 0.50 | | $ | 0.72 | | $ | 0.45 | | $ | 0.37 | | $ | 0.71 | |
Weighted average shares used in computing per share amounts: | | | | | | | | | | | | | | | | |
Basic | | | 38,987,470 | | | 36,267,345 | | | 35,802,678 | | | 31,577,758 | | | 29,791,973 | |
Diluted(1) | | | 39,230,516 | | | 39,017,345 | | | 38,740,863 | | | 34,635,594 | | | 30,248,683 | |
Other Data: | | | | | | | | | | | | | | | | |
Net cash provided by operating activities | | $ | 123,477 | | $ | 95,293 | | $ | 32,991 | | $ | 67,213 | | $ | 54,680 | |
Depreciation and amortization | | $ | 86,267 | | $ | 65,737 | | $ | 58,033 | | $ | 42,934 | | $ | 25,761 | |
Stock-based compensation expense | | $ | 22,828 | | $ | 14,374 | | $ | 10,067 | | $ | 9,466 | | $ | 5,934 | |
EBITDA(2) | | $ | 115,527 | | $ | 111,443 | | $ | 87,013 | | $ | 67,148 | | $ | 61,228 | |
Capital Expenditures: | | | | | | | | | | | | | | | | |
Capitalized curriculum development costs | | $ | 15,411 | | $ | 18,560 | | $ | 16,123 | | $ | 18,086 | | $ | 13,904 | |
Purchases of property, equipment and capitalized software development costs | | $ | 33,958 | | $ | 31,785 | | $ | 32,477 | | $ | 29,563 | | $ | 10,357 | |
New capital lease obligations(3) | | $ | 24,132 | | $ | 24,703 | | $ | 27,209 | | $ | 15,645 | | $ | 12,194 | |
| | | | | | | | | | | | |
| | | | | | | | | | | | | | | | | |
Total capital expenditures | | $ | 73,501 | | $ | 75,048 | | $ | 75,809 | | $ | 63,294 | | $ | 36,455 | |
| | | | | | | | | | | | |
| | | | | | | | | | | | | | | | | |
| | | | | | | | | | | | | | | | | |
| | | | | | | | | | | | |
| | | | | | | | | | | | | | | |
| | As of June 30, |
| | 2017 | | 2016 | | 2015 | | 2014 | | 2013 |
| | (In thousands) |
Consolidated Balance Sheet Data: | | | | | | | | | | | | | | | |
Cash and cash equivalents | | $ | 230,864 | | $ | 213,989 | | $ | 195,852 | | $ | 196,109 | | $ | 181,480 |
Total assets | | $ | 735,284 | | $ | 734,055 | | $ | 708,599 | | $ | 711,667 | | $ | 718,896 |
Current portion of capital lease obligations | | $ | 11,880 | | $ | 13,210 | | $ | 16,635 | | $ | 20,492 | | $ | 19,785 |
Capital lease obligations, net of current portion | | $ | 10,025 | | $ | 9,922 | | $ | 13,022 | | $ | 16,447 | | $ | 16,107 |
Total K12 Inc. stockholders’ equity | | $ | 574,346 | | $ | 558,720 | | $ | 536,938 | | $ | 528,930 | | $ | 530,162 |
Working capital(4) | | $ | 355,831 | | $ | 322,843 | | $ | 348,306 | | $ | 351,441 | | $ | 348,762 |
| | | | | | | | | | | | | | | | |
| | As of June 30, | |
|---|
| | 2014 | | 2013 | | 2012 | | 2011 | | 2010 | |
|---|
| | (In thousands)
| |
|---|
Consolidated Balance Sheet Data: | | | | | | | | | | | | | | | | |
Cash and cash equivalents | | $ | 196,109 | | $ | 181,480 | | $ | 144,652 | | $ | 193,099 | | $ | 81,751 | |
Total assets | | $ | 711,667 | | $ | 718,896 | | $ | 648,835 | | $ | 582,095 | | $ | 307,882 | |
Total short-term debt | | $ | 20,492 | | $ | 19,785 | | $ | 17,095 | | $ | 13,357 | | $ | 12,247 | |
Total long-term obligations | | $ | 16,447 | | $ | 16,107 | | $ | 15,901 | | $ | 10,851 | | $ | 8,365 | |
Total K12 Inc. stockholders' equity | | $ | 528,930 | | $ | 530,162 | | $ | 473,494 | | $ | 448,621 | | $ | 221,851 | |
Working capital | | $ | 351,441 | | $ | 348,762 | | $ | 289,226 | | $ | 264,447 | | $ | 149,344 | |
(1)For the years ended, June 30, 2013, 2012, 2011 and 2010, diluted net income per common share reflects pro rata net income allocated to the 2,750,000 non-voting shares of the Series A Special Stock issued in the acquisition of KCDL in July 2010. These shares were converted into common stock on September 3, 2013 and no Series A Special stock remains outstanding as of June 30, 2014.
(2)EBITDA consists of net income, plus net interest expense, income tax expense, depreciation and amortization minus noncontrolling interest charges. Interest expense primarily consists of interest expense for capital leases, long-term and short-term borrowings. We use EBITDA in addition to income from operations and net income as a measure of operating performance. However, EBITDA is not a recognized measurement under U.S. generally accepted accounting principles, or GAAP, and when analyzing our operating performance, investors should use EBITDA in addition to, and not as an alternative for, net income as determined in accordance with GAAP. Because not all companies use identical calculations, our presentation of EBITDA may not be comparable to similarly titled measures of other companies. Furthermore, EBITDA is not intended to be a measure of free cash
| (1) | | For the year ended June 30, 2013, diluted net income per common share reflects pro rata net income allocated to the 2,750,000 non‑voting shares of the Series A Special Stock issued in the acquisition of KCDL in July 2010. These shares were converted into common stock on September 3, 2013 and no Series A Special stock remains outstanding as of June 30, 2017. |
| (2) | | EBITDA is defined as net income (loss) attributable to common stockholders, including Series A stockholders, as adjusted for interest income (expense), net; impairment of investment in Web International Education Group, Ltd.; income tax benefit (expense); noncontrolling interest; and depreciation and amortization. Interest income (expense), net primarily consists of interest expense for capital leases, long‑term and short‑term borrowings. We use EBITDA in addition to income (loss) from operations and net income (loss) as a measure of operating performance. However, EBITDA is not a recognized measurement under U.S. generally accepted accounting principles, or GAAP, and when analyzing our operating performance, investors should use EBITDA in addition to, and not as an alternative for, net income (loss) as determined in accordance with GAAP. Because not all companies use identical calculations, our presentation of EBITDA may not be comparable to similarly titled measures of other companies. Furthermore, EBITDA is not intended to be a measure of free cash flow for our management’s discretionary use, as it does not consider certain cash requirements such as capital expenditures, tax payments, interest payments, or other working capital. |
Table of Contents
flow for our management's discretionary use, as it does not consider certain cash requirements such as capital expenditures, tax payments, interest payments, or other working capital.
We believe EBITDA is useful to an investor in evaluating our operating performance because it is widely used to measure a company'scompany’s operating performance without regard to items such as depreciation and amortization, which can vary depending upon accounting methods and the book value of assets, and to present a meaningful measure of corporate performance exclusive of our capital structure and the method by which assets were acquired. Our management uses EBITDA:
• | · | | as an additional measurement of operating performance because it assists us in comparing our performance on a consistent basis; and |
| · | | in presentations to the members of our Board of Directors to enable our Board to have the same measurement basis of operating performance as is used by management to compare our current operating results with corresponding prior periods and with the results of other companies in our industry. |
| (3) | | New capital lease obligations are primarily for student computers and related equipment. |
The following table provides a reconciliation of net income attributable to common stockholders, including Series A stockholders, to EBITDA:
| | | | | | | | | | | | | | | |
| | Year Ended June 30, |
| | 2017 | | 2016 | | 2015 | | 2014 | | 2013 |
| | (In thousands) |
Net income attributable to common stockholders, including Series A stockholders | | $ | 451 | | $ | 9,035 | | $ | 10,988 | | $ | 19,600 | | $ | 28,111 |
Interest (income) expense, net | | | (1,808) | | | 617 | | | 91 | | | 69 | | | (851) |
Impairment of investment in Web International Education Group, Ltd. | | | 10,000 | | | — | | | 3,200 | | | — | | | — |
Income tax (benefit) expense | | | 5,396 | | | 4,746 | | | 5,810 | | | 11,075 | | | 20,023 |
Depreciation and amortization(5) | | | 74,280 | | | 68,225 | | | 83,801 | | | 86,267 | | | 65,737 |
Noncontrolling interest | | | (910) | | | (484) | | | (1,662) | | | (1,484) | | | (1,577) |
EBITDA | | $ | 87,409 | | $ | 82,139 | | $ | 102,228 | | $ | 115,527 | | $ | 111,443 |
| (4) | | Working capital is calculated by subtracting current liabilities from current assets. |
| (5) | | For fiscal year 2015, depreciation and amortization includes $13.9 million of expense related to accelerated depreciation and amortization for certain curriculum, learning systems and other fixed assets that will no longer be used or developed, computer peripherals that will not be reclaimed, and the write‑off of capitalized software that will be abandoned. For fiscal year 2014, depreciation and amortization includes approximately $18.6 million for certain curriculum, learning systems and other fixed assets that will no longer be used or developed, computers that we estimate will not be returned and additional provisions for the decision to discontinue certain products and for excess inventory relative to anticipated demand. |
| | | | | | | | | | | | | | | | |
| | Year Ended June 30, | |
|---|
| | 2014 | | 2013 | | 2012 | | 2011 | | 2010 | |
|---|
| | (In thousands)
| |
|---|
Net Income attributable to common stockholders, including Series A stockholders | | $ | 19,600 | | $ | 28,111 | | $ | 17,543 | | $ | 12,792 | | $ | 21,525 | |
Interest expense (income), net | | | 69 | | | (851 | ) | | 989 | | | 1,207 | | | 1,331 | |
Income tax expense | | | 11,075 | | | 20,023 | | | 11,882 | | | 11,342 | | | 13,249 | |
Depreciation and amortization(4) | | | 86,267 | | | 65,737 | | | 58,033 | | | 42,934 | | | 25,761 | |
Noncontrolling interest | | | (1,484 | ) | | (1,577 | ) | | (1,434 | ) | | (1,127 | ) | | (638 | ) |
| | | | | | | | | | | | |
| | | | | | | | | | | | | | | | | |
EBITDA | | $ | 115,527 | | $ | 111,443 | | $ | 87,013 | | $ | 67,148 | | $ | 61,228 | |
| | | | | | | | | | | | |
| | | | | | | | | | | | | | | | | |
| | | | | | | | | | | | | | | | | |
| | | | | | | | | | | | |
(3)New capital lease obligations are primarily for student computers and related equipment.
(4)For fiscal year 2014, depreciation and amortization includes approximately $18.6 million for certain curriculum, learning systems and other fixed assets that will no longer be used or developed, computers that we estimate will not be returned and additional provisions for the decision to discontinue certain products and for excess inventory relative to anticipated demand.
Table of Contents
ITEM 7. MANAGEMENT'SMANAGEMENT’S DISCUSSION AND ANALYSIS OF FINANCIAL CONDITION AND RESULTS OF OPERATIONS
This Management'sManagement’s Discussion and Analysis of Financial Condition and Results of Operations ("(“MD&A"&A”) contains certain forward-lookingforward‑looking statements within the meaning of Section 21E of the Securities Exchange Act of 1934, as amended. Historical results may not indicate future performance. Our forward-lookingforward‑looking statements reflect our current views about future events, are based on assumptions, and are subject to known and unknown risks and uncertainties that could cause actual results to differ materially from those contemplated by these statements. Factors that may cause differences between actual results and those contemplated by forward-lookingforward‑looking statements include, but are not limited to, those discussed in "Risk Factors"“Risk Factors” in Part I, Item 1A, of this Annual Report. We undertake no obligation to publicly update or revise any forward-lookingforward‑looking statements, including any changes that might result from any facts, events, or circumstances after the date hereof that may bear upon forward-lookingforward‑looking statements. Furthermore, we cannot guarantee future results, events, levels of activity, performance, or achievements.
This MD&A is intended to assist in understanding and assessing the trends and significant changes in our results of operations and financial condition. As used in this MD&A, the words, "we," "our"“we,” “our” and "us"“us” refer to K12 Inc. and its consolidated subsidiaries. This MD&A should be read in conjunction with our consolidated financial statements and related notes included elsewhere in this Annual Report. The following overview provides a summary of the sections included in our MD&A:
• | · | | Executive Summary—a general description of our business and key highlights of the year ended June 30, 2017. |
| · | | Key Aspects and Trends of Our Operations—a discussion of items and trends that may impact our business in the upcoming year. |
| · | | Critical Accounting Policies and Estimates—a discussion of critical accounting policies requiring critical judgments and estimates. |
| · | | Results of Operations—an analysis of our results of operations in our consolidated financial statements. |
| · | | Liquidity and Capital Resources—an analysis of cash flows, sources and uses of cash, commitments and contingencies, seasonality in the results of our operations, the impact of inflation, and quantitative and qualitative disclosures about market risk. |
Executive Summary
—a general description of our business and key highlights of the fiscal year ended June 30, 2014.
•Key Aspects and Trends of Our Operations—a discussion of items and trends that may impact our business in the upcoming year.
•Critical Accounting Policies and Estimates—a discussion of critical accounting policies requiring critical judgments and estimates.
•Results of Operations—an analysis of our results of operations in our consolidated financial statements.
•Liquidity and Capital Resources—an analysis of cash flows, sources and uses of cash, commitments and contingencies, seasonality in the results of our operations, the impact of inflation, and quantitative and qualitative disclosures about market risk.
Executive Summary
We are a technology-basedtechnology‑based education company. Wecompany and offer proprietaryonline curriculum, software systems and educational services designed to facilitate individualized learning for students primarily in kindergarten through 12th grade, or K-12.K‑12. Our mission is to maximize a child's potential by providing access to an engaging and effective education, regardless of geographic location or socio-economic background. We provide a continuum of technology-based educational products and solutions to public school districts, public schools, charter schools, private schools and families as we strive to transform the student's experience into one that delivers individualized education on a highly scalable basis.
We achieved revenue growth during fiscal year 2014, primarily in our online managed public schools. We increased revenues to $919.6 million from $848.2 million, a growth rate of 8.4% from fiscal year 2013. In fiscal year 2014, operating income decreased to $22.9 million from $45.7 million in fiscal year 2013, a decrease of 49.9%; net income attributable to common stockholders decreased to $19.6 million from $28.1 million, a decrease of 30.2% and EBITDA, a non-GAAP measure (see reconciliation of net income to EBITDA in "Item 6—Selected Financial Data"), increased to $115.5 million from $111.4 million, an increase of 3.7%. The operating income for fiscal year 2014 included $31.2 million of severancelearning systems combine curriculum, instruction and related stock-based compensation, accelerated depreciation and amortizationsupport services to create an individualized learning approach well-suited for certain curriculum, learning
Table of Contents
systems, trade names, and other fixed assets that will no longer be used or developed and additional provisions for inventory that we previously anticipated using.
Our Managed Public Schools line of business, which includes virtual and blended public schools, generally under long-term turn-key management contractsschool districts, charter schools and private schools that utilize varying degrees of online and traditional classroom instruction, and other educational applications. These products and services are provided to three lines of business: Managed Public School Programs (curriculum and services sold to managed public schools), Institutional (curriculum, technology and services provided to school districts, public schools and other educational institutions that we do not manage), and Private Pay Schools and Other (private schools for which we charge student tuition and make direct consumer sales).
Managed Public School Programs accounted for approximately 88%83% of our revenuerevenues in fiscalthe year 2014. For bothended June 30, 2017. A Managed Public School Program provides substantially all of the administrative functions, technology and academic support services, online curriculum, learning systems and instructional services. These arrangements are negotiated with and approved by the governing authorities of our customers, which are mostly virtual and blended managed public schools, the governing authority with control over the school negotiates contractual terms with us for all aspects of the management of the school, including monitoring academic achievement, teacher recruitment and training, student recruitment and marketing, compensation recommendations for school personnel, financial management, enrollment processing and procurement of curriculum, equipment and other required services.charter schools. For the 2014-15 school year ended June 30, 2017, we expectprovided our Managed Public School Programs to manage 77 schools in 33a majority of states andthroughout the District of Columbia.United States.
ThroughWith our Institutional Sales business, we work closely as partners with a growing numberdo not assume primary management responsibilities for the schools. Rather, the Institutional business sells online curriculum programs and technology (full time and part time), courses, teacher instruction, and various support tools and platforms (see description of PEAK below) to schools and school districts enabling them to offer their students an arraydistricts. Our
Institutional business consists of both Non-managed Public School Programs and Institutional Software and Services. Non-managed Public School Programs include schools where K12 provides the curriculum and technology for full-time virtual and blended programs, semester courses and supplemental solutions.the school can also contract for instruction, marketing, enrollment or other educational services. Non-managed Public School Programs do not offer primary administrative oversight. The Institutional Software and Services offerings provide an array of online educational products and support services to meet the specific needs of the school or school district and its students. In addition to curriculum, systems and programs, we also provide teacher training, teaching services and otherthe support services. The services we provide to these schools and school districtscustomers are designed to assist them in launching their own online and blended learning programs which vary accordingtailored to the needs of the individual school and school districttheir own requirements and may include teacher training programs, administrator support and our PEAK management system. PEAK is a platform designed to centrally manage multiple online solutions across a school or district through one application. With our services, schools and districts can offer programs that allow students to participate full-time, as their primary school, or part-time, supplementing their education with core courses, electives, credit recovery options, remediation and supplemental content options. During the 2013-14 school year, we continued to provide these services to school districts or individual schools in all 50 states
Our Private Pay Schools and the District of Columbia.
We operateOther include three accredited online private schools that we operate in which parents can enroll students on a tuition basis for a full-time online education or individual courses to supplement their children'schildren’s traditional instruction. These include our K12schools are: (1) K12 International Academy, an online private school that enables us to offer students worldwide the same full-time education programs and curriculum that we provide to the virtual and blended public schools, (2) The Keystone School, a private school that offers online and correspondence courses, and (3) the George Washington University Online High School, a school that offers a college preparatory curriculumprogram and is designed for middle and high school students who are seeking a challenging academic experience. In addition, during
We believe that the past year, we owned and operated the International Schoolacceptance of Berne, a traditional private school located in Berne, Switzerland and a recognized IB school serving studentsonline education in grades Pre-K through 12. In June 2014, we completed a sale of select businesses, including the InternationalK-12 continues to grow, and anticipate that increased overall demand for virtual options in education will translate into increased demand for both our Non-managed Public School of Berne, to Safanad Education Ventures Limited. The other select businesses divested consisted of our interest in an existing Middle East joint venture currently operating with a Safanad Limited affiliatePrograms and our post-secondary business.Institutional Sales business (sold under the brand names Fuel Education or FuelEd). The results of federal and state elections can also result in shifts in education policy and the amount of funding available for various education programs.
For the year ended June 30, 2017, revenues increased to $888.5 million from $872.7 million for the year ended June 30, 2016, an increase of 1.8% primarily due to our Managed Public School Programs. Over the same period, operating income decreased to $13.1 million from $13.9 million for the year ended June 30, 2016, a decrease of 5.8%; net income attributable to common stockholders decreased to $0.5 million from $9.0 million in the year ended June 30, 2016, a decrease of 94.4%; and EBITDA, a non‑GAAP measure (see reconciliation of net income to EBITDA in “Item 6—Selected Financial Data”), increased to $87.4 million from $82.1 million in the year ended June 30, 2016, an increase of 6.5%. The operating income for the year ended June 30, 2016 included charges of $7.1 million related to the Settlement Agreement with the State of California.
Financial Statement Overview
As a result of acquisitions, our business has evolved significantly, thereby impacting the comparability of period to period financial results. During 2012, we acquired KVE and Insight Schools (the "Kaplan/Insight Assets"). These acquisitions accounted for a portion of the increases in our revenue, student enrollments and operating costs, including transaction and integrations costs. In addition, we experienced growth from the new state schools added in recent years identified above and the continued ramp-up in student enrollments and associated variable operating costs from schools opening over the last five years.
Student enrollment in our Managed Public Schools hasSchool Programs experienced a shift in the mix of students with an increased level of high school students. The shift occurred as a result of our acquisition of the Kaplan/Insight Assets, which only serve students in grades 6-12, and from organic growth in many of the schools we serve. The continued expansion of our Institutional Sales and our International and Private Pay Schools and Other also shifts the mix of our revenuerevenues and associated costs of providing services including additional sales
Table of Contents
personnel, third-party distributor costs and third-party royalty costs for our Institutional Sales.business. We may continue to experience changes in our enrollment, revenuerevenues and cost mix as we continue to expand into markets different than our traditional Managed Public Schools.School Programs.
Our headcount growth from approximately 3,300 employees at the beginning of 2012 to approximately 4,200 at the end of our 2014 fiscal year, including teachers associated with our enrollment growth, the development of the Institutional Sales, including the expansion of a sales force, and the decision to have more K12-employed teachers in our managed schools have also directly impacted our operating expenses during the last three years. We believe that all the above factors, particularly the significant infrastructure investments, acquisitions and the depreciation and amortization associated with our acquired assets and infrastructure investments, reduce the comparability of our operating results between periods.
Key Aspects and Trends of Our Operations
Revenues—Overview
We generate a significant portion of our revenues from the sale of curriculum, management and technology services to managed virtual and blended public schools, where we provide turn-keyturn‑key management services. Approximately 88%83% of our revenues were derived from this source in fiscalthe year 2014.ended June 30, 2017. We anticipate that these revenues will continue to represent the majority of our total revenues over the next several years. However we also expect revenues in other aspects of our business to increase as we execute on our growth strategy. Our growth strategy includes increasing revenues in other distribution channels, adding enrollments in our private schools and expanding our Institutional business, and pursuing international opportunities to offer our learning systems. Combined revenues from these other sectors were significantly smaller than that from the Managed Public SchoolsSchool Programs in fiscalthe year 2014.ended June 30, 2017. Our success in
executing our strategies will impact future growth. We provide products and services primarily to three lines of business: Managed Public Schools,School Programs, Institutional Sales and International and Private Pay Schools.Schools and Other.
Factors affecting our revenues include:
(i)the number of enrollments;
(ii)the mix of enrollments across grades and states;
(iii)management services provided to the schools and school districts;
(iv)state or district per student funding levels and attendance requirements;
(v)prices for our products and services;
(vi)growth in our other customer types; and
(vii)revenues from new initiatives, mergers and acquisitions.
We define an enrollment as any student enrolled in a student using our curriculum.virtual or blended public school which qualifies as a Public School Program. Generally, students will take four to six courses, except for some kindergarten students who may participate in half-dayhalf‑day programs. We count each half-dayhalf‑day kindergarten student as an enrollment. School sessions generally begin in August or September and end in May or June. To ensure that all schools are reflected in our measure of enrollments, we consider the number of students on the last dayfirst Wednesday of SeptemberOctober to be our opening enrollment level, and the number of students enrolled on the last day of May to be our ending enrollment level. For each period, average enrollments represent the average of the month-endmonth‑end enrollment levels for each school month in the period. We continually evaluate our enrollment levels by state, by school and by grade. We track new student enrollments and withdrawals throughout the year.
Table of Contents
We believe that our revenue growth from enrollments depends upon the following:
•the number of states and school districts in which we operate;
•the mix of students served;
•the restrictive terms of local laws or regulations, including enrollment caps;
•the appeal of our curriculum and instructional model to students and families;
•the specific school or school district requirements including credit recovery or special needs;
•the effectiveness of our program in delivering favorable academic outcomes;
•the quality of the teachers working in the schools we serve;
•the effectiveness of our marketing and recruiting programs to attract new enrollments; and
•retention of students through successive grade levels.
| · | | the number of states and school districts in which we operate; |
| · | | the mix of students served; |
| · | | the restrictive terms of local laws or regulations, including enrollment caps; |
| · | | the appeal of our curriculum and instructional model to students and families; |
| · | | the specific school or school district requirements including credit recovery or special needs; |
| · | | the effectiveness of our program in delivering favorable academic outcomes; |
| · | | the quality of the teachers working in the schools we serve; |
| · | | the effectiveness of our marketing and recruiting programs to attract new enrollments; and |
| · | | retention of students through successive grade levels. |
In fiscal year 2014, we increased2017, total average student enrollments in Managed Public School Programs increased by 5,696,759 or 4.8%0.7%, to 123,259,103,694 as compared to total average student enrollments of 117,563102,935 in fiscal year 2013. In fiscal year 2013, we increased total average student enrollments by 13,274, or 12.7%, to 117,563, as compared to total average student enrollments of 104,289 in fiscal year 2012.2016. We continually evaluate our trends in revenues by monitoring the number of student enrollments in total, by state, by school and by grade, assessing the impact of changes in school funding levels and the pricing of our curriculum and educational services. In fiscal year 2014years 2017 and 2013,2016, the growth rate of our revenuerevenues exceeded the growth in our managed school average student enrollments
primarily due to increases in the per-pupilper‑pupil rate of achieved state funding in somecertain states, school mix (distribution of enrollments by school) and other factors, including changes in state funding rates and higher utilization in federal and state restricted funding per managed student. During the year ended June 30, 2017, we had no contracts that represented 10% or more of total revenues.
Enrollments in these schoolsManaged Public School Programs on average generate substantially more revenues than enrollments served through our Institutional Salesbusiness where we provide limited or no management services. Similarly, revenues earned per pupil across our private school programs vary. As we continue to build our Institutional Salesbusiness and increase enrollment in International and Private Pay Schools and Other, enrollment mix is expected to shift and may impact growth in revenues relative to the growth in enrollments.
In fiscal year 2014,During the years ended June 30, 2017, 2016 and 2015, we derived approximately 13% and 10% of our revenues, respectively, from thehad a contract with Agora Cyber Charter School ("Agora"(“Agora”) in Pennsylvaniathat represented approximately $28.7 million, $18.5 million and $129.8 million of revenues, respectively.
In fiscal year 2015, Agora renegotiated its service agreement and entered into a three year contract with us to purchase our curriculum and certain technology services, while the Ohio Virtual Academy. In aggregate, these schools accounted forschool board assumed daily operational responsibilities, including its charter renewal process and marketing and enrollment activities. This assumption of responsibilities caused the classification of Agora to change from a Managed Public School Program to a non-managed school within the Institutional business. The net impact of this event on the fiscal year 2016 revenues attributable to the loss of the management component of the Agora contract was approximately 23%$111 million. Renegotiation and renewal of our total revenues. We provide our full turn-key management solution pursuant to our contract withfully integrated Managed Public School Program contracts by independent school boards occurs as well. On July 12, 2017, for example, we disclosed on a Form 8-K that the Ohio Virtual Academy which terminates on June 30, 2017. We provide our full turn-key solution to Agora pursuant torenewed a contractfully managed program agreement with us for a five (5) year term commencing at the school that expires on June 30, 2015. Instart of fiscal year 2014, Agora elected to use a request for proposal process for the services and products required to operate the school for the 2015-16 school year in connection with its charter renewal application. The annual revenues generated under each of these contracts represented a material portion2018. Although this contract may not generate 10% or more of our total revenues in fiscal year 2014; however,2018 or in future years, we are filing it with this report as our managed public schools expand and other business sectors grow, these proportions may decrease.Exhibit 99.1 for informational purposes.
While Managed Public SchoolsSchool Programs constitute the majority of our revenue,revenues, there is emergingincreasing demand by public school districts, individualpublic schools and other educational institutions for more limited components of our online services and products than are used in Managed Public Schools.School Programs. Sales to those entities are conducted through our Institutional Salesbusiness organization. While we expect long-termlong‑term growth opportunities in our Institutional Sales business, the sector is currently experiencingcontinues to experience significant competitive pricing pressures.
Table of Contents
The Institutional Salesbusiness portfolio contains an array of curriculum and technology solutions packaged in a portfolio of flexible learning and delivery models mapped to specific student, school and district needs. This portfolio provides a continuum of delivery models, from full and part-timepart‑time virtual to blended learning and other options that can be used in traditional classrooms to differentiate instruction. The Institutional Salesbusiness course catalog is comprehensive and enables districts to offer their students educational opportunities that otherwise might not be financially justifiable, such as Advanced Placement ("AP"(“AP”), honors, world languages, remediation, credit recovery, alternative education, career and technology electives and college readiness. In connection with these solutions, we also offer highly qualified state-certifiedstate‑certified teachers, professional development and other support services as needed by our customers.
Given the variables discussed in further detail below, we believe that the best performance metric for the Institutional Salesbusiness is revenues. The customers served by the Institutional Salesbusiness organizations purchase curriculum in a variety of ways, making consistent comparisons on the basis of enrollments less relevant. For example, we serve not only full-timefull‑time students, but also students taking semester-longsemester‑long courses, students who recover credits through concentrated four to eighteen-weekeighteen‑week programs, students who are using our curricula as a supplemental enhancement to their traditional textbook, and teachers who may present our lessons on an interactive whiteboard as either the core of their instruction or as an engaging supplement to their lecture. Given all these variables, it is therefore difficult to identify a single metric (such as a full time equivalent or "FTE"“FTE”), or combination of metrics (such as course enrollments or programs sold), that can accurately capture the entirety of the Institutional Sales. Indeed,business. Therefore, our efforts to do so led us to the conclusion that at this time, revenue isrevenues are the best performance metric for the Institutional Sales.business.
Sales opportunities in the Institutional Salesbusiness are driven by a number of factors in a diverse customer population, which determine the deliverable and price. These factors include:
• | · | | Type of Customer—A customer can be a U.S.‑based public school district, private school, charter school, early childhood learning center or corporate partner. |
Table of Customer—A customer can be a U.S.-based public, private or public charter school, a district, regional education agency, or a commercial company that provides services to students.
•Curriculum Needs—We sell our curriculum solutions based on the scope of the customer need, and a solution is generally purchased as end-user access to a complete catalog, individual course or supplemental content title.
•License Options—Depending on the scope of the solution, a license can be purchased for individual course enrollments, annual seat, school or district-wide site licenses or a perpetual license (a prepaid lifetime license). We charge incrementally if we are hosting the solution.
•Hosting—Customers may host curricula themselves or license our hosted solution. We are able to track all students for customers who use our hosted solution. However, more often in large-scale, district-wideContents
| · | | Curriculum Needs—We sell our curriculum solutions based on the scope of the customer need, and a solution is generally purchased as end‑user access to a complete catalog, individual course or supplemental content title. |
| · | | License Options—Depending on the scope of the solution, a license can be purchased for individual course enrollments, annual seat, school or district‑wide site licenses or a perpetual license (a prepaid lifetime license). We may charge incrementally if we are hosting the solution. |
| · | | Hosting—Customers may host curricula themselves or license our hosted solution. We are able to track all students for customers who use our hosted solution. However, more often in large‑scale, district‑wide implementations, a customer may choose to host the curriculum, and in that case we have no visibility of individual student usage for counting enrollments. |
| · | | Services Menu—Instructional services may be provided and priced per‑enrollment or bundled in the overall price of the solution. Additional services, including professional development, title maintenance and support may also be provided and are priced based on the scope of services. |
On June 9, 2016, Agora signed a new service agreement with us that extends through 2019 and included additional services including curriculum and certain technology services while the school board retained daily operational responsibilities. The agreement also calls for payment terms of outstanding receivables to be paid over an approximate two‑year period resulting in that case we have no visibilityreclassification of individual student usage for counting enrollments.
•Services Menu—Instructional services may be provideda portion to long‑term assets (Deposits and priced per-enrollment or bundled in the overall price of the solution. Additional services, including professional development, title maintenance and support may also be provided and are priced based on the scope of services.Private schools are managed schools where tuition is paid directly by the family of the student. We receive no public funds for students in our private schools. We operate three private online schools at differing price points and service levels. Our revenue isrevenues are derived from tuition receipts that are a function of course enrollments and program price. In some circumstances, a third-partythird‑party school may elect to enroll one of its students in a K12K12 private school course as a supplement to the student'sstudent’s regular on-campuson‑campus instruction. In such cases, the third-partythird‑party school may pay the K12K12 private school tuition.
Table of Contents
Our private schools business has evolved over the past three years as we have acquired and developed new private school offerings with different structures and price points. This has made the use of full-time equivalent metrics no longer as meaningful. As a result, we report performance in the private pay schools on the basis of the student counts and semester-course enrollments which more accurately reflects the way revenues and expenses occur in the business.
Student counts tell us how many individual students have been served at any point in time. As a result of the variation in the number of courses taken by students, we measure the total size of our schools by "semester-course enrollments" ("SCEs"). A semester long course is counted as a single SCE and a year-long course is counted as two SCEs. Private school students take courses ranging from a single, semester long K-8 course to a twelve high school course annual load. For example, a student who takes six courses per semester for two semester accounts for twelve SCEs.
Some of our private school operations, notably Keystone and the K12 International Academy, start classes on a monthly or rolling basis. As a result, there are students in our system of education at any point in time who have just started a course, just finished a course or have partially completed a course.
We believe our revenue growth depends primarily on the recruitment of students into our programs through effective marketing and word-of-mouthword‑of‑mouth referral based on the quality of our service. In addition, through high service quality, we seek to retain existing students and increase the total number of courses each student takes with us. In some cases, students return each summer and take only one course. In other cases, students choose a K12K12 private school as their principal form of education and may stay for many years. The flexibility of our programs, the quality of our curriculum and teaching, and the student community features lead to customer satisfaction and therefore, retention.
We have entered into agreements which enable us to distribute our products and services to our international school partners throughout the world who use our courses as a supplement to their on-campuson‑campus academic programs. These courses provide students with additional electives, advanced placement (AP)AP courses, and sometimes include dual-degreedual‑degree programs that the school cannot offer on its own. Student enrollments derived from partner school programs are included in the count of SCEs for these private schools.
We sometimes offer additional teacher assistance, counseling, clubs and other additive services to our basic course offerings. These additive services may carry additional fees that appear in our revenue. During the majority of fiscal year 2014, we also operated IS Berne, a traditional private school in Switzerland. Through the sale date on June 11, 2014, enrollments and revenue from IS Berne are included in our private school totals along with the numbers from our online school operations. We do not include students in our consumer sales business as we are not involved in the progress of these students in the same way as we do in our other programs.
Instructional Costs and Services Expenses
Instructional costs and services expenses include expenses directly attributable to the educational products and services we provide. The Managed Public Schoolspublic schools we manage are the primary drivers of these costs, including teacher and administrator salaries and benefits and expenses of related support services. We also employ teachers and administrators for instruction and oversight in our Institutional Sales and Internationalbusiness and Private Pay Schools and Other business. Instructional costs also include fulfillment costs of student textbooks and materials, depreciation and reclamation costs of computers provided for student use, the cost of any third-partythird‑party online courses and the amortization of capitalized curriculum and related systems. Our instructional costs are variable and are based directly on our number of schools and enrollments.
In the near term, we expect high school enrollments to continue to grow as a percentage of total enrollments. Our high school offering requires increased instructional costs as a percentage of revenuerevenues compared to our kindergarten to 8th grade offering. This is due to the following: (i) generally lower student‑to‑teacher ratios; (ii) higher
student-to-teacher ratios; (ii) higher compensation costs for some teaching positions requiring subject-mattersubject‑matter expertise; (iii) ancillary costs for required student support services, including college placement, SAT preparation and guidance counseling; (iv) use of third-partythird‑party courses to augment our proprietary curriculum; and (v) use of a third-partythird‑party learning management system to service high school students. Over time, we may partially offset these factors by obtaining productivity gains in our high school instructional model, replacing third-partythird‑party high school courses with proprietary content, replacing our third-partythird‑party learning management system with another third-partythird‑party system, leveraging our school infrastructure and obtaining purchasing economies of scale.
We have deployed and are continuing to develop new delivery models, including blended schools, where students receive limited face-to-faceface‑to‑face instruction in a learning center to complement their online instruction, and other programs that utilize brick and mortar facilities. The maintenance, management and operations of these facilities necessitate additional costs, which are generally not required to operate typical virtual public schools. We are pursuing expansion into new states for both virtual public and other specialized charter schools. If we are successful, we will incur start-upstart‑up costs and other expenses associated with the initial launch of a school, including the funding of building leases and leasehold improvements.
Selling, Administrative and Other Operating Expenses
Selling, administrative and other operating expenses include the salaries and benefits of employees engaged in business development, public affairs, sales and marketing, and administrative functions, and transaction and due diligence expenses related to mergers and acquisitions.
Product Development Expenses
Product development expenses include research and development costs and overhead costs associated with the management of both our curriculum development and internal systems development teams. In addition, product development expenses include the amortization of internal systems. We measure and track our product development expenditures on a per course or project basis to measure and assess our development efficiency. In addition, we monitor employee utilization rates to evaluate our workforce efficiency. We plan to continue to invest in additional curriculum development and related software in the future, primarily to produce additional high school courses, world language courses and new releases of existing courses and to continue to upgrade our content management system and online schools.future. We capitalize selected costs incurred to develop our curriculum, beginning with application development, through production and testing into capitalized curriculum development costs. We capitalize certain costs incurred to develop internal systems into capitalized software development costs.
Expense Management
We are constantly searching for ways to deliver more value at a lower cost for our customers and we take pride in our ability to deliver highly-individualized,highly‑individualized, effective education solutions at significant savings to taxpayers. We have sought to increase efficiencies whenever possible without affecting educational quality. We believe our scale and infrastructure investment positions us for greater efficiency in future periods while allowing us to deliver more value for students.
Critical Accounting Policies and Estimates
The discussion of our financial condition and results of operations is based upon our consolidated financial statements, which have been prepared in accordance with U.S. GAAP. In the preparation of our consolidated financial statements, we are required to make estimates and assumptions that affect the reported amounts of assets, liabilities, revenues and expenses, as well as the related disclosures of contingent assets and liabilities. We base our estimates on historical experience and on various other assumptions that we believe to be reasonable under the circumstances. The results of our analysis form the
Table of Contents
basis for making assumptions about the carrying values of assets and liabilities that are not readily apparent from other sources. Actual results may differ from these estimates under different assumptions or conditions, and the impact of such differences may be material to our consolidated financial statements. Our critical accounting policies have been discussed with the Audit Committee of our Board of Directors. We believe that the following critical accounting policies affect the more significant judgments and estimates used in the preparation of our consolidated financial statements:
In accordance with Accounting Standards Codification ("ASC"(“ASC”) 605,Revenue Recognition (“ASC 605”), we recognize revenuerevenues when the following conditions are met: (1) persuasive evidence of an arrangement exists; (2) delivery
of physical goods or rendering of services is complete; (3) the seller'sseller’s price to the buyer is fixed or determinable; and (4) collection is reasonably assured.
We have determined that the separate elements of our multiple element contracts with managed schools do not have standalone value. Accordingly, we account for revenues received under multiple element arrangements with managed schools as a single unit of accounting and recognize the entire arrangement over the term of the contractual service period. While we have concluded that the elements of our contracts do not have standalone value, we invoice schools in accordance with the established contractual terms and rates. Generally, this means that for each enrolled student, we invoice their school on a per student basis for the following items: (1) access to our online school and online curriculum; (2) learning kits; and (3) student computers. We also invoice for management and technology services. We apply ASC 605 to each of these items as follows:
•Access to the Online School and Online Curriculum. Our proprietary learning management system ("OLS") revenues are generally earned on a per course basis from schools and school districts. Students enrolled through a school are provided access to the OLS and online curriculum. Revenues are earned ratably over the school year, typically 10 months, or over the semester depending on the length of the course.
•Learning Kits. The lessons in our online school are often accompanied with selected printed materials, workbooks, laboratory materials and other manipulative items which we provide to students. We generally ship all learning kits to a student when their enrollment is approved. Once materials have been shipped, our efforts are substantially complete. Therefore, we recognize revenues upon shipment. Shipments to schools that occur in the fourth fiscal quarter that are for the following school year are recorded in deferred revenues. We also earn reclamation fee income when we reclaim materials for schools at the end of the school year or when a student withdraws from the school.
•Student Computers. We provide many enrolled students with the use of a personal computer and complete technical support through our call center. Revenues are generally earned ratably over the school year and we also earn revenues for reclamation services when a student withdraws from a school and returns the computer which may occur in a subsequent school year.
•Management, Technology and Educational Services. Under most of our statewide virtual public and blended school contracts, we provide the boards of managed schools with turn-key management and technology services. We recognize these revenues ratably over our fiscal year as administrative offices of the school remain open for the entire year. Our management and technology service fees are generally a contracted percentage of yearly school funding. To determine the pro rata amount of revenues to recognize in a fiscal quarter, we estimate the total funds each school will receive in a particular school year. Total funds for a school are primarily a function of the number of students enrolled in the school and established per enrollment funding levels which are generally published on an annual basis by the state or school district.
| · | | Access to the Online School and Online Curriculum. Our proprietary learning management system (“OLS”) revenues are generally earned on a per course basis from schools and school districts. Students enrolled through a school are provided access to the OLS and online curriculum. Revenues are earned ratably over the school year, typically 10 months, or over the semester depending on the length of the course. |
| · | | Learning Kits. The lessons in our online school are often accompanied with selected printed materials, workbooks, laboratory materials and other manipulative items which we provide to students. We generally ship all learning kits to a student when their enrollment is approved. Once materials have been shipped, our efforts are substantially complete. Therefore, we recognize revenues upon shipment. Shipments to schools that occur in the fourth fiscal quarter that are for the following school year are recorded in deferred revenues. We also earn reclamation fee income when we reclaim materials for schools at the end of the school year or when a student withdraws from the school. |
| · | | Student Computers. We provide many enrolled students with the use of a personal computer and complete technical support through our call center. Revenues are generally earned ratably over the school year and we also earn revenues for reclamation services when a student withdraws from a school and returns the computer which may occur in a subsequent school year. |
| · | | Management, Technology and Educational Services. Under most of our statewide virtual public and blended school contracts, we provide the boards of managed schools with turn‑key management and technology services. We recognize these revenues ratably over our fiscal year as administrative offices of the school remain open for the entire year. Our management and technology service fees are generally a contracted percentage of yearly school funding. To determine the pro rata amount of revenues to recognize in a fiscal quarter, we estimate the total funds each school will receive in a particular school year. Total funds for a school are primarily a function of the number of students enrolled in the school and established per enrollment funding levels, which are generally published on an annual basis by the state or school district. |
Table of Contents
To determine the pro rata amount of revenues to recognize in a fiscal quarter, we estimate the total funds each school will receive in a particular school year. Total funds for a school are primarily a function of the number of students enrolled in the school and established per enrollment funding levels, which are generally published on an annual basis by the state or school district. We review our estimates of funding periodically, and revise as necessary, amortizing any adjustments to earned revenues over the remaining portion of the fiscal year. Actual school funding may vary from these estimates, and the impact of these differences could have a material impact on our results of operations. Since the end of the school year coincides with the end of our fiscal year, weannual revenues are generally able to base our annual revenuesbased on actual school funding.funding and actual costs incurred (including costs for our services to the schools plus other costs the schools may incur) in the calculation of school operating losses. Our schoolsschools’ reported results are subject to annual school district financial audits, which incorporate enrollment counts, funding and other routine financial audit considerations. The results of these audits are incorporated into our monthly funding estimates and for the reported fiscal years ended June 30, 2013, 20122017, 2016 and 2011,2015 our aggregate funding estimates differed from actual reimbursements impacting total reported revenuerevenues by approximately 0.2%(0.1)%, (0.1%)0.4% and 0.7%(0.1)%, respectively.
Under the contracts where the Company provideswe provide turnkey management services to schools, the Company haswe have generally agreed to absorb any operating losses of the schools in a given school year. These school operating losses represent the excess of costs incurred over revenues earned by the virtual or blended public school as reflected on its respective financial statements, including Companyour charges to the schools. To the extent a school does not receive funding for each student enrolled
in the school, the school would still incur an operating loss forcosts associated with serving the unfunded enrollment. If losses due to unfunded enrollments result in a net operating loss for the year that loss is reflected as a reduction in the revenuerevenues and net receivables that we collect from the school. A school net operating loss in one year does not necessarily mean the Company anticipateswe anticipate losing money on the entire contract with the school. However, a school operating loss may reduce the Company'sour ability to collect its management fees in full and recognized revenues are reduced accordingly to reflect the expected cash collections from such schools. The Company amortizesWe amortize the estimated school operating loss against revenues based upon the percentage of actual revenues in the period to total estimated revenues for the fiscal year.
For turnkey revenue service contracts,contract revenues, a school operating loss may reduce our ability to collect our management fees in full, though as noted it does not necessarily mean that we incur a loss during the period with respect to our services to that school. We recognize revenue,revenues, net of our estimated portion of school operating losses, to reflect the expected cash collections from such schools. Revenue isRevenues are recognized based on our performance of services under the contract, which we believe is proportionate to our incurrence of costs. We incur costs directly related to the delivery of services. Most of these costs are recognized throughout the year; however, certain costs related to upfront delivery of printed materials, workbooks, laboratory materials and other items are provided at the beginning of the school year and are recognized as expenseexpenses when shipped.
Each state or school district has variations in the school funding formulas and methodologies that we use to estimate funding for revenue recognition at our respective schools. As we build the funding estimates for each school, we are mindful of the state definition for count dates on which reported enrollment numbers will be used for per pupil funding. The parameters we consider in estimating funding for revenue recognition purposes include school district count definitions, withdrawal rates, average daily attendance, special needs enrollment, student demographics, academic progress trajectory and historical completion, student location, funding caps and other state specified categorical program funding. The estimates we make each period on a school-by-school basis consider the latest information available to us and consider material relevant information at the time of the estimate.
Management periodically reviews its estimates of full-year school revenues and operating expenses and amortizes the net impact of any changes to these estimates over the remainder of the fiscal year. Actual school operating losses may vary from these estimates or revisions, and the impact of these differences could have a material impact on results of operations. Since the end of the school year coincides with the end of our fiscal year, annual revenues are generally based on actual school revenues
Table of Contents
funding and actual costs incurred (including costs for our services to the schools plus other costs the schools may incur) in the calculation of school operating losses. For the years ended June 30, 2014, 20132017, 2016 and 2012, the Company's revenue2015, our revenues included a reduction for these school operating losses of $49.8$61.0 million, $64.5$57.1 million, and $54.8$65.2 million, respectively.
A school operating loss may result from a combination of cost increases or funding reductions attributable to the following:
•costs associated with opening new schools including the initial hiring of teachers, administrators and the establishment of school infrastructure;
•school requirements to establish contingency reserves;
•one-time costs, such as legal claims;
•funding reductions due to the inability to qualify specific students for funding;
•regulatory or academic performance thresholds that may restrict the ability of a school to fund all expenses;
•inadequate school funding in particular states;
•providing services without receiving state funding when enrollments occur after enrollment count dates; and
•burdensome regulations creating excessive costs.
| · | | costs associated with opening new schools, including the initial hiring of teachers, administrators and the establishment of school infrastructure; |
| · | | school requirements to establish contingency reserves; |
| · | | one‑time costs, such as legal claims; |
| · | | funding reductions due to the inability to qualify specific students for funding; |
| · | | regulatory or academic performance thresholds that may restrict the ability of a school to fund all expenses; |
| · | | inadequate school funding in particular states; |
| · | | providing services without receiving state funding when enrollments occur after enrollment count dates; and |
| · | | burdensome regulations creating excessive costs. |
We generate a small percentage of our revenues from the sale of perpetual licenses of curriculum and ongoing support to schools. Under ASC 605, weWe account for the license and support of separate units of accounting and recognize revenues associated with the license up front and ongoing maintenance and support over the performance period. We also generate
a small percentage of our revenues through the sale of our online courses and learning kits directly to consumers, as well as providing hosting services to certain customers. We record revenue for consumer services over the term of the course subscription.
For the year ended June 30, 2014,2017, special education students comprisecomprised approximately 13% of our student population and approximately 21%20% of estimated funding for revenue recognition purposes at our schools. We compute revenuerevenues at the school level not based on the type of student served; therefore, we are unable to determine the revenuerevenues and profitability by student type. For each student enrolled, we receive basic per pupil funds determined by state funding and count definitions, and policies which vary from state-to-state.state‑to‑state. Additionally, based on the needs of the student population, we may receive supplemental special education state funding grants and federal funding under the Individuals with Disabilities Education Act. While we do not track profitability at the student level, these supplemental funding programs are intended to offset part of the costs of the education needs of children with learning disabilities through reimbursement of qualifying costs under the programs.
Allowance for Doubtful Accounts
We maintain an allowance for uncollectible accounts primarily for estimated losses resulting from the inability or failure of individual customers to make required payments. We analyze accounts receivable, historical percentages of uncollectible accounts, and changes in payment history when evaluating the adequacy of the allowance for uncollectible accounts. We write-off accounts receivable based on the age of the receivable and the facts and circumstances surrounding the customer and reasons for non-payment. We record an allowance for estimated uncollectible accounts in an amount approximating anticipated losses. Actual write-offs might exceed the recorded allowance.
Capitalized Curriculum Development Costs
Our curriculum is primarily developed by our employees and, to a lesser extent, by independent contractors. Generally, our courses cover traditional subjects and utilize examples and references designed to remain relevant for long periods of time. The online nature of our curriculum allows us to incorporate user feedback rapidly and make ongoing corrections and improvements. For these reasons, we believe that our courses, once developed, have an extended useful life, similar to computer software. We also publish textbooks and other offline materials. Our curriculum is integral to our learning systems. Our customers generally do not acquire our curriculum or future rights to it.
Due to the similarity in development stages and long economic life of curriculum to computer software, we capitalize curriculum development costs incurred during the application development stage in
Table of Contents
accordance with ASC 350,Intangibles -- Goodwill and Other (“ASC 350”), Intangibles—Goodwill and Other.Other. ASC 350 provides guidance for the treatment of costs associated with computer software development and defines those costs to be capitalized and those to be expensed. Costs that qualify for capitalization are external direct costs, payroll and payroll-relatedpayroll‑related costs. Costs related to general and administrative functions are not capitalizable and are expensed as incurred. We capitalize curriculum development costs during the design, development and deployment phases of the project. Many of our new courses leverage off of proven delivery platforms and are primarily content, which has no technological hurdles. As a result, a significant portion of our courseware development costs qualify for capitalization due to the concentration of our development efforts on the content of the courseware. Capitalization ends when a course is available for general release to our customers, at which time amortization of the capitalized costs begins. Capitalized costs are recorded in capitalized curriculum development costs. The period of time over which these development costs will be amortized is generally five years. This is consistent with the capitalization period used by others in our industry and corresponds with our product development lifecycle. The Company wrote down approximately $2.2 million of capitalized curriculum development costs due to its decision to discontinue certain curriculum during the fiscal year ended June 30, 2014. There were no material write-downs of capitalized curriculum development costs for the fiscal years ended June 30, 2013 and 2012.
We develop our own proprietary computer software programs to provide specific functionality to support both our unique education offerings and the student and school management services. These programs enable us to develop courses, process student enrollments, meet state documentation requirements, track student academic progress, deliver online courses to students, coordinate and track the delivery of course-specificcourse‑specific materials to students and provide teacher support and training. These applications are integral to our learning systems and we continue to enhance existing applications and create new applications. Our customers do not acquire our software or future rights to it.
We capitalize software development costs incurred during development in accordance with ASC 350. These capitalized development costs are included in capitalized software development costs and are generally amortized over three years. During the fiscal year ended June 30, 2014, the Company wrote down approximately $3.8 million
Impairment of Long-livedLong‑lived Assets
Long-livedLong‑lived assets include property, equipment, capitalized curriculum and software developed or obtained for internal use. In accordance with ASC 360,Property, Plant and Equipment (“ASC 360”), we review our recorded long-livedlong‑lived assets for impairment annually or whenever events or changes in circumstances indicate that the carrying amount of an asset may not be fully recoverable. We determine the extent to which an asset may be impaired based upon our expectation of the asset'sasset’s future usability as well as on a reasonable assurance that the future cash flows associated with the asset will be in excess of its carrying amount. If the total of the expected undiscounted future cash flows is less than the carrying amount of the asset, a loss is recognized for the difference between fair value and the carrying value of the asset. The Company wrote down approximately $2.2 million of capitalized curriculum development costs due to its decision to discontinue certain curriculum during the fiscal year ended June 30, 2014. During the fiscal year ended June 30, 2014, the Company also wrote down approximately $3.8 million of capitalized software projects after determining the assets either have no future use or are being sunset. There were no material impairment charges for the fiscal years ended June 30, 2013 and 2012.
| · | | We wrote down approximately $2.6 million of capitalized curriculum development costs due to our decision to discontinue certain curriculum during the year ended June 30, 2015. There were no material write‑downs of capitalized curriculum development costs for the years ended June 30, 2017 and 2016. |
| · | | We wrote down approximately $0.5 million and $4.8 million, respectively, of capitalized software projects after determining the assets either had no future use or are being sunset during the years ended June 30, 2016 and 2015. There were no material write-downs of capitalized software projects for the year ended June 30, 2017. |
| · | | We wrote down approximately $6.5 million of property and equipment, primarily related to computer peripherals shipped to students and for which no reclamation will be processed during the year ended June 30, 2015. There were no material write‑downs of computer peripherals for the years ended June 30, 2017 and 2016. |
Income Taxes
Table of Contents
We account for income taxes in accordance with ASC 740,Income Taxes (“ASC 740”). ASC 740 prescribes the use of the asset and liability method to compute the differences between the tax bases of assets and liabilities and the related financial amounts, using currently enacted tax laws. If necessary, a valuation allowance is established, based on the weight of available evidence, to reduce deferred tax assets to the amount that is more likely than not to be realized. Realization of the deferred tax assets, net of deferred tax liabilities, is principally dependent upon achievement of sufficient future taxable income. We exercise significant judgment in determining our provisions for income taxes, our deferred tax assets and liabilities and our future taxable income for purposes of assessing our ability to utilize any future tax benefit from our deferred tax assets.
Although we believe that our tax estimates are reasonable, the ultimate tax determination involves significant judgments that could become subject to examination by tax authorities in the ordinary course of business. We periodically assess the likelihood of adverse outcomes resulting from these examinations to determine the impact on our deferred taxes and income tax liabilities and the adequacy of our provision for income taxes. Changes in income tax legislation, statutory income tax rates or future taxable income levels, among other things, could materially impact our valuation of income tax assets and liabilities and could cause our income tax provision to vary significantly among financial reporting periods.
We have a valuation allowance on net deferred tax assets of $2.0$7.2 million and $1.3$4.3 million as of June 30, 20142017 and 2013,2016, respectively, for the amount that more likely than not will not be realized. The majority of our remaining net operating loss carryforwards were utilized during fiscal year 2013 and we made more significant federal income tax payments in fiscal year 2014.
We recognize stock-basedstock‑based compensation expense under the provisions of ASC 718,Compensation—Stock Compensation (“ASC 718”). We use the Black-ScholesBlack‑Scholes option pricing model to calculate the fair value of stock options at their respective grant date. The use of option valuation models requires the input of highly subjective assumptions, including the expected stock price volatility and the expected term of the option. The fair value of restricted stock awards is the fair market value on the date of grant. We recognize these compensation costs on a straight-linestraight‑line basis over the requisite service period, which is generally the vesting period of the award. During 2012 to 2014,the fiscal year 2015 through the fiscal year 2017, we granted more restricted stock awards than stock options, resulting in increased stock-basedstock‑based compensation that will be recognized over the required service periods. In addition, the vesting period is generally three years for
restricted stock compared to four years for stock options. The increase in restricted stock awards and the shorter vesting period has increased our stock-basedstock‑based compensation costs, and this increased cost is expected to continue in future periods.
We record as goodwill the excess of purchase price over the fair value of the identifiable net assets acquired. Finite-livedFinite‑lived intangible assets acquired in business combinations subject to amortization are recorded at their fair value. Finite-livedFinite‑lived intangible assets include the trade names, customer contractsacquired customers and curriculum and suchnon-compete agreements. Such intangible assets are amortized on a straight-linestraight‑line basis over their estimated useful lives based on third party valuations.lives. We periodically evaluate the remaining useful lives of intangible assets and adjust our amortization period if it is determined that such intangible assets have a shorter useful life. We evaluate the recoverability of our recorded goodwill and other intangible assets annually, or whenever a triggering event of impairment may occur. DuringWe currently have one reporting unit. In the prior fiscal year, 2014, we used a qualitative approach to evaluate goodwill for impairment. Duringhad two reporting units, which included Middlebury. The Middlebury reporting unit was merged into the K12 reporting unit during the fourth quarter of fiscal year ended June 30, 2014,2017. As a result of our purchase of the Company determinedremaining 40% interest in the joint venture, Middlebury Interactive Language, we began a process of integration. This integration included the accounting function, as well as the operations and management of remaining MIL employees. MIL no longer had a separate segment manager that reviewed results and reported into the Chief Operating Decision Maker (the “CODM”).
ASC 350 prescribes a two-step process for impairment testing of goodwill and intangibles with indefinite lives, which is performed annually, as well as when an event triggering impairment may have occurred. ASC 350 also allows preparers to qualitatively assess goodwill impairment through a screening process which would permit companies to forgo Step 1 of their annual goodwill impairment process. This qualitative screening process is referred to as “Step 0”. We perform our annual assessment on May 31st. Under the two-step process, the first step tests for potential impairment by comparing the fair value of reporting units with reporting units’ net asset values. If the fair value of a reporting unit exceeds the carrying value of the reporting unit’s net assets, then goodwill is not impaired and no further testing is required. If the fair value of reporting unit is below the reporting unit’s carrying value, then the second step is required to measure the amount of potential impairment. The second step requires an assignment of the reporting unit’s fair value to the reporting unit’s assets and liabilities, using the initial acquisition accounting guidance related to business combinations, to determine the implied fair value of the reporting unit’s goodwill. The implied fair value of the reporting unit’s goodwill is then compared with the carrying amount of the reporting unit’s goodwill to determine the goodwill impairment loss to be recognized, if any. If the carrying value of a reporting unit’s goodwill exceeds its implied fair value, an impairment loss equal to the difference is recorded.
Redeemable Noncontrolling Interest
Earnings or losses attributable to minority shareholders of a consolidated affiliated company are classified separately as “noncontrolling interest” in our consolidated statements of operations. Noncontrolling interests in subsidiaries that are redeemable outside of our control for cash or other assets are classified outside of permanent equity at redeemable value, which approximates fair value. If the redemption amount is other than fair value (e.g. fixed or variable), the redeemable noncontrolling interest is accounted for at the fixed or variable redeemable value. The redeemable noncontrolling interests are adjusted to their redeemable value at each balance sheet date. The resulting increases or decreases in the estimated redemption amount are affected by corresponding charges against retained earnings, or in the absence of retained earnings, additional paid-in-capital.
Results of Operations
We operate in one operating and reportable business segment as a technology‑based education company providing online curriculum, software systems and educational services designed to facilitate individualized learning for students primarily in kindergarten through 12th grade. The Chief Operating Decision Maker evaluates profitability based on rebrandingconsolidated results. We have three lines of thebusiness: Managed Public School Programs, Institutional Sales business, the Company fully amortized certain trade names that are no longer going to be used and recorded a $5.2 million impairment charge for the fiscal year ended June 30, 2014. During the fiscal year ended June 30, 2014, the Company also sold(educational
certain business assetsproducts and wrote off approximately $3.4 million of goodwillservices provided to school districts, public schools and $0.4 million of net intangible assets related to the assets of the businessother educational institutions that were sold. There were no material impairment chargeswe do not manage), and Private Pay Schools and Other (private schools for the years ended June 30, 2013which we charge student tuition and 2012.make direct consumer sales).
Our consolidated financial statements reflect the results of operations of our Middle East and Middlebury Interactive Languages (“MIL”) and LearnBop joint ventures. On December 27, 2016, we consummated the acquisition of the remaining 40% noncontrolling interest of MIL. Earnings or losses attributable to our partnerpartners are classified as "net“net loss attributable to noncontrolling interest"interest” in the accompanying consolidated statements of operations. Net income or net loss attributable to noncontrolling interest adjusts our consolidated net results of operations to reflect only our share of the after-taxafter‑tax earnings or losses of an affiliated company. In June 2014, we completed a sale of select businesses to Safanad Education Ventures Limited, including our interest in our Middle East joint venture which we had operated with a Safanad Limited affiliate.
In the formation of our joint venture with Middlebury College, at any time after the fifth (5th) anniversary of the agreement (April 2015), Middlebury College may give written notice of its irrevocable election to sell all (but not less than all) of its membership interest (put right) to us. The purchase price for Middlebury College's membership interest shall be its fair market value and we may, in our sole discretion, pay the purchase price in cash or shares of our common stock. At June 30, 2014, MIL had not met certain milestones associated with its Language Academy summer camp programs. As such, Middlebury College may exercise its option to either repurchase the camp programs at fair market value along with other contractual rights. Middlebury College has neither exercised nor expressed an intent to exercise the option.
Given the provision of the put right, the redeemable noncontrolling interest is redeemable outside of our control and it is recorded outside of permanent equity at its redemption value, which approximates fair value, in accordance with ASC 480,Distinguishing Liabilities from Equity. We adjust the redeemable noncontrolling interest to redemption value on each balance sheet date with changes in redemption value recognized as an adjustment to retained earnings, or in the absence of retained earnings, by adjustment to additional paid-in-capital. The redeemable value as of the end of each fiscal year is based on a third-party valuation, while the redeemable value during interim periods is based on management updates from the date of the most recent independent valuation. As of June 30, 2014 and 2013, the estimated redeemable noncontrolling interest was $16.8 million and $15.2 million, respectively.
We operate in one operating and reportable business segment: we are a technology-based education company. We offer proprietary curriculum, software systems and educational services designed to facilitate individualized learning for students primarily in kindergarten through 12th grade, or K-12. We have the following three lines of business: Managed Public Schools, Institutional Sales and International and Private Pay Schools. Our Chief Executive Officer is the Chief Operating Decision Maker (the "CODM"). Our CODM manages our business primarily by function and reviews financial information on a consolidated basis, accompanied by disaggregated information on revenues by line of business as well as certain operational data, for purposes of allocating resources and evaluating financial performance. The profitability of our business segments is not produced. The CODM only evaluates profitability based on consolidated results.
Table of Contents
Results of OperationsEnrollment Data
Managed Public Schools
The following table sets forth total average enrollment data for students in our Managed Public Schools. These figures exclude enrollments from our classroom pilot programs.
| | | | | | | | | | | | | | | | | | | | | | |
| | Year Ended June 30, | | Growth
2014 / 2013 | | Growth
2013 / 2012 | |
|---|
| | 2014 | | 2013 | | 2012 | | Change | | Change % | | Change | | Change % | |
|---|
Average Student Enrollments* | | | 123,259 | | | 117,563 | | | 104,289 | | | 5,696 | | | 4.8 | % | | 13,274 | | | 12.7 | % |
*TheSchool Programs and Non‑managed Public School Programs. Managed Public Schools average student enrollmentsSchool Programs include enrollmentsschools where K12 provides substantially all of the management, technology and academic support services in addition to curriculum, learning systems and instructional services. Non‑managed Public School Programs include schools where K12 provides curriculum and technology, and the school can also contract for which we receive no public funding. Additionally, Managedinstruction or other educational services. Non‑managed Public Schools enrollments include all programs which have been classified as turn-key programs or where substantial management services are performed in accordance with the contract.
School Programs, however, do not offer primary administrative oversight services. | | | | | | | | | | | | | | | | | | | |
| | | | | | | | | | | | | | | |
| | Year Ended June 30, | | 2017 / 2016 | | 2016 / 2015 |
| | 2017 | | 2016 | | 2015 | | Change | | Change % | | Change | | Change % |
| | | (In thousands, except percentages) |
| | | | | | | | | | | | | | | | | | | |
Managed Public School Programs (1)(2) | | | 103.7 | | | 102.9 | | | 114.6 | | | 0.8 | | 0.8% | | | (11.7) | | (10.2%) |
Non-managed Public School Programs (1) | | | 28.9 | | | 27.0 | | | 20.1 | | | 1.9 | | 7.0% | | | 6.9 | | 34.5% |
| (1) | | If a school changes from a Managed to a Non‑managed Program, the corresponding enrollment classification would change in the period in which the contract arrangement changed. |
| (2) | | Managed Public School Programs include enrollments for which K12 receives no public funding or revenue. |
International and Private Pay Schools
The following table sets forth total data for students in our International and Private Pay Schools. These figures exclude enrollments from our consumer program.
| | | | | | | | | | | | | | | | | | | | | | |
| | Year Ended June 30, | | Growth
2014 / 2013 | | Growth
2013 / 2012 | |
|---|
| | 2014 | | 2013 | | 2012 | | Change | | Change % | | Change | | Change % | |
|---|
Student Enrollments | | | 32,625 | | | 31,619 | | | 31,830 | | | 1,006 | | | 3.2 | % | | (211 | ) | | -0.7 | % |
Semester Course Enrollments | | | 89,630 | | | 84,642 | | | 83,519 | | | 4,988 | | | 5.9 | % | | 1,123 | | | 1.3 | % |
Revenue is captured by business line based on the underlying customer contractual agreement.agreements. Periodically, a customer may change business line classification. For example, a district that purchases a single course (Institutional Salesbusiness customer) may decide to convert to a full-timefull‑time virtual school program (Managed Public School customer).
Changes in business line classification occur at the time the contractual agreement is modified. The following represents our revenue for our three lines of business for each of the last threeperiods indicated:
| | | | | | | | | | | | | | | | | | | |
| | | | | | | | | | | | | | | |
| | | | | | | | | | | | | | | |
| | | | | | | | | | | | | | | |
| | Year Ended June 30, | | 2017 / 2016 | | 2016 / 2015 |
| | 2017 | | 2016 | | 2015 | | Change $ | | Change % | | Change $ | | Change % |
| | | (In thousands, except percentages) |
| | | | | | | | | | | | | | | | | | | |
Managed Public School Programs | | $ | 733,690 | | $ | 717,059 | | $ | 813,677 | | $ | 16,631 | | 2.3% | | $ | (96,618) | | (11.9%) |
Institutional | | | | | | | | | | | | | | | | | | | |
Non-managed Public School Programs | | | 65,362 | | | 55,601 | | | 39,321 | | | 9,761 | | 17.6% | | | 16,280 | | 41.4% |
Institutional Software & Services | | | 53,709 | | | 52,990 | | | 48,770 | | | 719 | | 1.4% | | | 4,220 | | 8.7% |
Total Institutional | | | 119,071 | | | 108,591 | | | 88,091 | | | 10,480 | | 9.7% | | | 20,500 | | 23.3% |
Private Pay Schools and Other | | | 35,758 | | | 47,050 | | | 46,526 | | | (11,292) | | (24.0%) | | | 524 | | 1.1% |
Total | | $ | 888,519 | | $ | 872,700 | | $ | 948,294 | | $ | 15,819 | | 1.8% | | $ | (75,594) | | (8.0%) |
Beginning in fiscal years.
| | | | | | | | | | | | | | | | | | | | | | |
| | Year Ended June 30, | | Growth 2014 / 2013 | | Growth 2013 / 2012 | |
|---|
(Dollars in thousands)
| | 2014 | | 2013 | | 2012 | | Change | | Change % | | Change | | Change % | |
|---|
Managed Public Schools | | $ | 804,469 | | $ | 730,800 | | $ | 596,142 | | $ | 73,669 | | | 10.1 | % | $ | 134,658 | | | 22.6 | % |
Institutional Business | | | 66,765 | | | 73,269 | | | 73,150 | | | (6,504 | ) | | -8.9 | % | | 119 | | | 0.2 | % |
International and Private Pay Business | | | 48,319 | | | 44,151 | | | 39,115 | | | 4,168 | | | 9.4 | % | | 5,036 | | | 12.9 | % |
| | | | | | | | | | | | | | | | | | |
| | | | | | | | | | | | | | | | | | | | | | | |
Total | | $ | 919,553 | | $ | 848,220 | | $ | 708,407 | | $ | 71,333 | | | 8.4 | % | $ | 139,813 | | | 19.7 | % |
| | | | | | | | | | | | | | | | | | |
| | | | | | | | | | | | | | | | | | | | | | | |
| | | | | | | | | | | | | | | | | | | | | | | |
| | | | | | | | | | | | | | | | | | |
Tableyear 2016, we presented revenue from Non‑managed Public School Programs as part of Contentsthe Institutional line of business, along with the Institutional Software and Services, which together constitute total Institutional revenue. In the prior year these revenues were presented as part of the Public School Programs line of business, which included both managed and non‑managed public school programs. We believe this revised presentation clarifies and better aligns the disclosure of Non‑Managed Program revenues with our operational and sales structure.
The following table sets forth statements of operations data and the amounts as a percentage of revenues for each of the periods indicated:
| | | | | | | | | | | | | | | | | | | |
| | Year Ended June 30, | |
|---|
| | 2014 | | 2013 | | 2012 | |
|---|
| | (Dollars in thousands)
| |
|---|
Revenues | | $ | 919,553 | | | 100.0 | % | $ | 848,220 | | | 100.0 | % | $ | 708,407 | | | 100.0 | % |
| | | | | | | | | | | | | | |
| | | | | | | | | | | | | | | | | | | | |
Cost and expenses | | | | | | | | | | | | | | | | | | | |
Instructional costs and services | | | 569,219 | | | 61.9 | % | | 498,398 | | | 58.7 | % | | 408,560 | | | 57.7 | % |
Selling, administrative and other operating expenses | | | 313,258 | | | 34.1 | % | | 283,032 | | | 33.4 | % | | 245,274 | | | 34.6 | % |
Product development expenses | | | 14,220 | | | 1.5 | % | | 21,084 | | | 2.5 | % | | 25,593 | | | 3.6 | % |
| | | | | | | | | | | | | | |
| | | | | | | | | | | | | | | | | | | | |
Total costs and expenses | | | 896,697 | | | 97.5 | % | | 802,514 | | | 94.6 | % | | 679,427 | | | 95.9 | % |
| | | | | | | | | | | | | | |
| | | | | | | | | | | | | | | | | | | | |
Income from operations | | | 22,856 | | | 2.5 | % | | 45,706 | | | 5.4 | % | | 28,980 | | | 4.1 | % |
Realized gain on sale of assets | | | 6,404 | | | 0.7 | % | | — | | | 0.0 | % | | — | | | 0.0 | % |
Interest income (expense), net | | | (69 | ) | | 0.0 | % | | 851 | | | 0.1 | % | | (989 | ) | | -0.1 | % |
| | | | | | | | | | | | | | |
| | | | | | | | | | | | | | | | | | | | |
Income before income tax expense and noncontrolling interest | | | 29,191 | | | 3.2 | % | | 46,557 | | | 5.5 | % | | 27,991 | | | 4.0 | % |
Income tax expense | | | (11,075 | ) | | -1.2 | % | | (20,023 | ) | | -2.4 | % | | (11,882 | ) | | -1.7 | % |
| | | | | | | | | | | | | | |
| | | | | | | | | | | | | | | | | | | | |
Net income | | | 18,116 | | | 2.0 | % | | 26,534 | | | 3.1 | % | | 16,109 | | | 2.3 | % |
Add net loss attributable to noncontrolling interest | | | 1,484 | | | 0.1 | % | | 1,577 | | | 0.2 | % | | 1,434 | | | 0.2 | % |
| | | | | | | | | | | | | | |
| | | | | | | | | | | | | | | | | | | | |
Net income attributable to common stockholders, including Series A stockholders | | $ | 19,600 | | | 2.1 | % | $ | 28,111 | | | 3.3 | % | $ | 17,543 | | | 2.5 | % |
| | | | | | | | | | | | | | |
| | | | | | | | | | | | | | | | | | | | |
| | | | | | | | | | | | | | | | | | | | |
| | | | | | | | | | | | | | |
| | | | | | | | | | | | | | | | | | | |
| | Year Ended June 30, | |
| | 2017 | | 2016 | | 2015 | |
| | (Dollars in thousands) | |
Revenues | | $ | 888,519 | | | 100.0 | % | $ | 872,700 | | | 100.0 | % | $ | 948,294 | | | 100.0 | % |
Cost and expenses | | | | | | | | | | | | | | | | | | | |
Instructional costs and services | | | 557,316 | | | 62.7 | | | 546,510 | | | 62.6 | | | 607,756 | | | 64.1 | |
Selling, administrative, and other operating expenses | | | 305,617 | | | 34.4 | | | 302,205 | | | 34.6 | | | 307,730 | | | 32.5 | |
Product development expenses | | | 12,457 | | | 1.4 | | | 10,071 | | | 1.2 | | | 14,381 | | | 1.5 | |
Total costs and expenses | | | 875,390 | | | 98.5 | | | 858,786 | | | 98.4 | | | 929,867 | | | 98.1 | |
Income from operations | | | 13,129 | | | 1.5 | | | 13,914 | | | 1.6 | | | 18,427 | | | 1.9 | |
Impairment of investment in Web International Education Group, Ltd. | | | (10,000) | | | (1.1) | | | — | | | — | | | (3,200) | | | (0.3) | |
Interest income (expense), net | | | 1,808 | | | 0.2 | | | (617) | | | (0.1) | | | (91) | | | (0.0) | |
Income before income taxes and noncontrolling interest | | | 4,937 | | | 0.6 | | | 13,297 | | | 1.5 | | | 15,136 | | | 1.6 | |
Income tax expense | | | (5,396) | | | (0.6) | | | (4,746) | | | (0.5) | | | (5,810) | | | (0.6) | |
Net income (loss) | | | (459) | | | (0.1) | | | 8,551 | | | 1.0 | | | 9,326 | | | 1.0 | |
Add net loss attributable to noncontrolling interest | | | 910 | | | 0.1 | | | 484 | | | 0.1 | | | 1,662 | | | 0.2 | |
Net income attributable to common stockholders | | | 451 | | | 0.1 | % | | 9,035 | | | 1.1 | % | | 10,988 | | | 1.2 | % |
Comparison of the Years Ended June 30, 20142017 and 20132016
Revenues. Our revenues for the year ended June 30, 2014 2017were $919.6$888.5 million, representing an increase of $71.4$15.8 million, or 8.4%1.8%, as compared to $848.2from $872.7 million for the year ended June 30, 2013. Our revenue growth was primarily attributable to an increase2016. Managed Public School Program revenues
increased $16.6 million, or 10.1%2.3%, year over year. The increase in Managed Public Schools revenue, largelySchool Program revenues was primarily due to overall enrollment growth of 4.8%the 0.8% increase in enrollments in both new and existing schools and increases in the per-pupil rate of achieved state funding in somecertain states, school mix (distribution of enrollments by school), and other changesfactors.
Total Institutional revenues increased $10.5 million, or 9.7%, primarily due to the additional revenues from expanded services in state funding rateskey accounts and higher utilization in federal and state restricted funding per managed student, and a $4.2 million increase in International andgrowth from our acquired digital game-based learning solutions company. Private Pay revenue, partially as a result of strong growth in iCademy course enrollments. Institutional business revenueSchools and Other revenues decreased $6.5$11.3 million, or 8.9%24.0%, fromover the prior year due to decreased volumethe closure of programs in the United Kingdom.
Enrollments in Managed Public School Programs on average generate more revenues than enrollments served through our Institutional business where we provide limited or no management services. As we continue to build our Institutional business and rates.the Managed Public School Programs business continues to mature, enrollment mix may shift and impact growth in revenues relative to the growth in enrollments.
Instructional costs and services expenses. Instructional costs and services expenses for year ended June 30, 2017 were $557.3 million, representing an increase of $10.8 million, or 2.0%, from $546.5 million for the year ended June 30, 2016. This increase in expense was primarily due to the incremental personnel and related benefit costs. Instructional costs and services expenses were 62.7% of revenues during the year ended June 30, 2017, an increase from 62.6% for the year ended June 30, 2016.
Selling, administrative, and other operating expenses. Selling, administrative, and other operating expenses for the year ended June 30, 2017 were $305.6 million, representing an increase of $3.4 million, or 1.1% from $302.2 million for the year ended June 30, 2016. This increase was primarily due to increases in severance and related accelerated stock-based compensation associated with reductions in headcount, restructuring charges associated with the consolidation of facilities, and advertising expense, partially offset by a decrease in professional fees during the year ended June 30, 2016. Selling, administrative, and other operating expenses were 34.4% of revenues during the year ended June 30, 2017, a decrease from 34.6% for the year ended June 30, 2016.
Product development expenses. Product development expenses for the year ended June 30, 2017 were $12.5 million, representing an increase of $2.4 million, or 23.8% from $10.1 million for the year ended June 30, 2016. The increase was primarily due to an increase in salaries and benefits and professional fees, as well as an increase in severance associated with reductions in headcount. As a percentage of revenues, product development expenses increased to 1.4% for the year ended June 30, 2017, as compared to 1.2% for the year ended June 30, 2016.
Interest income (expense), net. Net interest income for the year ended June 30, 2017 was $1.8 million as compared to $(0.6) million in the year ended June 30, 2016. The increase in net interest income was primarily associated with interest income on certain accounts receivable and lower interest expense associated with capital leases during the year ended June 30, 2017, as compared to the year ended June 30, 2016.
Impairment of investment in Web International Education Group, Ltd. Impairment of investment in Web International Education Group, Ltd. (“Web”) for the year ended June 30, 2017 was $10.0 million as compared to zero for the year ended June 30, 2016. We continue to work with Web on the repayment of our investment, and to the extent we collect in a subsequent period, we will record the amount collected in other income in the period received.
Income tax expense. We had an income tax expense of $5.4 million for the year ended June 30, 2017, or 109.3% of income before taxes, as compared to $4.7 million, or 35.7% of income before taxes for the year ended June 30, 2016. The increase in the effective tax rate for the year ended June 30, 2017 was primarily due to the Web impairment which resulted in substantial foreign losses with no tax benefit due to the full valuation allowance against these losses.
Net income (loss). Net loss was $(0.5) million for the year ended June 30, 2017, compared to net income of $8.6 million for the year ended June 30, 2016, representing a decrease of $9.1 million, primarily due to the Web impairment.
Noncontrolling interest loss. Net loss attributable to noncontrolling interest for the year ended June 30, 2017 was $0.9 million as compared to net loss attributable to noncontrolling interest of $0.5 million for the year ended June 30, 2016. The increase is primarily due to larger losses at MIL during the year ended June 30, 2017, as compared to the year ended June 30, 2016. Noncontrolling interest reflects the after-tax income attributable to minority interest owners in our investments, and fluctuates in proportion to the operating results of the investments.
Comparison of the Years Ended June 30, 2016 and 2015
Revenues. Our revenues for the year ended June 30, 2016 were $872.7 million, representing a decrease of $75.6 million, or 8.0%, from $948.3 million for the year ended June 30, 2015. Managed Public School Program revenues decreased $96.6 million, or 11.9%, year over year. The decline in Managed Public School Programs revenues was primarily due to the 10.2% decline in enrollments, largely resulting from the loss of the management component of the Agora contract, offset in part by increases in the per pupil rate of achieved state funding in certain states. The full fiscal year net impact of the Agora program transition to a non‑managed program resulting in an approximate decrease of $111 million of total revenues from the prior year.
We provide the schools and school boards we serve with academic programs sufficiently rigorous to yield strong academic results. These challenging performance expectations for students in a virtual public school can result in parents opting to withdraw their students from a managed public school and enroll in other school options. We have also seen some of our virtual public schools transition from Managed Public School Programs to self‑administered schools by seeking competitive alternatives to portions of the products and services now entirely provided by us. While any one of these factors alone is not necessarily indicative of a material trend in the growth rate in enrollments, continuing to experience a combination of these factors could negatively impact enrollment growth, revenues and operating income. There also is increasing competition from several sources including online or blended offerings by traditional public schools that are recognizing the value of online study and curriculum delivery.
Institutional revenues increased $20.5 million, or 23.3% from the prior year primarily due to transition of the Agora contract from a managed to non‑managed programs.
Instructional Costscosts and Services Expenses.services expenses. Instructional costs and services expenses for the year ended June 30, 20142016 were $569.2$546.5 million, representing an increasea decrease of $70.8$61.3 million, or 14.2%10.1%, as compared to $498.4from $607.8 million for the prior fiscal year. Ofyear ended June 30, 2015. This decrease in expense was primarily due to the total increase, $18.6transition of the Agora contract from managed to non‑managed programs. Additionally, during the year ended June 30, 2015, there was $9.6 million relatesof expense related to accelerated depreciation and amortization during fiscal year 2014 for certain curriculum, learning systems and other fixed assets that will no longer be used or developed, computers that we estimate willestimated would not be returned and additional provisions for the decision to discontinue certain products and for excess inventory relative to anticipated demand. The remaining $52.2 million increase between periods related to increased salary and other personnel benefits to teachers, program and material costs due to enrollment growth. Instructional costs and services expenses were 61.9%62.6% of revenuerevenues during the year ended June 30, 2014; however excluding2016, a decrease from 64.1% for the year ended June 30, 2015. Excluding the impact of the accelerated depreciation and amortization,charges noted above, instructional costs and services were 59.9%, compared to 58.7%62.6% and 63.1% of revenues for the prior fiscal year.
Table of Contentsyears ended June 30, 2016 and 2015.
Selling, Administrativeadministrative, and Other Operating Expenses.other operating expenses. Selling, administrative, and other operating expenses for the year ended June 30, 20142016 were $313.3$302.2 million, representing an increasea decrease of $30.3$5.5 million, or 10.7%1.8%, as compared to $283.0from $307.7 million for the prior fiscal year. Ofyear ended June 30, 2015. Included in expenses for the total increase, $7.4year ended June 30, 2016 was $7.1 million of expense related to severance and accelerated stock compensation coststhe settlement agreement with the state of California. Included in expenses for the terminationyear ended June 30, 2015 was $7.5 million of employment of our former Chief Executive Officer and other employees, and $5.2 millionexpense related to an impairment charge on trade namesuncollectible receivables, as well as $4.8 million for the write‑off of capitalized software that will no longer be used. The remainder of the increase related to increased headcount, professional fees and marketing costs, offset in part by reduced sales commissions. As a percentage of revenues, selling,developed. Selling, administrative, and other operating expenses were 34.1%34.6% of revenues during the year ended June 30, 2016, an increase from 32.5% for the year ended June 30, 2014; however excluding severance and accelerated amortization described above, selling, administrative and other2015. This increase of expenses were 32.7% as a percentage of revenue, less thanto revenues was primarily due to the 33.4% for prior fiscal year, reflecting our continued costs savings initiatives.legal settlement described above.
Product Development Expenses.Product development expenses include costs related to new products and associated systems.expenses. Product development expenses for the year ended June 30, 20142016 were $14.2$10.1 million, representing a decrease of $6.9$4.3 million, or 32.7%, as compared to $21.129.9% from $14.4 million for the prior fiscal year.year ended June 30, 2015. As a percentage of revenues product development expenses decreased to 1.2% for the year ended June 30, 2016, as compared to 1.5% for the year ended June 30, 2014, as compared to 2.5% for the prior fiscal year due to a decrease in third-party professional fees supporting product development activities and our costs savings initiatives.2015.
Realized Gain on Sale of Assets.Interest income (expense), net. Realized gain on sale of assetsNet interest expense and other for the year ended June 30, 20142016 was $6.4$(0.6) million as compared to zero for the prior fiscal year. In June 2014, we completed a sale of select non-strategic businesses to Safanad Education Ventures Limited, including IS Berne, Capital Education, our post-secondary business, and our interest in our joint venture$(0.1) million in the Middle East we operated withyear ended June 30, 2015, a Safanad Limited affliliate.decrease of $0.5 million.
Net Interest Income (Expense).Impairment of investment in Web International Education Group, Ltd. Net interest expenseImpairment of investment in Web was zero for the year ended June 30, 2014 was $(0.1) million,2016, as compared to net interest income of $0.9$3.2 million for the prior fiscal year. The change to net interest expense compared to net interest income in the prior fiscal year related primarily to a decrease of approximately $1.0 million in interest income related to our exercise of the put option on our investment in Web International Education Group, Ltd in fiscal year 2013, partially offset by interest expense related our capital leases and equipment financing arrangements.
Income Taxes. Income tax expense for the year ended June 30, 2014 was $11.12015 as we wrote off interest income associated with our investment.
Income tax expense. We had an income tax expense of $4.7 million for the year ended June 30, 2016, or 37.9%35.7% of income before taxes, as compared to an income tax expense of $20.0$5.8 million, or 43.0%38.4% of our income before taxes for the prior fiscal year.year ended June 30, 2015. Our overall effective tax rate decreased from the prior year primarily due to prior year favorable return to provision true-ups, providing for additional reserves related to the prior yeardecreases in unrecognized tax positions andbenefits primarily resulting from audit resolution in a certain foreign jurisdiction, additional tax benefits related to our research activities, of the Company.and provision true ups.
Net Income.income (loss). Net income was $18.1$8.6 million for the year ended June 30, 20142016, compared to net income of $26.5$9.3 million for the year ended June 30, 2013,2015, a decrease of $8.4$0.7 million, or 31.7%. Net income as a percentage of revenues decreaseddue to 2.0% for the year ended June 30, 2014 as compared to 3.1% for the prior year, as a result of the factors discussednoted above.
Noncontrolling Interest.interest loss. Net loss attributable to noncontrolling interest for the years ended June 30, 2014 and 2013 was $1.5 million and $1.6 million, respectively. Noncontrolling interest reflects the after-tax losses attributable to shareholders in our joint ventures in the Middle East through the sale date and Middlebury Interactive Languages. Our noncontrolling interest fluctuates in proportion to the operating results of these respective joint ventures.
Table of Contents
Comparison of Years Ended June 30, 2013 and 2012
Revenues. Our revenues for the year ended June 30, 2013 were $848.22016 was $0.5 million representing an increase of $139.8 million or 19.7%, as compared to $708.4net loss attributable to noncontrolling interest of $1.7 million for the year ended June 30, 2012. Our revenue growth was primarily attributable to an increase of $134.7 million in Managed Public Schools revenue, largely as the result of an increase in per pupil funding rates compared to the previous year; overall enrollment growth; and a $5.0 million increase in International and Private Pay revenue, partially as a result of strong growth in iCademy course enrollments. Revenue for the Managed Public Schools grew 22.6% year-over-year, while total average enrollment growth for Managed Public Schools students grew by 12.7%.
Instructional Costs and Services Expenses. Instructional costs and services expenses for the year ended June 30, 2013 were $498.4 million, representing an increase of $89.8 million or 22.0%, as compared to $408.6 million for the prior fiscal year. The increase was primarily attributable to an increase in instructional and administrative costs of $80.2 million; an increase in materials and computers costs of $4.0 million; and an increase in amortization of curriculum and online learning systems of $4.4 million. Our instructional costs and services expenses grew in similar proportion to the growth in revenue as these generally are variable costs directly associated with student enrollments. As a percentage of revenues, instructional costs and services expenses increased slightly to 58.7% for the fiscal year ended June 30, 2013, as compared to 57.7% for the prior fiscal year.
Selling, Administrative and Other Operating Expenses. Selling, administrative and other operating expenses for the year ended June 30, 2013 were $283.0 million, representing an increase of $37.7 million or 15.4%, as compared to $245.3 million for the prior fiscal year. This increase was principally attributable to an increase of $29.0 million in personnel costs primarily due to growth in headcount and an increase in marketing and advertising expenses. As a percentage of revenues, selling, administrative and other operating expenses decreased slightly to 33.4% for the year ended June 30, 2013 as compared to 34.6% for the prior fiscal year.
Product Development Expenses. Product development expenses include costs related to new products and associated systems. Product development expenses for the year ended June 30, 2013 were $21.1 million, representing a decrease of $4.5 million or 17.6%, as compared to $25.6 million for the prior fiscal year. This decrease was primarily attributable to higher capitalization rates compared to the prior year and a decrease in system maintenance expenses. As a percentage of revenues, product development expenses decreased to 2.5% for the year ended June 30, 2013, as compared to 3.6% for the prior fiscal year.
Net Interest Income (Expense). Net interest income for the year ended June 30, 2013 was $0.9 million, as compared to net interest expense of $1.0 million for the prior fiscal year. The change to net interest income compared to net interest expense in the prior fiscal year related to $2.0 million in interest income related to our exercise of the put option on our investment in Web International Education Group, Ltd. The interest income related to this transaction was partially offset by interest expense related our capital leases and equipment financing arrangements.
Income Taxes. Income tax expense for the year ended June 30, 2013 was $20.0 million, or 43.0% of income before taxes, as compared to an income tax expense of $11.9 million, or 42.4% of income before taxes, for the prior fiscal year. Our overall effective tax rate increased from the prior year with 2013 reflecting an increase to the rate attributable to foreign operations.
Net Income. Net income was $26.5 million for the year ended June 30, 2013 compared to net income of $16.1 million for the year ended June 30, 2012, an increase of $10.4 million, or 64.6%. Net income as a percentage of revenues increased to 3.1% for the year ended June 30, 2013 as compared to 2.3% for the prior year, as a result of the factors discussed above.
Table of Contents
Noncontrolling Interest. Net loss attributable to noncontrolling interest for the years ended June 30, 2013 and 2012 was $1.6 million and $1.4 million, respectively.2015. Noncontrolling interest reflects the after-taxafter‑tax losses attributable to shareholdersminority interest owners in our joint ventures in the Middle East and Middlebury Interactive Languages. Our noncontrolling interest fluctuates in proportion to the operating results of these respective joint ventures.investments.
Discussion of Seasonality of Financial Condition
Certain accounts in our balance sheet are subject to seasonal fluctuations. As our enrollments and revenues grow, we expect these seasonal trends to be amplified. The bulk of our materials are shipped to students prior to the beginning of the school year, usually in July or August. In order to prepare for the upcoming school year, we generally build up inventories during the fourth quarter of our fiscal year. Therefore, inventories tend to be at the highest levels at the end of our fiscal year. In the first quarter of our fiscal year, inventories tend to decline significantly as materials are shipped to students. In our fourth quarter, inventory purchases and the extent to which we utilize early payment discounts will impact the level of accounts payable.
Accounts receivable balances tend to be at the highest levels in the first quarter of our fiscal year as we begin billing for all enrolled students and our billing arrangements include upfront fees for many of the elements of our offering. These upfront fees result in seasonal fluctuations to our deferred revenue balances. State education budgets, which remain under pressure due to the current economic environment and public school funding levels, including for the online public schools that we manage, have been reduced in many states over the past few years and even mid-year adjustments have occurred. We routinely monitor state legislative activity and regulatory proceedings that might impact the funding received by the schools we serve and to the extent possible, factor potential outcomes into our business planning decisions.
Generally, deferred revenue balances related to the schools tend to be highest in the first quarter, when the majority of students enroll. Since the deferred revenue is amortized over the course of the school year, which typically ends in May or June, the balance is normally at its lowest at the end of our fiscal year. Generally, deferred revenues from virtual and blended public schools have not been a source of liquidity as most schools receive their funding over the course of the school year.
The deferred revenue related to our direct-to-consumerdirect‑to‑consumer business results from advance payments for twelve month subscriptions to our online school. These advance payments are amortized over the life of the subscription and tend to be highest at the end of the fourth quarter and first quarter, when the majority of subscriptions are sold.
Liquidity and Capital Resources
As of June 30, 2014,2017, we had net working capital, or current assets minus current liabilities, of $351.4$355.8 million. Our working capital includes cash and cash equivalents of $196.1$230.9 million including $2.4 million associated with our joint venture, and net accounts receivable of $194.7$192.2 million. Our working capital provides a significant source of liquidity for our normal operating needs. Our accounts receivable balance fluctuates throughout the fiscal year based on the timing of customer billings and collections and tends to be highest in theour first fiscal quarter as we begin billing for students. In addition, our cash and accounts receivable were significantly in excess of our accounts payable and short-term accrued liabilities at June 30, 2014.2017.
We had a $35.0 million unsecured line of credit that expired on December 31, 2013 with PNC Bank, N.A., or PNC, for general corporate operating purposes.
On January 31, 2014, we executed a $100.0 million unsecured line of credit to be used for general corporate operating purposes with Bank of America, N.A. ("BOA"(“BOA”). The line has a five-year term, bears interest at the higher of the Bank'sBank’s prime rate plus 0.25%, or the Federal Funds Rates plus 0.50%0.75%, or the LIBOR rate plus 1.00%1.25%; and incorporates customary financial and other covenants, including but not limited to a maximum debt leverage and a minimum fixed
Table of Contents
charge coverage ratio. As of June 30, 2014,2017, we were in compliance with these covenants and we had no borrowings outstanding on the line of credit.
We incur capital lease obligations for student computers under a lease line of credit with PNC Equipment Finance, LLC with annual lease availability limits. We have $35.0 million of availability for new leasing during fiscal year 2015. This availability expires in July 2015 and interest rates on the new borrowings are based upon an initial rate of 2.34% modified by changes in the three year interest rate swaps rate as published in the Federal Reserve Statistical Release H.15, "Selected Interest Rates," between June 25, 2014 and the Lease Commencement Date, as defined in the lease line of credit.
LLC. As of June 30, 2014,2017 and 2016, the aggregate outstanding balance of capital leases under the current and former lease lines of credit was $36.9 million. Borrowings bore$21.9 million and $23.1 million, respectively, with lease interest at rates ranging from 2.52%1.95% to 3.08% and included a2.71%. Individual leases under the lease line of credit include 36-month payment termterms with a $1 purchase option at the end of theeach lease term. We have pledged the assets financed to secure the outstanding leases.
We may extendexecuted a second extension to our $35.0 million non-revolving lease line of credit for additional periods, or consider alternative arrangements for financing student computers.during the third quarter of fiscal year 2017 to extend the maturity date to August 15, 2018, and had remaining availability under the new lease line of $31.9 million as of June 30, 2017. We had $11.3 million of remaining availability under the previous non-revolving $35 million lease line of credit as of June 30, 2016. Interest on unpaid principal under the new line of credit is at a fluctuating rate of LIBOR plus 1.2%.
On November 4, 2013, the Board of Directors authorized the repurchase of up to $75.0 million of our outstanding common stock over a two year period. Any purchases under thisthe buyback arewere dependent upon business and market conditions and other factors. The stock purchases may bewere made from time to time and may be made through a variety of methods including open market purchases and trading plans that may bewere adopted in accordance with the Rule 10b5-110b‑18 of the Exchange Act. DuringFor the fiscal year ended June 30, 2014, cumulative stock repurchases totaled $48.5 million resulting in remaining availability of2015, we paid approximately $26.5 million forin cash to repurchase 1,307,402 shares to beof common stock at an average price of $20.23 per share. There were no repurchases of shares made during the fiscal years ended June 30, 2017 and 2016. As of June 30, 2017 and 2016 total shares purchased under the plan were 3,502,598, at an average cost of $21.41 per share, and there were no shares remaining to be repurchased under the plan.
Our cash requirements consist primarily of day-to-day operating expenses, capital expenditures and contractual obligations with respect to office facility leases, capital equipment leases and other operating leases. We expect to make future payments on existing leases from cash generated from operations. We believe that the combination of funds to be generated from operations, net working capital on hand and access to our line of credit will be adequate to finance our ongoing operations for the foreseeable future. In addition, to a lesser degree, we continue to explore acquisitions, strategic investments and joint ventures related to our business that we may acquire using cash, stock, debt, contribution of assets or a combination thereof.
On May 4, 2015, Middlebury College, under the joint venture agreement, exercised its right to require the Company to purchase all of its ownership interest in the joint venture. On December 27, 2016, we consummated the acquisition of the remaining 40% noncontrolling interest for $9.1 million in cash.
Operating Activities
Net cash provided by operating activities for the years ended June 30, 2014, 20132017, 2016 and 20122015 was $123.5$88.7 million, $95.3$121.8 million and $33.0$120.1 million, respectively.
Net cash provided by operating activities for the year ended June 30, 20142017 was $123.5$88.7 million compared to $95.3$121.8 million for the year ended June 30, 2013.2016. The $28.2$33.1 million improvementdecrease in cash flow fromprovided by operations between periods was attributable primarily due to increasedan increase in working capital of $42.0 million. The changes in working capital were primarily due to an increase in accounts receivable from the timing of collections and less investmentrevenue growth. The increase in inventory duringworking capital was partially offset by an increase of $8.9 million in non-cash adjustments to net income primarily from depreciation and amortization and stock-based compensation expense.
Net cash provided by operating activities for the year ended June 30, 2014 than during2016 was $121.8 million compared to $120.1 million for the prior year.year ended June 30, 2015. The increase of $1.7 million in cash provided by operations between periods was primarily due to changes in working capital which increased approximately $26.7 million, offset by a decrease in net income including non‑cash adjustments which decreased net income approximately $25.0 million. These changes in working capital were primarily due to the timing of cash payments related to accounts receivable and accounts payable offset by increased accrued liabilities. Cash from operations is impacted by the timing of cash collections from products and services provided and payment of operating costs to fund the continued growth and expansion of our business.
Net cash provided by operating activities for the year ended June 30, 20132015 was $95.3$120.1 million compared to $33.0$122.9 million for the year ended June 30, 2012.2014. The $62.3decrease of $2.8 million improvement in cash flow fromprovided by operations between periods was attributableprimarily due to higher net income excluding non-cash items,including non‑cash adjustments which increased approximately $6.1 million,
offset by an overall use of cash collectionsflows from accounts receivable and less investmentchanges in working capital duringof $8.9 million. These changes in working capital were primarily due to the year ended June 30, 2013 than during the prior year. Thesetiming of cash collections relatepayments related to accounts receivable that increased during fiscal year 2012 from state funding delays to certainpayable and decreased accrued liabilities, offset in part by improved collections of our managed public schools.accounts receivable. Cash from operations is impacted by the timing of cash collections from products and services provided and payment of operating costs to fund the continued growth and expansion of our business.
Table of Contents
Net cash used in investing activities for the years ended June 30, 2014, 20132017, 2016 and 20122015 was $45.8$57.2 million, $50.3$82.9 million and $61.2$68.3 million, respectively.
Net cash used in investing activities for the year ended June 30, 20142017 decreased $4.5$25.7 million from 2013.the year ended June 30, 2016. This decrease was a result of cash received of $5.7due primarily to the $20.0 million related to a sale of assetsinvestment in LTS Education Systems during the year ended June 30, 2016 and a netan $11.8 million decrease of approximately $1.0 million in net capital expenditures for other property and equipment, capitalized software and curriculum development expenses, partially offset in part by a note made$9.1 million payment to a managed school partner of $2.1 million.Middlebury College for the remaining 40% interest in Middlebury Interactive Languages.
Net cash used in investing activities for the year ended June 30, 2013 decreased $10.92016 increased $14.6 million from 2012. Thethe year ended June 30, 2012 included2015. This increase was due primarily to the payment of $12.6$20.0 million for the purchase of the Kaplan/Insight Assets, which is the primary reason for the net decreaseinvestment in fiscal year 2013. This decrease was partially offset byLTS Education Systems and a net$1.1 million increase in capital expenditures approximating $1.7 million for property and equipment, capitalized software and curriculum, development and other property and equipment.partially offset by the prior year investment in LearnBop for $6.5 million.
Net cash used in investing activities for the year ended June 30, 20122015 increased $22.5 million from the year ended June 30, 2014. This increase was due primarily due to the $6.5 million investment of $32.5in LearnBop, a $12.4 million increase in capital expenditures for property and equipment, including internally developedcapitalized software and purchased software,curriculum, and $5.7 million received on the sale of assets in the year ended June 30, 2014, offset by the investment in capitalized curriculum of $16.1a mortgage note to a managed school partner for $2.1 million primarily related tothat was made in the production of high school courses and elementary school math courses and the purchase of the Kaplan/Insight Assets for $12.6 million.prior year.
Net cash used in financing activities for the years ended June 30, 2014, 20132017, 2016 and 20122015 was $64.0$14.6 million, $8.2$20.8 million and $19.8$50.4 million, respectively.
For the year ended June 30, 2014,2017, our primary uses of cash in financing activities were the purchase of treasury stock and the payment of capital lease obligations incurred for the acquisition of student computers. For the year ended June 30, 2014, the Company purchased treasury stock which totaled approximately $48.5 million. The Company made no treasury stock purchases during the year ended June 30, 2013. Our cash payments for capital leases increased approximately $2.4 million due to increased purchases of student computers financed under capital leases. In addition, the year ended June 30, 2014 included a reduction of $7.8 million in the excess tax benefit from stock based compensation. The year ended June 30, 2014 included approximately $3.0 million more in proceeds from the exercise of stock options than the year ended June 30, 2013, which partially offset the increased uses noted above. The timing of cash from the exercise of options impacts our net cash used in financing activities.
For the year ended June 30, 2013, net cash used in financing activities consisted primarily of payments on capital leaseslease obligations incurred for the acquisition of student computers totaling $21.8$15.7 million and for the repurchasepurchase of restricted stock from employees for income tax withholdingwithholdings upon vesting of $2.5$6.2 million, partially offset by proceeds from the exercise of stock options of $7.3 million and excess tax benefit from stock-based compensation expense of $8.9$7.0 million. Our cash payments for capital leases increased $3.7 million between periods resulting from increased purchases of student computers financed under capital leases. The timing of cash from the exercise of options impacts our net cash used in financing activities.
For the year ended June 30, 2012, net2016, our cash used in financing activities consisted primarily of payments on capital leases and software financing arrangementslease obligations incurred for the acquisition of student computers totaling $18.4$17.4 million and excessfor the purchase of restricted stock from employees for income tax expense from stock-based compensation expense of $3.1 million, partially offset by proceeds from the exercise of stock optionswithholdings upon vesting of $3.4 million.
For the year ended June 30, 2015, our cash used in financing activities consisted primarily of payments made in connection with our share repurchase program for the purchase of treasury stock of $26.5 million and payments on capital lease obligations incurred for the acquisition of student computers totaling $21.9 million.
Contractual Obligations
Our contractual obligations consist primarily of leases for office space, capital leases for equipment and other operating leases. The following summarizes our long-termlong‑term contractual obligations as of June 30, 2014,2017, which decreased from $94.4$69.7 million as of June 30, 2013:2016:
| | | | | | | | | | | | | | | |
| | Contractual Obligations—Payments due by period |
| | Total | | < 1 year | | 1 - 3 years | | 3 - 5 years | | > 5 years |
| | (In thousands) |
Contractual obligations at June 30, 2017 | | | | | | | | | | | | | | | |
Capital leases(1) | | $ | 22,430 | | $ | 12,235 | | $ | 10,195 | | $ | — | | $ | — |
Operating leases | | | 39,903 | | | 9,208 | | | 16,998 | | | 13,547 | | | 150 |
Total | | $ | 62,333 | | $ | 21,443 | | $ | 27,193 | | $ | 13,547 | | $ | 150 |
| | | | | | | | | | | | | | | | | | | | | | |
| | Year Ending June 30, | |
|---|
| | Total | | 2015 | | 2016 | | 2017 | | 2018 | | 2019 | | Thereafter | |
|---|
| | (In thousands)
| |
|---|
Contractual obligations at June 30, 2014 | | | | | | | | | | | | | | | | | | | | | | |
Capital leases(1) | | $ | 38,003 | | $ | 21,217 | | $ | 12,021 | | $ | 4,765 | | $ | — | | $ | — | | $ | — | |
Operating leases | | | 55,186 | | | 7,910 | | | 7,599 | | | 7,291 | | | 7,199 | | | 7,243 | | | 17,944 | |
| | | | | | | | | | | | | | | | |
| | | | | | | | | | | | | | | | | | | | | | | |
Total | | $ | 93,189 | | $ | 29,127 | | $ | 19,620 | | $ | 12,056 | | $ | 7,199 | | $ | 7,243 | | $ | 17,944 | |
| | | | | | | | | | | | | | | | |
| | | | | | | | | | | | | | | | | | | | | | | |
| | | | | | | | | | | | | | | | | | | | | | | |
| | | | | | | | | | | | | | | | |
(1)Includes interest expense.
| (1) | | Includes interest expense. |
For the schools to which we provide turn-keyturn‑key management services, we typically take responsibility for any school operating losses that the school may incur. These individual school operating losses, if they occur, are recorded at the time as a reduction in revenues. Potential school operating losses are not included as a commitment or obligation in the above table as they cannot be determined at this time and many may not even occur.
Off-BalanceOff‑Balance Sheet Arrangements
We haveAs of June 30, 2017, we provided guarantees of approximately $8.5$0.9 million related to lease commitments on the buildings for certain of our Flex schools. WePreviously, we had guaranteed two leases which are excluded from the number above, and discussed in more detail below. During the year ended June 30, 2017, the lessee on one of the leases in which we served as guarantor defaulted, and under the terms of the guarantee, the obligation was assigned to us. Since the default occurred, we have taken steps to exit this facility and have entered into an agreement to sublet the space. Additionally, during the year ended June 30, 2017, we entered into a lease buyout agreement with the landlord on another guaranteed space to exit the lease early under the terms of the original lease.
In addition, we contractually guarantee that certain schools under our management will not have annual operating deficits and our management fees from these schools may be reduced accordingly to cover any school operating deficits.
Other than these lease and operating deficit guarantees, we do not have any off-balanceoff‑balance sheet arrangements that have or are reasonably likely to have a current or future effect on our financial condition, changes in financial condition, revenues or expenses, results of operations, liquidity, capital expenditures or capital resources.
Impact of Inflation
We believe that inflation has not had a material impact on our results of operations for any of the years in the three year period ended June 30, 2014.2017. We cannot be sure that future inflation will not have an adverse impact on our operating results and financial condition.condition in future periods.
Recent Accounting Pronouncements
In February 2013, the Financial Accounting Standards Board ("FASB") issued Accounting Standards Update ("ASU") 2013-02,Reporting of Amounts Reclassified out of Accumulated Other Comprehensive Income, which is included in Accounting Standards Codification ("ASC") 220,Comprehensive Income. This update improves the reporting of reclassifications out of accumulated other comprehensive income. The guidance was effective for the Company's interim and annual reporting periods beginning January 1, 2013, and applied prospectively. The adoption of this guidance in the Company's fiscal year 2014 did not have a material impact on the Company's financial condition, results of operations, cash flows or disclosures.
In April 2014, the FASB issued ASU 2014-08,Reporting Discontinued Operations and Disclosures of Components of an Entity, which updates the definition of discontinued operations from current US GAAP. Going forward only those disposals of components of an entity that represent a strategic shift that has (or will have) a major effect on an entity's operations and financial results will be reported as discontinued operations in the financial statements. Currently, a component of an entity that is a reportable segment, an
Table of Contents
operating segment, a reporting unit, a subsidiary, or an asset group is eligible for discontinued operations presentation. Additionally, the existing condition that the entity will not have any significant continuing involvement in the operations of the component after the disposal transaction has been removed. The effective date for the revised standard is for applicable transactions that occur within annual periods beginning on or after December 15, 2014. Early adoption is permitted, but only for disposals (or classifications as held for sale) that have not been reported in financial statements previously issued or available for issuance. The Company adopted this standard in the fourth quarter of fiscal 2014. This resulted in the presentation of historical results of our sold business assets as normal operations in fiscal year 2014, and a one-time gain of $6.4 million being recognized outside of operating income upon the sale of the business in fiscal year 2014.
In May 2014, the FASB issued ASU 2014-09,Revenue from Contracts with Customers (“ASU 2014-09”) (ASU 2014-09), which supersedes nearly allmost existing revenue recognition guidance under US GAAP. The core principle of ASU 2014-09 is to recognize revenues when promised goods or services are transferred to customers in an amount that reflects the consideration to which an entity expects to be entitled for those goods or services. ASU 2014-09 defines a five step process to achieve this core principle and, in doing so, more judgment and estimates may be required within the revenue recognition process than are required under existing U.S. GAAP. The standard is effective for annual periods beginning after December 15, 2016, and interim periods therein, using either of the following transition methods: (i) a full retrospective approach reflecting the application of the standard in each prior reporting period with the option to elect certain practical expedients, or (ii) a retrospective approach with the cumulative effect of initially adopting ASU 2014-09 recognized at the date of adoption (which includes additional footnote disclosures). On July 9, 2015, the FASB voted to defer the effective date of the new revenue recognition standard by one year. Based on the Board’s decision, public organizations would apply the new
revenue standard to annual reporting periods beginning after December 15, 2017. We are currently evaluating the impact this standard will have on our consolidated financial statements which includes performing a detailed review of each of our revenue streams and comparing historical accounting policies and practices to the new standard. We will provide expanded disclosures pertaining to revenue recognition in our annual and quarterly filings beginning in the first quarter of fiscal 2019. We expect to complete our assessment of the cumulative effect of adopting ASU 2014-09 as well as the expected impact of adoption during fiscal 2018.
In February 2016, the FASB issued ASU 2016-02, Leases (Topic 842) (“ASU 2016-02”). The Companynew standard establishes a right-of-use (“ROU”) model that requires a lessee to record a ROU asset and a lease liability on the balance sheet for all leases with terms longer than 12 months. Leases will be classified as either finance or operating, with classification affecting the pattern of expense recognition in the income statement. The new standard is effective for fiscal years beginning after December 15, 2018, including interim periods within those fiscal years. A modified retrospective transition approach is required for lessees for capital and operating leases existing at, or entered into after, the beginning of the earliest comparative period presented in the financial statements, with certain practical expedients available. We are currently evaluating this guidance, as well as the effect on our consolidated financial statements.
In March 2016, the FASB issued ASU 2016-09, Compensation - Stock Compensation (Topic 718) (“ASU 2016‑09”). This update was issued as part of the FASB’s simplification initiative and affects all entities that issue share-based payment awards to their employees. The amendments in this update cover such areas as the recognition of excess tax benefits and deficiencies and an accounting policy election for forfeitures. As part of the new guidance:
| · | | Excess tax benefits or deficiencies arising from share-based awards will be reflected within the consolidated statements of operations as a component of income tax expense rather than as a component of stockholders’ equity. The adoption of this guidance may result in volatility within a company’s results of operations, primarily due to changes in the stock price. |
| · | | Excess tax benefits will be presented as an operating activity on the statement of cash flows rather than as a financing activity. |
| · | | A forfeiture election will be made to either estimate forfeitures (similar to today’s requirement) or recognizing actual forfeitures as they occur. Entities will apply the forfeiture election provision using a modified retrospective transition approach, with a cumulative effect adjustment recorded to retained earnings as of the beginning of the period of adoption. |
| · | | Statutory tax withholding requirements for employers who withhold shares upon settlement of an award on behalf of an employee to cover tax obligations are broadened to allow for a range of withholding from the minimum to the maximum statutory allowable amounts. |
We will adopt this guidance during the first quarter of fiscal 2018. As part of our adoption of ASU 2016-09, we will make an accounting policy election to change the way in which we account for forfeitures of share-based awards. Specifically, beginning in the first quarter of fiscal 2018, we will recognize forfeitures of share-based awards as they occur in the period of forfeiture rather than estimating the number of awards expected to be forfeited at the grant date and subsequently adjusting the estimate when awards are actually forfeited. We expect that the change in accounting policy will result in an adjustment to retained earnings as of July 1, 2017. We will determine the method of adoption for the remaining provisions during the first quarter of fiscal 2018.
In June 2016, the FASB issued ASU 2016-13, Financial Instruments – Credit Losses (Topic 326) (“ASU 2016‑13”) related to the methodology for recognizing credit losses. The new guidance revises the accounting requirements related to the measurement of credit losses and will require organizations to measure all expected credit losses for financial assets based on historical experience, current conditions and reasonable and supportable forecasts about collectability. Assets must be presented in the financial statements at the net amount expected to be collected. This ASU will be effective for us in the first quarter of fiscal 2021, and early adoption is permitted. We are currently evaluating the impact of our pending adoption ofthis ASU 2014-09 on our consolidated financial statements.
In August 2016, the FASB issued ASU 2016-15, Statement of Cash Flows (Topic 230) (“ASU 2016-15”) related to the classification of certain cash receipts and cash payments on the statement of cash flows. This ASU will be effective for us beginning in the first quarter of fiscal 2019 on a retrospective basis, and early adoption is permitted. We are currently evaluating the impact of this ASU on our consolidated statements of cash flows.
In January 2017, the FASB issued ASU 2017-04, Intangibles – Goodwill and has not yet determined the methodOther (Topic 350) (“ASU 2017‑04”). This amendment simplifies how an entity is required to test goodwill for impairment by which we will adopt the standard in 2017.eliminating
Step 2 from the goodwill impairment test. Step 2 measures a goodwill impairment loss by comparing the implied fair value of a reporting unit’s goodwill with the carrying amount of that goodwill. Instead, under the amendments in this update, an entity should perform its annual, or interim, goodwill impairment test by comparing the fair value of a reporting unit with its carrying amount. An entity should recognize an impairment charge for the amount by which the carrying amount exceeds the reporting unit’s fair value. The update is effective for annual or any interim goodwill impairment tests in fiscal years beginning after December 15, 2019. An entity should apply the amendments in this update on a prospective basis. An entity is required to disclose the nature of and reason for the change in accounting principle upon transition. Early adoption is permitted for interim or annual goodwill impairment tests performed on testing dates after January 1, 2017. We are currently evaluating this guidance, as well as the effect on our consolidated financial statements.
ITEM 7A. QUANTITATIVE AND QUALITATIVE DISCLOSURES ABOUT MARKET RISK
Interest Rate Risk
At June 30, 20142017 and 2013,2016, we had cash and cash equivalents totaling $196.1$230.9 million and $181.5$214.0 million, respectively. The Company did not enter intoOur excess cash has been invested primarily in U.S. Treasury money market risk sensitive instruments for trading purposes during fiscal years 2014, 2013funds although we may also invest in money market accounts, government securities, corporate debt securities and 2012.similar investments. Future interest and investment income is subject to the impact of interest rate changes, and we may be subject to changes in the fair value of our investment portfolio as a result of changes in interest rates. At June 30, 2014,2017, a 1% gross increase in interest rates earned on cash would result in $2.0a $2.3 million annualized increase in interest income.
Our short-term debt obligations under our revolving credit facility are subject to interest rate exposure,exposure; however, as we had no outstanding balance on this facility as of June 30, 2014,2017, fluctuations in interest rates would not have anyhad no impact on our interest expense.
Foreign Currency Exchange Risk
We currently operate in several foreign countries, but we do not transact a material amount of business in a foreign currency and therefore fluctuationscurrency. At June 30, 2017, a 1% change in exchange rates will not have a materialbetween the U.S. dollar and British pound would result in an approximate impact of $0.1 million on our financial statements. However, we are pursuing additional opportunities in international markets and expect our international presence to grow. If we enter into any material transactions in a foreign currency or establish or acquire any subsidiaries that measure and record their financial condition and results of operation in a foreign currency, we will be exposed to currency transaction risk and/or currency translation risk. Exchange rates between U.S. dollars and many foreign currencies have fluctuated significantly over the last few years and may continue to do so in the future. Accordingly, we may decide in the future to undertake hedging strategies to minimize the effect of currency fluctuations on our financial condition and results of operations.
ITEM 8. FINANCIAL STATEMENTS AND SUPPLEMENTARY DATA
INDEX TO CONSOLIDATED FINANCIAL STATEMENTS
| | | | Page |
| | Page | |
|---|
Report of Independent Registered Public Accounting Firm | | | 84 | 74 |
Consolidated Balance Sheets as of June 30, 20142017 and 20132016 | | | 85 | 75 |
Consolidated Statements of Operations for the years ended June 30, 2014, 20132017, 2016 and 20122015 | | | 86 | 76 |
Consolidated Statements of Comprehensive Income for the years ended June 30, 2014, 20132017, 2016 and 20122015 | | | 87 | 77 |
Consolidated Statements of Stockholders'Stockholders’ Equity for the years ended June 30, 2014, 20132017, 2016 and 20122015 | | | 88 | 78 |
Consolidated Statements of Cash Flows for the years ended June 30, 2014, 20132017, 2016 and 20122015 | | | 89 | 79 |
Notes to Consolidated Financial Statements | | | 90 | 80 |
Schedule II—Valuation and Qualifying Accounts | | | 120 | 114 |
Report of Independent Registered Public Accounting Firm
Board of Directors and Stockholders
K12 Inc.
Herndon, Virginia
We have audited the accompanying consolidated balance sheets of K12 Inc. and subsidiaries (the Company) as of June 30, 20142017 and 20132016, and the related consolidated statements of operations, comprehensive income, stockholders'stockholders’ equity, and cash flows for each of the three years in the period ended June 30, 2014.2017. In connection with our audits of the financial statements, we have also audited the financial statement scheduleschedules listed in the accompanying index. These financial statements and scheduleschedules are the responsibility of the Company'sCompany’s management. Our responsibility is to express an opinion on these financial statements and schedule based on our audits.
We conducted our audits in accordance with the standards of the Public Company Accounting Oversight Board (United States). Those standards require that we plan and perform the audit to obtain reasonable assurance about whether the financial statements are free of material misstatement. An audit also includes examining, on a test basis, evidence supporting the amounts and disclosures in the financial statements, assessing the accounting principles used and significant estimates made by management, as well as evaluating the overall presentation of the financial statements and schedule.schedules. We believe that our audits provide a reasonable basis for our opinion.
In our opinion, the consolidated financial statements referred to above present fairly, in all material respects, the financial position of K12 Inc. and subsidiaries at June 30, 20142017 and 2013,2016, and the results of its operations and its cash flows for each of the three years in the period ended June 30, 2014,2017, in conformity with accounting principles generally accepted in the United States of America.
Also, in our opinion, the financial statement schedule, when considered in relation to the basic consolidated financial statements taken as a whole, presents fairly, in all material respects, the information set forth therein.
We also have audited, in accordance with the standards of the Public Company Accounting Oversight Board (United States), K12 Inc. and subsidiaries'subsidiaries’ internal control over financial reporting as of June 30, 2014,2017, based on criteria established in Internal Control—Control – Integrated Framework (1992)(2013) issued by the Committee of Sponsoring Organizations of the Treadway Commission (COSO) and our report dated August 15, 20149, 2017 expressed an unqualified opinion thereon.
Bethesda, Maryland
McLean, Virginia
August 15, 20149, 2017
K12 INC.
CONSOLIDATED BALANCE SHEETS
| | | | | | | | | | | | | |
| | June 30, | | | June 30, |
|---|
| | 2014 | | 2013 | | | 2017 | | 2016 |
|---|
| | (In thousands, except share and per share data)
| | | (In thousands except share and per share data) |
|---|
ASSETS | ASSETS | | | | | | | |
Current assets | | | | | | | | | | | |
Cash and cash equivalents | | $ | 196,109 | | $ | 181,480 | | | $ | 230,864 | | $ | 213,989 |
Accounts receivable, net of allowance of $3,460 and $2,560 at June 30, 2014 and June 30, 2013, respectively | | 194,676 | | 186,459 | | |
Accounts receivable, net of allowance of $14,791 and $10,813 at June 30, 2017 and 2016, respectively | | | | 192,205 | | | 169,554 |
Inventories, net | | 33,830 | | 44,395 | | | | 30,503 | | | 30,631 |
Current portion of deferred tax asset | | 7,732 | | 11,368 | | |
Prepaid expenses | | 7,356 | | 10,331 | | | | 8,006 | | | 9,634 |
Other current assets | | 25,498 | | 23,916 | | | | 12,004 | | | 22,047 |
| | | | | | | |
| | | | | | |
Total current assets | | 465,201 | | 457,949 | | | | 473,582 | | | 445,855 |
Property and equipment, net | | 48,581 | | 56,142 | | | | 26,297 | | | 28,447 |
Capitalized software, net | | 49,920 | | 43,504 | | | | 62,695 | | | 70,055 |
Capitalized curriculum development costs, net | | 60,782 | | 64,599 | | | | 59,213 | | | 63,367 |
Intangible assets, net | | 23,708 | | 32,139 | | | | 20,226 | | | 23,102 |
Goodwill | | 58,088 | | 61,413 | | | | 87,214 | | | 87,285 |
Deposits and other assets | | 5,387 | | 3,150 | | | | 6,057 | | | 15,944 |
| | | | | | | |
| | | | | | |
Total assets | | $ | 711,667 | | $ | 718,896 | | | $ | 735,284 | | $ | 734,055 |
| | | | | | | |
| | | | | | |
| | | | | | |
| | | | | | | |
LIABILITIES, REDEEMABLE NONCONTROLLING INTEREST AND EQUITY | | |
LIABILITIES, REDEEMABLE NONCONTROLLING INTEREST AND STOCKHOLDERS' EQUITY | | | | | | | |
Current liabilities | | | | | | | | | | | |
Current portion of capital lease obligations | | | $ | 11,880 | | $ | 13,210 |
Accounts payable | | $ | 30,976 | | $ | 21,838 | | | | 30,052 | | | 25,919 |
Accrued liabilities | | 20,539 | | 17,027 | | | | 21,622 | | | 26,877 |
Accrued compensation and benefits | | 17,400 | | 21,970 | | | | 29,367 | | | 31,042 |
Deferred revenue | | 24,353 | | 28,567 | | | | 24,830 | | | 25,964 |
Current portion of capital lease obligations | | 20,492 | | 19,395 | | |
Current portion of note payable | | — | | 390 | | |
| | | | | | | |
| | | | | | |
Total current liabilities | | 113,760 | | 109,187 | | | | 117,751 | | | 123,012 |
Capital lease obligations, net of current portion | | | | 10,025 | | | 9,922 |
Deferred rent, net of current portion | | 8,488 | | 8,833 | | | | 4,157 | | | 6,661 |
Capital lease obligations, net of current portion | | 16,447 | | 16,107 | | |
Deferred tax liability | | 22,478 | | 33,299 | | | | 16,726 | | | 18,458 |
Other long term liabilities | | 4,763 | | 2,512 | | |
| | | | | | | |
| | | | | | |
Other long-term liabilities | | | | 11,579 | | | 9,780 |
Total liabilities | | 165,936 | | 169,938 | | | | 160,238 | | | 167,833 |
| | | | | | | |
| | | | | | |
Commitments and contingencies | | — | | — | | | | — | | | — |
Redeemable noncontrolling interest | | 16,801 | | 15,200 | | | | 700 | | | 7,502 |
| | | | | | | |
| | | | | | |
Equity: | | | | | | |
K12 Inc. stockholders' equity | | | | | | |
Common stock, par value $0.0001; 100,000,000 shares authorized; 41,144,062 and 37,440,662 shares issued and 38,948,866 and 37,440,662 shares outstanding at June 30, 2014 and June 30, 2013, respectively | | 4 | | 4 | | |
Stockholders’ equity | | | | | | | |
Common stock, par value $0.0001; 100,000,000 shares authorized; 44,325,772 and 43,184,068 shares issued and 40,823,174 and 39,681,470 shares outstanding at June 30, 2017 and 2016, respectively | | | | 4 | | | 4 |
Additional paid-in capital | | 639,036 | | 548,390 | | | | 690,488 | | | 675,436 |
Series A Special Stock, par value $0.0001; 2,750,000 shares issued, zero and 2,750,000 outstanding at June 30, 2014 and 2013, respectively | | — | | 63,112 | | |
Accumulated other comprehensive loss | | (112 | ) | | (294 | ) | | | (170) | | | (293) |
Accumulated deficit | | (61,450 | ) | | (81,050 | ) | | | (40,976) | | | (41,427) |
Treasury stock of 2,195,196 and zero shares at cost at June 30, 2014 and June 30, 2013, respectively | | (48,548 | ) | | — | | |
| | | | | | | |
| | | | | | |
Total K12 Inc. stockholders' equity | | 528,930 | | 530,162 | | |
Noncontrolling interest | | — | | 3,596 | | |
| | | | | | | |
| | | | | | |
Total equity | | 528,930 | | 533,758 | | |
| | | | | | | |
| | | | | | |
Total liabilities, redeemable noncontrolling interest and equity | | $ | 711,667 | | $ | 718,896 | | |
| | | | | | | |
| | | | | | |
| | | | | | |
| | | | | | | |
Treasury stock of 3,502,598 shares at cost at June 30, 2017 and 2016 | | | | (75,000) | | | (75,000) |
Total stockholders’ equity | | | | 574,346 | | | 558,720 |
Total liabilities, redeemable noncontrolling interest and stockholders' equity | | | $ | 735,284 | | $ | 734,055 |
See accompanying summary of accounting policies and notes to consolidated financial statements.
K12 INC.
CONSOLIDATED STATEMENTS OF OPERATIONS
| | | | | | | | | | |
| | Year Ended June 30, | |
|---|
| | 2014 | | 2013 | | 2012 | |
|---|
| | (In thousands, except share and per share data)
| |
|---|
Revenues | | $ | 919,553 | | $ | 848,220 | | $ | 708,407 | |
| | | | | | | | |
| | | | | | | | | | | |
Cost and expenses | | | | | | | | | | |
Instructional costs and services | | | 569,219 | | | 498,398 | | | 408,560 | |
Selling, administrative and other operating expenses | | | 313,258 | | | 283,032 | | | 245,274 | |
Product development expenses | | | 14,220 | | | 21,084 | | | 25,593 | |
| | | | | | | | |
| | | | | | | | | | | |
Total costs and expenses | | | 896,697 | | | 802,514 | | | 679,427 | |
| | | | | | | | |
| | | | | | | | | | | |
Income from operations | | | 22,856 | | | 45,706 | | | 28,980 | |
Realized gain on sale of assets | | | 6,404 | | | — | | | — | |
Interest income (expense), net | | | (69 | ) | | 851 | | | (989 | ) |
| | | | | | | | |
| | | | | | | | | | | |
Income before income tax expense and noncontrolling interest | | | 29,191 | | | 46,557 | | | 27,991 | |
Income tax expense | | | (11,075 | ) | | (20,023 | ) | | (11,882 | ) |
| | | | | | | | |
| | | | | | | | | | | |
Net income | | | 18,116 | | | 26,534 | | | 16,109 | |
Add net loss attributable to noncontrolling interest | | | 1,484 | | | 1,577 | | | 1,434 | |
| | | | | | | | |
| | | | | | | | | | | |
Net income attributable to common stockholders, including Series A stockholders | | $ | 19,600 | | $ | 28,111 | | $ | 17,543 | |
| | | | | | | | |
| | | | | | | | | | | |
| | | | | | | | | | | |
| | | | | | | | |
Net income attributable to common stockholders per share, excluding Series A stockholders: | | | | | | | | | | |
Basic | | $ | 0.50 | | $ | 0.72 | | $ | 0.46 | |
| | | | | | | | |
| | | | | | | | | | | |
| | | | | | | | | | | |
| | | | | | | | |
Diluted | | $ | 0.50 | | $ | 0.72 | | $ | 0.45 | |
| | | | | | | | |
| | | | | | | | | | | |
| | | | | | | | | | | |
| | | | | | | | |
Weighted average shares used in computing per share amounts: | | | | | | | | | | |
Basic | | | 38,987,470 | | | 36,267,345 | | | 35,802,678 | |
| | | | | | | | |
| | | | | | | | | | | |
| | | | | | | | | | | |
| | | | | | | | |
Diluted | | | 39,230,516 | | | 39,017,345 | | | 38,740,863 | |
| | | | | | | | |
| | | | | | | | | | | |
| | | | | | | | | | | |
| | | | | | | | |
| | | | | | | | | |
| | Year Ended June 30, |
| | 2017 | | 2016 | | 2015 |
| | (In thousands except share and per share data) |
Revenues | | $ | 888,519 | | $ | 872,700 | | $ | 948,294 |
Cost and expenses | | | | | | | | | |
Instructional costs and services | | | 557,316 | | | 546,510 | | | 607,756 |
Selling, administrative, and other operating expenses | | | 305,617 | | | 302,205 | | | 307,730 |
Product development expenses | | | 12,457 | | | 10,071 | | | 14,381 |
Total costs and expenses | | | 875,390 | | | 858,786 | | | 929,867 |
Income from operations | | | 13,129 | | | 13,914 | | | 18,427 |
Impairment of investment in Web International Education Group, Ltd. | | | (10,000) | | | — | | | (3,200) |
Interest income (expense), net | | | 1,808 | | | (617) | | | (91) |
Income before income taxes and noncontrolling interest | | | 4,937 | | | 13,297 | | | 15,136 |
Income tax expense | | | (5,396) | | | (4,746) | | | (5,810) |
Net income (loss) | | | (459) | | | 8,551 | | | 9,326 |
Add net loss attributable to noncontrolling interest | | | 910 | | | 484 | | | 1,662 |
Net income attributable to common stockholders | | $ | 451 | | $ | 9,035 | | $ | 10,988 |
Net income attributable to common stockholders per share: | | | | | | | | | |
Basic | | $ | 0.01 | | $ | 0.24 | | | 0.29 |
Diluted | | $ | 0.01 | | $ | 0.23 | | $ | 0.29 |
Weighted average shares used in computing per share amounts: | | | | | | | | | |
Basic | | | 38,298,581 | | | 37,613,782 | | | 37,330,569 |
Diluted | | | 39,500,934 | | | 38,850,388 | | | 37,625,425 |
See accompanying summary of accounting policies and notes to consolidated financial statements.
K12 INC.
CONSOLIDATED STATEMENTS OF COMPREHENSIVE INCOME
| | | | | | | | | | |
| | Year Ended June 30, | |
|---|
| | 2014 | | 2013 | | 2012 | |
|---|
| | (In thousands)
| |
|---|
Net income | | $ | 18,116 | | $ | 26,534 | | $ | 16,109 | |
Other comprehensive income, net of tax | | | | | | | | | | |
Foreign currency translation adjustment | | | 182 | | | (394 | ) | | 72 | |
| | | | | | | | |
| | | | | | | | | | | |
Total other comprehensive income, net of tax | | | 18,298 | | | 26,140 | | | 16,181 | |
Comprehensive income attributable to noncontrolling interest | | | 1,484 | | | 1,577 | | | 1,434 | |
| | | | | | | | |
| | | | | | | | | | | |
Comprehensive income attributable to common stockholders, including Series A stockholders | | $ | 19,782 | | $ | 27,717 | | $ | 17,615 | |
| | | | | | | | |
| | | | | | | | | | | |
| | | | | | | | | | | |
| | | | | | | | |
| | | | | | | | | |
| | Year Ended June 30, |
| | 2017 | | 2016 | | 2015 |
| | (In thousands) |
Net income (loss) | | $ | (459) | | $ | 8,551 | | $ | 9,326 |
Other comprehensive income, net of tax: | | | | | | | | | |
Foreign currency translation adjustment | | | 123 | | | 772 | | | (953) |
Total other comprehensive income (loss), net of tax | | | (336) | | | 9,323 | | | 8,373 |
Comprehensive loss attributable to noncontrolling interest | | | 910 | | | 484 | | | 1,662 |
| | | | | | | | | |
Comprehensive income attributable to common stockholders | | $ | 574 | | $ | 9,807 | | $ | 10,035 |
See accompanying summary of accounting policies and notes to consolidated financial statements.
K12 INC.
CONSOLIDATED STATEMENTS OF STOCKHOLDERS'STOCKHOLDERS’ EQUITY
| | | | | | | | | | | | | | | | | | | | | | |
| | K12 Inc. Stockholders | | | |
| | | | | | | | | | Accumulated | | | | | | | | | | | |
| | | | | | | Additional | | Other | | | | | | | | | | | |
| | Common Stock | | Paid-in | | Comprehensive | | Accumulated | | Treasury Stock | | | |
(In thousands, except share data) | | Shares | | Amount | | Capital | | Loss | | Deficit | | Shares | | Amount | | Total |
Balance, June 30, 2014 | | 41,144,062 | | $ | 4 | | $ | 639,036 | | $ | (112) | | $ | (61,450) | | (2,195,196) | | $ | (48,548) | | $ | 528,930 |
Net income(1) | | — | | | — | | | — | | | — | | | 10,988 | | — | | | — | | | 10,988 |
Foreign currency translation adjustments | | — | | | — | | | — | | | (953) | | | — | | — | | | — | | | (953) |
Purchase of Treasury Stock | | — | | | — | | | — | | | — | | | — | | (1,307,402) | | | (26,452) | | | (26,452) |
Stock-based compensation expense | | — | | | — | | | 21,299 | | | — | | | — | | — | | | — | | | 21,299 |
Exercise of stock options | | 99,935 | | | — | | | 553 | | | — | | | — | | — | | | — | | | 553 |
Excess tax expense from stock-based compensation | | — | | | — | | | (2,793) | | | — | | | — | | — | | | — | | | (2,793) |
Issuance of restricted stock awards | | 822,698 | | | — | | | — | | | — | | | — | | — | | | — | | | — |
Forfeiture of restricted stock awards | | (66,480) | | | — | | | — | | | — | | | — | | — | | | — | | | — |
Adjustments to redeemable noncontrolling interests to estimated redemption value | | — | | | — | | | 8,038 | | | — | | | — | | — | | | — | | | 8,038 |
Retirement of restricted stock for tax withholding | | (162,321) | | | — | | | (2,672) | | | — | | | — | | — | | | — | | | (2,672) |
Balance, June 30, 2015 | | 41,837,894 | | $ | 4 | | $ | 663,461 | | $ | (1,065) | | $ | (50,462) | | (3,502,598) | | $ | (75,000) | | $ | 536,938 |
Net income(1) | | — | | | — | | | — | | | — | | | 9,035 | | — | | | — | | | 9,035 |
Foreign currency translation adjustments | | — | | | — | | | — | | | 772 | | | — | | — | | | — | | | 772 |
Stock-based compensation expense | | — | | | — | | | 18,616 | | | — | | | — | | — | | | — | | | 18,616 |
Exercise of stock options | | 1,000 | | | — | | | 14 | | | — | | | — | | — | | | — | | | 14 |
Excess tax expense from stock-based compensation | | — | | | — | | | (4,876) | | | — | | | — | | — | | | — | | | (4,876) |
Issuance of restricted stock awards | | 1,704,843 | | | — | | | — | | | — | | | — | | — | | | — | | | — |
Forfeiture of restricted stock awards | | (95,980) | | | — | | | — | | | — | | | — | | — | | | — | | | — |
Adjustments to redeemable noncontrolling interests to estimated redemption value | | — | | | — | | | 1,615 | | | — | | | — | | — | | | — | | | 1,615 |
Retirement of restricted stock for tax withholding | | (263,689) | | | — | | | (3,394) | | | — | | | — | | — | | | — | | | (3,394) |
Balance, June 30, 2016 | | 43,184,068 | | $ | 4 | | $ | 675,436 | | $ | (293) | | $ | (41,427) | | (3,502,598) | | $ | (75,000) | | $ | 558,720 |
Net income(1) | | — | | | — | | | — | | | — | | | 451 | | — | | | — | | | 451 |
Foreign currency translation adjustment | | — | | | — | | | — | | | 123 | | | — | | — | | | — | | | 123 |
Stock-based compensation expense | | — | | | — | | | 22,598 | | | — | | | — | | — | | | — | | | 22,598 |
Exercise of stock options | | 425,180 | | | — | | | 6,953 | | | — | | | — | | — | | | — | | | 6,953 |
Excess tax expense from stock-based compensation | | — | | | — | | | (5,063) | | | — | | | — | | — | | | — | | | (5,063) |
Issuance of restricted stock awards | | 1,268,311 | | | — | | | — | | | — | | | — | | — | | | — | | | — |
Forfeiture of restricted stock awards | | (175,008) | | | — | | | — | | | — | | | — | | — | | | — | | | — |
Adjustments to redeemable noncontrolling interests to estimated redemption value | | — | | | — | | | (3,245) | | | — | | | — | | — | | | — | | | (3,245) |
Retirement of restricted stock for tax withholding | | (376,779) | | | — | | | (6,191) | | | — | | | — | | — | | | — | | | (6,191) |
Balance, June 30, 2017 | | 44,325,772 | | $ | 4 | | $ | 690,488 | | $ | (170) | | $ | (40,976) | | (3,502,598) | | $ | (75,000) | | $ | 574,346 |
| | | | | | | | | | | | | | | | | | | | | | | | | | | | | | | | | | |
| | K12 Inc Stockholders | |
| |
| |
|---|
| | Common Stock | | Common Stock—A | |
| | Accumulated
Other
Comprehensive
Income | |
| | Treasury Stock | |
| |
| |
|---|
| | Additional
Paid-in
Capital | | Accumulated
Deficit | | Noncontrolling
Interest | |
| |
|---|
(In thousands, except share data)
| | Shares | | Amount | | Shares | | Amount | | Shares | | Amount | | Total | |
|---|
Balance, June 30, 2011 | | | 35,927,452 | | $ | 4 | | | 2,750,000 | | $ | 63,112 | | $ | 512,181 | | $ | 28 | | $ | (126,704 | ) | | — | | $ | — | | $ | 4,126 | | $ | 452,747 | |
Net income (loss)(1) | | | — | | | — | | | — | | | — | | | — | | | — | | | 17,543 | | | — | | | — | | | 28 | | | 17,571 | |
Foreign currency translation adjustments | | | — | | | — | | | — | | | — | | | — | | | 72 | | | — | | | — | | | — | | | — | | | 72 | |
Stock based compensation expense | | | — | | | — | | | — | | | — | | | 10,067 | | | — | | | — | | | — | | | — | | | — | | | 10,067 | |
Exercise of stock options | | | 217,956 | | | — | | | — | | | — | | | 3,380 | | | — | | | — | | | — | | | — | | | — | | | 3,380 | |
Excess tax expense from stock-based compensation | | | — | | | — | | | — | | | — | | | (3,122 | ) | | — | | | — | | | — | | | — | | | — | | | (3,122 | ) |
Issuance of restricted stock awards | | | 398,940 | | | — | | | — | | | — | | | — | | | — | | | — | | | — | | | — | | | — | | | — | |
Forfeiture of restricted stock awards | | | (52,411 | ) | | — | | | — | | | — | | | — | | | — | | | — | | | — | | | — | | | — | | | — | |
Accretion of redeemable noncontrolling interests to estimated redemption value | | | — | | | — | | | — | | | — | | | (1,462 | ) | | — | | | — | | | — | | | — | | | — | | | (1,462 | ) |
Retirement of restricted stock for tax withholding | | | (55,004 | ) | | — | | | — | | | — | | | (1,292 | ) | | — | | | — | | | — | | | — | | | — | | | (1,292 | ) |
Registration expenses for shares issued in private placement | | | — | | | — | | | — | | | — | | | (313 | ) | | — | | | — | | | — | | | — | | | — | | | (313 | ) |
| | | | | | | | | | | | | | | | | | | | | | | | |
| | | | | | | | | | | | | | | | | | | | | | | | | | | | | | | | | | | |
Balance, June 30, 2012 | | | 36,436,933 | | | 4 | | | 2,750,000 | | | 63,112 | | | 519,439 | | | 100 | | | (109,161 | ) | | — | | $ | — | | | 4,154 | | | 477,648 | |
Net income (loss)(1) | | | — | | | — | | | — | | | — | | | — | | | — | | | 28,111 | | | — | | | — | | | (558 | ) | | 27,553 | |
Foreign currency translation adjustments | | | — | | | — | | | — | | | — | | | — | | | (394 | ) | | — | | | — | | | — | | | — | | | (394 | ) |
Stock based compensation expense | | | — | | | — | | | — | | | — | | | 14,374 | | | — | | | — | | | — | | | — | | | — | | | 14,374 | |
Exercise of stock options | | | 437,054 | | | — | | | — | | | — | | | 7,253 | | | — | | | — | | | — | | | — | | | — | | | 7,253 | |
Excess tax benefit from stock-based compensation | | | — | | | — | | | — | | | — | | | 8,889 | | | — | | | — | | | — | | | — | | | — | | | 8,889 | |
Issuance of restricted stock awards | | | 768,951 | | | — | | | — | | | — | | | — | | | — | | | — | | | — | | | — | | | — | | | — | |
Forfeiture of restricted stock awards | | | (86,142 | ) | | — | | | — | | | — | | | — | | | — | | | — | | | — | | | — | | | — | | | — | |
Accretion of redeemable noncontrolling interests to estimated redemption value | | | — | | | — | | | — | | | — | | | 981 | | | — | | | — | | | — | | | — | | | — | | | 981 | |
Retirement of restricted stock for tax withholding | | | (116,134 | ) | | — | | | — | | | — | | | (2,546 | ) | | — | | | — | | | — | | | — | | | — | | | (2,546 | ) |
| | | | | | | | | | | | | | | | | | | | | | | | |
| | | | | | | | | | | | | | | | | | | | | | | | | | | | | | | | | | | |
Balance, June 30, 2013 | | | 37,440,662 | | $ | 4 | | | 2,750,000 | | $ | 63,112 | | $ | 548,390 | | $ | (294 | ) | $ | (81,050 | ) | | — | | $ | — | | $ | 3,596 | | $ | 533,758 | |
Net income (loss)(1) | | | — | | | — | | | — | | | — | | | — | | | — | | | 19,600 | | | — | | | — | | | (209 | ) | | 19,391 | |
Foreign currency translation adjustments | | | — | | | — | | | — | | | — | | | — | | | 182 | | | — | | | — | | | — | | | — | | | 182 | |
Conversion of Series A to Common Stock | | | 2,750,000 | | | — | | | (2,750,000 | ) | | (63,112 | ) | | 63,112 | | | — | | | — | | | — | | | — | | | — | | | — | |
Purchase of Treasury Stock | | | — | | | — | | | — | | | — | | | — | | | — | | | — | | | (2,195,196 | ) | | (48,548 | ) | | — | | | (48,548 | ) |
Stock based compensation expense | | | — | | | — | | | — | | | — | | | 22,828 | | | — | | | — | | | — | | | — | | | — | | | 22,828 | |
Exercise of stock options | | | 531,262 | | | — | | | — | | | — | | | 10,294 | | | — | | | — | | | — | | | — | | | — | | | 10,294 | |
Excess tax benefit from stock-based compensation | | | — | | | — | | | — | | | — | | | 1,075 | | | — | | | — | | | — | | | — | | | — | | | 1,075 | |
Issuance of restricted stock awards | | | 704,131 | | | — | | | — | | | — | | | — | | | — | | | — | | | — | | | — | | | — | | | — | |
Forfeiture of restricted stock awards | | | (93,423 | ) | | — | | | — | | | — | | | — | | | — | | | — | | | — | | | — | | | — | | | — | |
Accretion of redeemable noncontrolling interests to estimated redemption value | | | — | | | — | | | — | | | — | | | (1,645 | ) | | — | | | — | | | — | | | — | | | — | | | (1,645 | ) |
Retirement of restricted stock for tax withholding | | | (188,570 | ) | | — | | | — | | | — | | | (5,018 | ) | | — | | | — | | | — | | | — | | | — | | | (5,018 | ) |
Deconsolidation of certain businesses | | | — | | | — | | | — | | | — | | | — | | | — | | | — | | | — | | | — | | | (3,387 | ) | | (3,387 | ) |
| | | | | | | | | | | | | | | | | | | | | | | | |
| | | | | | | | | | | | | | | | | | | | | | | | | | | | | | | | | | | |
Balance, June 30, 2014 | | | 41,144,062 | | $ | 4 | | | — | | $ | — | | $ | 639,036 | | $ | (112 | ) | $ | (61,450 | ) | | (2,195,196 | ) | $ | (48,548 | ) | $ | — | | $ | 528,930 | |
| | | | | | | | | | | | | | | | | | | | | | | | |
| | | | | | | | | | | | | | | | | | | | | | | | | | | | | | | | | | | |
| | | | | | | | | | | | | | | | | | | | | | | | | | | | | | | | | | | |
| | | | | | | | | | | | | | | | | | | | | | | | |
(1)Net income (loss) attributable to noncontrolling interest excludes $1.3 million, $1.0 million and $1.5 million for the years ended June 30, 2014, 2013 and 2012, respectively due to the redeemable noncontrolling interest related to Middlebury Interactive Languages, which is reported outside of permanent equity in the consolidated balance sheet (See Note 10).
| (1) | | Net income attributable to noncontrolling interest excludes $0.9 million, $0.5 million and $1.7 million for the years ended June 30, 2017, 2016 and 2015, respectively, due to the redeemable noncontrolling interest related to Middlebury Interactive Languages and LearnBop, which is reported outside of permanent equity in the consolidated balance sheets (See Note 10 – “Redeemable Noncontrolling Interest”). |
See accompanying summary of accounting policies and notes to consolidated financial statements.
K12 INC.
CONSOLIDATED STATEMENTS OF CASH FLOWS
| | | | | | | | | | | | | | | | | | | |
| | Year Ended June 30, | | | Year Ended June 30, |
|---|
| | 2014 | | 2013 | | 2012 | | | 2017 | | 2016 | | 2015 |
|---|
| | (In thousands)
| | | (In thousands) |
|---|
Cash flows from operating activities | | | | | | | | | | | | | | | | |
Net income | | $ | 18,116 | | $ | 26,534 | | $ | 16,109 | | |
Adjustments to reconcile net income to net cash provided by operating activities: | | | | | | | | |
Net income (loss) | | | $ | (459) | | $ | 8,551 | | $ | 9,326 |
Adjustments to reconcile net income (loss) to net cash provided by operating activities: | | | | | | | | | | |
Depreciation and amortization expense | | 86,267 | | 65,737 | | 58,033 | | | | 74,280 | | | 68,225 | | | 80,282 |
Stock-based compensation expense | | 22,828 | | 14,374 | | 10,067 | | | | 22,598 | | | 18,616 | | | 21,299 |
Excess tax (benefit) expense from stock-based compensation | | (1,075 | ) | | (8,889 | ) | | 3,122 | | |
Excess tax benefit from stock-based compensation | | | | (291) | | | (6) | | | (118) |
Deferred income taxes | | (7,186 | ) | | 15,770 | | 10,297 | | | | (7,065) | | | (3,818) | | | (3,094) |
Provision for doubtful accounts | | 1,439 | | 2,070 | | 204 | | | | 4,512 | | | 4,610 | | | 9,300 |
Provision for inventory obsolescence | | 4,293 | | 387 | | 1,618 | | |
Provision for excess and obsolete inventory | | | | 475 | | | 691 | | | 1,406 |
Provision for student computer shrinkage and obsolescence | | (526 | ) | | 482 | | 1,038 | | | | 246 | | | (459) | | | (430) |
Realized gain on sale of assets | | (6,404 | ) | | — | | — | | |
Impairment loss on other assets | | | | 586 | | | 200 | | | — |
Expensed computer peripherals | | | | 3,525 | | | 2,625 | | | 3,519 |
Impairment of investment in Web International Education Group, Ltd. | | | | 10,000 | | | — | | | 3,200 |
Other | | | | (255) | | | — | | | — |
Changes in assets and liabilities: | | | | | | | | | | | | | | | | |
Accounts receivable | | (12,257 | ) | | (27,708 | ) | | (64,270 | ) | | | (27,745) | | | 14,463 | | | (1,892) |
Inventories | | 6,272 | | (6,929 | ) | | (8,918 | ) | | | (348) | | | (1,751) | | | 2,853 |
Prepaid expenses | | 2,735 | | 843 | | (784 | ) | | | 1,628 | | | 1,860 | | | (4,073) |
Other current assets | | (1,645 | ) | | 682 | | (5,260 | ) | | | 43 | | | 2,830 | | | (2,579) |
Deposits and other assets | | (212 | ) | | (466 | ) | | 764 | | | | 10,020 | | | (8,910) | | | (1,440) |
Accounts payable | | 9,778 | | (2,115 | ) | | 2,794 | | | | 5,317 | | | (3,900) | | | (1,192) |
Accrued liabilities | | 4,793 | | 3,226 | | (292 | ) | | | (4,963) | | | 15,497 | | | (7,854) |
Accrued compensation and benefits | | (4,214 | ) | | 4,616 | | 4,275 | | | | (1,674) | | | 4,255 | | | 9,389 |
Deferred revenue | | (1,429 | ) | | 3,119 | | 3,351 | | | | (1,135) | | | 636 | | | 621 |
Restricted cash | | — | | 1,501 | | — | | |
Deferred rent and other liabilities | | 1,904 | | 2,059 | | 843 | | | | (567) | | | (2,437) | | | 1,562 |
| | | | | | | | | |
| | | | | | | | |
Net cash provided by operating activities | | 123,477 | | 95,293 | | 32,991 | | | | 88,728 | | | 121,778 | | | 120,085 |
| | | | | | | | | |
| | | | | | | | |
Cash flows from investing activities | | | | | | | | | | | | | | | | |
Purchases of property and equipment | | (7,405 | ) | | (8,339 | ) | | (10,483 | ) | |
Purchase of property and equipment | | | | (2,174) | | | (5,008) | | | (9,928) |
Capitalized software development costs | | (26,553 | ) | | (23,446 | ) | | (21,994 | ) | | | (26,918) | | | (36,265) | | | (33,755) |
Capitalized curriculum development costs | | (15,411 | ) | | (18,560 | ) | | (16,123 | ) | | | (19,132) | | | (21,627) | | | (18,057) |
Mortgage note to a managed school partner | | (2,100 | ) | | — | | — | | |
Net cash received on sale of assets | | 5,665 | | — | | — | | |
Purchase of Kaplan/Insight assets | | — | | — | | (12,641 | ) | |
| | | | | | | | | |
| | | | | | | | |
Purchase of noncontrolling interest | | | | (9,134) | | | — | | | — |
Sale of trade name | | | | 89 | | | — | | | — |
Acquisition of LearnBop, Inc. | | | | — | | | — | | | (6,512) |
Acquisition of LTS Education Systems, net of cash acquired | | | | 71 | | | (19,953) | | | — |
Net cash used in investing activities | | (45,804 | ) | | (50,345 | ) | | (61,241 | ) | | | (57,198) | | | (82,853) | | | (68,252) |
| | | | | | | | | |
| | | | | | | | |
Cash flows from financing activities | | | | | | | | | | | | | | | | |
Repayments on capital lease obligations | | (22,694 | ) | | (20,275 | ) | | (16,600 | ) | | | (15,697) | | | (17,402) | | | (21,939) |
Repayments on notes payable | | (390 | ) | | (1,533 | ) | | (1,820 | ) | |
Purchase of treasury stock | | (48,548 | ) | | — | | — | | | | — | | | — | | | (26,452) |
Proceeds from exercise of stock options | | 10,294 | | 7,253 | | 3,380 | | | | 6,953 | | | 14 | | | 553 |
Net proceeds from investment in noncontrolling interest | | 1,275 | | — | | — | | |
Payment of stock registration expense | | — | | — | | (313 | ) | |
Excess tax benefit (expense) from stock-based compensation | | 1,075 | | 8,889 | | (3,122 | ) | |
Retirement of restricted stock for tax withholding | | (5,018 | ) | | (2,546 | ) | | (1,292 | ) | |
| | | | | | | | | |
| | | | | | | | |
Excess tax benefit from stock-based compensation | | | | 291 | | | 6 | | | 118 |
Repurchase of restricted stock for income tax withholding | | | | (6,191) | | | (3,394) | | | (2,672) |
Net cash used in financing activities | | (64,006 | ) | | (8,212 | ) | | (19,767 | ) | | | (14,644) | | | (20,776) | | | (50,392) |
| | | | | | | | | |
| | | | | | | | |
Effect of foreign exchange rate changes on cash and cash equivalents | | 962 | | 92 | | (430 | ) | | | (11) | | | (12) | | | (1,698) |
| | | | | | | | | |
| | | | | | | | |
Net change in cash and cash equivalents | | 14,629 | | 36,828 | | (48,447 | ) | | | 16,875 | | | 18,137 | | | (257) |
Cash and cash equivalents, beginning of year | | 181,480 | | 144,652 | | 193,099 | | |
| | | | | | | | | |
| | | | | | | | |
Cash and cash equivalents, end of year | | $ | 196,109 | | $ | 181,480 | | $ | 144,652 | | |
| | | | | | | | | |
| | | | | | | | |
| | | | | | | | |
| | | | | | | | | |
Cash and cash equivalents, beginning of period | | | | 213,989 | | | 195,852 | | | 196,109 |
Cash and cash equivalents, end of period | | | $ | 230,864 | | $ | 213,989 | | $ | 195,852 |
See accompanying summary of accounting policies and notes to consolidated financial statements.
1. Description of the Business
K12K12 Inc. and, together with its subsidiaries ("K12"(“K12” or the "Company"“Company”), is a technology-based education company. The Company offers proprietaryonline curriculum, software systems and educational services designed to facilitate individualized learning for students primarily in kindergarten through 12th grade, or K-12. The Company's mission isCompany’s learning systems combine curriculum, instruction and related support services to maximize a child's potential by providing access to an engaging and effective education, regardless of geographic location or socio-economic background. Our learning system combines the Company's curriculum and offerings withcreate an individualized learning approach well-suited for virtual and blended public schools, public school districts, charter schools and private schools and families that utilize varying degrees of online and traditional classroom instruction, and other educational applications. In contracting withThese products and services are provided primarily to three lines of business: Managed Public School Programs (curriculum and services sold to 77 managed public schools in a virtualmajority of states throughout the United States), Institutional (curriculum, technology and blendedservices provided to school districts, public school,schools and other educational institutions that the Company typically provides students with access to the K12 online curriculum, offline learning kitsdoes not manage), and the use of a personal computer in certain cases, in addition to providing management services. For fiscal year 2015,Private Pay Schools and Other (private schools for which the Company will manage virtual schools in 33 statescharges student tuition and the District of Columbia.makes direct consumer sales).
In addition, the
The Company works closely as partnersa partner with a growing number of public schools, school districts, privatecharter schools and charterprivate schools, enabling them to offer their students an array of online education solutions, including full-time virtual and blended programs, semester coursecourses and supplemental solutions. In addition to curriculum, systems and programs, the Company provides teacher training, teaching services, and other academic and technology support services.
2. Basis of Presentation
The consolidated financial statements include the accounts of the Company its wholly-owned subsidiaries and all controlledits subsidiaries. All significant intercompany transactionsaccounts and balancestransactions have been eliminated in consolidation.eliminated.
The Company operates in one operating and reportable business segment as a technology-basedtechnology‑based education company providing proprietaryonline curriculum, software systems and educational services designed to facilitate individualized learning for students primarily in kindergarten through 12th12th grade. The Chief Operating Decision Maker evaluates profitability based only on consolidated results.
3. Summary of Significant Accounting Policies
The preparation of financial statements in conformity with accounting principles generally accepted in the United States ("GAAP"(“GAAP”) requires management to make estimates and assumptions affecting the reported amounts of assets and liabilities and contingent assets and liabilities at the date of the financial statements and the reported amounts of revenues and expenses during the reporting period. On an ongoing basis, the Company evaluates its estimates and assumptions, including those related to allowance for doubtful accounts, inventory reserves, amortization periods, the allocation of purchase price to the fair value of net assets and liabilities acquired in business combinations, fair values used in asset impairment evaluations, valuation of long-lived assets, accrual for incurred but not reported (“IBNR”) claims, fair value of redeemable noncontrolling interest, fair value of lease exit liabilities, contingencies, income taxes and stock-based compensation expense. The Company bases its estimates on historical experience and various assumptions that it believes are reasonable under the circumstances. The results of the analysis form the basis for making assumptions about the carrying values of assets and liabilities that are not readily apparent from other sources. Actual results could differ from those estimates.
Table of Contents
K12 Inc.
Notes to Consolidated Financial Statements (Continued)
3. Summary of Significant Accounting Policies (Continued)
Revenues are principally earned from long-term contractual agreements to provide online curriculum, books, materials, computers and management services to virtual and blended publiccharter schools, traditional public schools, school districts, public charter schools, and private schools. In addition to providing the curriculum, books and materials, under most contracts, the Company managesprovides management services and technology to virtual and blended public schools, including monitoring academic achievement, teacher hiring and training, compensation of school personnel, financial management, enrollment processing and development and procurement of curriculum, equipment and required services. The schools receive funding
on a per student basis from the state in which the public school or school district is located. Shipments of materials for schools that occur in the fourth fiscal quarter and for the upcoming school year are recorded in deferred revenues.revenue.
Where the Company has determined that it is the primary obligor for substantially all expenses under these contracts, the Company records the associated per student revenuerevenues received by the school from its state funding school district up to the expenses incurred in accordance with ASCAccounting Standards Codification (“ASC”) 605,Revenue Recognition (“ASC 605”). As a result of being the primary obligor, amounts recorded as revenues and instructional costs and servicesschool operating expenses for the years ended June 30, 2014, 20132017, 2016 and 20122015, were $265.2$292.0 million, $247.1$294.7 million and $183.5$338.2 million, respectively. For contracts where the Company is not the primary obligor, the Company records revenuerevenues based on its net fees earned under the contractual agreement.
The Company generates revenues under turnkey management contracts with virtual and blended public schools which include multiple elements. These elements include providing each of a school's students with access to the Company's online school and the component of lessons; offline learning kits, which include books and materials to supplement the online lessons; the use of a personal computer and associated reclamation services; internet access and technology support services; the services of a state-certified teacher; and management and technology services required to operate a virtual public or blended school. In certain managed school contracts, revenue is determined directly by per enrollment funding.include:
| · | | providing each of a school’s students with access to the Company’s online school and lessons; |
| · | | offline learning kits, which include books and materials to supplement the online lessons, where required; |
| · | | the use of a personal computer and associated reclamation services, where required; |
| · | | internet access and technology support services; |
| · | | instruction by a state-certified teacher, where required; and |
| · | | management and technology services necessary to operate a virtual public or blended school. In certain managed school contracts, revenues are determined directly by per enrollment funding. |
The Company has determined that the elements of its contracts are valuable to schools in combination, but do not have standalone value. As a result, the elements within the Company'sCompany’s multiple-element contracts do not qualify as separate units of accounting. Accordingly, the Company accounts for revenues under multiple element arrangements as a single unit of accounting and recognizes the entire arrangement based upon the approximate rate at which it incurs the costs associated with each element. RevenueRevenues from certain managed schools isare recognized ratably over the period services are performed.
To determine the pro rata amount of revenues to recognize in a fiscal quarter, we estimatethe Company estimates the total funds each school will receive in a particular school year. Total funds for a school are primarily a function of the number of students enrolled in the school and established per enrollment funding levels, which are generally published on an annual basis by the state or school district. We review ourThe Company reviews its estimates of funding periodically, and reviserevises as necessary, amortizing any adjustments to earned revenues over the remaining portion of the fiscal year. Actual school funding may vary from these estimates and the impact of these differences could have a material impact on ourthe Company’s results of operations. Since the end of the school year coincides with the end of ourthe Company’s fiscal year, weannual revenues are generally able to base our annual revenuesbased on actual school funding. Ourfunding and actual costs incurred (including costs for the Company’s services to the schools plus other costs the schools may incur) in the calculation of school operating losses. The Company’s schools’ reported results are subject to annual school district financial audits, which incorporate enrollment counts, funding and other routine financial audit considerations. The results of these audits are incorporated into ourthe Company’s monthly funding estimates and for the reported fiscal years ended June 30, 2013, 20122016, 2015 and 2011, our2014, the Company’s aggregate funding estimates differed from actual reimbursements impacting total reported revenue by approximately 0.2%(0.1)%, (0.1%)0.4%, and 0.7%(0.1)%, respectively.
Table of Contents
K12 Inc.
Notes to Consolidated Financial Statements (Continued)
3. Summary of Significant Accounting Policies (Continued)
Under the contracts where the Company provides turnkey management services to schools, the Company has generally agreed to absorb any operating losses of the schools in a given school year. These school operating losses represent the excess of costs incurred over revenues earned by the virtual or blended public school as reflected on its respective financial statements, including Company charges to the schools. To the extent a school does not receive funding
for each student enrolled in the school, the school would still incur an operating loss forcosts associated with serving the unfunded enrollment. If losses due to unfunded enrollments result in a net operating loss for the year that loss is reflected as a reduction in the revenuerevenues and net receivables that we collectthe Company collects from the school. A school net operating loss in one year does not necessarily mean the Company anticipates losing money on the entire contract with the school. However, a school operating loss may reduce the Company'sCompany’s ability to collect its management fees in full and recognized revenues are reduced accordingly to reflect the expected cash collections from such schools. The Company amortizes the estimated school operating loss against revenues based upon the percentage of actual revenues in the period to total estimated revenues for the fiscal year.
For turnkey revenue service contracts,contract revenues, a school operating loss may reduce ourthe Company’s ability to collect ourits management fees in full, though as noted it does not necessarily mean that we incurthe Company incurs a loss during the period with respect to ourits services to that school. We recognize revenue,The Company recognizes revenues, net of ourits estimated portion of school operating losses, to reflect the expected cash collections from such schools. Revenue isRevenues are recognized based on ourthe Company’s performance of services under the contract, which we believeit believes is proportionate to ourits incurrence of costs. We incurThe Company incurs costs directly related to the delivery of services. Most of these costs are recognized throughout the year; however, certain costs related to upfront delivery of printed materials, workbooks, laboratory materials and other items are provided at the beginning of the school year and are recognized as expenseexpenses when shipped.
Each state or school district has variations in the school funding formulas and methodologies that we useit uses to estimate funding for revenue recognition at ourits respective schools. As we buildthe Company builds the funding estimates for each school, we areit is mindful of the state definition for count dates on which reported enrollment numbers will be used for per pupil funding. The parameters we considerthe Company considers in estimating funding for revenue recognition purposes include school district count definitions, withdrawal rates, average daily attendance, special needs enrollment, student demographics, academic progress trajectory and historical completion, student location, funding caps and other state specified categorical program funding. The estimates we make each period on a school-by-school basis consider the latest information available to us and consider material relevant information at the time of the estimate.
Management periodically reviews its estimates of full-year school revenues and operating expenses and amortizes the net impact of any changes to these estimates over the remainder of the fiscal year. Actual school operating losses may vary from these estimates or revisions, and the impact of these differences could have a material impact on results of operations. Since the end of the school year coincides with the end of ourthe Company’s fiscal year, annual revenues are generally based on actual school revenuesfunding and actual costs incurred (including costs for ourthe Company’s services to the schools plus other costs the schools may incur) in the calculation of school operating losses. For the years ended June 30, 2014, 20132017, 2016 and 2012,2015, the Company's revenueCompany’s revenues included a reduction for these school operating losses of $49.8$61.0 million, $64.5$57.1 million, and $54.8$65.2 million, respectively.
The Company provides certain online curriculum and services to schools and school districts under subscription and perpetual license agreements. RevenueRevenues under these agreements isare recognized in accordance with the ASC 605 when all of the following conditions are met: there is persuasive evidence of
Table of Contents
K12 Inc.
Notes to Consolidated Financial Statements (Continued)
3. Summary of Significant Accounting Policies (Continued)
an arrangement; delivery has occurred or services have been rendered; the amount of fees to be paid by the customer is fixed and determinable; and the collectability of the fee is probable. RevenueRevenues from the licensing of curriculum under subscription arrangements isare recognized on a ratable basis over the subscription period. RevenueRevenues from the licensing of curriculum under non-cancelable perpetual arrangements isare recognized when all revenue recognition criteria have been met. RevenueRevenues from professional consulting, training and support services are deferred and recognized ratably over the service period.
Other revenues are generated from individual customers who prepay and have access for one to two years to company-provided online curriculum. The Company recognizes these revenues pro rata over the maximum term of the customer contract. Revenues from associated offline learning kits are recognized upon shipment.
The Company accrues interest on its long-term receivables based on contracted terms.
During the years ended June 30, 2014, 20132017, 2016 and 2012,2015, approximately 88%83%, 86%82% and 84%86%, respectively, of the Company'sCompany’s revenues were recognized from schools we managed. Thethat contracted with the Company for Managed Public School Programs. During the year ended June 30, 2017, the Company had no such contracts with two schoolsthat represented 10% of total
revenues. During the years ended June 30, 2016 and 2015, the Company had one contract that represented approximately 13%10% and 10%14% of total revenues, respectively, during 2014, approximately 14% and 11% of revenues in 2013 and represented about 13% and 12% of revenues in 2012.respectively. Approximately 9% and 7% of accounts receivable was attributable to athat one contract with one school as of June 30, 20142016.
In fiscal year 2015, Agora renegotiated its service agreement and 2013.entered into a three year contract with the Company to purchase its curriculum and certain technology services, while the school board assumed daily operational responsibilities, including its charter renewal process and marketing and enrollment activities. This assumption of responsibilities caused the classification of Agora to change from a Managed Public School Program to a non-managed school within the Institutional business. The net impact of this event on the fiscal year 2016 revenues attributable to the loss of the management component of the Agora contract was approximately $111 million.
On June 9, 2016, Agora signed a new service agreement that extends through 2019 and included additional services including curriculum and certain technology services while the school board retained daily operational responsibilities. The agreement also calls for payment terms of outstanding receivables to be paid over an approximate two-year period resulting in the reclassification of a portion to deposits and other assets on the consolidated balance sheets. The Company has reclassified certain prior year fixed asset classifications to conform to the current year presentation. There was no effect on the fixed assets, total assets, or the income statementhad outstanding receivables from such reclassification.Agora of $25.4 million and $29.5 million as of June 30, 2017 and 2016.
Shipping and handling costs are expensed when incurred and are classified as instructional costs and services in the accompanying consolidated statements of operations. Shipping and handling charges invoiced to a customer and are included in revenues.
All research and development costs, including patent application costs, are expensed as incurred.
Cash and cash equivalents generally consist of cash on hand and cash held in money market and demand deposit accounts. The Company considers all highly liquid investments with maturities of three months or less when purchased to be cash equivalents. The Company periodically has cash balances which exceed federally insured limits.
The Company maintains an allowance for uncollectible accounts primarily for estimated losses resulting from the inability or failure of individual customers to make required payments. The Company analyzes accounts receivable, historical percentages of uncollectible accounts, and changes in payment history when evaluating the adequacy of the allowance for uncollectible accounts. The Company writes-off accounts receivable based on the age of the receivable and the facts and circumstances surrounding the customer and reasons for non-payment. The Company records an allowance for estimated uncollectible accounts in an amount approximating anticipated losses. Actual write-offs might
Table of Contents
K12 Inc.
Notes to Consolidated Financial Statements (Continued)
3. Summary of Significant Accounting Policies (Continued)
exceed the recorded allowance, but collection experience has been consistent with the Company's estimates.allowance.
Inventories consist primarily of textbooks and curriculum materials, a majority of which are supplied to virtual public schools and blended public schools and utilized directly by students. Inventories represent items that are purchased and held for sale and are recorded at the lower of cost (first-in, first-out method) or market value. ExcessProvisions for excess and obsolete inventory reserves are established based upon the evaluation of the quantity on hand relative to demand.
During the yearyears ended June 30, 2014,2016 and 2015, the Company increased the provision for excess and obsolete inventory by $4.2$0.7 million and $1.4 million primarily related to inventory in excess of anticipated demand and the decision to discontinue certain products and excess inventory relative to anticipated demand. There were no material write-downs forproducts. The Company decreased the yearsprovision during the year ended June 30, 2013 and 2012.2017 by $0.3
million. The excess and obsolete inventory reserve at June 30, 20142017 and 20132016, was $9.1$2.3 million and $4.9$2.6 million, respectively.
Other current assets consist primarily of textbooks, curriculum materials and other supplies which are expected to be returned upon the completion of the school year. Materials not returned are expensed as part of instructional costs and services.
Property and equipment are stated at cost less accumulated depreciation and amortization. Depreciation expense is calculated using the straight-line method over the estimated useful life of the asset (or the lesser of the term of the lease and the estimated useful life of the asset under capital lease). Amortization of assets capitalized under capital lease arrangements is included in depreciation and amortization expense. Leasehold improvements are amortized over the lesser of the lease term or the estimated useful life of the asset. The Company determines the lease term in accordance with ASC 840,Leases(“ASC 840”), as the fixed non-cancelable term of the lease plus all periods for which failure to renew the lease imposes a penalty on the lessee in an amount such that renewal appears, at the inception of the lease, to be reasonably assured. Beginning in fiscal year 2016, the Company no longer recovers peripheral equipment as it was determined to be uneconomical. Accordingly, the Company fully expenses peripheral equipment upon shipment as a component of instructional costs and services. These expenses totaled $3.5 million and $2.6 million for the years ended June 30, 2017 and 2016, respectively.
In addition, during the year ended June 30, 2015, the Company wrote down $6.5 million of property and equipment primarily related to computer peripherals and other fixed assets shipped to students, and for which no reclamation will be processed. There were no other material write-downs for the years ended June 30, 2017 and 2016.
Property and equipment are depreciated over the following useful lives:
| | |
| | Useful Life |
|---|
Student computers
| | 3 years |
Computer hardware
| | 3 yearsUseful Life |
Computer softwareStudent and state testing computers
| | 3 - 5 years |
Computer hardware | | 3 years |
Computer software | | 3 - 5 years |
Web site development | | 3 years |
Office equipment | | 5 years |
Furniture and fixtures | | 7 years |
Leasehold improvements | | 3 - 12 years |
During the fiscal year ended June 30, 2014, theThe Company updated themakes an estimate of unreturned student computers based on an analysis of recent trends of returnsreturns. In addition during the fiscal year 2017, the Company accelerated depreciation on property and utilization rates, as well as information obtained fromequipment associated with the student computer processing systems. As a result,operating leases that were exited during the three months ended March 31, 2017 (see Note 12, “Restructuring and Severance”). The Company recorded accelerated depreciation of $6.5$3.5 million, $2.8 million and $5.0 million for computers that we estimate will not be returned by our students. The Company recorded no accelerated depreciation for the fiscal years ended June 30, 20132017, 2016 and 2012.2015, respectively, related to the leases exited and for unreturned student computers.
Table of ContentsCapitalized Software
K12 Inc.
Notes to Consolidated Financial Statements (Continued)
3. Summary of Significant Accounting Policies (Continued)
The Company develops software for internal use. Software development costs incurred during the application development stage are capitalized in accordance with ASC 350,Intangibles—Intangibles -- Goodwill and Other (“ASC 350”). The Company amortizes these costs over the estimated useful life of the software, which is generally three years. Capitalized software development costs are stated at cost less accumulated amortization.
Capitalized software development additions totaled $26.6$26.9 million, $23.4$36.3 million and $22.0$33.8 million for the years ended June 30, 2014, 20132017, 2016 and 2012,2015, respectively. During the year ended June 30, 2014, theThe Company wrote down approximately $3.8$0.5 million and $4.8 million,
respectively, of capitalized software projects after determining the assets either havehad no future use or are being sunset.sunset for the years ended June 30, 2016 and 2015. This write-down was included in selling, administrative and other operating expenses. There were no material write-downs of capitalized software projects for the yearsyear ended June 30, 2013 and 2012. 2017.
Amortization expense for the years ended June 30, 2014, 20132017, 2016 and 20122015, was $20.1$33.0 million, $14.7$28.9 million and $11.7$26.8 million, respectively.
The Company internally develops curriculum, which is primarily provided as online content and accessed via the Internet. The Company also creates textbooks and other materials that are complementary to online content.
The Company capitalizes curriculum development costs incurred during the application development stage in accordance with ASC 350. The Company capitalizes curriculum development costs during the design and deployment phases of the project. Many of the Company'sCompany’s new courses leverage off of proven delivery platforms and are primarily content, which has no technological hurdles. As a result, a significant portion of the Company'sCompany’s courseware development costs qualify for capitalization due to the concentration of its development efforts on the content of the courseware. Capitalization ends when a course is available for general release to its customers, at which time amortization of the capitalized costs begins. The period of time over which these development costs will beare amortized is generally five years.
Total capitalized curriculum development additions were $15.4$19.1 million, $18.6$21.6 million and $16.1$18.1 million for the years ended June 30, 2014, 20132017, 2016 and 2012,2015, respectively. These amounts are recorded on the accompanying consolidated balance sheets, net of amortization and impairment charges. Amortization charges are recorded in product development expensesinstructional costs and services on the accompanying consolidated statements of operations. Amortization expense for the years ended June 30, 2014, 20132017, 2016 and 2012 were $19.02015 was $19.9 million, $14.3$17.0 million and $12.4$20.1 million, respectively. The Company wrote down approximately $2.2$2.6 million of capitalized curriculum development costs due to its decision to discontinuean assessment of recoverability of certain curriculum during the fiscal year ended June 30, 2014.2015. There were no material write-downswrite‑downs of capitalized curriculum development costs for the fiscal years ended June 30, 20132017 and 2012.2016.
Earnings or losses attributable to other stockholdersminority shareholders of a consolidated affiliated company are classified separately as "noncontrolling interest"“noncontrolling interest” in the Company'sCompany’s consolidated statements of operations. Net loss attributable to noncontrolling interest reflects only its share of the after-tax earnings or losses of an affiliated company. Income taxes attributable to noncontrolling interest are determined using the applicable statutory tax rates in the jurisdictions where such operations are conducted. These rates vary from country to country. The Company's consolidated balance sheets reflect noncontrolling interests within the equity section of the consolidated balance sheet, except for redeemable noncontrolling interests.
Table of Contents
K12 Inc.
Notes to Consolidated Financial Statements (Continued)
3. Summary of Significant Accounting Policies (Continued)
Noncontrolling interest is classified separately in the Company's consolidated statements of stockholders' equity. These businesses were deconsolidated during fiscal year 2014.
Noncontrolling interests in subsidiaries that are redeemable outside of the Company'sCompany’s control for cash or other assets are classified outside of permanent equity at redeemable value, which approximates fair value. If the redemption amount is other than fair value (e.g. fixed or variable), the redeemable noncontrolling interest is accounted for at the fixed or variable redeemable value. The redeemable noncontrolling interests are adjusted to their fairredeemable value at each balance sheet date. The resulting increases or decreases in the estimated redemption amount are affected by corresponding charges against retained earnings, or in the absence of retained earnings, additional paid-in-capital.
The Company records as goodwill the excess of purchase price over the fair value of the identifiable net assets acquired. Finite-livedFinite‑lived intangible assets acquired in business combinations subject to amortization are recorded at their fair value. Finite-livedFinite‑lived intangible assets include trade names, acquired customers and non-competenon‑compete agreements. Such intangible assets are amortized on a straight-linestraight‑line basis over their estimated useful lives. As of June 30, 2014 and 2013, finite-lived intangible assets were recorded at $37.4 million and $44.9 million, respectively, and accumulated amortization of $13.7 million and $12.8 million, respectively. Amortization expense for the years ended June 30, 2014, 20132017, 2016 and 20122015 was $8.0$2.9 million, $4.6$2.7 million and $4.7$2.6 million, respectively. During the year ended June 30, 2014, the Company determined that based on rebranding of the Institutional Sales business, the Company fully amortized certain trade names that are no longer going to be used and recorded a $5.2 million impairment charge. There was no material impairment charge for the years ended June 30, 2013 and 2012. Future amortization of intangible assets is $2.5$2.9 million, $2.5$2.8 million, $2.0$2.7 million, $2.0$2.3 million and $2.0$2.2 million in the years ended June 30, 20152018 through June 30, 2019,2022, respectively and $12.7$7.1 million thereafter. As of June 30, 20142017 and 2013,2016, the goodwill balance was $58.1$87.2 million and $61.4$87.3 million, respectively. The reduction in goodwill was the result of an adjustment to the purchase price consideration related to the Company’s acquisition of LTS Education Systems, Inc. (see Note 13, “Acquisitions and Investments”).
The Company reviews its recorded finite-lived intangible assets for impairment whenever events or changes in circumstances indicate that the carrying amount of an asset may not be fully recoverable. If the total of the expected undiscounted future cash flows is less than the carrying amount of the asset, a loss is recognized for the difference between fair value and the carrying value of the asset. There were no such events during the year ended June 30, 2017.
Goodwill and intangible assets deemed to have an indefinite life are tested for impairment on an annual basis, or earlier when events or changes in circumstances suggest the carrying amount may not be fully recoverable. Examples of such events or circumstances include, but are not limited to, significant underperformance relative to historical or projected future operating results, significant changes in the manner of use of acquired assets or the strategy for the Company’s business, significant negative industry or economic trends, and/or a significant decline in the Company’s stock price for a sustained period.
ASC 350 prescribes a two-step process for impairment testing of goodwill and intangibles with indefinite lives, which is performed annually, as well as when an event triggering impairment may have occurred. ASC 350 also allows preparers to qualitatively assess goodwill impairment through a screening process which would permit companies to forgo Step 1 of their annual goodwill impairment process. This qualitative screening process will hereinafter beis referred to as "Step 0"“Step 0”. Goodwill and intangible assets deemed to have an indefinite life are tested for impairment on an annual basis, or earlier when events or changes in circumstances suggest the carrying amount may not be fully recoverable. The Company has elected to performperforms its annual assessment on May 31st. For31st. Under the years ended June 30, 2014, 2013two-step process, the first step tests for potential impairment by comparing the fair value of reporting units with reporting units’ net asset values. If the fair value of a reporting unit exceeds the carrying value of the reporting unit’s net assets, then goodwill is not impaired and 2012 no further testing is required. If the fair value of reporting unit is below the reporting unit’s carrying value, then the second step is required to measure the amount of potential impairment. The second step requires an assignment of the reporting unit’s fair value to the reporting unit’s assets and liabilities, using the initial acquisition accounting guidance related to business combinations, to determine the implied fair value of the reporting unit’s goodwill. The implied fair value of the reporting unit’s goodwill is then compared with the carrying amount of the reporting unit’s goodwill to determine the goodwill impairment loss to be recognized, if any. If the carrying value of a reporting unit’s goodwill exceeds its implied fair value, an impairment loss equal to the difference is recorded.
The Company has determined it has one reporting unit. In the prior fiscal year, the Company had two reporting units, which included Middlebury. The Middlebury reporting unit was recorded.merged into the K12 reporting unit during the fourth quarter of fiscal year 2017. As a result of the saleCompany’s purchase of the business assets duringremaining 40% interest in the fiscaljoint venture, Middlebury Interactive Language (“MIL”) (see Note 10, “Redeemable Noncontrolling Interest”), the Company began a process of integration. This integration included the accounting function, as well as the operations and management of remaining MIL employees. MIL no longer had a separate segment manager that reviewed results and reported into the Chief Operating Decision Maker (the “CODM”).
During the year ended June 30, 2017, the Company performed “Step 0” of the impairment test and determined that there were no facts and circumstances that indicated that the fair value of the reporting unit may be less than its carrying amount and as a result, the Company determined that no impairment was required. During the year ended June 30, 2016, the Company performed step one of the two-step impairment test. The estimated fair value of the K12 reporting unit exceeded its carrying value by approximately 9.8% and the Middlebury reporting unit exceeded its fair value by approximately 29.8%. Based on the goodwill impairment analysis results, the Company determined that no impairment was required.
On July 31, 2014, the Company wrote off goodwill of $3.4acquired a 51% majority interest in LearnBop, Inc. for $6.5 million in cash. On April 21, 2016, The Company acquired 100% interest in LTS Education Systems (“LTS”), for $23.1 million in cash and net intangibles of $0.4 million associated with these entities.contingent consideration, see Note 13, “Acquisitions and Investments.”
Table of Contents
K12 Inc.
Notes to Consolidated Financial Statements (Continued)
3. Summary of Significant Accounting Policies (Continued)
The following table represents goodwill additions/reductions during fiscalthe years ended June 30, 2014, 20132017, 2016 and 2012:2015:
| | | | |
($ in millions) | | Amount | |
|---|
Rollforward of Goodwill | | | | |
Balance as of June 30, 2012 | | $ | 61.6 | |
| | | | |
| | | | | |
Adjustments due to other foreign exchange translations | | | (0.2 | ) |
| | | | |
| | | | | |
Balance as of June 30, 2013 | | $ | 61.4 | |
| | | | |
| | | | | |
Sale of business unit | | $ | (3.4 | ) |
Adjustments due to other foreign exchange translations | | | 0.1 | |
| | | | |
| | | | | |
Balance as of June 30, 2014 | | $ | 58.1 | |
| | | | |
| | | | | |
| | | | | |
| | | | |
| | | |
($ in millions) | | Amount |
Goodwill | | | |
Balance as of June 30, 2014 | | $ | 58.1 |
Acquisition of LearnBop | | | 8.1 |
Balance as of June 30, 2015 | | $ | 66.2 |
Acquisition of LTS | | | 21.1 |
Balance as of June 30, 2016 | | $ | 87.3 |
Adjustment to purchase price of LTS | | | (0.1) |
Balance as of June 30, 2017 | | $ | 87.2 |
Intangible Assets:
| | | | | | | | | | | | | | | | | | |
| | June 30, 2017 | | June 30, 2016 |
($ in millions) | | Gross
Carrying
Amount | | Accumulated
Amortization | | Net
Carrying
Value | | Gross
Carrying
Amount | | Accumulated
Amortization | | Net
Carrying
Value |
Trade names | | $ | 17.6 | | $ | (7.6) | | $ | 10.0 | | $ | 17.6 | | $ | (6.9) | | $ | 10.7 |
Customer and distributor relationships | | | 20.1 | | | (12.0) | | | 8.1 | | | 20.1 | | | (10.6) | | | 9.5 |
Developed technology | | | 2.9 | | | (1.7) | | | 1.2 | | | 2.9 | | | (1.2) | | | 1.7 |
Other | | | 1.4 | | | (0.5) | | | 0.9 | | | 1.4 | | | (0.2) | | | 1.2 |
Total | | $ | 42.0 | | $ | (21.8) | | $ | 20.2 | | $ | 42.0 | | $ | (18.9) | | $ | 23.1 |
| | | | | | | | | | | | | | | | | | | |
| | 2014 | | 2013 | |
|---|
($ in millions)
| | Gross
Carrying
Amount | | Accumulated
Amortization | | Net
Carrying
Value | | Gross
Carrying
Amount | | Accumulated
Amortization | | Net
Carrying
Value | |
|---|
Trade names | | $ | 17.5 | | $ | (4.6 | ) | $ | 12.9 | | $ | 24.0 | | $ | (5.1 | ) | $ | 18.9 | |
Customer and distributor relationships | | | 18.2 | | | (7.7 | ) | | 10.5 | | | 18.9 | | | (6.5 | ) | | 12.4 | |
Developed technology | | | 1.2 | | | (1.2 | ) | | — | | | 1.5 | | | (1.0 | ) | | 0.5 | |
Other | | | 0.5 | | | (0.2 | ) | | 0.3 | | | 0.5 | | | (0.2 | ) | | 0.3 | |
| | | | | | | | | | | | | | |
| | | | | | | | | | | | | | | | | | | | |
| | $ | 37.4 | | $ | (13.7 | ) | $ | 23.7 | | $ | 44.9 | | $ | (12.8 | ) | $ | 32.1 | |
| | | | | | | | | | | | | | |
| | | | | | | | | | | | | | | | | | | | |
| | | | | | | | | | | | | | | | | | | | |
| | | | | | | | | | | | | | |
Long-lived assets include property, equipment, capitalized curriculum and software developed or obtained for internal use. In accordance with ASC 360, Property, Plant and Equipment (“ASC 360”), management reviews the Company reviews itsCompany’s recorded long-lived assets for impairment annually or whenever events or changes in circumstances indicate that the carrying amount of an asset may not be fully recoverable. The Company determines the extent to which an asset may be impaired based upon its expectation of the asset’s future usability as well as on a reasonable assurance that the future cash flows associated with the asset will be in excess of its carrying amount. If the total of the expected undiscounted future cash flows is less than the carrying amount of the asset, a loss is recognized for the difference between fair value and the carrying value of the asset. There was no such impairment charge for the years ended June 30, 2017, 2016 and 2015.
The Company accounts for income taxes in accordance with ASC 740,Income Taxes (“ASC 740”). Under ASC 740, deferred tax assets and liabilities are computed based on the difference between the financial reporting and income tax bases of assets and liabilities using the enacted marginal tax rate. ASC 740 requires that the net deferred tax asset be reduced by a valuation allowance if, based on the weight of available evidence, it is more likely than not that some portion or all of the net deferred tax asset will not be realized.
Table of Contents
K12 Inc.
Notes to Consolidated Financial Statements (Continued)
3. Summary of Significant Accounting Policies (Continued)
Sales tax collected from customers is excluded from revenues. Collected but unremitted sales tax is included as part of accrued liabilities in the accompanying consolidated balance sheets. Revenues do not include sales tax as the Company considers itself a pass-throughpass‑through conduit for collecting and remitting sales tax.
Stock‑Based Compensation
The Company estimates the fair value of share-based awards on the date of grant. The fair value of stock options is determined using the Black-Scholes option-pricing model and the fair value of restricted stock awards is based on the closing price of the Company'sCompany’s common stock on the date of grant. The determination of the fair value of the Company'sCompany’s stock option awards and restricted stock awards is based on a variety of factors including, but not limited to, the Company'sCompany’s common stock price, expected stock price volatility over the expected life of awards, and actual and projected exercise behavior. Additionally, the Company has estimated forfeitures for share-based awards at the dates of grant based on historical experience, adjusted for future expectation. The forfeiture estimate is revised as necessary if actual forfeitures differ from these estimates.
Advertising and marketing costs consist primarily of internet advertising, online marketing, direct mail, print media and television commercials and are expensed when incurred.
The Company issued 2,750,000 shares of Series A Special stock in connection with an acquisition. The holders of the Series A Special stock had the right to convert those shares into common stock on a one-for-one basis Advertising costs totaled $36.8 million, $31.2 million and $29.6 million for the right to vote on all matters presented to K12 stockholders, other than for the election and removal of directors, for which holders of the Series A Special stock have no voting rights. These shares were converted into common stock on September 3, 2013 and no Series A Special stock remains outstanding as ofyears ended June 30, 2014.2017, 2016 and 2015, respectively, and are included within selling, administrative, and other operating expenses in the consolidated statements of operations.
The Company calculates net income (loss) per share in accordance with ASC 260,Earnings Per Share (“ASC 260”).. Under ASC 260, basic net income (loss) per common share is calculated by dividing net income (loss) by the weighted-average number of common shares outstanding during the reporting period. The weighted average number of shares of common stock outstanding includes vested restricted stock awards. Diluted earningsnet income (loss) per share ("EPS"(“EPS”) reflects the potential dilution that could occur assuming conversion or exercise of all dilutive unexercised stock options. The dilutive effect of stock options and restricted stock awards was determined using the treasury stock method. Under the treasury stock method, the proceeds received from the exercise of stock options and restricted stock awards, the amount of compensation cost for future service not yet recognized by the Company and the amount of tax benefits that would be recorded in additional paid-in capital when the stock options become deductible for income tax purposes are all assumed to be used to repurchase shares of the Company'sCompany’s common stock. Stock options and restricted stock awards are not included in the computation of diluted earningsnet income (loss) per share when they are antidilutive. Common stock outstanding reflected in the Company'sCompany’s condensed consolidated balance sheets includeincludes restricted stock awards outstanding. Securities
Table of Contents
K12 Inc.
Notes to Consolidated Financial Statements (Continued)
3. Summary of Significant Accounting Policies (Continued)
that may participate in undistributed earningsnet income with common stock are considered participating securities. Since the Series A Shares participate in all dividends and distributions declared or paid with respect
Table of Contents
K12 Inc.
Notes to common stock of the Company (as if a holder of common stock), the Series A Shares meet the definition of participating security under ASC 260. All securities that meet the definition of a participating security, regardless of whether the securities are convertible, non-convertible or potential common stock securities, are included in the computation of both basic and diluted EPS (as a reduction of the numerator) using the two-class method. Under the two-class method, all undistributed earnings in a period are to be allocated to common stock and participating securities to the extent that each security may share in earnings as if all of the earnings for the period had been distributed.Consolidated Financial Statements (Continued)
The following schedule presents the calculation of basic and diluted net income per share:
| | | | | | | | | | |
| | Year Ended June 30, | |
|---|
| | 2014 | | 2013 | | 2012 | |
|---|
| | (In thousands except shares and per share data)
| |
|---|
Basic earnings per share computation: | | | | | | | | | | |
Net income attributable to common stockholders, including Series A stockholders | | $ | 19,600 | | $ | 28,111 | | $ | 17,543 | |
Amount allocated to participating Series A stockholders | | $ | — | | $ | (1,985 | ) | $ | (1,252 | ) |
| | | | | | | | |
| | | | | | | | | | | |
Income available to common stockholders—basic | | $ | 19,600 | | $ | 26,126 | | $ | 16,291 | |
| | | | | | | | |
| | | | | | | | | | | |
| | | | | | | | | | | |
| | | | | | | | |
Weighted average common shares—basic | | | 38,987,470 | | | 36,267,345 | | | 35,802,678 | |
| | | | | | | | |
| | | | | | | | | | | |
Basic net income per share | | $ | 0.50 | | $ | 0.72 | | $ | 0.46 | |
| | | | | | | | |
| | | | | | | | | | | |
| | | | | | | | | | | |
| | | | | | | | |
Dilutive earnings per share computation: | | | | | | | | | | |
Income available to common stockholders—basic | | $ | 19,600 | | $ | 26,126 | | $ | 16,291 | |
Amount allocated to participating Series A stockholders | | $ | — | | $ | 1,985 | | $ | 1,252 | |
| | | | | | | | |
| | | | | | | | | | | |
Net income attributable to common stockholders, including Series A stockholders | | $ | 19,600 | | $ | 28,111 | | $ | 17,543 | |
| | | | | | | | |
| | | | | | | | | | | |
| | | | | | | | | | | |
| | | | | | | | |
Share computation: | | | | | | | | | | |
Weighted average common shares—basic | | | 38,987,470 | | | 36,267,345 | | | 35,802,678 | |
Series A Special Stock | | | — | | | 2,750,000 | | | 2,750,000 | |
Effect of dilutive stock options and restricted stock awards | | | 243,046 | | | — | | | 188,185 | |
| | | | | | | | |
| | | | | | | | | | | |
Weighted average common shares outstanding—diluted | | | 39,230,516 | | | 39,017,345 | | | 38,740,863 | |
| | | | | | | | |
| | | | | | | | | | | |
| | | | | | | | | | | |
| | | | | | | | |
Diluted net income per share | | $ | 0.50 | | $ | 0.72 | | $ | 0.45 | |
| | | | | | | | |
| | | | | | | | | | | |
| | | | | | | | | | | |
| | | | | | | | |
| | | | | | | | | |
| | Year Ended June 30, |
| | 2017 | | 2016 | | 2015 |
| | (In thousands except share and per share data) |
Basic net income per share computation: | | | | | | | | | |
| | | | | | | | | |
Net income attributable to common stockholders | | $ | 451 | | $ | 9,035 | | $ | 10,988 |
Weighted average common shares — basic | | | 38,298,581 | | | 37,613,782 | | | 37,330,569 |
Basic net income per share | | $ | 0.01 | | $ | 0.24 | | $ | 0.29 |
| | | | | | | | | |
Diluted net income per share computation: | | | | | | | | | |
| | | | | | | | | |
Net income attributable to common stockholders | | $ | 451 | | $ | 9,035 | | $ | 10,988 |
Share computation: | | | | | | | | | |
Weighted average common shares — basic | | | 38,298,581 | | | 37,613,782 | | | 37,330,569 |
Effect of dilutive stock options and restricted stock awards | | | 1,202,353 | | | 1,236,606 | | | 294,856 |
Weighted average common shares — diluted | | | 39,500,934 | | | 38,850,388 | | | 37,625,425 |
Diluted net income per share | | $ | 0.01 | | $ | 0.23 | | $ | 0.29 |
At June 30, 2014, we had 41,144,062 shares of common stock issued and 38,948,866 shares outstanding, which included the 2,750,000 common shares associated with the Series A special stock conversion which occurred on September 3, 2013.
As of June 30, 2014, 20132017, 2016 and 2012, the2015, shares of common stock issuable in connection with stock options and restricted stock of 558,186, 1,181,8201,965,283 , 2,548,762 and 858,986,2,784,593 respectively, were not included in the diluted income per common share calculation since theirbecause the effect was anti-dilutive.
Tablewould have been antidilutive. As of ContentsJune 30, 2017, the Company had 44,325,772 shares of common stock issued and 40,823,174 shares outstanding.
K12 Inc.
Notes to Consolidated Financial Statements (Continued)
3. Summary of Significant Accounting Policies (Continued)
ASC 820,, Fair Value Measurements and Disclosures (“ASC 820”),, defines fair value as the price that would be received to sell an asset or paid to transfer a liability, in the principal or most advantageous market for the asset or liability, in an orderly transaction between market participants at the measurement date. ASC 820 also establishes a fair value hierarchy which requires an entity to maximize the use of observable inputs and minimize the use of unobservable inputs when measuring fair value.
ASC 820 describes three levels of inputs that may be used to measure fair value:
| | |
Level 1: | | Inputs based on quoted market prices for identical assets or liabilities in active markets at the measurement date. |
Level 2: |
|
Observable inputs other than quoted prices included in Level 1, such as quoted prices for similar assets and liabilities in active markets; quoted prices for identical or similar assets and liabilities in markets that are not active; or other inputs that are observable or can be corroborated by observable market data. |
Level 3: |
|
Inputs reflect management's best estimate of what market participants would use in pricing the asset or liability at the measurement date. The inputs are unobservable in the market and significant to the instruments valuation. |
Level 1: Inputs based on quoted market prices for identical assets or liabilities in active markets at the measurement date.
Level 2: Observable inputs other than quoted prices included in Level 1, such as quoted prices for similar assets and liabilities in active markets; quoted prices for identical or similar assets and liabilities in markets that are not active; or other inputs that are observable or can be corroborated by observable market data.
Level 3: Inputs reflect management’s best estimate of what market participants would use in pricing the asset or liability at the measurement date. The inputs are unobservable in the market and significant to the instrument’s valuation.
The carrying values reflected in the Company'saccompanying condensed consolidated balance sheets for cash and cash equivalents, receivables, and short and long term debt approximate their fair values.
The redeemable noncontrolling interest is a result
Table of the Company's joint venture with Middlebury CollegeContents
K12 Inc.
Notes to form Middlebury Interactive Languages. Under the agreement, Middlebury College has an irrevocable election to sell all (but not less than all) of its membership interest to the Company (put right). The fair value of the redeemable noncontrolling interest reflects management's best estimate of the redemption of the put right.Consolidated Financial Statements (Continued)
The following table summarizes certain fair value information at June 30, 20142017 and liabilities measured at fair value on a nonrecurring basis.
| | | | | | | | | | | | |
| | Fair Value Measurements Using: |
| | | | | Quoted Prices | | | | |
| | | | | in Active | | Significant | | |
| | | | | Markets for | | Other | | Significant |
| | | | | Identical | | Observable | | Unobservable |
| | | | | Assets | | Input | | Inputs |
Description | | Fair Value | | (Level 1) | | (Level 2) | | (Level 3) |
| | | (In thousands) |
Held for sale asset | | $ | 1,200 | | $ | — | | $ | — | | $ | 1,200 |
Lease exit liability | | | 4,841 | | | — | | | — | | | 4,841 |
Total | | $ | 6,041 | | $ | — | | $ | — | | $ | 6,041 |
The following table summarizes certain fair value information at June 30, 2016 for assets and liabilities measured at fair value on a nonrecurring basis.
| | | | | | | | | | | | |
| | Fair Value Measurements Using: |
| | | | | Quoted Prices | | | | |
| | | | | in Active | | Significant | | |
| | | | | Markets for | | Other | | Significant |
| | | | | Identical | | Observable | | Unobservable |
| | | | | Assets | | Input | | Inputs |
Description | | Fair Value | | (Level 1) | | (Level 2) | | (Level 3) |
| | | (In thousands) |
Held for sale asset | | $ | 1,786 | | $ | — | | $ | — | | $ | 1,786 |
Total | | $ | 1,786 | | $ | — | | $ | — | | $ | 1,786 |
The held for sale asset is discussed in more detail in Note 13, “Acquisitions and Investments.” The lease exit liability is discussed in more detail in Note 12, “Restructuring and Severance.”
The following table summarizes certain fair value information at June 30, 2017 and liabilities measured at fair value on a recurring basis.
| | | | | | | | | | | | |
| | Fair Value Measurements Using: |
| | | | | Quoted Prices | | | | |
| | | | | in Active | | Significant | | |
| | | | | Markets for | | Other | | Significant |
| | | | | Identical | | Observable | | Unobservable |
| | | | | Assets | | Input | | Inputs |
Description | | Fair Value | | (Level 1) | | (Level 2) | | (Level 3) |
| | | (In thousands) |
Contingent consideration associated with acquisition of LTS Education Systems | | $ | 2,806 | | $ | — | | $ | — | | $ | 2,806 |
Total | | $ | 2,806 | | $ | — | | $ | — | | $ | 2,806 |
The following table summarizes certain fair value information at June 30, 2016 for assets and liabilities measured at fair value on a recurring basis.
| | | | | | | | | | | | | |
| | Fair Value Measurements Using: | |
|---|
Description | | Fair Value | | Quoted Prices
in Active
Markets for
Identical Assets
(Level 1) | | Significant
Other
Observable
Input
(Level 2) | | Significant
Unobservable
Inputs
(Level 3) | |
|---|
| | (In thousands)
| |
|---|
Redeemable Noncontrolling Interest in Middlebury Joint Venture | | $ | 16,801 | | $ | — | | $ | — | | $ | 16,801 | |
| | | | | | | | | | |
| | | | | | | | | | | | | | |
Total | | $ | 16,801 | | $ | — | | $ | — | | $ | 16,801 | |
| | | | | | | | | | |
| | | | | | | | | | | | | | |
| | | | | | | | | | | | | | |
| | | | | | | | | | |
| | | | | | | | | | | | |
| | Fair Value Measurements Using: |
| | | | | Quoted Prices | | | | |
| | | | | in Active | | Significant | | |
| | | | | Markets for | | Other | | Significant |
| | | | | Identical | | Observable | | Unobservable |
| | | | | Assets | | Input | | Inputs |
Description | | Fair Value | | (Level 1) | | (Level 2) | | (Level 3) |
| | | (In thousands) |
Redeemable noncontrolling interest in Middlebury Interactive Learning | | $ | 6,801 | | $ | — | | $ | — | | $ | 6,801 |
Contingent consideration associated with acquisition of LTS Education Systems | | | 2,947 | | | — | | | — | | | 2,947 |
Total | | $ | 9,748 | | $ | — | | $ | — | | $ | 9,748 |
Table of Contents
K12 Inc.
Notes to Consolidated Financial Statements (Continued)
3. Summary of Significant Accounting Policies (Continued)
The following table summarizes certain fair value information at June 30, 2013 for assets and liabilities measured at fair value on a recurring basis.
| | | | | | | | | | | | | |
| | Fair Value Measurements Using: | |
|---|
Description | | Fair Value | | Quoted Prices
in Active
Markets for
Identical Assets
(Level 1) | | Significant
Other
Observable
Input
(Level 2) | | Significant
Unobservable
Inputs
(Level 3) | |
|---|
| | (In thousands)
| |
|---|
Redeemable Noncontrolling Interest in Middlebury Joint Venture | | $ | 15,200 | | $ | — | | $ | — | | $ | 15,200 | |
| | | | | | | | | | |
| | | | | | | | | | | | | | |
Total | | $ | 15,200 | | $ | — | | $ | — | | $ | 15,200 | |
| | | | | | | | | | |
| | | | | | | | | | | | | | |
| | | | | | | | | | | | | | |
| | | | | | | | | | |
The following table presents activity related to ourthe Company’s fair value measurements categorized as Level 3 of the valuation hierarchy, valued on a recurring basis, for the fiscal year ended June 30, 2014.2017.
| | | | | | | | | | | | |
| | | | | Purchases, | | | | | | |
| | Fair Value | | Issuances, | | Unrealized | | Fair Value |
Description | | June 30, 2016 | | and Settlements | | Gains (Losses) | | June 30, 2017 |
| | (In thousands) |
Redeemable Noncontrolling Interest in Middlebury Interactive Learning | | $ | 6,801 | | $ | (9,134) | | $ | 2,333 | | $ | — |
Contingent consideration associated with acquisition of LTS Education Systems | | | 2,947 | | | — | | | (141) | | | 2,806 |
Total | | $ | 9,748 | | $ | (9,134) | | $ | 2,192 | | $ | 2,806 |
The following table presents activity related to the Company’s fair value measurements categorized as Level 3 of the valuation hierarchy, valued on a recurring basis, for the year ended June 30, 2016.
| | | | | | | | | | | | | |
| | Fair Value
June 30, 2013 | | Purchases,
Issuances, and
Settlements | | Net
Unrealized
Gains | | Fair Value
June 30, 2014 | |
|---|
| | (In thousands)
| |
|---|
Redeemable Noncontrolling Interest in Middlebury Joint Venture | | $ | 15,200 | | $ | 1,275 | | $ | 326 | | $ | 16,801 | |
| | | | | | | | | | |
| | | | | | | | | | | | | | |
Total | | $ | 15,200 | | $ | 1,275 | | $ | 326 | | $ | 16,801 | |
| | | | | | | | | | |
| | | | | | | | | | | | | | |
| | | | | | | | | | | | | | |
| | | | | | | | | | |
| | | | | | | | | | | | |
| | | | | Purchases, | | | | | | |
| | Fair Value | | Issuances, | | Unrealized | | Fair Value |
Description | | June 30, 2015 | | and Settlements | | Gains (Losses) | | June 30, 2016 |
| | (In thousands) |
Redeemable Noncontrolling Interest in Middlebury Interactive Learning | | $ | 6,801 | | $ | — | | $ | — | | $ | 6,801 |
Contingent consideration associated with acquisition of LTS Education Systems | | | — | | | 2,942 | | | 5 | | | 2,947 |
Total | | $ | 6,801 | | $ | 2,942 | | $ | 5 | | $ | 9,748 |
The redeemable noncontrolling interest included the Company’s joint venture with Middlebury College. Under the agreement, Middlebury College had an irrevocable election to sell all of its membership interest to the Company (put right). On May 4, 2015, Middlebury College, under the joint venture agreement, exercised its right to require the Company to purchase all of its ownership interest in the joint venture. On December 27, 2016, the Company consummated the acquisition of the remaining 40% noncontrolling interest for $9.1 million in cash. The fair value of the Redeemable Noncontrolling Interestredeemable noncontrolling interest in Middlebury Joint VentureMIL was measuredaccounted for in accordance with ASC 480,480-10-S99, Distinguishing Liabilities fromAccounting forRedeemable Equity Instruments,. The redeemable noncontrolling interest was redeemable outside of the Company’s control and was based upon a valuation from a third-party valuation firm. In determining the fair value, the valuation incorporated a number of assumptions and estimates including an income-based valuation approach. As of June 30, 2014 the fair value was estimated at $16.8 million.recorded
Recent Accounting Pronouncements
In February 2013, the Financial Accounting Standards Board ("FASB") issued Accounting Standards Update ("ASU") 2013-02,Reporting of Amounts Reclassified out of Accumulated Other Comprehensive Income, which is included in Accounting Standards Codification ("ASC") 220,Comprehensive Income. This update improves the reporting of reclassifications out of accumulated other comprehensive income. The guidance was effective for the Company's interim and annual reporting periods beginning January 1, 2013, and applied prospectively. The adoption of this guidance in the Company's fiscal year 2014 did not have a material impact on the Company's financial condition, results of operations, cash flows or disclosures.
In April 2014, the FASB issued ASU 2014-08,Reporting Discontinued Operations and Disclosures of Components of an Entity, which updates the definition of discontinued operations from current US GAAP. Going forward only those disposals of components of an entity that represent a strategic shift that has (or will have) a major effect on an entity's operations and financial results will be reported as discontinued operations in the financial statements. Currently, a component of an entity that is a reportable segment, an operating segment, a reporting unit, a subsidiary, or an asset group is eligible for discontinued operations presentation. Additionally, the existing condition that the entity will not have any significant continuing
outside of stockholders’ equity. The contingent consideration is discussed in more detail in Note 13, “Acquisitions and Investments.”
3. SummaryReclassification
Certain previous year amounts have been reclassified to conform with current year presentations, as related to the reporting of Significant Accounting Policies (Continued)
involvementnew line items in the statements of operations and statement of cash flows.
Recent Accounting Pronouncements
Accounting Standards Adopted
In April 2015, the FASB issued ASU 2015-05, Intangibles - Goodwill and Other - Internal-Use Software (Subtopic 350-40) Customer’s Accounting for Fees Paid in a Cloud Computing Arrangement (“ASU 2015-05”), which provides guidance regarding whether a cloud computing arrangement includes a software license. If a cloud computing arrangement includes a software license, then the entity should account for the software license element of the component afterarrangement consistent with the disposal transaction has been removed. The effective dateacquisition of other software licenses. If a cloud computing arrangement does not include a software license, the entity should account for the revised standardarrangement as a service contract. ASU 2015-05 does not change the accounting for service contracts. ASU 2015-05 is effective for applicable transactions that occurfiscal years, including interim periods within annual periodsthose fiscal years, beginning on or after December 15, 2014. Early adoption is permitted, but only for disposals (or classifications as held for sale) that have not been reported in financial statements previously issued or available for issuance.2015. The Company adopted this guidance during the first quarter ended September 30, 2016 prospectively to all arrangements entered into or materially modified after June 30, 2016. As a result of the adoption, during the year ended June 30, 2017, the Company expensed approximately $2.2 million of professional services fees that would have been capitalized previously. These costs are included in the product development expenses in the condensed consolidated statements of operations.
In September 2015, the FASB issued ASU 2015-16, Simplifying the Accounting for Measurement-Period Adjustments (“ASU 2015-16”), which eliminates the requirement to restate prior period financial statements for measurement period adjustments. The new guidance requires that the cumulative impact of a measurement period adjustment (including the impact on prior periods) be recognized in the reporting period in which the adjustment is identified. The new standard should be applied prospectively to measurement period adjustments that occur after the effective date. The Company adopted this amended standard in the fourthfirst quarter of fiscal 2014. This resulted inended September 30, 2016. The standard did not have a significant impact on the presentation of historical results of our sold business assets as normal operations in fiscal year 2014, and a one-time gain of $6.4 million being recognized outside of operating income upon the sale of the business in fiscal year 2014.Company’s consolidated condensed financial statements.
Accounting Standards Not Yet Adopted
In May 2014, the FASB issued ASU 2014-09,Revenue from Contracts with Customers (“ASU 2014-09”) (ASU 2014-09), which supersedes nearly allmost existing revenue recognition guidance under US GAAP. The core principle of ASU 2014-09 is to recognize revenues when promised goods or services are transferred to customers in an amount that reflects the consideration to which an entity expects to be entitled for those goods or services. ASU 2014-09 defines a five step process to achieve this core principle and, in doing so, more judgment and estimates may be required within the revenue recognition process than are required under existing U.S. GAAP. The standard is effective for annual periods beginning after December 15, 2016, and interim periods therein, using either of the following transition methods: (i) a full retrospective approach reflecting the application of the standard in each prior reporting period with the option to elect certain practical expedients, or (ii) a retrospective approach with the cumulative effect of initially adopting ASU 2014-09 recognized at the date of adoption (which includes additional footnote disclosures). On July 9, 2015, the FASB voted to defer the effective date of the new revenue recognition standard by one year. Based on the Board’s decision, public organizations would apply the new revenue standard to annual reporting periods beginning after December 15, 2017. The Company is currently evaluating the impact this standard will have on its consolidated financial statements which includes performing a detailed review of each of its revenue streams and comparing historical accounting policies and practices to the new standard. The Company will provide expanded disclosures pertaining to revenue recognition in our annual and quarterly filings beginning in the first quarter of fiscal 2019. The Company expects to complete its assessment of the cumulative effect of adopting ASU 2014-09 as well as the expected impact of adoption during fiscal 2018.
In February 2016, the FASB issued ASU 2016-02, Leases (Topic 842) (“ASU 2016-02”). The new standard establishes a right-of-use (“ROU”) model that requires a lessee to record a ROU asset and a lease liability on the balance sheet for all leases with terms longer than 12 months. Leases will be classified as either finance or operating, with classification affecting the pattern of expense recognition in the income statement. The new standard is effective for fiscal years beginning after December 15, 2018, including interim periods within those fiscal years. A modified retrospective transition approach is required for lessees for capital and operating leases existing at, or entered into after, the beginning of the earliest comparative period presented in the financial statements, with certain practical expedients available. The Company is currently evaluating this guidance, as well as the effect on its consolidated financial statements.
In March 2016, the FASB issued ASU 2016-09, Compensation - Stock Compensation (Topic 718) (“ASU 2016‑09”). This update was issued as part of the FASB’s simplification initiative and affects all entities that issue share-based payment awards to their employees. The amendments in this update cover such areas as the recognition of excess tax benefits and deficiencies and an accounting policy election for forfeitures. As part of the new guidance:
| · | | Excess tax benefits or deficiencies arising from share-based awards will be reflected within the consolidated statements of operations as a component of income tax expense rather than as a component of stockholders’ equity. The adoption of this guidance may result in volatility within a company’s results of operations, primarily due to changes in the stock price. |
| · | | Excess tax benefits will be presented as an operating activity on the statement of cash flows rather than as a financing activity. |
| · | | A forfeiture election will be made to either estimate forfeitures (similar to today’s requirement) or recognizing actual forfeitures as they occur. Entities will apply the forfeiture election provision using a modified retrospective transition approach, with a cumulative effect adjustment recorded to retained earnings as of the beginning of the period of adoption. |
| · | | Statutory tax withholding requirements for employers who withhold shares upon settlement of an award on behalf of an employee to cover tax obligations are broadened to allow for a range of withholding from the minimum to the maximum statutory allowable amounts. |
The Company will adopt this guidance during the first quarter of fiscal 2018. As part of its adoption of ASU 2016‑09, the Company will make an accounting policy election to change the way in which it accounts for forfeitures of share-based awards. Specifically, beginning in the first quarter of fiscal 2018, the Company will recognize forfeitures of share-based awards as they occur in the period of forfeiture rather than estimating the number of awards expected to be forfeited at the grant date and subsequently adjusting the estimate when awards are actually forfeited. The Company expects that the change in accounting policy will result in an adjustment to retained earnings as of July 1, 2017. The Company will determine the method of adoption for the remaining provisions during the first quarter of fiscal 2018.
In June 2016, the FASB issued ASU 2016-13, Financial Instruments – Credit Losses (Topic 326) (“ASU 2016‑13”) related to the methodology for recognizing credit losses. The new guidance revises the accounting requirements related to the measurement of credit losses and will require organizations to measure all expected credit losses for financial assets based on historical experience, current conditions and reasonable and supportable forecasts about collectability. Assets must be presented in the financial statements at the net amount expected to be collected. This ASU will be effective for the Company in the first quarter of fiscal 2021, and early adoption is permitted.The Company is currently evaluating the impact of our pending adoption ofthis ASU 2014-09 on ourits consolidated financial statements.
In August 2016, the FASB issued ASU 2016-15, Statement of Cash Flows (Topic 230) (“ASU 2016-15”) related to the classification of certain cash receipts and cash payments on the statement of cash flows. This ASU will be effective for the Company beginning in the first quarter of fiscal 2019 on a retrospective basis, and early adoption is permitted. The Company is currently evaluating the impact of this ASU on its consolidated statements of cash flows.
In January 2017, the FASB issued ASU 2017-04, Intangibles – Goodwill and has not yet determinedOther (Topic 350) (“ASU 2017‑04”). This amendment simplifies how an entity is required to test goodwill for impairment by eliminating Step 2 from the methodgoodwill impairment test. Step 2 measures a goodwill impairment loss by comparing the implied fair value of a reporting unit’s goodwill with the carrying amount of that goodwill. Instead, under the amendments in this update, an entity should perform its annual, or interim, goodwill impairment test by comparing the fair value of a reporting unit with
its carrying amount. An entity should recognize an impairment charge for the amount by which we will adopt the standardcarrying amount exceeds the reporting unit’s fair value. The update is effective for annual or any interim goodwill impairment tests in fiscal years beginning after December 15, 2019. An entity should apply the amendments in this update on a prospective basis. An entity is required to disclose the nature of and reason for the change in accounting principle upon transition. Early adoption is permitted for interim or annual goodwill impairment tests performed on testing dates after January 1, 2017. The Company is currently evaluating this guidance, as well as the effect on its consolidated financial statements.
4. Property and Equipment and Capitalized Software
Property and equipment consist of the following at:
| | | | | | | | | | | | | |
| | June 30, | | | June 30, |
|---|
| | 2014 | | 2013 | | | 2017 | | 2016 |
|---|
| | (In thousands)
| | | (In thousands) |
|---|
Student computers | | $ | 61,165 | | $ | 104,639 | | | $ | 32,867 | | $ | 34,143 |
Computer software | | 30,788 | | 28,074 | | | | 26,314 | | | 25,434 |
Computer hardware | | 16,377 | | 17,162 | | | | 15,927 | | | 16,233 |
Leasehold improvements | | 11,369 | | 10,857 | | | | 10,094 | | | 12,048 |
State testing computers | | | | 6,274 | | | 5,837 |
Furniture and fixtures | | | | 4,533 | | | 5,870 |
Office equipment | | 1,387 | | 1,581 | | | | 1,488 | | | 1,538 |
Furniture and fixtures | | 5,698 | | 5,700 | | |
Web site development costs | | 1,115 | | 1,115 | | | | 263 | | | 1,115 |
| | | | | | | |
| | | | | | |
| | 127,899 | | 169,128 | | | | 97,760 | | | 102,218 |
Less accumulated depreciation and amortization | | (79,318 | ) | | (112,986 | ) | | | (71,463) | | | (73,771) |
| | | | | | | | $ | 26,297 | | $ | 28,447 |
| | | | | | |
| | $ | 48,581 | | $ | 56,142 | | |
| | | | | | | |
| | | | | | |
| | | | | | |
| | | | | | | |
The Company recorded depreciation expense related to property and equipment reflected in selling, administrative and other operating expenses of $9.4$6.7 million, $9.8$6.4 million and $9.6$6.0 million during the years ended June 30, 2014, 20132017, 2016 and 2012,2015, respectively. Depreciation expense of $28.1$11.2 million, $21.0$12.6 million and $17.7$27.5 million related to computers leased to students is reflected in instructional costs and services during the years ended June 30, 2014, 20132017, 2016 and 2012,2015, respectively. There were no significant write-downs of capitalized software projects during the years ended June 30, 2017 or 2016. During the year ended June 30, 2015, the Company wrote down approximately $4.8 million of capitalized software projects after determining the assets either have no future use or are being sunset. Amortization expense of $1.7$0.6 million,
Table of Contents
K12 Inc.
Notes to Consolidated Financial Statements (Continued)
4. Property and Equipment and Capitalized Software (Continued)
$1.4 $0.5 million and $2.0$0.9 million related to student software costs is reflected in instructional costs and services during the years ended June 30, 2014, 20132017, 2016 and 2012,2015, respectively.
In the course of its normal operations, the Company incurs maintenance and repair expenses. Thoseexpenses, which are expensed as incurred and amounted to $10.2$11.7 million, $8.1$11.6 million and $5.6$11.2 million for the years ended June 30, 2014, 20132017, 2016 and 2012,2015, respectively.
Capitalized software consists of the following at:
| | | | | | | |
| | June 30, | |
|---|
| | 2014 | | 2013 | |
|---|
| | (In thousands)
| |
|---|
Capitalized software costs | | $ | 109,590 | | $ | 87,166 | |
Less accumulated depreciation and amortization | | | (59,670 | ) | | (43,662 | ) |
| | | | | | |
| | | | | | | | |
| | $ | 49,920 | | $ | 43,504 | |
| | | | | | |
| | | | | | | | |
| | | | | | | | |
| | | | | | |
| | | | | | |
| | June 30, |
| | 2017 | | 2016 |
| | (In thousands) |
Capitalized software costs | | $ | 193,252 | | $ | 176,374 |
Less accumulated depreciation and amortization | | | (130,557) | | | (106,319) |
| | $ | 62,695 | | $ | 70,055 |
The Company recorded amortization expense of $18.2$25.1 million, $12.2$23.4 million and $9.6$19.4 million related to capitalized software development reflected in instructional costs and services and $7.9 million, $5.5 million and $7.4 million reflected in selling, administrative and other operating expenses during the years ended June 30, 2017, 2016 and 2015, respectively.
Capitalized curriculum consists of the following at:
| | | | | | |
| | June 30, |
| | 2017 | | 2016 |
| | (In thousands) |
Capitalized curriculum | | $ | 171,736 | | $ | 156,471 |
Less accumulated depreciation and amortization | | | (112,523) | | | (93,104) |
| | $ | 59,213 | | $ | 63,367 |
The Company recorded amortization expense of $19.9 million, $17.0 million and $20.1 million related to capitalized curriculum development reflected in instructional costs and services during the years ended June 30, 2014, 20132017, 2016 and 2012,2015, respectively. Amortization expense of zero, $0.8 million and $2.0 million related to capitalized software development reflected in product development expenses during the years ended June 30, 2014, 2013 and 2012, respectively. The Company recorded amortization of capitalized software development costs reflected in selling, administrative and other operating expenses of $1.9 million, $1.7 million and $1.0 million during the years ended June 30, 2014, 2013 and 2012, respectively. During the year ended June 30, 2014, the Company wrote down approximately $3.8 million of capitalized software projects after determining the assets either have no future use or are being sunset. There were no material write-downs of capitalized software costs for the years ended June 30, 2013 and 2012.
5. Income Taxes
The provision for income taxes is based on earnings reported in the consolidated financial statements. A deferred income tax asset or liability is determined by applying currently enacted tax laws and rates to the expected reversal of the cumulative temporary differences between the carrying value of assets and liabilities for financial statement and income tax purposes. Deferred income tax expense or benefit is measured by the change in the deferred income tax asset or liability during the year.
Table of Contents
K12 Inc.
Notes to Consolidated Financial Statements (Continued)
5. Income Taxes (Continued)
Deferred tax assets and liabilities result primarily from temporary differences in book versus tax basis accounting. Deferred tax assets and liabilities consist of the following:
| | | | | | | | | | | | | |
| | June 30, | | | June 30, |
|---|
| | 2014 | | 2013 | | | 2017 | | 2016 |
|---|
| | (In thousands)
| | | (In thousands) |
|---|
Deferred tax assets (liabilities): | | | | | | | | | | | |
Net operating loss carryforward | | $ | 3,066 | | $ | 3,545 | | | $ | 8,033 | | $ | 5,464 |
Reserves | | | | 7,400 | | | 5,892 |
Accrued expenses | | 6,953 | | 8,147 | | | | 10,695 | | | 11,494 |
Stock compensation expense | | 12,055 | | 9,616 | | | | 11,449 | | | 11,735 |
Reserves | | 5,462 | | 3,994 | | |
Other assets | | | | 1,720 | | | 2,628 |
Deferred rent | | | | 3,299 | | | 1,922 |
Deferred revenue | | | | 401 | | | — |
Federal tax credits | | 20 | | 2,777 | | | | 20 | | | 20 |
State tax credits | | 975 | | — | | | | 390 | | | 841 |
Other assets | | 2,232 | | 2,006 | | |
Tax basis intangibles | | 576 | | 638 | | |
Deferred rent | | 2,074 | | 1,857 | | |
Total deferred tax assets | | | | 43,407 | | | 39,996 |
Deferred tax liabilities | | | | | | | |
Capitalized curriculum development | | | | (15,323) | | | (13,821) |
Capitalized software and website development costs | | | | (23,288) | | | (25,435) |
Property and equipment | | | | (2,649) | | | (1,931) |
Investment in Middlebury Interactive Languages | | | | — | | | (20) |
Returned materials | | | | (4,559) | | | (4,883) |
Deferred revenue | | 490 | | 504 | | | | — | | | (128) |
| | | | | | | |
| | | | | | |
Total deferred tax assets | | 33,903 | | 33,084 | | |
| | | | | | | |
| | | | | | |
Deferred tax liabilities: | | | | | | |
Capitalized software and website development costs | | (18,743 | ) | | (15,812 | ) | |
Purchased intangibles | | (6,166 | ) | | (7,898 | ) | | | (7,161) | | | (7,897) |
Property and equipment | | (2,313 | ) | | (10,616 | ) | |
Capitalized curriculum development | | (12,782 | ) | | (13,701 | ) | |
Returned materials | | (5,316 | ) | | (4,722 | ) | |
Investment in Middlebury Interactive Languages | | (1,361 | ) | | (997 | ) | |
| | | | | | | |
| | | | | | |
Total deferred tax liabilities | | (46,681 | ) | | (53,746 | ) | | | (52,980) | | | (54,115) |
| | | | | | | |
| | | | | | |
Deferred tax liability | | (12,778 | ) | | (20,662 | ) | |
Valuation allowance | | (1,968 | ) | | (1,269 | ) | |
| | | | | | | |
| | | | | | |
Net deferred tax liability before valuation allowance | | | | (9,573) | | | (14,119) |
Valuation Allowance | | | | (7,153) | | | (4,339) |
Net deferred tax liability | | $ | (14,746 | ) | $ | (21,931 | ) | | $ | (16,726) | | $ | (18,458) |
| | | | | | | |
| | | | | | |
| | | | | | |
| | | | | | | |
Reported as: | | | | | | | | | | | |
Current deferred tax assets | | $ | 7,732 | | $ | 11,368 | | |
Noncurrent deferred tax liability | | (22,478 | ) | | (33,299 | ) | |
| | | | | | | |
| | | | | | |
Long-term deferred tax liabilities | | | | (16,726) | | | (18,458) |
Net deferred tax liability | | $ | (14,746 | ) | $ | (21,931 | ) | | $ | (16,726) | | $ | (18,458) |
| | | | | | | |
| | | | | | |
| | | | | | |
| | | | | | | |
The Company maintainsmaintained a valuation allowance on net noncurrent deferred tax assets of $2.0$7.2 million and $1.3$4.3 million as of June 30, 20142017 and 2013,2016, respectively, predominantly related to state and foreign income tax net operating losses ("NOL") as theand operating losses related to its tax non-consolidating entity. The Company does not believe it is more likely than not that it will utilize these deferred tax assets. The Company adjusted its valuation allowance for the year ended June 30, 2014 to increase the valuation allowance for additional foreign net operating losses, certain state tax credits, and capital losses.
The Company has not provided for U.S. deferred income taxes on undistributed foreign earnings because such earnings are considered to be permanentlyindefinitely reinvested. Undistributed earnings of certain consolidated foreign subsidiaries at June 30, 20142017 amounted to $13.2$22.8 million. If such
Table of Contents
K12 Inc.
Notes to Consolidated Financial Statements (Continued)
5. Income Taxes (Continued)
earnings were not permanentlyindefinitely reinvested, a U.S. deferred income tax liability of approximately $5.3$9.1 million would have been required.
At June 30, 2014,2017, the Company had available federal and state NOL carryforwards of $3.6 million. These$1.6 million and $0.2 million, respectively, net of valuation allowances. The federal NOLs, if unused, expire in 2020 and the state NOLs expire in 2021 if unused.on various dates.
At June 30, 2013, the Company had available Research and Development Credits of $3.3 million. The Company has no unused R&D credits at June 30, 2014.
For the years ended June 30, 20142017 and 2013,2016, the Company has evaluated whether a change in the Company's ownership of outstanding classes of stock as defined in Internal Revenue Code Section 382 could prohibit or limit the Company's ability to utilize its NOLs. As a result of this study, theThe Company has concluded it is more likely than not that the Company will be able to fully utilize its NOLs subject to the Section 382 limitation.
The related components of the income tax expense for the years ended June 30, 2014, 20132017, 2016 and 20122015 were as follows:
| | | | | | | | | |
| | Year Ended June 30, |
| | 2017 | | 2016 | | 2015 |
| | (In thousands) |
Current: | | | | | | | | | |
Federal | | $ | 8,756 | | $ | 4,651 | | $ | 6,490 |
State | | | 3,153 | | | 1,152 | | | 1,964 |
Foreign | | | 552 | | | 2,761 | | | 450 |
Total current | | | 12,461 | | | 8,564 | | | 8,904 |
Deferred: | | | | | | | | | |
Federal | | | (6,505) | | | (1,648) | | | (2,291) |
State | | | (560) | | | (97) | | | (1,635) |
Foreign | | | — | | | (2,073) | | | 832 |
Total deferred | | | (7,065) | | | (3,818) | | | (3,094) |
Total income tax expense | | $ | 5,396 | | $ | 4,746 | | $ | 5,810 |
| | | | | | | | | | |
| | Year Ended June 30, | |
|---|
| | 2014 | | 2013 | | 2012 | |
|---|
| | (In thousands)
| |
|---|
Current: | | | | | | | | | | |
Federal | | $ | 13,520 | | $ | 1,153 | | $ | 154 | |
State | | | 2,649 | | | 3,134 | | | 1,358 | |
Foreign | | | 56 | | | (34 | ) | | 73 | |
| | | | | | | | |
| | | | | | | | | | | |
Total current | | | 16,225 | | | 4,253 | | | 1,585 | |
Deferred: | | | | | | | | | | |
Federal | | | (4,537 | ) | | 16,388 | | | 8,891 | |
State | | | (263 | ) | | (784 | ) | | 1,219 | |
Foreign | | | (350 | ) | | 166 | | | 187 | |
| | | | | | | | |
| | | | | | | | | | | |
Total deferred | | | (5,150 | ) | | 15,770 | | | 10,297 | |
| | | | | | | | |
| | | | | | | | | | | |
Total income tax expense | | $ | 11,075 | | $ | 20,023 | | $ | 11,882 | |
| | | | | | | | |
| | | | | | | | | | | |
| | | | | | | | | | | |
| | | | | | | | |
Table of Contents
K12 Inc.
Notes to Consolidated Financial Statements (Continued)
5. Income Taxes (Continued)
The provision for income taxes can be reconciled to the income tax that would result from applying the statutory rate to the net income before income taxes as follows:
| | | | | | | | | | | | | | | | | |
| | Year Ended June 30, | | | Year Ended June 30, | |
|---|
| | 2014 | | 2013 | | 2012 | | | 2017 | | 2016 | | 2015 | |
|---|
U.S. federal tax at statutory rates | | 35.0 | % | | 35.0 | % | | 35.0 | % | | 35.0 | % | 35.0 | % | 35.0 | % |
Permanent items | | 1.3 | | 0.4 | | 1.4 | | | 7.1 | | 4.8 | | 2.3 | |
Lobbying | | (0.2 | ) | | 1.6 | | 2.4 | | | 7.2 | | 5.3 | | 5.0 | |
State taxes, net of federal benefit | | 4.3 | | 3.5 | | 6.6 | | | 19.5 | | 3.8 | | 1.8 | |
Transaction costs | | (0.1 | ) | | 0.4 | | — | | |
Research and development tax credits | | (0.7 | ) | | (0.7 | ) | | (1.0 | ) | | (8.2) | | (8.1) | | (1.7) | |
Domestic production activities deduction | | (6.4 | ) | | — | | — | | | (22.9) | | (5.2) | | (6.5) | |
Change in valuation allowance | | | 53.3 | | 2.9 | | 5.2 | |
Effects of foreign operations | | (4.0 | ) | | 2.4 | | (2.7 | ) | | 2.6 | | (0.9) | | (13.6) | |
Noncontrolling interests | | 1.8 | | 0.9 | | 1.8 | | |
Reserve for unrecognized tax benefits | | 3.9 | | — | | — | | | 3.3 | | (6.3) | | 6.1 | |
Valuation allowances | | 2.4 | | — | | — | | |
Noncontrolling Interests | | | 12.5 | | 4.2 | | 5.5 | |
Other | | 0.6 | | (0.5 | ) | | (1.1 | ) | | (0.1) | | 0.2 | | (0.7) | |
| | | | | | | | | |
| | | | | | | | |
Provision for income taxes | | 37.9 | % | | 43.0 | % | | 42.4 | % | | 109.3 | % | 35.7 | % | 38.4 | % |
| | | | | | | | | |
| | | | | | | | |
| | | | | | | | |
| | | | | | | | | |
The effective income tax rates during the years ended June 30, 2014, 20132017, 2016 and 20122015 were 37.9%109.3%, 43.0%35.7%, and 42.4%38.4%, respectively. The primary causes of the changesincrease in the effective tax rate were provision true-ups and additionalfor the year ended June 30, 2017 was primarily due to the Web impairment which resulted in substantial foreign losses with no tax benefits relatedbenefit due to research activities of the Company, offset by additional reserves related to prior year tax positions.full valuation allowance against these losses.
Tax Uncertainties
The Company follows the provisions of ASC 740-10 which applies to all tax positions related to income taxes. ASC 740-10 provides a comprehensive model for how a company should recognize, measure, present and disclose in its financial statements uncertain tax positions that the company has taken or expects to take on a tax return. ASC 740-10 clarifies accounting for income taxes by prescribing a minimum probability threshold that a tax position must meet before a financial statement benefit is recognized. If the probability for sustaining a tax position is greater than 50%, then the tax position is warranted and recognition should be at the highest amount which would be expected to be realized upon ultimate settlement.
The Company recognizes interest and penalties, if any, related to unrecognized tax benefits in income tax expense. AtAs of June 30, 2014,2017, 2016 and 2015, the Company had $0.1 million, $0.1 million and $0.2 million in accrued interest and penalties, accrued.
| | | | | | | | | | |
| | Year Ended June 30, | |
|---|
| | 2014 | | 2013 | | 2012 | |
|---|
| | (In thousands)
| |
|---|
Balance at beginning of the year | | $ | 1,346 | | $ | 906 | | $ | 817 | |
Additions for prior year tax positions | | | 702 | | | 302 | | | — | |
Additions for current year tax positions | | | 507 | | | 138 | | | 89 | |
| | | | | | | | |
| | | | | | | | | | | |
Balance at end of the year | | $ | 2,555 | | $ | 1,346 | | $ | 906 | |
| | | | | | | | |
| | | | | | | | | | | |
| | | | | | | | | | | |
| | | | | | | | |
Table of Contentsrespectively.
K12 Inc.
Notes to Consolidated Financial Statements (Continued)
5. Income Taxes (Continued)
The Company or one of its subsidiaries files incomeunrecognized tax returns in the U.S. federal, foreign and various state jurisdictions. Given the federal and certain state net operating losses generated in prior years, the statute of limitations for all tax years beginning with the period ended December 31, 2000 are still open. The statute of limitations for certain states for certain subsidiaries that have generated income may only extend back to 2009. The returns of the foreign subsidiaries are open to examinationbenefits for the periods dating back to 2009.years ended June 30, 2017, 2016 and 2015 were as follows:
| | | | | | | | | |
| | Year Ended June 30, |
| | 2017 | | 2016 | | 2015 |
| | (In thousands) |
Balance at beginning of the year | | $ | 2,224 | | $ | 3,558 | | $ | 2,555 |
Additions for prior year tax positions | | | 951 | | | 351 | | | 137 |
Additions for current year tax positions | | | 241 | | | 290 | | | 989 |
Reductions for prior year tax positions | | | (1,156) | | | (1,975) | | | (123) |
Balance at end of the year | | $ | 2,260 | | $ | 2,224 | | $ | 3,558 |
If recognized, all of the $2.6$2.3 million balance of unrecognized tax benefits would affect the effective tax rate. It is reasonably expected thatWe do not anticipate a significant increase or decrease in unrecognized tax benefits related to income tax issues may change by a significant amount overin the next twelve months.
The Company remains subject to audit by the Internal Revenue Service for federal tax purposes for tax years after June 30, 2013. Certain state and foreign tax jurisdictions are also either currently under audit or remain open under the statute of limitations for the tax years after June 30, 2011.
6. Lease Commitments
Capital Leases
The Company incurs capital lease obligations for student computers under a non-revolving lease line of credit with PNC Equipment Finance, LLC with annual borrowing limits. The Company had annual borrowing availability under the lease line of credit of $35.0 million as of June 30, 2014 and 2013, respectively.LLC. As of June 30, 20142017 and 2013,2016, the aggregate outstanding balance of capital leases under the current and former lease linelines of credit including balances from prior years,(as discussed in more detail below) was $36.9$21.9 million and $35.5$23.1 million, respectively, with lease interest rates ranging from 2.52%1.95% to 3.08%2.71%. Individual leases under the lease linelines of credit include 36-month36‑month payment terms with a $1 purchase option at the end of each lease term. The Company has pledged the assets financed to secure the outstanding leases. The lease line of credit was subject to cross default compliance provisions in the Company's line of credit agreement with PNC Bank, N.A. (see Note 7). The netgross carrying value of leased student computers as of June 30, 20142017 and 20132016 was $20.9$39.1 million and $31.2$39.9 million, respectively. The accumulated depreciation of leased student computers as of June 30, 2017 and 2016 was $25.1 million and $25.9 million, respectively.
In July 2014, theThe Company extendedexecuted a second extension to its leasing agreement with an annual leasing availability of $35.0 million for fiscal year 2015. This availability expires in July 2015 and interest rates on the new borrowings are based upon an initial rate of 2.34% modified by changes in the three year interest rate swaps rate as published in the Federal Reserve Statistical Release H.15, "Selected Interest Rates," between June 25, 2014 and the Lease Commencement Date, as defined in thenon-revolving lease line of credit.credit during the third quarter of fiscal year 2017 to extend the maturity date to August 15, 2018, and had remaining availability under the new lease line of $31.9 million as of June 30, 2017. The Company had $11.3 million of remaining availability under the previous non-revolving $35.0 million lease line of credit as of June 30, 2016. Interest on unpaid principal under the new line of credit is at a fluctuating rate of LIBOR plus 1.2%.
The following is a summary as of June 30, 20142017 of the present value of the net minimum lease payments on capital leases under the Company'sCompany’s commitments:
| | | | |
($ in thousands)
| | Capital
Leases | |
|---|
2015 | | $ | 21,217 | |
2016 | | | 12,021 | |
2017 | | | 4,765 | |
| | | | |
| | | | | |
Total minimum lease payments | | | 38,003 | |
Less amount representing interest (imputed weighted average interest rate of 2.86%) | | | (1,064 | ) |
| | | | |
| | | | | |
Net minimum lease payments | | | 36,939 | |
Less current portion | | | (20,492 | ) |
| | | | |
| | | | | |
Present value of net minimum payments, less current portion | | $ | 16,447 | |
| | | | |
| | | | | |
| | | | | |
| | | | |
| | | |
As of June 30, | | Capital Leases |
| | (in thousands) |
2018 | | $ | 12,235 |
2019 | | | 7,819 |
2020 | | | 2,376 |
Total minimum payments | | | 22,430 |
Less amount representing interest (imputed weighted average capital lease interest rate of 2.28%) | | | (525) |
Net minimum payments | | | 21,905 |
Less current portion | | | (11,880) |
Present value of minimum payments, less current portion | | $ | 10,025 |
Operating Leases
Table of Contents
K12 Inc.
Notes to Consolidated Financial Statements (Continued)
6. Lease Commitments (Continued)
Operating leases
The Company has fixed non-cancelablenon‑cancelable operating leases with terms expiring through 2022 for office space leases. Office leases generally contain renewal options and certain leases provide for scheduled rate increases over the lease terms.
Rent expense was $8.8$6.3 million, $7.7$7.8 million and $7.8$8.1 million for the years ended June 30, 2014, 20132017, 2016 and 2012,2015, respectively.
Future minimum lease payments under noncancelablenon-cancelable operating leases with initial terms of one year or more are as follows:
| | | | |
($ in thousands)
| | Year Ending
June 30, | |
|---|
2015 | | $ | 7,910 | |
2016 | | | 7,599 | |
2017 | | | 7,291 | |
2018 | | | 7,199 | |
2019 | | | 7,243 | |
Thereafter | | | 17,944 | |
| | | | |
| | | | | |
Total future minimum lease payments | | $ | 55,186 | |
| | | | |
| | | | | |
| | | | | |
| | | | |
| | | |
| | Year Ended |
($ in thousands) | | June 30, |
2018 | | $ | 9,208 |
2019 | | | 9,138 |
2020 | | | 7,860 |
2021 | | | 7,351 |
2022 | | | 6,196 |
Thereafter | | | 150 |
Total future minimum lease payments | | $ | 39,903 |
7. Line of Credit
We had a $35.0 million unsecured line of credit that expired on December 31, 2013 with PNC Bank, N.A., or PNC, for general corporate operating purposes. On January 31, 2014, wethe Company executed a $100.0 million unsecured line of credit to be used for general corporate operating purposes with Bank of America, N.A. ("BOA"(“BOA”). The line has a five yearfive-year term, bears interest at the higher of the Bank'sBank’s prime rate plus 0.25%, or the Federal Funds Rates plus 0.50%0.75%, or LIBOR plus 1.25%; and incorporates customary financial and other covenants, including but not limited to a maximum debt leverage and a minimum fixed charge coverage ratio. As of June 30, 2017 and 2016, the LIBOR rate plus 1.00%. The Credit Agreement includes a $10.0 million letterCompany was in compliance with these covenants. During the years ended June 30, 2017 and 2016, there was no borrowing activity on this line of credit, facility. Issuance of letters of credit reducesand the availability of permitted borrowings under the Credit Agreement. The Company had no amountsborrowings outstanding on the line of credit or letteras of credit facilities in fiscal years 2014June 30, 2017 and 2013.2016.
The Credit AgreementBOA credit agreement contains a number of financial and other covenants that, among other things,things; restrict ourthe Company and our subsidiaries' abilitiesits subsidiaries’ ability to incur additional indebtedness, grant liens or other security interests, make certain investments, make specified restricted payments including dividends, dispose of assets or stock including the stock of ourits subsidiaries, or make capital expenditures above specified limits and engage in other matters customarily restricted in senior credit facilities. The agreement incorporates customary financial and other covenants, including but not limited
Table of Contents
K12 Inc.
Notes to a maximum debt leverage and a minimum fixed charge coverage ratio. As of June 30, 2014, we were in compliance with these covenants.Consolidated Financial Statements (Continued)
8. Equity Transactions
The Company's SecondCompany’s Fourth Amended and Restated Certificate of Incorporation authorizes the Company to issue 100,000,000 shares of Common Stock and 10,000,000 shares of Preferred Stock. No Preferred Stock was issued or outstanding as of June 30, 20142017 or 2013.2016.
TableCommon Stock Repurchases
On November 4, 2013, the Board of Contents
K12 Inc.
NotesDirectors authorized the repurchase of up to Consolidated Financial Statements (Continued)
8. Equity Transactions (Continued)
Series A Special Stock
$75.0 million of the Company’s outstanding common stock over a two year period. Any purchases under the buyback are dependent upon business and market conditions and other factors. The stock purchases are made from time to time and may be made through a variety of methods including open market purchases and trading plans that may be adopted in accordance with the Rule 10b-18 of the Exchange Act. For fiscal year ended June 30, 2015, the Company issued 2,750,000paid approximately $26.5 million in cash to repurchase 1,307,402 shares of Series A Special Stock in connection with its acquisition of KC Distance Learning, Inc. The holders of the Series A Special Stock had the right to convert those shares into common stock on a one-for-one basis and for the right to vote on all matters presented to K12 stockholders, other than for the election and removalat an average price of directors, for which holders of the Series A Special Stock had no voting rights. These shares were converted into common stock on September 3, 2013 and no Series A Special Stock remains outstanding as$20.23 per share. As of June 30, 2014.2017 and 2016, total shares purchased under the plan were 3,502,598, at an average cost of $21.41 per share, and there were no shares remaining to be repurchased under the plan. No stock purchases were made during the year ended June 30, 2017 and 2016.
9. Stock OptionEquity Incentive Plan
On December 15, 2016 (the “Effective Date”), the Company’s stockholders approved the 2016 Incentive Award Plan (the “Plan”). The Company adopted a Stock Option Plan in May 2000 (the "Option Plan") under which,is designed to motivate high levels of performance and align the interests of the Company’s employees, outside directors and independent contractors could participate inconsultants with the Company's futurelong-term interests of its stockholders by linking compensation to Company performance through awardswhile building the long-term value of nonqualifiedthe Company. Awards granted under the Plan may include stock options, to purchase common stock. In December 2003,stock appreciation rights, restricted stock, restricted stock units, and other stock-based awards. Under the total numberPlan, the following types of common stock shares reservedgo back into the pool of shares available for grant and issuance pursuantissuance:
| · | | unissued shares related to forfeited or cancelled restricted stock and stock options from Plan awards and Prior Plan awards (that were outstanding as of the Effective Date), and; |
| · | | shares tendered to satisfy the tax withholding obligation related to the vesting of restricted stock (but not stock options). |
Unlike the Option Plan was increased to 2,549,019 shares. In October 2007, the Company's Board adopted theCompany’s 2007 Equity Incentive Award Plan as amended (the "2007 Plan"“Prior Plan”) increasing, the Plan has no evergreen provision to increase the shares available for issuance; any new shares would require stockholder approval. The Prior Plan was set to expire in October 2017; however, with the approval of the Plan, the Company will no longer award equity from the Prior Plan. At June 30, 2017, the remaining aggregate number of shares of the Company’s common stock shares reservedauthorized for future issuance to 4,213,921 shares plus increases in the shares pursuant to an "evergreen provision" that may be issued under the 2007 Plan overwas 4,384,718. At June 30, 2017, there were 4,541,177 shares of the course of its ten-year term. Company’s common stock that remain outstanding under the Plan and Prior Plan.
Each stock option is exercisable pursuant to the vesting schedule set forth in the stock option agreement granting such stock option, generally over four years. No stock option shall be exercisable after the expiration of its option term. The Company has granted stock options under the 2007Prior Plan and the Company has also granted stock options to executive officers under stand-alone agreements outside the Prior Plan. Options granted under stand-alone agreements totaled 1,441,168 as of June 30, 2014, 2013 and 2012. There have been no grants of stock options to independent contractors.
Compensation expense for all equity-based compensation awards is based on the grant-date fair value estimated in accordance with the provisions of ASC 718. The Company recognizes these compensation costs on a straight-line basis over the requisite service period, which is generally the vesting period of the award.
The Company uses the Black-Scholes option pricing model method to calculate the fair value of stock options. The use of option valuation models requires the input by management of highly subjective assumptions, including the expected stock price volatility, the expected life of the option term and forfeiture rate. These assumptions are utilized by the Company in determining the estimated fair value of stock options.
Table of Contents
K12 Inc.
Notes to Consolidated Financial Statements (Continued)
9. Stock Option Plan (Continued)
The fair value of the Company'sCompany’s service and performance based stock options was estimated as of the date of grant using the Black-Scholes option pricing model with the following assumptions:
| | | | | | | | | | | | |
| | Year Ended June 30, | Year Ended June 30, | |
|---|
| | 2014 | | 2013 | | 2012 | 2016 | | 2015 | |
|---|
Dividend yield | | 0.00% | | 0.00% | | 0.00% | | 0.00% | | | 0.00% | |
Expected volatility | | 49% to 55% | | 51% to 58% | | 48% to 55% | | 54.5% | | | 48% to 51% | |
Risk-free interest rate | | 1.23% to 1.73% | | 0.62% to 1.23% | | 0.68% to 0.96% | | 1.00% | | | 1.27% to 1.71% | |
Expected life of the option term (in years) | | 4.82 to 5.14 | | 4.82 to 5.14 | | 5.11 to 5.25 | | 5.11 | | | 4.97 to 5.11 | |
Forfeiture rate | | 12% to 28% | | 10% to 28% | | 10% to 27% | | 12% | | | 12% to 28% | |
There were no grants of stock options during the year ended June 30, 2017. The fair value of the options granted for the years ended June 30, 2014, 20132016 and 20122015 was $3.0 million, $6.9$3.2 million and $4.6$4.4 million, respectively. This amount will be expensed over the required service period.
Dividend yield—The Company has never declared or paid dividends on its common stock and has no plans to do so in the foreseeable future.
Expected volatility—Volatility is a measure of the amount by which a financial variable such as a share price has fluctuated (historical volatility) or is expected to fluctuate (expected volatility) during a period. Prior to fiscal year 2014, since the Company did not have sufficient historical data, the basis for the standard option volatility calculation is derived from known publicly traded comparable companies. The annual volatility for these companies is derived from their historical stock price data. Beginning in 2014, the Company used its own volatility rather than utilizing a peer group volatility.
Risk-freeRisk‑free interest rate—The assumed risk free rate used is a zero coupon U.S. Treasury security with a maturity that approximates the expected term of the option.
Expected life of the option term—The period of time that the options granted are expected to remain unexercised. Options granted during the year have a maximum term of eight years. The Company estimates the expected life of the option term based on an average life between the dates that options become fully vested and the maximum life of options granted.
Forfeiture rate—The estimated percentage of options granted that areis expected to be forfeited or canceled before becoming fully vested. The Company uses a forfeiture rate based on historical forfeitures of different classification levels of employees in the Company.
Table of Contents
K12 Inc.
Notes to Consolidated Financial Statements (Continued)
9. Stock Option Plan (Continued)
Stock option activity including stand-alonestand‑alone agreements during the years ended June 30, 2014, 20132017, 2016 and 2012 are2015 is as follows:
| | | | | | | | | | | | | |
| | Shares | | Weighted
Average
Exercise
Price | | Weighted
Average
Remaining
Contractual
Life (Years) | | Aggregate
Intrinsic
Value | |
|---|
Outstanding, June 30, 2011 | | | 2,765,729 | | $ | 16.81 | | | 4.58 | | $ | 38,485 | |
Granted | | | 489,486 | | | 25.22 | | | | | | | |
Exercised | | | (217,956 | ) | | 15.08 | | | | | | | |
Forfeited or canceled | | | (87,319 | ) | | 23.34 | | | | | | | |
| | | | | | | | | | | | |
| | | | | | | | | | | | | | |
Outstanding, June 30, 2012 | | | 2,949,940 | | $ | 20.41 | | | 4.21 | | $ | 36,916 | |
Granted | | | 740,509 | | | 21.35 | | | | | | | |
Exercised | | | (437,054 | ) | | 16.59 | | | | | | | |
Forfeited or canceled | | | (360,207 | ) | | 28.93 | | | | | | | |
| | | | | | | | | | | | |
| | | | | | | | | | | | | | |
Outstanding, June 30, 2013 | | | 2,893,188 | | $ | 20.17 | | | 4.98 | | $ | 50,038 | |
Granted | | | 306,220 | | | 26.90 | | | | | | | |
Exercised | | | (531,262 | ) | | 17.49 | | | | | | | |
Forfeited or canceled | | | (89,745 | ) | | 22.63 | | | | | | | |
| | | | | | | | | | | | |
| | | | | | | | | | | | | | |
Outstanding, June 30, 2014 | | | 2,578,401 | | $ | 21.44 | | | 4.57 | | $ | 42,754 | |
| | | | | | | | | | | | |
| | | | | | | | | | | | | | |
| | | | | | | | | | | | | | |
| | | | | | | | | | | | |
Stock options exercisable at June 30, 2014 | | | 1,808,758 | | $ | 20.30 | | | 3.66 | | $ | 10,755 | |
| | | | | | | | | | | | |
| | | | | | | | | | | | | | |
| | | | | | | | | | | | | | |
| | | | | | | | | | | | |
| | | | | | | | | | |
| | | | | | | Weighted | | | |
| | | | Weighted | | Average | | | |
| | | | Average | | Remaining | | Aggregate |
| | | | Exercise | | Contractual | | Intrinsic |
| | Shares | | Price | | Life (Years) | | Value |
Outstanding, June 30, 2014 | | 2,578,401 | | $ | 21.44 | | 4.57 | | $ | 42,754 |
Granted | | 617,985 | | | 16.12 | | | | | |
Exercised | | (99,935) | | | 5.68 | | | | | |
Forfeited or canceled | | (181,858) | | | 29.85 | | | | | |
Outstanding, June 30, 2015 | | 2,914,593 | | $ | 20.33 | | 4.05 | | $ | 88,200 |
Granted | | 243,112 | | | 13.43 | | | | | |
Exercised | | (1,000) | | | 13.66 | | | | | |
Forfeited or canceled | | (806,530) | | | 18.55 | | | | | |
Outstanding, June 30, 2016 | | 2,350,175 | | $ | 20.20 | | 3.94 | | $ | 46,573 |
Granted | | — | | | — | | | | | |
Exercised | | (425,180) | | | 16.35 | | | | | |
Forfeited or canceled | | (568,467) | | | 23.12 | | | | | |
Outstanding, June 30, 2017 | | 1,356,528 | | $ | 20.19 | | 4.46 | | $ | 1,481,585 |
Stock options exercisable at June 30, 2017 | | 1,055,783 | | $ | 21.46 | | 4.10 | | $ | 621,708 |
Stock options outstanding at June 30, 2014 included 368,575 options related to performance or market based options. During the year ended June 30, 2014, performance or market based options vested were 79,359. Stock options exercisable at June 30, 2014 included 368,575 stock options related to performance based options. Vesting of performance based options is contingent on meeting various company-wide performance goals.
The aggregate intrinsic value in the table above represents the total pre-taxpre‑tax intrinsic value (the difference between the Company'sCompany’s closing stock price on the last day of the year and the exercise price, multiplied by the number of in-the-moneyin‑the‑money options) that would have been received by the option holders had all option holders exercised their options on June 30, 2014.2017. The amount of aggregate intrinsic value will change based on the fair market value of the Company'sCompany’s stock.
The total intrinsic value of options exercised for the years ended June 30, 2014, 20132017, 2016 and 20122015 was $7.4$1.3 million, $3.4 millionzero and $3.6$0.3 million, respectively.
As of June 30, 2014,2017, there was $6.7$2.1 million of total unrecognized compensation expense related to unvestednonvested stock options granted under the Stock Option Plans adopted in May 2000 and October 2007.granted. The cost is expected to be recognized over a weighted average period of 2.181.7 years. During the years ended June 30, 2014, 20132017, 2016 and 2012,2015, the Company recognized $7.0$2.0 million, $5.0$3.7 million and $4.5$5.5 million, respectively, of stock-based compensation expense related to stock based compensation expense. Duringoptions. Included in expense for the yearyears ended June 30, 2014, the Company recorded stock-based compensation of $1.62017, 2016 and 2015 is zero, $0.4 million associated with extending the exercise period of certain option awards to our former Chief Executive Officer upon his resignation from the Board of Directors and $1.5 millionzero, respectively, associated with accelerated vesting of option awards to our former Chief Executive Officer
Table of Contents
K12 Inc.
Notes to Consolidated Financial Statements (Continued)
9. Stock Option Plan (Continued)
for executives and other employees upon termination of employment. There were no similar charges in the years ended June 30, 2013 and 2012. The total income tax (expense)/benefit recognized in the consolidated statements of operations related to stock options exercised during the years ended June 30, 2014, 2013 and 2012 was $1.1 million, $8.9 million and $(3.1) million, respectively.employees.
Restricted Stock Awards
The Company has approved grants of restricted stock awards ("RSA"(“RSA”) pursuant to the 2007Plan and Prior Plan. Under the Plan and Prior Plan, employees, outside directors and independent contractors are able to participate in the Company'sCompany’s future performance through the awards of restricted stock. Each RSA vests pursuant to the vesting schedule set forth in the restricted stock agreement granting such RSA's,RSAs, generally over three years. Under the 2007Plan and Prior Plan, there have been no awards of restricted stock to independent contractors.
Restricted stock award activity during the years ended June 30, 2014, 20132017, 2016 and 20122015 was as follows:
| | | | | | | | | | | | |
| | Shares | | Weighted-
Average
Fair Value | | | | | Weighted- |
|---|
Nonvested, June 30, 2011 | | 444,151 | | $ | 23.62 | | |
| | | | | Average |
| | | | | Grant-Date |
| | | Shares | | Fair Value |
Nonvested, June 30, 2014 | | | 979,595 | | $ | 22.97 |
Granted | | 398,940 | | 26.19 | | | 822,698 | | | 17.54 |
Vested | | (199,043 | ) | | 23.46 | | | (490,309) | | | 15.63 |
Canceled | | (52,411 | ) | | 26.86 | | | (66,480) | | | 22.46 |
| | | | | | | |
| | | | | | |
Nonvested, June 30, 2012 | | 591,637 | | 25.12 | | |
Nonvested, June 30, 2015 | | | 1,245,504 | | $ | 22.30 |
Granted | | 768,951 | | 21.78 | | | 1,704,843 | | | 10.13 |
Vested | | (346,309 | ) | | 24.00 | | | (722,577) | | | 22.24 |
Canceled | | (86,142 | ) | | 23.01 | | | (95,980) | | | 20.25 |
| | | | | | | |
| | | | | | |
Nonvested, June 30, 2013 | | 928,137 | | 22.97 | | |
Nonvested, June 30, 2016 | | | 2,131,790 | | $ | 12.46 |
Granted | | 704,131 | | 31.49 | | | 1,268,311 | | | 12.70 |
Vested | | (559,250 | ) | | 25.11 | | | (1,084,046) | | | 12.94 |
Canceled | | (93,423 | ) | | 26.24 | | | (175,008) | | | 12.69 |
Nonvested, June 30, 2017 | | | 2,141,047 | | $ | 12.34 |
| | | | | | | | | | | |
| | | | | | |
Nonvested, June 30, 2014 | | 979,595 | | $ | 22.97 | | |
| | | | | | | |
| | | | | | |
| | | | | | |
| | | | | | | |
Performance Based Restricted Stock Awards (included above)
During the year ended June 30, 2014, 144,2222017, 333,489 new performance based restricted stock awards were granted and 311,722 were outstanding467,131 remain nonvested at June 30, 2014.2017. During the year ended June 30, 2014, 87,5002017, 99,155 performance or market based restricted stock awards vested. Vesting of the performance-basedperformance based restricted stock awards is contingent on the achievement of certain financial performance goals.goals and service vesting conditions.
Equity Incentive Market Based Restricted Stock Awards (included above)
The fair value of restricted stock awards granted for
During the year ended June 30, 20142017, 58,000 new equity incentive market based restricted stock awards were granted with a weighted average grant date fair value of $4.99 per share. The awards were granted pursuant to the Prior Plan and 20% of the shares granted vest immediately upon achievement of specified average closing prices of the Company’s stock for 30 consecutive days following the public release of fiscal year 2017 earnings and the remaining 80% vest ratably in semi-annual intervals until the three year anniversary from grant date. Additionally, vesting is dependent upon continuing service by the grantee as an employee of the Company at each vest date, unless the grantee is eligible for earlier vesting. The fair value was $18.7 million.determined using a Monte Carlo simulation model incorporating the following factors: stock price on the grant date of $11.50, risk free rate of return of 0.6%, and expected volatility of approximately 50%.
During the year ended June 30, 2017, 71,796, 118,750, and 144,738 of previously issued market based awards vested upon on the attainment of the average stock price performance target of $13, $16 and $19 per share, respectively, for 30 consecutive days. As of June 30, 2014,2017, 307,075 equity incentive market based restricted stock awards remain nonvested.
Service Based Restricted Stock Awards (included above)
During the year ended June 30, 2017, 876,822 new service based restricted stock awards were granted and 1,366,841 remain nonvested at June 30, 2017. During the year ended June 30, 2017, 649,607 service based restricted stock awards vested.
Summary of All Restricted Stock Awards
As of June 30, 2017, there was $19.4$13.8 million of total unrecognized compensation expense related to unvestednonvested restricted stock awards granted.awards. The cost is expected to be recognized over a weighted average period of 2.111.4 years. The fair value of restricted stock awards granted for the years ended June 30, 2017 and 2016 was $16.0 million and $14.5 million, respectively. The total fair value of shares vested duringfor the yearyears ended June 30, 20142017 and 2016 was $12.5 million.$17.5 million and $8.2 million, respectively. During the years ended June 30, 2014, 20132017, 2016 and 2012,2015, the Company recognized $15.8$16.8 million, $9.4$14.8 million and $5.6$15.8 million, respectively, of stock-based compensation expense related to restricted stock awards. DuringIncluded in the yearexpense for the years ended June 30, 2014, the Company recorded stock-based compensation of $3.62017, 2016 and 2015, is $1.0 million, $0.4 million and $2.5 million associated with accelerated vesting of equity awards to our former Chiefexecutives and other employees.
Performance Share Units (“PSU”)
During the years ended June 30, 2017 and 2016, the Company granted 52,000 and 1,154,602 PSUs, respectively to certain senior executives, having a weighted average grant date fair value of $18.97 and $12.92 per share, respectively. The PSUs vest upon achievement of certain performance criteria associated with a Board-approved Long Term Incentive Plan (“LTIP”) and continuation of employee service over a two to three year period. The level of performance will determine the number of PSUs earned as measured against threshold, target and stretch achievement levels of the LTIP. Each PSU represents the right to receive one share of the Company’s common stock, or at the option of the Company, an equivalent amount of cash, and are classified as an equity award in accordance with ASC 718. If actual performance exceeds the target criteria for a full award, then additional PSUs up to 521,801 could be earned by the participants.
In addition to the LTIP performance conditions, there is a service vesting condition which stipulates that thirty percent of the earned award (“Tranche #1) will vest quarterly beginning November 15, 2017 and seventy percent of the earned award (“Tranche #2) will vest on August 15, 2018, in both cases dependent upon continuing service by the grantee as an employee of the Company, unless the grantee is eligible for earlier vesting upon a change in control and qualifying termination, as defined by the PSU agreement. For equity performance awards, including the PSUs, subject to graduated vesting schedules for which vesting is based on achievement of a performance metric in addition to grantee service, stock-based compensation expense is recognized on an accelerated basis by treating each vesting tranche as if it was a separate grant. For the year ended June 30, 2017, the Company determined the achievement of the performance condition was probable on Tranche #1. Achievement is believed to be probable at the highest level which equals 150% of the target award. Therefore, during the fourth quarter of fiscal 2017, the Company recorded $3.8 million of expense for the period of grant date (September 2015) through June 2017. The Company determined the achievement of the performance conditions associated with Tranche #2 was not probable, therefore no expense was recorded during the year ended June 30, 2017. As of June 30, 2017, there was $1.6 million of total unrecognized compensation expense related to nonvested PSUs for which probable achievement is assumed. During the years ended June 30, 2017, 2016 and 2015, the Company recognized $3.8 million, zero and zero, respectively, of stock-based compensation expense related to PSUs.
Table of Contents
K12 Inc.
Notes to Consolidated Financial Statements (Continued)
9. Stock Option Plan (Continued)
Executive Officer and other employees upon termination of employment. There were no similar charges inPerformance share unit activity during the years ended June 30, 20132017 and 2012.2016 was as follows:
| | | | | |
| | | | Weighted- |
| | | | Average |
| | | | Grant-Date |
| | Shares | | Fair Value |
Nonvested, June 30, 2015 | | — | | $ | — |
Granted | | 1,154,602 | | | 12.92 |
Vested | | — | | | — |
Canceled | | (65,000) | | | 13.45 |
Nonvested, June 30, 2016 | | 1,089,602 | | $ | 12.91 |
Granted | | 52,000 | | | 18.97 |
Vested | | — | | | — |
Canceled | | (98,000) | | | 13.45 |
Nonvested, June 30, 2017 | | 1,043,602 | | $ | 13.16 |
10. Redeemable Noncontrolling Interest
In May 2010,Investment in LearnBop, Inc.
On July 31, 2014, the Company entered intoacquired a majority interest in LearnBop, Inc. (“LearnBop”), for $6.5 million in cash in return for a 51% interest in LearnBop. The purpose of the acquisition was to complement the Company’s K-12 math curriculum as LearnBop has developed an agreementadaptive math curriculum learning software. As part of this transaction, the non-controlling shareholders have a non-transferable put right, which is exercisable between July 31, 2018 and December 31, 2018 for the remaining minority interest. The price of the put right will be determined based on the trailing twelve month revenue and contribution margin as defined in the Stockholders’ Agreement between the Company and LearnBop. Additionally, the Company has a non-transferable call option for the remaining minority interest at a price of $3.0 million, which becomes exercisable January 1, 2019 or thereafter. Acquisition costs incurred by the Company related to establish a joint venture with Middlebury College ("Middlebury") to form Middlebury Interactive Languages LLC ("MIL"). The venture creates and distributes innovative, high-quality online language courses under the trademark Middleburythis transaction included in selling, administrative and other marks. At any time afteroperating expenses were $0.1 million during the fifth (5th) anniversary of forming the joint venture, Middlebury may give written notice of its irrevocable election to sell all (but not less than all) of its membership interest to the Company (put right). year ended June 30, 2015.
The purchase price of $6.5 million was allocated to the underlying assets and liabilities based on their estimated fair value at the date of acquisition. The Company recorded goodwill of $8.1 million, which will be non-deductible for Middlebury's membership interest shall betax purposes. Recognition of goodwill is largely attributed to the value paid for LearnBop’s capabilities in providing adaptive learning software for math curriculum to K-12 students. The Company has not disclosed current period or pro-forma revenue and earnings attributable to LearnBop as they are immaterial.
The Company finalized its fair market value and the Company may, in its sole discretion, payallocation of the purchase price in cash or shares of the Company's common stock. AtLearnBop as of June 30, 2014, MIL had not met certain milestones associated with its Language Academy summer camp programs. As such, Middlebury may exercise its option to either repurchase the camp programs at fair market value along with other contractual rights. Middlebury has neither exercised nor expressed an intent to exercise the option.2015. The purchase price was allocated as follows:
�� LearnBop (in millions):
| | | |
As of July 31, 2014 | | Amount |
Current assets | | $ | 0.1 |
Capitalized software | | | 0.9 |
Goodwill | | | 8.1 |
Current liabilities | | | (0.1) |
Redeemable noncontrolling interest | | | (2.5) |
Fair value of total consideration transferred | | $ | 6.5 |
Given the provision of the put right,rights, the redeemable noncontrolling interest isinterests are redeemable outside of the Company'sCompany’s control and it isare recorded outside of permanent equity at itstheir redemption value fair value in accordance with
ASC 480,480‑10‑S99, Distinguishing Liabilities FromAccounting for Redeemable Equity Instruments. (EITF Topic D-98,Classification and Measurement of Redeemable Securities). The Company will adjust the redeemable noncontrolling interestinterests to redemption value on each balance sheet date with changes in redemption value recognized as an adjustment to retained earnings, or in the absence of retained earnings, by adjustment to additional paid-in-capital.
The noncontrolling interest is redeemable at other than fair value as the redemption value is determined based on a specified formula. The noncontrolling interest becomes redeemable after the passage of time, and therefore the Company records the carrying amount of the noncontrolling interest at the greater of (i) the initial carrying amount, increased or decreased for the noncontrolling interest’s share of net income or loss, or (ii) the redemption value.
According to ASC 480-10-S99, to the extent that the noncontrolling interest holder has the contractual right to receive an amount upon share redemption that is other than fair value of such shares, only the portion of the periodic adjustment to the instrument’s carrying amount that reflects redemption in excess of fair value is treated like a dividend for earnings per share computation purposes. No adjustment to the earnings per share computation was necessary as estimated fair value of the noncontrolling interest is greater than the redemption value.
Middlebury College Joint Venture
In May 2010, the Company entered into an agreement to establish a joint venture with Middlebury College (“Middlebury”) to form Middlebury Interactive Languages LLC (“MIL”). The venture creates and distributes innovative, online language courses under the trademark Middlebury and other marks. The joint venture agreement provided Middlebury with the right at any time after the fifth (5th) anniversary of forming the joint venture, to irrevocably elect to sell all of its membership interest to the Company (put right) at the fair market value of Middlebury’s membership interest. Additionally, Middlebury had an option to repurchase the camp programs at fair market value along with other contractual rights as certain milestones associated with its Language Academy summer camp programs were not met. On May 4, 2015, Middlebury exercised its right to require the Company to purchase all of its ownership interest in the joint venture, and on December 27, 2016, the Company consummated the acquisition of the remaining 40% noncontrolling interest for $9.1 million in cash.
The following is a summary of the activity of the redeemable noncontrolling interest at June 30, 20142017 and 2013:2016:
| | | | |
(In thousands)
| | Value | |
|---|
Balance of redeemable noncontrolling interest at June 30, 2012 | | $ | 17,200 | |
Net loss | | | (1,019 | ) |
Adjustment to redemption value | | | (981 | ) |
| | | | |
| | | | | |
Balance of redeemable noncontrolling interest at June 30, 2013 | | | 15,200 | |
Net loss | | | (1,319 | ) |
Net proceeds from noncontrolling interest contribution | | | 1,275 | |
Adjustment to redemption value | | | 1,645 | |
| | | | |
| | | | | |
Balance of redeemable noncontrolling interest at June 30, 2014 | | $ | 16,801 | |
| | | | |
| | | | | |
| | | | | |
| | | | |
| | | |
(In thousands) | | Value |
Balance of redeemable noncontrolling interest at June 30, 2015 | | $ | 9,601 |
Net loss | | | (484) |
Adjustment to redemption value | | | (1,615) |
Balance of redeemable noncontrolling interest at June 30, 2016 | | $ | 7,502 |
Net loss | | | (910) |
Adjustment to redemption value | | | 3,245 |
Purchase of noncontrolling interest | | | (9,137) |
Balance of redeemable noncontrolling interest at June 30, 2017 | | $ | 700 |
11. Commitments and Contingencies
Litigation
In the ordinary conduct of the Company’s business, the Company is subject to lawsuits, arbitrations and administrative proceedings from time to time. The Company expenses legal costs as incurred.believes that the outcome of any existing or known threatened proceedings, even if determined adversely, should not have a material adverse effect on the Company’s business, financial condition, liquidity or results of operations.
On September 24, 2015, in connection with an industry-wide investigation styled “In the Matter of the Investigation of For-Profit Virtual Schools,” the Company received a civil investigative subpoena for specified documents and responses to interrogatories from the Attorney General of the State of California, Bureau of Children’s Justice (“BCJ”).
On July 8, 2016, K12 and the California Virtual Academy (“CAVA”) charter schools (“CAVA Schools”) entered into: (i) a Settlement Agreement and Release of a previously sealed Qui Tam lawsuit alleging false attendance reporting; (ii) a Stipulation for Entry of Final Judgment (“Stipulation”) in connection with the BCJ’s investigation as it pertained to us; and (iii) a Final Judgment enjoining us from engaging in certain business practices in California, and requiring that the Company and CAVA Schools undertake certain Conduct Provisions. The Settlement Agreement and Release provides for us to pay the State of California $2.5 million, and the Qui Tam plaintiff $0.1 million to settle the attendance reporting claims and in which we and the CAVA Schools deny any and all liability and wrongdoing. The Stipulation specifies that the Attorney General, the Company and the CAVA Schools have concluded the BCJ investigation and agreed to implement the Conduct Provisions of the Final Judgment “without admissions of findings of fact or law or wrongdoing, misconduct or illegal acts by K12 or the CAVA Schools, or any facts alleged in the [Attorney General’s] Complaint.” The Final Judgement provides for the Company to pay the State of California $6.0 million “to defray the costs of this action and to fund the investigation and prosecution of enforcement cases to protect the rights of children,” and further includes a release of all legal claims that could be brought by the Attorney General involving the covered conduct. The Conduct Provisions of the Final Judgment require the Company to continue to improve its business practices and compliance programs as they generally relate to the operations and promotional activities of K12 and the CAVA Schools. The proceeding settlement costs were offset by insurance reimbursable administrative costs of approximately $1.5 million reflected in selling, administrative and other operating expenses. The resulting charge of $7.1 million was recorded in selling, administrative and other operating expenses for the year ended June 30, 2016.
11. CommitmentsOn July 20, 2016, a securities class action lawsuit captioned Babulal Tarapara v. K12 Inc. et al was filed against the Company, two of its officers and Contingencies (Continued)
IpLearn
On October 26, 2011, IpLearn, LLC ("IpLearn") filed a complaint for patent infringement against usone of its former officers in the United States District Court for the Northern District of Delaware,IpLearn, LLC v. K12 Inc.,California, Case No. 1:11-1026-RGA, which it subsequently amended on November 18, 2011. IpLearn is a privately-held technology development and licensing company for web and computer-based learning technologies. In its complaint, IpLearn alleges that we have infringed three of its patents for various computer-aided learning methods and systems and it is primarily seeking an injunction enjoining us from any continued infringement as well as an award of unspecified monetary damages. On July 2, 2012, the court granted our motion to dismiss IpLearn's allegations of indirect patent infringement and allowed IpLearn's allegations of direct patent infringement to proceed. On January 15, 2013, the court approved a stay of IpLearn's claims alleging infringement of one of the three patents in the case involving technology licensed to us by a third party and on June 12, 2014, the court approved a stipulation by IpLearn that K12's technology does not infringe the second of the three patents. The Company filed its motion for summary judgment regarding the remaining allegation of infringement on June 25, 2014. At June 30, 2014, the Company had not recorded a liability as a loss was neither probable nor estimable.
Oklahoma Firefighters Complaint
On January 30, 2014, a securities class-action lawsuit captionedOklahoma Firefighters Pension & Retirement System v. K12 Inc., et al., was filed against the Company, four of its officers and directors, and a former officer, in the United States District Court for the Eastern District of Virginia,In re K12 Inc. Securities Litigation, Case No. 1:14-CV-108-AJT-JFA. On June 24, 2014, the Court appointed the Oklahoma Firefighters Pension and Retirement System as lead plaintiff, and on May 23, 2014 the lead plaintiff filed an amended class action complaint ("Amended Complaint"3:16-cv-04069 (“Tarapara Case”). The plaintiff purports to represent a class of persons who purchased or otherwise acquired K12the Company’s common stock between February 5,November 7, 2013 and October 8, 2013,27, 2015, inclusive, and alleges violations by the Company and the individual defendants of SectionsSection 10(b) of the Securities Exchange Act of 1934, as amended (the “Exchange Act”), and Rule 10b-5 promulgated under the Exchange Act, and violations by the individual defendants of Section 20(a) of the Exchange Act, and Rule 10b-5 promulgated thereunder.Act. The Amended Complaint alleges, among other things, that the defendants made false or misleading statements of material fact, or failed to disclose material facts, about (i) the Company's enrollment and revenue growth prospects for fiscal 2014, and (ii) the Company's compliance with state regulations governing enrollment. The plaintiff seekscomplaint sought unspecified monetary damages and other relief. Additionally, on September 15, 2016, a second securities class action lawsuit captioned Gil Tuinenburg v.K12 Inc. et al was filed against the Company, two of its officers and one of its former officers in the United States District Court for the Northern District of California, Case No. 3:16-cv-05305 (“Tuinenburg Case”). On October 6, 2016, the Court consolidated the Tarapara Case and the Tuinenburg Case, appointed Babul Tarapara and Mark Beadle as lead plaintiffs, and recaptioned the matter as In Re K12 Inc. Securities Litigation. On December 2, 2016, the lead plaintiffs filed an amended complaint against the Company. The amended complaint named an additional former officer as a defendant and specified a class period start date of October 10, 2013. The amended complaint alleges materially false or misleading statements and omissions regarding the decision of the Agora Cyber Charter School not to renew its managed public school agreement with the Company, student academic and Scantron results, and other statements regarding student academic performance and K12’s academic services and offerings. On January 30, 2017, the Company filed its motion to dismiss the amended complaint. The lead plaintiffs filed an opposition to the motion to dismiss the amended complaint on March 1, 2017. On March 31, 2017, the Company filed its response to the lead plaintiffs’ opposition to the motion to dismiss. A hearing on the motion to dismiss the amended complaint was held on April 19, 2017 and a decision is pending. The Company intends to continue to defend vigorously against the claims assertedeach and every allegation and claim set forth in the Amended Complaint and filed a motion to dismiss the Amended Complaint on June 20, 2014. The parties have fully briefed the motion to dismiss and on August 8, 2014 the Court heard oral arguments on the motion.amended complaint.
Employment Agreements
The Company has entered into employment agreements with certain executive officers that provide for severance payments and, in some cases other benefits, upon certain terminations of employment. Except for the agreements with the Company's CEOCompany’s Executive Chairman and Chief Executive Officer that have two and three year terms, respectively, all other agreements provide for employment on an "at-will"“at-will” basis. If the employee resigns for “good reason” or is terminated for "good reason" or without cause, the employee is entitled to salary continuation, and in some cases benefit continuation, for varying periods depending on the agreement.
Table of Contents
K12 Inc.
Notes to Consolidated Financial Statements (Continued)
11. Commitments and Contingencies (Continued)
Off-BalanceOff‑Balance Sheet Arrangements
We haveAs of June 30, 2017, the Company provided guarantees of approximately $8.5$0.9 million related to lease commitments on the buildings for certain of our Flexthe Company’s schools. WePreviously, the Company had guaranteed two leases which are excluded from the number above, and discussed in more detail below. During the year ended June 30, 2017, the lessee on one of the leases in which the Company served as guarantor defaulted, and under the terms of the guarantee, the obligation was assigned to the Company. Since the default occurred, the Company has taken steps to exit this facility and entered into an agreement to sublet the space. Additionally, during the year ended June 30, 2017, the Company entered into a lease buyout agreement with the landlord on another guaranteed space to exit the lease early under the terms of the original lease (see Note 12, “Restructuring and Severance”).
In addition, the Company contractually guaranteeguarantees that certain schools under ourthe Company’s management will not have annual operating deficits and ourthe Company’s management fees from these schools may be reduced accordingly to cover any school operating deficits.
Other than these lease and operating deficit guarantees, we dothe Company did not have any off-balance sheet arrangements that have or are reasonably likely to have a current or future effect on ourthe Company’s financial condition, changes in financial condition, revenues or expenses, results of operations, liquidity, capital expenditures or capital resources.
12. Restructuring and Severance
12.In the third and fourth quarters of fiscal year 2017, the Company exited three facilities (which included the subleased facility above) that are currently under an operating lease, entered into a lease buyout agreement (discussed above) and reduced its workforce through involuntary terminations. The Company consolidated its corporate workforce by exiting its space in a building as well as two other facilities that were no longer being utilized. The workforce reduction was executed after an internal management review of resources required to meet the future business plans of the Company.
The present value of the remaining lease payments was calculated using a credit adjusted risk-free rate and estimated sublease rentals for each lease. The Company recorded an impairment of $5.3 million for the three leases. The current portion of the liability of $1.6 million, is included in accrued liabilities and the long-term portion of $3.7 million, is included in other long-term liabilities on the consolidated balance sheet. In addition to the lease impairment, the Company accelerated the useful life of each lease’s property and equipment to the cease-use date and recorded accelerated depreciation of $1.4 million. The Company also wrote off the deferred rent and the liability for tenant improvements associated with each lease which resulted in income of $1.9 million. The $4.8 million net impact of these actions is recorded in selling, administrative, and other operating expenses in the consolidated statements of operations. Additionally, the lease buyout was $0.7 million and is included in instructional costs and services in the consolidated statements of operations. There were no similar charges recorded during the years ended June 30, 2016 or 2015.
The Company reduced its workforce during the year ended June 30, 2017 and recorded salary-related severance of $3.4 million. During the years ended June 30, 2016 and 2015, the Company recorded salary-related severance of $1.7 million and $1.5 million, respectively.
13. Acquisitions and Investments
In January 2011, the Company invested $10.0 million to obtain a 20% minority interest in Web International Education Group, Ltd. ("Web"(“Web”), a provider of English language learning centers in cities throughout China. From January 2011 through May 2013, the Company recorded its investment in Web as an available for sale debt security because of the ability to put the investment to other Web shareholders in return for the original $10.0 million investment plus interest. The Company'sCompany’s option to purchase no less than 51% of Web expired on March 31, 2013 and on May 6, 2013, the Company exercised its right to put its investment back to Web for return of its original $10.0 million investment plus interest of 8%, which Web was contractually required to be paidpay by May 31, 2014, as amended. The Company reclassified this $10.0 million investment, plus accrued interest of $2.8 million to a receivable, which is includedrecording it in other current assets.
The receivable is dueCompany accrued interest up through December 31, 2014. Given the difficulties in expatriating money from China, the Company discontinued the accrual of interest and continues to accruewrote off the interest while Web works to administratively process the payment.accrued during fiscal year 2015. During the fourth quarter of fiscal 2017, the Company entered into a contract with a third-party investor to sell its investment in Web, however, the agreement was terminated subsequent to year endedend due to nonperformance. Accordingly, at June 30, 2014 and June 30, 2013,2017, the Company recorded interestan impairment of $10.0 million in the consolidated statement of operations. The Company continues to work with Web, and to the extent it collects in a subsequent period, the Company will record the amount collected in other income of $0.8 million and $2.0 million, respectively, associated with Web.in the period received.
On September 11, 2013, the Company issued a mortgage note ("Mortgage"(“Mortgage”) lending $2.1 million to a managed school partner (“Partner”). The note bore interest at a fixed rate of 5.25% per year with a five year maturity and it was secured by the underlying property. During fiscal year 2016, the borrower defaulted on the loan payment, and in March 2017, the Company received the deed of ownership to the property.
As of March 31, 2017, the Company decided to dispose of the property and classified it as an asset held for sale, and included it in other current assets on the consolidated balance sheet. During the third quarter of fiscal year 2017, management approved a plan to sell, and began actively marketing the property. The Company reduced the property’s estimated carrying value to $1.2 million, resulting in an impairment loss of $0.6 million, which was included in selling, administrative and other operating expenses on the consolidated statements of operations. As of June 30, 2017, the Company continues to market the property and determined that there had been no change to its estimated carrying value.
During the years ended June 30, 2016 and 2015, the Company conducted an appraisal of the property to assess its market value. At June 30, 2016, the estimated market value had declined below the note’s carrying value, resulting in an impairment loss of $0.2 million. There was no impairment loss during the year ended June 30, 2015.
Acquisition of LearnBop, Inc.
On July 31, 2014, the Company acquired a majority interest in LearnBop, Inc., for $6.5 million in cash in return for a 51% interest in LearnBop. The purpose of the acquisition is to complement the Company’s K-12 math curriculum as LearnBop has developed an adaptive math curriculum learning software. As part of this transaction, the non-controlling shareholders have a non-transferable put right, which is exercisable between July 31, 2018 and December 31, 2018 for the remaining minority interest. The price of the put right will be determined based on the trailing twelve month revenue and contribution margin as defined in the Stockholders’ Agreement between the Company and LearnBop. Additionally, the Company has a non-transferable call option for the remaining minority interest at a price of $3.0 million, which becomes exercisable January 1, 2019 or thereafter. Acquisition costs incurred by the Company related to this transaction included in selling, administrative and other operating expenses were $0.1 million.
Acquisition of LTS Education Systems
On April 21, 2016, the Company completed its acquisition of Disguise the Learning, Inc. dba LTS Education Systems (“LTS”), a provider of personalized, digital game–based online learning solutions. With its acquisition of LTS, the Company aims to expand its online courses offerings in math, reading, english language arts, science and history.
The total purchase price consideration for this acquisition was $23.1 million, which consisted primarily of cash of $20.2 million and $2.9 million of contingent consideration (earn–out liability), of which $21.0 million was allocated to goodwill, $4.6 million to acquired intangible assets and $2.5 million to net liabilities assumed. The customer relationships and developed technology have estimated lives of seven and four years, respectively; while the other intangible assets have estimated lives ranging from two to five years. The goodwill is not deductible for income tax purposes. Acquisition costs incurred by the Company related to this transaction included in selling, administrative and other operating expenses were $0.4 million. The acquisition of LTS was not significant to the Company’s results of operations.
During the year ended June 30, 2017, the Company made its final adjustments to the purchase price of LTS which included a $0.1 million escrow refund resulting from the final working capital adjustment which was recorded as a reduction to goodwill.
The following table summarizes the fair values of considerations paid and identifiable assets acquired and liabilities assumed for LTS as of the date of acquisition, after the Company’s final purchase price adjustments (in millions):
| | |
Acquisition consideration: | June 30, 2017 |
Cash | $ | 20.2 |
Fair value of contingent consideration (earn-out liability) | | 2.9 |
Total consideration transferred | $ | 23.1 |
Identifiable assets acquired and liabilities assumed: | | |
Customer relationships | $ | 1.9 |
Developed technology | | 1.7 |
Other intangible assets | | 1.0 |
Goodwill | | 21.0 |
Deferred tax | | (2.6) |
Other net assets | | 0.1 |
The contingent consideration included in the table above represents the fair value of additional consideration payable to the seller, estimated using a discounted cash flow method. Consideration is to be distributed on the eighteen month and thirty month anniversaries of the closing date, and is contingent on the future performance of two key contracts. Each contract is to be assessed independently with an aggregate potential payment of $3.0 million. Performance metrics are based on the year-over-year maintenance of a total aggregate contract value in excess of 51%, with a greater than 90% success rate ensuring full payment.
14. Related Party Transactions
At June 30, 2017 and 2016, the Company had loaned a total of $4.0 million to MIL in accordance with the terms of the original joint venture agreement. The loan was repayable under terms and conditions specified in the loan agreement. The loan balance and related interest are eliminated since MIL is consolidated in the Company’s financial statements.
On September 11, 2013, the Company issued a mortgage note (“Mortgage”) lending $2.1 million to a managed school partner. The note bearsbore interest at a fixed rate of 5.25% per year and has a term of five years. Monthly principal and interest payments began in October 2013 with a final balloon payment of $1.8 million at the term of the loan. The Mortgage is primarilyfive year maturity date and it was secured by the underlying property.
The Mortgage and ancillary documents include customary affirmative and financial covenants for secured transactions of this type. The Company has recorded this as a held to maturity investment and During fiscal year 2016, the current amounts are included in other current assets while the non-current amounts are included in deposits and other assetsborrower defaulted on the balance sheet.
Acquisition of Assets from Kaplan Virtual Educationloan payment, and Insight Schools, Inc.
On July 1, 2011,in March 2017, the Company acquired certain assetsreceived the deed of Kaplan Virtual Education ("Kaplan/Insight Assets")ownership to the property. See Note 13, “Acquisitions and Investments – Investment in School Mortgage.”
During the years ended June 30, 2017 and 2016, the Company contributed $0.5 million and $0.7 million, respectively to The Foundation for $12.6 million.Blended and Online Learning (“Foundation”). The Kaplan/Insight Assets included contracts to serve nine virtual charter schools throughout the United States that have been integrated into the Company's existing operations. The acquisitionFoundation is a related party as an executive officer of the Kaplan/Insight assets had an immaterial pro forma impactCompany serves on 2011 results. The majoritythe Board of the purchase price has been allocated to goodwill and intangible assets for $6.7 million and $4.3 million, respectively.
Table of Contents
K12 Inc.
Notes to Consolidated Financial Statements (Continued)
13. Sale and Deconsolidation of Assets
On June 11, 2014, the Company sold an asset group comprised of certain domestic and international business and assets including Capital Education a post-secondary education product, a brick and mortar school named the International School of Berne, and the Company's 60% interest in the Middle East Joint Venture ("Middle East JV") to Safanad Education Ventures Limited ("Safanad"). Safanad is an affiliate of Safanad Limited, our former partner in the Middle East JV. There was no retained interest in the disposed businesses and, as a result of the loss of control in the sale, the Company deconsolidated the assets recording a non-operating gain of approximately $6.4 million. In aggregate, these businessesFoundation. No contributions were responsible for $16.9 million in revenue formade during the year ended June 30, 2014.2015.
As part of the transaction, the Company entered into a services agreement to license, host and provide other related services to use its curriculum and technology for education services in limited territories and markets as defined by the agreement. In addition, the Company entered into a Transition Services Agreement (TSA) with Safanad to provide various administrative and support services.
14. Related Party Transactions
For the years ended June 30, 2014, 2013 and 2012, the Company purchased services and assets in the amount of zero, $0.2 million, and $0.6 million, respectively, from Knowledge Universe Technologies ("KUT") pursuant to a Transition Services Agreement related to the Company's acquisition of KCDL. KUT is an affiliate of Learning Group, LLC, which was a related party until September 2013.
In 2012, in accordance with the original terms of the joint venture agreement, the Company loaned $3.0 million to its 60% owned joint venture, Middlebury Interactive Language. In September 2013, the Company loaned the remaining $1.0 million available for borrowing under a loan agreement ("Loan Agreement") between the Company and Middlebury Interactive Languages. The loan is repayable under terms and conditions specified in the Loan Agreement. The loan balance and related interest are eliminated since Middlebury Interactive Language is consolidated in the Company's financial statements; however, repayment of the loan is dependent on the continued liquidity of Middlebury Interactive Language.
On September 11, 2013, the Company issued a mortgage note ("Mortgage") lending $2.1 million to a managed school partner. The note bears interest at a fixed rate of 5.25% per year and has a term of five years. Monthly principal and interest payments began in October 2013 with a final balloon payment of $1.8 million at the term of the loan. The Mortgage is primarily secured by the underlying property.
15. Employee Benefits
The Company maintains a 401(k) salary deferral plan (the "401(k) Plan"“401(k) Plan”) for its employees. Employees at least 18 years of age who have been employed for at least 30 days may voluntarily contribute up to 15% of their compensation to the 401(k) Plan on a pretax basis.basis, up to the maximum allowed by the Internal Revenue Service. The 401(k) Plan provides for a matching Company contribution of 25% of the first 4% of each participant's compensation, which begins following six months of service with full vesting after three years of service.participant’s compensation. The Company expensed $3.7$1.6 million, $2.6$1.5 million and $0.6$1.8 million during each of the years ended June 30, 2014, 20132017, 2016 and 2012,2015, respectively under the 401(k) Plan.
16. Supplemental Disclosure of Cash Flow Information
| | | | | | | | | | |
| | Year Ended June 30, | |
|---|
(In thousands)
| | 2014 | | 2013 | | 2012 | |
|---|
Cash paid for interest | | $ | 1,054 | | $ | 1,237 | | $ | 981 | |
| | | | | | | | |
| | | | | | | | | | | |
| | | | | | | | | | | |
| | | | | | | | |
Cash paid for taxes | | $ | 9,134 | | $ | 1,517 | | $ | 294 | |
| | | | | | | | |
| | | | | | | | | | | |
| | | | | | | | | | | |
| | | | | | | | |
Supplemental disclosure of non-cash investing and financing activities: | | | | | | | | | | |
Property and equipment financed by capital lease obligations | | $ | 24,132 | | $ | 24,703 | | $ | 27,209 | |
| | | | | | | | |
| | | | | | | | | | | |
| | | | | | | | | | | |
| | | | | | | | |
Business Combinations | | | | | | | | | | |
—Current Assets | | $ | — | | $ | — | | $ | 1,043 | |
| | | | | | | | |
| | | | | | | | | | | |
| | | | | | | | | | | |
| | | | | | | | |
—Property, equipment and software development costs | | $ | — | | $ | — | | $ | 1,941 | |
| | | | | | | | |
| | | | | | | | | | | |
| | | | | | | | | | | |
| | | | | | | | |
—Capitalized curriculum development costs | | $ | — | | $ | — | | $ | 1,000 | |
| | | | | | | | |
| | | | | | | | | | | |
| | | | | | | | | | | |
| | | | | | | | |
—Intangible assets | | $ | — | | $ | — | | $ | 3,115 | |
| | | | | | | | |
| | | | | | | | | | | |
| | | | | | | | | | | |
| | | | | | | | |
—Goodwill | | $ | — | | $ | — | | $ | 5,992 | |
| | | | | | | | |
| | | | | | | | | | | |
| | | | | | | | | | | |
| | | | | | | | |
—Deferred revenue | | $ | — | | $ | — | | $ | (405 | ) |
| | | | | | | | |
| | | | | | | | | | | |
| | | | | | | | | | | |
| | | | | | | | |
| | | | | | | | | |
| | Year Ended June 30, |
| | 2017 | | 2016 | | 2015 |
| | | | | | | | | |
Cash paid for interest | | $ | 750 | | $ | 790 | | $ | 1,051 |
| | | | | | | | | |
Cash paid for taxes | | $ | 8,052 | | $ | 1,125 | | $ | 19,390 |
| | | | | | | | | |
Supplemental disclosure of non-cash financing activities: | | | | | | | | | |
Property and equipment financed by capital lease obligations, including student peripherals | | $ | 14,469 | | $ | 10,878 | | $ | 14,654 |
| | | | | | | | | |
Business combinations: | | | | | | | | | |
Current assets | | $ | — | | $ | 419 | | $ | 27 |
Intangible assets | | | — | | | 4,600 | | | — |
Capitalized software development costs | | | — | | | — | | | 940 |
Goodwill | | | — | | | 21,054 | | | 8,101 |
Assumed liabilities | | | — | | | (5,780) | | | (50) |
Deferred revenue | | | — | | | (400) | | | (23) |
17. Common Stock Repurchases
On November 4, 2013, the Board of Directors authorized the repurchase of up to $75.0 million of the Company'sCompany’s outstanding common stock over a two year period. Any purchases under the buyback are dependent upon business and market conditions and other factors. The stock purchases are made from time to time and may be made through a variety of methods including open market purchases and trading plans that may be adopted in accordance with the Rule 10b5-110b‑18 of the Exchange Act. For fiscal yearThere were no stock repurchases during the years ended June 30, 2014, the Company paid approximately $48.5 million, respectively, in cash2017 and 2016.
Table of Contents
K12 Inc.
Notes to redeem 2,195,196 shares of common stock at an average price of $22.10 per share. At June 30, 2014, approximately $26.5 million remained authorized for repurchase.Consolidated Financial Statements (Continued)
18. Quarterly Results of Operations (Unaudited)
The unaudited consolidated interim financial information presented should be read in conjunction with other information included in the Company'sCompany’s consolidated financial statements. The following unaudited consolidated financial information reflects all adjustments necessary for the fair presentation of
Table of Contents
K12 Inc.
Notes to Consolidated Financial Statements (Continued)
18. Quarterly Results of Operations (Unaudited) (Continued)
the results of interim periods. The following tables set forth selected unaudited quarterly financial information for each of the Company'sCompany’s last eight quarters.
| | | | | | | | | | | | |
| | Fiscal 2017 |
| | Jun 30, | | Mar 31, | | Dec 31, | | Sep 30, |
| | 2017 (1) | | 2017 | | 2016 | | 2016 |
| | (In thousands) |
Consolidated Quarterly Statements of Operations | | | | | | | | | | | | |
Revenues | | $ | 215,758 | | $ | 222,533 | | $ | 221,090 | | $ | 229,138 |
Cost and expenses | | | | | | | | | | | | |
Instructional costs and services | | | 139,244 | | | 136,431 | | | 137,542 | | | 144,099 |
Selling, administrative and other operating expenses | | | 68,791 | | | 69,828 | | | 62,352 | | | 104,646 |
Product development expenses | | | 3,011 | | | 3,511 | | | 2,873 | | | 3,062 |
Total costs and expenses | | | 211,046 | | | 209,770 | | | 202,767 | | | 251,807 |
Income (loss) from operations | | | 4,712 | | | 12,763 | | | 18,323 | | | (22,669) |
Impairment of investment in Web International Education Group, Ltd. | | | (10,000) | | | — | | | — | | | — |
Interest income (expense), net | | | 561 | | | 641 | | | 264 | | | 342 |
Income (loss) before income taxes and noncontrolling interest | | | (4,727) | | | 13,404 | | | 18,587 | | | (22,327) |
Income tax benefit (expense) | | | (1,876) | | | (4,522) | | | (7,688) | | | 8,690 |
Net income (loss) | | | (6,603) | | | 8,882 | | | 10,899 | | | (13,637) |
Add net (income) loss attributable to noncontrolling interest | | | 120 | | | 233 | | | 753 | | | (196) |
Net income (loss) attributable to common stockholders | | $ | (6,483) | | $ | 9,115 | | $ | 11,652 | | $ | (13,833) |
Net income (loss) attributable to common stockholders per share: | | | | | | | | | | | | |
Basic | | $ | (0.17) | | $ | 0.24 | | $ | 0.31 | | $ | (0.36) |
Diluted | | $ | (0.17) | | $ | 0.23 | | $ | 0.30 | | $ | (0.36) |
Weighted average shares used in computing per share amounts: | | | | | | | | | | | | |
Basic | | | 38,757,312 | | | 38,376,984 | | | 38,104,909 | | | 37,938,705 |
Diluted | | | 38,757,312 | | | 39,328,127 | | | 39,007,276 | | | 37,938,705 |
| | | | | | | | | | | | | |
| | 2014 | |
|---|
| | Jun 30,
2014 | | Mar 31,
2014 | | Dec 31,
2013 | | Sep 30,
2013 | |
|---|
| | (In thousands)
| |
|---|
Consolidated Quarterly Statements of Operations | | | | | | | | | | | | | |
Revenues | | $ | 232,046 | | $ | 235,222 | | $ | 223,919 | | $ | 228,366 | |
Cost and expenses | | | | | | | | | | | | | |
Instructional costs and services | | | 142,053 | | | 140,592 | | | 153,672 | | | 132,902 | |
Selling, administrative and other operating expenses | | | 74,847 | | | 64,414 | | | 75,753 | | | 98,244 | |
Product development expenses | | | 2,303 | | | 2,831 | | | 3,402 | | | 5,684 | |
| | | | | | | | | | |
| | | | | | | | | | | | | | |
Total costs and expenses | | | 219,203 | | | 207,837 | | | 232,827 | | | 236,830 | |
| | | | | | | | | | |
| | | | | | | | | | | | | | |
Income from operations | | | 12,843 | | | 27,385 | | | (8,908 | ) | | (8,464 | ) |
Realized gain on sale of assets | | | 6,404 | | | — | | | — | | | — | |
Interest income (expense), net | | | 55 | | | (12 | ) | | (28 | ) | | (84 | ) |
| | | | | | | | | | |
| | | | | | | | | | | | | | |
Income before income tax expense and noncontrolling interest | | | 19,302 | | | 27,373 | | | (8,936 | ) | | (8,548 | ) |
Income tax expense | | | (7,349 | ) | | (11,861 | ) | | 4,685 | | | 3,450 | |
| | | | | | | | | | |
| | | | | | | | | | | | | | |
Net income | | | 11,953 | | | 15,512 | | | (4,251 | ) | | (5,098 | ) |
Add net loss attributable to noncontrolling interest | | | 403 | | | 437 | | | 586 | | | 58 | |
| | | | | | | | | | |
| | | | | | | | | | | | | | |
Net income attributable to common stockholders, including Series A stockholders | | $ | 12,356 | | $ | 15,949 | | $ | (3,665 | ) | $ | (5,040 | ) |
| | | | | | | | | | |
| | | | | | | | | | | | | | |
| | | | | | | | | | | | | | |
| | | | | | | | | | |
Net income attributable to common stockholders per share, excluding Series A stockholders: | | | | | | | | | | | | | |
Basic | | $ | 0.32 | | $ | 0.40 | | $ | (0.09 | ) | $ | (0.13 | ) |
| | | | | | | | | | |
| | | | | | | | | | | | | | |
| | | | | | | | | | | | | | |
| | | | | | | | | | |
Diluted | | $ | 0.32 | | $ | 0.40 | | $ | (0.09 | ) | $ | (0.13 | ) |
| | | | | | | | | | |
| | | | | | | | | | | | | | |
| | | | | | | | | | | | | | |
| | | | | | | | | | |
Weighted average shares used in computing per share amounts: | | | | | | | | | | | | | |
Basic | | | 38,540,464 | | | 39,596,798 | | | 39,977,228 | | | 37,868,928 | |
| | | | | | | | | | |
| | | | | | | | | | | | | | |
| | | | | | | | | | | | | | |
| | | | | | | | | | |
Diluted | | | 38,742,379 | | | 39,596,798 | | | 39,977,228 | | | 37,868,928 | |
| | | | | | | | | | |
| | | | | | | | | | | | | | |
| | | | | | | | | | | | | | |
| | | | | | | | | | |
Table of Contents
K12 Inc.
Notes to Consolidated Financial Statements (Continued)
18. Quarterly Results of Operations (Unaudited) (Continued)
| | | | | | | | | | | | |
| | Fiscal 2016 |
| | Jun 30, | | Mar 31, | | Dec 31, | | Sep 30, |
| | 2016 | | 2016 | | 2015 | | 2015 |
| | (In thousands) |
Consolidated Quarterly Statements of Operations | | | | | | | | | | | | |
Revenues | | $ | 221,319 | | $ | 221,340 | | $ | 208,811 | | $ | 221,230 |
Cost and expenses | | | | | | | | | | | | |
Instructional costs and services | | | 143,136 | | | 134,755 | | | 129,616 | | | 139,003 |
Selling, administrative and other operating expenses | | | 76,606 | | | 64,888 | | | 61,440 | | | 99,270 |
Product development expenses | | | 1,067 | | | 2,563 | | | 3,028 | | | 3,413 |
Total costs and expenses | | | 220,809 | | | 202,206 | | | 194,084 | | | 241,686 |
Income (loss) from operations | | | 510 | | | 19,134 | | | 14,727 | | | (20,456) |
Interest income (expense), net | | | (21) | | | (101) | | | (190) | | | (305) |
Income (loss) before income taxes and noncontrolling interest | | | 489 | | | 19,033 | | | 14,537 | | | (20,761) |
Income tax benefit (expense) | | | (822) | | | (5,368) | | | (6,653) | | | 8,097 |
Net income (loss) | | | (333) | | | 13,665 | | | 7,884 | | | (12,664) |
Add net (income) loss attributable to noncontrolling interest | | | (649) | | | 608 | | | 654 | | | (129) |
Net income (loss) attributable to common stockholders | | $ | (982) | | $ | 14,273 | | $ | 8,538 | | $ | (12,793) |
Net income (loss) attributable to common stockholders per share: | | | | | | | | | | | | |
Basic | | $ | (0.03) | | $ | 0.38 | | $ | 0.23 | | $ | (0.34) |
Diluted | | $ | (0.03) | | $ | 0.37 | | $ | 0.23 | | $ | (0.34) |
Weighted average shares used in computing per share amounts: | | | | | | | | | | | | |
Basic | | | 37,768,812 | | | 37,692,826 | | | 37,559,999 | | | 37,433,493 |
Diluted | | | 37,768,812 | | | 38,999,871 | | | 37,680,876 | | | 37,433,493 |
| | | | | | | | | | | | | |
| | 2013 | |
|---|
| | Jun 30,
2013 | | Mar 31,
2013 | | Dec 31,
2012 | | Sep 30,
2012 | |
|---|
| | (In thousands)
| |
|---|
Consolidated Quarterly Statements of Operations | | | | | | | | | | | | | |
Revenues | | $ | 203,087 | | $ | 218,009 | | $ | 206,028 | | $ | 221,096 | |
Cost and expenses | | | | | | | | | | | | | |
Instructional costs and services | | | 129,192 | | | 127,759 | | | 122,799 | | | 118,648 | |
Selling, administrative and other operating expenses | | | 66,206 | | | 65,828 | | | 61,379 | | | 89,619 | |
Product development expenses | | | 6,268 | | | 5,070 | | | 5,578 | | | 4,168 | |
| | | | | | | | | | |
| | | | | | | | | | | | | | |
Total costs and expenses | | | 201,666 | | | 198,657 | | | 189,756 | | | 212,435 | |
| | | | | | | | | | |
| | | | | | | | | | | | | | |
Income from operations | | | 1,421 | | | 19,352 | | | 16,272 | | | 8,661 | |
Interest income (expense), net | | | 1,657 | | | (306 | ) | | (272 | ) | | (228 | ) |
| | | | | | | | | | |
| | | | | | | | | | | | | | |
Income before income tax expense and noncontrolling interest | | | 3,078 | | | 19,046 | | | 16,000 | | | 8,433 | |
Income tax expense | | | (1,828 | ) | | (7,626 | ) | | (6,680 | ) | | (3,889 | ) |
| | | | | | | | | | |
| | | | | | | | | | | | | | |
Net income | | | 1,250 | | | 11,420 | | | 9,320 | | | 4,544 | |
Add net loss attributable to noncontrolling interest | | | 1,018 | | | 555 | | | 191 | | | (187 | ) |
| | | | | | | | | | |
| | | | | | | | | | | | | | |
Net income attributable to common stockholders, including Series A stockholders | | $ | 2,268 | | $ | 11,975 | | $ | 9,511 | | $ | 4,357 | |
| | | | | | | | | | |
| | | | | | | | | | | | | | |
| | | | | | | | | | | | | | |
| | | | | | | | | | |
Net income attributable to common stockholders per share, excluding Series A stockholders*: | | | | | | | | | | | | | |
Basic | | $ | 0.06 | | $ | 0.31 | | $ | 0.24 | | $ | 0.11 | |
| | | | | | | | | | |
| | | | | | | | | | | | | | |
| | | | | | | | | | | | | | |
| | | | | | | | | | |
Diluted | | $ | 0.06 | | $ | 0.31 | | $ | 0.24 | | $ | 0.11 | |
| | | | | | | | | | |
| | | | | | | | | | | | | | |
| | | | | | | | | | | | | | |
| | | | | | | | | | |
Weighted average shares used in computing per share amounts: | | | | | | | | | | | | | |
Basic | | | 36,642,685 | | | 36,283,353 | | | 36,118,519 | | | 36,029,252 | |
| | | | | | | | | | |
| | | | | | | | | | | | | | |
| | | | | | | | | | | | | | |
| | | | | | | | | | |
Diluted | | | 39,475,382 | | | 39,033,353 | | | 38,868,519 | | | 38,779,252 | |
| | | | | | | | | | |
| | | | | | | | | | | | | | |
| | | | | | | | | | | | | | |
| | | | | | | | | | |
113
*Includes the effect of rounding
SCHEDULE II
SCHEDULE II
K12 INC
INC.
VALUATION AND QUALIFYING ACCOUNTS
YEARS ENDED
Years Ending June 30, 2014, 20132017, 2016 and 20122015
1.ALLOWANCE FOR DOUBTFUL ACCOUNTS
| | | | | | | | | | | | | |
| | Balance at
Beginning
of Period | | Additions
Charged to
Cost and
Expenses | | Deductions
from
Allowance | | Balance at
End of Period | |
|---|
June 30, 2014 | | $ | 2,560,207 | | | 1,438,964 | | | 539,243 | | $ | 3,459,928 | |
June 30, 2013 | | $ | 1,623,974 | | | 2,070,033 | | | 1,133,800 | | $ | 2,560,207 | |
June 30, 2012 | | $ | 1,777,481 | | | 204,386 | | | 357,893 | | $ | 1,623,974 | |
| | | | | | | | | | |
| | | | | Additions | | | | | |
| | Balance at | | Charged to | | Deductions | | | |
| | Beginning | | Cost and | | from | | Balance at |
| | of Period | | Expenses | | Allowance | | End of Period |
June 30, 2017 | | $ | 10,813,394 | | 4,512,899 | | 535,122 | | $ | 14,791,171 |
June 30, 2016 | | $ | 9,657,092 | | 4,609,720 | | 3,453,418 | | $ | 10,813,394 |
June 30, 2015 | | $ | 3,459,928 | | 9,299,766 | | 3,102,602 | | $ | 9,657,092 |
2.INVENTORY RESERVERESERVES
| | | | | | | | | | | | | |
| | Balance at
Beginning
of Period | | Charged to
Cost and
Expenses | | Deductions,
Shrinkage and
Obsolescence | | Balance at
End of Period | |
|---|
June 30, 2014 | | $ | 4,893,783 | | | 4,292,974 | | | 130,615 | | $ | 9,056,142 | |
June 30, 2013 | | $ | 4,506,981 | | | 386,802 | | | — | | $ | 4,893,783 | |
June 30, 2012 | | $ | 2,916,659 | | | 1,617,623 | | | 27,301 | | $ | 4,506,981 | |
| | | | | | | | | | |
| | Balance at | | Charged to | | Deductions, | | | |
| | Beginning | | Cost and | | Shrinkage and | | Balance at |
| | of Period | | Expenses | | Obsolescence | | End of Period |
June 30, 2017 | | $ | 2,642,547 | | 475,218 | | 807,456 | | $ | 2,310,309 |
June 30, 2016 | | $ | 2,192,234 | | 691,407 | | 241,094 | | $ | 2,642,547 |
June 30, 2015 | | $ | 9,056,142 | | 1,405,988 | | 8,269,896 | | $ | 2,192,234 |
3.COMPUTER RESERVE(1)RESERVE (1)
| | | | | | | | | | |
| | | | | | | | | | |
| | | | | Additions | | | | | |
| | Balance at | | Charged to | | Deductions, | | | |
| | Beginning | | Cost and | | Shrinkage and | | Balance at |
| | of Period | | Expenses | | Obsolescence | | End of Period |
June 30, 2017 | | $ | 573,444 | | 595,876 | | 350,278 | | $ | 819,042 |
June 30, 2016 | | $ | 1,032,253 | | 89,064 | | 547,873 | | $ | 573,444 |
June 30, 2015 | | $ | 1,462,424 | | 379,030 | | 809,201 | | $ | 1,032,253 |
| | | | | | | | | | | | | |
| | Balance at
Beginning
of Period | | Additions
(Deductions)
Charged to
Cost and
Expenses | | Deductions,
Shrinkage and
Obsolescence | | Balance at
End of Period | |
|---|
June 30, 2014 | | $ | 1,988,400 | | | 1,862,553 | | | 2,388,529 | | $ | 1,462,424 | |
June 30, 2013 | | $ | 1,507,299 | | | 482,188 | | | 1,087 | | $ | 1,988,400 | |
June 30, 2012 | | $ | 1,063,285 | | | 1,038,132 | | | 594,118 | | $ | 1,507,299 | |
(1)A reserve account is maintained against potential shrinkage and obsolescence for computers provided to the Company's students. The reserve is calculated based upon several factors including historical percentages, the net book value and the remaining useful life. During fiscal years 2014, 2013 and 2012, certain computers were written off against the reserve.
| (1) | | A reserve account is maintained against potential obsolescence of, and damage beyond economic repair to, computers provided to the Company’s students. The reserve is calculated based upon several factors including historical percentages, the net book value and the remaining useful life. During fiscal years 2017, 2016 and 2015, certain computers were written off against the reserve. |
4.INCOME TAX VALUATION ALLOWANCE
| | | | | | | | | | |
| | | | | Additions to | | Deductions in | | | |
| | Balance at | | Net Deferred | | Net Deferred | | | |
| | Beginning | | Tax Asset | | Tax Asset | | Balance at |
| | of Period | | Allowance | | Allowance | | End of Period |
June 30, 2017 | | $ | 4,338,653 | | 3,296,617 | | 482,410 | | $ | 7,152,860 |
June 30, 2016 | | $ | 2,791,033 | | 1,594,174 | | 46,554 | | $ | 4,338,653 |
June 30, 2015 | | $ | 1,968,482 | | 1,352,231 | | 529,680 | | $ | 2,791,033 |
| | | | | | | | | | | | | |
| | Balance at
Beginning
of Period | | Additions to
Net Deferred
Tax Assets
Allowance | | Deductions in
Net Deferred
Tax Asset
Allowance | | Balance at
End of Period | |
|---|
June 30, 2014 | | $ | 1,268,966 | | | 699,516 | | | — | | $ | 1,968,482 | |
June 30, 2013 | | $ | 1,065,829 | | | 203,137 | | | — | | $ | 1,268,966 | |
June 30, 2012 | | $ | 915,945 | | | 149,884 | | | — | | $ | 1,065,829 | |
ITEM 9. CHANGES IN AND DISAGREEMENTS WITH ACCOUNTANTS ON ACCOUNTING AND FINANCIAL DISCLOSURE
None.
ITEM 9A. CONTROLS AND PROCEDURES
Evaluation of Disclosure Controls and Procedures
As required by Rules 13a-15 and 15d-1513a‑15(d) under the Securities Exchange Act of 1934, as amended) (the "Exchange Act"“Exchange Act”) management has evaluated, with the participation of our Chief Executive Officer and Chief Financial Officer, the effectiveness of our disclosure controls and procedures as of the end of the period covered by this report. Disclosure controls and procedures refer to controls and other procedures designed to ensure that information required to be disclosed in the reports the Company files or submits under the Exchange Act is recorded, processed, summarized and reported, within the time periods specified in the rules and forms of the Securities and Exchange Commission. Disclosure controls and procedures include, without limitation, controls and procedures designed to ensure that information required to be disclosed by us in our reports that the Company files or submits under the Exchange Act is accumulated and communicated to management, including our Chief Executive Officer and Chief Financial Officer, as appropriate to allow timely decisions regarding our required disclosure. In designing and evaluating our disclosure controls and procedures, management recognizes that any controls and procedures, no matter how well designed and operated, can provide only reasonable assurance of achieving the desired control objectives, and management necessarily applies its judgment in evaluating and implementing possible controls and procedures. Based on the evaluation of our disclosure controls and procedures as of June 30, 2014,2017, our Chief Executive Officer and Chief Financial Officer concluded that, as of such date, our disclosure controls and procedures were effective.
Management'sManagement’s Annual Report on Internal Control over Financial Reporting
Management is responsible for establishing and maintaining adequate internal control over financial reporting.
Internal control over financial reporting refers to a process designed by, or under the supervision of, our Chief Executive Officer and Chief Financial Officer and effected by our board of directors, management and other personnel, to provide reasonable assurance regarding the reliability of financial reporting and the preparation of financial statements for external purposes in accordance with generally accepted accounting principles and includes those policies and procedures that:
•pertain to the maintenance of records that in reasonable detail accurately and fairly reflect the transactions and dispositions of our assets;
•provide reasonable assurance that transactions are recorded as necessary to permit preparation of financial statements in accordance with generally accepted accounting principles, and that our receipts and expenditures are being made only in accordance with authorizations of our management and members of our board of directors; and
•provide reasonable assurance regarding prevention or timely detection of unauthorized acquisition, use, or disposition of our assets that could have a material effect on our financial statements.
| · | | pertain to the maintenance of records that in reasonable detail accurately and fairly reflect the transactions and dispositions of our assets; |
| · | | provide reasonable assurance that transactions are recorded as necessary to permit preparation of financial statements in accordance with generally accepted accounting principles, and that our receipts and expenditures are being made only in accordance with authorizations of our management and members of our board of directors; and |
| · | | provide reasonable assurance regarding prevention or timely detection of unauthorized acquisition, use, or disposition of our assets that could have a material effect on our financial statements. |
Internal control over financial reporting cannot provide absolute assurance of achieving financial reporting objectives because of inherent limitations. Internal control over financial reporting is a process that involves human diligence and compliance and is subject to lapses in judgment and breakdowns resulting from human failures. Internal control over financial reporting also can be circumvented by collusion or improper override. Because of such limitations, there is a risk that material misstatements may not be prevented or detected on a timely basis by internal control over financial reporting. However, these
Table of Contents
inherent limitations are known features of the financial reporting process, and it is possible to design into the process safeguards to reduce, though not eliminate, this risk.
Management evaluated the effectiveness of our internal control over financial reporting as of June 30, 20142017 using the framework set forth in the report of the Treadway Commission'sCommission’s Committee of Sponsoring Organizations (COSO), "Internal“Internal Control—Integrated Framework (1992)(2013)."” As a result of management'smanagement’s evaluation of our internal control over
financial reporting, management concluded that as of June 30, 2014,2017, our internal control over financial reporting was effective. The effectiveness of our internal control over financial reporting as of June 30, 20142017 has been audited by BDO USA, LLP, an independent registered public accounting firm, as stated in its report which appears on the subsequent page 123 of this Annual Report on Form 10-K.10‑K.
Changes in Internal Control over Financial Reporting:
In addition, management carried out an evaluation, as required by Rule 13a-15(d)13a‑15(d) of the Exchange Act, under supervision of the Chief Executive Officer and Chief Financial Officer, of changes in the Company'sCompany’s internal control over financial reporting. Based on this evaluation, the Chief Executive Officer and Chief Financial Officer concluded that there were no changes in the Company'sCompany’s internal control over financial reporting that occurred during the last fiscal yearquarter that have materially affected, or are reasonably likely to materially affect, the Company'sCompany’s internal control over financial reporting.
Report of Independent Registered Public Accounting Firm
Board of Directors and Stockholders
K12 Inc.
Herndon, Virginia
We have audited K12 Inc. and subsidiaries'subsidiaries’ (the Company) internal control over financial reporting as of June 30, 2014,2017, based on criteria established in Internal Control—Control – Integrated Framework (1992)(2013) issued by the Committee of Sponsoring Organizations of the Treadway Commission (the COSO criteria). K12 Inc. and subsidiaries'subsidiaries’ management is responsible for maintaining effective internal control over financial reporting and for its assessment of the effectiveness of internal control over financial reporting, included in the accompanying "Item“Item 9A, Management's AnnualManagement’s Report on Internal Control Over Financial Reporting"Reporting”. Our responsibility is to express an opinion on the Company'scompany’s internal control over financial reporting based on our audit.
We conducted our audit in accordance with the standards of the Public Company Accounting Oversight Board (United States). Those standards require that we plan and perform the audit to obtain reasonable assurance about whether effective internal control over financial reporting was maintained in all material respects. Our audit included obtaining an understanding of internal control over financial reporting, assessing the risk that a material weakness exists, and testing and evaluating the design and operating effectiveness of internal control based on the assessed risk. Our audit also included performing such other procedures as we considered necessary in the circumstances. We believe that our audit provides a reasonable basis for our opinion.
A company'scompany’s internal control over financial reporting is a process designed to provide reasonable assurance regarding the reliability of financial reporting and the preparation of financial statements for external purposes in accordance with generally accepted accounting principles. A company'scompany’s internal control over financial reporting includes those policies and procedures that (1) pertain to the maintenance of records that, in reasonable detail, accurately and fairly reflect the transactions and dispositions of the assets of the company; (2) provide reasonable assurance that transactions are recorded as necessary to permit preparation of financial statements in accordance with generally accepted accounting principles, and that receipts and expenditures of the company are being made only in accordance with authorizations of management and directors of the company; and (3) provide reasonable assurance regarding prevention or timely detection of unauthorized acquisition, use, or disposition of the company'scompany’s assets that could have a material effect on the financial statements.
Because of its inherent limitations, internal control over financial reporting may not prevent or detect misstatements. Also, projections of any evaluation of effectiveness to future periods are subject to the risk that controls may become inadequate because of changes in conditions, or that the degree of compliance with the policies or procedures may deteriorate.
In our opinion, K12 Inc. and subsidiaries maintained, in all material respects, effective internal control over financial reporting as of June 30, 2014,2017, based on the COSO criteria.criteria.
We also have audited, in accordance with the standards of the Public Company Accounting Oversight Board (United States), the consolidated balance sheets of K12 Inc. and subsidiaries as of June 30, 20142017 and 20132016, and the related consolidated statements of operations, comprehensive income, stockholders'stockholders’ equity, and cash flows for each of the three years in the period ended June 30, 20142017 and our report dated August 15, 20149, 2017, expressed an unqualified opinion thereon.
| | |
| | /s/ BDO USA, LLP |
Bethesda, Maryland |
|
|
August 15, 2014 | | |
McLean, Virginia
August 9, 2017
ITEM 9B. OTHER INFORMATION
NoneNone.
PART III
We will file a definitive Proxy Statement for our 20142017 Annual Meeting of Stockholders (the "20142017 Proxy Statement"Statement”) with the SEC, pursuant to Regulation 14A of the Exchange Act, not later than 120 days after the end of our fiscal year. Accordingly, certain information required by Part III has been omitted under General Instruction G(3) to Form 10-K.10‑K. Only those sections of the 20142017 Proxy Statement that specifically address the items set forth herein are incorporated by reference.
ITEM 10. DIRECTORS, EXECUTIVE OFFICERS AND CORPORATE GOVERNANCE
The information required by Item 10 is hereby incorporated by reference to our 20142017 Proxy Statement under the captions "Election“Proposal 1: Election of Directors"Directors” and "Section“Section 16(a) Beneficial Ownership Reporting Compliance."”
ITEM 11. EXECUTIVE COMPENSATION
The information required by Item 11 is hereby incorporated by reference to our 20142017 Proxy Statement under the captions "Executive Compensation"“Compensation Discussion and "Director Compensation."Analysis” and “Director Compensation for Fiscal 2017.”
ITEM 12. SECURITY OWNERSHIP OF CERTAIN BENEFICIAL OWNERS, MANAGEMENT AND RELATED STOCKHOLDER MATTERS
The information required by Item 12 is hereby incorporated by reference to our 20142017 Proxy Statement under the caption "Security“Security Ownership of Certain Beneficial Owners and Management."”
ITEM 13. CERTAIN RELATIONSHIPS, RELATED TRANSACTIONS AND DIRECTOR INDEPENDENCE
The information required by Item 13 is hereby incorporated by reference to our 20142017 Proxy Statement under the captions "Certain Transactions"“Certain Relationships and "DirectorRelated‑Party Transactions” and “Director Independence."”
ITEM 14. PRINCIPAL ACCOUNTING FEES AND SERVICES
The information required by Item 14 is hereby incorporated by reference to our 20142017 Proxy Statement under the caption "Independent“Fees Paid to Independent Registered Public Accounting Firm Fees."Firm.”
PART IV
ITEM 15. EXHIBITS AND FINANCIAL STATEMENT SCHEDULES
(a)
- (1) Financial Statements.
The information required by this item is incorporated herein by reference to the financial statements and notes thereto listed in Item 8 of Part II and included in this Annual Report.
(a)
- (2) Financial Statement Schedules.
Except for Schedule II which was presented separately, all financial statement schedules are omitted because the required information is included in the financial statements and notes thereto listed in Item 8 of Part II and included in this Annual Report.
The following exhibits are incorporated by reference or filed herewith.
See Exhibit Index
ITEM 16. 10-K SUMMARY
None.
SIGNATURES
Pursuant to the requirements of Section 13 or 15(d) of the Securities Exchange Act of 1934, as amended, the registrant has duly caused this report to be signed on its behalf by the undersigned, thereunto duly authorized.
August 9, 2017 | | | | | | K12 INC. |
| | K12 INC. |
|
By: |
By: |
|
/s/ NATHANIEL A. DAVIS
Stuart J. Udell |
| | | | Name: | | Nathaniel A. Davis Stuart J. Udell |
| | | | Title: | | Chief Executive Officer |
| | | | August 15, 20149, 2017 |
POWER OF ATTORNEY
Know all persons by these presents, that each person whose signature appears below constitutes and appoints Nathaniel A. Davis,Stuart J. Udell, James J. Rhyu and Howard D. Polsky, and each of them severally, his or her true and lawful attorney-in-factattorney‑in‑fact with power of substitution and resubstitution to sign in his or her name, place and stead, in any and all capacities, to do any and all things and execute any and all instruments that such attorney may deem necessary or advisable under the Securities Exchange Act of 1934, as amended, and any rules, regulations and requirements of the U.S. Securities and Exchange Commission in connection with the Annual Report on Form 10-K10‑K and any and all amendments hereto, as fully for all intents and purposes as he or she might or could do in person, and hereby ratifies and confirms all said attorneys-in-factattorneys‑in‑fact and agents, each acting alone, and his or her substitute or substitutes, may lawfully do or cause to be done by virtue hereof.
Pursuant to the requirements of the Securities Exchange Act of 1934, as amended, this report has been signed below by the following persons on behalf of the registrant and in the capacities and on the dates indicated.
Signature | | Title | | Date |
| | | | |
/s/ STUART J. UDELL | | Chief Executive Officer (Principal Executive Officer) | | August 9, 2017 |
Stuart J. Udell | | | |
| | | | |
/s/ JAMES J. RHYU | | Chief Financial Officer (Principal Financial Officer and Principal Accounting Officer) | | August 9, 2017 |
James J. Rhyu | | | |
| | | | |
/s/ NATHANIEL A. DAVIS | | Executive Chairman of the Board of Directors | | August 9, 2017 |
Nathaniel A. Davis | | | |
| | | | |
/s/ AIDA M. ALVAREZ | | Director | | August 9, 2017 |
Aida M. Alvarez | | | |
| | | | |
/s/ CRAIG R. BARRETT | | Director | | August 9, 2017 |
Craig R. Barrett | | | |
| | | | |
/s/ GUILLERMO BRON | | Director | | August 9, 2017 |
Guillermo Bron | | | |
| | | | �� |
/s/ KEVIN P. CHAVOUS | | Director | | August 9, 2017 |
Kevin P. Chavous | | | |
| | | | |
/s/ JOHN M. ENGLER | | Director | | August 9, 2017 |
John M. Engler | | | |
| | | | |
/s/ STEVEN B. FINK | | Director | | August 9, 2017 |
Steven B. Fink | | | |
| | | | |
/s/ LIZA McFADDEN | | Director | | August 9, 2017 |
Liza McFadden | | | |
| | | | |
/s/ Jon Q. Reynolds | | Director | | August 9, 2017 |
Jon Q. Reynolds | | | |
| | | | |
/s/ Andrew H. Tisch | | Director | | August 9, 2017 |
Andrew H. Tisch | | | |
| | | | |
Signature
| | Title
| | Date
|
|---|
|
|
|
|
|
/s/ NATHANIEL A. DAVIS
Nathaniel A. Davis | | Chief Executive Officer
(Principal Executive Officer) | | August 15, 2014 |
/s/ JAMES J. RHYU
James J. Rhyu |
|
Chief Financial Officer
(Principal Financial Officer) |
|
August 15, 2014 |
/s/ CRAIG R. BARRETT
Craig R. Barrett |
|
Director |
|
August 15, 2014 |
/s/ GUILLERMO BRON
Guillermo Bron |
|
Director |
|
August 15, 2014 |
Table of Contents
| | | | |
Signature
| | Title
| | Date
|
|---|
|
|
|
|
|
/s/ FREDDA J. CASSELL
Fredda J. Cassell | | Director | | August 15, 2014 |
/s/ ADAM L. COHN
Adam L. Cohn |
|
Director |
|
August 15, 2014 |
/s/ JOHN M. ENGLER
John M. Engler |
|
Director |
|
August 15, 2014 |
/s/ STEVEN B. FINK
Steven B. Fink |
|
Director |
|
August 15, 2014 |
/s/ MARY H. FUTRELL
Mary H. Futrell |
|
Director |
|
August 15, 2014 |
/s/ JON Q. REYNOLDS
Jon Q. Reynolds |
|
Director |
|
August 15, 2014 |
/s/ ANDREW H. TISCH
Andrew H. Tisch |
|
Director |
|
August 15, 2014 |
Table of Contents
Exhibit Index
| | | |
| Exhibit No. | | | | Description of Exhibit |
|---|
| 3.1 | | ThirdFourth Amended and Restated Certificate of Incorporation of K12 Inc. (incorporated by reference to Exhibit 3.1 to the Registrant'sRegistrant’s Quarterly Report on Form 10-Q10‑Q for the quarter ended December 31, 2007)2016, filed with the SEC on January 27, 2017, File No. 001‑33883). |
| | | |
| 3.2 | | Second Amended and Restated Bylaws of K12 Inc. (incorporated by reference to Exhibit 3.2 to the Registrant's Quarterly Report on Form 10-Q for the quarter ended December 31, 2007). |
| | | |
| 3.3 | | Amendment to the Amended and Restated Bylaws of K12 Inc. dated November 21, 2013 (incorporated by reference to Exhibit 3.1 to the Registrant's Form 8-K filed on November 27, 2013). |
| | | |
| 3.4 | | Certificate of Designations, Preferences and Relative and Other Special Rights of Series A Special Stock (incorporated by reference to Exhibit 3.1 to the Registrant'sRegistrant’s Current Report on Form 8-K8‑K, filed with the SEC on July 26, 2010)February 9, 2016, File No. 001‑33883). |
| | | |
| 4.1 | | Form of stock certificate of common stock (incorporated by reference to Exhibit 4.1 to the Registrant'sRegistrant’s Amendment No. 4 to Registration Statement on Form S-1,S‑1, filed with the SEC on November 8, 2007, File No. 333-144894)333‑144894). |
4.2* | | | Form of Stock Option Agreement under the 2016 Incentive Award Plan. |
4.3* | 4.2 | *Form of Restricted Stock Award Agreement under the 2016 Incentive Award Plan. |
4.4* | Amended and Restated Stock Option | K12 Inc. 2016 Incentive Award Plan and Amendment thereto (incorporated by reference to Exhibit 4.2 to the Registrant's RegistrationRegistrant’s Post-Effective Amendment to Form S-8, filed on March 22, 2017, File No. 333-213033. |
| | |
4.5* | | K12 Inc. 2007 Equity Incentive Award Plan, as amended (incorporated by reference to Appendix A to the Registrant’s Definitive Proxy Statement on Form S-1,Schedule 14A, filed on October 28, 2015, File No. 333-144894)001‑33883). |
4.6* | | | |
| 4.3 | * | Form of Stock Option Contract—EmployeeIndemnification Agreement for Non‑Management Directors and for Officers of K12 Inc. (incorporated by reference to Exhibit 4.310.1 to the Registrant's Registration StatementRegistrant’s Quarterly Report on Form S-1,10‑Q for the quarter ended September 30, 2008, filed with the SEC on November 14, 2008, File No. 333-144894)001‑33883). |
| 4.7 | | | |
| 4.4 | | Form of Stock Option Contract—DirectorDirector’s Indemnification Agreement (incorporated by reference to Exhibit 4.410.1 to the Registrant's Registration StatementRegistrant’s Current Report on Form S-1,8‑K filed with the SEC on October 22, 2008, File No. 333-144894)001‑33883). |
| 4.8 | | | |
| 4.5 | | Form of Second Amended and Restated Stockholders Agreement (incorporated by reference to Exhibit 4.5 to the Registrant'sRegistrant’s Registration Statement on Form S-1,S‑1, filed with the SEC on July 27, 2007, File No. 333-144894)333‑144894). |
10.1* | | | Amendment to Amended and Restated Stock Option Agreement, dated December 23, 2010 (incorporated by reference to Exhibit 10.1 to the Registrant’s Quarterly Report on Form 10‑Q for the quarter ended December 31, 2010, filed with the SEC on February 9, 2011, File No. 001‑33883). |
10.2* | 4.6 | *Employment Agreement for Nathaniel A. Davis, effective January 7, 2013 (incorporated by reference to Exhibit 10.3 to the Registrant’s Quarterly Report on Form 10‑Q for the quarter ended December 31, 2012, filed with the SEC on February 5, 2013, File No. 001‑33883). |
10.3* | K12 Inc. | First Amendment to Employment Agreement for Nathaniel A. Davis, effective January 7, 2013 (incorporated by reference to Exhibit 10.28 to the Registrant’s Annual Report on Form 10‑K for the year ended June 30, 2013, filed with the SEC on August 29, 2013, File No. 001‑33883). |
10.4* | | Amended and Restated Employment Agreement for Nathaniel A. Davis, effective March 10, 2014 (incorporated by reference to Exhibit 10.1 to the Registrant’s Quarterly Report on Form 10‑Q for the quarter ended March 31, 2014, filed with the SEC on April 29, 2014, File No. 001‑33883). |
| 10.5 | | Second Amended and Restated Employment Agreement of Nathaniel A. Davis, dated January 27, 2016. (incorporated by reference to Exhibit 10.1 to the Registrant’s Quarterly Report on Form 10‑Q for the quarter ended December 31, 2015, filed with the SEC on January 28, 2016, File No. 001‑33883). |
| 10.6 | | Employment Agreement of Stuart J. Udell (“Agreement”), dated January 7, 2016. (incorporated by reference to Exhibit 10.2 to the Registrant’s Quarterly Report on Form 10‑Q for the quarter ended December 31, 2015, filed with the SEC on January 28, 2016, File No. 001‑33883). |
| 10.8 | | Form of Performance Share Unit Agreement under the 2016 Incentive Award Plan. |
| 10.9 | | Form of Performance Share Unit Agreement under the 2007 Equity Incentive Award Plan, as amended and filed herewith. |
| | | |
| 4.7 | * | K12 Inc. 2007 Employee Stock Purchase Plan (incorporated by reference to Exhibit 4.910.3 to the Registrant'sRegistrant’s Quarterly Report on Form 10‑Q for the quarter ended September 30, 2015, filed with the SEC on October 27, 2015, File No. 001‑33883). |
10.10* | | Employment Agreement of James J. Rhyu, dated May 1, 2013 (incorporated by reference to Exhibit 10.29 to the Registrant’s Annual Report on Form 10‑K for the year ended June 30, 2013, filed with the SEC on August 29, 2013, File No. 001‑33883). |
10.11* | | Employment Agreement of Howard D. Polsky, dated June 1, 2004 (incorporated by reference to Exhibit 10.16 to the Registrant’s Amendment No. 1 to Registration Statement on Form S‑1, filed with the SEC on September 26, 2007, File No. 333‑144894). |
10.12* | | First Amendment to Employment Agreement of Howard D. Polsky, dated July 1, 2007 (incorporated by reference to Exhibit 10.18 to the Registrant’s Amendment No. 4 to Registration Statement on Form S-1,S‑1, filed with the SEC on November 8, 2007, File No. 333-144894)333‑144894). |
| | |
Exhibit No. | | | Description of Exhibit |
10.13* | 4.8 | * | Form of Indemnification Agreement for Non-Management Directors and for Officers of K12 Inc. (incorporated by reference to Exhibit 10.1 to the Registrant's Quarterly Report on Form 10-Q for the quarter ended September 30, 2008). |
| | | |
| 4.9 | | Form of Director's IndemnificationExecutive Change in Control Severance Agreement (incorporated by reference to Exhibit 10.1 to the Registrant'sRegistrant’s Current Report on Form 8-K, filed with the SEC on October 22, 2008)31, 2016, File No. 001‑33883). |
| 10.14 | | | |
| 10.1 | *^ | Amended and Restated Stock Option Agreement of Ronald J. Packard dated as of July 12, 2007 (incorporated by reference to Exhibit 10.5 to the Registrant's Amendment No. 6 to Registration Statement on Form S-1, File No. 333-144894). |
| | | |
| 10.2 | | Deed of Lease by and between ACP/2300 Corporate Park Owner,Drive, LLC and K12 Inc., dated December 7, 2005 (incorporated by reference to Exhibit 10.13 to the Registrant'sRegistrant’s Amendment No. 1 to Registration Statement on Form S-1,S‑1, filed with the SEC on September 26, 2007, File No. 333-144894)333‑144894). |
| 10.15 | | | |
| 10.3 | * | Employment Agreement of Howard D. Polsky (incorporated by reference to Exhibit 10.16 to the Registrant's Amendment No. 1 to Registration Statement on Form S-1, File No. 333-144894). |
| | | |
| 10.4 | *^ | Stock Option Agreement between K12 Inc. and Ronald J. Packard dated as of July 12, 2007 (incorporated by reference to Exhibit 10.17 to the Registrant's Amendment No. 6 to Registration Statement on Form S-1, File No. 333-144894). |
|
| | |
Table of Contents
| | | |
Exhibit No. | | Description of Exhibit |
|---|
| 10.5 | * | First Amendment to Employment Agreement of Howard D. Polsky (incorporated by reference to Exhibit 10.18 to the Registrant's Amendment No. 4 to Registration Statement on Form S-1, File No. 333-144894). |
| | | |
| 10.6 | | First Amendment to Deed of Lease by and between ACP/2300 Corporate Park Owner, LLC and K12 Inc., dated as of November 30, 2006 (incorporated by reference to Exhibit 10.21 to the Registrant'sRegistrant’s Annual Report on Form 10-K10‑K for the year ended June 30, 2008)2008, filed with the SEC on September 26, 2008, File No. 001‑33883). |
| 10.16 | | | |
| 10.7 | | Second Amendment to Deed of Lease by and between ACP/2300 Corporate Park Owner, LLC and K12 Inc., dated as of March 26, 2007 (incorporated by reference to Exhibit 10.22 to the Registrant'sRegistrant’s Annual Report on Form 10-K10‑K for the year ended June 30, 2008). |
| | | |
| 10.8 | | Stockholders Agreement by and among K12 Inc., KCDL Holdings LLC, Learning Group LLC, Learning Group Partners, Knowledge Industries LLC, and Cornerstone Financial Group LLC (incorporated by reference to Exhibit 4.2 to the Registrant's Current Report on Form 8-K2008, filed with the SEC on October 6, 2010)September 26, 2008, File No. 001‑33883). |
| | | |
| 10.9 | * | Amendment to Amended and Restated Stock Option Agreement (incorporated by reference to Exhibit 10.1 to the Registrant's Quarterly Report on Form 10-Q for the quarter ended December 31, 2010). |
| | | |
| 10.10 | * | Employment Agreement of Timothy L. Murray (incorporated by reference to Exhibit 10.1 to the Registrant's Quarterly Report on Form 10-Q for the quarter ended March 31, 2012). |
| | | |
| 10.11 | * | Amended and Restated Employment Agreement for Ronald J. Packard dated January 7, 2013 (incorporated by reference to Exhibit 10.2 to the Registrant's Quarterly Report on Form 10-Q for the quarter ended December 31, 2012). |
| | | |
| 10.12 | | Educational and Products Services Agreement between the Agora Cyber Charter School and K12 Virtual Schools LLC, dated as of November 13, 2009 (incorporated by reference to Exhibit 10.1 to the Registrant's Quarterly Report on Form 10-Q for the quarter ended March 31, 2013). |
| | | |
| 10.13 | | First Amendment to the Educational and Products Services Agreement between the Agora Cyber Charter School and K12 Virtual Schools LLC, dated as of April 8, 2010 (incorporated by reference to Exhibit 10.2 to the Registrant's Quarterly Report on Form 10-Q for the quarter ended March 31, 2013). |
| | | |
| 10.14 | * | First Amendment to Amended and Restated Employment Agreement for Ronald J. Packard, effective April, 29, 2013(incorporated by reference to Exhibit 10.3 to the Registrant's Quarterly Report on Form 10-Q for the quarter ended March 31, 2013). |
| 10.15 | | Second Amended and Restated Educational Products, and Administrative, and Technology Services Agreement between the Ohio Virtual Academy and K12 Ohio L.L.C (incorporated by reference to Exhibit 10.21 to Amendment No. 4 to the Registrant's Registration Statement on Form S-1 filed with the Securities and Exchange Commission on November 8, 2007). |
| | | |
| 10.16 | * | Employment Agreement for Nathaniel A. Davis effective as of January 7, 2013 (incorporated by reference to Exhibit 10.3 to the Registrant's Quarterly Report on Form 10-Q for the quarter ended December 31, 2012). |
| | | |
| 10.17 | * | First Amendment to Employment Agreement for Nathaniel A. Davis effective as of January 7, 2013 (incorporated by reference to Exhibit 10.28 to the Registrant's Annual Report on Form 10-K for the year ended June 30, 2013). |
| | | |
| 10.18 | * | Employment Agreement of James J. Rhyu dated May 1, 2013 (incorporated by reference to Exhibit 10.29 to the Registrant's Annual Report on Form 10-K for the year ended June 30, 2013).
|
Table of Contents
| | | |
Exhibit No. | | Description of Exhibit |
|---|
| | | |
| 10.19 | * | Amended and Restated Employment Agreement for Nathaniel A. Davis effective as of March 10, 2014 (incorporated by reference to Exhibit 10.1 to the Registrant's Quarterly Report on Form 10-Q for the quarter ended March 31, 2014). |
| | | |
| 10.20 | * | First Amendment to Employment Agreement of Timothy L. Murray effective as of December 19, 2013 (incorporated by reference to Exhibit 10.1 to the Registrant's Quarterly Report on Form 10-Q for the quarter ended December 31, 2013). |
| | | |
| 10.21 | * | Credit Agreement, dated January 31, 2014, by and among K12 Inc., certain of K12'sK12’s subsidiaries, Bank of America, N.A., and the other lenders party thereto (incorporated by reference to Exhibit 10.2 to the Registrant'sRegistrant’s Quarterly Report on Form 10-Q10‑Q for the quarter ended December 31, 2013)2013, filed with the SEC on February 4, 2014, File No. 001‑33883). |
10.18* | | | Form of Stock Option Agreement under the 2007 Equity Incentive Award Plan, as amended (incorporated by reference to Exhibit 10.18 to the Registrant’s Annual Report on Form 10‑K for the year ended June 30, 2015, filed with the SEC on August 4, 2015, File No. 001‑33883). |
10.19* | | Form of Restricted Stock Award Agreement under the 2007 Equity Incentive Award Plan, as amended (incorporated by reference to Exhibit 10.19 to the Registrant’s Annual Report on Form 10‑K for the year ended June 30, 2015, filed with the SEC on August 4, 2015, File No. 001‑33883). |
| 21.1 | | Subsidiaries of K12 Inc. |
| | | |
| 23.1 | | Consent of BDO USA, LLP. |
| | | |
| 24.1 | | Power of Attorney (included in signature pages). |
| | | |
| 31.1 | | Certification of Principal Executive Officer Required Under Rule 13a-14(a)13a‑14(a) of the Securities Exchange Act of 1934, as amended. |
| | | |
| 31.2 | | Certification of Principal Financial Officer Required Under Rule 13a-14(a)13a‑14(a) of the Securities Exchange Act of 1934, as amended. |
| | | |
| 32.1 | | Certification of Principal Executive Officer Required Under Rule 13a-14(b)13a‑14(b) of the Securities Exchange Act of 1934, as amended, and 18 U.S.C. Section 1350. |
| | | |
| 32.2 | | Certification of Principal Financial Officer Required Under Rule 13a-14(b)13a‑14(b) of the Securities Exchange Act of 1934, as amended, and 18 U.S.C. Section 1350. |
| 99.1 | † | | Third Amended and Restated Educational Products and Administrative, and Technology Services Agreement between the Ohio Virtual Academy and K12 Virtual Schools L.L.C., dated July 1, 2017. |
101.INS# | 101.INS | | XBRL Instance Document |
101.SCH# | | | |
| 101.SCH | | XBRL Taxonomy Extension Schema |
101.CAL# | | | |
| 101.CAL | | XBRL Taxonomy Extension Calculation |
101.LAB# | | | |
| 101.LAB | | XBRL Taxonomy Extension Labels |
101.PRE# | | | |
| 101.PRE | | XBRL Taxonomy Extension Presentation |
101.DEF# | | | |
| 101.DEF | | XBRL Taxonomy Extension Definition
|
*
- Denotes management compensation plan or arrangement.
^Confidential treatment has been granted with respect to certain portions of this exhibit. A complete copy of the document, including the redacted portions, has been filed separately with the SEC.
#Pursuant#Pursuant to Rule 406T of Regulation S-T,S‑T, the Interactive Data Files included in Exhibit 101 hereto are deemed not filed or part of a registration statement or prospectus for purposes of Sections 11 or 12 of the Securities Act of 1933, as amended, are deemed not filed for purposes of Section 18 of the Securities Exchange Act of 1934, as amended, and otherwise are not subject to liability under those Sections.
†Confidential treatment requested with the Securities and Exchange Commission as to certain portions. Confidential materials omitted and filed separately with the Securities and Exchange Commission.