Use these links to rapidly review the document
Table of ContentsITEM 8. Financial Statements Table of ContentsITEM 15. Financial Statements Table of ContentsPART IV
UNITED STATES
SECURITIES AND EXCHANGE COMMISSION
Washington, D.C. 20549
FORM 10-K
| (Mark One) | ||
ý | ANNUAL REPORT PURSUANT TO SECTION 13 OR 15(d) OF THE SECURITIES EXCHANGE ACT OF 1934 | |
For the fiscal year ended October 31, | ||
Or | ||
o | TRANSITION REPORT PURSUANT TO SECTION 13 OR 15(d) OF THE SECURITIES EXCHANGE ACT OF 1934 | |
For the transition period from to | ||
Commission file number 1-4423 | ||
HEWLETT-PACKARD COMPANYHP INC.
(Exact name of registrant as specified in its charter)
| Delaware | 94-1081436 | |
| (State or other jurisdiction of incorporation or organization) | (I.R.S. employer identification no.) | |
94304 | ||
| (Address of principal executive offices) | (Zip code) | |
Registrant's telephone number, including area code:(650) 857-1501 | ||
Securities registered pursuant to Section 12(b) of the Act: | ||
Title of each class | Name of each exchange on which registered | |
|---|---|---|
| Common stock, par value $0.01 per share | New York Stock Exchange | |
Securities registered pursuant to Section 12(g) of the Act: None | ||
Indicate by check mark if the registrant is a well-known seasoned issuer as defined in Rule 405 of the Securities Act. Yes ý No o
Indicate by check mark if the registrant is not required to file reports pursuant to Section 13 or Section 15(d) of the Act. Yes o No ý
Indicate by check mark whether the registrant (1) has filed all reports required to be filed by Section 13 or 15(d) of the Securities Exchange Act of 1934 during the preceding 12 months (or for such shorter period that the registrant was required to file such reports), and (2) has been subject to such filing requirements for the past 90 days. Yes ý No o
Indicate by check mark whether the registrant has submitted electronically and posted on its corporate Web site, if any, every Interactive Data File required to be submitted and posted pursuant to Rule 405 of Regulation S-T during the preceding 12 months (or for such shorter period that the registrant was required to submit and post such files). Yes ý No o
Indicate by check mark if disclosure of delinquent filers pursuant to Item 405 of Regulation S-K is not contained herein, and will not be contained, to the best of registrant's knowledge, in definitive proxy or information statements incorporated by reference in Part III of this Form 10-K or any amendment to this Form 10-K.o
Indicate by check mark whether the registrant is a large accelerated filer, an accelerated filer, a non-accelerated filer, or a smaller reporting company. See the definitions of "large accelerated filer," "accelerated filer" and "smaller reporting company" in Rule 12b-2 of the Exchange Act. (Check one):
| Large accelerated filerý | Accelerated filero | Non-accelerated filero (Do not check if a smaller reporting company) | Smaller reporting companyo |
Indicate by check mark whether the registrant is a shell company (as defined in Rule 12b-2 of the Act). Yes o No ý
The aggregate market value of the registrant's common stock held by non-affiliates was $61,031,111,812$59,551,395,919 based on the last sale price of common stock on April 30, 2014.2015.
The number of shares of HP Inc. common stock outstanding as of November 30, 20142015 was 1,834,081,9931,791,848,366 shares.
| DOCUMENTS INCORPORATED BY REFERENCE | ||
|---|---|---|
DOCUMENT DESCRIPTION | 10-K PART | |
| Portions of the Registrant's proxy statement related to its | III | |
Hewlett-Packard CompanyHP INC. AND SUBSIDIARIES
Form 10-K
For the Fiscal Year Endedended October 31, 20142015
| | | Page | ||||
|---|---|---|---|---|---|---|
PART I | ||||||
Item 1. | Business | |||||
Item 1A. | Risk Factors | 18 | ||||
Item 1B. | Unresolved Staff Comments | |||||
Item 2. | Properties | |||||
Item 3. | Legal Proceedings | |||||
Item 4. | Mine Safety Disclosures | |||||
PART II | ||||||
Item 5. | Market for Registrant's Common Equity, Related Stockholder Matters and Issuer Purchases of Equity Securities | |||||
Item 6. | Selected Financial Data | |||||
Item 7. | Management's Discussion and Analysis of Financial Condition and Results of Operations | |||||
Item 7A. | Quantitative and Qualitative Disclosures about Market Risk | |||||
Item 8. | Financial Statements and Supplementary Data | |||||
Item 9. | Changes in and Disagreements with Accountants on Accounting and Financial Disclosure | |||||
Item 9A. | Controls and Procedures | |||||
Item 9B. | Other Information | |||||
PART III | ||||||
Item 10. | Directors, Executive Officers and Corporate Governance | |||||
Item 11. | Executive Compensation | |||||
Item 12. | Security Ownership of Certain Beneficial Owners and Management and Related Stockholder Matters | |||||
Item 13. | Certain Relationships and Related Transactions, and Director Independence | |||||
Item 14. | Principal Accounting Fees and Services | |||||
PART IV | ||||||
Item 15. | Exhibits and Financial Statement Schedules | |||||
In this report on Form 10-K, for all periods presented, "we", "us", "our", "company", "HP" and "HP Inc." refer to HP Inc. and subsidiaries (formerly Hewlett-Packard Company).
Forward-Looking Statements
This Annual Report on Form 10-K, including "Management's Discussion and Analysis of Financial Condition and Results of Operations" in Item 7, contains forward-looking statements that involve risks, uncertainties and assumptions. If the risks or uncertainties ever materialize or the assumptions prove incorrect, the results of Hewlett-Packard CompanyHP Inc. and its consolidated subsidiaries ("HP") may differ materially from those expressed or implied by such forward-looking statements and assumptions. All statements other than statements of historical fact are statements that could be deemed forward-looking statements, including but not limited to any projections of revenue, margins, expenses, effective tax rates, net earnings, net earnings per share, cash flows, benefit plan funding, deferred tax assets, share repurchases, currency exchange rates or other financial items; any projections of the amount, timing or impact of cost savings or restructuring charges; any statements of the plans, strategies and objectives of management for future operations, including, the previously announced separation transaction and the future performances of the post-separation companies if the separation is completed, as well as the execution of restructuring plans and any resulting cost savings, or revenue or profitability improvements; any statements concerning the expected development, performance, market share or competitive performance relating to products or services; any statements regarding current or future macroeconomic trends or events and the impact of those trends and events on HP and its financial performance; any statements regarding pending investigations, claims or disputes; any statements of expectation or belief; and any statements of assumptions underlying any of the foregoing. Risks, uncertainties and assumptions include the need to address the many challenges facing HP's businesses; the competitive pressures faced by HP's businesses; risks associated with executing HP's strategy, including the planned separation transaction; the impact of macroeconomic and geopolitical trends and events; the need to manage third-party suppliers and the distribution of HP's products and the delivery of HP's services effectively; the protection of HP's intellectual property assets, including intellectual property licensed from third parties; risks associated with HP's international operations; the development and transition of new products and services and the enhancement of existing products and services to meet customer needs and respond to emerging technological trends; the execution and performance of contracts by HP and its suppliers, customers, clients and partners; the hiring and retention of key employees; integration and other risks associated with business combination and investment transactions; the execution, timing and results of the separation transaction or restructuring plans, including estimates and assumptions related to the cost (including any possible disruption of HP's business) and the anticipated benefits of implementing the separation transaction and restructuring plans; the resolution of pending investigations, claims and disputes; and other risks that are described herein, including but not limited to the items discussed in "Risk Factors" in Item 1A of Part I of this report and that are otherwise described or updated from time to time in HP's Securities and Exchange Commission reports. HP assumes no obligation and does not intend to update these forward-looking statements.
Business Overview
We are a leading global provider of products, technologies, software, solutions and services to individual consumers, small- and medium-sized businesses ("SMBs") and large enterprises, including customers in the government, health and education sectors.
HP was incorporated in 1947 under the laws of the state of California as the successor to a partnership founded in 1939 by William R. Hewlett and David Packard. Effective in May 1998, we changed our state of incorporation from California to Delaware.
HP Separation Transaction
On November 1, 2015 (the "Distribution Date"), Hewlett-Packard Company completed the separation of Hewlett Packard Enterprise Company ("Hewlett Packard Enterprise"), Hewlett-Packard Company's former enterprise technology infrastructure, software, services and financing businesses (the "Separation"). In connection with the Separation, Hewlett-Packard Company changed its name to HP Inc. Accordingly, references to the "company" in this report refer to Hewlett-Packard Company with respect to events occurring on or prior to October 31, 2015, and to HP Inc. with respect to events occurring after October 31, 2015.
On November 1, 2015, each of our stockholders of record as of the close of business on October 21, 2015 (the "Record Date") received one share of Hewlett Packard Enterprise common stock for every one share of our common stock held as of the Record Date.
Hewlett Packard Enterprise is now an independent public company trading on the New York Stock Exchange ("NYSE") under the symbol "HPE". After the Separation, we do not beneficially own any shares of Hewlett Packard Enterprise common stock and beginning November 1, 2015, we no longer consolidate Hewlett Packard Enterprise within our financial results or reflect the financial results of Hewlett Packard Enterprise within our continuing results of operations.
The historical results of operations and the financial position of Hewlett Packard Enterprise are included in the consolidated financial statements of HP Inc. for each of the fiscal years included in this report and will be reported as discontinued operations beginning in the first quarter of fiscal 2016.
HP Products and Services; Segment Information
Our offerings span the following:
HP was incorporated in 1947 under the laws of the state of California as the successor to a partnership founded in 1939 by William R. Hewlett and David Packard. Effective in May 1998, we changed our state of incorporation from California to Delaware.
October 2014 Announcement of HP Separation Transaction
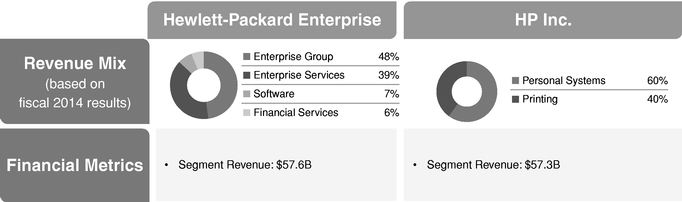
On October 6, 2014, we announced plans to separate into two independent publicly-traded companies: one comprising our enterprise technology infrastructure, software, services and financing businesses, which will conduct business as Hewlett-Packard Enterprise and one that will comprise our printing and personal systems businesses, which will conduct business as HP Inc. The separation is subject to certain conditions, including, among others, obtaining final approval from HP's Board of Directors, receipt of a favorable opinion and/or rulings with respect to the tax-free nature of the transaction for federal income tax purposes and the effectiveness of a Form 10 filing with the SEC. The separation is expected to be completed by the end of fiscal 2015. Under the separation plan, HP shareholders will own shares of both Hewlett-Packard Enterprise and HP Inc. The following chart provides an overview of the planned separation and segment revenues of the respective businesses based on HP's fiscal 2014 results, excluding Corporate Investments and intercompany eliminations.
HP Products and Services; Segment Information
We offer one of the IT industry's broadest portfolios of products and services that bring together infrastructure, software, and services through innovation to enable our customers to create value and solve business problems. As consumers and enterprises shift the way technology is created, delivered,
consumed and paid for, they are demanding a foundation that will support much greater agility, lower cost, facilitate quicker time-to-market, and provide a higher degree of accessibility by end-users to that technology. We design our solutions to provide that foundation, particularly in the areas of security, cloud, mobility and big data, by leveraging the breadth of our offerings and the strengths and capabilities of our individual business units.
Our operations are organized into seven business segments: Personal Systems; Printing; the Enterprise Group ("EG"); Enterprise Services ("ES"); Software; HP Financial Services ("HPFS"); and Corporate Investments. As a result of the Separation, effective November 1, 2015 EG, ES, Software, HPFS and certain parts of Corporate Investments are no longer reported in the continuing results of HP Inc. Personal Systems, Printing and the remaining parts of Corporate Investments segments will be HP Inc.'s reportable segments.
In each of the past three fiscal years, notebook personal computers ("PCs"), printing supplies, infrastructure technology outsourcing services, desktop PCs and industry standard servers ("ISS") each accounted for more than 10% of our consolidated net revenue.
The Personal Systems segment and the Printing segment are structured beneath a broader Printing and Personal Systems Group ("PPS"). While PPS is not a reportable segment, we may provide financial
data aggregating the Personal Systems and Printing segments to provide a supplementary view of its business.
A summary of our net revenue, earnings from operations and assets for our segments along with a description of our fiscal 20142015 organizational realignments can be found in Note 2 to the Consolidated Financial Statements in Item 8, which is incorporated herein by reference. A discussion of factors potentially affecting our operations is set forth in "Risk Factors" in Item 1A, which is incorporated herein by reference.
Printing and Personal Systems Group
The mission of PPS is to leverage the respective strengths of the Personal Systems segment and the Printing segment by creating a unified business that is customer-focused and poised to capitalize on rapidly shifting industry trends. Each of the business segments within PPS is described in detail below.
Personal Systems
Personal Systems provides commercial PCs, consumer PCs, workstations, thin client PCs, tablets, retail point-of-sale ("POS") systems, calculators and other related accessories, software, support and services for the commercial and consumer markets. We group commercial notebooks, commercial desktops, commercial tablets, workstations and thin clients into commercial clients and consumer notebooks consumer desktops and consumer tabletsdesktops into consumer clients when describing performance in these markets. Both commercial and consumer PCs and tablets are based predominately on the Microsoft Windows operating systemsystems and use processors from Intel Corporation ("Intel") and Advanced Micro Devices, Inc. ("AMD"). Personal Systems also maintains a multi-operating system, multi-architecture strategy using the Google Chrome and Android operating systems for notebooks and tablets, respectively.
Commercial PCs. Commercial PCs are optimized for use by customers including enterprise and SMB customers, and for connectivity, reliability and manageability in networked environments. Commercial PCs include the HP ProBook and HP EliteBook lines of notebooks and hybrids (detachable tablets), the HP Pro and HP Elite lines of business desktops and all-in-ones, retail POS systems, HP Thin Clients, HP ElitePad and HP Pro Tablet PCs. Commercial PCs also include workstations that are designed and optimized for high-performance and demanding application environments including Z desktop workstations, Z all-in-ones and Z mobile workstations.
Consumer PCs. Consumer PCs include the HP Spectre, HP ENVY, HP Pavilion, HP Chromebook, HP Split and HP Slate series of multi-media consumer notebooks, consumer tablets, hybrids and desktops, including the TouchSmart line of touch-enabled notebooks and all-in-one desktops.
Printing
Printing provides consumer and commercial printer hardware, supplies, media, software and services, as well as scanning devices. Printing is also focused on imaging solutions in the commercial markets. These solutions range from managed print services to areas such as industrial applications, outdoor signage and the graphic arts business. HP groups LaserJet, large format printers and commercial inkjet printers into Commercial Hardware and consumer and SMB inkjet printers into Consumer Hardware when describing performance in these markets.
LaserJet and Enterprise Solutions. LaserJet and Enterprise Solutions delivers LaserJet and enterprise products, services and solutions to the SMB and enterprise segments including LaserJet printers and supplies (toner), Officejet Pro X inkjet enterprise products and supplies, multi-function devices, scanners, web-connected hardware, managed services, and enterprise software solutions such as
Web Jetadmin. Managed Print Services provides printing equipment, supplies, support, workflow optimization and security features for SMB and enterprise customers around the world, utilizing proprietary HP tools and fleet management solutions, as well as third-party software.
Inkjet and Printing Solutions. Inkjet and Printing Solutions deliver consumer and SMB inkjet solutions (hardware, ink supplies, media, and web-connected hardware and services) and include single-function and all-in-one inkjet printers. Ongoing initiatives and programs, such as Ink in the Office and Ink Advantage, and newer initiatives, such as Instant Ink, are intended to provide innovative printing solutions to consumers and SMBs. Our Ink in the Office initiative is focused on providing high value inkjet printing solutions to SMBs through our Officejet Premium and Officejet Pro inkjet portfolios. Our Ink Advantage program aims to provide savings on the overall cost of printing in emerging markets. Instant Ink is an ink replacement service that allows customers to pay a monthly fee to print a specified number of pages per month.
Graphics Solutions. Graphics Solutions deliver large format printers (Designjet, Large Format Production and Scitex Industrial), specialty printing, digital press solutions (Indigo and Inkjet Webpress), supplies and services to print service providers and design and rendering customers. The solutions cover a wide range of printing applications such as technical design, photos, sign and display, direct mail, marketing collateral, labels and packaging, and publishing.
Software and Web Services. Software and Web Services delivers a suite of offerings, including photo-storage and printing offerings (such as Snapfish), document storage, entertainment services, web-connected printing, and PC back-up and related services.
Marketing Optimization. Marketing Optimization focuses on delivering solutions and software that help businesses engage audiences, reach new customer segments and markets and deliver compelling content across channels. The group provides solutions for augmented reality, contact center analytics, customer communications management and digital experience management.
Enterprise Group
EG provides a broad portfolio of enterprise technology solutions to address customer needs in building the foundation for the next generation of applications, web services and user experiences—which are only as rich, impactful and world-changing as the infrastructure solutions for a variety of operating environmentsplatforms that addressthey sit on. EG technology addresses a wide range of customer challenges, including the needsupporting new types of applications, new approaches to increase agilityIT operations, and accelerate innovation in ordernew demands and uses for insight, and managing new threats and risks. EG technology also allows customers to drivecapitalize on a wide range of trends and
opportunities, from servicing new segments and buying behaviors to inventing new consumption models and creating new revenue manage risk and lower costs. HP Helion, our enterprisestreams. EG technology infrastructuredelivers customer outcomes through its innovative, industry leading portfolio ofacross servers, storage, networking, management software, converged infrastructure solutions, and technology services. In today's rapidly changing technology landscape, customers face twin challenges when it comes to their infrastructure foundation: they must optimize their "traditional IT" to support existing applications, and they must simultaneously invest in "cloud-first, mobile-first" infrastructure that will support the next generation of applications, web services and user experiences. The EG portfolio delivers products and services across servers, storage and networking to reduce cost and continue high performance operations for traditional IT loads. For tomorrow's cloud-first, mobile first workloads, the EG portfolio provides products and services across converged solutions engineered for the world's most important workloads in cloud, mobility, infrastructure-as-a-service, and big data; HP OneView as the industry's only unified display software-defined infrastructure management solution; HP Helion cloud portfolio delivering a broad offering of hybrid cloud solutions, cloud services and cloud software; and technology services combined with HP's cloud services and software, allowsto advise customers on the right path to adopt a holistic approach to building a technology infrastructure that supportstransforming their current business and consumer demands and next generation applications and web services. HP's Converged Systems portfolio (servers, storage and networking) simplifies IT through quick deployment, intuitive management and system-level support. Optimizedenterprises for key workloads such as virtualization, cloud and big data, these complete, integrated solutions enable organizations of all sizes to efficiently utilize IT staffing resources and deploy applications faster.tomorrow's digital era.
Industry Standard Servers. Industry Standard ServersISS offers a range of products from entry-level servers through premium ProLiant servers, which run primarily Windows, Linux and virtualization platforms from software providers such as Microsoft Corporation ("Microsoft") and VMware, Inc. ("VMware"), and open source software from other major vendors while leveraging x86 processors from Intel and AMD. The business spans a range of server product lines, including microservers, towers, traditional rack, density-optimized rack and blades, solutions for large, distributed computing companies who buy and deploy nodes at a massive scale. Industry Standard ServersISS also offers HP Moonshot servers operating on ARM, AMD and Intel Atom-based processors which offer reduced cost, space, energy and complexity compared to traditional servers.
Business Critical Systems. Business Critical Systems delivers our mission-critical systems through a portfolio of HP Integrity servers based on the Intel Itanium processor that run the HP-UX and OpenVMS operating systems, as well as HP Integrity NonStop solutions and mission-critical x86 ProLiant servers.
Storage. Our storage offerings include platforms for enterprise and SMB environments. Our flagship product is the 3PAR StoreServ Storage Platform, which is designed for virtualization, cloud and IT-as-a-service. Traditional Storage solutions include tape, storage networking and legacy external disk products such as EVA and XP. Converged Storage solutions include 3PAR StoreServ, StoreOnce and StoreVirtual products. These offerings enable customers to optimize their existing storage systems, build new virtualization solutions and facilitate their transition to cloud computing.
Networking. Our networking offerings include switches, routers, wireless local area network ("WLAN") and network management products that deliver open, scalable, secure, agile and consistent solutions that span the data center, campus and branch environments and deliver software-defined networking and unified communications capabilities. Our unified wired and wireless networking offerings include both WLAN access points, controllers and switches. Our networking solutions are based on our FlexNetwork architecture, which is designed to enable simplified server virtualization, unified communications and multi-mediabusiness application delivery for the enterprise. Software-defined networking provides an end-to-end solution to automate the network from data center to campus and branch.
Technology Services. Technology Services provides support servicesSupport and technology consulting, focused on cloud, mobility and big data and provides IT organizations with advice, design, implementation, migration and optimization of EG's platforms: servers, storage, networking and converged infrastructure.Consulting services. Support services offerings span various levels of customer support needs and include: HP Foundation Care, our portfolio of reactive hardware and software support services; HP Proactive Care, which combines remote support technology for real-timereal time monitoring with rapid access to our technical experts; HP Datacenter Care, a comprehensive, and flexible capacity end-to-end support for HP and multi-vendor systems that enables customers to build, operate or consume IT in traditional, cloudprivate or hybrid cloud environments; and Lifecycle Event services, which are event-basedevent
based services, offering our technology expertise and consultingadvice for each phase of the technology life cycle. These services are available in the form of service contracts, pre-packaged offerings (HP Care Pack services) or on a customized basis. Consulting services are focused on cloud, mobility and big data and provide IT organizations with advice, design, implementation, migration and optimization of EG's platforms: servers, storage, networking and converged infrastructure.
Enterprise Services
ES provides technology consulting, outsourcing and support services across infrastructure, applications and business process domains.domains in traditional and Strategic Enterprise Services offerings which includes analytics and data management, security and cloud services. ES delivers toleverages our clients by leveraging investments in our consulting and support professionals, infrastructure technology, applications, standardized methodologies and global supply and delivery.delivery capabilities. ES also creates opportunities for us to sellmarket additional hardware and software by offering solutions that encompass bothleverage our other products and services.services in order to meet our clients' needs.
Infrastructure Technology Outsourcing. The Infrastructure Technology Outsourcing group delivers comprehensive services that streamline and help optimize our clients' technology infrastructure to efficiently enhance performance, reduce costs, mitigate risk and enable business change.optimization. These services encompass the management of data centers, IT security, cloud computing, workplace technology, networks, unified communications and enterprise service management. We also offer a set of managed services that provide a cross-section of our broader infrastructure services for smaller, discrete engagements.
Application and Business Services. The Application and Business Services portfolio helps our clients develop, revitalize and manage their applications and information assets. This fullOur complete application life cyclelifecycle approach encompasses application development, testing, modernization, system integration, maintenance and management for both packaged and custom-built applications and cloud offerings. TheOur Application and Business Services portfolio also includes intellectual property-based industry solutions, along with technologies and related services, all of which help our clients better manage their critical industry processes for customer relationship management, finance and administration, human resources, payroll and document processing.
Software
Software portfolio provides IT management,big data analytics and applications, enterprise security, application testing and delivery information management big data analytics, security intelligence and risk managementIT Operations Management solutions for businesses and other enterprises of all sizes. Our softwareSoftware offerings include licenses, support, professional services and software-as-a-service ("SaaS"). Described below are ourOur global business capabilities within Software.Software are described below.
Application Delivery Management Big Data. which is part of HP's IT management offerings, provides software that enables organizations to deliver high performance applications by automating and testing the processes required to ensure the quality and scalability of desktop, web, mobile and cloud-based applications.
Big Data group provides a full suite of software designed to help organizations capture, store, explore, govern,analyze, protect and serveshare information and insights that fundamentallywithin and outside their organizations to improve thebusiness outcomes, of businesseswhile also enabling them to manage risks and the environment, while managing risk and meetingmeet legal obligations. The group'sOur Big Data suite includes HP Vertica, the leading analytics platformdatabase technology for machine, structured and semi-structured data,data; HP IDOL, a unique analytics platformtool for human information from Autonomy,information; as well as market leading solutions for archiving, data protection, eDiscovery, information governance and Enterprise Content Management.
Enterprise Security software is designed to disrupt fraud, hackers and cyber criminals by scanning software and websites for security vulnerabilities, improving network defenses and providing real-time warning of threats as they emerge.
IT Operations Management which is part of HP's IT management offerings, provides software required to automate routine IT tasks and to pinpoint IT problems when they occur, helping enterprises to reduce operational costs and improve the reliability of applications running in a traditional, cloud or hybrid environment.
Marketing Optimization focuses on delivering solutions that help businesses engage audiences, reach new customer segments and markets and deliver compellingenterprise content across channels. The group provides solutions for augmented reality, contact center analytics, customer communications management and digital experience management.
Software'sOur big data platform, HAVEn, providesHaven, brings these unique assets together for processing and understanding machine and sensor data, business data and unstructured human information. A growing ecosystem of customers, partners and developers use this platform to build big data driven analytic applications. Our Software segment also leverages HAVEn'sHaven's unique analytic assets to deliver market-leading, purpose-built solutions for a variety of markets, including application testing and delivery, big data analytics and applications, IT operations management, marketing optimizationOperations Management, and enterprise security. These solutions are designed for businesses and enterprises of all sizes, and are available via on-premises,on-premise, as well as via SaaS and hybrid delivery models. Software's HAVEnHaven big data platform and purpose-built applications are augmented by our support and professional services offerings in order to provide an end-to-end solution to customers.
Application Delivery Management. The Application Delivery Management group provides software that enables organizations to deliver high-performance applications, accelerating the application delivery lifecycle and automating the testing processes to ensure the quality and scalability of desktop, web, mobile and cloud-based applications.
Enterprise Security. Enterprise Security software is designed to disrupt fraud, hackers and cyber criminals by testing and scanning software and websites for security vulnerabilities, improving network defenses and security, implementing security controls, safeguarding data at rest, in motion and in use (regardless of where software and data reside), and providing security intelligence, analytics, and information management to identify threats and manage risk.
IT Operations Management. The IT Operations Management group provides the software required to automate routine IT tasks and to pinpoint IT problems as they occur, helping enterprises to reduce operational costs and improve the reliability of applications running in a traditional, cloud or hybrid environment.
HP Financial Services
HPFS provides flexible investment solutions for our customers, such as leasing, financing, IT consumption and utility programs and asset management services for customers to enable the creation ofthat facilitate unique technology deployment models and the acquisition of complete IT solutions, including hardware, software and services from HP and others. ProvidingIn order to provide flexible services and capabilities that support the entire IT lifecycle, HPFS partners with our customers globally to help build investment strategies that enhance their business agility and support their business transformation. HPFS offers a wide selection of investment solution capabilities for large enterprise customers and channel partners, along with an array of financial options to SMBs and educational and governmental entities.
Corporate Investments
Corporate Investments includes HP Labs, and certain cloud-relatedenterprise-related business incubation projects and venture focused minority investments, among others.
Sales, Marketing and Distribution
We manage our business and report our financial results based on the business segments described above. Our customers are organized by consumer and commercial groups, and purchases of HP products, solutions and services may be fulfilled directly by HP or indirectly through a variety of partners, including:
The mix of our business conducted by direct sales or channel differs substantially by business and region. We believe that customer buying patterns and different regional market conditions require us to tailor our sales, marketing and distribution efforts accordingly. We are focused on driving the depth and breadth of our coverage, in addition to identifying efficiencies and productivity gains, in both our direct and indirect businesses. While each of our business segments manages the execution of its own go-to-market and distribution strategy, our business segments also collaborate to ensure strategic and process alignment where appropriate. For example, we typically assign an account manager generally from EG or ES, to manage relationships across our business with large enterprise customers. The account manager is supported by a team of specialists with product and services expertise. For other customers and for consumers, PPS typically manages direct online sales as well as channel relationships with retailers, while our business segments collaborate to manage relationships with commercial resellers targeting SMBs where appropriate.
Manufacturing and Materials
We utilize a significant number of outsourced manufacturers ("OMs") around the world to manufacture HP-designed products. The use of OMs is intended to generate cost efficiencies and reduce time to market for HP-designed products. We use multiple OMs to maintain flexibility in our supply chain and manufacturing processes. In some circumstances, third-party OEMs produce products that we purchase and resell under the HP brand. In addition to our use of OMs, we currently manufacture a limited number of finished products from components and subassemblies that we acquire from a wide range of vendors.
We utilize two primary methods of fulfilling demand for products: building products to order and configuring products to order. We build products to order to maximize manufacturing and logistics efficiencies by producing high volumes of basic product configurations. Alternatively, configuring products to order enables units to match a customer's particular hardware and software customization requirements. Our inventory management and distribution practices in both building products to order and configuring products to order seek to minimize inventory holding periods by taking delivery of the inventory and manufacturing shortly before the sale or distribution of products to our customers.
We purchase materials, supplies and product subassemblies from a substantial number of vendors. For most of our products, we have existing alternate sources of supply or such alternate sources of supply are readily available. However, we do rely on sole sources for laser printer engines, LaserJet supplies, certain customized parts and parts for products with short life cycles (although some of these sources have operations in multiple locations in the event of a disruption). We are dependent upon Intel and AMD as suppliers of x86 processors and Microsoft for various software products; however, we believe that disruptions with these suppliers would result in industry-wide dislocations and therefore would not disproportionately disadvantage us relative to our competitors. See "Risk Factors—We depend on third-party suppliers, and our financial results could suffer if we fail to manage our suppliers properly,effectively," in Item 1A, which is incorporated herein by reference.
Like other participants in the IT industry, we ordinarily acquire materials and components through a combination of blanket and scheduled purchase orders to support our demand requirements for periods averaging 90 to 120 days. From time to time, we may experience significant price volatility or supply constraints for certain components that are not available from multiple sources. Frequently, we are able to obtain scarce components for somewhat higher prices on the open market, which may have an impact on our gross margin but does not generally disrupt production. We also may acquire component inventory in anticipation of supply constraints or enter into longer-term pricing
commitments with vendors to improve the priority, price and availability of supply.supplies. See "Risk Factors—We depend on third-party suppliers, and our financial results could suffer if we fail to manage our suppliers properly,effectively," in Item 1A, which is incorporated herein by reference.
International
Our products and services are available worldwide. We believe this geographic diversity allows us to meet demand on a worldwide basis for both consumer and enterprise customers, draws on business and technical expertise from a worldwide workforce, provides stability to our operations, provides revenue streams that may offset geographic economic trends and offers us an opportunity to access new markets for maturing products. In addition, we believe that future growth is dependent in part on our ability to develop products and sales models that target developing countries. In this regard, we believe that our broad geographic presence gives us a solid base on which to build such future growth.
A summary of our domestic and international net revenue and net property, plant and equipment is set forth in Note 2 to the Consolidated Financial Statements in Item 8, which is incorporated herein by reference. Approximately 65%64% of our overall net revenue in fiscal 20142015 came from outside the United States ("U.S.").
For a discussion of risks attendant to HP's international operations, see "Risk Factors—Due to the international nature of our business, political or economic changes or other factors could harm our future revenue, costs and expenses,business and financial condition,performance," in Item 1A, "Quantitative and Qualitative Disclosure about Market Risk," in Item 7A and Note 11 to the Consolidated Financial Statements in Item 8, which are incorporated herein by reference.
Research and Development
Innovation is a key element of our culture. Our development efforts are focused on designing and developing products, services and solutions that anticipate customers' changing needs and desires, and emerging technological trends. Our efforts also are focused on identifying the areas where we believe we can make a unique contribution and the areas where partnering with other leading technology companies will leverage our cost structure and maximize our customers' experiences.
HP Labs, together with the various research and development groups within our business segments, are responsible for our research and development efforts. HP Labs is part of our Corporate Investments segment.
Expenditures for research and development were $3.5 billion in fiscal 2015, $3.4 billion in fiscal 2014 and $3.1 billion in fiscal 2013 and $3.4 billion in fiscal 2012.2013. We anticipate that we will continue to have significant research and development expenditures in the future to support the design and development of innovative, high-quality products and services to maintain and enhance our competitive position.
For a discussion of risks attendant to our research and development activities, see "Risk Factors—If we cannot successfully execute on our go-to-market strategy and continue to develop, manufacture and market innovative products and services, our business and solutions that meet customer requirements for innovation and quality, our revenue and gross marginfinancial performance may suffer," in Item 1A, which is incorporated herein by reference.
Patents
Our general policy has been to seek patent protection for those inventions likely to be incorporated into our products and services or where obtaining such proprietary rights will improve our competitive position. At October 31, 2014,2015, our worldwide patent portfolio included over 34,00033,000 patents, which represents a slight decrease over the number of patents in our portfolio at the end of fiscal 2013 and fiscal 2012. This decrease is attributable, in part,2014. As a result of the Separation, approximately 15,000 patents were transferred to the saleHewlett Packard Enterprise beginning November 1, 2015.
Table of a portfolio of mobile computing intellectual property ("IP") in January 2014.Contents
Patents generally have a term of twenty years from the date they are filed. As our patent portfolio has been built over time, the remaining terms of the individual patents across our patent portfolio vary. We believe that our patents and patent applications are important for maintaining the competitive differentiation of our products and services, enhancing our freedom of action to sell our products and services in markets in which we choose to participate, and maximizing our return on research and development investments. No single patent is in itself essential to HP as a whole or to any of HP's business segments.
In addition to developing our patent portfolio, we license IPintellectual property ("IP") from third parties as we deem appropriate. We have also granted and continue to grant to others licenses, and other rights, under our patents when we consider these arrangements to be in our interest. These license arrangements include a number of cross-licenses with third parties.
For a discussion of risks attendant to IP rights, see "Risk Factors—Our revenue, cost of sales, and expensesfinancial performance may suffer if we cannot continue to develop, license or enforce the IPintellectual property rights on which our business depends or if third parties assert that we violate their IP rights,businesses depend," in Item 1A, which is incorporated herein by reference.
Backlog
We believe that backlog is not a meaningful indicator of future business prospects due to our diverse products and services portfolio, including the large volume of products delivered from finished goods or channel partner inventories and the shortening of product life cycles. Therefore, we believe that backlog information is not material to an understanding of our overall business.
Seasonality
General economic conditions have an impact on our business and financial results. From time to time, the markets in which we sell our products and services experience weak economic conditions that may negatively affect sales. We experience some seasonal trends in the sale of our products and services. For example, European sales are often weaker in the summer months and consumer sales are often stronger in the fourth calendar quarter. Demand during the spring and early summer months also may be adversely impacted by market anticipation of seasonal trends. See "Risk Factors—Our uneven sales cycle makes planning and inventory management difficult and future financial results less predictable," in Item 1A, which is incorporated herein by reference.
Competition
We encounter strong competition in all areas of our business activity. We compete primarily on the basis of technology, performance, price, quality, reliability, brand, reputation, distribution, range of products and services, ease of use of our products, account relationships, customer training, service and support, security, availability of application software and internet infrastructure offerings.
The markets for each of our business segments are characterized by strong competition among major corporations with long-established positions and a large number of new and rapidly growing firms. Most product life cycles are short, and to remain competitive we must develop new products and services, periodically enhance our existing products and services and compete effectively on the basis of the factors listed above. In addition, we compete with many of our current and potential partners, including OEMs that design, manufacture and often market their products under their own brand names. Our successful management of these competitive partner relationships will be critical to our future success. Moreover, we anticipate that we will have to continue to adjust prices on many of our products and services to stay competitive.
We have a broad technology portfolio spanning personal computing and other access devices, imaging and printing-related products and services, enterprise IT infrastructure products and solutions,
multi-vendor customer services and IT management software and solutions. We are the leader or among the leaders in each of our business segments.
The competitive environments in which each segment operates are described below:
Personal Systems. The markets in which Personal Systems operates are highly competitive and are characterized by price competition and inventory obsolescence.competition. The decline in the PC market and the ongoing shift among customers to mobility products has further intensified competition in the PC market. Our primary competitors are Lenovo Group Limited ("Lenovo"), Dell Inc. ("Dell"), Acer Inc., ASUSTeK Computer Inc., Apple Inc., Toshiba Corporation and Samsung Electronics Co., Ltd. ("Samsung"). In particular regions, we also experience competition from local companies and from generically-branded or "white box" manufacturers. Our competitive advantages include our broad product portfolio, our innovation and research and development capabilities, our brand and procurement leverage, our ability to cross-sell our portfolio of offerings, our extensive service and support offerings and the accessibility of our products through a broad-based distribution strategy from retail and commercial channels to direct sales.
Printing. The markets for printer hardware and associated supplies are highly competitive. Printing's key customer segments each face competitive market pressures in pricing and the introduction of new products. Our primary competitors include Canon U.S.A., Inc., Lexmark International, Inc., Xerox Corporation Ltd., Seiko Epson Corporation, The Ricoh Company Ltd., Samsung and Brother Industries, Ltd. In addition, independent suppliers offer refill and remanufactured alternatives for HP original inkjet and toner supplies, which are often available for lower prices but generally offer lower print quality and reliability. Other competitors also have
developed and marketed new compatible cartridges for HP's laser and inkjet products, particularly outside of the U.S. where IP protection is inadequate or ineffective. Our competitive advantages include our comprehensive solutions for the home, office and publishing environments, our innovation and research and development capabilities, our brand, and the accessibility of our products through a broad-based distribution strategy from retail and commercial channels to direct sales.
Enterprise Group. EG operates in the highly competitive enterprise technology infrastructure market that is characterized by rapid and ongoing technological innovation and price competition. Our primary competitors include technology vendors such as International Business Machines Corporation ("IBM"), Dell, EMC Corporation ("EMC"), Cisco Systems, Inc. ("Cisco"), Lenovo, Oracle Corporation ("Oracle"), Fujitsu Limited ("Fujitsu"), Inspur Co. Ltd., Huawei Technologies Co. Ltd., NetApp, Inc., Hitachi Ltd., Juniper Networks, Inc., Arista Networks, Inc., Extreme Networks, Inc., Brocade Communications Systems, Inc., VMware, Microsoft, Google Inc., Rackspace Inc., and Amazon.com, Inc. ("Amazon"). In certain regions, we also experience competition from local companies and from generically-branded or "white-box" manufacturers. Our strategy is to deliver superior products, high-value technology support services and differentiated integrated solutions that combine our infrastructure, software and services capabilities. Our competitive advantages include our broad end-to-end solutions portfolio, supported by our strong IP portfolio and research and development capabilities, coupled with our global reach and partner ecosystem.
Enterprise Services. ES competes in the IT services, consulting and integration, infrastructure technology outsourcing, business process outsourcing and application serviceservices markets. Our primary competitors include IBM Global Services, Computer Sciences Corporation, systems integration firms such as Accenture plc.plc and offshore companies such as Fujitsu and India-based competitors Wipro Limited, Infosys Limited and Tata Consultancy Services Ltd. We also compete with other traditional hardware providers, such as Dell, which are increasingly offering services to support their products, new players in emerging areas like cloud such as Amazon, and smaller local players. Many of our competitors offer a wide range of global services, and some of our competitors enjoy significant brand recognition. ES teams with many companies to offer services, and those arrangements allow us to
extend our reach and augment our capabilities. Our competitive advantages include our deep technology expertise, especially in complex multi-country, multi-vendor and/or multi-language environments, our differentiated IP,intellectual property, our strong track record of collaboration with clients and partners, and the combination of our expertise in infrastructure management with skilled global resources on platforms from SAP AG ("SAP"), Oracle and Microsoft, among others.
Software. The markets in which our Software segment operates are fueledcharacterized by rapidly changing customer requirements and technologies. We design and develop enterprise IT management software in competition with IBM, CA Technologies, Inc., VMware, BMC Software, Inc. and others. Our big data solutions, which include data analytics, information governance and digital marketing offerings incorporating both structured and unstructured data, compete with products from companies like Adobe Systems Inc., IBM, EMC, Open Text Corporation, Oracle and Symantec Corporation. We also deliver enterprise security/risk intelligence solutions that compete with products from EMC, IBM, Cisco and Intel. As customers are becoming increasingly comfortable with newer delivery mechanisms such as SaaS, we are facing competition from smaller, less traditional competitors, particularly for customers with smaller IT organizations. Our differentiation lies in the breadth and depth of our software, our collaboration with EG and ES to provide comprehensive IT solutions and services portfolio and the scope of our market coverage.
HP Financial Services. In our financing solution business, our competitors are captive financing companies, mainly IBM Global Financing, as well as banks and other financial institutions.institutions in our financing business. We believe our competitive advantage in this business over banks and other financial institutions is our ability to deliver flexible investment solutions and expertise that help customers and other partners create unique technology deployments based on specific business needs.
For a discussion of risks attendant to these competitive factors, see "Risk Factors—CompetitiveWe operate in an intensely competitive industry and competitive pressures could harm our revenue, gross marginbusiness and prospects,financial performance," in Item 1A, which is incorporated herein by reference.
Environment
Our operations are subject to regulation under various federal, state, local and foreign laws concerning the environment, including laws addressing the discharge of pollutants into the air and water, the management and disposal of hazardous substances and wastes, and the cleanup of contaminated sites. We could incur substantial costs, including cleanup costs, fines and civil or criminal sanctions, and third-party damage or personal injury claims, if we were to violate or become liable under environmental laws.
Many of our products are subject to various federal, state, local and foreign laws governing chemical substances in products and their safe use, including laws regulating the manufacture and distribution of chemical substances and laws restricting the presence of certain substances in electronics products. Some of our products also are, or may in the future be, subject to requirements applicable to their energy consumption. In addition, we face increasing complexity in our product design and procurement operations as we adjust to new and future requirements relating to the chemical and materials composition of our products, their safe use, and their energy efficiency, including requirements relating to climate change. We are also subject to legislation in an increasing number of jurisdictions that makes producers of electrical goods, including computers and printers, financially responsible for specified collection, recycling, treatment and disposal of past and future covered products (sometimes referred to as "product take-back legislation"). In the event our products become non-compliant with these laws, our products could be restricted from entering certain jurisdictions and we could face other sanctions, including fines.
Our operations, and ultimately our products, are expected to become increasingly subject to federal, state, local and foreign laws, regulations and international treaties relating to climate change.
As these laws, regulations, treaties and similar initiatives and programs are adopted and implemented throughout the world, we will be required to comply or potentially face market access limitations or other sanctions, including fines. However, we believe that technology will be fundamental to finding solutions to achieve compliance with and manage those requirements, and we are collaborating with industry, business groups and governments to find and promote ways that HP technology can be used to address climate change and to facilitate compliance with related laws, regulations and treaties.
We are committed to maintaining compliance with all environmental laws applicable to our operations, products and services and to reducing our environmental impact across all aspects of our business. We meet this commitment with a comprehensive environmental, health and safety policy, strict environmental management of our operations and worldwide environmental programs and services.
A liability for environmental remediation and other environmental costs is accrued when we consider it probable that a liability has been incurred and the amount of loss can be reasonably estimated. Environmental costs and accruals are presently not material to our operations, cash flows or financial position. Although there is no assurance that existing or future environmental laws applicable to our operations or products will not have a material adverse effect on our operations, cash flows or financial condition, we do not currently anticipate material capital expenditures for environmental control facilities.
For a discussion of risks attendant to these environmental factors, see "Risk Factors—Unforeseen environmentalOur business is subject to various federal, state, local and foreign laws and regulations that could result in costs couldor other sanctions that adversely affect our business and results of operations," in Item 1A, which is incorporated herein by reference. In addition, for a discussion of our environmental contingencies see
Note 1516 to the Consolidated Financial Statements in Item 8, which is also incorporated herein by reference.
Executive Officers
The following are our current executive officers:
Martin Fink;Rob Binns; age 50; Executive47; Head of Global Treasury and Investor Relations
Mr. Binns has served as Head of Global Treasury and Investor Relations since November 2015. Mr. Binns joined Hewlett-Packard Company in 2006 as Finance Director for HP Software in the Europe, Middle East and Africa regions following the acquisition of Mercury Interactive. Since then, Mr. Binns has held a number of finance and business roles within HP Software, including Vice President of Worldwide Field Operations. Previously, Mr. Binns was Vice President of Investor Relations. Most recently, Mr. Binns was the Vice President and Chief TechnologyFinancial Officer for HP Software responsible for driving all finance activities.
Ron Coughlin; age 49; President, Personal Systems
Mr. Coughlin has served as President, Personal Systems since November 2015. Mr. Coughlin joined Hewlett-Packard Company from PepsiCo in June 2007 as the senior vice president of the Imaging and Printing Group Worldwide Strategy and Marketing team. In 2010, Mr. Coughlin transitioned to lead the LaserJet and Enterprise Solutions global business unit at Hewlett-Packard Company and later ran Consumer Personal Systems at Hewlett-Packard Company.
Jon Flaxman; age 58; Chief Operating Officer
Mr. FinkFlaxman has served as Executive Vice President, Chief TechnologyOperating Officer and Director of HP Labs since November 2012. Prior to that, he2015. Previously, Mr. Flaxman served as Senior Vice President and General ManagerChief Financial Officer for Hewlett-Packard Company's Printing
Table of the Business CriticalContents
and Personal Systems and Converged Application Systems from April 2005Group. Prior to October 2012. During his almost 30 year career at HP, Mr. Fink has worked in a wide range of roles across HP. He also serves as a director of Hortonworks, Inc.
Henry Gomez; age 51; Executivesuch role, he was Senior Vice President of Finance for Hewlett-Packard Company's Imaging and Printing Group for four years. From March 2007 to November 2008, Mr. Flaxman was Chief Marketing and Communications Officer
Mr. Gomez has served as Executive Vice President and Chief Marketing and Communications Officer since August 2013. Previously, he served as Chief CommunicationsAdministrative Officer and Executive Vice President from January 2012 to July 2013. Prior to that, he ran HSG Communications, a consulting business that he foundedof Hewlett-Packard Company. Mr. Flaxman joined Hewlett-Packard Company in September 2008. He also served on the leadership team of Ms. Whitman's gubernatorial campaign from February 2009 to November 2010. For most of the previous decade, he worked at eBay Inc. in a variety of roles including Senior Vice President for Corporate Communications and President of Skype. From September 2011 to September 2013 he served as a director of BJ's Restaurants, Inc.
John M. Hinshaw; age 44; Executive Vice President, Technology and Operations
Mr. Hinshaw has served as Executive Vice President, Technology and Operations since November 2011. Previously, Mr. Hinshaw served as Vice President and General Manager of Information Solutions at The Boeing Company, an aerospace company, from January 2011 to October 2011 and as Global Chief Information Officer for Boeing from June 2007 to December 2010. He also serves as a director of Bank of New York Mellon.
Abdo George Kadifa; age 55; Executive Vice President, Strategic Relationships
Mr. Kadifa has served as Executive Vice President, Strategic Relationships since May 2014. Previously, Mr. Kadifa served as Executive Vice President, Software from May 2012 to May 2014. Prior to that, he served as a director of Silver Lake, a private equity firm, from June 2007 to May 2012.1981.
Tracy S. Keogh; age 53; Executive Vice President,54; Chief Human Resources Officer
Ms. Keogh has served as Chief Human Resources Officer since November 2015. Previously, Ms. Keogh served as Executive Vice President, Human Resources sinceof Hewlett-Packard Company from April 2011. Previously,2011 to November 2015. Prior to joining Hewlett-Packard Company, Ms. Keogh served as Senior Vice President of Human Resources at Hewitt Associates, a provider of human resources consulting services, from May 2007 until March 2011.
Catherine A. Lesjak; age 55; Executive Vice President and56; Chief Financial Officer
Ms. Lesjak has served as Chief Financial Officer since November 2015. Previously, Ms. Lesjak served as Executive Vice President and Chief Financial Officer since January 2007.of Hewlett-Packard Company from 2007 to November 2015. Prior to that, Ms. Lesjak served as Hewlett-Packard Company's interim Chief Executive Officer from August 2010 until November 2010. She also serves as a director of SunPower Corporation.
Todd R. Morgenfeld;Enrique Lores; age 42; Treasurer50; President, Printing, Solutions and Senior Vice President, Corporate Development and Corporate Analytics
Mr. Morgenfeld has served as Treasurer and Senior Vice President, Corporate Development and Corporate Analytics since November 2013. Previously, Mr. Morgenfeld served as Senior Vice President, HP Mobility, supporting our strategy of providing integrated solutions for the rapidly changing information technology landscape, from June 2013 to October 2013. Prior to that, Mr. Morgenfeld served in several roles at Silver Lake, a private equity firm, from 2004 until May 2013, most recently serving as a director.
Michael G. Nefkens; age 45; Executive Vice President, Enterprise Services
Mr. NefkensLores has served as Executive Vice President, EnterprisePrinting, Solutions and Services since December 2012.November 2015. Throughout his 26-year tenure with Hewlett-Packard Company, Mr. Lores held leadership positions across the organization, most recently leading the Separation Management Office for HP Inc. Previously, he served in that role in an acting capacity since August 2012. Prior to that, Mr. Nefkens served asLores was the Senior Vice President and General Manager of Enterprise Services in the EMEA region from November 2009 to August 2012, after having served in client-facing roles for some of Enterprise Services' largest clients since joining the business in 2001. He also serves as a director of Riverbed Technology, Inc.
Jeff T. Ricci; age 53;Business Personal Systems. Before his Business Personal Systems role, Mr. Lores was Senior Vice President of Customer Support and Services.
Marie Myers; age 47; Global Controller and Principal Accounting OfficerHead of Finance Services
Mr. RicciMs. Myers has served as Senior Vice President,Global Controller and Principal Accounting OfficerHead of Finance Services since April 2014. Previously, Mr. Ricci served as Controller and Principal Accounting Officer on an interim basis from November 2013 to April 2014.2015. Prior to that Mr. Ricci served asfrom October 2014 to October 2015, Ms. Myers was Finance Lead for HP Inc. in the Separation, and held key leadership roles at Hewlett-Packard Company, including: Vice President offor PPS HQ and Strategy Finance for our Technology and Operations organization from May 2012 to November 2013. Mr. Ricci served as Vice President of Finance for Global Accounts and HP Financial Services from March 2011 to May 2012October 2015 and Vice President of Finance for HP SoftwarePSG Americas from March 20092010 to March 2011.May 2012.
Kim Rivera; age 47; Chief Legal Officer and General Counsel
Ms. Rivera has served as Chief Legal Officer and General Counsel since November 2015. Prior to joining HP, Mr. Riccius, at DaVita Health Care Partners she served as Senior Vice President of Finance for BEA Systems, Inc., an enterprise software company,the Chief Legal Officer from 2000 until June 2008.
John F. Schultz; age 50; Executive Vice President, General CounselJuly 2011 to October 2015, as Corporate Secretary from January 2010 to December 2013 and Secretary
Mr. Schultz has served as Executive Vice President, General Counsel and Secretary since April 2012. Previously, he served as Deputy General Counsel for Litigation, Investigations and Global Functions from September 2008 to April 2012. From March 2005 to September 2008, Mr. Schultz was a partner in the litigation practice at Morgan, Lewis & Bockius LLP, where, among other clients, he supported HP as external counsel on a variety of litigation and regulatory matters.
William L. Veghte; age 47; Executive Vice President and General Manager, Enterprise Group
Mr. Veghte hasCounsel from January 2010 to July 2011. From February 2006 to November 2009, she served as Executive Vice President and Associate General Manager of the Enterprise Group since August 2013. Previously, he served as Chief Operating Officer from May 2012 to August 2013.Counsel at The Clorox Company. Prior to that, Mr. VeghteMs. Rivera served as Executive Vice President of HP Software from May 2010Law and Chief Litigation Counsel to May 2012. Prior to joining HP, Mr. Veghte servedRockwell Automation as Senior Vice President of the Windows business group at Microsoft Corporation, a software company, from February 2008 until January 2010.well as General Counsel for its Automation Controls and Information Group.
Dion J. Weisler; age 47;48; President and Chief Executive Vice President, Printing and Personal Systems GroupOfficer
Mr. Weisler has served as President and Chief Executive Officer since November 2015. Previously, he served as Executive Vice President of the Printing and Personal Systems Group sinceof Hewlett-Packard Company from June 2013. Previously, he served2013 to November 2015 and as Senior Vice President and Managing Director, Printing and Personal Systems, Asia Pacific and Japan from January 2012 to June 2013. Prior to joining HP,
Hewlett-Packard Company, he was Vice President and Chief Operating Officer of the Product and Mobile Internet Digital Home Groups at Lenovo Group Ltd., a technology company, from January 2008 to December 2011.
Margaret C. Whitman; age 58; Chairman, President and Chief Executive Officer
Ms. Whitman has served as Chairman since July 2014, President and Chief Executive Officer since September 2011 and as a member of our Board of Directors since January 2011. From March 2011 to September 2011, Ms. Whitman served as a part-time strategic advisor to Kleiner Perkins Caufield & Byers, a private equity firm. Previously, Ms. Whitman served as President and Chief Executive Officer of eBay Inc., from 1998 to March 2008. Prior to joining eBay, Ms. Whitman held executive-level positions at Hasbro Inc., FTD, Inc., The Stride Rite Corporation, The Walt Disney Company, and Bain & Company. Ms. Whitman also serves as a director of The Procter & Gamble Company and is a former director of Zipcar, Inc.
Robert Youngjohns; age 63; Executive Vice President and General Manager, HP Software
Mr. Youngjohns has served as Executive Vice President and General Manager of HP Software since May 2014. Previously, Mr. Youngjohns served as Senior Vice President and General Manager of the HP Autonomy /Information Management business unit, within HP Software from September 2012 to May 2014. Prior to joining HP, he was President of Microsoft North America from September 2007 to September 2012 and was President and Chief Executive Officer of Callidus Software from August 2005 to September 2007. Prior to that, he spent 10 years at Sun Microsystems, where he had a variety of leadership positions in sales and general management both regionally and globally.
Employees
We had approximately 302,000287,000 employees worldwide as of October 31, 2014.2015.
Available Information
Our Annual Report on Form 10-K, Quarterly Reports on Form 10-Q, Current Reports on Form 8-K and amendments to reports filed or furnished pursuant to Sections 13(a) and 15(d) of the Securities Exchange Act of 1934, as amended, are available on our website at http://www.hp.com/investor/home, as soon as reasonably practicable after HP electronically files such reports with, or furnishes those reports to, the Securities and Exchange Commission. HP's Corporate Governance Guidelines, Board of Directors' committee charters (including the charters of the Audit Committee, Finance and Investment Committee, HR and Compensation Committee, Technology Committee, and Nominating, Governance and Social Responsibility Committee) and code of ethics entitled "Standards of Business Conduct" are also available at that same location on our website. Stockholders may request free copies of these documents from:
Hewlett-Packard CompanyHP Inc.
Attention: Investor Relations3000 Hanover Street1501 Page Mill Road,
Palo Alto, CA 94304
http://www.hp.com/investor/informationrequest
Additional Information
Microsoft® and Windows® are U.S.-registered trademarks of Microsoft Corporation. Intel®, Itanium® , Intel®AtomTM, and Intel® Itanium® are trademarks of Intel Corporation in the United States and other countries. AMD is a trademark of Advanced Micro Devices, Inc. ARM® is a registered trademark of ARM Limited. UNIX® is a registered trademark of The Open Group.
The following discussion of risk factors contains forward-looking statements. These risk factors may be important for understanding any statement in this Form 10-K or elsewhere. The following information should be read in conjunction with Part II, Item 7, "Management's Discussion and Analysis of Financial Condition and Results of Operation" and the Consolidated Financial Statements and related notes in Part II, Item 8, "Financial Statements and SupplementalSupplementary Data" of this Form 10-K.
Because of the following factors, as well as other variables affecting our results of operations, past financial performance may not be a reliable indicator of future performance, and historical trends should not be used to anticipate results or trends in future periods.
Risks related to our business
If we are unsuccessful at addressing our business challenges, our business and results of operations may be adversely affected and our ability to invest in and grow our business could be limited.
We are in the process of addressing many challenges facing our business. One set of challenges relates to dynamic and accelerating market trends, such as the decline in the PC market, the growth of multi-architecture devices running competing operating systems the market shift towards tablets within mobility, the market shiftand movement to cloud-related infrastructure, software, and services, and the growth in software-as-a-service business models. Anothercontinuous ink supply systems. A second set of challenges relates to changes in the competitive landscape. Our major competitors are expanding their product and service offerings with integrated products and solutions; our business-specific competitors are exerting increased competitive pressure in targeted areas and are going afterentering new markets; our emerging competitors are introducing new technologies and business models; and our alliance partners in some businesses are increasingly becoming our competitors in others. A third set of challenges relates to business model changes and our go-to-market execution. For example, we may fail to develop innovative products and services, maintain the manufacturing quality of our products, manage our distribution network or successfully market new products and services, any of which could adversely affect our business and financial condition.
In addition, we are facing a series of significant macroeconomic challenges, including weakness across many geographic regions, particularly in the United States, Central and Eastern Europe and Russia, and certain countries and businesses in Asia. We may experience delays in the anticipated timing of activities related to our efforts to address these effortschallenges and higher than expected or unanticipated execution costs. In addition, we are vulnerable to increased risks associated with our efforts to address these effortschallenges given our large and diverse portfolio of businesses, the broad range of geographic regions in which we and our customers and partners operate, and the ongoing integration of acquired businesses. If we do not succeed in these efforts, or if these efforts are more costly or time-consuming than expected, our business and results of operations may be adversely affected, which could limit our ability to invest in and grow our business.
In May 2012, we announced a company-wide restructuring plan. The restructuring plan includes both voluntary early retirement programsWe operate in an intensely competitive industry and non-voluntary workforce reductions. Significant risks associated with these actions that may impair our ability to achieve anticipated cost reductions or that may otherwisecompetitive pressures could harm our business include delays in implementation of anticipated workforce reductions in highly regulated locations outside of the United States, particularly in Europe and Asia, decreases in employee morale and the failure to meet operational targets due to the loss of employees. In addition, our ability to achieve the anticipated cost savings and other benefits from these actions within the expected time frame is subject to many estimates and assumptions. These estimates and assumptions are subject to significant economic, competitive and other uncertainties, some of which are beyond our control. If these estimates and assumptions are incorrect, if we experience delays, or if other unforeseen events occur, our business and financial results could be adversely affected.
Competitive pressures could harm our revenue, gross margin and prospects.performance.
We encounter aggressive competition from numerous and varied competitors in all areas of our business, and our competitors may targethave targeted and are expected to continue targeting our key market segments. We compete primarily on the basis of our technology, innovation, performance, price, quality, reliability, brand, reputation, distribution, range of products and services, ease of use of our products, account relationships, customer training, service and support
security, availability of application software, and internet infrastructure offerings.security. If our products, services, support and cost structure do not enable us to compete successfully based on any of those criteria, our results of operations and business prospects could be harmed.
We have a large portfolio of businessesproducts and must allocate our financial, personnel and other resources across all of those businessesour products while competing with companies that have much smaller portfolios or
specialize in one or more of theseour product lines. As a result, we may invest less in certain areas of our businessesbusiness than our competitors do, and theseour competitors may have greater financial, technical and marketing resources available to them thancompared to the resources allocated to our businessesproducts and services that compete against them. Industry consolidation also may affect competition by creating larger, more homogeneous and potentially stronger competitors in the markets in which we compete, and our competitors also may affect our business by entering into exclusive arrangements with existing or potential customers or suppliers.their products.
Companies with whom we have alliances in somecertain areas may be or become our competitors in other areas. In addition, companies with whom we have alliances also may acquire or form alliances with our competitors, which could reduce their business with us. If we are unable to effectively manage these complicated relationships with alliance partners, our cash flowsbusiness and results of operations could be adversely affected.
We face aggressive price competition for our products and services and, as a result, we may have to continue lowering the prices of many of our products and services to stay competitive, while at the same time trying to maintain or improve our revenue and gross margin. In addition, competitors who have a greater presence in some of the lower-cost markets in which we compete, or who can obtain better pricing, more favorable contractual terms and conditions, or more favorable allocations of products and components during periods of limited supply, may be able to offer lower prices than we are able to offer. Our cash flows, results of operations and financial condition may be adversely affected by these and other industry-wide pricing pressures.
Industry consolidation may also affect competition by creating larger, more homogeneous and potentially stronger competitors in the markets in which we operate. Additionally, our competitors may affect our business by entering into exclusive arrangements with our existing or potential customers or suppliers.
Because our business model is based on providing innovative and high-quality products, we may spend a proportionately greater amount of our revenues on research and development than some of our competitors. If we cannot proportionately decrease our cost structure (apart from research and development expenses) on a timely basis in response to competitive price pressures, our gross margin and, therefore, our profitability could be adversely affected. In addition, if our pricing and other factorsfacets of our offerings are not sufficiently competitive, or if there is an adverse reaction to our product decisions, we may lose market share in certain areas, which could adversely affect our revenuefinancial performance and business prospects.
Even if we are able to maintain or increase market share for a particular product, revenueits financial performance could decline because the product is in a maturing industry or market segment or contains technology that is becoming obsolete. For example, our Storage business unit is experiencing the effects of a market transition towards converged products and solutions, which has led to a decline in demand for our traditional storage products. In addition, theFinancial performance of our Business Critical Systems business unit has been affected by the decline in demand for UNIX servers and concerns about the development of new versions of software to support our Itanium-based products. Revenue and margins also could decline due to increased competition from other types of products. For example, growing demand for an increasing array of mobile computing devices and the development of cloud-based solutions has reduced demand for some of our existing hardware products. In addition, refill and remanufactured alternatives for some of HP'sour LaserJet toner and inkjet cartridges compete with our printing supplies business.
If we cannot successfully execute on our go-to-market strategy and continue to develop, manufacture and market innovative products, services and solutions, that meet customer requirements for innovationour business and quality, our revenue and gross marginfinancial performance may suffer.
Our long-term strategy is focused on leveraging our existing portfolio of hardware, softwareproducts, services and services as we adaptsolutions to meet the demands of a continually changing technological landscape and hybrid modelto offset certain areas of IT delivery and consumption driven by the growing adoption of cloud computing and increased demand for integrated IT solutions.industry decline. To successfully execute
on this strategy, we needmust emphasize the aspects of our core business where demand remains strong, identify and capitalize on natural areas of growth, and innovate and develop new products and services that will enable us to continue evolvingexpand beyond our focus towards the delivery of integrated IT solutions for our customers and to continue to invest and expand into cloud computing, security, big data and mobility.existing technology categories. Any failure to successfully execute this strategy, including any failure to invest sufficiently in strategic growth areas, could adversely affect our business, results of operationoperations and financial results.condition.
The process of developing new high-technology products, software, services and solutions and enhancing existing hardware and software products, services and solutions is complex, costly and uncertain, and any failure by us to anticipate customers' changing needs and emerging technological trends accurately could significantly harm our market share, and results of operations.operations and financial condition. For example, as the transition to an environment characterized by cloud-based computing and software being delivered as a service progresses,offset industry declines in some of our businesses, we must continuesuccessfully grow in adjacencies such as copier printers, maintain our strong position in graphics and execute on our strategy to successfully developgrow commercial mobility by providing specialized products and deploy cloud-based solutions forservices to address the needs of our customers. We must make long-term investments, develop or obtain and protect appropriate intellectual property, and commit significant research and development and other resources before knowing whether our predictions will accurately reflect customer demand for our products services and solutions. In addition, afterservices. Any failure to accurately predict technological and business trends, control research and development costs or execute our innovation strategy could harm our business and financial performance. Our research and development initiatives may not be successful in whole or in part, including research and development projects which we have prioritized with respect to funding and/or personnel.
After we develop a product, we must be able to manufacture appropriate volumes quickly while also managing costs and preserving margins. To accomplish this, we must accurately forecast volumes, mixes of products and configurations that meet customer requirements, and we may not succeed at doing so within a given product's life cyclelifecycle or at all. Any delay in the development, production or marketing of a new product, service or solution could result in us not being among the first to market, which could further harm our competitive position.
If we cannot continue to produce quality products and services, our reputation, business and financial performance may suffer.
In the course of conducting our business, we must adequately address quality issues associated with our products services and solutions,services, including defects in our engineering, design and manufacturing processes and unsatisfactory performance under service contracts, as well as defects in third-party components included in our products and unsatisfactory performance or even malicious acts by third-party contractors or subcontractors or the employees of those contractors or subcontractors.their employees. In order to address quality issues, we work extensively with our customers and suppliers and engage in product testing to determine the causes of problems and to develop and implement appropriate solutions. However, the products services and solutionsservices that we offer are complex, and our regular testing and quality control efforts may not be effective in controlling or detecting all quality issues or errata,errors, particularly with respect to faulty components manufactured by third-parties. If we are unable to determine the cause or find an appropriate solution or offer a temporary fix (or "patch") to address quality issues with our products, we may delay shipment to customers, which would delay revenue recognition and receipt of customer payments and could adversely affect our revenue, cash flows and reported results.profitability. In addition, after products are delivered, quality issues may require us to repair or replace such products. Addressing quality issues can be expensive and may result in additional warranty, repair, replacement and other costs, adversely affecting our profits.financial performance. If new or existing customers have difficulty operating our products or are dissatisfied with our services, or solutions, our results of operations could be adversely affected, and we could face possible claims if we fail to meet our customers' expectations. In addition, quality issues can impair our relationships with new or existing customers and adversely affect our brand and reputation, which could, in turn, adversely affect our results of operations.
Our planWe are exposed to separate into two independent publicly-traded companies is subject to various risks and uncertainties and may not be completedfluctuations in accordance with the expected plans or anticipated timeline, or at all, and will involve significant time and expense, which could disrupt or adversely affect our business.foreign currency exchange rates.
On October 6, 2014, we announced plansCurrencies other than the U.S. dollar, including the euro, the British pound, Chinese yuan (renminbi) and the Japanese yen, can have an impact on our results as expressed in U.S. dollars. In particular, the economic uncertainties relating to separate into two independent publicly-traded companies. The separation, which is currently targeted to be completed byEuropean sovereign and other debt obligations and the end of fiscal 2015, is subject to approval by our Board of Directorsrelated European financial restructuring efforts may cause the value of the final terms of the separation and market, regulatory and certain other conditions. Unanticipated developments, including changes in the competitive conditions of Hewlett-Packard Enterprise's and HP Inc.'s respective markets, possible delays in obtaining various tax opinions or rulings, regulatory approvals or clearances, the uncertainty of the financial markets and challenges in executing the separation, could delay or prevent theeuro to fluctuate.
completionGlobal economic events and uncertainty may cause currencies to fluctuate and currency volatility contributes to variations in our sales of products and services in impacted jurisdictions. For example, in the event that one or more European countries were to replace the euro with another currency, our sales into such countries, or into Europe generally, would likely be adversely affected until stable exchange rates are established. Accordingly, fluctuations in foreign currency exchange rates, such as the strengthening of the proposed separation,U.S. dollar against the euro or cause the proposed separation to occur on terms or conditions that are different or less favorable than expected.
We have established a Separation Management Office tasked with drivingweakness of the separation process. We expect that the process of completing the proposed separation will be time-consuming and involve significant costs and expenses, which may be significantly higher than what we currently anticipate and may not yield a discernible benefit if the separation is not completed. Executing the proposed separation will require significant time and attention from our senior management and employees, whichJapanese yen, could adversely affect our business, financial resultsrevenue growth in future periods. In addition, currency variations can adversely affect margins on sales of our products in countries outside of the United States and resultsmargins on sales of operations.products that include components obtained from suppliers located outside of the United States.
From time to time, we may use forward contracts and options designated as cash flow hedges to protect against foreign currency exchange rate risks. The effectiveness of our hedges depends on our ability to accurately forecast future cash flows, which is particularly difficult during periods of uncertain demand for our products and services and highly volatile exchange rates. We may also experience increased difficulties in attracting, retainingincur significant losses from our hedging activities due to factors such as demand volatility and motivating employees during the pendency of the separation and following its completion, which could harm our businesses.
The separation may not achieve somecurrency variations. In addition, certain or all of the anticipated benefits.
Weour hedging activities may be ineffective, may expire and not be renewed or may not realize someoffset any or allmore than a portion of the anticipated strategic,adverse financial operational, marketing or other benefitsimpact resulting from the separation. As independent publicly-traded companies, Hewlett-Packard Enterprise and HP Inc. will be smaller, less diversified companiescurrency variations. Losses associated with a narrower business focus andhedging activities also may be more vulnerable to changing market conditions, which could materially and adversely affect their respective business,impact our revenue, financial condition and, resultsto a lesser extent, our cost of operations. Further, there can be no assurance that the combined value of the common stock of the two publicly-traded companies will be equal to or greater than what the value of our common stock would have been had the proposed separation not occurred.sales.
The proposed separation may result in disruptions to,Recent global, regional and negatively impact our relationships with, our customers and other business partners.
Uncertainty related to the proposed separation may lead customers and other parties with which we currently do business or may do business in the future to terminate or attempt to negotiate changes in existing business relationships, or consider entering into business relationships with parties other than us. These disruptions could have a material and adverse effect on our businesses, financial condition, results of operations and prospects. The effect of such disruptions could be exacerbated by any delays in the completion of the separation.
The separation could result in substantial tax liability.
We intend to obtain an opinion of outside counsel to the effect that, for U.S. federal income tax purposes, the separation will qualify, for both HP and its stockholders, as a reorganization within the meaning of Sections 368(a)(1)(D) and 355 of the U.S. Internal Revenue Code of 1986, as amended. In addition, we intend to obtain a private letter ruling from the Internal Revenue Service (the "IRS") and/or one or more opinions of outside counsel regarding certain matters impacting the U.S. federal income tax treatment of the separation for HP and certain related transactions as transactions that are generally tax-free for U.S. federal income tax purposes. The opinions of outside counsel and any IRS private letter ruling will be based, among other things, on various factual assumptions we have authorized and representations we have made to outside counsel or the IRS. If any of these assumptions or representations are, or become, inaccurate or incomplete, reliance on the opinions and/or IRS private letter ruling may be affected. An opinion of outside counsel represents their legal judgment but is not binding on the IRS or any court. Accordingly, there can be no assurance that the IRS will not challenge the conclusions reflected in the opinions or that a court would not sustain such a challenge. In addition, we may incur certain tax costs in connection with the separation, including non-U.S. tax expense resulting from separations in multiple non-U.S. jurisdictions that do not legally provide for tax-free separations, which may be material.
Economiclocal economic weakness and uncertainty could adversely affect our revenue, gross marginbusiness and expenses.financial performance.
Our revenuebusiness and gross marginfinancial performance depend significantly on worldwide economic conditions and the demand for technology hardware, softwareproducts and services in the markets in which we compete. EconomicRecent economic weakness and uncertainty in various markets throughout the world have resulted, and may result in the future, in decreased revenue, gross margin, earnings or growth rates and in increased expenses and difficulty in managing inventory levels. For example, we are continuing to experience macroeconomic weakness across many geographic regions, particularly in the Europe, the Middle East and Africa ("EMEA") region, China and certain other high-growth markets. TheOngoing U.S. federal government spending cuts that went into effect on March 1, 2013limits may furthercontinue to reduce demand for our products services and solutionsservices from organizations that receive funding from the U.S. government, and could negatively affect macroeconomic conditions in the United States, which could further reduce demand for our products services and solutions.services. Economic weakness and uncertainty may adversely affect demand for our products services and solutions,services, may result in increased expenses due to higher allowances for doubtful accounts and potential goodwill and asset impairment charges, and may make it more difficult for us to make accurate forecasts of revenue, gross margin, cash flows and expenses.
We also have experienced, and may experience in the future, gross margin declines in certain businesses, reflecting the effect of items such as competitive pricing pressures and increases in component and manufacturing costs resulting from higher labor and material costs borne by our manufacturers and suppliers that, as a result of competitive pricing pressures or other factors, we are unable to pass on to our customers. In addition, our business may be disrupted if we are unable to obtain equipment, parts or components from our suppliers—and our suppliers from their suppliers—due to the insolvency of key suppliers or the inability of key suppliers to obtain credit.
Economic weakness and uncertainty could cause our expenses to vary materially from our expectations. Any financial turmoil affecting the banking system and financial markets or any significant financial services institution failures could negatively impact our treasury operations, as the financial condition of such parties may deteriorate rapidly and without notice in times of market volatility and disruption. Poor financial performance of asset markets combined with lower interest rates and the adverse effects of fluctuating currency exchange rates could lead to higher pension and post-retirement benefit expenses. Interest and other expenses could vary materially from expectations depending on
changes in interest rates, borrowing costs, currency exchange rates, costs of hedging activities and the fair value of derivative instruments. Economic downturns also may lead to restructuring actions and associated expenses.
The revenue and profitability of our operations have historically varied, which makes our future financial results less predictable.
Our revenue, gross margin and profit vary among our diverse products and services, customer groups and geographic markets and therefore will likely be different in future periods than our current results. Our revenue depends on the overall demand for our products and services. Delays or reductions in IThardware and related services spending by our customers or potential customers could have a material adverse effect on demand for our products and services, which could result in a significant decline in revenue. In addition, revenue declines in some of our businesses, particularly our services businesses may affect revenue in our other businesses as we may lose cross-selling opportunities. Overall gross margins and profitability in any given period are dependent partially on the product, service, customer and geographic mix reflected in that period's net revenue. Competition, lawsuits, investigations, increases in component and manufacturing costs that we are unable to pass on to our customers, component supply disruptions and other risks affecting those businesses therefore may have a significant impact on our overall gross margin and profitability. Certain segments have a higher fixed cost structure and more variation in gross margins across their business units and product portfolios than others and may therefore experience significant operating profit volatility on a quarterly basis. In addition, newer geographic markets may be relatively less profitable due to our investments associated with entering those markets and local pricing pressures, and we may have difficulty establishing and
maintaining the operating infrastructure necessary to support the high growth rate associated with some of those markets. Market trends, industry shifts, competitive pressures, commoditization of products, seasonal rebates, increased component or shipping costs, regulatory impacts and other factors may result in reductions in revenue or pressure on gross margins of certain segments in a given period, which may lead to adjustments to our operations. Moreover, our efforts to address the challenges facing our business could increase the level of variability in our financial results because the rate at which we are able to realize the benefits from those efforts may vary from period to period.
If we fail to manage the distribution of our products and services properly, our revenue, gross marginsbusiness and profitabilityfinancial performance could suffer.
We use a variety of distribution methods to sell our products and services around the world, including third-party resellers and distributors and both direct and indirect sales to enterprise accounts and consumers. Successfully managing the interaction of our direct and indirect channel efforts to reach various potential customer segments for our products and services is a complex process. Moreover, since each distribution method has distinct risks and gross margins, our failure to implement the most advantageous balance in the delivery model for our products and services could adversely affect our revenue and gross margins and therefore our profitability. Other distribution risks are described below.
Our financial results could be materially adversely affected due to distribution channel conflicts or if the financial conditions of our channel partners were to weaken.
Our results of operations may be adversely affected by any conflicts that might arise between our various salesdistribution channels or the loss or deterioration of any alliance or distribution arrangement or the loss of retail shelf space. Moreover, some of our wholesale and retail distributors may have insufficient financial resources and may not be able to withstand changes in business conditions, including economic weakness, industry consolidation and industry consolidation.market trends. Many of our significant distributors operate on narrow product margins and have been negatively affected by business pressures.pressures in the past. Considerable trade receivables that are not covered by collateral or credit insurance are outstanding with our distribution and retail channel partners. Revenue from indirect sales could suffer, and we could experience disruptions in distribution, if our distributors' financial conditions, abilities to borrow funds in the credit markets or operations weaken.
Our inventory management is complex, as we continue to sell a significant mix of products through distributors.
We must manage both owned and channel inventory effectively, particularly with respect to sales to distributors, which involves forecasting demand and pricing issues.challenges. Distributors may increase orders during periods of product shortages, cancel orders if their inventory is too high or delay orders in anticipation of new products. Distributors also may adjust their orders in response to the supply of our products and the products of our competitors and seasonal fluctuations in end-user demand. Our reliance upon indirect distribution methods may reduce our visibility tointo demand and pricing trends and issues, and therefore make forecasting more difficult. If we have excess or obsolete inventory, we may have to reduce our prices and write down inventory. Moreover, our use of indirect distribution channels may limit our willingness or ability to adjust prices quickly and otherwise to respond to pricing changes by competitors. We also may have limited ability to estimate future product rebate redemptions in order to price our products effectively.
We depend on third-party suppliers, and our financial results could suffer if we fail to manage our suppliers properly.effectively.
Our operations depend on our ability to anticipate our needs for components, products and services, as well as our suppliers' ability to deliver sufficient quantities of quality components, products and services at reasonable prices and in time for us to meet critical schedules.schedules for the delivery of our own products and services. Given the wide variety
of systems, products and services that we offer, the large number of our suppliers and contract manufacturers that are located around the world, and the long lead times required to manufacture, assemble and deliver certain components and products, problems could arise in production, planning and inventory management that could seriously harm us.our business. In addition, our ongoing efforts to optimize the efficiency of our supply chain could cause supply disruptions and be more expensive, time-consuming and resource intensive than expected. Furthermore, certain of our suppliers may decide to discontinue conducting business with us. Other supplier problems that we could face include component shortages, excess supply, risks related to the terms of our contracts with suppliers, risks associated with contingent workers and risks related to our relationships with single source suppliers, aseach of which is described below.
favorable pricing or to address concerns about the availability of future components. If we fail to anticipate customer demand properly, a temporary oversupply could result in excess or obsolete components, which could adversely affect our gross margin.
business and financial performance.
Business disruptions could seriously harm our future revenue and financial condition and increase our costs and expenses.
Our worldwide operations could be disrupted by earthquakes, telecommunications failures, power or water shortages, tsunamis, floods, hurricanes, typhoons, fires, extreme weather conditions, medical epidemics or pandemics and other natural or manmade disasters or catastrophic events, for which we are predominantly self-insured. The occurrence of any of these business disruptions could result in significant losses, seriously harm our revenue, profitability and financial condition, adversely affect our competitive position, increase our costs and expenses, and require substantial expenditures and recovery time in order to fully resume operations. Our corporate headquarters and a portion of our research and development activities are located in California, and other critical business operations and some of our suppliers are located in California and Asia, near major earthquake faults known for seismic activity. In addition, six of our principal worldwide IT data centers are located in the southern United States, making our operations more vulnerable to natural disasters or other business disruptions occurring in that geographical area. The manufacture of product components, the final assembly of our products and other critical operations are concentrated in certain geographic locations, including Shanghai, Singapore and India.locations. We also rely on major logistics hubs primarily in Asia to manufacture and distribute our products, and primarily in the southwestern United States to import products into the Americas region. Our operations could be adversely affected if manufacturing, logistics or other operations in these locations are disrupted for any reason, including natural disasters, information technologyIT system failures, military actions or economic, business, labor, environmental, public health, regulatory or political issues. The ultimate impact on us, our significant suppliers and our general
infrastructure of being located near locations more vulnerable to the occurrence of the aforementioned business disruptions, such as near major earthquake faults, and being consolidated in certain geographical areas is unknown and remains uncertain.
Our uneven sales cycle makes planning and inventory management difficult and future financial results less predictable.
In some of our segments, ourOur quarterly sales often have reflected a pattern in which a disproportionate percentage of each quarter's total sales occurs towards the end of suchthe quarter. This uneven sales pattern makes predicting revenue, earnings, cash flow from operations and working capital for each financial period difficult, increases the risk of unanticipated variations in our quarterly results and financial condition and places pressure on our inventory management and logistics systems. If predicted demand is substantially greater than orders, there may be excess inventory. Alternatively, if orders substantially exceed predicted demand, we may not be able to fulfill all of the orders received in the last few weeks of each quarter.quarter and such orders may be cancelled. Depending on when they occur in a quarter, developments such as a systems failure, component pricing movements, component shortages or global logistics disruptions could adversely impact our inventory levels and results of operations in a manner that is disproportionate to the number of days in the quarter affected.
We experience some seasonal trends in the sale of our products that also may produce variations in our quarterly results and financial condition. For example, sales to governments (particularly sales to the U.S. government) are often stronger in the third calendar quarter, consumer sales are often stronger in the fourth calendar quarter, and many customers whose fiscal andyear is the calendar years are the sameyear spend their remaining capital budget authorizations in the fourth calendar quarter prior to new budget constraints in the first calendar quarter of the following year. Consumer sales are often higher in the fourth calendar quarter compared to other quarters due in part to seasonal holiday demand. European sales are often weaker during the summer months. Demand during the spring and early summer also may be adversely impacted by market anticipation of seasonal trends. Moreover, to the extent that we introduce new products in anticipation of seasonal demand trends, our discounting of existing products may adversely affect our gross margin prior to or shortly after such product launches. Typically, our third fiscal quarter is our weakest and our fourth fiscal quarter is our strongest. Many of the factors that create and affect seasonal trends are beyond our control.
Due to the international nature of our business, political or economic changes or other factors could harm our future revenue, costs and expenses,business and financial condition.performance.
Sales outside the United States makemade up approximately 65%64% of our net revenue.revenue for fiscal 2015. In addition, an increasinga portion of our business activity is being conducted in emerging markets, including Brazil, Russia, India and China.markets. Our future revenue, gross margin, expensesbusiness and financial conditionperformance could suffer due to a variety of international factors, including:
The factors described above also could disrupt our product and component manufacturing and key suppliers located outside of the United States. For example, we rely on manufacturers in Taiwan for the production of notebook computers and other suppliers in Asia for product assembly and manufacture.
Currencies other than the U.S. dollar, including the euro, the British pound, Chinese yuan renminbi and the Japanese Yen, can have an impact on our results (expressed in U.S. dollars). In particular, the economic uncertainties relating to European sovereign and other debt obligations and the related European financial restructuring efforts may cause the value of the euro to fluctuate. Currency variations also contribute to variations in sales of products and services in impacted jurisdictions. For example, in the event that one or more European countries were to replace the euro with another currency, our sales into such countries, or into Europe generally, would likely be adversely affected until stable exchange rates are established. Accordingly, fluctuations in foreign currency rates, most notably the strengthening of the dollar against the euro, could adversely affect our revenue growth in future periods. In addition, currency variations can adversely affect margins on sales of our products in countries outside of the United States and margins on sales of products that include components obtained from suppliers located outside of the United States. We use a combination of forward contracts and options designated as cash flow hedges to protect against foreign currency exchange rate risks. The effectiveness of our hedges depends on our ability to accurately forecast future cash flows, which is particularly difficult during periods of uncertain demand for our products and services and highly volatile exchange rates. We may incur significant losses from our hedging activities due to factors such as volatility and currency variations. In addition, our hedging activities may be ineffective or may not offset any or more than a portion of the adverse financial impact resulting from currency variations. Losses associated with hedging activities also may impact our revenue and to a lesser extent our cost of sales and financial condition.
In many foreign countries, particularly in those with developing economies, it is common tothere are companies that engage in business practices that are prohibited by laws and regulations applicable to us, such as the Foreign Corrupt Practices Act of 1977, as amended (the "FCPA"). For example, as discussed in Note 15 to the Consolidated Financial Statements, the German Public Prosecutor's Office has been investigating allegations that certain current and former employees of HP engaged in bribery, embezzlement and tax evasion. In addition, the Polish Central Anti-Corruption Bureau is conducting investigations into potential FCPA violations by a former employee of an HP subsidiary in connection with certain public-sector transactions in Poland. Although we implement policies, procedures and procedurestraining designed to facilitate compliance with these laws, our employees, contractors and agents, as well as those of the companies to which we outsource certain of our business operations, may take actions in violation of our policies. Any such violation, even if prohibited by our policies, could have an adverse effect on our business and reputation.
Any failure by us to identify, manage complete and integratecomplete acquisitions, divestitures and other significant transactions successfully could harm our financial results, business and prospects, and the costs, expenses and other financial and operational effects associated with managing, completing and integrating acquisitions may result in financial results that are different than expected.prospects.
As part of our business strategy, we may acquire companies or businesses, divest businesses or assets, enter into strategic alliances and joint ventures and make investments to further our business (collectively, "business combination and investment transactions"). In order to pursue this strategy successfully, we must identify candidates for and successfully complete business combination and investment transactions, some of which may be large or complex, and manage post-closing issues such as the integration of acquired businesses, products, services or employees. Risks associated with business combination and investment transactions include the following, any of which could adversely affect our revenue, gross margin, profitability and financial results:
We have incurred and will incur additional depreciation and amortization expense over the useful lives of certain assets acquired in connection with business combination and investment transactions, and, to the extent that the value of goodwill or intangible assets acquired in connection with a business combination and investment transaction becomes impaired, we may be required to incur additional material charges relating to the impairment of those assets. For example, in our third fiscal quarter of 2012, we recorded an $8.0 billion impairment charge relating to the goodwill associated with our enterprise services reporting unit within our former Services segment and a $1.2 billion impairment charge as a result of an asset impairment analysis of the "Compaq" trade name acquired in 2002. In addition, in our fourth fiscal quarter of 2012, we recorded an $8.8 billion impairment charge relating to the goodwill and intangible assets associated with Autonomy. If there are future decreases in our stock price or significant changes in the business climate or results of operations of our reporting units, we may incur additional charges, which may include goodwill impairment or intangible asset charges.
Integration issues are often complex, time-consuming and expensive and, without proper planning and implementation, could significantly disruptAs part of our business and the acquired business. The challenges involved in integration include:
While we do not currently plan to divest any of our major businesses, we do regularly evaluate the potential disposition of assets and businesses that may no longer help us meet our objectives. When we decide to sell assets or a business, we may encounter difficulty in finding buyers or alternative exit strategies on acceptable terms in a timely manner, which could delay the achievement of our strategic
objectives. We may also dispose of a business at a price or on terms that are less desirable than we had anticipated. In addition, we may experience greater dis-synergies than expected, and the impact of the divestiture on our revenue growth may be larger than projected. After reaching an agreement with a buyer or seller for the acquisition or disposition of a business, we are subject to satisfaction of pre-closing conditions as well as to necessary regulatory and governmental approvals on acceptable terms, which, if not satisfied or obtained, may prevent us from completing the transaction. Dispositions may also involve continued financial involvement in the divested business, such as through continuing equity ownership, guarantees, indemnities or other financial obligations. Under these arrangements, performance by the divested businesses or other conditions outside of our control could affect our future financial results.
Integrating acquisitions may be difficult and time-consuming. Any failure by us to integrate acquired companies, products or services into our overall business in a timely manner could harm our financial results, business and prospects.
In order to pursue our strategy successfully, we must identify candidates for and successfully complete business combination and investment transactions, some of which may be large or complex, and manage post-closing issues such as the integration of acquired businesses, products, services or employees. Integration issues are often time-consuming and expensive and, without proper planning and implementation, could significantly disrupt our business and the acquired business. The challenges involved in integration include:
We may not achieve some or all of the expected benefits of our restructuring plan and our restructuring may adversely affect our business.
We announced a restructuring plan in September 2015 to realign our cost structure due to the changing nature of our business and to achieve operating efficiencies that we expect to reduce costs. We may not be able to obtain the cost savings and benefits that were initially anticipated in connection with our restructuring. Additionally, as a result of our restructuring, we may experience a loss of continuity, loss of accumulated knowledge and/or inefficiency during transitional periods. Reorganization and restructuring can require a significant amount of management and other employees' time and focus, which may divert attention from operating and growing our business. If we fail to achieve some or all of the expected benefits of restructuring, it could have a material adverse effect on our competitive position, business, financial condition, results of operations and cash flows. For more information about our restructuring plan, including details regarding the plan announced in September 2015, see Note 3 to our Consolidated Financial Statements in Item 8.
Our revenue, cost of sales, and expensesfinancial performance may suffer if we cannot continue to develop, license or enforce the intellectual property rights on which our businesses depend or if third parties assert that we violate their intellectual property rights.depend.
We rely upon patent, copyright, trademark, and trade secret and other intellectual property laws in the United States, similar laws in other countries, and agreements with our employees, customers, suppliers and other parties, to establish and maintain intellectual property rights in the products and services we sell, provide or otherwise use in our operations. However, any of our intellectual property rights could be challenged, invalidated, infringed or circumvented, or such intellectual property rights may not be sufficient to permit us to take advantage of current market trends or to otherwise provide competitive advantages, either of which could result in costly product redesign efforts, discontinuance of certain product offerings or other harm to our competitive position. For example, our enforcement of inkjet printer supplies IP against infringers may be successfully challenged or our IP may be successfully circumvented. Further, the laws of certain countries do not protect proprietary rights to the same extent as the laws of the United States. Therefore, in certain jurisdictions we may be unable to protect our proprietary technology adequately against unauthorized third-party copying or use; this, too, could adversely affect our ability to sell products or services and our competitive position.
Because of the rapid pace of technological changeOur products and services depend in the informationpart on intellectual property and technology industry, muchlicensed from third parties.
Some of our business and manysome of our products rely on key technologies developed or licensed by third-parties. We may not be able to obtain or continue to obtain licenses and technologies from these third-parties at all or on reasonable terms, or such third-parties may demand cross-licenses to our intellectual property. For example, some of our software offerings are developed using software components or other intellectual property licensed from third parties, including through both proprietary and open source licenses. These third-party software components may become obsolete,
defective or incompatible with future versions of our products, or our relationship with the third party may deteriorate, or our agreements with the third party may expire or be terminated. We may face legal or business disputes with licensors that may threaten or lead to the disruption of inbound licensing relationships. In order to remain in compliance with the terms of our licenses, we must carefully monitor and manage our use of third-party software components, including both proprietary and open source license terms that may require the licensing or public disclosure of our intellectual property without compensation or on undesirable terms. Additionally, some of these licenses may not be available to us in the future on terms that are acceptable or that allow our product offerings to remain competitive. Our inability to obtain licenses or rights on favorable terms could have a material effect on our business, including our financial condition and results of operations. In addition, it is possible that as a consequence of a merger or acquisition, third-parties may obtain licenses to some of our intellectual property rights or our business may be subject to certain restrictions that were not in place prior to such transaction. Because the transaction.availability and cost of licenses from third parties depends upon the willingness of third parties to deal with us on the terms we request, there is a risk that third parties who license to our competitors will either refuse to license us at all, or refuse to license us on terms equally favorable to those granted to our competitors. Consequently, we may lose a competitive advantage with respect to these intellectual property rights or we may be required to enter into costly arrangements in order to terminate or limit these rights.
Third-party claims of intellectual property infringement are commonplace in the IT industry and successful third-party claims may limit or disrupt our ability to sell our products and services.
Third-parties also may claim that we or customers indemnified by us are infringing upon their intellectual property rights. For example, individuals and groupspatent assertion entities may purchase intellectual property assets for the purpose of asserting claims of infringement and attempting to extract settlements from companies such as HP Inc. and itsour customers. The number of these claims has increased in recent periods and may continue to increase in the future. If we cannot or do not license allegedly infringed intellectual property at all or on reasonable terms, or if we are required to substitute similar technology from another source, our operations could be adversely affected. Even if we believe that intellectual property claims are without merit, they can be time-consuming and costly to defend against and may divert management's attention and resources away from our business. Claims of intellectual property infringement also might require us to redesign affected products, enter into costly settlement or license agreements, pay costly damage awards, or face a temporary or permanent injunction prohibiting us from importing, marketing or selling certain of our products. Even if we have an agreement to indemnify us against such costs, the indemnifying party may be unable or unwilling to uphold its contractual obligations to us.
Finally,Further, our results of operations and cash flows have been and could continue to be affected in certain periods and on an ongoing basis by the imposition, accrual and payment of copyright levies or similar fees. In certain countries (primarily in Europe), proceedings are ongoing or have been concluded involving HPour company in which groups representing copyright owners have sought or are seeking to impose upon and collect from HP Inc. levies upon equipment (such as PCs, MFDs and printers) alleged to be copying devices under applicable laws. Other such groups have also sought to modify existing levy schemes to increase the amount of the levies that can be collected from us. Other countries that have not imposed levies on these types of devices are expected to extend existing levy schemes, and countries that do not currently have levy schemes may decide to impose copyright levies on these types of devices. The total amount of the copyright levies will depend on the types of products determined to be subject to the levy, the number of units of those products sold during the period covered by the levy, and the per unit fee for each type of product, all of which are affected by several factors, including the outcome of ongoing litigation involving us and other industry participants and possible action by the legislative bodies in the applicable countries, and could be substantial. Consequently, the ultimate impact of these copyright levies or similar fees, and our ability to recover such amounts through increased prices, remains uncertain.
The allocation of intellectual property rights between Hewlett Packard Enterprise Company ("Hewlett Packard Enterprise") and HP Inc. as part of the Separation, and the shared use of certain intellectual property rights following the Separation, could adversely impact our reputation, our ability to enforce certain intellectual property rights that are important to us and our competitive position.
In connection with the Separation, Hewlett-Packard Company allocated to each of Hewlett Packard Enterprise and HP Inc. the intellectual property assets relevant to their businesses. The terms of the Separation include cross-licenses and other arrangements to provide for certain ongoing use of intellectual property in the existing operations of both businesses. For example, through a joint brand holding structure, both Hewlett Packard Enterprise and HP Inc. will retain the ability to make ongoing use of certain variations of the legacy Hewlett-Packard and HP branding, respectively. There is a risk that the joint brand holding structure may impair the enforcement of HP Inc.'s trademark rights against third parties that infringe them. Furthermore, as a result of this shared use of the legacy branding there is a risk that conduct or events adversely affecting the reputation of Hewlett Packard Enterprise could also adversely affect the reputation of HP Inc. In addition, as a result of the allocation of intellectual property as part of the Separation, HP Inc. will no longer have ownership of intellectual property allocated to Hewlett Packard Enterprise and our resulting intellectual property ownership position could adversely affect our position and options relating to patent enforcement, patent licensing and cross-licensing, our ability to sell our products or services, our competitive position in the industry and our ability to enter new product markets.
Our revenuebusiness and profitabilityfinancial performance could suffer if we do not manage the risks associated with our services business properly.
The risks that accompany our services business differ from those of our other businesses and include the following:
Failure to comply with our customer contracts or government contracting regulations could adversely affect our revenuebusiness and results of operations.
Our contracts with our customers may include unique and specialized performance requirements. In particular, our contracts with federal, state, provincial and local governmental customers are subject to various procurement regulations, contract provisions and other requirements relating to their formation, administration and performance. Any failure by us to comply with the specific provisions in our customer contracts or any violation of government contracting regulations could result in the imposition of various civil and criminal penalties, which may include termination of contracts, forfeiture of profits, suspension of payments and, in the case of our government contracts, fines and suspension from future government contracting. Such failures could also cause reputational damage to our business. In addition, we haveHewlett-Packard Company has in the past been, and we may in the future be, subject to qui tam litigation brought by private individuals on behalf of the government relating to our government contracts, which could include claims for up to treble damages. Further, any negative publicity related to our customer contracts or any proceedings surrounding them, regardless of its accuracy, may damage our business by affecting our ability to compete for new contracts. If our customer contracts are terminated, if we are suspended or disbarred from government work, or if our ability to compete for new contracts is adversely affected, weour financial performance could suffer a reduction in expected revenue.suffer.
HP'sHewlett-Packard Company's stock price has historically fluctuated, and our stock price may continue to fluctuate, which may make future prices of HP'sHP Inc.'s stock difficult to predict.
HP'sOur stock price, like that of other technology companies, can be volatile. Some of the factors that could affect our stock price are:
investment transactions, future stock price performance, board of directors, executive team, our competitors or our industry in general;
General or industry specific market conditions or stock market performance or domestic or international macroeconomic and geopolitical factors unrelated to HP'sour performance also may affect the price of HPour stock. For these reasons, investors should not rely on recent or historical trends to predict future stock prices, financial condition, results of operations or cash flows. In addition, as discussed in Note 15 to the Consolidated Financial Statements, we are involved in several securities class action litigation matters. Additional volatility in the price of our securities could result in the filing of additional securities class action litigation matters, which could result in substantial costs and the diversion of management time and resources.
Failure to maintain our credit ratings could adversely affect our liquidity, capital position, borrowing costs and access to capital markets.
Our credit risk is evaluated by the major independent rating agencies. Two of those rating agencies,Fitch Ratings, Moody's InvestorsInvestor Service and Standard & Poor's RatingsRating Services downgraded ourHewlett-Packard Company's ratings once during fiscal 2012, and a third rating agency, Fitch Ratings, downgraded our ratings twice during that fiscal year. In addition, Moody's Investors Service downgraded our ratings again in November 2012. Our credit ratings remain under negative outlook by Moody's Investors Service.the past. Past downgrades have increased the cost of borrowing under our credit facilities, have reduced market capacity for our commercial paper, and may require the posting of additional collateral under some of our derivative contracts. There can be no assuranceWe cannot assure you that we will be able to maintain our current credit ratings, and any additional actual or anticipated changes or downgrades in our credit ratings, including any announcement that our ratings are under further review for a downgrade, may further impact us in a similar manner and may have a negative impact on our liquidity, capital position and access to capital markets.
We make estimates and assumptions in connection with the preparation of HP'sour Consolidated Financial Statements, and any changes to those estimates and assumptions could adversely affect our results of operations.
In connection with the preparation of HP'sour Consolidated Financial Statements, we use certain estimates and assumptions based on historical experience and other factors. Our most critical accounting estimates are described in the section entitled "Management's Discussion and Analysis of Financial Condition and Results of Operations" in Item 7 of this report. In addition, as discussed in Note 1516 to the Consolidated Financial Statements, we make certain estimates, including decisions related to provisions for legal proceedings and other contingencies. While we believe that these estimates and assumptions are reasonable under the circumstances, they are subject to significant uncertainties, some of which are beyond our control. Should any of these estimates and assumptions change or prove to have been incorrect, it could adversely affect our results of operations.
Unanticipated changes in our tax provisions, the adoption of new tax legislation or exposure to additional tax liabilities could affect our profitability.financial performance.
We are subject to income and other taxes in the United States and numerous foreign jurisdictions. Our tax liabilities are affected by the amounts we charge in intercompany transactions for inventory, services, licenses, funding and other items. We are subject to ongoing tax audits in various jurisdictions. Tax authorities may disagree with our intercompany charges, cross-jurisdictional transfer pricing or other matters, and may assess additional taxes.taxes as a result. We regularly assess the likely outcomes of these audits in order to determine the appropriateness of our tax provision. However, there can be no assurancewe cannot assure you that we will accurately predict the outcomes of these audits, and the amounts ultimately paid upon resolution of audits could be materially different from the amounts previously included in our income tax expense and therefore could have a material impact on our tax provision, net income and cash flows. In addition, our effective tax rate in the future could be adversely affected by changes to our operating structure, changes in the mix of earnings in countries with differing statutory tax rates, changes in the valuation of deferred tax assets and liabilities, changes in tax laws and the discovery of
new information in the course of our tax return preparation process. In particular, if circumstances change such that we are unable to indefinitely reinvest our foreign earnings outside the United States, future income tax expense and payments may differ significantly from historical amounts and could materially adversely affect our results of operations. The carrying value of deferred tax assets, which are predominantly in the United States, is dependent on our ability to generate future taxable income in the United States. In addition, there are proposals for tax legislation that have been introduced or that are being considered that could have a significant adverse effect on our tax rate, the carrying value of deferred tax assets, or our deferred tax liabilities. Any of these changes could affect our profitability.financial performance.
In order to be successful, we must attract, retain, train, motivate, develop and transition key employees, and failure to do so could seriously harm us.
In order to be successful, we must attract, retain, train, motivate, develop and transition qualified executives and other key employees, including those in managerial, technical, development, sales, marketing and IT support positions. Identifying, developing internally or hiring externally, training and retaining qualified executives, engineers, skilled solutions providers in the IT support business and qualified sales representatives are critical to our future, and competition for experienced employees in the IT industry can be intense. In order to attract and retain executives and other key employees in a competitive marketplace, we must provide a competitive compensation package, including cash- and share-basedequity-based compensation. Our share-basedequity-based incentive awards include stock options, restricted stock units and performance-based restricted units, some of whichmay contain conditions relating to HP'sour stock price performance and HP'sour long-term financial performance that make the future value of those awards uncertain. If the anticipated value of such share-basedequity-based incentive awards does not materialize, if our share-basedequity-based compensation otherwise ceases to be viewed as a valuable benefit, if our total compensation package is not viewed as being competitive, or if we do not obtain the shareholderstockholder approval needed to continue granting share-basedequity-based incentive awards in the amounts we believe are necessary, our ability to attract, retain and motivate executives and key employees could be weakened. TheOur failure to successfully hire executives and key employees or the loss of any executives and key employees could have a significant impact on our operations. Further, changes in our management team may be disruptive to our business, and any failure to successfully transition and assimilate key new hires or promoted employees could adversely affect our business and results of operations.
System security risks, data protection breaches, cyber attackscyberattacks and systems integration issues could disrupt our internal operations or information technology services provided to customers, and any such disruption could reduce our expected revenue, increase our expenses, damage our reputation and adversely affect our stock price.
Experienced computer programmers and hackers may be able to penetrate our network security and misappropriate or compromise our confidential information or that of third-parties,third parties, create system disruptions or cause shutdowns. Computer programmers and hackers also may be able to develop and
deploy viruses, worms, and other malicious software programs that attack our products or otherwise exploit any security vulnerabilities of our products. In addition, sophisticated hardware and operating system software and applications that we produce or procure from third-parties may contain defects in design or manufacture, including "bugs" and other problems that could unexpectedly interfere with the operation of the system. The costs to us to eliminate or alleviate cyber or other security problems, including bugs, viruses, worms, malicious software programs and other security vulnerabilities, could be significant, and our efforts to address these problems may not be successful and could result in interruptions, delays, cessation of service and loss of existing or potential customers that may impede our sales, manufacturing, distribution or other critical functions.
We manage and store various proprietary information and sensitive or confidential data relating to our business. In addition,business and our outsourcing services business routinely processes, stores and transmits large amounts of data for our clients, including sensitive and personally identifiable information.customers. Breaches of our security measures or the accidental loss, inadvertent disclosure or unapproved dissemination of proprietary information or sensitive or confidential data
about us, our clients or our customers, including the potential loss or disclosure of such information or data as a result of fraud, trickery or other forms of deception, could expose us, our customers or the individuals affected to a risk of loss or misuse of this information, result in litigation and potential liability for us, damage our brand and reputation or otherwise harm our business. We also could lose existing or potential customers of outsourcing services or other IT solutions or incur significant expenses in connection with our customers' system failures or any actual or perceived security vulnerabilities in our products and services. In addition, the cost and operational consequences of implementing further data protection measures could be significant.
Portions of our IT infrastructure also may experience interruptions, delays or cessations of service or produce errors in connection with systems integration or migration work that takes place from time to time. We may not be successful in implementing new systems and transitioning data, which could cause business disruptions and be more expensive, time-consuming, disruptive and resource intensive. Such disruptions could adversely impact our ability to fulfill orders and respond to customer requests and interrupt other processes. Delayed sales, lower margins or lost customers resulting from these disruptions could reduce our expected revenue, increase our expenses, damage our reputation and adversely affect our stock price.
Terrorist acts, conflicts, wars and geopolitical uncertainties may seriously harm our business and revenue, costs and expenses and financial condition and stock price.
Terrorist acts, conflicts or wars (wherever located around the world) may cause damage or disruption to our business, our employees, facilities, partners, suppliers, distributors, resellers or customers or adversely affect our ability to manage logistics, operate our transportation and communication systems or conduct certain other critical business operations. The potential for future attacks, the national and international responses to attacks or perceived threats to national security, and other actual or potential conflicts or wars have created many economic and political uncertainties. In addition, as a major multinational company with headquarters and significant operations located in the United States, actions against or by the United States may impact our business or employees. Although it is impossible to predict the occurrences or consequences of any such events, if they occur, they could result in a decrease in demand for our products, make it difficult or impossible to provide services or deliver products to our customers or to receive components from our suppliers, create delays and inefficiencies in our supply chain and result in the need to impose employee travel restrictions. We are predominantly uninsured for losses and interruptions caused by terrorist acts, conflicts and wars.
Unforeseen environmentalOur business is subject to various federal, state, local and foreign laws and regulations that could result in costs couldor other sanctions that adversely affect our business and results of operations.
We are subject to various federal, state, local and foreign laws and regulations. For example, we are subject to laws and regulations concerning environmental protection, including laws addressing the discharge of pollutants into the air and water, the management and disposal of hazardous substances and wastes, the cleanupclean-up of contaminated sites, the content of our products and the recycling, treatment and disposal of our products, including batteries. In particular, we face increasing complexity in our product design and procurement operations as we adjust to new and future requirements relating to the chemical and materials composition of our products, their safe use, the energy consumption associated with those products, climate change laws and regulations, and product take-back legislation. If we were to violate or become liable under environmental laws or if our products become non- compliantnon-compliant with environmental laws, we could incur substantial costs or face other sanctions, which may include restrictions on our products entering certain jurisdictions. Our potential exposure includes fines and civil or criminal sanctions, third-party property damage, personal injury claims and clean-up costs. Further, liability under some environmental laws relating to contaminated sites can be imposed
retroactively, on a joint and several basis, and without any finding of noncompliance or fault. The amount and timing of costs to comply with environmental laws are difficult to predict.
Some anti-takeover provisions contained in our certificate of incorporation and bylaws, as well as provisions of Delaware law, could impair a takeover attempt.
We have provisions in our certificate of incorporation and bylaws each of which could have the effect of rendering more difficult or discouraging an acquisition of HP Inc. deemed undesirable by our Board of Directors. These include provisions:
These provisions, alone or together, could deter or delay hostile takeovers, proxy contests and changes in control or management of HP.our management. As a Delaware corporation, we are also subject to provisions of Delaware law, including Section 203 of the Delaware General Corporation Law, which prevents some stockholders from engaging in certain business combinations without approval of the holders of substantially all of our outstanding common stock.
Any provision of our certificate of incorporation or bylaws or Delaware law that has the effect of delaying or deterring a change in control of HP Inc. could limit the opportunity for our stockholders to receive a premium for their shares of HPour stock and also could affect the price that some investors are willing to pay for our stock.
Risks Related to the Separation
The separation of Hewlett-Packard Company into two independent publicly-traded companies is subject to various risks and uncertainties and may not achieve some or all of the anticipated benefits.
On November 1, 2015, we completed the Separation of our enterprise technology infrastructure, software, services and financing businesses from its personal systems and printing businesses. The process of completing the Separation has involved significant costs and expenses. Uncertainty related to the Separation may lead customers and other parties with which we currently do business or may do business in the future to terminate or attempt to negotiate changes in our existing business relationships, or cause them to consider entering into business relationships with parties other than us. These disruptions could have a material and adverse effect on our businesses, financial condition, results of operations and prospects.
We may not realize some or all of the anticipated strategic, financial, operational, marketing or other benefits from the separation. As an independent publicly-traded company we are a smaller, less diversified company with a narrower business focus and may be more vulnerable to changing market conditions, which could materially and adversely affect its business, financial condition and results of operations.
The Separation could result in substantial tax liability.
We obtained an opinion of outside counsel that, for U.S. federal income tax purposes, the Separation qualified, for both the company and our stockholders, as a reorganization within the meaning of Sections 368(d)(1)(D) and 355 of the U.S. Internal Revenue Code of 1986, as amended. In addition, we obtained a private letter ruling from the Internal Revenue Service (the "IRS") and opinions of outside counsel regarding certain matters impacting the U.S. federal income tax treatment of the Separation for the company and certain related transactions as transactions that are generally tax-free for U.S. federal income tax purposes. The opinions of outside counsel and the IRS private letter ruling were based, among other things, on various factual assumptions we have authorized and representations we have made to outside counsel and the IRS. If any of these assumptions or representations are, or become, inaccurate or incomplete, reliance on the opinions and IRS private letter ruling may be affected. An opinion of outside counsel represents their legal judgement but is not binding on the IRS or any court. Accordingly, there can be no assurance that the IRS will not challenge the conclusions reflected in the opinions or that a court would not sustain such a challenge. Notwithstanding the foregoing, we incurred certain tax costs in connection with the Separation, including non-U.S. tax expenses resulting from the Separation in multiple non-U.S. jurisdictions that do not legally provide for tax-free Separation, which may be material. If the Separation or certain internal transactions undertaken in anticipation of the Separation are determined to be taxable for U.S. federal income tax purposes, we, our stockholders that are subject to U.S. federal income tax and/or Hewlett Packard Enterprise could incur significant U.S. federal income tax liabilities.
Hewlett Packard Enterprise or HP stock.Inc. may fail to perform under the transaction agreements executed as part of the Separation.
In connection with the Separation, Hewlett Packard Enterprise and HP Inc. entered into several agreements, including among others a transition services agreement, a separation and distribution agreement, a tax matters agreement, an employee matters agreement, a real estate matters agreement, a commercial agreement and an IT service agreement. The transition services agreement provides for the performance of certain services by each company for the benefit of the other for a transition period after the Separation. The separation and distribution agreement, tax matters agreement, employee matters agreement and real estate matters agreement determine the allocation of assets and liabilities between the companies following the Separation for those respective areas and include any necessary indemnifications related to liabilities and obligations. The commercial agreement establishes a bilateral relationship between Hewlett Packard Enterprise and us for the purchase and sale of commercially available products and services for internal use, incorporation and bundling in OEM products and services, resale to customers and use in the provision of managed services to customers, as well as joint customer pursuits and joint development activities. The IT service agreement provides for the performance by one of Hewlett Packard Enterprise's subsidiaries of certain application development and maintenance and IT infrastructure services for us. We will rely on Hewlett Packard Enterprise to satisfy its performance and payment obligations under these agreements. If Hewlett Packard Enterprise is unable to satisfy its obligations under these agreements, we could incur operational difficulties or losses that could have a material and adverse effect on our business, financial condition and results of operations.
ITEM 1B. Unresolved Staff Comments.
None.
As of October 31, 2014,2015, we owned or leased approximately 6670 million square feet of space worldwide, a summary of which is provided below.
| | Fiscal year ended October 31, 2015 | |||||||||
|---|---|---|---|---|---|---|---|---|---|---|
| | Owned | Leased | Total | |||||||
| | (square feet in millions) | |||||||||
Administration and support | 11 | 23 | 34 | |||||||
(Percentage) | 32 | % | 68 | % | 100 | % | ||||
Core data centers, manufacturing plants, research and development facilities and warehouse operations | 14 | 16 | 30 | |||||||
(Percentage) | 47 | % | 53 | % | 100 | % | ||||
| | | | | | | | | | | |
Total(1) | 25 | 39 | 64 | |||||||
(Percentage) | 39 | % | 61 | % | 100 | % | ||||
In connection with the Separation, as of November 1, 2015, we transferred a total of approximately 51 million square feet of space worldwide to Hewlett Packard Enterprise. Of that, Hewlett Packard Enterprise owned approximately 21 million square feet and leased approximately 30 million square feet of space. We believe that our existing properties are in good condition and are suitable for the conduct of our business.
| | As of October 31, 2014 | |||||||||
|---|---|---|---|---|---|---|---|---|---|---|
| | Owned | Leased | Total | |||||||
| | Square feet in millions | |||||||||
Administration and support | 11 | 19 | 30 | |||||||
| 37 | % | 63 | % | 100 | % | |||||
Core data centers, manufacturing plants, research and development facilities, and warehouse operations | 15 | 14 | 29 | |||||||
| 52 | % | 48 | % | 100 | % | |||||
Total(1) | 26 | 33 | 59 | |||||||
| 44 | % | 56 | % | 100 | % | |||||
We have seven business segments: Personal Systems, Printing, the Enterprise Group, Enterprise Services, Software, HP Financial Services and Corporate Investments. Because of the interrelation of theseour segments, a majority of theseour segments use substantially all of the properties at least in part, and we retain the flexibility to use each of the properties in whole or in part for each of the segments.
Principal Executive Offices
Our principal executive offices, including our global headquarters, are located at 3000 Hanover Street,1501 Page Mill Road, Palo Alto, California, United States of America.
Headquarters of Geographic Operations
The locations of our geographic headquarters at October 31, 2014 wereare as follows:
| Americas | Europe, Middle East, Africa | Asia Pacific | ||
|---|---|---|---|---|
| Houston, United States Mississauga, Canada | Geneva, Switzerland | Singapore Tokyo, Japan |
Product Development, Services and Manufacturing
The locations of our major product development, manufacturing, data centers and HP Labs facilities at October 31, 2014, wereare as follows:
| Americas Canada—Markham, Mississauga Puerto United States—Alpharetta, Andover, Auburn Hills, Austin, | Europe, Middle East, Africa Spain—Barcelona United Kingdom—Billingham, Erskine, Norwich, Sunderland | |
Asia Pacific | HP Labs United United |
Information with respect to this item may be found in Note 1516 to the Consolidated Financial Statements in Item 8, which is incorporated herein by reference.
ITEM 4. Mine Safety Disclosures.
Not applicable.
ITEM 5. Market for Registrant's Common Equity, Related Stockholder Matters and Issuer Purchases of Equity Securities.
Information regarding the market prices of HP common stock and the markets for that stock may be found in the "Quarterly Summary" in Item 8 and on the cover page of this Annual Report on Form 10-K, respectively, which are incorporated herein by reference. We have declared and paid cash dividends each fiscal year since 1965. Dividends declared and paid per share by fiscal quarter in 20142015 and 20132014 were as follows:
| | 2014 | 2013 | 2015 | 2014 | ||||||||||||||||||||||||||||||||||||||||||||||
|---|---|---|---|---|---|---|---|---|---|---|---|---|---|---|---|---|---|---|---|---|---|---|---|---|---|---|---|---|---|---|---|---|---|---|---|---|---|---|---|---|---|---|---|---|---|---|---|---|---|---|
| | Q4 | Q3 | Q2 | Q1 | Q4 | Q3 | Q2 | Q1 | Q4 | Q3 | Q2 | Q1 | Q4 | Q3 | Q2 | Q1 | ||||||||||||||||||||||||||||||||||
Dividends declared | — | $ | 0.32 | — | $ | 0.29 | — | $ | 0.29 | — | $ | 0.26 | — | $ | 0.35 | — | $ | 0.32 | — | $ | 0.32 | — | $ | 0.29 | ||||||||||||||||||||||||||
Dividends paid | $ | 0.16 | $ | 0.16 | $ | 0.15 | $ | 0.15 | $ | 0.15 | $ | 0.15 | $ | 0.13 | $ | 0.13 | $ | 0.18 | $ | 0.18 | $ | 0.16 | $ | 0.16 | $ | 0.16 | $ | 0.16 | $ | 0.15 | $ | 0.15 | ||||||||||||||||||
As of November 30, 2014, there were approximately 95,719 stockholders of record. Additional information concerning dividends may be found in "Selected Financial Data" in Item 6 and Note 1314 to the Consolidated Financial Statements in Item 8, which are incorporated herein by reference.
As of November 30, 2015, there were approximately 71,910 stockholders of record.
In connection with the Separation, on November 1, 2015, we completed the distribution of the outstanding common stock of Hewlett Packard Enterprise to our stockholders as of the close of business on October 21, 2015, the record date for the distribution. Our stockholders received one share of Hewlett Packard Enterprise common stock for every one share of our common stock held at the close of business on the record date. We distributed a total of approximately 1.8 billion shares of Hewlett Packard Enterprise common stock to our stockholders.
Recent Sales of Unregistered Securities
On October 9, 2015, Hewlett Packard Enterprise completed the offering of senior unsecured notes in aggregate principal amount of $14.6 billion (the "Notes") through private placement to qualified institutional buyers pursuant to Rule 144A under the Securities Act of 1933, as amended (the "Securities Act"), and to certain non-U.S. persons in accordance with Regulation S under the Securities Act. The Notes issued by Hewlett Packard Enterprise have not been registered under the Securities Act or any state securities laws.
There were no unregistered sales of equity securities in fiscal 2014.2015.
Issuer Purchases of Equity Securities
Period | Total Number of Shares Purchased | Average Price Paid per Share | Total Number of Shares Purchased as Part of Publicly Announced Plans or Programs | Approximate Dollar Value of Shares that May Yet Be Purchased under the Plans or Programs | ||||||||||||||||||||||
|---|---|---|---|---|---|---|---|---|---|---|---|---|---|---|---|---|---|---|---|---|---|---|---|---|---|---|
Fourth Quarter of Fiscal 2015 | Total Number of Shares Purchased | Average Price Paid per Share | Total Number of Shares Purchased as Part of Publicly Announced Plans or Programs | Approximate Dollar Value of Shares that May Yet Be Purchased under the Plans or Programs | ||||||||||||||||||||||
| | In thousands, except per share amounts | In thousands, except per share amounts | ||||||||||||||||||||||||
Month #1 | — | $ | — | — | $ | 5,666,443 | ||||||||||||||||||||
Month #2 | — | $ | — | — | $ | 5,666,443 | ||||||||||||||||||||
Month #3 | 21,661 | $ | 34.61 | 21,661 | $ | 4,916,793 | ||||||||||||||||||||
Month #1 | 3,429 | $ | 28.90 | 3,429 | $ | 2,235,197 | ||||||||||||||||||||
Month #2 | 3,641 | $ | 27.11 | 3,641 | $ | 2,136,497 | ||||||||||||||||||||
Month #3 | 3,732 | $ | 27.70 | 3,732 | $ | 2,033,098 | ||||||||||||||||||||
| | | | | | | | | | | | | | | | | | | | | | ||||||
Total | 21,661 | $ | 34.61 | 21,661 | 10,802 | $ | 27.88 | 10,802 | ||||||||||||||||||
| | | | | | | | | | | | | | | | | | | | | | | |||||
| | | | | | | | | | | | | |||||||||||||||
On July 21, 2011, HP's Board of Directors authorized a $10.0 billion share repurchase program. HP may choose to repurchase shares when sufficient liquidity exists and the shares are trading at a discount relative to estimated intrinsic value. This program, which does not have a specific expiration date, authorizes repurchases in the open market or in private transactions. All share repurchases settled in the fourth quarter of fiscal 20142015 were open market transactions. As of October 31, 2014,2015, HP had remaining authorization of $4.9$2.0 billion for future share repurchases.
Stock Performance Graph and Cumulative Total Return
The graph below shows the cumulative total stockholder return assuming the investment of $100 at the market close on October 31, 20092010 (and the reinvestment of dividends thereafter) in each of HP common stock, the S&P 500 Index, and the S&P Information Technology Index. The comparisons in the graph below are based on historical data and are not indicative of, or intended to forecast, future performance of our common stock.
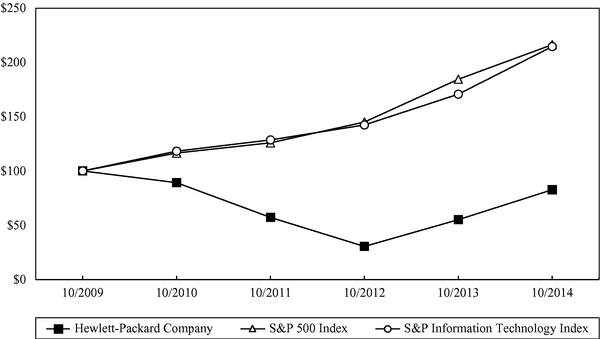
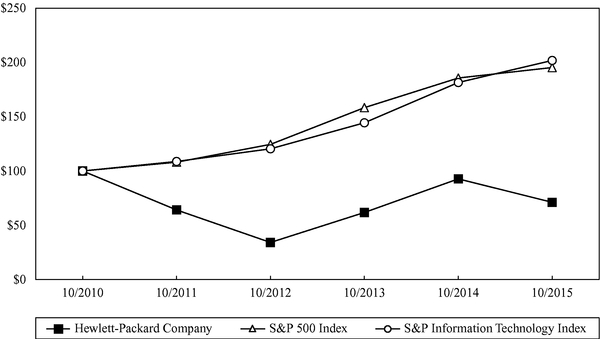
| | 10/09 | 10/10 | 10/11 | 10/12 | 10/13 | 10/14 | 10/10 | 10/11 | 10/12 | 10/13 | 10/14 | 10/15 | ||||||||||||||||||||||||||
|---|---|---|---|---|---|---|---|---|---|---|---|---|---|---|---|---|---|---|---|---|---|---|---|---|---|---|---|---|---|---|---|---|---|---|---|---|---|---|
Hewlett-Packard Company | 100.00 | 89.19 | 57.17 | 30.45 | 55.10 | 82.69 | 100.00 | 64.10 | 34.14 | 61.77 | 92.71 | 71.13 | ||||||||||||||||||||||||||
S&P 500 Index | 100.00 | 116.51 | 125.93 | 145.06 | 184.48 | 216.31 | 100.00 | 108.08 | 124.51 | 158.33 | 185.66 | 195.3 | ||||||||||||||||||||||||||
S&P Information Technology Index | 100.00 | 118.23 | 128.59 | 142.37 | 170.72 | 214.60 | 100.00 | 108.76 | 120.42 | 144.39 | 181.5 | 201.82 | ||||||||||||||||||||||||||
ITEM 6. Selected Financial Data.
The information set forth below includes the results of Hewlett Packard Enterprise which separated from HP on November 1, 2015 and is not necessarilyan indicative of results of future operations andcontinuing operations. The information set forth below should be read in conjunction with Item 7, "Management's Discussion and Analysis of Financial Condition and Results of Operations," and the Consolidated Financial Statements and notes thereto included in Item 8, "Financial Statements and Supplementary Data," of this Annual Report on Form 10-K, which are incorporated herein by reference, in order to understand further the factors that may affect the comparability of the financial data presented below.
HEWLETT-PACKARD COMPANYHP INC. AND SUBSIDIARIES
Selected Financial Data
| | For the fiscal years ended October 31 | For the fiscal years ended October 31 | ||||||||||||||||||||||||||||||
|---|---|---|---|---|---|---|---|---|---|---|---|---|---|---|---|---|---|---|---|---|---|---|---|---|---|---|---|---|---|---|---|---|
| | 2014 | 2013 | 2012 | 2011 | 2010 | 2015 | 2014 | 2013 | 2012 | 2011 | ||||||||||||||||||||||
| | In millions, except per share amounts | In millions, except per share amounts | ||||||||||||||||||||||||||||||
Net revenue | $ | 111,454 | $ | 112,298 | $ | 120,357 | $ | 127,245 | $ | 126,033 | $ | 103,355 | $ | 111,454 | $ | 112,298 | $ | 120,357 | $ | 127,245 | ||||||||||||
Earnings (loss) from operations(1) | $ | 7,185 | $ | 7,131 | $ | (11,057 | ) | $ | 9,677 | $ | 11,479 | $ | 5,471 | $ | 7,185 | $ | 7,131 | $ | (11,057 | ) | $ | 9,677 | ||||||||||
Net earnings (loss)(1) | $ | 5,013 | $ | 5,113 | $ | (12,650 | ) | $ | 7,074 | $ | 8,761 | $ | 4,554 | $ | 5,013 | $ | 5,113 | $ | (12,650 | ) | $ | 7,074 | ||||||||||
Net earnings (loss) per share | ||||||||||||||||||||||||||||||||
Basic | $ | 2.66 | $ | 2.64 | $ | (6.41 | ) | $ | 3.38 | $ | 3.78 | $ | 2.51 | $ | 2.66 | $ | 2.64 | $ | (6.41 | ) | $ | 3.38 | ||||||||||
Diluted | $ | 2.62 | $ | 2.62 | $ | (6.41 | ) | $ | 3.32 | $ | 3.69 | $ | 2.48 | $ | 2.62 | $ | 2.62 | $ | (6.41 | ) | $ | 3.32 | ||||||||||
Cash dividends declared per share | $ | 0.61 | $ | 0.55 | $ | 0.50 | $ | 0.40 | $ | 0.32 | $ | 0.67 | $ | 0.61 | $ | 0.55 | $ | 0.50 | $ | 0.40 | ||||||||||||
At year-end: | ||||||||||||||||||||||||||||||||
Total assets(2) | $ | 103,206 | $ | 105,676 | $ | 108,768 | $ | 129,517 | $ | 124,503 | $ | 106,882 | $ | 103,206 | $ | 105,676 | $ | 108,768 | $ | 129,517 | ||||||||||||
Long-term debt | $ | 16,039 | $ | 16,608 | $ | 21,789 | $ | 22,551 | $ | 15,258 | $ | 21,780 | $ | 16,039 | $ | 16,608 | $ | 21,789 | $ | 22,551 | ||||||||||||
Total debt(3) | $ | 19,525 | $ | 22,587 | $ | 28,436 | $ | 30,634 | $ | 22,304 | $ | 24,665 | $ | 19,525 | $ | 22,587 | $ | 28,436 | $ | 30,634 | ||||||||||||
| | 2014 | 2013 | 2012 | 2011 | 2010 | 2015 | 2014 | 2013 | 2012 | 2011 | ||||||||||||||||||||||
|---|---|---|---|---|---|---|---|---|---|---|---|---|---|---|---|---|---|---|---|---|---|---|---|---|---|---|---|---|---|---|---|---|
| | In millions | In millions | ||||||||||||||||||||||||||||||
Amortization of intangible assets | $ | 1,000 | $ | 1,373 | $ | 1,784 | $ | 1,607 | $ | 1,484 | $ | 931 | $ | 1,000 | $ | 1,373 | $ | 1,784 | $ | 1,607 | ||||||||||||
Impairment of goodwill and intangible assets | — | — | 18,035 | 885 | — | — | — | — | 18,035 | 885 | ||||||||||||||||||||||
Wind down of webOS device business | — | — | (36 | ) | 755 | — | — | — | — | (36 | ) | 755 | ||||||||||||||||||||
Wind down of non-strategic businesses | — | — | 108 | — | — | — | — | — | 108 | — | ||||||||||||||||||||||
Restructuring charges | 1,619 | 990 | 2,266 | 645 | 1,144 | 1,017 | 1,619 | 990 | 2,266 | 645 | ||||||||||||||||||||||
Acquisition-related charges | 11 | 22 | 45 | 182 | 293 | |||||||||||||||||||||||||||
Separation costs | 1,259 | — | — | — | — | |||||||||||||||||||||||||||
Defined benefit plan settlement charges | 168 | — | — | — | — | |||||||||||||||||||||||||||
Impairment of data center assets | 136 | — | — | — | — | |||||||||||||||||||||||||||
Acquisition and other related charges | 90 | 11 | 22 | 45 | 182 | |||||||||||||||||||||||||||
| | | | | | | | | | | | | | | | | | | | | | | | | | | | | |||||
Total charges before taxes | $ | 2,630 | $ | 2,385 | $ | 22,202 | $ | 4,074 | $ | 2,921 | $ | 3,601 | $ | 2,630 | $ | 2,385 | $ | 22,202 | $ | 4,074 | ||||||||||||
| | | | | | | | | | | | | | | | | | | | | | | | | | | | | | ||||
| | | | | | | | | | | | | | | | | | ||||||||||||||||
Total charges, net of taxes | $ | 2,132 | $ | 1,825 | $ | 20,685 | $ | 3,130 | $ | 2,105 | $ | 2,737 | $ | 2,132 | $ | 1,825 | $ | 20,685 | $ | 3,130 | ||||||||||||
| | | | | | | | | | | | | | | | | | | | | | | | | | | | | | ||||
| | | | | | | | | | | | | | | | | | ||||||||||||||||
ITEM 7. Management's Discussion and Analysis of Financial Condition and Results of Operations.
HEWLETT-PACKARD COMPANYHP INC. AND SUBSIDIARIES
Management's Discussion and Analysis of
Financial Condition and Results of Operations
This Management's Discussion and Analysis of Financial Condition and Results of Operations ("MD&A") is organized as follows:
We intend the discussion of our financial condition and results of operations that follows to provide information that will assist the reader in understanding our Consolidated Financial Statements, the changes in certain key items in those financial statements from year to year, and the primary factors that accounted for those changes, as well as how certain accounting principles, policies and estimates affect our Consolidated Financial Statements. This discussion should be read in conjunction with our Consolidated Financial Statements and the related notes that appear elsewhere in this document.
October 2014 Announcement of HP Separation Transaction
On October 6, 2014,November 1, 2015 (the "Distribution Date"), we announced plans to separate into two independent publicly-traded companies: one comprising ourcompleted the separation of Hewlett Packard Enterprise, Hewlett-Packard Company's former enterprise technology infrastructure, software, services and financing businesses which will conduct business as(the "Separation"). In connection with the Separation, Hewlett-Packard Enterprise and one that will comprise our printing and personal systems businesses, which will conduct business asCompany changed its name to HP Inc. The separation is subject to certain conditions, including, among others, obtaining final approval from HP's Board
On November 1, 2015, each of Directors, receiptour stockholders of a favorable opinion and/or rulings with respect to the tax-free naturerecord as of the transactionclose of business on October 21, 2015 (the "Record Date") received one share of Hewlett Packard Enterprise common stock for federal income tax purposes andevery one share of our common stock held as of the effectivenessRecord Date. We distributed a total of a Form 10 filing with the SEC. The separation is expected to be completed by the end of fiscal 2015. Under the separation plan, HP shareholders will ownapproximately 1.8 billion shares of both Hewlett-PackardHewlett Packard Enterprise and HP Inc. The following chart providescommon stock to our stockholders.
Hewlett Packard Enterprise is now an overviewindependent public company trading on the New York Stock Exchange ("NYSE") under the symbol "HPE". After the Separation, we do not beneficially own any shares of the planned separation and segment revenues of the respective businesses based on HP's fiscal 2014 results, excluding Corporate Investments and intercompany eliminations.Hewlett Packard Enterprise common stock.
HEWLETT-PACKARD COMPANYHP INC. AND SUBSIDIARIES
Management's Discussion and Analysis of
Financial Condition and Results of Operations (Continued)
The following Overview, ResultsWe recorded a deferred tax asset on these costs and expenses as they were incurred through fiscal 2015. We expect a portion of Operationsthese deferred tax assets associated with separation costs and Liquidity discussionsexpenses will be eliminated, given that some will be non-deductible, at the time the Separation is executed. Furthermore, we concluded on the legal form of the Separation and analysis comparein May 2015 announced that Hewlett Packard Enterprise will be the spinnee company in the United States ("U.S."). Accordingly, we implemented certain internal reorganizations of, and transactions among, our wholly-owned subsidiaries and operating activities in preparation for the legal form of separation. As a result, we recognized gross incremental foreign tax expenses related to the separation of foreign legal entities of approximately $300 million and foreign tax credits of approximately $100 million in fiscal 2014 to fiscal 2013 and fiscal 2013 to fiscal 2012, unless otherwise noted. The Capital Resources and Contractual and Other Obligations discussions present information as2015 with additional tax credit amounts expected over several years. As of October 31, 2014, unless otherwise noted.2015, we also expect separation-related capital expenditures of approximately $30 million in fiscal 2016.
In connection with the Separation, we and Hewlett Packard Enterprise have entered into a separation and distribution agreement as well as various other agreements that provide a framework for the relationships between the parties going forward, including among others a tax matters agreement, an employee matters agreement, a transition service agreement, a real estate matters agreement, a master commercial agreement and an information technology service agreement. In the fourth quarter of fiscal 2015, we transferred substantially all of the assets, liabilities and operations of enterprise technology infrastructure, software, services and financing businesses to Hewlett Packard Enterprise in the fourth fiscal quarter of 2015.
The historical results of operations and the financial position of Hewlett Packard Enterprise are included in the consolidated financial statements of HP Inc. for each of the fiscal years included in this report and will be reported as discontinued operations beginning in the first quarter of fiscal 2016. Beginning November 1, 2015, we no longer consolidate Hewlett Packard Enterprise within our financial results or reflect the financial results of Hewlett Packard Enterprise within our continuing results of operations.
OVERVIEW
We areAs of October 31, 2015, we were a leading global provider of products, technologies, software, solutions and services to individual consumers, small- and medium-sized businesses ("SMBs") and large enterprises, including customers in the government, health and education sectors. Our offerings span the following:
HP INC. AND SUBSIDIARIES
Management's Discussion and Analysis of
Financial Condition and Results of Operations (Continued)
As of October 31, 2015, we had seven segments for financial reporting purposes: Personal Systems, Printing, the Enterprise Group ("EG"), Enterprise Services ("ES"), Software, HP Financial Services ("HPFS") and Corporate Investments.
Table Effective November 1, 2015, we report three segments as part of Contents
HEWLETT-PACKARD COMPANY AND SUBSIDIARIES
Management's Discussioncontinuing operations: Personal Systems, Printing and Analysis ofFinancial Condition and Results of Operations (Continued)Corporate Investments.
The following provides an overview of our key financial metrics by segment for fiscal 2014:2015:
| | | Printing and Personal Systems Group | | | | | | | Printing and Personal Systems Group | | | | | | ||||||||||||||||||||||||||||||||||||||||||
|---|---|---|---|---|---|---|---|---|---|---|---|---|---|---|---|---|---|---|---|---|---|---|---|---|---|---|---|---|---|---|---|---|---|---|---|---|---|---|---|---|---|---|---|---|---|---|---|---|---|---|---|---|---|---|---|---|
| | HP Consolidated | Personal Systems | Printing | Total | Enterprise Group | Enterprise Services | Software | HPFS | Corporate Investments(2) | HP Consolidated | Personal Systems | Printing | Total | Enterprise Group | Enterprise Services | Software | HPFS | Corporate Investments(3) | ||||||||||||||||||||||||||||||||||||||
| | Dollars in millions, except per share amounts | | Dollars in millions, except per share amounts | | ||||||||||||||||||||||||||||||||||||||||||||||||||||
Net revenue(1) | $ | 111,454 | $ | 34,303 | $ | 22,979 | $ | 57,282 | $ | 27,814 | $ | 22,398 | $ | 3,933 | $ | 3,498 | $ | 302 | $ | 103,355 | $ | 31,469 | $ | 21,232 | $ | 52,701 | $ | 27,907 | $ | 19,806 | $ | 3,458 | $ | 3,216 | $ | 27 | ||||||||||||||||||||
Year-over-year change % | (0.8 | )% | 6.6 | % | (3.8 | )% | 2.2 | % | (1.0 | )% | (6.9 | )% | (2.2 | )% | (3.6 | )% | NM | (7.3 | )% | (8.3 | )% | (8.5 | )% | (8.4 | )% | 0.7 | % | (11.6 | )% | (6.6 | )% | (8.1 | )% | (91.1 | )% | |||||||||||||||||||||
Earnings from operations | $ | 7,185 | $ | 1,270 | $ | 4,185 | $ | 5,455 | $ | 4,008 | $ | 803 | $ | 872 | $ | 389 | $ | (199 | ) | $ | 5,471 | $ | 1,064 | $ | 3,865 | $ | 4,929 | $ | 3,981 | $ | 1,051 | $ | 760 | $ | 349 | $ | (565 | ) | ||||||||||||||||||
Earnings from operations as a % of net revenue | 6.4 | % | 3.7 | % | 18.2 | % | 9.5 | % | 14.4 | % | 3.6 | % | 22.2 | % | 11.1 | % | NM | 5.3 | % | 3.4 | % | 18.2 | % | 9.4 | % | 14.3 | % | 5.3 | % | 22.0 | % | 10.9 | % | NM | ||||||||||||||||||||||
Year-over-year change percentage points | 0.0 | pts | 0.7 | pts | 1.7 | pts | 0.7 | pts | (0.8 | ) pts | 0.8 | pts | 0.6 | pts | 0.1 | pts | NM | (1.1 | )pts | (0.3 | )pts | 0.0 | pts | (0.2 | )pts | (0.1 | )pts | 1.7 | pts | (0.4 | )pts | (0.2 | )pts | NM | ||||||||||||||||||||||
Net earnings | $ | 5,013 | ||||||||||||||||||||||||||||||||||||||||||||||||||||||
Net earnings per share | ||||||||||||||||||||||||||||||||||||||||||||||||||||||||
Basic | $ | 2.66 | ||||||||||||||||||||||||||||||||||||||||||||||||||||||
Diluted | $ | 2.62 | ||||||||||||||||||||||||||||||||||||||||||||||||||||||
HP consolidated net revenue declined 0.8%7.3% (decreased 0.4%2.1% on a constant currency basis) in fiscal 20142015 as compared to fiscal 2013.2014. The leading contributors to the HP net revenue decline were unfavorable currency impacts across all major segments, key account runoff and soft demand in Infrastructure Technology Outsourcing ("ITO") in ES, and lower Printing supplies volume. Partially offsetting the net revenue decline was growthdesktop sales in Personal Systems and lower sales of printers and supplies. Partially offsetting these declines was growth within the EG segment from commercial personal computers ("PCs"), which experienced growth across all product categories, along with growthsales of ISS servers. Gross margin was 24.0% ($24.8 billion) and 23.9% ($26.6 billion) for fiscal 2015 and 2014, respectively. The 0.1 percentage point increase in consumer notebooks. HP's gross margin increased by 0.8 percentage points in fiscal 2014was due primarily to service delivery efficiencies and improvements in underperforming contracts in ESES. Partially offsetting the gross margin increase was the impact from a higher mix of ISS products in EG, competitive pricing pressures in Printing and favorable currency impactsthe impact from the Japanese Yen and continued cost structure improvementssale of intellectual property ("IP") in Printing.the prior-year period. We continue to experience gross margin pressures resulting from a competitive pricing environment across our hardware portfolio. HP's operating margin was flat fordecreased by 1.1 percentage points in fiscal 20142015 as compared to fiscal 20132014 due primarily to separation costs, pension plan settlement charges, data center impairments and the impact from the sale of IP in the prior-year period. Partially offsetting these
HP INC. AND SUBSIDIARIES
Management's Discussion and Analysis of
Financial Condition and Results of Operations (Continued)
declines was the gross margin increase, improved business performance primarily in Printing, ES and Personal Systems, and lower intangible asset amortization, offset by higher restructuring charges, investments in research and development ("R&D"), and higher selling, general and administrative ("SG&A") expenses. The increase in SG&A expenses was partially offset by gains from sales of real estate.and lower restructuring charges.
Our business continues to produce significant cash flow from operations, generating $12.3 billion in fiscal 2014. Additionally, we invested $3.0 billion in property, plant and equipment net of proceeds from sales, repurchased $2.7 billion of common stock and paid dividends of $1.2 billion to stockholders. As of October 31, 2014,2015, cash and cash equivalents and short- and long-term investments were $15.5$17.7 billion, representing an increase of approximately $3.0$2.2 billion from the October 31, 2013.2014 balance of $15.5 billion. The increase in cash and cash equivalents and short- and long-term investments in fiscal 2015 was primarily due to the following factors: cash received from operating cash flows of $6.5 billion and cash received for net issuances and repayments of debt of $5.0 billion; partially offset by investments in property, plant and equipment and business acquisitions net of divestitures of $3.2 billion and $2.4 billion, respectively, cash utilization for share repurchases of common stock of $2.9 billion and dividend payments to stockholders of $1.2 billion.
We continue to experience challenges that are representative of trends and uncertainties that may affect our business and results of operations. One set of challenges relates to continuing dynamic and accelerating market trends. Anothertrends such as the decline in the PC market. Certain of our legacy hardware businesses face challenges as customers migrate to cloud-based offerings and reduce their purchases of hardware products. A second set of challenges relates to changes in the competitive landscape. Our major competitors are expanding their product and service offerings with integrated products and
HEWLETT-PACKARD COMPANY AND SUBSIDIARIES
Management's Discussion and Analysis ofFinancial Condition and Results of Operations (Continued)
solutions, our business-specific competitors are exerting increased competitive pressure in targeted areas and are entering new markets, our emerging competitors are introducing new technologies and business models, and our alliance partners in some businesses are increasingly becoming our competitors in others. A third set of challenges relates to business model changes and our go-to-market execution.
The macroeconomic weakness we have experienced has moderated in some geographic regions but remains an overall challenge. A discussion of some of these challenges at the segment level is set forth below.
HP INC. AND SUBSIDIARIES
Management's Discussion and Analysis of
Financial Condition and Results of Operations (Continued)
initiative also targets shifting ink into SMBs through our OfficeJet Pro X printers which leverage our Page-Wide Array technology. The Ink in the Office initiative targets shifting ink into SMBs more profitably. In the commercial market, our focus is on placing higher value printer units which also offeroffers a positive annuity of toner.toner and ink and accelerating growth in graphics. We are accomplishing this in twoseveral growth areas,areas: in multi-function and Enterprise Ink printers with recently introduced products that are increasing demand, and in managed print services, which presents a strong after-market supplies opportunity.opportunity, and in graphics with product innovation such as our Indigo product line. We plan to continue this focus on replenishingshifting the mix in the installed base withto more value-added units, and expanding our innovative ink, laser and lasergraphics programs.
HEWLETT-PACKARD COMPANY AND SUBSIDIARIES
Management's Discussion and Analysis ofFinancial Condition and Results of Operations (Continued)
growth in Industry Standard Servers ("ISS"), Networking and TS, due in part to product innovation and new product introductions in cloud and data center computing. These products build on our existing capabilities in cloud, security, big data and converged infrastructure and include CloudSystem 8, HP Helion, HP Apollo and support solutions such as Proactive data center and flexible capacity services.
To address these challenges, we continue to pursue innovation with a view towards developing new products and services aligned with market demand, industry trends and the needs of our customers and partners. In addition, we need to continue to improve our operations, with a particular focus on enhancing our end-to-end processes and efficiencies. We also need to continue to optimize our sales coverage models, align our sales incentives with our strategic goals, improve channel execution, strengthen our capabilities in our areas of strategic focus, and develop and capitalize on market opportunities.
HP INC. AND SUBSIDIARIES
Management's Discussion and Analysis of
Financial Condition and Results of Operations (Continued)
For a further discussion of trends, uncertainties and other factors that could impact our operating results, see the section entitled "Risk Factors" in Item 1A, which is incorporated herein by reference.
CRITICAL ACCOUNTING POLICIES AND ESTIMATES
General
The Consolidated Financial Statements of HP are prepared in accordance with United States ("U.S.") generally accepted accounting principles ("GAAP"), which require management to make estimates, judgments and assumptions that affect the reported amounts of assets, liabilities, net revenue and expenses, and the disclosure of contingent liabilities. Management bases its estimates on historical experience and on various other assumptions that it believes to be reasonable under the circumstances, the results of which form the basis for making judgments about the carrying amount of assets and liabilities that are not readily apparent from other sources. Management has discussed the development, selection and disclosure of these estimates with the Audit Committee of HP's Board of Directors. Management believes that the accounting estimates employed and the resulting amounts are reasonable; however, actual results may differ from these estimates. Making estimates and judgments about future events is inherently unpredictable and is subject to significant uncertainties, some of which are beyond our control. Should any of these estimates and assumptions change or prove to have been incorrect, it could have a material impact on our results of operations, financial position and cash flows.
HEWLETT-PACKARD COMPANY AND SUBSIDIARIES
Management's Discussion and Analysis ofFinancial Condition and Results of Operations (Continued)
A summary of significant accounting policies is included in Note 1 to the Consolidated Financial Statements in Item 8, which is incorporated herein by reference. An accounting policy is deemed to be critical if it requires an accounting estimate to be made based on assumptions about matters that are highly uncertain at the time the estimate is made, if different estimates reasonably could have been used, or if changes in the estimate that are reasonably possible could materially impact the financial statements. Management believes the following critical accounting policies reflect the significant estimates and assumptions used in the preparation of the Consolidated Financial Statements.
Revenue Recognition
We recognize revenue when persuasive evidence of an arrangement exists, delivery has occurred or services are rendered, the sales price or fee is fixed or determinable and collectibilitycollectability is reasonably assured, as well as when other revenue recognition principles are met, including industry specificindustry-specific revenue recognition guidance.
We enter into contracts to sell our products and services, and while many of our sales agreements contain standard terms and conditions, there are agreements we enter into which contain non-standard terms and conditions. Further, many of our arrangements include multiple elements. As a result, significant contract interpretation may be required to determine the appropriate accounting, including the identification of deliverables considered to be separate units of accounting, the allocation of the transaction price among elements in the arrangement and the timing of revenue recognition for each of those elements.
We recognize revenue for delivered elements as separate units of accounting when the delivered elements have standalone value to the customer. For elements with no standalone value, we recognize revenue consistent with the pattern of the associated deliverables.undelivered elements. If the arrangement includes a customer-negotiated refund or return right or other contingency relative to the delivered items and the delivery and performance of the undelivered items is considered probable and substantially within our control, the delivered element constitutes a separate unit of accounting. In arrangements with
HP INC. AND SUBSIDIARIES
Management's Discussion and Analysis of
Financial Condition and Results of Operations (Continued)
combined units of accounting, changes in the allocation of the transaction price betweenamong elements may impact the timing of revenue recognition for the contract but will not change the total revenue recognized for the contract.
We establish the selling prices used for each deliverable based on vendor-specificvendor specific objective evidence ("VSOE") of selling price, if available, third-party evidence ("TPE"), if VSOE of selling price is not available, or estimated selling price ("ESP"), if neither VSOE of selling price nor TPE is available. We establish VSOE of selling price using the price charged for a deliverable when sold separately and, in rare instances, using the price established by management having the relevant authority. TPE of selling price is established by evaluating largely similar and interchangeable competitor products or services in standalone sales to similarly situated customers. ESP is established based on management's judgment considering internal factors such as margin objectives, pricing practices and controls, customer segment pricing strategies and the product life cycle. Consideration is also given to market conditions such as competitor pricing strategies and industry technology life cycles. We may modify or develop new go-to-market practices in the future, which may result in changes in selling prices, impacting both VSOE of selling price and ESP. In most arrangements with multiple elements, the transaction price is allocated to the individual units of accounting at inception of the arrangement based on their relative selling price. However, the aforementioned factors may result in a different allocation of the transaction price to deliverables in multiple element arrangements entered into in future periods. This may change the pattern and timing of revenue recognition for identical
HEWLETT-PACKARD COMPANY AND SUBSIDIARIES
Management's Discussion and Analysis ofFinancial Condition and Results of Operations (Continued)
arrangements executed in future periods, but will not change the total revenue recognized for any given arrangement.
We reduce revenue for customer and distributor programs and incentive offerings, including price protection, rebates, promotions, other volume-based incentives and expected returns. Future market conditions and product transitions may require us to take actions to increase customer incentive offerings, possibly resulting in an incremental reduction of revenue at the time the incentive is offered. For certain incentive programs, we estimate the number of customers expected to redeem the incentive based on historical experience and the specific terms and conditions of the incentive.
For hardware products, we recognize revenue generated from direct sales to end customers and indirect sales to channel partners (including resellers, distributors and value-added solution providers) when the revenue recognition criteria are satisfied. For indirect sales to channel partners, we recognize revenue at the time of delivery when the channel partner has economic substance apart from HP and HP has completed its obligations related to the sale.
For the various software products we sell (e.g., operating system software, network enabling software, ITbig data analytics and applications, application delivery management, software and enterprise security software)and IT Operations Management), we assess whether the software products were sold on a standalone basis or with hardware products. If the software sold with a hardware product is not essential to the functionality of the hardware product and is more-than-incidental, we treat it as a software deliverable.
We recognize revenue from the sale of perpetual software licenses at inception of the license term, assuming all revenue recognition criteria have been satisfied. Term-based software license revenue is generally recognized ratably over the term of the license. We use the residual method to allocate revenue to software licenses at inception of the arrangement when VSOE of fair value for all undelivered elements, such as post-contract customer support, exists and all other revenue recognition criteria have been satisfied. Revenue from maintenance and unspecified upgrades or updates provided
HP INC. AND SUBSIDIARIES
Management's Discussion and Analysis of
Financial Condition and Results of Operations (Continued)
on an if-and-when-availablea when-and-if-available basis is recognized ratably over the period during which such items are delivered.
For hosting or SaaS arrangements, we recognize revenue as the service is delivered, generally on a straight-line basis, over the contractual period of performance. In hosting arrangements, we consider the rights provided to the customer (e.g. whether the customer has the contractual right to take possession of the software at any time during the hosting period without significant penalty and the feasibility of the customer to operate or contract with another vendor to operate the software) in determining whether the arrangement includes the sale of a software license. In hosting arrangements where software licenses are sold, license revenue is generally recognized according to whether perpetual or term licenses are sold, when all other revenue recognition criteria are satisfied. In hosting arrangements that include software licenses, we consider the rights provided to the customer (e.g., ownership of a license, contract termination provisions and feasibility of the customer to operate the software) in determining when to recognize revenue for the licenses.
We recognize revenue from fixed-price support or maintenance contracts, including extended warranty contracts and software post-contract customer support agreements, ratably over the contract period. For certain fixed-price contracts, such as consulting arrangements, we recognize revenue as work progresses using a proportional performance method. We estimate the total expected labor costs in order to determine the amount of revenue earned to date. We apply a proportional performance method because reasonably dependable estimates of the labor costs applicable to various stages of a contract can be made. On fixed-price contracts for design and build projects (to design, develop and construct software infrastructure and systems), we recognize revenue as work progresses using the percentage-of-completion method. We use the cost-to-cost method to measure progress toward completion as determined by the percentage of costcosts incurred to date compared to the total estimated costs of the project. Total project costs are subject to revision throughout the life of a fixed-price contract. Provisions for estimated losses on fixed-price contracts are recognized in the period when such
HEWLETT-PACKARD COMPANY AND SUBSIDIARIES
Management's Discussion and Analysis ofFinancial Condition and Results of Operations (Continued)
losses become known and are recorded as a component of cost of sales. In circumstances when reasonable and reliable cost estimates for a project cannot be made we recognize revenue using the completed contract method.
Outsourcing services revenue is generally recognized in the period when the service is provided and the amount earned is not contingent on the occurrence of any future event. We recognize revenue using an objective measure of output for per unit-priced contracts. Revenue for fixed-price outsourcing contracts with periodic billings is recognized on a straight-line basis if the service is provided evenly over the contract term. Provisions for estimated losses on outsourcing arrangements are recognized in the period when such losses become probable and estimable and are recorded as a component of cost of sales.
Warranty
We accrue the estimated cost of product warranties at the time we recognize revenue. We evaluate our warranty obligations on a product group basis. Our standard product warranty terms generally include post-sales support and repairs or replacement of a product at no additional charge for a specified period of time. While we engage in extensive product quality programs and processes, including actively monitoring and evaluating the quality of our component suppliers, we base our estimated warranty obligation on contractual warranty terms, repair costs, product call rates, average cost per call, current period product shipments and ongoing product failure rates, as well as specific product class failure outside of our baseline experience. Warranty terms generally range from 90 days to three years for parts and labor, depending upon the product. Over the last three fiscal years, the annual warranty expense and actual warranty costs have averaged approximately 2.7%2.5% and 2.9%2.7% of annual net product revenue, respectively.
HP INC. AND SUBSIDIARIES
Management's Discussion and Analysis of
Financial Condition and Results of Operations (Continued)
Restructuring
We have engaged in restructuring actions which require management to estimate the timing and amount of severance and other employee separation costs for workforce reduction and enhanced early retirement programs, fair value of assets made redundant or obsolete, and the fair value of lease cancellation and other exit costs. We accrue for severance and other employee separation costs under these actions when it is probable that benefits will be paid and the amount is reasonably estimable. The rates used in determining severance accruals are based on existing plans, historical experiences and negotiated settlements. For a full description of our restructuring actions, refer to our discussions of restructuring in "Results of Operations" below and in Note 3 to the Consolidated Financial Statements in Item 8, which are incorporated herein by reference.
Retirement and Post-Retirement Benefits
Our pension and other post-retirement benefit costs and obligations depend on various assumptions. Our major assumptions relate primarily to discount rates, mortality rates, expected increases in compensation levels and the expected long-term return on plan assets. The discount rate assumption is based on current investment yields of high-quality fixed-income securities with maturities similar to the expected benefits payment period. Mortality rates help predict the expected life of plan participants and are based on a historical demographic study of the plan. As a result of a historical study of the U.S. plans, in fiscal 2014, HP adopted a new mortality rate table which incorporated newly released mortality rates published by the Society of Actuaries. This resulted in an increase to the projected benefit obligation of approximately $870 million for the U.S. defined benefit plans. The
HEWLETT-PACKARD COMPANY AND SUBSIDIARIES
Management's Discussion and Analysis ofFinancial Condition and Results of Operations (Continued)
expected increase in the compensation levels assumption reflects our long-term actual experience and future expectations. The expected long-term return on plan assets is determined based on asset allocations, historical portfolio results, historical asset correlations and management's expected returns for each asset class. We evaluate our expected return assumptions annually including reviewing current capital market assumptions to assess the reasonableness of the expected long-term return on plan assets. We update the expected long-term return on assets when we observe a sufficient level of evidence that would suggest the long-term expected return has changed. In any fiscal year, significant differences may arise between the actual return and the expected long-term return on plan assets. Historically, differences between the actual return and expected long-term return on plan assets have resulted from changes in target or actual asset allocation, short-term performance relative to expected long-term performance, and to a lesser extent, differences between target and actual investment allocations, the timing of benefit payments compared to expectations, and the use of derivatives intended to effect asset allocation changes or hedge certain investment or liability exposures. For the recognition of net periodic benefit cost, the calculation of the expected long-term return on plan assets uses the fair value of plan assets as of the beginning of the fiscal year.year unless updated as result of interim remeasurement.
Our major assumptions vary by plan, and the weighted-average rates used are set forth in Note 4 to the Consolidated Financial Statements in Item 8, which is incorporated herein by reference. The following table provides the impact changes in the weighted-average assumptions of discount rates, the
HP INC. AND SUBSIDIARIES
Management's Discussion and Analysis of
Financial Condition and Results of Operations (Continued)
expected increase in compensation levels and the expected long-term return on plan assets would have had on our net periodic benefit cost for fiscal 2014:2015:
| | Change in percentage points | Change in Net Periodic Benefit Cost in millions | Change in percentage points | Change in Net Periodic Benefit Cost in millions | ||||||||||
|---|---|---|---|---|---|---|---|---|---|---|---|---|---|---|
Assumptions: | ||||||||||||||
Discount rate | (25 | ) | $ | 83 | (25 | ) | $ | 88 | ||||||
Expected increase in compensation levels | 25 | $ | 20 | 25 | $ | 17 | ||||||||
Expected long-term return on plan assets | (25 | ) | $ | 68 | (25 | ) | $ | 75 | ||||||
Taxes on Earnings
We calculate our current and deferred tax provisions based on estimates and assumptions that could differ from the final positions reflected in our income tax returns. We adjust our current and deferred tax provisions based on income tax returns which are generally filed in the third or fourth quarters of the subsequent fiscal year.
We recognize deferred tax assets and liabilities for the expected tax consequences of temporary differences between the tax bases of assets and liabilities and their reported amounts using enacted tax rates in effect for the year in which we expect the differences to reverse.
We record a valuation allowance to reduce deferred tax assets to the amount that we are more likely than not to realize. In determining the need for a valuation allowance, we consider future market growth, forecasted earnings, future taxable income, the mix of earnings in the jurisdictions in which we operate and prudent and feasible tax planning strategies. In the event we were to determine that it is more likely than not that we will be unable to realize all or part of our deferred tax assets in the future, we would increase the valuation allowance and recognize a corresponding charge to earnings or other comprehensive income in the period in which we make such a determination. Likewise, if we later determine that we are more likely than not to realize the deferred tax assets, we would reverse the applicable portion of the previously recognized valuation allowance. In order for us to realize our deferred tax assets, we must be able to generate sufficient taxable income in the jurisdictions in which the deferred tax assets are located.
HEWLETT-PACKARD COMPANY AND SUBSIDIARIES
Management's Discussion and Analysis ofFinancial Condition and Results of Operations (Continued)
Our effective tax rate includes the impact of certain undistributed foreign earnings for which we have not provided U.S. federal taxes because we plan to reinvest such earnings indefinitely outside the U.S. We plan distributions of foreign earnings based on projected cash flow needs as well as the working capital and long-term investment requirements of our foreign subsidiaries and our domestic operations. Based on these assumptions, we estimate the amount we expect to indefinitely invest outside the U.S. and the amounts we expect to distribute to the U.S. and provide the U.S. federal taxes due on amounts expected to be distributed to the U.S. Further, as a result of certain employment actions and capital investments we have undertaken, income from manufacturing activities in certain jurisdictions is subject to reduced tax rates and, in some cases, is wholly exempt from taxes for fiscal years through 2024.2026. Material changes in our estimates of cash, working capital and long-term investment requirements in the various jurisdictions in which we do business could impact how future earnings are repatriated to the U.S., and our related future effective tax rate.
We are subject to income taxes in the U.S. and approximately 105 other countries, and we are subject to routine corporate income tax audits in many of these jurisdictions. We believe that positions
HP INC. AND SUBSIDIARIES
Management's Discussion and Analysis of
Financial Condition and Results of Operations (Continued)
taken on our tax returns are fully supported, but tax authorities may challenge these positions, which may not be fully sustained on examination by the relevant tax authorities. Accordingly, our income tax provision includes amounts intended to satisfy assessments that may result from these challenges. Determining the income tax provision for these potential assessments and recording the related effects requires management judgments and estimates. The amounts ultimately paid on resolution of an audit could be materially different from the amounts previously included in our income tax provision and, therefore, could have a material impact on our income tax provision, net income and cash flows. Our accrual for uncertain tax positions is attributable primarily to uncertainties concerning the tax treatment of our international operations, including the allocation of income among different jurisdictions, intercompany transactions and related interest. For a further discussion on taxes on earnings, refer to Note 6 to the Consolidated Financial Statements in Item 8, which is incorporated herein by reference.
Inventory
We state our inventory at the lower of cost or market on a first-in, first-out basis. We make adjustments to reduce the cost of inventory to its net realizable value at the product group level for estimated excess obsolescence or impaired balances.obsolescence. Factors influencing these adjustments include changes in demand, technological changes, product life cycle and development plans, component cost trends, product pricing, physical deterioration and quality issues.
Business Combinations
We allocate the fair value of purchase consideration to the assets acquired, including in-process research and development ("IPR&D"), liabilities assumed, and non-controlling interests in the acquiree generally based on their fair values at the acquisition date. IPR&D is initially capitalized at fair value as an intangible asset with an indefinite life and assessed for impairment thereafter. When the IPR&D project is complete, it is reclassified as an amortizable purchased intangible asset and is amortized over its estimated useful life. If an IPR&D project is abandoned, we will record a charge for the value of the related intangible asset to the Consolidated Statement of Earnings in the period it is abandoned. The excess of the fair value of purchase consideration over the fair value of these assets acquired, liabilities assumed and non-controlling interests in the acquiree is recorded as goodwill.
When determining the fair values of assets acquired, liabilities assumed, and non-controlling interests in the acquiree, management makes significant estimates and assumptions, especially with respect to intangible assets. Critical estimates in valuing intangible assets include, but are not limited to, expected future cash flows, which includes consideration of future growth rates and margins, attrition rates, future changes in technology and brand awareness, loyalty and position, and discount rates. Fair value estimates are based on the assumptions management believes a market participant would use in pricing the asset or liability. Amounts recorded in a business combination may change during the measurement period, which is a period not to exceed one year from the date of acquisition, as additional information about conditions existing at the acquisition date becomes available.
Goodwill
We review goodwill for impairment annually and whenever events or changes in circumstances indicate the carrying amount of goodwill may not be recoverable. While we are permitted to conduct a qualitative assessment to determine whether it is necessary to perform a two-step quantitative goodwill impairment test, for our annual goodwill impairment test in the fourth quarter of fiscal 2014,2015, we performed a quantitative test for all of our reporting units.
Goodwill is tested for impairment at the reporting unit level. At the beginning of the first quarter of fiscal 2014, we changed our reporting units. In connection with continued operational synergies and interdependencies between the Enterprise Servers, Storage and Networking reporting unit and the TS reporting unit within the EG segment, we combined these reporting units to create the EG reporting unit. As of October 31, 2014, our reporting units are consistent with the reportable segments identified
HEWLETT-PACKARD COMPANYHP INC. AND SUBSIDIARIES
Management's Discussion and Analysis of
Financial Condition and Results of Operations (Continued)
reporting unit level. As of October 31, 2015, our reporting units are consistent with the reportable segments identified in Note 2, except for ES, which includes two reporting units: MphasiS Limited; and the remainder of ES.
In the first step of the goodwill impairment test, we compare the fair value of each reporting unit to its carrying amount. We estimate the fair value of our reporting units using a weighting of fair values derived most significantly from the income approach and, to a lesser extent, the market approach. Under the income approach, we estimate the fair value of a reporting unit based on the present value of estimated future cash flows. Cash flow projections are based on management's estimates of revenue growth rates and operating margins, taking into consideration industry and market conditions. The discount rate used is based on the weighted-average cost of capital adjusted for the relevant risk associated with business-specific characteristics and the uncertainty related to the reporting unit's ability to execute on the projected cash flows. Under the market approach, we estimate fair value based on market multiples of revenue and earnings derived from comparable publicly-traded companies with operating and investment characteristics similar to the reporting unit. We weight the fair value derived from the market approach depending on the level of comparability of these publicly-traded companies to the reporting unit. When market comparables are not meaningful or not available, we estimate the fair value of a reporting unit using only the income approach. For the MphasiS Limited reporting unit, we utilized the quoted market price in an active market to estimate fair value.
In order to assess the reasonableness of the estimated fair value of our reporting units, we compare the aggregate reporting unit fair value to HP's market capitalization and calculate an implied control premium (the excess of the sum of the reporting units' fair value over HP's market capitalization). We evaluate the control premium by comparing it to observable control premiums from recent comparable transactions. If the implied control premium is not believed to be reasonable in light of these recent transactions, we reevaluate reporting unit fair values, which may result in an adjustment to the discount rate and/or other assumptions. This reevaluation could result in a change to the estimated fair value for certain or all of our reporting units.
Estimating the fair value of a reporting unit is judgmental in nature and involves the use of significant estimates and assumptions. These estimates and assumptions include revenue growth rates and operating margins used to calculate projected future cash flows, risk-adjusted discount rates, future economic and market conditions and the determination of appropriate comparable publicly-traded companies. In addition, we make certain judgments and assumptions in allocating shared assets and liabilities to individual reporting units to determine the carrying amount of each reporting unit.
If the fair value of a reporting unit exceeds the carrying amount of the net assets assigned to that reporting unit, goodwill is not impaired and no further testing is required. If the fair value of the reporting unit is less than its carrying amount, then we perform the second step of the goodwill impairment test to measure the amount of impairment loss, if any. In the second step, the reporting unit's assets, including any unrecognized intangible assets, liabilities and non-controlling interests are measured at fair value in a hypothetical analysis to calculate the implied fair value of goodwill for the reporting unit in the same manner as if the reporting unit was being acquired in a business combination. If the implied fair value of the reporting unit's goodwill is less than its carrying amount, the difference is recorded as an impairment loss.
Our annual goodwill impairment analysis, which we performed as of the first day of the fourth quarter of fiscal 2014,2015, did not result in any impairment charges. The excess of fair value over carrying amount for our reporting units ranged from 18%19% to approximately 12,000%2,600% of carrying amounts. The Software reporting unit has the lowest excess of fair value over carrying amount at 18%19%.
HEWLETT-PACKARD COMPANYHP INC. AND SUBSIDIARIES
Management's Discussion and Analysis of
Financial Condition and Results of Operations (Continued)
In order to evaluate the sensitivity of the estimated fair value of our reporting units in the goodwill impairment test, we applied a hypothetical 10% decrease to the fair value of each reporting unit. This hypothetical 10% decrease resulted in an excess of fair value over carrying amount for our reporting units ranging from 6%7% to approximately 10,000%2,400% of the carrying amounts with the Software reporting unit having the lowest excess of fair value over carrying amount of 6%7%. The fair value of the Software reporting unit is estimated using aequal weighting of both the income and market approaches. Our Software business is facing multiple challenges including the market shift to SaaS and go-to-market execution challenges. If we are not successful in addressing these challenges, our projected revenue growth rates could decline resulting in a decrease in the fair value of the Software reporting unit. The fair value of the Software reporting unit could also be negatively impacted by declines in market multiples of revenue for comparable publicly-traded companies, changes in management's business strategy or significant and sustained declines in our stock price, which could result in an indicator of impairment.
Intangible Assets
We review intangible assets with finite lives for impairment whenever events or changes in circumstances indicate the carrying amount of an asset may not be recoverable. Recoverability of our finite-lived intangible assets is assessed based on the estimated undiscounted future cash flows expected to result from the use and eventual disposition of the asset. If the undiscounted future cash flows are less than the carrying amount, the finite-lived intangible assets are considered to be impaired. The amount of the impairment loss, if any, is measured as the difference between the carrying amount of the asset and its fair value. We estimate the fair value of finite-lived intangible assets by using an income approach or, when available and appropriate, using a market approach.
Fair Value of Derivative Instruments
We use derivative instruments to manage a variety of risks, including risks related to foreign currency exchange rates and interest rates. We use forwards, swaps and at times, options to hedge certain foreign currency and interest rate exposures. We do not use derivative financial instruments for speculative purposes. AtAs of October 31, 2014,2015, the gross notional of our derivative portfolio was $54.7$52.6 billion. Assets and liabilities related to derivative instruments are measured at fair value, and were $980 million$1.1 billion and $405 million,$0.5 billion, respectively as of October 31, 2014.2015.
Fair value is the price we would receive to sell an asset or pay to transfer a liability in an orderly transaction between market participants at the measurement date. In the absence of active markets for the identical assets or liabilities, such measurements involve developing assumptions based on market observable data and, in the absence of such data, internal information that is consistent with what market participants would use in a hypothetical transaction that occurs at the measurement date. The determination of fair value often involves significant judgments about assumptions such as determining an appropriate discount rate that factors in both risk and liquidity premiums, identifying the similarities and differences in market transactions, weighting those differences accordingly and then making the appropriate adjustments to those market transactions to reflect the risks specific to the asset or liability being valued. We generally use industry standard valuation models to measure the fair value of our derivative positions. When prices in active markets are not available for the identical asset or liability, we use industry standard valuation models to measure fair value. Where applicable, these models project future cash flows and discount the future amounts to present value using market-based
HP INC. AND SUBSIDIARIES
Management's Discussion and Analysis of
Financial Condition and Results of Operations (Continued)
observable inputs, including interest rate curves, HP and counterparty credit risk, foreign currency exchange rates, and forward and spot prices.
HEWLETT-PACKARD COMPANY AND SUBSIDIARIES
Management's Discussion and Analysis ofFinancial Condition and Results of Operations (Continued)
For a further discussion on fair value measurements and derivative instruments, refer to Note 1011 and Note 11,12, respectively, to the Consolidated Financial Statements in Item 8, which are incorporated herein by reference.
Loss Contingencies
We are involved in various lawsuits, claims, investigations and proceedings including those consisting of IP, commercial, securities, employment, employee benefits and environmental matters that arise in the ordinary course of business. We record a liability when we believe that it is both probable that a liability has been incurred and the amount of loss can be reasonably estimated. Significant judgment is required to determine both the probability of having incurred a liability and the estimated amount of the liability. We review these matters at least quarterly and adjust these liabilities to reflect the impact of negotiations, settlements, rulings, advice of legal counsel and other updated information and events, pertaining to a particular case. Based on our experience, we believe that any damage amounts claimed in the specific litigation and contingencies matters further discussed in Note 1516 to the Consolidated Financial Statements in Item 8, which is incorporated herein by reference, are not a meaningful indicator of HP's potential liability. Litigation is inherently unpredictable. However, we believe we have valid defenses with respect to legal matters pending against us. Nevertheless, cash flows or results of operations could be materially affected in any particular period by the resolution of one or more of these contingencies. We believe we have recorded adequate provisions for any such matters and, as of October 31, 2014,2015, it was not reasonably possible that a material loss had been incurred in excess of the amounts recognized in our financial statements.
ACCOUNTING PRONOUNCEMENTS
For a summary of recent accounting pronouncements applicable to our consolidated financial statements see Note 1 to the Consolidated Financial Statements in Item 8, which is incorporated herein by reference.
RESULTS OF OPERATIONS
Revenue from our international operations has historically represented, and we expect will continue to represent, a majority of our overall net revenue. As a result, our net revenue growth has been impacted, and we expect will continue to be impacted, by fluctuations in foreign currency exchange rates. In order to provide a framework for assessing performance excluding the impact of foreign currency fluctuations, we present the year-over-year percentage change in net revenue on a constant currency basis, which assumes no change in foreign currency exchange rates from the prior-year period.period and doesn't adjust for any repricing or demand impacts from changes in foreign currency exchange rates. This information is provided so that net revenue can be viewed without the effect of fluctuations in foreign currency exchange rates, which is consistent with how management evaluates our net revenue results and trends. This constant currency disclosure is provided in addition to, and not as a substitute for, the year-over-year percentage change in revenue on a GAAP basis. Other companies may calculate and define similarly labeled items differently, which may limit the usefulness of this measure for comparative purposes.
HEWLETT-PACKARD COMPANYHP INC. AND SUBSIDIARIES
Management's Discussion and Analysis of
Financial Condition and Results of Operations (Continued)
Results of operations in dollars and as a percentage of net revenue were as follows:
| | For the fiscal years ended October 31 | For the fiscal years ended October 31 | ||||||||||||||||||||||||||||||||||||
|---|---|---|---|---|---|---|---|---|---|---|---|---|---|---|---|---|---|---|---|---|---|---|---|---|---|---|---|---|---|---|---|---|---|---|---|---|---|---|
| | 2014 | 2013 | 2012 | 2015 | 2014 | 2013 | ||||||||||||||||||||||||||||||||
| | Dollars in millions | Dollars in millions | ||||||||||||||||||||||||||||||||||||
Net revenue | $ | 111,454 | 100.0 | % | $ | 112,298 | 100.0 | % | $ | 120,357 | 100.0 | % | $ | 103,355 | 100.0 | % | $ | 111,454 | 100.0 | % | $ | 112,298 | 100.0 | % | ||||||||||||||
Cost of sales(1) | 84,839 | 76.1 | % | 86,380 | 76.9 | % | 92,385 | 76.8 | % | 78,596 | 76.0 | % | 84,839 | 76.1 | % | 86,380 | 76.9 | % | ||||||||||||||||||||
| | | | | | | | | | | | | | | | | | | | | | | | | | | | | | | | | | ||||||
Gross profit | 26,615 | 23.9 | % | 25,918 | 23.1 | % | 27,972 | 23.2 | % | 24,759 | 24.0 | % | 26,615 | 23.9 | % | 25,918 | 23.1 | % | ||||||||||||||||||||
Research and development | 3,447 | 3.1 | % | 3,135 | 2.8 | % | 3,399 | 2.8 | % | 3,502 | 3.4 | % | 3,447 | 3.1 | % | 3,135 | 2.8 | % | ||||||||||||||||||||
Selling, general and administrative | 13,353 | 12.0 | % | 13,267 | 11.8 | % | 13,500 | 11.2 | % | 12,185 | 11.8 | % | 13,353 | 12.0 | % | 13,267 | 11.8 | % | ||||||||||||||||||||
Amortization of intangible assets | 1,000 | 0.9 | % | 1,373 | 1.2 | % | 1,784 | 1.5 | % | 931 | 0.9 | % | 1,000 | 0.9 | % | 1,373 | 1.2 | % | ||||||||||||||||||||
Impairment of goodwill and intangible assets(2) | — | — | — | — | 18,035 | 15.0 | % | |||||||||||||||||||||||||||||||
Restructuring charges | 1,619 | 1.5 | % | 990 | 0.9 | % | 2,266 | 1.9 | % | 1,017 | 1.0 | % | 1,619 | 1.5 | % | 990 | 0.9 | % | ||||||||||||||||||||
Acquisition-related charges | 11 | — | 22 | — | 45 | — | ||||||||||||||||||||||||||||||||
Acquisition and other related charges | 90 | 0.1 | % | 11 | 0.0 | % | 22 | 0.0 | % | |||||||||||||||||||||||||||||
Separation costs | 1,259 | 1.2 | % | — | — | — | — | |||||||||||||||||||||||||||||||
Defined benefit plan settlement charges | 168 | 0.2 | % | — | — | — | — | |||||||||||||||||||||||||||||||
Impairment of data center assets | 136 | 0.1 | % | — | — | — | — | |||||||||||||||||||||||||||||||
| | | | | | | | | | | | | | | | | | | | | | | | | | | | | | | | | | ||||||
Earnings (loss) from operations | 7,185 | 6.4 | % | 7,131 | 6.4 | % | (11,057 | ) | (9.2 | )% | ||||||||||||||||||||||||||||
Earnings from operations | 5,471 | 5.3 | % | 7,185 | 6.4 | % | 7,131 | 6.4 | % | |||||||||||||||||||||||||||||
Interest and other, net | (628 | ) | (0.6 | )% | (621 | ) | (0.6 | )% | (876 | ) | (0.8 | )% | (739 | ) | (0.7 | )% | (628 | ) | (0.6 | )% | (621 | ) | (0.6 | )% | ||||||||||||||
| | | | | | | | | | | | | | | | | | | | | | | | | | | | | | | | | | ||||||
Earnings (loss) before taxes | 6,557 | 5.8 | % | 6,510 | 5.8 | % | (11,933 | ) | (10.0 | )% | ||||||||||||||||||||||||||||
Earnings before taxes | 4,732 | 4.6 | % | 6,557 | 5.8 | % | 6,510 | 5.8 | % | |||||||||||||||||||||||||||||
Provision for taxes | (1,544 | ) | (1.3 | )% | (1,397 | ) | (1.2 | )% | (717 | ) | (0.5 | )% | (178 | ) | (0.2 | )% | (1,544 | ) | (1.3 | )% | (1,397 | ) | (1.2 | )% | ||||||||||||||
| | | | | | | | | | | | | | | | | | | | | | | | | | | | | | | | | | ||||||
Net earnings (loss) | $ | 5,013 | 4.5 | % | $ | 5,113 | 4.6 | % | $ | (12,650 | ) | (10.5 | )% | |||||||||||||||||||||||||
Net earnings | $ | 4,554 | 4.4 | % | $ | 5,013 | 4.5 | % | $ | 5,113 | 4.6 | % | ||||||||||||||||||||||||||
| | | | | | | | | | | | | | | | | | | | | | | | | | | | | | | | | | | |||||
| | | | | | | | | | | | | | | | | | | | | |||||||||||||||||||
Net Revenue
The componentsIn fiscal 2015, total HP net revenue declined 7.3% (decreased 2.1% on a constant currency basis) as compared to fiscal 2014. U.S. net revenue decreased 2.9% to $37.7 billion, and net revenue from outside of the weighted net revenue change were as follows:
| | For the fiscal years ended October 31 | ||||||
|---|---|---|---|---|---|---|---|
| | 2014 | 2013 | |||||
| | Percentage Points | ||||||
Enterprise Services | (1.5 | ) | (1.7 | ) | |||
Printing | (0.8 | ) | (0.5 | ) | |||
Enterprise Group | (0.2 | ) | (1.3 | ) | |||
Software | (0.1 | ) | (0.1 | ) | |||
HP Financial Services | (0.1 | ) | (0.2 | ) | |||
Corporate Investments/Other | 0.1 | 0.1 | |||||
Personal Systems | 1.8 | (3.0 | ) | ||||
| | | | | | | | |
Total HP | (0.8 | ) | (6.7 | ) | |||
| | | | | | | | |
| | | | | | | | |
HEWLETT-PACKARD COMPANY AND SUBSIDIARIES
Management's Discussion and Analysis ofFinancial Condition and Results of Operations (Continued)
Fiscal 2014 compared with Fiscal 2013
U.S. decreased 9.6% to $65.7 billion. In fiscal 2014, total HP net revenue declined 0.8% (decreased 0.4% on a constant currency basis) as compared withto fiscal 2013. U.S. net revenue decreased 3.7% to $38.8 billion, while net revenue from outside of the U.S. increased 0.9% to $72.6 billion.
HP INC. AND SUBSIDIARIES
Management's Discussion and Analysis of
Financial Condition and Results of Operations (Continued)
The leading contributors tocomponents of the HPweighted net revenue declinechange by segment were key account runoff in ES and lower Printing supplies volume. Partially offsetting theas follows:
| | For the fiscal years ended October 31 | ||||||
|---|---|---|---|---|---|---|---|
| | 2015 | 2014 | |||||
| | Percentage Points | ||||||
Personal Systems | (2.6 | ) | 1.8 | ||||
Enterprise Services | (2.3 | ) | (1.5 | ) | |||
Printing | (1.8 | ) | (0.8 | ) | |||
HP Financial Services | (0.3 | ) | (0.1 | ) | |||
Corporate Investments/Other | (0.3 | ) | 0.1 | ||||
Software | (0.2 | ) | (0.1 | ) | |||
Enterprise Group | 0.2 | (0.2 | ) | ||||
| | | | | | | | |
Total HP | (7.3 | ) | (0.8 | ) | |||
| | | | | | | | |
| | | | | | | | |
| | | | | | | | |
Fiscal 2015 compared with Fiscal 2014
For fiscal 2015, total net revenue decline was growth in Personal Systems from commercial PCs, which experienced growth across all product categories, along with growth in consumer notebooks.
decreased 7.3 percentage points. From a segment perspective, the primary factors contributing to the change in HP net revenue for fiscalare summarized as follows:
Fiscal 2014 compared with Fiscal 2013
For fiscal 20132014, total net revenue decreased 0.8 percentage points. From a segment perspective, the primary factors contributing to the change in net revenue are summarized as follows:
HP INC. AND SUBSIDIARIES
Management's Discussion and Analysis of
Financial Condition and Results of Operations (Continued)
Fiscal 2013 compared with Fiscal 2012
In fiscal 2013, total HP net revenue declined 6.7% (decreased 5.5% on a constant currency basis) as compared with fiscal 2012. U.S. net revenue decreased 4.4% to $40.3 billion, while net revenue from outside of the U.S. decreased 7.9% to $72.0 billion. The net revenue decline was due primarily to declines of approximately 10%, 7%, 5% and 3% in our Personal Systems, ES, EG and Printing segments, respectively.
From a segment perspective, the primary factors contributing to the change in HP net revenue for fiscal 2013 compared with fiscal 2012 are summarized as follows:
HEWLETT-PACKARD COMPANY AND SUBSIDIARIES
Management's Discussion and Analysis ofFinancial Condition and Results of Operations (Continued)
A more detailed discussion of segment revenue is included under "Segment Information" below.
Gross Margin
Fiscal 2015 compared with Fiscal 2014
HP's gross margin increased by 0.1 percentage points for fiscal year 2015 compared with fiscal 2014. From a segment perspective, the primary factors impacting gross margin performance are summarized as follows:
Fiscal 2014 compared with Fiscal 2013
HP's gross margin increased by 0.8 percentage points for fiscal year 2014 compared with fiscal 2013. From a segment perspective, the primary factors impacting gross margin performance are summarized as follows:
HP INC. AND SUBSIDIARIES
Management's Discussion and Analysis of
Financial Condition and Results of Operations (Continued)
Fiscal 2013 compared with Fiscal 2012
HP's gross margin decreased by 0.2 percentage points for fiscal year 2013 compared with fiscal 2012. From a segment perspective, the primary factors impacting gross margin performance are summarized as follows:
HEWLETT-PACKARD COMPANY AND SUBSIDIARIES
Management's Discussion and Analysis ofFinancial Condition and Results of Operations (Continued)
A more detailed discussion of segment gross margins and operating margins is included under "Segment Information" below.
Operating Expenses
Research and Development
R&D expense increased 2% in fiscal 2015 as compared to fiscal 2014 due primarily to expenses from the acquisition of Aruba and increases in Technology Services, cloud and HP Labs, partially offset by favorable currency impacts.
R&D expense increased 10% in fiscal 2014 as compared to fiscal 2013 with increases across each of our segments as we makemade investments in our strategic focus areas of cloud, security, big data and mobility.
Selling, General and Administrative
R&DSG&A expense decreased 8%9% in fiscal 20132015 as compared to fiscal 20122014 due primarily to the rationalizationfavorable currency impacts and declines in go-to-market costs as a result of R&D in EG for BCS, cost savings from restructuringlower commissions and higher value added R&D tax subsidy credits. The decrease was partially offset by increased R&D expense in our Storage and ISS business units and in Software for innovation-focused spending in the areas of converged infrastructure and cloud.productivity initiatives.
Selling, General and Administrative
SG&A expense increased 1% in fiscal 2014 as compared to fiscal 2013 due primarily to higher compensation costs, litigation expenses and higher selling costs from investments in the areas of cloud, networking and storage, partially offset by gains from sales of real estate and lower program spending in marketing.
SG&A expense decreased 2% in fiscal 2013 as compared to fiscal 2012 due primarily to cost savings associated with our ongoing restructuring efforts that impacted all of our segments. Partially offsetting the decline were higher marketing expenses to support new product introductions and increased administrative expenses due in part to higher consulting project spending.
Amortization of Intangible Assets
Amortization expense decreased in fiscal 2015 and in fiscal 2014 due primarily to certain intangible assets associated with prior acquisitions reaching the end of their respective amortization periods.
Amortizationperiods, partially offset by amortization expense decreasedfrom intangible assets resulting from the acquisition of Aruba in fiscal 20132015.
Restructuring Charges
Restructuring charges decreased 37% in fiscal 2015 due primarily to lower charges from the intangible asset impairment recordedmulti-year restructuring plan initially announced in May 2012 (the "2012 Plan").
On September 14, 2015, our Board of Directors approved a restructuring plan (the "2015 Plan") in connection with the Separation which will be implemented through fiscal 2018. As a result, HP recognized $391 million of charges related to the 2015 Plan during the fourth quarter of fiscal 2012 related to Autonomy and certain intangible assets associated with prior acquisitions reaching the end of their amortization periods.
Impairment of Goodwill and Intangible Assets
In fiscal 2012, we recorded goodwill impairment charges of $8.0 billion and $5.7 billion associated with ES and the acquisition of Autonomy, respectively. In addition, we recorded intangible asset impairment charges of $3.1 billion and $1.2 billion associated with the acquisition of Autonomy and the "Compaq" trade name, respectively. For more information on our impairment charges, see Note 9 to the Consolidated Financial Statements in Item 8, which is incorporated herein by reference.2015.
HEWLETT-PACKARD COMPANYHP INC. AND SUBSIDIARIES
Management's Discussion and Analysis of
Financial Condition and Results of Operations (Continued)
Restructuring Charges
Restructuring charges increased in fiscal 2014 due primarily to higher charges in connection with the multi-year restructuring plan initially announced in May 2012 (the "2012 Plan")Plan and from increases to the 2012 Plan announced in fiscal 2014. During fiscal 2014, HP increased the total for positions expected to be eliminated under the 2012 Plan from 34,000 to 55,000 positions. With these changes,In fiscal 2015, HP expects to recognize additionalrecognized restructuring charges of $640 million in connection with the 2012 Plan.
Acquisition and Other Related Charges
Acquisition and other related charges increased for fiscal 2015.
Restructuring charges decreased in fiscal 20132015, due primarily to the $2.1 billionacquisition of Aruba resulting in a non-cash inventory fair value adjustment charge recorded inand professional services and legal fees associated with the acquisition.
Separation Costs
Separation costs for fiscal 2012 for the 2012 Plan. Restructuring2015 were primarily comprised of third-party consulting, contractor fees and other related costs.
Defined Benefit Plan Settlement Charges
Defined benefit plan settlement charges for fiscal 20132015 were approximately $1.0 billion, which included $1.2 billion of charges related to U.S. defined benefit plan settlement expense and net periodic benefit cost resulting from the 2012 Plan that were partially offset by a reversalvoluntary lump sum program announced in January 2015.
Impairment of $190 millionData Center Assets
Impairment of severance chargesdata center assets for fiscal 2015 was related to our fiscal 2010exit from several ES restructuring plan.data centers.
Interest and Other, Net
Interest and other, net expense increased by $111 million in fiscal 2015. The increase was in connection with $167 million of early debt settlement costs and higher foreign currency transaction losses, partially offset by lower interest expense due to lower weighted average interest rates and a decrease in miscellaneous other expenses.
Interest and other, net expense increased by $7 million in fiscal 2014. The increase was due primarily to higher currency transaction losses partially offset by lower interest expense from a lower average debt balance.
Interest and other, net expense decreased by $255 million in fiscal 2013. The decrease was driven primarily by lower currency transaction losses coupled with lower interest expense due to lower average debt balances and lower investment losses.
Provision for Taxes
Our effective tax rates were 23.5%3.8%, 21.5%,23.5% and (6.0)%21.5% in fiscal 2015, 2014 2013 and 2012,2013, respectively. Our effective tax rate generally differs from the U.S. federal statutory rate of 35% due to favorable tax rates associated with certain earnings from our operations in lower-taxlower tax jurisdictions throughout the world. The jurisdictions with favorable tax rates that had the most significant impact on HP's effective tax rate impact in the periods presented were Puerto Rico, Singapore, Netherlands, China, Malaysia, Ireland and Ireland. We planNetherlands. HP plans to reinvest certain earnings of these jurisdictions indefinitely outside the U.S. and therefore havehas not provided U.S. taxes on those indefinitely reinvested earnings.
In addition to the above factors, the effective tax rate in fiscal 2012 was impacted by nondeductible goodwill impairmentsTable of Contents
HP INC. AND SUBSIDIARIES
Management's Discussion and increases in valuation allowances against certain deferred tax assets.Analysis of
Financial Condition and Results of Operations (Continued)
For a reconciliation of our effective tax rate to the U.S. federal statutory rate of 35% and further explanation of our provision for taxes, see Note 6 to the Consolidated Financial Statements in Item 8, which is incorporated herein by reference.
In fiscal 2015, we recorded $1.6 billion of net income tax benefits related to items unique to the year. These amounts included $1.8 billion tax benefit due to a release of valuation allowances pertaining to certain U.S. deferred tax assets and $486 million tax charge to record valuation allowances on certain foreign deferred tax assets, both related to legal entities within the ES business, $394 million of tax charges for adjustments to uncertain tax positions and the settlement of tax audit matters, inclusive of $449 million of tax charges related to pension transfers, and $3 million of tax charges for various provision to return adjustments and other adjustments. In addition, we recorded $639 million of net tax benefits on restructuring, separation-related and other charges and a tax benefit of $47 million arising from the retroactive research and development credit resulting from the Tax Increase Prevention Act of 2014, which was signed into law in December 2014.
We recorded gross deferred tax assets of $12.5 billion, $14.0 billion and $13.6 billion at October 31, 2015, 2014 and 2013 which were reduced by valuation allowances of $9.9 billion, $11.9 billion and $11.4 billion respectively. Total valuation allowances decreased by $2 billion in fiscal 2015 associated with the release of a valuation allowance against deferred tax assets in the U.S., and increased by $525 million in fiscal 2014, associated primarily with foreign net operating losses.
In fiscal 2014, we recorded $53 million of net income tax charges related to items unique to the year.
In fiscal 2013, we recorded $471 million of net income tax charges related to items unique to the year. These amounts included $214 million of net increases to valuation allowances, $406 million of tax charges for adjustments to uncertain tax positions and the settlement of tax audit matters and $47 million of tax charges for various prior period adjustments. In addition, we recorded $146 million of tax benefits from adjustments to prior year foreign income tax accruals and a tax benefit of $50 million arising from the retroactive research and development credit resulting from the American Taxpayer Relief Act of 2012, which was signed into law in January 2013.
Segment Information
A description of the products and services for each segment can be found in Note 2 to the Consolidated Financial Statements in Item 8, which is incorporated herein by reference. Future changes to this organizational structure may result in changes to the segments disclosed.
Effective at the beginning of theits first quarter of fiscal 2014,2015, we implemented certainan organizational changeschange to align theour segment financial reporting more closely with ourits current business structure. TheseThis organizational changes include:
In connection with the Separation, effective at the beginning of its fourth quarter of fiscal 2015, we implemented an organizational change which resulted in the transfer of marketing optimization solutions business from the Software segment to the Commercial Hardware business unit within the Printing segment to the Software segment;
HEWLETT-PACKARD COMPANYHP INC. AND SUBSIDIARIES
Management's Discussion and Analysis of
Financial Condition and Results of Operations (Continued)
Printing segment. We have reflected this change to our segment information in prior reporting periods on an as-if basis, which resulted in the Personal Systems trade and warranty support businesstransfer of net revenue from the TS business unit within the EGSoftware segment to the Other business unit within the Personal Systems segment;
In addition, we transferred certain intrasegment eliminations from the ES segment and the EG segment to corporate intersegment revenue eliminations.
HP has reflected these changes to its segment information retrospectively to the earliest period presented, which has This change also resulted in the transfer of revenue amongoperating profit from the Software segment to the Commercial Hardware business unit within the Printing Personal Systems, EG, ES andsegment. In addition, this change resulted in the reclassification of $512 million of goodwill from the Software segments and the transfer of operating profit amongsegment to the Printing Personal Systems, EG, Software and Corporate Investments segments.segment.
These changes had no impact on the previously reported financial results for the HPFS segment. In addition, none of these changes impacted HP'sour previously reported consolidated net revenue, earnings from operations, net earnings or net EPS or consolidated assets.earnings per share.
Printing and Personal Systems Group
The Personal Systems segment and the Printing segment are structured beneath a broader Printing and Personal Systems Group ("PPS"). We describe the results of the business segments within PPS below.
Personal Systems
| | For the fiscal years ended October 31 | For the fiscal years ended October 31 | ||||||||||||||||||
|---|---|---|---|---|---|---|---|---|---|---|---|---|---|---|---|---|---|---|---|---|
| | 2014 | 2013 | 2012 | 2015 | 2014 | 2013 | ||||||||||||||
| | Dollars in millions | Dollars in millions | ||||||||||||||||||
Net revenue | $ | 34,303 | $ | 32,179 | $ | 35,843 | $ | 31,469 | $ | 34,303 | $ | 32,179 | ||||||||
Earnings from operations | $ | 1,270 | $ | 980 | $ | 1,724 | $ | 1,064 | $ | 1,270 | $ | 980 | ||||||||
Earnings from operations as a % of net revenue | 3.7 | % | 3.0 | % | 4.8 | % | 3.4 | % | 3.7 | % | 3.0 | % | ||||||||
The components of net revenue and the weighted net revenue change by business unit were as follows:
| | For the fiscal years ended October 31 | | | Weighted Net Revenue Change Percentage Points | |||||||||||||
|---|---|---|---|---|---|---|---|---|---|---|---|---|---|---|---|---|---|
| | 2014 | 2013 | Net Revenue | ||||||||||||||
| | Percentage Points | 2015 | 2014 | ||||||||||||||
| | Dollars in millions | | |||||||||||||||
Desktop PCs | $ | 10,941 | $ | 13,197 | (6.6 | ) | |||||||||||
Notebook PCs | 4.7 | (7.8 | ) | 17,271 | 17,540 | (0.8 | ) | ||||||||||
Desktop PCs | 1.1 | (2.9 | ) | ||||||||||||||
Workstations | 0.2 | — | 2,018 | 2,218 | (0.6 | ) | |||||||||||
Other | 0.6 | 0.5 | 1,239 | 1,348 | (0.3 | ) | |||||||||||
| | | | | | | | | | | | | | | | | ||
Total Personal Systems | 6.6 | (10.2 | ) | $ | 31,469 | $ | 34,303 | (8.3 | ) | ||||||||
| | | | | | | | | | | | | | | | | | |
| | | | | | | | | | | | |||||||
| | | | Weighted Net Revenue Change Percentage Points | |||||||
|---|---|---|---|---|---|---|---|---|---|---|
| | Net Revenue | |||||||||
| | 2014 | 2013 | ||||||||
| | Dollars in millions | | ||||||||
Desktop PCs | $ | 13,197 | $ | 12,844 | 1.1 | |||||
Notebook PCs | 17,540 | 16,029 | 4.7 | |||||||
Workstations | 2,218 | 2,147 | 0.2 | |||||||
Other | 1,348 | 1,159 | 0.6 | |||||||
| | | | | | | | | | | |
Total Personal Systems | $ | 34,303 | $ | 32,179 | 6.6 | |||||
| | | | | | | | | | | |
| | | | | | | | | | | |
| | | | | | | | | | | |
HEWLETT-PACKARD COMPANYHP INC. AND SUBSIDIARIES
Management's Discussion and Analysis of
Financial Condition and Results of Operations (Continued)
Fiscal 2015 compared with Fiscal 2014
Personal Systems net revenue decreased 8.3% (decreased 3.1% on a constant currency basis) in fiscal 2015. The net revenue decline in Personal Systems was due primarily to unfavorable currency impacts, particularly in EMEA, and weakening market demand. Personal Systems net revenue decreased as a result of a 5% decline in average selling prices ("ASPs") and a 3% decline in unit volume. The decline in ASPs was due primarily to unfavorable currency impacts, a shift in consumer PCs to low end products and a lower mix of commercial PCs within Personal Systems. The unit volume decline was due primarily to a unit volume decline in desktops, partially offset by a unit volume growth in notebooks, both consumer and commercial.
Net revenue for commercial clients decreased 8% due primarily to unfavorable currency impacts, a decline in commercial desktops as a result of weak market demand and higher net revenue in the prior-year period resulting from the replacement of the Windows XP operating system. Net revenue for consumer clients decreased 8% due primarily to unfavorable currency impacts and a decline in consumer desktops. Net revenue declined 17% in Desktop PCs, 2% in Notebook PCs, 9% in Workstations and 8% in Other. The net revenue decline in Other was due primarily to a decline in consumer tablets, the sale of IP in the prior-year period, and unfavorable currency impacts, the effects of which were partially offset by increased sales of extended warranties.
Personal Systems earnings from operations as a percentage of net revenue decreased by 0.3 percentage points for fiscal 2015 as a result of a decline in gross margin combined with an increase in operating expenses as a percentage of net revenue. The decline in gross margin was due primarily to unfavorable currency impacts and a lower mix of commercial products, partially offset by favorable component costs and operational cost improvements. Operating expenses as a percentage of net revenue increased due primarily to the size of the net revenue decline, higher administrative expenses as a result of lower bad debt recoveries as compared to the prior-year period and higher R&D investments in commercial, mobility and immersive computing products, the effects of which were partially offset by a decline in field selling costs as a result of favorable currency impacts and operational cost improvements.
Fiscal 2014 compared with Fiscal 2013
Personal Systems net revenue increased 6.6% (increased 7.2% on a constant currency basis) in fiscal 2014. While the Personal Systems business continuescontinued to be challenged by the market shift towards mobility products, the pace of the PC market decline is slowingslowed with signs of stabilization driven by growth in commercial PCs, the effects of which were partially offset by weakness in consumer PCs. The revenue increase in Personal Systems was due to growth in commercial PCs, particularly notebooks, along with growth in consumer notebooks. Personal Systems experienced revenue growth across all regions led by double digit revenue growth in EMEA, which experienced improved demand. The revenue increase was driven by an 8.2% increase in unit volume, the effects of which were partially offset by a 1.5% decline in average selling prices ("ASPs").ASPs. The unit volume increase was primarily led by growth in commercial notebooks as well as strength in commercial desktops, consumer notebooks and thin client products. The decline in ASPs was due primarily to a competitive pricing environment and unfavorable currency impacts, the effects of which were partially offset by a favorable mix of commercial PCs.
Net revenue for commercial clients increased 10.2%10% due primarily to the benefits from the delayed installed base refresh cycle, the effects of customers migrating from the Windows XP operating system and growth in all product categories partly driven by new product introductions, including the HP Elite
HP INC. AND SUBSIDIARIES
Management's Discussion and Analysis of
Financial Condition and Results of Operations (Continued)
products. Net revenue for consumer clients remained flat as growth in consumer notebooks, partly driven by our new product lineup including Chromebooks and hybrid products, was offset by a decline in consumer desktops. For fiscal 2014, net revenue for Notebook PCs increased 9%, Desktop PCs increased 3%, Workstations increased 3% and Other net revenue increased 16%. The net revenue increase in Other was due to the sale of IP and growth in mobility products, primarily consumer tablets which were introduced in the second half of fiscal 2013.
Personal Systems earnings from operations as a percentage of net revenue increased 0.7 percentage points for fiscal 2014. The increase was driven by an increase in gross margin and a decline in operating expenses as a percentage of net revenue. The increase in gross margin was due primarily to operational cost improvements, a favorable commercial mix and the sale of IP, the effects of which were partially offset by unfavorable currency impacts. Operating expenses as a percentage of net revenue decreased due primarily to our cost structure optimization efforts, the effects of which were partially offset by increased research and development investments for commercial, mobility and immersive computing products, as well as higher administrative expenses driven by lower bad debt recoveries as compared to fiscal 2013.
Fiscal 2013 compared with Fiscal 2012Printing
| | For the fiscal years ended October 31 | |||||||||
|---|---|---|---|---|---|---|---|---|---|---|
| | 2015 | 2014 | 2013 | |||||||
| | Dollars in millions | |||||||||
Net revenue | $ | 21,232 | $ | 23,211 | $ | 24,128 | ||||
Earnings from operations | $ | 3,865 | $ | 4,229 | $ | 3,953 | ||||
Earnings from operations as a % of net revenue | 18.2 | % | 18.2 | % | 16.4 | % | ||||
Personal SystemsThe components of the net revenue decreased 10.2% (decreased 9.0% on a constant currency basis) in fiscal 2013. The Personal Systems business continued to experience significant challenges due to the overall PC market decline as a result of a customer shift, particularly consumers, to tablet products. The business also experienced broad-based regional demand weakness, particularly in the EMEA region. The decline in Personal Systems revenue was driven by an 8% decline in unit volume along with a 3% decline in ASPs. The unit volume decrease was led by declines in consumer and notebook products as a result of the market shift to tablet products. The decline in ASPs was due primarily to a competitive pricing environment. Net revenue for consumer clients decreased 19%, whileweighted net revenue for commercial clients decreased 4%. Notebook PCs net revenue decreased 15%, while Desktop PCs net revenue decreased 8%. Workstations net revenue growth was flat, while Other net revenue increased 19%. The net revenue increase in Other was related to increased sales of extended warranties and third-party branded options and sales of consumer tablets.change by business unit were as follows:
| | For the fiscal years ended October 31 | |||||||||
|---|---|---|---|---|---|---|---|---|---|---|
| | | | Weighted Net Revenue Change Percentage Points | |||||||
| | Net Revenue | |||||||||
| | 2015 | 2014 | ||||||||
| | Dollars in millions | | ||||||||
Supplies | $ | 13,979 | $ | 14,917 | (4.0 | ) | ||||
Commercial Hardware | 5,378 | 5,949 | (2.5 | ) | ||||||
Consumer Hardware | 1,875 | 2,345 | (2.0 | ) | ||||||
| | | | | | | | | | | |
Total Printing | $ | 21,232 | $ | 23,211 | (8.5 | ) | ||||
| | | | | | | | | | | |
| | | | | | | | | | | |
| | | | | | | | | | | |
HEWLETT-PACKARD COMPANYHP INC. AND SUBSIDIARIES
Management's Discussion and Analysis of
Financial Condition and Results of Operations (Continued)
Personal Systems
| | For the fiscal years ended October 31 | |||||||||
|---|---|---|---|---|---|---|---|---|---|---|
| | | | Weighted Net Revenue Change Percentage Points | |||||||
| | Net Revenue | |||||||||
| | 2014 | 2013 | ||||||||
| | Dollars in millions | | ||||||||
Supplies | $ | 14,917 | $ | 15,716 | (3.3 | ) | ||||
Consumer Hardware | 2,345 | 2,436 | (0.4 | ) | ||||||
Commercial Hardware | 5,949 | 5,976 | (0.1 | ) | ||||||
| | | | | | | | | | | |
Total Printing | $ | 23,211 | $ | 24,128 | (3.8 | ) | ||||
| | | | | | | | | | | |
| | | | | | | | | | | |
| | | | | | | | | | | |
Fiscal 2015 compared with Fiscal 2014
Printing net revenue decreased 8.5% (decreased 5.1% on a constant currency basis) for fiscal 2015. The decline in net revenue was due primarily to unfavorable currency impacts, decline in Supplies, weak market demand and competitive pricing pressures, the effects of which were partially offset by growth in graphics products. From a regional perspective, Printing experienced a net revenue decline across all regions, primarily in EMEA and particularly in Russia as a result of challenges in those markets.
Net revenue for Supplies decreased 6% due primarily to unfavorable currency impacts and demand weakness in toner and ink, partially offset by growth in graphics supplies. The demand weakness in toner was particularly in EMEA, led by a net revenue decline in Russia. Printer unit volumes declined 7% while average revenue per unit ("ARU") decreased 7%. Printer unit volume declined due primarily to a decline in LaserJet and home printer units, the effects of which were partially offset by growth in graphics printer units. The ARU for printers decreased due primarily to a highly competitive pricing environment and unfavorable currency impacts on Inkjet and LaserJet printers. Net revenue for Commercial Hardware decreased 10% driven by a 7% decline in printer unit volume and a 4% decline in ARU, partially offset by a net revenue increase in other peripheral solutions. In Commercial Hardware, the decline in unit volume was due primarily to an overall decline in LaserJet printer units, partially offset by growth in graphics printer units. The ARU decline in Commercial Hardware was due primarily to a competitive pricing environment and unfavorable currency impacts. Net revenue for Consumer Hardware decreased 20% driven by a 13% decline in ARU and a 7% decline in unit volume. The ARU decline in Consumer Hardware was due primarily to a competitive pricing environment and unfavorable currency impacts. The unit volume decline in Consumer Hardware was due primarily to lower sales of home and SMB printer units.
Printing earnings from operations as a percentage of net revenue decreased 1.8 percentage points inremained flat for fiscal 2013. The decrease was driven by2015 due to a decline in gross margin, combined with an increase inoffset by lower operating expenses as a percentage of net revenue. The decline in gross margin was due primarily to a competitive pricing environment in hardware and unfavorable currency impacts, and competitive pricing pressures. These unfavorable impacts to gross marginthe effects of which were partially offset by lower component and warranty costs and a favorable mix of higher-margin commercial products.ink and graphics supplies and favorable currency impacts from the Japanese yen. Operating expenses as a percentage of net revenue increaseddecreased due primarily to our cost saving initiatives, lower marketing expenses, the sizeimpact of the revenue decline as well as slightly higher R&D costs. However, operating expenses declined across most other expense categories as a resultdivestiture of benefits from our ongoing restructuring efforts.photo printing service Snapfish and favorable currency impacts.
Printing
HP INC. AND SUBSIDIARIES
| | For the fiscal years ended October 31 | |||||||||
|---|---|---|---|---|---|---|---|---|---|---|
| | 2014 | 2013 | 2012 | |||||||
| | Dollars in millions | |||||||||
Net revenue | $ | 22,979 | $ | 23,896 | $ | 24,538 | ||||
Earnings from operations | $ | 4,185 | $ | 3,933 | $ | 3,612 | ||||
Earnings from operations as a % of net revenue | 18.2 | % | 16.5 | % | 14.7 | % | ||||
The componentsManagement's Discussion and Analysis of
Financial Condition and Results of the weighted net revenue change by business unit were as follows:Operations (Continued)
| | For the fiscal years ended October 31 | ||||||
|---|---|---|---|---|---|---|---|
| | 2014 | 2013 | |||||
| | Percentage Points | ||||||
Supplies | (3.3 | ) | (1.8 | ) | |||
Consumer Hardware | (0.4 | ) | — | ||||
Commercial Hardware | (0.1 | ) | (0.8 | ) | |||
| | | | | | | | |
Total Printing | (3.8 | ) | (2.6 | ) | |||
| | | | | | | | |
| | | | | | | | |
Fiscal 2014 compared with Fiscal 2013
In fiscal 2014, Printing experienced a decline in revenue and an increase in operating profit as we continued to push our print strategies, which includes driving high value printer unit placements and expanding our graphics products and managed print services portfolio. Printing net revenue decreased 3.8% (decreased 3.4%3.3% on a constant currency basis) for fiscal 2014. The decline in net revenue was primarily driven by a decline in Supplies, the effects of which were partially offset by growth in graphics products and managed print services.
Net revenue for Supplies decreased 5% driven by demand weakness in toner and ink, and a reduction in channel inventory in the fourth quarter of fiscal 2014, the effects of which were partially offset by growth in graphics supplies. Printer unit volume remained flat while average revenue per unit ("ARU")ARU decreased 1%. Printer unit volume was flat due primarily to our continued efforts to target high value areas of the market, which resulted in a decline in home printer units and low-valuelow value LaserJet printer units, the effects of which were offset by increased units in SMB, multifunction laser and graphics printers. The decline in ARU was due primarily to increased discounting driven by competitive pricing pressures. Net revenue for Commercial Hardware was flat as a 3% increase in printer unit volume was offset by a 3% decline in printer ARU. The unit volume in Commercial Hardware increased due primarily to growth in our multifunction laser printers and graphics printers. The ARU decline in Commercial Hardware was due primarily to a decline in
HEWLETT-PACKARD COMPANY AND SUBSIDIARIES
Management's Discussion and Analysis ofFinancial Condition and Results of Operations (Continued)
LaserJet and graphics printers driven by a competitive pricing environment. Net revenue for Consumer Hardware decreased 4% driven by a 1% decline in printer unit volume and a 1% decline in ARU, along with a decline in other peripheral printing solutions. The unit volume decline in Consumer Hardware was due to lower sales of home printers, the effects of which were partially offset by growth in SMB printers. The ARU decline in Consumer Hardware was due primarily to increased discounting for SMB printers due to a competitive pricing environment, the effects of which were partially offset by a favorable mix of high value home printers.
Printing earnings from operations as a percentage of net revenue increased by 1.71.8 percentage points for fiscal 2014 as an increase in gross margin more than offset an increase in operating expenses as a percentage of net revenue. The gross margin increase was due to favorable currency impacts primarily driven by the Japanese Yen,yen, continued cost structure improvements and a favorable mix from a higher proportion of graphics and ink supplies, the effects of which were partially offset by a competitive pricing environment. Operating expenses as a percentage of net revenue increased due primarily to higher R&D expenses as a result of our investments in enterprise products and 3-D printing, the effects of which were partially offset by reduced marketing expenses.
Fiscal 2013 compared with Fiscal 2012Enterprise Group
Printing net revenue decreased 2.6% (decreased 1% on a constant currency basis) in fiscal 2013. The decrease was driven by unfavorable currency impacts, particularly weakness in the euro, and declines in supplies and commercial printers. Net revenue for Supplies decreased 3% due to unfavorable currency impacts and lower volumes of toner and ink supplies. These effects were partially offset by growth in large format printing supplies. Printer unit volumes declined by 3% while ARU increased by 1%. Printer unit volumes decreased largely due to declines in low-end consumer printers as we continued our focus on higher-value Ink in the Office and Ink Advantage products. The increase in ARU was driven by a mix shift to high-value consumer printers, the effect of which was partially offset by higher discounting in commercial printers. Net revenue for Commercial Hardware decreased 3%, which was driven by a 6% decline in ARU that was partially offset by a volume increase of 2%. The decline in Commercial Hardware net revenue was partially offset by net revenue growth in the graphics services and managed print services businesses. Net revenue for Consumer Hardware remained flat due to a 7% increase in ARU, the effect of which was offset by a 5% reduction in volume. Unit volume and ARU increased within high-value consumer printers as a result of our continued focus on those more profitable printers.
Printing earnings from operations as a percentage of net revenue increased by 1.8 percentage points in fiscal 2013 due to an increase in gross margin combined with lower operating expenses as a percentage of net revenue. The gross margin increase was due to improvement in toner gross margins resulting from lower discounting, higher ARU in consumer printers, and lower cost of sales in toner and commercial printers due to a favorable currency impact from the Japanese Yen. These positive effects were partially offset by an unfavorable mix of lower-margin consumer printers. Operating expenses as a percentage of net revenue decreased due to lower administrative, R&D and field selling costs as a result of benefits from our ongoing restructuring efforts. These effects were partially offset by higher marketing expenses to support new product introductions.
| | For the fiscal years ended October 31 | |||||||||
|---|---|---|---|---|---|---|---|---|---|---|
| | 2015 | 2014 | 2013 | |||||||
| | Dollars in millions | |||||||||
Net revenue | $ | 27,907 | $ | 27,723 | $ | 28,003 | ||||
Earnings from operations | $ | 3,981 | $ | 3,995 | $ | 4,245 | ||||
Earnings from operations as a % of net revenue | 14.3 | % | 14.4 | % | 15.2 | % | ||||
HEWLETT-PACKARD COMPANYHP INC. AND SUBSIDIARIES
Management's Discussion and Analysis of
Financial Condition and Results of Operations (Continued)
Enterprise Group
| | For the fiscal years ended October 31 | |||||||||
|---|---|---|---|---|---|---|---|---|---|---|
| | 2014 | 2013 | 2012 | |||||||
| | Dollars in millions | |||||||||
Net revenue | $ | 27,814 | $ | 28,081 | $ | 29,643 | ||||
Earnings from operations | $ | 4,008 | $ | 4,259 | $ | 5,123 | ||||
Earnings from operations as a % of net revenue | 14.4 | % | 15.2 | % | 17.3 | % | ||||
The components of the net revenue and weighted net revenue change by business unit were as follows for the following fiscal years ended October 31:follows:
| | For the fiscal years ended October 31 | ||||||||||||||||
|---|---|---|---|---|---|---|---|---|---|---|---|---|---|---|---|---|---|
| | | Weighted Net Revenue Change Percentage Points | |||||||||||||||
| | For the fiscal years ended October 31 | Net Revenue | |||||||||||||||
| | 2014 | 2013 | 2015 | 2014 | |||||||||||||
| | Percentage Points | Dollars in millions | | ||||||||||||||
Technology Services | (1.1 | ) | (1.3 | ) | $ | 7,662 | $ | 8,375 | (2.6 | ) | |||||||
Storage | 3,180 | 3,316 | (0.5 | ) | |||||||||||||
Business Critical Systems | (0.9 | ) | (1.4 | ) | 807 | 929 | (0.4 | ) | |||||||||
Storage | (0.6 | ) | (1.1 | ) | |||||||||||||
Networking | 0.3 | 0.1 | 2,846 | 2,629 | 0.8 | ||||||||||||
Industry Standard Servers | 1.3 | (1.6 | ) | 13,412 | 12,474 | 3.4 | |||||||||||
| | | | | | | | | | | | | | | | | ||
Total Enterprise Group | (1.0 | ) | (5.3 | ) | $ | 27,907 | $ | 27,723 | 0.7 | ||||||||
| | | | | | | | | | | | | | | | | | |
| | | | | | | | | | | | |||||||
| | For the fiscal years ended October 31 | |||||||||
|---|---|---|---|---|---|---|---|---|---|---|
| | | | Weighted Net Revenue Change Percentage Points | |||||||
| | Net Revenue | |||||||||
| | 2014 | 2013 | ||||||||
| | Dollars in millions | | ||||||||
Technology Services | $ | 8,375 | $ | 8,710 | (1.2 | ) | ||||
Storage | 3,316 | 3,475 | (0.6 | ) | ||||||
Business Critical Systems | 929 | 1,190 | (0.9 | ) | ||||||
Networking | 2,629 | 2,526 | 0.4 | |||||||
Industry Standard Servers | 12,474 | 12,102 | 1.3 | |||||||
| | | | | | | | | | | |
Total Enterprise Group | $ | 27,723 | $ | 28,803 | (1.0 | ) | ||||
| | | | | | | | | | | |
| | | | | | | | | | | |
| | | | | | | | | | | |
Fiscal 2015 compared with Fiscal 2014
EG net revenue increased 0.7% (increased 6.3% on a constant currency basis) in fiscal 2015. The increase in EG net revenue was due primarily to growth in ISS and from our acquisition of Aruba in May 2015, partially offset primarily by unfavorable currency impacts led by the euro and a net revenue decline in TS. However, we continued to experience challenges due to market trends, including the transition to cloud computing, as well as product and technology transitions, along with a highly competitive pricing environment.
ISS net revenue increased 8% as a result of higher average unit prices ("AUPs) and unit volume growth. The increase in AUP's was across the server portfolio, primarily driven by higher option attach rates for memory, processors and hard drives and a mix shift to high-end new generation HP ProLiant servers. The unit volume growth was primarily due to shipment increases in rack and density optimized server products. Networking net revenue increased 8% due primarily to revenue from Aruba, which resulted in higher revenue from wireless local area network ("WLAN") products, the effect of which was partially offset by competitive pricing pressures, particularly in the China market. Storage net revenue decreased 4% as a result of a decline in traditional storage products, the effect of which was partially offset by growth in Converged Storage solutions from the 3PAR StoreServ products,
HP INC. AND SUBSIDIARIES
Management's Discussion and Analysis of
Financial Condition and Results of Operations (Continued)
particularly All-flash arrays, and StoreOnce. BCS net revenue decreased 13% largely as a result of contraction in the overall UNIX market. TS net revenue decreased 9% due primarily to a reduction in support for BCS and traditional storage products along with lower revenue from consulting services, the effects of which were partially offset by growth in HP Data Center Care and HP Proactive Care support solutions.
In fiscal 2015, EG earnings from operations as a percentage of net revenue decreased by 0.1 percentage point due to a decrease in gross margin partially offset by a decrease in operating expenses as a percentage of net revenue. The decrease in gross margin was due primarily to a higher revenue mix of ISS products, unfavorable currency impacts and competitive pricing, the effects of which were partially offset by improved cost management, improved pricing in Storage and a higher gross margin contribution in Networking from Aruba. The decrease in operating expenses as a percentage of net revenue was due primarily to favorable currency impacts, partially offset by expenses during the period from Aruba.
Fiscal 2014 compared with Fiscal 2013
EG net revenue decreased 1.0% (decreased 0.6% on a constant currency basis) in fiscal 2014. In EG, we continuecontinued to experience revenue challenges due to market trends, including the transition to cloud computing, as well as product and technology transitions, along with a highly competitive pricing environment. The decline in EG net revenue was due to net revenue declines in TS, BCS and Storage partially offset by net revenue growth in ISS and Networking.
TS net revenue decreased 4% due primarily to a continued reduction in support for BCS, traditional storage products and lower support in networking services, partially offset by growth in support solutions for converged storageConverged Storage solutions and ISS. BCS net revenue decreased 22% as a result of ongoing pressures from the overall UNIX market contraction. Storage net revenue decreased by 5% as we continue to experience multiple challenges including product transitions from traditional storage products which include our tape, storage networking and legacy external disk products, to converged solutions, which include our 3PAR StoreServ, StoreOnce, and StoreVirtual products, other challenges include market weakness in high-end converged solutions and sales execution challenges, the effects of which were partially offset by revenue growth in our Converged Storage solutions. Networking net revenue increased 4% due to higher switching product revenue as a result of growth in our data center products, partially offset by lower revenue from wireless local area networkWLAN products. ISS net revenue increased by 3% due primarily to higher volume and higher average unit prices in rack and blade server products driven by higher option attach rates for memory, processors and hard drives.
EG earnings from operations as a percentage of net revenue decreased by 0.8 percentage points in fiscal 2014 due to a decrease in gross margin coupled with an increase in operating expenses as a percentage of net revenue. The gross margin decline was due primarily to a higher mix of ISS products, a lower mix of BCS products and competitive pricing pressure in ISS and Networking, partially offset
HEWLETT-PACKARD COMPANY AND SUBSIDIARIES
Management's Discussion and Analysis ofFinancial Condition and Results of Operations (Continued)
by supply chain cost optimization and improved cost management in TS. The increase in operating expenses as a percentage of net revenue was driven by higher R&D investments in storage, networking and ISS, partially offset by continued cost savings associated with our ongoing restructuring efforts.
Fiscal 2013 compared with Fiscal 2012
EG net revenue decreased 5.3% (decreased 4.2% on a constant currency basis) in fiscal 2013 due primarily to the macroeconomic demand challenges the business faced during the fiscal year. Additionally, new product and technology transitions in Storage and ISS and a competitive pricing environment contributed to the revenue decline. EG also experienced execution challenges that impacted revenue growth in fiscal 2013, although those challenges moderated in the fourth quarter due to improved sales execution. Each of the business units within EG experienced year-over-year revenue declines in fiscal 2013 except Networking. ISS net revenue decreased by 4% due to competitive pricing and soft demand. Within ISS, we experienced a revenue decline in our core mainstream products that was partially offset by revenue growth in our hyperscale server products. TS net revenue decreased by 4% due to revenue declines in the support and consulting businesses and, to a lesser extent, to unfavorable currency impacts. Support revenue declined due to a reduction in support for BCS products. The consulting revenue decline was a result of unfavorable currency impacts, the divestiture of a service product line and a shift to more profitable services such as data center and storage consulting. BCS net revenue decreased by 26% as a result of ongoing pressures from the decline in the overall UNIX market along with lower demand for our Itanium-based servers. Storage net revenue decreased by 9% due to declines in traditional storage products, which include our tape, storage networking, and legacy external disk products, the effects of which were partially offset by growth in Converged Storage solutions, which include our 3PAR, StoreOnce, StoreVirtual and StoreAll products. Networking revenue increased by 2% due to higher demand for our switching, routing, and wireless products, the effect of which was partially offset by the impact of the divestiture of our video surveillance business in the first quarter of fiscal 2012.
EG earnings from operations as a percentage of net revenue decreased by 2.1 percentage points in fiscal 2013 driven by a decrease in gross margin and, to a lesser extent, an increase in operating expenses as a percentage of net revenue. The gross margin decrease was due primarily to competitive pricing pressures in ISS and, to a lesser extent, pricing pressures in Storage and mix impacts from lower BCS revenue. Operating expenses as a percentage of net revenue increased due to the decline in EG net revenue and increased field selling costs and administrative expenses. R&D expenses as a percentage of net revenue decreased due primarily to the rationalization of R&D specifically for BCS and a value-added tax subsidy credit in BCS. EG also benefited from cost savings resulting from our ongoing restructuring efforts.
Enterprise Services
| | For the fiscal years ended October 31 | |||||||||
|---|---|---|---|---|---|---|---|---|---|---|
| | 2014 | 2013 | 2012 | |||||||
| | Dollars in millions | |||||||||
Net revenue | $ | 22,398 | $ | 24,061 | $ | 25,993 | ||||
Earnings from operations | $ | 803 | $ | 679 | $ | 1,045 | ||||
Earnings from operations as a % of net revenue | 3.6 | % | 2.8 | % | 4.0 | % | ||||
HEWLETT-PACKARD COMPANYHP INC. AND SUBSIDIARIES
Management's Discussion and Analysis of
Financial Condition and Results of Operations (Continued)
Enterprise Services
| | For the fiscal years ended October 31 | |||||||||
|---|---|---|---|---|---|---|---|---|---|---|
| | 2015 | 2014 | 2013 | |||||||
| | Dollars in millions | |||||||||
Net revenue | $ | 19,806 | $ | 22,398 | $ | 24,061 | ||||
Earnings from operations | $ | 1,051 | $ | 816 | $ | 693 | ||||
Earnings from operations as a % of net revenue | 5.3 | % | 3.6 | % | 2.9 | % | ||||
The components of the net revenue and weighted net revenue change by business unit were as follows:
| | For the fiscal years ended October 31 | ||||||||||||||||
|---|---|---|---|---|---|---|---|---|---|---|---|---|---|---|---|---|---|
| | | Weighted Net Revenue Change Percentage Points | |||||||||||||||
| | For the fiscal years ended October 31 | Net Revenue | |||||||||||||||
| | 2014 | 2013 | 2015 | 2014 | |||||||||||||
| | Percentage Points | Dollars in millions | | ||||||||||||||
Infrastructure Technology Outsourcing | (4.9 | ) | (3.7 | ) | $ | 12,107 | $ | 14,038 | (8.6 | ) | |||||||
Application and Business Services | (2.0 | ) | (3.7 | ) | 7,699 | 8,360 | (3.0 | ) | |||||||||
| | | | | | | | | | | | | | | | | ||
Total Enterprise Services | (6.9 | ) | (7.4 | ) | $ | 19,806 | $ | 22,398 | (11.6 | ) | |||||||
| | | | | | | | | | | | | | | | | | |
| | | | | | | | | | | | |||||||
| | For the fiscal years ended October 31 | |||||||||
|---|---|---|---|---|---|---|---|---|---|---|
| | | | Weighted Net Revenue Change Percentage Points | |||||||
| | Net Revenue | |||||||||
| | 2014 | 2013 | ||||||||
| | Dollars in millions | | ||||||||
Infrastructure Technology Outsourcing | $ | 14,038 | $ | 15,223 | (4.9 | ) | ||||
Application and Business Services | 8,360 | 8,838 | (2.0 | ) | ||||||
| | | | | | | | | | | |
Total Enterprise Services | $ | 22,398 | $ | 24,061 | (6.9 | ) | ||||
| | | | | | | | | | | |
| | | | | | | | | | | |
| | | | | | | | | | | |
Fiscal 2015 compared with Fiscal 2014
ES net revenue decreased 11.6% (decreased 5.7% on a constant currency basis) in fiscal 2015. Performance in ES remained challenged by the impact of several large contracts winding down. The net revenue decrease in ES was due primarily to unfavorable currency impacts, revenue runoff in key accounts and weak growth in new and existing accounts, partially offset by growth in our SES portfolio which includes analytics and data management, security and cloud services. Net revenue in ITO decreased by 14% in fiscal 2015 due to unfavorable currency impacts, revenue runoff in key accounts and weak growth in new and existing accounts, particularly in EMEA in the first half of fiscal 2015, partially offset by growth in SES revenue in the second half of fiscal 2015. Net revenue in Application and Business Services ("ABS") declined by 8% in fiscal 2015, due to unfavorable currency impacts and weak growth in new and existing accounts particularly in the first half of fiscal 2015, partially offset by growth in SES net revenue in the second half of fiscal 2015.
ES earnings from operations as a percentage of net revenue increased 1.7 percentage points in fiscal 2015. The increase in operating margin was due to an increase in gross margin and a decrease in
HP INC. AND SUBSIDIARIES
Management's Discussion and Analysis of
Financial Condition and Results of Operations (Continued)
operating expenses as a percentage of net revenue. Gross margin increased due primarily to service delivery efficiencies and improving profit performance in underperforming contracts. The decrease in operating expenses as a percentage of net revenue was primarily driven by lower field selling costs, which was due to favorable currency impacts and our sales transformation initiatives.
Fiscal 2014 compared with Fiscal 2013
ES net revenue decreased 6.9% (decreased 6.8% on a constant currency basis) in fiscal 2014. Performance in ES remainsremained challenged by the impact of several large contracts winding down and lower public sector spending in EMEA, particularly in the United Kingdom, and several other countries in EMEA. The net revenue decrease in ES was due primarily to revenue runoff in key accounts, weak growth in new and existing accounts, particularly in EMEA, and contractual price declines. These effects were partially offset by net revenue growth in our SES portfolio, which includes information management and analytics, security and cloud services. Net revenue in Infrastructure Technology Outsourcing ("ITO") decreased by 8% in fiscal 2014 due to revenue runoff in key accounts, weak growth in new and existing accounts, particularly in EMEA, and contractual price declines in ongoing contracts partially offset by growth in cloud and security revenue and favorable currency impacts. Net revenue in Application and Business Services ("ABS")ABS decreased by 5% in fiscal 2014, due to revenue runoff in a key account, weak growth in new and existing accounts, particularly in EMEA, and unfavorable currency impacts, partially offset by growth in information management and analytics and cloud revenue.
ES earnings from operations as a percentage of net revenue increased 0.80.7 percentage points in fiscal 2014. The increase in operating margin was due to an increase in gross margin, partially offset by an increase in operating expenses as a percentage of net revenue. Gross margin increased due primarily to our continued focus on service delivery efficiencies, improving profit performance in under-performing contracts and labor savings as a result of restructuring, partially offset by unfavorable impacts from revenue runoff in key accounts and weak growth in new and existing accounts. The increase in operating expenses as a percentage of net revenue was primarily driven by the size of the revenue decline and higher administrative expenses and field selling costs. The increase in current year administrative expenses was due to the prior-year period containing higher bad debt recoveries and insurance recoveries. The increase in selling costs was the result of expanding the sales force coverage as we transition from a reactive sales model to a more proactive approach.
Software
| | For the fiscal years ended October 31 | |||||||||
|---|---|---|---|---|---|---|---|---|---|---|
| | 2015 | 2014 | 2013 | |||||||
| | Dollars in millions | |||||||||
Net revenue | $ | 3,458 | $ | 3,701 | $ | 3,789 | ||||
Earnings from operations | $ | 760 | $ | 828 | $ | 848 | ||||
Earnings from operations as a % of net revenue | 22.0 | % | 22.4 | % | 22.4 | % | ||||
Fiscal 20132015 compared with Fiscal 20122014
ESSoftware net revenue decreased 7.4%6.6% (decreased 6.3%2.7% on a constant currency basis) in fiscal 2013.2015. Revenue performancegrowth in ES continues to beSoftware is being challenged by several factors that impact the demand environment, including weak public sector spendingoverall market shift to SaaS solutions and related go-to-market sales execution challenges. Additionally, these challenges are impacting growth in the U.S. and austerity measures in other countries, particularly in the United Kingdom, and weak IT services spend due to the mixed global recovery, particularly in the EMEA region. The net revenue decrease in ES was driven primarily by net service revenue runoff, contractual price declines in ongoing contracts and unfavorable currency impacts. ITO net revenue decreased by 6% in fiscal 2013, due to net service revenue runoff,
HEWLETT-PACKARD COMPANYHP INC. AND SUBSIDIARIES
Management's Discussion and Analysis of
Financial Condition and Results of Operations (Continued)
contractual price declineslicense and support revenue. In fiscal 2015, net revenue growth was negatively impacted by foreign currency fluctuations across all regions, led primarily by weakness in ongoing contractsthe euro.
In fiscal 2015, net revenue from licenses, professional services, SaaS and support decreased by 13%, 8%, 3% and 3%, respectively. The decrease in license revenue was due primarily to the market shift to SaaS solutions and sales execution challenges and, as a result, we experienced lower revenue in IT Operations Management. Professional services net revenue decreased due primarily to unfavorable currency impacts, the effects of which wereour continued focus on higher-margin engagements, and, as a result, we experienced a net revenue decrease in big data solutions, partially offset by net revenue growth in security and cloud offerings. ABSproducts. SaaS net revenue declined 10%decreased due primarily to sales execution challenges, which resulted in fiscal 2013. Thelower revenue from big data solutions, partially offset by net revenue declinegrowth in IT Operations Management. The decrease in support revenue was due primarily to net service revenue runoff and unfavorable currency impacts the effects of which wereand past declines in license revenue, partially offset by revenue growth in cloud and information and analytics offerings. Revenue in ABS was also negatively impacted by weakness in public-sector spending.revenue for security products.
ESIn fiscal 2015, Software earnings from operations as a percentage of net revenue decreased 1.2by 0.4 percentage points in fiscal 2013. The decrease was due to a declinedecrease in gross margin combined withand an increase in operating expenses as a percentage of net revenue. GrossThe decrease in gross margin declinedwas due primarily to net service revenue runoff and contractual price declines. These unfavorable impacts to gross margin were partially offset by our continued focus on improving resource management and profit improvements on under-performing contracts. Operatinga lower mix of license revenue. The increase in operating expenses as a percentage of net revenue increasedwas due to higher administrative, marketingthe size of the revenue decline. During the period, operating expense declined due primarily to favorable currency impacts and R&D costs. These effects were partially offset by reducedlower SG&A expenses as a result of lower field selling costs due to lower headcount-related costs during the year and other savings from our ongoing restructuring efforts.driven by expense management.
Software
| | For the fiscal years ended October 31 | |||||||||
|---|---|---|---|---|---|---|---|---|---|---|
| | 2014 | 2013 | 2012 | |||||||
| | Dollars in millions | |||||||||
Net revenue | $ | 3,933 | $ | 4,021 | $ | 4,171 | ||||
Earnings from operations | $ | 872 | $ | 868 | $ | 836 | ||||
Earnings from operations as a % of net revenue | 22.2 | % | 21.6 | % | 20.0 | % | ||||
Fiscal 2014 compared with Fiscal 2013
Software net revenue decreased 2.2%2.3% (decreased 2.1%2.2% on a constant currency basis) in fiscal 2014. Revenue growth in Software is beingwas challenged by the overall market and customer shift to SaaS solutions, which is impacting growth in license and support revenue. In fiscal 2014, net revenue from licenses, support and professional services decreased by 3%, 2% and 5%6% respectively, while SaaS net revenue increased by 5%.
The decline in license net revenue was due to the market and customer shift to SaaS solutions, which resulted in lower revenue from IT/cloud management and information management products, partially offset by strength in some of our key focus areas of big data analytics and security. The decrease in support net revenue was due to past declines in license revenue. Professional services net revenue decreased as we continuecontinued our focus on higher-margin engagements. These declines were partially offset by higher SaaS revenue due to improving demand for our SaaS solutions in IT/cloud management products and security products.
In fiscal 2014, Software earnings from operations as a percentage of net revenue increased by 0.6remained flat in percentage points due topoints. There was an increase in gross margin, the effect of which was partially offset by an increase in operating expenses as a percentage of net revenue. The increase in gross margin was due to the shift to more profitable contracts and improved workforce utilization in professional services. The increase in operating expenses as a percentage of net revenue was due primarily to investments in R&D partially offset by lower SG&A expenses due to cost savings associated with our ongoing restructuring efforts and improved operational expense management.
HEWLETT-PACKARD COMPANYHP INC. AND SUBSIDIARIES
Management's Discussion and Analysis of
Financial Condition and Results of Operations (Continued)
HP Financial Services
| | For the fiscal years ended October 31 | |||||||||
|---|---|---|---|---|---|---|---|---|---|---|
| | 2015 | 2014 | 2013 | |||||||
| | Dollars in millions | |||||||||
Net revenue | $ | 3,216 | $ | 3,498 | $ | 3,629 | ||||
Earnings from operations | $ | 349 | $ | 389 | $ | 399 | ||||
Earnings from operations as a % of net revenue | 10.9 | % | 11.1 | % | 11.0 | % | ||||
Fiscal 20132015 compared with Fiscal 20122014
SoftwareHPFS net revenue decreased 3.6%by 8.1% (decreased 2.6%1.5% on a constant currency basis) in fiscal 2013. Net revenue from licenses and professional services decreased by 16% and 13%, respectively, while net revenue from SaaS and support increased by 10% and 7%, respectively.
The decline in software revenue was driven primarily by lower license revenue from IT/cloud management and information management products,2015 due primarily to a large deal entered intounfavorable currency impacts led by weakness in the prior yeareuro and the market shift to SaaS offerings. The revenue decline was also due to lower professional services revenue from IT/cloudasset management and information management products as we manage the professional services portfolio to focus on higher-margin solutions. These declines were partially offset by higher growthactivity in support revenue from our information management and security products and higher revenue growth in our SaaS offerings from IT/cloud management and information management products as we shift with the market to providing more SaaS offerings.customer buyouts.
SoftwareHPFS earnings from operations as a percentage of net revenue increaseddecreased by 1.60.2 percentage points in fiscal 20132015 due primarily to a decrease in gross margin while operating expense as a percentage of net revenue the effect of which was partially offset by a decreaseflat in gross margin.fiscal 2015 as compared to fiscal 2014. The decrease in gross margin was due primarily to higher development costsunfavorable currency impacts, lower margins in IT/cloud management productscustomer buyouts, and lower portfolio margin due to competitive pricing, the comparative impacteffects of a highly profitable software deal entered into in the prior year. These decreaseswhich were partially offset by a lower mix of lower-margin professional services revenue. The decrease in operating expensehigher margins from asset recovery services. Operating expenses as a percentage of net revenue was drivenflat as a result of lower SG&A expenses due primarily byto lower field selling costs due to cost savings associated with our ongoing restructuring efforts.the effects of which were offset by size of the revenue decline.
HP Financial Services
| | For the fiscal years ended October 31 | |||||||||
|---|---|---|---|---|---|---|---|---|---|---|
| | 2014 | 2013 | 2012 | |||||||
| | Dollars in millions | |||||||||
Net revenue | $ | 3,498 | $ | 3,629 | $ | 3,819 | ||||
Earnings from operations | $ | 389 | $ | 399 | $ | 388 | ||||
Earnings from operations as a % of net revenue | 11.1 | % | 11.0 | % | 10.2 | % | ||||
Fiscal 2014 compared with Fiscal 2013
HPFS net revenue decreased by 3.6% (decreased 3.3% on a constant currency basis) in fiscal 2014 due primarily to lower portfolio revenue from lower average portfolio assets and lower asset management activity, primarily in customer buyouts.
HPFS earnings from operations as a percentage of net revenue increased by 0.1 percentage points in fiscal 2014. The increase was due primarily to an increase in gross margin, partially offset by an increase in operating expenses as a percentage of net revenue. The increase in gross margin was the result of a higher portfolio margin, primarily from lower bad debt expense and a lower cost of funds and improved margins in remarketing sales. The increase in operating expenses as a percentage of net revenue was due primarily to higher go-to-market investments.
Fiscal 2013 compared with Fiscal 2012
HPFS net revenue decreased by 5.0% (decreased 4.2% on a constant currency basis) in fiscal 2013 due primarily to lower rental revenue from a decrease in average operating lease assets, lower asset recovery services revenue, and unfavorable currency impacts. These effects were partially offset by higher revenue from remarketing sales and higher finance income from an increase in finance lease assets.
HEWLETT-PACKARD COMPANY AND SUBSIDIARIES
Management's Discussion and Analysis ofFinancial Condition and Results of Operations (Continued)
HPFS earnings from operations as a percentage of net revenue increased by 0.8 percentage points in fiscal 2013. The increase was due primarily to an increase in gross margin, the effect of which was partially offset by an increase in operating expenses as a percentage of net revenue as a result of higher IT investments. The increase in gross margin was the result of higher portfolio margin from a lower mix of operating leases, higher margin on early buyouts and lower bad debt expense.
Financing OriginationsVolume
| | For the fiscal years ended October 31 | |||||||||
|---|---|---|---|---|---|---|---|---|---|---|
| | 2014 | 2013 | 2012 | |||||||
| | Dollars in millions | |||||||||
Total financing originations | $ | 6,425 | $ | 5,603 | $ | 6,590 | ||||
| | For the fiscal years ended October 31 | |||||||||
|---|---|---|---|---|---|---|---|---|---|---|
| | 2015 | 2014 | 2013 | |||||||
| | Dollars in millions | |||||||||
Total financing volume | $ | 6,504 | $ | 6,425 | $ | 5,603 | ||||
New financing originations,volume, which represent the amount of financing provided to customers for equipment and related software and services, including intercompany activity, increased 1.2% in fiscal 2015 and 14.7% in fiscal 2014, and decreased 15.0% in fiscal 2013, respectively. The increase in both fiscal 2015 and 2014 was driven by higher financing associated with HP product sales and related services offerings, while the decreaseofferings. The increase in fiscal 20132015 was primarily drivenpartially offset by lower financing associated with HP product sales and services offerings, and to a lesser extent unfavorable currency impacts.impacts led by weakness in the euro.
HP INC. AND SUBSIDIARIES
Management's Discussion and Analysis of
Financial Condition and Results of Operations (Continued)
Portfolio Assets and Ratios
The HPFS business model is asset intensive and uses certain internal metrics to measure its performance against other financial services companies, including a segment balance sheet that is derived from our internal management reporting system. The accounting policies used to derive HPFS amounts are substantially the same as those used by HP. However, intercompany loans and certain accounts that are reflected in the segment balances are eliminated in our Consolidated Financial Statements.
HEWLETT-PACKARD COMPANY AND SUBSIDIARIES
Management's Discussion and Analysis ofFinancial Condition and Results of Operations (Continued)
The portfolio assets and ratios derived from the segment balance sheet for HPFS were as follows:
| | As of October 31 | As of October 31 | ||||||||||||
|---|---|---|---|---|---|---|---|---|---|---|---|---|---|---|
| | 2014 | 2013 | 2015 | 2014 | ||||||||||
| | Dollars in millions | Dollars in millions | ||||||||||||
Financing receivables, gross | $ | 6,670 | $ | 7,153 | $ | 6,689 | $ | 6,670 | ||||||
Net equipment under operating leases | 2,595 | 2,370 | 2,710 | 2,595 | ||||||||||
Capitalized profit on intercompany equipment transactions(1) | 783 | 715 | 873 | 783 | ||||||||||
Intercompany leases(1) | 2,199 | 2,202 | 2,195 | 2,199 | ||||||||||
| | | | | | | | | | | | | | ||
Gross portfolio assets | 12,247 | 12,440 | 12,467 | 12,247 | ||||||||||
| | | | | | | | | | | | | | ||
Allowance for doubtful accounts(2) | 111 | 131 | 95 | 111 | ||||||||||
Operating lease equipment reserve | 68 | 76 | 58 | 68 | ||||||||||
| | | | | | | | | | | | | | ||
Total reserves | 179 | 207 | 153 | 179 | ||||||||||
| | | | | | | | | | | | | | ||
Net portfolio assets | $ | 12,068 | $ | 12,233 | $ | 12,314 | $ | 12,068 | ||||||
| | | | | | | | | | | | | | | |
| | | | | | | | | |||||||
Reserve coverage | 1.5 | % | 1.7 | % | 1.2 | % | 1.5 | % | ||||||
Debt-to-equity ratio(3) | 7.0x | 7.0x | 7.0x | 7.0x | ||||||||||
At October 31, 20142015 and October 31, 2013,2014, HPFS cash balancesand cash equivalents and short term investments were $829$589 million and $697$952 million, respectively.
Net portfolio assets at October 31, 2014 decreased 1.3%2015 increased 2% from October 31, 2013.2014. The decreaseincrease generally resulted from unfavorable currency impacts,new financing volume partially offset by new financing volume in excess of portfolio runoff.runoff and unfavorable currency impacts.
HPFS recorded net bad debt expensesexpense and operating lease equipment reserves of $46 million, $40 million, $50 million and $62$50 million in fiscal 2015, 2014 2013 and 2012,2013, respectively.
HEWLETT-PACKARD COMPANYHP INC. AND SUBSIDIARIES
Management's Discussion and Analysis of
Financial Condition and Results of Operations (Continued)
Corporate Investments
| | For the fiscal years ended October 31 | For the fiscal years ended October 31 | ||||||||||||||||||
|---|---|---|---|---|---|---|---|---|---|---|---|---|---|---|---|---|---|---|---|---|
| | 2014 | 2013 | 2012 | 2015 | 2014 | 2013 | ||||||||||||||
| | Dollars in millions | Dollars in millions | ||||||||||||||||||
Net revenue | $ | 302 | $ | 24 | $ | 58 | $ | 27 | $ | 302 | $ | 24 | ||||||||
Loss from operations | $ | (199 | ) | $ | (316 | ) | $ | (233 | ) | $ | (565 | ) | $ | (199 | ) | $ | (316 | ) | ||
Loss from operations as a % of net revenue(1) | (66.0 | )% | NM | NM | NM | (66.0 | )% | NM | ||||||||||||
Fiscal 2015 compared with Fiscal 2014
The revenue decrease for fiscal 2015 was due primarily to the sale of IP related to the Palm acquisition in the prior-year period.
The increase in the loss from operations for fiscal 2015 was due primarily to the sale of IP in the prior-year period and higher expenses from enterprise-related business incubation activities and HP Labs.
Fiscal 2014 compared with Fiscal 2013
The revenue increase for fiscal 2014 was due primarily to the sale of IP related to the Palm acquisition.
The decrease in the loss from operations for fiscal 2014 was due primarily to the sale of IP, the benefits of which were partially offset by higher expenses associated with cloud-relatedenterprise-related business incubation activities, corporate strategy, HP Labs and global alliances.
Fiscal 2013 compared with Fiscal 2012
In fiscal 2013, Corporate Investments net revenue was primarily related to licensing revenue from HP Labs. Net revenue decreased from fiscal 2012 due primarily to lower residual activity from the webOS device business and lower revenue from business intelligence products.
Costs and expenses in Corporate Investments are due to activities in the segment from residual activity related to the webOS device business, HP Labs, certain incubation projects, corporate strategy, and global alliances.
LIQUIDITY AND CAPITAL RESOURCES
We use cash generated by operations as our primary source of liquidity. We believe that internally generated cash flows are generally sufficient to support our operating businesses, capital expenditures, restructuring activities, maturingprincipal and interest payment of debt, income tax payments and the payment of stockholder dividends, in addition to investments and share repurchases. We are able to supplement this short-term liquidity, if necessary, with broad access to capital markets and credit facilities made available by various domestic and foreign financial institutions. Our access to capital markets may be constrained and our cost of borrowing may increase under certain business, market and economic conditions; however, our access to a variety of funding sources to meet our liquidity needs is designed to facilitate continued access to capital resources under all such conditions. Our liquidity is subject to various risks including the risks identified in the section entitled "Risk Factors" in Item 1A and market risks identified in the section entitled "Quantitative and Qualitative Disclosures about Market Risk" in Item 7A, which is incorporated herein by reference.
Our cash balances are held in numerous locations throughout the world, with substantially all of those amounts held outside of the U.S. We utilize a variety of planning and financing strategies in an effort to ensure that our worldwide cash is available when and where it is needed. Our cash position remains strong, and we expect that our cash balances, anticipated cash flow generated from operations and access to capital markets will be sufficient to cover our expected near-term cash outlays.
HEWLETT-PACKARD COMPANYHP INC. AND SUBSIDIARIES
Management's Discussion and Analysis of
Financial Condition and Results of Operations (Continued)
Amounts held outside of the U.S. are generally utilized to support non-U.S. liquidity needs, although a portion of those amounts may from time to time be subject to short-term intercompany loans into the U.S. Most of the amounts held outside of the U.S. could be repatriated to the U.S. but, under current law, some would be subject to U.S. federal income taxes, less applicable foreign tax credits. Repatriation of some foreign earnings is restricted by local law. Except for foreign earnings that are considered indefinitely reinvested outside of the U.S., we have provided for the U.S. federal tax liability on these earnings for financial statement purposes. Repatriation could result in additional income tax payments in future years. Where local restrictions prevent an efficient intercompany transfer of funds, our intent is that cash balances would remain outside of the U.S. and we would meet liquidity needs through ongoing cash flows, external borrowings, or both. We do not expect restrictions or potential taxes incurred on repatriation of amounts held outside of the U.S. to have a material effect on our overall liquidity, financial condition or results of operations.
In connection with the Separation, we reviewed our capital structure during fiscal 2015 to ensure that each company, HP Inc. and Hewlett Packard Enterprise, would be well capitalized after the Separation. In October 2015, prior to the Separation, Hewlett Packard Enterprise completed its offering of $14.6 billion senior unsecured notes and we redeemed and paid $6.6 billion of U.S. Dollar Global Notes as a result of early extinguishment of debt. In connection with our ongoing operations and in part due to the Separation, we repaid a short-term loan of $3.5 billion, issued $18.2 billion and repaid $18.4 billion of commercial paper in fiscal 2015. On November 4, 2015, we incrementally redeemed and paid $2.1 billion U.S. Dollar Global Notes as part of the final settlement of the debt redemption issued as a part of the Separation.
Liquidity
Our cash and cash equivalents, total debt and available borrowing resources were as follows:
| | As of October 31 | As of October 31 | ||||||||||||||||||
|---|---|---|---|---|---|---|---|---|---|---|---|---|---|---|---|---|---|---|---|---|
| | 2014 | 2013 | 2012 | 2015 | 2014 | 2013 | ||||||||||||||
| | In billions | In billions | ||||||||||||||||||
Cash and cash equivalents | $ | 15.1 | $ | 12.2 | $ | 11.3 | $ | 17.4 | $ | 15.1 | $ | 12.2 | ||||||||
Total debt | $ | 19.5 | $ | 22.6 | $ | 28.4 | $ | 24.7 | $ | 19.5 | $ | 22.6 | ||||||||
Available borrowing resources(1) | $ | 17.8 | $ | 17.8 | $ | 17.4 | $ | 19.0 | $ | 17.8 | $ | 17.8 | ||||||||
Our key cash flow metrics were as follows:
| | For the fiscal years ended October 31 | For the fiscal years ended October 31 | ||||||||||||||||||
|---|---|---|---|---|---|---|---|---|---|---|---|---|---|---|---|---|---|---|---|---|
| | 2014 | 2013 | 2012 | 2015 | 2014 | 2013 | ||||||||||||||
| | In millions | In millions | ||||||||||||||||||
Net cash provided by operating activities | $ | 12,333 | $ | 11,608 | $ | 10,571 | $ | 6,490 | $ | 12,333 | $ | 11,608 | ||||||||
Net cash used in investing activities | (2,792 | ) | (2,803 | ) | (3,453 | ) | (5,534 | ) | (2,792 | ) | (2,803 | ) | ||||||||
Net cash used in financing activities | (6,571 | ) | (7,943 | ) | (3,860 | ) | ||||||||||||||
Net cash provided by (used in) financing activities | 1,344 | (6,571 | ) | (7,943 | ) | |||||||||||||||
| | | | | | | | | | | | | | | | | | | |||
Net increase in cash and cash equivalents | $ | 2,970 | $ | 862 | $ | 3,258 | $ | 2,300 | $ | 2,970 | $ | 862 | ||||||||
| | | | | | | | | | | | | | | | | | | | ||
| | | | | | | | | | | | ||||||||||
HP INC. AND SUBSIDIARIES
Management's Discussion and Analysis of
Financial Condition and Results of Operations (Continued)
Operating Activities
Net cash provided by operating activities decreased by approximately $5.8 billion for fiscal 2015 as compared to fiscal 2014. The decrease was due primarily to lower cash generated from working capital management activities, payments for separation costs, lower cash receipts from contract manufacturers and financing receivables, lower net earnings in the current period, unfavorable currency impacts, as well as higher cash payments for prepaids and employee benefits. Net cash provided by operating activities increased by $0.7 billion for fiscal 2014 as compared to fiscal 2013, due primarily to improvements in working capital management. Net cash provided by operating activities increased by $1.0 billion for fiscal 2013 compared to fiscal 2012, due primarily to improvements in working capital management and a reduction in payments associated with webOS contract cancellations.
HEWLETT-PACKARD COMPANY AND SUBSIDIARIES
Management's Discussion and Analysis ofFinancial Condition and Results of Operations (Continued)
Our key working capital metrics were as follows:
| | As of October 31 | As of October 31 | ||||||||||||||||||
|---|---|---|---|---|---|---|---|---|---|---|---|---|---|---|---|---|---|---|---|---|
| | 2014 | 2013 | 2012 | 2015 | 2014 | 2013 | ||||||||||||||
Days of sales outstanding in accounts receivable | 44 | 49 | 49 | 47 | 44 | 49 | ||||||||||||||
Days of supply in inventory | 27 | 24 | 25 | 30 | 27 | 24 | ||||||||||||||
Days of purchases outstanding in accounts payable | (67 | ) | (56 | ) | (53 | ) | (74 | ) | (67 | ) | (56 | ) | ||||||||
| | | | | | | | | | | | | | | | | | | |||
Cash conversion cycle | 4 | 17 | 21 | 3 | 4 | 17 | ||||||||||||||
| | | | | | | | | | | | | | | | | | | | ||
| | | | | | | | | | | | ||||||||||
Days of sales outstanding in accounts receivable ("DSO") measures the average number of days our receivables are outstanding. DSO is calculated by dividing ending accounts receivable, net of allowance for doubtful accounts, by a 90-day average of net revenue. For fiscal 2015, the increase in DSO was due primarily to lower usage of cash discounts by our customers and longer standard payment terms for Aruba. For fiscal 2014, the decrease in DSO was due primarily to the impact of currency and the expansion of our factoring programs.
Days of supply in inventory ("DOS") measures the average number of days from procurement to sale of our product. DOS is calculated by dividing ending inventory by a 90-day average of cost of goods sold. For fiscal 2015, the increase in DOS was due to higher inventory balance to support future sales levels. For fiscal 2014, the increase in DOS was due to a higher inventory balance in Personal Systems due in part to strategic and advanced buys.
Days of purchases outstanding in accounts payable ("DPO") measures the average number of days our accounts payable balances are outstanding. DPO is calculated by dividing ending accounts payable by a 90-day average of cost of goods sold. For fiscal 2015, the increase in DPO was primarily the result of purchasing linearity and an extension of payment terms with our product suppliers. For fiscal 2014, the increase in DPO was primarily the result of an extension of payment terms with our product suppliers.
The cash conversion cycle is the sum of DSO and DOS less DPO. The cash conversion cycle ended fiscal 2014 below what we expect to be a long-term sustainable rate. Items which may cause the cash conversion cycle in a particular period to differ from a long-term sustainable rate include, but are not limited to, changes in business mix, changes in payment terms, extent of receivables factoring, seasonal trends and the timing of revenue recognition and inventory purchases within the period.
Investing Activities
Net cash used in investing activities increased by approximately $2.7 billion for fiscal 2015 as compared to fiscal 2014, due primarily to the acquisition of Aruba. Net cash used in investing activities
HP INC. AND SUBSIDIARIES
Management's Discussion and Analysis of
Financial Condition and Results of Operations (Continued)
was flat for fiscal 2014 as compared to fiscal 2013, due primarily to higher cash utilization for purchases of property, plant and equipment offset by cash generated from sales of available-for-sale securities. Net cash used in investing activities decreased by $0.7 billion for fiscal 2013 as compared to fiscal 2012, due primarily to lower investments in property, plant and equipment and higher net sales and maturities of available-for-sale securities.
Financing Activities
Net cash provided by financing activities was $1.3 billion in fiscal 2015 as compared to net cash used in financing activities of $6.6 billion in fiscal 2014. The change was due primarily to proceeds from the issuance of senior unsecured notes in October 2015 by Hewlett Packard Enterprise in principal amount of $14.6 billion and higher proceeds from issuance of commercial paper, partially offset by the repayment as a result of early debt extinguishment of $6.6 billion of U.S. Dollar Global Notes and higher repayment of commercial paper as compared to fiscal 2014. Net cash used in financing activities decreased by approximately $1.4 billion for fiscal 2014 as compared to fiscal 2013. The decrease was2013 due primarily to proceeds from the issuance of U.S. Dollar Global Notes in January 2014, partially offset by higher debt repayments and repurchases of common stock. Net cash used in financing activities increased by $4.1 billion for fiscal 2013 as compared to fiscal 2012. The increase was due primarily to higher maturities of debt and net repayments of commercial paper. For more information on our share repurchase programs, see Item 5 and Note 13 to the Consolidated Financial Statements in Item 8, which are incorporated herein by reference.
HEWLETT-PACKARD COMPANY AND SUBSIDIARIES
Management's Discussion and Analysis ofFinancial Condition and Results of Operations (Continued)
Capital Resources
Debt Levels
| | As of October 31 | As of October 31 | ||||||||||||||||||
|---|---|---|---|---|---|---|---|---|---|---|---|---|---|---|---|---|---|---|---|---|
| | 2014 | 2013 | 2012 | 2015 | 2014 | 2013 | ||||||||||||||
| | Dollars in millions | Dollars in millions | ||||||||||||||||||
Short-term debt | $ | 3,486 | $ | 5,979 | $ | 6,647 | $ | 2,885 | $ | 3,486 | $ | 5,979 | ||||||||
Long-term debt | $ | 16,039 | $ | 16,608 | $ | 21,789 | $ | 21,780 | $ | 16,039 | $ | 16,608 | ||||||||
Debt-to-equity ratio | 0.72x | 0.82x | 1.25x | 0.88x | 0.72x | 0.82x | ||||||||||||||
Weighted-average interest rate | 2.7 | % | 3.0 | % | 3.0 | % | 3.4 | % | 2.7 | % | 3.0 | % | ||||||||
We maintain debt levels that we establish through consideration of a number of factors, including cash flow expectations, cash requirements for operations, investment plans (including acquisitions), share repurchase activities, our cost of capital and targeted capital structure.
Short-term debt decreased by $601 million and long-term debt increased by approximately $5.7 billion for fiscal 2015 as compared to fiscal 2014. The net increase in total debt was due primarily to issuance of senior unsecured notes in October 2015 by Hewlett Packard Enterprise in principal amount of $14.6 billion which includes of $14.0 billion fixed rate notes and $600 million of floating rate notes, partially offset by the payment as a result of early debt extinguishment of $6.6 billion in connection with the Separation, maturities of $2.5 billion of U.S. Dollar Global Notes and repayment of $3.5 billion of short-term loan. We also issued $18.2 billion and repaid $18.4 billion of commercial paper in fiscal 2015. On November 4, 2015, we paid $2.1 billion of U.S. Dollar Global Notes as part of the final settlement of the debt redemption issued as a part of the Separation.
Short-term debt and long-term debt decreased by approximately $2.5 billion and $0.6 billion, respectively, for fiscal 2014 as compared to fiscal 2013. The net decrease in total debt was due primarily to maturities of debt. During fiscal 2014, we issued $2.0 billion of U.S. Dollar Global Notes under the 2012 Shelf Registration Statement which mature in 2019 and repaid $4.9 billion of U.S. Dollar Global Notes. We also issued $11.6 billion and repaid $11.5 billion of commercial paper in fiscal 2014. Short-term debt
HP INC. AND SUBSIDIARIES
Management's Discussion and long-term debt decreased by $0.6 billionAnalysis of
Financial Condition and $5.2 billion, respectively, for fiscal 2013 as compared to fiscal 2012. Both net decreases were due primarily to maturitiesResults of debt and net repayments of commercial paper. The issuances and repayments of commercial paper were $16.1 billion and $16.2 billion in fiscal 2013 and $12.2 billion and $15.0 billion in fiscal 2012, respectively.
During fiscal 2015, $2.5 billion of U.S. Dollar Global Notes are scheduled to mature, of which $650 million matured in December 2014. For more information on our borrowings, see Note 12 to the Consolidated Financial Statements in Item 8, which is incorporated herein by reference.Operations (Continued)
Our debt-to-equity ratio is calculated as the carrying amount of debt divided by total stockholders' equity. Our debt-to-equity ratio increased by 0.16x in fiscal 2015, due to an increase in total debt balances of $5.1 billion partially offset by an increase in stockholders' equity by $1.0 billion at the end of fiscal 2015. Our debt-to-equity ratio decreased by 0.10x in fiscal 2014, due to a decrease in total debt balances of $3.1 billion partially offset by a decrease in stockholders' equity by $0.5 billion at the end of fiscal 2014. Our debt-to-equity ratio decreased by 0.43x in fiscal 2013, due to a decrease in total debt balances of $5.8 billion coupled with an increase in stockholders' equity by $4.8 billion at the end of fiscal 2013.
For more information on our borrowings, see Note 12 to the Consolidated Financial Statements in Item 8, which is incorporated herein by reference.
Our weighted-average interest rate reflects the effective interest rate on our borrowings prevailing during the period and reflects the effect of interest rate swaps. For more information on our interest rate swaps, see Note 1113 to the Consolidated Financial Statements in Item 8, which is incorporated herein by reference.
HEWLETT-PACKARD COMPANY AND SUBSIDIARIES
Management's Discussion and Analysis ofFinancial Condition and Results of Operations (Continued)
Available Borrowing Resources
We had the following resources available to obtain short- or long-term financing if we need additional liquidity:
| ||||
| ||||
| ||||
| | As of October 31, 2015 | |||
|---|---|---|---|---|
| | In millions | |||
Commercial paper programs | $ | 16,461 | ||
Uncommitted lines of credit | $ | 2,524 | ||
For more information on our available borrowings resources, see Note 1213 to the Consolidated Financial Statements in Item 8, which is incorporated herein by reference.
Credit Ratings
Our credit risk is evaluated by major independent rating agencies based onupon publicly available information as well as information obtained in our ongoing discussions with them. Our credit ratings as of October 31, 2014, were as follows:
| |||||||||
| |||||||||
After the announcement of our separation in October 2014, our credit ratings were assigned a negative outlook by Standard & Poor's Rating Services and Fitch Rating Services. Additionally, Moody's Investors Service placed us under review for downgrade. In December 2013, Moody's Investors Service affirmed its negative outlook assigned in November 2012. While we do not have any rating downgrade triggers that would accelerate the maturity of a material amount of our debt, previous downgrades have increased the cost of borrowing under our credit facilities, have reduced market capacity for our commercial paper and have required the posting of additional collateral under some of our derivative contracts. In addition, any further downgrade to our credit ratings by any of these rating agencies may further impact us in a similar manner, and, depending on the extent of theany such downgrade, could have a negative impact on our liquidity and capital position. We can rely on alternative sources of funding, including drawdowns under our credit facilities, or the issuance of debt or other securities under our existing 2012 Shelf Registration Statement, if necessary, to offset potential reductions in the market capacity for our commercial paper.
HEWLETT-PACKARD COMPANYHP INC. AND SUBSIDIARIES
Management's Discussion and Analysis of
Financial Condition and Results of Operations (Continued)
CONTRACTUAL AND OTHER OBLIGATIONS
OurThe contractual and other obligations for HP (including Hewlett Packard Enterprise) as of October 31, 2014,2015, were as follows:
| | | Payments Due by Period | | Payments Due by Period | ||||||||||||||||||||||||||||
|---|---|---|---|---|---|---|---|---|---|---|---|---|---|---|---|---|---|---|---|---|---|---|---|---|---|---|---|---|---|---|---|---|
| | Total | 1 Year or Less | 1-3 Years | 3-5 Years | More than 5 Years | Total | 1 Year or Less | 1-3 Years | 3-5 Years | More than 5 Years | ||||||||||||||||||||||
| | In millions | In millions | ||||||||||||||||||||||||||||||
Principal payments on long-term debt(1) | $ | 18,539 | $ | 2,647 | $ | 5,938 | $ | 2,785 | $ | 7,169 | ||||||||||||||||||||||
Interest payments on long-term debt(2) | 3,990 | 480 | 793 | 601 | 2,116 | |||||||||||||||||||||||||||
Principal payments on debt(1) | $ | 24,538 | $ | 2,860 | $ | 5,635 | $ | 3,409 | $ | 12,634 | ||||||||||||||||||||||
Interest payments on debt(2) | 8,445 | 721 | 1,344 | 1,147 | 5,233 | |||||||||||||||||||||||||||
Operating lease obligations | 3,001 | 721 | 951 | 534 | 795 | 2,791 | 603 | 870 | 527 | 791 | ||||||||||||||||||||||
Purchase obligations | 2,113 | 1,383 | 518 | 212 | — | 2,654 | 1,126 | 944 | 451 | 133 | ||||||||||||||||||||||
Capital lease obligations | 48 | 8 | 12 | 7 | 21 | 104 | 28 | 51 | 8 | 17 | ||||||||||||||||||||||
| | | | | | | | | | | | | | | | | | | | | | | | | | | | | |||||
Total(4)(5)(6) | $ | 27,691 | $ | 5,239 | $ | 8,212 | $ | 4,139 | $ | 10,101 | ||||||||||||||||||||||
Total(5)(6)(7)(8) | $ | 38,532 | $ | 5,338 | $ | 8,844 | $ | 5,542 | $ | 18,808 | ||||||||||||||||||||||
| | | | | | | | | | | | | | | | | | | | | | | | | | | | | | ||||
| | | | | | | | | | | | | | | | | | ||||||||||||||||
HP INC. AND SUBSIDIARIES
Management's Discussion and Analysis of
Financial Condition and Results of Operations (Continued)
$18 million to its non-U.S. pension plans, approximately $36 million to cover benefit payments to U.S. non-qualified pension plan participants and expectsapproximately $43 million to paycover benefit claims of $47 million under itsfor HP's post-retirement benefit plans. Our policy is to fund our pension plans so that we meet at least the minimum contribution requirements, as established by local government, funding and taxing authorities. Expected contributions and payments to our pension and post-retirement benefit plans are excluded from the contractual obligations table because they do not represent contractual cash outflows as they are dependent on numerous factors which may result in a wide range of outcomes. For more information on our retirement and post-retirement benefit plans, see Note 4 to the Consolidated Financial Statements in Item 8, which is incorporated herein by reference.
HEWLETT-PACKARD COMPANY AND SUBSIDIARIES
Management's Discussion and Analysis ofFinancial Condition and Results of Operations (Continued)
excluded from the contractual obligations table, because they do not represent contractual cash outflows and there is uncertainty as to the timing of these payments. For more information on our restructuring activities, see Note 3 to the Consolidated Financial Statements in Item 8, which is incorporated herein by reference.
OFF-BALANCE SHEET ARRANGEMENTS
As part of our ongoing business, we have not participated in transactions that generate material relationships with unconsolidated entities or financial partnerships, such as entities often referred to as
HP INC. AND SUBSIDIARIES
Management's Discussion and Analysis of
Financial Condition and Results of Operations (Continued)
structured finance or special purpose entities, established for the purpose of facilitating off-balance sheet arrangements or other contractually narrow or limited purposes.
We have third-party revolving short-term financing arrangements intended to facilitate the working capital requirements of certain customers. The total aggregate maximum capacity of the financing arrangements was $3.0$3.3 billion as of October 31, 2014,2015, including an aggregate maximum capacity of $1.1$1.4 billion in non-recourse financing arrangements and an aggregate maximum capacity of $1.9 billion in partial-recourse facilities. For more information on our third-party revolving short-term financing arrangements, see Note 7 to the Consolidated Financial Statements in Item 8, which is incorporated herein by reference.
ITEM 7A. Quantitative and Qualitative Disclosures About Market Risk.
In the normal course of business, we are exposed to foreign currency exchange rate and interest rate risks that could impact our financial position and results of operations. Our risk management strategy with respect to these market risks may include the use of derivative financial instruments. We use derivative contracts only to manage existing underlying exposures. Accordingly, we do not use derivative contracts for speculative purposes. Our risks, risk management strategy and a sensitivity analysis estimating the effects of changes in fair value for each of these exposures is outlined below.
Actual gains and losses in the future may differ materially from the sensitivity analyses based on changes in the timing and amount of foreign currency exchange rate and interest rate movements and our actual exposures and derivatives in place at the time of the change, as well as the effectiveness of the derivative to hedge the related exposure.
Foreign currency exchange rate risk
We are exposed to foreign currency exchange rate risk inherent in our sales commitments, anticipated sales, anticipated purchases and assets and liabilities denominated in currencies other than the U.S. dollar. We transact business in approximately 7579 currencies worldwide, of which the most significant foreign currencies to our operations for fiscal 20142015 were the euro, the British pound, Chinese yuan renminbi and the Japanese Yen.yen. For most currencies, we are a net receiver of the foreign currency and therefore benefit from a weaker U.S. dollar and are adversely affected by a stronger U.S. dollar relative to the foreign currency. Even where we are a net receiver of the foreign currency, a weaker U.S. dollar may adversely affect certain expense figures, if taken alone.
We use a combination of forward contracts and at times, options designated as cash flow hedges to protect against the foreign currency exchange rate risks inherent in our forecasted net revenue and, to a lesser extent, cost of sales and intercompany loans denominated in currencies other than the U.S. dollar. In addition, when debt is denominated in a foreign currency, we may use swaps to exchange the foreign currency principal and interest obligations for U.S. dollar-denominated amounts to manage the exposure to changes in foreign currency exchange rates. We also use other derivatives not designated as hedging instruments consisting primarily of forward contracts to hedge foreign currency balance sheet exposures. Alternatively, we may choose not to hedge the risk associated with our foreign currency exposures, primarily if such exposure acts as a natural hedge for offsetting amounts denominated in the same currency or if the currency is too difficult or too expensive to hedge.
We have performed sensitivity analyses as of October 31, 20142015 and 2013,2014, using a modeling technique that measures the change in the fair values arising from a hypothetical 10% adverse movement in the levels of foreign currency exchange rates relative to the U.S. dollar, with all other variables held constant. The analyses cover all of our foreign currency derivative contracts offset by underlying exposures. The foreign currency exchange rates we used in performing the sensitivity analysis were based on market rates in effect at October 31, 20142015 and 2013.2014. The sensitivity analyses indicated that a hypothetical 10% adverse movement in foreign currency exchange rates would result in a foreign exchange fair value loss of $62$72 million and $80$62 million at October 31, 20142015 and October 31, 2013,2014, respectively.
Interest rate risk
We also are exposed to interest rate risk related to debt we have issued and our investment portfolio and financing receivables.
We issue long-term debt in either U.S. dollars or foreign currencies based on market conditions at the time of financing. We often use interest rate and/or currency swaps to modify the market risk exposures in connection with the debt to achieve U.S. dollar LIBOR-based floating interest expense.
The swap transactions generally involve the exchange of fixed for floating interest payments. However, we may choose not to swap fixed for floating interest payments or may terminate a previously executed swap if we believe a larger proportion of fixed-rate debt would be beneficial.
In order to hedge the fair value of certain fixed-rate investments, we may enter into interest rate swaps that convert fixed interest returns into variable interest returns. We may use cash flow hedges to hedge the variability of LIBOR-based interest income received on certain variable-rate investments. We may also enter into interest rate swaps that convert variable rate interest returns into fixed-rate interest returns.
We have performed sensitivity analyses as of October 31, 20142015 and 2013,2014, using a modeling technique that measures the change in the fair values arising from a hypothetical 10% adverse movement in the levels of interest rates across the entire yield curve, with all other variables held constant. The analyses cover our debt, investments, financing receivables and interest rate swaps. The analyses use actual or approximate maturities for the debt, investments, financing receivables and interest rate swaps. The discount rates used were based on the market interest rates in effect at October 31, 20142015 and 2013.2014. The sensitivity analyses indicated that a hypothetical 10% adverse movement in interest rates would result in a loss in the fair values of our debt, investments and financing receivables, net of interest rate swaps, of $119 million at October 31, 2015 and $80 million at October 31, 2014 and $95 million at October 31, 2013.2014.
ITEM 8. Financial Statements and Supplementary Data.
| | Page | |||
|---|---|---|---|---|
Reports of Independent Registered Public Accounting Firm | ||||
Management's Report on Internal Control Over Financial Reporting | ||||
Consolidated Statements of Earnings | ||||
Consolidated Statements of Comprehensive Income | ||||
Consolidated Balance Sheets | ||||
Consolidated Statements of Cash Flows | ||||
Consolidated Statements of Stockholders' Equity | ||||
Notes to Consolidated Financial Statements | ||||
Note 1: Overview and Summary of Significant Accounting Policies | ||||
Note 2: Segment Information | ||||
Note 3: Restructuring | ||||
Note 4: Retirement and Post-Retirement Benefit Plans | ||||
Note 5: Stock-Based Compensation | ||||
Note 6: Taxes on Earnings | ||||
Note 7: Balance Sheet Details | ||||
Note 8: Financing Receivables and Operating Leases | ||||
Note 9: Acquisitions and Divestitures | 145 | |||
Note 10: Goodwill and Intangible Assets | ||||
Note | ||||
Note | ||||
Note | ||||
Note | ||||
Note | ||||
Note | ||||
| 167 | |||
Note 17: Guarantees, Indemnifications and Warranties | 177 | |||
Note 18: Commitments | ||||
Quarterly Summary | ||||
Report of Independent Registered Public Accounting Firm
To the Board of Directors and Stockholders of Hewlett-Packard Company HP Inc.
We have audited the accompanying consolidated balance sheets of Hewlett-Packard CompanyHP Inc. and subsidiaries as of October 31, 20142015 and 2013,2014, and the related consolidated statements of earnings, comprehensive income, stockholders' equity, and cash flows for each of the three years in the period ended October 31, 2014.2015. These financial statements are the responsibility of the Company's management. Our responsibility is to express an opinion on these financial statements based on our audits.
We conducted our audits in accordance with the standards of the Public Company Accounting Oversight Board (United States). Those standards require that we plan and perform the audit to obtain reasonable assurance about whether the financial statements are free of material misstatement. An audit includes examining, on a test basis, evidence supporting the amounts and disclosures in the financial statements. An audit also includes assessing the accounting principles used and significant estimates made by management, as well as evaluating the overall financial statement presentation. We believe that our audits provide a reasonable basis for our opinion.
In our opinion, the financial statements referred to above present fairly, in all material respects, the consolidated financial position of Hewlett-Packard CompanyHP Inc. and subsidiaries at October 31, 20142015 and 2013,2014, and the consolidated results of their operations and their cash flows for each of the three years in the period ended October 31, 2014,2015, in conformity with U.S. generally accepted accounting principles.
We also have audited, in accordance with the standards of the Public Company Accounting Oversight Board (United States), Hewlett-Packard Company'sHP Inc.'s internal control over financial reporting as of October 31, 2014,2015, based on criteria established in Internal Control—Integrated Framework issued by the Committee of Sponsoring Organizations of the Treadway Commission (1992(2013 framework) and our report dated December 17, 201416, 2015 expressed an unqualified opinion thereon.
/s/ ERNST & YOUNG LLP
San Jose, California
December 17, 201416, 2015
Report of Independent Registered Public Accounting Firm
To the Board of Directors and Stockholders of Hewlett-Packard Company HP Inc.
We have audited Hewlett-Packard Company'sHP Inc.'s internal control over financial reporting as of October 31, 2014,2015, based on criteria established in Internal Control—Integrated Framework issued by the Committee of Sponsoring Organizations of the Treadway Commission (1992(2013 framework) (the COSO criteria). Hewlett-Packard Company'sHP Inc.'s management is responsible for maintaining effective internal control over financial reporting, and for its assessment of the effectiveness of internal control over financial reporting included in the accompanying Management's Report on Internal Control Over Financial Reporting. Our responsibility is to express an opinion on the company's internal control over financial reporting based on our audit.
We conducted our audit in accordance with the standards of the Public Company Accounting Oversight Board (United States). Those standards require that we plan and perform the audit to obtain reasonable assurance about whether effective internal control over financial reporting was maintained in all material respects. Our audit included obtaining an understanding of internal control over financial reporting, assessing the risk that a material weakness exists, testing and evaluating the design and operating effectiveness of internal control based on the assessed risk, and performing such other procedures as we considered necessary in the circumstances. We believe that our audit provides a reasonable basis for our opinion.
A company's internal control over financial reporting is a process designed to provide reasonable assurance regarding the reliability of financial reporting and the preparation of financial statements for external purposes in accordance with generally accepted accounting principles. A company's internal control over financial reporting includes those policies and procedures that (1) pertain to the maintenance of records that, in reasonable detail, accurately and fairly reflect the transactions and dispositions of the assets of the company; (2) provide reasonable assurance that transactions are recorded as necessary to permit preparation of financial statements in accordance with generally accepted accounting principles, and that receipts and expenditures of the company are being made only in accordance with authorizations of management and directors of the company; and (3) provide reasonable assurance regarding prevention or timely detection of unauthorized acquisition, use or disposition of the company's assets that could have a material effect on the financial statements.
Because of its inherent limitations, internal control over financial reporting may not prevent or detect misstatements. Also, projections of any evaluation of effectiveness to future periods are subject to the risk that controls may become inadequate because of changes in conditions, or that the degree of compliance with the policies or procedures may deteriorate.
In our opinion, Hewlett-Packard CompanyHP Inc. maintained, in all material respects, effective internal control over financial reporting as of October 31, 2014,2015, based on the COSO criteria.
We also have audited, in accordance with the standards of the Public Company Accounting Oversight Board (United States), the accompanying consolidated balance sheets of Hewlett-Packard CompanyHP Inc. and subsidiaries as of October 31, 20142015 and 2013,2014, and the related consolidated statements of earnings, comprehensive income, stockholders' equity and cash flows for each of the three years in the period ended October 31, 20142015 and our report dated December 17, 201416, 2015 expressed an unqualified opinion thereon.
/s/ ERNST & YOUNG LLP
San Jose, California
December 17, 201416, 2015
Management's Report on Internal Control Over Financial Reporting
HP's management is responsible for establishing and maintaining adequate internal control over financial reporting for HP. HP's internal control over financial reporting is a process designed to provide reasonable assurance regarding the reliability of financial reporting and the preparation of financial statements for external purposes in accordance with U.S. generally accepted accounting principles. HP's internal control over financial reporting includes those policies and procedures that (i) pertain to the maintenance of records that, in reasonable detail, accurately and fairly reflect the transactions and dispositions of the assets of HP; (ii) provide reasonable assurance that transactions are recorded as necessary to permit preparation of financial statements in accordance with generally accepted accounting principles, and that receipts and expenditures of HP are being made only in accordance with authorizations of management and directors of HP; and (iii) provide reasonable assurance regarding prevention or timely detection of unauthorized acquisition, use, or disposition of HP's assets that could have a material effect on the financial statements.
Because of its inherent limitations, internal control over financial reporting may not prevent or detect misstatements. Also, projections of any evaluation of effectiveness to future periods are subject to the risk that controls may become inadequate because of changes in conditions, or that the degree of compliance with the policies or procedures may deteriorate.
HP's management assessed the effectiveness of HP's internal control over financial reporting as of October 31, 2014,2015, utilizing the criteria set forth by the Committee of Sponsoring Organizations of the Treadway Commission (COSO) in Internal Control—Integrated Framework (1992(2013 framework). Based on the assessment by HP's management, we determined that HP's internal control over financial reporting was effective as of October 31, 2014.2015. The effectiveness of HP's internal control over financial reporting as of October 31, 20142015 has been audited by Ernst & Young LLP, HP's independent registered public accounting firm, as stated in their report which appears on page 8286 of this Annual Report on Form 10-K.
| /s/ December | /s/ CATHERINE A. LESJAK Catherine A. Lesjak December |
HEWLETT-PACKARD COMPANYHP INC. AND SUBSIDIARIES
Consolidated Statements of Earnings
| | For the fiscal years ended October 31 | For the fiscal years ended October 31 | ||||||||||||||||||
|---|---|---|---|---|---|---|---|---|---|---|---|---|---|---|---|---|---|---|---|---|
| | 2014 | 2013 | 2012 | 2015 | 2014 | 2013 | ||||||||||||||
| | In millions, except per share amounts | In millions, except per share amounts | ||||||||||||||||||
Net revenue: | ||||||||||||||||||||
Products | $ | 73,726 | $ | 72,398 | $ | 77,887 | $ | 69,032 | $ | 73,726 | $ | 72,398 | ||||||||
Services | 37,327 | 39,453 | 42,008 | 33,962 | 37,327 | 39,453 | ||||||||||||||
Financing income | 401 | 447 | 462 | 361 | 401 | 447 | ||||||||||||||
| | | | | | | | | | | | | | | | | | | |||
Total net revenue | 111,454 | 112,298 | 120,357 | 103,355 | 111,454 | 112,298 | ||||||||||||||
| | | | | | | | | | | | | | | | | | | |||
Costs and expenses: | ||||||||||||||||||||
Cost of products | 56,469 | 55,632 | 59,468 | 53,081 | 56,469 | 55,632 | ||||||||||||||
Cost of services | 28,093 | 30,436 | 32,600 | 25,275 | 28,093 | 30,436 | ||||||||||||||
Financing interest | 277 | 312 | 317 | 240 | 277 | 312 | ||||||||||||||
Research and development | 3,447 | 3,135 | 3,399 | 3,502 | 3,447 | 3,135 | ||||||||||||||
Selling, general and administrative | 13,353 | 13,267 | 13,500 | 12,185 | 13,353 | 13,267 | ||||||||||||||
Amortization of intangible assets | 1,000 | 1,373 | 1,784 | 931 | 1,000 | 1,373 | ||||||||||||||
Impairment of goodwill and intangible assets | — | — | 18,035 | |||||||||||||||||
Restructuring charges | 1,619 | 990 | 2,266 | 1,017 | 1,619 | 990 | ||||||||||||||
Acquisition-related charges | 11 | 22 | 45 | |||||||||||||||||
Acquisition and other related charges | 90 | 11 | 22 | |||||||||||||||||
Separation costs | 1,259 | — | — | |||||||||||||||||
Defined benefit plan settlement charges | 168 | — | — | |||||||||||||||||
Impairment of data center assets | 136 | — | — | |||||||||||||||||
| | | | | | | | | | | | | | | | | | | |||
Total operating expenses | 104,269 | 105,167 | 131,414 | 97,884 | 104,269 | 105,167 | ||||||||||||||
| | | | | | | | | | | | | | | | | | | |||
Earnings (loss) from operations | 7,185 | 7,131 | (11,057 | ) | ||||||||||||||||
Earnings from operations | 5,471 | 7,185 | 7,131 | |||||||||||||||||
| | | | | | | | | | | | | | | | | | | |||
Interest and other, net | (628 | ) | (621 | ) | (876 | ) | (739 | ) | (628 | ) | (621 | ) | ||||||||
| | | | | | | | | | | | | | | | | | | |||
Earnings (loss) before taxes | 6,557 | 6,510 | (11,933 | ) | ||||||||||||||||
Earnings before taxes | 4,732 | 6,557 | 6,510 | |||||||||||||||||
Provision for taxes | (1,544 | ) | (1,397 | ) | (717 | ) | (178 | ) | (1,544 | ) | (1,397 | ) | ||||||||
| | | | | | | | | | | | | | | | | | | |||
Net earnings (loss) | $ | 5,013 | $ | 5,113 | $ | (12,650 | ) | |||||||||||||
Net earnings | $ | 4,554 | $ | 5,013 | $ | 5,113 | ||||||||||||||
| | | | | | | | | | | | | | | | | | | | ||
Net earnings (loss) per share: | ||||||||||||||||||||
| | | | | | | | | | | | ||||||||||
Net earnings per share: | ||||||||||||||||||||
Basic | $ | 2.66 | $ | 2.64 | $ | (6.41 | ) | $ | 2.51 | $ | 2.66 | $ | 2.64 | |||||||
| | | | | | | | | | | | | | | | | | | | ||
| | | | | | | | | | | | ||||||||||
Diluted | $ | 2.62 | $ | 2.62 | $ | (6.41 | ) | $ | 2.48 | $ | 2.62 | $ | 2.62 | |||||||
| | | | | | | | | | | | | | | | | | | | ||
Weighted-average shares used to compute net earnings (loss) per share: | ||||||||||||||||||||
| | | | | | | | | | | | ||||||||||
Weighted average shares used to compute net earnings per share: | ||||||||||||||||||||
Basic | 1,882 | 1,934 | 1,974 | 1,814 | 1,882 | 1,934 | ||||||||||||||
| | | | | | | | | | | | | | | | | | | | ||
| | | | | | | | | | | | ||||||||||
Diluted | 1,912 | 1,950 | 1,974 | 1,836 | 1,912 | 1,950 | ||||||||||||||
| | | | | | | | | | | | | | | | | | | | ||
| | | | | | | | | | | | ||||||||||
The accompanying notes are an integral part of these Consolidated Financial Statements.
HEWLETT-PACKARD COMPANYHP INC. AND SUBSIDIARIES
Consolidated Statements of Comprehensive Income
| | For the fiscal years ended October 31 | For the fiscal years ended October 31 | ||||||||||||||||||
|---|---|---|---|---|---|---|---|---|---|---|---|---|---|---|---|---|---|---|---|---|
| | 2014 | 2013 | 2012 | 2015 | 2014 | 2013 | ||||||||||||||
| | In millions | In millions | ||||||||||||||||||
Net earnings (loss) | $ | 5,013 | $ | 5,113 | $ | (12,650 | ) | |||||||||||||
Net earnings | $ | 4,554 | $ | 5,013 | $ | 5,113 | ||||||||||||||
| | | | | | | | | | | | ||||||||||
Other comprehensive (loss) income before taxes: | ||||||||||||||||||||
Change in unrealized (losses) gains on available-for-sale securities: | ||||||||||||||||||||
Unrealized (losses) gains arising during the period | (17 | ) | 7 | 52 | ||||||||||||||||
Gains reclassified into earnings | — | (1 | ) | (49 | ) | |||||||||||||||
| | | | | | | | | | | | ||||||||||
| (17 | ) | 6 | 3 | |||||||||||||||||
| | | | | | | | | | | | | | | | | | | |||
Other comprehensive (loss) income before taxes: | ||||||||||||||||||||
Change in unrealized gains on available-for-sale securities: | ||||||||||||||||||||
Unrealized gains arising during the period | 7 | 52 | 25 | |||||||||||||||||
Gains reclassified into earnings | (1 | ) | (49 | ) | — | |||||||||||||||
Change in unrealized (losses) gains on cash flow hedges: | ||||||||||||||||||||
Unrealized gains (losses) arising during the period | 1,091 | 337 | (243 | ) | ||||||||||||||||
(Gains) losses reclassified into earnings | (1,312 | ) | 151 | 106 | ||||||||||||||||
| | | | | | | | | | | | | | | | | | | |||
| 6 | 3 | 25 | ||||||||||||||||||
| | | | | | | | ||||||||||||||
Change in unrealized gains (losses) on cash flow hedges: | ||||||||||||||||||||
Unrealized gains (losses) arising during the period | 337 | (243 | ) | 335 | ||||||||||||||||
Losses (gains) reclassified into earnings | 151 | 106 | (399 | ) | ||||||||||||||||
| | | | | | | | ||||||||||||||
| 488 | (137 | ) | (64 | ) | ||||||||||||||||
| (221 | ) | 488 | (137 | ) | ||||||||||||||||
| | | | | | | | | | | | | | | | | | | |||
Change in unrealized components of defined benefit plans: | ||||||||||||||||||||
(Losses) gains arising during the period | (2,756 | ) | 1,953 | (2,457 | ) | (548 | ) | (2,756 | ) | 1,953 | ||||||||||
Amortization of actuarial loss and prior service benefit | 259 | 326 | 172 | 443 | 259 | 326 | ||||||||||||||
Curtailments, settlements and other | 51 | 25 | 122 | 115 | 51 | 25 | ||||||||||||||
| | | | | | | | | | | | | | | | | | | |||
| (2,446 | ) | 2,304 | (2,163 | ) | ||||||||||||||||
| 10 | (2,446 | ) | 2,304 | |||||||||||||||||
| | | | | | | | | | | | | | | | | | | |||
Change in cumulative translation adjustment | (85 | ) | (150 | ) | (47 | ) | (207 | ) | (85 | ) | (150 | ) | ||||||||
| | | | | | | | | | | | | | | | | | | |||
Other comprehensive (loss) income before taxes | (2,037 | ) | 2,020 | (2,249 | ) | (435 | ) | (2,037 | ) | 2,020 | ||||||||||
(Provision) benefit for taxes | (66 | ) | (239 | ) | 188 | |||||||||||||||
Benefit (provision) for taxes | 14 | (66 | ) | (239 | ) | |||||||||||||||
| | | | | | | | | | | | | | | | | | | |||
Other comprehensive (loss) income, net of taxes | (2,103 | ) | 1,781 | (2,061 | ) | (421 | ) | (2,103 | ) | 1,781 | ||||||||||
| | | | | | | | | | | | | | | | | | | |||
Comprehensive income (loss) | $ | 2,910 | $ | 6,894 | $ | (14,711 | ) | |||||||||||||
Comprehensive income | $ | 4,133 | $ | 2,910 | $ | 6,894 | ||||||||||||||
| | | | | | | | | | | | | | | | | | | | ||
| | | | | | | | | | | | ||||||||||
The accompanying notes are an integral part of these Consolidated Financial Statements.
HEWLETT-PACKARD COMPANYHP INC. AND SUBSIDIARIES
Consolidated Balance Sheets
| | As of October 31 | As of October 31 | ||||||||||||
|---|---|---|---|---|---|---|---|---|---|---|---|---|---|---|
| | 2014 | 2013 | 2015 | 2014 | ||||||||||
| | In millions, except par value | In millions, except par value | ||||||||||||
ASSETS | ||||||||||||||
Current assets: | ||||||||||||||
Cash and cash equivalents | $ | 15,133 | $ | 12,163 | $ | 17,433 | $ | 15,133 | ||||||
Accounts receivable | 13,832 | 15,876 | 13,363 | 13,832 | ||||||||||
Financing receivables | 2,946 | 3,144 | 2,918 | 2,946 | ||||||||||
Inventory | 6,415 | 6,046 | 6,485 | 6,415 | ||||||||||
Other current assets | 11,819 | 13,135 | 11,588 | 11,819 | ||||||||||
| | | | | | | | | | | | | | ||
Total current assets | 50,145 | 50,364 | 51,787 | 50,145 | ||||||||||
| | | | | | | | | | | | | | ||
Property, plant and equipment | 11,340 | 11,463 | 11,090 | 11,340 | ||||||||||
Long-term financing receivables and other assets | 8,454 | 9,556 | 9,050 | 8,454 | ||||||||||
Goodwill | 31,139 | 31,124 | 32,941 | 31,139 | ||||||||||
Intangible assets | 2,128 | 3,169 | 2,014 | 2,128 | ||||||||||
| | | | | | | | | | | | | | ||
Total assets | $ | 103,206 | $ | 105,676 | $ | 106,882 | $ | 103,206 | ||||||
| | | | | | | | | | | | | | | |
| | | | | | | | | |||||||
LIABILITIES AND STOCKHOLDERS' EQUITY | ||||||||||||||
Current liabilities: | ||||||||||||||
Notes payable and short-term borrowings | $ | 3,486 | $ | 5,979 | $ | 2,885 | $ | 3,486 | ||||||
Accounts payable | 15,903 | 14,019 | 15,956 | 15,903 | ||||||||||
Employee compensation and benefits | 4,209 | 4,436 | 3,608 | 4,209 | ||||||||||
Taxes on earnings | 1,017 | 1,203 | 830 | 1,017 | ||||||||||
Deferred revenue | 6,143 | 6,477 | 6,199 | 6,143 | ||||||||||
Accrued restructuring | 898 | 901 | 689 | 898 | ||||||||||
Other accrued liabilities | 12,079 | 12,506 | 12,024 | 12,079 | ||||||||||
| | | | | | | | | | | | | | ||
Total current liabilities | 43,735 | 45,521 | 42,191 | 43,735 | ||||||||||
| | | | | | | | | | | | | | ||
Long-term debt | 16,039 | 16,608 | 21,780 | 16,039 | ||||||||||
Other liabilities | 16,305 | 15,891 | 14,760 | 16,305 | ||||||||||
Commitments and contingencies | ||||||||||||||
Stockholders' equity: | ||||||||||||||
HP stockholders' equity | ||||||||||||||
Preferred stock, $0.01 par value (300 shares authorized; none issued) | — | — | — | — | ||||||||||
Common stock, $0.01 par value (9,600 shares authorized; 1,839 and 1,908 shares issued and outstanding at October 31, 2014 and October 31, 2013, respectively) | 18 | 19 | ||||||||||||
Common stock, $0.01 par value (9,600 shares authorized; 1,804 and 1,839 shares issued and outstanding at October 31, 2015 and 2014, respectively) | 18 | 18 | ||||||||||||
Additional paid-in capital | 3,430 | 5,465 | 1,963 | 3,430 | ||||||||||
Retained earnings | 29,164 | 25,563 | 32,089 | 29,164 | ||||||||||
Accumulated other comprehensive loss | (5,881 | ) | (3,778 | ) | (6,302 | ) | (5,881 | ) | ||||||
| | | | | | | | | | | | | | ||
Total HP stockholders' equity | 26,731 | 27,269 | 27,768 | 26,731 | ||||||||||
Non-controlling interests | 396 | 387 | 383 | 396 | ||||||||||
| | | | | | | | | | | | | | ||
Total stockholders' equity | 27,127 | 27,656 | 28,151 | 27,127 | ||||||||||
| | | | | | | | | | | | | | ||
Total liabilities and stockholders' equity | $ | 103,206 | $ | 105,676 | $ | 106,882 | $ | 103,206 | ||||||
| | | | | | | | | | | | | | | |
| | | | | | | | | |||||||
The accompanying notes are an integral part of these Consolidated Financial Statements.
HEWLETT-PACKARD COMPANYHP INC. AND SUBSIDIARIES
Consolidated Statements of Cash Flows
| | For the fiscal years ended October 31 | For the fiscal years ended October 31 | ||||||||||||||||||
|---|---|---|---|---|---|---|---|---|---|---|---|---|---|---|---|---|---|---|---|---|
| | 2014 | 2013 | 2012 | 2015 | 2014 | 2013 | ||||||||||||||
| | In millions | In millions | ||||||||||||||||||
Cash flows from operating activities: | ||||||||||||||||||||
Net earnings (loss) | $ | 5,013 | $ | 5,113 | $ | (12,650 | ) | |||||||||||||
Adjustments to reconcile net earnings (loss) to net cash provided by operating activities: | ||||||||||||||||||||
Net earnings | $ | 4,554 | $ | 5,013 | $ | 5,113 | ||||||||||||||
Adjustments to reconcile net earnings to net cash provided by operating activities: | ||||||||||||||||||||
Depreciation and amortization | 4,334 | 4,611 | 5,095 | 4,061 | 4,334 | 4,611 | ||||||||||||||
Impairment of goodwill and intangible assets | — | — | 18,035 | |||||||||||||||||
Stock-based compensation expense | 560 | 500 | 635 | 709 | 560 | 500 | ||||||||||||||
Provision for doubtful accounts | 55 | 61 | 142 | 71 | 55 | 61 | ||||||||||||||
Provision for inventory | 211 | 275 | 277 | 305 | 211 | 275 | ||||||||||||||
Restructuring charges | 1,619 | 990 | 2,266 | 1,017 | 1,619 | 990 | ||||||||||||||
Deferred taxes on earnings | (34 | ) | (410 | ) | (711 | ) | (700 | ) | (34 | ) | (410 | ) | ||||||||
Excess tax benefit from stock-based compensation | (58 | ) | (2 | ) | (12 | ) | (145 | ) | (58 | ) | (2 | ) | ||||||||
Other, net | 81 | 443 | 265 | 1,031 | 81 | 443 | ||||||||||||||
Changes in operating assets and liabilities (net of acquisitions): | ||||||||||||||||||||
Changes in operating assets and liabilities, net of acquisitions: | ||||||||||||||||||||
Accounts receivable | 2,017 | 530 | 1,687 | 572 | 2,017 | 530 | ||||||||||||||
Financing receivables | 420 | 484 | (418 | ) | (65 | ) | 420 | 484 | ||||||||||||
Inventory | (580 | ) | (4 | ) | 890 | (330 | ) | (580 | ) | (4 | ) | |||||||||
Accounts payable | 1,912 | 541 | (1,414 | ) | 31 | 1,912 | 541 | |||||||||||||
Taxes on earnings | 310 | 417 | (320 | ) | (137 | ) | 310 | 417 | ||||||||||||
Restructuring | (1,506 | ) | (904 | ) | (840 | ) | (1,243 | ) | (1,506 | ) | (904 | ) | ||||||||
Other assets and liabilities | (2,021 | ) | (1,037 | ) | (2,356 | ) | (3,241 | ) | (2,021 | ) | (1,037 | ) | ||||||||
| | | | | | | | | | | | | | | | | | | |||
Net cash provided by operating activities | 12,333 | 11,608 | 10,571 | 6,490 | 12,333 | 11,608 | ||||||||||||||
| | | | | | | | | | | | | | | | | | | |||
Cash flows from investing activities: | ||||||||||||||||||||
Investment in property, plant and equipment | (3,853 | ) | (3,199 | ) | (3,706 | ) | (3,603 | ) | (3,853 | ) | (3,199 | ) | ||||||||
Proceeds from sale of property, plant and equipment | 843 | 653 | 617 | 424 | 843 | 653 | ||||||||||||||
Purchases of available-for-sale securities and other investments | (1,086 | ) | (1,243 | ) | (972 | ) | (259 | ) | (1,086 | ) | (1,243 | ) | ||||||||
Maturities and sales of available-for-sale securities and other investments | 1,347 | 1,153 | 662 | 302 | 1,347 | 1,153 | ||||||||||||||
Payments made in connection with business acquisitions, net of cash acquired | (49 | ) | (167 | ) | (141 | ) | (2,644 | ) | (49 | ) | (167 | ) | ||||||||
Proceeds from business divestiture, net | 6 | — | 87 | |||||||||||||||||
Proceeds from business divestitures, net | 246 | 6 | — | |||||||||||||||||
| | | | | | | | | | | | | | | | | | | |||
Net cash used in investing activities | (2,792 | ) | (2,803 | ) | (3,453 | ) | (5,534 | ) | (2,792 | ) | (2,803 | ) | ||||||||
| | | | | | | | | | | | | | | | | | | |||
Cash flows from financing activities: | �� | |||||||||||||||||||
Short-term borrowings with original maturities less than 90 days, net | 148 | (154 | ) | (2,775 | ) | 74 | 148 | (154 | ) | |||||||||||
Issuance of debt | 2,875 | 279 | 5,154 | |||||||||||||||||
Proceeds from debt, net of issuance costs | 20,758 | 2,875 | 279 | |||||||||||||||||
Payment of debt | (6,037 | ) | (5,721 | ) | (4,333 | ) | (15,867 | ) | (6,037 | ) | (5,721 | ) | ||||||||
Settlement of cash flow hedges | (4 | ) | — | — | ||||||||||||||||
Issuance of common stock under employee stock plans | 297 | 288 | 716 | 371 | 297 | 288 | ||||||||||||||
Repurchase of common stock | (2,728 | ) | (1,532 | ) | (1,619 | ) | (2,883 | ) | (2,728 | ) | (1,532 | ) | ||||||||
Excess tax benefit from stock-based compensation | 58 | 2 | 12 | 145 | 58 | 2 | ||||||||||||||
Cash dividends paid | (1,184 | ) | (1,105 | ) | (1,015 | ) | (1,250 | ) | (1,184 | ) | (1,105 | ) | ||||||||
| | | | | | | | | | | | | | | | | | | |||
Net cash used in financing activities | (6,571 | ) | (7,943 | ) | (3,860 | ) | ||||||||||||||
Net cash provided by (used in) financing activities | 1,344 | (6,571 | ) | (7,943 | ) | |||||||||||||||
| | | | | | | | | | | | | | | | | | | |||
Increase in cash and cash equivalents | 2,970 | 862 | 3,258 | 2,300 | 2,970 | 862 | ||||||||||||||
Cash and cash equivalents at beginning of period | 12,163 | 11,301 | 8,043 | 15,133 | 12,163 | 11,301 | ||||||||||||||
| | | | | | | | | | | | | | | | | | | |||
Cash and cash equivalents at end of period | $ | 15,133 | $ | 12,163 | $ | 11,301 | $ | 17,433 | $ | 15,133 | $ | 12,163 | ||||||||
| | | | | | | | | | | | | | | | | | | | ||
| | | | | | | | | | | | ||||||||||
Supplemental cash flow disclosures: | ||||||||||||||||||||
Income taxes paid (net of refunds) | $ | 1,267 | $ | 1,391 | $ | 1,750 | ||||||||||||||
Income taxes paid, net of refunds | $ | 1,012 | $ | 1,267 | $ | 1,391 | ||||||||||||||
Interest expense paid | 678 | 837 | 856 | 532 | 678 | 837 | ||||||||||||||
Supplemental schedule of non-cash investing and financing activities: | ||||||||||||||||||||
Purchase of assets under capital leases | $ | 113 | $ | 3 | $ | 12 | $ | 70 | $ | 113 | $ | 3 | ||||||||
Stock awards assumed in business acquisitions | 31 | — | — | |||||||||||||||||
The accompanying notes are an integral part of these Consolidated Financial Statements.
HEWLETT-PACKARD COMPANYHP INC. AND SUBSIDIARIES
Consolidated Statements of Stockholders' Equity
| | Common Stock | | | | | | | Common Stock | | | | | | | ||||||||||||||||||||||||||||||||||||
|---|---|---|---|---|---|---|---|---|---|---|---|---|---|---|---|---|---|---|---|---|---|---|---|---|---|---|---|---|---|---|---|---|---|---|---|---|---|---|---|---|---|---|---|---|---|---|---|---|---|---|
| | | | Accumulated Other Comprehensive (Loss) Income | | | | | | Accumulated Other Comprehensive (Loss) Income | | | | ||||||||||||||||||||||||||||||||||||||
| | Number of Shares | Par Value | Additional Paid-in Capital | Retained Earnings | Total HP Stockholders' Equity | Non- controlling Interests | Total | Number of Shares | Par Value | Additional Paid-in Capital | Retained Earnings | Total HP Stockholders' Equity | Non- controlling Interests | Total | ||||||||||||||||||||||||||||||||||||
| | In millions, except number of shares in thousands | In millions, except number of shares in thousands | ||||||||||||||||||||||||||||||||||||||||||||||||
Balance October 31, 2011 | 1,990,506 | $ | 20 | $ | 6,837 | $ | 35,266 | $ | (3,498 | ) | $ | 38,625 | $ | 379 | $ | 39,004 | ||||||||||||||||||||||||||||||||||
Net loss | (12,650 | ) | (12,650 | ) | (12,650 | ) | ||||||||||||||||||||||||||||||||||||||||||||
Other comprehensive loss | (2,061 | ) | (2,061 | ) | (2,061 | ) | ||||||||||||||||||||||||||||||||||||||||||||
Balance October 31, 2012 | 1,962,838 | $ | 20 | $ | 6,454 | $ | 21,521 | $ | (5,559 | ) | $ | 22,436 | $ | 397 | $ | 22,833 | ||||||||||||||||||||||||||||||||||
Net earnings | 5,113 | 5,113 | 5,113 | |||||||||||||||||||||||||||||||||||||||||||||||
Other comprehensive income, net of taxes | 1,781 | 1,781 | 1,781 | |||||||||||||||||||||||||||||||||||||||||||||||
| | | | | | | | | | | | | | | | | | | | | | | | | | | | | | | | | | | | | | ||||||||||||||
Comprehensive loss | (14,711 | ) | (14,711 | ) | ||||||||||||||||||||||||||||||||||||||||||||||
Comprehensive income | 6,894 | 6,894 | ||||||||||||||||||||||||||||||||||||||||||||||||
| | | | | | | | | | | | | | | | | | | | | | | | | | | | | | | | | | | | | | ||||||||||||||
Issuance of common stock in connection with employee stock plans and other | 39,068 | 682 | 1 | 683 | 683 | 22,950 | 210 | (2 | ) | 208 | 208 | |||||||||||||||||||||||||||||||||||||||
Repurchases of common stock | (66,736 | ) | (1,525 | ) | (101 | ) | (1,626 | ) | (1,626 | ) | (77,905 | ) | (1 | ) | (1,550 | ) | 5 | (1,546 | ) | (1,546 | ) | |||||||||||||||||||||||||||||
Tax deficiency from employee stock plans | (175 | ) | (175 | ) | (175 | ) | (149 | ) | (149 | ) | (149 | ) | ||||||||||||||||||||||||||||||||||||||
Cash dividends declared | (995 | ) | (995 | ) | (995 | ) | (1,074 | ) | (1,074 | ) | (1,074 | ) | ||||||||||||||||||||||||||||||||||||||
Stock-based compensation expense | 635 | 635 | 635 | 500 | 500 | 500 | ||||||||||||||||||||||||||||||||||||||||||||
Changes in non-controlling interest | 18 | 18 | (10 | ) | (10 | ) | ||||||||||||||||||||||||||||||||||||||||||||
| | | | | | | | | | | | | | | | | | | | | | | | | | | | | | | | | | | | | | | | | | | | ||||||||
Balance October 31, 2012 | 1,962,838 | $ | 20 | $ | 6,454 | $ | 21,521 | $ | (5,559 | ) | $ | 22,436 | $ | 397 | $ | 22,833 | ||||||||||||||||||||||||||||||||||
Balance October 31, 2013 | 1,907,883 | $ | 19 | $ | 5,465 | $ | 25,563 | $ | (3,778 | ) | $ | 27,269 | $ | 387 | $ | 27,656 | ||||||||||||||||||||||||||||||||||
Net earnings | 5,113 | 5,113 | 5,113 | 5,013 | 5,013 | 5,013 | ||||||||||||||||||||||||||||||||||||||||||||
Other comprehensive income | 1,781 | 1,781 | 1,781 | |||||||||||||||||||||||||||||||||||||||||||||||
Other comprehensive loss, net of taxes | (2,103 | ) | (2,103 | ) | (2,103 | ) | ||||||||||||||||||||||||||||||||||||||||||||
| | | | | | | | | | | | | | | | | | | | | | | | | | | | | | | | | | | | | | ||||||||||||||
Comprehensive income | 6,894 | 6,894 | 2,910 | 2,910 | ||||||||||||||||||||||||||||||||||||||||||||||
| | | | | | | | | | | | | | | | | | | | | | | | | | | | | | | | | | | | | | ||||||||||||||
Issuance of common stock in connection with employee stock plans and other | 22,950 | 210 | (2 | ) | 208 | 208 | 23,785 | 142 | 1 | 143 | 143 | |||||||||||||||||||||||||||||||||||||||
Repurchases of common stock | (77,905 | ) | (1 | ) | (1,550 | ) | 5 | (1,546 | ) | (1,546 | ) | (92,380 | ) | (1 | ) | (2,694 | ) | (262 | ) | (2,957 | ) | (2,957 | ) | |||||||||||||||||||||||||||
Tax deficiency from employee stock plans | (149 | ) | (149 | ) | (149 | ) | (43 | ) | (43 | ) | (43 | ) | ||||||||||||||||||||||||||||||||||||||
Cash dividends declared | (1,074 | ) | (1,074 | ) | (1,074 | ) | (1,151 | ) | (1,151 | ) | (1,151 | ) | ||||||||||||||||||||||||||||||||||||||
Stock-based compensation expense | 500 | 500 | 500 | 560 | 560 | 560 | ||||||||||||||||||||||||||||||||||||||||||||
Changes in non-controlling interest | (10 | ) | (10 | ) | 9 | 9 | ||||||||||||||||||||||||||||||||||||||||||||
| | | | | | | | | | | | | | | | | | | | | | | | | | | | | | | | | | | | | | | | | | | | ||||||||
Balance October 31, 2013 | 1,907,883 | $ | 19 | $ | 5,465 | $ | 25,563 | $ | (3,778 | ) | $ | 27,269 | $ | 387 | $ | 27,656 | ||||||||||||||||||||||||||||||||||
Balance October 31, 2014 | 1,839,288 | $ | 18 | $ | 3,430 | $ | 29,164 | $ | (5,881 | ) | $ | 26,731 | $ | 396 | $ | 27,127 | ||||||||||||||||||||||||||||||||||
Net earnings | 5,013 | 5,013 | 5,013 | 4,554 | 4,554 | 4,554 | ||||||||||||||||||||||||||||||||||||||||||||
Other comprehensive income | (2,103 | ) | (2,103 | ) | (2,103 | ) | ||||||||||||||||||||||||||||||||||||||||||||
Other comprehensive loss, net of taxes | (421 | ) | (421 | ) | (421 | ) | ||||||||||||||||||||||||||||||||||||||||||||
| | | | | | | | | | | | | | | | | | | | | | | | | | | | | | | | | | | | | | ||||||||||||||
Comprehensive income | 2,910 | 2,910 | 4,133 | 4,133 | ||||||||||||||||||||||||||||||||||||||||||||||
| | | | | | | | | | | | | | | | | | | | | | | | | | | | | | | | | | | | | | ||||||||||||||
Issuance of common stock in connection with employee stock plans and other | 23,785 | 142 | 1 | 143 | 143 | 39,834 | (34 | ) | 1 | (33 | ) | (33 | ) | |||||||||||||||||||||||||||||||||||||
Repurchases of common stock | (92,380 | ) | (1 | ) | (2,694 | ) | (262 | ) | (2,957 | ) | (2,957 | ) | (75,403 | ) | (2,237 | ) | (411 | ) | (2,648 | ) | (2,648 | ) | ||||||||||||||||||||||||||||
Tax deficiency from employee stock plans | (43 | ) | (43 | ) | (43 | ) | ||||||||||||||||||||||||||||||||||||||||||||
Assumption of equity awards in connection with acquisitions | 31 | 31 | 31 | |||||||||||||||||||||||||||||||||||||||||||||||
Tax benefit from employee stock plans | 64 | 64 | 64 | |||||||||||||||||||||||||||||||||||||||||||||||
Cash dividends declared | (1,151 | ) | (1,151 | ) | (1,151 | ) | (1,219 | ) | (1,219 | ) | (1,219 | ) | ||||||||||||||||||||||||||||||||||||||
Stock-based compensation expense | 560 | 560 | 560 | 709 | 709 | 709 | ||||||||||||||||||||||||||||||||||||||||||||
Changes in non-controlling interest | 9 | 9 | (13 | ) | (13 | ) | ||||||||||||||||||||||||||||||||||||||||||||
| | | | | | | | | | | | | | | | | | | | | | | | | | | | | | | | | | | | | | | | | | | | ||||||||
Balance October 31, 2014 | 1,839,288 | $ | 18 | $ | 3,430 | $ | 29,164 | $ | (5,881 | ) | $ | 26,731 | $ | 396 | $ | 27,127 | ||||||||||||||||||||||||||||||||||
Balance October 31, 2015 | 1,803,719 | $ | 18 | $ | 1,963 | $ | 32,089 | $ | (6,302 | ) | $ | 27,768 | $ | 383 | $ | 28,151 | ||||||||||||||||||||||||||||||||||
| | | | | | | | | | | | | | | | | | | | | | | | | | | | | | | | | | | | | | | | | | | | | |||||||
| | | | | | | | | | | | | | | | | | | | | | | | | | | |||||||||||||||||||||||||
The accompanying notes are an integral part of these Consolidated Financial Statements.
HEWLETT-PACKARD COMPANYHP INC. AND SUBSIDIARIES
Notes to Consolidated Financial Statements
Note 1: Overview and Summary of Significant Accounting Policies
Overview
On November 1, 2015 (the "Distribution Date"), Hewlett-Packard Company completed the separation of Hewlett Packard Enterprise Company ("Hewlett Packard Enterprise"), Hewlett-Packard Company's former enterprise technology infrastructure, software, services and financing businesses (the "Separation"). In connection with the Separation, Hewlett-Packard Company changed its name to HP Inc. ("HP").
On November 1, 2015, each of HP stockholders of record as of the close of business on October 21, 2015 (the "Record Date") received one share of Hewlett Packard Enterprise common stock for every one share of HP's common stock held as of the Record Date. Hewlett Packard Enterprise is now an independent public company trading on the New York Stock Exchange ("NYSE") under the symbol "HPE". After the Separation, HP does not beneficially own any shares of Hewlett Packard Enterprise common stock and beginning November 1, 2015, HP no longer consolidates Hewlett Packard Enterprise within its financial results or reflect the financial results of Hewlett Packard Enterprise within its continuing results of operations.
In connection with the Separation, HP and Hewlett Packard Enterprise have entered into a separation and distribution agreement as well as various other agreements that provide a framework for the relationships between the parties going forward, including among others a tax matters agreement, an employee matters agreement, a transition service agreement, a real estate matters agreement, a master commercial agreement and an information technology service agreement. These agreements provide for the allocation between HP and Hewlett Packard Enterprise of assets, employees, liabilities and obligations (including its investments, property and employee benefits and tax-related assets and liabilities) attributable to periods prior to, at and after the Separation and govern certain relationship between HP and Hewlett Packard Enterprise after the Separation. For more information on the impacts of these agreements, see Note 3 "Restructuring", Note 4 "Retirement and Post-Retirement Benefit Plans", Note 5 "Stock-Based Compensation", Note 6 "Taxes on Earnings", Note 13 "Borrowings", Note 16 "Litigation and Contingencies" and Note 17 "Guarantees, Indemnifications and Warranties".
Basis of Presentation
The accompanying consolidated financial statements of HP and its wholly-owned subsidiaries are prepared in conformity with United States ("U.S.") generally accepted accounting principles ("GAAP"). HP has eliminated all intercompany accounts and transactions. The historical results of operations, financial position, and cash flows of Hewlett Packard Enterprise are included in the consolidated financial statements of HP for each of the fiscal years included in this report and will be reported as discontinued operations beginning in the first quarter of fiscal 2016.
Principles of Consolidation
The Consolidated Financial Statements include the accounts of Hewlett-Packard Company ("HP")HP and theits subsidiaries and affiliates in which HP has a controlling financial interest or is the primary beneficiary. HP accounts for investments in companies over which HP has the ability to exercise significant influence but does not hold a controlling interest under the equity method, and HP records its proportionate share of income or losses in Interest and other, net in the Consolidated Statements of Earnings. HP presents non-controlling interests as a separate component within Total stockholder's equity in the Consolidated
HP INC. AND SUBSIDIARIES
Notes to Consolidated Financial Statements (Continued)
Note 1: Overview and Summary of Significant Accounting Policies (Continued)
Balance Sheets. Net earnings attributable to the non-controlling interests are eliminated within Interest and other, net in the Consolidated Statements of Earnings and are not presented separately as they were not material for any period presented. HP has eliminated all intercompany accounts and transactions.
Reclassifications
HP has made certain segment and business unit realignments in order to optimize its operating structure. Reclassifications of certain prior-year segment and business unit financial information have been made to conform to the current-year presentation. None of the changes impacts HP's previously reported consolidated net revenue, earnings from operations, net earnings or net earnings per share ("EPS"). See Note 2 for a further discussion of HP's segment reorganization.
Use of Estimates
The preparation of financial statements in accordance with United States ("U.S.") generally accepted accounting principles ("GAAP") GAAP requires management to make estimates and assumptions that affect the amounts reported in HP's Consolidated Financial Statements and accompanying notes. Actual results could differ materially from those estimates.
Foreign Currency Translation
HP predominately uses the U.S. dollar as its functional currency. Assets and liabilities denominated in non-U.S. dollars are remeasured into U.S. dollars at current exchange rates for monetary assets and liabilities and at historical exchange rates for nonmonetary assets and liabilities. Net revenue, costs and expenses denominated in non-U.S. dollars are recorded in U.S. dollars at monthly average exchange rates prevailing during the period. HP includes gains or losses from foreign currency remeasurement in Interest and other, net in the Consolidated Statements of Earnings. Certain non-U.S. subsidiaries designate the local currency as their functional currency, and HP records the translation of their assets and liabilities into U.S. dollars at the balance sheet date as translation adjustments and includes them as a component of Accumulated other comprehensive loss in the Consolidated Balance Sheets.
Accounting Pronouncements
In May 2014,November 2015, the Financial Accounting Standards Board ("FASB") issued an accounting standards update for income taxes, which requires deferred tax assets and liabilities to be classified as noncurrent in a classified statement of financial position. The new accounting guidance is effective for annual reporting periods beginning after December 15, 2016 and interim periods therein. Early adoption is permitted for all entities as of the beginning of interim or annual reporting periods. HP is currently assessing the impact of this adoption on its Consolidated Financial Statements, and plans to adopt for its interim and annual reporting period beginning November 1, 2015.
In April 2015, the FASB amended the existing accounting standards for intangible assets. The amendments provide explicit guidance to customers in determining the accounting for fees paid in a cloud computing arrangement, wherein the arrangements that do not convey a software license to the customer are accounted for as service contracts. HP is required to adopt the guidance in the first quarter of fiscal 2017; however early adoption is permitted as is retrospective application. HP is currently evaluating the impact of these amendments on its Consolidated Financial Statements.
HP INC. AND SUBSIDIARIES
Notes to Consolidated Financial Statements (Continued)
Note 1: Overview and Summary of Significant Accounting Policies (Continued)
In April 2015, the FASB amended the existing accounting standards for imputation of interest. The amendments require that debt issuance costs related to a recognized debt liability be presented on the balance sheet as a direct deduction from the carrying amount of that debt liability, consistent with debt discounts. The recognition and measurement guidance for debt issuance costs are not affected by these amendments. HP is required to adopt the guidance in the first quarter of fiscal 2017. Early adoption is permitted. The amendments should be applied retrospectively with the adjusted balance sheet of each individual period presented, in order to reflect the period-specific effects of applying the new guidance. HP is currently evaluating the timing and the impact of these amendments on its Consolidated Financial Statements.
In May 2014, the FASB amended the existing accounting standards for revenue recognition. The amendments are based on the principle that revenue should be recognized to depict the transfer of promised goods or services to customers in an amount that reflects the consideration to which the entity expects to be entitled in exchange for those goods or services. In August 2015, the FASB issued an accounting standard update for a one-year deferral of the effective date, with an option of applying the standard on the original effective date, which for HP is the first quarter of fiscal 2018. In accordance with this deferral, HP is required to adopt thethese amendments in the first quarter of fiscal 2018. Early adoption is
HEWLETT-PACKARD COMPANY AND SUBSIDIARIES
Notes to Consolidated Financial Statements (Continued)
Note 1: Summary of Significant Accounting Policies (Continued)
not permitted.2019. The amendments may be applied retrospectively to each prior period presented or retrospectively with the cumulative effect recognized as of the date of initial application. HP is currently evaluatingcontinuing to evaluate the impact of these amendments and the transition alternatives on its Consolidated Financial Statements.
In April 2014, the FASB issued guidance which changes the criteria for identifying a discontinued operation. The guidance limits the definition of a discontinued operation to the disposal of a component or group of components that is disposed of or is classified as held for sale and represents a strategic shift that has, or will have, a major effect on an entity's operations and financial results. HP is required to adopt the guidance in the first quarter of fiscal 2016, with early adoption permitted for transactions that have not been reported in financial statements previously issued.
In July 2013, the FASB issued a new accounting standard requiring the presentation of certain unrecognized tax benefits as reductions to deferred tax assets rather than as liabilities in the Consolidated Balance Sheets when a net operating loss carryforward, a similar tax loss or a tax credit carryforward exists. HP is required to adopt this new standard on a prospective basis in the first quarter of fiscal 2015; however, early adoption is permitted as is retrospective application. HP will adopt the new standard in the first fiscal quarter of 2015 on a prospective basis. Adoption of the new standard is not expected to have a material effect on HP's Consolidated Financial Statements.2016.
Revenue Recognition
General
HP recognizes revenue when persuasive evidence of an arrangement exists, delivery has occurred or services are rendered, the sales price or fee is fixed or determinable, and collectibilitycollectability is reasonably assured. Additionally, HP recognizes hardware revenue on sales to channel partners, including resellers, distributors or value-added solution providers at the time of delivery when the channel partners have economic substance apart from HP, and HP has completed its obligations related to the sale. HP generally recognizes revenue for its standalone software sales to channel partners on receipt of evidence that the software has been sold to a specific end user. HP limits the amount of revenue recognized for delivered elements to the amount that is not contingent on the future delivery of products or services, future performance obligations or subject to customer-specified refund or return rights.
HP reduces revenue for customer and distributor programs and incentive offerings, including price protection, rebates, promotions, other volume-based incentives and expected returns.returns, at the later of the date of revenue recognition or the date the sales incentive is offered. Future market conditions and product transitions may require HP to take actions to increase customer incentive offerings, possibly resulting in an incremental reduction of revenue at the time the incentive is offered. For certain
HP INC. AND SUBSIDIARIES
Notes to Consolidated Financial Statements (Continued)
Note 1: Overview and Summary of Significant Accounting Policies (Continued)
incentive programs, HP estimates the number of customers expected to redeem the incentive based on historical experience and the specific terms and conditions of the incentive.
In instances when revenue is derived from sales of third-party vendor products or services, HP records revenue on a gross basis when HP is a principal to the transaction and on a net basis when HP is acting as an agent between the customer and the vendor. HP considers several factors to determine whether it is acting as a principal or an agent, most notably whether HP is the primary obligor to the customer, has established its own pricing and has inventory and credit risks.
HEWLETT-PACKARD COMPANY AND SUBSIDIARIES
Notes to Consolidated Financial Statements (Continued)
Note 1: Summary of Significant Accounting Policies (Continued)
HP reports revenue net of any taxes collected from customers and remitted to government authorities, with the collected taxes recorded as current liabilities until remitted to the relevant government authority.
Multiple element arrangements
When a sales arrangement contains multiple elements or deliverables, such as hardware and software products, and/or services, HP allocates revenue to each element based on a selling price hierarchy. The selling price for a deliverable is based on its vendor specific objective evidence ("VSOE") of selling price, if available, third partythird-party evidence ("TPE") if VSOE of selling price is not available, or estimated selling price ("ESP") if neither VSOE of selling price nor TPE is available. HP establishes VSOE of selling price using the price charged for a deliverable when sold separately and, in rare instances, using the price established by management having the relevant authority. HP establishes TPE of selling price by evaluating largely similar and interchangeable competitor products or services in standalone sales to similarly situated customers. HP establishes ESP based on management judgment considering internal factors such as margin objectives, pricing practices and controls, customer segment pricing strategies and the product life cycle. Consideration is also given to market conditions such as competitor pricing strategies and technology industry life cycles. In most arrangements with multiple elements, HP allocates the transaction price to the individual units of accounting at inception of the arrangement based on their relative selling price.
In multiple element arrangements that include software that is more-than-incidental, HP allocates the transaction price to the individual units of accounting for the non-software deliverables and to the software deliverables as a group using the relative selling price of each of the deliverables in the arrangement based on the selling price hierarchy. If the arrangement contains more than one software deliverable, the transaction price allocated to the group of software deliverables is then allocated to each component software deliverable.
HP evaluates each deliverable in an arrangement to determine whether it represents a separate unit of accounting. A deliverable constitutes a separate unit of accounting when it has standalone value to the customer. For elements with no standalone value, HP recognizes revenue consistent with the pattern of the associated deliverables.undelivered elements. If the arrangement includes a customer-negotiated refund or return right or other contingency relative to the delivered items, and the delivery and performance of the undelivered items is considered probable and substantially within HP's control, the delivered element constitutes a separate unit of accounting. In arrangements with combined units of accounting, changes in the allocation of the transaction price betweenamong elements may impact the timing of revenue recognition for the contract but will not change the total revenue recognized for the contract.
HP INC. AND SUBSIDIARIES
Notes to Consolidated Financial Statements (Continued)
Note 1: Overview and Summary of Significant Accounting Policies (Continued)
Product revenue
Hardware
Under HP's standard terms and conditions of sale, HP transfers title and risk of loss to the customer at the time product is delivered to the customer and recognizes revenue accordingly, unless customer acceptance is uncertain or significant obligations to the customer remain. HP reduces revenue for estimated customer returns, price protection, rebates and other programs offered under sales agreements established by HP with its distributors and resellers. HP records revenue from the sale of equipment under sales-type leases as product revenue at the inception of the lease. HP accrues the
HEWLETT-PACKARD COMPANY AND SUBSIDIARIES
Notes to Consolidated Financial Statements (Continued)
Note 1: Summary of Significant Accounting Policies (Continued)
estimated cost of post-sale obligations, including standard product warranties, based on historical experience at the time HP recognizes revenue.
Software
HP recognizes revenue from perpetual software licenses at the inception of the license term, assuming all revenue recognition criteria have been satisfied. Term-based software license revenue is generally recognized ratably over the term of the license. HP uses the residual method to allocate revenue to software licenses at inception of the arrangement when VSOE of fair value for all undelivered elements, such as post-contract customer support, exists and all other revenue recognition criteria have been satisfied. HP recognizes revenue from maintenance and unspecified upgrades or updates provided on a when-and-if-availablewhen-and- if-available basis ratably over the period during which such items are delivered.
HP recognizes revenue for hosting or software-as-a-service ("SaaS") arrangements as the service is delivered, generally on a straight-line basis, over the contractual period of performance. In hosting arrangements, HP considers the rights provided to the customer (e.g. whether the customer has the contractual right to take possession of the software at any time during the hosting period without significant penalty and the feasibility of the customer to operate or contract with another vendor to operate the software) in determining whether the arrangement includes the sale of a software license. In hosting arrangements where software licenses are sold, HP recognizes the license revenue is generally recognized according to whether perpetual or term licenses are sold, when all other revenue recognition criteria are satisfied. In hosting arrangements that include software licenses, HP considers the rights provided to the customer (e.g., ownership of a license, contract termination provisions and the feasibility of the customer to operate the software) in determining when to recognize revenue for the licenses.
Services revenue
HP recognizes revenue from fixed-price support or maintenance contracts, including extended warranty contracts and software post-contract customer support agreements, ratably over the contract period and recognizes the costs associated with these contracts as incurred. For time and material contracts, HP recognizes revenue as services are rendered and recognizes costs as they are incurred.
HP recognizes revenue from certain fixed-price contracts, such as consulting arrangements, as work progresses over the contract period on a proportional performance basis, as determined by the percentage of labor costs incurred to date compared to the total estimated contract labor costs of a contract. HP recognizes revenue on fixed-price contracts for design and build projects (to design, develop and construct software and systems) using the percentage-of-completion method. HP uses the cost-to-cost method to measure progress toward completion as determined by the percentage of cost incurred to date compared to the total estimated costs of the project. Estimates of total project costs for fixed-price
HP INC. AND SUBSIDIARIES
Notes to Consolidated Financial Statements (Continued)
Note 1: Overview and Summary of Significant Accounting Policies (Continued)
contracts are regularly revised during the life of a contract. Provisions for estimated losses on fixed-priced contracts are recognized in the period when such losses become known. If reasonable and reliable cost estimates for a project cannot be made, HP uses the completed contract method and recognizes revenue and costs upon service completion.
HP generally recognizes outsourcing services revenue in the period when the service is provided and the amount earned is not contingent on the occurrence of any future event. HP recognizes revenue using an objective measure of output for unit-priced contracts. Revenue for fixed-price outsourcing contracts with periodic billings is recognized on a straight-line basis if the service is provided evenly during the contract term. Provisions for estimated losses on outsourcing arrangements are recognized in the period when such losses become probable and estimable.
HEWLETT-PACKARD COMPANY AND SUBSIDIARIES
Notes to Consolidated Financial Statements (Continued)
Note 1: Summary of Significant Accounting Policies (Continued)
HP recognizes revenue from operating leases on a straight-line basis as service revenue over the rental period.
Financing income
Sales-type and direct-financing leases produce financing income, which HP recognizes at consistent rates of return over the lease term.
Deferred revenue and deferred costs
HP records amounts invoiced to customers in excess of revenue recognized as deferred revenue until the revenue recognition criteria are satisfied. HP records revenue that is earned and recognized in excess of amounts invoiced on services contracts as trade receivables.
Deferred revenue represents amounts invoiced in advance for product support contracts, software customer support contracts, outsourcing startup services work, consulting and integration projects, product sales or leasing income.
HP recognizes costs associated with outsourcing contracts as incurred, unless such costs are considered direct and incremental to the startup phase of the contract, in which case HP defers these costs during the startup phase and subsequently amortizes such costs over the period that outsourcing services are provided, once those services commence. HP amortizes deferred contract costs on a straight-line basis over the remaining term of the contract unless facts and circumstances of the contract indicate a shorter period is more appropriate. Based on actual and projected contract financial performance indicators, HP analyzes the recoverability of deferred contract costs using the undiscounted estimated cash flows of the contract over its remaining term. If such undiscounted cash flows are insufficient to recover the carrying amount of deferred contract costs and long-lived assets directly associated with the contract, the deferred contract costs are first impaired. If a cash flow deficiency remains after reducing the carrying amount of the deferred contract costs to zero, HP evaluates any remaining long-lived assets related to that contract for impairment.
Shipping and Handling
HP includes costs related to shipping and handling in costCost of sales.products.
HP INC. AND SUBSIDIARIES
Notes to Consolidated Financial Statements (Continued)
Note 1: Overview and Summary of Significant Accounting Policies (Continued)
Stock-Based Compensation
HP determines stock-based compensation expense based on the measurement date fair value of the award. HP recognizes compensation cost only for those awards expected to meet the service and performance vesting conditions on a straight-line basis over the requisite service period of the award. HP determines compensation costs at the aggregate grant level for service-based awards and at the individual vesting tranche level for awards with performance and/or market conditions. HP estimates the forfeiture rate based on its historical experience.
Retirement and Post-Retirement Plans
HP has various defined benefit, other contributory and noncontributory retirement and post-retirement plans. HP generally amortizes unrecognized actuarial gains and losses on a straight-line basis over the average remaining estimated service life of participants. In some cases, HP amortizes actuarial
HEWLETT-PACKARD COMPANY AND SUBSIDIARIES
Notes to Consolidated Financial Statements (Continued)
Note 1: Summary of Significant Accounting Policies (Continued)
gains and losses using the corridor approach. See Note 4 for a full description of these plans and the accounting and funding policies.
Advertising
Costs to produce advertising are expensed as incurred during production. Costs to communicate advertising are expensed when the advertising is first run. Such costs totaled approximately $784$859 million in fiscal 2015, $834 million in fiscal 2014 $878and $867 million in fiscal 2013 and $1.0 billion in fiscal 2012.2013.
Restructuring
HP records charges associated with management-approved restructuring plans to reorganize one or more of HP's business segments, to remove duplicative headcount and infrastructure associated with business acquisitions or to simplify business processes and accelerate innovation. Restructuring charges can include severance costs to eliminate a specified number of employees, infrastructure charges to vacate facilities and consolidate operations, and contract cancellation costs. HP records restructuring charges based on estimated employee terminations and site closure and consolidation plans. HP accrues for severance and other employee separation costs under these actions when it is probable that benefits will be paid and the amount is reasonably estimable. The rates used in determingdetermining severance accruals are based on existing plans, historical experiences and negotiated settlements.
Taxes on Earnings
HP recognizes deferred tax assets and liabilities for the expected tax consequences of temporary differences between the tax bases of assets and liabilities and their reported amounts using enacted tax rates in effect for the year the differences are expected to reverse. HP records a valuation allowance to reduce the deferred tax assets to the amount that is more likely than not to be realized.
HP records accruals for uncertain tax positions when HP believes that it is not more likely than not that the tax position will be sustained on examination by the taxing authorities based on the technical merits of the position. HP makes adjustments to these accruals when facts and circumstances change, such as the closing of a tax audit or the refinement of an estimate. The provision for income taxes includes the effects of adjustments for uncertain tax positions, as well as any related interest and penalties.
HP INC. AND SUBSIDIARIES
Notes to Consolidated Financial Statements (Continued)
Note 1: Overview and Summary of Significant Accounting Policies (Continued)
Accounts Receivable
HP establishes an allowance for doubtful accounts for accounts receivable. HP records a specific reserve for individual accounts when HP becomes aware of specific customer circumstances, such as in the case of a bankruptcy filing or deterioration in the customer's operating results or financial position. If there are additional changes in circumstances related to the specific customer, HP further adjusts estimates of the recoverability of receivables. HP maintains bad debt reserves for all other customers based on a variety of factors, including the use of third-party credit risk models that generate quantitative measures of default probabilities based on market factors, the financial condition of customers, the length of time receivables are past due, trends in the weighted-average risk rating for the portfolio, macroeconomic conditions, information derived from competitive benchmarking, significant one-time events and historical experience. The past due or delinquency status of a receivable is based on the contractual payment terms of the receivable.
HEWLETT-PACKARD COMPANY AND SUBSIDIARIES
Notes to Consolidated Financial Statements (Continued)
Note 1: Summary of Significant Accounting Policies (Continued)
HP has third-party revolving short-term financing arrangements intended to facilitate the working capital requirements of certain customers. These financing arrangements, which in certain cases provide for partial recourse, result in the transfer of HP's trade receivables to a third party. HP reflects amounts transferred to, but not yet collected from, the third party in accounts receivable in the Consolidated Balance Sheets. For arrangements involving an element of recourse, the fair value of the recourse obligation is measured using market data from similar transactions and reported as a current liability in the Consolidated Balance Sheets.
Concentrations of Risk
Financial instruments that potentially subject HP to significant concentrations of credit risk consist principally of cash and cash equivalents, investments, receivables from trade customers and contract manufacturers, financing receivables and derivatives.
HP maintains cash and cash equivalents, investments, derivatives and certain other financial instruments with various financial institutions. These financial institutions are located in many different geographic regions, and HP's policy is designed to limit exposure from any particular institution. As part of its risk management processes, HP performs periodic evaluations of the relative credit standing of these financial institutions. HP has not sustained material credit losses from instruments held at these financial institutions. HP utilizes derivative contracts to protect against the effects of foreign currency and interest rate exposures. Such contracts involve the risk of non-performance by the counterparty, which could result in a material loss.
HP sells a significant portion of its products through third-party distributors and resellers and, as a result, maintains individually significant receivable balances with these parties. If the financial condition or operations of these distributors' and resellers' aggregated business deteriorates substantially, HP's operating results could be adversely affected. The ten largest distributor and reseller receivable balances, which were concentrated primarily in North America and Europe, collectively represented approximately18% and 20% and 21% of gross accounts receivable atas of October 31, 20142015 and 2013,2014, respectively. No single customer accounts for more than 10% of gross accounts receivable. Credit risk with respect to other accounts receivable and financing receivables is generally diversified due to the large number of entities comprising HP's customer base and their dispersion across many different industries and geographic regions. HP performs ongoing credit evaluations of the financial condition of its third-party distributors,
HP INC. AND SUBSIDIARIES
Notes to Consolidated Financial Statements (Continued)
Note 1: Overview and Summary of Significant Accounting Policies (Continued)
resellers and other customers and may require collateral, such as letters of credit and bank guarantees, in certain circumstances.
HP utilizes outsourced contract manufacturers around the world to manufacture HP-designed products. HP may purchase product components from suppliers and sell those components to its outsourcedcontract manufacturers thereby creating receivable balances from the outsourcedcontract manufacturers. The three largest outsourcedcontract manufacturer receivable balances collectively represented 90%60% and 82%65% of HP's supplier receivables from contract manufacturers of $1.0 billion and $1.0 billion atas of October 31, 20142015 and 2013,2014, respectively. HP includes the supplier receivables from contract manufacturers in Other current assets in the Consolidated Balance Sheets on a gross basis. HP's credit risk associated with these receivables is mitigated wholly or in part, by the amount HP owes to these outsourced contract manufacturers, as HP generally has the legal right to offset its payables to the outsourcedcontract manufacturers against these receivables. HP does not reflect the sale of these components in revenue and does not recognize any profit on these component sales until the related products are sold by HP, at which time any profit is recognized as a reduction to cost of sales.
HEWLETT-PACKARD COMPANY AND SUBSIDIARIES
Notes to Consolidated Financial Statements (Continued)
Note 1: Summary of Significant Accounting Policies (Continued)
HP obtains a significant number of components from single source suppliers due to technology, availability, price, quality or other considerations. The loss of a single source supplier, the deterioration of HP's relationship with a single source supplier, or any unilateral modification to the contractual terms under which HP is supplied components by a single source supplier could adversely affect HP's revenue and gross margins.
Inventory
HP values inventory at the lower of cost or market. Cost is computed using standard cost which approximates actual cost on a first-in, first-out basis. Adjustments to reduce the cost of inventory to its net realizable value are made, if required, for estimated excess obsolete or impaired balances.obsolescence.
Property, Plant and Equipment
HP states property, plant and equipment at cost less accumulated depreciation. HP capitalizes additions and improvements and expenses maintenance and repairs as incurred. Depreciation expense is recognized on a straight-line basis over the estimated useful lives of the assets. Estimated useful lives are five to 40 years for buildings and improvements and three to 15 years for machinery and equipment. HP depreciates leasehold improvements over the life of the lease or the asset, whichever is shorter. HP depreciates equipment held for lease over the initial term of the lease to the equipment's estimated residual value. The estimated useful lives of assets used solely to support a customer services contract generally do not exceed the term of the customer contract. On retirement or disposition, the asset cost and related accumulated depreciation are removed from the Consolidated Balance Sheets with any gain or loss recognized in the Consolidated Statements of Earnings.
HP capitalizes certain internal and external costs incurred to acquire or create internal use software, principally related to software coding, designing system interfaces and installation and testing of the software. HP amortizes capitalized internal use software costs using the straight-line method over the estimated useful lives of the software, generally from three to five years.
Software Development Costs
HP capitalizes costs incurred to acquire or develop software for resale subsequent to establishing technological feasibility for the software, if significant. HP amortizes capitalized software development costs using the greater of the straight-line amortization method or the ratio that current gross revenues for a product bear to the total current and anticipated future gross revenues for that product. The estimated useful life for capitalized software for resale is generally three years or less. Software development costs incurred subsequent to establishing technological feasibility are generally not significant.
HEWLETT-PACKARD COMPANYHP INC. AND SUBSIDIARIES
Notes to Consolidated Financial Statements (Continued)
Note 1: Overview and Summary of Significant Accounting Policies (Continued)
Business Combinations
HP includes the results of operations of acquired businesses in HP's consolidated results prospectively from the date of acquisition. HP allocates the fair value of purchase consideration to the assets acquired, including in-process research and development ("IPR&D"), liabilities assumed, and non-controlling interests in the acquired entity generally based on their fair values at the acquisition date. IPR&D is initially capitalized at fair value as an intangible asset with an indefinite life and assessed for impairment thereafter. When the IPR&D project is complete, it is reclassified as an amortizable purchased intangible asset and is amortized over its estimated useful life. If an IPR&D project is abandoned, HP will record a charge for the value of the related intangible asset to HP's Consolidated Statement of Earnings in the period it is abandoned. The excess of the fair value of purchase consideration over the fair value of these assets acquired, liabilities assumed and non-controlling interests in the acquired entity is recorded as goodwill. The primary items that generate goodwill include the value of the synergies between the acquired company and HP and the value of the acquired assembled workforce, neither of which qualifies for recognition as an intangible asset. Acquisition-related expenses and post-acquisition restructuring costs are recognized separately from the business combination and are expensed as incurred.
Goodwill
HP reviews goodwill for impairment annually and whenever events or changes in circumstances indicate the carrying amount of goodwill may not be recoverable. While HP is permitted to conduct a qualitative assessment to determine whether it is necessary to perform a two-step quantitative goodwill impairment test, for its annual goodwill impairment test in the fourth quarter of fiscal 2014,2015, HP performed a quantitative test for all of its reporting units.
Goodwill is tested for impairment at the reporting unit level. At the beginning of its first quarter of fiscal 2014, HP made a change to its reporting units. In connection with continued operational synergies and interdependencies between the Enterprise Servers, Storage and Networking reporting unit and the Technology Services ("TS") reporting unit within the Enterprise Group ("EG") segment, HP combined these reporting units to create the EG reporting unit. As of October 31, 2014,2015, HP's reporting units are consistent with the reportable segments identified in Note 2, except for Enterprise Services ("ES"), which consists of two reporting units: MphasiS Limited and the remainder of ES.
In the first step of the impairment test, HP compares the fair value of each reporting unit to its carrying amount. HP estimates the fair value of its reporting units using a weighting of fair values derived most significantly from the income approach, and to a lesser extent, the market approach. Under the income approach, HP estimates the fair value of a reporting unit based on the present value of estimated future cash flows. HP bases cash flow projections on management's estimates of revenue growth rates and operating margins, taking into consideration industry and market conditions. HP bases the discount rate on the weighted-average cost of capital adjusted for the relevant risk associated with business-specific characteristics and the uncertainty related to the reporting unit's ability to execute on the projected cash flows. Under the market approach, HP estimates fair value based on market multiples of revenue and earnings derived from comparable publicly-traded companies with similar operating and investment characteristics as the reporting unit. HP weights the fair value derived from the market approach depending on the level of comparability of these publicly-traded companies to the reporting unit. When market comparables are not meaningful or not available, HP estimates the fair value of a reporting unit using only the income approach. For the MphasiS Limited reporting unit, HP utilized the quoted market price in an active market to estimate fair value.
In order to assess the reasonableness of the estimated fair value of HP's reporting units, HP compares the aggregate reporting unit fair value to HP's market capitalization and calculates an
HP INC. AND SUBSIDIARIES
Notes to Consolidated Financial Statements (Continued)
Note 1: Overview and Summary of Significant Accounting Policies (Continued)
implied control premium (the excess of the sum of the reporting units' fair value over HP's market
HEWLETT-PACKARD COMPANY AND SUBSIDIARIES
Notes to Consolidated Financial Statements (Continued)
Note 1: Summary of Significant Accounting Policies (Continued)
capitalization). HP evaluates the control premium by comparing it to observable control premiums from recent comparable transactions. If the implied control premium is not believed to be reasonable in light of these recent transactions, HP reevaluates reporting unit fair values, which may result in an adjustment to the discount rate and/or other assumptions. This reevaluation could result in a change to the estimated fair value for certain or all reporting units.
If the fair value of a reporting unit exceeds the carrying amount of the net assets assigned to that reporting unit, goodwill is not impaired and no further testing is required. If the fair value of the reporting unit is less than its carrying amount, then HP performs the second step of the goodwill impairment test to measure the amount of impairment loss, if any. In the second step, HP measures the reporting unit's assets, including any unrecognized intangible assets, liabilities and non-controlling interests at fair value in a hypothetical analysis to calculate the implied fair value of goodwill for the reporting unit in the same manner as if the reporting unit was being acquired in a business combination. If the implied fair value of the reporting unit's goodwill is less than its carrying amount, the difference is recorded as an impairment loss.
Intangible Assets and Long-Lived Assets
HP reviews intangible assets with finite lives and long-lived assets for impairment whenever events or changes in circumstances indicate the carrying amount of an asset may not be recoverable. HP assesses the recoverability of assets based on the estimated undiscounted future cash flows expected to result from the use and eventual disposition of the asset. If the undiscounted future cash flows are less than the carrying amount, the asset is impaired. HP measures the amount of impairment loss, if any, as the difference between the carrying amount of the asset and its fair value using an income approach or, when available and appropriate, using a market approach. HP amortizes intangible assets with finite lives using the straight-line method over the estimated economic lives of the assets, ranging from one to ten years.
Debt and Marketable Equity Securities Investments
Debt and marketable equity securities are generally considered available-for-sale and are reported at fair value with unrealized gains and losses, net of applicable taxes, in Accumulated other comprehensive loss in the Consolidated Balance Sheets. Realized gains and losses for available-for-sale securities are calculated based on the specific identification method and included in Interest and other, net in the Consolidated Statements of Earnings. HP monitors its investment portfolio for potential impairment on a quarterly basis. When the carrying amount of an investment in debt securities exceeds its fair value and the decline in value is determined to be other-than-temporary (i.e., when HP does not intend to sell the debt securities and it is not more likely than not that HP will be required to sell the debt securities prior to anticipated recovery of its amortized cost basis), HP records an impairment charge to Interest and other, net in the amount of the credit loss and the balance, if any, is recorded in Accumulated other comprehensive loss in the Consolidated Balance Sheets.
Derivatives
HP uses derivative financial instruments, primarily forwards, swaps, and at times, options, to hedge certain foreign currency and interest rate exposures. HP also may use other derivative instruments not
HP INC. AND SUBSIDIARIES
Notes to Consolidated Financial Statements (Continued)
Note 1: Overview and Summary of Significant Accounting Policies (Continued)
designated as hedges, such as forwards used to hedge foreign currency balance sheet exposures. HP
HEWLETT-PACKARD COMPANY AND SUBSIDIARIES
Notes to Consolidated Financial Statements (Continued)
Note 1: Summary of Significant Accounting Policies (Continued)
does not use derivative financial instruments for speculative purposes. See Note 1112 for a full description of HP's derivative financial instrument activities and related accounting policies.
Loss Contingencies
HP is involved in various lawsuits, claims, investigations and proceedings that arise in the ordinary course of business. HP records a liability for contingencies when it believes it is both probable that a liability has been incurred and the amount of the loss can be reasonably estimated. See Note 1516 for a full description of HP's loss contingencies and related accounting policies.
HP is a leading global provider of products, technologies, software, solutions and services to individual consumers, small- and medium-sized businesses ("SMBs") and large enterprises, including customers in the government, health and education sectors. HP's offerings span the following:
HP's operations are organized into seven segments for financial reporting purposes: Personal Systems, Printing, the EG, ES,Enterprise Group ("EG"), Enterprise Services ("ES"), Software, HP Financial Services ("HPFS") and Corporate Investments. HP's organizational structure is based on a number of factors that management uses to evaluate, view and run its business operations, which include, but are not limited to, customer base and homogeneity of products and technology. The segments are based on this organizational structure and information reviewed by HP's management to evaluate segment results.
The Personal Systems segment and the Printing segment are structured beneath a broader Printing and Personal Systems Group ("PPS"). While PPS is not a reportable segment, HP may provide financial data aggregating the Personal Systems and the Printing segments in order to provide a supplementary view of its business.
As a result of the Separation, beginning November 1, 2015, HP will report three segments as part of continuing operations: Personal Systems, Printing and Corporate Investments.
A summary description of each segment follows.
ThePrinting and Personal Systems Group's mission is to leverage the respective strengths of the Personal Systems business and the Printing business by creating a unified organization that is
HP INC. AND SUBSIDIARIES
Notes to Consolidated Financial Statements (Continued)
Note 2: Segment Information (Continued)
customer-focused and poised to capitalize on rapidly shifting industry trends. Each of the segments within PPS is described below.
Personal Systems provides commercial Personal Computerspersonal computers ("PCs"), consumer PCs, workstations, thin clients, tablets, retail point-of-sale systems, calculators and other related accessories, software, support and services for the commercial and consumer markets. HP groups commercial notebooks, commercial desktops, commercial services, commercial tablets, workstations and thin clients into commercial clients and consumer notebooks, consumer desktops, consumer services and consumer tablets into consumer clients when describing performance in these markets. Described below are HP's global business capabilities within Personal Systems.
HEWLETT-PACKARD COMPANY AND SUBSIDIARIES
Notes to Consolidated Financial Statements (Continued)
Note 2: Segment Information (Continued)
Printing provides consumer and commercial printer hardware, supplies, media, software and services, as well as scanning devices. Printing is also focused on imaging solutions in the commercial markets. HP groups LaserJet, large format printers and commercial inkjet printers into commercial hardwareCommercial Hardware and consumer inkjet printers into consumer hardwareConsumer Hardware when describing performance in these markets. Described below are HP's global business capabilities within Printing.
TheEnterprise Group provides servers, storage, networking and technology services that, when combined with HP's Cloudcloud solutions, enable customers to manage applications across public cloud, virtual private cloud, private cloud and traditional IT environments. Described below are HP's business units and capabilities within EG.
HP INC. AND SUBSIDIARIES
Notes to Consolidated Financial Statements (Continued)
Note 2: Segment Information (Continued)
HEWLETT-PACKARD COMPANY AND SUBSIDIARIES
Notes to Consolidated Financial Statements (Continued)
Note 2: Segment Information (Continued)
Enterprise Services provides technology consulting, outsourcing and support services across infrastructure, applications and business process domains. ES is comprised of the Infrastructure Technology Outsourcing ("ITO") and the Application and Business Services.Services ("ABS") business units.
Software provides IT management,big data analytics and applications, enterprise security, application testing and delivery information management big data analytics, security intelligence and risk managementIT Operations Management solutions for businesses and other enterprises of all sizes. OurThese software offerings include licenses, support, professional services and SaaS.software-as-a-service.
HP Financial Services provides flexible investment solutions, such as leasing, financing, IT consumption and utility programs and asset management services, for customers to enable the creation of unique technology deployment models and acquire complete IT solutions, including hardware, software and services from HP and others. Providing flexible services and capabilities that support the entire IT lifecycle, HPFS partners with customers globally to help build investment strategies that enhance their business agility and support their business transformation. HPFS offers a wide selection of investment solution capabilities for large enterprise customers and channel partners, along with an array of financial options to SMBs and educational and governmental entities.
Corporate Investments includes HP Labs and certain cloud-relatedenterprise-related business incubation projects and venture focused minority investments among others.
HP INC. AND SUBSIDIARIES
Notes to Consolidated Financial Statements (Continued)
Note 2: Segment Information (Continued)
Segment Policy
HP derives the results of the business segments directly from its internal management reporting system. The accounting policies HP uses to derive segment results are substantially the same as those the consolidated company uses. Management measures the performance of each segment based on several metrics, including earnings from operations. Management uses these results, in part, to evaluate the performance of, and to allocate resources to, each of the segments.
Segment revenue includes revenues from sales to external customers and intersegment revenues that reflect transactions between the segments on an arm's-length basis. Intersegment revenues primarily consist of sales of hardware and software that are sourced internally and, in the majority of the cases, are financed as operating leases by HPFS. HP's consolidated net revenue is derived and reported after the elimination of intersegment revenues from such arrangements.
HP periodically engages in intercompany advanced royalty payment and licensing arrangements that may result in advance payments between subsidiaries. Revenues from these intercompany licensing arrangements are deferred and recognized ratablyas earned over the term of the arrangement by the HP legal entities involved in such transactions; however, these advanced payments are eliminated from revenues as reported by HP and its business segments. As disclosed in Note 6, during fiscal 2015, HP executed an intercompany advanced royalty payment arrangement resulting in advanced payments of $8.8 billion, while during fiscal 2014 HP executed a multi-year intercompany licensing
HEWLETT-PACKARD COMPANY AND SUBSIDIARIES
Notes to Consolidated Financial Statements (Continued)
Note 2: Segment Information (Continued)
arrangement on whichand intercompany advanced royalty payment arrangement which resulted in combined advanced payments of $10.4 billion$11.5 billion. In these transactions, the payments were received in the U.S. from a foreign consolidated affiliate. Deferredaffiliate, with a deferral of intercompany royalty revenues of $9.9 billion will be recognized over the lifeterm of the arrangement through 2029 in the respective legal entities, butarrangements, approximately 5 years and 15 years, respectively. The impact of these intercompany arrangements is eliminated from both HP consolidated and segment revenues.
Financing interest in the Consolidated Statements of Earnings reflects interest expense on debt attributable to HPFS. Debt attributable to HPFS consists of intercompany equity that is treated as debt for segment reporting purposes, intercompany debt, and borrowing- and funding-related activity associated with HPFS and its subsidiaries.
HP does not allocate to its segments certain operating expenses, which it manages at the corporate level. These unallocated costs include certain corporate governance costs, stock-based compensation expense, amortization of intangible assets, restructuring charges, acquisition and other related charges, separation costs, defined benefit plan settlement charges and impairment of goodwill and intangible assets, restructuring charges and acquisition-related charges.data center assets.
Segment Realignment
Effective at the beginning of itsthe first quarter of fiscal 2014,2015, HP implemented certainan organizational changeschange to align its segment financial reporting more closely with its current business structure. TheseThis organizational changes include:
In addition, HP transferred certain intrasegment eliminations from the ES segment and the EG segment to corporate intersegment revenue eliminations.
HP has reflected these changesthis change to its segment information retrospectively to the earliest period presented, which has resulted in the transferremoval of intersegment revenue amongfrom the Printing, Personal Systems,TS business unit within the EG ESsegment and Software segmentsthe related corporate intersegment revenue eliminations, and the transfer of operating profit amongfrom the Printing, Personal Systems,TS business unit within the EG Software and Corporate Investments segments. These changes had no impact onsegment to the previously reported financial results forITO business unit within the HPFSES segment. In addition, none of these changes impacted HP's previously reported consolidated net revenue, earnings from operations, net earnings or net EPS.
HEWLETT-PACKARD COMPANYHP INC. AND SUBSIDIARIES
Notes to Consolidated Financial Statements (Continued)
Note 2: Segment Information (Continued)
In connection with the Separation, effective at the beginning of the fourth quarter of fiscal 2015, HP implemented an organizational change which resulted in the transfer of marketing optimization solutions business from the Software segment to the Commercial Hardware business unit within the Printing segment. HP has reflected this change to its segment information in prior reporting periods on an as-if basis, which resulted in the transfer of net revenue from the Software segment to the Commercial Hardware business unit within the Printing segment. This change also resulted in the transfer of operating profit from the Software segment to the Commercial Hardware business unit within the Printing segment. In addition, this change resulted in the reclassification of $512 million of goodwill from the Software segment to the Printing segment.
These changes had no impact on HP's previously reported consolidated net revenue, earnings from operations, net earnings or net EPS.
Segment Operating Results
| | Printing and Personal Systems | | | | | | | Printing and Personal Systems | | | | | | | ||||||||||||||||||||||||||||||||||||
|---|---|---|---|---|---|---|---|---|---|---|---|---|---|---|---|---|---|---|---|---|---|---|---|---|---|---|---|---|---|---|---|---|---|---|---|---|---|---|---|---|---|---|---|---|---|---|---|---|---|---|
| | Personal Systems | Printing | Enterprise Group | Enterprise Services | Software | HP Financial Services | Corporate Investments | Total | Personal Systems | Printing | Enterprise Group | Enterprise Services | Software | HP Financial Services | Corporate Investments | Total | ||||||||||||||||||||||||||||||||||
| | In millions | In millions | ||||||||||||||||||||||||||||||||||||||||||||||||
2015 | ||||||||||||||||||||||||||||||||||||||||||||||||||
Net revenue | $ | 30,438 | $ | 20,938 | $ | 26,670 | $ | 19,009 | $ | 3,142 | $ | 3,131 | $ | 27 | $ | 103,355 | ||||||||||||||||||||||||||||||||||
Intersegment net revenue and other | 1,031 | 294 | 1,237 | 797 | 316 | 85 | — | 3,760 | ||||||||||||||||||||||||||||||||||||||||||
| | | | | | | | | | | | | | | | | | | | | | | | | | | |||||||||||||||||||||||||
Total segment net revenue | $ | 31,469 | $ | 21,232 | $ | 27,907 | $ | 19,806 | $ | 3,458 | $ | 3,216 | $ | 27 | $ | 107,115 | ||||||||||||||||||||||||||||||||||
| | | | | | | | | | | | | | | | | | | | | | | | | | | |||||||||||||||||||||||||
| | | | | | | | | | | | | | | | | | | |||||||||||||||||||||||||||||||||
| | | | | | | | | | | | | | | | | | | | | | | | | | | |||||||||||||||||||||||||
Earnings (loss) from operations | $ | 1,064 | $ | 3,865 | $ | 3,981 | $ | 1,051 | $ | 760 | $ | 349 | $ | (565 | ) | $ | 10,505 | |||||||||||||||||||||||||||||||||
| | | | | | | | | | | | | | | | | | | | | | | | | | | |||||||||||||||||||||||||
| | | | | | | | | | | | | | | | | | | |||||||||||||||||||||||||||||||||
| | | | | | | | | | | | | | | | | | | | | | | | | | | |||||||||||||||||||||||||
2014 | ||||||||||||||||||||||||||||||||||||||||||||||||||
Net revenue | $ | 33,304 | $ | 22,719 | $ | 26,809 | $ | 21,297 | $ | 3,607 | $ | 3,416 | $ | 302 | $ | 111,454 | $ | 33,304 | $ | 22,951 | $ | 26,809 | $ | 21,297 | $ | 3,375 | $ | 3,416 | $ | 302 | $ | 111,454 | ||||||||||||||||||
Intersegment net revenue and other | 999 | 260 | 1,005 | 1,101 | 326 | 82 | — | 3,773 | 999 | 260 | 914 | 1,101 | 326 | 82 | — | 3,682 | ||||||||||||||||||||||||||||||||||
| | | | | | | | | | | | | | | | | | | | | | | | | | | | | | | | | | | | | | | | | | | | ||||||||
Total segment net revenue | $ | 34,303 | $ | 22,979 | $ | 27,814 | $ | 22,398 | $ | 3,933 | $ | 3,498 | $ | 302 | $ | 115,227 | $ | 34,303 | $ | 23,211 | $ | 27,723 | $ | 22,398 | $ | 3,701 | $ | 3,498 | $ | 302 | $ | 115,136 | ||||||||||||||||||
| | | | | | | | | | | | | | | | | | | | | | | | | | | | | | | | | | | | | | | | | | | | | |||||||
| | | | | | | | | | | | | | | | | | | | | | | | | | | |||||||||||||||||||||||||
Earnings (loss) from operations | $ | 1,270 | $ | 4,185 | $ | 4,008 | $ | 803 | $ | 872 | $ | 389 | $ | (199 | ) | $ | 11,328 | $ | 1,270 | $ | 4,229 | $ | 3,995 | $ | 816 | $ | 828 | $ | 389 | $ | (199 | ) | $ | 11,328 | ||||||||||||||||
| | | | | | | | | | | | | | | | | | | | | | | | | | | | | | | | | | | | | | | | | | | | | |||||||
| | | | | | | | | | | | | | | | | | | | | | | | | | | |||||||||||||||||||||||||
2013 | ||||||||||||||||||||||||||||||||||||||||||||||||||
Net revenue | $ | 31,232 | $ | 23,685 | $ | 27,045 | $ | 23,041 | $ | 3,701 | $ | 3,570 | $ | 24 | $ | 112,298 | $ | 31,232 | $ | 23,917 | $ | 27,045 | $ | 23,041 | $ | 3,469 | $ | 3,570 | $ | 24 | $ | 112,298 | ||||||||||||||||||
Intersegment net revenue and other | 947 | 211 | 1,036 | 1,020 | 320 | 59 | — | 3,593 | 947 | 211 | 958 | 1,020 | 320 | 59 | — | 3,515 | ||||||||||||||||||||||||||||||||||
| | | | | | | | | | | | | | | | | | | | | | | | | | | | | | | | | | | | | | | | | | | | ||||||||
Total segment net revenue | $ | 32,179 | $ | 23,896 | $ | 28,081 | $ | 24,061 | $ | 4,021 | $ | 3,629 | $ | 24 | $ | 115,891 | $ | 32,179 | $ | 24,128 | $ | 28,003 | $ | 24,061 | $ | 3,789 | $ | 3,629 | $ | 24 | $ | 115,813 | ||||||||||||||||||
| | | | | | | | | | | | | | | | | | | | | | | | | | | | | | | | | | | | | | | | | | | | | |||||||
| | | | | | | | | | | | | | | | | | | | | | | | | | | |||||||||||||||||||||||||
Earnings (loss) from operations | $ | 980 | $ | 3,933 | $ | 4,259 | $ | 679 | $ | 868 | $ | 399 | $ | (316 | ) | $ | 10,802 | $ | 980 | $ | 3,953 | $ | 4,245 | $ | 693 | $ | 848 | $ | 399 | $ | (316 | ) | $ | 10,802 | ||||||||||||||||
| | | | | | | | | | | | | | | | | | | | | | | | | | | | | | | | | | | | | | | | | | | | | |||||||
2012 | ||||||||||||||||||||||||||||||||||||||||||||||||||
Net revenue | $ | 34,892 | $ | 24,317 | $ | 28,349 | $ | 25,090 | $ | 3,868 | $ | 3,784 | $ | 57 | $ | 120,357 | ||||||||||||||||||||||||||||||||||
Intersegment net revenue and other | 951 | 221 | 1,294 | 903 | 303 | 35 | 1 | 3,708 | ||||||||||||||||||||||||||||||||||||||||||
| | | | | | | | | | | | | | | | | | | | | | | | | | | | | | | | | | | | | | | | | | | | ||||||||
Total segment net revenue | $ | 35,843 | $ | 24,538 | $ | 29,643 | $ | 25,993 | $ | 4,171 | $ | 3,819 | $ | 58 | $ | 124,065 | ||||||||||||||||||||||||||||||||||
| | | | | | | | | | | | | | | | | | ||||||||||||||||||||||||||||||||||
| | | | | | | | | | | | | | | | | | ||||||||||||||||||||||||||||||||||
Earnings (loss) from operations | $ | 1,724 | $ | 3,612 | $ | 5,123 | $ | 1,045 | $ | 836 | $ | 388 | $ | (233 | ) | $ | 12,495 | |||||||||||||||||||||||||||||||||
| | | | | | | | | | | | | | | | | | ||||||||||||||||||||||||||||||||||
| | | | | | | | | | | | | | | | | | ||||||||||||||||||||||||||||||||||
HP INC. AND SUBSIDIARIES
Notes to Consolidated Financial Statements (Continued)
Note 2: Segment Information (Continued)
The reconciliation of segment operating results to HP consolidated results was as follows:
| | For the fiscal years ended October 31 | For the fiscal years ended October 31 | ||||||||||||||||||
|---|---|---|---|---|---|---|---|---|---|---|---|---|---|---|---|---|---|---|---|---|
| | 2014 | 2013 | 2012 | 2015 | 2014 | 2013 | ||||||||||||||
| | In millions | In millions | ||||||||||||||||||
Net Revenue: | ||||||||||||||||||||
Total segments | $ | 115,227 | $ | 115,891 | $ | 124,065 | $ | 107,115 | $ | 115,136 | $ | 115,813 | ||||||||
Elimination of intersegment net revenue and other | (3,773 | ) | (3,593 | ) | (3,708 | ) | (3,760 | ) | (3,682 | ) | (3,515 | ) | ||||||||
| | | | | | | | | | | | | | | | | | | |||
Total HP consolidated net revenue | $ | 111,454 | $ | 112,298 | $ | 120,357 | $ | 103,355 | $ | 111,454 | $ | 112,298 | ||||||||
| | | | | | | | | | | | | | | | | | | | ||
| | | | | | | | | | | | ||||||||||
Earnings before taxes: | ||||||||||||||||||||
Total segment earnings from operations | $ | 11,328 | $ | 10,802 | $ | 12,495 | $ | 10,505 | $ | 11,328 | $ | 10,802 | ||||||||
Corporate and unallocated costs and eliminations | (953 | ) | (786 | ) | (787 | ) | (724 | ) | (953 | ) | (786 | ) | ||||||||
Stock-based compensation expense | (560 | ) | (500 | ) | (635 | ) | (709 | ) | (560 | ) | (500 | ) | ||||||||
Amortization of intangible assets | (1,000 | ) | (1,373 | ) | (1,784 | ) | (931 | ) | (1,000 | ) | (1,373 | ) | ||||||||
Impairment of goodwill and intangible assets | — | — | (18,035 | ) | ||||||||||||||||
Restructuring charges | (1,619 | ) | (990 | ) | (2,266 | ) | (1,017 | ) | (1,619 | ) | (990 | ) | ||||||||
Acquisition-related charges | (11 | ) | (22 | ) | (45 | ) | ||||||||||||||
Acquisition and other related charges | (90 | ) | (11 | ) | (22 | ) | ||||||||||||||
Separation costs | (1,259 | ) | — | — | ||||||||||||||||
Defined benefit plan settlement charges | (168 | ) | — | — | ||||||||||||||||
Impairment of data center assets | (136 | ) | — | — | ||||||||||||||||
Interest and other, net | (628 | ) | (621 | ) | (876 | ) | (739 | ) | (628 | ) | (621 | ) | ||||||||
| | | | | | | | | | | | | | | | | | | |||
Total HP consolidated earnings (loss) before taxes | $ | 6,557 | $ | 6,510 | $ | (11,933 | ) | |||||||||||||
Total HP consolidated earnings before taxes | $ | 4,732 | $ | 6,557 | $ | 6,510 | ||||||||||||||
| | | | | | | | | | | | | | | | | | | | ||
| | | | | | | | | | | | ||||||||||
HEWLETT-PACKARD COMPANY AND SUBSIDIARIES
Notes to Consolidated Financial Statements (Continued)
Note 2: Segment Information (Continued)
Segment Assets
HP allocates assets to its business segments based on the segments primarily benefiting from the assets. Total assets by segment and the reconciliation of segment assets to HP consolidated assets were as follows:
| | As of October 31 | As of October 31 | ||||||||||||
|---|---|---|---|---|---|---|---|---|---|---|---|---|---|---|
| | 2014 | 2013(1) | 2015 | 2014 | ||||||||||
| | In millions | In millions | ||||||||||||
Personal Systems | $ | 12,104 | $ | 11,690 | $ | 9,534 | $ | 12,104 | ||||||
Printing | 10,063 | 11,088 | 8,994 | 10,666 | ||||||||||
| | | | | | | | | | | | | | ||
Printing and Personal Systems Group | 22,167 | 22,778 | 18,528 | 22,770 | ||||||||||
| | | | | | | | | | | | | | ||
Enterprise Group | 27,236 | 29,759 | ||||||||||||
Enterprise Group(1) | 33,499 | 27,236 | ||||||||||||
Enterprise Services | 13,472 | 16,217 | 14,354 | 13,472 | ||||||||||
Software | 11,575 | 11,940 | 11,226 | 10,972 | ||||||||||
HP Financial Services | 13,529 | 12,746 | 13,093 | 13,529 | ||||||||||
Corporate Investments | 34 | 105 | 56 | 34 | ||||||||||
Corporate and unallocated assets | 15,193 | 12,131 | 16,126 | 15,193 | ||||||||||
| | | | | | | | | | | | | | ||
Total HP consolidated assets | $ | 103,206 | $ | 105,676 | $ | 106,882 | $ | 103,206 | ||||||
| | | | | | | | | | | | | | | |
| | | | | | | | | |||||||
HP INC. AND SUBSIDIARIES
Notes to Consolidated Financial Statements (Continued)
Note 2: Segment Information (Continued)
Major Customers
No single customer represented 10% or more of HP's total net revenue in any fiscal year presented.
Geographic Information
Net revenue by country is based upon the sales location that predominately represents the customer location. For each of the fiscal years of 2015, 2014 2013 and 2012,2013, other than the U.S., no country represented more than 10% of HPHP's net revenue.
Net revenue by country in which HP operates was as follows:
| | For the fiscal years ended October 31 | For the fiscal years ended October 31 | ||||||||||||||||||
|---|---|---|---|---|---|---|---|---|---|---|---|---|---|---|---|---|---|---|---|---|
| | 2014 | 2013 | 2012 | 2015 | 2014 | 2013 | ||||||||||||||
| | In millions | In millions | ||||||||||||||||||
U.S. | $ | 38,805 | $ | 40,284 | $ | 42,140 | $ | 37,679 | $ | 38,805 | $ | 40,284 | ||||||||
Other countries | 72,649 | 72,014 | 78,217 | 65,676 | 72,649 | 72,014 | ||||||||||||||
| | | | | | | | | | | | | | | | | | | |||
Total net revenue | $ | 111,454 | $ | 112,298 | $ | 120,357 | $ | 103,355 | $ | 111,454 | $ | 112,298 | ||||||||
| | | | | | | | | | | | | | | | | | | | ||
| | | | | | | | | | | | ||||||||||
As of October 31, 2015, the U.S. and Netherlands each represented more than 10% of net assets. As of October 31, 2014, the U.S., Netherlands and Ireland each represented more than 10% of net assets. As of October 31, 2013, the U.S., the Cayman Islands and Ireland each represented 10% or more of net assets.
Net property, plant and equipment by country in which HP operates was as follows:
| | As of October 31 | ||||||
|---|---|---|---|---|---|---|---|
| | 2015 | 2014 | |||||
| | In millions | ||||||
U.S. | $ | 5,501 | $ | 5,668 | |||
United Kingdom. | 955 | 1,053 | |||||
Other countries | 4,634 | 4,619 | |||||
| | | | | | | | |
Total net property, plant and equipment | $ | 11,090 | $ | 11,340 | |||
| | | | | | | | |
| | | | | | | | |
| | | | | | | | |
HEWLETT-PACKARD COMPANYHP INC. AND SUBSIDIARIES
Notes to Consolidated Financial Statements (Continued)
Note 2: Segment Information (Continued)
Net property, plant and equipment by country in which HP operates was as follows:
| | As of October 31 | ||||||
|---|---|---|---|---|---|---|---|
| | 2014 | 2013 | |||||
| | In millions | ||||||
U.S. | $ | 5,668 | $ | 5,546 | |||
The United Kingdom. | 1,053 | 1,090 | |||||
Other countries | 4,619 | 4,827 | |||||
| | | | | | | | |
Total net property, plant and equipment | $ | 11,340 | $ | 11,463 | |||
| | | | | | | | |
| | | | | | | | |
Net revenue by segment and business unit was as follows:
| | For the fiscal years ended October 31 | For the fiscal years ended October 31 | ||||||||||||||||||
|---|---|---|---|---|---|---|---|---|---|---|---|---|---|---|---|---|---|---|---|---|
| | 2014 | 2013 | 2012 | 2015 | 2014 | 2013 | ||||||||||||||
| | In millions | In millions | ||||||||||||||||||
Notebooks | $ | 17,540 | $ | 16,029 | $ | 18,830 | $ | 17,271 | $ | 17,540 | $ | 16,029 | ||||||||
Desktops | 13,197 | 12,844 | 13,888 | 10,941 | 13,197 | 12,844 | ||||||||||||||
Workstations | 2,218 | 2,147 | 2,148 | 2,018 | 2,218 | 2,147 | ||||||||||||||
Other | 1,348 | 1,159 | 977 | 1,239 | 1,348 | 1,159 | ||||||||||||||
| | | | | | | | | | | | | | | | | | | |||
Personal Systems | 34,303 | 32,179 | 35,843 | 31,469 | 34,303 | 32,179 | ||||||||||||||
| | | | | | | | | | | | | | | | | | | |||
Supplies | 14,917 | 15,716 | 16,151 | 13,979 | 14,917 | 15,716 | ||||||||||||||
Commercial Hardware | 5,717 | 5,744 | 5,946 | 5,378 | 5,949 | 5,976 | ||||||||||||||
Consumer Hardware | 2,345 | 2,436 | 2,441 | 1,875 | 2,345 | 2,436 | ||||||||||||||
| | | | | | | | | | | | | | | | | | | |||
Printing | 22,979 | 23,896 | 24,538 | 21,232 | 23,211 | 24,128 | ||||||||||||||
| | | | | | | | | | | | | | | | | | | |||
Total Printing and Personal Systems Group | 57,282 | 56,075 | 60,381 | 52,701 | 57,514 | 56,307 | ||||||||||||||
| | | | | | | | | | | | | | | | | | | |||
Industry Standard Servers | 12,474 | 12,102 | 12,582 | 13,412 | 12,474 | 12,102 | ||||||||||||||
Technology Services | 8,466 | 8,788 | 9,152 | 7,662 | 8,375 | 8,710 | ||||||||||||||
Storage | 3,316 | 3,475 | 3,815 | 3,180 | 3,316 | 3,475 | ||||||||||||||
Networking | 2,629 | 2,526 | 2,482 | 2,846 | 2,629 | 2,526 | ||||||||||||||
Business Critical Systems | 929 | 1,190 | 1,612 | 807 | 929 | 1,190 | ||||||||||||||
| | | | | | | | | | | | | | | | | | | |||
Enterprise Group | 27,814 | 28,081 | 29,643 | 27,907 | 27,723 | 28,003 | ||||||||||||||
| | | | | | | | | | | | | | | | | | | |||
Infrastructure Technology Outsourcing | 14,038 | 15,223 | 16,176 | 12,107 | 14,038 | 15,223 | ||||||||||||||
Application and Business Services | 8,360 | 8,838 | 9,817 | 7,699 | 8,360 | 8,838 | ||||||||||||||
| | | | | | | | | | | | | | | | | | | |||
Enterprise Services | 22,398 | 24,061 | 25,993 | 19,806 | 22,398 | 24,061 | ||||||||||||||
| | | | | | | | | | | | | | | | | | | |||
Software | 3,933 | 4,021 | 4,171 | 3,458 | 3,701 | 3,789 | ||||||||||||||
HP Financial Services | 3,498 | 3,629 | 3,819 | 3,216 | 3,498 | 3,629 | ||||||||||||||
Corporate Investments | 302 | 24 | 58 | 27 | 302 | 24 | ||||||||||||||
| | | | | | | | | | | | | | | | | | | |||
Total segment net revenue | 115,227 | 115,891 | 124,065 | 107,115 | 115,136 | 115,813 | ||||||||||||||
| | | | | | | | | | | | | | | | | | | |||
Eliminations of intersegment net revenue and other | (3,773 | ) | (3,593 | ) | (3,708 | ) | (3,760 | ) | (3,682 | ) | (3,515 | ) | ||||||||
| | | | | | | | | | | | | | | | | | | |||
Total net revenue | $ | 111,454 | $ | 112,298 | $ | 120,357 | $ | 103,355 | $ | 111,454 | $ | 112,298 | ||||||||
| | | | | | | | | | | | | | | | | | | | ||
| | | | | | | | | | | | ||||||||||
HEWLETT-PACKARD COMPANYHP INC. AND SUBSIDIARIES
Notes to Consolidated Financial Statements (Continued)
Summary of Restructuring Plans
HP's restructuring activities in fiscal 20142015 summarized by plan were as follows:
| | | Fiscal 2014 | | As of October 31, 2014 | | Fiscal 2015 | | As of October 31, 2015 | ||||||||||||||||||||||||||||||||||||
|---|---|---|---|---|---|---|---|---|---|---|---|---|---|---|---|---|---|---|---|---|---|---|---|---|---|---|---|---|---|---|---|---|---|---|---|---|---|---|---|---|---|---|---|---|
| | Balance, October 31, 2013 | Charges | Cash Payments | Other Adjustments and Non-Cash Settlements | Balance, October 31, 2014 | Total Costs Incurred to Date | Total Expected Costs to Be Incurred | Balance, October 31, 2014 | Charges | Cash Payments | Other Adjustments and Non-Cash Settlements | Balance, October 31, 2015 | Total Costs Incurred to Date | Total Expected Costs to Be Incurred | ||||||||||||||||||||||||||||||
| | In millions | In millions | ||||||||||||||||||||||||||||||||||||||||||
Fiscal 2015 Plan | ||||||||||||||||||||||||||||||||||||||||||||
Severance | $ | — | $ | 390 | $ | — | $ | — | $ | 390 | $ | 390 | $ | 2,355 | ||||||||||||||||||||||||||||||
Infrastructure and other | — | 1 | (1 | ) | — | — | 1 | 506 | ||||||||||||||||||||||||||||||||||||
| | | | | | | | | | | | | | | | | | | | | | | | ||||||||||||||||||||||
Total 2015 Plan | — | 391 | (1 | ) | — | 390 | 391 | 2,861 | ||||||||||||||||||||||||||||||||||||
Fiscal 2012 Plan | ||||||||||||||||||||||||||||||||||||||||||||
Severance and EER | $ | 945 | $ | 1,357 | $ | (1,233 | ) | $ | (114 | ) | $ | 955 | $ | 4,393 | $ | 5,000 | 955 | 566 | (1,101 | ) | (78 | ) | 342 | 4,959 | 4,959 | |||||||||||||||||||
Infrastructure and other | 40 | 268 | (208 | ) | (2 | ) | 98 | 515 | 540 | 98 | 74 | (120 | ) | (4 | ) | 48 | 589 | 589 | ||||||||||||||||||||||||||
| | | | | | | | | | | | | | | | | | | | | | | | | | | | | | | | | | | | | | | |||||||
Total 2012 Plan | 985 | 1,625 | (1,441 | ) | (116 | ) | 1,053 | 4,908 | 5,540 | 1,053 | 640 | (1,221 | ) | (82 | ) | 390 | 5,548 | 5,548 | ||||||||||||||||||||||||||
Other Plans: | ||||||||||||||||||||||||||||||||||||||||||||
Severance | 10 | — | (3 | ) | — | 7 | 2,629 | 2,629 | 7 | (4 | ) | (1 | ) | (1 | ) | 1 | 2,625 | 2,625 | ||||||||||||||||||||||||||
Infrastructure | 122 | (6 | ) | (62 | ) | — | 54 | 1,433 | 1,437 | 54 | (10 | ) | (20 | ) | — | 24 | 1,424 | 1,424 | ||||||||||||||||||||||||||
| | | | | | | | | | | | | | | | | | | | | | | | | | | | | | | | | | | | | | | |||||||
Total Other Plans | 132 | (6 | ) | (65 | ) | — | 61 | 4,062 | 4,066 | 61 | (14 | ) | (21 | ) | (1 | ) | 25 | 4,049 | 4,049 | |||||||||||||||||||||||||
| | | | | | | | | | | | | | | | | | | | | | | | | | | | | | | | | | | | | | | |||||||
Total restructuring plans | $ | 1,117 | $ | 1,619 | $ | (1,506 | ) | $ | (116 | ) | $ | 1,114 | $ | 8,970 | $ | 9,606 | $ | 1,114 | $ | 1,017 | $ | (1,243 | ) | $ | (83 | ) | $ | 805 | $ | 9,988 | $ | 12,458 | ||||||||||||
| | | | | | | | | | | | | | | | | | | | | | | | | | | | | | | | | | | | | | | | ||||||
| | | | | | | | | | | | | | | | | | | | | | | | ||||||||||||||||||||||
Reflected in Consolidated Balance Sheets: | ||||||||||||||||||||||||||||||||||||||||||||
Accrued restructuring | $ | 901 | $ | 898 | $ | 898 | $ | 689 | ||||||||||||||||||||||||||||||||||||
| | | | | | | | | | | | | | | | | | | | | | | | | | | | | | | | | | ||||||||||||
Other liabilities | $ | 216 | $ | 216 | $ | 216 | $ | 116 | ||||||||||||||||||||||||||||||||||||
| | | | | | | | | | | | | | | | | | | | | | | | | | | | | | | | | | ||||||||||||
Fiscal 2015 Restructuring Plan
In connection with the Separation, on September 14, 2015, HP's Board of Directors approved a cost saving and investment proposal which includes a restructuring plan (the "2015 Plan") which will be implemented through fiscal 2018. As part of the 2015 Plan, HP expects up to approximately 33,300 employees to exit the company by the end of 2018. These workforce reductions are primarily associated with the ES segment. The changes to the workforce will vary by country, based on local legal requirements and consultations with employee works councils and other employee representatives, as appropriate. HP estimates that it will incur aggregate pre-tax charges through fiscal 2018 of approximately $2.9 billion in connection with the 2015 Plan, of which the estimated cost for HP Inc. is approximately $280 million. Total estimated charges as a result of workforce reductions are approximately $2.4 billion and total estimated charges for real estate consolidation are approximately $506 million.
HP INC. AND SUBSIDIARIES
Notes to Consolidated Financial Statements (Continued)
Note 3: Restructuring (Continued)
Fiscal 2012 Restructuring Plan
On May 23, 2012, HP adopted a multi-year restructuring plan (the "2012 Plan") designed to simplify business processes, accelerate innovation and deliver better results for customers, employees and stockholders. As of October 31, 2013,2015 HP estimated that it would eliminate approximately 34,000eliminated 55,800 positions in connection with the 2012 Plan, through fiscal 2014, with a portion of those employees exiting the company as part of voluntary enhanced early retirement ("EER") programs in the U.S. and in certain other countries. As of October 31, 2013, HP estimated that it would recognize approximately $4.1recognized $5.5 billion in total aggregate charges in connection with the 2012 Plan.
In fiscal 2014, HP increased the expected number of positions to be eliminated to 55,000 as HP continued to optimize the workforce and reengineer business processes to be more competitive and meet its objectives. As a result, as of October 31, 2014, HP estimates that it will recognize approximately $5.5 billion in aggregate charges in connectionPlan, with the 2012 Plan. As of October 31, 2014, HP had recorded $4.9 billion in aggregate charges of which $4.4 billion related to workforce reductions, including the EER programs, and $515$589 million related to infrastructure, including data center and real estate consolidation and other items. As of October 31, 2014, HP had eliminated approximately 40,900 positions for which aThe severance payment has been or will be made as part of the 2012 Plan. The severance- and infrastructure-relatedinfrastructure related cash payments associated with the 2012 Plan are expected to be paid out through fiscal 2021.
HEWLETT-PACKARD COMPANY AND SUBSIDIARIES
NotesOctober 31, 2015, the 2012 Plan is considered completed. HP does not expect any additional charges to Consolidated Financial Statements (Continued)this plan.
Note 3: Restructuring (Continued)
Other Plans
Restructuring plans initiated by HP in fiscal 2008 and 2010 were substantially completed as of October 31, 2014. Severance-2015. Severance and infrastructure-relatedinfrastructure related cash payments associated with the other plans are expected to be paid out through fiscal 2019.
Note 4: Retirement and Post-Retirement Benefit Plans
Defined Benefit Plans
HP sponsors a number of defined benefit pension plans worldwide, of which theworldwide. The most significant defined benefit plans are in the United States. Both theU.S. The HP Pension Plan ("Pension Plan"), a defined benefit pension plan under which benefits are based on pay includes the former HP Retirement Plan and years of service, and the former HP Company Cash Account Pension Plan ("Cash Account Pension Plan"),. Under the HP Retirement Plan, benefits are based on pay and years of service, and under whichthe Cash Account Pension Plan, benefits are accrued pursuant to a formula based on a percentage of pay plus interest, wereinterest. The Pension Plan was frozen effective January 1, 2008. The Cash Account Pension Plan was merged into the HP Pension Plan in 2005 for certain funding and investment purposes. Effective October 30, 2009, the Electronic Data Systems Corporation ("EDS") U.S. qualified pension plan was also merged into the Pension Plan. The EDS pension plan was frozen effective January 1, 2009.
HP reduces the benefit payable to certain U.S. employees under the Pension Plan for service before 1993, if any, by any amounts due to the employee under HP's frozen defined contribution Deferred Profit-Sharing Plan ("DPSP"). HP closed the DPSP to new participants in 1993. The DPSP plan obligations are equal to the plan assets and are recognized as an offset to the Pension Plan when HP
HP INC. AND SUBSIDIARIES
Notes to Consolidated Financial Statements (Continued)
Note 4: Retirement and Post-Retirement Benefit Plans (Continued)
calculates its defined benefit pension cost and obligations. The fair value of plan assets and projected benefit obligations for the U.S. defined benefit plans combined with the DPSP were as follows:
| | For the fiscal years ended October 31 | For the fiscal years ended October 31 | ||||||||||||||||||||||||
|---|---|---|---|---|---|---|---|---|---|---|---|---|---|---|---|---|---|---|---|---|---|---|---|---|---|---|
| | 2014 | 2013 | 2015 | 2014 | ||||||||||||||||||||||
| | Plan Assets | Projected Benefit Obligation | Plan Assets | Projected Benefit Obligation | Plan Assets | Projected Benefit Obligation | Plan Assets | Projected Benefit Obligation | ||||||||||||||||||
| | In millions | In millions | ||||||||||||||||||||||||
U.S. defined benefit plans | $ | 11,979 | $ | 13,756 | $ | 10,866 | $ | 11,866 | $ | 11,077 | $ | 12,716 | $ | 11,979 | $ | 13,756 | ||||||||||
DPSP | 828 | 828 | 837 | 837 | 742 | 742 | 828 | 828 | ||||||||||||||||||
| | | | | | | | | | | | | | | | | | | | | | | | ||||
Total | $ | 12,807 | $ | 14,584 | $ | 11,703 | $ | 12,703 | $ | 11,819 | $ | 13,458 | $ | 12,807 | $ | 14,584 | ||||||||||
| | | | | | | | | | | | | | | | | | | | | | | | | |||
| | | | | | | | | | | | | | | |||||||||||||
HEWLETT-PACKARD COMPANY AND SUBSIDIARIES
Notes to Consolidated Financial Statements (Continued)
Note 4: Retirement and Post-Retirement Benefit Plans (Continued)
Post-Retirement Benefit Plans
HP sponsors retiree health and welfare benefit plans, of which the most significant are in the U.S. Under the HP Retiree Welfare Benefits Plan, certain pre-2003 retirees and grandfathered participants with continuous service to HP since 2002 are eligible to receive partially-subsidized medical coverage based on years of service at retirement. Former grandfathered employees of Digital Equipment Corporation also receive partially-subsidized medical benefits that are not service-based. HP's share of the premium cost is capped for all subsidized medical coverage provided under the HP Retiree Welfare Benefits Plan. HP currently leverages the employer group waiver plan process to provide HP Retiree Welfare Benefits Plan post-65 prescription drug coverage under Medicare Part D, thereby giving HP access to federal subsidies to help pay for retiree benefits.
Certain employees not grandfathered under the above programs, as well as employees hired after 2002 but before August 2008, are eligible for credits under the HP Retirement Medical Savings Account Plan ("RMSA") upon attaining age 45. Credits offered after September 2008 are provided in the form of matching credits on employee contributions made to a voluntary employee beneficiary association. OnUpon retirement, former employees may use these credits for the reimbursement of certain eligible medical expenses, including premiums required for coverage.
Defined Contribution Plans
HP offers various defined contribution plans for U.S. and non-U.S. employees. Total defined contribution expense was $542 million in fiscal 2015, $573 million in fiscal 2014 and $603 million in fiscal 2013 and $628 million in fiscal 2012.2013.
U.S. employees are automatically enrolled in the Hewlett-Packard CompanyHP 401(k) Plan ("HP 401(k) Plan") when they meet eligibility requirements, unless they decline participation.
The quarterly employer matching contributions in the HP 401(K)401(k) Plan are 100% of an employee's contributions, up to a maximum of 4% of eligible compensation.
HEWLETT-PACKARD COMPANYHP INC. AND SUBSIDIARIES
Notes to Consolidated Financial Statements (Continued)
Note 4: Retirement and Post-Retirement Benefit Plans (Continued)
Pension and Post-Retirement Benefit Expense
HP's net pension and post-retirement benefit (credit) cost recognized in the Consolidated Statements of Earnings was as follows:
| | For the fiscal years ended October 31 | For the fiscal years ended October 31 | ||||||||||||||||||||||||||||||||||||||||||||||||||||||
|---|---|---|---|---|---|---|---|---|---|---|---|---|---|---|---|---|---|---|---|---|---|---|---|---|---|---|---|---|---|---|---|---|---|---|---|---|---|---|---|---|---|---|---|---|---|---|---|---|---|---|---|---|---|---|---|---|
| | 2014 | 2013 | 2012 | 2014 | 2013 | 2012 | 2014 | 2013 | 2012 | 2015 | 2014 | 2013 | 2015 | 2014 | 2013 | 2015 | 2014 | 2013 | ||||||||||||||||||||||||||||||||||||||
| | U.S. Defined Benefit Plans | Non-U.S. Defined Benefit Plans | Post-Retirement Benefit Plans | U.S. Defined Benefit Plans | Non-U.S. Defined Benefit Plans | Post-Retirement Benefit Plans | ||||||||||||||||||||||||||||||||||||||||||||||||||
| | In millions | In millions | ||||||||||||||||||||||||||||||||||||||||||||||||||||||
Service cost | $ | 1 | $ | 1 | $ | 1 | $ | 308 | $ | 337 | $ | 294 | $ | 5 | $ | 6 | $ | 7 | $ | 1 | $ | 1 | $ | 1 | $ | 326 | $ | 308 | $ | 337 | $ | 5 | $ | 5 | $ | 6 | ||||||||||||||||||||
Interest cost | 569 | 560 | 566 | 737 | 676 | 690 | 32 | 31 | 35 | 566 | 569 | 560 | 622 | 737 | 676 | 29 | 32 | 31 | ||||||||||||||||||||||||||||||||||||||
Expected return on plan assets | (811 | ) | (845 | ) | (793 | ) | (1,140 | ) | (1,007 | ) | (816 | ) | (34 | ) | (34 | ) | (38 | ) | (818 | ) | (811 | ) | (845 | ) | (1,166 | ) | (1,140 | ) | (1,007 | ) | (39 | ) | (34 | ) | (34 | ) | ||||||||||||||||||||
Amortization and deferrals: | ||||||||||||||||||||||||||||||||||||||||||||||||||||||||
Actuarial loss (gain) | 15 | 77 | 43 | 318 | 341 | 235 | (10 | ) | 2 | (3 | ) | 54 | 15 | 77 | 441 | 318 | 341 | (11 | ) | (10 | ) | 2 | ||||||||||||||||||||||||||||||||||
Prior service benefit | — | — | — | (23 | ) | (27 | ) | (24 | ) | (41 | ) | (67 | ) | (79 | ) | — | — | — | (21 | ) | (23 | ) | (27 | ) | (20 | ) | (41 | ) | (67 | ) | ||||||||||||||||||||||||||
| | | | | | | | | | | | | | | | | | | | | | | | | | | | | | | | | | | | | | | | | | | | | | | | | |||||||||
Net periodic benefit (credit) cost | (226 | ) | (207 | ) | (183 | ) | 200 | 320 | 379 | (48 | ) | (62 | ) | (78 | ) | (197 | ) | (226 | ) | (207 | ) | 202 | 200 | 320 | (36 | ) | (48 | ) | (62 | ) | ||||||||||||||||||||||||||
| | | | | �� | | | | | | | | | | | | | | | | | | | | | | | | | | | | | | | | | | | | | | | | | | | | |||||||||
Curtailment (gain) loss | — | — | — | (7 | ) | (3 | ) | 4 | — | (7 | ) | (30 | ) | |||||||||||||||||||||||||||||||||||||||||||
Settlement loss (gain) | 1 | 12 | 11 | 12 | 18 | (18 | ) | — | — | — | ||||||||||||||||||||||||||||||||||||||||||||||
Curtailment gain | — | — | — | — | (7 | ) | (3 | ) | — | — | (7 | ) | ||||||||||||||||||||||||||||||||||||||||||||
Settlement loss | 114 | 1 | 12 | 4 | 12 | 18 | — | — | — | |||||||||||||||||||||||||||||||||||||||||||||||
Special termination benefits | — | — | 833 | 50 | 31 | 17 | 32 | (5 | ) | 227 | — | — | — | 25 | 50 | 31 | 1 | 32 | (5 | ) | ||||||||||||||||||||||||||||||||||||
| | | | | | | | | | | | | | | | | | | | | | | | | | | | | | | | | | | | | | | | | | | | | | | | | |||||||||
Net benefit (credit) cost | $ | (225 | ) | $ | (195 | ) | $ | 661 | $ | 255 | $ | 366 | $ | 382 | $ | (16 | ) | $ | (74 | ) | $ | 119 | $ | (83 | ) | $ | (225 | ) | $ | (195 | ) | $ | 231 | $ | 255 | $ | 366 | $ | (35 | ) | $ | (16 | ) | $ | (74 | ) | ||||||||||
| | | | | | | | | | | | | | | | | | | | | | | | | | | | | | | | | | | | | | | | | | | | | | | | | | ||||||||
| | | | | | | | | | | | | | | | | | | | | | | | | | | | | | ||||||||||||||||||||||||||||
Lump sum program
In January 2015, HP offered certain terminated vested participants of the U.S. HP Pension Plan the option of receiving their pension benefit in a one-time voluntary lump sum within a specified window. Approximately 50% of the eligible participants elected to receive their benefits and as a result the pension plan trust paid $826 million in lump sum payments to these participants in fiscal 2015. As a result of the lump sum program, HP recognized a settlement expense of approximately $96 million and a remeasurement of the U.S. HP Pension Plan was required. The remeasurement also resulted in an additional net periodic benefit cost of $45 million for fiscal 2015 which was recognized in the Consolidated Statements of Earnings along with the settlement expense.
During fiscal 2015, certain events, primarily the Separation and settlement as a result of the lump sum program, required multiple pension plans to be remeasured during the year. Thus, the assumptions used to calculate the net benefit (credit) cost for the remaining portion of the fiscal year after remeasurement were re-determined based on then current market conditions.
The weighted-average assumptions used to calculate net benefit (credit) cost were as follows:
| | For the fiscal years ended October 31 | For the fiscal years ended October 31 | ||||||||||||||||||||||||||||||||||||||||||||||||||||||
|---|---|---|---|---|---|---|---|---|---|---|---|---|---|---|---|---|---|---|---|---|---|---|---|---|---|---|---|---|---|---|---|---|---|---|---|---|---|---|---|---|---|---|---|---|---|---|---|---|---|---|---|---|---|---|---|---|
| | 2014 | 2013 | 2012 | 2014 | 2013 | 2012 | 2014 | 2013 | 2012 | 2015 | 2014 | 2013 | 2015 | 2014 | 2013 | 2015 | 2014 | 2013 | ||||||||||||||||||||||||||||||||||||||
| | U.S. Defined Benefit Plans | Non-U.S. Defined Benefit Plans | Post-Retirement Benefit Plans | U.S. Defined Benefit Plans | Non-U.S. Defined Benefit Plans | Post-Retirement Benefit Plans | ||||||||||||||||||||||||||||||||||||||||||||||||||
Discount rate | 4.9 | % | 4.1 | % | 4.8 | % | 3.9 | % | 3.8 | % | 4.5 | % | 3.9 | % | 3.0 | % | 4.4 | % | 4.4 | % | 4.9 | % | 4.1 | % | 3.0 | % | 3.9 | % | 3.8 | % | 3.6 | % | 3.9 | % | 3.0 | % | ||||||||||||||||||||
Expected increase in compensation levels | 2.0 | % | 2.0 | % | 2.0 | % | 2.4 | % | 2.4 | % | 2.5 | % | — | — | — | 2.0 | % | 2.0 | % | 2.0 | % | 2.4 | % | 2.4 | % | 2.4 | % | — | — | — | ||||||||||||||||||||||||||
Expected long-term return on plan assets | 7.7 | % | 7.8 | % | 7.6 | % | 7.0 | % | 7.2 | % | 6.4 | % | 8.9 | % | 9.0 | % | 10.0 | % | 7.2 | % | 7.7 | % | 7.8 | % | 6.9 | % | 7.0 | % | 7.2 | % | 9.0 | % | 8.9 | % | 9.0 | % | ||||||||||||||||||||
HEWLETT-PACKARD COMPANYHP INC. AND SUBSIDIARIES
Notes to Consolidated Financial Statements (Continued)
Note 4: Retirement and Post-Retirement Benefit Plans (Continued)
Funded Status
The funded status of the defined benefit and post-retirement benefit plans was as follows:
| | As of October 31 | As of October 31 | ||||||||||||||||||||||||||||||||||||
|---|---|---|---|---|---|---|---|---|---|---|---|---|---|---|---|---|---|---|---|---|---|---|---|---|---|---|---|---|---|---|---|---|---|---|---|---|---|---|
| | 2014 | 2013 | 2014 | 2013 | 2014 | 2013 | 2015 | 2014 | 2015 | 2014 | 2015 | 2014 | ||||||||||||||||||||||||||
| | U.S. Defined Benefit Plans | Non-U.S. Defined Benefit Plans | Post-Retirement Benefit Plans | U.S. Defined Benefit Plans | Non-U.S. Defined Benefit Plans | Post-Retirement Benefit Plans | ||||||||||||||||||||||||||||||||
| | In millions | In millions | ||||||||||||||||||||||||||||||||||||
Change in fair value of plan assets: | ||||||||||||||||||||||||||||||||||||||
Fair value—beginning of year | $ | 10,866 | $ | 11,536 | $ | 16,083 | $ | 14,021 | $ | 396 | $ | 395 | $ | 11,979 | $ | 10,866 | $ | 17,570 | $ | 16,083 | $ | 458 | $ | 396 | ||||||||||||||
Acquisition/addition of plans | — | — | 8 | 7 | — | — | (1 | ) | — | 5 | 8 | — | — | |||||||||||||||||||||||||
Actual return on plan assets | 1,648 | 629 | 1,814 | 1,842 | 83 | 32 | 506 | 1,648 | 1,059 | 1,814 | 45 | 83 | ||||||||||||||||||||||||||
Employer contributions | 27 | 54 | 1,019 | 634 | 92 | 102 | 29 | 27 | 619 | 1,019 | 39 | 92 | ||||||||||||||||||||||||||
Participant contributions | — | — | 64 | 63 | 54 | 72 | — | — | 55 | 64 | 57 | 54 | ||||||||||||||||||||||||||
Benefits paid | (558 | ) | (1,320 | ) | (568 | ) | (504 | ) | (167 | ) | (205 | ) | (322 | ) | (558 | ) | (570 | ) | (568 | ) | (125 | ) | (167 | ) | ||||||||||||||
Settlement | (4 | ) | (33 | ) | (49 | ) | (96 | ) | — | — | (1,114 | ) | (4 | ) | (17 | ) | (49 | ) | — | — | ||||||||||||||||||
Currency impact | — | — | (801 | ) | 116 | — | — | — | — | (1,244 | ) | (801 | ) | — | — | |||||||||||||||||||||||
| | | | | | | | | | | | | | | | | | | | | | | | | | | | | | | | | | ||||||
Fair value—end of year | 11,979 | 10,866 | 17,570 | 16,083 | 458 | 396 | 11,077 | 11,979 | 17,477 | 17,570 | 474 | 458 | ||||||||||||||||||||||||||
| | | | | | | | | | | | | | | | | | | | | | | | | | | | | | | | | | ||||||
Change in benefit obligation: | ||||||||||||||||||||||||||||||||||||||
Projected benefit obligation—beginning of year | 11,866 | 14,237 | 19,152 | 18,097 | 867 | 1,056 | 13,756 | 11,866 | 21,220 | 19,152 | 840 | 867 | ||||||||||||||||||||||||||
Acquisition/addition of plans | — | — | 10 | 14 | — | — | (1 | ) | — | 1 | 10 | — | — | |||||||||||||||||||||||||
Service cost | 1 | 1 | 308 | 337 | 5 | 6 | 1 | 1 | 326 | 308 | 5 | 5 | ||||||||||||||||||||||||||
Interest cost | 569 | 560 | 737 | 676 | 32 | 31 | 566 | 569 | 622 | 737 | 29 | 32 | ||||||||||||||||||||||||||
Participant contributions | — | — | 64 | 63 | 54 | 72 | — | — | 55 | 64 | 57 | 54 | ||||||||||||||||||||||||||
Actuarial loss (gain) | 1,882 | (1,579 | ) | 2,500 | 343 | 22 | (85 | ) | ||||||||||||||||||||||||||||||
Actuarial (gain) loss | (170 | ) | 1,882 | 457 | 2,500 | (59 | ) | 22 | ||||||||||||||||||||||||||||||
Benefits paid | (558 | ) | (1,320 | ) | (568 | ) | (504 | ) | (167 | ) | (205 | ) | (322 | ) | (558 | ) | (570 | ) | (568 | ) | (126 | ) | (167 | ) | ||||||||||||||
Plan amendments | — | — | — | 6 | — | — | — | — | (89 | ) | — | — | — | |||||||||||||||||||||||||
Curtailment | — | — | (49 | ) | 13 | — | — | — | — | — | (49 | ) | — | — | ||||||||||||||||||||||||
Settlement | (4 | ) | (33 | ) | (49 | ) | (100 | ) | — | — | (1,114 | ) | (4 | ) | (17 | ) | (49 | ) | — | — | ||||||||||||||||||
Special termination benefits | — | — | 50 | 31 | 32 | (5 | ) | — | — | 25 | 50 | 1 | 32 | |||||||||||||||||||||||||
Currency impact | — | — | (935 | ) | 176 | (5 | ) | (3 | ) | — | — | (1,509 | ) | (935 | ) | (10 | ) | (5 | ) | |||||||||||||||||||
| | | | | | | | | | | | | | | | | | | | | | | | | | | | | | | | | | ||||||
Projected benefit obligation—end of year | 13,756 | 11,866 | 21,220 | 19,152 | 840 | 867 | 12,716 | 13,756 | 20,521 | 21,220 | 737 | 840 | ||||||||||||||||||||||||||
| | | | | | | | | | | | | | | | | | | | | | | | | | | | | | | | | | ||||||
Funded status at end of year | $ | (1,777 | ) | $ | (1,000 | ) | $ | (3,650 | ) | $ | (3,069 | ) | $ | (382 | ) | $ | (471 | ) | $ | (1,639 | ) | $ | (1,777 | ) | $ | (3,044 | ) | $ | (3,650 | ) | $ | (263 | ) | $ | (382 | ) | ||
| | | | | | | | | | | | | | | | | | | | | | | | | | | | | | | | | | | |||||
| | | | | | | | | | | | | | | | | | | | | |||||||||||||||||||
Accumulated benefit obligation | $ | 13,755 | $ | 11,865 | $ | 20,207 | $ | 18,254 | $ | 12,715 | $ | 13,755 | $ | 19,695 | $ | 20,207 | ||||||||||||||||||||||
HEWLETT-PACKARD COMPANYHP INC. AND SUBSIDIARIES
Notes to Consolidated Financial Statements (Continued)
Note 4: Retirement and Post-Retirement Benefit Plans (Continued)
The weighted-average assumptions used to calculate the projected benefit obligations were as follows:
| | For the fiscal years ended October 31 | For the fiscal years ended October 31 | ||||||||||||||||||||||||||||||||||||
|---|---|---|---|---|---|---|---|---|---|---|---|---|---|---|---|---|---|---|---|---|---|---|---|---|---|---|---|---|---|---|---|---|---|---|---|---|---|---|
| | 2014 | 2013 | 2014 | 2013 | 2014 | 2013 | 2015 | 2014 | 2015 | 2014 | 2015 | 2014 | ||||||||||||||||||||||||||
| | U.S. Defined Benefit Plans | Non-U.S. Defined Benefit Plans | Post-Retirement Benefit Plans | U.S. Defined Benefit Plans | Non-U.S. Defined Benefit Plans | Post-Retirement Benefit Plans | ||||||||||||||||||||||||||||||||
Discount rate | 4.4 | % | 4.9 | % | 3.2 | % | 3.9 | % | 3.6 | % | 3.9 | % | 4.4 | % | 4.4 | % | 3.0 | % | 3.2 | % | 3.8 | % | 3.6 | % | ||||||||||||||
Expected increase in compensation levels | 2.0 | % | 2.0 | % | 2.5 | % | 2.4 | % | — | — | 2.0 | % | 2.0 | % | 2.5 | % | 2.5 | % | — | — | ||||||||||||||||||
For the U.S. defined benefit plan,plans, HP adopted a new mortality rate table in fiscal 2014 to better reflect expected lifetimes of its U.S. plan participants. The table used is based on a historical demographic study of the plans and increased the projected benefit obligation by approximately $870 million.million for the year ended October 31, 2014. The increase in the projected benefit obligation in fiscal 2014 was recognized as a part of the net actuarial loss as included in the other comprehensive loss which will beis being amortized over the remaining estimated life of plan participants (approximately 26.5 years).participants.
The net amounts recognized for HP's defined benefit and post-retirement benefit plans in HP's Consolidated Balance Sheets were as follows:
| | As of October 31 | As of October 31 | ||||||||||||||||||||||||||||||||||||
|---|---|---|---|---|---|---|---|---|---|---|---|---|---|---|---|---|---|---|---|---|---|---|---|---|---|---|---|---|---|---|---|---|---|---|---|---|---|---|
| | 2014 | 2013 | 2014 | 2013 | 2014 | 2013 | 2015 | 2014 | 2015 | 2014 | 2015 | 2014 | ||||||||||||||||||||||||||
| | U.S. Defined Benefit Plans | Non-U.S. Defined Benefit Plans | Post-Retirement Benefit Plans | U.S. Defined Benefit Plans | Non-U.S. Defined Benefit Plans | Post-Retirement Benefit Plans | ||||||||||||||||||||||||||||||||
| | In millions | In millions | ||||||||||||||||||||||||||||||||||||
Noncurrent assets | $ | — | $ | — | $ | 421 | $ | 479 | $ | — | $ | — | $ | — | $ | — | $ | 532 | $ | 421 | $ | — | $ | — | ||||||||||||||
Current liabilities | (35 | ) | (33 | ) | (43 | ) | (46 | ) | (47 | ) | (109 | ) | (37 | ) | (35 | ) | (42 | ) | (43 | ) | (46 | ) | (47 | ) | ||||||||||||||
Noncurrent liabilities | (1,742 | ) | (967 | ) | (4,028 | ) | (3,502 | ) | (335 | ) | (362 | ) | (1,602 | ) | (1,742 | ) | (3,534 | ) | (4,028 | ) | (217 | ) | (335 | ) | ||||||||||||||
| | | | | | | | | | | | | | | | | | | | | | | | | | | | | | | | | | ||||||
Funded status at end of year | $ | (1,777 | ) | $ | (1,000 | ) | $ | (3,650 | ) | $ | (3,069 | ) | (382 | ) | $ | (471 | ) | $ | (1,639 | ) | $ | (1,777 | ) | $ | (3,044 | ) | $ | (3,650 | ) | $ | (263 | ) | $ | (382 | ) | |||
| | | | | | | | | | | | | | | | | | | | | | | | | | | | | | | | | | | |||||
| | | | | | | | | | | | | | | | | | | | | |||||||||||||||||||
The following table summarizes the pretax net actuarial loss (gain) and prior service benefit recognized in accumulatedAccumulated other comprehensive loss for the defined benefit and post-retirement benefit plans:
| | For the fiscal year ended October 31, 2014 | As of October 31, 2015 | ||||||||||||||||||
|---|---|---|---|---|---|---|---|---|---|---|---|---|---|---|---|---|---|---|---|---|
| | U.S. Defined Benefit Plans | Non-U.S. Defined Benefit Plans | Post-Retirement Benefit Plans | U.S. Defined Benefit Plans | Non-U.S. Defined Benefit Plans | Post-Retirement Benefit Plans | ||||||||||||||
| | In millions | In millions | ||||||||||||||||||
Net actuarial loss (gain) | $ | 1,405 | $ | 5,423 | $ | (115 | ) | $ | 1,379 | $ | 5,161 | $ | (173 | ) | ||||||
Prior service benefit | — | (186 | ) | (119 | ) | — | (242 | ) | (99 | ) | ||||||||||
| | | | | | | | | | | | | | | | | | | |||
Total recognized in accumulated other comprehensive loss | $ | 1,405 | $ | 5,237 | $ | (234 | ) | |||||||||||||
Total recognized in Accumulated other comprehensive loss | $ | 1,379 | $ | 4,919 | $ | (272 | ) | |||||||||||||
| | | | | | | | | | | | | | | | | | | | ||
| | | | | | | | | | | | ||||||||||
HEWLETT-PACKARD COMPANYHP INC. AND SUBSIDIARIES
Notes to Consolidated Financial Statements (Continued)
Note 4: Retirement and Post-Retirement Benefit Plans (Continued)
The following table summarizes the net actuarial loss (gain) and prior service benefit that are expected to be amortized from accumulated other comprehensive loss (income) and recognized as components of HP Inc.'s net periodic benefit (credit) cost (credit) during the next fiscal year.
| | U.S. Defined Benefit Plans | Non-U.S. Defined Benefit Plans | Post-Retirement Benefit Plans | U.S. Defined Benefit Plans | Non-U.S. Defined Benefit Plans | Post-Retirement Benefit Plans | ||||||||||||||
|---|---|---|---|---|---|---|---|---|---|---|---|---|---|---|---|---|---|---|---|---|
| | In millions | In millions | ||||||||||||||||||
Net actuarial loss (gain) | $ | 54 | $ | 452 | $ | (10 | ) | $ | 55 | $ | 25 | $ | (12 | ) | ||||||
Prior service benefit | — | (22 | ) | (20 | ) | — | (3 | ) | (17 | ) | ||||||||||
| | | | | | | | | | | | | | | | | | | |||
Total expected to be recognized in net periodic benefit cost (credit) | $ | 54 | $ | 430 | $ | (30 | ) | |||||||||||||
Total expected to be recognized in net periodic benefit (credit) cost | $ | 55 | $ | 22 | $ | (29 | ) | |||||||||||||
| | | | | | | | | | | | | | | | | | | | ||
| | | | | | | | | | | | ||||||||||
Defined benefit plans with projected benefit obligations exceeding the fair value of plan assets were as follows:
| | As of October 31 | As of October 31 | ||||||||||||||||||||||||
|---|---|---|---|---|---|---|---|---|---|---|---|---|---|---|---|---|---|---|---|---|---|---|---|---|---|---|
| | 2014 | 2013 | 2014 | 2013 | 2015 | 2014 | 2015 | 2014 | ||||||||||||||||||
| | U.S. Defined Benefit Plans | Non-U.S. Defined Benefit Plans | U.S. Defined Benefit Plans | Non-U.S. Defined Benefit Plans | ||||||||||||||||||||||
| | In millions | In millions | ||||||||||||||||||||||||
Aggregate fair value of plan assets | $ | 11,979 | $ | 10,866 | $ | 12,701 | $ | 10,462 | $ | 11,077 | $ | 11,979 | $ | 8,928 | $ | 12,701 | ||||||||||
Aggregate projected benefit obligation | $ | 13,756 | $ | 11,866 | $ | 16,774 | $ | 14,010 | $ | 12,716 | $ | 13,756 | $ | 12,504 | $ | 16,774 | ||||||||||
Defined benefit plans with accumulated benefit obligations exceeding the fair value of plan assets were as follows:
| | As of October 31 | As of October 31 | ||||||||||||||||||||||||
|---|---|---|---|---|---|---|---|---|---|---|---|---|---|---|---|---|---|---|---|---|---|---|---|---|---|---|
| | 2014 | 2013 | 2014 | 2013 | 2015 | 2014 | 2015 | 2014 | ||||||||||||||||||
| | U.S. Defined Benefit Plans | Non-U.S. Defined Benefit Plans | U.S. Defined Benefit Plans | Non-U.S. Defined Benefit Plans | ||||||||||||||||||||||
| | In millions | In millions | ||||||||||||||||||||||||
Aggregate fair value of plan assets | $ | 11,979 | $ | 10,866 | $ | 12,578 | $ | 9,926 | $ | 11,077 | $ | 11,979 | $ | 8,858 | $ | 12,578 | ||||||||||
Aggregate accumulated benefit obligation | $ | 13,755 | $ | 11,865 | $ | 15,797 | $ | 12,703 | $ | 12,715 | $ | 13,755 | $ | 11,804 | $ | 15,797 | ||||||||||
Retirement Incentive Program
As part of the 2012 restructuring plan, the company announced a voluntary enhanced early retirement program for its U.S employees. Participation in the EER program was limited to those employees whose combined age and years of service equaled 65 or more. Approximately 8,500 employees elected to participate in the EER program and left the company on dates designated by the company, with the majority of the EER participants having left the company on August 31, 2012 and others exiting through August 31, 2013. The HP Pension Plan was amended to provide for an EER benefit from the plan for electing EER participants who were current participants in the plan. The retirement incentive benefit was calculated as a lump sum and ranged between five and fourteen months of pay depending on years of service at the time of retirement under the program. As a result of this retirement incentive, HP recognized a special termination benefit ("STB") of $833 million, which reflected the present value of all additional benefits that HP would distribute from the HP Pension Plan. HP recorded these expenses as a restructuring charge. In addition, the HP Pension Plan was remeasured on June 30, 2012, which resulted in no material change to the 2012 net periodic benefit cost or funded status.
HEWLETT-PACKARD COMPANYHP INC. AND SUBSIDIARIES
Notes to Consolidated Financial Statements (Continued)
Note 4: Retirement and Post-Retirement Benefit Plans (Continued)
HP extended to all employees participating in the EER program the opportunity to continue health care coverage at active employee contribution rates for up to 24 months following retirement. In addition, for employees not grandfathered into certain employer-subsidized retiree medical plans, HP provided up to $12,000 in employer credits under the RMSA. These items resulted in an additional special termination benefit STB expense of $227 million, which was offset by net curtailment gains of $37 million, due primarily to the resulting accelerated recognition of the existing prior service benefit. The entire STB and approximately $30 million in curtailment gains were recognized in fiscal 2012. HP reported this net expense as a restructuring charge in the Consolidated Statements of Earnings.
Fair Value of Plan Assets
The table below sets forth the fair value of plan assets by asset category within the fair value hierarchy.hierarchy as of October 31, 2015.
| | As of October 31, 2014 | As of October 31, 2015 | ||||||||||||||||||||||||||||||||||||||||||||||||||||||||||||||||||||||||
|---|---|---|---|---|---|---|---|---|---|---|---|---|---|---|---|---|---|---|---|---|---|---|---|---|---|---|---|---|---|---|---|---|---|---|---|---|---|---|---|---|---|---|---|---|---|---|---|---|---|---|---|---|---|---|---|---|---|---|---|---|---|---|---|---|---|---|---|---|---|---|---|---|---|---|
| | U.S. Defined Benefit Plans | Non-U.S. Defined Benefit Plans | Post-Retirement Benefit Plans | U.S. Defined Benefit Plans | Non-U.S. Defined Benefit Plans | Post-Retirement Benefit Plans | ||||||||||||||||||||||||||||||||||||||||||||||||||||||||||||||||||||
| | Level 1 | Level 2 | Level 3 | Total | Level 1 | Level 2 | Level 3 | Total | Level 1 | Level 2 | Level 3 | Total | Level 1 | Level 2 | Level 3 | Total | Level 1 | Level 2 | Level 3 | Total | Level 1 | Level 2 | Level 3 | Total | ||||||||||||||||||||||||||||||||||||||||||||||||||
| | In millions | In millions | ||||||||||||||||||||||||||||||||||||||||||||||||||||||||||||||||||||||||
Asset Category: | ||||||||||||||||||||||||||||||||||||||||||||||||||||||||||||||||||||||||||
Equity securities | ||||||||||||||||||||||||||||||||||||||||||||||||||||||||||||||||||||||||||
U.S. | $ | 1,787 | $ | — | $ | — | $ | 1,787 | $ | 2,935 | $ | 30 | $ | — | $ | 2,965 | $ | — | $ | — | $ | — | $ | — | $ | 1,833 | $ | 47 | $ | — | $ | 1,880 | $ | 2,851 | $ | 76 | $ | — | $ | 2,927 | $ | — | $ | 1 | $ | — | $ | 1 | ||||||||||||||||||||||||||
Non-U.S. | 1,268 | — | — | 1,268 | 4,050 | 742 | 80 | 4,872 | — | — | — | — | 1,322 | 13 | — | 1,335 | 4,085 | 494 | 83 | 4,662 | — | — | — | — | ||||||||||||||||||||||||||||||||||||||||||||||||||
Debt securities | ||||||||||||||||||||||||||||||||||||||||||||||||||||||||||||||||||||||||||
Corporate | — | 3,283 | 7 | 3,290 | — | 2,935 | — | 2,935 | — | 20 | — | 20 | — | 3,238 | 31 | 3,269 | — | 3,352 | — | 3,352 | — | 28 | — | 28 | ||||||||||||||||||||||||||||||||||||||||||||||||||
Government(1) | — | 2,204 | — | 2,204 | — | 1,787 | — | 1,787 | — | 22 | — | 22 | — | 1,756 | — | 1,756 | — | 1,534 | — | 1,534 | — | 39 | — | 39 | ||||||||||||||||||||||||||||||||||||||||||||||||||
Alternative Investments | ||||||||||||||||||||||||||||||||||||||||||||||||||||||||||||||||||||||||||
Private Equity(2) | — | — | 1,284 | 1,284 | — | 2 | 51 | 53 | — | — | 271 | 271 | — | — | 1,170 | 1,170 | — | 1 | 70 | 71 | — | — | 253 | 253 | ||||||||||||||||||||||||||||||||||||||||||||||||||
Hybrids(3) | — | — | 3 | 3 | 114 | 2,466 | 43 | 2,623 | — | — | 1 | 1 | — | — | — | — | — | 2,670 | 30 | 2,700 | — | — | — | — | ||||||||||||||||||||||||||||||||||||||||||||||||||
Hedge Funds(4) | — | 346 | 263 | 609 | — | 103 | 285 | 388 | — | — | — | — | — | 388 | 260 | 648 | 28 | 125 | 250 | 403 | — | — | — | — | ||||||||||||||||||||||||||||||||||||||||||||||||||
Real Estate Funds | — | — | — | — | 220 | 277 | 543 | 1,040 | — | — | — | — | — | — | — | — | 464 | 49 | 571 | 1,084 | — | — | — | — | ||||||||||||||||||||||||||||||||||||||||||||||||||
Insurance Group Annuity Contracts | — | — | — | — | — | 44 | 79 | 123 | — | — | — | — | — | — | — | — | — | 46 | 73 | 119 | — | — | — | — | ||||||||||||||||||||||||||||||||||||||||||||||||||
Common Collective Trusts and 103-12 Investment Entities(5) | — | 854 | — | 854 | — | — | — | — | — | 55 | — | 55 | — | 756 | — | 756 | — | 7 | — | 7 | — | 59 | — | 59 | ||||||||||||||||||||||||||||||||||||||||||||||||||
Registered Investment Companies(6) | 68 | 314 | — | 382 | — | — | — | — | 86 | 1 | — | 87 | 38 | 176 | — | 214 | — | 1 | — | 1 | 92 | 3 | — | 95 | ||||||||||||||||||||||||||||||||||||||||||||||||||
Cash and Cash Equivalents(7) | 161 | 66 | — | 227 | 573 | — | — | 573 | — | 6 | — | 6 | 38 | 203 | — | 241 | 493 | — | — | 493 | 4 | 3 | — | 7 | ||||||||||||||||||||||||||||||||||||||||||||||||||
Other(8) | (24 | ) | 95 | — | 71 | 79 | 130 | 2 | 211 | (4 | ) | — | — | (4 | ) | (224 | ) | 32 | — | (192 | ) | 68 | 14 | 42 | 124 | (8 | ) | — | — | (8 | ) | |||||||||||||||||||||||||||||||||||||||||||
| | | | | | | | | | | | | | | | | | | | | | | | | | | | | | | | | | | | | | | | | | | | | | | | | | | | | | | | | | | | | | | | ||||||||||||
Total | $ | 3,260 | $ | 7,162 | $ | 1,557 | $ | 11,979 | $ | 7,971 | $ | 8,516 | $ | 1,083 | $ | 17,570 | $ | 82 | $ | 104 | $ | 272 | $ | 458 | $ | 3,007 | $ | 6,609 | $ | 1,461 | $ | 11,077 | $ | 7,989 | $ | 8,369 | $ | 1,119 | $ | 17,477 | $ | 88 | $ | 133 | $ | 253 | $ | 474 | ||||||||||||||||||||||||||
| | | | | | | | | | | | | | | | | | | | | | | | | | | | | | | | | | | | | | | | | | | | | | | | | | | | | | | | | | | | | | | | | |||||||||||
| | | | | | | | | | | | | | | | | | | | | | | | | | | | | | | | | | | | | | | |||||||||||||||||||||||||||||||||||||
HEWLETT-PACKARD COMPANYHP INC. AND SUBSIDIARIES
Notes to Consolidated Financial Statements (Continued)
Note 4: Retirement and Post-Retirement Benefit Plans (Continued)
Changes in fair value measurements of Level 3 investments for the fiscal year ended October 31, 2015 were as follows:
| | For the fiscal year ended October 31, 2014 | For the fiscal year ended October 31, 2015 | ||||||||||||||||||||||||||||||||||||||||||||||||||||||||||||||||||||||||||||||||||||||||||||||||
|---|---|---|---|---|---|---|---|---|---|---|---|---|---|---|---|---|---|---|---|---|---|---|---|---|---|---|---|---|---|---|---|---|---|---|---|---|---|---|---|---|---|---|---|---|---|---|---|---|---|---|---|---|---|---|---|---|---|---|---|---|---|---|---|---|---|---|---|---|---|---|---|---|---|---|---|---|---|---|---|---|---|---|---|---|---|---|---|---|---|---|---|---|---|---|---|---|---|---|
| | U.S. Defined Benefit Plans | Non-U.S. Defined Benefit Plans | Post-Retirement Benefit Plans | U.S. Defined Benefit Plans | Non-U.S. Defined Benefit Plans | Post-Retirement Benefit Plans | ||||||||||||||||||||||||||||||||||||||||||||||||||||||||||||||||||||||||||||||||||||||||||||
| | Debt Securities | Alternative Investments | | Equity | Alternative Investments | | | | | Alternative Investments | | Debt Securities | Alternative Investments | | Equity | Alternative Investments | | | | | Alternative Investments | | ||||||||||||||||||||||||||||||||||||||||||||||||||||||||||||||||||||||||||||
| | Corporate Debt | Private Equity | Hybrids | Hedge Funds | Total | Non U.S. Equities | Private Equity | Hedge Funds | Hybrids | Real Estate | Insurance Group Annuities | Other | Total | Private Equity | Hybrids | Total | Corporate Debt | Private Equity | Hybrids | Hedge Funds | Total | Non U.S. Equities | Private Equity | Hybrids | Hedge Funds | Real Estate | Insurance Group Annuities | Other | Total | Private Equity | Hybrids | Total | ||||||||||||||||||||||||||||||||||||||||||||||||||||||||||||||||||
| | In millions | In millions | ||||||||||||||||||||||||||||||||||||||||||||||||||||||||||||||||||||||||||||||||||||||||||||||||
Beginning balance at October 31, 2013 | $ | — | $ | 1,250 | $ | 2 | $ | 113 | $ | 1,365 | $ | 77 | $ | 48 | $ | 204 | $ | — | $ | 325 | $ | 81 | $ | 2 | $ | 737 | $ | 234 | $ | 1 | $ | 235 | ||||||||||||||||||||||||||||||||||||||||||||||||||||||||||||||||||
Beginning balance at October 31, 2014 | $ | 7 | $ | 1,284 | $ | 3 | $ | 263 | $ | 1,557 | $ | 80 | $ | 51 | $ | 43 | $ | 285 | $ | 543 | $ | 79 | $ | 2 | $ | 1,083 | $ | 271 | $ | 1 | $ | 272 | ||||||||||||||||||||||||||||||||||||||||||||||||||||||||||||||||||
Actual return on plan assets: | ||||||||||||||||||||||||||||||||||||||||||||||||||||||||||||||||||||||||||||||||||||||||||||||||||
Relating to assets still held at the reporting date | — | 92 | 1 | 10 | 103 | 3 | 2 | 14 | — | 46 | (8 | ) | — | 57 | 51 | — | 51 | — | (25 | ) | — | (3 | ) | (28 | ) | (18 | ) | (1 | ) | — | — | 13 | (6 | ) | 3 | (9 | ) | (2 | ) | — | (2 | ) | ||||||||||||||||||||||||||||||||||||||||||||||||||||||||
Relating to assets sold during the period | — | 169 | — | — | 169 | — | 2 | (1 | ) | — | — | — | — | 1 | 21 | — | 21 | — | 145 | (1 | ) | — | 144 | — | 7 | (22 | ) | — | — | — | — | (15 | ) | 46 | — | 46 | ||||||||||||||||||||||||||||||||||||||||||||||||||||||||||||||
Purchases, sales, and settlements (net) | 7 | (227 | ) | — | 140 | (80 | ) | — | (1 | ) | 68 | 43 | 108 | (2 | ) | — | 216 | (35 | ) | — | (35 | ) | 24 | (234 | ) | (2 | ) | — | (212 | ) | — | 13 | — | 48 | 14 | (2 | ) | — | 73 | (62 | ) | (1 | ) | (63 | ) | |||||||||||||||||||||||||||||||||||||||||||||||||||||
Transfers in and/or out of Level 3 | — | — | — | — | — | — | — | — | — | 64 | 8 | — | 72 | — | — | — | — | — | — | — | — | 21 | — | 9 | (83 | ) | 1 | 2 | 37 | (13 | ) | — | — | — | ||||||||||||||||||||||||||||||||||||||||||||||||||||||||||||||||
| | | | | | | | | | | | | | | | | | | | | | | | | | | | | | | | | | | | | | | | | | | | | | | | | | | | | | | | | | | | | | | | | | | | | | | | | | | | | | | | | | | | ||||||||||||||||
Ending balance at October 31, 2014 | $ | 7 | $ | 1,284 | $ | 3 | $ | 263 | $ | 1,557 | $ | 80 | $ | 51 | $ | 285 | $ | 43 | $ | 543 | $ | 79 | $ | 2 | $ | 1,083 | $ | 271 | $ | 1 | $ | 272 | ||||||||||||||||||||||||||||||||||||||||||||||||||||||||||||||||||
| �� | ||||||||||||||||||||||||||||||||||||||||||||||||||||||||||||||||||||||||||||||||||||||||||||||||||
Ending balance at October 31, 2015 | $ | 31 | $ | 1,170 | $ | — | $ | 260 | $ | 1,461 | $ | 83 | $ | 70 | $ | 30 | $ | 250 | $ | 571 | $ | 73 | $ | 42 | $ | 1,119 | $ | 253 | $ | — | $ | 253 | ||||||||||||||||||||||||||||||||||||||||||||||||||||||||||||||||||
| | | | | | | | | | | | | | | | | | | | | | | | | | | | | | | | | | | | | | | | | | | | | | | | | | | | | | | | | | | | | | | | | | | | | | | | | | | | | | | | | | | | | |||||||||||||||
| | | | | | | | | | | | | | | | | | | | | | | | | | | | | | | | | | | | | | | | | | | | | | | | | | | |||||||||||||||||||||||||||||||||||||||||||||||||
The table below sets forth the fair value of plan assets by asset category within the fair value hierarchy.hierarchy as of October 31, 2014.
| | As of October 31, 2013 | As of October 31, 2014 | ||||||||||||||||||||||||||||||||||||||||||||||||||||||||||||||||||||||||
|---|---|---|---|---|---|---|---|---|---|---|---|---|---|---|---|---|---|---|---|---|---|---|---|---|---|---|---|---|---|---|---|---|---|---|---|---|---|---|---|---|---|---|---|---|---|---|---|---|---|---|---|---|---|---|---|---|---|---|---|---|---|---|---|---|---|---|---|---|---|---|---|---|---|---|
| | U.S. Defined Benefit Plans | Non-U.S. Defined Benefit Plans | Post-Retirement Benefit Plans | U.S. Defined Benefit Plans | Non-U.S. Defined Benefit Plans | Post-Retirement Benefit Plans | ||||||||||||||||||||||||||||||||||||||||||||||||||||||||||||||||||||
| | Level 1 | Level 2 | Level 3 | Total | Level 1 | Level 2 | Level 3 | Total | Level 1 | Level 2 | Level 3 | Total | Level 1 | Level 2 | Level 3 | Total | Level 1 | Level 2 | Level 3 | Total | Level 1 | Level 2 | Level 3 | Total | ||||||||||||||||||||||||||||||||||||||||||||||||||
| | In millions | In millions | ||||||||||||||||||||||||||||||||||||||||||||||||||||||||||||||||||||||||
Asset Category: | ||||||||||||||||||||||||||||||||||||||||||||||||||||||||||||||||||||||||||
Equity securities | ||||||||||||||||||||||||||||||||||||||||||||||||||||||||||||||||||||||||||
U.S. | $ | 1,711 | $ | — | $ | — | $ | 1,711 | $ | 2,456 | $ | 31 | $ | — | $ | 2,487 | $ | — | $ | — | $ | — | $ | — | $ | 1,787 | $ | — | $ | — | $ | 1,787 | $ | 2,935 | $ | 30 | $ | — | $ | 2,965 | $ | — | $ | — | $ | — | $ | — | ||||||||||||||||||||||||||
Non-U.S. | 1,274 | — | — | 1,274 | 4,059 | 670 | 77 | 4,806 | — | — | — | — | 1,268 | — | — | 1,268 | 4,050 | 742 | 80 | 4,872 | — | — | — | — | ||||||||||||||||||||||||||||||||||||||||||||||||||
Debt securities | ||||||||||||||||||||||||||||||||||||||||||||||||||||||||||||||||||||||||||
Corporate | — | 3,028 | — | 3,028 | — | 3,347 | — | 3,347 | — | 17 | — | 17 | — | 3,283 | 7 | 3,290 | — | 2,935 | — | 2,935 | — | 20 | — | 20 | ||||||||||||||||||||||||||||||||||||||||||||||||||
Government(1) | — | 1,849 | — | 1,849 | — | 1,751 | — | 1,751 | 5 | 17 | — | 22 | — | 2,204 | — | 2,204 | — | 1,787 | — | 1,787 | — | 22 | — | 22 | ||||||||||||||||||||||||||||||||||||||||||||||||||
Alternative Investments | ||||||||||||||||||||||||||||||||||||||||||||||||||||||||||||||||||||||||||
Private Equity(2) | — | — | 1,250 | 1,250 | — | 2 | 48 | 50 | — | — | 234 | 234 | — | — | 1,284 | 1,284 | — | 2 | 51 | 53 | — | — | 271 | 271 | ||||||||||||||||||||||||||||||||||||||||||||||||||
Hybrids(3) | — | — | 2 | 2 | — | 1,223 | — | 1,223 | — | — | 1 | 1 | — | — | 3 | 3 | 114 | 2,466 | 43 | 2,623 | — | — | 1 | 1 | ||||||||||||||||||||||||||||||||||||||||||||||||||
Hedge Funds(4) | — | — | 113 | 113 | — | 226 | 204 | 430 | — | — | — | — | — | 346 | 263 | 609 | — | 103 | 285 | 388 | — | — | — | — | ||||||||||||||||||||||||||||||||||||||||||||||||||
Real Estate Funds | — | — | — | — | 470 | 237 | 325 | 1,032 | — | — | — | — | — | — | — | — | 220 | 277 | 543 | 1,040 | — | — | — | — | ||||||||||||||||||||||||||||||||||||||||||||||||||
Insurance Group Annuity Contracts | — | — | — | — | — | 50 | 81 | 131 | — | — | — | — | — | — | — | — | — | 44 | 79 | 123 | — | — | — | — | ||||||||||||||||||||||||||||||||||||||||||||||||||
Common Collective Trusts and 103-12 Investment Entities(5) | — | 1,233 | — | 1,233 | — | — | — | — | — | 42 | — | 42 | — | 854 | — | 854 | — | — | — | — | — | 55 | — | 55 | ||||||||||||||||||||||||||||||||||||||||||||||||||
Registered Investment Companies(6) | 61 | 329 | — | 390 | — | — | — | — | 79 | — | — | 79 | 68 | 314 | — | 382 | — | — | — | — | 86 | 1 | — | 87 | ||||||||||||||||||||||||||||||||||||||||||||||||||
Cash and Cash Equivalents(7) | 11 | 62 | — | 73 | 648 | 4 | — | 652 | — | 3 | — | 3 | 161 | 66 | — | 227 | 573 | — | — | 573 | — | 6 | — | 6 | ||||||||||||||||||||||||||||||||||||||||||||||||||
Other(8) | (37 | ) | (20 | ) | — | (57 | ) | 110 | 62 | 2 | 174 | (2 | ) | — | — | (2 | ) | (24 | ) | 95 | — | 71 | 79 | 130 | 2 | 211 | (4 | ) | — | — | (4 | ) | ||||||||||||||||||||||||||||||||||||||||||
| | | | | | | | | | | | | | | | | | | | | | | | | | | | | | | | | | | | | | | | | | | | | | | | | | | | | | | | | | | | | | | | ||||||||||||
Total | $ | 3,020 | $ | 6,481 | $ | 1,365 | $ | 10,866 | $ | 7,743 | $ | 7,603 | $ | 737 | $ | 16,083 | $ | 82 | $ | 79 | $ | 235 | $ | 396 | $ | 3,260 | $ | 7,162 | $ | 1,557 | $ | 11,979 | $ | 7,971 | $ | 8,516 | $ | 1,083 | $ | 17,570 | $ | 82 | $ | 104 | $ | 272 | $ | 458 | ||||||||||||||||||||||||||
| | | | | | | | | | | | | | | | | | | | | | | | | | | | | | | | | | | | | | | | | | | | | | | | | | | | | | | | | | | | | | | | | |||||||||||
| | | | | | | | | | | | | | | | | | | | | | | | | | | | | | | | | | | | | | | |||||||||||||||||||||||||||||||||||||
HEWLETT-PACKARD COMPANYHP INC. AND SUBSIDIARIES
Notes to Consolidated Financial Statements (Continued)
Note 4: Retirement and Post-Retirement Benefit Plans (Continued)
Changes in fair value measurements of Level 3 investments for the fiscal year ended October 31, 2014 were as follows:
| | For the fiscal year ended October 31, 2013 | For the fiscal year ended October 31, 2014 | |||||||||||||||||||||||||||||||||||||||||||||||||||||||||||||||||||||||||||||||||||||||||||||
|---|---|---|---|---|---|---|---|---|---|---|---|---|---|---|---|---|---|---|---|---|---|---|---|---|---|---|---|---|---|---|---|---|---|---|---|---|---|---|---|---|---|---|---|---|---|---|---|---|---|---|---|---|---|---|---|---|---|---|---|---|---|---|---|---|---|---|---|---|---|---|---|---|---|---|---|---|---|---|---|---|---|---|---|---|---|---|---|---|---|---|---|---|---|---|---|
| | U.S. Defined Benefit Plans | Non-U.S. Defined Benefit Plans | Post-Retirement Benefit Plans | U.S. Defined Benefit Plans | Non-U.S. Defined Benefit Plans | Post-Retirement Benefit Plans | |||||||||||||||||||||||||||||||||||||||||||||||||||||||||||||||||||||||||||||||||||||||||
| | Debt Securities | Alternative Investments | | Equity | Alternative Investments | | | | | Alternative Investments | | Debt Securities | Alternative Investments | | Equity | Alternative Investments | | | | | Alternative Investments | | |||||||||||||||||||||||||||||||||||||||||||||||||||||||||||||||||||||||||
| | Corporate Debt | Private Equity | Hybrids | Hedge Funds | Total | Non U.S. Equities | Private Equity | Hedge Funds | Real Estate | Insurance Group Annuities | Other | Total | Private Equity | Hybrids | Total | Corporate Debt | Private Equity | Hybrids | Hedge Funds | Total | Non U.S. Equities | Private Equity | Hybrids | Hedge Funds | Real Estate | Insurance Group Annuities | Other | Total | Private Equity | Hybrids | Total | ||||||||||||||||||||||||||||||||||||||||||||||||||||||||||||||||
| | In millions | In millions | |||||||||||||||||||||||||||||||||||||||||||||||||||||||||||||||||||||||||||||||||||||||||||||
Beginning balance at October 31, 2012 | $ | 1 | $ | 1,300 | $ | 2 | $ | 65 | $ | 1,368 | $ | 76 | $ | 21 | $ | 233 | $ | 194 | $ | 88 | $ | 2 | $ | 614 | $ | 235 | $ | 1 | $ | 236 | |||||||||||||||||||||||||||||||||||||||||||||||||||||||||||||||||
Beginning balance at October 31, 2013 | $ | — | $ | 1,250 | $ | 2 | $ | 113 | $ | 1,365 | $ | 77 | $ | 48 | $ | — | $ | 204 | $ | 325 | $ | 81 | $ | 2 | $ | 737 | $ | 234 | $ | 1 | $ | 235 | |||||||||||||||||||||||||||||||||||||||||||||||||||||||||||||||
Actual return on plan assets: | |||||||||||||||||||||||||||||||||||||||||||||||||||||||||||||||||||||||||||||||||||||||||||||||
Relating to assets still held at the reporting date | — | (9 | ) | — | 13 | 4 | 1 | 8 | — | 16 | (5 | ) | — | 20 | 5 | — | 5 | — | 92 | 1 | 10 | 103 | 3 | 2 | — | 14 | 46 | (8 | ) | — | 57 | 51 | — | 51 | |||||||||||||||||||||||||||||||||||||||||||||||||||||||||||||
Relating to assets sold during the period | — | 143 | — | — | 143 | — | — | 11 | — | — | — | 11 | 21 | — | 21 | — | 169 | — | — | 169 | — | 2 | — | (1 | ) | — | — | — | 1 | 21 | — | 21 | |||||||||||||||||||||||||||||||||||||||||||||||||||||||||||||||
Purchases, sales, and settlements (net) | — | (184 | ) | — | 35 | (149 | ) | — | 19 | (40 | ) | 115 | (2 | ) | — | 92 | (27 | ) | — | (27 | ) | 7 | (227 | ) | — | 140 | (80 | ) | — | (1 | ) | 43 | 68 | 108 | (2 | ) | — | 216 | (35 | ) | — | (35 | ) | ||||||||||||||||||||||||||||||||||||||||||||||||||||
Transfers in and/or out of Level 3 | (1 | ) | — | — | — | (1 | ) | — | — | — | — | — | — | — | — | — | — | — | — | — | — | — | — | — | — | — | 64 | 8 | — | 72 | — | — | — | ||||||||||||||||||||||||||||||||||||||||||||||||||||||||||||||
| | | | | | | | | | | | | | | | | | | | | | | | | | | | | | | | | | | | | | | | | | | | | | | | | | | | | | | | | | | | | | | | | | | | | | | | | | | | | | | | | | |||||||||||||||
Ending balance at October 31, 2013 | $ | — | $ | 1,250 | $ | 2 | $ | 113 | $ | 1,365 | $ | 77 | $ | 48 | $ | 204 | $ | 325 | $ | 81 | $ | 2 | $ | 737 | $ | 234 | $ | 1 | $ | 235 | |||||||||||||||||||||||||||||||||||||||||||||||||||||||||||||||||
Ending balance at October 31, 2014 | $ | 7 | $ | 1,284 | $ | 3 | $ | 263 | $ | 1,557 | $ | 80 | $ | 51 | $ | 43 | $ | 285 | $ | 543 | $ | 79 | $ | 2 | $ | 1,083 | $ | 271 | $ | 1 | $ | 272 | |||||||||||||||||||||||||||||||||||||||||||||||||||||||||||||||
| | | | | | | | | | | | | | | | | | | | | | | | | | | | | | | | | | | | | | | | | | | | | | | | | | | | | | | | | | | | | | | | | | | | | | | | | | | | | | | | | | | ||||||||||||||
| | | | | | | | | | | | | | | | | | | | | | | | | | | | | | | | | | | | | | | | | | | | | | | | | | | ||||||||||||||||||||||||||||||||||||||||||||||
The following is a description of the valuation methodologies used to measure plan assets at fair value. There have been no changes in the methodologies used during the reporting period.
Investments in publicly-traded equity securities are valued using the closing price on the measurement date as reported on the stock exchange on which the individual securities are traded. For corporate, government and asset-backed debt securities, fair value is based on observable inputs of comparable market transactions. For corporate and government debt securities traded on active exchanges, fair value is based on observable quoted prices. The valuation of alternative investments, such as limited partnerships and joint ventures, may require significant management judgment. For alternative investments, valuation is based on net asset value ("NAV") as reported by the Asset Manager and adjusted for cash flows, if necessary. In making such an assessment, a variety of factors
HP INC. AND SUBSIDIARIES
Notes to Consolidated Financial Statements (Continued)
Note 4: Retirement and Post-Retirement Benefit Plans (Continued)
are reviewed by management, including, but not limited to, the timeliness of NAV as reported by the asset manager and changes in general economic and market conditions subsequent to the last NAV reported by the asset manager. Depending on the amount of management judgment, the lack of near-term liquidity, and the absence of quoted market prices, these assets are classified in Level 2 or Level 3 of the fair value hierarchy. Further, depending on how quickly HP can redeem its hedge fund investments, and the extent of any adjustments to NAV, hedge funds are classified in either Level 2 or Level 3 of the fair value hierarchy. Common collective trusts, interests in 103-12 entities and registered investment companies are valued at NAV. The valuation for some of these assets requires judgment due
HEWLETT-PACKARD COMPANY AND SUBSIDIARIES
Notes to Consolidated Financial Statements (Continued)
Note 4: Retirement and Post-Retirement Benefit Plans (Continued)
to the absence of quoted market prices, and these assets are generally classified in Level 2 of the fair value hierarchy. Cash and cash equivalents includes money market funds, which are valued based on NAV. Other assets, including insurance group annuity contracts, were classified in the fair value hierarchy based on the lowest level input (e.g., quoted prices and observable inputs) that is significant to the fair value measure in its entirety.
Plan Asset Allocations
The weighted-average target and actual asset allocations across the benefit plans at the respective measurement dates were as follows:
| | U.S. Defined Benefit Plans | Non-U.S. Defined Benefit Plans | Post-Retirement Benefit Plans | U.S. Defined Benefit Plans | Non-U.S. Defined Benefit Plans | Post-Retirement Benefit Plans | ||||||||||||||||||||||||||||||||||||||||||||||||||
|---|---|---|---|---|---|---|---|---|---|---|---|---|---|---|---|---|---|---|---|---|---|---|---|---|---|---|---|---|---|---|---|---|---|---|---|---|---|---|---|---|---|---|---|---|---|---|---|---|---|---|---|---|---|---|---|---|
| | | Plan Assets | | Plan Assets | | Plan Assets | | Plan Assets | | Plan Assets | | Plan Assets | ||||||||||||||||||||||||||||||||||||||||||||
| | 2014 Target Allocation | 2014 Target Allocation | 2014 Target Allocation | 2015 Target Allocation | 2015 Target Allocation | 2015 Target Allocation | ||||||||||||||||||||||||||||||||||||||||||||||||||
Asset Category | 2014 | 2013 | 2014 | 2013 | 2014 | 2013 | 2015 | 2014 | 2015 | 2014 | 2015 | 2014 | ||||||||||||||||||||||||||||||||||||||||||||
Public equity securities | 31.3 | % | 36.7 | % | 46.8 | % | 48.0 | % | 10.2 | % | 9.5 | % | 34.2 | % | 31.3 | % | 45.7 | % | 46.8 | % | 10.7 | % | 10.2 | % | ||||||||||||||||||||||||||||||||
Private/other equity securities | 15.8 | % | 12.6 | % | 15.2 | % | 7.9 | % | 58.6 | % | 59.1 | % | 16.4 | % | 15.8 | % | 15.9 | % | 15.2 | % | 53.4 | % | 58.6 | % | ||||||||||||||||||||||||||||||||
Real estate and other | 0.6 | % | — | 7.1 | % | 7.5 | % | — | — | (1.7 | )% | 0.6 | % | 6.9 | % | 7.1 | % | (1.8 | )% | — | ||||||||||||||||||||||||||||||||||||
| | | | | | | | | | | | | | | | | | | | | | | | | | | | | | | | | | | | | | | | | | | | | | ||||||||||||
Equity-related investments | 47.5 | % | 47.7 | % | 49.3 | % | 67.7 | % | 69.1 | % | 63.4 | % | 71.1 | % | 68.8 | % | 68.6 | % | 53.5 | % | 48.9 | % | 47.7 | % | 66.4 | % | 68.5 | % | 69.1 | % | 66.1 | % | 62.3 | % | 68.8 | % | ||||||||||||||||||||
Debt securities | 52.5 | % | 49.2 | % | 48.2 | % | 31.6 | % | 27.6 | % | 32.5 | % | 27.0 | % | 27.5 | % | 29.0 | % | 46.1 | % | 47.5 | % | 49.2 | % | 33.4 | % | 28.7 | % | 27.6 | % | 32.0 | % | 33.2 | % | 27.5 | % | ||||||||||||||||||||
Cash | — | 3.1 | % | 2.5 | % | 0.7 | % | 3.3 | % | 4.1 | % | 1.9 | % | 3.7 | % | 2.4 | % | 0.4 | % | 3.6 | % | 3.1 | % | 0.2 | % | 2.8 | % | 3.3 | % | 1.9 | % | 4.5 | % | 3.7 | % | |||||||||||||||||||||
| | | | | | | | | | | | | | | | | | | | | | | | | | | | | | | | | | | | | | | | | | | | | | | | | |||||||||
Total | 100.0 | % | 100.0 | % | 100.0 | % | 100.0 | % | 100.0 | % | 100.0 | % | 100.0 | % | 100.0 | % | 100.0 | % | 100.0 | % | 100.0 | % | 100.0 | % | 100.0 | % | 100.0 | % | 100.0 | % | 100.0 | % | 100.0 | % | 100.0 | % | ||||||||||||||||||||
| | | | | | | | | | | | | | | | | | | | | | | | | | | | | | | | | | | | | | | | | | | | | | | | | | ||||||||
| | | | | | | | | | | | | | | | | | | | | | | | | | | | | | ||||||||||||||||||||||||||||
Investment Policy
HP's investment strategy is to seek a competitive rate of return relative to an appropriate level of risk depending on the funded status of each plan and the timing of expected benefit payments. The majority of the plans' investment managers employ active investment management strategies with the goal of outperforming the broad markets in which they invest. Risk management practices include diversification across asset classes and investment styles and periodic rebalancing toward asset allocation targets. A number of the plans' investment managers are authorized to utilize derivatives for investment or liability exposures, and HP may utilize derivatives to effect asset allocation changes or to hedge certain investment or liability exposures.
The target asset allocation selected for each U.S. plan reflects a risk/return profile HP believes is appropriate relative to each plan's liability structure and return goals. HP conducts periodic asset-liability studies for U.S. plans in order to model various potential asset allocations in comparison to each plan's forecasted liabilities and liquidity needs. HP invests a portion of the U.S. defined benefit
HP INC. AND SUBSIDIARIES
Notes to Consolidated Financial Statements (Continued)
Note 4: Retirement and Post-Retirement Benefit Plans (Continued)
plan assets and post-retirement benefit plan assets in private market securities such as private equity funds to provide diversification and a higher expected return on assets.
Outside the U.S., asset allocation decisions are typically made by an independent board of trustees for the specific plan. As in the U.S., investment objectives are designed to generate returns that will enable the plan to meet its future obligations. In some countries, local regulations may restrict asset allocations, typically leading to a higher percentage of investment in fixed income securities than would otherwise be deployed. HP reviews the investment strategy and provides a recommended list of investment managers for each country plan, with final decisions on asset allocation and investment managers made by the board of trustees for the specific plan.
HEWLETT-PACKARD COMPANY AND SUBSIDIARIES
Notes to Consolidated Financial Statements (Continued)
Note 4: Retirement and Post-Retirement Benefit Plans (Continued)
Basis for Expected Long-Term Rate of Return on Plan Assets
The expected long-term rate of return on plan assets reflects the expected returns for each major asset class in which the plan invests and the weight of each asset class in the target mix. Expected asset returns reflect the current yield on government bonds, risk premiums for each asset class and expected real returns which considers each country's specific inflation outlook. Because HP's investment policy is to employ primarily active investment managers who seek to outperform the broader market, the expected returns are adjusted to reflect the expected additional returns net of fees.
Future Contributions and Funding Policy
In fiscalAs of October 31, 2015, HP (including Hewlett Packard Enterprise) expects to contribute approximately $686$384 million to its non-U.S. pension plans and approximately $35$37 million to cover benefit payments to U.S. non-qualified plan participants. HP expects to payparticipants and approximately $47$46 million to cover benefit claims for HP's post-retirement benefit plans.plans in fiscal 2016. Subsequent to the Separation, HP Inc. expects to contribute approximately $18 million to its non-U.S. pension plans, approximately $36 million to cover benefit payments to U.S. non-qualified plan participants and approximately $43 million to cover benefit claims for HP's post-retirement benefit plans in fiscal 2016. HP's policy is to fund its pension plans so that it makes at least the minimum contribution required by local government, funding and taxing authorities.
Estimated Future Benefits Payments
As of October 31, 2014,2015, HP Inc. estimates that the future benefits payments for the retirement and post-retirement plans are as follows:
Fiscal year | U.S. Defined Benefit Plans | Non-U.S. Defined Benefit Plans | Post-Retirement Benefit Plans | U.S. Defined Benefit Plans | Non-U.S. Defined Benefit Plans | Post-Retirement Benefit Plans | ||||||||||||||
|---|---|---|---|---|---|---|---|---|---|---|---|---|---|---|---|---|---|---|---|---|
| | In millions | In millions | ||||||||||||||||||
2015 | $ | 801 | $ | 567 | $ | 91 | ||||||||||||||
2016 | 588 | 528 | 94 | $ | 879 | $ | 22 | $ | 82 | |||||||||||
2017 | 613 | 560 | 82 | 636 | 24 | 71 | ||||||||||||||
2018 | 648 | 606 | 71 | 645 | 26 | 58 | ||||||||||||||
2019 | 694 | 659 | 68 | 670 | 28 | 54 | ||||||||||||||
Next five fiscal years to October 31, 2024 | 3,850 | 3,980 | 278 | |||||||||||||||||
2020 | 705 | 29 | 51 | |||||||||||||||||
Next five fiscal years to October 31, 2025 | 3,785 | 188 | 197 | |||||||||||||||||
HP INC. AND SUBSIDIARIES
Notes to Consolidated Financial Statements (Continued)
Note 4: Retirement and Post-Retirement Benefit Plans (Continued)
Separation related activities
In advance of the Separation, HP underwent a plan-by-plan analysis in which it was determined if each plan would be assigned to HP Inc. or Hewlett Packard Enterprise. While some pension plans transitioned in their entirety to Hewlett Packard Enterprise or remain in their entirety with HP Inc., other plans were split into two identical plans resulting in both companies splitting the plan's assets and liabilities. As a result of these plan separations, HP Inc. will retain defined benefit plan assets of approximately $11,930 million, of which approximately $11,077 million pertain to the U.S. defined benefit plans. The projected benefit obligation for these defined benefit plans as of October 31, 2015 was $13,792 million, of which $12,709 million pertains to the U.S. defined benefit plans. The net funded status of these plans represents a net obligation which is recognized on HP Inc.'s Consolidated Balance Sheets for approximately $1,862 million of which $1,632 million pertains to the U.S. defined benefit plans. In addition, HP Inc. will retain post-retirement benefit plan assets of approximately $434 million. The projected benefit obligation for these post-retirement benefit plans as of October 31, 2015 was approximately $598 million. The net funded status of these plans represents a net obligation which is recognized on HP Inc.'s Consolidated Balance Sheets for approximately $164 million.
The current Hewlett-Packard Company 401(k) Plan ("HP 401(k) Plan") will remain with HP Inc. A new 401(k) Plan was created for the employees of Hewlett Packard Enterprise and the respective balances were transferred after the Separation.
Note 5: Stock-Based Compensation
HP's stock-based compensation plans include incentive compensation plans and an employee stock purchase plan ("ESPP").
HEWLETT-PACKARD COMPANY AND SUBSIDIARIES
Notes to Consolidated Financial Statements (Continued)
Note 5: Stock-Based Compensation (Continued)
Stock-Based Compensation Expense and Related Income Tax Benefits
Stock-based compensation expense and the resulting tax benefits were as follows:
| | For the fiscal years ended October 31 | For the fiscal years ended October 31 | ||||||||||||||||||
|---|---|---|---|---|---|---|---|---|---|---|---|---|---|---|---|---|---|---|---|---|
| | 2014 | 2013 | 2012 | 2015 | 2014 | 2013 | ||||||||||||||
| | In millions | In millions | ||||||||||||||||||
Stock-based compensation expense | $ | 560 | $ | 500 | $ | 635 | $ | 709 | $ | 560 | $ | 500 | ||||||||
Income tax benefit | (179 | ) | (158 | ) | (197 | ) | (208 | ) | (179 | ) | (158 | ) | ||||||||
| | | | | | | | | | | | | | | | | | | |||
Stock-based compensation expense, net of tax | $ | 381 | $ | 342 | $ | 438 | $ | 501 | $ | 381 | $ | 342 | ||||||||
| | | | | | | | | | | | | | | | | | | | ||
| | | | | | | | | | | | ||||||||||
In connection with the Separation, the Board of Directors approved amendments to certain outstanding long-term incentive awards on July 29, 2015. The amendments provided for the accelerated vesting on September 17, 2015 of certain stock-based awards that were otherwise scheduled to vest between September 18, 2015 and December 31, 2015. The pre-tax stock-based compensation expense due to the acceleration was approximately $76 million in fiscal year 2015.
Cash received from option exercises and purchases under the Hewlett-Packard Company 2011 Employee Stock Purchase Plan (the "2011 ESPP") was $0.4 billion in fiscal 2015, $0.3 billion in fiscal 2014 and $0.3 billion in fiscal 2013 and $0.7 billion in fiscal 2012.2013. The benefit realized for the tax deduction from option exercises in fiscal 2015, 2014 and 2013 and 2012 was $75 million, $51 million and $13 million, and $57 million, respectively.
HP INC. AND SUBSIDIARIES
Notes to Consolidated Financial Statements (Continued)
Note 5: Stock-Based Compensation (Continued)
Stock-Based Incentive Compensation Plans
HP's stock-based incentive compensation plans include equity plans adopted in 2004 2000 and 1995,2000, as amended ("principal equity plans"), as well as various equity plans assumed through acquisitions under which stock-based awards are outstanding. Stock-based awards granted from the principal equity plans include restricted stock awards, stock options and performance-based awards. Employees meeting certain employment qualifications are eligible to receive stock-based awards.
Restricted stock awards are non-vested stock awards that may include grants of restricted stock or restricted stock units. Restricted stock awards and cash-settled awards are generally subject to forfeiture if employment terminates prior to the lapse of the restrictions. Such awards generally vest one to three years from the date of grant. During the vesting period, ownership of the restricted stock cannot be transferred. Restricted stock has the same dividend and voting rights as common stock and is considered to be issued and outstanding upon grant. The dividends paid on restricted stock are non-forfeitable. Restricted stock units have forfeitable dividend equivalent rights equal to the dividend paid on common stock. Restricted stock units do not have the voting rights of common stock, and the shares underlying restricted stock units are not considered issued and outstanding upon grant. However, shares underlying restricted stock units are included in the calculation of diluted net EPS. Restricted stock units have forfeitable dividend equivalent rights equal to the dividend paid on common stock. HP expenses the fair value of restricted stock awards ratably over the period during which the restrictions lapse.
Stock options granted under the principal equity plans are generally non-qualified stock options, but the principal equity plans permit some options granted to qualify as incentive stock options under the U.S. Internal Revenue Code. Stock options generally vest over three to four years from the date of grant. The exercise price of a stock option is equal to the closing price of HP's stock on the option grant date. The majority of stock options issued by HP contain only service vesting conditions. However, starting in fiscal 2011, HP began granting performance-contingent stock options that vest only on the satisfaction of both service and market conditions prior to the expiration of the awards.
In connection with the Separation and in accordance with the Employee Matters Agreement, HP will make certain adjustments to the exercise price and number of share-based compensation awards with the intention of preserving the intrinsic value of the awards prior to the separation. Exercisable and non-exercisable stock options will be converted to similar awards of the entity where the employee is working post-separation. Restricted stock unit awards and performance-contingent awards will be adjusted to provide holders restricted stock units and performance-contingent awards in the company that employs such employee following the separation.
HEWLETT-PACKARD COMPANYHP INC. AND SUBSIDIARIES
Notes to Consolidated Financial Statements (Continued)
Note 5: Stock-Based Compensation (Continued)
Restricted Stock Awards
A summary of restricted stock awards activity is as follows:
| | As of October 31 | As of October 31 | ||||||||||||||||||||||||||||||||||||
|---|---|---|---|---|---|---|---|---|---|---|---|---|---|---|---|---|---|---|---|---|---|---|---|---|---|---|---|---|---|---|---|---|---|---|---|---|---|---|
| | 2014 | 2013 | 2012 | 2015 | 2014 | 2013 | ||||||||||||||||||||||||||||||||
| | Shares | Weighted- Average Grant Date Fair Value Per Share | Shares | Weighted- Average Grant Date Fair Value Per Share | Shares | Weighted- Average Grant Date Fair Value Per Share | Shares | Weighted- Average Grant Date Fair Value Per Share | Shares | Weighted- Average Grant Date Fair Value Per Share | Shares | Weighted- Average Grant Date Fair Value Per Share | ||||||||||||||||||||||||||
| | In thousands | | In thousands | | In thousands | | In thousands | | In thousands | | In thousands | | ||||||||||||||||||||||||||
Outstanding at beginning of year | 32,262 | $ | 21 | 25,532 | $ | 31 | 16,813 | $ | 39 | 40,808 | $ | 24 | 32,262 | $ | 21 | 25,532 | $ | 31 | ||||||||||||||||||||
Granted | 26,036 | $ | 28 | 20,707 | $ | 15 | 20,316 | $ | 27 | |||||||||||||||||||||||||||||
Granted and assumed through acquisition | 26,991 | $ | 35 | 26,036 | $ | 28 | 20,707 | $ | 15 | |||||||||||||||||||||||||||||
Vested | (14,253 | ) | $ | 24 | (10,966 | ) | $ | 33 | (8,521 | ) | $ | 38 | (34,177 | ) | $ | 26 | (14,253 | ) | $ | 24 | (10,966 | ) | $ | 33 | ||||||||||||||
Forfeited | (3,237 | ) | $ | 22 | (3,011 | ) | $ | 24 | (3,076 | ) | $ | 34 | (3,905 | ) | $ | 29 | (3,237 | ) | $ | 22 | (3,011 | ) | $ | 24 | ||||||||||||||
| | | | | | | | | | | | | | | | | | | | | | | | | | | | | | | |||||||||
Outstanding at end of year | 40,808 | $ | 24 | 32,262 | $ | 21 | 25,532 | $ | 31 | 29,717 | $ | 32 | 40,808 | $ | 24 | 32,262 | $ | 21 | ||||||||||||||||||||
| | | | | | | | | | | | | | | | | | | | | | | | | | | | | | | | ||||||||
| | | | | | | | | | | | | | | | | | ||||||||||||||||||||||
In fiscal 2015, HP assumed approximately 8 million shares of restricted stock units through acquisition with a weighted-average grant date fair value of $33 per share.
The total grant date fair value of restricted stock awards vested in fiscal 2015, 2014 and 2013 and 2012 was $593 million, $234 million $247 million and $229$247 million, respectively, net of taxes. As of October 31, 2014,2015, total unrecognized pre-tax stock-based compensation expense related to non-vested restricted stock awards was $511$652 million, which is expected to be recognized over the remaining weighted-average vesting period of 1.41.5 years.
Stock Options
HP utilizes the Black-Scholes-Merton option pricing formula to estimate the fair value of stock options subject to service-based vesting conditions. HP estimates the fair value of stock options subject to performance-contingent vesting conditions using a combination of a Monte Carlo simulation model and a lattice model as these awards contain market conditions. The weighted-average fair value and the assumptions used to measure fair value were as follows:
| | For the fiscal years ended October 31 | For the fiscal years ended October 31 | ||||||||||||||||||
|---|---|---|---|---|---|---|---|---|---|---|---|---|---|---|---|---|---|---|---|---|
| | 2014 | 2013 | 2012 | 2015 | 2014 | 2013 | ||||||||||||||
Weighted-average fair value(1) | $7 | $4 | $9 | $8 | $7 | $4 | ||||||||||||||
Expected volatility(2) | 33.1 | % | 41.7 | % | 41.9 | % | 26.8 | % | 33.1 | % | 41.7 | % | ||||||||
Risk-free interest rate(3) | 1.8 | % | 1.1 | % | 1.2 | % | 1.7 | % | 1.8 | % | 1.1 | % | ||||||||
Expected dividend yield(4) | 2.1 | % | 3.6 | % | 1.8 | % | 1.8 | % | 2.1 | % | 3.6 | % | ||||||||
Expected term in years(5) | 5.7 | 5.9 | 5.6 | 5.9 | 5.7 | 5.9 | ||||||||||||||
HP INC. AND SUBSIDIARIES
Notes to Consolidated Financial Statements (Continued)
Note 5: Stock-Based Compensation (Continued)
HEWLETT-PACKARD COMPANY AND SUBSIDIARIES
Notes to Consolidated Financial Statements (Continued)
Note 5: Stock-Based Compensation (Continued)
volatility for all awards was estimated using the implied volatility derived from options traded on HP's common stock.
A summary of stock option activity is as follows:
| | As of October 31 | As of October 31 | ||||||||||||||||||||||||||||||||||||||||||||||||||||||||||||||||||||||||
|---|---|---|---|---|---|---|---|---|---|---|---|---|---|---|---|---|---|---|---|---|---|---|---|---|---|---|---|---|---|---|---|---|---|---|---|---|---|---|---|---|---|---|---|---|---|---|---|---|---|---|---|---|---|---|---|---|---|---|---|---|---|---|---|---|---|---|---|---|---|---|---|---|---|---|
| | 2014 | 2013 | 2012 | 2015 | 2014 | 2013 | ||||||||||||||||||||||||||||||||||||||||||||||||||||||||||||||||||||
| | Shares | Weighted- Average Exercise Price | Weighted- Average Remaining Contractual Term | Aggregate Intrinsic Value | Shares | Weighted- Average Exercise Price | Weighted- Average Remaining Contractual Term | Aggregate Intrinsic Value | Shares | Weighted- Average Exercise Price | Weighted- Average Remaining Contractual Term | Aggregate Intrinsic Value | Shares | Weighted- Average Exercise Price | Weighted- Average Remaining Contractual Term | Aggregate Intrinsic Value | Shares | Weighted- Average Exercise Price | Weighted- Average Remaining Contractual Term | Aggregate Intrinsic Value | Shares | Weighted- Average Exercise Price | Weighted- Average Remaining Contractual Term | Aggregate Intrinsic Value | ||||||||||||||||||||||||||||||||||||||||||||||||||
| | In thousands | | In years | In millions | In thousands | | In years | In millions | In thousands | | In years | In millions | In thousands | | In years | In millions | In thousands | | In years | In millions | In thousands | | In years | In millions | ||||||||||||||||||||||||||||||||||||||||||||||||||
Outstanding at beginning of year | 84,042 | $ | 27 | 87,296 | $ | 29 | 120,243 | $ | 28 | 57,853 | $ | 27 | 84,042 | $ | 27 | 87,296 | $ | 29 | ||||||||||||||||||||||||||||||||||||||||||||||||||||||||
Granted | 9,575 | $ | 28 | 25,785 | $ | 15 | 7,529 | $ | 27 | |||||||||||||||||||||||||||||||||||||||||||||||||||||||||||||||||
Granted and assumed through acquisitions | 9,086 | $ | 36 | 9,575 | $ | 28 | 25,785 | $ | 15 | |||||||||||||||||||||||||||||||||||||||||||||||||||||||||||||||||
Exercised | (11,145 | ) | $ | 18 | (10,063 | ) | $ | 19 | (29,683 | ) | $ | 20 | (12,845 | ) | $ | 19 | (11,145 | ) | $ | 18 | (10,063 | ) | $ | 19 | ||||||||||||||||||||||||||||||||||||||||||||||||||
Forfeited/cancelled/expired | (24,619 | ) | $ | 31 | (18,976 | ) | $ | 25 | (10,793 | ) | $ | 35 | (17,816 | ) | $ | 40 | (24,619 | ) | $ | 31 | (18,976 | ) | $ | 25 | ||||||||||||||||||||||||||||||||||||||||||||||||||
| | | | | | | | | | | | | | | | | | | | | | | | | | | | | | | | | | | | | | | | | | | | | | | | | | | | | | | |||||||||||||||||||||
Outstanding at end of year | 57,853 | $ | 27 | 4.3 | $ | 629 | 84,042 | $ | 27 | 3.9 | $ | 303 | 87,296 | $ | 29 | 3.0 | $ | 15 | 36,278 | $ | 26 | 5.1 | $ | 153 | 57,853 | $ | 27 | 4.3 | $ | 629 | 84,042 | $ | 27 | 3.9 | $ | 303 | ||||||||||||||||||||||||||||||||||||||
| | | | | | | | | | | | | | | | | | | | | | | | | | | | | | | | | | | | | | | | | | | | | | | | | | | | | | | | ||||||||||||||||||||
| | | | | | | | | | | | | | | | | | | | | | | | | | | | | | ||||||||||||||||||||||||||||||||||||||||||||||
Vested and expected to vest at end of year | 54,166 | $ | 27 | 4.1 | $ | 571 | 80,004 | $ | 27 | 3.7 | $ | 274 | 85,935 | $ | 29 | 2.9 | $ | 15 | 34,973 | $ | 26 | 5.0 | $ | 152 | 54,166 | $ | 27 | 4.1 | $ | 571 | 80,004 | $ | 27 | 3.7 | $ | 274 | ||||||||||||||||||||||||||||||||||||||
| | | | | | | | | | | | | | | | | | | | | | | | | | | | | | | | | | | | | | | | | | | | | | | | | | | | | | | | ||||||||||||||||||||
| | | | | | | | | | | | | | | | | | | | | | | | | | | | | | ||||||||||||||||||||||||||||||||||||||||||||||
Exercisable at end of year | 30,459 | $ | 33 | 2.3 | $ | 197 | 49,825 | $ | 33 | 1.8 | $ | 58 | 68,437 | $ | 31 | 1.9 | $ | 12 | 25,630 | $ | 24 | 4.4 | $ | 146 | 30,459 | $ | 33 | 2.3 | $ | 197 | 49,825 | $ | 33 | 1.8 | $ | 58 | ||||||||||||||||||||||||||||||||||||||
| | | | | | | | | | | | | | | | | | | | | | | | | | | | | | | | | | | | | | | | | | | | | | | | | | | | | | | | ||||||||||||||||||||
| | | | | | | | | | | | | | | | | | | | | | | | | | | | | | ||||||||||||||||||||||||||||||||||||||||||||||
The aggregate intrinsic value in the table above represents the total pre-tax intrinsic value that option holders would have received had all option holders exercised their options on the last trading day of fiscal 2015, 2014 2013 and 2012.2013. The aggregate intrinsic value is the difference between HP's closing stock price on the last trading day of the fiscal year and the exercise price, multiplied by the number of in-the-money options. The total intrinsic value of options exercised in fiscal 2015, 2014 and 2013 and 2012 was $214 million, $151 million $36 million and $176$36 million, respectively. The total grant date fair value of options vested in fiscal 2015, 2014 and 2013 and 2012 was $59 million, $53 million $64 million and $104$64 million, respectively, net of taxes.
HEWLETT-PACKARD COMPANYHP INC. AND SUBSIDIARIES
Notes to Consolidated Financial Statements (Continued)
Note 5: Stock-Based Compensation (Continued)
The following table summarizes significant ranges of outstanding and exercisable stock options:
| | As of October 31, 2014 | As of October 31, 2015 | ||||||||||||||||||||||||||||||
|---|---|---|---|---|---|---|---|---|---|---|---|---|---|---|---|---|---|---|---|---|---|---|---|---|---|---|---|---|---|---|---|---|
| | Options Outstanding | Options Exercisable | Options Outstanding | Options Exercisable | ||||||||||||||||||||||||||||
Range of Exercise Prices | Shares Outstanding | Weighted- Average Remaining Contractual Term | Weighted- Average Exercise Price | Shares Exercisable | Weighted- Average Exercise Price | Shares Outstanding | Weighted- Average Remaining Contractual Term | Weighted- Average Exercise Price | Shares Exercisable | Weighted- Average Exercise Price | ||||||||||||||||||||||
| | In thousands | In years | | In thousands | | In thousands | In years | | In thousands | | ||||||||||||||||||||||
$0-$9.99 | 324 | 3.7 | $ | 7 | 323 | $ | 7 | 221 | 3.9 | $ | 6 | 205 | $ | 7 | ||||||||||||||||||
$10-$19.99 | 18,387 | 5.8 | $ | 14 | 3,620 | $ | 14 | 9,863 | 4.5 | $ | 14 | 9,398 | $ | 14 | ||||||||||||||||||
$20-$29.99 | 21,077 | 5.8 | $ | 26 | 9,358 | $ | 25 | 15,775 | 4.9 | $ | 26 | 11,635 | $ | 25 | ||||||||||||||||||
$30-$39.99 | 2,502 | 3.5 | $ | 36 | 1,628 | $ | 36 | 8,858 | 6.7 | $ | 37 | 2,831 | $ | 37 | ||||||||||||||||||
$40-$49.99 | 14,910 | 0.4 | $ | 43 | 14,877 | $ | 43 | 1,322 | 1.3 | $ | 45 | 1,322 | $ | 45 | ||||||||||||||||||
$50-$59.99 | 511 | 2.3 | $ | 52 | 511 | $ | 52 | 239 | 2.3 | $ | 52 | 239 | $ | 52 | ||||||||||||||||||
$60 and over | 142 | 0.1 | $ | 71 | 142 | $ | 71 | |||||||||||||||||||||||||
| | | | | | | | | | | | | | | | | | | | | | | | | | ||||||||
| 57,853 | 4.3 | $ | 27 | 30,459 | $ | 33 | ||||||||||||||||||||||||||
| 36,278 | 5.1 | $ | 26 | 25,630 | $ | 24 | ||||||||||||||||||||||||||
| | | | | | | | | | | | | | | | | | | | | | | | | | | |||||||
| | | | | | | | | | | | | | | |||||||||||||||||||
As of October 31, 2014,2015, total unrecognized pre-tax stock-based compensation expense related to stock options was $61$46 million, which is expected to be recognized over a weighted-average vesting period of 2.01.9 years.
Employee Stock Purchase Plan
HP sponsors the 2011 ESPP, pursuant to which eligible employees may contribute up to 10% of base compensation, subject to certain income limits, to purchase shares of HP's common stock.
Pursuant to the terms of the 2011 ESPP, employees purchase stock under the 2011 ESPP at a price equal to 95% of HP's closing stock price on the purchase date. No stock-based compensation expense was recorded in connection with those purchases because the criteria of a non-compensatory plan were met.
Shares Reserved
Shares available for future grant and shares reserved for future issuance under the stock-based incentive compensation plans and the 2011 ESPP were as follows:
| | As of October 31 | As of October 31 | ||||||||||||||||||
|---|---|---|---|---|---|---|---|---|---|---|---|---|---|---|---|---|---|---|---|---|
| | 2014 | 2013 | 2012 | 2015 | 2014 | 2013 | ||||||||||||||
| | In thousands | In thousands | ||||||||||||||||||
Shares available for future grant | 246,852 | 300,984 | 152,837 | 215,949 | 246,852 | 300,984 | ||||||||||||||
| | | | | | | | | | | | | | | | | | | | ||
| | | | | | | | | | | | ||||||||||
Shares reserved for future issuance | 344,848 | 417,642 | 270,498 | 276,481 | 344,848 | 417,642 | ||||||||||||||
| | | | | | | | | | | | | | | | | | | | ||
| | | | | | | | | | | | ||||||||||
HEWLETT-PACKARD COMPANYHP INC. AND SUBSIDIARIES
Notes to Consolidated Financial Statements (Continued)
Provision for Taxes
The domestic and foreign components of earnings (loss) before taxes were as follows:
| | For the fiscal years ended October 31 | For the fiscal years ended October 31 | ||||||||||||||||||
|---|---|---|---|---|---|---|---|---|---|---|---|---|---|---|---|---|---|---|---|---|
| | 2014 | 2013 | 2012 | 2015 | 2014 | 2013 | ||||||||||||||
| | In millions | In millions | ||||||||||||||||||
U.S. | $ | 2,565 | $ | 2,618 | $ | (3,192 | ) | $ | 373 | $ | 2,565 | $ | 2,618 | |||||||
Non-U.S. | 3,992 | 3,892 | (8,741 | ) | 4,359 | 3,992 | 3,892 | |||||||||||||
| | | | | | | | | | | | | | | | | | | |||
| $ | 6,557 | $ | 6,510 | $ | (11,933 | ) | ||||||||||||||
| $ | 4,732 | $ | 6,557 | $ | 6,510 | |||||||||||||||
| | | | | | | | | | | | | | | | | | | | ||
| | | | | | | | | | | | ||||||||||
The provision for (benefit from) taxes on earnings was as follows:
| | For the fiscal years ended October 31 | For the fiscal years ended October 31 | ||||||||||||||||||
|---|---|---|---|---|---|---|---|---|---|---|---|---|---|---|---|---|---|---|---|---|
| | 2014 | 2013 | 2012 | 2015 | 2014 | 2013 | ||||||||||||||
| | In millions | In millions | ||||||||||||||||||
U.S. federal taxes: | ||||||||||||||||||||
Current | $ | 381 | $ | 475 | $ | 330 | $ | (324 | ) | $ | 381 | $ | 475 | |||||||
Deferred | 210 | (666 | ) | 81 | (1,237 | ) | 210 | (666 | ) | |||||||||||
Non-U.S. taxes: | ||||||||||||||||||||
Current | 984 | 1,275 | 1,139 | 993 | 984 | 1,275 | ||||||||||||||
Deferred | (42 | ) | 89 | (787 | ) | 678 | (42 | ) | 89 | |||||||||||
State taxes: | ||||||||||||||||||||
Current | 212 | 57 | (41 | ) | 210 | 212 | 57 | |||||||||||||
Deferred | (201 | ) | 167 | (5 | ) | (142 | ) | (201 | ) | 167 | ||||||||||
| | | | | | | | | | | | | | | | | | | |||
| $ | 1,544 | $ | 1,397 | $ | 717 | |||||||||||||||
| $ | 178 | $ | 1,544 | $ | 1,397 | |||||||||||||||
| | | | | | | | | | | | | | | | | | | | ||
| | | | | | | | | | | | ||||||||||
The differences between the U.S. federal statutory income tax rate and HP's effective tax rate were as follows:
| | For the fiscal years ended October 31 | |||||||||
|---|---|---|---|---|---|---|---|---|---|---|
| | 2014 | 2013 | 2012(1) | |||||||
U.S. federal statutory income tax rate | 35.0 | % | 35.0 | % | 35.0 | % | ||||
State income taxes, net of federal tax benefit | 0.4 | % | 0.1 | % | 0.5 | % | ||||
Lower rates in other jurisdictions, net | (12.9 | )% | (24.5 | )% | 13.9 | % | ||||
Valuation allowance | 1.7 | % | 3.8 | % | (14.0 | )% | ||||
Nondeductible goodwill | — | — | (40.3 | )% | ||||||
Uncertain tax positions | (2.3 | )% | 4.1 | % | (1.4 | )% | ||||
Other, net | 1.6 | % | 3.0 | % | 0.3 | % | ||||
| | | | | | | | | | | |
| 23.5 | % | 21.5 | % | (6.0 | )% | |||||
| | | | | | | | | | | |
| | | | | | | | | | | |
| | For the fiscal years ended October 31 | |||||||||
|---|---|---|---|---|---|---|---|---|---|---|
| | 2015 | 2014 | 2013 | |||||||
U.S. federal statutory income tax rate | 35.0 | % | 35.0 | % | 35.0 | % | ||||
State income taxes, net of federal tax benefit | (4.6 | )% | 0.4 | % | 0.1 | % | ||||
Lower rates in other jurisdictions, net | (16.2 | )% | (12.9 | )% | (24.5 | )% | ||||
Valuation allowances | (23.4 | )% | 1.7 | % | 3.8 | % | ||||
Uncertain tax positions | 10.1 | % | (2.3 | )% | 4.1 | % | ||||
Other, net | 2.9 | % | 1.6 | % | 3.0 | % | ||||
| | | | | | | | | | | |
| 3.8 | % | 23.5 | % | 21.5 | % | |||||
| | | | | | | | | | | |
| | | | | | | | | | | |
| | | | | | | | | | | |
The jurisdictions with favorable tax benefitsrates that have the most significant effective tax rate impact in the periods presented include Puerto Rico, Singapore, China, Malaysia, Ireland and negative numbers represent tax expense as HP recorded income tax expense on a pretax loss.Netherlands. To
HEWLETT-PACKARD COMPANYHP INC. AND SUBSIDIARIES
Notes to Consolidated Financial Statements (Continued)
Note 6: Taxes on Earnings (Continued)
The jurisdictions with favorable tax ratesthe extent that have the most significant impact on HP's effective tax rate in the periods presented include Puerto Rico, Singapore, Netherlands, China and Ireland. HP plans to reinvest some of the earnings of these jurisdictions indefinitely outside the U.S. and therefore has not providedUnited States, U.S. taxes have not been provided on those indefinitely reinvested earnings.
In fiscal 2015, HP recorded $1.6 billion of net income tax benefits related to items unique to the year. These amounts included $1.8 billion tax benefit due to a release of valuation allowances pertaining to certain U.S. deferred tax assets and $486 million tax charge to record valuation allowances on certain foreign deferred tax assets, both related to legal entities within the ES business, $394 million of tax charges for adjustments to uncertain tax positions and the settlement of tax audit matters, inclusive of $449 million of tax charges related to pension transfers, and $3 million of tax charges for various provision to return adjustments and other adjustments. In addition, HP recorded $639 million of net tax benefits on restructuring, separation-related, and other charges and a tax benefit of $47 million arising from the retroactive research and development credit resulting from the Tax Increase Prevention Act of 2014, which was signed into law in December 2014.
In fiscal 2014, HP recorded $53 million of net income tax charges related to items unique to the year.
In fiscal 2013, HP recorded $471 million of net income tax charges related to items unique to the year. These amounts included $214 million of net increases to valuation allowances, $406 million of tax charges for adjustments to uncertain tax positions and the settlement of tax audit matters and $47 million of tax charges for various prior period adjustments. In addition, HP recorded $146 million of tax benefits from adjustments to prior year foreign income tax accruals and a tax benefit of $50 million arising from the retroactive research and development credit resulting from the American Taxpayer Relief Act of 2012, which was signed into law in January 2013.
In fiscal 2012, HP recorded a $1.3 billion income tax charge to record valuation allowances on certain U.S. deferred tax assets related to the ES segment, which was unique to the year. Other unique items included charges of $297 million for various foreign valuation allowances, as well as $26 million of income tax benefits related to adjustments to prior year foreign income tax accruals, settlement of tax audit matters, and miscellaneous other items.
As a result of certain employment actions and capital investments HP has undertaken, income from manufacturing and services in certain countries is subject to reduced tax rates, and in some cases is wholly exempt from taxes, through 2024.2026. The gross income tax benefits attributable to these actions and investments were estimated to be $581 million ($0.32 diluted net EPS) in fiscal year 2015, $1.2 billion ($0.61 diluted net EPS) in fiscal 2014, $827 million ($0.42 diluted net EPS) in fiscal 2013 and $900 million ($0.46 diluted net EPS) in fiscal 2012.
Uncertain Tax Positions
A reconciliation of unrecognizedyear 2013. The gross income tax benefits is as follows:
| | As of October 31 | |||||||||
|---|---|---|---|---|---|---|---|---|---|---|
| | 2014 | 2013 | 2012 | |||||||
| | In millions | |||||||||
Balance at beginning of year | $ | 3,484 | $ | 2,573 | $ | 2,118 | ||||
Increases: | ||||||||||
For current year's tax positions | 304 | 290 | 209 | |||||||
For prior years' tax positions | 593 | 997 | 651 | |||||||
Decreases: | ||||||||||
For prior years' tax positions | (125 | ) | (146 | ) | (321 | ) | ||||
Statute of limitations expiration | (46 | ) | (11 | ) | (1 | ) | ||||
Settlements with taxing authorities | (82 | ) | (219 | ) | (83 | ) | ||||
| | | | | | | | | | | |
Balance at end of year | $ | 4,128 | $ | 3,484 | $ | 2,573 | ||||
| | | | | | | | | | | |
| | | | | | | | | | | |
Up to $2.2 billion, $1.9 billion and $1.4 billionwere offset partially by accruals of HP's unrecognized tax benefits at October 31, 2014, 2013 and 2012, respectively, would affect HP's effective tax rate if realized.U.S. income taxes on undistributed earnings, among other factors.
HEWLETT-PACKARD COMPANYHP INC. AND SUBSIDIARIES
Notes to Consolidated Financial Statements (Continued)
Note 6: Taxes on Earnings (Continued)
Uncertain Tax Positions
A reconciliation of unrecognized tax benefits is as follows:
| | As of October 31 | |||||||||
|---|---|---|---|---|---|---|---|---|---|---|
| | 2015 | 2014 | 2013 | |||||||
| | In millions | |||||||||
Balance at beginning of year | $ | 4,128 | $ | 3,484 | $ | 2,573 | ||||
Increases: | ||||||||||
For current year's tax positions | 1,942 | 304 | 290 | |||||||
For prior years' tax positions | 4,673 | 593 | 997 | |||||||
Decreases: | ||||||||||
For prior years' tax positions | (655 | ) | (125 | ) | (146 | ) | ||||
Statute of limitations expirations | (21 | ) | (46 | ) | (11 | ) | ||||
Settlements with taxing authorities | (90 | ) | (82 | ) | (219 | ) | ||||
| | | | | | | | | | | |
Balance at end of year | $ | 9,977 | $ | 4,128 | $ | 3,484 | ||||
| | | | | | | | | | | |
| | | | | | | | | | | |
| | | | | | | | | | | |
Up to $3.0 billion, $2.2 billion and $1.9 billion of HP's unrecognized tax benefits at October 31, 2015, 2014 and 2013, respectively, would affect HP's effective tax rate if realized. The $5.8 billion increase in the amount of unrecognized tax benefits for the year ended October 31, 2015 primarily relates to the timing of intercompany royalty income recognition which does not affect HP's effective tax rate.
HP recognizes interest income from favorable settlements and interest expense and penalties accrued on unrecognized tax benefits in Provision for taxes in the Consolidated Statements of Earnings. HP had accrued $254$357 million and $196$254 million for interest and penalties as of October 31, 20142015 and October 31, 2013,2014, respectively.
HP engages in continuous discussion and negotiation with taxing authorities regarding tax matters in various jurisdictions. HP does not expect complete resolution of any U.S. Internal Revenue Service ("IRS") audit cycle within the next 12 months. However, it is reasonably possible that certain federal, foreign and state tax issues may be concluded in the next 12 months, including issues involving transfer pricing and other matters. Accordingly, HP believes it is reasonably possible that its existing unrecognized tax benefits may be reduced by an amount up to $1.4 billion$144 million within the next 12 months.
HP is subject to income tax in the U.S. and approximately 105 other countries and is subject to routine corporate income tax audits in many of these jurisdictions. In addition, HP is subject to numerous ongoing audits by federal, state and foreign tax authorities. The IRS is conducting an audit of HP's 2009, 2010, 2011, 2012, 2013 and 20112014 income tax returns. HP has received from the IRS Notices of Deficiency for its fiscal 1999, 2000, 2003, 2004 and 2005 tax years, and Revenue Agent Reports ("RAR") for its fiscal 2001, 2002, 2006, 2007 and 2008 tax years. The proposed IRS adjustments for these tax years would, if sustained, reduce the benefits of tax refund claims HP has filed for net operating loss carrybacks to earlier fiscal years and tax credit carryforwards to subsequent years by approximately $445 million. In addition, HP expects the IRS to issue an RAR for 2009 through 2011 relating to certain tax positions taken on the filed tax returns, including matters related to the U.S. taxation of certain intercompany loans. While the RAR may be material in amount, HP
HP INC. AND SUBSIDIARIES
Notes to Consolidated Financial Statements (Continued)
Note 6: Taxes on Earnings (Continued)
believes it has valid positions supporting its tax returns and, if necessary, it will vigorously defend such matters.
HP has filed petitions with the U.S. Tax Court regarding certain proposed IRS adjustments regarding tax years 1999 through 2003 and is continuing to contest additional adjustments proposed by the IRS for other tax years. The U.S. Tax Court ruled in May 2012 against HP regarding one of the IRS adjustments for which HP has filed a formal Notice of Appeal. The Court proceedings are expected to begin in fiscal 2015.2016.
Pre-acquisition tax years of HP's U.S. group of subsidiaries providing enterprise services through 2004 have been audited by the IRS, and all proposed adjustments have been resolved. RARs have been received for tax years 2005, 2006, 2007 and the short period ended August 26, 2008, proposing total tax deficiencies of $274 million. HP is contesting certain of these issues.
The IRS began an audit in fiscal 2013 of the 2010 income tax return for HP's U.S. group of subsidiaries providing enterprise services, and has issued an RAR for the short period ended October 31, 2008 and the period ending October 31, 2009 proposing a total tax deficiency of $62 million. HP is contesting certain of these issues.
With respect to major foreignstate and stateforeign tax jurisdictions, HP is no longer subject to tax authority examinations for years prior to 1999. HP is subject to a foreign tax audit concerning an intercompany transaction for fiscal 2009. The relevant taxing authority has proposed an assessment of approximately $680$733 million. HP is contesting this proposed assessment.
HP believes it has provided adequate reserves for all tax deficiencies or reductions in tax benefits that could result from federal, state and foreign tax audits. HP regularly assesses the likely outcomes of these audits in order to determine the appropriateness of HP's tax provision. HP adjusts its uncertain
HEWLETT-PACKARD COMPANY AND SUBSIDIARIES
Notes to Consolidated Financial Statements (Continued)
Note 6: Taxes on Earnings (Continued)
tax positions to reflect the impact of negotiations, settlements, rulings, advice of legal counsel, and other information and events pertaining to a particular audit. However, income tax audits are inherently unpredictable and there can be no assurance that HP will accurately predict the outcome of these audits. The amounts ultimately paid on resolution of an audit could be materially different from the amounts previously included in the Provision for taxes and therefore the resolution of one or more of these uncertainties in any particular period could have a material impact on net income or cash flows.
HP has not provided for U.S. federal income and foreign withholding taxes on $42.9$47.2 billion of undistributed earnings from non-U.S. operations as of October 31, 20142015 because HP intends to reinvest such earnings indefinitely outside of the U.S. If HP were to distribute these earnings, foreign tax credits may become available under current law to reduce the resulting U.S. income tax liability. Determination of the amount of unrecognized deferred tax liability related to these earnings is not practicable. HP will remit non-indefinitely reinvested earnings of its non-U.S. subsidiaries for which deferred U.S. federal and withholding taxes have been provided where excess cash has accumulated and HP determines that it is advantageous for business operations, tax or cash management reasons.
HP INC. AND SUBSIDIARIES
Notes to Consolidated Financial Statements (Continued)
Note 6: Taxes on Earnings (Continued)
Deferred Income Taxes
The significant components of deferred tax assets and deferred tax liabilities were as follows:
| | As of October 31 | As of October 31 | ||||||||||||||||||||||||
|---|---|---|---|---|---|---|---|---|---|---|---|---|---|---|---|---|---|---|---|---|---|---|---|---|---|---|
| | 2014 | 2013 | 2015 | 2014 | ||||||||||||||||||||||
| | Deferred Tax Assets | Deferred Tax Liabilities | Deferred Tax Assets | Deferred Tax Liabilities | Deferred Tax Assets | Deferred Tax Liabilities | Deferred Tax Assets | Deferred Tax Liabilities | ||||||||||||||||||
| | In millions | In millions | ||||||||||||||||||||||||
Loss carryforwards | $ | 9,476 | $ | — | $ | 9,807 | $ | — | $ | 8,749 | $ | — | $ | 9,476 | $ | — | ||||||||||
Credit carryforwards | 2,377 | — | 4,261 | — | 453 | — | 2,377 | — | ||||||||||||||||||
Unremitted earnings of foreign subsidiaries | — | 7,828 | — | 7,469 | — | 8,450 | — | 7,828 | ||||||||||||||||||
Inventory valuation | 152 | 8 | 128 | 13 | 120 | 7 | 152 | 8 | ||||||||||||||||||
Intercompany transactions—profit in inventory | 136 | — | 125 | — | 147 | — | 136 | — | ||||||||||||||||||
Intercompany transactions—excluding inventory | 4,403 | — | 1,923 | — | 6,952 | — | 4,403 | — | ||||||||||||||||||
Fixed assets | 383 | 74 | 289 | 72 | 377 | 64 | 383 | 74 | ||||||||||||||||||
Warranty | 616 | — | 622 | — | 549 | — | 616 | — | ||||||||||||||||||
Employee and retiree benefits | 2,790 | 57 | 2,350 | 11 | 1,872 | 31 | 2,790 | 57 | ||||||||||||||||||
Accounts receivable allowance | 107 | 1 | 185 | 1 | 136 | 1 | 107 | 1 | ||||||||||||||||||
Intangible assets | 212 | 596 | 224 | 886 | 74 | 546 | 212 | 596 | ||||||||||||||||||
Restructuring | 354 | — | 340 | — | 239 | — | 354 | — | ||||||||||||||||||
Deferred revenue | 1,143 | 12 | 1,119 | 19 | 1,235 | 5 | 1,143 | 12 | ||||||||||||||||||
Other | 1,573 | 1,145 | 1,443 | 759 | 2,215 | 1,486 | 1,573 | 1,145 | ||||||||||||||||||
| | | | | | | | | | | | | | | | | | | | | | | | ||||
Gross deferred tax assets and liabilities | 23,722 | 9,721 | 22,816 | 9,230 | 23,118 | 10,590 | 23,722 | 9,721 | ||||||||||||||||||
Valuation allowance | (11,915 | ) | — | (11,390 | ) | — | ||||||||||||||||||||
Valuation allowances | (9,878 | ) | — | (11,915 | ) | — | ||||||||||||||||||||
| | | | | | | | | | | | | | | | | | | | | | | | ||||
Net deferred tax assets and liabilities | $ | 11,807 | $ | 9,721 | $ | 11,426 | $ | 9,230 | $ | 13,240 | $ | 10,590 | $ | 11,807 | $ | 9,721 | ||||||||||
| | | | | | | | | | | | | | | | | | | | | | | | | |||
| | | | | | | | | | | | | | | |||||||||||||
HEWLETT-PACKARD COMPANY AND SUBSIDIARIES
Notes to Consolidated Financial Statements (Continued)
Note 6: Taxes on Earnings (Continued)
Current and long-term deferred tax assets and liabilities included in the Consolidated Balance Sheets as follows:
| | As of October 31 | As of October 31 | ||||||||||||
|---|---|---|---|---|---|---|---|---|---|---|---|---|---|---|
| | 2014 | 2013 | 2015 | 2014 | ||||||||||
| | In millions | In millions | ||||||||||||
Current deferred tax assets | $ | 2,754 | $ | 3,893 | $ | 2,242 | $ | 2,754 | ||||||
Current deferred tax liabilities | (284 | ) | (375 | ) | (168 | ) | (284 | ) | ||||||
Long-term deferred tax assets | 740 | 1,346 | 871 | 740 | �� | |||||||||
Long-term deferred tax liabilities | (1,124 | ) | (2,668 | ) | (295 | ) | (1,124 | ) | ||||||
| | | | | | | | | | | | | | ||
Net deferred tax assets net of deferred tax liabilities | $ | 2,086 | $ | 2,196 | $ | 2,650 | $ | 2,086 | ||||||
| | | | | | | | | | | | | | | |
| | | | | | | | | |||||||
Excess tax benefits of $64 million were recorded resulting from the exercise of employee stock options and other employee stock programs in fiscal 2015. Tax deficits of approximately $43 million $149 million and $175$149 million were recorded as a result of employee stock program activity and exercise of employee stock options, as a decrease in stockholders' equity in fiscal 2014 2013 and 2012,2013, respectively.
HP periodically engages in intercompany advanced royalty payment and licensing arrangements that may result in advance payments between subsidiaries in different tax jurisdictions. When the local tax treatment of the intercompany licensing arrangements differs from their U.S. GAAP treatment, deferred taxes are recognized. During fiscal 2014, HP executed a multi-year intercompany licensing arrangement on which advanced royalty payments of $10.4 billion were received in the U.S., the result of which was the recognition of net U.S. long-term deferred tax assets of $1.3 billion. The remaining intercompany royalty revenues of $9.9 billion will be recognized over the life of the arrangement through 2029 in the respective legal entities and eliminated in consolidation. The amortization expense related to the licensing rights will also be eliminated in consolidation. The decrease in deferred tax assets for credit carryforwards and increase in deferred tax assets for intercompany transactions excluding inventory include the deferred tax attributable to this transaction. This results in an increase in long-term deferred tax assets which is presented as a component of HP's long-term deferred tax liabilities due to the effects of jurisdictional netting.
As of October 31, 2014, HP had $858 million, $4.2 billion and $29.7 billion of federal, state and foreign net operating loss carryforwards, respectively. Amounts included in federal net operating loss carryforwards will begin to expire in fiscal 2021 and amounts included in state and foreign net operating loss carryforwards will begin to expire in 2015. HP also has a capital loss carryforward of approximately $272 million which will expire in fiscal 2015. HP has provided a valuation allowance of $133 million and $8.7 billion for deferred tax assets related to state and foreign net operating losses carryforwards, respectively and $104 million for deferred tax assets related to capital loss carryforwards that HP does not expect to realize.
HEWLETT-PACKARD COMPANYHP INC. AND SUBSIDIARIES
Notes to Consolidated Financial Statements (Continued)
Note 6: Taxes on Earnings (Continued)
tax treatment of the intercompany licensing arrangements differs from U.S. GAAP treatment, deferred taxes are recognized. During fiscal 2015, HP executed an intercompany advanced royalty payment arrangement resulting in advanced payments of $8.8 billion, while during fiscal 2014, HP executed a multi-year intercompany licensing arrangement and an intercompany advanced royalty payment arrangement which resulted in combined advanced payments of $11.5 billion, the result of which was the recognition of zero net U.S. deferred tax assets in fiscal 2015 and $1.7 billion in fiscal 2014. In these transactions, the payments were received in the U.S. from a foreign consolidated affiliate, with a deferral of intercompany revenues over the term of the arrangements, approximately 5 years and 15 years, respectively. Intercompany royalty revenue and the amortization expense related to the licensing rights are eliminated in consolidation.
Separation costs are expenses associated with HP's plan to separate into two independent publicly-traded companies. HP recorded a deferred tax asset on these costs and expenses as they were incurred through fiscal 2015. HP expects a portion of these deferred tax assets associated with separation costs and expenses will be non-deductible expenses, at the time the Separation is executed. Furthermore, HP has also concluded on the legal form of the Separation and in May 2015 announced that Hewlett Packard Enterprise will be the spinnee in the U.S. Accordingly, during the second half of fiscal 2015, HP implemented certain internal reorganizations of, and transactions among, its wholly owned subsidiaries and operating activities in preparation for the legal form of Separation. As a result, HP recorded adjustments to certain deferred and prepaid tax assets as well as income tax liabilities reflecting the impact of separation related activities.
As of October 31, 2014,2015, HP had $971 million, $6.1 billion and $26.8 billion of federal, state and foreign net operating loss carryforwards, respectively. Amounts included in each of these respective totals begin to expire in fiscal 2023, 2016 and 2016, respectively. HP also has capital loss carryforwards of approximately $26 million which will expire in fiscal 2020. HP has provided a valuation allowance of $106 million and $8.2 billion related to the state and foreign net operating loss carryforwards, respectively.
As of October 31, 2015, HP had recorded deferred tax assets for various tax credit carryforwards as follows:
| | Carryforward | Valuation Allowance | Initial Year of Expiration | Carryforward | Valuation Allowance | Initial Year of Expiration | ||||||||||||||
|---|---|---|---|---|---|---|---|---|---|---|---|---|---|---|---|---|---|---|---|---|
| | In millions | | In millions | | ||||||||||||||||
U.S. foreign tax credits | $ | 1,321 | $ | 47 | 2021 | $ | 46 | $ | — | 2021 | ||||||||||
U.S. research and development and other credits | 662 | — | 2018 | |||||||||||||||||
U.S. R&D and other credits | 47 | — | 2017 | |||||||||||||||||
Tax credits in state and foreign jurisdictions | 394 | 204 | 2015 | 360 | (223 | ) | 2016 | |||||||||||||
| | | | | | | | | | | | | | | | | | ||||
Balance at end of year | $ | 2,377 | $ | 251 | $ | 453 | $ | (223 | ) | |||||||||||
| | | | | | | | | | | | | | | | | | | |||
| | | | | | | | | | | |||||||||||
HP INC. AND SUBSIDIARIES
Notes to Consolidated Financial Statements (Continued)
Note 6: Taxes on Earnings (Continued)
Deferred Tax Asset Valuation Allowance
The deferred tax asset valuation allowance and changes were as follows:
| | As of October 31 | As of October 31 | ||||||||||||||||||
|---|---|---|---|---|---|---|---|---|---|---|---|---|---|---|---|---|---|---|---|---|
| | 2014 | 2013 | 2012 | 2015 | 2014 | 2013 | ||||||||||||||
| | In millions | In millions | ||||||||||||||||||
Balance at beginning of year | $ | 11,390 | $ | 10,223 | $ | 9,057 | $ | 11,915 | $ | 11,390 | $ | 10,223 | ||||||||
Income tax expense | 184 | 1,644 | 865 | |||||||||||||||||
Income tax (benefit) expense | (1,657 | ) | 184 | 1,644 | ||||||||||||||||
Other comprehensive income, currency translation and charges to other accounts | 341 | (477 | ) | 301 | (380 | ) | 341 | (477 | ) | |||||||||||
| | | | | | | | | | | | | | | | | | | |||
Balance at end of year | $ | 11,915 | $ | 11,390 | $ | 10,223 | $ | 9,878 | $ | 11,915 | $ | 11,390 | ||||||||
| | | | | | | | | | | | | | | | | | | | ||
| | | | | | | | | | | | ||||||||||
Gross deferred tax assets at October 31, 2015, 2014 and 2013 were reduced by valuation allowances of $9.9 billion, $11.9 billion and $11.4 billion, respectively. Total valuation allowancesallowance decreased by $2 billion in fiscal 2015 associated with the reversal of a valuation allowance against deferred tax assets in the U.S., and increased by $525 million and $1.2 billion in fiscal 2014, and 2013, respectively. These increases were associated primarily with foreign net operating losses.
Tax Matters Agreement and Other Income Tax Matters
In connection with the Separation, HP entered into a Tax Matters Agreement (the "Tax Matters Agreement") with Hewlett Packard Enterprise effective on November 1, 2015 that governs the rights and obligations of HP and Hewlett Packard Enterprise for certain pre-Separation tax liabilities. The Tax Matters Agreement provides that HP and Hewlett Packard Enterprise will share certain pre-Separation income tax liabilities that arise from adjustments made by tax authorities to HP and Hewlett Packard Enterprise's U.S. and certain non-U.S. income tax returns. In certain jurisdictions HP and Hewlett Packard Enterprise have joint and several liability for past income tax liabilities and accordingly, HP could be legally liable under applicable tax law for such liabilities and required to make additional tax payments.
In addition, if the distribution of Hewlett Packard Enterprise's common shares to the HP stockholders is determined to be taxable, Hewlett Packard Enterprise and HP would share the tax liability equally, unless the taxability of the distribution is the direct result of action taken by either Hewlett Packard Enterprise or HP subsequent to the distribution in which case the party causing the distribution to be taxable would be responsible for any taxes imposed on the distribution.
Upon completion of the Separation on November 1, 2015, HP recorded a net payable to Hewlett Packard Enterprise of $390 million for certain tax liabilities that Hewlett Packard Enterprise is joint and severally liable for, but for which it is indemnified by HP under the Tax Matters Agreement. The actual amount that HP may be obligated to pay could vary depending upon the outcome of certain unresolved tax matters, which may not be resolved for several years.
HP INC. AND SUBSIDIARIES
Notes to Consolidated Financial Statements (Continued)
Balance sheet details were as follows:
Accounts Receivable, Net
| | As of October 31 | As of October 31 | ||||||||||||
|---|---|---|---|---|---|---|---|---|---|---|---|---|---|---|
| | 2014 | 2013 | 2015 | 2014 | ||||||||||
| | In millions | In millions | ||||||||||||
Accounts receivable | $ | 14,064 | $ | 16,208 | $ | 13,552 | $ | 14,064 | ||||||
Allowance for doubtful accounts | (232 | ) | (332 | ) | (189 | ) | (232 | ) | ||||||
| | | | | | | | | | | | | | ||
| $ | 13,832 | $ | 15,876 | |||||||||||
| $ | 13,363 | $ | 13,832 | |||||||||||
| | | | | | | | | | | | | | | |
| | | | | | | | | |||||||
HEWLETT-PACKARD COMPANY AND SUBSIDIARIES
Notes to Consolidated Financial Statements (Continued)
Note 7: Balance Sheet Details (Continued)
The allowance for doubtful accounts related to accounts receivable and changes were as follows:
| | As of October 31 | As of October 31 | ||||||||||||||||||
|---|---|---|---|---|---|---|---|---|---|---|---|---|---|---|---|---|---|---|---|---|
| | 2014 | 2013 | 2012 | 2015 | 2014 | 2013 | ||||||||||||||
| | In millions | In millions | ||||||||||||||||||
Balance at beginning of year | $ | 332 | $ | 464 | $ | 470 | $ | 232 | $ | 332 | $ | 464 | ||||||||
Provision for doubtful accounts | 25 | 23 | 100 | 46 | 25 | 23 | ||||||||||||||
Deductions, net of recoveries | (125 | ) | (155 | ) | (106 | ) | (89 | ) | (125 | ) | (155 | ) | ||||||||
| | | | | | | | | | | | | | | | | | | |||
Balance at end of year | $ | 232 | $ | 332 | $ | 464 | $ | 189 | $ | 232 | $ | 332 | ||||||||
| | | | | | | | | | | | | | | | | | | | ||
| | | | | | | | | | | | ||||||||||
HP has third-party revolving short-term financing arrangements intended to facilitate the working capital requirements of certain customers. In the second quarter of fiscal 2014, HP expanded its revolving short-term financing arrangements, adding $1.6 billion of capacity. The maximum, utilized and available program capacity under these revolving short-term financing arrangements was as follows:
| | As of October 31 | As of October 31 | ||||||||||||
|---|---|---|---|---|---|---|---|---|---|---|---|---|---|---|
| | 2014 | 2013 | 2015 | 2014 | ||||||||||
| | In millions | In millions | ||||||||||||
Non-recourse arrangements: | ||||||||||||||
Maximum program capacity | $ | 1,083 | $ | 764 | $ | 1,427 | $ | 1,083 | ||||||
Utilized capacity(1) | (613 | ) | (314 | ) | ||||||||||
Utilized capacity(1)(2) | (568 | ) | (613 | ) | ||||||||||
| | | | | | | | | | | | | | ||
Available capacity | $ | 470 | $ | 450 | $ | 859 | $ | 470 | ||||||
| | | | | | | | | | | | | | ||
Partial-recourse arrangements: | ||||||||||||||
Maximum program capacity | $ | 1,877 | $ | 631 | $ | 1,860 | $ | 1,877 | ||||||
Utilized capacity(1) | (1,500 | ) | (454 | ) | ||||||||||
Utilized capacity(1)(2) | (1,381 | ) | (1,500 | ) | ||||||||||
| | | | | | | | | | | | | | ||
Available capacity | $ | 377 | $ | 177 | $ | 479 | $ | 377 | ||||||
| | | | | | | | | | | | | | ||
Total arrangements: | ||||||||||||||
Maximum program capacity | $ | 2,960 | $ | 1,395 | $ | 3,287 | $ | 2,960 | ||||||
Utilized capacity(1) | (2,113 | ) | (768 | ) | ||||||||||
Utilized capacity(1)(2) | (1,949 | ) | (2,113 | ) | ||||||||||
| | | | | | | | | | | | | | ||
Available capacity | $ | 847 | $ | 627 | $ | 1,338 | $ | 847 | ||||||
| | | | | | | | | | | | | | | |
| | | | | | | | | |||||||
| | As of October 31 | ||||||
|---|---|---|---|---|---|---|---|
| | 2014 | 2013 | |||||
| | In millions | ||||||
Non-recourse arrangements | $ | 78 | $ | 54 | |||
Partial-recourse arrangements | 381 | 118 | |||||
| | | | | | | | |
Total arrangements | $ | 459 | $ | 172 | |||
| | | | | | | | |
| | | | | | | | |
HEWLETT-PACKARD COMPANYHP INC. AND SUBSIDIARIES
Notes to Consolidated Financial Statements (Continued)
Note 7: Balance Sheet Details (Continued)
| | As of October 31 | ||||||
|---|---|---|---|---|---|---|---|
| | 2015 | 2014 | |||||
| | In millions | ||||||
Non-recourse arrangements | $ | 21 | $ | 78 | |||
Partial-recourse arrangements | 140 | 381 | |||||
| | | | | | | | |
Total arrangements | $ | 161 | $ | 459 | |||
| | | | | | | | |
| | | | | | | | |
| | | | | | | | |
The activity related to HP's revolving short-term financing arrangements was as follows:
| | As of October 31 | As of October 31 | ||||||||||||||||||
|---|---|---|---|---|---|---|---|---|---|---|---|---|---|---|---|---|---|---|---|---|
| | 2014 | 2013 | 2012 | 2015 | 2014 | 2013 | ||||||||||||||
| | In millions | In millions | ||||||||||||||||||
Balance at beginning of period(1) | $ | 172 | $ | 228 | $ | 245 | ||||||||||||||
Balance at beginning of year(1) | $ | 459 | $ | 172 | $ | 228 | ||||||||||||||
Trade receivables sold(2) | 9,627 | 4,241 | 3,510 | 10,733 | 9,627 | 4,241 | ||||||||||||||
Cash receipts(2) | (9,306 | ) | (4,305 | ) | (3,510 | ) | (10,998 | ) | (9,306 | ) | (4,305 | ) | ||||||||
Foreign currency and other | (34 | ) | 8 | (17 | ) | (33 | ) | (34 | ) | 8 | ||||||||||
| | | | | | | | | | | | | | | | | | | |||
Balance at end of period(1) | $ | 459 | $ | 172 | $ | 228 | ||||||||||||||
Balance at end of year(1) | $ | 161 | $ | 459 | $ | 172 | ||||||||||||||
| | | | | | | | | | | | | | | | | | | | ||
| | | | | | | | | | | | ||||||||||
Inventory
| | As of October 31 | ||||||
|---|---|---|---|---|---|---|---|
| | 2014 | 2013 | |||||
| | In millions | ||||||
Finished goods | $ | 3,973 | $ | 3,847 | |||
Purchased parts and fabricated assemblies | 2,442 | 2,199 | |||||
| | | | | | | | |
| $ | 6,415 | $ | 6,046 | ||||
| | | | | | | | |
| | | | | | | | |
Other Current Assets
| | As of October 31 | ||||||
|---|---|---|---|---|---|---|---|
| | 2014 | 2013 | |||||
| | In millions | ||||||
Deferred tax assets—short-term | $ | 2,754 | $ | 3,893 | |||
Value-added taxes receivable | 2,169 | 2,425 | |||||
Supplier and other receivables | 2,378 | 2,579 | |||||
Prepaid and other current assets | 4,518 | 4,238 | |||||
| | | | | | | | |
| $ | 11,819 | $ | 13,135 | ||||
| | | | | | | | |
| | | | | | | | |
| | As of October 31 | ||||||
|---|---|---|---|---|---|---|---|
| | 2015 | 2014 | |||||
| | In millions | ||||||
Finished goods | $ | 4,337 | $ | 3,973 | |||
Purchased parts and fabricated assemblies | 2,148 | 2,442 | |||||
| | | | | | | | |
| $ | 6,485 | $ | 6,415 | ||||
| | | | | | | | |
| | | | | | | | |
| | | | | | | | |
HEWLETT-PACKARD COMPANY AND SUBSIDIARIES
Notes to Consolidated Financial Statements (Continued)
Note 7: Balance Sheet Details (Continued)
Property, Plant and Equipment
| | As of October 31 | ||||||
|---|---|---|---|---|---|---|---|
| | 2014 | 2013 | |||||
| | In millions | ||||||
Land | $ | 540 | $ | 626 | |||
Buildings and leasehold improvements | 9,048 | 8,942 | |||||
Machinery and equipment, including equipment held for lease | 16,664 | 16,565 | |||||
| | | | | | | | |
| 26,252 | 26,133 | ||||||
| | | | | | | | |
Accumulated depreciation | (14,912 | ) | (14,670 | ) | |||
| | | | | | | | |
| $ | 11,340 | $ | 11,463 | ||||
| | | | | | | | |
| | | | | | | | |
Depreciation expense was $3.3 billion, $3.2 billion and $3.3 billion in fiscal 2014, 2013 and 2012, respectively. The change in gross property, plant and equipment was due primarily to purchases of $3.9 billion, which were partially offset by sales and retirements totaling $3.5 billion. Accumulated depreciation associated with the assets sold and retired in fiscal 2014 was $2.9 billion.
Long-Term Financing Receivables and Other Assets
| | As of October 31 | ||||||
|---|---|---|---|---|---|---|---|
| | 2014 | 2013 | |||||
| | In millions | ||||||
Financing receivables, net | $ | 3,613 | $ | 3,878 | |||
Deferred tax assets—long-term | 740 | 1,346 | |||||
Deferred costs—long-term | 755 | 999 | |||||
Other | 3,346 | 3,333 | |||||
| | | | | | | | |
| $ | 8,454 | $ | 9,556 | ||||
| | | | | | | | |
| | | | | | | | |
Other Accrued Liabilities
| | As of October 31 | ||||||
|---|---|---|---|---|---|---|---|
| | 2014 | 2013 | |||||
| | In millions | ||||||
Accrued taxes—other | $ | 2,269 | $ | 2,703 | |||
Warranty | 1,325 | 1,390 | |||||
Sales and marketing programs | 2,986 | 2,823 | |||||
Other | 5,499 | 5,590 | |||||
| | | | | | | | |
| $ | 12,079 | $ | 12,506 | ||||
| | | | | | | | |
| | | | | | | | |
HEWLETT-PACKARD COMPANYHP INC. AND SUBSIDIARIES
Notes to Consolidated Financial Statements (Continued)
Note 7: Balance Sheet Details (Continued)
Other Current Assets
| | As of October 31 | ||||||
|---|---|---|---|---|---|---|---|
| | 2015 | 2014 | |||||
| | In millions | ||||||
Deferred tax assets—short-term | $ | 2,242 | $ | 2,754 | |||
Value-added taxes receivable | 2,481 | 2,169 | |||||
Supplier and other receivables | 2,749 | 2,378 | |||||
Prepaid and other current assets | 4,116 | 4,518 | |||||
| | | | | | | | |
| $ | 11,588 | $ | 11,819 | ||||
| | | | | | | | |
| | | | | | | | |
| | | | | | | | |
Property, Plant and Equipment
| | As of October 31 | ||||||
|---|---|---|---|---|---|---|---|
| | 2015 | 2014 | |||||
| | In millions | ||||||
Land | $ | 537 | $ | 540 | |||
Buildings and leasehold improvements | 9,172 | 9,048 | |||||
Machinery and equipment, including equipment held for lease | 16,766 | 16,664 | |||||
| | | | | | | | |
| 26,475 | 26,252 | ||||||
| | | | | | | | |
Accumulated depreciation | (15,385 | ) | (14,912 | ) | |||
| | | | | | | | |
| $ | 11,090 | $ | 11,340 | ||||
| | | | | | | | |
| | | | | | | | |
| | | | | | | | |
Depreciation expense was $3.1 billion, $3.3 billion and $3.2 billion in fiscal 2015, 2014 and 2013, respectively. The change in gross property, plant and equipment was due primarily to purchases of $3.7 billion, which were partially offset by sales and retirements totaling $2.9 billion and unfavorable currency impacts of $0.5 billion. Accumulated depreciation associated with the assets sold and retired in fiscal 2015 was $2.5 billion.
Long-Term Financing Receivables and Other Assets
| | As of October 31 | ||||||
|---|---|---|---|---|---|---|---|
| | 2015 | 2014 | |||||
| | In millions | ||||||
Financing receivables, net | $ | 3,676 | $ | 3,613 | |||
Deferred tax assets | 871 | 740 | |||||
Deferred costs | 742 | 755 | |||||
Other | 3,761 | 3,346 | |||||
| | | | | | | | |
| $ | 9,050 | $ | 8,454 | ||||
| | | | | | | | |
| | | | | | | | |
| | | | | | | | |
HP INC. AND SUBSIDIARIES
Notes to Consolidated Financial Statements (Continued)
Note 7: Balance Sheet Details (Continued)
Other Accrued Liabilities
| | As of October 31 | ||||||
|---|---|---|---|---|---|---|---|
| | 2014 | 2013 | |||||
| | In millions | ||||||
Pension, post-retirement, and post-employment liabilities | $ | 6,379 | $ | 5,098 | |||
Deferred revenue—long-term | 3,931 | 3,907 | |||||
Deferred tax liability—long-term | 1,124 | 2,668 | |||||
Tax liability—long-term | 2,861 | 2,213 | |||||
Other long-term liabilities | 2,010 | 2,005 | |||||
| | | | | | | | |
| $ | 16,305 | $ | 15,891 | ||||
| | | | | | | | |
| | | | | | | | |
| | As of October 31 | ||||||
|---|---|---|---|---|---|---|---|
| | 2015 | 2014 | |||||
| | In millions | ||||||
Accrued taxes—other | $ | 2,371 | $ | 2,269 | |||
Warranty | 1,147 | 1,325 | |||||
Sales and marketing programs | 3,089 | 2,986 | |||||
Other | 5,417 | 5,499 | |||||
| | | | | | | | |
| $ | 12,024 | $ | 12,079 | ||||
| | | | | | | | |
| | | | | | | | |
| | | | | | | | |
Other Liabilities
| | As of October 31 | ||||||
|---|---|---|---|---|---|---|---|
| | 2015 | 2014 | |||||
| | In millions | ||||||
Pension, post-retirement, and post-employment liabilities | $ | 5,630 | $ | 6,379 | |||
Deferred revenue—long-term | 4,373 | 3,931 | |||||
Deferred tax liability—long-term | 295 | 1,124 | |||||
Tax liability—long-term | 2,593 | 2,861 | |||||
Other long-term liabilities | 1,869 | 2,010 | |||||
| | | | | | | | |
| $ | 14,760 | $ | 16,305 | ||||
| | | | | | | | |
| | | | | | | | |
| | | | | | | | |
Note 8: Financing Receivables and Operating Leases
Financing receivables represent sales-type and direct-financing leases of HP and third-party products. These receivables typically have terms ranging from two to five years and are usually
HP INC. AND SUBSIDIARIES
Notes to Consolidated Financial Statements (Continued)
Note 8: Financing Receivables and Operating Leases (Continued)
collateralized by a security interest in the underlying assets. Financing receivables also include billed receivables from operating leases. The components of financing receivables were as follows:
| | As of October 31 | As of October 31 | ||||||||||||
|---|---|---|---|---|---|---|---|---|---|---|---|---|---|---|
| | 2014 | 2013 | 2015 | 2014 | ||||||||||
| | In millions | In millions | ||||||||||||
Minimum lease payments receivable | $ | 6,982 | $ | 7,505 | $ | 7,000 | $ | 6,982 | ||||||
Unguaranteed residual value | 235 | 252 | 217 | 235 | ||||||||||
Unearned income | (547 | ) | (604 | ) | (528 | ) | (547 | ) | ||||||
| | | | | | | | | | | | | | ||
Financing receivables, gross | 6,670 | 7,153 | 6,689 | 6,670 | ||||||||||
Allowance for doubtful accounts | (111 | ) | (131 | ) | (95 | ) | (111 | ) | ||||||
| | | | | | | | | | | | | | ||
Financing receivables, net | 6,559 | 7,022 | 6,594 | 6,559 | ||||||||||
Less: current portion(1) | (2,946 | ) | (3,144 | ) | (2,918 | ) | (2,946 | ) | ||||||
| | | | | | | | | | | | | | ||
Amounts due after one year, net(1) | $ | 3,613 | $ | 3,878 | $ | 3,676 | $ | 3,613 | ||||||
| | | | | | | | | | | | | | | |
| | | | | | | | | |||||||
As of October 31, 2014,2015, scheduled maturities of HP's minimum lease payments receivable were as follows for the fiscal years ended October 31:follows:
| | 2015 | 2016 | 2017 | 2018 | 2019 | Thereafter | Total | |||||||||||||||
|---|---|---|---|---|---|---|---|---|---|---|---|---|---|---|---|---|---|---|---|---|---|---|
| | In millions | |||||||||||||||||||||
Scheduled maturities of minimum lease payments receivable | $ | 3,220 | $ | 1,959 | $ | 1,112 | $ | 483 | $ | 174 | $ | 34 | $ | 6,982 | ||||||||
Fiscal year | In millions | |||
|---|---|---|---|---|
2016 | $ | 3,176 | ||
2017 | 1,922 | |||
2018 | 1,144 | |||
2019 | 526 | |||
2020 | 194 | |||
Thereafter | 38 | |||
| | | | | |
Total | $ | 7,000 | ||
| | | | | |
| | | | | |
| | | | | |
HEWLETT-PACKARD COMPANY AND SUBSIDIARIES
Notes to Consolidated Financial Statements (Continued)
Note 8: Financing Receivables and Operating Leases (Continued)
Credit Quality Indicators
Due to the homogenous nature of its leasing transactions, HP manages its financing receivables on an aggregate basis when assessing and monitoring credit risk. Credit risk is generally diversified due to the large number of entities comprising HP's customer base and their dispersion across many different industries and geographic regions. HP evaluates the credit quality of an obligor at lease inception and monitors that credit quality over the term of a transaction. HP assigns risk ratings to each lease based on the creditworthiness of the obligor and other variables that augment or mitigate the inherent credit risk of a particular transaction. Such variables include the underlying value and liquidity of the collateral, the essential use of the equipment, the term of the lease, and the inclusion of credit enhancements, such as guarantees, letters of credit or security deposits.
The credit risk profile of gross financing receivables, based on internally assigned ratings, was as follows:
| | As of October 31 | ||||||
|---|---|---|---|---|---|---|---|
| | 2014 | 2013 | |||||
| | In millions | ||||||
Risk Rating: | |||||||
Low | $ | 3,536 | $ | 3,948 | |||
Moderate | 3,022 | 3,084 | |||||
High | 112 | 121 | |||||
| | | | | | | | |
Total | $ | 6,670 | $ | 7,153 | |||
| | | | | | | | |
| | | | | | | | |
Accounts rated low risk typically have the equivalent of a Standard & Poor's rating of BBB- or higher, while accounts rated moderate risk generally have the equivalent of BB+ or lower. HP classifies accounts as high risk when it considers the financing receivable to be impaired or when management believes there is a significant near-term risk of impairment.
HP INC. AND SUBSIDIARIES
Notes to Consolidated Financial Statements (Continued)
Note 8: Financing Receivables and Operating Leases (Continued)
The credit risk profile of gross financing receivables, based on internally assigned ratings, was as follows:
| | As of October 31 | ||||||
|---|---|---|---|---|---|---|---|
| | 2015 | 2014 | |||||
| | In millions | ||||||
Risk Rating: | |||||||
Low | $ | 3,458 | $ | 3,536 | |||
Moderate | 3,158 | 3,022 | |||||
High | 73 | 112 | |||||
| | | | | | | | |
Total | $ | 6,689 | $ | 6,670 | |||
| | | | | | | | |
| | | | | | | | |
| | | | | | | | |
Allowance for Doubtful Accounts
The allowance for doubtful accounts for financing receivables is comprised of a general reserve and a specific reserve. HP maintains general reserve percentages on a regional basis and bases such percentages on several factors, including consideration of historical credit losses and portfolio delinquencies, trends in the overall weighted-average risk rating of the portfolio, current economic conditions and information derived from competitive benchmarking. HP excludes accounts evaluated as part of the specific reserve from the general reserve analysis. HP establishes a specific reserve for financing receivables with identified exposures, such as customer defaults, bankruptcy or other events, that make it unlikely HP will recover its investment. For individually evaluated receivables, HP determines the expected cash flow for the receivable, which includes consideration of estimated proceeds from disposition of the collateral, and calculates an estimate of the potential loss and the probability of loss. For those accounts where a loss is considered probable, HP records a specific reserve. HP generally writes off a receivable or records a specific reserve when a receivable becomes 180 days past due, or sooner if HP determines that the receivable is not collectible.
The allowance for doubtful accounts related to financing receivables and changes were as follows:
| | As of October 31 | |||||||||
|---|---|---|---|---|---|---|---|---|---|---|
| | 2015 | 2014 | 2013 | |||||||
| | In millions | |||||||||
Balance at beginning of year | $ | 111 | $ | 131 | $ | 149 | ||||
Provision for doubtful accounts | 25 | 30 | 38 | |||||||
Deductions, net of recoveries | (41 | ) | (50 | ) | (56 | ) | ||||
| | | | | | | | | | | |
Balance at end of year | $ | 95 | $ | 111 | $ | 131 | ||||
| | | | | | | | | | | |
| | | | | | | | | | | |
| | | | | | | | | | | |
HEWLETT-PACKARD COMPANYHP INC. AND SUBSIDIARIES
Notes to Consolidated Financial Statements (Continued)
Note 8: Financing Receivables and Operating Leases (Continued)
The allowance for doubtful accounts related to financing receivables and changes were as follows:
| | As of October 31 | |||||||||
|---|---|---|---|---|---|---|---|---|---|---|
| | 2014 | 2013 | 2012 | |||||||
| | In millions | |||||||||
Balance at beginning of year | $ | 131 | $ | 149 | $ | 130 | ||||
Provision for doubtful accounts | 30 | 38 | 42 | |||||||
Deductions, net of recoveries | (50 | ) | (56 | ) | (23 | ) | ||||
| | | | | | | | | | | |
Balance at end of year | $ | 111 | $ | 131 | $ | 149 | ||||
| | | | | | | | | | | |
| | | | | | | | | | | |
The gross financing receivables and related allowance evaluated for loss were as follows:
| | As of October 31 | As of October 31 | ||||||||||||
|---|---|---|---|---|---|---|---|---|---|---|---|---|---|---|
| | 2014 | 2013 | 2015 | 2014 | ||||||||||
| | In millions | In millions | ||||||||||||
Gross financing receivables collectively evaluated for loss | $ | 6,378 | $ | 6,773 | $ | 6,433 | $ | 6,378 | ||||||
Gross financing receivables individually evaluated for loss | 292 | 380 | 256 | 292 | ||||||||||
| | | | | | | | | | | | | | ||
Total | $ | 6,670 | $ | 7,153 | $ | 6,689 | $ | 6,670 | ||||||
| | | | | | | | | | | | | | | |
| | | | | | | | | |||||||
Allowance for financing receivables collectively evaluated for loss | $ | 92 | $ | 95 | $ | 82 | $ | 92 | ||||||
Allowance for financing receivables individually evaluated for loss | 19 | 36 | 13 | 19 | ||||||||||
| | | | | | | | | | | | | | ||
Total | $ | 111 | $ | 131 | $ | 95 | $ | 111 | ||||||
| | | | | | | | | | | | | | | |
| | | | | | | | | |||||||
Non-Accrual and Past-Due Financing Receivables
HP considers a financing receivable to be past due when the minimum payment is not received by the contractually specified due date. HP generally places financing receivables on non-accrual status, which is suspension of interest accrual, and considers such receivables to be non-performing at the earlier of the time at which full payment of principal and interest becomes doubtful or the receivable becomes 90 days past due. Subsequently, HP may recognize revenue on non-accrual financing receivables as payments are received, which is on a cash basis, if HP deems the recorded financing receivable to be fully collectible; however, if there is doubt regarding the ultimate collectability of the recorded financing receivable, all cash receipts are applied to the carrying amount of the financing receivable, which is the cost recovery method. In certain circumstances, such as when HP deems a delinquency to be of an administrative nature, financing receivables may accrue interest after becoming 90 days past due. The non-accrual status of a financing receivable may not impact a customer's risk rating. After all of a customer's delinquent principal and interest balances are settled, HP may return the related financing receivable to accrual status.
HEWLETT-PACKARD COMPANYHP INC. AND SUBSIDIARIES
Notes to Consolidated Financial Statements (Continued)
Note 8: Financing Receivables and Operating Leases (Continued)
The following table summarizes the aging and non-accrual status of gross financing receivables:
| | As of October 31 | As of October 31 | ||||||||||||
|---|---|---|---|---|---|---|---|---|---|---|---|---|---|---|
| | 2014 | 2013 | 2015 | 2014 | ||||||||||
| | In millions | In millions | ||||||||||||
Billed(1): | ||||||||||||||
Current 1-30 days | $ | 243 | $ | 217 | $ | 358 | $ | 243 | ||||||
Past due 31-60 days | 46 | 50 | 52 | 46 | ||||||||||
Past due 61-90 days | 12 | 15 | 14 | 12 | ||||||||||
Past due >90 days | 49 | 46 | 57 | 49 | ||||||||||
Unbilled sales-type and direct-financing lease receivables | 6,320 | 6,825 | 6,208 | 6,320 | ||||||||||
| | | | | | | | | | | | | | ||
Total gross financing receivables | $ | 6,670 | $ | 7,153 | $ | 6,689 | $ | 6,670 | ||||||
| | | | | | | | | | | | | | | |
| | | | | | | | | |||||||
Gross financing receivables on non-accrual status(2) | $ | 130 | $ | 199 | $ | 154 | $ | 130 | ||||||
| | | | | | | | | | | | | | | |
| | | | | | | | | |||||||
Gross financing receivables 90 days past due and still accruing interest(2) | $ | 162 | $ | 181 | $ | 102 | $ | 162 | ||||||
| | | | | | | | | | | | | | | |
| | | | | | | | | |||||||
Operating Leases
Operating lease assets included in machinery and equipment in the Consolidated Balance Sheets were as follows:
| | As of October 31 | As of October 31 | ||||||||||||
|---|---|---|---|---|---|---|---|---|---|---|---|---|---|---|
| | 2014 | 2013 | 2015 | 2014 | ||||||||||
| | In millions | In millions | ||||||||||||
Equipment leased to customers | $ | 3,977 | $ | 3,822 | $ | 4,077 | $ | 3,977 | ||||||
Accumulated depreciation | (1,382 | ) | (1,452 | ) | (1,367 | ) | (1,382 | ) | ||||||
| | | | | | | | | | | | | | ||
| $ | 2,595 | $ | 2,370 | |||||||||||
| $ | 2,710 | $ | 2,595 | |||||||||||
| | | | | | | | | | | | | | | |
| | | | | | | | | |||||||
HP INC. AND SUBSIDIARIES
Notes to Consolidated Financial Statements (Continued)
Note 8: Financing Receivables and Operating Leases (Continued)
As of October 31, 2014,2015, minimum future rentals on non-cancelable operating leases related to leased equipment were as follows for the fiscal years ended October 31:follows:
| | 2015 | 2016 | 2017 | 2018 | 2019 | Thereafter | Total | |||||||||||||||
|---|---|---|---|---|---|---|---|---|---|---|---|---|---|---|---|---|---|---|---|---|---|---|
| | In millions | |||||||||||||||||||||
Minimum future rentals on non-cancelable operating leases | $ | 1,487 | $ | 958 | $ | 467 | $ | 156 | $ | 50 | $ | 6 | $ | 3,124 | ||||||||
Fiscal year | In millions | |||
|---|---|---|---|---|
2016 | $ | 1,439 | ||
2017 | 973 | |||
2018 | 508 | |||
2019 | 200 | |||
2020 | 70 | |||
Thereafter | 17 | |||
| | | | | |
Total | $ | 3,207 | ||
| | | | | |
| | | | | |
| | | | | |
Note 9: Acquisitions and Divestitures
Acquisitions
In fiscal 2015, HP completed five acquisitions. The purchase price allocation for these acquisitions as set forth in the table below reflects various preliminary fair value estimates and analyses, including preliminary work performed by third-party valuation specialists, which are subject to change within the measurement period as valuations are finalized. The primary areas of the preliminary purchase price allocation that are not yet finalized relate to the fair values of certain tangible assets and liabilities acquired, the valuation of intangible assets acquired, certain legal matters, income and non-income based taxes, and residual goodwill. HP expects to continue to obtain information to assist it in determining the fair value of the net assets acquired at the acquisition date during the measurement period. Measurement period adjustments that HP determines to be material will be applied retrospectively to the period of acquisition in HP's Consolidated Financial Statements and, depending on the nature of the adjustments, other periods subsequent to the period of acquisition could also be affected.
Pro forma results of operations for these acquisitions have not been presented because they are not material to HP's consolidated results of operations, either individually or in the aggregate. Goodwill, which represents the excess of the purchase price over the net tangible and intangible assets acquired, is not deductible for tax purposes.
The following table presents the aggregate purchase price allocation, including those items that are still preliminary allocations, for HP's acquisitions in fiscal 2015:
| | In millions | |||
|---|---|---|---|---|
Goodwill | $ | 1,987 | ||
Amortizable intangible assets | 704 | |||
In-process research and development | 159 | |||
Net assets assumed | 221 | |||
| | | | | |
Total fair value of consideration | $ | 3,071 | ||
| | | | | |
| | | | | |
| | | | | |
HEWLETT-PACKARD COMPANYHP INC. AND SUBSIDIARIES
Notes to Consolidated Financial Statements (Continued)
Note 9: Acquisitions Goodwill and Intangible Assets
Divestitures (Continued)
Acquisition of Aruba
HP's largest acquisition in fiscal 2015 was the acquisition of Aruba, which was completed in May 2015. Aruba is a leading provider of next-generation network access solutions for the mobile enterprise. HP reported the financial results of Aruba's business in the Networking business unit within the EG segment. The acquisition date fair value of consideration of $2.8 billion consisted of cash paid for outstanding common stock, vested in-the-money stock awards and the estimated fair value of earned unvested stock awards assumed by HP. In connection with this acquisition, HP recorded approximately $1.8 billion of goodwill, $643 million of intangible assets and $153 million of IPR&D. HP is amortizing the intangible assets on a straight-line basis over an estimated weighted-average life of six years.
Acquisitions in prior year
In fiscal 2014, HP completed two acquisitions with a combined purchase price of $55 million, of which $12 million was recorded as goodwill and $25 million was recorded as intangible assets related to these acquisitions.
Divestitures
In fiscal 2013, MphasiS Limited, a majority-owned subsidiary of2015, HP acquired Digital Risk LLC for $174 million. HP recorded $112completed five divestitures which resulted in $246 million of goodwillproceeds. These divestitures included HP's sale of its web-based photo sharing and $48 millionphoto printing service, Snapfish. Snapfish was previously reported within the Consumer Hardware business unit within the Printing segment. Additionally, HP completed the sales of intangibleits LiveVault and iManage businesses, which were previously reported within the Software segment. The gains associated with these divestitures were included in Selling, general and administrative expenses in the Consolidated Statements of Earnings.
In May 2015, HP and Tsinghua Holdings jointly announced a partnership that will bring together the Chinese enterprise technology assets of Hewlett Packard Enterprise and Tsinghua University to create a Chinese provider of technology infrastructure. Under the definitive agreement, Tsinghua Holdings' subsidiary, Unisplendour Corporation, will purchase 51% of a new business called H3C, comprising Hewlett Packard Enterprise's current H3C Technologies and China-based server, storage and technology services businesses, for approximately $2.3 billion. Hewlett Packard Enterprise China will maintain 100% ownership of its existing China-based ES, Aruba, Software and Hewlett Packard Enterprise Helion Cloud businesses. Once the transaction closes, the new H3C will be the exclusive provider for Hewlett Packard Enterprise's server, storage and networking portfolio, as well as Hewlett Packard Enterprise's exclusive hardware support services provider in China, customized for that market. The transaction will be a part of Hewlett Packard Enterprise as a result of the Separation and is expected to close during the first quarter of fiscal 2016, subject to regulatory approvals and other closing conditions.
In October 2015, HP signed a definitive agreement to sell the TippingPoint business to Trend Micro International for approximately $300 million. TippingPoint is a provider of next-generation intrusion prevention systems and related network security solutions. The results of TippingPoint were recorded within the Software segment. The transaction will be a part of Hewlett Packard Enterprise as a result of the Separation and is expected to this acquisition.close during the first quarter of fiscal 2016, subject to regulatory approvals and other closing conditions.
HP INC. AND SUBSIDIARIES
Notes to Consolidated Financial Statements (Continued)
Note 10: Goodwill and Intangible Assets
Goodwill
Goodwill allocated to HP's reportable segments and changes in the carrying amount of goodwill were as follows:
| | Personal Systems | Printing | Enterprise Group | Enterprise Services(3) | Software | HP Financial Services | Corporate Investments | Total | Personal Systems | Printing | Enterprise Group | Enterprise Services(3) | Software | HP Financial Services | Corporate Investments | Total | ||||||||||||||||||||||||||||||||||
|---|---|---|---|---|---|---|---|---|---|---|---|---|---|---|---|---|---|---|---|---|---|---|---|---|---|---|---|---|---|---|---|---|---|---|---|---|---|---|---|---|---|---|---|---|---|---|---|---|---|---|
| | In millions | In millions | ||||||||||||||||||||||||||||||||||||||||||||||||
Balance at October 31, 2012(1)(2) | $ | 2,588 | $ | 2,591 | $ | 16,825 | $ | — | $ | 8,921 | $ | 144 | $ | — | $ | 31,069 | ||||||||||||||||||||||||||||||||||
Goodwill acquired during the period | — | — | — | 112 | — | — | — | 112 | ||||||||||||||||||||||||||||||||||||||||||
Goodwill adjustments | — | — | 39 | (15 | ) | (81 | ) | — | — | (57 | ) | |||||||||||||||||||||||||||||||||||||||
| | | | | | | | | | | | | | | | | | ||||||||||||||||||||||||||||||||||
Balance at October 31, 2013(1)(2) | $ | 2,588 | $ | 2,591 | $ | 16,864 | $ | 97 | $ | 8,840 | $ | 144 | $ | — | $ | 31,124 | $ | 2,588 | $ | 3,103 | $ | 16,864 | $ | 97 | $ | 8,328 | $ | 144 | $ | — | $ | 31,124 | ||||||||||||||||||
Goodwill acquired during the period | — | — | — | — | 12 | — | — | 12 | — | — | — | — | 12 | — | — | 12 | ||||||||||||||||||||||||||||||||||
Goodwill adjustments | — | — | 3 | — | — | — | — | 3 | — | — | 3 | — | — | — | — | 3 | ||||||||||||||||||||||||||||||||||
| | | | | | | | | | | | | | | | | | | | | | | | | | | | | | | | | | | | | | | | | | | | ||||||||
Balance at October 31, 2014(1) | $ | 2,588 | $ | 2,591 | $ | 16,867 | $ | 97 | $ | 8,852 | $ | 144 | $ | — | $ | 31,139 | ||||||||||||||||||||||||||||||||||
Balance at October 31, 2014(1)(2) | $ | 2,588 | $ | 3,103 | $ | 16,867 | $ | 97 | $ | 8,340 | $ | 144 | $ | — | $ | 31,139 | ||||||||||||||||||||||||||||||||||
Goodwill acquired during the period | — | — | 1,891 | — | 96 | — | — | 1,987 | ||||||||||||||||||||||||||||||||||||||||||
Goodwill adjustments | — | (11 | ) | (46 | ) | (5 | ) | (123 | ) | — | — | (185 | ) | |||||||||||||||||||||||||||||||||||||
| | | | | | | | | | | | | | | | | | | | | | | | | | | |||||||||||||||||||||||||
Balance at October 31, 2015(1) | $ | 2,588 | $ | 3,092 | $ | 18,712 | $ | 92 | $ | 8,313 | $ | 144 | $ | — | $ | 32,941 | ||||||||||||||||||||||||||||||||||
| | | | | | | | | | | | | | | | | | | | | | | | | | | | | | | | | | | | | | | | | | | | | |||||||
| | | | | | | | | | | | | | | | | | | | | | | | | | | |||||||||||||||||||||||||
In fiscal 2015, HP recorded approximately $2.0 billion of goodwill related to acquisitions based on its preliminary fair value estimates of the assets acquired. Goodwill adjustments primarily relate to the allocation of goodwill to the LiveVault, Snapfish and iManage businesses, which were sold during the period.
Table of ContentsGoodwill Impairments
HEWLETT-PACKARD COMPANY AND SUBSIDIARIES
Notes to Consolidated Financial Statements (Continued)
Note 9: Acquisitions, Goodwill and Intangible Assets (Continued)
Goodwill is tested for impairment at the reporting unit level. At the beginning of its first quarter of fiscal 2014, HP made a change to its reporting units. In connection with continued operational synergies and interdependencies between the Enterprise Servers, Storage and Networking reporting unit and the TS reporting unit within the EG segment, HP combined these reporting units to create the EG reporting unit. As of October 31, 2014, HP's2015, our reporting units are consistent with the reportable segments identified in Note 2, except for ES, which includes two reporting units: MphasiS Limited; and the remainder of ES.
Based on the results of its annual impairment tests, HP determined that no impairment of goodwill existed as of August 1, 2014.2015. There were no goodwill impairments in fiscal 2014 and 2013.
HP INC. AND SUBSIDIARIES
Notes to Consolidated Financial Statements (Continued)
Note 10: Goodwill and Intangible Assets (Continued)
However, future goodwill impairment tests could result in a charge to net earnings. HP will continue to evaluate goodwill on an annual basis as of the beginning of its fourth fiscal quarter and whenever events or changes in circumstances indicate there may be a potential impairment.
Goodwill impairments
There were no goodwill impairments in fiscal 2014 and 2013.
During fiscal 2012, HP determined that sufficient indicators of potential impairment existed to require an interim goodwill impairment analysis for the ES reporting unit. These indicators included the trading values of HP's stock at the time of the impairment test, coupled with market conditions and business trends within ES. The fair value of the ES reporting unit was based on the income approach. The decline in the fair value of the ES reporting unit resulted from lower projected revenue growth rates and profitability levels as well as an increase in the risk factor that was included in the discount rate used to calculate the discounted cash flows. The increase in the discount rate was due to the implied control premium resulting from trading values of HP stock at the time of the impairment test. The resulting adjustments to discount rates caused a significant reduction in the fair value for the ES reporting unit. Based on the step one and step two analyses, HP recorded an $8.0 billion goodwill impairment charge in fiscal 2012, and there was no remaining goodwill in the ES reporting unit as of October 31, 2012. Prior to completing the goodwill impairment test, HP tested the recoverability of the ES long-lived assets (other than goodwill) and concluded that such assets were not impaired.
Also during fiscal 2012, the Software segment included two reporting units, which were Autonomy and the legacy HP Software business. HP initiated its annual goodwill impairment analysis in the fourth quarter of fiscal 2012 and concluded that fair value was below carrying amount for the Autonomy reporting unit. The fair value of the Autonomy reporting unit was based on the income approach.
The decline in the estimated fair value of the Autonomy reporting unit resulted from lower projected revenue growth rates and profitability levels as well as an increase in the risk factor that was included in the discount rate used to calculate the discounted cash flows. The increase in the discount rate was due to the implied control premium that resulted from trading values of HP stock at the time of the impairment test. The lower projected operating results reflected changes in assumptions related to organic revenue growth rates, market trends, business mix, cost structure, expected deal synergies and other expectations about the anticipated short-term and long-term operating results of the Autonomy business. These assumptions incorporated HP's analysis of what it believes were accounting improprieties, incomplete disclosures and misrepresentations at Autonomy that occurred prior to the Autonomy acquisition with respect to Autonomy's pre-acquisition business and related operating results. In addition, as noted above, when estimating the fair value of a reporting unit HP may need to adjust
HEWLETT-PACKARD COMPANY AND SUBSIDIARIES
Notes to Consolidated Financial Statements (Continued)
Note 9: Acquisitions, Goodwill and Intangible Assets (Continued)
discount rates and/or other assumptions in order to derive a reasonable implied control premium when comparing the sum of the fair values of HP's reporting units to HP's market capitalization. Due to the trading values of HP stock at the time of the impairment test, the resulting adjustments to the discount rate to arrive at an appropriate control premium caused a significant reduction in the fair value for the Autonomy reporting unit as well as the fair values for HP's other reporting units.
Prior to conducting step one of the goodwill impairment test for the Autonomy reporting unit, HP first evaluated the recoverability of the long-lived assets, including intangible assets. When indicators of impairment are present, HP tests long-lived assets (other than goodwill) for recoverability by comparing the carrying amount of an asset group to its undiscounted cash flows. HP considered the lower-than-expected revenue and profitability levels over a sustained period of time, the trading values of HP stock and downward revisions to management's short- and long-term forecasts for the Autonomy business to be indicators of impairment for the Autonomy long-lived assets. Based on the results of the recoverability test, HP determined that the carrying amount of the Autonomy asset group exceeded its undiscounted cash flows and was therefore not recoverable. HP then compared the fair value of the asset group to its carrying amount and determined the impairment loss. The impairment loss was allocated to the carrying values of the long-lived assets but not below their individual fair values. Based on the analysis, HP recorded an impairment charge of $3.1 billion on intangible assets, which resulted in a remaining carrying amount of approximately $0.8 billion as of October 31, 2012. The decline in the fair value of the Autonomy intangible assets was attributable to the same factors as discussed above for the fair value of the Autonomy reporting unit.
The decline in the fair value of the Autonomy reporting unit and Autonomy intangibles, as well as fair value changes for other assets and liabilities in the step two goodwill impairment test, resulted in an implied fair value of goodwill substantially below the carrying amount of the goodwill for the Autonomy reporting unit. As a result, HP recorded a goodwill impairment charge of $5.7 billion, which resulted in a $1.2 billion remaining carrying amount of Autonomy goodwill as of October 31, 2012. Both the goodwill impairment charge and the intangible assets impairment charge, totaling $8.8 billion, were included in the Impairment of goodwill and intangible assets line item in the Consolidated Statements of Earnings.
Subsequent to the Autonomy purchase price allocation period, which concluded in the first quarter of fiscal 2012, and in conjunction with HP's annual goodwill impairment testing, HP identified certain indicators of impairment. The indicators of impairment included lower-than-expected revenue and profitability levels over a sustained period of time, the trading values of HP stock and downward revisions to management's short- and long-term forecasts for the Autonomy business. HP revised its multi-year forecast for the Autonomy business, and the timing of this forecast revision coincided with the timing of HP's overall forecasting process for all reporting units, which is completed each year in the fourth fiscal quarter in conjunction with the annual goodwill impairment analysis. The change in assumptions used in the revised forecast and the fair value estimates utilized in the impairment testing of the Autonomy goodwill and long-lived assets incorporated insights gained from having owned the Autonomy business for the preceding year. The revised forecast reflected changes related to organic revenue growth rates, current market trends, business mix, cost structure, expected deal synergies and other expectations about the anticipated short- and long-term operating results of the Autonomy business, driven by HP's analysis regarding certain accounting improprieties, incomplete disclosures and misrepresentations at Autonomy that occurred prior to the Autonomy acquisition with respect to Autonomy's pre-acquisition business and related operating results. Accordingly, the change in fair values represented a change in accounting estimate that occurred outside the purchase price allocation period, resulting in the recorded impairment charge.
Based on the results of the annual impairment test for all other reporting units, HP concluded that no other goodwill impairment existed as of August 1, 2012, apart from the impairment charges discussed above.
HEWLETT-PACKARD COMPANY AND SUBSIDIARIES
Notes to Consolidated Financial Statements (Continued)
Note 9: Acquisitions, Goodwill and Intangible Assets (Continued)
Intangible Assets
HP's intangible assets are composed of:
| | As of October 31, 2014 | As of October 31, 2013 | As of October 31, 2015 | As of October 31, 2014 | ||||||||||||||||||||||||||||||||||||||||||||||
|---|---|---|---|---|---|---|---|---|---|---|---|---|---|---|---|---|---|---|---|---|---|---|---|---|---|---|---|---|---|---|---|---|---|---|---|---|---|---|---|---|---|---|---|---|---|---|---|---|---|---|
| | Gross | Accumulated Amortization | Accumulated Impairment Loss | Net | Gross | Accumulated Amortization | Accumulated Impairment Loss | Net | Gross | Accumulated Amortization | Accumulated Impairment Loss | Net | Gross | Accumulated Amortization | Accumulated Impairment Loss | Net | ||||||||||||||||||||||||||||||||||
| | In millions | In millions | ||||||||||||||||||||||||||||||||||||||||||||||||
Customer contracts, customer lists and distribution agreements | $ | 5,289 | $ | (3,228 | ) | $ | (856 | ) | $ | 1,205 | $ | 5,321 | $ | (2,709 | ) | $ | (856 | ) | $ | 1,756 | $ | 5,311 | $ | (3,674 | ) | $ | (856 | ) | $ | 781 | $ | 5,289 | $ | (3,228 | ) | $ | (856 | ) | $ | 1,205 | ||||||||||
Developed and core technology and patents | 4,266 | (1,301 | ) | (2,138 | ) | 827 | 5,331 | (1,966 | ) | (2,138 | ) | 1,227 | 4,312 | (1,165 | ) | (2,138 | ) | 1,009 | 4,266 | (1,301 | ) | (2,138 | ) | 827 | ||||||||||||||||||||||||||
Trade name and trade marks | 1,693 | (261 | ) | (1,336 | ) | 96 | 1,730 | (211 | ) | (1,336 | ) | 183 | 1,458 | (57 | ) | (1,336 | ) | 65 | 1,693 | (261 | ) | (1,336 | ) | 96 | ||||||||||||||||||||||||||
In-process research and development | — | — | — | — | 3 | — | — | 3 | 159 | — | — | 159 | — | — | — | — | ||||||||||||||||||||||||||||||||||
| | | | | | | | | | | | | | | | | | | | | | | | | | | | | | | | | | | | | | | | | | | | ||||||||
Total intangible assets | $ | 11,248 | $ | (4,790 | ) | $ | (4,330 | ) | $ | 2,128 | $ | 12,385 | $ | (4,886 | ) | $ | (4,330 | ) | $ | 3,169 | $ | 11,240 | $ | (4,896 | ) | $ | (4,330 | ) | $ | 2,014 | $ | 11,248 | $ | (4,790 | ) | $ | (4,330 | ) | $ | 2,128 | ||||||||||
| | | | | | | | | | | | | | | | | | | | | | | | | | | | | | | | | | | | | | | | | | | | | |||||||
| | | | | | | | | | | | | | | | | | | | | | | | | | | |||||||||||||||||||||||||
ForIn fiscal 2015, the decrease in gross intangible assets was due primarily to $936 million of intangible assets that became fully amortized, partially offset by intangible assets and IPR&D resulting from HP's acquisitions, primarily the acquisition of Aruba. Fully amortized intangible assets have been eliminated from gross intangible assets and accumulated amortization during the period.
In fiscal 2014, $855 million of intangible assets became fully amortized and have been eliminated from gross intangible assets and accumulated amortization. HP also eliminated gross intangible assets and accumulated amortization related to the sale of a portfolio of intellectual property ("IP") in the first quarter of fiscal 2014.
For fiscal 2013, the majority of the decrease in gross intangible assets was related to $1.7 billion of fully amortized intangible assets that were eliminated from both the gross and accumulated amounts.
In fiscal 2012, HP recorded total intangible asset impairment charges of $4.3 billion, of which $3.1 billion was related to the Autonomy reporting unit as described above. The remaining $1.2 billion was related to a change in the Compaq branding strategy. In May 2012, HP approved a change to its branding strategy for PCs, which has resulted in a more limited and focused use of the "Compaq" trade name acquired in fiscal 2002. In conjunction with the change in branding strategy, HP revised its assumption as to the useful life of that intangible asset, which resulted in a reclassification of the asset from an indefinite-lived intangible to a finite- lived intangible. These changes triggered an impairment review of the "Compaq" trade name intangible asset. In conducting an impairment review of an intangible asset, HP compares the fair value of the asset to its carrying amount. If the fair value of the asset is less than the carrying amount, the difference is recorded as an impairment loss. HP estimated the fair value of the "Compaq" trade name by calculating the present value of the royalties saved that would have been paid to a third party had HP not owned the trade name. Following the completion of that analysis, HP determined that the fair value of the trade name asset was less than the carrying amount due primarily to the change in the useful life assumption and a decrease in expected future revenues related to Compaq-branded products resulting from the more focused branding strategy. As a result, HP recorded an impairment charge of $1.2 billion in the third quarter of fiscal 2012, which was included in the Impairment of goodwill and intangible assets line item in the Consolidated Statements of Earnings.
HEWLETT-PACKARD COMPANY AND SUBSIDIARIES
Notes to Consolidated Financial Statements (Continued)
Note 9: Acquisitions, Goodwill and Intangible Assets (Continued)
The weighted-average useful lives of intangible assets as of October 31, 2015 are as follows:
Finite-Lived Intangible Assets | Weighted-Average Useful Lives | |||
|---|---|---|---|---|
| | In years | |||
Customer contracts, customer lists and distribution agreements | 8 | |||
Developed and core technology and patents | ||||
Trade name and trade marks | 7 | |||
HP INC. AND SUBSIDIARIES
Notes to Consolidated Financial Statements (Continued)
Note 10: Goodwill and Intangible Assets (Continued)
As of October 31, 2014,2015, estimated future amortization expense related to finite-lived intangible assets was as follows:
Fiscal year | In millions | In millions | ||||||
|---|---|---|---|---|---|---|---|---|
2015 | $ | 872 | ||||||
2016 | 653 | $ | 773 | |||||
2017 | 244 | 353 | ||||||
2018 | 147 | 253 | ||||||
2019 | 110 | 213 | ||||||
2020 | 181 | |||||||
Thereafter | 102 | 82 | ||||||
| | | | | | | | | |
Total | $ | 2,128 | $ | 1,855 | ||||
| | | | | | | | | |
| | | | | | ||||
Fair value is defined as the price that would be received to sell an asset or paid to transfer a liability (an exit price) in an orderly transaction between market participants at the measurement date.
Fair Value Hierarchy
HP uses valuation techniques that are based upon observable and unobservable inputs. Observable inputs are developed using market data such as publicly available information and reflect the assumptions market participants would use, while unobservable inputs are developed using the best information available about the assumptions market participants would use. Assets and liabilities are classified in the fair value hierarchy based on the lowest level input that is significant to the fair value measurement:
Level 1—Quoted prices (unadjusted) in active markets for identical assets or liabilities.
Level 2—Quoted prices for similar assets or liabilities in active markets, quoted prices for identical or similar assets or liabilities in markets that are not active, inputs other than quoted prices that are observable for the asset or liability and market-corroborated inputs.
Level 3—Unobservable inputs for the asset or liability.
The fair value hierarchy gives the highest priority to observable inputs and lowest priority to unobservable inputs.
HEWLETT-PACKARD COMPANYHP INC. AND SUBSIDIARIES
Notes to Consolidated Financial Statements (Continued)
Note 10:11: Fair Value (Continued)
The following table presents HP's assets and liabilities that are measured at fair value on a recurring basis:
| | As of October 31, 2014 | As of October 31, 2013 | As of October 31, 2015 | As of October 31, 2014 | ||||||||||||||||||||||||||||||||||||||||||||||
|---|---|---|---|---|---|---|---|---|---|---|---|---|---|---|---|---|---|---|---|---|---|---|---|---|---|---|---|---|---|---|---|---|---|---|---|---|---|---|---|---|---|---|---|---|---|---|---|---|---|---|
| | Fair Value Measured Using | | Fair Value Measured Using | | Fair Value Measured Using | | Fair Value Measured Using | | ||||||||||||||||||||||||||||||||||||||||||
| | Level 1 | Level 2 | Level 3 | Total | Level 1 | Level 2 | Level 3 | Total | Level 1 | Level 2 | Level 3 | Total | Level 1 | Level 2 | Level 3 | Total | ||||||||||||||||||||||||||||||||||
| | In millions | In millions | ||||||||||||||||||||||||||||||||||||||||||||||||
Assets | ||||||||||||||||||||||||||||||||||||||||||||||||||
Cash Equivalents and Investments: | ||||||||||||||||||||||||||||||||||||||||||||||||||
Time deposits | $ | — | $ | 2,865 | $ | — | $ | 2,865 | $ | — | $ | 2,221 | $ | — | $ | 2,221 | $ | — | $ | 3,584 | $ | — | $ | 3,584 | $ | — | $ | 2,865 | $ | — | $ | 2,865 | ||||||||||||||||||
Money market funds | 9,857 | — | — | 9,857 | 6,819 | — | — | 6,819 | 8,895 | — | — | 8,895 | 9,857 | — | — | 9,857 | ||||||||||||||||||||||||||||||||||
Mutual funds | — | 244 | — | 244 | — | 313 | — | 313 | — | 246 | — | 246 | — | 244 | — | 244 | ||||||||||||||||||||||||||||||||||
Marketable equity securities | 14 | 5 | — | 19 | 10 | 5 | — | 15 | 52 | 10 | — | 62 | 14 | 5 | — | 19 | ||||||||||||||||||||||||||||||||||
Foreign bonds | 9 | 367 | — | 376 | 9 | 387 | — | 396 | 8 | 347 | — | 355 | 9 | 367 | — | 376 | ||||||||||||||||||||||||||||||||||
Other debt securities | — | 1 | 46 | 47 | — | 2 | 47 | 49 | — | 2 | 40 | 42 | — | 1 | 46 | 47 | ||||||||||||||||||||||||||||||||||
Derivatives: | ||||||||||||||||||||||||||||||||||||||||||||||||||
Derivative Instruments: | ||||||||||||||||||||||||||||||||||||||||||||||||||
Interest rate contracts | — | 105 | — | 105 | — | 156 | — | 156 | — | 38 | — | 38 | — | 105 | — | 105 | ||||||||||||||||||||||||||||||||||
Foreign exchange contracts | — | 862 | 6 | 868 | — | 284 | 3 | 287 | — | 1,029 | 2 | 1,031 | — | 862 | 6 | 868 | ||||||||||||||||||||||||||||||||||
Other derivatives | — | 7 | — | 7 | — | 9 | — | 9 | — | 8 | — | 8 | — | 7 | — | 7 | ||||||||||||||||||||||||||||||||||
| | | | | | | | | | | | | | | | | | | | | | | | | | | | | | | | | | | | | | | | | | | | ||||||||
Total assets | $ | 9,880 | $ | 4,456 | $ | 52 | $ | 14,388 | $ | 6,838 | $ | 3,377 | $ | 50 | $ | 10,265 | $ | 8,955 | $ | 5,264 | $ | 42 | $ | 14,261 | $ | 9,880 | $ | 4,456 | $ | 52 | $ | 14,388 | ||||||||||||||||||
| | | | | | | | | | | | | | | | | | | | | | | | | | | | | | | | | | | | | | | | | | | | | |||||||
| | | | | | | | | | | | | | | | | | | | | | | | | | | |||||||||||||||||||||||||
Liabilities | ||||||||||||||||||||||||||||||||||||||||||||||||||
Derivatives: | ||||||||||||||||||||||||||||||||||||||||||||||||||
Derivative Instruments: | ||||||||||||||||||||||||||||||||||||||||||||||||||
Interest rate contracts | $ | — | $ | 55 | $ | — | $ | 55 | $ | — | $ | 107 | $ | — | $ | 107 | $ | — | $ | 55 | $ | — | $ | 55 | $ | — | $ | 55 | $ | — | $ | 55 | ||||||||||||||||||
Foreign exchange contracts | — | 348 | 2 | 350 | — | 547 | 2 | 549 | — | 439 | 2 | 441 | — | 348 | 2 | 350 | ||||||||||||||||||||||||||||||||||
| | | | | | | | | | | | | | | | | | | | | | | | | | | | | | | | | | | | | | | | | | | | ||||||||
Total liabilities | $ | — | $ | 403 | $ | 2 | $ | 405 | $ | — | $ | 654 | $ | 2 | $ | 656 | $ | — | $ | 494 | $ | 2 | $ | 496 | $ | — | $ | 403 | $ | 2 | $ | 405 | ||||||||||||||||||
| | | | | | | | | | | | | | | | | | | | | | | | | | | | | | | | | | | | | | | | | | | | | |||||||
| | | | | | | | | | | | | | | | | | | | | | | | | | | |||||||||||||||||||||||||
For the year ended October 31, 2014, thereThere were no transfers between levels within the fair value hierarchy.hierarchy during fiscal 2015 and 2014.
Valuation Techniques
Cash Equivalents and Investments: HP holds time deposits, money market funds, mutual funds, other debt securities primarily consisting of corporate and foreign government notes and bonds, and common stock and equivalents. HP values cash equivalents and equity investments using quoted market prices, alternative pricing sources, including NAV, or models utilizing market observable inputs. The fair value of debt investments was based on quoted market prices or model-driven valuations using inputs primarily derived from or corroborated by observable market data, and, in certain instances, valuation models that utilize assumptions which cannot be corroborated with observable market data.
Derivative Instruments: HP uses forward contracts, interest rate and total return swaps, and option contracts to hedge certain foreign currency and interest rate exposures. HP uses industry standard valuation models to measure fair value. Where applicable, these models project future cash flows and discount the future amounts to present value using market-based observable inputs, including interest rate curves, HP and counterparty credit risk, foreign exchangecurrency rates, and forward and spot prices for currencies and interest rates. See Note 1112 for a further discussion of HP's use of derivative instruments.
HEWLETT-PACKARD COMPANYHP INC. AND SUBSIDIARIES
Notes to Consolidated Financial Statements (Continued)
Note 10:11: Fair Value (Continued)
Other Fair Value Disclosures
Short- and Long-Term Debt: HP estimates the fair value of its debt primarily using an expected present value technique, which is based on observable market inputs using interest rates currently available to companies of similar credit standing for similar terms and remaining maturities, and considering its own credit risk. The portion of HP's debt that is hedged is reflected in the Consolidated Balance Sheets as an amount equal to the debt's carrying amount and a fair value adjustment representing changes in the fair value of the hedged debt obligations arising from movements in benchmark interest rates. The estimated fair value of HP's short- and long-term debt approximated its carrying amount of $24.7 billion at October 31, 2015. The estimated fair value of HP's short- and long-term debt was $19.9 billion at October 31, 2014, compared to its carrying amount of $19.5 billion at that date. The estimated fair value of HP's short- and long-term debt was $22.7 billion at October 31, 2013, compared to its carrying amount of $22.6 billion at that date. If measured at fair value in the Consolidated Balance Sheets, short- and long-term debt would be classified in Level 2 of the fair value hierarchy.
Other Financial Instruments: For the balance of HP's financial instruments, primarily accounts receivable, accounts payable and financial liabilities included in other accrued liabilities, the carrying amounts approximate fair value due to their short maturities. If measured at fair value in the Consolidated Balance Sheets, these other financial instruments would be classified in Level 2 or Level 3 of the fair value hierarchy.
Non-Marketable Equity Investments and Non-Financial Assets: Elements within HP's non-marketable equity investments and non-financial assets, such as goodwill, intangible assets goodwill and property, plant and equipment, are recorded at fair value in the period an impairment charge is recognized. If measured at fair value in the Consolidated Balance Sheets, these would generally be classified in Level 3 of the fair value hierarchy.
In fiscal 2012,2015, HP recognizeddetermined that it would exit certain data centers. HP conducted an analysis of the respective asset group to determine if the carrying value is greater than the fair value. As a goodwill and intangible assetresult of this assessment, HP recorded a $136 million impairment charge to Impairment of $8.8 billion associated with the Autonomy reporting unit, a goodwill impairment charge of $8.0 billion associated with the ES reporting unit, and an intangible asset impairment charge of $1.2 billion associated with the Compaq trade name. The fair value of these reporting units was classified in Level 3 of the fair value hierarchy due to the significance of unobservable inputs developed using company-specific information. HP used the income approach to measure the fair value of the ES and Autonomy reporting units. Under the income approach, HP calculated the fair value of a reporting unit baseddata center assets on the present valueConsolidated Statements of the estimated future cash flows. Cash flow projections were based on management's estimates of revenue growth rates and operating margins, taking into consideration industry and market conditions. The discount rate used was based on the weighted-average cost of capital adjusted for the relevant risk associated with business-specific characteristics and the uncertainty related to the business's ability to execute on the projected cash flows. The discount rate also reflected adjustments required when comparing the sum of the fair values of HP's reporting units to HP's market capitalization as discussed in Note 9. The unobservable inputs used to estimate the fair value these reporting units included projected revenue growth rates, profitability and the risk factor added to the discount rate.
The inputs used to estimate the fair value of the intangible assets of Autonomy and the "Compaq" trade name were largely unobservable, and, accordingly, these measurements were classified in Level 3 of the fair value hierarchy. The fair value of the intangible assets for Autonomy were estimated using an income approach, which is based on management's cash flow projections of revenue growth rates and operating margins, taking into consideration industry and market conditions. HP estimated the fair value of the "Compaq" trade name by calculating the present value of the royalties saved that wouldEarnings.
HEWLETT-PACKARD COMPANYHP INC. AND SUBSIDIARIES
Notes to Consolidated Financial Statements (Continued)
Note 10: Fair Value (Continued)
have been paid to a third party had HP not owned the trade name. The discount rates used in the fair value calculations for the Autonomy intangibles and the "Compaq" trade name were based on a weighted average cost of capital adjusted for the relevant risk associated with those assets. The unobservable inputs used in these valuations include projected revenue growth rates, operating margins, royalty rates and the risk factor added to the discount rate. The discount rates ranged from 11% to 16%. Projected revenue growth rates ranged from (61)% to 13%. The (61)% rate reflected the significant decline in expected future revenues for Compaq-branded products from fiscal 2013 to fiscal 2014 due to the change in branding strategy discussed in Note 9.
Note 11:12: Financial Instruments
Cash Equivalents and Available-for-Sale Investments
Cash equivalents and available-for-sale investments were as follows:
| | As of October 31, 2014 | As of October 31, 2013 | As of October 31, 2015 | As of October 31, 2014 | ||||||||||||||||||||||||||||||||||||||||||||||
|---|---|---|---|---|---|---|---|---|---|---|---|---|---|---|---|---|---|---|---|---|---|---|---|---|---|---|---|---|---|---|---|---|---|---|---|---|---|---|---|---|---|---|---|---|---|---|---|---|---|---|
| | Cost | Gross Unrealized Gain | Gross Unrealized Loss | Fair Value | Cost | Gross Unrealized Gain | Gross Unrealized Loss | Fair Value | Cost | Gross Unrealized Gain | Gross Unrealized Loss | Fair Value | Cost | Gross Unrealized Gain | Gross Unrealized Loss | Fair Value | ||||||||||||||||||||||||||||||||||
| | In millions | In millions | ||||||||||||||||||||||||||||||||||||||||||||||||
Cash Equivalents: | ||||||||||||||||||||||||||||||||||||||||||||||||||
Time deposits | $ | 2,720 | $ | — | $ | — | $ | 2,720 | $ | 2,207 | $ | — | $ | — | $ | 2,207 | $ | 3,478 | $ | — | $ | — | $ | 3,478 | $ | 2,720 | $ | — | $ | — | $ | 2,720 | ||||||||||||||||||
Money market funds | 9,857 | — | — | 9,857 | 6,819 | — | — | 6,819 | 8,895 | — | — | 8,895 | 9,857 | — | — | 9,857 | ||||||||||||||||||||||||||||||||||
Mutual funds | 110 | — | — | 110 | 13 | — | — | 13 | 173 | — | — | 173 | 110 | — | — | 110 | ||||||||||||||||||||||||||||||||||
| | | | | | | | | | | | | | | | | | | | | | | | | | | | | | | | | | | | | | | | | | | | ||||||||
Total cash equivalents | 12,687 | — | — | 12,687 | 9,039 | — | — | 9,039 | 12,546 | — | — | 12,546 | 12,687 | — | — | 12,687 | ||||||||||||||||||||||||||||||||||
| | | | | | | | | | | | | | | | | | | | | | | | | | | | | | | | | | | | | | | | | | | | ||||||||
Available-for-Sale Investments: | ||||||||||||||||||||||||||||||||||||||||||||||||||
Debt securities: | ||||||||||||||||||||||||||||||||||||||||||||||||||
Time deposits | 145 | — | — | 145 | 14 | — | — | 14 | 106 | — | — | 106 | 145 | — | — | 145 | ||||||||||||||||||||||||||||||||||
Foreign bonds | 286 | 90 | — | 376 | 310 | 86 | — | 396 | 276 | 79 | — | 355 | 286 | 90 | — | 376 | ||||||||||||||||||||||||||||||||||
Other debt securities | 61 | — | (14 | ) | 47 | 64 | — | (15 | ) | 49 | 55 | — | (13 | ) | 42 | 61 | — | (14 | ) | 47 | ||||||||||||||||||||||||||||||
| | | | | | | | | | | | | | | | | | | | | | | | | | | | | | | | | | | | | | | | | | | | ||||||||
Total debt securities | 492 | 90 | (14 | ) | 568 | 388 | 86 | (15 | ) | 459 | 437 | 79 | (13 | ) | 503 | 492 | 90 | (14 | ) | 568 | ||||||||||||||||||||||||||||||
| | | | | | | | | | | | | | | | | | | | | | | | | | | | | | | | | | | | | | | | | | | | ||||||||
Equity securities: | ||||||||||||||||||||||||||||||||||||||||||||||||||
Mutual funds | 134 | — | — | 134 | 300 | — | — | 300 | 73 | — | — | 73 | 134 | — | — | 134 | ||||||||||||||||||||||||||||||||||
Equity securities in public companies | 8 | 7 | — | 15 | 5 | 6 | — | 11 | 58 | 9 | (9 | ) | 58 | 8 | 7 | — | 15 | |||||||||||||||||||||||||||||||||
| | | | | | | | | | | | | | | | | | | | | | | | | | | | | | | | | | | | | | | | | | | | ||||||||
Total equity securities | 142 | 7 | — | 149 | 305 | 6 | — | 311 | 131 | 9 | (9 | ) | 131 | 142 | 7 | — | 149 | |||||||||||||||||||||||||||||||||
| | | | | | | | | | | | | | | | | | | | | | | | | | | | | | | | | | | | | | | | | | | | ||||||||
Total available-for-sale investments | 634 | 97 | (14 | ) | 717 | 693 | 92 | (15 | ) | 770 | 568 | 88 | (22 | ) | 634 | 634 | 97 | (14 | ) | 717 | ||||||||||||||||||||||||||||||
| | | | | | | | | | | | | | | | | | | | | | | | | | | | | | | | | | | | | | | | | | | | ||||||||
Total cash equivalents and available-for-sale investments | $ | 13,321 | $ | 97 | $ | (14 | ) | $ | 13,404 | $ | 9,732 | $ | 92 | $ | (15 | ) | $ | 9,809 | $ | 13,114 | $ | 88 | $ | (22 | ) | $ | 13,180 | $ | 13,321 | $ | 97 | $ | (14 | ) | $ | 13,404 | ||||||||||||||
| | | | | | | | | | | | | | | | | | | | | | | | | | | | | | | | | | | | | | | | | | | | | |||||||
| | | | | | | | | | | | | | | | | | | | | | | | | | | |||||||||||||||||||||||||
HEWLETT-PACKARD COMPANY AND SUBSIDIARIES
Notes to Consolidated Financial Statements (Continued)
Note 11: Financial Instruments (Continued)
All highly liquid investments with original maturities of three months or less at the date of acquisition are considered cash equivalents. As of October 31, 20142015 and October 31, 2013,2014, the carrying amount of cash equivalents approximated fair value due to the short period of time to maturity. Interest income related to cash, cash equivalents and debt securities was approximately $129 million in fiscal 2015, $136 million in fiscal 2014 and $148 million in fiscal 2013 and $155 million in fiscal 2012.2013. Time deposits were primarily issued by institutions outside the U.S. as of October 31, 20142015 and October 31, 2013.2014. The estimated fair value of the available-for-sale investments may not be representative of values that will be realized in the future.
The gross unrealized loss as of October 31, 20142015 and October 31, 20132014 was due primarily to decline in the fair value of a debt security of $14$13 million and $15$14 million, respectively, that has been in a continuous loss position for more than twelve months. HP does not intend to sell this debt security, and it is not likely that HP will be required to sell this debt security prior to the recovery of the amortized cost.
HP INC. AND SUBSIDIARIES
Notes to Consolidated Financial Statements (Continued)
Note 12: Financial Instruments (Continued)
Contractual maturities of investments in available-for-sale debt securities were as follows:
| | As of October 31, 2014 | As of October 31, 2015 | ||||||||||||
|---|---|---|---|---|---|---|---|---|---|---|---|---|---|---|
| | Amortized Cost | Fair Value | Amortized Cost | Fair Value | ||||||||||
| | In millions | In millions | ||||||||||||
Due in one year | $ | 129 | $ | 129 | $ | 104 | $ | 104 | ||||||
Due in one to five years | 3 | 3 | 14 | 14 | ||||||||||
Due in more than five years | 360 | 436 | 319 | 385 | ||||||||||
| | | | | | | | | | | | | | ||
| $ | 492 | $ | 568 | |||||||||||
| $ | 437 | $ | 503 | |||||||||||
| | | | | | | | | | | | | | | |
| | | | | | | | | |||||||
Equity securities in privately held companies include cost basis and equity method investments and are included in Long-term financing receivables and other assets in the Consolidated Balance Sheets. These amounted to $97$58 million and $50$97 million at October 31, 20142015 and October 31, 2013,2014, respectively.
Derivative Instruments
HP is a global company exposed to foreign currency exchange rate fluctuations and interest rate changes in the normal course of its business. As part of its risk management strategy, HP uses derivative instruments, primarily forward contracts, option contracts, interest rate swaps, and total return swaps and, at times, option contracts to hedge certain foreign currency, interest rate and, to a lesser extent, equity exposures. HP's objective is to offset gains and losses resulting from these exposures with losses and gains on the derivative contracts used to hedge them, thereby reducing volatility of earnings or protecting the fair value of assets and liabilities. HP does not have any leveraged derivatives and does not use derivative contracts for speculative purposes. HP may designate its derivative contracts as fair value hedges, cash flow hedges or hedges of the foreign currency exposure of a net investment in a foreign operation ("net investment hedges"). Additionally, for derivatives not designated as hedging instruments, HP categorizes those economic hedges as other derivatives. HP recognizes all derivative instruments at fair value in the Consolidated Balance Sheets. HP classifies cash flows from its derivative programs as operatingwith the activities that correspond to the underlying hedged items in the Consolidated Statements of Cash Flows.
As a result of its use of derivative instruments, HP is exposed to the risk that its counterparties will fail to meet their contractual obligations. To mitigate counterparty credit risk, HP has a policy of only entering into derivative contracts with carefully selected major financial institutions based on their
HEWLETT-PACKARD COMPANY AND SUBSIDIARIES
Notes to Consolidated Financial Statements (Continued)
Note 11: Financial Instruments (Continued)
credit ratings and other factors, and HP maintains dollar risk limits that correspond to each financial institution's credit rating and other factors. HP's established policies and procedures for mitigating credit risk include reviewing and establishing limits for credit exposure and periodically re-assessingreassessing the creditworthiness of its counterparties. Master netting agreements further mitigate credit exposure to counterparties by permitting HP to net amounts due from HP to counterparty against amounts due to HP from the same counterparty under certain conditions.
To further mitigate credit exposure to counterparties, HP has collateral security agreements that allow HP to hold collateral from, or require HP to post collateral to, counterparties when aggregate derivative fair values exceed contractually established thresholds which are generally based on the credit ratings of HP and its counterparties. If HP's or the counterparty's credit rating falls below a specified credit rating, either party has the right to request full collateralization of the derivatives' net liability
HP INC. AND SUBSIDIARIES
Notes to Consolidated Financial Statements (Continued)
Note 12: Financial Instruments (Continued)
position. Collateral is generally posted within two business days. The fair value of derivatives with credit contingent features in a net liability position was $38$173 million and $207$38 million at October 31, 20142015 and October 31, 2013,2014, respectively, all of which were fully collateralized within two business days.
Under HP's derivative contracts, the counterparty can terminate all outstanding trades following a covered change of control event affecting HP that results in the surviving entity being rated below a specified credit rating. This credit contingent provision did not affect HP's financial position or cash flows as of October 31, 20142015 and October 31, 2013.2014.
Fair Value Hedges
HP issues long-term debt primarily in U.S. dollars based on market conditions at the time of financing. HP may enter into fair value hedges, such as interest rate swaps, to reduce the exposure of its debt portfolio to changes in fair value resulting from changes in interest rates by achieving a primarily U.S. dollar LIBOR-basedLondon Interbank Offered Rate ("LIBOR")-based floating interest expense. The swap transactions generally involve principal and interest obligations for U.S. dollar-denominated amounts. Alternatively, HP may choose not to swap fixed for floating interest payments or may terminate a previously executed swap if it believes a larger proportion of fixed-rate debt would be beneficial.
When investing in fixed-rate instruments, HP may enter into interest rate swaps that convert the fixed interest payments into variable interest payments and may designate these swaps as fair value hedges.
For derivative instruments that are designated and qualify as fair value hedges, HP recognizes the change in fair value of the derivative instrument, as well as the offsetting change in the fair value of the hedged item, in Interest and other, net in the Consolidated Statements of Earnings in the period of change.
Cash Flow Hedges
HP uses a combination of forward contracts and at times, option contracts designated as cash flow hedges to protect against the foreign currency exchange rate risks inherent in its forecasted net revenue and, to a lesser extent, cost of sales, operating expenses, and intercompany loans denominated in currencies other than the U.S. dollar. HP's foreign currency cash flow hedges mature generally within twelve months; however, hedges related to longer term procurement arrangements extend several years and forward contracts associated with sales-type and direct-financing leases and intercompany loans extend for the duration of the lease or loan term, which typically range from two to five years.
HEWLETT-PACKARD COMPANY AND SUBSIDIARIES
Notes to Consolidated Financial Statements (Continued)
Note 11: Financial Instruments (Continued)
For derivative instruments that are designated and qualify as cash flow hedges, HP initially records changes in fair value for the effective portion of the derivative instrument in Accumulated other comprehensive loss as a separate component of stockholders' equity in the Consolidated Balance Sheets and subsequently reclassifies these amounts into earnings in the period during which the hedged transaction is recognized in earnings. HP reports the effective portion of its cash flow hedges in the same financial statement line item as changes in the fair value of the hedged item.
HP INC. AND SUBSIDIARIES
Notes to Consolidated Financial Statements (Continued)
Note 12: Financial Instruments (Continued)
Net Investment Hedges
HP uses forward contracts designated as net investment hedges to hedge net investments in certain foreign subsidiaries whose functional currency is the local currency. HP records the effective portion of such derivative instruments together with changes in the fair value of the hedged items in Cumulative translation adjustment as a separate component of stockholders' equity in the Consolidated Balance Sheets.
Other Derivatives
Other derivatives not designated as hedging instruments consist primarily of forward contracts used to hedge foreign currency-denominated balance sheet exposures. HP also uses total return swaps and, to a lesser extent, interest rate swaps, based on equity or fixed income indices, to hedge its executive deferred compensation plan liability.
For derivative instruments not designated as hedging instruments, HP recognizes changes in fair value of the derivative instrument, as well as the offsetting change in the fair value of the hedged item, in Interest and other, net in the Consolidated Statements of Earnings in the period of change.
Hedge Effectiveness
For interest rate swaps designated as fair value hedges, HP measures hedge effectiveness by offsetting the change in fair value of the hedged instrumentitem with the change in fair value of the derivative. For foreign currency options and forward contracts designated as cash flow or net investment hedges, HP measures hedge effectiveness by comparing the cumulative change in fair value of the hedge contract with the cumulative change in fair value of the hedged item, both of which are based on forward rates. HP recognizes any ineffective portion of the hedge in the Consolidated Statements of Earnings in the same period in which ineffectiveness occurs. Amounts excluded from the assessment of effectiveness are recognized in the Consolidated Statements of Earnings in the period they arise.
HEWLETT-PACKARD COMPANYHP INC. AND SUBSIDIARIES
Notes to Consolidated Financial Statements (Continued)
Note 11:12: Financial Instruments (Continued)
Fair Value of Derivative Instruments in the Consolidated Balance Sheets
The gross notional and fair value of derivative instruments in the Consolidated Balance Sheets was as follows:
| | As of October 31, 2014 | As of October 31, 2013 | As of October 31, 2015 | As of October 31, 2014 | ||||||||||||||||||||||||||||||||||||||||||||||||||||||||||
|---|---|---|---|---|---|---|---|---|---|---|---|---|---|---|---|---|---|---|---|---|---|---|---|---|---|---|---|---|---|---|---|---|---|---|---|---|---|---|---|---|---|---|---|---|---|---|---|---|---|---|---|---|---|---|---|---|---|---|---|---|---|---|
| | Outstanding Gross Notional | Other Current Assets | Long-Term Financing Receivables and Other Assets | Other Accrued Liabilities | Long-Term Other Liabilities | Outstanding Gross Notional | Other Current Assets | Long-Term Financing Receivables and Other Assets | Other Accrued Liabilities | Long-Term Other Liabilities | Outstanding Gross Notional | Other Current Assets | Long-Term Financing Receivables and Other Assets | Other Accrued Liabilities | Long-Term Other Liabilities | Outstanding Gross Notional | Other Current Assets | Long-Term Financing Receivables and Other Assets | Other Accrued Liabilities | Long-Term Other Liabilities | ||||||||||||||||||||||||||||||||||||||||||
| | In millions | In millions | ||||||||||||||||||||||||||||||||||||||||||||||||||||||||||||
Derivatives designated as hedging instruments | ||||||||||||||||||||||||||||||||||||||||||||||||||||||||||||||
Fair value hedges: | ||||||||||||||||||||||||||||||||||||||||||||||||||||||||||||||
Interest rate contracts | $ | 10,800 | $ | 3 | $ | 102 | $ | — | $ | 55 | $ | 11,100 | $ | 31 | $ | 125 | $ | — | $ | 107 | $ | 12,675 | $ | 1 | $ | 37 | $ | — | $ | 55 | $ | 10,800 | $ | 3 | $ | 102 | $ | — | $ | 55 | ||||||||||||||||||||||
Cash flow hedges: | ||||||||||||||||||||||||||||||||||||||||||||||||||||||||||||||
Foreign currency contracts | 20,196 | 539 | 124 | 131 | 94 | 22,463 | 79 | 40 | 341 | 80 | 19,551 | 467 | 216 | 193 | 87 | 20,196 | 539 | 124 | 131 | 94 | ||||||||||||||||||||||||||||||||||||||||||
Net investment hedges: | ||||||||||||||||||||||||||||||||||||||||||||||||||||||||||||||
Foreign currency contracts | 1,952 | 44 | 47 | 10 | 8 | 1,920 | 30 | 40 | 20 | 12 | 1,860 | 114 | 66 | 7 | 4 | 1,952 | 44 | 47 | 10 | 8 | ||||||||||||||||||||||||||||||||||||||||||
| | | | | | | | | | | | | | | | | | | | | | | | | | | | | | | | | | | | | | | | | | | | | | | | | | | | | | ||||||||||
Total derivatives designated as hedging instruments | 32,948 | 586 | 273 | 141 | 157 | 35,483 | 140 | 205 | 361 | 199 | 34,086 | 582 | 319 | 200 | 146 | 32,948 | 586 | 273 | 141 | 157 | ||||||||||||||||||||||||||||||||||||||||||
| | | | | | | | | | | | | | | | | | | | | | | | | | | | | | | | | | | | | | | | | | | | | | | | | | | | | | ||||||||||
Derivatives not designated as hedging instruments | ||||||||||||||||||||||||||||||||||||||||||||||||||||||||||||||
Foreign currency contracts | 21,384 | 82 | 32 | 82 | 25 | 16,048 | 72 | 26 | 76 | 20 | 18,238 | 79 | 89 | 87 | 63 | 21,384 | 82 | 32 | 82 | 25 | ||||||||||||||||||||||||||||||||||||||||||
Other derivatives | 361 | 6 | 1 | — | — | 344 | 8 | 1 | — | — | 300 | 8 | — | — | — | 361 | 6 | 1 | — | — | ||||||||||||||||||||||||||||||||||||||||||
| | | | | | | | | | | | | | | | | | | | | | | | | | | | | | | | | | | | | | | | | | | | | | | | | | | | | | ||||||||||
Total derivatives not designated as hedging instruments | 21,745 | 88 | 33 | 82 | 25 | 16,392 | 80 | 27 | 76 | 20 | 18,538 | 87 | 89 | 87 | 63 | 21,745 | 88 | 33 | 82 | 25 | ||||||||||||||||||||||||||||||||||||||||||
| | | | | | | | | | | | | | | | | | | | | | | | | | | | | | | | | | | | | | | | | | | | | | | | | | | | | | ||||||||||
Total derivatives | $ | 54,693 | $ | 674 | $ | 306 | $ | 223 | $ | 182 | $ | 51,875 | $ | 220 | $ | 232 | $ | 437 | $ | 219 | $ | 52,624 | $ | 669 | $ | 408 | $ | 287 | $ | 209 | $ | 54,693 | $ | 674 | $ | 306 | $ | 223 | $ | 182 | ||||||||||||||||||||||
| | | | | | | | | | | | | | | | | | | | | | | | | | | | | | | | | | | | | | | | | | | | | | | | | | | | | | | |||||||||
| | | | | | | | | | | | | | | | | | | | | | | | | | | | | | | | | |||||||||||||||||||||||||||||||
Offsetting of Derivative Instruments
HP recognizes all derivative instruments on a gross basis in the Consolidated Balance Sheets. HP does not offset the fair value of its derivative instruments against the fair value of cash collateral posted under its collateral security agreements. As of October 31, 2015 and 2014, and October 31, 2013,
HEWLETT-PACKARD COMPANY AND SUBSIDIARIES
Notes to Consolidated Financial Statements (Continued)
Note 11: Financial Instruments (Continued)
information related to the potential effect of HP's master netting agreements and collateral security agreements was as follows:
| | As of October 31, 2014 | ||||||||||||||||||
|---|---|---|---|---|---|---|---|---|---|---|---|---|---|---|---|---|---|---|---|
| | In the Consolidated Balance Sheets | | |||||||||||||||||
| | (i) | (ii) | (iii) = (i)-(ii) | (iv) | (v) | (vi) = (iii)-(iv)-(v) | |||||||||||||
| | | | | Gross Amounts Not Offset | | ||||||||||||||
| | Gross Amount Recognized | Gross Amount Offset | Net Amount Presented | Derivatives | Financial Collateral | Net Amount | |||||||||||||
| | In millions | ||||||||||||||||||
Derivative assets | $ | 980 | $ | — | $ | 980 | $ | 361 | $ | 452 | $ | 167 | |||||||
Derivative liabilities | $ | 405 | $ | — | $ | 405 | $ | 361 | $ | 29 | (1) | $ | 15 | ||||||
| | As of October 31, 2015 | ||||||||||||||||||
|---|---|---|---|---|---|---|---|---|---|---|---|---|---|---|---|---|---|---|---|
| | In the Consolidated Balance Sheets | | |||||||||||||||||
| | (vi) = (iii)–(iv)–(v) | ||||||||||||||||||
| | (i) | (ii) | (iii) = (i)–(ii) | (iv) | (v) | ||||||||||||||
| | | | | Gross Amounts Not Offset | | ||||||||||||||
| | Gross Amount Recognized | Gross Amount Offset | Net Amount Presented | Derivatives | Financial Collateral | Net Amount | |||||||||||||
| | In millions | ||||||||||||||||||
Derivative assets | $ | 1,077 | $ | — | $ | 1,077 | $ | 315 | $ | 640 | (1) | $ | 122 | ||||||
Derivative liabilities | $ | 496 | $ | — | $ | 496 | $ | 315 | $ | 19 | (2) | $ | 162 | ||||||
HP INC. AND SUBSIDIARIES
Notes to Consolidated Financial Statements (Continued)
Note 12: Financial Instruments (Continued)
| | As of October 31, 2014 | ||||||||||||||||||
|---|---|---|---|---|---|---|---|---|---|---|---|---|---|---|---|---|---|---|---|
| | In the Consolidated Balance Sheets | | |||||||||||||||||
| | (vi) = (iii)–(iv)–(v) | ||||||||||||||||||
| | (i) | (ii) | (iii) = (i)–(ii) | (iv) | (v) | ||||||||||||||
| | | | | Gross Amounts Not Offset | | ||||||||||||||
| | Gross Amount Recognized | Gross Amount Offset | Net Amount Presented | Derivatives | Financial Collateral | Net Amount | |||||||||||||
| | In millions | ||||||||||||||||||
Derivative assets | $ | 980 | $ | — | $ | 980 | $ | 361 | $ | 452 | (1) | $ | 167 | ||||||
Derivative liabilities | $ | 405 | $ | — | $ | 405 | $ | 361 | $ | 29 | (2) | $ | 15 | ||||||
| | As of October 31, 2013 | ||||||||||||||||||
|---|---|---|---|---|---|---|---|---|---|---|---|---|---|---|---|---|---|---|---|
| | In the Consolidated Balance Sheets | | |||||||||||||||||
| | (i) | (ii) | (iii) = (i)-(ii) | (iv) | (v) | (vi) = (iii)-(iv)-(v) | |||||||||||||
| | | | | Gross Amounts Not Offset | | ||||||||||||||
| | Gross Amount Recognized | Gross Amount Offset | Net Amount Presented | Derivatives | Financial Collateral | Net Amount | |||||||||||||
| | In millions | ||||||||||||||||||
Derivative assets | $ | 452 | $ | — | $ | 452 | $ | 372 | $ | 30 | $ | 50 | |||||||
Derivative liabilities | $ | 656 | $ | — | $ | 656 | $ | 372 | $ | 283 | (1) | $ | 1 | ||||||
Effect of Derivative Instruments on the Consolidated Statements of Earnings
The pre-tax effect of derivative instruments and related hedged items in a fair value hedging relationship for fiscal years ended October 31, 2015, 2014 2013 and 20122013 was as follows:
| | (Loss) Gain Recognized in Income on Derivative and Related Hedged Item | (Loss) Gain Recognized in Income on Derivative Instruments and Related Hedged Items | ||||||||||||||||||||||||||||||||||||||||||||||||
|---|---|---|---|---|---|---|---|---|---|---|---|---|---|---|---|---|---|---|---|---|---|---|---|---|---|---|---|---|---|---|---|---|---|---|---|---|---|---|---|---|---|---|---|---|---|---|---|---|---|---|
Derivative Instrument | Location | 2014 | 2013 | 2012 | Hedged Item | Location | 2014 | 2013 | 2012 | Location | 2015 | 2014 | 2013 | Hedged Item | Location | 2015 | 2014 | 2013 | ||||||||||||||||||||||||||||||||
| | | In millions | | | In millions | | In millions | | | In millions | ||||||||||||||||||||||||||||||||||||||||
Interest rate contracts | Interest and other, net | $ | 1 | $ | (270 | ) | $ | (130 | ) | Fixed-rate debt | Interest and other, net | $ | (1 | ) | $ | 270 | $ | 134 | Interest and other, net | $ | (67 | ) | $ | 1 | $ | (270 | ) | Fixed-rate debt | Interest and other, net | $ | 67 | $ | (1 | ) | $ | 270 | ||||||||||||||
HEWLETT-PACKARD COMPANY AND SUBSIDIARIES
Notes to Consolidated Financial Statements (Continued)
Note 11: Financial Instruments (Continued)
The pre-tax effect of derivative instruments in cash flow and net investment hedging relationships for fiscal years ended October 31, 2015, 2014 2013 and 20122013 was as follows:
| | Gain (Loss) Recognized in OCI on Derivatives (Effective Portion) | Gain (Loss) Reclassified from Accumulated OCI Into Earnings (Effective Portion) | Gain (Loss) Recognized in OCI on Derivatives (Effective Portion) | Gain (Loss) Reclassified from Accumulated OCI Into Earnings (Effective Portion) | ||||||||||||||||||||||||||||||||||||||
|---|---|---|---|---|---|---|---|---|---|---|---|---|---|---|---|---|---|---|---|---|---|---|---|---|---|---|---|---|---|---|---|---|---|---|---|---|---|---|---|---|---|---|
| | 2014 | 2013 | 2012 | Location | 2014 | 2013 | 2012 | 2015 | 2014 | 2013 | Location | 2015 | 2014 | 2013 | ||||||||||||||||||||||||||||
| | | In millions | | In millions | | In millions | | In millions | ||||||||||||||||||||||||||||||||||
Cash flow hedges: | ||||||||||||||||||||||||||||||||||||||||||
Foreign currency contracts | $ | 593 | $ | (53 | ) | $ | 415 | Net revenue | $ | (21 | ) | $ | 48 | $ | 423 | $ | 1,067 | $ | 593 | $ | (53 | ) | Net revenue | $ | 1,271 | $ | (21 | ) | $ | 48 | ||||||||||||
Foreign currency contracts | (203 | ) | (192 | ) | (65 | ) | Cost of products | (71 | ) | (165 | ) | (15 | ) | (176 | ) | (203 | ) | (192 | ) | Cost of products | (150 | ) | (71 | ) | (165 | ) | ||||||||||||||||
Foreign currency contracts | 7 | (19 | ) | (7 | ) | Other operating expenses | (9 | ) | 1 | (6 | ) | (3 | ) | 7 | (19 | ) | Other operating expenses | (7 | ) | (9 | ) | 1 | ||||||||||||||||||||
Foreign currency contracts | (60 | ) | 21 | (8 | ) | Interest and other, net | (50 | ) | 10 | (3 | ) | 203 | (60 | ) | 21 | Interest and other, net | 198 | (50 | ) | 10 | ||||||||||||||||||||||
| | | | | | | | | | | | | | | | | | | | | | | | | | | | | | | | | | ||||||||||
Total currency hedges | $ | 337 | $ | (243 | ) | $ | 335 | $ | (151 | ) | $ | (106 | ) | $ | 399 | $ | 1,091 | $ | 337 | $ | (243 | ) | $ | 1,312 | $ | (151 | ) | $ | (106 | ) | ||||||||||||
| | | | | | | | | | | | | | | | | | | | | | | | | | | | | | | | | | | |||||||||
| | | | | | | | | | | | | | | | | | | | | |||||||||||||||||||||||
Net investment hedges: | ||||||||||||||||||||||||||||||||||||||||||
Foreign currency contracts | $ | 57 | $ | 38 | $ | 37 | Interest and other, net | $ | — | $ | — | $ | — | $ | 228 | $ | 57 | $ | 38 | Interest and other, net | $ | — | $ | — | $ | — | ||||||||||||||||
| | | | | | | | | | | | | | | | | | | | | | | | | | | | | | | | | | | |||||||||
| | | | | | | | | | | | | | | | | | | | | |||||||||||||||||||||||
HP INC. AND SUBSIDIARIES
Notes to Consolidated Financial Statements (Continued)
Note 12: Financial Instruments (Continued)
As of October 31, 2015, 2014 and October 31, 2013, no portion of the hedging instruments' gain or loss was excluded from the assessment of effectiveness for fair value, cash flow or net investment hedges. As of October 31, 2012 the portion of the hedging instruments' gain or loss excluded from the assessment of effectiveness was not material for fair value, cash flow or net investment hedges. Hedge ineffectiveness for fair value, cash flow and net investment hedges was not material for fiscal 2015, 2014 2013 and 2012.2013.
As of October 31, 2014,2015, HP expects to reclassify an estimated net Accumulated other comprehensive gain of approximately $185$26 million, net of taxes, to earnings in the next twelve months along with the earnings effects of the related forecasted transactions associated with cash flow hedges.
The pre-tax effect of derivative instruments not designated as hedging instruments on the Consolidated Statements of Earnings for fiscal years ended October 31,2015, 2014 2013 and 20122013 was as follows:
| | Gain (Loss) Recognized in Income on Derivatives | Gain (Loss) Recognized in Income on Derivatives | ||||||||||||||||||||||
|---|---|---|---|---|---|---|---|---|---|---|---|---|---|---|---|---|---|---|---|---|---|---|---|---|
| | Location | 2014 | 2013 | 2012 | Location | 2015 | 2014 | 2013 | ||||||||||||||||
| | | In millions | | In millions | ||||||||||||||||||||
Foreign currency contracts | Interest and other, net | $ | 56 | $ | 166 | $ | 171 | Interest and other, net | $ | 304 | $ | 106 | $ | 156 | ||||||||||
Other derivatives | Interest and other, net | — | 11 | (32 | ) | Interest and other, net | — | — | 11 | |||||||||||||||
Interest rate contracts | Interest and other, net | — | 3 | 13 | Interest and other, net | — | — | 3 | ||||||||||||||||
| | | | | | | | | | | | | | | | | | | |||||||
Total | $ | 56 | $ | 180 | $ | 152 | $ | 304 | $ | 106 | $ | 170 | ||||||||||||
| | | | | | | | | | | | | | | | | | | | ||||||
| | | | | | | | | | | | ||||||||||||||
HEWLETT-PACKARD COMPANY AND SUBSIDIARIES
Notes to Consolidated Financial Statements (Continued)
Notes Payable and Short-Term Borrowings
Notes payable and short-term borrowings, including the current portion of long-term debt, were as follows:
| | 2014 | 2013 | 2015 | 2014 | ||||||||||||||||||||||
|---|---|---|---|---|---|---|---|---|---|---|---|---|---|---|---|---|---|---|---|---|---|---|---|---|---|---|
| | As of October 31 | As of October 31 | ||||||||||||||||||||||||
| | Amount Outstanding | Weighted-Average Interest Rate | Amount Outstanding | Weighted-Average Interest Rate | Amount Outstanding(1) | Weighted-Average Interest Rate | Amount Outstanding | Weighted-Average Interest Rate | ||||||||||||||||||
| | In millions | | In millions | | In millions | | In millions | | ||||||||||||||||||
Current portion of long-term debt | $ | 2,655 | 2.2 | % | $ | 5,226 | 2.8 | % | $ | 2,321 | 3.2 | % | $ | 2,655 | 2.2 | % | ||||||||||
Commercial paper | 298 | 0.5 | % | 327 | 0.4 | % | 39 | 0.3 | % | 298 | 0.5 | % | ||||||||||||||
Notes payable to banks, lines of credit and other | 533 | 4.0 | % | 426 | 1.7 | % | 525 | 3.1 | % | 533 | 4.0 | % | ||||||||||||||
| | | | | | | | | | | | | | | | | | | | | | ||||||
| $ | 3,486 | $ | 5,979 | |||||||||||||||||||||||
| $ | 2,885 | $ | 3,486 | |||||||||||||||||||||||
| | | | | | | | | | | | | | | | | | | | | | | |||||
| | | | | | | | | | | | | |||||||||||||||
HEWLETT-PACKARD COMPANYHP INC. AND SUBSIDIARIES
Notes to Consolidated Financial Statements (Continued)
Note 12:13: Borrowings (Continued)
Long-Term Debt
| | As of October 31 | ||||||
|---|---|---|---|---|---|---|---|
| | 2014 | 2013 | |||||
| | In millions | ||||||
U.S. Dollar Global Notes(1) | |||||||
2006 Shelf Registration Statement: | |||||||
$500 issued at discount to par at a price of 99.694% in February 2007 at 5.4%, due March 2017 | $ | 500 | $ | 499 | |||
$750 issued at discount to par at a price of 99.932% in March 2008 at 5.5%, due March 2018 | 750 | 750 | |||||
$2,000 issued at discount to par at a price of 99.561% in December 2008 at 6.125%, paid March 2014 | — | 1,999 | |||||
$1,500 issued at discount to par at a price of 99.993% in February 2009 at 4.75%, paid June 2014 | — | 1,500 | |||||
2009 Shelf Registration Statement: | |||||||
$1,100 issued at discount to par at a price of 99.887% in September 2010 at 2.125%, due September 2015 | 1,100 | 1,100 | |||||
$650 issued at discount to par at a price of 99.911% in December 2010 at 2.2%, due December 2015 | 650 | 650 | |||||
$1,350 issued at discount to par at a price of 99.827% in December 2010 at 3.75%, due December 2020 | 1,349 | 1,349 | |||||
$500 issued at par in May 2011 at three-month USD LIBOR plus 0.4%, paid May 2014 | — | 500 | |||||
$500 issued at discount to par at a price of 99.971% in May 2011 at 1.55%, paid May 2014 | — | 500 | |||||
$1,000 issued at discount to par at a price of 99.958% in May 2011 at 2.65%, due June 2016 | 1,000 | 1,000 | |||||
$1,250 issued at discount to par at a price of 99.799% in May 2011 at 4.3%, due June 2021 | 1,248 | 1,248 | |||||
$350 issued at par in September 2011 at three-month USD LIBOR plus 1.55%, paid September 2014 | — | 350 | |||||
$750 issued at discount to par at a price of 99.977% in September 2011 at 2.35%, due March 2015 | 750 | 750 | |||||
$1,300 issued at discount to par at a price of 99.784% in September 2011 at 3.0%, due September 2016 | 1,298 | 1,298 | |||||
$1,000 issued at discount to par at a price of 99.816% in September 2011 at 4.375%, due September 2021 | 999 | 999 | |||||
$1,200 issued at discount to par at a price of 99.863% in September 2011 at 6.0%, due September 2041 | 1,199 | 1,198 | |||||
$650 issued at discount to par at a price of 99.946% in December 2011 at 2.625%, paid December 2014 | 650 | 650 | |||||
$850 issued at discount to par at a price of 99.790% in December 2011 at 3.3%, due December 2016 | 849 | 849 | |||||
$1,500 issued at discount to par at a price of 99.707% in December 2011 at 4.65%, due December 2021 | 1,496 | 1,496 | |||||
$1,500 issued at discount to par at a price of 99.985% in March 2012 at 2.6%, due September 2017 | 1,500 | 1,500 | |||||
$500 issued at discount to par at a price of 99.771% in March 2012 at 4.05%, due September 2022 | 499 | 499 | |||||
2012 Shelf Registration Statement: | |||||||
$750 issued at par in January 2014 at three-month USD LIBOR plus 0.94%, due January 2019 | 750 | — | |||||
$1,250 issued at discount to par at a price of 99.954% in January 2014 at 2.75%, due January 2019 | 1,250 | — | |||||
| | | | | | | | |
| 17,837 | 20,684 | ||||||
EDS Senior Notes(1) | |||||||
$300 issued October 1999 at 7.45%, due October 2029 | 313 | 314 | |||||
Other, including capital lease obligations, at 0.00%-8.30%, due in calendar years 2014-2024(2) | 424 | 689 | |||||
Fair value adjustment related to hedged debt | 120 | 147 | |||||
Less: current portion | (2,655 | ) | (5,226 | ) | |||
| | | | | | | | |
Total long-term debt | $ | 16,039 | $ | 16,608 | |||
| | | | | | | | |
| | | | | | | | |
| | As of | ||||||
|---|---|---|---|---|---|---|---|
| | October 31, 2015 | October 31, 2014 | |||||
| | In millions | ||||||
U.S. Dollar Global Notes(1) | |||||||
2006 Shelf Registration Statement: | |||||||
$500 issued at discount to par at a price of 99.694% in February 2007 at 5.4%, due March 2017, paid November 2015 | $ | 162 | $ | 500 | |||
$750 issued at discount to par at a price of 99.932% in March 2008 at 5.5%, due March 2018, paid November 2015 | 283 | 750 | |||||
2009 Shelf Registration Statement: | |||||||
$1,100 issued at discount to par at a price of 99.887% in September 2010 at 2.125%, paid September 2015 | — | 1,100 | |||||
$650 issued at discount to par at a price of 99.911% in December 2010 at 2.2%, due December 2015, paid November 2015 | 309 | 650 | |||||
$1,350 issued at discount to par at a price of 99.827% in December 2010 at 3.75%, due December 2020 | 648 | 1,349 | |||||
$1,000 issued at discount to par at a price of 99.958% in May 2011 at 2.65%, due June 2016, paid November 2015 | 346 | 1,000 | |||||
$1,250 issued at discount to par at a price of 99.799% in May 2011 at 4.3%, due June 2021 | 1,248 | 1,248 | |||||
$750 issued at discount to par at a price of 99.977% in September 2011 at 2.35%, paid March 2015 | — | 750 | |||||
$1,300 issued at discount to par at a price of 99.784% in September 2011 at 3.0%, due September 2016, paid November 2015 | 390 | 1,298 | |||||
$1,000 issued at discount to par at a price of 99.816% in September 2011 at 4.375%, due September 2021 | 999 | 999 | |||||
$1,200 issued at discount to par at a price of 99.863% in September 2011 at 6.0%, due September 2041 | 1,199 | 1,199 | |||||
$650 issued at discount to par at a price of 99.946% in December 2011 at 2.625%, paid December 2014 | — | 650 | |||||
$850 issued at discount to par at a price of 99.790% in December 2011 at 3.3%, due December 2016, paid November 2015 | 220 | 849 | |||||
$1,500 issued at discount to par at a price of 99.707% in December 2011 at 4.65%, due December 2021 | 1,497 | 1,496 | |||||
$1,500 issued at discount to par at a price of 99.985% in March 2012 at 2.6%, due September 2017, paid November 2015 | 436 | 1,500 | |||||
$500 issued at discount to par at a price of 99.771% in March 2012 at 4.05%, due September 2022 | 499 | 499 | |||||
2012 Shelf Registration Statement: | |||||||
$750 issued at par in January 2014 at three-month USD LIBOR plus 0.94%, due January 2019 | 102 | 750 | |||||
$1,250 issued at discount to par at a price of 99.954% in January 2014 at 2.75%, due January 2019 | 300 | 1,250 | |||||
| | | | | | | | |
| 8,638 | 17,837 | ||||||
Hewlett Packard Enterprise Senior Notes | |||||||
$2,250 issued at discount to par at a price of 99.944% in October 2015 at 2.4%, due October 2017 | 2,249 | — | |||||
$2,650 issued at discount to par at a price of 99.872% in October 2015 at 2.8%, due October 2018 | 2,647 | — | |||||
$3,000 issued at discount to par at a price of 99.972% in October 2015 at 3.6%, due October 2020 | 2,999 | — | |||||
$1,350 issued at discount to par at a price of 99.802% in October 2015 at 4.4%, due October 2022 | 1,347 | — | |||||
$2,500 issued at discount to par at a price of 99.725% in October 2015 at 4.9%, due October 2025 | 2,493 | — | |||||
$750 issued at discount to par at a price of 99.942% in October 2015 at 6.2%, due October 2035 | 749 | — | |||||
$1,500 issued at discount to par at a price of 99.932% in October 2015 at 6.3%, due October 2045 | 1,499 | — | |||||
$350 issued at par in October 2015 at three-month USD LIBOR plus 1.74%, due October 2017 | 350 | — | |||||
$250 issued at par in October 2015 at three-month USD LIBOR plus 1.93%, due October 2018 | 250 | — | |||||
| | | | | | | | |
| 14,583 | — | ||||||
HP INC. AND SUBSIDIARIES
Notes to Consolidated Financial Statements (Continued)
Note 13: Borrowings (Continued)
| | As of | ||||||
|---|---|---|---|---|---|---|---|
| | October 31, 2015 | October 31, 2014 | |||||
| | In millions | ||||||
EDS Senior Notes(1) | |||||||
$300 issued October 1999 at 7.45%, due October 2029 | 313 | 313 | |||||
Other, including capital lease obligations, at 0.00%-8.30%, due in calendar years 2015-2024(2) | 519 | 424 | |||||
Fair value adjustment related to hedged debt | 48 | 120 | |||||
Less: current portion | (2,321 | ) | (2,655 | ) | |||
| | | | | | | | |
Total long-term debt | $ | 21,780 | $ | 16,039 | |||
| | | | | | | | |
| | | | | | | | |
| | | | | | | | |
HEWLETT-PACKARD COMPANY AND SUBSIDIARIES
Notes to Consolidated Financial Statements (Continued)
Note 12: Borrowings (Continued)
As disclosed in Note 11,12, HP uses interest rate swaps to mitigate the exposure of its debt portfolio to changes in fair value resulting from changes in interest rates by achieving a primarily U.S. dollar LIBOR-based floating interest expense. Interest rates shown in the table of long-term debt have not been adjusted to reflect the impact of any interest rate swaps.
In May 2012, As of October 31, 2015, aggregate future maturities of debt at face value (excluding a fair value adjustment related to hedged debt of $48 million, a premium on debt issuance of $13 million and a discount on debt issuance of $25 million) were as follows:
Fiscal year | Aggregate future maturities of debt outstanding including capital lease obligations | |||
|---|---|---|---|---|
| | In millions | |||
2016 | $ | 2,885 | ||
2017 | 2,653 | |||
2018 | 3,029 | |||
2019 | 411 | |||
2020 | 3,003 | |||
Thereafter | 12,648 | |||
| | | | | |
Total | $ | 24,629 | ||
| | | | | |
| | | | | |
| | | | | |
HP filed a shelf registration statementINC. AND SUBSIDIARIES
Notes to Consolidated Financial Statements (Continued)
Note 13: Borrowings (Continued)
Interest expense on borrowings recognized in the Consolidated Statements of Earnings during the fiscal years was as follows:
Expense | Location | 2015 | 2014 | 2013 | ||||||||
|---|---|---|---|---|---|---|---|---|---|---|---|---|
| | | In millions | ||||||||||
Financing interest | Financing interest | $ | 240 | $ | 277 | $ | 312 | |||||
Interest expense | Interest and other, net | 327 | 344 | 426 | ||||||||
| | | | | | | | | | | | | |
Total interest expense | $ | 567 | $ | 621 | $ | 738 | ||||||
| | | | | | | | | | ��� | | | |
| | | | | | | | | | | | | |
| | | | | | | | | | | | | |
Hewlett Packard Enterprise Senior Notes
On October 9, 2015, Hewlett Packard Enterprise completed the offering and pricing of nine series of senior unsecured notes (the "2012 Shelf Registration Statement""Notes") in an aggregate principal amount of $14.6 billion which includes $14.0 billion of fixed rate notes and $600 million of floating rate notes. The interest on fixed rate notes are payable semiannually and the interest on floating-rate notes are payable quarterly. The issuance costs of $54 million are included in Other assets on the Consolidated Balance Sheets and are being amortized to Interest expense over the term of the Notes. The Notes were initially guaranteed by HP. The guarantee was automatically and unconditionally released upon the completion of the Separation on November 1, 2015.
Concurrent with the Securities and Exchange Commissionissuance of the Notes, Hewlett Packard Enterprise entered into interest rate swaps to reduce the exposure of $9.5 billion of aggregate principal amount of fixed rate senior notes to changes in fair value resulting from changes in interest rates by achieving LIBOR-based floating interest expense.
Extinguishment of Debt
On September 30, 2015, HP commenced cash tender offers ("SEC"the Tender Offers") to enable the companypurchase up to offer$8.85 billion outstanding debt securities in two separate offers, for sale, from time(i) any and all of its outstanding 2.20% notes due December 2015, 2.65% notes due June 2016, 3.00% notes due September 2016, 3.30% notes due December 2016, 5.40% notes due March 2017, 2.60% notes due September 2017 and 5.50% notes due March 2018 and (ii) up to time,$2.3 billion in one or more offerings, an unspecifiedaggregate principal amount of its outstanding 2.75% notes due January 2019, Floating Rate notes due January 2019, 3.75% notes due December 2020, 4.30% notes due June 2021, 4.375% notes due September 2021, 4.650% notes due December 2021, 4.050% notes due September 2022 and 6.00% notes due September 2041. In the fourth quarter of fiscal 2015, HP redeemed and repaid $6.6 billion and this early extinguishment of debt securities, common stock, preferred stock, depositary sharesresulted in a loss of $167 million, net of realized gains from fair value hedges, which was recorded as "Interest and warrants.other, net" on the Consolidated Statements of Earnings. On November 4, 2015, HP incrementally redeemed and repaid a total of $2.1 billion fixed-rate U.S. Dollar Global Notes which resulted in a loss of $66 million, net of realized gains from fair value hedges.
Commercial Paper
HP's Board of Directors has authorized the issuance of up to $16.0 billion in aggregate principal amount of commercial paper by HP. HP's subsidiaries are authorized to issue up to an additional $1.0 billion in aggregate principal amount of commercial paper. HP maintains two commercial paper
HP INC. AND SUBSIDIARIES
Notes to Consolidated Financial Statements (Continued)
Note 13: Borrowings (Continued)
programs, and a wholly-owned subsidiary maintains a third program. HP's U.S. program provides for the issuance of U.S. dollar-denominated commercial paper up to a maximum aggregate principal amount of $16.0 billion. HP's euro commercial paper program provides for the issuance of commercial paper outside of the U.S. denominated in U.S. dollars, euros or British pounds up to a maximum aggregate principal amount of $3.0 billion or the equivalent in those alternative currencies. The combined aggregate principal amount of commercial paper outstanding under those programs at any one time cannot exceed the $16.0 billion authorized by HP's Board of Directors. The HP subsidiary's Euroeuro Commercial Paper/Certificate of Deposit Programme provides for the issuance of commercial paper in various currencies of up to a maximum aggregate principal amount of $500 million.
On November 1, 2015, HP's Board of Directors authorized to borrow for the use and benefit of HP and HP's subsidiaries, by the issuance of commercial paper or through the execution of promissory notes, loan agreements, letters of credit, agreements for lines of credit or overdraft facilities. The total outstanding principal balance of such commercial paper issued by shall not exceed $4.0 billion or the equivalent in foreign currencies.
Hewlett Packard Enterprise Commercial Paper and Credit Agreements
Hewlett Packard Enterprise's Board of Directors has authorized the issuance of up to $4.0 billion in aggregate principal amount of commercial paper. Hewlett Packard Enterprise maintains two commercial paper programs: (i) a U.S. dollar-denominated commercial paper program under which, Hewlett Packard Enterprise is permitted to have issued and outstanding up to $4.0 billion unsecured commercial paper notes (the "U.S. Commercial Paper Program"), and (ii) a euro-commercial paper program under which, Hewlett Packard Enterprise is permitted to have issued and outstanding up to $3 billion unsecured commercial paper notes issued outside the U.S., (the "euro Commercial Paper Program"). The combined aggregate principal amount of commercial paper outstanding under those programs at any one time cannot exceed $4.0 billion. The Hewlett Packard Enterprise's subsidiaries has been authorized to issue up to an additional $500 million in aggregate principal amount of commercial paper. The Hewlett Packard Enterprise subsidiary's euro Commercial Paper / Certificate of Deposit Program, which provides for the issuance of commercial paper in various currencies of up to a maximum aggregate principal amount of $500 million.
Credit Agreements
As of October 31, 2015, HP maintained senior unsecured committed credit facilities primarily to support the issuance of commercial paper. HP hashad a $3.0 billion five-year credit facility that expireswould have expired in March 2017 and a $4.5 billion five-year credit facility that expireswould have expired in April 2019. The $4.5 billion credit facility expiring in April 2019 was executed in the second quarter of fiscal 2014 and replaced a previous $4.5 billion credit facility that was to expire in February 2015. Both facilities supportsupported the U.S. commercial paper program and the euro commercial paper program. Commitment fees, interest rates and other terms of borrowing under the credit facilities varyvaried based on HP's external credit ratings. HP's ability to have an outstanding U.S. commercial paper balance that exceedsexceeded the $7.5 billion supported by these credit facilities iswas subject to a number of factors, including liquidity conditions and business performance. In addition, the $3.0 billion five-year credit facility washad been amended in September 2012 to permit borrowings in euros and British pounds, with the amounts available in euros and British pounds being limited to the U.S. dollar equivalent of $2.2 billion and $300 million, respectively.
HEWLETT-PACKARD COMPANYHP INC. AND SUBSIDIARIES
Notes to Consolidated Financial Statements (Continued)
Note 12:13: Borrowings (Continued)
On November 1, 2015, the $3.0 billion five-year credit facility was cancelled and HP amended the $4.5 billion five-year credit facility to a revolving credit facility providing for a senior, unsecured revolving credit facility with aggregate lending commitments of $4.0 billion. Commitments under the revolving credit facility will be available until the period ending on April 2, 2019. Funds to be borrowed under this revolving credit facility may be used for general corporate purposes.
Term Loan Agreement
On April 30, 2015, HP entered into a credit agreement that provides for a senior unsecured delayed, multiple draw term loan facility in the aggregate principal amount of $5.0 billion. Funds borrowed under this agreement were used for general corporate purposes, including to pay expenses associated with HP's proposed plan to separate into two independent publicly traded companies and matters related to the acquisition of Aruba. In fiscal 2015, HP borrowed and repaid $3.5 billion under this credit agreement. Along with the repayment in the fourth quarter of fiscal 2015, this term loan agreement has terminated upon the Separation.
Available Borrowing Resources
HP's and the HP subsidiary'sHP's subsidiaries' resources available to obtain short- orshort-or long-term financing were as follows:
| ||||
| ||||
| ||||
| | As of October 31, 2015 | |||
|---|---|---|---|---|
| | In millions | |||
Commercial paper programs(1) | $ | 16,461 | ||
Uncommitted lines of credit | $ | 2,524 | ||
The extent to which HP is able to utilize the 2012 Shelf Registration Statement and the commercial paper programs as sources of liquidity at any given time is subject to a number of factors, including market demand for HP securities and commercial paper, HP's financial performance, HP's credit ratings and market conditions generally.
As of October 31, 2014, aggregate future maturities of long-term debt at face value (excluding a fair value adjustment related to hedged debt of $120 million, a premium on debt issuance of $13 million and a discount on debt issuance of $13 million) were as follows:
| | 2015 | 2016 | 2017 | 2018 | 2019 | Thereafter | Total | |||||||||||||||
|---|---|---|---|---|---|---|---|---|---|---|---|---|---|---|---|---|---|---|---|---|---|---|
| | In millions | |||||||||||||||||||||
Aggregate future maturities of debt outstanding including capital lease obligations | $ | 2,652 | $ | 3,027 | $ | 2,920 | $ | 786 | $ | 2,003 | $ | 7,186 | $ | 18,574 | ||||||||
Interest expense on borrowings recognized in the Consolidated Statements of Earnings during the fiscal years was as follows:
Expense | Location | 2014 | 2013 | 2012 | ||||||||
|---|---|---|---|---|---|---|---|---|---|---|---|---|
| | | In millions | ||||||||||
Financing interest | Financing interest | $ | 277 | $ | 312 | $ | 317 | |||||
Interest expense | Interest and other, net | 344 | 426 | 514 | ||||||||
| | | | | | | | | | | | | |
Total interest expense | $ | 621 | $ | 738 | $ | 831 | ||||||
| | | | | | | | | | | | | |
| | | | | | | | | | | | | |
Note 13:14: Stockholders' Equity
Dividends
The stockholders of HP common stock are entitled to receive dividends when and as declared by HP's Board of Directors. Dividends declared were $0.67 per common share in fiscal 2015, $0.61 per common share in fiscal 2014 and $0.55 per common share in fiscal 2013 and $0.50 per common share in fiscal 2012.
HEWLETT-PACKARD COMPANY AND SUBSIDIARIES
Notes to Consolidated Financial Statements (Continued)
Note 13: Stockholders' Equity (Continued)2013.
Share Repurchase Program
HP's share repurchase program authorizes both open market and private repurchase transactions. In fiscal 2015, HP executed share repurchases of 75 million shares which included 0.5 million shares settled in November, 2015. In fiscal 2015, HP settled total shares for $2.9 billion. In fiscal 2014, HP executed share repurchases of 92 million shares which wereand settled total shares for $2.7 billion and included 7 million shares expected to settle in the first quarter of fiscal 2015.billion. In fiscal 2013, HP executed share repurchases of 77 million shares which wereand settled total shares for $1.5 billion. In fiscal 2012,
HP executed share repurchases of 67 million shares which were settled for $1.6 billion.INC. AND SUBSIDIARIES
Notes to Consolidated Financial Statements (Continued)
Note 14: Stockholders' Equity (Continued)
The shares repurchased and settled in fiscal 2015, 2014 fiscaland 2013 and fiscal 2012 were all open market repurchase transactions. As of October 31, 2014,2015, HP had remaining authorization of $4.9$2.0 billion for future share repurchases under the $10.0 billion repurchase authorization approved by HP's Board of Directors on July 21, 2011.
Taxes related to Other Comprehensive (Loss) Income
| | For the fiscal years ended October 31 | For the fiscal years ended October 31 | ||||||||||||||||||
|---|---|---|---|---|---|---|---|---|---|---|---|---|---|---|---|---|---|---|---|---|
| | 2014 | 2013 | 2012 | 2015 | 2014 | 2013 | ||||||||||||||
| | In millions | In millions | ||||||||||||||||||
Tax (provision) benefit on change in unrealized gains on available-for-sale securities: | ||||||||||||||||||||
Tax (provision) benefit on unrealized gains arising during the period | $ | (1 | ) | $ | (14 | ) | $ | 25 | ||||||||||||
Tax benefit (provision) on change in unrealized (losses) gains on available-for-sale securities: | ||||||||||||||||||||
Tax benefit (provision) on unrealized (losses) gains arising during the period | $ | 2 | $ | (1 | ) | $ | (14 | ) | ||||||||||||
| | | | | | | | | | | | ||||||||||
| 2 | (1 | ) | (14 | ) | ||||||||||||||||
| | | | | | | | | | | | | | | | | | | |||
| (1 | ) | (14 | ) | 25 | ||||||||||||||||
Tax benefit (provision) on change in unrealized (losses) gains on cash flow hedges: | ||||||||||||||||||||
Tax (provision) benefit on unrealized gains (losses) arising during the period | (294 | ) | (174 | ) | 97 | |||||||||||||||
Tax provision (benefit) on (gains) losses reclassified into earnings | 368 | (18 | ) | (49 | ) | |||||||||||||||
| | | | | | | | | | | | | | | | | | | |||
Tax (provision) benefit on change in unrealized gains (losses) on cash flow hedges: | ||||||||||||||||||||
Tax (provision) benefit on unrealized gains (losses) arising during the period | (174 | ) | 97 | (137 | ) | |||||||||||||||
Tax (benefit) provision on losses (gains) reclassified into earnings | (18 | ) | (49 | ) | 143 | |||||||||||||||
| | | | | | | | ||||||||||||||
| (192 | ) | 48 | 6 | |||||||||||||||||
| 74 | (192 | ) | 48 | |||||||||||||||||
| | | | | | | | | | | | | | | | | | | |||
Tax benefit (provision) on change in unrealized components of defined benefit plans: | ||||||||||||||||||||
Tax benefit (provision) on (losses) gains arising during the period | 181 | (258 | ) | 261 | 5 | 181 | (258 | ) | ||||||||||||
Tax benefit on amortization of actuarial loss and prior service benefit | (18 | ) | (35 | ) | (31 | ) | (18 | ) | (18 | ) | (35 | ) | ||||||||
Tax provision on curtailments, settlements and other | (9 | ) | (5 | ) | (48 | ) | ||||||||||||||
Tax benefit (provision) on curtailments, settlements and other | 24 | (9 | ) | (5 | ) | |||||||||||||||
| | | | | | | | | | | | | | | | | | | |||
| 154 | (298 | ) | 182 | |||||||||||||||||
| 11 | 154 | (298 | ) | |||||||||||||||||
| | | | | | | | | | | | | | | | | | | |||
Tax (provision) benefit on change in cumulative translation adjustment | (27 | ) | 25 | (25 | ) | (73 | ) | (27 | ) | 25 | ||||||||||
| | | | | | | | | | | | | | | | | | | |||
Tax (provision) benefit on other comprehensive (loss) income | $ | (66 | ) | $ | (239 | ) | $ | 188 | ||||||||||||
Tax benefit (provision) on other comprehensive (loss) income | $ | 14 | $ | (66 | ) | $ | (239 | ) | ||||||||||||
| | | | | | | | | | | | | | | | | | | | ||
| | | | | | | | | | | | ||||||||||
HEWLETT-PACKARD COMPANYHP INC. AND SUBSIDIARIES
Notes to Consolidated Financial Statements (Continued)
Note 13:14: Stockholders' Equity (Continued)
Changes and reclassifications related to Other Comprehensive (Loss) Income, net of taxes
| | For the fiscal years ended October 31 | For the fiscal years ended October 31 | ||||||||||||||||||
|---|---|---|---|---|---|---|---|---|---|---|---|---|---|---|---|---|---|---|---|---|
| | 2014 | 2013 | 2012 | 2015 | 2014 | 2013 | ||||||||||||||
| | In millions | In millions | ||||||||||||||||||
Other comprehensive (loss) income, net of taxes: | ||||||||||||||||||||
Change in unrealized gains on available-for-sale securities: | ||||||||||||||||||||
Unrealized gains arising during the period | $ | 6 | $ | 38 | $ | 50 | ||||||||||||||
Change in unrealized (losses) gains on available-for-sale securities: | ||||||||||||||||||||
Unrealized (losses) gains arising during the period | $ | (15 | ) | $ | 6 | $ | 38 | |||||||||||||
Gains reclassified into earnings | (1 | ) | (49 | ) | — | — | (1 | ) | (49 | ) | ||||||||||
| | | | | | | | | | | | ||||||||||
| (15 | ) | 5 | (11 | ) | ||||||||||||||||
| | | | | | | | | | | | | | | | | | | |||
| 5 | (11 | ) | 50 | |||||||||||||||||
Change in unrealized (losses) gains on cash flow hedges: | ||||||||||||||||||||
Unrealized gains (losses) arising during the period | 797 | 163 | (146 | ) | ||||||||||||||||
(Gains) losses reclassified into earnings(1) | (944 | ) | 133 | 57 | ||||||||||||||||
| | | | | | | | | | | | | | | | | | | |||
Change in unrealized gains (losses) on cash flow hedges: | ||||||||||||||||||||
Unrealized gains (losses) arising during the period | 163 | (146 | ) | 198 | ||||||||||||||||
Losses (gains) reclassified into earnings(1) | 133 | 57 | (256 | ) | ||||||||||||||||
| | | | | | | | ||||||||||||||
| 296 | (89 | ) | (58 | ) | ||||||||||||||||
| (147 | ) | 296 | (89 | ) | ||||||||||||||||
| | | | | | | | | | | | | | | | | | | |||
Change in unrealized components of defined benefit plans: | ||||||||||||||||||||
(Losses) gains arising during the period | (2,575 | ) | 1,695 | (2,196 | ) | (543 | ) | (2,575 | ) | 1,695 | ||||||||||
Amortization of actuarial loss and prior service benefit(2) | 241 | 291 | 141 | 425 | 241 | 291 | ||||||||||||||
Curtailments, settlements and other | 42 | 20 | 74 | 139 | 42 | 20 | ||||||||||||||
| | | | | | | | | | | | | | | | | | | |||
| (2,292 | ) | 2,006 | (1,981 | ) | ||||||||||||||||
| 21 | (2,292 | ) | 2,006 | |||||||||||||||||
| | | | | | | | | | | | | | | | | | | |||
Change in cumulative translation adjustment | (112 | ) | (125 | ) | (72 | ) | (280 | ) | (112 | ) | (125 | ) | ||||||||
| | | | | | | | | | | | | | | | | | | |||
Other comprehensive (loss) income, net of taxes | $ | (2,103 | ) | $ | 1,781 | $ | (2,061 | ) | $ | (421 | ) | $ | (2,103 | ) | $ | 1,781 | ||||
| | | | | | | | | | | | | | | | | | | | ||
| | | | | | | | | | | | ||||||||||
| | | | 2014 | 2013 | 2012 | |||||||||||||||||||||
|---|---|---|---|---|---|---|---|---|---|---|---|---|---|---|---|---|---|---|---|---|---|---|---|---|---|---|
| | | | In millions | | | 2015 | 2014 | 2013 | ||||||||||||||||||
Net revenue | $ | 21 | $ | (48 | ) | $ | (423 | ) | | | In millions | |||||||||||||||
Cost of products | 71 | 165 | 15 | Net revenue | $ | (1,271 | ) | $ | 21 | $ | (48 | ) | ||||||||||||||
Other operating expenses | 9 | (1 | ) | 6 | Cost of products | 150 | 71 | 165 | ||||||||||||||||||
Interest and other, net | 50 | (10 | ) | 3 | Other operating expenses | 7 | 9 | (1 | ) | |||||||||||||||||
Interest and other, net | (198 | ) | 50 | (10 | ) | |||||||||||||||||||||
| | | | | | | | | | | | | | | | | | | |||||||||
| $ | 151 | $ | 106 | $ | (399 | ) | $ | (1,312 | ) | $ | 151 | $ | 106 | |||||||||||||
| | | | | | | | | | | | | | | | | | | | ||||||||
| | | | | | | | | | | | ||||||||||||||||
HEWLETT-PACKARD COMPANYHP INC. AND SUBSIDIARIES
Notes to Consolidated Financial Statements (Continued)
Note 13:14: Stockholders' Equity (Continued)
The components of accumulated other comprehensive loss, net of taxes as of October 31, 20142015 and changes during fiscal year 20142015 were as follows:
| | Net unrealized gain on available-for-sale securities | Net unrealized loss on cash flow hedges | Unrealized components of defined benefit plans | Cumulative translation adjustment | Accumulated other comprehensive loss | Net unrealized gain on available-for-sale securities | Net unrealized gain (loss) on cash flow hedges | Unrealized components of defined benefit plans | Cumulative translation adjustment | Accumulated other comprehensive loss | ||||||||||||||||||||||
|---|---|---|---|---|---|---|---|---|---|---|---|---|---|---|---|---|---|---|---|---|---|---|---|---|---|---|---|---|---|---|---|---|
| | In millions | In millions | ||||||||||||||||||||||||||||||
Balance at beginning of period | $ | 76 | $ | (188 | ) | $ | (3,084 | ) | $ | (582 | ) | $ | (3,778 | ) | $ | 81 | $ | 108 | $ | (5,376 | ) | $ | (694 | ) | $ | (5,881 | ) | |||||
Other comprehensive income (loss) before reclassifications | 6 | 163 | (2,533 | ) | (112 | ) | (2,479 | ) | ||||||||||||||||||||||||
Other comprehensive (loss) income before reclassifications | (15 | ) | 797 | (404 | ) | (280 | ) | 98 | ||||||||||||||||||||||||
Reclassifications of (gains) losses into earnings | (1 | ) | 133 | 241 | — | 376 | — | (944 | ) | 425 | — | (519 | ) | |||||||||||||||||||
| | | | | | | | | | | | | | | | | | | | | | | | | | | | | |||||
Balance at end of period | $ | 81 | $ | 108 | $ | (5,376 | ) | $ | (694 | ) | $ | (5,881 | ) | $ | 66 | $ | (39 | ) | $ | (5,355 | ) | $ | (974 | ) | $ | (6,302 | ) | |||||
| | | | | | | | | | | | | | | | | | | | | | | | | | | | | | ||||
| | | | | | | | | | | | | | | | | | ||||||||||||||||
Note 14:15: Net Earnings Per Share
HP calculates basic net EPS using net earnings (loss) and the weighted-average number of shares outstanding during the reporting period. Diluted net EPS includes any dilutive effect of restricted stock awards, stock options, performance-based awards and shares purchased under the 2011 ESPP.
The reconciliations of the numerators and denominators of each of the basic and diluted net EPS calculations were as follows:
| | For the fiscal years ended October 31 | For the fiscal years ended October 31 | ||||||||||||||||||
|---|---|---|---|---|---|---|---|---|---|---|---|---|---|---|---|---|---|---|---|---|
| | 2014 | 2013 | 2012 | 2015 | 2014 | 2013 | ||||||||||||||
| | In millions, except per share amounts | In millions, except per share amounts | ||||||||||||||||||
Numerator: | ||||||||||||||||||||
Net earnings (loss)(1) | $ | 5,013 | $ | 5,113 | $ | (12,650 | ) | |||||||||||||
Net earnings(1) | $ | 4,554 | $ | 5,013 | $ | 5,113 | ||||||||||||||
| | | | | | | | | | | | | | | | | | | | ||
| | | | | | | | | | | | ||||||||||
Denominator: | ||||||||||||||||||||
Weighted-average shares used to compute basic net EPS | 1,882 | 1,934 | 1,974 | 1,814 | 1,882 | 1,934 | ||||||||||||||
Dilutive effect of employee stock plans | 30 | 16 | — | 22 | 30 | 16 | ||||||||||||||
| | | | | | | | | | | | | | | | | | | |||
Weighted-average shares used to compute diluted net EPS | 1,912 | 1,950 | 1,974 | 1,836 | 1,912 | 1,950 | ||||||||||||||
| | | | | | | | | | | | | | | | | | | | ||
Net earnings (loss) per share: | ||||||||||||||||||||
| | | | | | | | | | | | ||||||||||
Net earnings per share: | ||||||||||||||||||||
Basic | $ | 2.66 | $ | 2.64 | $ | (6.41 | ) | $ | 2.51 | $ | 2.66 | $ | 2.64 | |||||||
| | | | | | | | | | | | | | | | | | | | ||
Diluted(2) | $ | 2.62 | $ | 2.62 | $ | (6.41 | ) | |||||||||||||
| | | | | | | | | | | | ||||||||||
Diluted | $ | 2.48 | $ | 2.62 | $ | 2.62 | ||||||||||||||
| | | | | | | | | | | | | | | | | | | | ||
Anti-dilutive weighted average options(3) | 26 | 52 | 57 | |||||||||||||||||
| | | | | | | | | | | | ||||||||||
Anti-dilutive weighted-average options(2) | 23 | 26 | 52 | |||||||||||||||||
HEWLETT-PACKARD COMPANYHP INC. AND SUBSIDIARIES
Notes to Consolidated Financial Statements (Continued)
Note 14:15: Net Earnings Per Share (Continued)
awards outstanding. For fiscal 2014 and 2013, the net earnings allocated to participating securities were not significant.
Note 15:16: Litigation and Contingencies
HP is involved in lawsuits, claims, investigations and proceedings, including those identified below, consisting of IP, commercial, securities, employment, employee benefits and environmental matters that arise in the ordinary course of business. HP accrues a liability when management believes that it is both probable that a liability has been incurred and the amount of loss can be reasonably estimated. HP believes it has recorded adequate provisions for any such matters and, as of October 31, 2014,2015, it was not reasonably possible that a material loss had been incurred in excess of the amounts recognized in HP's financial statements. HP reviews these matters at least quarterly and adjusts its accruals to reflect the impact of negotiations, settlements, rulings, advice of legal counsel, and other information and events pertaining to a particular case. Based on its experience, HP believes that any damage amounts claimed in the specific matters discussed below are not a meaningful indicator of HP's potential liability. Litigation is inherently unpredictable. However, HP believes it has valid defenses with respect to legal matters pending against it. Nevertheless, cash flows or results of operations could be materially affected in any particular period by the resolution of one or more of these contingencies.
Under the separation and distribution agreement, HP and Hewlett Packard Enterprise agreed to cooperate with each other in managing litigation and environmental matters related to both companies' businesses. The separation and distribution agreement also included provisions that assign to each company responsibility for managing pending and future litigation and environmental matters related to the general corporate matters of HP arising prior to the Separation.
Litigation, Proceedings and Investigations
Copyright Levies. As described below, proceedings are ongoing or have been concluded involving HP in certain European Union ("EU") member countries, including litigation in Germany, Belgium and Austria, seeking to impose or modify levies upon equipment (such as multi-function devices ("MFDs"), personal computers ("PCs")PCs and printers) and alleging that these devices enable producing private copies of copyrighted materials. Descriptions of some of the ongoing proceedings are included below. The levies are generally based upon the number of products sold and the per-product amounts of the levies, which vary. Some EU member countries that do not yet have levies on digital devices are expected to implement similar legislation to enable them to extend existing levy schemes, while some other EU member countries have phased out levies or are expected to limit the scope of levy schemes and applicability in the digital hardware environment, particularly with respect to sales to business users. HP, other companies and various industry associations have opposed the extension of levies to the digital environment and have advocated alternative models of compensation to rights holders.
VerwertungsGesellschaft Wort ("VG Wort"), a collection agency representing certain copyright holders, instituted legal proceedings against HP in the Stuttgart Civil Court seeking to impose levies on
HP INC. AND SUBSIDIARIES
Notes to Consolidated Financial Statements (Continued)
Note 16: Litigation and Contingencies (Continued)
printers. On December 22, 2004, the court held that HP is liable for payments regarding all printers using ASCII code sold in Germany but did not determine the amount payable per unit. HP appealed this decision in January 2005 to the Stuttgart Court of Appeals. On May 11, 2005, the Stuttgart Court of Appeals issued a decision confirming that levies are due. On June 6, 2005, HP filed an appeal to the German Federal Supreme Court in Karlsruhe. On December 6, 2007, the German Federal Supreme Court issued a judgment that printers are not subject to levies under existing law. VG Wort appealed the decision by filing a claim with the German Federal Constitutional Court challenging the ruling that printers are not subject to levies. On September 21, 2010, the Constitutional Court published a decision holding that the German Federal Supreme Court erred by not referring questions on interpretation of German copyright law to the Court of Justice of the European Union ("CJEU") and therefore revoked
HEWLETT-PACKARD COMPANY AND SUBSIDIARIES
Notes to Consolidated Financial Statements (Continued)
Note 15: Litigation and Contingencies (Continued)
the German Federal Supreme Court decision and remitted the matter to it. On July 21, 2011, the German Federal Supreme Court stayed the proceedings and referred several questions to the CJEU with regard to the interpretation of the European Copyright Directive. On June 27, 2013, the CJEU issued its decision responding to those questions. The German Federal Supreme Court subsequently scheduled a joint hearing on this matter with other cases relating to reprographic levies on printers and PCs that was held on October 31, 2013. The German Federal Supreme Court issued a decision on July 3, 2014 partially granting the claim of VG Wort. The German Federal Supreme Court decision provides that levies are due where the printer is used with a PC to make permitted reprographic copies in a single process under the control of the same person, but no levies are due on a printer for reprographic copies made with a "scanner-PC-printer" product chain. The case has been remitted to lower courtsthe Stuttgart Civil Court to assess the amount to be paid per printer unit. The industry association BITKOM and VG Wort signed a settlement agreement defining the levies due on printers sold in Germany from 2001-2007. HP opted to join the settlement agreement on August 10, 2015 and paid €68.2 million (approximately $72.0 million) in levies, excluding value added taxes, due as a result of such settlement by November 30, 2015.
In September 2003, VG Wort filed a lawsuit against Fujitsu Technology Solutions GmbH ("Fujitsu") in the Munich Civil Court in Munich, Germany seeking to impose levies on PCs. This is an industry test case in Germany, and HP has agreed not to object to the delay if VG Wort sues HP for such levies on PCs following a final decision against Fujitsu. On December 23, 2004, the Munich Civil Court held that PCs are subject to a levy and that Fujitsu must pay €12 plus compound interest for each PC sold in Germany since March 2001. Fujitsu appealed this decision in January 2005 to the Munich Court of Appeals. On December 15, 2005, the Munich Court of Appeals affirmed the Munich Civil Court decision. Fujitsu filed an appeal with the German Federal Supreme Court in February 2006. On October 2, 2008, the German Federal Supreme Court issued a judgment that PCs were not photocopiers within the meaning of the German copyright law that was in effect until December 31, 2007 and, therefore, were not subject to the levies on photocopiers established by that law. VG Wort subsequently filed a claim with the German Federal Constitutional Court challenging that ruling. In January 2011, the Constitutional Court published a decision holding that the German Federal Supreme Court decision was inconsistent with the German Constitution and revoking the German Federal Supreme Court decision. The Constitutional Court also remitted the matter to the German Federal Supreme Court for further action. On July 21, 2011, the German Federal Supreme Court stayed the proceedings and referred several questions to the CJEU with regard to the interpretation of the European Copyright Directive. On June 27, 2013, the CJEU issued its decision responding to those questions. The German Federal Supreme Court subsequently scheduled a joint hearing on that matter with other cases relating to reprographic levies on printers that was held on October 31, 2013. The
HP INC. AND SUBSIDIARIES
Notes to Consolidated Financial Statements (Continued)
Note 16: Litigation and Contingencies (Continued)
German Federal Supreme Court issued a decision on July 3, 2014 partially granting the claim of VG Wort. The German Federal Supreme Court decision provides that levies are due for audio-visual copying of standing text and pictures using a PC as the last device in a single reproduction process under the control of the same person, but no levies are due on a PC for reprographic copies made using a "PC-printer" or a "scanner-PC-printer" chain. The case has been remitted to lower courtsthe Munich Court of Appeals to assess the amount to be paid per PC unit.
Reprobel, a cooperative society with the authority to collect and distribute the remuneration for reprography to Belgian copyright holders, requested by extra-judicial means that HP amend certain copyright levy declarations submitted for inkjet MFDs sold in Belgium from January 2005 to December 2009 to enable it to collect copyright levies calculated based on the generally higher copying speed when the MFDs are operated in draft print mode rather than when operated in normal print mode. In March 2010, HP filed a lawsuit against Reprobel in the French-speaking chambers of the Court of First Instance of Brussels seeking a declaratory judgment that no copyright levies are payable on sales of MFDs in Belgium or, alternatively, that copyright levies payable on such MFDs must be assessed based
HEWLETT-PACKARD COMPANY AND SUBSIDIARIES
Notes to Consolidated Financial Statements (Continued)
Note 15: Litigation and Contingencies (Continued)
on the copying speed when operated in the normal print mode set by default in the device. On November 16, 2012, the court issued a decision holding that Belgium law is not in conformity with EU law in a number of respects and ordered that, by November 2013, Reprobel substantiate that the amounts claimed by Reprobel are commensurate with the harm resulting from legitimate copying under the reprographic exception. HP subsequently appealed that court decision to the Courts of Appeal in Brussels seeking to confirm that the Belgian law is not in conformity with EU law and that, if Belgian law is interpreted in a manner consistent with EU law, no payments by HP are required or, alternatively, the payments already made by HP are sufficient to comply with its obligations under Belgian law. On October 23, 2013, the Court of Appeal in Brussels stayed the proceedings and referred several questions to the CJEU relating to whether the Belgian reprographic copyright levies system is in conformity with EU law. The case was heard by the CJEU on January 29, 2015 and on November 12, 2015, the CJEU published its judgment providing that a national legislation such as the Belgian one at issue in the main proceedings is incompatible with EU law in multiple legal points, as argued by HP. The Court of Appeal of Brussels now has to rule on the litigation between HP and Reprobel following the answers provided by the CJEU.
Based on industry opposition to the extension of levies to digital products, HP's assessments of the merits of various proceedings and HP's estimates of the number of units impacted and the amounts of the levies, HP has accrued amounts that it believes are adequate to address the matters described above. However, the ultimate resolution of these matters and the associated financial impact on HP, including the number of units impacted and the amount of levies imposed, remains uncertain.
Memjet Technology Ltd. v. HP. On August 11, 2015, Memjet Technology Ltd. ("Memjet") filed a lawsuit against HP in U.S. District Court in the Southern District of California. The complaint alleges that HP infringes eight Memjet patents. The products accused of infringement are those that use the HP PageWide Technology, including the OfficeJet Pro X series, OfficeJet Enterprise X series, HP PageWide XL, wide scan printers, and printers using 4.25-inch thermal inkjet printheads, such as HP Web Presses and Photo Kiosks. On October 2, 2015, HP answered Memjet's complaint and asserted a counter-claim against Memjet for infringement of four HP patents. The products accused of infringement include various Memjet OEM printers that incorporate Memjet's printheads and print engines. On November 20, 2015, HP asserted three additional patents against Memjet. The patents
HP INC. AND SUBSIDIARIES
Notes to Consolidated Financial Statements (Continued)
Note 16: Litigation and Contingencies (Continued)
asserted by both parties generally relate to inkjet printhead and print system technology. Both Memjet's and HP's respective complaints seek injunctive relief and monetary damages from the other party for alleged patent infringement. On November 16, 2015, Memjet was granted anex partepreliminary injunction in Germany (State Court Munich), against HP Deutschland GmbH's sale and offers for sale of HP PageWide XL printers. Memjet's injunction request alleges that HP infringes a Memjet European patent. On December 4, 2015, HP filed an opposition and an application to suspend enforcement of the preliminary injunction pending a court hearing and decision. On December 9, 2015, the court denied HP's application to suspend enforcement prior to a hearing. A hearing is scheduled for January 7, 2016.
Fair Labor Standards Act LitigationLitigation.. HP is involved in several lawsuits in which the plaintiffs are seeking unpaid overtime compensation and other damages based on allegations that various employees of Electronic Data Systems Corporation ("EDS") or HP have been misclassified as exempt employees under the Fair Labor Standards Act (" FLSA") and/or in violation of the California Labor Code or other state laws. Those matters include the following:
HEWLETT-PACKARD COMPANY AND SUBSIDIARIES
Notes to Consolidated Financial Statements (Continued)
Note 15: Litigation and Contingencies (Continued)
State of South Carolina Department of Social Services Contract Dispute. In October 2012, the State of South Carolina Department of Social Services and related government agencies ("SCDSS") filed a proceeding before South Carolina's Chief Procurement Officer ("CPO") against Hewlett-Packard State & Local Enterprise Services, Inc., a subsidiary of HP ("HPSLES"). The dispute arises from a contract between SCDSS and HPSLES for the design, implementation and maintenance of a Child Support Enforcement and a Family Court Case Management System (the "CFS System"). SCDSS seeks aggregate damages of approximately $275 million, a declaration that HPSLES is in material breach of the contract and, therefore, that termination of the contract for cause by SCDSS would be appropriate, and a declaration that HPSLES is required to perform certain additional disputed work that expands the scope of the original contract. In November 2012, HPSLES filed responsive pleadings asserting defenses and seeking payment of past-due invoices totaling more than $12 million. On July 10, 2013, SCDSS terminated the contract with HPSLES for cause, and, in its termination notice, SCDSS asserted that HPSLES is responsible for all future federal penalties until the CFS System achieves federal certification, sought an immediate order requiring HPSLES to transfer to SCDSS all work completed and in progress, and indicated that it intends to seek suspension and debarment of HPSLES from contracting with the State of South Carolina. HPSLES is disputing the termination as improper and defective. In addition, on August 9, 2013, HPSLES filed its own affirmative claim within the proceeding alleging that SCDSS materially breached the contract by its improper termination and that SCDSS was a primary and material cause of the project delays. On September 4, 2013, the CPO denied SCDSS's motion for injunctive relief seeking immediate transfer of the system assets to SCDSS and indicated that the CPO would address that request following a hearing on the merits. The hearing on the merits before the CPO concluded on February 25, 2014 and closing briefs were submitted on July 18, 2014.
HEWLETT-PACKARD COMPANY AND SUBSIDIARIES
Notes to Consolidated Financial Statements (Continued)
Note 15: Litigation and Contingencies (Continued)
On August 15, 2014, the CPO agreed to the parties' joint request that the CPO not issue an order unless and until the parties, with the guidance of the mediator, report to the CPO that their ongoing mediation has reached a final impasse.
On September 10, 2014, the parties reached an agreement in principle to resolve this matter and on December 15, 2014, the parties submitted a settlement agreement and time and materials agreement to the CPO for approval.
India Directorate of Revenue Intelligence ProceedingsProceedings.. On April 30 and May 10, 2010, the India Directorate of Revenue Intelligence (the "DRI") issued show cause notices to Hewlett-Packard India Sales Private Ltd ("HPI"HP India"), a subsidiary of HP, seven then-current HP India employees and one former HP India employee alleging that HP India underpaid customs duties while importing products and spare parts into India and seeking to recover an aggregate of approximately $370 million, plus penalties. Prior to the issuance of the show cause notices, HP India deposited approximately $16 million with the DRI
HP INC. AND SUBSIDIARIES
Notes to Consolidated Financial Statements (Continued)
Note 16: Litigation and Contingencies (Continued)
and agreed to post a provisional bond in exchange for the DRI's agreement to not seize HP India products and spare parts and to not interrupt the transaction of business by HP in India.
On April 11, 2012, the Bangalore Commissioner of Customs issued an order on the products-related show cause notice affirming certain duties and penalties against HPIHP India and the named individuals of approximately $386 million, of which HPIHP India had already deposited $9 million. On December 11, 2012, HPIHP India voluntarily deposited an additional $10 million in connection with the products-related show cause notice.
The differential duty demand is subject to interest. On April 20, 2012, the Commissioner issued an order on the parts-related show cause notice affirming certain duties and penalties against HPIHP India and certain of the named individuals of approximately $17 million, of which HPIHP India had already deposited $7 million. After the order, HPIHP India deposited an additional $3 million in connection with the parts-related show cause notice so as to avoid certain penalties.
HPIHP India filed appeals of the Commissioner's orders before the Customs Tribunal along with applications for waiver of the pre-deposit of remaining demand amounts as a condition for hearing the appeals. The Customs Department has also filed cross-appeals before the Customs Tribunal. On January 24, 2013, the Customs Tribunal ordered HPIHP India to deposit an additional $24 million against the products order, which HPIHP India deposited in March 2013. The Customs Tribunal did not order any additional deposit to be made under the parts order. In December 2013, HPIHP India filed applications before the Customs Tribunal seeking early hearing of the appeals as well as an extension of the stay of deposit as to HP India and the individuals already granted until final disposition of the appeals. On February 7, 2014, the application for extension of the stay of deposit was granted by the Customs Tribunal until disposal of the appeals. On October 27, 2014, the Customs Tribunal commenced hearings on the cross-appeals of the Commissioner's orders. The Customs Tribunal rejected HP'sHP India's request to remand the matter to the Commissioner on procedural grounds, and isgrounds. The hearings scheduled to reconvene hearings on the merits beginning on April 6, 2015.2015 and again on November 3, 2015 were cancelled at the request of the Customs Tribunal. A new hearing date has not been set.
Russia GPO and Other FCPA InvestigationsAnti-Corruption Investigations.. The German Public Prosecutor's Office ("German PPO") has been conducting an investigation into allegations that current and former employees of HP engaged in bribery, embezzlement and tax evasion relating to a transaction between Hewlett-Packard ISE GmbH in Germany, a former subsidiary of HP, and the General Prosecutor's Office of the Russian Federation. The approximately €35 million transaction, which was referred to as the Russia GPO deal, spanned the years 2001 to 2006 and was for the delivery and installation of an IT network. The
HEWLETT-PACKARD COMPANY AND SUBSIDIARIES
Notes to Consolidated Financial Statements (Continued)
Note 15: Litigation and Contingencies (Continued)
German PPO has issued an indictment of four individuals, including one current and two former HP employees, on charges including bribery, breach of trust and tax evasion. The German PPO has also requested that HP be made an associated party to the case, and, if that request is granted, HP would participate in any portion of the court proceedings that could ultimately bear on the question of whether HP should be subject to potential disgorgement of profits based on the conduct of the indicted current and former employees. The Regional Court of Leipzig will determine whether the matter should be admitted to trial. The Polish Central Anti-Corruption Bureau is also conducting an investigation intoinvestigating potential corruption violationscorrupt actions by ana former employee of Hewlett-Packard Polska Sp. z o.o., ana former indirect subsidiary of HP, in connection with certain public-sector transactions in Poland. HP is cooperating with these investigating agencies.
The DOJ and the SEC also conducted an investigation into the Russia GPO deal and potential violations of the Foreign Corrupt Practices Act ("FCPA"). In addition, the same U.S. enforcement agencies conducted investigations into certain other public-sector transactions in Russia, Poland, the Commonwealth of Independent States and Mexico, among other countries. On April 9, 2014, HP announced a resolution of the DOJ and SEC FCPA investigations. Pursuant to the terms of the resolution of the DOJ and SEC FCPA investigation announced in April 2014, on September 11, 2014, an HP subsidiary in Russia, ZAO Hewlett Packard A.O., entered a guilty plea in the United States District Court, Northern District of California, to criminal violations of the FCPA. HP paid the SEC approximately $31 million, and paid approximately $77 million in fines and penalties pursuant to its agreements with the DOJ. HP also has agreed to undertake certain compliance, reporting and cooperation obligations.
On December 2, 2014, plaintiffs Petroleos Mexicanos and Pemex Exploracion filed a complaint against HP and HP Mexico in the United States District Court for the Northern District of California
HP INC. AND SUBSIDIARIES
Notes to Consolidated Financial Statements (Continued)
Note 16: Litigation and Contingencies (Continued)
alleging violations of the Racketeer Influenced and Corrupt Organizations Act (RICO Act), fraudulent concealment, tortious interference, and violations of the California Unfair Competition Law in connection with alleged improper payments provided to Pemex officials by third-parties retained by HP Mexico. These allegations arise from the same subject-matter as a previously disclosed 2014 Non-Prosecution Agreement between HP Mexico and the DOJ and a simultaneous cease-and-desist order against HP issued by the SEC.Securities and Exchange Commission ("SEC"). On February 9, 2015, HP is investigatingand HP Mexico filed a motion to dismiss the complaint in its entirety. On July 13, 2015, the court granted the motion to dismiss and gave the plaintiffs leave to amend their complaint. The plaintiffs filed a first amended complaint on July 31, 2015. On August 21, 2015, HP and HP Mexico filed a motion to dismiss the first amended complaint. On November 3, 2015, the parties settled the matter for no payment and the court dismissed this claim, however, HP does not believe that the resolution of this matter will have a material impactcase with prejudice on its financial statements.November 4, 2015.
ECT ProceedingsProceedings.. In January 2011, the postal service of Brazil, Empresa Brasileira de Correios e Telégrafos ("ECT"), notified an HP subsidiary in Brazil ("HP Brazil") that it had initiated administrative proceedings to consider whether to suspend HP Brazil's right to bid and contract with ECT related to alleged improprieties in the bidding and contracting processes whereby employees of HP Brazil and employees of several other companies allegedly coordinated their bids and fixed results for three ECT contracts in 2007 and 2008. In late July 2011, ECT notified HP Brazil it had decided to apply the penalties against HP Brazil and suspend HP Brazil's right to bid and contract with ECT for five years, based upon the evidence before it. In August 2011, HP Brazil appealed ECT's decision. In April 2013, ECT rejected HP Brazil's appeal, and the administrative proceedings were closed with the penalties against HP Brazil remaining in place. In parallel, in September 2011, HP Brazil filed a civil action against ECT seeking to have ECT's decision revoked. HP Brazil also requested an injunction suspending the application of the penalties until a final ruling on the merits of the case. The court of first instance has not issued a decision on the merits of the case, but it has denied HP Brazil's request for injunctive relief. HP Brazil appealed the denial of its request for injunctive relief to the intermediate appellate court, which issued a preliminary ruling denying the request for injunctive relief
HEWLETT-PACKARD COMPANY AND SUBSIDIARIES
Notes to Consolidated Financial Statements (Continued)
Note 15: Litigation and Contingencies (Continued)
but reducing the length of the sanctions from five to two years. HP Brazil appealed that decision and, in December 2011, obtained a ruling staying enforcement of ECT's sanctions until a final ruling on the merits of the case. HP expects thisthe decision to be issued in 20152016 and any subsequent appeal on the merits to last several years. Pursuant to the separation and distribution agreement, Hewlett Packard Enterprise has been assigned responsibility for this litigation.
Cisco Systems. On August 21, 2015, Cisco Systems, Inc. ("Cisco Systems") and Cisco Systems Capital Corporation ("Cisco Capital") filed an action in Santa Clara County Superior Court for declaratory judgment and breach of contract against HP in connection with a dispute arising out of a third-party's termination of a services contract with HP. As part of that third-party services contract, HP separately contracted with Cisco on an agreement to utilize Cisco products and services. HP prepaid the entire amount due Cisco through a financing arrangement with Cisco Capital. Following the termination of HP services contract with the third-party, HP no longer required Cisco's products and services, and, accordingly, exercised its contractual termination rights under the agreement with Cisco, and requested that Cisco apply the appropriate credit toward the remaining balance owed Cisco Capital. This lawsuit relates to the calculation of that credit under the agreement between Cisco and HP. Cisco contends that after the credit is applied, HP still owes Cisco Capital approximately $58 million. HP contends that under a proper reading of the agreement, HP owes nothing to Cisco
HP INC. AND SUBSIDIARIES
Notes to Consolidated Financial Statements (Continued)
Note 16: Litigation and Contingencies (Continued)
Capital, and that Cisco owes significant amounts to HP. Pursuant to the separation and distribution agreement, Hewlett Packard Enterprise has been assigned responsibility for this litigation.
Stockholder LitigationLitigation.. As described below, HP is involved in various stockholder litigation matters commenced against certain current and former HP executive officers and/or certain current and former members of HP's Board of Directors in which the plaintiffs are seeking to recover damages related to HP's allegedly inflated stock price, certain compensation paid by HP to the defendants, other damages and/or injunctive relief:
HEWLETT-PACKARD COMPANY AND SUBSIDIARIES
Notes to Consolidated Financial Statements (Continued)
Note 15: Litigation and Contingencies (Continued)
statements, the departure of Mr. Hurd as Chairman of HP's Board of Directors and HP's Chief Executive Officer, alleged violations of the FCPA, and HP's acquisition of 3PAR Inc. and Autonomy Corporation plc ("Autonomy"). On February 25, 2014, the court issued an order granting HP's administrative motion to relateCopeland II toCopeland I. On April 8, 2014, the court granted the parties' stipulation to stay the action pending resolution ofCopeland I by the United States Court of Appeals for the Ninth Circuit.
HEWLETT-PACKARD COMPANYHP INC. AND SUBSIDIARIES
Notes to Consolidated Financial Statements (Continued)
Note 15:16: Litigation and Contingencies (Continued)
business and by authorizing HP's repurchase of its own stock on August 29, 2010 and July 21, 2011. The lawsuits are currently stayed pending resolution of theEspinoza/Salat consolidated action in federal court. The court held a status conference on November 17, 2014.
Autonomy-Related Legal Matters
InvestigationsInvestigations.. As a result of the findings of an ongoing investigation, HP has provided information to the U.K. Serious Fraud Office, the DOJU.S. Department of Justice ("DOJ") and the SEC related to the accounting improprieties, disclosure failures and misrepresentations at Autonomy that occurred prior to and in connection with HP's acquisition of Autonomy. On November 21, 2012, DOJ representatives of the U.S. Department of Justice advised HP that they had opened an investigation relating to Autonomy. On February 6, 2013, representatives of the U.K. Serious Fraud Office advised HP that they had also opened an investigation relating to Autonomy. On January 19, 2015, the U.K. Serious Fraud Office notified HP that it was closing its investigation and had decided to cede jurisdiction of the investigation to the U.S. authorities. HP is cooperating with the three investigating agencies.DOJ and the SEC, whose investigations are ongoing.
LitigationLitigation.. As described below, HP is involved in various stockholder litigation relating to, among other things, its October 2011 acquisition of Autonomy and its November 20, 2012 announcement that it recorded a non-cash charge for the impairment of goodwill and intangible assets within its Software segment of approximately $8.8 billion in the fourth quarter of its 2012 fiscal year and HP's statements that, based on HP's findings from an ongoing investigation, the majority of this impairment charge related to accounting improprieties, misrepresentations to the market and disclosure failures at Autonomy that occurred prior to and in connection with HP's acquisition of Autonomy and the impact of those improprieties, failures and misrepresentations on the expected future financial performance of the Autonomy business over the long term. This stockholder litigation was commenced against, among others, certain current and former HP executive officers, certain current and former members of HP's Board of Directors and certain advisors to HP. The plaintiffs in these litigation matters are seeking to recover certain compensation paid by HP to the defendants and/or other damages. These matters include the following:
HP INC. AND SUBSIDIARIES
Notes to Consolidated Financial Statements (Continued)
Note 16: Litigation and Contingencies (Continued)
California alleging, among other things, that from August 19, 2011 to November 20, 2012, the defendants violated Sections 10(b) and 20(a) of the Exchange Act by concealing material
HEWLETT-PACKARD COMPANY AND SUBSIDIARIES
Notes to Consolidated Financial Statements (Continued)
Note 15: Litigation and Contingencies (Continued)
information and making false statements related to HP's acquisition of Autonomy and the financial performance of HP's enterprise services business. On May 3, 2013, the lead plaintiff filed a consolidated complaint alleging that, during that same period, all of the defendants violated Sections 10(b) and 20(a) of the Exchange Act and SEC Rule 10b-5(b) by concealing material information and making false statements related to HP's acquisition of Autonomy and that certain defendants violated SEC Rule 10b-5(a) and (c) by engaging in a "scheme" to defraud investors. On July 2, 2013, HP filed a motion to dismiss the lawsuit. On November 26, 2013, the court granted in part and denied in part HP's motion to dismiss, allowing claims to proceed against HP and Margaret C. Whitman based on alleged statements and/or omissions made on or after May 23, 2012. The court dismissed all of the plaintiff's claims that were based on alleged statements and/or omissions made between August 19, 2011 and May 22, 2012. The plaintiffslead plaintiff filed a motion for class certification on November 4, 2014 and, on December 15, 2014, the defendants filed their opposition to the motion. The hearing onOn June 9, 2015, HP entered into a settlement agreement with the motion forlead plaintiff in the consolidated securities class certificationaction. Under the terms of the settlement, HP, through its insurers, will contribute $100 million to a settlement fund that will be used to compensate persons who purchased HP's shares during the period from August 19, 2011 through November 20, 2012. No individual is scheduled for February 20, 2015.contributing to the settlement. HP and its current and former officers, directors, and advisors will be released from any Autonomy-related securities claims as part of the settlement. On July 17, 2015, the court granted preliminary approval to the settlement. On November 13, 2015, the court granted final approval to the settlement.
HEWLETT-PACKARD COMPANYHP INC. AND SUBSIDIARIES
Notes to Consolidated Financial Statements (Continued)
Note 15:16: Litigation and Contingencies (Continued)
entertain any remaining objections to the settlement and decide whether to grant final approval of the settlement. On July 30, 2015, the court granted final approval to the settlement and denied all remaining objections to the settlement. Certain objectors to the settlement appealed the court's final approval order.
HP INC. AND SUBSIDIARIES
Notes to Consolidated Financial Statements (Continued)
Note 16: Litigation and Contingencies (Continued)
Sections 404(a)(1) and 405(a) of the Employee Retirement Income Security Act of 1974, as amended, by concealing negative information regarding the financial performance of Autonomy and HP's enterprise services business and by failing to restrict participants from investing in HP stock. On August 16, 2013, HP filed a motion to dismiss the lawsuit. On March 31, 2014, the court granted HP's motion to dismiss this action with leave to amend. On July 16, 2014, the plaintiffs filed a second amended complaint containing substantially similar allegations and seeking substantially similar relief as the first amended complaint. HP movedOn June 15, 2015, the court granted HP's motion to dismiss the second amended complaint in its entirety and a hearing on the motion is scheduled for January 23, 2015.
HEWLETT-PACKARD COMPANY AND SUBSIDIARIES
Notes to Consolidated Financial Statements (Continued)
Note 15: Litigation and Contingencies (Continued)
Environmental
HP's operations and products are subject to various federal, state, local and foreign laws and regulations concerning environmental protection, including laws addressing the discharge of pollutants into the air and water, the management and disposal of hazardous substances and wastes, the cleanup of contaminated sites, the content of HP's products and the recycling, treatment and disposal of those products. In particular, HP faces increasing complexity in its product design and procurement operations as it adjusts to new and future requirements relating to the chemical and materials composition of its products, their safe use, and the energy consumption associated with those products, including requirements relating to climate change. HP is also subject to legislation in an increasing number of jurisdictions that makes producers of electrical goods, including computers and printers, financially responsible for specified collection, recycling, treatment and disposal of past and future covered products (sometimes referred to as "product take-back legislation"). HP could incur substantial costs, its products could be restricted from entering certain jurisdictions, and it could face other sanctions, if it were to violate or become liable under environmental laws or if its products become non-compliant with environmental laws. HP's potential exposure includes fines and civil or criminal sanctions, third-party property damage or personal injury claims and clean-up costs. The amount and timing of costs to comply with environmental laws are difficult to predict.
HP is party to, or otherwise involved in, proceedings brought by U.S. or state environmental agencies under the Comprehensive Environmental Response, Compensation and Liability Act ("CERCLA"), known as "Superfund," or state laws similar to CERCLA, and may become a party to, or otherwise involved in, proceedings brought by private parties for contribution towards clean-up costs. HP is also conducting environmental investigations or remediations at several current or former operating sites pursuant to administrative orders or consent agreements with state environmental agencies.
Note 16:17: Guarantees, Indemnifications and Warranties
Guarantees
In the ordinary course of business, HP may issue performance guarantees to certain of its clients, customers and other parties pursuant to which HP has guaranteed the performance obligations of third parties. Some of those guarantees may be backed by standby letters of credit or surety bonds. In general, HP would be obligated to perform over the term of the guarantee in the event a specified
HP INC. AND SUBSIDIARIES
Notes to Consolidated Financial Statements (Continued)
Note 17: Guarantees, Indemnifications and Warranties (Continued)
triggering event occurs as defined by the guarantee. HP believes the likelihood of having to perform under a material guarantee is remote.
HP has entered into service contracts with certain of its clients that are supported by financing arrangements. If a service contract is terminated as a result of HP's non-performance under the contract or failure to comply with the terms of the financing arrangement, HP could, under certain circumstances, be required to acquire certain assets related to the service contract. HP believes the likelihood of having to acquire a material amount of assets under these arrangements is remote.
Indemnifications
In the ordinary course of business, HP enters into contractual arrangements under which HP may agree to indemnify a third party to such arrangement from any losses incurred relating to the services
HEWLETT-PACKARD COMPANY AND SUBSIDIARIES
Notes to Consolidated Financial Statements (Continued)
Note 16: Guarantees (Continued)
they perform on behalf of HP or for losses arising from certain events as defined within the particular contract, which may include, for example, litigation or claims relating to past performance. HP also provides indemnifications to certain vendors and customers against claims of IP infringement made by third parties arising from the vendor'svendors' and customer'scustomers' use of HP's software products and services and certain other matters. Some indemnifications may not be subject to maximum loss clauses. Historically, payments made related to these indemnifications have been immaterial.
Under the separation and distribution agreement, HP agreed to indemnify Hewlett Packard Enterprise, each of its subsidiaries and each of their respective directors, officers and employees from and against all liabilities relating to, arising out of or resulting from, among other matters, the liabilities allocated to HP as part of the Separation. Hewlett Packard Enterprise similarly agreed to indemnify HP, each of its subsidiaries and each of their respective directors, officers and employees from and against all liabilities relating to, arising out of or resulting from, among other matters, the liabilities allocated to Hewlett Packard Enterprise as part of the Separation. HP expects Hewlett Packard Enterprise to fully perform under the terms of the separation and distribution agreement.
For information on the cross-indemnifications related to the tax matter agreements and litigations effective upon the Separation on November 1, 2015, see Note 6 "Taxes on Earnings" and Note 16 "Litigation and Contingencies", respectively.
WarrantyWarranties
HP accrues the estimated cost of product warranties at the time it recognizes revenue. HP engages in extensive product quality programs and processes, including actively monitoring and evaluating the quality of its component suppliers; however, contractual warranty terms, repair costs, product call rates, average cost per call, current period product shipments and ongoing product failure rates, as well as specific product class failures outside of HP's baseline experience, affect the estimated warranty obligation.
HP INC. AND SUBSIDIARIES
Notes to Consolidated Financial Statements (Continued)
Note 17: Guarantees, Indemnifications and Warranties (Continued)
HP's aggregate product warranty liabilities and changes during the fiscal years were as follows:
| | As of October 31 | As of October 31 | ||||||||||||
|---|---|---|---|---|---|---|---|---|---|---|---|---|---|---|
| | 2014 | 2013 | 2015 | 2014 | ||||||||||
| | In millions | In millions | ||||||||||||
Balance at beginning of year | $ | 2,031 | $ | 2,170 | $ | 1,956 | $ | 2,031 | ||||||
Accruals for warranties issued | 1,840 | 2,007 | 1,507 | 1,840 | ||||||||||
Adjustments related to pre-existing warranties (including changes in estimates) | 12 | (4 | ) | (32 | ) | 12 | ||||||||
Settlements made (in cash or in kind) | (1,927 | ) | (2,142 | ) | (1,723 | ) | (1,927 | ) | ||||||
| | | | | | | | | | | | | | ||
Balance at end of year | $ | 1,956 | $ | 2,031 | $ | 1,708 | $ | 1,956 | ||||||
| | | | | | | | | | | | | | | |
| | | | | | | | | |||||||
Lease Commitments
HP leases certain real and personal property under non-cancelable operating leases. Certain leases require HP to pay property taxes, insurance and routine maintenance and include renewal options and escalation clauses. Rent expense was approximately $1.0 billion in fiscal 2015, 2014 2013 and 2012.2013.
Property under capital leases was comprised primarily of equipment and furniture. Capital lease assets included in Property, plant and equipment in the Consolidated Balance Sheets were $229$207 million and $437$229 million as of October 31, 20142015 and October 31, 2013,2014, respectively. Accumulated depreciation on the property under capital leaseleases was $207$187 million and $404$207 million as of October 31, 2015 and 2014, and October 31, 2013, respectively.
HEWLETT-PACKARD COMPANY AND SUBSIDIARIES
Notes to Consolidated Financial Statements (Continued)
Note 17: Commitments (Continued)
As of October 31, 2014,2015, future minimum operating lease commitments were as follows:
Fiscal year | In millions | |||
|---|---|---|---|---|
2016 | $ | 624 | ||
2017 | 517 | |||
2018 | 379 | |||
2019 | 310 | |||
2020 | 237 | |||
Thereafter | 801 | |||
Less: Sublease rental income | (77 | ) | ||
| | | | | |
Total(1) | $ | 2,791 | ||
| | | | | |
| | | | | |
| | | | | |
| | Operating Lease | |||
|---|---|---|---|---|
| | In millions | |||
Fiscal year | ||||
2015 | $ | 744 | ||
2016 | 555 | |||
2017 | 416 | |||
2018 | 308 | |||
2019 | 237 | |||
Thereafter | 804 | |||
Less: Sublease rental income | (63 | ) | ||
| | | | | |
Total | $ | 3,001 | ||
| | | | | |
| | | | | |
Unconditional Purchase Obligations
AtAs of October 31, 2014,2015, HP had unconditional purchase obligations of approximately $2.1$2.7 billion. These unconditional purchase obligations include agreements to purchase goods or services that are enforceable and legally binding on HP and that specify all significant terms, including fixed or minimum quantities to be purchased, fixed, minimum or variable price provisions and the approximate
HP INC. AND SUBSIDIARIES
Notes to Consolidated Financial Statements (Continued)
Note 18: Commitments (Continued)
timing of the transaction. These unconditional purchase obligations are related principally to inventory, service support and other items. Unconditional purchase obligations exclude agreements that are cancelable without penalty.
As of October 31, 2014,2015, future unconditional purchase obligations were as follows:
Fiscal year | In millions | |||
|---|---|---|---|---|
2016 | $ | 1,126 | ||
2017 | 473 | |||
2018 | 471 | |||
2019 | 342 | |||
2020 | 109 | |||
Thereafter | 133 | |||
| | | | | |
Total(1) | $ | 2,654 | ||
| | | | | |
| | | | | |
| | | | | |
| | 2015 | 2016 | 2017 | 2018 | 2019 | Thereafter | Total | |||||||||||||||
|---|---|---|---|---|---|---|---|---|---|---|---|---|---|---|---|---|---|---|---|---|---|---|
| | In millions | | ||||||||||||||||||||
Unconditional purchase obligations | $ | 1,383 | $ | 289 | $ | 229 | $ | 212 | $ | — | $ | — | $ | 2,113 | ||||||||
HEWLETT-PACKARD COMPANYHP INC. AND SUBSIDIARIES
Quarterly Summary
(Unaudited)
(In millions, except per share amounts)
| | For the three-month fiscal periods ended in fiscal 2014 | For the three-month fiscal periods ended in fiscal 2015 | ||||||||||||||||||||||||
|---|---|---|---|---|---|---|---|---|---|---|---|---|---|---|---|---|---|---|---|---|---|---|---|---|---|---|
| | January 31 | April 30 | July 31 | October 31 | January 31 | April 30 | July 31 | October 31 | ||||||||||||||||||
Net revenue | $ | 28,154 | $ | 27,309 | $ | 27,585 | $ | 28,406 | $ | 26,839 | $ | 25,453 | $ | 25,349 | $ | 25,714 | ||||||||||
Cost of sales(1) | 21,736 | 20,704 | 20,974 | 21,425 | 20,571 | 19,345 | 19,317 | 19,363 | ||||||||||||||||||
Research and development | 811 | 873 | 887 | 876 | 825 | 850 | 893 | 934 | ||||||||||||||||||
Selling, general and administrative | 3,210 | 3,391 | 3,388 | 3,364 | 3,071 | 3,063 | 2,962 | 3,089 | ||||||||||||||||||
Amortization of intangible assets | 283 | 264 | 227 | 226 | 222 | 221 | 242 | 246 | ||||||||||||||||||
Restructuring charges | 114 | 252 | 649 | 604 | 146 | 255 | 25 | 591 | ||||||||||||||||||
Acquisition-related charges | 3 | 3 | 2 | 3 | ||||||||||||||||||||||
Acquisition and other related charges | 4 | 19 | 47 | 20 | ||||||||||||||||||||||
Separation costs | 80 | 269 | 401 | 509 | ||||||||||||||||||||||
Defined benefit plan settlement charges | — | — | 114 | 54 | ||||||||||||||||||||||
Impairment of data center assets | — | — | 136 | — | ||||||||||||||||||||||
Total costs and expenses | 26,157 | 25,487 | 26,127 | 26,498 | 24,919 | 24,022 | 24,137 | 24,806 | ||||||||||||||||||
Earnings from operations | 1,997 | 1,822 | 1,458 | 1,908 | 1,920 | 1,431 | 1,212 | 908 | ||||||||||||||||||
Interest and other, net | (163 | ) | (174 | ) | (145 | ) | (146 | ) | (174 | ) | (139 | ) | (108 | ) | (318 | ) | ||||||||||
Earnings before taxes | 1,834 | 1,648 | 1,313 | 1,762 | 1,746 | 1,292 | 1,104 | 590 | ||||||||||||||||||
Provision for taxes | (409 | ) | (375 | ) | (328 | ) | (432 | ) | (380 | ) | (281 | ) | (250 | ) | 733 | |||||||||||
Net earnings | $ | 1,425 | $ | 1,273 | $ | 985 | $ | 1,330 | $ | 1,366 | $ | 1,011 | $ | 854 | $ | 1,323 | ||||||||||
Net earnings per share:(2) | ||||||||||||||||||||||||||
Basic | $ | 0.75 | $ | 0.67 | $ | 0.53 | $ | 0.71 | $ | 0.75 | $ | 0.56 | $ | 0.47 | $ | 0.73 | ||||||||||
Diluted | $ | 0.74 | $ | 0.66 | $ | 0.52 | $ | 0.70 | $ | 0.73 | $ | 0.55 | $ | 0.47 | $ | 0.73 | ||||||||||
Cash dividends paid per share | $ | 0.15 | $ | 0.15 | $ | 0.16 | $ | 0.16 | $ | 0.16 | $ | 0.16 | $ | 0.18 | $ | 0.18 | ||||||||||
Range of per share stock prices on the New York Stock Exchange | ||||||||||||||||||||||||||
Low | $ | 24.50 | $ | 27.89 | $ | 31.21 | $ | 31.62 | $ | 35.77 | $ | 31.00 | $ | 29.52 | $ | 24.30 | ||||||||||
High | $ | 30.13 | $ | 33.90 | $ | 36.21 | $ | 38.25 | $ | 41.10 | $ | 38.86 | $ | 35.60 | $ | 30.78 | ||||||||||
| | For the three-month fiscal periods ended in fiscal 2013 | For the three-month fiscal periods ended in fiscal 2014 | ||||||||||||||||||||||||
|---|---|---|---|---|---|---|---|---|---|---|---|---|---|---|---|---|---|---|---|---|---|---|---|---|---|---|
| | January 31 | April 30 | July 31 | October 31 | January 31 | April 30 | July 31 | October 31 | ||||||||||||||||||
Net revenue | $ | 28,359 | $ | 27,582 | $ | 27,226 | $ | 29,131 | $ | 28,154 | $ | 27,309 | $ | 27,585 | $ | 28,406 | ||||||||||
Cost of sales(1) | 22,029 | 21,055 | 20,859 | 22,437 | 21,736 | 20,704 | 20,974 | 21,425 | ||||||||||||||||||
Research and development | 794 | 815 | 797 | 729 | 811 | 873 | 887 | 876 | ||||||||||||||||||
Selling, general and administrative | 3,300 | 3,342 | 3,274 | 3,351 | 3,210 | 3,391 | 3,388 | 3,364 | ||||||||||||||||||
Amortization of intangible assets | 350 | 350 | 356 | 317 | 283 | 264 | 227 | 226 | ||||||||||||||||||
Restructuring charges | 130 | 408 | 81 | 371 | 114 | 252 | 649 | 604 | ||||||||||||||||||
Acquisition-related charges | 4 | 11 | 4 | 3 | ||||||||||||||||||||||
Acquisition and other related charges | 3 | 3 | 2 | 3 | ||||||||||||||||||||||
Total costs and expenses | 26,607 | 25,981 | 25,371 | 27,208 | 26,157 | 25,487 | 26,127 | 26,498 | ||||||||||||||||||
Earnings from operations | 1,752 | 1,601 | 1,855 | 1,923 | 1,997 | 1,822 | 1,458 | 1,908 | ||||||||||||||||||
Interest and other, net | (179 | ) | (193 | ) | (146 | ) | (103 | ) | (163 | ) | (174 | ) | (145 | ) | (146 | ) | ||||||||||
Earnings before taxes | 1,573 | 1,408 | 1,709 | 1,820 | 1,834 | 1,648 | 1,313 | 1,762 | ||||||||||||||||||
Provision for taxes | (341 | ) | (331 | ) | (319 | ) | (406 | ) | (409 | ) | (375 | ) | (328 | ) | (432 | ) | ||||||||||
Net earnings | $ | 1,232 | $ | 1,077 | $ | 1,390 | $ | 1,414 | $ | 1,425 | $ | 1,273 | $ | 985 | $ | 1,330 | ||||||||||
Net earnings per share:(2) | ||||||||||||||||||||||||||
Basic | $ | 0.63 | $ | 0.56 | $ | 0.72 | $ | 0.74 | $ | 0.75 | $ | 0.67 | $ | 0.53 | $ | 0.71 | ||||||||||
Diluted | $ | 0.63 | $ | 0.55 | $ | 0.71 | $ | 0.73 | $ | 0.74 | �� | $ | 0.66 | $ | 0.52 | $ | 0.70 | |||||||||
Cash dividends paid per share | $ | 0.13 | $ | 0.13 | $ | 0.15 | $ | 0.15 | $ | 0.15 | $ | 0.15 | $ | 0.16 | $ | 0.16 | ||||||||||
Range of per share stock prices on the New York Stock Exchange | ||||||||||||||||||||||||||
Low | $ | 11.35 | $ | 16.03 | $ | 20.15 | $ | 20.25 | $ | 24.50 | $ | 27.89 | $ | 31.21 | $ | 31.62 | ||||||||||
High | $ | 17.45 | $ | 24.05 | $ | 26.71 | $ | 27.78 | $ | 30.13 | $ | 33.90 | $ | 36.21 | $ | 38.25 | ||||||||||
ITEM 9. Changes in and Disagreements with Accountants on Accounting and Financial Disclosure.
None.
ITEM 9A. Controls and Procedures.
Under the supervision and with the participation of our management, including our principal executive officer and principal financial officer, we conducted an evaluation of the effectiveness of the design and operation of our disclosure controls and procedures, as defined in Rules 13a-15(e) and 15d-15(e) under the Exchange Act as of the end of the period covered by this report (the "Evaluation Date"). Based on this evaluation, our principal executive officer and principal financial officer concluded as of the Evaluation Date that our disclosure controls and procedures were effective such that the information relating to HP, including our consolidated subsidiaries, required to be disclosed in our SEC reports (i) is recorded, processed, summarized and reported within the time periods specified in SEC rules and forms, and (ii) is accumulated and communicated to HP's management, including our principal executive officer and principal financial officer, as appropriate to allow timely decisions regarding required disclosure.
UnderDuring the fourth qurter of fiscal 2015, under the supervision and with the participation of our management, including our principal executive officer and principal financial officer, we conducted an evaluationcompleted our preparations and implementation for a series of anychanges to our information technology environment, which includes our financial reporting systems, to support the separate financial reporting requirements for HP Inc. and Hewlett Packard Enterprise. There were no other changes in our internal control over financial reporting (as such term is defined in Rules 13a-15(f) and 15d-15(f) under the Exchange Act)during fiscal 2015 that occurred during our most recently completed fiscal quarter. Based on that evaluation, our principal executive officer and principal financial officer concluded that there has not been any change in our internal control over financial reporting during that quarter that hashave materially affected, or isare reasonably likely to materially affect, our internal control over financial reporting.
See Management's Report on Internal Control over Financial Reporting and the Report of Independent Registered Public Accounting Firm on our internal control over financial reporting in Item 8, which are incorporated herein by reference.
None.
ITEM 10. Directors, Executive Officers and Corporate Governance.
The names of the executive officers of HP and their ages, titles and biographies as of the date hereof are incorporated by reference from Part I, Item 1, above.
The following information is included in HP's Proxy Statement related to its 20152016 Annual Meeting of Stockholders to be filed within 120 days after HP's fiscal year end of October 31, 20142015 (the "Proxy Statement") and is incorporated herein by reference:
ITEM 11. Executive Compensation.
The following information is included in the Proxy Statement and is incorporated herein by reference:
ITEM 12. Security Ownership of Certain Beneficial Owners and Management and Related Stockholder Matters.
The following information is included in the Proxy Statement and is incorporated herein by reference:
ITEM 13. Certain Relationships and Related Transactions, and Director Independence.
The following information is included in the Proxy Statement and is incorporated herein by reference:
ITEM 14. Principal Accounting Fees and Services.
Information regarding principal accounting fees and services is set forth under "Principal Accounting Fees and Services" in the Proxy Statement, which information is incorporated herein by reference.
ITEM 15. Exhibits and Financial Statement Schedules.
The following financial statements are filed as part of this report under Item 8—"Financial Statements and Supplementary Data."
Reports of Independent Registered Public Accounting Firm | ||||
Management's Report on Internal Control Over Financial Reporting | ||||
Consolidated Statements of Earnings | ||||
Consolidated Statements of Comprehensive Income | ||||
Consolidated Balance Sheets | ||||
Consolidated Statements of Cash Flows | ||||
Consolidated Statements of Stockholders' Equity | ||||
Notes to Consolidated Financial Statements | ||||
Quarterly Summary |
All schedules are omitted as the required information is not applicable or the information is presented in the Consolidated Financial Statements and notes thereto in Item 8 above.
A list of exhibits filed or furnished with this Annual Report on Form 10-K (or incorporated by reference to exhibits previously filed or furnished by HP) is provided in the accompanying Exhibit Index. HP will furnish copies of exhibits for a reasonable fee (covering the expense of furnishing copies) upon request. Stockholders may request exhibits copies by contacting:
Hewlett-Packard CompanyHP Inc.
Attn: Investor Relations3000 Hanover Street1501 Page Mill Road
Palo Alto, CA 94304
Pursuant to the requirements of Section 13 or 15(d) of the Securities Exchange Act of 1934, the registrant has duly caused this report to be signed on its behalf by the undersigned, thereunto duly authorized.
| Date: December | ||||
By: | /s/ CATHERINE A. LESJAK Catherine A. Lesjak Chief Financial Officer | |||
KNOW ALL PERSONS BY THESE PRESENTS, that each person whose signature appears below constitutes and appoints Catherine A. Lesjak, John F. SchultzKim Rivera and Rishi Varma,Ruairidh Ross, or any of them, his or her attorneys-in-fact, for such person in any and all capacities, to sign any amendments to this report and to file the same, with exhibits thereto, and other documents in connection therewith, with the Securities and Exchange Commission, hereby ratifying and confirming all that either of said attorneys-in-fact, or substitute or substitutes, may do or cause to be done by virtue hereof.
Pursuant to the requirements of the Securities Exchange Act of 1934, this report has been signed below by the following persons on behalf of the registrant and in the capacities and on the dates indicated.
| Signature | Title(s) | Date | ||
|---|---|---|---|---|
/s/ |
| December | ||
Catherine A. Lesjak |
|
| ||
/s/ |
| December | ||
|
|
| ||
Shumeet Banerji |
|
| ||
/s/ CARL BASS Carl Bass | Director | December 16, 2015 | ||
/s/ ROBERT R. BENNETT Robert R. Bennett |
|
| ||
|
|
|
| Signature | Title(s) | Date | ||
|---|---|---|---|---|
/s/ | Director | December | ||
|
|
| ||
|
|
| ||
|
|
| ||
|
|
| ||
|
|
| ||
|
|
|
HEWLETT-PACKARD COMPANYHP INC. AND SUBSIDIARIES
EXHIBIT INDEX
| Incorporated by Reference | ||||||||||
|---|---|---|---|---|---|---|---|---|---|---|
| Exhibit Number | ||||||||||
| Exhibit Description | Form | File No. | Exhibit(s) | Filing Date | ||||||
| 2(a) | Agreement and Plan of Merger, dated as of March 2, 2015, among the Registrant, Aspen Acquisition Sub, Inc. and Aruba Networks, Inc.** | 8-K | 001-04423 | 2.1 | March 2, 2015 | |||||
2(b) | Separation and Distribution Agreement, dated as of October 31, 2015, by and among Hewlett-Packard Company, Hewlett Packard Enterprise Company and the Other Parties Thereto.** | 8-K | 001-04423 | 2.1 | November 5, 2015 | |||||
2(c) | Transition Services Agreement, dated as of November 1, 2015, by and between Hewlett-Packard Company and Hewlett Packard Enterprise Company.** | 8-K | 001-04423 | 2.2 | November 5, 2015 | |||||
2(d) | Tax Matters Agreement, dated as of October 31, 2015, by and between Hewlett-Packard Company and Hewlett Packard Enterprise Company.** | 8-K | 001-04423 | 2.3 | November 5, 2015 | |||||
2(e) | Employee Matters Agreement, dated as of October 31, 2015, by and between Hewlett-Packard Company and Hewlett Packard Enterprise Company.** | 8-K | 001-04423 | 2.4 | November 5, 2015 | |||||
2(f) | Real Estate Matters Agreement, dated as of October 31, 2015, by and between Hewlett-Packard Company and Hewlett Packard Enterprise Company.** | 8-K | 001-04423 | 2.5 | November 5, 2015 | |||||
2(g) | Master Commercial Agreement, dated as of November 1, 2015, by and between Hewlett-Packard Company and Hewlett Packard Enterprise Company.** | 8-K | 001-04423 | 2.6 | November 5, 2015 | |||||
2(h) | Information Technology Service Agreement, dated as of November 1, 2015, by and between Hewlett-Packard Company and HP Enterprise Services, LLC.** | 8-K | 001-04423 | 2.7 | November 5, 2015 | |||||
| | | Incorporated by Reference | ||||||||
|---|---|---|---|---|---|---|---|---|---|---|
| Exhibit Number | | |||||||||
| Exhibit Description | Form | File No. | Exhibit(s) | Filing Date | ||||||
| 3(a) | Registrant's Certificate of Incorporation. | 10-Q | 001-04423 | 3(a) | June 12, 1998 | |||||
3(b) | Registrant's Amendment to the Certificate of Incorporation. | 10-Q | 001-04423 | 3(b) | March 16, 2001 | |||||
3(c) | Registrant's | 8-K | 001-04423 | 3.1 | ||||||
3(d) | Registrant's Certificate of Amendment to the Certificate of Incorporation. | 8-K | 001-04423 | 3.2 | October 22, 2015 | |||||
3(e) | Registrant's Amended and Restated Bylaws. | 8-K | 001-04423 | 3.3 | October 22, 2015 | |||||
4(a) | Senior Indenture between the Registrant and The Bank of New York Mellon Trust Company, National Association, as successor in interest to J.P. Morgan Trust Company, National Association (formerly known as Chase Manhattan Bank and Trust Company, National Association), as Trustee, dated June 1, 2000. | S-3 | 333-134327 | 4.9 | June 7, 2006 | |||||
4(b) | Form of Subordinated Indenture. | S-3 | 333-30786 | 4.2 | March 17, 2000 | |||||
4(c) | Form of Registrant's | |||||||||
8-K | 001-04423 | December 2, 2010 | ||||||||
Form of Registrant's | 8-K | 001-04423 | 4.5 and 4.6 | June 1, 2011 | ||||||
4(e) | Form of Registrant's 4.375% Global Note due September 15, 2021 and 6.000% Global Note due September 15, 2041 and form of related Officers' Certificate. | 8-K | 001-04423 | 4.4, 4.5 and 4.6 | ||||||
4(f) | Form of Registrant's 4.650% Global Note due December 9, 2021 and related Officers' Certificate. | 8-K | 001-04423 | 4.3 and 4.4 | December 12, 2011 | |||||
4(g) | Form of Registrant's 4.050% Global Note due September 15, 2022 and related Officers' Certificate. | 8-K | 001-04423 | 4.2 and 4.3 | March 12, 2012 | |||||
| | | Incorporated by Reference | ||||||||
|---|---|---|---|---|---|---|---|---|---|---|
| Exhibit Number | | |||||||||
| Exhibit Description | Form | File No. | Exhibit(s) | Filing Date | ||||||
| 4(h) | Form of Registrant's | |||||||||
8-K | 001-04423 | 4.1, 4.2 and 4.3 | January 14, 2014 | |||||||
Specimen certificate for the Registrant's common stock. | 8-A/A | 001-04423 | 4.1 | June 23, 2006 | ||||||
4(j) | Senior Indenture, dated as of October 9, 2015, between Hewlett Packard Enterprise Company and The Bank of New York Mellon Trust Company, N.A., as Trustee. | 8-K | 001-04423 | 4.1 | October 13, 2015 | |||||
4(k) | First Supplemental Indenture, dated as of October 9, 2015, between Hewlett Packard Enterprise Company and The Bank of New York Mellon Trust Company, N.A., as Trustee, relating to Hewlett Packard Enterprise Company's 2.450% notes due 2017. | 8-K | 001-04423 | 4.2 | October 13, 2015 | |||||
4(l) | Second Supplemental Indenture, dated as of October 9, 2015, between Hewlett Packard Enterprise Company and The Bank of New York Mellon Trust Company, N.A., as Trustee, relating to Hewlett Packard Enterprise Company's 2.850% notes due 2018. | 8-K | 001-04423 | 4.3 | October 13, 2015 | |||||
4(m) | Third Supplemental Indenture, dated as of October 9, 2015, between Hewlett Packard Enterprise Company and The Bank of New York Mellon Trust Company, N.A., as Trustee, relating to Hewlett Packard Enterprise Company's 3.600% notes due 2020. | 8-K | 001-04423 | 4.4 | October 13, 2015 | |||||
4(n) | Fourth Supplemental Indenture, dated as of October 9, 2015, between Hewlett Packard Enterprise Company and The Bank of New York Mellon Trust Company, N.A., as Trustee, relating to Hewlett Packard Enterprise Company's 4.400% notes due 2022. | 8-K | 001-04423 | 4.5 | October 13, 2015 | |||||
| Incorporated by Reference | ||||||||||
|---|---|---|---|---|---|---|---|---|---|---|
| Exhibit Number | ||||||||||
| Exhibit Description | Form | File No. | Exhibit(s) | Filing Date | ||||||
| 4(o) | Fifth Supplemental Indenture, dated as of October 9, 2015, between Hewlett Packard Enterprise Company and The Bank of New York Mellon Trust Company, N.A., as Trustee, relating to Hewlett Packard Enterprise Company's 4.900% notes due 2025. | 8-K | 001-04423 | 4.6 | October 13, 2015 | |||||
4(p) | Sixth Supplemental Indenture, dated as of October 9, 2015, between Hewlett Packard Enterprise Company and The Bank of New York Mellon Trust Company, N.A., as Trustee, relating to Hewlett Packard Enterprise Company's 6.200% notes due 2035. | 8-K | 001-04423 | 4.7 | October 13, 2015 | |||||
4(q) | Seventh Supplemental Indenture, dated as of October 9, 2015, between Hewlett Packard Enterprise Company and The Bank of New York Mellon Trust Company, N.A., as Trustee, relating to Hewlett Packard Enterprise Company's 6.350% notes due 2045. | 8-K | 001-04423 | 4.8 | October 13, 2015 | |||||
4(r) | Eighth Supplemental Indenture, dated as of October 9, 2015, between Hewlett Packard Enterprise Company and The Bank of New York Mellon Trust Company, N.A., as Trustee, relating to Hewlett Packard Enterprise Company's floating rate notes due 2017. | 8-K | 001-04423 | 4.9 | October 13, 2015 | |||||
4(s) | Ninth Supplemental Indenture, dated as of October 9, 2015, between Hewlett Packard Enterprise Company and The Bank of New York Mellon Trust Company, N.A., as Trustee, relating to Hewlett Packard Enterprise Company's floating rate notes due 2018. | 8-K | 001-04423 | 4.10 | October 13, 2015 | |||||
| Incorporated by Reference | ||||||||||
|---|---|---|---|---|---|---|---|---|---|---|
| Exhibit Number | ||||||||||
| Exhibit Description | Form | File No. | Exhibit(s) | Filing Date | ||||||
| 4(t) | Guarantee Agreement, dated as of October 9, 2015, between Hewlett-Packard Company, Hewlett Packard Enterprise Company and The Bank of New York Mellon Trust Company, N.A., as Trustee, in favor of the holders of the Notes. | 8-K | 001-04423 | 4.11 | October 13, 2015 | |||||
4(u) | Registration Rights Agreement, dated as of October 9, 2015, among Hewlett Packard Enterprise Company, Hewlett-Packard Company, and the representatives of the initial purchasers of the Notes. | 8-K | 001-04423 | 4.12 | October 13, 2015 | |||||
10(a) | Registrant's 2004 Stock Incentive Plan.* | S-8 | 333-114253 | 4.1 | April 7, 2004 | |||||
10(b) | Registrant's 2000 Stock Plan, amended and restated effective September 17, 2008.* | 10-K | 001-04423 | 10(b) | December 18, 2008 | |||||
10(c) | Registrant's Excess Benefit Retirement Plan, amended and restated as of January 1, 2006.* | 8-K | 001-04423 | 10.2 | September 21, 2006 | |||||
10(d) | Hewlett-Packard Company Cash Account Restoration Plan, amended and restated as of January 1, 2005.* | 8-K | 001-04423 | 99.3 | November 23, 2005 | |||||
10(e) | Registrant's 2005 Pay-for-Results Plan, as amended.* | 10-K | 001-04423 | 10(h) | December 14, 2011 | |||||
10(f) | Registrant's 2005 Executive Deferred Compensation Plan, as amended and restated effective October 1, 2006.* | 8-K | 001-04423 | 10.1 | September 21, 2006 | |||||
10(g) | ||||||||||
| First Amendment to the Registrant's 2005 Executive Deferred Compensation Plan, as amended and restated effective October 1, 2006.* | ||||||||||
10-Q | 001-04423 | |||||||||
Registrant's Executive Severance Agreement.* | 10-Q | 001-04423 | 10(u)(u) | June 13, 2002 | ||||||
Registrant's Executive Officers Severance Agreement.* | 10-Q | 001-04423 | 10(v)(v) | June 13, 2002 | ||||||
Form letter regarding severance offset for restricted stock and restricted units.* | 8-K | 001-04423 | 10.2 | March 22, 2005 | ||||||
| | | Incorporated by Reference | ||||||||
|---|---|---|---|---|---|---|---|---|---|---|
| Exhibit Number | | |||||||||
| Exhibit Description | Form | File No. | Exhibit(s) | Filing Date | ||||||
| Second Amendment to the Registrant's 2005 Executive Deferred Compensation Plan, as amended and restated effective October 1, 2006.* | 10-K | 001-04423 | 10(l)(l) | December 18, 2007 | ||||||
10(l) | Form of Agreement Regarding Confidential Information and Proprietary Developments (California).* | 8-K | 001-04423 | 10.2 | January 24, 2008 | |||||
10(m) | Form of Agreement Regarding Confidential Information and Proprietary Developments (Texas).* | 10-Q | 001-04423 | 10(o)(o) | March 10, 2008 | |||||
10(n) | Form of Stock Option Agreement for Registrant's 2004 Stock Incentive Plan.* | 10-Q | 001-04423 | 10(c)(c) | March 10, 2008 | |||||
Form of Option Agreement for Registrant's 2000 Stock Plan.* | 10-Q | 001-04423 | 10(t)(t) | June 6, 2008 | ||||||
Form of Common Stock Payment Agreement for Registrant's 2000 Stock Plan.* | 10-Q | 001-04423 | 10(u)(u) | June 6, 2008 | ||||||
Third Amendment to the Registrant's 2005 Executive Deferred Compensation Plan, as amended and restated effective October 1, 2006.* | 10-K | 001-04423 | 10(v)(v) | December 18, 2008 | ||||||
Form of Stock Notification and Award Agreement for awards of non-qualified stock options.* | 10-K | 001-04423 | 10(y)(y) | December 18, 2008 | ||||||
First Amendment to the Hewlett-Packard Company Excess Benefit Retirement Plan.* | 10-Q | 001-04423 | 10(b)(b)(b) | March 10, 2009 | ||||||
Fourth Amendment to the Registrant's 2005 Executive Deferred Compensation Plan, as amended and restated effective October 1, 2006.* | 10-Q | 001-04423 | 10(c)(c)(c) | June 5, 2009 | ||||||
Fifth Amendment to the Registrant's 2005 Executive Deferred Compensation Plan, as amended and restated effective October 1, 2006.* | 10-Q | 001-04423 | 10(d)(d)(d) | September 4, 2009 | ||||||
Amended and Restated Hewlett-Packard Company 2004 Stock Incentive Plan.* | 8-K | 001-04423 | 10.2 | March 23, | ||||||
| | | Incorporated by Reference | ||||||||
|---|---|---|---|---|---|---|---|---|---|---|
| Exhibit Number | | |||||||||
| Exhibit Description | Form | File No. | Exhibit(s) | Filing Date | ||||||
Form of Stock Notification and Award Agreement for awards of non-qualified stock options.* | 10-K | 001-04423 | 10(i)(i)(i) | December 15, 2010 | ||||||
Form of Agreement Regarding Confidential Information and Proprietary Developments (California—new hires).* | 10-K | 001-04423 | 10(j)(j)(j) | December 15, 2010 | ||||||
Form of Agreement Regarding Confidential Information and Proprietary Developments (California—current employees).* | 10-K | 001-04423 | 10(k)(k)(k) | December 15, 2010 | ||||||
First Amendment to the Registrant's Executive Deferred Compensation Plan, as amended and restated effective October 1, 2004.* | 10-Q | 001-04423 | 10(o)(o)(o) | September 9, 2011 | ||||||
Sixth Amendment to the Registrant's 2005 Executive Deferred Compensation Plan, as amended and restated effective October 1, 2006.* | 10-Q | 001-04423 | 10(p)(p)(p) | September 9, 2011 | ||||||
Employment offer letter, dated September 27, 2011, between the Registrant and Margaret C. Whitman.* | 8-K | 001-04423 | 10.2 | September 29, 2011 | ||||||
Seventh Amendment to the Registrant's 2005 Executive Deferred Compensation Plan, as amended and restated effective October 1, 2006.* | 10-K | 001-04423 | December 14, 2011 | |||||||
Registrant's Severance Plan for Executive Officers, as amended and restated September 18, 2013.* | 10-K | 001-04423 | 10(q)(q) | December 30, 2013 | ||||||
10(e)(e) | Aircraft Time Sharing Agreement, dated March 16, 2012, between the Registrant and Margaret C. Whitman.* | 10-Q | 001-04423 | 10(h)(h)(h) | June 8, 2012 | |||||
10(f)(f) | Second Amended and Restated Hewlett-Packard Company 2004 Stock Incentive Plan, as amended effective February 28, 2013.* | 8-K | 001-04423 | 10.2 | March 21, 2013 | |||||
10(g)(g) | Aircraft Time Sharing Agreement, dated April 22, 2013, between the Registrant and John M. Hinshaw.* | 10-Q | 001-04423 | 10(t)(t) | June 6, 2013 | |||||
| | | Incorporated by Reference | ||||||||
|---|---|---|---|---|---|---|---|---|---|---|
| Exhibit Number | | |||||||||
| Exhibit Description | Form | File No. | Exhibit(s) | Filing Date | ||||||
| 10(h) | ||||||||||
Form of Stock Notification and Award Agreement for awards of restricted stock units.* | 10-Q | 001-04423 | 10(u)(u) | March 11, 2014 | ||||||
Form of Stock Notification and Award Agreement for awards of foreign stock appreciation rights.* | 10-Q | 001-04423 | 10(v)(v) | March 11, 2014 | ||||||
Form of Stock Notification and Award Agreement for long-term cash awards.* | 10-Q | 001-04423 | 10(w)(w) | March 11, 2014 | ||||||
Form of Stock Notification and Award Agreement for awards of non-qualified stock options.* | 10-Q | 001-04423 | 10(x)(x) | March 11, 2014 | ||||||
Form of Grant Agreement for grants of performance-adjusted restricted stock units.* | 10-Q | 001-04423 | 10(y)(y) | March 11, 2014 | ||||||
Form of Stock Notification and Award Agreement for awards of restricted stock.* | 10-Q | 001-04423 | 10(z)(z) | March 11, 2014 | ||||||
Form of Stock Notification and Award Agreement for awards of performance-contingent non-qualified stock options.* | 10-Q | 001-04423 | 10(a)(a)(a) | March 11, 2014 | ||||||
Form of Grant Agreement for grants of performance-contingent non-qualified stock options.* | 10-Q | 001-04423 | 10(b)(b)(b) | March 11, 2014 | ||||||
Eighth Amendment to the Registrant's 2005 Executive Deferred Compensation Plan, as amended and restated effective October 1, 2006.* | 10-Q | 001-04423 | 10(c)(c)(c) | March 11, 2014 | ||||||
10(q)(q) | Ninth Amendment to the Registrant's 2005 Executive Deferred Compensation Plan, as amended and restated effective October 1, 2006.* | 10-Q | 001-04423 | 10(d)(d)(d) | March 11, 2014 | |||||
10(r)(r) | Tenth Amendment to the Registrant's 2005 Executive Deferred Compensation Plan, as amended and restated effective October 1, 2006.* | 10-K | 001-0442 | 10(c)(c)(c) | December 17, 2014 | |||||
10(s)(s) | Form of Grant Agreement for grants of restricted stock units.* | 10-Q | 001-04423 | 10(c)(c)(c) | March 11, 2015 | |||||
10(t)(t) | Form of Grant Agreement for grants of foreign stock appreciation rights.* | 10-Q | 001-04423 | 10(d)(d)(d) | March 11, 2015 | |||||
| | | Incorporated by Reference | ||||||||
|---|---|---|---|---|---|---|---|---|---|---|
| Exhibit Number | | |||||||||
| Exhibit Description | Form | File No. | Exhibit(s) | Filing Date | ||||||
| 10-Q | 001-04423 | March 11, | ||||||||
10-Q | 001-04423 | 10(f)(f)(f) | March 11, 2015 | |||||||
10(w)(w) | Form of Grant Agreement for grants of performance-adjusted restricted stock units.* | 10-Q | 001-04423 | 10(g)(g)(g) | March 11, 2015 | |||||
10(x)(x) | Form of Grant Agreement for grants of restricted stock awards.* | 10-Q | 001-04423 | 10(h)(h)(h) | March 11, 2015 | |||||
10(y)(y) | Form of Grant Agreement for grants of performance-contingent non-qualified stock options.* | 10-Q | 001-04423 | 10(i)(i)(i) | March 11, 2015 | |||||
10(z)(z) | Registrant's | 10-Q | 001-04423 | 10(j)(j)(j) | March 11, 2015 | |||||
10(a)(a)(a) | Voting Agreement, dated as of March 2, 2015, among the Registrant and the listed stockholders of Aruba Networks, Inc. | 8-K | 001-04423 | 10.1 | March 2, 2015 | |||||
10(b)(b)(b) | Term Loan Agreement, dated as of April 30, 2015, among the Registrant, the lenders named therein and JPMorgan Chase Bank, N.A., as administrative agent. | 10-Q | 001-04423 | 10(b)(b)(b) | June 8, 2015 | |||||
10(c)(c)(c) | Amendment, dated as of June 1, | 10-Q | 001-04423 | 10(c)(c)(c) | June 8, 2015 | |||||
10(d)(d)(d) | Five-Year Credit Agreement, dated as of April 2, 2014, as Amended and Restated as of November 1, 2015, among the Registrant, the lenders named therein and Citibank, N.A., as administrative processing agent and co-administrative agent, and JPMorgan Chase Bank, N.A., as co-administrative agent. | 8-K | 001-04423 | 10.1 | November 5, 2015 | |||||
| Incorporated by Reference | ||||||||||
|---|---|---|---|---|---|---|---|---|---|---|
| Exhibit Number | ||||||||||
| Exhibit Description | Form | File No. | Exhibit(s) | Filing Date | ||||||
| 10(e)(e)(e) | Form of Grant Agreement for grants of foreign stock appreciation rights.*‡ | |||||||||
10(f)(f)(f) | Form of Grant Agreement for grants of performance-contingent non-qualified stock options.*‡ | |||||||||
10(g)(g)(g) | Form of Grant Agreement for grants of non-qualified stock options.*‡ | |||||||||
9 | None. | |||||||||
11 | None. | |||||||||
12 | ||||||||||
13-14 | None. | |||||||||
None. | ||||||||||
18 | None. | |||||||||
21 | Subsidiaries of the Registrant as of | |||||||||
22 | None. | |||||||||
23 | Consent of Independent Registered Public Accounting Firm.‡ | |||||||||
24 | Power of Attorney (included on the signature page). | |||||||||
31.1 | Certification of Chief Executive Officer pursuant to Rule 13a-14(a) and Rule 15d-14(a) of the Securities Exchange Act of 1934, as amended.‡ | |||||||||
31.2 | Certification of Chief Financial Officer pursuant to Rule 13a-14(a) and Rule 15d-14(a) of the Securities Exchange Act of 1934, as amended.‡ | |||||||||
32 | Certification of Chief Executive Officer and Chief Financial Officer pursuant to 18 U.S.C. 1350, as adopted pursuant to Section 906 of the Sarbanes-Oxley Act of 2002.† | |||||||||
| | | Incorporated by Reference | ||||||||
|---|---|---|---|---|---|---|---|---|---|---|
| Exhibit Number | | |||||||||
| Exhibit Description | Form | File No. | Exhibit(s) | Filing Date | ||||||
| XBRL | ||||||||||
101.SCH | XBRL Taxonomy Extension Schema Document.‡ | |||||||||
101.CAL | XBRL Taxonomy Extension Calculation Linkbase Document.‡ | |||||||||
101.DEF | XBRL Taxonomy Extension Definition Linkbase Document.‡ | |||||||||
101.LAB | XBRL Taxonomy Extension Label Linkbase Document.‡ | |||||||||
101.PRE | XBRL Taxonomy Extension Presentation Linkbase Document.‡ | |||||||||
The registrant agrees to furnish to the Commission supplementally upon request a copy of (1) any instrument with respect to long-term debt not filed herewith as to which the total amount of securities authorized thereunder does not exceed 10% of the total assets of the registrant and its subsidiaries on a consolidated basis and (2) any omitted schedules to any material plan of acquisition, disposition or reorganization set forth above.