
UNITED STATES
SECURITIES AND EXCHANGE COMMISSION
Washington, D.C. 20549
FORM 10-K
| (Mark One) | ||
| ý | ANNUAL REPORT PURSUANT TO SECTION 13 OR 15(d) OF THE SECURITIES EXCHANGE ACT OF 1934 | |
For the fiscal year ended December 31, | ||
or | ||
o | TRANSITION REPORT PURSUANT TO SECTION 13 OR 15(d) OF THE SECURITIES EXCHANGE ACT OF 1934 | |
For the transition period from to | ||
Commission File No. 1-34062
INTERVAL LEISURE GROUP, INC.
(Exact name of registrant as specified in its charter)
| Delaware (State or other jurisdiction of incorporation or organization) | 26-2590997 (I.R.S. Employer Identification No.) | |
6262 Sunset Drive, Miami, FL (Address of Registrant's principal executive offices) | 33143 (Zip Code) |
(305) 666-1861
(Registrant's telephone number, including area code)
Securities registered pursuant to Section 12(b) of the Act:
| Title of each class | Name of each exchange on which registered | |
|---|---|---|
| Common Stock, $0.01 par value per share | The NASDAQ Stock Market |
Securities registered pursuant to Section 12(g) of the Act: None
Indicate by check mark if the registrant is a well-known seasoned issuer, as defined in Rule 405 of the Securities Act. Yes ý No o
Indicate by check mark if the registrant is not required to file reports pursuant to Section 13 or Section 15(d) of the Exchange Act. Yes o No ý
Indicate by check mark whether the registrant (1) has filed all reports required to be filed by Section 13 or 15(d) of the Securities Exchange Act of 1934 during the preceding 12 months (or for such shorter period that the registrant was required to file such reports), and (2) has been subject to such filing requirements for the past 90 days. Yes ý No o
Indicate by check mark whether the registrant has submitted electronically and posted on its corporate Web site, if any, every Interactive Data File required to be submitted and posted pursuant to Rule 405 of Regulation S-T (§232.405 of this chapter) during the preceding 12 months (or for such shorter period that the registrant was required to submit and post such files). Yes ý No o
Indicate by check mark if disclosure of delinquent filers pursuant to Item 405 of Regulation S-K is not contained herein, and will not be contained, to the best of registrant's knowledge, in definitive proxy or information statements incorporated by reference in Part III of this Form 10-K or any amendment to this Form 10-K. ý
Indicate by check mark whether the registrant is a large accelerated filer, an accelerated filer, a non-accelerated filer, or a smaller reporting company. See the definitions of "large accelerated filer," "accelerated filer" and "smaller reporting company" in Rule 12b-2 of the Exchange Act. (Check one):
| Large accelerated filer ý | Accelerated filer o | Non-accelerated filer o (Do not check if a smaller reporting company) | Smaller reporting company o |
Indicate by check mark whether the registrant is a shell company (as defined in Rule 12b-2 of the Exchange Act). Yeso Noý
As of June 30, 2014,2015, the aggregate market value of the registrant's common stock held by non-affiliates of the registrant was $856,476,607.$894,617,693. As of February 23, 2015, 57,100,8202016, 57,490,609 shares of the registrant's common stock were outstanding.
DOCUMENTS INCORPORATED BY REFERENCE
Portions of the Registrant's proxy statement for its 20142016 Annual Meeting of Stockholders are incorporated by reference into Part III herein.
TABLE OF CONTENTS
| Page | ||||
|---|---|---|---|---|
PART I | ||||
Item 1. | Business | 3 | ||
Item 1A. | Risk Factors | 21 | ||
Item 1B. | Unresolved Staff Comments | 39 | ||
Item 2. | Properties | 39 | ||
Item 3. | Legal Proceedings | 40 | ||
Item 4. | Mine Safety Disclosure | 40 | ||
Executive Officers of the Registrant | 40 | |||
PART II | ||||
Item 5. | Market For Registrant's Common Equity, Related Stockholder Matters and Issuer Purchases of Equity Securities | 41 | ||
Item 6. | Selected Financial Data | 43 | ||
Item 7. | Management's Discussion and Analysis of Financial Condition and Results of Operations | 46 | ||
Item 7A. | Quantitative and Qualitative Disclosures About Market Risk | 92 | ||
Item 8. | Financial Statements and Supplementary Data | 93 | ||
Item 9. | Changes in and Disagreements with Accountant on Accounting and Financial Disclosure | 154 | ||
Item 9A. | Controls and Procedures | 154 | ||
Item 9B. | Other Information | 157 | ||
PART III | ||||
Item 10. | Directors, Executive Officers and Corporate Governance | 157 | ||
Item 11. | Executive Compensation | 157 | ||
Item 12. | Security Ownership of Certain Beneficial Owners and Management and Related Stockholder Matters | 157 | ||
Item 13. | Certain Relationships and Related Transactions, and Director Independence | 157 | ||
Item 14. | Principal Accountant Fees and Services | 157 | ||
PART IV | ||||
Item 15. | Exhibits and Financial Statement Schedules | 159 |
i
Throughout this Annual Report on Form 10-K, the terms "ILG," "Company," "we," "us" and" "our" refer to Interval Leisure Group, Inc. and, except as the context otherwise requires, its consolidated subsidiaries. The "Hyatt Vacation Ownership" business or "HVO" refers to the group of businesses using the Hyatt® brand in the shared ownership business pursuant to a master license agreement with a subsidiary of Hyatt Hotels Corporation ("Hyatt"). All brand trademarks, service marks or trade names cited in this report are the property of their respective holders.
The information found on our corporate website, www.iilg.com, or any other website referred to in this report, is not incorporated into this Annual Report or any other report we file with or furnish to the United States Securities and Exchange Commission.
Cautionary Statement Regarding Forward-Looking Information
This annual report on Form 10-K contains certain statements which may constitute "forward-looking statements" within the meaning of the Private Securities Litigation Reform Act of 1995. Statements that are not historical fact are forward looking-statements, and are contained throughout this document. These forward-looking statements reflect management's views and assumptions as of the date of this annual report regarding future events and operating performance. The use of words such as "anticipates," "estimates," "expects," "intends," "plans," "potential," "continue," and "believes," and similar expressions or future or conditional verbs such as "will," "should," "would," "may," "might," and "could" among others, generally identify forward-looking statements. These forward-looking statements include, among others, statements relating to: our future financial performance, our business prospects and strategy, anticipated financial position, liquidity and capital needs and other similar matters. These forward-looking statements are based on management's current expectations and assumptions about future events, which are inherently subject to uncertainties, risks and changes in circumstances that are difficult to predict.
Actual results could differ materially from those contained in the forward-looking statements included in this annual report for a variety of reasons, including, among others: (1) the occurrence of any event, change or other circumstances that could give rise to the termination of the merger agreement to acquire Vistana as described below, (2) the risk that ILG stockholders may not approve the issuance of ILG common stock in connection with the proposed merger, (3) the risk that the necessary regulatory approvals may not be obtained or may be obtained subject to conditions that are not anticipated, (4) risks that any of the closing conditions to the proposed merger, including Starwood's spin-off of Vistana, may not be satisfied in a timely manner, (5) risks related to disruption of management time from ongoing business operations due to the proposed merger, (6) failure to realize the benefits expected from the proposed merger, (7) the effect of the announcement of the proposed merger on the ability of ILG and Vistana to retain and hire key personnel and maintain relationships with their key business partners, and on their operating results and businesses generally, (8) adverse trends in economic conditions generally or in the vacation ownership, vacation rental and travel industries;industries, or adverse events or trends in key vacation destinations, (9) adverse changes to, or interruptions in, relationships with third parties;parties unrelated to the announcement, (10) lack of available financing for, or insolvency of developers;or consolidation of developers;developers, (11) decreased demand from prospective purchasers of vacation interests;interests, (12) travel related health concerns; changes in our senior management; regulatory changes; ourconcerns, (13) ILG's ability to compete effectively and successfully and to add new products and services; ourservices, (14) ILG's ability to successfully manage and integrate acquisitions;acquisitions, (15) the occurrence of a change in controltermination event under the master license agreement with Hyatt; our failure to comply with designated Hyatt® brand standards with respect to the operation of the Hyatt, Vacation Ownership business; our(16) ILG's ability to market vacation ownership interests successfully and efficiently;efficiently, (17) impairment of assets;ILG's assets, (18) the restrictive covenants in ourILG's revolving credit facility; adverse events or trends in key vacation destinations;facility and indenture; (19) business interruptions in connection with ourILG's technology systems;systems, (20) the ability of managed homeowners'homeowners associations to collect sufficient maintenance fees;fees, (21) third parties not repaying advances or extensions of credit;credit, (22) fluctuations in currency exchange rates;rates and our
(23) ILG's ability to expand successfully in international markets and manage risks specific to international operations. Certain of these and other risks and uncertainties are discussed in our filings with the SEC, including in Item 1A "Risk Factors" of this report. In light of these risks and uncertainties, the forward looking statements discussed in this report may not prove to be accurate. Accordingly, you should not place undue reliance on these forward looking statements, which only reflect the views of our management as of the date of this report. Except as required by applicable law, we do not undertake to update these forward-looking statements.
Overview
Interval Leisure Group, Inc., or ILG, is a leading global provider of non-traditional lodging, encompassing a portfolio of leisure businesses from vacation exchange and vacation rental to vacation
ownership. At the end of 2014, we re-aligned our operating segments to encompass the vacation ownership sales and marketing capabilities that we added to our company with the acquisition of the Hyatt Vacation Ownership business in October 2014. As a result, weWe operate in the following two segments: Exchange and Rental, and Vacation Ownership.
Exchange and Rental offers access to vacation accommodations and other travel-related transactions and services to leisure travelers, by providing vacation exchange services and vacation rental, working with resort developers and operating vacation rental properties. Vacation exchange services provide owners of vacation interests with flexibility and choice by delivering access to alternate accommodations through exchange networks encompassing a variety of resorts. Our principal exchange network is the Interval Network, in which more than 2,9003,000 resorts located in over 80 nations participated as of December 31, 2014.2015. We also operate additional exchange programs including the Hyatt Residence Club, which encompasses 16 resorts as of the end of 2014.2015. This segment provides vacation rental through its Aston and Aqua businessesthe Aqua-Aston business as part of a comprehensive package of marketing, management and rental services offered to vacation property owners, primarily of Hawaiian properties, as well as through the Interval Network. The Exchange and Rental segment represented approximately 73.8% of ILG's consolidated revenue for the fiscal year ended December 31, 2015 and approximately 78.7% of ILG's consolidated revenue for the fiscal year ended December 31, 2014 and approximately 88.3% of ILG's consolidated revenue for the fiscal year ended December 31, 2013.2014.
The Exchange and Rental operating segment consists of Interval International (referred to as Interval), the Hyatt Residence Club, the Trading Places International (known as TPI) operated exchange business, Aston Hotels & Resorts, Inc.and Aqua-Aston Hospitality (referred to as Aston) and Aqua Hospitality, LLC (referred to as Aqua)Aqua-Aston).
Vacation Ownership engages in the management of vacation ownership resorts; sales, marketing, and financing of vacation ownership interests; and related services to owners and associations. We provide management services to nearly 200 vacation ownership properties and/or their associations. Following the October 2014 acquisition, we also provide sales and marketing of vacation ownership interests in the Hyatt Residence Club resorts. The Vacation Ownership segment represented approximately 28.1% of ILG's consolidated revenue for the fiscal year ended December 31, 2015 and approximately 21.3% of ILG's consolidated revenue for the fiscal year ended December 31, 2014 and approximately 11.7% of ILG's consolidated revenue for the fiscal year ended December 31, 2013.2014. For information regarding the results of operations of ILG and its segments on a historical basis, see Note 15 to the Consolidated Financial Statements of ILG and the disclosure set forth under the caption "Management's Discussion and Analysis of Financial Condition and Results of Operations."
The Vacation Ownership operating segment consists of the management related lines of business of Vacation Resorts International (known as VRI), TPI, VRI Europe and Hyatt Vacation Ownership (referred to as HVO) as well as the sales and financing of vacation ownership interests.
Recent Developments
On October 28, 2015, we announced that we had entered into a merger agreement pursuant to which we will acquire the vacation ownership business of Starwood Hotels & Resorts Worldwide, Inc., or Starwood, as well as five hotels that are expected to be converted to vacation ownership properties
in the future. The acquisition will be effected through a "Reverse Morris Trust" transaction pursuant to which Starwood will spin-off Vistana Signature Experiences, or Vistana, a wholly-owned subsidiary, tax-free to Starwood shareholders and simultaneously merge with a wholly-owned subsidiary of ILG, with Vistana becoming a wholly-owned subsidiary of ILG. At the close of the proposed transactions, Starwood stockholders will own approximately 55% of ILG common stock and ILG stockholders will own approximately 45% of ILG common stock, in each case, on a fully diluted basis.
In connection with the transaction, Vistana will enter into an 80-year exclusive global license agreement for the use of the Westin® and Sheraton® brands in vacation ownership in addition to the non-exclusive license for the existing St. Regis® and The Luxury Collection® properties. Under the terms of the license agreement, Starwood will receive an annual base royalty fee of $30 million plus 2% of vacation ownership interest sales.
The merger is anticipated to close in the second quarter of 2016, subject to customary closing conditions, including regulatory and ILG shareholder approvals. Liberty Interactive Corporation and certain ILG executive officers have entered into voting and support agreements in favor of the transaction, representing approximately 31% of ILG's shares outstanding.
History
ILG was incorporated as a Delaware corporation in May 2008 in connection with a plan bythe spin-off of IAC/InterActiveCorp, or IAC, to separate into five separate publicly traded companies, referred to as the "spin-off."companies. ILG commenced trading on The NASDAQ Stock Market in August 2008 under the symbol "IILG."
The businesses operated by ILG's subsidiaries have extensive operating histories. ILG's Interval International business was founded in 1976, its Aston business traces its roots in lodging back over 60 years, while Aqua was founded in 2001. Trading Places International was founded in 1973, Vacation Resorts International in 1981; and the Hyatt Vacation Ownership business began in 1994.
On February 28, 2012, we acquired all of the equity of Vacation Resorts International, a provider of resort and homeowners' association management services to the shared ownership industry.
On November 4, 2013, VRI Europe Limited, a subsidiary of ILG, purchased the European shared ownership resort management business of CLC World Resorts and Hotels (CLC), for cash and issuance to CLC of shares totaling 24.5% of VRI Europe Limited.
On December 12, 2013, we acquired all of the equity of Aqua Hospitality LLC and Aqua Hotels and Resorts, Inc., referred to as Aqua, a Hawaii-based hotel and resort management company representing more than 25 properties in Hawaii and Guam.
On October 1, 2014, we acquired the Hyatt Vacation Ownership business, which provides vacation ownership services at 16 Hyatt Residence Club resorts, from subsidiaries of Hyatt Hotels Corporation. In connection with the acquisition, we entered into a long-term exclusive license for use of the Hyatt® brand with respect to the shared ownership business.
On October 28, 2015, we announced that we had entered into a merger agreement pursuant to which we will acquire the vacation ownership business of Starwood to be known as Vistana. Upon closing, Starwood will spin-off Vistana to its stockholders then immediately following the spin-off Vistana will merge with a wholly owned subsidiary of ILG. In the merger, the Vistana common stock to which Starwood stockholders are entitled in the spin-off will automatically convert in to ILG common stock. At the close of the proposed transactions, Starwood stockholders will own approximately 55% of ILG common stock and ILG stockholders will own approximately 45% of ILG common stock, in each case, on a fully diluted basis.
Industry Overview and Trends
The hospitality industry, which includes non-traditional lodging, is a major component of the leisure travel industry. Within non-traditional lodging, a variety of leisure accommodations are provided including vacation ownership and vacation rentals.
Vacation Ownership
Vacation ownership is the component of the non-traditional lodging industry that encompasses the development, operation, sales, marketing and management of vacation interests in traditional timeshare regimes, fractional products, private residence clubs, condo hotels and other forms of shared ownership, and vacation home ownership. VacationAccording to the American Resort Developer Association, referred to as ARDA, vacation ownership sales (excluding sales of fractional, private residence club, destination club and whole ownership products) in the U.S. for 2013,2014, the last year for which data is available, were approximately $7.6$7.9 billion, as compared to $6.9$7.6 billion in 2012.2013. U.S. sales of fractional products, private residences and destination club products were approximately $517$516 million in 2013,2014, the last year for which data is available, as comparedcomparable to $497$517 million in 2012. Although vacation ownership sales (excluding sales of fractional, private residence club, destination club and whole ownership products) have not returned to the 2007 levels of $10.6 billion, leisure travelers continue to use their vacation ownership interests as demonstrated by significantly higher average occupancy rates at2013. Notably, U.S. timeshare resorts had an average occupancy of 78% in 2014 significantly higher than average occupancy of approximately 64% at U.S. hotels.hotels for the same period.
According to the American Resort Developer Association, referred to as ARDA, as of December 31, 2013,2014, the U.S. traditional timeshare industry was comprised of 1,5401,555 resorts, representing
approximately 192,420198,490 units and an estimated 8.58.7 million vacation ownership week equivalents. The following table reflects
In the growth in ownershippast year, several developers have announced new resorts, some of vacation ownership week equivalents since 1975:
Access to financing has returned to the industry following the recessionwhich are being internally developed and slow recovery. While few new projects have been constructed in the last several years,others are using asset and capital-light arrangements with third parties. Also, developers and homeowners' associations have been taking back vacation ownership interests which are available to be sold again. This allows developers to continue to generate sales revenues without significant capital expenditure for development and causes homeowners' associations at resorts that are no longer linked to a developer to look for efficient distribution channels to resell the inventory to preserve the maintenance fee paying owner base.
In addition to sales, the vacation ownership industry provides financing or facilitates access to third-party financing for customers. Customers that choose to finance their purchase generally make a down payment of 10% to 20% of the purchase price for a seven to ten year loan. Larger timeshare companies will access the securitization markets to obtain long-term capital and liquidity. The resorts are often managed by a homeowners' association governed by a board, which generallyhistorically will have representation from the developer until the units have been substantially sold out. These homeowners' associations typically engage a management company to undertake the operation, maintenance and refurbishment of the resort as well as management of the association. This fee-for-service business providesprovides:
Vacation Exchange and Rental Services
The vacationVacation exchange and rental services industry offersbusinesses offer leisure travelers vacation accommodations at vacation homes, villas, condo hotels, hotels, vacation ownership units and condominiums, as well as other travel-related products and benefits. In addition, this fee-for-service business provides services to owners of vacation properties and developers.
Within the vacation exchange sector, there are two principal providers of vacation ownership exchange services, Interval International, an ILG business, and RCI, LLC, a subsidiary of Wyndham Worldwide Corp. Trading Places International and several third parties also operate in this industry
with a significantly more limited scope of available accommodations. In addition, many vacation ownership resort developers and managers provide exchange services to owners within their resort systems, including Hyatt Residence Club.Club and Vistana.
The fragmented vacation rental market includes both managed properties and those offered by owners. In general, the managed properties are better able to engage in market-based pricing and offer hotel-like services. Vacation rental accommodations generally offer value to travelers seeking more than a nightly stay by often providing greater space and convenience than traditional hotel rooms and offering separate living, sleeping and eating quarters. Rental companies also facilitate the rental process by handling most, if not all, aspects of interaction with vacationers. In addition, alternative lodging marketplaces, such as Airbnb and HomeAway, operate websites that market available furnished, privately-owned residential properties for nightly, weekly or monthly rental.
Currently, ILG offersprovides rental and related management services for condominium, hotel and timeshare resorts in North America, Hawaii and Guam. A significant amount of our rental revenue is derived from resorts located in Hawaii. According to the Hawaii Tourism Authority, visitor arrivals by air in Hawaii increased 2.0%4.3% for the year ended December 31, 20142015 compared to the prior year. As of the latest forecast (November 2014)(February 2016), the Hawaii Department of Business, Economic Development and Tourism forecasts increases of 1.9% in visitors to Hawaii and 3.6%2.4% in visitor expenditures in 20152016 over 2014.2015.
Industry Growth
Future growth in the non-traditional lodging industry will be driven primarily by development of new resorts and conversion of existing properties. Due to the decreased pace of vacation ownership sales since the 2008 recession coupled with the ability for developers to acquire delinquent and secondary market inventory, developers in the United States have been building fewer new resorts. Some developers are expanding the fee for service nature of their business by selling inventory acquired from defaults, resales or agreements with resort owners. Industry expansion is expected to be driven by:
DESCRIPTION OF BUSINESS SEGMENTS
Exchange and Rental
Our Exchange and Rental segment offers access to vacation accommodations and other travel-related transactions and services to leisure travelers, by providing vacation exchange services and vacation rental, working with resort developers and operating vacation rental properties.
Vacation Exchange
Exchange Services
We offer leisure and travel-related products and services to owners of vacation interests and others primarily through various membership programs, as well as related services to resort developer clients. Vacation exchange allows owners of vacation ownership interests to exchange their occupancy rights
(whether (whether denominated in weeks or points) for comparable, alternative accommodations at another resort and/or occupancy period.period or for other vacation experiences.
After their initial membership period, certain Interval Network members generally have the option of renewing their memberships for terms ranging from one to five years and paying their own
membership fees directly to us. We sometimes refer to these as traditional members. Alternatively, some resort developers incorporate the Interval Network membership fee into certain annual fees they charge to owners of vacation interests at their resorts or vacation ownership clubs, which results in these owners having their membership in the Interval Network and, where applicable, the Interval Gold or Interval Platinum program (as described below), automatically renewed through the period of their resort's or club's participation in the Interval Network. We sometimes refer to these as corporate members.
All vacation ownership accommodations relinquished to the Interval Network exchange programs are assigned a trading value based on multiple factors, including location, quality, seasonality, unit attributes and time of relinquishment prior to occupancy to determine the relinquished accommodations' relative exchange value to the exchange network. Members are offered an exchange to accommodations which are generally of comparable value to those relinquished.
Related Products and Services
accommodations available as Getaways consist of seasonal oversupply of vacation ownership accommodations within the applicable exchange network, as well as resort accommodations we source specifically for use in Getaways.
Relationships with Developers
Resort Affiliations. The Interval Network has established multi-year relationships with numerous resort developers, including leading independent and brand name developers, under exclusive affiliation agreements. Pursuant to these agreements, resort developers are obligated to enroll all purchasers of vacation interests at their resorts in the applicable exchange membership program and, in some circumstances, are obligated to renew these memberships for the term of their affiliation agreement. We do not consider our overall business to be dependent on any one of these resort developers, provided, that the loss of or unfavorable amendment of terms with a few large developers (particularly those from which Interval receives membership renewal fees directly) could materially impact our business.
Products and Services. A primary basis on which resort developers choose us as a partner is the comprehensive array of products and services that we offer to them, such as sales and marketing support and operational support, including custom vacation program design services.
The Interval Network's resort recognition program recognizes certain of its eligible Interval Network resorts as either a "Select Resort," a "Select Boutique Resort," a "Premier Resort," or a "Premier Boutique Resort," or an "Elite Resort" based upon the satisfaction of qualifying criteria, inspection, member feedback, and other resort-specific factors. Over 40% of Interval Network resorts were recognized as a Select, Select Boutique, Premier, or Premier Boutique, Elite or Elite Boutique Resort for 2014.as of December 31, 2015.
Revenue
Our Exchange and Rental segment earns most of its exchange revenue from (i) fees paid for membership in the Interval Network and the Hyatt Residence Club and (ii) Interval Network and Hyatt Residence Club transactional and service fees paid primarily for exchanges, Getaways, reservation servicing, and related transactions collectively referred to as "transaction revenue." Revenue is also derived from fees for ancillary products and services provided to members, fees from other exchange and rental programs and other products and services sold to developers.
Marketing and Technology
Our exchange businesses maintain corporate and consumer marketing departments, based in ILG's global headquarters in Miami, Florida, with input and local expertise being provided by employees in local and regional offices worldwide. Hyatt Residence Club marketing is based in St. Petersburg, Florida. These departments are responsible for implementing our overall marketing strategy and developing printed and digital materials that are necessary to secure new relationships with resort developers, homeowners' associations and resorts and obtain new members and participants, as well as promote membership renewals, exchange opportunities and other value-added services to existing members.
We market our products and services to resort developers and other parties in the vacation ownership industry through a series of business development initiatives. Our sales and services personnel proactively seek to establish strong relationships with developers during the early stages of the development of a particular resort by providing input on consumer preferences and industry trends based upon years of experience. In addition, given our long-standing relationships with others within the vacation ownership industry, we are often able to refer resort developers, management companies and owner-controlled associations to quality providers of a wide range of planning and operational resources. We believe that we have established a strong reputation within the vacation ownership industry as being highly responsive to the needs of resort developers, management companies and owners of vacation interests.
In addition, we sponsor, participate in and attend numerous industry conferences around the world. For over 15 years, we have organized and co-sponsored a proprietary, multi-day informational seminar, known as the Shared Ownership Investment Conference, where real estate developers, hospitality companies, investors and others contemplating entry into the vacation ownership industry can meet and network with industry leaders, as well as participate in educational panels on various vacation ownership issues, such as property and program planning, sales and marketing, financing and regulatory requirements. This seminar is offered annually in the U.S. with additional conferences held periodically at locations in regions that Interval views as potential market opportunities for vacation ownership development. In 2014, we held short conferences in Lima, Peru; and Bangkok, Thailand. With these programs, we work to strengthen and expand the vacation ownership industry through the education and support of viable new entrants. We have also maintained leadership roles in various industry trade organizations throughout the world since their inception, through which we have been a driving force in the promotion of constructive legislation, both in the U.S. and abroad, principally aimed at creating or enhancing consumer protection in the vacation ownership industry. In addition we operate a business to business website,www.resortdeveloper.com, and publish a trade magazine, Vacation Industry Review, for developers, industry partners and those interested in learning more about the shared ownership industry and our services.
Our consumer marketing efforts revolve around the deepening of new and existing customer relationships globally, focusing on the strategic design of consumer marketing and product development initiatives across the customer lifecycle. The design, development and execution of programs, promotions, online and offline communications, cross-sell initiatives, new technology tools and overall
enhancements to both membership and product value propositions are all aimed at increasing acquisition, usage, loyalty, retention and overall engagement of members and non-members. The online channel remains a strategic focus of growth with new technology for our online booking tools and communications created to increase the overall user experience, member service and engagement. Interval Community and other social media channels offer Interval NetworkILG's exchange companies engage with their members through a platformnumber of online resources to share theirencourage sharing of experiences and communicatecommunication with each otherone another about vacation ownership, travel and ways to utilize and maximize their membershipmemberships. Interval International hosts the members-only Interval Community at intervalworld.com, and theirboth Interval and Hyatt Residence Club are utilizing social media
channels like Facebook and Instagram to inspire vacations, share stories and promote the vacation ownership.ownership lifestyle.
Our success also depends, in part, on our ability to provide prompt, accurate and complete service to our members through voice and data networks and proprietary and third party information systems. The technology platform for the Interval Network is a proprietary, custom developed enterprise application and database that manages all aspects of membership, exchange and Getaway transaction processing and inventory management. TPI uses a separate proprietary network for its exchange program. We also use advanced telecommunications systems and technologies to promptly respond and efficiently route member calls. In addition, we operate consumer websites for our members and participants, such aswww.intervalworld.com, www.hyattresidenceclub.com, www.tradingplaces.com andwww.preferredresidences.com.
Vacation Rental
In addition to the rental opportunities provided through the Getaway program, we provide vacation rental as the key part of a comprehensive package of marketing, management and rental services offered to vacation property owners, primarily of Hawaiian properties, through Aston and Aqua.Aqua-Aston. As of December 31, 2014, Aston and Aqua2015, Aqua-Aston provided vacation rental and/or management services to more than 50 resorts primarily in Hawaii, as well as Guam, Orlando, Florida, South Lake Tahoe, California, and Lake Las Vegas, Nevada and Pocono Mountains, Pennsylvania.Nevada.
These businesses provideThis business provides vacation property rental services for condominium owners, hotel owners, and homeowners' associations. The condominium rental properties are generally investment properties, and, to a lesser extent, second homes, owned by individuals who contract with Aston or AquaAqua-Aston directly to manage, market and rent their properties, generally pursuant to short-term agreements. We also offer such owners a comprehensive package of marketing, management and rental services designed to enhance rental income and profitability. Generally, property and homeowners' association management services, including administrative, fiscal and quality assurance services, are provided pursuant to exclusive agreements with terms typically ranging from one to ten years or more, many of which are automatically renewable.
Revenue is derived principally from fees for rental services and related management of hotel, condominium resort, and homeowners' association management. Agreements with owners at many of our vacation rental's managed hotel and condominium resorts provide that owners receive either specified percentages of the rental revenue generated under our management or guaranteed dollar amounts. In these cases, the operating expenses for the rental operation are paid from the revenue generated by the rentals, the owners are then paid their contractual percentages or guaranteed amounts, and our vacation rental business either retains the balance (if any) as its fee or makes up the deficit. Management fees consist of a base management fee and, in some instances for hotels or condominium resorts, an incentive management fee which is generally a percentage of operating profits or improvement in operating profits. Service fee revenue is based on the services provided to owners including reservations, sales and marketing, property accounting and information technology services either internally or through third party providers.
Important to the success and continued growth of the vacation rental business is our ability to source vacationers interested in booking vacation properties made available through our rental services. Our sales and marketing team in Honolulu, Hawaii, utilizes a variety of sales, marketing, revenue
management and digital marketing initiatives to attract consumers and additional properties to Aston and Aqua.Aqua-Aston. The team in Hawaii focuses on many channels of distribution including traditional wholesale through tour operators and travel partners, online travel agencies and the Global Distribution System. In addition, Aston and AquaAqua-Aston focus on driving direct business through channels such as brand websites and our central reservations office. The sales team covers several market segments from corporate and government/military to travel agents and groups with a focus on the US, Canada,
Australia, Europe, Japan, China and Korea. In many of these markets we have field sales personnel. We offer a variety of leisure accommodations to visitors from around the world through consumer websites such as,www.astonhotels.com, www.aquaresorts.com, www.aquahospitality.com, www.resortquesthawaii.com andwww.mauicondo.com. As an additional distribution channel, Aston and Aqua provideAqua-Aston provides units to Interval for use as Getaways.
Vacation Ownership
Our Vacation Ownership segment engages in the management of vacation ownership resorts; sales, marketing, and financing of vacation ownership interests; as well as related services to owners and associations. Revenue from the Vacation Ownership segment is derived principally from fees for resort and homeowners' association management services, sales of Hyatt® branded vacation ownership interests, interest income earned for financing these sales, and licensing, sales and marketing, and other fees charged to non-controlled developers of Hyatt Residence Club affiliated resorts.
Management Services
We provide management services to nearly 200 vacation ownership properties and/or their associations through HVO, TPI, VRI and VRI Europe. As of December 31, 2014:2015:
All of these businesses provide resort management services for vacation ownership resorts, which generally offer leisure accommodations with certain comforts of home, such as kitchens or kitchenettes, separate seating or living room areas and in suite, private bedrooms, with actual services and features varying by property. We also provide homeowners' association management services, which include administrative, fiscal and quality assurance services.
Our management services are provided pursuant to agreements with terms generally ranging from one to ten years or more, many of which are automatically renewable. Management fees are negotiated amounts for management and other specified services, and at times are based on a cost plus arrangement. For the United States based businesses, our management fees are paid by the homeowners' association and funded from the annual maintenance fees paid by the individual owners to the association. Most of VRI Europe revenue is based on a different model. Typically, VRI Europe charges vacation owners directly an annual fee intended to cover property management, all resort operating expenses and a management profit. Consequently, VRI Europe's business model normally operates at a lower gross margin than the other management businesses, when excluding pass-through revenue.
HVO, TPI and VRI also offer vacation rental services to individual timeshare owners and homeowners' associations. HVO provides management services to homeowners' associations and resorts that participate in the Hyatt Residence Club. VRI Europe manages resorts developed by CLC World
Resorts, our joint venture partner in VRI Europe, as well as independent homeowners' associations. The loss of several of our largest management agreements could materially impact our Vacation Ownership business.
Sales, Marketing, Financing and Related Services
HVO sells, markets, finances, develops and/or licenses the brand for 16 vacation ownership resorts that participate in the Hyatt Residence Club as of December 31, 2014:2015:
HVO sells traditional vacation ownership interests of weekly intervals and, at certain properties, fractional interests, as deeded real estate. These interests provide annual usage rights for a one-week or longer interval at a specific resort. Each purchaser is automatically enrolled in the Hyatt Residence Club through which the owner may trade some or all of his or her usage rights as described above in Exchange and Rental.
In connection with the sales of vacation ownership interests, we provide financing to eligible purchasers collateralized by the deeded interest. These loans generally bear interest at a fixed rate, have a term of up to 10 years and require a minimum 10% down payment. As of December 31, 2014,2015, our consolidated loan portfolio consisted of approximately 4,4004,000 loans with an outstanding balance of $36.5$32.2 million and a weighted average interest rate of 14.0%.
In addition, we receive fees for sales and marketing, brand licensing and other services provided to properties where the developer is not controlled by us. We have a global master license agreement with a subsidiary of Hyatt Hotels Corporation which provides us with an exclusive license for the use of Hyatt® brand with respect to shared ownership, as described below. The Hyatt Residence Club resorts are able to use the Hyatt brand through agreements with us. In the event the master license agreement expires or otherwise terminates, these resorts will no longer be able to use the Hyatt® name and any of the resorts may also lose the rights to the name in the event it does not maintain certain standards or otherwise breaches its agreements with us.
In December 2014, the newest Hyatt Residence Club resort, Hyatt Ka'anapali Beach opened on Maui. This resort was developed through an unconsolidated joint venture with Host Hotels & Resorts and HVO is providing sales, marketing and management services and the license for the brand.
Marketing
Marketing efforts for TPI, VRI and VRI Europe are focused on homeowners' associations of vacation ownership resorts. VRI Europe has an agreement with CLC World Resorts to source additional management opportunities, while HVO focuses its management services on Hyatt Residence Club resorts and associations. We also market online directly to consumers through our websites,www.vriresorts.com, www.resort-solutions.co.uk, andwww.tradingplaces.com as well as provide rental units to Interval for use as Getaways.
Generally, we sell vacation ownership interests to prospective purchasers thatwho attend a resort tour and sales presentation at one of our sales preview centers and learn about the benefits of ownership in a Hyatt Residence Club resort from one of our sales associates. As of December 31, 2014,2015, we operate seven sales preview centers. Our marketing to attract potential purchasers focuses primarily on guests of our resorts and nearby Hyatt hotels, existing owners and potential customers targeted through our marketing programs. These programs include direct mailmarketing to Hyatt Gold Passport® customer loyalty program members and other databases as well as local marketing centers in high-traffic locations. We maintain a significant presence on thewww.hyatt.com website and also reach consumers through ourwww.hyattresidenceclub.com website.
Master License Agreement
On October 1, 2014, in connection with the closing of the acquisition of HVO, our subsidiary entered into a Master License Agreement with a subsidiary of Hyatt Hotels Corporation. The Master License Agreement provides an exclusive license for the use of the Hyatt® brand in connection with the shared ownership business.
Pursuant to the terms of the Master License Agreement, our subsidiary may continue to develop, market, sell and operate existing shared ownership projects as well as new shared ownership projects agreed to by us and Hyatt. HVO must comply with designated Hyatt® brand standards with respect to the operation of the licensed business. The initial term of the Master License Agreement expires on December 31, 2093, with three 20-year extensions subject to meeting sales performance tests. In consideration for the exclusive license and for access to Hyatt's various marketing channels, including the existing hotel loyalty program, we have agreed to pay Hyatt certain recurring royalty fees based on revenues generated from vacation ownership sales, management, rental and club dues collected by us related to the branded business.
There are restrictions on transfers by us without Hyatt's written consent of:
Hyatt's written consent is not required for a "change of control" of ILG if on the date of the transaction that results in a "change of control":
provided that the following conditions are satisfied as of the date of the transaction that resulted in a "change of control" of ILG:
The transfer of a "noncontrolling" interest in HVO or ILG to a hotel or shared ownership competitor of Hyatt does not require Hyatt's written consent as long as transferee does not control or direct the day-to-day operations of the licensed business and we institute controls reasonably designed to prevent the transferee from obtaining Hyatt's confidential information.
Hyatt may terminate the Master License Agreement upon the occurrence of certain uncured, material defaults by us. Such defaults include, but are not limited to, a payment default, bankruptcy, a transfer in breach of the specified transfer restrictions or a material failure to comply with Hyatt® brand standards on a systemic level.
Competitive Strengths
Leading positions within non-traditional leisure lodging
The Interval Network, with 1.8 million members, has been a pioneer and innovator in serving the vacation ownership market since 1976, providing high-quality products and services to resort developers and members worldwide. Our tenure of our relationships with our top 25 new-member producing developer clients for the last twelve months ended December 31, 2014 average over 14 years. We are also a leading manager of vacation ownership properties through VRI, VRI Europe, TPI and HVO. Our Aston and Aqua businesses offer vacation rentals in more hotels and resorts throughout Hawaii than any other manager. As an industry leader, we are well-positioned to provide a variety of non-traditional lodging products and services to vacationers, owners, associations and developers.
Increasingly diversified revenue streams
Our revenues are diversified across a variety of business models within non-traditional lodging. We derive revenue from vacation exchange, vacation rental, as well as management of vacation ownership resorts and financing, sales and marketing of vacation ownership interests. Our management offerings include property management, association management and related services. With offices in 16 nations, we have a global presence and generate revenue from customers in over 100 countries worldwide. This breadth of services provides us with multiple opportunities to participate in the future growth of the non-traditional lodging industry.
Compelling value proposition for leisure travelers, developers and property owners
The flexibility of exchange has consistently been cited by consumers as an important feature of their timeshare purchase. The flexibility Interval membership provides, coupled with its relatively low cost as a percentage of the vacation ownership interest purchase price (generally less than 0.5%), provide an attractive value proposition at point of sale. At the same time, Interval provides sales, marketing and operational support to resort developers. Our vacation rental businesses offer leisure travelers an array of vacation accommodations at properties that are professionally managed. By handling the administrative, fiscal, quality assurance, reservations, association management, maintenance and rentals, our vacation ownership management businesses provide valuable assistance to the property owners. The HVO business offers opportunities to work with an internationally recognized brand and affiliate luxury and upper upscale destinations with the Hyatt Residence Club.
Recurring revenue streams and robust cash flow generation
Our businesses generate recurring revenues from membership, club, rental and management fees. This business model provided stable revenue generation through the recent recession.
Historically, we have required relatively low levels of capital expenditures and we will continue to focus on fee-for-service revenue streams that contribute to our strong free cash flow. Since the beginning of 2010, we have generated approximately $410.0 million of cumulative free cash flow, including $91.6 million during the year ended December 31, 2014.
Seasoned management team with demonstrated history of success
Our senior management team has approximately 200 years of combined industry experience. The senior management team has been responsible for many of our core strategies, including enhancing developer and branded hospitality company relationships and entering new international markets. The management team has also been integral in expanding the vacation rental, property and association management and vacation ownership sales and marketing services through acquisitions, including the HVO transaction in October 2014.
Business Strategy
To grow our business and expand our presence within non-traditional lodging, we are pursuing the following strategic initiatives:
Enlarging the platform for growth
ILG plans to invest in and grow HVO (and following completion of the acquisition, Vistana) through enhanced marketing efforts, expanding existing projects, and executing on opportunities to develop or otherwise acquire resort inventory. ILG intends to continue providing the exceptional service and vacation experiences to which owners at branded vacation ownership resorts are accustomed.
The ILG portfolio includes companies with long and successful track records of leadership in the vacation industry, and upon closing of the pending transaction, the addition of the Vistana business will expand and fortify ILG's timeshare resort management and exchange businesses. Importantly, Vistana will provide a new platform for growth with a strong vacation ownership sales, marketing and financing infrastructure, while further advancing ILG's strategy of increasing its recurring fee-for-service revenue. ILG expects the Vistana platform revenue growth will primarily originate from the capital-efficient development and sale of vacation ownership interests in existing markets, conversion of and sales at the transferred properties and added distribution through new sales centers.
In addition, ILG plans to selectively evaluate potential joint ventures, acquisitions, and other business arrangements that focus on non-traditional lodging. These activities may be used to expand the Hyatt Residence Club and ILG's other vacation ownership, exchange and rental businesses, provide cross-selling opportunities, or otherwise enhance or complement existing operations and strategy.
Grow highly predictable fee businesses
ILG intends to grow the highly predictable fee business earned on the recurring revenue from its resort management, vacation network and owner services activities. By developing and selling vacation ownership interests, ILG expects to generate additional cost-plus management contracts and increase membership in both the branded proprietary clubs and the Interval International business. Furthermore, ILG expects to achieve incremental revenue growth from expanding the products and services provided to owners, members and guests.
Leveraging our strategic developer, vacation club and homeowners'homeowners association relationships to expand product and service offerings
ILG believes it can leverage its existing, long-standing relationships with strategic developer,developers, vacation clubclubs and homeowners' association relationshipsassociations to capitalize on expanded product offerings related to exchange, rental and management. For example, Interval International offers several membership tiers, Basic, Gold and Platinum, which developers may promote in conjunction with their product at point of
sale as well as the Club Interval points overlaypoints-based exchange program that developers and resellers can offer as an upgrade to existing owners and new purchasers. This allows owners the option to convert their weeks-based ownership into a points currency and experience the flexibility of exchanging with Interval based on points.
In addition, we are lookingILG looks to collaborate with third parties to develop additional properties that will join the Hyatt Residence Club.Club (and following completion of the acquisition, Vistana), including through asset and capital-light opportunities.
Enlarging our platform for growthDeliver world-class experiences at branded properties in premier locations
We plan to invest inWhile ILG has always been focused on providing members and grow HVO through enhanced marketing efforts, expanding some existing projects, and executing on opportunities to broaden the group's footprint. We intend to continue providing the exceptional service andresort guests with memorable vacation experiences, to which Hyatt Residence Club owners are accustomed. Theas the global master licensee for the Hyatt® (and following completion of the Vistana acquisition Westin® and Sheraton® brands) in vacation ownership, ILG portfolio includes companies with longhas an amplified role in developing, operating and successful track recordsmaintaining vacation ownership resorts at the highest level of leadershipquality and service. Existing resorts, located in the vacation industrypremier destinations in North America such as Hawaii, Florida, California, Colorado, Mexico and the addition of HVO expanded our timeshare resort management and exchange businesses. Importantly, HVO provides a new platform for growth with the inclusion of a vacation ownership sales and marketing and financing infrastructure, and further advances our strategy of increasing our recurring fee-for-service revenue.Caribbean, attract loyalists that expect world-class branded experiences. ILG will seek to establish relationships with additional developers building new resorts as well as pursue strategic partnerships.
Enhancing services with cooperation among our various businesses
As we continue to integrate the acquisitions from the past couple years, we are pursuing additional opportunities to leverage competencies between our businesses. Ourconsistently deliver remarkable vacation ownership management and vacation rental businesses partner with our exchange businesses to provide flexibility and
alternative vacation opportunities to owners. Interval's Getaway program provides an additional distribution channel for the rental of managed inventory, while our vacation rental businesses provide lead generation services to our vacation ownership businesses. We expect to continue to capitalize on opportunities for our businesses to collaboratememories in order to enhance our sales and marketing efforts, and to share best practices across our platforms.high-value resort destinations.
Continuing to expand internationally
WeILG expects to continue to make strategic investments to grow in international markets. In 2013, weILG formed the VRI Europe joint venture with CLC World Resorts and expanded ourits vacation ownership management business to Europe. Over the past several years, the Interval Network has been affiliating more resorts abroad than in the United States with 75% of the newly-affiliated resorts from 20122013 through 20142015 located outside the United States. Further, revenue generated outsideWith the United States represented 21%license for three globally-recognized upper-upscale brands in vacation ownership, ILG plans to take advantage of our total revenue during the year ended December 31, 2014 compared to 18% during fiscal 2012. We expect to continue to review opportunities to expand our presence internationally.these businesses internationally, including the three Westin properties in Mexico that are part of the Vistana transaction and are anticipated to be converted to vacation ownership.
Pursuing strategic acquisitions and joint venturesMaintain an efficient balance sheet
We planILG expects to selectively evaluate potential acquisitions, joint venturesmaintain a prudent level of debt and other business arrangements that focus on non-traditional lodging. These activities may be usedensure access to expandcapital commensurate with operating needs, growth profile and risk mitigation policies. ILG intends to meet liquidity needs through operating cash flow, credit facilities and access to the Hyatt Residence Club and our other vacation ownership and exchange and rental businesses, provide cross-sellingasset-backed financing market. Further, ILG intends to regularly review capital efficient opportunities, or otherwise enhance or complement our existing operations and strategy.balancing its capital structure with stockholder returns.
International Operations
We conduct operations through offices in the U.S. and 15 other countries. For the year ended December 31, 2014,2015, revenue is sourced from over 100 countries worldwide. Other than the United States and Europe, revenue sourced from any individual country or geographic region did not exceed 10% of consolidated revenue for the years ended December 31, 2015, 2014 2013 and 2012.2013.
Geographic information on revenue, based on sourcing, and long-lived assets, based on physical location, is presented in the table below (in thousands). Amounts in the proceeding table representing
revenue sourced from the United States and Europe versus all other countries for yearyears ended December 31, 2012 have been reclassified to conform to current period presentation.2015, 2014 and 2013.
| | Year Ended December 31, | Year Ended December 31, | ||||||||||||||||||
|---|---|---|---|---|---|---|---|---|---|---|---|---|---|---|---|---|---|---|---|---|
| | 2014 | 2013 | 2012 | 2015 | 2014 | 2013 | ||||||||||||||
Revenue | ||||||||||||||||||||
United States | $ | 483,007 | $ | 404,886 | $ | 385,973 | $ | 577,052 | $ | 483,007 | $ | 404,886 | ||||||||
Europe | 73,119 | 34,306 | 26,715 | 68,237 | 73,119 | 34,306 | ||||||||||||||
All other countries(a) | 58,247 | 62,023 | 60,651 | 52,147 | 58,247 | 62,023 | ||||||||||||||
| | | | | | | | | | | | | | | | | | | | | |
Total | $ | 614,373 | $ | 501,215 | $ | 473,339 | $ | 697,436 | $ | 614,373 | $ | 501,215 | ||||||||
| | | | | | | | | | | | | | | | | | | | | | |
| | | | | | | | | | | | | | | | | | | | | |
| | December 31, | December 31, | ||||||||||||
|---|---|---|---|---|---|---|---|---|---|---|---|---|---|---|
| | 2014 | 2013 | 2015 | 2014 | ||||||||||
Long-lived assets (excluding goodwill and other intangible assets) | ||||||||||||||
United States | $ | 81,291 | $ | 53,056 | $ | 86,813 | $ | 81,291 | ||||||
Europe | 4,884 | 5,812 | 4,335 | 4,884 | ||||||||||
All other countries | 426 | 688 | 334 | 426 | ||||||||||
| | | | | | | | | | | | | | | |
Total | $ | 86,601 | $ | 59,556 | $ | 91,482 | $ | 86,601 | ||||||
| | | | | | | | | | | | | | | | |
| | | | | | | | | | | | | | | |
Competition
Exchange and Rental
The two principal companies in the globalOur main vacation ownership exchange business, our Interval International, business and RCI, aggressively competeprincipally competes for developer and consumer market share.share with RCI. TPI and several third parties that operate in this industry with a significantly more limited scope of available accommodations. Our Exchange and Rental segmentThis business also faces increasing competition from points-based vacation clubs and large resort developers, which often operate their own internal exchange systems to facilitate exchanges for owners of vacation interests at their resorts as they increase in size and scope. Increased consolidation in the industry enhances this competition. In addition, vacation clubs and resort developers may have direct exchange relationships with other developers.
We believe that developers and homeowners' associations generally choose to affiliate with an exchange network based on:
Based on the most recent disclosure statements filed by RCI and Interval for the year ended December 31, 2013,2014, RCI had approximately 3.73.8 million points and weeks members and its network for
weeks included a total of approximately 4,250 resorts while the Interval Network, at that time, had approximately 1.8 million members and included nearly 2,900approximately 3,000 resorts. Accordingly, RCI is the larger provider of vacation ownership member services with a larger exchange network. Through the resources of its corporate affiliates, particularly Wyndham Vacation Ownership, Inc., itself engaged in vacation ownership sales and significantly larger than HVO, RCI may have greater access to a significant segment of new purchasers of vacation interests.
While overall, the Interval Network's primary competitorRCI has a greater number of resorts in its exchange network and reports a larger number of owners of vacation interests participating in its vacation ownership membership programs, we believe that the Interval Network has distinguished itself as the membership and exchange provider of choice withfor developers of high quality vacation ownership properties and their owners. This belief is based primarily on the quality of the resorts in the Interval Network and related services provided by these resorts, coupled with favorable membership demographics and a continued commitment to attract distinctive resorts to the network and foster memorable vacation experiences for its members.
On the rental side, weWe also compete with hotels and other leisure accommodations providers for vacationers on the basis of our range of available accommodations, price, locations, and amenities. In addition, we also compete with alternative lodging marketplaces such as Airbnb and HomeAway, which operate websites that market available furnished, privately-owned residential properties, including homes and condominiums, in locations throughout the world, which can be rented on a nightly, weekly or monthly basis.
Vacation Ownership
The vacation ownership management businesses face competition from other management companies, developers and clubs. The principal competitive factors in attracting hotel, condominiumhomeowners' associations and timeshare resort and other vacation property owners and homeowners' associations are the ability to provide comprehensive management services at competitive prices and increasingly the ability to assist in the sale of defaulted inventory. In addition, there are low barriers to entry for new competitors.
Our vacation ownership business competes with other branded and independent vacation ownership developers for sales of vacation ownership interests based principally on location, quality of accommodations, price, financing terms, quality of service, terms of property use, opportunity for vacation ownership owners to exchange into time at other vacation ownership properties or other program benefits as well as brand name recognition and reputation. We also compete for talent, marketing channels and new projects. Hyatt Vacation Ownership's principal competitors in the sale of vacation ownership products include Diamond Resorts, Disney Vacation Club, Hilton Grand Vacations Club, Marriott Vacation Club Worldwide, Vistana and Wyndham Vacation Ownership. A number of the competitors in this business are larger with greater resources, distribution platforms, sales capabilities and access to capital for new projects than our business. Our ability to attract and retain purchasers of vacation ownership interests depends on our success in distinguishing the quality and value of our vacation ownership offerings from those offered by others.
Seasonality
Revenue at ILG is influenced by the seasonal nature of travel. Within our Exchange and Rental segment, our vacation exchange businesses generally recognize exchange and Getaway revenue based on confirmation of the vacation, with the first quarter generally experiencing higher revenue and the fourth quarter generally experiencing lower revenue. Our vacation rental businesses recognize rental revenue based on occupancy, with the first and third quarters generally generating higher revenue as a result of increased leisure travel to our Hawaii-based managed properties during these periods, and the second and fourth quarters generally generating lower revenue.
Within our Vacation Ownership segment, our sales and financing business experiences a modest impact from seasonality, with higher sales volumes during the traditional vacation periods, largely the third quarter (summer months).periods. Our vacation ownership management businesses by and large do not experience significant seasonality.
Employees
As of December 31, 2014,2015, ILG had approximately 6,1005,600 employees worldwide. With the exception of employees at two propertiesone property in Hawaii, one property in California, one property in Puerto Rico and employees in Argentina, Brazil, Italy, Mexico and Spain, employees are not represented by unions or collective bargaining agreements. ILG believes that relationships with its employees are generally good.
Intellectual Property
We regard ourhave a broad intellectual property rights,portfolio, including service marks, trademarks and domain names, copyrights, trade secrets and similar intellectual property (as applicable), which we view as critical to our success. Our businesses also rely heavily upon proprietary software, informational databases and other components that make up their products and services.
We rely on a combination of laws and contractual restrictions with employees, customers, suppliers, affiliates and others to establish and protect these proprietary rights. Despite these precautions, it may be possible for a third party to copy or otherwise obtain and use trade secret or copyrighted intellectual property without authorization which, if discovered, might require legal action to correct. In addition, third parties may independently and lawfully develop substantially similar intellectual properties.
We have generally registered and continue to apply to register, or secure by contract when appropriate, our trademarks and service marks as they are developed and used, and reserve and register domain names as we deem appropriate. We generally consider the protection of our trademarks to be important for purposes of brand maintenance and reputation. While we protect our trademarks, service marks and domain names, effective trademark protection may not be available or may not be sought in every country in which products and services are made available, and contractual disputes may affect the use of marks governed by private contract. Similarly, not every variation of a domain name may be available or be registered, even if available. Our failure to protect our intellectual property rights in a meaningful manner or challenges to related contractual rights could result in erosion of brand names and limit our ability to control marketing on or through the internet using our various domain names or otherwise, which could adversely affect our business, financial condition and results of operations.
From time to time in the ordinary course of business, we are a party to various legal proceedings and claims, including claims of alleged infringement of the trademarks, copyrights, patents and other intellectual property rights of third parties. In addition, litigation may be necessary in the future to enforce our intellectual property rights, protect trade secrets or to determine the validity and scope of proprietary rights claimed by others. Any litigation of this nature, regardless of outcome or merit, could result in substantial costs and diversion of management and technical resources, any of which could adversely affect our business, financial condition and results of operations.
Government Regulation
Our businesses are subject to and affected by international, federal, state and local laws, regulations and policies, which are subject to change. The descriptions of the laws, regulations and policies that follow are summaries of those which we believe to be most relevant to our business and do not purport to cover all of the laws, regulations and policies that affect our businesses. We believe that we are in material compliance with these laws, regulations and policies.
Regulations Generally Applicable to Our Business
Privacy and Data Collection. The collection and use of personal data of our customers, as well as the sharing of our customer data with affiliates and third parties, are governed by privacy laws and regulations enacted in the United States and in other jurisdictions around the world. For instance,
several states have introduced legislation or enacted laws and regulations that require compliance with standards for data collection and protection of privacy and, in some instances, provide for penalties for failure to notify customers when the security of a company's electronic/computer systems designed to protect such standards are breached, even by third parties. Other states, such as California, have enacted legislation that requires enhanced disclosure on Internet web sites regarding consumer privacy and information sharing among affiliated entities or have such legislation pending. In addition, the European Union Directive on Data Protection requires that, unless the use of data is "necessary" for certain specified purposes, including, for example, the performance of a contract with the individual concerned, consent must be obtained to use the data (other than in accordance with our stipulated privacy policies) or to transfer it outside of the European Union. Certain Latin American countries have also recently enacted similar data privacy laws. We believe that we are in material compliance with the laws and regulations applicable to privacy and data collection as such are relevant to our business.
��Marketing Operations. The products and services offered by our various businesses are marketed through a number of distribution channels, each of which is regulated at the federal and state level. Such regulations may limit our ability to solicit new customers or to market additional products or services to existing customers. For example, to comply with state and federal regulations on telemarketing, our affected businesses have adopted processes to routinely identify and remove phone numbers listed on the various "do not call" registries from our calling lists and have instituted procedures for preventing unsolicited or otherwise unauthorized telemarketing calls. In addition, where appropriate, our business has registered as a telemarketer and has adopted calling practices compliant with requirements of the applicable jurisdiction, such as restrictions on the methods and timing of telemarketing calls and limitations on the percentage of abandoned calls generated through the use of automated telephone-dialing equipment or software. Our business has taken steps to identify cellular telephone numbers to prevent them from being called through the use of automated dialers without consent.
Similarly, state and federal regulations may place limitations on our ability to engage our consumers in electronic mail marketing campaigns. Most notably, the CAN-SPAM Act imposes various requirements on the transmission of e-mail messages whose primary purpose is to advertise or promote a commercial product or service. Some foreign jurisdictions in which we operate have similar regulations. Our affected businesses have adopted e-mail messaging practices responsive to the requirements of such regulations.
Internet. A number of laws and regulations have been adopted to regulate the Internet, particularly in the areas of privacy and data collection. In addition, it is possible that existing laws may be interpreted to apply to the Internet in ways that the existing laws are not currently applied, particularly with respect to the imposition of state and local taxes on transactions through the Internet. Regulatory and legal requirements are particularly subject to change with respect to the Internet. We cannot predict with certainty whether such new requirements will affect our practices or impact our ability to market our products and services online.
Travel Agency Services. The travel agency products and services that we provide are subject to various federal, state and local regulations. We must comply with laws and regulations that relate to our marketing and sales of such products and services, including laws and regulations that prohibit unfair and deceptive advertising or practices and laws that require us to register as a "seller of travel" to comply with disclosure requirements. In addition, we are directly or indirectly affected by the
regulation of our travel suppliers, many of which are heavily regulated by the United States and other jurisdictions.
Regulations Applicable to Vacation Ownership Sales and the Exchange Business
Our vacation ownership business is subject to laws and regulations that govern the development of vacation ownership properties and the sale of vacation ownership interests. Developers are generally required to register in the state where the vacation property is located as well as each state having residents to whom the vacation ownership program will be marketed. Generally, registration must be completed before the program is marketed or advertised. The laws of most states require resort developers to file a detailed offering statement describing their business and all material aspects of the project and sale of vacation interests with a designated state authority. Laws in many jurisdictions where vacation interests are marketed grant the purchaser of a vacation interest the right to cancel a contract of purchase at any time within a specified rescission period following the earlier of the date the contract was signed or the date the purchaser has received the last of the documents required to be provided. Our sales and marketing practices are subject to the Equal Credit Opportunity Act as well as various federal and state fair housing laws, while our financing operations are subject to the requirements of the Truth-in-Lending Act as well as the Real Estate Settlement Procedures Act ("RESPA").
Certain jurisdictions regulate exchange services, generally requiring us to annually prepare and file disclosure guides in such jurisdictions. In the European Union, a Timeshare Directive has been implemented by member states. This directive imposes requirements on businesses offering timeshare exchange relating to disclosures, rescission and timing of acceptance of initial membership payment to the exchange provider. We have implemented compliance measures as national laws have been adopted by member states pursuant to this directive.
In addition, several jurisdictions in the future may enact regulations that would impose or increase taxes on members that complete exchanges, similar to local transient occupancy taxes.
Lending Regulation
Our lending activities are subject to a number of laws and regulations. In the U.S., these include the Dodd-Frank Act, the Federal Trade Commission Act, the Fair Housing Act, the Truth-in-Lending Act and Regulation Z promulgated thereunder, the Real Estate Settlement Procedures Act and Regulation X promulgated thereunder, the Home Mortgage Disclosure Act and Regulation C promulgated thereunder, the Equal Credit Opportunity Act and Regulation B promulgated thereunder, the Interstate Land Sales Full Disclosure Act, the Telephone Consumer Protection Act, the Telemarketing and Consumer Fraud and Abuse Prevention Act, the Gramm-Leach-Bliley Act, the Deceptive Mail Prevention and Enforcement Act, Section 501 of the Depository Institutions Deregulation and Monetary Control Act of 1980 and the Civil Rights Acts of 1964, 1968 and 1991. Most recently, the Consumer Finance Protection Bureau ("CFPB") has indicated an interest in the sales and consumer financing practices associated with the vacation ownership industry through initiating a review of certain developers' practices; this review may result in additional regulation of our industry. Our lending activities are also subject to the laws and regulations of other jurisdictions, including, among others, laws and regulations related to consumer loans, retail installment contracts, mortgage lending, fair debt collection practices, consumer collection practices, mortgage disclosure, lender licenses and money laundering.
Regulations Applicable to Resort Operations
A number of our businesses that manage operations of resorts are subject to, among others, laws and regulations that relate to health, safety and sanitation, the sale of alcoholic beverages, facility operation, access by disabled persons and fire safety. Applicable tourism regulations in Spain and the Canary Islands require that resorts managed by VRI Europe and its subsidiaries in those regions be registered in the Registry of Tourism. We believe that we are in material compliance with these laws and regulations as such are relevant to our business. These requirements are summarized below.
Health, Safety and Sanitation. Lodging and restaurant businesses often require licensing by applicable authorities, and sometimes these licenses are obtainable only after the business passes health inspections to assure compliance with health and sanitation codes. Health inspections are performed on a recurring basis. Health-related laws affect the food and beverage establishments. They also govern swimming pool use and operation and require the posting of notices, availability of certain rescue and other equipment and limitations on the number of persons allowed to use the pool at any time. These regulations typically impose civil fines or penalties for violations, which may lead to operating restrictions if uncorrected or in extreme cases of violations.
Sale of Alcoholic Beverages. Alcoholic beverage service is subject to licensing and extensive regulations that govern virtually all aspects of service. Compliance with these regulations at managed locations may impose obligations on the owners of managed resorts, the property manager or both. Resort operations may be adversely affected by delays in transfers or issuances of alcoholic beverage licenses necessary for food and beverage services.
Facility Operation. The operation of lodging facilities is subject to various innkeepers' laws and laws regarding accessibility and use of public accommodations by disabled persons. Federal and state laws applicable to places of public accommodation prohibit discrimination in lodging services on the basis of the race, sex, color, religion, ancestry or disability of the guest and impose ongoing obligations with respect to accessibility. Hawaiian state law prohibits smoking in guest rooms and all enclosed areas.
Other. Our businesses are subject to state and local regulation, including fire safety and applicable real estate brokerage and community association management licensing statutes.
Internet Address and SEC Filings
Our Internet address iswww.iilg.com. On our Web site, we provide a link to our electronic SEC filings, including our annual report on Form 10-K, our quarterly reports on Form 10-Q, our current reports on Form 8-K and any amendments to these reports. All such filings are available free of charge and are available as soon as reasonably practicable after filing.
Adverse Events and Trends—Adverse events and trends in the vacation ownership, vacation rental and travel industries could adversely affect our business, financial condition and results of operations.
The success of ILG and our businesses depends, in substantial part, upon the health of the worldwide vacation ownership, vacation rental and travel industries. Travel expenditures are sensitive to business and personal discretionary spending levels and tend to decline during general economic downturns. Economic conditions may cause decreased demand forinterest in purchases of vacation ownership interests, may increase default rates among current owners, and may increase refund requests from our members. Members and other consumers may be unable or unwilling to travel to certain destinations where vacation ownership resorts and vacation rental properties are located based on one or more of the following factors:
TheseThe occurrence of any of these factors could result in a decrease and/or delay in demand for travel to our managed hotels and resorts and for exchanges and Getaways to, and purchases of, vacation ownership interests in affected regions. This decrease and/or delay in demand, depending on its scope and duration, could adversely
affect our business and financial performance. Similarly, these factors could result in a decrease in the number of resort accommodations or vacation rentals available for use in our exchange programs or as vacation rentals. The matters described above could result in a decrease in the number of Interval Network members and could have a material adverse effect on the vacation ownership and vacation rental industries, which in turn could have a material adverse effect on our business, financial condition and results of operations.
Availability of Financing and Developer Insolvency—Lack of available financing for vacation property developers and the resultant potential for insolvency and bankruptcy of developers could adversely affect our business, financial condition and results of operations.
Vacation ownership property developers, including HVO and Vistana, rely on the credit markets for receivables financing used to fund their sales and marketing efforts and for financing new development. If receivables financing, vacation ownership asset backed securitizations, or financing for development of resorts is unavailable or is only available on unacceptable terms, developers may scale back or even cease operations, including sales and marketing efforts and development of resorts, which areresorts. In addition to adversely affecting HVO and Vistana, a slowdown in sales of vacation ownership interests decreases the sources of new members for our exchange networks. In addition,networks, and developers may seek to extend or adjust payment terms with us.
Inability to obtain financing on acceptable terms, or at all, previously caused and may in the future cause insolvency of resort developers affiliated with our exchange networks, which in turn could reduce or stop the flow of new members from their resorts and also could adversely affect the operations and desirability of exchange with those resorts if the developer's insolvency impacts the management of the resorts. In some cases a developer in bankruptcy could terminate its existing relationship with us. Insolvency of one or more developers that in the aggregate have significant obligations owed to us could cause impairments to certain receivables and assets which could have a material adverse effect on our results of operations.
Insolvency of a number of vacation ownership properties managed by us, particularly several of our largest managed properties, could materially adversely affect the Vacation Ownership segment's business, financial condition and results of operations.
Availability of Financing—Lack of available financing for consumers could adversely affect our business, financial condition and results of operations.
A lack of available credit for consumers could result in a decrease in potential purchasers of vacation interests, which would negatively impact our vacation ownership sales and membership in our exchange networks. This may also cause a decrease in potential purchasers of interests at vacation properties we manage, which could lead to loss of management agreements. A lack of available consumer credit could have a material adverse effect on our business, financial condition and results of operations.
Consolidation of Developers—Consolidation of developers could adversely affect our business, financial condition and results of operations
The industry has been in a period of consolidation, which is expected to continue. When developers that have affiliation agreements with the Interval Network are acquired, they may choose not to continue the agreement or renew at the end of the current term.term or may only continue on terms less favorable to ILG than the existing agreements. If we are unable to obtain or retain business relationships with the resultant resort developers on as favorable terms, our results of operations may be materially adversely affected.
Competition—The industries in which our businesses operate are highly competitive and these businesses are subject to risks relating to competition that may adversely affect our performance.
Our businesses will be adversely impacted if they cannot compete effectively in their respective industries, each of which is highly competitive. Some of our competitors have significantly greater financial, marketing and other resources than we have. In particular, in the case of the Interval Network, its primary competitor, RCI, is larger. Through the resources of its corporate affiliates, particularly, Wyndham Vacation Ownership, Inc., itself engaged in vacation ownership sales, RCI may have greater access to a significant segment of new vacation ownership purchasers and a broader platform for participating in industry consolidation. Our Exchange and Rental business also competes for rentals with other leisure lodging operators, including both independent and branded properties as well as with alternative lodging marketplaces such as Airbnb and HomeAway, which operate websites that market available furnished, privately-owned residential properties in locations throughout the world, including homes and condominiums, that can be rented on a nightly, weekly or monthly basis. Competitive pressures may cause us to reduce our fee structure or potentially modify our business models, which could adversely affect our business, financial condition and results of operations.
We believe that developers will continue to create, operate and expand internal exchange and vacation club systems, which decreases their reliance on external vacation ownership exchange programs, including those offered by us, and adversely impacts the supply of resort accommodations available through our exchange networks. The effects on our business are more pronounced as the proportion of vacation club corporate members in the Interval Network increases. The vacation ownership industry has and mayis expected to continue to experience consolidation through the acquisition of vacation ownership developers by other developers, which may result in the diversion of exchange membership and other business.
Our Vacation Ownership business competes with other vacation ownership developers for sales of vacation ownership interests based principally on location, quality of accommodations, price, financing terms, quality of service, terms of property use, opportunity for vacation ownership owners to exchange into time at other vacation ownership properties or other program benefits as well as brand name recognition and reputation. A number of our competitors are significantly larger with greater access to capital resources and broader sales, marketing and distribution capabilities than we have. We also compete with other timeshare management companies on the basis of quality and types of services offered, price and relationship. Our ability to attract and retain purchasers of vacation ownership interests and management services depends on our success in distinguishing the quality and value of our vacation ownership offerings from those offered by others. If we are unable to do so, our ability to compete effectively for sales of timeshare interests and management contracts could be adversely affected.
Third Party Relationships—We depend on relationships with developers, members and other vacation property owners and any adverse changes in these relationships could adversely affect our business, financial condition and results of operations.
Our Interval Network business is dependent upon vacation ownership developers for new members and upon members and participants to renew their existing memberships and otherwise engage in transactions. Developers and members also supply resort accommodations for use in exchanges and Getaways. Our vacation rental businesses arebusiness is dependent upon vacation property and hotel owners for vacation properties to rent to vacationers. The Interval Network has established relationships with numerous developers pursuant to exclusive multi-year affiliation agreements and we believe that relationships with these entities are generally strong, but these historical relationships may not continue in the future. During each year, the affiliation agreements for several of the Interval Network's new member-producing developers are scheduled to renew. The non-renewal of an affiliation agreement will adversely affect our ability to secure new members for our programs from the non-renewing resort or
developer, and will result in the loss of existing Interval Network members (and their vacation interests) at the end of their current membership to the extent that we do not secure membership renewals directly from such members. For corporate member relationships, this has a greater effect.
In addition, we may be unable to negotiate new affiliation agreements with resort developers or secure renewals with existing members in our exchange programs, and our failure to do so would result in decreases in the number of new and/or existing members, the supply of resort accommodations available through our exchange networks and related revenue. The loss or renegotiation on less favorable terms of several of our largest affiliation agreements could materially impact our business, financial condition and results of operations.
If we are unable to obtain sufficient renewals of affiliations with resorts and memberships with consumers or to enter into new affiliation agreements, this could have a material adverse effect on our business, financial condition and results of operations. Our ability to maintain existing or negotiate new affiliation agreements on terms as favorable as currently in place may be adversely impacted by the continued creation and operation of internal reservation and exchange networks by developers and vacation clubs, as well as by consolidation in the vacation ownership industry. This could materially adversely affect our business, financial condition and results of operations.
Similarly, the failure of our businesses to maintain existing or negotiate new rental services arrangements and related management agreements with hotel and vacation property owners, as a result of the sale of property to third parties, contract dispute or otherwise, or the failure of vacationers to book vacation rentals through these businesses would result in a decrease in related revenue, which would have an adverse effect on our business, financial condition and results of operations.
We may be unable to obtain and maintain management agreements with the homeowners' associations or other parties that control management of vacation ownership resorts. The loss of several of our largest vacation ownership management agreements could materially impact the business, financial condition and results of operations of our Vacation Ownership businesses.
Inventory—Insufficient availability of inventory may adversely affect our profits.
Our exchange networks' transaction levels are influenced by the supply of inventory in the system and the demand for such available inventory. The availability of exchange inventory is dependent on it being deposited into the system, directly by a member in support of a current or future exchange request or by a developer on behalf of its owners to support their anticipated exchanges.
A number of factors may impact the supply and demand of inventory. For example, economic conditions may negatively impact our members' desire to travel, often resulting in an increase in the number of deposits made as a means of preserving the inventory's value for exchange at a later date
when the member is ready to travel, while reducing the demand for inventory which is then available for exchange. Also, destination-specific factors such as regional health and safety concerns, the occurrence or threat of natural disasters and weather may decrease our members' desire to travel or exchange to a given destination, resulting in an increased supply of, but a decreased demand for, inventory from this destination. Additionally, inventory may not be as available to the Interval system because owners are choosing to travel to their home resort/vacation club system or otherwise not depositing with the Interval Network. In these instances, the demand for exchange and Getaway inventory may be greater than the inventory available. The supply of available inventory may also be affected by the occurrence of natural disasters, such as floods, earthquakes or hurricanes. Where the supply and demand of inventory do not keep pace, transactions may decrease or we may elect to purchase additional inventory to fulfill the demand, which could negatively affect our profits and margin.
If we fail to develop vacation ownership properties, expand existing properties or are unsuccessful in entering into new agreements with third-party developers, we may experience a decline in vacation ownership interest inventory available to be sold by us, which could result in a decrease in our revenues. In addition, a decline in vacation ownership interest inventory could result in both a decrease
of financing revenues that are generated from purchasers of vacation ownership interests and fee revenues that are generated by providing club, management, sales and marketing services.
Vistana Transaction-We may not consummate our acquisition of Vistana, Starwood's vacation ownership business or realize the anticipated benefits if we do complete the acquisition.
Our proposed acquisition of the Vistana business may not be consummated in a timely manner or at all. If we are unable to complete the proposed acquisition, we will have incurred substantial expenses and diverted significant management time and resources from our ongoing business. Even if we consummate the proposed acquisition, we will still have incurred substantial expenses but may not realize the anticipated revenue and cost synergies and other benefits of the acquisition. Given the size and significance of the acquisition, we may encounter difficulties in the integration of the operations of the Vistana business, which could adversely affect our combined business and financial performance.
If the proposed transaction is not completed, the price of the our common stock may decline to the extent that the market price of our common stock reflects positive market assumptions that the proposed acquisition will be completed and the related anticipated benefits will be realized. We also may be subject to additional risks if the proposed transaction is not completed, including, depending on the reasons for termination of the merger agreement, the requirement that we pay Starwood a termination fee of $40.0 million or reimburse Starwood for their expenses in connection with the transaction in an amount up to $15.0 million or, in the case of our breach, $30.0 million.
Post-Transaction Relationship—Following the anticipated closing of the Vistana acquisition, the Vistana business will have an ongoing relationship with Starwood and, as a result, the future state or actions of Starwood or any successor of Starwood could impact ILG's reputation, business, financial condition or results of operations.
Certain additional agreements related to the pending Vistana transaction provide for ongoing services by Starwood as well as the license of the licensed marks under the license agreement. Changes in the strategic direction of Starwood, or any successor of Starwood, could, over time, impact the positioning and offerings of Starwood's brands and programs, including those being made available to the Vistana business. As part of its ongoing evaluation of business and strategic planning alternatives, the Starwood Board of Directors and Starwood's senior management regularly review Starwood's businesses, its strategic direction, performance and prospects in the context of developments in the industries in which it operates and the competitive landscape in the markets in which it operates. In particular, in April 2015, Starwood announced that it was exploring strategic alternatives with respect to
its business and in November 2015 entered into a definitive merger agreement to be acquired by Marriott International, Inc. in the Marriott transaction. Any uncertainty regarding the closing of the Marriott transaction or the future state or actions of Starwood or any successor of Starwood could affect the reputation of the licensed marks and the offerings of Starwood's brands and programs, thus impacting the business, financial conditions or results of operations of ILG.
Licensing—The exclusive license for the Hyatt® brand and following anticipated completion of the Vistana acquisition, the Westin® and Sheraton® brands, in connection with our vacation ownership business could be terminated.
If we default as specified in the Master License Agreement, dated October 1, 2014, with Hyatt Franchising, L.L.C., we could lose our exclusive right to use the Hyatt® brand in the timeshare business. The loss of this right along with the right to use Hyatt's marketing channels, including its existing hotel loyalty program, could result in the reduction of revenue and profits derived from our vacation ownership business. In addition, the Hyatt Gold Passport Participation Agreement would also terminate upon termination of the Master License Agreement, and we would not be able to offer Hyatt Gold Passport Points to owners and potential owners, which could impair our ability to sell our products and reduce the flexibility and options available in connection with our products.
If following completion of the pending Vistana acquisition, Vistana defaults as specified in its license agreement to be entered into with Starwood, Vistana could lose its exclusive right to use the Westin® and Sheraton® brands in connection with the Vistana business and its exclusive right to use specified St. Regis® and The Luxury Collection® marks in connection with existing fractional properties that are part of the Vistana business. The loss of this right, along with the right to use Starwood's marketing channels and other centralized services, including the Starwood Preferred Guest loyalty program, could result in the reduction of revenue and profits derived from the Vistana business. In addition, the Starwood Preferred Guest Affiliation Agreement would terminate upon termination of the license agreement and Vistana would not be able to offer SPG Starpoints to vacation property owners and potential owners, which would impair the marketability of these properties and Vistana's ability to sell its products and reduce the flexibility and options available in connection with its products.
The termination of the Master License Agreement or the Hyatt Gold Passport Participation Agreement, and following completion of the pending Vistana acquisition, the license agreement with Starwood or the SPG Affiliation Agreement, would materially harm our business and results of operations and impair our ability to market and sell our products and maintain our competitive position, and could have a material adverse effect on our financial position, results of operations or cash flows. For example, we would not be able to rely on the strength of the Hyatt®, Westin® and Sheraton® brands to attract qualified prospects in the marketplace, which could cause our revenue and profits to decline and our marketing and sales expenses to increase.
Hyatt® Brand—The Hyatt Vacation Ownership business depends on the quality and reputation of the Hyatt® brand, and any deterioration in the quality or reputation of the Hyatt® brand could adversely affect our market share, reputation, business, financial condition and results of operations.
We offer vacation ownership products under the Hyatt® brand name, and we intend to continue to develop and offer products and services under the Hyatt® brand in the future. If the quality of the Hyatt® brand deteriorates, or the reputation of the Hyatt® brand declines, our market share, reputation, business, financial condition and results of operations could be materially adversely affected.
Westin®, Sheraton®, St. Regis® and The Luxury Collection® Brands and SPG Program—The Vistana business depends on the quality and reputation of the Westin®, Sheraton®, St. Regis® and The Luxury Collection® Brands and affiliation with the SPG Program, and any deterioration in the quality or reputation of the Westin®, Sheraton® St. Regis® and The Luxury Collection® Brands or the SPG Program could following the acquisition adversely affect ILG's market share, reputation, business, financial condition or results of operations.
The Vistana business offers vacation ownership products under the Westin®, Sheraton®, St. Regis® and The Luxury Collection® brand names and affiliation with the Starwood Preferred Guest Program, which we refer to as the SPG Program, and intends to continue to offer products and services under the Westin®, Sheraton®, St. Regis® and The Luxury Collection® brands in the future. If the quality of the Westin®, Sheraton®, St. Regis® or The Luxury Collection® brands or the SPG Program deteriorate, or the reputation of the Westin®, Sheraton®, St. Regis® or The Luxury Collection® brands or the SPG Program decline, Vistana's market share, reputation, business, financial condition or results of operations could be materially adversely affected.
Approvals for Expansion—Our ability to expand our vacation ownership business and remain competitive could be harmed if Hyatt Franchising does not consent to our use of their trademarks at new resorts we acquire, develop or propose to franchise in the future.
Under the terms of our master license agreement, we must obtain Hyatt Franchising's approval, to use the Hyatt® brand in connection with shared ownership projects we acquire, develop or propose to franchise in the future. Hyatt may reject a proposed project if, among other things, the project does not meet applicable brand standards or is reasonably likely to breach applicable contractual or legal restrictions. If Hyatt does not permit us to use the brand in connection with our development or acquisition plans, our ability to expand our HVO business and remain competitive may be materially adversely affected. The requirement to obtain consent to our expansion plans, or the need to identify and secure alternative expansion opportunities if we do not obtain approval, may delay implementation of our expansion plans and cause us to incur additional expense. These same risks apply to the approval by Starwood of the use of the Westin® and Sheraton® brands following completion of the pending Vistana acquisition.
Maintenance of Brand Standards—The maintenance and refurbishment of Hyatt Residence Club properties in accordance with brand standards depends on maintenance fees paid by the owners of vacation ownership interests.
Owners of vacation ownership interests at Hyatt Residence Club resorts must pay maintenance fees levied by property owners' association boards. These maintenance fees are used to maintain and refurbish the vacation ownership properties and to keep the properties in compliance with Hyatt® brand standards. If property owners' association boards do not levy sufficient maintenance fees or special assessments, or if owners of vacation ownership interests do not pay these fees, not only would our management fee revenue be adversely affected, but the vacation ownership properties could fail to comply with applicable brand standards. If any vacation ownership property fails to comply with the brand standards, Hyatt could terminate our rights under the Master License Agreement to use its trademarks at such noncompliant property, which could result in the loss of management fees, decrease customer satisfaction and impair our ability to market and sell our products at the non-compliant locations. These same risks apply to the use of the Westin® and Sheraton® brands and the existing St. Regis® or The Luxury Collection® branded vacation ownership resorts following completion of the pending Vistana acquisition.
Development Risks-Timing, budgeting and other risks could result in delays or cancellations of our efforts to develop the vacation ownership projects that we undertake, or make these activities more expensive, which could reduce our profits or impair our ability to compete effectively.
We plan to selectively undertake, in some cases with joint venture partners, construction of vacation ownership developments which may span multiple phases and often take years to complete. These efforts are subject to a number of risks, including:
Additionally, developing new properties often involves lengthy development periods during which significant amounts of capital must be funded before sales proceeds are available to defray costs. If the cost of funding new development exceeds budgeted amounts, and/or the time period for development is longer than initially anticipated, our profits could be reduced. Further, due to the lengthy development cycle, adverse economic conditions may alter or impede our development plans, thereby resulting in incremental costs to us or potential impairment charges.
Vacation Rental Revenue—Our success is dependent, in part, on revenue from vacation rentals and, if consumer demand for vacation rentals falls materially below historic levels, our business, financial condition and results of operations could be adversely affected.
General economic conditions can negatively affect demand for our rentals of vacation accommodations to our members and other vacationers, leading us to decrease pricing and resulting in reduced revenue from vacation rentals. Failure of our rental businesses to secure a sufficient number of vacationers for accommodations we offer could also result in increased obligations under guaranteed dollar amount or specified percentage provisions of certain hotel and resort management agreements and, ultimately, could affect our ability to obtain and maintain rental management agreements with vacation property owners. We also actively seek to provide vacation rental services to resorts participating in our exchange networks and rent units for developers and associations that are part of the Hyatt Residence Club or managed by TPI and VRI. Any material or prolonged decrease in demand and/or pricing for vacation rentals would further impact our revenue and, if materially below historical levels, could have a material adverse effect on our business, financial condition and results of operations.
Marketing of Vacation Ownership Interests—The future growth of our vacation ownership business depends on our ability to market vacation ownership interests successfully and efficiently.
We compete for customers with hotel and resort properties and with other vacation ownership resorts and other vacation options such as cruises. The identification of prospective purchasers, and the marketing of our products to them, are essential to our success. We incur significant expenses associated with marketing programs in advance of closing sales. If our marketing efforts are not successful and we are unable to convert prospects to a sufficient number of sales, we may be unable to recover the expense of our marketing programs and grow our business.
Resale Market for Vacation Ownership Interests—Secondary Market—The resalesale of vacation ownership interests in the secondary market for vacation interestsby existing owners could adversely affectcause our timeshare business.sales revenues and profits to decline.
There is not currently an active, organized or liquid resale market for vacation ownership interests, and resale of vacation ownership interests generally are made at sales prices substantially below their original customer purchase prices. These factors may makeExisting owners have offered, and are expected to continue to offer, their vacation ownership interests for sale on the initial purchasesecondary market. As a result, these sales create additional pricing pressure on our sale of avacation ownership interests, which could cause our sales revenues and profits to decline. In addition, if the secondary market for vacation ownership interests becomes more organized or financing for such resales becomes more available, our ability to sell vacation ownership interests could be adversely impacted and/or the resulting availability of vacation ownership interests (particularly where the vacation ownership interests are available for sale at lower prices than the prices at which we would sell them) could cause the volume of vacation ownership inventory that we are able to repurchase to decline, which could adversely affect our sales revenues. Further, unlawful or deceptive third-party vacation ownership interest less attractive to potential buyers who are concerned about theirresale schemes involving vacation ownership interests in our resorts could damage our reputation and brand value or impact our ability to resell their vacation ownership interest.collect management fees, which may adversely impact its sales revenues and results of operations.
Debt Covenants—Restrictive covenants in ourSubstantial Debt-We have substantial debt instruments could limit our flexibility or otherwiseand interest payment obligations that may restrict our business activities.future operations and impair our ability to meet our obligations.
We and our consolidated subsidiaries have substantial indebtedness and, as a result, significant debt service obligations. As of December 31, 2014,2015, we had $425 million of total debt of approximately $488.0indebtedness outstanding and $516.4 million borrowed under our revolving credit facility. We also had an additional $103.7 million, net(net of any outstanding letters of credit usage,credit) available for borrowingfuture borrowings as secured indebtedness under the credit facility at that date. We may also incurfacility. Our level of debt and these significant additional indebtedness in the future,demands on our cash resources could have material consequences to our business, including, expanding our revolving credit facility by up to $100.0 million. Our indebtedness and the restrictive covenants contained in our credit facility may, among other things:but not limited to:
Ability to refinance debt-We may not be able to refinance our debt on acceptable terms.
If we are unable to meet our debt obligations or to fund our other liquidity needs, we may need to restructure or refinance our indebtedness, including the notes. Our ability to refinance our indebtedness or obtain additional financing will depend on, among other things:
Our ability to restructure or refinance our debt will depend on the condition of the capital markets and our financial condition at such time. Any refinancing of our debt could be at higher interest rates and may require us to comply with more onerous covenants, which could further restrict our business operations. As a result, it may be difficult for us to obtain financing on terms that are acceptable to us, or at all. Without this financing, we could be forced to reduce or delay investments and capital expenditures, or to sell assets, seek additional capital or restructure or refinance our indebtedness, including the risknotes. The terms of increased interest rates becausethe credit facility and the indenture governing the senior notes limit our ability to sell assets and also restrict the use of proceeds from such a sale. Moreover, substantially all of our domestic assets have been pledged to secure repayment of our indebtedness under the credit facility. In addition, we may not be able to sell assets quickly enough or for sufficient amounts to enable us to meet our obligations, including our obligations on the notes.
Additional Debt Capacity-Despite our substantial indebtedness, we may still be able or obligated to incur more debt, which could intensify the risks described above.
Although the terms of the credit facility and the indenture governing the senior notes contain, restrictions on the incurrence of additional indebtedness, these restrictions are subject to a number of important exceptions, and indebtedness incurred in compliance with these exceptions could be substantial. As of December 31, 2015, we had approximately $516.4 million (net of any outstanding letters of credit) available for additional revolving credit borrowings under ourthe credit facility, are at variable interest rates.facility. To the extent we incur additional indebtedness, the risks discussed above will increase.
Key Personnel—Loss of one or more of our key personnel could adversely affect our relationships with third parties, business, financial condition and results of operations.
Our operations require managerial, operational, sales and marketing expertise as well as the maintenance of relationships with resort developers, homeowners' associations, vacation property owners and other third parties. In particular, we are dependent upon the management skills and continued services of several members of our senior management team. The failure of such key personnel to continue to be active in management of our businesses could have a material adverse effect on relationships with third parties, business, financial condition, and results of operations. In addition, our failure to attractoperations and retain key personnel will adversely impact our ability to grow the HVO business. We do not maintain key employee insurance for any of our officers and employees.
Adverse Events and Trends in Key Vacation Destinations—Events and trends in key vacation destinations could adversely affect our business, financial condition and results of operations.
A substantial percentage of the vacation ownership resorts currently participating in Interval's exchange networks are located in Florida, Hawaii, Las Vegas, Mexico and Southern California, a large number of vacation properties for which we provide rental services are located in Hawaii, and a significant portion of our European management revenue derives from Costa del Sol, Spain and Tenerife, Canary Islands. Approximately $231.6 million, $211.1 million, and $146.6 million, of 2015 2014, and $133.3 million of 2014, 2013 and 2012 revenue, respectively, which excludes the pass-through revenue, was generated from travel to properties in these key vacation destinations as well as hotel, resort and homeowners' association management services performed in these locations. As a result, our ongoing ability to successfully process exchange vacations for members, as well as our ability to find vacationers for accommodations marketed or managed by us, is largely dependent on the continued desirability of these areas as key vacation destinations. Any significant shift in travel demand for one or more of these
key destinations or any adverse impact on transportation to them, such as decreased airlift, natural disasters, regional violence, terrorism, pandemics or increased travel costs, could have a material adverse effect on our business, financial condition and results of operations.
In addition, the same events that affect demand to one or more of these key destinations could significantly reduce the number of accommodations available for exchanges, Getaways or rental to vacationers, as well as the need for vacation rental and property management services generally. Accordingly, any such event could have a material adverse effect on our business, financial condition and results of operations, the impact of which could be prolonged. Similarly, the effects of climate change may cause these locations to become less appealing to vacation owners as a result of temperature changes, more severe weather or changes to coastal areas which could adversely affect our business.
A substantial percentage of the HVO business' vacation ownership interests available for sale are located in Florida and Hawaii. These same events could affect sales of vacation ownership interests and other revenues related to those properties.
International Operations—We operate in a number of international markets, which exposes us to additional risks that could adversely affect our business, financial condition and results of operations.
Revenue from international operations for the years ended December 31, 2015, 2014 and 2013 and 2012 was $120.3 million, $131.4 million $96.3 million, and $87.4$96.3 million, respectively. We continue to seek to invest in various international markets.
In order to achieve widespread acceptance in international markets, we must continue to successfully tailor our services to the unique customs and cultures of relevant countries and markets. Learning the customs and cultures of various countries and markets can be difficult and costly, and the failure to do so could slow international growth. Operating in international markets also exposes us to additional risks, including, among others, compliance with applicable U.S. and foreign laws including economic sanctions, embargoes and anti-corruption laws, changes in regulatory requirements including taxation, limits on our ability to sell products and services and enforce intellectual property rights and difficulties in managing operations due to distance, language and cultural differences, including issues associated with staffing and managing foreign operations. Our failure to comply with these laws and regulations could result in substantial civil and criminal penalties being imposed.
We are also exposed to risks associated with the repatriation of cash from certain of our foreign operations to the United States where currency restrictions exist, such as Venezuela, Argentina, and Argentina,Egypt, which limit our ability to immediately access cash through repatriations. As of December 31, 2014,2015, we had $5.2 million of unrealized loss in other comprehensive income within stockholders' equity pertaining to our Venezuela entity, until such time we sell or liquidate our investment. Furthermore, other countries in which we maintain operations may impose limitations on the repatriation of cash from such countries now or in the future. Any limitation on us to transfer significant cash across borders from our international operations pertaining to intercompany debt or intercompany trade payables, if any, could have a material adverse effect on our business, financial condition and results of operations.
Exchange Rate Changes—Material changes in foreign currency exchange rates could materially adversely affect our results of operations.
Our operations in international markets are exposed to potentially volatile movements in currency exchange rates. The economic impact of currency exchange rate movements on us is often linked to variability in real growth, inflation, interest rates, governmental actions and other factors. These changes, if material, could cause us to adjust our financing, operating and hedging strategies. In particular, significant fluctuations in the value of the U.S. dollar relative to the Euro and the British
Pound, among other foreign currencies, could have an adverse effect on our results of operations due to lower demand in affected jurisdictions and the effects of translation of local currency balances and results into U.S. dollars. We do not currently engage in hedging transactions designed to reduce our exposure to foreign currency risk.
Acquisitions and Strategic Arrangements—We may experience financial and operational risks in connection with acquisitions and strategic arrangements.
In October 2015, we announced that we had entered into agreements to acquire the Vistana vacation ownership business from Starwood Hotels & Resorts Worldwide, Inc. in a merger transaction that is expected to close in the second quarter of 2016. The pending Vistana acquisition follows our October 2014 we purchasedpurchase of the HVO business. Duringbusiness and our 2013 acquisition of the fourth quarter of 2013,Aqua business and the purchase by our newly-formed subsidiarynew VRI Europe Limited purchasedjoint venture of the European shared ownership resort management business of CLC World Resorts and Hotels, or CLC, and we also purchased the Aqua business in Hawaii. These acquisitions are in addition to the February 2012 acquisition of VRI and the November 2010 acquisition of TPI.CLC. We intend to continue selectively pursuing other acquisitions. However, we may be unable to identify attractive acquisition candidates or complete transactions on favorable terms. In addition, in the case of acquired businesses, we will need to:
We may not be successful in addressing these challenges or any others encountered in connection with historical and future acquisitions. In addition, the anticipated benefits of one or more acquisitions may not be realized and future acquisitions could result in potentially dilutive issuances of equity securities and/or the assumption of contingent liabilities. The occurrence of any of these events could adversely affect our business, financial condition and results of operations.
We also intend to selectively enter into joint ventures and other strategic arrangements to provide new products and services complementary to those currently offered by our businesses. However, we may be unable to successfully enter into these arrangements on favorable terms or launch related products and services or such products and services may not gain market acceptance or be profitable. The failure to develop and execute any such initiatives on a cost-effective basis could have an adverse effect on our business, financial condition and results of operations.
Impairment of Assets—Goodwill and other intangible and long-lived assets associated with businesses we acquire may become impaired which could adversely affect our business, financial condition and results of operations.
The performance of the businesses that we have acquired or will acquire may not meet the financial projections anticipated at acquisition or may be impacted by one or more unfavorable events or circumstances. This could negatively affect the value of goodwill and other intangible assets, as well as long-lived assets, and may require us to test the applicable reporting unit and/or asset for impairment. If following the test, we determine that we should record an impairment charge, our business, financial condition and results of operations may be adversely affected.
Estimates and Assumptions—We are required to make a number of significant judgments in applying our accounting policies, and our use of different estimates and assumptions in the application of these policies could result in material changes to our financial condition and results of operations. In addition, changes in accounting standards or their interpretation could significantly impact our results of operations.
Our accounting policies are critical to the manner in which we present our results of operations and financial condition. Many of these policies, including those with respect to our recently acquired vacation ownership business, are highly complex and involve many subjective assumptions, estimates and judgments. We are required to review these estimates regularly and revise them when necessary. Our actual results of operations vary from period to period based on revisions to these estimates. In addition, the regulatory bodies that establish accounting and reporting standards, including the SEC and the Financial Accounting Standards Board (FASB) periodically revise or issue new financial accounting and reporting standards that govern the preparation of our consolidated financial statements. Changes to these standards or their interpretation could significantly impact our results in future periods. For example, the Financial Accounting Standards BoardFASB recently released a final, converged, principles-based standard on revenue recognition that will modify revenue recognition in periods after December 15, 2016.2017.
Third Party Relationships—We depend on third parties to process certain fulfillment services.
In connection with providing benefits and services in our Exchange and Rental businesses, we rely on third party service providers for processing certain fulfillment services. If these third parties are unable to continue to provide the services to us, our ability to deliver expected benefits and services to
our customers may be adversely affected. This may cause dissatisfaction and may damage our reputation.
Advances and Extensions of Credit—Our results may be adversely affected if third parties who receive loans, advances or other credit from us are unable to repay.
In connection with obtaining or extending business relationships with our clients, on occasion we provide loans, advances and other credit. To the extent that these clients are unable to repay these amounts and they are not fully secured by collateral, our results of operations could be materially adversely affected.
In connection with our vacation ownership business, we provide loans to purchasers to finance their purchase of vacation ownership interests. If purchasers default on the loans that we provide to finance their purchases of vacation ownership interests, the revenues and profits that we derive from the vacation ownership business could be reduced. Providing secured financing to some purchasers of vacation ownership interests subjects us to the risk of purchaser default. As of December 31, 2014,2015, we had approximately $36.5$32.2 million of net timeshare financing receivables outstanding. We could incur material losses if there is a significant increase in the delinquency rate applicable to our portfolio of consumer loans. An increased level of delinquencies could result from changes in economic or market conditions, increases in interest rates, adverse employment conditions and other factors beyond our control. Increased delinquencies could also result from our inability to evaluate accurately the credit worthiness of the customers to whom we extend financing. If default rates for our borrowers were to increase, we may be required to increase our provision for loan losses. In addition, increased delinquency rates may cause buyers of, or lenders whose loans are secured by, our consumer loans to reduce the amount of availability under our financing or loan sale facilities, or to increase the interest costs associated with such facilities. In such an event, our cost of financing would increase, and we may not be able to secure financing on terms acceptable to us, if at all.
If a purchaser defaults under the financing that we provide, we could be forced to write off the loan and reclaim ownership of the timeshare interest through foreclosure or deed in lieu of foreclosure. If the timeshare interest has declined in value, we may incur impairment losses that reduce our profits.
In addition, we may be unable to resell the property in a timely manner or at the same price, or at all. Also, if a purchaser of a timeshare interest defaults on the related loan during the early part of the amortization period, we may not have recovered the marketing, selling and general and administrative costs associated with the sale of that timeshare interest. If we are unable to recover any of the principal amount of the loan from a defaulting purchaser, or if the allowances for losses from such defaults are inadequate, the revenues and profits that we derive from the vacation ownership business could be reduced.
Volatility in Credit Markets—Volatility in the credit markets may adversely impact our ability to finance the loans that our vacation ownership business generates.
Our vacation ownership business provides financing to purchasers of our vacation ownership interests, and we may seek to obtain third party lender receivables financing. Volatility in the credit markets may impact the timing and volume of the timeshare loans that we are able to finance which could adversely affect our sales. Vistana expects to fund construction costs with the proceeds of vacation ownership notes receivable securitizations, which may be adversely affected by this voloatility.
Sufficiency of Maintenance Fee Collection and Budgeting—Our continued management of homeowners' associations depends on their ability to collect sufficient maintenances fees.
Our management fees from homeowners' associations are derived from maintenance fees levied on the owners by the associations. These maintenance fees also fund the operation, maintenance and improvements for the property. Many of the properties that we manage do not receive subsidies or
resale services for foreclosed inventory from the developer. Once an association begins to experience a high default rate, if it is unable to foreclose and resell units to paying owners, the situation worsens as the maintenance fees on remaining owners continually increase to cover expenses. If the homeowners' associations that we manage are unable to levy and collect sufficient maintenance fees to cover the costs to operate and maintain the resort properties, such properties may be forced to close or file bankruptcy and may terminate our management.management agreements.
Most of our VRI Europe properties in Spain operate on a fixed fee basis and VRI Europe has a responsibility to maintain the properties. To the extent the costs of maintenance and operation exceed historic and planned amounts, we may be required to fund the deficit.
Control of Managed Resorts—Our management agreements with homeowners' associations may not be renewed if an entity that offers management services acquires sufficient interests in the resort.
The homeowners' associations that engage us to manage their resorts are operated through an elected board. Entities that offer management services have acquired, or may acquire, a number of vacation ownership interests that may be voted to influence the composition of the homeowners' association board. To the extent that an entity offering management services is able to influence the membership or decision-making of the homeowners' association board based on their ownership of interests at the resort, our management agreements may not be renewed and our business and results of operations may be adversely affected.
New Products and Services—We may not be able to achieve our strategic objectives through new products and initiatives.
In order to support our strategic objectives, we have introduced new products and services and expect to continue to do so in the future. Launching new products and services involves a number of risks including the ability to achieve the anticipated level of market acceptance and to manage the costs and timeliness of rolling-out the product or service. If we are unable to gain market acceptance,
experience substantial delays or are required to expend significantly more than expected, our business and results of operations may be materially adversely affected.
Property Renovations—A significant decrease in the supply of available vacation accommodations due to ongoing property renovations could adversely affect our business, financial condition and results of operations.
The vacation properties for which we provide rental and/or management services are expected to undergo significant renovations periodically. These renovations may result in a decrease in the supply of vacation accommodations available to vacationers during the applicable renovation periods. Furthermore, ongoing renovations at a particular property may negatively impact the desirability of the property as a vacation destination. A significant decrease in the supply of available vacation accommodations during renovation periods, coupled with the inability to attract vacationers to properties undergoing renovations, could have an adverse effect on our business, financial condition and results of operations.
Compliance and Changing Laws, Rules and Regulations—The failure of our businesses to comply with extensive regulatory requirements, or to obtain and maintain required licenses and rights, could adversely affect our business, financial condition and results of operations.
Our businesses are subject to various laws, rules and regulations on a global basis, including those specific to the vacation ownership industry, as well as those applicable to businesses generally, such as licensing requirements, laws governing our marketing and sales activities, including anti-fraud, sweepstakes, telemarketing, home solicitation sales, tour operator, seller of travel, consumer privacy, consumer protection, securities and sales, use, value-added and other tax laws, rules and regulations. Additionally, our businesses are subject to laws and regulations associated with hotel and resort management, including relating to the preparation and sale of food and beverages, liquor service and health, safety and accessibility of managed premises. While we believe that the operations and practices of our businesses have been structured in a manner to ensure material compliance with applicable laws, rules and regulations, the relevant regulatory
authorities may take a contrary position. The failure of our businesses to comply with applicable laws, rules and regulations, or to obtain required licenses or rights, could have a material adverse effect on our business, financial condition and results of operations. In addition, unfavorable changes in the laws, rules and regulations applicable to our businesses, including those related to the imposition of taxes, could decrease demand for the services offered by our businesses, increase costs and/or subject us to additional liabilities, which could have an adverse effect on our business, financial condition, or results of operations.
Compliance with Vacation Ownership Regulations—The failure of our businesses to comply with regulatory requirements applicable to real estate development and sales and marketing activities with respect to vacation ownership interests could adversely affect our business, financial condition and results of operations.
The vacation ownership industry is subject to extensive regulations in various jurisdictions in the United States and elsewhere, which generally require vacation ownership resort developers to follow certain procedures in connection with the development, sale and marketing of vacation interests, including the filing of offering statements with relevant governmental authorities for approval and the delivery to prospective purchasers of certain information relating to the terms of the purchase and use, including rescission rights. The preparation of vacation ownership interest registrations requires time and cost, and in many jurisdictions the exact date of registration approval cannot be accurately predicted. Our vacation ownership business's real estate development activities are also subject to laws and regulations applicable to real estate development, subdivision and construction activities, zoning, land use restrictions, environmental regulation, title transfers, title insurance and taxation. Laws in some jurisdictions also impose liability on property developers for construction defects discovered or repairs made by future owners of property developed by the developer. In addition, we provide
financing to some purchasers of vacation ownership interests and we also service the resulting loans. This practice subjects us to various regulations, including those which require disclosure to borrowers regarding the terms of their loans as well as settlement, servicing and collection of loans. As a result, any negative change in the regulatory environment within the vacation ownership industry could have a material adverse effect on our business, financial condition and results of operations.
Vacation property operations are directly subject to a number of licensing requirements, as well as certain laws and regulations relating to consumer protection, particularly, those associated with hotel and resort management, including those relating to the preparation and sale of food and beverages, liquor service and health, safety and accessibility of managed premises. Theor failure of our businesses to comply with applicable laws rules and regulations or to obtain required licenses or rights, could have a material adverse effect on our business, financial condition and results of operations.
Licensing—The exclusive license forPermissions—Following the Hyatt® brandclosing of the Vistana transaction, additional permissions may be required in connection with our vacation ownership business could be terminated.order to market to potential customers.
If we defaultFollowing completion of the pending Vistana acquisition and because Vistana's relationship with Starwood will be changing as specifieda result of the pending transactions, for purposes of "do not call" and similar legislation in some jurisdictions, it may be more difficult for Vistana to utilize customer information it obtains from Starwood in the Master License Agreement, dated October 1, 2014,future, and as a result, maintain compliance with Hyatt Franchising, L.L.C., weapplicable legislation. This could lose our exclusive right to usediminish the Hyatt® brand in the timeshare business. The losseffectiveness of this right along with the right to use Hyatt'sexisting marketing channels, including its existing hotel loyalty program, could result in the reduction of revenuepractices and profits derived from our vacation ownership business.
The termination of the Master License Agreement would materially harm our business and results of operations and impair our ability to market and sell our products and maintain our competitive position, and could have a material adverse effect on our financial position, results of operations or cash flows. For example, we would not be able to rely on the strength of the Hyatt® brand to attract qualified prospects in the marketplace, which could cause our revenue and profits to decline and our marketing and sales expenses to increase.
In addition, the Hyatt Gold Passport Participation Agreement would also terminate upon termination of the Master License Agreement, and we would not be able to offer Hyatt Gold Passport Points to owners and potential owners, which could impair our ability to sell our products and reduce the flexibility and options available in connection with our products.
Hyatt® Brand—The Hyatt Vacation Ownership business depends on the quality and reputation of the Hyatt® brand, and any deterioration in the quality or reputation of the Hyatt® brand could adversely affect our market share, reputation, business, financial condition and results of operations.
We offer vacation ownership products under the Hyatt® brand name, and we intend to continue to develop and offer products and services under the Hyatt® brand in the future. If the quality of the
Hyatt® brand deteriorates, or the reputation of the Hyatt® brand declines, our market share, reputation, business, financial condition and results of operations could be materially adversely affected.
Our ability to expand our vacation ownership business and remain competitive could be harmed if Hyatt Franchising does not consent to our use of their trademarks at new resorts we acquire, develop or propose to franchise in the future.
Under the terms of our master license agreement, we must obtain Hyatt Franchising's approval, to use the Hyatt® brand in connection with shared ownership projects we acquire, develop or propose to franchise in the future. Hyatt may reject a proposed project if, among other things, the project does not meet applicable brand standards or is reasonably likely to breach applicable contractual or legal restrictions. If Hyatt does not permit us to use the brand in connection with our development or acquisition plans, our ability to expand our HVO business and remain competitive may be materially adversely affected. The requirement to obtain consent to our expansion plans, or the need to identify and secure alternative expansion opportunities if we do not obtain approval, may delay implementation of our expansion plans and cause us to incur additional expense.
Maintenance of Brand Standards—The maintenance and refurbishment of Hyatt Residence Club properties in accordance with brand standards depends on maintenance fees paid by the owners of vacation ownership interests.
Owners of vacation ownership interests at Hyatt Residence Club resorts must pay maintenance fees levied by property owners' association boards. These maintenance fees are used to maintain and refurbish the vacation ownership properties and to keep the properties in compliance with Hyatt® brand standards. If property owners' association boards do not levy sufficient maintenance fees or special assessments, or if owners of vacation ownership interests do not pay these fees, not only would our management fee revenue be adversely affected, but the vacation ownership properties could fail to comply with applicable brand standards. If any vacation ownership property fails to comply with the brand standards, Hyatt could terminate our rights under the Master License Agreement to use its trademarks at such noncompliant property, which could result in the loss of management fees, decrease customer satisfaction and impair our ability to market and sell our products at the non-compliant locations.
Timing, budgeting and other risks could result in delays or cancellations of our efforts to develop the vacation ownership developments that we undertake, or make these activities more expensive, which could reduce our profits or impair our ability to compete effectively.
We plan to selectively undertake, in some cases with joint venture partners, construction of vacation ownership developments which may span multiple phases and often take years to complete. These efforts are subject to a number of risks, including:
Additionally, developing new properties often involves lengthy development periods during which significant amounts of capital must be funded before sales proceeds are available to defray costs. If the cost of funding new development exceeds budgeted amounts, and/or the time period for development is longer than initially anticipated, our profits could be reduced. Further, due to the lengthy development cycle, adverse economic conditions may alter or impede our development plans, thereby resulting in incremental costs to us or potential impairment charges.business.
Partnerships and Joint Ventures—Investing through partnerships or joint ventures decreases our ability to manage risk.
In addition to acquiring or developing resorts or acquiring companies that complement our business directly, we have from time to time invested, and expect to continue to invest, as a co-venturer. Joint venturers often have shared control over the operation of the joint venture assets. Therefore, joint venture investments may involve risks such as the possibility that the co-venturer in an investment might become bankrupt or not have the financial resources to meet its obligations, or have economic or business interests or goals that are inconsistent with our business interests or goals, or be in a position to take action contrary to our instructions or requests or contrary to our policies or objectives. Consequently, actions by a co-venturer might subject resorts or other businesses owned by the joint venture to additional risk. Further, we may be unable to take action without the approval of our joint venture partners. Alternatively, our joint venture partners could take actions binding on the joint venture without our consent. Additionally, should a joint venture partner become bankrupt, we could become liable for our partner's share of joint venture liabilities.
Maintenance of Systems and Infrastructure—Our success depends, in part, on the integrity of our systems and infrastructure. System interruption and the lack of integration and redundancy in these systems and infrastructure may have an adverse impact on our business, financial condition and results of operations.
Our success depends, in part, on our ability to maintain the integrity of our systems and infrastructure, including websites, information and related systems, call centers and distribution and fulfillment facilities. System interruption and any lack of integration and redundancy in our information systems and infrastructure may adversely affect our ability to operate websites, process and fulfill transactions, respond to customer inquiries and generally maintain cost-efficient operations. We may experience occasional system interruptions that make some or all systems or data unavailable or prevent our businesses from efficiently providing services or fulfilling orders. We also rely on third-party computer systems, broadband and other communications systems and service providers in connection with the provision of services generally, as well as to facilitate, process and fulfill transactions. Any interruptions, outages or delays in the systems and infrastructures of our businesses and/or third parties, or deterioration in the performance of these systems and infrastructure, could impair the ability of our businesses to provide services, fulfill orders and/or process transactions.
Fire, flood, power loss, telecommunications failure, hurricanes, tornadoes, earthquakes, acts of war or terrorism, acts of God and similar events or disruptions may damage or interrupt computer, broadband or other communications systems and infrastructure at any time. Any of these events could
cause system interruption, delays and loss of critical data, and could prevent our businesses from providing services, fulfilling orders and/or processing transactions. While our businesses have backup systems for certain aspects of their operations, these systems are not fully redundant and disaster recovery planning is not sufficient for all eventualities. In addition, we may not have adequate insurance coverage to compensate for losses from a major interruption. If any of these adverse events were to occur, it could adversely affect our business, financial conditions and results of operations.
Technology Projects—Business interruptions, cost overruns or project delays in connection with our undertaking of significant technology projects may materially adversely affect our business.
WeOur businesses have several significantongoing development projects related to our proprietary and third party technology.technology, some of which are significant. We have committed sizable resources to these projects, which are expected to be phased in over several years. These projects are extremely complex, in part, because of the wide range of processes and the legacy systems involved. We use both internal and external resources, and if these resources become unavailable, our business and operations may be adversely affected. As we proceed with our existing projects, we are using controlled project plans and change control processes that we believe will provide for the adequate allocation of resources. However, a divergence from these may result in cost overruns or project delays. If the systems do not operate as expected, this could impact our ability to perform necessary business operations, which could materially adversely affect our business.
Privacy—The processing, storage, use and disclosure of personal data could give rise to liabilities as a result of governmental regulation, conflicting legal requirements, or requirements imposed by credit card companies.
In the processing of consumer transactions, our businesses receive, transmit and store a large volume of personally identifiable information and other user data. The sharing, use, disclosure and protection of this information are governed by the privacy and data security policies maintained by us and our businesses.businesses, as well as by contractual obligations with respect to data privacy. Moreover, there are federal, state and international laws regarding privacy and the storing, sharing, use, disclosure and protection of personally identifiable information and user data. Specifically, personally identifiable information is increasingly subject to legislation and regulations in numerous jurisdictions around the world, the intent of which is to protect the privacy of personal information that is collected, processed and transmitted in or from the governing jurisdiction. We could be adversely affected if legislation or regulations are expanded to require changes in business practices or privacy policies, or if governing jurisdictions interpret or implement their legislation or regulations in ways that negatively affect our business, financial condition and results of operations.
A company processing, storing, or transmitting payment card data must be compliant with Payment Card Industry-Data Security Standards, or PCI-DSS, or risk losing its ability to process credit card payments and being audited and/or fined. As of December 31, 2014,2015, we believe our Interval, HVO, VRI, TPI and VRI Europe businesses are compliant with these standards and our Aqua, Aston, VRI and TPI businesses areAqua-Aston business is working to become fully compliant. Failure to obtain or maintain PCI-DSS compliance could result in our inability to accept credit card payments or subject us to penalties and thus could have a material negative effect on our operations. Changes in these security standards may cause us to incur significant unanticipated expenses to meet new requirements.
Online Security Risks—We are subject to online security risks, including security breaches and identity theft and the related requirements imposed by credit card companies.
Our failure, and/or the failure by the various third party vendors and service providers with which we do business, to comply with applicable privacy policies or federal, state or similar international laws and regulations or any compromise of security that results in the unauthorized release of personally identifiable information or other user data could damage the reputation of our businesses, discourage
potential users from trying our products and services, breach certain agreements under which we have obligations with respect to network security, and/or result in fines and/or proceedings by governmental agencies, service providers and/or consumers, one or all of which could adversely affect our business, financial condition and results of operations. Any penetration of network security or other misappropriation or misuse of personal consumer information could cause interruptions in the operations of our businesses and subject us to increased costs, litigation and other liabilities. Security breaches could also significantly damage our reputation with consumers and third parties with whom we do business. It is possible that advances in computer capabilities, new discoveries, undetected fraud, inadvertent violations of company policies or procedures or other developments could result in a
compromise of information or a breach of the technology and security processes that are used to protect consumer transaction data. As a result, current security measures may not prevent any or all security breaches. We may be required to expend significant capital and other resources to protect against and remedy any potential or existing security breaches and their consequences.
Intellectual Property—We may fail to adequately protect our intellectual property rights or may be accused of infringing intellectual property rights of third parties.
We may fail to adequately protect our intellectual property rights or may be accused of infringing intellectual property rights of third parties. Our failure to protect our intellectual property rights in a meaningful manner or challenges to related contractual rights could result in erosion of brand names and limit our ability to control marketing, which could adversely affect our business, financial condition and results of operations.
From time to time, we are subject to legal proceedings and claims in the ordinary course of business, including claims of alleged infringement of the trademarks, copyrights, patents and other intellectual property rights of third parties. In addition, litigation may be necessary in the future to enforce our intellectual property rights, protect trade secrets or to determine the validity and scope of proprietary rights claimed by others. Any litigation of this nature, regardless of outcome or merit, will likely be protracted and expensive and could result in substantial costs and diversion of management and technical resources, any of which could adversely affect our business, financial condition and results of operations.
Environmental Matters—We are subject to certain requirements under applicable environmental laws and regulations and may be subject to potential liabilities.
The resorts that we manage and the assets at vacation ownership resorts that are owned by us are all subject to certain requirements and potential liabilities under national, state, and local laws and regulations that govern the discharge of materials into the environment or otherwise relate to protection of the environment or health and safety. The costs of complying with these requirements are generally covered by the homeowners' associations that operate the affected resort property and are our responsibility for assets we own. To the extent that we hold interests in a particular resort, we would be responsible for their pro rata share of losses sustained by such resort as a result of a violation of any such environmental laws and regulations.
Insurance—Damage to, or other potential losses involving, properties that we own or manage may not be covered by insurance.
Market forces beyond our control may limit the scope of the insurance coverage we can obtain or our ability to obtain coverage at reasonable rates. Certain types of losses, generally of a catastrophic nature, such as earthquakes, hurricanes and floods, or terrorist acts, may be uninsurable or the price of coverage for such losses may be too expensive to justify obtaining insurance. As a result, the cost of our insurance may increase and our coverage levels may decrease. In addition, in the event of a substantial loss, the insurance coverage we carry may not be sufficient to pay the full market value or replacement
cost of our lost investment or that of owners of vacation ownership interests or in some cases may not provide a recovery for any part of a loss. As a result, we could lose some or all of the capital we have invested in a property, as well as the anticipated future revenue from the property,property. In addition, we could lose the management contract for the property and, for HVO properties,to the extent such property operates under a licensed brand, the property may lose operating rights under the associated brand.
Compliance with Sanction laws—ILG could be adversely affected by changes to or violations of sanctions laws.
The United States has from time to time imposed sanctions that restrict U.S. companies from engaging in business activities with certain persons, foreign countries, or foreign governments that it determines are adverse to U.S. foreign policy interests. Other countries in which we operate may also impose such sanctions. Any restrictions on our ability to conduct business operations could negatively impact our financial results. If we are found to be liable for violations of U.S. sanctions laws or equivalent laws of another country where we operate, either due to our own acts or out of inadvertence, we could suffer monetary penalties and reputational harm which could have a material and adverse effect on our results of operations and financial condition.
Takeover Defenses—Our rights plan, charter provisions and terms of our debt agreements may affect the likelihood of a takeover or change of control of ILG.
We have in place a stockholders' rights plan and certain charter provisions that may have the effect of deterring hostile takeovers or delaying or preventing changes in control or management of our company that are not approved by our board. In particular, our charter provides that stockholders may not act by written consent and that the board has the power to issue shares of preferred stock with such designation, powers, preferences, and rights as the board shall determine. The transactions that may be deterred, delayed or prevented might have allowed our stockholders to receive a premium for their shares over then-current market prices. In addition, under our senior credit facility, a change of control (as defined in the credit agreement) constitutes an event of default, entitling our lenders to terminate the facility and require us to repay outstanding borrowings. Under the indenture governing our senior notes, we are required to make an offer to repurchase the senior notes at a price of 101% of the principal amount plus accrued interest following a change of control (as defined in the indenture). As a result, the provisions of this agreementthese debt agreements also may affect the likelihood of a takeover or other change of control. Under the master license agreement, we need Hyatt's written consent prior to a change of control (as defined in the agreement) of our subsidiary, S.O.I. Acquisition Corp. and, in certain cases, of ILG.
Dividends—We may not continue paying dividends at the same rate or at all.
While we began paying quarterly dividends in 2012, we may be unable to continue to pay dividends at the current rate or at all based on covenants in our credit agreement or if we do not have sufficient surplus under Delaware law. Our board of directors may determine not to declare dividends if the board deems this action to be in our company's best interests. Discontinuing payment of dividends could change the manner, timing and/or ability to realize gains on investment in our common stock.
Item 1B. Unresolved Staff Comments.
None.
As of the date hereof, ILG conducts operations through 36 offices in 16 countries, of which 15 offices are within the United States and 21 offices are outside of the United States. ILG's global
headquarters is located in Miami, Florida and occupies approximately 100,000 square feet of office space under a long-term lease expiring in December 2020.
Our vacation exchange businesses within the Exchange and Rental segment operate a call center in Miami with approximately 60,000 square feet under a long-term lease expiring in October 2016.September 2026. Our European headquarters is located in London, England and occupies approximately 24,00012,000 square feet of office space under a long-term lease which expires in September 2021, while our Asian headquarters is located in Singapore and occupies approximately 5,500 square feet of office space expiring in August 2015.2018. The vacation rental business within our Exchange and Rental segment is headquartered in Honolulu, Hawaii with approximately 18,00022,000 square feet of total office space under a leaseleases expiring in October 2019.2019 and February 2026.
The Vacation Ownership businesses have main offices in St. Petersburg, Florida under a lease of 13,000 square feet through November 2020 and Orange County, California under a lease of 34,000 square feet expiring May 2024.
Rules of the Securities and Exchange Commission require the description of material pending legal proceedings, other than ordinary, routine litigation incidental to ILG's business, and advise that proceedings ordinarily need not be described if they primarily involve damages for claims in amounts (exclusive of interest and costs) not exceeding 10% of the current assets of the registrant and its subsidiaries on a consolidated basis. In the judgment of management, none of the pending litigation matters which ILG and its subsidiaries are defending, involves or is likely to involve amounts of that magnitude.
Item 4. Mine Safety Disclosures.
Not applicable
Executive Officers of the Registrant
See Part III, Item 10 of this report for information about our executive officers.
Item 5. Market For Registrant's Common Equity, Related Stockholder Matters and Issuer Purchases of Equity Securities.
Market for Registrant's Common Equity and Related Stockholder Matters
Our common stock has been listed on The NASDAQ Stock Market Global Select Market under the ticker symbol "IILG" since August 2008. Prior to that time there was no public market for our common stock. The table below sets forth the high and low sales prices per share for ILG common stock as reported on NASDAQ, for the calendar periods indicated.
| | High | Low | High | Low | ||||||||||
|---|---|---|---|---|---|---|---|---|---|---|---|---|---|---|
Year Ended December 31, 2015 | ||||||||||||||
Fourth Quarter | $ | 21.98 | $ | 13.98 | ||||||||||
Third Quarter | $ | 23.19 | $ | 18.29 | ||||||||||
Second Quarter | $ | 26.78 | $ | 22.75 | ||||||||||
First Quarter | $ | 27.45 | $ | 20.75 | ||||||||||
Year Ended December 31, 2014 | ||||||||||||||
Fourth Quarter | $ | 24.48 | $ | 18.83 | $ | 24.48 | $ | 18.83 | ||||||
Third Quarter | $ | 22.85 | $ | 19.05 | $ | 22.85 | $ | 19.05 | ||||||
Second Quarter | $ | 27.51 | $ | 18.96 | $ | 27.51 | $ | 18.96 | ||||||
First Quarter | $ | 31.04 | $ | 25.39 | $ | 31.04 | $ | 25.39 | ||||||
Year Ended December 31, 2013 | ||||||||||||||
Fourth Quarter | $ | 32.13 | $ | 23.00 | $ | 32.13 | $ | 23.00 | ||||||
Third Quarter | $ | 23.85 | $ | 19.95 | $ | 23.85 | $ | 19.95 | ||||||
Second Quarter | $ | 22.24 | $ | 18.82 | $ | 22.24 | $ | 18.82 | ||||||
First Quarter | $ | 22.20 | $ | 19.35 | $ | 22.20 | $ | 19.35 | ||||||
As of February 13, 2015,16, 2016, there were approximately 1,5001,400 holders of record of our common stock and the closing price of ILG common stock was $25.44.$11.31. Because many of the outstanding shares of ILG common stock are held by brokers and other institutions on behalf of stockholders, ILG is not able to estimate the total number of beneficial stockholders represented by these record holders.
Dividend Policy
In March 2012, our Board of Directors announced the beginning of our quarterly dividend payments which, in 2012, were declared and paid at a rate of $0.10 per share. In December 2012, we accelerated the payment of the dividend that would otherwise have been paid during the first quarter of 2013. In 20132014 and 2014,2015, we declared and paid quarterly dividends of $0.11 and $0.12 per share, beginning with the payment in the second quarter of 2013.respectively. We currently expect to declare and pay quarterly dividends of $0.12 per share quarterly in 2015.2016. The actual declaration of any future cash dividends, and the establishment of record and payment dates, will be subject to final determination by the Board of Directors each quarter and will depend upon our results of operations, cash requirements and surplus, financial condition, legal requirements, capital requirements relating to business initiatives, investments and acquisitions and other factors that our Board of Directors may deem relevant. In addition, our revolving credit facility has various financial and operating covenants that place significant restrictions on us, including our ability to pay dividends. The merger agreement with Starwood restricts our ability to pay dividends (other than our ordinary quarterly dividends of $0.12 per share) to holders of our common stock without Starwood's consent.
Unregistered Sales of Equity Securities
During the year ended December 31, 2013,2015, we did not issue or sell any shares of our common stock or other equity securities pursuant to unregistered transactions in reliance upon an exemption from the registration requirements of the Securities Act of 1933, as amended.
Issuer Purchases of Equity Securities
The following table sets forth information with respect to purchases of shares of our common stock, excluding commissions, made during the quarter ended December 31, 20142015 by or on behalf of ILG or any "affiliated purchaser," as defined by Rule 10b-18(a)(3) of the Exchange Act. All purchases were made in accordance with Rule 10b-18 of the Exchange Act.
Period | Total Number of Shares Purchased | Average Price Paid per Share | Total Number of Shares Purchased as Part of Publicly Announced Plans or Programs | Approximate Dollar Value of Shares that May Yet Be Purchase Under the Plans or Programs(1) | |||||||
|---|---|---|---|---|---|---|---|---|---|---|---|
October 2014 | — | — | — | $ | 10,013,364 | ||||||
November 2014 | — | — | — | $ | 10,013,364 | ||||||
December 2014 | — | — | — | $ | 10,013,364 | ||||||
Period | Total Number of Shares Purchased | Average Price Paid per Share | Total Number of Shares Purchased as Part of Publicly Announced Plans or Programs | Approximate Dollar Value of Shares that May Yet Be Purchase Under the Plans or Programs(1) | |||||||
|---|---|---|---|---|---|---|---|---|---|---|---|
October 2015 | — | — | — | $ | 25,000,000 | ||||||
November 2015 | — | — | — | $ | 25,000,000 | ||||||
December 2015 | — | — | — | $ | 25,000,000 | ||||||
Performance Comparison Graph
The performance graph is not deemed filed with the SEC and shall not be deemed incorporated by reference into any of our prior or future filings made with the SEC.
The following graph covers the period from December 31, 20092010 to December 31, 2014,2015, assuming $100 was invested on December 31, 20092010 in ILG common stock, and in each of the Russell 2000 in which our stock has been included since June 2009, and a peer group of companies in the Russell 2000 with the Hotels, Restaurant and Leisure GICS code 253010 (a list of these companies is provided below). The graph assumes that all dividends were reinvested on the date of payment without payment of any commissions. The stock price performance shown in the graph is not necessarily indicative of future price performance.
Comparison of Cumulative Total Return
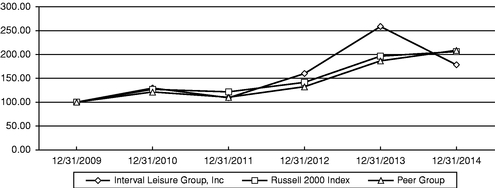
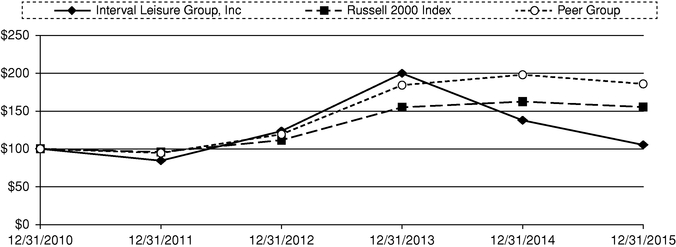
ASSUMES $100 INVESTED ON DECEMBER 31, 20092010
ASSUMES DIVIDENDS REINVESTED
FISCAL YEAR ENDING DECEMBER 31, 20142015
(in dollars)
Company/Index/Market | 12/31/2009 | 12/31/2010 | 12/31/2011 | 12/31/2012 | 12/31/2013 | 12/31/2014 | 12/31/2010 | 12/31/2011 | 12/31/2012 | 12/31/2013 | 12/31/2014 | 12/31/2015 | ||||||||||||||||||||||||||
|---|---|---|---|---|---|---|---|---|---|---|---|---|---|---|---|---|---|---|---|---|---|---|---|---|---|---|---|---|---|---|---|---|---|---|---|---|---|---|
Interval Leisure Group, Inc. | $ | 100.00 | $ | 129.43 | $ | 109.14 | $ | 159.77 | $ | 258.33 | $ | 178.09 | 100.00 | 84.32 | 123.44 | 199.59 | 137.59 | 105.18 | ||||||||||||||||||||
Russell 2000 Index | $ | 100.00 | $ | 126.81 | $ | 121.52 | $ | 141.42 | $ | 196.32 | $ | 205.93 | 100.00 | 95.82 | 111.49 | 154.78 | 162.35 | 155.18 | ||||||||||||||||||||
Peer Group | $ | 100.00 | $ | 121.30 | $ | 110.24 | $ | 132.35 | $ | 186.44 | $ | 208.56 | 100.00 | 94.47 | 119.17 | 184.05 | 197.78 | 185.73 | ||||||||||||||||||||
Companies included in peer group index with GICS Code 253010:
| Dineequity Inc |
| ||
| El Pollo Loco, Inc. |
| ||
| Eldorado Resorts, Inc. | Papa Murphy's Holdings, Inc. | ||
Bloomin' Brands, Inc. | Empire Resorts, Inc. | Penn National Gaming, Inc. | ||
| Fiesta Restaurant Group, Inc. | Pinnacle Entertainment Company | ||
Bojangles' Inc. | Interval Leisure Group Inc. |
| ||
| International Speedway Corp. |
| ||
| Intrawest Resorts Holdings, Inc. |
| ||
| Isle of Capri Casinos Inc. | Ruby Tuesday Inc. | ||
Carrols Restaurant Group Inc. | Jack in the Box | Ruth's Hospitality Group Inc. | ||
|
| Scientific Games Corp. | ||
| Kona Grill, Inc. | SeaWorld Entertainment, Inc. | ||
Chuy's Holdings | Krispy Kreme Doughuts, Inc. | Shake Shakc, Inc. | ||
Clubcorp Holdings | La Quinta Holdings, Inc. |
| ||
|
| Sonic Corp. | ||
| Marcus Corporation | Speedway Motorsports, Inc. | ||
| Marriott Vacations Worldwide Corp. |
| ||
Denny's Corp | Monarch Casino & Resort Inc. | Vail Resorts, Inc. | ||
Diamond Resorts International, Inc. | Morgans Hotel Group Co. | Zoe's Kitchen, Inc. |
Item 6. Selected Financial Data
The following Selected Financial Data should be read in conjunction with the consolidated financial statements and notes thereto in Item 8 of this report and "Management's Discussion and Analysis of Financial Condition and Results of Income" in Item 7 of this report.
Financial Information:
| | Year Ended December 31, | Year Ended December 31, | ||||||||||||||||||||||||||||||
|---|---|---|---|---|---|---|---|---|---|---|---|---|---|---|---|---|---|---|---|---|---|---|---|---|---|---|---|---|---|---|---|---|
| | 2014 | 2013 | 2012 | 2011 | 2010 | 2015 | 2014 | 2013 | 2012 | 2011 | ||||||||||||||||||||||
| | (In thousands, except per share data) | (In thousands, except per share data) | ||||||||||||||||||||||||||||||
Statement of Income Data | ||||||||||||||||||||||||||||||||
Revenue | $ | 614,373 | $ | 501,215 | $ | 473,339 | $ | 428,794 | $ | 409,440 | $ | 697,436 | $ | 614,373 | $ | 501,215 | $ | 473,339 | $ | 428,794 | ||||||||||||
Operating income | 127,094 | 132,745 | 109,781 | 98,784 | 104,477 | 128,144 | 127,094 | 132,745 | 109,781 | 98,784 | ||||||||||||||||||||||
Net income attributable to common stockholders | 78,930 | 81,217 | 40,702 | 41,126 | 42,418 | 73,315 | 78,930 | 81,217 | 40,702 | 41,126 | ||||||||||||||||||||||
Adjusted net income(1) | 81,833 | 81,468 | 53,206 | 40,827 | 43,110 | 76,419 | 80,346 | 81,468 | 53,206 | 40,827 | ||||||||||||||||||||||
EBITDA(1) | 158,731 | 155,103 | 125,261 | 140,942 | 141,130 | 166,088 | 158,731 | 155,103 | 125,261 | 140,942 | ||||||||||||||||||||||
Adjusted EBITDA(1) | 175,140 | 166,243 | 157,068 | 152,349 | 152,375 | 184,888 | 172,705 | 166,243 | 157,068 | 152,349 | ||||||||||||||||||||||
Earnings per share | ||||||||||||||||||||||||||||||||
Basic | $ | 1.38 | $ | 1.42 | $ | 0.72 | $ | 0.72 | $ | 0.75 | $ | 1.28 | $ | 1.38 | $ | 1.42 | $ | 0.72 | $ | 0.72 | ||||||||||||
Diluted | 1.36 | 1.40 | 0.71 | 0.71 | 0.73 | 1.26 | 1.36 | 1.40 | 0.71 | 0.71 | ||||||||||||||||||||||
Adjusted earnings per share(1) | ||||||||||||||||||||||||||||||||
Basic | $ | 1.43 | $ | 1.42 | $ | 0.94 | $ | 0.72 | $ | 0.76 | $ | 1.33 | $ | 1.40 | $ | 1.42 | $ | 0.94 | $ | 0.72 | ||||||||||||
Diluted | 1.41 | 1.41 | 0.93 | 0.71 | 0.75 | 1.32 | 1.39 | 1.41 | 0.93 | 0.71 | ||||||||||||||||||||||
Dividends declared | ||||||||||||||||||||||||||||||||
Dividends declared per share of common stock | $ | 0.44 | $ | 0.33 | $ | 0.50 | $ | — | $ | — | $ | 0.48 | $ | 0.44 | $ | 0.33 | $ | 0.50 | $ | — | ||||||||||||
| | December 31, | December 31, | ||||||||||||||||||||||||||||||
|---|---|---|---|---|---|---|---|---|---|---|---|---|---|---|---|---|---|---|---|---|---|---|---|---|---|---|---|---|---|---|---|---|
| | 2014 | 2013 | 2012 | 2011 | 2010 | 2015 | 2014 | 2013 | 2012 | 2011 | ||||||||||||||||||||||
| | (In thousands) | (In thousands) | ||||||||||||||||||||||||||||||
Balance Sheet Data | ||||||||||||||||||||||||||||||||
Total assets | $ | 1,328,827 | $ | 1,024,619 | $ | 906,920 | $ | 976,322 | $ | 978,384 | $ | 1,279,107 | $ | 1,324,002 | $ | 1,021,899 | $ | 903,417 | $ | 970,877 | ||||||||||||
Long-term debt, net of current portion | 488,000 | 253,000 | 260,000 | 340,113 | 357,576 | 415,700 | 484,383 | 250,280 | 256,498 | 334,669 | ||||||||||||||||||||||
ILG stockholders' equity | 384,043 | 343,825 | 272,066 | 248,685 | 221,212 | 431,993 | 384,043 | 343,825 | 272,066 | 248,685 | ||||||||||||||||||||||
Noncontrolling interest | 36,305 | 32,708 | — | — | — | 33,418 | 36,305 | 32,708 | — | — | ||||||||||||||||||||||
Operating Statistics:
| | Year Ended December 31, | Year Ended December 31, | ||||||||||||||||||||||||||||||
|---|---|---|---|---|---|---|---|---|---|---|---|---|---|---|---|---|---|---|---|---|---|---|---|---|---|---|---|---|---|---|---|---|
| | 2014 | 2013 | 2012 | 2011 | 2010 | 2015 | 2014 | 2013 | 2012 | 2011 | ||||||||||||||||||||||
Exchange and Rental | ||||||||||||||||||||||||||||||||
Total active members (000's) | 1,799 | 1,815 | 1,824 | 1,780 | 1,803 | 1,811 | 1,799 | 1,815 | 1,824 | 1,780 | ||||||||||||||||||||||
Average revenue per member | $ | 180.55 | $ | 187.13 | $ | 182.39 | $ | 182.71 | $ | 181.36 | $ | 178.76 | $ | 180.55 | $ | 187.13 | $ | 182.39 | $ | 182.71 | ||||||||||||
Available room nights (000's) | 3,015 | 1,537 | 1,497 | 1,537 | 1,613 | 3,054 | 3,095 | 1,537 | 1,497 | 1,537 | ||||||||||||||||||||||
RevPAR | $ | 123.06 | $ | 138.90 | $ | 130.28 | $ | 111.43 | $ | 95.79 | $ | 119.70 | $ | 106.97 | $ | 132.57 | $ | 126.78 | $ | 110.55 | ||||||||||||
Vacation Ownership | ||||||||||||||||||||||||||||||||
Contract sales (000's) | $ | 26,173 | — | — | — | — | $ | 99,774 | $ | 26,173 | — | — | — | |||||||||||||||||||
Average transaction price | $ | 34,438 | — | — | — | — | $ | 34,169 | $ | 34,438 | — | — | — | |||||||||||||||||||
Volume per guest | $ | 3,581 | — | — | — | — | $ | 3,554 | $ | 3,581 | — | — | — | |||||||||||||||||||
Additional Data:
| | Year Ended December 31, | Year Ended December 31, | ||||||||||||||||||||||||||||||
|---|---|---|---|---|---|---|---|---|---|---|---|---|---|---|---|---|---|---|---|---|---|---|---|---|---|---|---|---|---|---|---|---|
| | 2014 | 2013 | 2012 | 2011 | 2010 | 2015 | 2014 | 2013 | 2012 | 2011 | ||||||||||||||||||||||
Exchange and Rental | ||||||||||||||||||||||||||||||||
Transaction revenue(9) | $ | 193,206 | $ | 198,933 | $ | 198,434 | $ | 192,297 | $ | 190,954 | ||||||||||||||||||||||
Membership fee revenue(10) | 127,396 | 135,198 | 130,784 | 129,477 | 129,818 | |||||||||||||||||||||||||||
Ancillary member revenue(11) | 6,649 | 6,852 | 6,976 | 7,371 | 8,709 | |||||||||||||||||||||||||||
Transaction revenue(10) | $ | 192,202 | $ | 193,206 | $ | 198,933 | $ | 198,434 | $ | 192,297 | ||||||||||||||||||||||
Membership fee revenue(11) | 126,234 | 127,396 | 135,198 | 130,784 | 129,477 | |||||||||||||||||||||||||||
Ancillary member revenue(12) | 5,577 | 6,649 | 6,852 | 6,976 | 7,371 | |||||||||||||||||||||||||||
| | | | | | | | | | | | | | | | | | | | | | | | | | | | | | | | | |
Total member revenue | 327,251 | 340,983 | 336,194 | 329,145 | 329,481 | 324,013 | 327,251 | 340,983 | 336,194 | 329,145 | ||||||||||||||||||||||
Other revenue(12) | 25,262 | 24,024 | 21,538 | 20,282 | 15,747 | |||||||||||||||||||||||||||
Other revenue(13) | 32,636 | 25,262 | 24,024 | 21,538 | 20,282 | |||||||||||||||||||||||||||
Rental management revenue | 48,148 | 29,956 | 27,075 | 24,800 | 22,113 | 50,384 | 48,148 | 29,956 | 27,075 | 24,800 | ||||||||||||||||||||||
Pass-through revenue(13) | 82,729 | 47,426 | 43,986 | 41,026 | 41,032 | |||||||||||||||||||||||||||
Pass-through revenue(14) | 94,311 | 82,729 | 47,426 | 43,986 | 41,026 | |||||||||||||||||||||||||||
| | | | | | | | | | | | | | | | | | | | | | | | | | | | | | | | | |
Total Exchange & Rental revenue | $ | 483,390 | $ | 442,389 | $ | 428,793 | $ | 415,253 | $ | 408,373 | $ | 501,344 | $ | 483,390 | $ | 442,389 | $ | 428,793 | $ | 415,253 | ||||||||||||
| | | | | | | | | | | | | | | | | | | | | | | | | | | | | | | | | | |
| | | | | | | | | | | | | | | | | | | | | | | | | | | | | | | | | |
Exchange and Rental gross margin | 62.0 | % | 67.1 | % | 67.1 | % | 68.2 | % | 68.8 | % | 61.1 | % | 62.0 | % | 67.1 | % | 67.1 | % | 68.2 | % | ||||||||||||
Exchange and Rental gross margin without pass-through | 74.8 | % | 75.2 | % | 74.8 | % | 75.7 | % | 76.4 | % | 75.3 | % | 74.8 | % | 75.2 | % | 74.8 | % | 75.7 | % | ||||||||||||
Vacation Ownership | ||||||||||||||||||||||||||||||||
Management fee revenue | $ | 92,017 | $ | 41,595 | $ | 27,871 | 7,641 | 580 | $ | 99,566 | $ | 92,017 | $ | 41,595 | $ | 27,871 | $ | 7,641 | ||||||||||||||
Sales and financing revenue | 9,479 | — | — | — | — | 39,041 | 9,478 | — | — | — | ||||||||||||||||||||||
Pass-through revenue(13) | 29,487 | 17,231 | 16,675 | 5,900 | 487 | |||||||||||||||||||||||||||
Pass-through revenue(14) | 57,485 | 29,488 | 17,231 | 16,675 | 5,900 | |||||||||||||||||||||||||||
| | | | | | | | | | | | | | | | | | | | | | | | | | | | | | | | | |
Total Vacation Ownership revenue | $ | 130,983 | $ | 58,826 | $ | 44,546 | $ | 13,541 | $ | 1,067 | $ | 196,092 | $ | 130,983 | $ | 58,826 | $ | 44,546 | $ | 13,541 | ||||||||||||
| | | | | | | | | | | | | | | | | | | | | | | | | | | | | | | | | | |
| | | | | | | | | | | | | | | | | | | | | | | | | | | | | | | | | |
Vacation Ownership gross margin | 38.5 | % | 42.3 | % | 39.2 | % | 30.5 | % | 28.6 | % | 37.9 | % | 38.5 | % | 42.3 | % | 39.2 | % | 30.5 | % | ||||||||||||
Vacation Ownership gross margin without pass-through | 49.6 | % | 59.8 | % | 62.3 | % | 54.0 | % | 52.6 | % | 53.6 | % | 49.6 | % | 59.8 | % | 62.3 | % | 54.0 | % | ||||||||||||
Item 7. Management's Discussion and Analysis of Financial Condition and Results of Operations
The following Management Discussion and Analysis provides a comparative discussion of the results of operations and financial condition of ILG for the three years ended December 31, 2014.2015. This section should be read in conjunction with the consolidated financial statements and accompanying notes included in this Form 10-K for the year ended December 31, 2014,2015, which have been prepared in accordance with U.S. generally accepted accounting principles ("GAAP"). This discussion includes the following sections:
Organization
In the fourth quarter of 2014, as a result of the acquisition of HVO and its added sales and marketing capabilities, ILG reorganized its management structure. This realignment resulted in a change to our operating and reportable segments which are now Exchange and Rental, and Vacation Ownership. The Exchange and Rental operating segment consists of Interval, the TPI operated exchange business, Aston, Aqua and the HVO exchange business. The Vacation Ownership operating segment consists of the management related lines of business of VRI, TPI, VRI Europe and HVO, as well as the HVO sales and financing business.
Basis of Presentation and Accounting Estimates
The accompanying consolidated financial statements have been prepared in accordance with GAAP and reflect the financial position and operating results of ILG. ILG's management is required to make certain estimates and assumptions during the preparation of its consolidated financial statements in accordance with GAAP. These estimates and assumptions impact the reported amounts of assets and liabilities and disclosures of contingent assets and liabilities as of the date of the consolidated financial statements. They also impact the reported amount of net earnings during any period. Actual results could differ from those estimates.
Significant estimates underlying the accompanying consolidated financial statements include: the recovery of goodwill and long-lived and other intangible assets; purchase price allocations; the determination of deferred income taxes including related valuation allowances; the determination of deferred revenue and membership costs; and the determination of stock-based compensation. In the opinion of ILG's management, the assumptions underlying the historical consolidated financial statements of ILG and its subsidiaries are reasonable.
General Description of our Business
Interval Leisure Group, Inc., or ILG, is a leading global provider of non-traditional lodging, encompassing a portfolio of leisure businesses from exchange and vacation rental to vacation ownership.
Exchange and Rental offers access to vacation accommodations and other travel-related transactions and services to leisure travelers, by providing vacation exchange services and vacation rentals, working with resort developers and operating vacation rental properties. Vacation Ownership engages in the management of vacation ownership resorts; sales, marketing, and financing of vacation ownership interests; and related services to owners and associations.
The Exchange and Rental operating segment consists of Interval, the TPI operated exchange business, Aston, Aqua and the HVO exchange business. The Vacation Ownership operating segment consists of the management related lines of business of VRI, TPI, VRI Europe and HVO, as well as the HVO sales and financing business.
Exchange & Rental Services
Interval the principal business in our Exchange and Rental segment, has been a leader in the vacation exchange services industry since its founding in 1976. As of December 31, 2014,2015, Interval's primary operation is the Interval Network, a quality global vacation ownership membership exchange network with:
Interval typically enters into multi-year contracts with developers of vacation ownership resorts, pursuant to which the resort developers agree to enroll all purchasers of vacation interests at the
applicable resort as members of an Interval exchange program. In return, Interval provides enrolled purchasers with the ability to exchange the use and occupancy of their vacation interest at the home resort/club system for the right to occupy accommodations at a different resort participating in an Interval exchange network. Through Interval's Getaways, members may rent resort accommodations for a fee without relinquishing the use of their vacation interest. In addition, Interval offers sales, marketing and operational support, consulting and back-office services, including reservation servicing, to certain resort developers participating in the Interval Network, upon their request and for additional consideration. We also operate additional exchange programs including the Hyatt Residence Club, which encompasses 16 resorts as of the end of 2014.2015.
This segment also provides vacation rental through its Aston and Aqua businessesAqua-Aston business as part of a comprehensive package of rental, marketing and management services offered to vacation property owners, primarily of Hawaiian properties, as well as through the Interval Network. Revenue from our vacation rental business is derived principally from fees for rental services and related management of hotels, condominium resorts and homeowners' associations. Agreements with owners at many of vacation rental's managed hotel and condominium resorts provide that owners receive either specified percentages of the revenue generated under our management or, in limited instances, guaranteed dollar amounts. In these cases, the operating expenses for the rental operation are paid from the revenue generated by the rentals, the owners are then paid their contractual percentages or guaranteed amounts, and our vacation rental business either retains the balance (if any) as its fee or makes up the deficit. In other instances, fees for rental services generally consist of commissions earned on rentals.
Management fees consist of a base management fee, and in some instances for hotels or condominium resorts, an incentive management fee which is generally a percentage of operating profits or improvement in operating profits. Service fee revenue is based on the services provided to owners including reservations, sales and marketing, property accounting and information technology services either internally or through third party providers.
The Exchange and Rental segment earns most of its revenue from (i) fees paid for membership in the Interval Network and the Hyatt Residence Club and (ii) Interval Network and Hyatt Residence Club transactional and service fees paid primarily for exchanges, Getaways, reservation servicing, and related transactions collectively referred to as "transaction revenue." Revenue is also derived from fees for ancillary products and services provided to members, fees from other exchange and rental programs and other products and services sold to developers.
Vacation Ownership Services
Revenue from the Vacation Ownership segment is derived principally from fees for vacation ownership resort and homeowners' association management services, sales of Hyatt® branded vacation ownership interests, interest income earned for financing these sales, and licensing, sales and marketing, and other fees charged to non-controlled developers of Hyatt Residence Club affiliated resorts.
We provide management services to nearly 200 vacation ownership properties and/or their associations through HVO, TPI, VRI and VRI Europe. TPI and VRI provide property management, homeowners' association management and related services to timeshare resorts in the United States, Canada and Mexico. VRI Europe manages vacation ownership resorts in Spain and the Canary Islands, the United Kingdom, France and Portugal. HVO provides management services for luxury and upper upscale resorts throughout the United States participating in the Hyatt Residence Club. Our management services are provided pursuant to agreements with terms generally ranging from one to ten years or more, many of which are automatically renewable. Management fees are negotiated amounts for management and other specified services, and at times are based on a cost-plus arrangement.
HVO sells, markets, finances, develops and/or licenses the brand for 16 vacation ownership resorts that participate in the Hyatt Residence Club. HVO sells traditional vacation ownership interests of weekly intervals and, at certain properties, fractional interests, as deeded real estate. These interests provide annual usage rights for a one-week or longer interval at a specific resort. Each purchaser is automatically enrolled in the Hyatt Residence Club. In connection with the sales of vacation ownership interests, we provide financing to eligible purchasers collateralized by the deeded interest. These loans generally bear interest at a fixed rate, have a term of up to 10 years and require a minimum 10% down payment. In addition, we receive fees for sales and marketing, brand licensing and other services provided to properties where the developer is not controlled by us. We have a global master license agreement with a subsidiary of Hyatt Hotels Corporation which provides us with an exclusive license for the use of Hyatt® brand with respect to shared ownership. The Hyatt Residence Club resorts are able to use the Hyatt brand through agreements with us. Marketing efforts for TPI, VRI and VRI Europe are focused on homeowners' associations of vacation ownership resorts. VRI Europe has an agreement with CLC World Resorts to source additional management opportunities, while HVO focuses its management services on Hyatt Residence Club resorts and associations.
In December 2014, the newest Hyatt Residence Club resort, Hyatt Ka'anapali Beach opened on Maui. This resort was developed through an unconsolidated joint venture with Host Hotels & Resorts and HVO is providing sales, marketing and management services and the license for the brand.
International Revenue
| | Year ended December 31, | |||||||||||||||
|---|---|---|---|---|---|---|---|---|---|---|---|---|---|---|---|---|
| | 2015 | % change | 2014 | % change | 2013 | |||||||||||
| | (Dollars in thousands) | |||||||||||||||
International revenue | $ | 120,384 | (8.4 | )% | $ | 131,366 | 36.4 | % | 96,329 | |||||||
International revenue in constant currency | $ | 131,162 | (0.2 | )% | $ | 131,366 | 36.4 | % | 96,329 | |||||||
As a percentage of total revenue | 17.3 | % | (19.3 | )% | 21.4 | % | 11.3 | % | 19.2 | % | ||||||
As a percentage of total revenue in constant currency | 18.5 | % | (13.4 | )% | 21.4 | % | 11.3 | % | 19.2 | % | ||||||
International revenue decreased 8.4% in 2015 compared to 2014, and increased 36.4% in 2014 compared to 2013, and 10.3% in 2013 compared to 2012.2013. As a percentage of our total revenue, international revenue increaseddecreased to 17.3% in 2015, from 21.4% in 2014, which was an increase in 2014 from 19.2% in 2013, which2013. In constant currency, international revenue was an increase fromflat for 2015 compared to last year, while as a percentage of our total revenue it decreased to 18.5% in 2012.2015 from 21.4% in 2014. The increasedecrease in international revenue on a constant currency basis as a percentage of total revenue in 20132015 is largely attributable to revenue from our VRI Europe joint venture commencing November 2013.HVO acquisition consummated in October 2014, which is entirely U.S. revenue.
Constant currency represents current period results of operations determined by translating our functional currency results to U.S. dollars (our reporting currency) using the actual prior period blended rate of translation from the comparable prior period. We believe that the presentation of our results of operations excluding the effect of foreign currency translations serves to enhance the understanding of our performance, improves transparency of our disclosures, provides meaningful presentations of our results from our business operations by excluding this effect not related to our core business operations and improves the period to period comparability of results from business operations.
Basis of Presentation and Accounting Estimates
The decreaseaccompanying consolidated financial statements have been prepared in internationalaccordance with GAAP and reflect the financial position and operating results of ILG. ILG's management is required to make certain estimates and assumptions during the preparation of its consolidated financial statements in accordance with GAAP. These estimates and assumptions impact the reported amounts of assets and liabilities and disclosures of contingent assets and liabilities as of the date of the consolidated financial statements. They also impact the reported amount of net earnings during any period. Actual results could differ from those estimates.
Significant estimates underlying the accompanying consolidated financial statements include: the recovery of goodwill and long-lived and other intangible assets; vacation ownership inventory; purchase price allocations; the determination of deferred income taxes including related valuation allowances; the determination of deferred revenue as a percentageand membership costs; and the determination of total revenue in 2012 is largely attributable tostock-based compensation. In the February 2012 acquisitionopinion of VRI which operates entirely inILG's management, the United States.assumptions underlying the historical consolidated financial statements of ILG and its subsidiaries are reasonable.
Other Factors Affecting Results
Exchange & Rental
The consolidation of resort developers driven by bankruptcies and the lack of receivables financing previously has resulted in a decrease in the flow of new members from point of sale to our exchange networks. Access to financing has returned to the industry following the recession and slow recovery. While fewer new projects have been constructed in the last several years, we are beginning to see more activity that generates new members. In addition, developers and homeowners' associations have been taking back vacation ownership interests which are available to be sold again. This allows developers to continue to generate sales revenues without significant capital expenditure for development and causes homeowners' associations at resorts that are no longer linked to a developer to look for efficient distribution channels to resell the inventory to preserve the maintenance fee paying owner base. Additionally,
development. However, a high proportion of sales by developers arecontinues to be to their existing owners, which does not result in new members to the Interval Network.
Our 20142015 results continue to bewere negatively affected by a shift in the percentage mix of the Interval Network membership base from traditional direct renewal members to corporate members, a tightening in the availability of exchange and Getaway inventory and, to a lesser extent, during the first quarter of 2014, severe weather throughout much of the United States which limited demand to certain destinations with availability. In addition, during the first quarter we secured multi-year renewals with several large developer clients that account for approximately two-thirds of the Interval Network corporate members; however, the terms associated with these renewals have resulted in reduced profitability.members. Our corporate developer accounts enroll and renew their entire active owner base which
positively impacts our retention rate; however, these members tend to have a lower propensity to transact with us. Membership mix as of December 31, 20142015 included 58%57% traditional and 42%43% corporate members, compared to 60%58% and 40%42%, respectively, as of December 31, 2013.2014.
Our Exchange and Rental segment results are susceptible to variations in economic conditions, particularly in its largest vacation rental market, Hawaii. According to the Hawaii Tourism Authority, visitor arrivals by air in Hawaii increased 1.3%4.3% for the year ended December 31, 20142015 compared to the prior year. The increase in visitors correlates with an overall increase of 4.2%3.0% in revenue per available room ("RevPAR") at AstonAqua-Aston in Hawaii in 20142015 compared to 2013, exclusive of Aqua for comparability purposes given its December 2013 acquisition date.2014. The combined increase in RevPAR in Hawaii was driven by higher average daily rates.
As of the latest forecast (November 2014)(February 2016), the Hawaii Department of Business, Economic Development and Tourism forecasts increases of 1.9% in visitors to Hawaii and 3.6%2.4% in visitor expenditures in 20152016 over 2014.2015.
Vacation Ownership
For the United States based businesses, our management fees are paid by the homeowners' association and funded from the annual maintenance fees paid by the individual owners to the association. Most of VRI Europe revenue is based on a different model. Typically, VRI Europe charges vacation owners directly an annual fee intended to cover property management, all resort operating expenses and a management profit. Consequently, VRI Europe's business model normally operates at a lower gross margin than the other management businesses, when excluding pass-through revenue.
HVO, TPI and VRI also offer vacation rental services to individual timeshare owners and homeowners' associations. HVO provides management services to homeowners' associations and resorts that participate in the Hyatt Residence Club. VRI Europe manages resorts developed by CLC World Resorts, our joint venture partner in VRI Europe, as well as independent homeowners' associations. The loss of several of our largest management agreements could materially impact our Vacation Ownership business.
On October 1, 2014, in connection with the closing of the acquisition of HVO, our subsidiary entered into a Master License Agreement with a subsidiary of Hyatt Hotels Corporation. The Master License Agreement provides an exclusive license for the use of the Hyatt® brand in connection with the shared ownership business. Pursuant to the terms of the Master License Agreement, our subsidiary may continue to develop, market, sell and operate existing shared ownership projects as well as new shared ownership projects agreed to by us and Hyatt. HVO must comply with designated Hyatt® brand standards with respect to the operation of the licensed business. The initial term of the Master License Agreement expires on December 31, 2093, with three 20-year extensions subject to meeting sales performance tests. In consideration for the exclusive license and for access to Hyatt's various marketing channels, including the existing hotel loyalty program, we have agreed to pay Hyatt certain recurring royalty fees based on revenues generated from vacation ownership sales, management, rental and club dues collected by us related to the branded business. Hyatt may terminate the Master License Agreement upon the occurrence of certain uncured, material defaults by us. Such defaults include, but are not limited to, a substantial payment default, bankruptcy, a transfer in breach of the specified transfer restrictions or a material failure to comply with Hyatt® brand standards on a systemic level.
Over the past year, we have been reviewing the effectiveness of our HVO sales and marketing organization. We are in the process of rebuilding the sales platform, particularly for the consolidated properties and have hired senior sales and marketing talent and added a new sales center in Key West.
Business Acquisitions
On February 28, 2012, we acquired VRI, a non-developer provider of resort and homeowners association management services to the shared ownership industry. VRI was consolidated into our financial statements as of the acquisition date and the financial effect of this acquisition was not material to our consolidated financial statements; however, the year-over-year comparability for the year ended December 31, 2013 was affected as further discussed in our Results of Operations section.
On November 4, 2013, VRI Europe Limited purchased the European shared ownership resort management business of CLC for cash and issuance to CLC of shares totaling 24.5% of VRI Europe Limited, creating a joint venture. In connection with this arrangement, ILG has committed to issue a convertible secured loan for approximately $15 million to CLC which matures in five years with interest payable monthly. VRI Europe was consolidated into our financial statements as of the acquisition date and is included in our Vacation Ownership operating segment for segment reporting.
On December 12, 2103,2013, we acquired all of the equity of Aqua Hospitality LLC and Aqua Hotels and Resorts, Inc., referred to as Aqua, a Hawaii-based hotel and resort management company representing more than 25 properties in Hawaii and Guam.
On October 1, 2014, we acquired the Hyatt Vacation Ownership business, or HVO, which provides vacation ownership services at 16 Hyatt Residence Club resorts, from subsidiaries of Hyatt Hotels Corporation. In connection with the acquisition, we entered into a long-term exclusive license for use of the Hyatt® brand with respect to the shared ownership business.
The financial effect of these acquisitions impacts the year-over-year comparability as further discussed in our Results of Operations section.
Liquidity
InOn April 2014,10, 2015, we completed a private offering of $350 million in aggregate principal amount of our 5.625% senior notes due in 2023. The net proceeds from the offering, after deducting estimated offering related expenses, were approximately $343 million. We used the proceeds to repay indebtedness outstanding on our revolving credit facility.
On April 10, 2015, we entered into the firsta third amendment to the June 21, 2012 amended and restated credit agreement which increases the revolving credit facility from $500 million to $600 million, extends the maturity of the credit facility to April 8, 2019 and provides for certain other amendments to covenants, as further discussed in Note 9 of the consolidated financial statements included in this report. The interest rate on the Amended Credit Agreement is basedwhich changes the leverage-based financial covenant from a maximum consolidated total leverage to EBITDA ratio of 3.5 to 1.0 to a maximum consolidated secured leverage to EBITDA ratio of 3.25 to 1.0. In addition, the amendment adds an incurrence test requiring a maximum consolidated total leverage to EBITDA ratio of 4.5 to 1.0 on (at our election)a pro forma basis in certain circumstances in which we make acquisitions or investments, incur additional indebtedness or make restricted payments. Also, the amendment added a new pricing level to the pricing grid for when the consolidated total leverage to EBITDA ratio equals or exceeds 3.5 to 1.0. This pricing level is either LIBOR plus a predetermined margin that ranges from 1.25% to 2.25%,2.5% or the Base Rate as defined inbase rate plus 1.5% and requires a commitment fee on undrawn amounts of 0.4% per annum. There were no other material changes under this amendment.
On May 5, 2015, we entered into a fourth amendment to the Amended Credit Agreement pluswhich changes the definition of change of control to remove the provision that certain changes in the composition of the board of directors would constitute a predetermined marginchange of control and therefore be a default under the credit agreement. The amendment also includes additional clarifying language regarding provisions that ranges from 0.25%relate to 1.25%, in each case based on our leverage ratio.
In September 2012, we redeemed all of our 9.5%5.625% senior notes at 100% of the principal amount plus accrued and unpaid interest to the redemption date, at which time the senior notesdue in 2023. There were no longer deemed to be outstanding and our obligationsother material changes under the indenture, as previously supplemented, terminated. Additionally, the extinguishment of our senior notes resulted in a non-cash, pre-tax loss on extinguishment of debt of $17.9 million during the third quarter of 2012 principally pertaining to the acceleration of the original issue discount and the write-off of the related unamortized deferred debt issuance costs. This non-cash charge is presented as a separate line item within other income (expense) in our consolidated statement of income for the year ended December 31, 2012.this amendment.
Outlook
We expect additional consolidation within the vacation ownership industry leading to increased competition in our Exchange and Rental business and reduced availability of exchange and Getaway inventory. Additionally, we anticipate continued margin compression and increased competition in our Exchange and Rental business.
Exchange and Rental business and continued softness in demand from jurisdictions with weaker currencies.
With regards to the vacation rental business, we expect year-over-yearour RevPAR to hold steady asexpectation generally tracks with the forecasted upward trend in tourism recoveryactivity of its largest market, Hawaii, moderates.which is benefiting from a relatively stable North American market. Additionally, airlift into the island chain remains a positive factor bolstering the Hawaiian tourism economy; however, limited inter-island airlift between islands and increases in the cost of a Hawaiian vacation, particularly for Japanese and Canadian travelers who have lost purchasing power due to the strengthening U.S. dollar, may continue to negatively impact visitor arrivals and expenditures, and temper growth.
In the vacation management business, we expect independent homeowners' associations to be increasingly dependent on secondary sales of inventory to replace lost maintenance fees from an aging owner base. Changes in currency exchange rates willmay contribute to negatively affect the results of our VRI Europe subsidiaries.
Additionally,On October 27, 2015, we entered into an Agreement and Plan of Merger, with Starwood Hotels & Resorts Worldwide, Inc. (Starwood), Vistana Signature Experiences, Inc. (Vistana) and our completionnewly formed subsidiary, pursuant to which we will acquire Vistana, the vacation ownership business of Starwood. The acquisition will be effected through a "Reverse Morris Trust" structure, which means that Vistana will be spun-off to Starwood's shareholders pursuant to a Separation Agreement and then merged with our subsidiary with Vistana shareholders receiving stock of ILG. Vistana will be the surviving entity of the HVO acquisitionmerger. The combination will result in Starwood shareholders owning approximately 55% of the fourth quartercombined company on a fully diluted basis, with existing shareholders of 2014 will affectILG owning approximately 45% of the year-over-year comparabilitycombined company. Completion of our resultsthe merger is subject to customary closing conditions, including regulatory and ILG shareholder approvals. Liberty Interactive Corp and ILG's senior executives have entered into Voting and Support Agreements, which provide for them to vote in favor of operations for the year ended December 31, 2015.merger and the issuance of ILG shares pursuant to the merger. For additional information see "Note 3—Business Combinations" in Item 8 of this report.
CRITICAL ACCOUNTING POLICIES AND ESTIMATES
The preparation of financial statements in conformity with GAAP requires management to make estimates, judgments and assumptions that affect the amounts reported in our consolidated financial statements and accompanying notes. On an ongoing basis, we evaluate our estimates which are based on historical experience and on various other judgments and assumptions that we believe are reasonable under the circumstances. Actual outcomes could differ from those estimates.
Our significant accounting policies are discussed in Note 2 accompanying our consolidated financial statements and should be reviewed in connection with the following discussion. Set forth below are the policies and estimates that we have identified as critical to our business operations and an understanding of our results of operations, based on the high degree of judgment or complexity in their application.
Revenue Recognition
Exchange and Rental
Revenue, net of sales incentives, from membership fees in our Exchange and Rental segment is deferred and recognized over the terms of the applicable memberships, typically ranging from one to five years, on a straight-line basis. When multiple member benefits and services are provided over the term of the membership, revenue is recognized for each separable deliverable ratably over the membership period, as applicable. Generally, memberships are cancelable and refundable on a pro-rata basis, with the exception of our Platinum tier which is non-refundable. Direct costs of acquiring
members (primarily commissions) and certain direct fulfillment costs related to deferred membership revenue are also deferred and amortized on a straight-line basis over the terms of the applicable memberships or benefit period, whichever is shorter. The recognition of previously deferred revenue and expense is based on estimates derived from an aggregation of member-level data. However, in the fourth quarter of 2014 upon implementation of a proprietary IT platform, recognition of deferred membership revenue and expense on new memberships sold is at the individual member-level.
Revenue from exchange and Getaway transactions is recognized when confirmation of the transaction is provided as the earnings process is complete. Reservation servicing revenue is recognized when service is performed or on a straight-line basis over the applicable service period. All taxable revenue transactions are presented on a net-of-tax basis.
Revenue from our vacation rental management businesses arebusiness is comprised of base management fees which are typically either (i) fixed amounts, (ii) amounts based on a percentage of adjusted gross lodging revenue, or (iii) various revenue sharing arrangements with condominium owners based on stated formulas. Base management fees are recognized when earned in accordance with the terms of the contract. Incentive management fees for certain hotels and condominium resorts are generally a percentage of operating profits or improvement in operating profits. We recognize incentive management fees as earned throughout the incentive period based on actual results which are trued-up
at the culmination of the incentive period. Service fee revenue is based on the services provided to owners including reservations, sales and marketing, property accounting and information technology services either internally or through third party providers. Service fee revenue is recognized when the service is provided.
In certain instances we arrange services which are provided directly to property owners. Transactions for these services do not impact our consolidated financial statements as they are not included in our results of operations. Additionally, in most cases we employ on-site personnel to provide services such as housekeeping, maintenance and administration to property owners under our management agreements. For such services, we recognize revenue in an amount equal to the expenses incurred.
Vacation Ownership
The Vacation Ownership segment's revenue is derived principally from sales of vacation ownership intervals, fees for timeshare resort and homeowners' association management, and other management related services. Management fees in this segment consist of base management fees, service fees, and annual maintenance fees, as applicable.
ILG recognizes revenue from sales of vacation ownership intervals in accordance with Financial Accounting Standard Board (FASB) Accounting Standards Codification (ASC) 970,Real Estate—General, and FASB ASC 978,Real Estate—Time-Sharing Activities. The stated sales price of the vacation ownership interests (VOI) are divided into separate revenue components, which include the revenue earned on the sale of the VOI and the revenue earned on the sales incentive given to the customer as motivation to purchase the VOI. ILG offers several types of sales incentives, including Hyatt Gold Passport Points, free bonus week, down payment credits to buyers, and waiver of first year maintenance fees.
Consolidated VOI sales are recognized and included in revenues after a binding sales contract has been executed, a 10% minimum down payment has been received as a measure of substantiating the purchaser's commitment, the rescission period has expired, and construction is substantially complete. Pursuant to accounting rules for real estate time-sharing transactions, as part of determining when we have met the criteria necessary for revenue recognition we must also take into consideration the fair value of certain incentives provided to the purchaser when assessing the adequacy of the purchaser's initial investment. The agreement for sale generally provides for a down payment and a note secured by a mortgage payable in monthly installments, including interest, over a period of up to 10 years. All
payments received prior to the recognition of the sale as revenue are recognized in deferred revenue in the accompanying consolidated balance sheets. Customer deposits relating to contracts cancelled after the applicable rescission period are forfeited and recorded in other income at the time of forfeiture.
The provision for loan losses is recorded as an adjustment to sales of vacation ownership intervals in the accompanying consolidated statements of income rather than as an adjustment to bad debt expense. ILG records an estimate of uncollectible amounts at the time of the interval sale.
Annual maintenance fees are amounts paid by timeshare owners for maintaining and operating the respective properties, which includes management services, and is recognized on a straight-line basis over the respective annual maintenance period.
Deferred Revenue in a Business Combination
When we acquire a business which records deferred revenue on their historical financial statements, we are required to re-measure that deferred revenue as of the acquisition date pursuant to rules related to accounting for business combinations, as described further below. The post-acquisition impact of that remeasurement results in recognizing revenue which solely comprises the cost of the
associated legal performance obligation we assumed as part of the acquisition, plus a normal profit margin. At times, this purchase accounting treatment results in lower amounts of revenue recognized in a reporting period following the acquisition than would have otherwise been recognized on a historical basis.
Multiple-Element Arrangements
When we enter into multiple-element arrangements, we are required to determine whether the deliverables in these arrangements should be treated as separate units of accounting for revenue recognition purposes and, if so, how the contract price should be allocated to each element. We analyze our contracts upon execution to determine the appropriate revenue recognition accounting treatment. Our determination of whether to recognize revenue for separate deliverables will depend on the terms and specifics of our products and arrangements as well as the nature of changes to our existing products and services, if any. The allocation of contract revenue to the various elements does not change the total revenue recognized from a transaction or arrangement, but may impact the timing of revenue recognition.
Vacation Ownership Mortgages Receivable and Allowance for Loan Losses
Consolidated vacation ownership mortgages receivable consist of loans to eligible customers who purchase vacation ownership interests and choose to finance their purchase. These mortgage receivables are collateralized by the underlying vacation ownership interest, generally bear interest at a fixed rate, have a typical term ranging from 5 - 10 years and are generally made available to customers who make a down payment on the purchase price within established credit guidelines.
Vacation ownership mortgages receivable are composed of mortgage loans related to our financing of vacation ownership interval sales. Included within our vacation ownership mortgages receivable are originated loans and loans acquired in connection with our acquisition of HVO. Acquired loans are segregated between those with deteriorated credit quality at acquisition and those deemed as performing. To make this determination, we consider such factors as credit collection history, past due status, non-accrual status, credit risk ratings, interest rates and the underlying collateral securing the loans. The fair value of acquired loans deemed performing is determined by discounting cash flows, both principal and interest, for the loan pool at market interest rates while giving consideration to anticipated future defaults. The difference between fair value and principal balances due at acquisition date is accreted to interest income, within consolidated revenue, over the estimated life of the loan pool.
Allowance for Loan Losses
For originated loans, we record an estimate of uncollectability as a reduction of sales of vacation ownership intervals in the accompanying consolidated statements of income at the time revenue is recognized on a vacation ownership interval sale. We evaluate our originated loan portfolio collectively as we hold a large group of largely homogeneous, smaller-balance, vacation ownership mortgages receivable. We use a technique referred to as static pool analysis, which tracks uncollectibles over the entire life of those mortgage receivable, as the basis for determining our general reserve requirements on our vacation ownership mortgages receivable. The adequacy of the related allowance is determined by management through analysis of several factors, such as current economic conditions and industry trends, as well as the specific risk characteristics of the portfolio, including defaults, aging, and historical write-offs of these receivables. The allowance is maintained at a level deemed adequate by management based on a periodic analysis of the mortgage portfolio.
We had $1.9 million and $0.3 million of allowance for loan losses as of December 31, 2015 and 2014, respectively, pertaining entirely to our originated loan portfolio. Changes in the estimates used in developing our default rates could result
in a material change to our allowance. A 10% increase to our default rates used in the allowance calculation would increase our allowance for loan losses by less than $0.1$0.2 million.
We determine our originated vacation ownership mortgages receivable to be nonperforming if either interest or principal is more than 120 days past due. All non-performing loans are placed on non-accrual status and we do not resume interest accrual until the receivable becomes contractually current. We apply payments we receive for vacation ownership notes receivable on non-performing status first to interest, then to principal, and any remainder to fees.
Loans acquired in connection with a business combination are recorded at their estimated fair value on their purchase date with no carryover of the related allowance for loan losses. Performing acquired loans are subsequently evaluated for any required allowance at each reporting date. An allowance for loan losses on acquired loans is calculated using a similar methodology for originated loans.
Accounting for Business Combinations
In accordance with ASC Topic 805, "Business Combinations," when accounting for business combinations we are required to recognize the assets acquired, liabilities assumed, contractual contingencies, noncontrolling interests and contingent consideration at their fair value as of the acquisition date.
The purchase price allocation process requires management to make significant estimates and assumptions with respect to intangible assets, estimated contingent consideration payments and/or pre-acquisition contingencies, all of which ultimately affect the fair value of goodwill established as of the acquisition date. Goodwill acquired in business combinations is assigned to the reporting unit(s) expected to benefit from the combination as of the acquisition date and is then subsequently tested for impairment at least annually.
As part of our accounting for business combinations we are required to determine the useful lives of identifiable intangible assets recognized separately from goodwill. The useful life of an intangible asset is the period over which the asset is expected to contribute directly or indirectly to the future cash flows of the acquired business. An intangible asset with a finite useful life shall be amortized; an intangible asset with an indefinite useful life shall not be amortized. We base the estimate of the useful life of an intangible asset on an analysis of all pertinent factors, in particular, all of the following factors with no one factor being more presumptive than the other:
If no legal, regulatory, contractual, competitive, economic, or other factors limit the useful life of an intangible asset to the reporting entity, the useful life of the asset shall be considered to be indefinite. The term indefinite does not mean the same as infinite or indeterminate. The useful life of an intangible asset is indefinite if that life extends beyond the foreseeable horizon—that is, there is no
foreseeable limit on the period of time over which it is expected to contribute to the cash flows of the acquired business.
Although we believe the assumptions and estimates we have made have been reasonable and appropriate, they are based in part on historical experience and information obtained from the management of the acquired entity and are inherently uncertain. Examples of critical estimates in accounting for acquisitions include but are not limited to:
Unanticipated events and circumstances may occur which could affect the accuracy or validity of our assumptions, estimates or actual results. Additionally, any change in the fair value of the acquisition-related contingent consideration subsequent to the acquisition date, including changes resulting from events that occur after the acquisition date, such as changes in our estimated fair value of the targets that are expected to be achieved, will be recognized in earnings in the period of the change in estimated fair value.
Additionally, when acquiring a company who has recorded deferred revenue in its historical, pre-acquisition financial statements, we are required as part of purchase accounting to re-measure the deferred revenue as of the acquisition date. Deferred revenue is re-measured to represent solely the cost that relates to the associated legal performance obligation which we assumed as part of the acquisition, plus a normal profit margin representing the level of effort or assumption of risk assumed. Legal performance obligations that simply relate to the passage of time would not result in recognized deferred revenue as there is little to no associated cost.
Recoverability of Goodwill and Other Intangible Assets
Our Policy
Goodwill and other intangible assets are significant components of our consolidated balance sheets. Our policies regarding the valuation of intangible assets affect the amount of future amortization and possible impairment charges we may incur. Assumptions and estimates about future values and remaining useful lives of our intangible and other long-lived assets are complex and subjective. They can be affected by a variety of factors, including external factors such as consumer spending habits and general economic trends, and internal factors such as changes in our business strategy and our internal forecasts.
Goodwill acquired in business combinations is assigned to the reporting unit(s) expected to benefit from the combination as of the acquisition date. In accordance with ASC Topic 350, "Intangibles—Goodwill and Other," we review the carrying value of goodwill and other intangible assets of each of our reporting units on an annual basis as of October 1, or more frequently upon the occurrence of certain events or substantive changes in circumstances. Goodwill is tested for impairment based on either a qualitative assessment or a two-step impairment test. As of December 31, 2014,2015, ILG identified
two reporting units within each of our Exchange and Rental, and Vacation Ownership operating segments as follows:
| OPERATING SEGMENTS | ||
|---|---|---|
| Exchange and Rental | Vacation Ownership | |
| Exchange reporting unit | VO management reporting unit | |
| Rental reporting unit | VO sales and financing reporting unit | |
During the year, we monitor the actual performance of our reporting units relative to the fair value assumptions used in our annual impairment test, including potential events and changes in circumstance affecting our key estimates and assumptions.
Qualitative Assessment
The qualitative assessment may be elected in any given year pursuant to ASU 2011-08, "Intangibles—Goodwill and Other (Topic 350): Testing Goodwill for Impairment" ("ASU 2011-08"). ASU 2011-08 amended the testing of goodwill for impairment. Under the revised guidance, entities testing goodwill for impairment have the option of performing a qualitative assessment before calculating the fair value of a reporting unit. If entities determine, on the basis of qualitative factors, that it is more-likely-than-not (i.e., a likelihood of more than 50 percent) that the fair value of the reporting unit is below the carrying amount, the two-step impairment test would be required. The guidance also provides the option to skip the qualitative assessment in any given year and proceed directly with the two-step impairment test at our discretion.
Two-step Impairment Test
The first step of the impairment test compares the fair value of each reporting unit with its carrying amount including goodwill. The fair value of each reporting unit is calculated using the average of an income approach and a market comparison approach which utilizes similar companies as the basis for the valuation. If the carrying amount exceeds fair value, then the second step of the impairment test is performed to measure the amount of any impairment loss. The impairment loss is determined by comparing the implied fair value of goodwill to the carrying value of goodwill. The implied fair value of goodwill represents the excess of the fair value of the reporting unit over amounts assigned to its net assets.
The determination of fair value utilizes an evaluation of historical and forecasted operating results and other estimates. Fair value measurements are generally determined through the use of valuation techniques that may include a discounted cash flow approach, which reflects our own assumptions of what market participants would use in pricing the asset or liability.
Indefinite-Lived Intangible Assets
Our intangible assets with indefinite lives relate principally to trade names, trademarks and certain resort management contracts. Pursuant to ASC 350, if an intangible asset is determined to have an indefinite useful life, it shall not be amortized until its useful life is determined to no longer be indefinite. Accordingly, we evaluate the remaining useful life of an intangible asset that is not being amortized each reporting period to determine whether events or circumstances continue to support an indefinite useful life. As of December 31, 2014,2015, there have been no changes to the indefinite life determination pertaining to these intangible assets.
In addition, an intangible asset that is not subject to amortization shall be tested for impairment annually, or more frequently if events or changes in circumstances indicate that the asset might be impaired. The impairment test consists of a comparison of the fair value of an intangible asset with its carrying amount. If the carrying amount of an indefinite-lived intangible asset exceeds its estimated fair value, an impairment loss equal to the excess is recorded. However, subsequent to July 2012, entities testing an indefinite-lived intangible asset for impairment have the option of performing a qualitative assessment before calculating the fair value of the asset. If entities determine, on the basis of qualitative factors, that the likelihood of the indefinite-lived intangible asset being impaired is below a "more-likely-than-not" threshold (i.e., a likelihood of more than 50 percent), the entity would not need to calculate the fair value of the asset.
20142015 Annual Impairment Test
As of December 31, 2014, as a result of the reorganization of our management reporting structure and reporting units (see Note 15 to our consolidated financial statements), we assessed the carrying value of goodwill pursuant to the two-step impairment approach. The first step of the impairment test concluded the carrying value of each reporting unit did not exceed its fair value; consequently, the second step of the impairment test was not necessary and goodwill was not determined to be impaired.
As of October 1, 2014, prior to the reorganization of our management reporting structure and reporting units,2015, we assessed the carrying value of goodwill and other intangible assets of each of our twofour reporting units. Goodwill assigned to Membership and Exchange, andRental, VO Management and Rental,VO Sales and Financing, our reporting units as of that date, was $483.5$495.7 million, $20.4 million, $38.3 million and $57.4$6.9 million, respectively. We performed a qualitative assessment on each of our Exchange, Rental and VO Management reporting units for the 2014our 2015 annual test and concluded that it was more-likely-than-not that the fair value of each reporting exceeded its carrying value and, therefore, a two-step impairment test was not necessary. With regards to our VO Sales and Financing reporting unit, we elected to bypass the qualitative assessment and assessed the carrying value of goodwill pursuant to the two-step impairment approach. The first step of the impairment test concluded the carrying value of this reporting unit did not exceed its fair value; consequently, the second step of the impairment test was not necessary and goodwill was not determined to be impaired.
Key Estimates and Assumptions
The determination of fair value utilizes an evaluation of historical and forecasted operating results and other key assumptions made by management, including discount rates, utilized in the valuation of certain identifiable assets. Deterioration in macroeconomic conditions or in our results of operations or unforeseen negative events could adversely affect either of our reporting units and lead to a revision of the estimates used to calculate fair value. These key estimates and forecasted operating results may or may not occur or may be revised by management which may require us to recognize impairment losses in the future.
As previously described, we performed a qualitative assessment as of our October 1, 2015 annual test date for our Exchange, Rental and VO Management reporting units. The qualitative assessment compares current performance, expectations and other indicators against what was expected as part of
the most recent Step 1 valuation. Consequently, the key estimates and assumptions related to the most recent Step 1 valuation pertaining to these reporting units have not changed since our previous annual report. With respect to our exchangeVO Sales and Financing reporting unit's step oneStep 1 analysis, the primary examples of key estimates include our discount rate and forecasted sales growth rates. As previously noted, we use the average of an income approach and a market comparison approach to calculate the fair value of our reporting units. As a measure of sensitivity on the income approach, as of the date of our last impairment test, a hypothetical 10% change in both our discount and long-term growth rates would result in a change of $300 million in the income approach fair value of the reporting unit, or approximately 29% of the excess of the fair value of the reporting unit over its carrying value. In regards to the market comparison approach, a changeused in our selected EBITDA multiple by 10% would result in a change of approximately $300 million in the Exchange and Rental reporting unit's market comparison approach fair value, or approximately 29% of the excess of the reporting unit's fair value over its carrying value.
With respect to our rental reporting unit's step one analysis, the primary examples of key estimates include forecasted available and occupied room nights, average daily rates and long-term growth rates. As a measure of sensitivity on the income approach, as of the date of our last impairment test, a hypothetical 10% change to all four forecasted key estimates would result in a change of approximately
$37 million in our income approach fair value, or approximately 30% of the excess of the fair value of the reporting unit over its carrying value. In regards to the market comparison approach, a change in our selected EBITDA multiple by 10% would result in a change of approximately $34 million in the reporting unit's market comparison approach fair value, or approximately 14% of the excess of the reporting unit's fair value over its carrying value.
With respect to our VO management reporting unit's step one analysis, the primary examples of key estimatesOctober 1, 2015 Step 1 valuation include our discount rate and forecasted growth rates. As a measure of sensitivity on the income approach, as of the date of our last impairment test, a hypothetical 10% change in both our discount and long-term growth rates would result in a change of $38 million in the income approach fair value of the reporting unit, or approximately 12% of the excess of the fair value of the reporting unit overfalling below its carrying value.value; consequently, we would have been required to perform the second step of our impairment test to measure the amount of impairment, if any. In regards to the market comparison approach, a change in our selected EBITDA multiple by 10% would result in a change of approximately $26$2 million in this reporting unit's market comparison approach fair value, or approximately 4%41% of the excess of the reporting unit's fair value over its carrying value.
Our VO sales and financing reporting unit is solely comprised of HVO's sales and financing business acquired on October 1, 2014 which was recorded on our consolidated balance sheet at fair value as of that date. Consequently, we concluded the carrying value and fair value as of October 1, 2014 (our annual impairment test date) are equivalent and approximately equivalent as of December 31, 2014 in all material respects. Furthermore, in the intervening three months subsequent to the acquisition and through year-end, we did not identify any triggering events which required an interim impairment test relative to this reporting unit.
Key estimates and assumptions for our reporting units can be impacted by certain potential events and changes in circumstances, as follows:
Events and trends in the vacation ownership, vacation rental and travel industries that could adversely affect consumers travel to and vacation in certain destinations and regions in which vacation rental and managed properties are located, including events such as:
Additionally, key estimates and assumptions for our reporting units can be impacted by certain potential events and changes in circumstances specific to each reporting unit, such as:
General
Vacation Exchange
our exchange network membership which could adversely affect our business, financial condition and results of operations
Vacation Rental
Vacation Ownership—VO Management
Vacation Ownership—VO Sales and Financing
Recoverability of Long-Lived Assets
Our Policy
We review the carrying value of all long-lived assets, primarily property and equipment and definite-lived intangible assets, for impairment whenever events or changes in circumstances indicate that the carrying value of a long-lived asset (asset group) may be impaired. In accordance with guidance included within ASC Topic 360, "Property, Plant and Equipment," recoverability of assets to be held and used is measured by a comparison of the carrying amount of an asset (asset group) to future undiscounted cash flows expected to be generated by the asset (asset group). An asset group is the lowest level of assets and liabilities for which identifiable cash flows are largely independent of the cash flows of other assets and liabilities. When estimating future cash flows, we consider:
If an asset (asset group) is considered to be impaired, the impairment to be recognized is measured by the amount by which the carrying amount of the asset (asset group) exceeds its fair value. When determining the fair value of the asset (asset group), we consider the highest and best use of the assets from a market-participant perspective. The fair value measurement is generally determined through the use of independent third party appraisals or an expected present value technique, both of
which may include a discounted cash flow approach, which reflects our own assumptions of what market participants would utilize to price the asset (asset group).
Assets to be disposed of are reported at the lower of the carrying amount or fair value less costs to sell. Assets to be abandoned, or from which no further benefit is expected, are written down to zero at the time that the determination is made and the assets are removed entirely from service.
Recoverability Test
For the years ended December 31, 20142015 and 2013,2014, we did not identify any events or changes in circumstances indicating that the carrying value of a long lived asset (or asset group) may be impaired; accordingly, a recoverability test has not been warranted.
Vacation Ownership Inventory
Inventory is composed of unsold vacation ownership intervals at our Hyatt-branded vacation ownership resorts. This inventory is carried at the lower of cost or market, based on relative sales value, less expected direct selling costs. Cost includes development, real estate, and content costs. Costs are allocated to units sold using the relative sales value method. This method calculates cost of sales as a percentage of projected gross sales using a cost-of-sales percentage, which is determined by dividing inventory cost into total estimated revenue projected for interval sales. Remaining inventory is a pool of costs that will be charged against future revenues.
It is possible that future changes in our sales strategies or project development plans could have a material effect on the carrying value of inventory. Consequently, we monitor the carrying value of our inventory on a quarterly basis to ensure the inventory is stated at the lower of cost or market through the application of an income approach method of determining fair value to compare against carrying value. Significant estimates associated with this process primarily relate to the discount rate used in the income approach method and the incremental revenue resulting from future product price increases or sales of reacquired defaulted vacation ownership mortgages receivable.
Stock-Based Compensation
Stock-based compensation is accounted for under ASC Topic 718, "Compensation—Stock Compensation" ("ASC 718"). On May 21, 2013, ILG adopted the Interval Leisure Group, Inc. 2013 Stock and Incentive Plan and stopped granting awards under the ILG 2008 Stock and Annual Incentive Plan. Both plans provide for the grant of stock options, stock appreciation rights, restricted stock, restricted stock units, and other stock-based awards. Restricted stock units ("RSUs") are awards in the form of phantom shares or units, denominated in a hypothetical equivalent number of shares of ILG common stock and with the value of each award equal to the fair value of ILG common stock at the date of grant, except for RSUs subject to relative total shareholder return performance criteria, for which the fair value is based on a Monte Carlo simulation analysis as further discussed in Note 13 accompanying our consolidated financial statements. Each RSU is subject to service-based vesting, where a specific period of continued employment must pass before an award vests. We grant awards subject to graded vesting (i.e., portions of the award vest at different times during the vesting period) or to cliff vesting (i.e. all awards vest at the end of the vesting period). In addition, certain RSUs are subject to attaining specific performance criteria.
ILG recognizes non-cash compensation expense for all RSUs held by ILG's employees and directors. For RSUs to be settled in stock, the accounting charge is measured at the grant date fair value of ILG common stock and expensed as non-cash compensation over the vesting term using the straight-line basis for service awards and the accelerated basis for performance-based awards with graded vesting. Certain cliff vesting awards with performance criteria are tied to anticipated future results of operations in determining the fair value of the award, while other cliff vesting awards with
performance criteria are tied to the achievement of relative total shareholder return criteria. This value is recognized as expense over the service period, net of estimated forfeitures, using the straight-line recognition method. The expense associated with RSU awards to be settled in cash is initially measured at fair value at the grant date and expensed ratably over the vesting term, recording a liability subject to mark-to-market adjustments for changes in the price of the respective common stock, as compensation expense.
Stock-based compensation is recorded within the same line item in our consolidated statements of income as the employee-related compensation of the award recipient, as disclosed in tabular format in Note 13 accompanying our consolidated financial statements.
The amount of stock-based compensation expense recognized in the consolidated statements of income is reduced by estimated forfeitures, as the amount recorded is based on awards ultimately expected to vest. The forfeiture rate is estimated at the grant date based on historical experience and revised, if necessary, in subsequent periods for any changes to the estimated forfeiture rate from that previously estimated. To the extent actual results or updated estimates differ from our current estimates, such amounts will be recorded as a cumulative adjustment in the period estimates are revised. For any vesting tranche of an award, the cumulative amount of compensation cost recognized is at least equal to the portion of the grant-date value of the award tranche that is actually vested at that date.
As of December 31, 2014,2015, ILG had approximately $18.8$17.2 million of unrecognized compensation cost, net of estimated forfeitures, related to all equity-based awards, which is currently expected to be recognized over a weighted average period of approximately 2.01.8 years. Of the $18.8$17.2 million of unrecognized compensation cost, 60.6%54.6% relates to an employee class group comprised of certain key employees for which we do not expect RSUs to be forfeited.forfeited for our accounting estimate. For awards in which we expect forfeitures to occur, a 10% change to our estimated forfeiture rate would have an impact of less than $50,000 to our unrecognized compensation cost as of December 31, 2014.2015.
Income Taxes
Accounting for our income taxes requires significant judgment in the evaluation of our uncertain tax positions and in the calculation of our provision for income taxes. Pursuant to ASC Topic 740 "Income Taxes" ("ASC 740"), we adopted a two-step approach to recognizing and measuring uncertain tax positions. The first step is to evaluate available evidence to determine if it appears more likely than not that an uncertain tax position will be sustained on an audit by a taxing authority, based solely on the technical merits of the tax position. The second step is to measure the tax benefit as the largest amount that is more than 50% likely of being realized upon settling the uncertain tax position.
Although we believe we have adequately reserved for our uncertain tax positions, the ultimate outcome of these tax matters may differ from our expectations. We adjust our reserves in light of changing facts and circumstances, such as the completion of a tax audit, expiration of the applicable statute of limitations, the refinement of an estimate, and interest accruals associated with uncertain tax positions until they are resolved. To the extent that the final tax outcome of these matters is different than the amounts recorded, such differences will impact the provision for income taxes in the period in which such determination is made. See Note 14 accompanying our consolidated financial statement.
Our future effective tax rates could be affected by changes in our deferred tax assets or liabilities, the valuation of our uncertain tax positions, or by changes in tax laws, regulations, accounting principles, or interpretations thereof.
Revenue
| | Year Ended December 31, | Year Ended December 31, | ||||||||||||||||||||||||||||||
|---|---|---|---|---|---|---|---|---|---|---|---|---|---|---|---|---|---|---|---|---|---|---|---|---|---|---|---|---|---|---|---|---|
| | 2014 | % Change | 2013 | % Change | 2012 | 2015 | % Change | 2014 | % Change | 2013 | ||||||||||||||||||||||
| | (Dollars in thousands) | (Dollars in thousands) | ||||||||||||||||||||||||||||||
Exchange and Rental | ||||||||||||||||||||||||||||||||
Transaction revenue | $ | 193,206 | (2.9 | )% | $ | 198,933 | 0.3 | % | $ | 198,434 | $ | 192,202 | (0.5 | )% | $ | 193,206 | (2.9 | )% | $ | 198,933 | ||||||||||||
Membership fee revenue | 127,396 | (5.8 | )% | 135,198 | 3.4 | % | 130,784 | 126,234 | (0.9 | )% | 127,396 | (5.8 | )% | 135,198 | ||||||||||||||||||
Ancillary member revenue | 6,649 | (3.0 | )% | 6,852 | (1.8 | )% | 6,976 | 5,577 | (16.1 | )% | 6,649 | (3.0 | )% | 6,852 | ||||||||||||||||||
| | | | | | | | | | | | | | | | | | | | | | | | | | | | | | | | | |
Total member revenue | 327,251 | (4.0 | )% | 340,983 | 1.4 | % | 336,194 | 324,013 | (1.0 | )% | 327,251 | (4.0 | )% | 340,983 | ||||||||||||||||||
Other revenue | 25,262 | 5.2 | % | 24,024 | 11.5 | % | 21,538 | 32,636 | 29.2 | % | 25,262 | 5.2 | % | 24,024 | ||||||||||||||||||
Rental management revenue | 48,148 | 60.7 | % | 29,956 | 10.6 | % | 27,075 | 50,384 | 4.6 | % | 48,148 | 60.7 | % | 29,956 | ||||||||||||||||||
Pass-through revenue | 82,729 | 74.4 | % | 47,426 | 7.8 | % | 43,986 | 94,311 | 14.0 | % | 82,729 | 74.4 | % | 47,426 | ||||||||||||||||||
| | | | | | | | | | | | | | | | | | | | | | | | | | | | | | | | | |
Total Exchange & Rental revenue | 483,390 | 9.3 | % | 442,389 | 3.2 | % | 428,793 | 501,344 | 3.7 | % | 483,390 | 9.3 | % | 442,389 | ||||||||||||||||||
| | | | | | | | | | | | | | | | | | | | | | | | | | | | | | | | | |
Vacation Ownership | ||||||||||||||||||||||||||||||||
Management fee revenue | 92,017 | 121.2 | % | 41,595 | 49.2 | % | 27,871 | 99,566 | 8.2 | % | 92,017 | 121.2 | % | 41,595 | ||||||||||||||||||
Sales and financing revenue | 9,478 | NM | — | NM | — | 39,041 | 311.9 | % | 9,478 | NM | — | |||||||||||||||||||||
Pass-through revenue | 29,488 | 71.1 | % | 17,231 | 3.3 | % | 16,675 | 57,485 | 94.9 | % | 29,488 | 71.1 | % | 17,231 | ||||||||||||||||||
| | | | | | | | | | | | | | | | | | | | | | | | | | | | | | | | | |
Total Vacation Ownership revenue | 130,983 | 122.7 | % | 58,826 | 32.1 | % | 44,546 | 196,092 | 49.7 | % | 130,983 | 122.7 | % | 58,826 | ||||||||||||||||||
| | | | | | | | | | | | | | | | | | | | | | | | | | | | | | | | | |
Total revenue | $ | 614,373 | 22.7 | % | $ | 501,215 | 5.9 | % | $ | 473,339 | $ | 697,436 | 13.5 | % | $ | 614,373 | 22.7 | % | $ | 501,215 | ||||||||||||
| | | | | | | | | | | | | | | | | | | | | | | | | | | | | | | | | | |
| | | | | | | | | | | | | | | | | | | | | | | | | | | | | | | | | |
2015 compared to 2014
Revenue for the year ended December 31, 2015 of $697.4 million increased $83.1 million, or 13.5%, compared to revenue of $614.4 million in 2014. Exchange and Rental segment revenue of $501.3 million increased $18.0 million, or 3.7%, and Vacation Ownership segment revenue of $196.1 million increased $65.1 million, or 49.7%, in the period compared to prior year. On a constant currency basis, ILG revenue for 2015 would have been $708.2 million, an increase of 15.3% over the prior year.
Exchange and Rental
Exchange and Rental segment revenue increased $18.0 million, or 3.7%, in 2015 compared to 2014. This increase is primarily due to incremental revenue attributable to our HRC business which drove an increase of $7.4 million in other revenue. Additionally, our rental businesses drove rental management revenue higher by $2.2 million, or 4.6%, over the prior year and pass-through revenue of $94.3 million in the year was higher by $11.6 million. These increases were partly offset by decreases of $1.2 million in membership fee revenue, $1.0 million in transaction revenue and $1.1 million in ancillary revenue. Further details on the components of this period's net increase in revenue are as follows:
Vacation Ownership
The increase of $65.1 million, or 49.7%, in segment revenue for 2015 reflects increases over the prior year of $29.6 million of incremental vacation ownership sales and financing revenue and $28.0 million in pass-through revenue, entirely related to the HVO acquisition, as well as $7.5 million in management fee revenue. The increase in management fee revenue is a result of incremental revenue from our HVO acquisition, partly offset by the foreign currency negative impact of translating the results of our European vacation ownership management businesses into U.S. dollars. This unfavorably impacted revenue by approximately $9.0 million in the current year, driven by the weakening of foreign currencies compared to the U.S. dollar. On a constant currency basis, total revenue and revenue excluding pass-through for this segment would have been $205.1 million and $147.6 million, respectively, increasing 56.6% and 45.4% over the prior year.
2014 compared to 2013
Revenue for the year ended December 31, 2014 of $614.4 million increased $113.2 million, or 22.6%, compared to revenue of $501.2 million in 2013. Exchange and Rental segment revenue of $483.4 million increased $41.0 million, or 9.3%, and Vacation Ownership segment revenue of $131.0 million increased $72.1 million, or 122.6%, in the year compared to 2013.
Exchange and Rental
Exchange and Rental segment revenue increased $41.0 million, or 9.3%, in 2014 compared to 2013. Excluding the impact of a $4.1 million correction of an immaterial prior period understatement of membership revenue recorded in the second quarter of 2013, Exchange and Rental revenue increased $45.1 million, or 10.3%, in 2014 compared to prior year. This increase of $45.1 million is primarily driven by higher rental management of $18.2 million and pass-through revenue of $35.3
$35.3 million, partially offset by lower membership fee revenue of $3.7$7.8 million, and lower transaction revenue of $5.7$0.5 million. This increase in segment revenue is primarily due to the following:
$0.6 $0.6 million settlement of a previously reserved membership fee receivable and the inclusion of HVO's club business subsequent to its October 1, 2014 acquisition. Additionally, the period was negatively affected by the shift in the percentage mix of our membership base from traditional to corporate members. This impact has been partly mitigated by continued improvement in the member base penetration of our Platinum and Club Interval products.
Vacation Ownership
The increase of $72.2 million, or 122.7%, in 2014 segment revenue reflects an increase of $50.4 million, or 121.2%, in management fee revenue, $9.5 million of incremental vacation ownership sales and financing revenue, and an increase in pass-through revenue of $12.3 million when compared to prior year. The increase in management fee revenue of $50.4 million is a result of incremental revenue from our VRI Europe acquisition in November 2013 and, to a lesser extent, incremental revenue from HVO subsequent to its October 2014 acquisition. The increase in pass-through revenue of $12.3 million, or 71.1%, in 2014 relates to our acquisition of HVO in the fourth quarter of 2014. Pass-through revenue of the Vacation Ownership segment also includes reimbursement of sales and
marketing expenses, without mark-up, pursuant to contractual arrangements. During the quarter subsequent to its acquisition, HVO contributed vacation ownership sales and financing revenue of $9.5 million.
2013 compared to 2012
Revenue for the year ended December 31, 2013 of $501.2 million increased $27.9 million, or 5.9%, compared to revenue of $473.3 million in 2012. Exchange and Rental segment revenue of $442.4 million increased $13.6 million, or 3.2%, and Vacation Ownership segment revenue of $58.8 million increased $14.3 million, or 32.1%, in the year compared to 2012.
Exchange and Rental
Exchange and Rental segment revenue increased $13.6 million, or 3.2%, in 2013 compared to 2012. Impacting year over year comparability in the segment revenue is the $4.1 million correction in 2013. Excluding the impact of this correction made in 2013, Exchange and Rental segment revenue increased $9.5 million, or 2.2% compared to 2012. This change in segment revenue is primarily driven by the following:
Vacation Ownership
Vacation ownership segment revenue increased $14.3 million, or 32.1%, in 2013 compared to 2012. This increase is primarily driven by higher management fee revenue of $13.7 million, or 49.2%, which reflects $9.2 million of incremental revenue from our VRI Europe joint venture which commenced in November 2013, coupled with $4.6 million of two additional months of VRI's results included in the 2013 period. Additionally, pass-through revenue increased $0.6 million largely as a result of two additional months of VRI included in the 2013 period.
Cost of Sales
| | Year Ended December 31, | Year Ended December 31, | ||||||||||||||||||||||||||||||
|---|---|---|---|---|---|---|---|---|---|---|---|---|---|---|---|---|---|---|---|---|---|---|---|---|---|---|---|---|---|---|---|---|
| | 2014 | % Change | 2013 | % Change | 2012 | 2015 | % Change | 2014 | % Change | 2013 | ||||||||||||||||||||||
| | (Dollars in thousands) | (Dollars in thousands) | ||||||||||||||||||||||||||||||
Exchange and Rental | ||||||||||||||||||||||||||||||||
Exchange and rental expenses | $ | 101,139 | 3.1 | % | $ | 98,136 | 1.0 | % | $ | 97,167 | $ | 100,688 | (0.4 | )% | $ | 101,139 | 3.1 | % | $ | 98,136 | ||||||||||||
Pass-through expenses | 82,729 | 74.4 | % | 47,426 | 7.8 | % | 43,986 | 94,311 | 14.0 | % | 82,729 | 74.4 | % | 47,426 | ||||||||||||||||||
| | | | | | | | | | | | | | | | | | | | | | | | | | | | | | | | | |
Total Exchange and Rental cost of sales | 183,868 | 26.3 | % | 145,562 | 3.1 | % | 141,153 | 194,999 | 6.1 | % | 183,868 | 26.3 | % | 145,562 | ||||||||||||||||||
| | | | | | | | | | | | | | | | | | | | | | | | | | | | | | | | | |
Gross margin | 62.0 | % | (7.7 | )% | 67.1 | % | (0.4 | )% | 67.1 | % | 61.1 | % | (1.4 | )% | 62.0 | % | (7.7 | )% | 67.1 | % | ||||||||||||
Gross margin without pass-through revenue/expenses | 74.8 | % | (0.5 | )% | 75.2 | % | (0.3 | )% | 74.7 | % | ||||||||||||||||||||||
Gross margin without pass-through revenue/ expenses | 75.3 | % | 0.7 | % | 74.8 | % | (0.5 | )% | 75.2 | % | ||||||||||||||||||||||
Vacation Ownership | ||||||||||||||||||||||||||||||||
Management, sales and financing expenses | 51,125 | 205.8 | % | 16,717 | 60.3 | % | 10,431 | 64,277 | 25.7 | % | 51,125 | 205.8 | % | 16,717 | ||||||||||||||||||
Pass-through expenses | 29,488 | 71.1 | % | 17,231 | 3.3 | % | 16,675 | 57,485 | 94.9 | % | 29,488 | 71.1 | % | 17,231 | ||||||||||||||||||
| | | | | | | | | | | | | | | | | | | | | | | | | | | | | | | | | |
Total Vacation Ownership cost of sales | 80,613 | 137.5 | % | 33,948 | 25.2 | % | 27,106 | 121,762 | 51.0 | % | 80,613 | 137.5 | % | 33,948 | ||||||||||||||||||
| | | | | | | | | | | | | | | | | | | | | | | | | | | | | | | | | |
Total cost of sales | $ | 264,481 | 47.3 | % | $ | 179,510 | 6.7 | % | $ | 168,259 | $ | 316,761 | 19.8 | % | $ | 264,481 | 47.3 | % | $ | 179,510 | ||||||||||||
| | | | | | | | | | | | | | | | | | | | | | | | | | | | | | | | | | |
| | | | | | | | | | | | | | | | | | | | | | | | | | | | | | | | | |
Gross margin | 38.5 | % | (9.1 | )% | 42.3 | % | (0.4 | )% | 39.2 | % | 37.9 | % | (1.4 | )% | 38.5 | % | (9.1 | )% | 42.3 | % | ||||||||||||
Gross margin without pass-through revenue/expenses | 49.6 | % | (17.0 | )% | 59.8 | % | (0.3 | )% | 62.6 | % | ||||||||||||||||||||||
Gross margin without pass-through revenue/ expenses | 53.6 | % | 8.1 | % | 49.6 | % | (17.0 | )% | 59.8 | % | ||||||||||||||||||||||
As a percentage of total revenue | 43.0 | % | 20.2 | % | 35.8 | % | 0.8 | % | 35.5 | % | 45.4 | % | 5.5 | % | 43.0 | % | 20.2 | % | 35.8 | % | ||||||||||||
As a percentage of total revenue excluding pass-through revenue | 52.7 | % | 28.1 | % | 41.1 | % | 0.9 | % | 40.8 | % | 58.1 | % | 10.2 | % | 52.7 | % | 28.1 | % | 41.1 | % | ||||||||||||
Gross margin | 57.0 | % | (11.3 | )% | 64.2 | % | (0.4 | )% | 64.5 | % | 54.6 | % | (4.2 | )% | 57.0 | % | (11.3 | )% | 64.2 | % | ||||||||||||
Gross margin without pass-through revenue/expenses | 69.7 | % | (5.4 | )% | 73.7 | % | (0.3 | )% | 73.9 | % | ||||||||||||||||||||||
Gross margin without pass-through revenue/ expenses | 69.8 | % | 0.1 | % | 69.7 | % | (5.4 | )% | 73.7 | % | ||||||||||||||||||||||
Cost of sales consists primarily of compensation and other employee-related costs (including stock-based compensation) for personnel engaged in providing services to members, property owners and/or guests of our respective segment businesses. Additionally, cost of sales includes other items such as costs necessary to operate certain of our managed properties, costs of rental inventory used primarily for Getaways included within the Exchange and Rental segment, costs associated with vacation ownership sales and related incentives, as well as recurring royalty fees related to our Hyatt-branded vacation ownership business.
2015 compared to 2014
Cost of sales for the year ended December 31, 2015 increased $52.3 million from 2014, consisting of increases of $11.1 million from our Exchange and Rental segment and $41.1 million from our Vacation Ownership segment. Overall gross margin decreased by 237 basis points to 54.6% in the period compared to last year. The decrease in overall gross margin is due to the incremental gross profit contribution from our lower-margin Vacation Ownership segment relative to total ILG gross profit.
Exchange and Rental
Gross margin for the Exchange and Rental segment in 2015 decreased 86 basis points to 61.1% when compared to the prior year. However, excluding the effect of pass-through revenue, gross margin of 75.3% in the year was higher by 51 basis points when compared to the prior year. Cost of sales for this segment rose $11.1 million, or 6.1%, from 2014 primarily resulting from $11.6 million of higher pass-through expenses at our rental management businesses and the inclusion of the HRC business. This change was partly offset by a decrease in call center costs.
Vacation Ownership
The increase of $41.1 million in cost of sales from the Vacation Ownership segment was attributable to the incremental costs of $48.9 million resulting from our HVO acquisition. Of this amount, $30.0 million represented incremental HVO pass-through expenses. This increase was partly offset by lower cost of sales at our other vacation ownership management businesses in the period largely attributable to the foreign currency impact of translating the results of our European vacation ownership management businesses into U.S. dollars at end of period. This decreased cost of sales by approximately $5.0 million in the period on a constant currency basis.
Incremental expenses related to HVO's management and vacation ownership sales and financing activities include:
Gross margin of 37.9% for this segment decreased by 55 basis points when compared to the prior year. Excluding the effect of pass-through revenue, gross margin for this segment was 53.6% in the year compared with prior year gross margin of 49.6%. Gross margin (excluding pass-throughs) for this segment was impacted by a relative decrease in certain reported expenses compared to prior year, as well as a favorable contribution from HVO.
2014 compared to 2013
Cost of sales in 2014 increased $85.0 million from 2013, consisting of increases of $38.3 million from our Exchange and Rental segment and $46.7 million from our Vacation Ownership segment. Overall gross margin, adjusted to exclude the impact of the prior period item, decreased by 696 basis points to 57.0% this year compared to 2013. The decrease in overall gross margin is due to the incremental gross profit contribution from our lower-margin Vacation Ownership segment relative to total ILG gross profit.
Exchange and Rental
Gross margin for the Exchange and Rental segment in 2014 decreased by 485 basis points to 62.0% when compared to the prior year and excluding the prior period item. Cost of sales for this
segment rose $38.3 million, or 26.3%, from 2013 resulting from the inclusion of Aqua's results subsequent to its December 2013 acquisition and HVO's club business subsequent to its October 1,
2014 acquisition. This change was partly offset by lower purchased rental inventory expense of $1.3 million, together with a decrease in call center costs and related member servicing activities. The decline in purchased rental inventory expense was principally due to lower purchased inventory volumes, partly offset by an increase in the average cost per unit of this purchased inventory. Excluding the effect of pass-through revenue, gross margin of 74.8% for this segment in 2014 was relatively flat when compared to the prior year.
Vacation Ownership
The increase of $46.7 million in cost of sales from the Vacation Ownership segment was primarily attributable to the incremental costs of $47.4 million resulting from our VRI Europe and HVO acquisitions. Of this amount, $12.3 million represented incremental HVO pass-through expenses.
Incremental expenses related to our VRI Europe vacation ownership management business are primarily comprised of compensation and other employee-related costs as well as well as costs associated with maintaining and operating the respective resorts. Incremental expenses related to HVO's management and vacation ownership sales and financing activities include:
Gross margin of 38.5% for this segment decreased by 383384 basis points when compared to the prior year. Excluding the effect of pass-through revenue, gross margin for this segment was 49.6% in the current year compared to 59.8% last year largely resulting from the incremental gross profit contribution from VRI Europe and HVO relative to total segment gross profit. VRI Europe's business model generally differs from our other management businesses with respect to the fee structure. Our other management businesses charge the association or property owner a management fee that is separate from the association/owner payments to maintain the property, while also recording pass-through revenues and expenses relating to certain reimbursed compensation and other employee-related costs directly associated with managing properties. Typically, VRI Europe charges vacation owners directly an annual fee intended to cover property management, all resort operating costs and a management profit.
2013 compared to 2012
Cost of sales for the year ended December 31, 2013 of $179.5 million increased $11.3 million from 2012, consisting of increases of $4.4 million and $6.8 million from our Exchange and Rental, and Vacation Ownership segments, respectively. Overall gross margin of 64.2% for 2013 remained relatively consistent year-over-year.
Exchange and Rental
Gross margin for the Exchange and Rental segment of 67.1% in 2013 was relatively flat when compared to the prior year. Cost of sales for this segment increased $4.4 million, or 3.1%, compared to the prior year. This increase was primarily attributable to higher pass-through expenses of $3.4 million driven in large part by our acquisition of Aqua in December 2013, an increase in purchased rental inventory expense of $0.9 million, higher compensation and other employee related costs and incremental Aqua expenses of $0.4 million. The increase in purchased rental inventory expense was due to a higher proportion of purchased inventory utilized during 2013, coupled with an increase in the average cost per unit of this purchased inventory. These items were partly offset by a drop in costs pertaining to our membership fulfillment activities when compared to prior year.
Vacation Ownership
The increase of $6.8 million in cost of sales from the Vacation Ownership segment was primarily attributable to $5.3 million of incremental expenses resulting from the inclusion of VRI Europe's results for two months, an increase of $0.6 million in segment pass-through expenses driven in large part by the additional two months of VRI's results included in the 2013 period and higher compensation and other employee related costs. Gross margin for this segment increased by 314 basis points to 42.3% in 2013 compared to 2012. Excluding the effect of pass-through revenue, gross margin for this segment decreased by 276 basis points to 59.8% during 2013 compared to the prior year.
Selling and Marketing Expense
| | Year Ended December 31, | Year Ended December 31, | ||||||||||||||||||||||||||||||
|---|---|---|---|---|---|---|---|---|---|---|---|---|---|---|---|---|---|---|---|---|---|---|---|---|---|---|---|---|---|---|---|---|
| | 2014 | % Change | 2013 | % Change | 2012 | 2015 | % Change | 2014 | % Change | 2013 | ||||||||||||||||||||||
| | (Dollars in thousands) | (Dollars in thousands) | ||||||||||||||||||||||||||||||
Exchange and Rental | $ | 58,020 | 9.3 | % | $ | 53,100 | 0.3 | % | $ | 53,120 | $ | 58,588 | 1.0 | % | $ | 58,020 | 9.3 | % | $ | 53,100 | ||||||||||||
Vacation Ownership | 3,595 | 464.6 | % | 622 | 41.7 | % | 439 | 12,449 | 246.3 | % | 3,595 | 478.0 | % | 622 | ||||||||||||||||||
| | | | | | | | | | | | | | | | | | | | | | | | | | | | | | | | | |
Total selling and marketing expense | $ | 61,615 | 14.5 | % | $ | 53,722 | 0.3 | % | $ | 53,559 | $ | 71,037 | 15.3 | % | $ | 61,615 | 14.7 | % | $ | 53,722 | ||||||||||||
| | | | | | | | | | | | | | | | | | | | | | | | | | | | | | | | | | |
| | | | | | | | | | | | | | | | | | | | | | | | | | | | | | | | | |
As a percentage of total revenue | 10.0 | % | (6.4 | )% | 10.7 | % | (5.3 | )% | 11.3 | % | 10.2 | % | 1.6 | % | 10.0 | % | (6.4 | )% | 10.7 | % | ||||||||||||
As a percentage of total revenue excluding pass-through revenue | 12.3 | % | (0.3 | )% | 12.3 | % | (6.1 | )% | 13.1 | % | 13.0 | % | 6.1 | % | 12.3 | % | (0.3 | )% | 12.3 | % | ||||||||||||
Selling and marketing expense consists primarily of advertising and promotional expenditures and compensation and other employee-related costs (including stock-based compensation) for personnel engaged in sales and sales support functions. Selling and marketing expenditures for our Exchange and Rental segment primarily include printing costs of directories and magazines, promotions, tradeshows, agency fees, marketing fees and related commissions.
Selling and marketing expenditures for our Vacation Ownership segment primarily relates to a range of marketing efforts aimed at generating prospects for our vacation ownership sales activities. These marketing efforts can include targeted promotional mailings, multi-night mini-vacation packages, telemarketing activities, premiums such as gift certificates and tickets to local attractions or events, the
cost of renting space at off-property locations, and other costs related to encouraging potential owners to attend sales presentations.
Selling and marketing expense in 2015 increased $9.4 million, or 15.3%, compared to 2014. Higher sales and marketing spend of $0.6 million in our Exchange and Rental segment is largely attributable to increased marketing fees related to developer contract renewals executed in 2014. The increase of $8.9 million in our Vacation Ownership segment principally pertains to a full year of incremental costs associated with our vacation ownership selling and marketing efforts subsequent to the acquisition of HVO.
As a percentage of total revenue and total revenue excluding pass-through revenue, sales and marketing expense increased 16 and 75 basis points, respectively, during the year compared to the prior year.
2014 compared to 2013
Selling and marketing expense in 2014 increased $7.8$7.9 million, or 14.5%14.7%, compared to 2013. Higher sales and marketing spend of $4.9 million in our Exchange and Rental segment is attributable to increased marketing fees related to developer contract renewals during the year, partly offset by lower printing and postage costs associated with a revision to the distribution timing and format of Interval Network member publications, as well as lower sales commissions as compared to the prior year. The increase of $2.9$3.0 million in our Vacation Ownership segment pertains to incremental costs associated with our vacation ownership selling and marketing efforts subsequent to the acquisition of HVO in October 2014.
As a percentage of total revenue and total revenue excluding pass-through revenue, sales and marketing expense decreased 70 and 54 basis points, respectively, during 2014 compared to the prior year.
2013 compared to 2012
Selling and marketing expense in 2013 remained relatively in line with 2012. As a percentage of total revenue and total revenue excluding pass-through revenue, sales and marketing expense decreased 60 and 67 basis points, respectively, during 2013 compared to the prior year.
General and Administrative Expense
| | Year Ended December 31, | Year Ended December 31, | ||||||||||||||||||||||||||||||
|---|---|---|---|---|---|---|---|---|---|---|---|---|---|---|---|---|---|---|---|---|---|---|---|---|---|---|---|---|---|---|---|---|
| | 2014 | % Change | 2013 | % Change | 2012 | 2015 | % Change | 2014 | % Change | 2013 | ||||||||||||||||||||||
| | (Dollars in thousands) | (Dollars in thousands) | ||||||||||||||||||||||||||||||
General and administrative expense | $ | 133,170 | 18.2 | % | $ | 112,574 | 6.9 | % | $ | 105,270 | $ | 150,091 | 12.7 | % | $ | 133,170 | 18.2 | % | $ | 112,574 | ||||||||||||
As a percentage of total revenue | 21.7 | % | (3.5 | )% | 22.5 | % | 1.0 | % | 22.2 | % | 21.5 | % | (0.7 | )% | 21.7 | % | (3.5 | )% | 22.5 | % | ||||||||||||
As a percentage of total revenue excluding pass-through revenue | 26.5 | % | 2.8 | % | 25.8 | % | 0.1 | % | 25.8 | % | 27.5 | % | 3.7 | % | 26.5 | % | 2.8 | % | 25.8 | % | ||||||||||||
General and administrative expense consists primarily of compensation and other employee-related costs (including stock-based compensation) for personnel engaged in finance, legal, tax, human resources, information technology and executive management functions, as well as facilities costs, fees for professional services and other company-wide benefits.
2015 compared to 2014
General and administrative expense in 2015 increased $16.9 million from 2014 predominately due to incremental expenses of $16.6 million from the inclusion of HVO in our results of operations for a full year. Additionally, excluding HVO, the change in general and administrative expense in the period was impacted by higher compensation and other employee-related costs of $3.4 million, as well as an increase in professional fees of $1.0 million primarily associated with Vistana acquisition related activities. This increase was partly offset by $2.2 million of lower restructuring expenses incurred in the
prior year, a favorable $1.6 million change related to our estimated accrual for the European Union value added tax matter discussed in Note 16 accompanying our consolidated financial statements, and a $0.5 million legal settlement recorded in the prior year.
The $3.4 million increase in overall compensation and other employee-related costs (excluding HVO) was primarily due to an increase of $1.4 million in non-cash compensation expense, a rise in health and welfare insurance expense of $0.7 million resulting from higher self-insured claim activity during the year, and higher salary and other employee-related costs.
As a percentage of total revenue, general and administrative expense was consistent with the prior year. As a percentage of total revenue excluding pass-through revenue, general and administrative expense was higher by 99 basis points.
2014 compared to 2013
General and administrative expense in 2014 increased $20.6 million from 2013 in large part due to incremental expenses of $9.5 million from the inclusion of our acquired businesses in our results of operations and higher professional fees of $3.8 million (excluding such incremental expenses from acquired businesses). Additionally, in the current year2014, we incurred $1.9 million of additional restructuring expenses, consisting mainly of estimated costs of exiting contractual commitments and costs associated with workforce reorganizations, an increase of $4.5 million in overall compensation and other employee related costs (excluding incremental expenses from acquired businesses), and an unfavorable year-over-year change of $0.7 million in our estimated accrual for European Union VAT, as well as certain other miscellaneous cost increases. These increases were partly offset by a favorable year-over-year change of $2.1 million related to the estimated fair value of contingent consideration for acquisitions.
The increase in overall compensation and employee-related costs, excluding incremental expenses from acquired businesses, were driven predominantly by $3.5 million of higher health and welfare insurance expense primarily resulting from an increase in self-insured claim activity during the year compared to the prior year. The $3.8 million increase in professional fees primarily related to
accounting and legal services provided largely in connection with acquisition activities, together with additional costs related to certain IT initiatives.
As a percentage of total revenue and total revenue excluding pass-through revenue, general and administrative expense decreased 80 basis points and increased 7170 basis points, respectively, during 2014 compared to the prior year.
2013 compared to 2012
General and administrative expense in 2013 increased $7.3 million from 2012, primarily due to incremental expenses of $2.8 million in the 2013 period from the inclusion of acquired businesses in our results of operations, higher professional fees of $4.9 million (excluding such incremental expenses from acquired businesses), and unfavorable year-over-year net changes of $1.2 million primarily related to the estimated fair value of contingent consideration for an acquisition, and certain other miscellaneous cost increases. These cost increases were partly offset by lower overall compensation and other employee related costs of $2.3 million, excluding incremental expenses from acquired business.
The $4.9 million increase in professional fees primarily related to accounting and legal services provided largely in connection with the VRI Europe transaction and the acquisition of Aqua, together with additional costs related to certain IT initiatives.
The $2.3 million decrease in overall compensation and other employee-related costs, excluding incremental expenses from acquired businesses, was primarily due to $2.2 million of lower health and welfare insurance expense primarily resulting from a drop in self-insured claim activity during 2013 compared to the prior year, $1.3 million of higher capitalized internal labor costs pertaining to internally developed software, and a $0.7 million decrease in non-cash compensation expense. These decreases were partly offset by higher salary and incentive related compensation.
As a percentage of total revenue and total revenue excluding pass-through revenue, general and administrative expense during 2013 increased 22 and 28 basis points, respectively, over the prior year.
Amortization Expense of Intangibles
| | Year Ended December 31, | Year Ended December 31, | ||||||||||||||||||||||||||||||
|---|---|---|---|---|---|---|---|---|---|---|---|---|---|---|---|---|---|---|---|---|---|---|---|---|---|---|---|---|---|---|---|---|
| | 2014 | % Change | 2013 | % Change | 2012 | 2015 | % Change | 2014 | % Change | 2013 | ||||||||||||||||||||||
| | (Dollars in thousands) | (Dollars in thousands) | ||||||||||||||||||||||||||||||
Amortization expense of intangibles | $ | 12,301 | 51.2 | % | $ | 8,133 | (64.7 | )% | $ | 23,041 | $ | 13,954 | 13.4 | % | $ | 12,301 | 51.2 | % | $ | 8,133 | ||||||||||||
As a percentage of total revenue | 2.0 | % | 23.4 | % | 1.6 | % | (66.7 | )% | 4.9 | % | 2.0 | % | (0.1 | )% | 2.0 | % | 23.4 | % | 1.6 | % | ||||||||||||
As a percentage of total revenue excluding pass-through revenue | 2.4 | % | 31.5 | % | 1.9 | % | (66.6 | )% | 5.6 | % | 2.6 | % | 4.4 | % | 2.4 | % | 31.5 | % | 1.9 | % | ||||||||||||
2015 compared to 2014
Amortization expense of intangibles for the year ended December 31, 2015 increased $1.7 million over 2014 due to incremental amortization expense pertaining to the HVO acquisition in October 2014.
2014 compared to 2013
Amortization expense of intangibles for 2014 increased $4.2 million over 2013 due to incremental amortization expense pertaining to intangible assets of our recently acquired businesses. See Note 4 for additional discussion of newly-acquired intangible assets.
2013 compared to 2012
Amortization expense of intangibles for 2013 decreased $14.9 million from 2012 primarily due to certain intangible assets related to the acquisition by IAC of our Interval International business in 2002 being fully amortized by the end of the third quarter of 2012, partly offset by the incremental amortization expense in 2013 pertaining to intangible assets resulting from recently acquired businesses. See Note 4 for additional discussion of newly-acquired intangible assets.
Depreciation Expense
| | Year Ended December 31, | Year Ended December 31, | ||||||||||||||||||||||||||||||
|---|---|---|---|---|---|---|---|---|---|---|---|---|---|---|---|---|---|---|---|---|---|---|---|---|---|---|---|---|---|---|---|---|
| | 2014 | % Change | 2013 | % Change | 2012 | 2015 | % Change | 2014 | % Change | 2013 | ||||||||||||||||||||||
| | (Dollars in thousands) | (Dollars in thousands) | ||||||||||||||||||||||||||||||
Depreciation expense | $ | 15,712 | 8.1 | % | $ | 14,531 | 8.2 | % | $ | 13,429 | $ | 17,449 | 11.1 | % | $ | 15,712 | 8.1 | % | $ | 14,531 | ||||||||||||
As a percentage of total revenue | 2.6 | % | (11.8 | )% | 2.9 | % | 3.6 | % | 2.8 | % | 2.5 | % | (2.2 | )% | 2.6 | % | (11.8 | )% | 2.9 | % | ||||||||||||
As a percentage of total revenue excluding pass-through revenue | 3.1 | % | (6.0 | )% | 3.3 | % | — | % | 3.3 | % | 3.2 | % | 2.2 | % | 3.1 | % | (6.0 | )% | 3.3 | % | ||||||||||||
2015 compared to 2014
Depreciation expense for the year ended December 31, 2015 increased $1.7 million over the comparable 2014 period largely due to incremental depreciation expense related to fixed assets acquired as part of the HVO acquisition, in addition to other depreciable assets, primarily software and related IT hardware, being placed in service subsequent to December 31, 2014.
2014 compared to 2013
Depreciation expense for 2014 increased $1.2 million over 2013 largely due to additional depreciable assets being placed in service subsequent to December 31, 2013, partly attributable to the inclusion of depreciable assets related to acquired businesses. These depreciable assets pertain primarily to software and related IT hardware.
2013 compared to 2012
Depreciation expense for 2013 increased $1.1 million over 2012 largely due to additional depreciable assets being placed in service subsequent to December 31, 2012. These depreciable assets pertain primarily to software and related IT hardware.
Operating Income
| | Year Ended December 31, | Year Ended December 31, | ||||||||||||||||||||||||||||||
|---|---|---|---|---|---|---|---|---|---|---|---|---|---|---|---|---|---|---|---|---|---|---|---|---|---|---|---|---|---|---|---|---|
| | 2014 | % Change | 2013 | % Change | 2012 | 2015 | % Change | 2014 | % Change | 2013 | ||||||||||||||||||||||
| | (Dollars in thousands) | (Dollars in thousands) | ||||||||||||||||||||||||||||||
Exchange and Rental | $ | 116,965 | (10.3 | )% | $ | 130,564 | 21.3 | % | $ | 107,654 | $ | 120,166 | 2.7 | % | $ | 116,965 | (10.4 | )% | $ | 130,564 | ||||||||||||
Vacation Ownership | 10,129 | 363.8 | % | 2,181 | 2.5 | % | 2,127 | 7,978 | (21.2 | )% | 10,129 | 364.4 | % | 2,181 | ||||||||||||||||||
| | | | | | | | | | | | | | | | | | | | | | | | | | | | | | | | | |
Total operating income | $ | 127,094 | (4.5 | )% | $ | 132,745 | 20.9 | % | $ | 109,781 | $ | 128,144 | 0.8 | % | $ | 127,094 | (4.3 | )% | $ | 132,745 | ||||||||||||
| | | | | | | | | | | | | | | | | | | | | | | | | | | | | | | | | | |
| | | | | | | | | | | | | | | | | | | | | | | | | | | | | | | | | |
As a percentage of total revenue | 20.7 | % | (21.9 | )% | 26.5 | % | 14.2 | % | 23.2 | % | 18.4 | % | (11.2 | )% | 20.7 | % | (21.9 | )% | 26.5 | % | ||||||||||||
As a percentage of total revenue excluding pass-through revenue | 25.3 | % | (16.8 | )% | 30.4 | % | 14.3 | % | 26.6 | % | 23.5 | % | (7.2 | )% | 25.3 | % | (16.8 | )% | 30.4 | % | ||||||||||||
2015 compared to 2014
Operating income in 2015 was relatively in-line with 2014 and consisted of a $3.2 million increase from our Exchange and Rental segment, offset in part by a $2.2 million decrease from our Vacation Ownership segment. On a constant currency basis, operating income would have been $131.8 million, up 3.7% when compared to last year.
Operating income for our Exchange and Rental segment increased $3.2 million to $120.2 million in the year compared to the prior year. The change in operating income was driven largely by the incremental contributions from our HRC business post-acquisition, together with stronger results from our rental business. These positive contributions were partly offset by higher operating expense items
such as employee related costs (including higher health and welfare insurance expense), in addition to lower Interval Network membership fee revenue.
The decrease in operating income of $2.2 million in our Vacation Ownership segment is due to $3.1 million of unfavorable foreign currency impact in the year from translating the results of our European vacation ownership management businesses into U.S. dollars. On a constant currency basis, operating income for this segment would have been $11.1 million, higher by 9.4% over prior year.
Operating income in the period for our Vacation Ownership segment also reflects incremental depreciation and amortization expense of intangibles of $1.1 million related to our HVO acquisition, as well as the unfavorable impact of a purchase accounting treatment applicable to our acquisition of HVO whereby pre-acquisition deferred revenue and any related expenses have been re-measured as of the acquisition date. As it relates to our HVO transaction, this re-measurement resulted in less income being recognized during the year than would have otherwise been recognized on a historical basis. Consequently, we did not recognize a net contribution of approximately $1.2 million and $1.3 million in operating income for the years ended 2015 and 2014, respectively, due to this purchase accounting treatment.
2014 compared to 2013
Operating income in 2014 decreased $5.5$5.7 million from 2013, consisting of a $13.4$13.6 million decrease from our Exchange and Rental segment, offset in part by a $7.9 million increase from our Vacation Ownership segment. Excluding the $3.5 million impact related to the prior period items recorded in the second quarter of 2013, operating income in 2014 decreased $2.2 million, or 1.7%.
Operating income for our Exchange and Rental segment decreased $13.6 million to $117.0 million in 2014 compared to the prior year. Excluding the prior period item, operating income for this segment decreased $10.1 million over the comparable 2013 period. The drop in operating income was driven primarily by reduced profitability resulting from securing multi-year renewals from several of our largest corporate developer clients, an increase in certain operating expense items such as health and welfare insurance costs, and higher professional fees in part related to acquisition activities.
The increase in operating income of $7.9 million in our Vacation Ownership segment is primarily due to the incremental contributions from our recently acquired businesses, partly offset by higher professional fees largely related to acquisitions and expenses related to restructuring activities.
2013 compared to 2012
Operating income in 2013 increased $23.0 million from 2012, consisting of increases of $22.9 million from our Exchange and Rental segment and $0.1 million from our Vacation Ownership segment.
Operating income for our Exchange and Rental segment increased $22.9 million to $130.6 million in 2013 compared to the prior year. The increase in operating income was driven primarily by $15.3 million of lower amortization expense of intangibles and stronger year-over-year gross profit contribution.
Operating income for our Vacation Ownership segment of $2.2 million in 2013 compared to $2.1 million in the prior year reflects incremental contributions from our VRI Europe business acquired in November of 2013 together with improved operating results at our other management businesses driven largely by stronger management fee revenue; however, these favorable factors were mostly offset by higher professional fees largely related to acquisitions and an unfavorable year-over-year net change of $0.7 million mainly related to the estimated fair value of contingent consideration for an acquisition.
Adjusted Earnings Before Interest, Taxes, Depreciation and Amortization
Adjusted earnings before interest, taxes, depreciation and amortization (adjusted EBITDA) is a non-GAAP measure and is defined in "ILG's Principles of Financial Reporting." Prior period amounts have been recast to conform to the current period definition of Adjusted EBITDA.
| | Year Ended December 31, | Year Ended December 31, | ||||||||||||||||||||||||||||||
|---|---|---|---|---|---|---|---|---|---|---|---|---|---|---|---|---|---|---|---|---|---|---|---|---|---|---|---|---|---|---|---|---|
| | 2014 | % Change | 2013 | % Change | 2012 | 2015 | % Change | 2014 | % Change | 2013 | ||||||||||||||||||||||
| | (Dollars in thousands) | (Dollars in thousands) | ||||||||||||||||||||||||||||||
Exchange and Rental | $ | 150,942 | (3.8 | )% | $ | 157,080 | 3.5 | % | $ | 151,805 | $ | 156,310 | 3.2 | % | $ | 151,508 | (3.5 | )% | $ | 157,080 | ||||||||||||
Vacation Ownership | 24,198 | 164.1 | % | 9,163 | 74.1 | % | 5,263 | 28,578 | 34.8 | % | 21,197 | 131.3 | % | 9,163 | ||||||||||||||||||
| | | | | | | | | | | | | | | | | | | | | | | | | | | | | | | | | |
Total adjusted EBITDA | $ | 175,140 | 5.5 | % | $ | 166,243 | 5.8 | % | $ | 157,068 | $ | 184,888 | 7.1 | % | $ | 172,705 | 3.9 | % | $ | 166,243 | ||||||||||||
| | | | | | | | | | | | | | | | | | | | | | | | | | | | | | | | | | |
| | | | | | | | | | | | | | | | | | | | | | | | | | | | | | | | | |
As a percentage of total revenue | 28.5 | % | (14.1 | )% | 33.2 | % | — | % | 33.2 | % | 26.5 | % | (5.7 | )% | 28.1 | % | (15.3 | )% | 33.2 | % | ||||||||||||
As a percentage of total revenue excluding pass-through revenue | 34.9 | % | (8.4 | )% | 38.1 | % | — | % | 38.1 | % | 33.9 | % | (1.5 | )% | 34.4 | % | (9.7 | )% | 38.1 | % | ||||||||||||
2015 compared to 2014
Adjusted EBITDA in 2015 increased by $12.2 million, or 7.1%, from 2014, consisting of increases of $7.4 million from our Vacation Ownership segment and $4.8 million from our Exchange and Rental segment. On a constant currency basis, adjusted EBITDA would have been $188.6 million, an increase of 9.2% over the prior year.
Adjusted EBITDA of $156.3 million from our Exchange and Rental segment increased by $4.8 million, or 3.2%, compared to the prior year. The increase in adjusted EBITDA is a result of the incremental contributions from our recently acquired HRC business, together with lower call center related costs and a favorable $1.6 million change related to our estimated accrual for the European Union value added tax. This was partly offset, among other items, by membership fee revenue compression, and higher overall compensation and other employee-related costs partly attributable to a rise in health and welfare costs resulting from higher self-insured claim activity.
Adjusted EBITDA from our Vacation Ownership segment increased by $7.4 million, or 34.8%, to $28.6 million in the year from $21.2 million last year. The growth in adjusted EBITDA in this segment reflects the incremental management and sales and financing activities from the full year inclusion of the HVO business. Of the incremental HVO contribution, we recognized a net $4.2 million increase in equity in earnings from unconsolidated entities, based on our definition of adjusted EBITDA, principally HVO's joint venture in Maui. The adjusted EBITDA increase was partly offset by approximately $3.1 million of unfavorable foreign currency impact in the period driven by the weakening of foreign currencies compared to the U.S. dollar. On a constant currency basis, adjusted EBITDA for this segment would have been $31.7 million, an increase of 49.5% over the prior year.
2014 Compared to 2013
Adjusted EBITDA in 2014 increased by $9.1$6.5 million, or 5.5%3.9%, from 2013, consisting of a $15.0$12.0 million increase from our Vacation Ownership segment, offset in part by a $6.1$5.6 million decrease from our Exchange and Rental segment.
Adjusted EBITDA of $150.9$151.5 million from our Exchange and Rental segment declined by $6.1$5.6 million, or 3.9%3.5%, compared to the prior year. The drop in adjusted EBITDA is mainly correlated with a decline in transaction revenue in the period, lower member related fees and reduced profitability resulting from securing multi-year renewals from several of our largest corporate developer clients as well as lower transaction volume overall. Transaction revenue was adversely affected in the period by the shift in percentage mix of the membership base from traditional to corporate, which reduced transaction propensity, coupled with a tightening in the availability of exchange and Getaway inventory mainly during the first quarter of 2014. Additionally, adjusted EBITDA in the period was unfavorably impacted by an increase in overall compensation and other employee-related costs partly attributable to a rise in health and welfare insurance costs resulting from higher self-insured claim activity when compared to last year. These items were partially offset by the incremental contribution from our recently acquired Aqua business, positive contributions from our E-Plus, Platinum, and Club Interval
products, cost savings related to our call center and a revision to the distribution timing and format of Interval Network member publications.
Adjusted EBITDA from our Vacation Ownership segment rose by $15.0$12.0 million, or 164.1%131.3%, to $24.2$21.2 million in 2014 from $9.2 million in the prior year. The growth in adjusted EBITDA in this segment is driven by the incremental contribution from our recently acquired businesses. Of this incremental contribution, we recognized $4.6$0.6 million in equity in earnings from unconsolidated entities, principally HVO's joint venture in Maui, Hawaii, which excludes $4.0 million of accumulated deferred revenue related to pre-construction sales that was recognized in the fourth quarter of 2014 an accumulated amount of deferred revenue related to pre-construction sales upon receipt of its temporary certificate of occupancy.
2013 Compared to 2012
Adjusted EBITDA in 2013 increased by $9.2 million, or 5.8%, from 2012, consistingTable of increases of $5.3 million from our Exchange and Rental segment and $3.9 million from our Vacation Ownership segment.
Adjusted EBITDA of $157.1 million from our Exchange and Rental segment grew by $5.3 million, or 3.5%, compared to the prior year. The improvement in adjusted EBITDA is primarily driven by revenue growth largely attributable to the positive contributions from our Platinum and Club Interval products, higher transaction revenue and other revenue related to membership programs outside of the Interval Network, as well as the incremental contribution for our recently acquired Aqua business. Additionally, adjusted EBITDA in the period benefitted from lower compensation and employee-related costs within general and administrative expense, partly offset by higher professional fees incurred for services provided in connection with the property management infrastructure at Aston.
Adjusted EBITDA from our Vacation Ownership segment rose by $3.9 million, or 74.1%, to $9.2 million in 2013 from $5.3 million in 2012. The growth in adjusted EBITDA in this segment is principally driven by the incremental contribution from our VRI Europe business acquired in November 2013 together with delivering higher gross profit on a year-over-year comparable basis.Contents
Other Income (Expense), net
| | Year Ended December 31, | Year Ended December 31, | ||||||||||||||||||||||||||||||
|---|---|---|---|---|---|---|---|---|---|---|---|---|---|---|---|---|---|---|---|---|---|---|---|---|---|---|---|---|---|---|---|---|
| | 2014 | % Change | 2013 | % Change | 2012 | 2015 | % Change | 2014 | % Change | 2013 | ||||||||||||||||||||||
| | (Dollars in thousands) | (Dollars in thousands) | ||||||||||||||||||||||||||||||
Interest income | $ | 412 | 13.8 | % | $ | 362 | (79.8 | )% | $ | 1,792 | $ | 1,118 | 171.4 | % | $ | 412 | 13.8 | % | $ | 362 | ||||||||||||
Interest expense | $ | (7,149 | ) | 15.8 | % | $ | (6,172 | ) | (75.9 | )% | $ | (25,629 | ) | $ | (21,401 | ) | 199.4 | % | $ | (7,149 | ) | 15.8 | % | $ | (6,172 | ) | ||||||
Equity in earnings from unconsolidated entities | $ | 4,630 | NM | $ | — | — | % | $ | — | $ | 4,916 | 6.2 | % | $ | 4,630 | NM | $ | — | ||||||||||||||
Other income (expense), net | $ | 2,012 | NM | $ | 259 | (110.5 | )% | $ | (2,456 | ) | ||||||||||||||||||||||
Loss on extinguishment of debt | $ | — | — | % | $ | — | 100.0 | % | $ | (18,527 | ) | |||||||||||||||||||||
Other income, net | $ | 3,558 | 76.8 | % | $ | 2,012 | NM | $ | 259 | |||||||||||||||||||||||
2015 compared to 2014
Interest income increased $0.7 million in 2015 compared to 2014 due to a loan receivable issued in the fourth quarter of 2014, as described in Note 11 to our consolidated financial statements.
Interest expense in the period relates to interest and amortization of debt costs on our amended and restated revolving credit facility and our $350 million senior notes issued in April of 2015. Higher interest expense in the year is primarily a function of our newly issued senior notes, which carry a higher interest rate than our revolving credit facility. Our senior notes were used to pay down our revolving credit facility in April 2015. Overall, we carried a higher average outstanding balance when compared to the prior year period primarily due to the funding of the HVO acquisition in the fourth quarter of 2014.
Other income net primarily relates to net gains and losses on foreign currency exchange related to cash held by foreign subsidiaries in currencies other than their functional currency. Non-operating foreign exchange net gains were $3.8 million and $2.3 million for the year ended December 31, 2015 and 2014, respectively. The favorable fluctuations during these periods were primarily driven by U.S. dollar positions held at December 31, 2015 and 2014 affected by the stronger dollar compared to the Mexican and Colombian pesos.
Equity in earnings from unconsolidated entities relates to noncontrolling investments that are recorded under the equity method of accounting; principally, our joint venture in Hawaii which developed a vacation ownership resort for the purpose of selling vacation ownership interests. Income and losses from this joint venture are allocated based on ownership interests. See Note 7 to our consolidated financial statements for further discussion.
2014 Compared to 2013
Interest income decreased $0.1 million in 2014 compared to 2013 due to certain loans receivable being outstanding and accruing interest for a portion of the first quarter of 2013 prior to settlement during that quarter.
Interest expense in 2014 relates to interest and amortization of debt costs on our amended and restated revolving credit facility. Higher interest expense in 2014 is primarily a function of a higher average balance outstanding on our revolver, particularly in the fourth quarter of 2014 in connection with funding the HVO acquisition, in addition to higher commitment fees on undrawn amounts on our revolving credit facility as a function of increasing the facility from $500 million to $600 million as part
of the April 2014 amendment. This was partly offset by lower average interest rate applicable to the period compared to prior year.
Equity in earnings from unconsolidated entities relates to noncontrolling investments that are recorded under the equity method of accounting; principally, our joint venture in Hawaii which developed a vacation ownership resort for the purpose of selling vacation ownership interests. Income and losses from this joint venture are allocated based on ownership interests. See Note 7 to our consolidated financial statements for further discussion.
Other income (expense), net primarily relates to net gains and losses on foreign currency exchange related to cash held in certain countries in currencies other than their local currency. Non-operating foreign exchange net gain was $2.3 million in 2014 compared to a net gain of $0.6 million in 2013. The favorable fluctuations during the year were primarily driven by U.S. dollar positions held at December 31, 2014 affected by the stronger dollar compared to the Mexican and Colombian pesos. The favorable fluctuations during the 2013 period were principally driven by U.S. dollar positions held at December 31, 2013 affected by the stronger dollar compared to the Colombian peso and the Egyptian pound, partly offset by the weaker dollar compared to the British pound.
2013 Compared to 2012
Interest income decreased $1.4 million in 2013 compared to 2012 primarily as a result of the repayment of certain loans receivable subsequent to August 2012.
Interest expense in 2012 primarily relates to interest and amortization of debt costs on our term loan and senior notes, which were extinguished on June 21, 2012 and September 4, 2012, respectively. Interest expense incurred from the fourth quarter of 2012 through December 31, 2013 relates to interest and amortization of debt costs on our amended and restated revolving credit facility entered into on June 21, 2012. Lower interest expense in 2013 is primarily due to lower average balance outstanding and interest rate under the revolving credit facility compared to the term loan and senior notes.
Other income (expense), net primarily relates to net gains and losses on foreign currency exchange related to cash held in certain countries in currencies other than their local currency. Non-operating foreign exchange for the year ended December 31, 2013 resulted in a net gain of $0.6 million compared to a net loss of $2.2 million in 2012. The favorable fluctuations during the 2013 period were principally driven by U.S. dollar positions held at December 31, 2013 affected by the stronger dollar compared to the Colombian peso and the Egyptian pound, partly offset by the weaker dollar compared to the British pound. The unfavorable fluctuations during 2012 were principally driven by U.S. dollar positions held at December 31, 2012 affected by the weaker dollar compared to the Mexican and Colombian pesos.
Additionally, in connection with the repayment of our term loan on June 21, 2012 and the redemption of our senior notes on September 4, 2012, we recognized a loss of $18.5 million in 2012 on the early extinguishment of this indebtedness resulting from the acceleration of related unamortized debt issuance costs and the remaining original issue discount on the senior notes. This loss is presented as a separate line item within other income (expense) in our consolidated statement of income for the year ended December 31, 2012.
Income Tax Provision
2015 compared to 2014
For the years ended December 31, 2015 and 2014, ILG recorded income tax provisions for continuing operations of $41.1 million and $45.1 million, respectively, which represent effective tax rates of 35.3% and 35.5%, respectively. These tax rates are higher than the federal statutory rate of 35% due principally to state and local income taxes partially offset by foreign income taxed at lower rates.
On November 18, 2015, the U.K. Finance (No.2) Act of 2015 was enacted, which further reduced the U.K. corporate income tax rate to 19% and 18% effective April 1, 2017 and April 1, 2020, respectively. The impact of these further rate reductions, recorded in the current reporting period, reduced our U.K. net deferred tax liability and decreased income tax expense, favorably impacting our effective tax rate. Going forward, the lower corporate tax rate will continue to decrease income tax expense and favorably impact our effective tax rate.
2014 Compared to 2013
For the years ended December 31, 2014 and 2013, ILG recorded income tax provisions for continuing operations of $45.1 million and $45.4 million, respectively, which represent effective tax rates of 35.5% and 35.7%, respectively. These tax rates are higher than the federal statutory rate of 35% due principally to state and local income taxes partially offset by foreign income taxed at lower
rates. In 2014, the effective tax rate is lower than the prior year due to the shift in the proportion of income earned and taxed between the various jurisdictions. Additionally, ILG recorded income tax benefits of $0.5 million associated with the U.S. tax consequences of certain of ILG's foreign operations and other income tax items. During 2013, the effective tax rate also decreased due to income tax benefits recorded of $3.5 million associated with state income tax items attributable to the impact of a binding technical advisement that was issued by a state taxing authority. ILG also recorded in 2013 income taxes of $0.8 million associated with the U.S. tax consequences of certain of ILG's foreign operations and other income tax items, the most significant of which related to the effect of changes in tax laws in the U.K.
During 2013, the U.K. Finance Act of 2013 was enacted, which further reduced the U.K. corporate income tax rate to 21%, effective April 1, 2014 and 20%, effective April 1, 2015. The impact of the U.K. rate reduction to 21% and 20%, which reduced our U.K. net deferred tax asset and increased income tax expense, was reflected in the reporting period when the law was enacted. The change in the corporate tax rate initially negatively impacted income tax expense as the future benefit expected to be realized from our U.K. net deferred tax assets decreased; however, going forward, the lower corporate tax rate will decrease income tax expense and favorably impact our effective tax rate.
2013 Compared to 2012
For the years ended December 31, 2013 and 2012, ILG recorded income tax provisions for continuing operations of $45.4 million and $24.3 million, respectively, which represent effective tax rates of 35.7% and 37.3%, respectively. These tax rates are higher than the federal statutory rate of 35% due principally to state and local income taxes partially offset by foreign income taxed at lower rates. In addition, during the fourth quarter of 2013, ILG recorded income tax benefits of $3.5 million associated with state income tax items attributable to the impact of a binding technical advisement that was issued by a state taxing authority, as discussed further below. ILG also recorded income taxes of $0.8 million associated with the U.S. tax consequences of certain of ILG's foreign operations and other income tax items, the most significant of which related to the effect of changes in tax laws in the U.K., as discussed further below. In 2012, ILG recorded income tax benefits of $0.9 million associated with the U.S. tax consequences of certain of ILG's foreign operations and other income tax items, the most significant of which related to the tax impact of ILG's redemption of the senior notes.
During 2012, the U.K. Finance Act of 2012 was enacted, which further reduced the U.K. corporate income tax rate to 24%, effective April 1, 2012 and 23%, effective April 1, 2013. The impact of the U.K. rate reduction to 24% and 23%, which reduced our U.K. net deferred tax asset and increased income tax expense, was reflected in the reporting period when the law was enacted. During the third quarter of 2013, the U.K. Finance Act of 2013 was enacted which further reduced the U.K. corporate income tax rate to 21%, effective April 1, 2014 and 20%, effective April 1, 2015. The impact of the U.K. rate reduction to 21% and 20% has been reflected in the 2013 reporting period. It reduced our U.K. net deferred tax asset and increased income tax expense by approximately $0.6 million. The change in the corporate tax rate initially negatively impacts income tax expense as the future benefit expected to be realized from our U.K. net deferred tax assets decreases; however, going forward, the lower corporate tax rate will decrease income tax expense and favorably impact our effective tax rate.
During the fourth quarter of 2013, we received the expected favorable binding technical advisement issued by a state taxing authority on state income tax items, which allowed us to use a more favorable apportionment methodology in that state. This advisement allowed us to decrease our unrecognized tax benefits, lower state income taxes for all prior open tax years following the spin-off from IAC, for which amended returns were filed, and reduce our U.S. net deferred tax liability, which further decreased income tax expense. State income tax benefits attributable to these items of approximately $3.5 million were recorded in the fourth quarter of 2013, all of which favorably impacted our effective tax rate. Additionally, this change in apportionment methodology lowered our current state effective tax rate, which reduced current year state income taxes and will continue to decrease income tax expense going forward and favorably impact our effective tax rate.
FINANCIAL POSITION, LIQUIDITY AND CAPITAL RESOURCES
As of December 31, 2014,2015, we had $80.5$93.1 million of cash and cash equivalents, including $59.0$76.1 million of U.S. dollar equivalent or denominated cash deposits held by foreign subsidiaries which are subject to changes in foreign exchange rates. Of this amount, $41.4$54.1 million is held in foreign jurisdictions, principally the U.K. Earnings of foreign subsidiaries, except Venezuela, are permanently reinvested. Additional tax provisions would be required should such earnings be repatriated to the U.S. Cash generated by operations is used as our primary source of liquidity. Additionally, we are also exposed to risks associated with the repatriation of cash from certain of our foreign operations to the United States where currency restrictions exist, such as Venezuela, Argentina, and Argentina,Egypt, which limit our ability to immediately access cash through repatriations. These currency restrictions had no impact on our overall liquidity during the year ended December 31, 20142015 and as of December 31, 2014, the respective cash balances were immaterial to our overall cash on hand.
We believe that our cash on hand along with our anticipated operating future cash flows and availability under our $600 million revolving credit facility, which may be increased to up to $700 million subject to certain conditions, are sufficient to fund our operating needs, quarterly cash dividend, capital expenditures, development and expansion of our operations, debt service, investments and other commitments and contingencies for at least the next twelve months. However, our operating cash flow may be impacted by macroeconomic and other factors outside of our control.
Cash Flows Discussion
Operating Activities
Net cash provided by operating activities increased to $142.7 million in 2015 from $110.7 million in 2014 which was up from $109.9 million in 2013 which was up from $80.42013. The increase of $32.1 million in 2012.2015 from 2014 was principally due to lower income taxes paid of $20.0 million, lower payments of $11.9 million made in connection with long-term agreements, and higher net cash receipts due in part to the addition of HVO, partly offset by higher interest paid of $9.3 million.
The increase of $0.8 million in 2014 from 2013 was principally due to higher net cash receipts, offset by higher payments of $13.2 million made in connection with long-term agreements, higher income taxes paid of $5.6 million, and higher interest paid of $1.2 million.
The increase of $29.4 million in 2013 from 2012 was principally due to lower interest paid of $26.0 million and higher net cash receipts, partially offset by higher income taxes paid of $17.1 million. Lower interest expense in 2013 is primarily due to lower average balance outstanding and interest rate under the revolving credit facility compared to the term loan and senior notes which were extinguished during 2012.
Investing Activities
Net cash used in investing activities of $258.3$20.6 million in 20142015 primarily related to capital expenditures of $20.3 million, mainly related to IT initiatives.
In 2014, net cash used in investing activities of $258.3 million primarily related to the HVO acquisition, net of cash acquired, of $208.5 million, capital expenditures of $19.1 million primarily related to IT initiatives, funding of a loan to CLC of $15.1 million, purchases of trading investments of $10.7 million, and contributions to one of our joint ventures totaling $4.1 million. The purchases of trading investments represent mutual fund activity directed by participants in a deferred compensation plan offered by us. The mutual funds are held in a Rabbi trust.
In 2013, net cash used in investing activities of $134.0 million primarily related to the VRI Europe and Aqua acquisitions, net of cash acquired, of $127.3 million, as well as the acquisition of certain propertyrental management contracts and other assets by our exchange and rental segment, and capital expenditures of $14.7 million primarily related to IT initiatives, all partially offset by the early repayment of an existing loan receivable totaling $9.9 million.
In 2012, net cash used in investing activities of $47.3 million primarily related to the VRI acquisition, net of cash acquired, of $40.0 million, disbursements totaling $9.5 million for investments in loans receivable, and capital expenditures of $15.0 million primarily related to IT initiatives, all partly
offset by the early repaymentsTable of existing loans receivable totaling $17.0 million. Interest on the loans receivable are due monthly or quarterly and in some instances may be paid in kind.Contents
Financing Activities
Net cash used in financing activities of $102.5 million in 2015 primarily related to net principal payments of $413.0 million on our revolving credit facility, cash dividend payments of $27.6 million as well as cash dividend payments of $3.0 million to a noncontrolling interest, payments of debt issuance costs of $6.7 million related primarily to our issuance of senior notes and also to amendments to our Amended Credit Agreement, and withholding taxes on the vesting of restricted stock units of $4.3 million. These uses of cash were partially offset by the proceeds of the issuance of senior notes of $350 million, of which net proceeds were used to repay indebtedness outstanding on our revolving credit facility, excess tax benefits from stock-based awards and the proceeds from the exercise of stock options.
Net cash provided by financing activities of $185.0 million in 2014 primarily related to net borrowings of $235.0 million on our revolving credit facility, and excess tax benefits from stock-based awards of $1.9 million, partly offset by cash dividends totaling $25.2 million, repurchases of our common stock which settled during the year at market prices totaling $14.1 million (including commissions), $7.3 million of contingent consideration payments related to acquisitions, withholding taxes on the vesting of restricted stock units of $3.9 million, and payment of $1.7 million of debt issuance costs related to the amendment of our credit facility in April 2014.
Net cash used in financing activities of $27.5 million in 2013 primarily related to principal payments of $70.0 million on our revolving credit facility, cash dividends totaling $18.9 million, and withholding taxes paid on the vesting of restricted stock units of $5.2 million. These uses of cash were partially offset by the $63.0 million drawn on our revolving credit facility in 2013, proceeds from excess tax benefits from stock-based awards and the exercise of stock options.
In 2012, net cash used in financing activities of $131.8 million was principally due to the redemption of our senior notes, principal payments of $56.0 million on the term loan, of which we paid $51.0 million from cash on-hand in June 2012 to fully extinguish the term loan, cash dividends totaling $28.4 million, payments of debt issuance costs of $3.9 million in connection with entering into our amended and restated credit agreement in June 2012, withholding taxes paid on the vesting of restricted stock units of $6.2 million and $1.1 million of the total $1.5 million contingent consideration payment related to an acquisition. These uses of cash were partially offset by proceeds of the $290.0 million drawn on our revolving credit facility to fund the redemption, proceeds from excess tax benefits from stock-based awards and the exercise of stock options.Revolving Credit Facility
In April 2014, we entered into the first amendmentamendments to our amended and restated credit agreement which increased the revolving line of credit from $500 million to $600 million, extended the maturity of the credit facility to April 2019 and provided for certain other amendments to covenants. The terms related to interest rates and commitment fees remain unchanged.
On April 10, 2015, we entered into a third amendment to the Amended Credit Agreement which changed the leverage-based financial covenant from a maximum consolidated total leverage to EBITDA ratio of 3.5 to 1.0 to a maximum consolidated secured leverage to EBITDA ratio of 3.25 to 1.0. In addition, the amendment added an incurrence test requiring a maximum consolidated total leverage to EBITDA ratio of 4.5 to 1.0 on a pro forma basis in certain circumstances in which we make acquisitions or investments, incur additional indebtedness or make restricted payments. Also, the amendment added a new pricing level to the pricing grid for when the consolidated leverage to EBITDA ratio equals or exceeds 3.5 to 1.0. This pricing level is either LIBOR plus 2.5% or the base rate plus 1.5% and requires a commitment fee on undrawn amounts of 0.4% per annum. There were no other material changes under this amendment.
Additionally, on May 5, 2015, we entered into a fourth amendment which changes the definition of change of control to remove the provision that certain changes in the composition of the board of directors would constitute a change of control and therefore be a default under the credit agreement. The amendment also includes additional clarifying language regarding provisions that relate to our 5.625% senior notes due in 2023. There were no other material changes under this amendment.
As of December 31, 2014,2015, borrowings outstanding under the revolving credit facility amounted to $488.0$75.0 million, with $103.7$516.4 million available to be drawn, net of any letters of credit.
Any principal amounts Borrowings outstanding underas of December 31, 2015 reflect the paydown of our revolving credit facility arewith proceeds from our senior notes issued in April 2015.
Senior Notes
On April 10, 2015, we completed a private offering of $350 million in aggregate principal amount of our 5.625% senior notes due at maturity.in 2023. The interest ratenet proceeds from the offering, after deducting offering related expenses, were $343.1 million. We used the proceeds to repay indebtedness outstanding on the amendedour revolving credit agreement is based on (at our election) either LIBOR plus a predetermined margin that ranges from 1.25% to 2.25%, or the Base Rate as defined in the amended credit agreement plus a predetermined margin that ranges from 0.25% to 1.25%, in each case based on the our consolidated leverage ratio.facility. As of December 31, 2014,2015, total unamortized debt issuance costs pertaining to our senior notes were $6.3 million.
Interest on the applicable margin was 1.75% per annum for LIBOR revolving loanssenior notes is paid semi-annually in arrears on April 15 and 0.75% per annum for Base Rate loans.October 15 of each year and the senior notes are fully and unconditionally guaranteed on a joint and several basis by our domestic subsidiaries that are required to guarantee the Amended Credit Facility. Additionally, the voting stock of the issuer and the subsidiary guarantors is 100% owned by ILG. The senior notes are redeemable from April 15, 2018 at a redemption price starting at 104.219% which declines over time.
Restrictions and Covenants
The senior notes and revolving credit facility has a commitment fee on undrawn amounts that ranges from 0.25% to 0.375% per annum based on our consolidated leverage ratio and as of December 31, 2014 the commitment fee was 0.275%.
The revolving credit facility hashave various financial and operating covenants that place significant restrictions on us, including our ability to incur additional indebtedness, to incur additional liens, issue redeemable stock and preferred stock, pay dividends or distributions or redeem or repurchase capital stock, prepay, redeem or repurchase debt, make loans and investments, enter into agreements that restrict distributions from our subsidiaries, sell assets and capital stock of our subsidiaries, enter into certain transactions with affiliates and consolidate or merge with or into or sell substantially all of our assets to another person.
The indenture governing the senior notes restricts our ability to issue additional debt in the event we are not in compliance with the minimum fixed charge coverage ratio of 2.0 to 1.0 and limits restricted payments and investments unless we are in compliance with the minimum fixed charge coverage ratio and the amount is within an amount that grows with our consolidated net income. We are in compliance with this covenant as of December 31, 2015. Additionally, the revolving credit facility requires us to meet certain financial covenants regarding the maintenance of a maximum consolidated leverage ratio of consolidated secured debt less credit
given for a portion of foreign cash, over consolidated Earnings Before Interest, Taxes, Depreciation and Amortization ("EBITDA"), as defined in the amended credit agreement. Currently,As of December 31, 2015, the maximum consolidated secured leverage to EBITDA ratio is 3.5x3.25x and the minimum consolidated interest coverage ratio is 3.0x. As of December 31, 2014,2015, ILG was in compliance in all material respects with the requirements of all applicable financial and operating covenants and our consolidated secured leverage ratio and consolidated interest coverage ratio under the amended credit agreement were 2.880.44 and 20.69,9.10, respectively.
Free Cash Flow
Free cash flow is a non-GAAP measure and is defined in "ILG's Principles of Financial Reporting." For the years ended December 31, 2015, 2014 2013 and 2012,2013, free cash flow was $122.4 million, $91.6 million $95.2 million and $65.4$95.2 million, respectively. The change is mainly a result of the variance in net cash provided by operating activities as discussed above.
Dividends and Share Repurchases
In 2015, our Board of Directors declared and we paid quarterly dividend payments of $0.12 per share amounting to $6.9 million each quarter. For the year ended December 31, 2015, we paid $27.6 million in cash dividends. In February May, August and November2016, our Board of Directors declared a $0.12 per share dividend payable March 16, 2016 to shareholders of record on March 7, 2016.
In 2014, our Board of Directors declared and we paid quarterly dividend payments of $0.11 per share paid in March, June, September and December 2014, respectively, ofamounting to $6.3 million each.each quarter. For the year ended December 31, 2014, we paid $25.2 million in cash dividends. In February 2015, our Board of Directors declared a $0.12 per share dividend payable March 31, 2015 to shareholders of record on March 17, 2015.
In May, August and November 2013, our Board of Directors declared quarterly dividend payments of $0.11 per share paid in June, September and December 2013, respectively, of $6.3 million each. For the year ended December 31, 2013, we paid $18.9 million in cash dividends.
Additionally, effective August 3, 2011 andEffective June 4, 2014, ILG's Board of Directors authorized a share repurchase program for up to $25.0 million and $20.0 million, respectively, excluding commissions, of our outstanding common stock. During the year ended December 31, 2014, we repurchased 0.2 million shares of common stock for $4.1 million, including commissions, under the August 2011 repurchase program and 0.5 million shares of common stock for $10.0 million, including commissions, under the June 2014 repurchase program. As of December 31, 2014, the remaining availability for future repurchases of our common stock was $10.0 million. In February 2015, ILG's Board of Directors increased the share repurchase authorization to a total of $25 million. Acquired shares of our common stock are held as treasury shares carried at cost on our consolidated financial statements. Common stock repurchases may be conducted in the open market or in privately negotiated transactions. The amount and timing of all repurchase transactions are contingent upon market conditions, applicable legal requirements and other factors. This program may be modified, suspended or terminated by us at any time without notice.
During the year ended December 31, 2014, we repurchased 0.7 million shares of common stock for $14.1 million, including commissions. As of December 31, 2015, the remaining availability for future repurchases of our common stock was $25.0 million. There were no repurchases of common stock during the year ended December 31, 2015.
Contractual Obligations and Commercial Commitments
We have funding commitments that could potentially require our performance in the event of demands by third parties or contingent events. At December 31, 2014,2015, guarantees, surety bonds and letters of credit totaled $65.3$88.7 million. The total includes a guarantee by us of up to $36.7 million of the construction loan for the Maui project. The total also includes maximum exposure under guarantees of $17.9$41.3 million, which primarily relates to the vacation rental business's hotel and resort management agreements, including those with guaranteed dollar amounts, and accommodation leases supporting the vacation rental business's management activities, entered into on behalf of the property owners for which either party generally may terminate such leases upon 60 to 90 days prior written notice to the other.
In addition, certain of the vacation rental business's hotel and resort management agreements provide that owners receive specified percentages of the revenue generated under management. In these cases, the operating expenses for the rental operations are paid from the revenue generated by the rentals, the owners are then paid their contractual percentages, and we either retain the balance (if any) as our management fee or make up the deficit. Although such deficits are reasonably possible in a few of these agreements, as of December 31, 2014,2015, future amounts are not expected to be significant, individually or in the aggregate. Certain of our vacation rental businesses also enter into agreements, as
principal, for services purchased on behalf of property owners for which they are subsequently reimbursed. As such, we are the primary obligor and may be liable for unreimbursed costs. As of December 31, 2014,2015, amounts pending reimbursements are not significant.
As of December 31, 20142015, our letters of credit totaled $8.3$8.6 million and were principally related to our Vacation Ownership sales and financing activities. More specifically, these letter of credits provide alternate assurance on amounts held in escrow which enable our developer entities to access purchaser deposits prior to closings, as well as provide a guarantee of maintenance fees owed by our developer entities during subsidy periods at a particular vacation ownership resort, among other items.
Contractual obligations and commercial commitments at December 31, 20142015 are as follows:
| | Payments Due by Period | Payments Due by Period | ||||||||||||||||||||||||||||||
|---|---|---|---|---|---|---|---|---|---|---|---|---|---|---|---|---|---|---|---|---|---|---|---|---|---|---|---|---|---|---|---|---|
Contractual Obligations | Total | Up to 1 year | 1-3 years | 3-5 years | More than 5 years | Total | Up to 1 year | 1-3 years | 3-5 years | More than 5 years | ||||||||||||||||||||||
| | (Dollars in thousands) | (Dollars in thousands) | ||||||||||||||||||||||||||||||
Debt principal(a) | $ | 488,000 | $ | — | $ | — | $ | 488,000 | $ | — | $ | 425,000 | $ | — | $ | — | $ | 75,000 | $ | 350,000 | ||||||||||||
Debt interest(a) | 42,583 | 9,970 | 19,966 | 12,647 | — | 158,138 | 23,906 | 47,790 | 40,504 | 45,938 | ||||||||||||||||||||||
Purchase obligations(b) | 80,044 | 19,609 | 31,343 | 15,092 | 14,000 | |||||||||||||||||||||||||||
Purchase obligations and other commitments(b) | 81,860 | 21,995 | 32,747 | 18,593 | 8,525 | |||||||||||||||||||||||||||
Operating leases | 60,948 | 14,308 | 22,211 | 14,596 | 9,833 | 53,551 | 12,465 | 18,681 | 12,927 | 9,478 | ||||||||||||||||||||||
| | | | | | | | | | | | | | | | | | | | | | | | | | | | | | | | | |
Total contractual obligations | $ | 671,575 | $ | 43,887 | $ | 73,520 | $ | 530,335 | $ | 23,833 | $ | 718,549 | $ | 58,366 | $ | 99,218 | $ | 147,024 | $ | 413,941 | ||||||||||||
| | | | | | | | | | | | | | | | | | | | | | | | | | | | | | | | | | |
| | | | | | | | | | | | | | | | | | | | | | | | | | | | | | | | | |
| | Amount of Commitment Expiration Per Period | Amount of Commitment Expiration Per Period | ||||||||||||||||||||||||||||||
|---|---|---|---|---|---|---|---|---|---|---|---|---|---|---|---|---|---|---|---|---|---|---|---|---|---|---|---|---|---|---|---|---|
Other Commercial Commitments(c) | Total Amounts Committed | Less than 1 year | 1-3 years | 3-5 years | More than 5 years | Total Amounts Committed | Less than 1 year | 1-3 years | 3-5 years | More than 5 years | ||||||||||||||||||||||
| | (Dollars in thousands) | (Dollars in thousands) | ||||||||||||||||||||||||||||||
Guarantees, surety bonds and letters of credit | $ | 65,315 | $ | 57,473 | $ | 6,014 | $ | 1,744 | $ | 84 | $ | 88,680 | $ | 65,122 | $ | 15,382 | $ | 8,134 | $ | 42 | ||||||||||||
| | | | | | | | | | | | | | | | | | | | | | | | | | | | | | | | | | |
| | | | | | | | | | | | | | | | | | | | | | | | | | | | | | | | | |
Off-Balance Sheet Arrangements
Except as disclosed above in our Contractual Obligations and Commercial Commitments (excluding "Debt principal"), as of December 31, 2013, we did not have any significant off-balance sheet arrangements, as defined in Item 303(a) (4) (ii) of SEC Regulation S-K.
Recent Accounting Pronouncements
Refer to Note 2 accompanying our consolidated financial statements for a description of recent accounting pronouncements.
Seasonality
Refer to Note 1 accompanying our consolidated financial statements for a discussion on the impact of seasonality.
ILG'S PRINCIPLES OF FINANCIAL REPORTING
Definition of ILG's Non-GAAP Measures
Earnings before interest, taxes, depreciation and amortization (EBITDA) is defined as net income attributable to common stockholders excluding, if applicable: (1) non-operating interest income and interest expense, (2) income taxes, (3) depreciation expense, and (4) amortization expense of intangibles.
Adjusted EBITDA is defined as EBITDA excluding without duplication, if applicable: (1) non-cash compensation expense, (2) goodwill and asset impairments, (3) acquisition related and restructuring costs, (4) other non-operating income and expense, (5) the impact of correcting a prior period items,item in fiscal year 2013, (6) the impact of the application of purchase accounting, (7) the deferral adjustment associated with percentage of completion accounting guidelines reflecting its impact on GAAP revenues and (6)expenses, and (8) other special items.
Adjusted net income is defined as net income attributable to common stockholders excluding, the impact ofwithout duplication, (1) acquisition related and restructuring costs, (2) other non-operating foreign currency remeasurements, (3) correctingcorrection of an immaterial prior period net understatement in the prior periodfiscal year 2013's financials, (4) excluding the 2012 non-cash loss on extinguishmentimpact of our indebtedness, netthe application of tax,purchase accounting, and (5) other special items.
Adjusted earnings per share (EPS) is defined as adjusted net income divided by the weighted average number of shares of common stock outstanding during the period for basic EPS and, additionally, inclusive of dilutive securities for diluted EPS.
Free cash flow is defined as cash provided by operating activities less capital expenditures.
Constant currency represents current period results of operations determined by translating our functional currency results to U.S. dollars (our reporting currency) using the actual prior year blended rate of translation from the comparable prior period. We believe that this measure improves the period to period comparability of results from business operations as it eliminates the effect of foreign currency translation.
Contract sales represents total vacation ownership interests sold at consolidated and unconsolidated projects pursuant to purchase agreements, net of actual cancellations and rescissions, where we have met a minimum threshold amounting to a 10% down payment of the contract purchase price during the period. Contract sales included herein are only since HVO's October 1, 2014 acquisition.
Our presentation of above-mentioned non-GAAP measures may not be comparable to similarly-titled measures used by other companies. We believe these measures are useful to investors because they represent the consolidated operating results from our segments, excluding the effects of any non-core expenses. We also believe these non-GAAP financial measures improve the transparency of our disclosures, provide a meaningful presentation of our results from our business operations, excluding the impact of certain items not related to our core business operations and improve the period-to-period comparability of results from business operations. These non-GAAP measures have certain limitations in that they do not take into account the impact of certain expenses to our statement of operations; such as non-cash compensation and acquisition related and restructuring costs as it relates to adjusted EBITDA. We endeavor to compensate for the limitations of the non-GAAP measures presented by also providing the comparable GAAP measure with equal or greater prominence and descriptions of the reconciling items, including quantifying such items, to derive the non-GAAP measure.
We report these non-GAAP measures as supplemental measures to results reported pursuant to GAAP. These measures are among the primary metrics by which we evaluate the performance of our businesses, on which our internal budgets are based and by which management is compensated. We
believe that investors should have access to the same set of metrics that we use in analyzing our results. These non-GAAP measures should be considered in addition to results prepared in accordance with GAAP, but should not be considered a substitute for or superior to GAAP results. We provide and encourage investors to examine the reconciling adjustments between the GAAP and non-GAAP measures which are discussed below.
Items That Are Excluded From ILG's Non-GAAP Measures (as applicable)
Amortization expense of intangibles is a non-cash expense relating primarily to acquisitions. At the time of an acquisition, the intangible assets of the acquired company, such as customer relationships, purchase agreements and resort management agreements are valued and amortized over their estimated lives. We believe that since intangibles represent costs incurred by the acquired company to build value prior to acquisition, they were part of transaction costs.
Depreciation expense is a non-cash expense relating to our property and equipment and is recorded on a straight-line basis to allocate the cost of depreciable assets to operations over their estimated service lives.
Non-cash compensation expense consists principally of expense associated with the grants of restricted stock units. These expenses are not paid in cash, and we will include the related shares in our future calculations of diluted shares of stock outstanding. Upon vesting of restricted stock units, the awards will be settled, at our discretion, on a net basis, with us remitting the required tax withholding amount from our current funds.
Goodwill and asset impairments are non-cash expenses relating to adjustments to goodwill and long-lived assets whereby the carrying value exceeds the fair value of the related assets, and are infrequent in nature.
Acquisition related and restructuring costs are transaction fees, costs incurred in connection with performing due diligence, subsequent adjustments to our initial estimate of contingent consideration obligations associated with business acquisitions, and other direct costs related to acquisition activities. Additionally, this item includes certain restructuring charges primarily related to workforce reductions, costs associated with integrating acquired businesses and estimated costs of exiting contractual commitments.
Other non-operating income and expense consists principally of foreign currency translations of cash held in certain countries in currencies, principally U.S. dollars, other than their functional currency, in addition to any gains or losses on extinguishment of debt.
Impact of the application of purchase accounting represents the difference between amounts derived from the fair value remeasurement of assets and liabilities acquired in a business combination versus the historical basis.
Other special items consist of other items that we believe are not related to our core business operations. For the year ended December 31, 2015, such item relates to the settlement of a certain legal proceeding. For the year ended December 31, 2014, such item relates to the recognition of prior period (pre-acquisition) sales at the Hyatt Vacation Ownership business's Maui joint venture upon receiving the temporary certificate of occupancy in the fourth quarter of 2014.
RECONCILIATIONS OF NON-GAAP MEASURES
The following tables reconcile EBITDA and adjusted EBITDA to operating income for our operating segments, and to net income attributable to common stockholders in total for the years ended December 31, 2015, 2014 2013 and 20122013 (in thousands). The noncontrolling interest relates primarily to the Vacation Ownership segment.
| | Year Ended December 31, 2014 | Year Ended December 31, 2015 | ||||||||||||||||||
|---|---|---|---|---|---|---|---|---|---|---|---|---|---|---|---|---|---|---|---|---|
| | Exchange and Rental | Vacation Ownership | Consolidated | Exchange and Rental | Vacation Ownership | Consolidated | ||||||||||||||
Adjusted EBITDA | $ | 150,942 | $ | 24,198 | $ | 175,140 | $ | 156,310 | $ | 28,578 | $ | 184,888 | ||||||||
Non-cash compensation expense | (9,510 | ) | (1,853 | ) | (11,363 | ) | (10,735 | ) | (2,735 | ) | (13,470 | ) | ||||||||
Other non-operating income (expense), net | 2,203 | (191 | ) | 2,012 | 3,666 | (108 | ) | 3,558 | ||||||||||||
Acquisition related and restructuring costs | (2,693 | ) | (4,365 | ) | (7,058 | ) | (963 | ) | (6,622 | ) | (7,585 | ) | ||||||||
Impact of purchase accounting | — | (1,150 | ) | (1,150 | ) | |||||||||||||||
Other special items | (129 | ) | (24 | ) | (153 | ) | ||||||||||||||
| | | | | | | | | | | | | | | | | | | | | |
EBITDA | 140,942 | 17,789 | 158,731 | 148,149 | 17,939 | 166,088 | ||||||||||||||
Amortization expense of intangibles | (7,058 | ) | (5,243 | ) | (12,301 | ) | (8,578 | ) | (5,376 | ) | (13,954 | ) | ||||||||
Depreciation expense | (14,683 | ) | (1,029 | ) | (15,712 | ) | (15,688 | ) | (1,761 | ) | (17,449 | ) | ||||||||
Less: Net income attributable to noncontrolling interests | 31 | 2,987 | 3,018 | 21 | 1,912 | 1,933 | ||||||||||||||
Equity in earnings from unconsolidated entities | (64 | ) | (4,566 | ) | (4,630 | ) | (72 | ) | (4,844 | ) | (4,916 | ) | ||||||||
Less: Other non-operating income (expense), net | (2,203 | ) | 191 | (2,012 | ) | (3,666 | ) | 108 | (3,558 | ) | ||||||||||
| | | | | | | | | | | | | | | | | | | | | |
Operating income | $ | 116,965 | $ | 10,129 | 127,094 | $ | 120,166 | $ | 7,978 | 128,144 | ||||||||||
| | | | | | | | | | | | | | | | | | | | | |
| | | | | | | | | | | | | | | | | | | | ||
Interest income | 412 | 1,118 | ||||||||||||||||||
Interest expense | (7,149 | ) | (21,401 | ) | ||||||||||||||||
Other non-operating income, net | 2,012 | 3,558 | ||||||||||||||||||
Equity in earnings from unconsolidated entities | 4,630 | 4,916 | ||||||||||||||||||
Income tax provision | (45,051 | ) | (41,087 | ) | ||||||||||||||||
| | | | | | | | | | | | | | | | | | ||||
Net income | 81,948 | 75,248 | ||||||||||||||||||
Net income attributable to noncontrolling interests | (3,018 | ) | (1,933 | ) | ||||||||||||||||
| | | | | | | | | | | | | | | | | | ||||
Net income attributable to common stockholders | $ | 78,930 | $ | 73,315 | ||||||||||||||||
| | | | | | | | | | | | | | | | | | | |||
| | | | | | | | | | | | | | | | | | ||||
| | Year Ended December 31, 2014 | |||||||||
|---|---|---|---|---|---|---|---|---|---|---|
| | Exchange and Rental | Vacation Ownership | Consolidated | |||||||
Adjusted EBITDA | $ | 151,508 | $ | 21,197 | $ | 172,705 | ||||
Non-cash compensation expense | (9,510 | ) | (1,853 | ) | (11,363 | ) | ||||
Other non-operating income (expense), net | 2,203 | (191 | ) | 2,012 | ||||||
Acquisition related and restructuring costs | (2,693 | ) | (4,365 | ) | (7,058 | ) | ||||
Impact of purchase accounting | (566 | ) | (961 | ) | (1,527 | ) | ||||
Other special items | — | 3,962 | 3,962 | |||||||
| | | | | | | | | | | |
EBITDA | 140,942 | 17,789 | 158,731 | |||||||
Amortization expense of intangibles | (7,058 | ) | (5,243 | ) | (12,301 | ) | ||||
Depreciation expense | (14,683 | ) | (1,029 | ) | (15,712 | ) | ||||
Less: Net income attributable to noncontrolling interests | 31 | 2,987 | 3,018 | |||||||
Equity in earnings from unconsolidated entities | (64 | ) | (4,566 | ) | (4,630 | ) | ||||
Less: Other non-operating income (expense), net | (2,203 | ) | 191 | (2,012 | ) | |||||
| | | | | | | | | | | |
Operating income | $ | 116,965 | $ | 10,129 | 127,094 | |||||
| | | | | | | | | | | |
| | | | | | | | | | | |
| | | | | | | | | | | |
Interest income | 412 | |||||||||
Interest expense | (7,149 | ) | ||||||||
Other non-operating income, net | 2,012 | |||||||||
Equity in earnings from unconsolidated entities | 4,630 | |||||||||
Income tax provision | (45,051 | ) | ||||||||
| | | | | | | | | | | |
Net income | 81,948 | |||||||||
Net income attributable to noncontrolling interests | (3,018 | ) | ||||||||
| | | ��� | | | | | | | | |
Net income attributable to common stockholders | $ | 78,930 | ||||||||
| | | | | | | | | | | |
| | | | | | | | | | | |
| | | | | | | | | | | |
| | Year Ended December 31, 2013 | |||||||||
|---|---|---|---|---|---|---|---|---|---|---|
| | Exchange and Rental | Vacation Ownership | Consolidated | |||||||
Adjusted EBITDA | $ | 157,080 | $ | 9,163 | $ | 166,243 | ||||
Non-cash compensation expense | (9,741 | ) | (687 | ) | (10,428 | ) | ||||
Other non-operating income (expense), net | 427 | (168 | ) | 259 | ||||||
Prior period item | 3,496 | — | 3,496 | |||||||
Acquisition related and restructuring costs | (1,011 | ) | (3,456 | ) | (4,467 | ) | ||||
| | | | | | | | | | | |
EBITDA | 150,251 | 4,852 | 155,103 | |||||||
Amortization expense of intangibles | (5,126 | ) | (3,007 | ) | (8,133 | ) | ||||
Depreciation expense | (14,134 | ) | (397 | ) | (14,531 | ) | ||||
Less: Net income attributable to noncontrolling interests | — | 565 | 565 | |||||||
Less: Other non-operating income (expense), net | (427 | ) | 168 | (259 | ) | |||||
| | | | | | | | | | | |
Operating income | $ | 130,564 | $ | 2,181 | 132,745 | |||||
| | | | | | | | | | | |
| | | | | | | | | | | |
| | | | | | | | | | | |
Interest income | 362 | |||||||||
Interest expense | (6,172 | ) | ||||||||
Other non-operating income, net | 259 | |||||||||
Income tax provision | (45,412 | ) | ||||||||
| | | | | | | | | | | |
Net income | 81,782 | |||||||||
Net income attributable to noncontrolling interests | (565 | ) | ||||||||
| | | | | | | | | | | |
Net income attributable to common stockholders | $ | 81,217 | ||||||||
| | | | | | | | | | | |
| | | | | | | | | | | |
| | | | | | | | | | | |
| | Year Ended December 31, 2012 | |||||||||
|---|---|---|---|---|---|---|---|---|---|---|
| | Exchange and Rental | Vacation Ownership | Consolidated | |||||||
Adjusted EBITDA | $ | 151,804 | $ | 5,264 | $ | 157,068 | ||||
Non-cash compensation expense | (10,393 | ) | (538 | ) | (10,931 | ) | ||||
Other non-operating expense, net | (2,303 | ) | (153 | ) | (2,456 | ) | ||||
Acquisition related and restructuring costs | (135 | ) | 242 | 107 | ||||||
Loss on extinguishment of debt | (18,527 | ) | — | (18,527 | ) | |||||
| | | | | | | | | | | |
EBITDA | 120,446 | 4,815 | 125,261 | |||||||
Amortization expense of intangibles | (20,444 | ) | (2,597 | ) | (23,041 | ) | ||||
Depreciation expense | (13,185 | ) | (244 | ) | (13,429 | ) | ||||
Less: Other non-operating expense, net | 2,303 | 153 | 2,456 | |||||||
Less: Net income attributable to noncontrolling interests | 7 | — | 7 | |||||||
Less: Loss on extinguishment of debt | 18,527 | — | 18,527 | |||||||
| | | | | | | | | | | |
Operating income | $ | 107,654 | $ | 2,127 | 109,781 | |||||
| | | | | | | | | | | |
| | | | | | | | | | | |
| | | | | | | | | | | |
Interest income | 1,792 | |||||||||
Interest expense | (25,629 | ) | ||||||||
Other non-operating expense, net | (2,456 | ) | ||||||||
Loss on extinguishment of debt | (18,527 | ) | ||||||||
Income tax provision | (24,252 | ) | ||||||||
| | | | | | | | | | | |
Net income | 40,709 | |||||||||
Net income attributable to noncontrolling interests | (7 | ) | ||||||||
| | | | | | | | | | | |
Net income attributable to common stockholders | $ | 40,702 | ||||||||
| | | | | | | | | | | |
| | | | | | | | | | | |
| | | | | | | | | | | |
The following tables reconcile EBITDA and adjusted EBITDA to operating income for our operating segments for the quarters respective to years ended December 31, 20142015 and 20132014 (in thousands).
| | Exchange and Rental | Exchange and Rental | ||||||||||||||||||||||||||||||
|---|---|---|---|---|---|---|---|---|---|---|---|---|---|---|---|---|---|---|---|---|---|---|---|---|---|---|---|---|---|---|---|---|
| | Quarter Ended | Year Ended | Quarter Ended | Year Ended | ||||||||||||||||||||||||||||
| | March 31, 2014 | June 30, 2014 | September 30, 2014 | December 31, 2014 | December 31, 2014 | March 31, 2015 | June 30, 2015 | September 30, 2015 | December 31, 2015 | December 31, 2015 | ||||||||||||||||||||||
Revenue | $ | 130,088 | $ | 116,802 | $ | 120,217 | $ | 116,283 | $ | 483,390 | $ | 135,636 | $ | 124,597 | $ | 124,888 | $ | 116,223 | $ | 501,344 | ||||||||||||
Cost of sales | 49,025 | 44,782 | 44,186 | 45,875 | 183,868 | 51,224 | 49,518 | 47,569 | 46,688 | 194,999 | ||||||||||||||||||||||
| | | | | | | | | | | | | | | | | | | | | | | | | | | | | | | | | |
Gross profit | 81,063 | 72,020 | 76.031 | 70,408 | 299,522 | 84,412 | 75,079 | 77,319 | 69,535 | 306,345 | ||||||||||||||||||||||
Selling and marketing expense | 14,.432 | 13,824 | 14,641 | 15,123 | 58,020 | 15,321 | 15,528 | 14,570 | 13,169 | 58,588 | ||||||||||||||||||||||
General and administrative expense | 24,719 | 25,540 | 25,334 | 27,203 | 102,796 | 26,075 | 25,931 | 26,284 | 25,035 | 103,325 | ||||||||||||||||||||||
Amortization expense of intangibles | 1,829 | 1,751 | 1,739 | 1,739 | 7,058 | 2,155 | 2,155 | 2,155 | 2,113 | 8,578 | ||||||||||||||||||||||
Depreciation expense | 3,611 | 3,694 | 3,587 | 3,791 | 14,683 | 3,826 | 3,896 | 3,958 | 4,008 | 15,688 | ||||||||||||||||||||||
| | | | | | | | | | | | | | | | | | | | | | | | | | | | | | | | | |
Operating income | 36,472 | 27,211 | 30,730 | 22,552 | 116,965 | 37,035 | 27,569 | 30,352 | 25,210 | 120,166 | ||||||||||||||||||||||
Amortization expense of intangibles | 1,829 | 1,751 | 1,739 | 1,739 | 7,058 | 2,155 | 2,155 | 2,155 | 2,113 | 8,578 | ||||||||||||||||||||||
Depreciation expense | 3,611 | 3,694 | 3,587 | 3,791 | 14,683 | 3,826 | 3,896 | 3,958 | 4,008 | 15,688 | ||||||||||||||||||||||
Equity in earnings of unconsolidated entities | — | — | — | 64 | 64 | 15 | 16 | 23 | 18 | 72 | ||||||||||||||||||||||
Net income attributable to noncontrolling interests | (18 | ) | — | (9 | ) | (4 | ) | (31 | ) | (9 | ) | (2 | ) | (8 | ) | (2 | ) | (21 | ) | |||||||||||||
Other non-operating income (expense), net | 17 | (279 | ) | 535 | 1,930 | 2,203 | 926 | 282 | 2,177 | 281 | 3,666 | |||||||||||||||||||||
| | | | | | | | | | | | | | | | | | | | | | | | | | | | | | | | | |
EBITDA | 41,911 | 32,377 | 36,582 | 30,072 | 140,942 | 43,948 | 33,916 | 38,657 | 31,628 | 148,149 | ||||||||||||||||||||||
Non-cash compensation expense | 2,479 | 2,261 | 2,423 | 2,347 | 9,510 | 2,748 | 2,654 | 2,660 | 2,673 | 10,735 | ||||||||||||||||||||||
Acquisition related and restructuring costs | 351 | 988 | 385 | 969 | 2,693 | 102 | 67 | 195 | 599 | 963 | ||||||||||||||||||||||
Other special items | — | 144 | — | (15 | ) | 129 | ||||||||||||||||||||||||||
Less: Other non-operating income (expense), net | (17 | ) | 279 | (535 | ) | (1,930 | ) | (2,203 | ) | (926 | ) | (282 | ) | (2,177 | ) | (281 | ) | (3,666 | ) | |||||||||||||
| | | | | | | | | | | | | | | | | | | | | | | | | | | | | | | | | |
Adjusted EBITDA | $ | 44,724 | $ | 35,905 | $ | 38,855 | $ | 31,458 | $ | 150,942 | $ | 45,872 | $ | 36,499 | $ | 39,335 | $ | 34,604 | $ | 156,310 | ||||||||||||
| | | | | | | | | | | | | | | | | | | | | | | | | | | | | | | | | | |
| | | | | | | | | | | | | | | | | | | | | | | | | | | | | | | | | |
| | Exchange and Rental | Exchange and Rental | ||||||||||||||||||||||||||||||
|---|---|---|---|---|---|---|---|---|---|---|---|---|---|---|---|---|---|---|---|---|---|---|---|---|---|---|---|---|---|---|---|---|
| | Quarter Ended | Year Ended | Quarter Ended | Year Ended | ||||||||||||||||||||||||||||
| | March 31, 2013 | June 30, 2013 | September 30, 2013 | December 31, 2013 | December 31, 2013 | March 31, 2014 | June 30, 2014 | September 30, 2014 | December 31, 2014 | December 31, 2014 | ||||||||||||||||||||||
Revenue | $ | 122,018 | $ | 112,884 | $ | 106,543 | $ | 100,944 | $ | 442,389 | $ | 130,088 | $ | 116,802 | $ | 120,217 | $ | 116,283 | $ | 483,390 | ||||||||||||
Cost of sales | 39,292 | 36,338 | 34,881 | 35,051 | 145,562 | 49,024 | 44,782 | 44,187 | 45,875 | 183,868 | ||||||||||||||||||||||
| | | | | | | | | | | | | | | | | | | | | | | | | | | | | | | | | |
Gross profit | 82,726 | 76,546 | 71,662 | 65,893 | 296,827 | 81,064 | 72,020 | 76,030 | 70,408 | 299,522 | ||||||||||||||||||||||
Selling and marketing expense | 13,609 | 14,106 | 12,794 | 12,591 | 53,100 | 14,433 | 13,824 | 14,640 | 15,123 | 58,020 | ||||||||||||||||||||||
General and administrative expense | 21,996 | 23,738 | 23,156 | 25,013 | 93,903 | 24,718 | 25,540 | 25,335 | 27,203 | 102,796 | ||||||||||||||||||||||
Amortization expense of intangibles | 1,266 | 1,266 | 1,291 | 1,303 | 5,126 | 1,829 | 1,751 | 1,739 | 1,739 | 7,058 | ||||||||||||||||||||||
Depreciation expense | 3,577 | 3,611 | 3,417 | 3,529 | 14,134 | 3,611 | 3,694 | 3,587 | 3,791 | 14,683 | ||||||||||||||||||||||
| | | | | | | | | | | | | | | | | | | | | | | | | | | | | | | | | |
Operating income | 42,278 | 33,825 | 31,004 | 23,457 | 130,564 | 36,473 | 27,211 | 30,729 | 22,552 | 116,965 | ||||||||||||||||||||||
Amortization expense of intangibles | 1,266 | 1,266 | 1,291 | 1,303 | 5,126 | 1,829 | 1,751 | 1,739 | 1,739 | 7,058 | ||||||||||||||||||||||
Depreciation expense | 3,577 | 3,611 | 3,417 | 3,529 | 14,134 | 3,611 | 3,694 | 3,587 | 3,791 | 14,683 | ||||||||||||||||||||||
Equity in earnings of unconsolidated entities | — | — | — | 64 | 64 | |||||||||||||||||||||||||||
Net income attributable to noncontrolling interests | (6 | ) | 1 | (4 | ) | 9 | — | (18 | ) | — | (9 | ) | (4 | ) | (31 | ) | ||||||||||||||||
Other non-operating income (expense), net | (348 | ) | 1,480 | (70 | ) | (635 | ) | 427 | 17 | (279 | ) | 535 | 1,930 | 2,203 | ||||||||||||||||||
| | | | | | | | | | | | | | | | | | | | | | | | | | | | | | | | | |
EBITDA | 46,767 | 40,183 | 35,638 | 27,663 | 150,251 | 41,912 | 32,377 | 36,582 | 30,072 | 140,942 | ||||||||||||||||||||||
Non-cash compensation expense | 2,414 | 2,418 | 2,440 | 2,469 | 9,741 | 2,479 | 2,261 | 2,423 | 2,347 | 9,510 | ||||||||||||||||||||||
Prior period item | — | (3,496 | ) | — | — | (3,496 | ) | |||||||||||||||||||||||||
Acquisition related and restructuring costs | 212 | (45 | ) | 389 | 452 | 1,008 | 351 | 987 | 385 | 969 | 2,693 | |||||||||||||||||||||
Impact of purchase accounting | — | — | — | 566 | 566 | |||||||||||||||||||||||||||
Less: Other non-operating income (expense), net | 348 | (1,480 | ) | 70 | 635 | (427 | ) | (17 | ) | 279 | (535 | ) | (1,930 | ) | (2,203 | ) | ||||||||||||||||
| | | | | | | | | | | | | | | | | | | | | | | | | | | | | | | | | |
Adjusted EBITDA | $ | 49,741 | $ | 37,580 | $ | 38,537 | $ | 31,219 | $ | 157,077 | $ | 44,724 | $ | 35,904 | $ | 38,854 | $ | 32,025 | $ | 151,508 | ||||||||||||
| | | | | | | | | | | | | | | | | | | | | | | | | | | | | | | | | | |
| | | | | | | | | | | | | | | | | | | | | | | | | | | | | | | | | |
| | Vacation Ownership | Vacation Ownership | ||||||||||||||||||||||||||||||
|---|---|---|---|---|---|---|---|---|---|---|---|---|---|---|---|---|---|---|---|---|---|---|---|---|---|---|---|---|---|---|---|---|
| | Quarter Ended | Year Ended | Quarter Ended | Year Ended | ||||||||||||||||||||||||||||
| | March 31, 2014 | June 30, 2014 | September 30, 2014 | December 31, 2014 | December 31, 2014 | March 31, 2015 | June 30, 2015 | September 30, 2015 | December 31, 2015 | December 31, 2015 | ||||||||||||||||||||||
Revenue | $ | 26,953 | $ | 26,726 | $ | 26,466 | $ | 50,838 | $ | 130,983 | $ | 48,916 | $ | 49,148 | $ | 49,152 | $ | 48,876 | $ | 196,092 | ||||||||||||
Cost of sales | 14,826 | 14,979 | 14,808 | 36,000 | 80,613 | 31,133 | 30,905 | 28,044 | 31,680 | 121,762 | ||||||||||||||||||||||
| | | | | | | | | | | | | | | | | | | | | | | | | | | | | | | | | |
Gross profit | 12,127 | 11,747 | 11,658 | 14,838 | 50,370 | 17,783 | 18,243 | 21,108 | 17,196 | 74,330 | ||||||||||||||||||||||
Selling and marketing expense | 136 | (15 | ) | 159 | 3,315 | 3,595 | 2,887 | 3,050 | 3,563 | 2,949 | 12,449 | |||||||||||||||||||||
General and administrative expense | 6,719 | 5,711 | 6,005 | 11,939 | 30,374 | 9,820 | 9,610 | 13,076 | 14,260 | 46,766 | ||||||||||||||||||||||
Amortization expense of intangibles | 1,137 | 1,144 | 1,140 | 1,822 | 5,243 | 1,346 | 1,359 | 1,362 | 1,309 | 5,376 | ||||||||||||||||||||||
Depreciation expense | 182 | 182 | 178 | 487 | 1,029 | 443 | 432 | 436 | 450 | 1,761 | ||||||||||||||||||||||
| | | | | | | | | | | | | | | | | | | | | | | | | | | | | | | | | |
Operating income (loss) | 3,953 | 4,725 | 4,176 | (2,725 | ) | 10,129 | 3,287 | 3,792 | 2,671 | (1,772 | ) | 7,978 | ||||||||||||||||||||
Amortization expense of intangibles | 1,137 | 1,144 | 1,140 | 1,822 | 5,243 | 1,346 | 1,359 | 1,362 | 1,309 | 5,376 | ||||||||||||||||||||||
Depreciation expense | 182 | 182 | 178 | 487 | 1,029 | 443 | 432 | 436 | 450 | 1,761 | ||||||||||||||||||||||
Equity in earnings of unconsolidated entities | — | — | — | 4,566 | 4,566 | 1,509 | 909 | 1,299 | 1,127 | 4,844 | ||||||||||||||||||||||
Net income attributable to noncontrolling interests | (961 | ) | (1,034 | ) | (800 | ) | (192 | ) | (2,987 | ) | (518 | ) | (484 | ) | (581 | ) | (329 | ) | (1,912 | ) | ||||||||||||
Other non-operating income (expense), net | (153 | ) | (1 | ) | (24 | ) | (13 | ) | (191 | ) | (5 | ) | (87 | ) | 20 | (36 | ) | (108 | ) | |||||||||||||
| | | | | | | | | | | | | | | | | | | | | | | | | | | | | | | | | |
EBITDA | 4,158 | 5,016 | 4,670 | 3,945 | 17,789 | 6,062 | 5,921 | 5,207 | 749 | 17,939 | ||||||||||||||||||||||
Non-cash compensation expense | 368 | 371 | 395 | 719 | 1,853 | 774 | 758 | 588 | 615 | 2,735 | ||||||||||||||||||||||
Acquisition related and restructuring costs | 887 | 181 | 457 | 2,840 | 4,365 | 105 | 209 | 1,404 | 4,904 | 6,622 | ||||||||||||||||||||||
Other special items | — | 27 | — | (3 | ) | 24 | ||||||||||||||||||||||||||
Impact of purchase accounting | 376 | 312 | 270 | 192 | 1,150 | |||||||||||||||||||||||||||
Less: Other non-operating income (expense), net | 153 | 1 | 24 | 13 | 191 | 5 | 87 | (20 | ) | 36 | 108 | |||||||||||||||||||||
| | | | | | | | | | | | | | | | | | | | | | | | | | | | | | | | | |
Adjusted EBITDA | $ | 5,566 | $ | 5,569 | $ | 5,546 | $ | 7,517 | $ | 24,198 | $ | 7,322 | $ | 7,314 | $ | 7,449 | $ | 6,493 | $ | 28,578 | ||||||||||||
| | | | | | | | | | | | | | | | | | | | | | | | | | | | | | | | | | |
| | | | | | | | | | | | | | | | | | | | | | | | | | | | | | | | | |
| | Vacation Ownership | Vacation Ownership | ||||||||||||||||||||||||||||||
|---|---|---|---|---|---|---|---|---|---|---|---|---|---|---|---|---|---|---|---|---|---|---|---|---|---|---|---|---|---|---|---|---|
| | Quarter Ended | Year Ended | Quarter Ended | Year Ended | ||||||||||||||||||||||||||||
| | March 31, 2013 | June 30, 2013 | September 30, 2013 | December 31, 2013 | December 31, 2013 | March 31, 2014 | June 30, 2014 | September 30, 2014 | December 31, 2014 | December 31, 2014 | ||||||||||||||||||||||
Revenue | $ | 12,863 | $ | 12,099 | $ | 12,613 | $ | 21,251 | $ | 58,826 | $ | 26,953 | $ | 26,726 | $ | 26,466 | $ | 50,838 | $ | 130,983 | ||||||||||||
Cost of sales | 7,084 | 7,083 | 7,110 | 12,671 | 33,948 | 14,826 | 14,979 | 14,808 | 36,000 | 80,613 | ||||||||||||||||||||||
| | | | | | | | | | | | | | | | | | | | | | | | | | | | | | | | | |
Gross profit | 5,779 | 5,016 | 5,503 | 8,580 | 24,878 | 12,127 | 11,747 | 11,658 | 14,838 | 50,370 | ||||||||||||||||||||||
Selling and marketing expense | 125 | 167 | 158 | 172 | 622 | 137 | (16 | ) | 159 | 3,315 | 3,595 | |||||||||||||||||||||
General and administrative expense | 4,309 | 4,488 | 4,230 | 5,644 | 18,671 | 6,719 | 5,711 | 6,005 | 11,939 | 30,374 | ||||||||||||||||||||||
Amortization expense of intangibles | 746 | 629 | 658 | 974 | 3,007 | 1,137 | 1,144 | 1,140 | 1,822 | 5,243 | ||||||||||||||||||||||
Depreciation expense | 87 | 85 | 82 | 143 | 397 | 182 | 182 | 178 | 487 | 1,029 | ||||||||||||||||||||||
| | | | | | | | | | | | | | | | | | | | | | | | | | | | | | | | | |
Operating income (loss) | 512 | (353 | ) | 375 | 1,647 | 2,181 | 3,952 | 4,726 | 4,176 | (2,725 | ) | 10,129 | ||||||||||||||||||||
Amortization expense of intangibles | 746 | 629 | 658 | 974 | 3,007 | 1,137 | 1,144 | 1,140 | 1,822 | 5,243 | ||||||||||||||||||||||
Depreciation expense | 87 | 85 | 82 | 143 | 397 | 182 | 182 | 178 | 487 | 1,029 | ||||||||||||||||||||||
Equity in earnings of unconsolidated entities | — | — | — | 4,566 | 4,566 | |||||||||||||||||||||||||||
Net income attributable to noncontrolling interests | — | — | — | (565 | ) | (565 | ) | (961 | ) | (1,034 | ) | (800 | ) | (192 | ) | (2,987 | ) | |||||||||||||||
Other non-operating income (expense), net | (171 | ) | (2 | ) | 5 | — | (168 | ) | (153 | ) | (1 | ) | (24 | ) | (13 | ) | (191 | ) | ||||||||||||||
| | | | | | | | | | | | | | | | | | | | | | | | | | | | | | | | | |
EBITDA | 1,174 | 359 | 1,120 | 2,199 | 4,852 | 4,157 | 5,017 | 4,670 | 3,945 | 17,789 | ||||||||||||||||||||||
Non-cash compensation expense | 144 | 168 | 169 | 206 | 687 | 368 | 372 | 394 | 719 | 1,853 | ||||||||||||||||||||||
Acquisition related and restructuring costs | 540 | 645 | 1,051 | 1,220 | 3,456 | 887 | 180 | 458 | 2,840 | 4,365 | ||||||||||||||||||||||
Other special items | — | — | — | (3,962 | ) | (3,962 | ) | |||||||||||||||||||||||||
Impact of purchase accounting | — | — | — | 961 | 961 | |||||||||||||||||||||||||||
Less: Other non-operating income (expense), net | 171 | 2 | (5 | ) | — | 168 | 153 | 1 | 24 | 13 | 191 | |||||||||||||||||||||
| | | | | | | | | | | | | | | | | | | | | | | | | | | | | | | | | |
Adjusted EBITDA | $ | 2,029 | $ | 1,174 | $ | 2,335 | $ | 3,625 | $ | 9,163 | $ | 5,565 | $ | 5,570 | $ | 5,546 | $ | 4,516 | $ | 21,197 | ||||||||||||
| | | | | | | | | | | | | | | | | | | | | | | | | | | | | | | | | | |
| | | | | | | | | | | | | | | | | | | | | | | | | | | | | | | | | |
The following tables present the inputs used to compute operating income and adjusted EBITDA margin for our operating segments for the years ended December 31, 2015, 2014 2013 and 20122013 (in thousands).
| | Exchange and Rental | Exchange and Rental | ||||||||||||||||||
|---|---|---|---|---|---|---|---|---|---|---|---|---|---|---|---|---|---|---|---|---|
| | Year Ended December 31, | Year Ended December 31, | ||||||||||||||||||
| | 2014 | 2013 | 2012 | 2015 | 2014 | 2013 | ||||||||||||||
Revenue | $ | 483,390 | $ | 442,389 | $ | 428,793 | $ | 501,344 | $ | 483,390 | $ | 442,389 | ||||||||
Revenue excluding pass-through revenue | 400,661 | 394,963 | 384,807 | 407,033 | 400,661 | 394,963 | ||||||||||||||
Revenue in constant currency | 503,114 | NA | NA | |||||||||||||||||
Operating income | 116,965 | 130,564 | 107,654 | 120,166 | 116,965 | 130,564 | ||||||||||||||
Operating income in constant currency | 120,670 | NA | NA | |||||||||||||||||
Adjusted EBITDA | 150,942 | 157,080 | 151,804 | 156,310 | 151,508 | 157,080 | ||||||||||||||
Adjusted EBITDA in constant currency | 156,863 | NA | NA | |||||||||||||||||
Margin computations | ||||||||||||||||||||
Operating income margin | 24.2 | % | 29.5 | % | 25.1 | % | 24.0 | % | 24.2 | % | 29.5 | % | ||||||||
Operating income margin excluding pass-through revenue | 29.2 | % | 33.1 | % | 28.0 | % | 29.5 | % | 29.2 | % | 33.1 | % | ||||||||
Adjusted EBITA margin | 31.2 | % | 35.5 | % | 35.4 | % | ||||||||||||||
Operating income margin in constant currency | 24.0 | % | NA | NA | ||||||||||||||||
Adjusted EBITDA margin | 31.2 | % | 31.3 | % | 35.5 | % | ||||||||||||||
Adjusted EBITDA margin excluding pass-through revenue | 37.7 | % | 39.8 | % | 39.4 | % | 38.4 | % | 37.8 | % | 39.8 | % | ||||||||
Adjusted EBITDA margin in constant currency | 31.2 | % | NA | NA | ||||||||||||||||
| | Vacation Ownership | Vacation Ownership | ||||||||||||||||||
|---|---|---|---|---|---|---|---|---|---|---|---|---|---|---|---|---|---|---|---|---|
| | Year Ended December 31, | Year Ended December 31, | ||||||||||||||||||
| | 2014 | 2013 | 2012 | 2015 | 2014 | 2013 | ||||||||||||||
Revenue | $ | 130,983 | $ | 58,826 | $ | 44,546 | $ | 196,092 | $ | 130,983 | $ | 58,826 | ||||||||
Revenue excluding pass-through revenue | 101,495 | 41,955 | 27,871 | 138,607 | 101,495 | 41,955 | ||||||||||||||
Revenue in constant currency | 205,099 | NA | NA | |||||||||||||||||
Operating income | 10,129 | 2,181 | 2,127 | 7,978 | 10,129 | 2,181 | ||||||||||||||
Operating income in constant currency | 11,081 | NA | NA | |||||||||||||||||
Adjusted EBITDA | 24,198 | 9,163 | 5,264 | 28,578 | 21,197 | 9,163 | ||||||||||||||
Adjusted EBITDA in constant currency | 31,683 | NA | NA | |||||||||||||||||
Margin computations | ||||||||||||||||||||
Operating income margin | 7.7 | % | 3.7 | % | 4.8 | % | 4.1 | % | 7.7 | % | 3.7 | % | ||||||||
Operating income margin excluding pass-through revenue | 10.0 | % | 5.2 | % | 7.6 | % | 5.8 | % | 10.0 | % | 5.2 | % | ||||||||
Adjusted EBITA margin | 18.5 | % | 15.6 | % | 11.8 | % | ||||||||||||||
Operating income margin in constant currency | 5.4 | % | NA | NA | ||||||||||||||||
Adjusted EBITDA margin | 14.6 | % | 16.2 | % | 15.6 | % | ||||||||||||||
Adjusted EBITDA margin excluding pass-through revenue | 23..8 | % | 21.8 | % | 18.9 | % | 20.6 | % | 20.9 | % | 22.0 | % | ||||||||
Adjusted EBITDA margin in constant currency | 15.4 | % | NA | NA | ||||||||||||||||
The following table reconciles cash provided by operating activities to free cash flow for the years ended December 31, 2015, 2014 2013 and 20122013 (in thousands).
| | Year Ended December 31, | Year Ended December 31, | ||||||||||||||||||
|---|---|---|---|---|---|---|---|---|---|---|---|---|---|---|---|---|---|---|---|---|
| | 2014 | 2013 | 2012 | 2015 | 2014 | 2013 | ||||||||||||||
Net cash provided by operating activities | $ | 110,658 | $ | 109,864 | $ | 80,438 | $ | 142,722 | $ | 110,658 | $ | 109,864 | ||||||||
Less: Capital expenditures | (19,087 | ) | (14,700 | ) | (15,040 | ) | (20,297 | ) | (19,087 | ) | (14,700 | ) | ||||||||
| | | | | | | | | | | | | | | | | | | | | |
Free cash flow | $ | 91,571 | $ | 95,164 | $ | 65,398 | $ | 122,425 | $ | 91,571 | $ | 95,164 | ||||||||
| | | | | | | | | | | | | | | | | | | | | | |
| | | | | | | | | | | | | | | | | | | | | |
The following tables reconcile net income attributable to common stockholders to adjusted net income, and to adjusted earnings per share for the years ended December 31, 2015, 2014 2013 and 20122013 (in thousands).
| | Year Ended December 31, | Year Ended December 31, | ||||||||||||||||||
|---|---|---|---|---|---|---|---|---|---|---|---|---|---|---|---|---|---|---|---|---|
| | 2014 | 2013 | 2012 | 2015 | 2014 | 2013 | ||||||||||||||
Net income attributable to common stockholders | $ | 78,930 | $ | 81,217 | $ | 40,702 | $ | 73,315 | $ | 78,930 | $ | 81,217 | ||||||||
Prior period item | — | (3,496 | ) | — | — | — | (3,496 | ) | ||||||||||||
Acquisition related and restructuring costs | 7,058 | 4,467 | (107 | ) | 7,585 | 7,058 | 4,467 | |||||||||||||
Other non-operating foreign currency remeasurements | (2,303 | ) | (589 | ) | 2,159 | (3,768 | ) | (2,303 | ) | (589 | ) | |||||||||
Loss on extinguishment of debt | — | — | 18,527 | |||||||||||||||||
Impact of purchase accounting | 1,150 | 1,527 | — | |||||||||||||||||
Other special items | 153 | (3,962 | ) | — | ||||||||||||||||
Income tax impact on adjusting items(1) | (1,852 | ) | (132 | ) | (8,075 | ) | (2,016 | ) | (904 | ) | (132 | ) | ||||||||
| | | | | | | | | | | | | | | | | | | | | |
Adjusted net income | $ | 81,833 | $ | 81,467 | $ | 53,206 | $ | 76,419 | $ | 80,346 | $ | 81,467 | ||||||||
| | | | | | | | | | | | | | | | | | | | | | |
| | | | | | | | | | | | | | | | | | | | | |
Earnings per share attributable to common stockholders: | ||||||||||||||||||||
Basic | $ | 1.38 | $ | 1.42 | $ | 0.72 | $ | 1.28 | $ | 1.38 | $ | 1.42 | ||||||||
Diluted | $ | 1.36 | $ | 1.40 | $ | 0.71 | $ | 1.26 | $ | 1.36 | $ | 1.40 | ||||||||
Adjusted earnings per share: | ||||||||||||||||||||
Basic | $ | 1.43 | $ | 1.42 | $ | 0.94 | $ | 1.33 | $ | 1.40 | $ | 1.42 | ||||||||
Diluted | $ | 1.41 | $ | 1.41 | $ | 0.93 | $ | 1.32 | $ | 1.39 | $ | 1.41 | ||||||||
Weighted average number of common stock outstanding: | ||||||||||||||||||||
Basic | 57,343 | 57,243 | 56,549 | 57,400 | 57,343 | 57,243 | ||||||||||||||
Diluted | 57,943 | 57,832 | 57,248 | 57,989 | 57,953 | 57,832 | ||||||||||||||
| | Year Ended December 31, | Year Ended December 31, | ||||||||||||||||||||||||||||||||||||
|---|---|---|---|---|---|---|---|---|---|---|---|---|---|---|---|---|---|---|---|---|---|---|---|---|---|---|---|---|---|---|---|---|---|---|---|---|---|---|
| | 2014 | 2013 | 2012 | 2015 | 2014 | 2013 | ||||||||||||||||||||||||||||||||
| | Basic | Diluted | Basic | Diluted | Basic | Diluted | Basic | Diluted | Basic | Diluted | Basic | Diluted | ||||||||||||||||||||||||||
Earnings per share | $ | 1.38 | $ | 1.36 | $ | 1.42 | $ | 1.40 | $ | 0.72 | $ | 0.71 | $ | 1.28 | $ | 1.26 | $ | 1.38 | $ | 1.36 | $ | 1.42 | $ | 1.40 | ||||||||||||||
Prior period item | — | — | (0.06 | ) | (0.06 | ) | — | — | — | — | — | — | (0.06 | ) | (0.06 | ) | ||||||||||||||||||||||
Acquisition related and restructuring costs | 0.12 | 0.12 | 0.08 | 0.08 | (0.01 | ) | (0.00 | ) | 0.13 | 0.13 | 0.12 | 0.12 | 0.08 | 0.08 | ||||||||||||||||||||||||
Other non-operating foreign currency remeasurements | (0.04 | ) | (0.04 | ) | (0.01 | ) | (0.01 | ) | 0.04 | 0.04 | (0.07 | ) | (0.06 | ) | (0.04 | ) | (0.04 | ) | (0.01 | ) | (0.01 | ) | ||||||||||||||||
Loss on extinguishment of debt | — | — | — | — | 0.33 | 0.32 | ||||||||||||||||||||||||||||||||
Impact of purchase accounting | 0.02 | 0.02 | 0.03 | 0.03 | — | — | ||||||||||||||||||||||||||||||||
Other special items | — | — | (0.07 | ) | (0.07 | ) | ||||||||||||||||||||||||||||||||
Income tax impact of adjusting items(1) | (0.03 | ) | (0.03 | ) | (0.01 | ) | (0.00 | ) | (0.14 | ) | (0.14 | ) | (0.03 | ) | (0.03 | ) | (0.02 | ) | (0.01 | ) | (0.01 | ) | (0.00 | ) | ||||||||||||||
| | | | | | | | | | | | | | | | | | | | | | | | | | | | | | | | | | | | | | | |
Adjusted earnings per share | $ | 1.43 | $ | 1.41 | $ | 1.42 | $ | 1.41 | $ | 0.94 | $ | 0.93 | $ | 1.33 | $ | 1.32 | $ | 1.40 | $ | 1.39 | $ | 1.42 | $ | 1.41 | ||||||||||||||
| | | | | | | | | | | | | | | | | | | | | | | | | | | | | | | | | | | | | | | | |
| | | | | | | | | | | | | | | | | | | | | | | | | | | | | | | | | | | | | | | |
Item 7A. Quantitative and Qualitative Disclosures about Market Risk
Foreign Currency Exchange Risk
We conduct business in certain foreign markets, primarily in the United Kingdom and other European Union markets. Our foreign currency risk primarily relates to our investments in foreign subsidiaries that transact business in a functional currency other than the U.S. dollar. This exposure is mitigated as we have generally reinvested profits in our international operations. As currency exchange rates change, translation of the income statements of our international businesses into U.S. dollars affects year-over-year comparability of operating results.
In addition, we are exposed to foreign currency risk related to transactions and/or assets and liabilities denominated in a currency other than the functional currency. Historically, we have not hedged currency risks. However, our foreign currency exposure related to EU VAT liabilities denominated in euros is offset by euro denominated cash balances.
Furthermore, in an effort to mitigate economic risk, we hold U.S. dollars in certain subsidiaries that have a functional currency other than the U.S. dollar.
Operating foreign currency exchange for the years ended December 31, 2015, 2014 2013 and 20122013 resulted in net gains of $0.2 and $0.4 million for the yearyears ended December 31, 21042015 and 2014 and in net losses of $0.1 million for each of the yearsyear ended December 31, 2013, and 2012, attributable to foreign currency remeasurements of operating assets and liabilities denominated in a currency other than their functional currency.
Non- operatingNon-operating foreign currency exchange included a net gain of $3.8 million, $2.3 million and $0.6 million for the years ended December 31, 2015, 2014 and 2013, respectively, and a net loss of $2.2 million for the year ended December 31, 2012, attributable to cash held in certain countries in currencies other than their functional currency. The favorable fluctuationfluctuations for the yearyears ended December 31, 2015 and 2014 waswere principally driven by U.S. dollar positions held at December 31, 2015 and 2014 affected by the stronger dollar compared to the Mexican peso and the Colombian peso. The favorable fluctuation for the year ended December 31, 2013 was principally driven by U.S. dollar positions held at December 31, 2013 affected by the stronger dollar compared to the ColombianColumbian peso and the Egyptian pound, partly offset by the weaker dollar compared to the British pound. The unfavorable fluctuation for the year ended December 31, 2012 was principally driven by U.S. dollar positions held at December 31, 2012 affected by the weaker dollar compared to the Mexican peso and Colombian peso.
Our operations in international markets are exposed to potentially volatile movements in currency exchange rates. The economic impact of currency exchange rate movements on us is often linked to variability in real growth, inflation, interest rates, governmental actions and other factors. These changes, if material, could cause us to adjust our financing, operating and hedging strategies. A hypothetical 10% weakening/strengthening in foreign exchange rates to the U.S. dollar for the year ended December 31, 20142015 would result in an approximate change to revenue of $7.4$6.8 million. There have been no material quantitative changes in market risk exposures since December 31, 2012.2014.
Interest Rate Risk
We are exposed to interest rate risk through borrowings under our April 2014 amended credit agreement which bears interest at variable rates. The interest rate on the amended credit agreement as of April 2015 is based on (at our election) either LIBOR plus a predetermined margin that ranges from 1.25% to 2.25%2.50%, or the Base Rate as defined in the amended credit agreement plus a predetermined margin that ranges from 0.25% to 1.25%1.50%, in each case based on ILG's leverage ratio. As of December 31, 2014,2015, the applicable margin was 1.75%2.25% per annum for LIBOR revolving loans and 0.75%1.25% per annum for Base Rate loans. During 2014,2015, we had at least $248$70 million outstanding under our revolving credit facility; a 100 basis point change in interest rates would result in an approximate change to interest expense of $3.2$1.9 million for the current year. While we currently do not hedge our interest rate exposure, this risk is somewhat mitigated by the issuance of $350 million senior notes in April 2015 at a fixed rate of 5.625% as well as variable interest rates earned on our cash balances. The proceeds of the senior notes were used to pay down the revolving credit facility in April 2015.
Item 8. Financial Statements and Supplementary Data
INTERVAL LEISURE GROUP, INC. AND SUBSIDIARIES
CONSOLIDATED FINANCIAL STATEMENTS
TABLE OF CONTENTS
| | PAGE | |||
|---|---|---|---|---|
Audited Consolidated Financial Statements: | ||||
Report of Independent Registered Public Accounting Firm | ||||
Consolidated Statements of Income for the years ended December 31, 2015, 2014 | ||||
Consolidated Statements of Comprehensive Income for the years ended December 31, 2015, 2014 | ||||
Consolidated Balance Sheets as of December 31, | ||||
Consolidated Statements of Stockholders' Equity for the years ended December 31, 2015, 2014 | ||||
Consolidated Statements of Cash Flows for the years ended December 31, 2015, 2014 | ||||
Notes to Consolidated Financial Statements | ||||
Schedule II—Valuation and Qualifying Accounts | ||||
Report of Independent Registered Public Accounting Firm
The Board of Directors and Stockholders of Interval Leisure Group, Inc. and subsidiaries
We have audited the accompanying consolidated balance sheets of Interval Leisure Group, Inc. and subsidiaries as of December 31, 20142015 and 2013,2014, and the related consolidated statements of income, comprehensive income, stockholders' equity, and cash flows for each of the three years in the period ended December 31, 2014.2015. Our audits also included the financial statement schedule listed in the Index at Item 15(a). These financial statements and schedule are the responsibility of the Company's management. Our responsibility is to express an opinion on these financial statements and schedule based on our audits.
We conducted our audits in accordance with the standards of the Public Company Accounting Oversight Board (United States). Those standards require that we plan and perform the audit to obtain reasonable assurance about whether the financial statements are free of material misstatement. An audit includes examining, on a test basis, evidence supporting the amounts and disclosures in the financial statements. An audit also includes assessing the accounting principles used and significant estimates made by management, as well as evaluating the overall financial statement presentation. We believe that our audits provide a reasonable basis for our opinion.
In our opinion, the financial statements referred to above present fairly, in all material respects, the consolidated financial position of Interval Leisure Group, Inc. and subsidiaries at December 31, 20142015 and 2013,2014, and the consolidated results of their operations and their cash flows for each of the three years in the period ended December 31, 2014,2015, in conformity with U.S. generally accepted accounting principles. Also, in our opinion, the related financial statement schedule, when considered in relation to the basic consolidated financial statements taken as a whole, presents fairly in all material respects the information set forth therein.
We have also audited, in accordance with the standards of the Public Company Accounting Oversight Board (United States), Interval Leisure Group, Inc. and subsidiaries' internal control over financial reporting as of December 31, 2014,2015, based on criteria established in Internal Control—Integrated Framework issued by the Committee of Sponsoring Organizations of the Treadway Commission (2013 framework) and our report dated February 27, 201526, 2016 expressed an unqualified opinion thereon.
/s/ ERNST & YOUNG LLP Certified Public Accountants |
Miami, Florida
February 27, 201526, 2016
INTERVAL LEISURE GROUP, INC. AND SUBSIDIARIES
CONSOLIDATED STATEMENTS OF INCOME
(In thousands, except per share data)
| | Year Ended December 31, | Year Ended December 31, | ||||||||||||||||||
|---|---|---|---|---|---|---|---|---|---|---|---|---|---|---|---|---|---|---|---|---|
| | 2014 | 2013 | 2012 | 2015 | 2014 | 2013 | ||||||||||||||
Revenue | $ | 614,373 | $ | 501,215 | $ | 473,339 | $ | 697,436 | $ | 614,373 | $ | 501,215 | ||||||||
Cost of sales (exclusive of depreciation and amortization shown separately below) | 264,481 | 179,510 | 168,259 | 316,761 | 264,481 | 179,510 | ||||||||||||||
| | | | | | | | | | | | | | | | | | | | | |
Gross profit | 349,892 | 321,705 | 305,080 | 380,675 | 349,892 | 321,705 | ||||||||||||||
Selling and marketing expense | 61,615 | 53,722 | 53,559 | 71,037 | 61,615 | 53,722 | ||||||||||||||
General and administrative expense | 133,170 | 112,574 | 105,270 | 150,091 | 133,170 | 112,574 | ||||||||||||||
Amortization expense of intangibles | 12,301 | 8,133 | 23,041 | 13,954 | 12,301 | 8,133 | ||||||||||||||
Depreciation expense | 15,712 | 14,531 | 13,429 | 17,449 | 15,712 | 14,531 | ||||||||||||||
| | | | | | | | | | | | | | | | | | | | | |
Operating income | 127,094 | 132,745 | 109,781 | 128,144 | 127,094 | 132,745 | ||||||||||||||
Other income (expense): | ||||||||||||||||||||
Interest income | 412 | 362 | 1,792 | 1,118 | 412 | 362 | ||||||||||||||
Interest expense | (7,149 | ) | (6,172 | ) | (25,629 | ) | (21,401 | ) | (7,149 | ) | (6,172 | ) | ||||||||
Other income (expense), net | 2,012 | 259 | (2,456 | ) | ||||||||||||||||
Loss on extinguishment of debt | — | — | (18,527 | ) | ||||||||||||||||
Other income, net | 3,558 | 2,012 | 259 | |||||||||||||||||
Equity in earnings from unconsolidated entities | 4,630 | — | — | 4,916 | 4,630 | — | ||||||||||||||
| | | | | | | | | | | | | | | | | | | | | |
Total other expense, net | (95 | ) | (5,551 | ) | (44,820 | ) | (11,809 | ) | (95 | ) | (5,551 | ) | ||||||||
| | | | | | | | | | | | | | | | | | | | | |
Earnings before income taxes and noncontrolling interests | 126,999 | 127,194 | 64,961 | 116,335 | 126,999 | 127,194 | ||||||||||||||
Income tax provision | (45,051 | ) | (45,412 | ) | (24,252 | ) | (41,087 | ) | (45,051 | ) | (45,412 | ) | ||||||||
| | | | | | | | | | | | | | | | | | | | | |
Net income | 81,948 | 81,782 | 40,709 | 75,248 | 81,948 | 81,782 | ||||||||||||||
Net income attributable to noncontrolling interests | (3,018 | ) | (565 | ) | (7 | ) | (1,933 | ) | (3,018 | ) | (565 | ) | ||||||||
| | | | | | | | | | | | | | | | | | | | | |
Net income attributable to common stockholders | $ | 78,930 | $ | 81,217 | $ | 40,702 | $ | 73,315 | $ | 78,930 | $ | 81,217 | ||||||||
| | | | | | | | | | | | | | | | | | | | | | |
| | | | | | | | | | | | | | | | | | | | | |
Earnings per share attributable to common stockholders: | ||||||||||||||||||||
Basic | $ | 1.38 | $ | 1.42 | $ | 0.72 | $ | 1.28 | $ | 1.38 | $ | 1.42 | ||||||||
Diluted | $ | 1.36 | $ | 1.40 | $ | 0.71 | $ | 1.26 | $ | 1.36 | $ | 1.40 | ||||||||
Weighted average number of shares of common stock outstanding: | ||||||||||||||||||||
Basic | 57,343 | 57,243 | 56,549 | 57,400 | 57,343 | 57,243 | ||||||||||||||
Diluted | 57,953 | 57,832 | 57,248 | 57,989 | 57,953 | 57,832 | ||||||||||||||
Dividends declared per share of common stock | $ | 0.44 | $ | 0.33 | $ | 0.50 | $ | 0.48 | $ | 0.44 | $ | 0.33 | ||||||||
The accompanying Notes to Consolidated Financial Statements are an integral part of these statements.
INTERVAL LEISURE GROUP, INC. AND SUBSIDIARIES
CONSOLIDATED STATEMENTS OF COMPREHENSIVE INCOME
(In thousands)
| | Year Ended December 31, | Year Ended December 31, | ||||||||||||||||||
|---|---|---|---|---|---|---|---|---|---|---|---|---|---|---|---|---|---|---|---|---|
| | 2014 | 2013 | 2012 | 2015 | 2014 | 2013 | ||||||||||||||
Net income | $ | 81,948 | $ | 81,782 | $ | 40,709 | $ | 75,248 | $ | 81,948 | $ | 81,782 | ||||||||
Other comprehensive income (loss), net of tax: | ||||||||||||||||||||
Foreign currency translation adjustments | (11,725 | ) | 1,800 | 3,285 | (10,781 | ) | (11,725 | ) | 1,800 | |||||||||||
| | | | | | | | | | | | | | | | | | | | | |
Total comprehensive income, net of tax | 70,223 | 83,582 | 43,994 | 64,467 | 70,223 | 83,582 | ||||||||||||||
| | | | | | | | | | | | | | | | | | | | | |
Less: Net income attributable to noncontrolling interests, net of tax | (3,018 | ) | (565 | ) | (7 | ) | (1,933 | ) | (3,018 | ) | (565 | ) | ||||||||
Less: Other comprehensive loss (income) attributable to noncontrolling interests | 2,322 | (796 | ) | — | 1,769 | 2,322 | (796 | ) | ||||||||||||
| | | | | | | | | | | | | | | | | | | | | |
Total comprehensive loss (income) attributable to noncontrolling interests | (696 | ) | (1,361 | ) | (7 | ) | ||||||||||||||
Total comprehensive income attributable to noncontrolling interests | (164 | ) | (696 | ) | (1,361 | ) | ||||||||||||||
| | | | | | | | | | | | | | | | | | | | | |
Comprehensive income attributable to common stockholders | $ | 69,527 | $ | 82,221 | $ | 43,987 | $ | 64,303 | $ | 69,527 | $ | 82,221 | ||||||||
| | | | | | | | | | | | | | | | | | | | | | |
| | | | | | | | | | | | | | | | | | | | | |
The accompanying Notes to Consolidated Financial Statements are an integral part of these statements.
INTERVAL LEISURE GROUP, INC. AND SUBSIDIARIES
CONSOLIDATED BALANCE SHEETS
(In thousands, except share and per share data)
| | December 31, 2014 | December 31, 2013 | December 31, 2015 | December 31, 2014 | ||||||||||
|---|---|---|---|---|---|---|---|---|---|---|---|---|---|---|
ASSETS | ||||||||||||||
Cash and cash equivalents | $ | 80,493 | $ | 48,462 | $ | 93,088 | $ | 80,493 | ||||||
Restricted cash and cash equivalents | 19,984 | 7,421 | 16,638 | 19,984 | ||||||||||
Accounts receivable, net of allowance of $193 and $290, respectively | 45,850 | 39,819 | ||||||||||||
Accounts receivable, net of allowance of $163 and $193, respectively | 47,959 | 45,850 | ||||||||||||
Vacation ownership mortgages receivable, net | 7,169 | — | 5,913 | 7,169 | ||||||||||
Vacation ownership inventory | 54,061 | — | 47,006 | 54,061 | ||||||||||
Deferred income taxes | 16,441 | 17,714 | — | 16,441 | ||||||||||
Deferred membership costs | 8,716 | 9,828 | 8,126 | 8,716 | ||||||||||
Prepaid income taxes | 22,029 | 11,211 | 12,656 | 22,029 | ||||||||||
Prepaid expenses and other current assets | 30,230 | 24,107 | 25,993 | 30,230 | ||||||||||
| | | | | | | | | | | | | | | |
Total current assets | 284,973 | 158,562 | 257,379 | 284,973 | ||||||||||
Vacation ownership mortgages receivable, net | 29,333 | — | 26,325 | 29,333 | ||||||||||
Investments in unconsolidated entities | 33,486 | — | 38,319 | 33,486 | ||||||||||
Property and equipment, net | 86,601 | 59,556 | 91,482 | 86,601 | ||||||||||
Goodwill | 562,250 | 540,839 | 561,413 | 562,250 | ||||||||||
Intangible assets, net | 268,875 | 225,864 | 250,367 | 268,875 | ||||||||||
Deferred membership costs | 10,948 | 10,741 | 9,830 | 10,948 | ||||||||||
Deferred income taxes | 112 | 3,820 | 277 | 112 | ||||||||||
Other non-current assets | 51,041 | 25,237 | 43,715 | 47,424 | ||||||||||
| | | | | | | | | | | | | | | |
TOTAL ASSETS | $ | 1,327,619 | $ | 1,024,619 | $ | 1,279,107 | $ | 1,324,002 | ||||||
| | | | | | | | | | | | | | | | |
| | | | | | | | | | | | | | | |
LIABILITIES AND EQUITY | ||||||||||||||
LIABILITIES: | ||||||||||||||
Accounts payable, trade | $ | 39,082 | $ | 13,793 | $ | 35,998 | $ | 39,082 | ||||||
Deferred revenue | 89,850 | 92,503 | 85,684 | 89,850 | ||||||||||
Accrued compensation and benefits | 28,891 | 23,214 | 26,880 | 28,891 | ||||||||||
Member deposits | 8,222 | 8,977 | 7,565 | 8,222 | ||||||||||
Accrued expenses and other current liabilities | 47,923 | 51,071 | 55,858 | 47,923 | ||||||||||
| | | | | | | | | | | | | | | |
Total current liabilities | 213,968 | 189,558 | 211,985 | 213,968 | ||||||||||
Long-term debt | 488,000 | 253,000 | 415,700 | 484,383 | ||||||||||
Other long-term liabilities | 18,247 | 14,156 | 18,822 | 18,247 | ||||||||||
Deferred revenue | 93,730 | 100,494 | 87,061 | 93,730 | ||||||||||
Deferred income taxes | 92,869 | 90,452 | 79,420 | 92,869 | ||||||||||
| | | | | | | | | | | | | | | |
Total liabilities | 906,814 | 647,660 | 812,988 | 903,197 | ||||||||||
| | | | | | | | | | | | | | | |
Redeemable noncontrolling interest | 457 | 426 | 708 | 457 | ||||||||||
Commitments and contingencies | ||||||||||||||
STOCKHOLDERS' EQUITY: | ||||||||||||||
Preferred stock—authorized 25,000,000 shares, of which 100,000 shares are designated Series A Junior Participating Preferred Stock; $0.01 par value; none issued and outstanding | — | — | — | — | ||||||||||
Common stock—authorized 300,000,000 shares; $.01 par value; issued 59,463,200 and 59,124,834 shares, respectively | 595 | 591 | ||||||||||||
Treasury stock—2,363,324 and 1,697,360 shares at cost, respectively | (35,034 | ) | (20,913 | ) | ||||||||||
Common stock—authorized 300,000,000 shares; $.01 par value; issued 59,853,933 and 59,463,200 shares, respectively | 599 | 595 | ||||||||||||
Treasury stock—2,363,324 shares at cost | (35,034 | ) | (35,034 | ) | ||||||||||
Additional paid-in capital | 201,834 | 191,106 | 214,089 | 201,834 | ||||||||||
Retained earnings | 235,945 | 182,935 | 280,648 | 235,945 | ||||||||||
Accumulated other comprehensive loss | (19,297 | ) | (9,894 | ) | (28,309 | ) | (19,297 | ) | ||||||
| | | | | | | | | | | | | | | |
Total ILG stockholders' equity | 384,043 | 343,825 | 431,993 | 384,043 | ||||||||||
| | | | | | | | | | | | | | | |
Noncontrolling interests | 36,305 | 32,708 | 33,418 | 36,305 | ||||||||||
| | | | | | | | | | | | | | | |
Total equity | 420,348 | 376,533 | 465,411 | 420,348 | ||||||||||
| | | | | | | | | | | | | | | |
TOTAL LIABILITIES AND EQUITY | $ | 1,327,619 | $ | 1,024,619 | $ | 1,279,107 | $ | 1,324,002 | ||||||
| | | | | | | | | | | | | | | | |
| | | | | | | | | | | | | | | |
The accompanying Notes to Consolidated Financial Statements are an integral part of these statements.
INTERVAL LEISURE GROUP, INC. AND SUBSIDIARIES
CONSOLIDATED STATEMENTS OF EQUITY
(In thousands, except share data)
| | | | | Common Stock | Treasury Stock | | | Accumulated Other Comprehensive Loss | | | | Common Stock | Treasury Stock | | | Accumulated Other Comprehensive Loss | ||||||||||||||||||||||||||||||||||||||||||||||
|---|---|---|---|---|---|---|---|---|---|---|---|---|---|---|---|---|---|---|---|---|---|---|---|---|---|---|---|---|---|---|---|---|---|---|---|---|---|---|---|---|---|---|---|---|---|---|---|---|---|---|---|---|---|---|---|---|---|---|---|---|---|---|
| | Total Equity | Noncontrolling Interest | Total ILG Stockholders' Equity | Additional Paid-in Capital | Retained Earnings | Total Equity | Noncontrolling Interests | Total ILG Stockholders' Equity | Additional Paid-in Capital | Retained Earnings | ||||||||||||||||||||||||||||||||||||||||||||||||||||
| | Amount | Shares | Amount | Shares | Accumulated Other Comprehensive Loss | Amount | Shares | Amount | Shares | Accumulated Other Comprehensive Loss | ||||||||||||||||||||||||||||||||||||||||||||||||||||
Balance as of December 31, 2011 | $ | 248,685 | $ | — | $ | 248,685 | $ | 577 | 57,712,621 | $ | (20,913 | ) | 1,697,360 | $ | 173,518 | $ | 109,686 | $ | (14,183 | |||||||||||||||||||||||||||||||||||||||||||
Net income attributable to common stockholders | 40,702 | — | 40,702 | — | — | — | — | — | 40,702 | — | ||||||||||||||||||||||||||||||||||||||||||||||||||||
Other comprehensive income, net of tax | 3,285 | — | 3,285 | — | — | — | — | — | — | 3,285 | ||||||||||||||||||||||||||||||||||||||||||||||||||||
Non-cash compensation expense | 10,931 | — | 10,931 | — | — | — | — | 10,931 | — | — | ||||||||||||||||||||||||||||||||||||||||||||||||||||
Issuance of common stock upon exercise of stock options | 659 | — | 659 | — | 52,718 | — | — | 659 | — | — | ||||||||||||||||||||||||||||||||||||||||||||||||||||
Issuance of common stock upon vesting of restricted stock units, net of withholding taxes | (6,182 | ) | — | (6,182 | ) | 9 | 787,926 | — | — | (6,191 | ) | — | — | |||||||||||||||||||||||||||||||||||||||||||||||||
Change in excess tax benefits from stock-based awards | 2,554 | — | 2,554 | — | — | — | — | 2,554 | — | — | ||||||||||||||||||||||||||||||||||||||||||||||||||||
Deferred stock compensation | (202 | ) | — | (202 | ) | — | — | — | — | (202 | ) | — | — | |||||||||||||||||||||||||||||||||||||||||||||||||
Dividends declared on common stock | (28,366 | ) | — | (28,366 | ) | — | — | — | — | 862 | (29,228 | ) | — | |||||||||||||||||||||||||||||||||||||||||||||||||
| | | | | | | | | | | | | | | | | | | | | | | | | | | | | | | | ||||||||||||||||||||||||||||||||
Balance as of December 31, 2012 | $ | 272,066 | $ | — | $ | 272,066 | $ | 586 | 58,553,265 | $ | (20,913 | ) | 1,697,360 | $ | 182,131 | $ | 121,160 | $ | (10,898 | ) | $ | 272,066 | $ | — | $ | 272,066 | $ | 586 | 58,553,265 | $ | (20,913 | ) | 1,697,360 | $ | 182,131 | $ | 121,160 | $ | (10,898 | ) | ||||||||||||||||||||||
Net income attributable to common stockholders | 81,782 | 565 | 81,217 | — | — | — | — | — | 81,217 | — | ||||||||||||||||||||||||||||||||||||||||||||||||||||
Net income | 81,782 | 565 | 81,217 | — | — | — | — | — | 81,217 | — | ||||||||||||||||||||||||||||||||||||||||||||||||||||
Other comprehensive income, net of tax | 1,800 | 796 | 1,004 | — | — | — | — | — | — | 1,004 | 1,800 | 796 | 1,004 | — | — | — | — | — | — | 1,004 | ||||||||||||||||||||||||||||||||||||||||||
Non-cash compensation expense | 10,428 | — | 10,428 | — | — | — | — | 10,428 | — | — | 10,428 | — | 10,428 | — | — | — | — | 10,428 | — | — | ||||||||||||||||||||||||||||||||||||||||||
Issuance of noncontrolling interest from acquisition | 31,347 | 31,347 | — | — | — | — | — | — | — | — | 31,347 | 31,347 | — | — | — | — | — | — | — | — | ||||||||||||||||||||||||||||||||||||||||||
Issuance of common stock upon exercise of stock options | 889 | — | 889 | — | 51,821 | — | — | 889 | — | — | 889 | — | 889 | — | 51,821 | — | — | 889 | — | — | ||||||||||||||||||||||||||||||||||||||||||
Issuance of common stock upon vesting of restricted stock units, net of withholding taxes | (5,234 | ) | — | (5,234 | ) | 5 | 519,748 | — | — | (5,239 | ) | — | — | (5,234 | ) | — | (5,234 | ) | 5 | 519,748 | — | — | (5,239 | ) | — | — | ||||||||||||||||||||||||||||||||||||
Change in excess tax benefits from stock-based awards | 2,864 | — | 2,864 | — | — | — | — | 2,864 | — | — | 2,864 | — | 2,864 | — | — | — | — | 2,864 | — | — | ||||||||||||||||||||||||||||||||||||||||||
Deferred stock compensation | (475 | ) | — | (475 | ) | — | — | — | — | (475 | ) | — | — | (475 | ) | — | (475 | ) | — | — | — | — | (475 | ) | — | — | ||||||||||||||||||||||||||||||||||||
Dividends declared on common stock | (18,934 | ) | — | (18,934 | ) | — | — | — | — | 508 | (19,442 | ) | — | (18,934 | ) | — | (18,934 | ) | — | — | — | — | 508 | (19,442 | ) | — | ||||||||||||||||||||||||||||||||||||
| | | | | | | | | | | | | | | | | | | | | | | | | | | | | | | | | | | | | | | | | | | | | | | | | | | | | | | | | | | | | | | |
Balance as of December 31, 2013 | $ | 376,533 | $ | 32,708 | $ | 343,825 | $ | 591 | 59,124,834 | $ | (20,913 | ) | 1,697,360 | $ | 191,106 | $ | 182,935 | $ | (9,894 | ) | $ | 376,533 | $ | 32,708 | $ | 343,825 | $ | 591 | 59,124,834 | $ | (20,913 | ) | 1,697,360 | $ | 191,106 | $ | 182,935 | $ | (9,894 | ) | ||||||||||||||||||||||
Net income attributable to common stockholders | 81,916 | 2,986 | 78,930 | — | — | — | — | — | 78,930 | — | ||||||||||||||||||||||||||||||||||||||||||||||||||||
Net income | 81,916 | 2,986 | 78,930 | — | — | — | — | — | 78,930 | — | ||||||||||||||||||||||||||||||||||||||||||||||||||||
Other comprehensive loss, net of tax | (11,725 | ) | (2,322 | ) | (9,403 | ) | — | — | — | — | — | — | (9,403 | ) | (11,725 | ) | (2,322 | ) | (9,403 | ) | — | — | — | — | — | — | (9,403 | ) | ||||||||||||||||||||||||||||||||||
Non-cash compensation expense | 11,363 | — | 11,363 | — | — | — | — | 11,363 | — | — | 11,363 | — | 11,363 | — | — | — | — | 11,363 | — | — | ||||||||||||||||||||||||||||||||||||||||||
Acquisition of noncontrolling interests | 3,327 | 3,327 | — | — | — | — | — | — | — | — | 3,327 | 3,327 | — | — | — | — | — | — | — | — | ||||||||||||||||||||||||||||||||||||||||||
Adjustment to noncontrolling interest from prior year acquisition | (394 | ) | (394 | ) | — | — | — | — | — | — | — | — | (394 | ) | (394 | ) | — | — | — | — | — | — | — | — | ||||||||||||||||||||||||||||||||||||||
Issuance of common stock upon exercise of stock options | 341 | — | 341 | — | 15,629 | — | — | 341 | — | — | 341 | — | 341 | — | 15,629 | — | — | 341 | — | — | ||||||||||||||||||||||||||||||||||||||||||
Issuance of common stock upon vesting of restricted stock units, net of withholding taxes | (3,941 | ) | — | (3,941 | ) | 4 | 322,737 | — | — | (3,945 | ) | — | — | (3,941 | ) | — | (3,941 | ) | 4 | 322,737 | — | — | (3,945 | ) | — | — | ||||||||||||||||||||||||||||||||||||
Change in excess tax benefits from stock-based awards | 1,883 | — | 1,883 | — | — | — | — | 1,883 | — | — | 1,883 | — | 1,883 | — | — | — | — | 1,883 | — | — | ||||||||||||||||||||||||||||||||||||||||||
Deferred stock compensation | 409 | — | 409 | — | — | — | — | 409 | — | — | 409 | — | 409 | — | — | — | — | 409 | — | — | ||||||||||||||||||||||||||||||||||||||||||
Dividends declared on common stock | (25,243 | ) | — | (25,243 | ) | — | — | — | — | 677 | (25,920 | ) | — | (25,243 | ) | — | (25,243 | ) | — | — | — | — | 677 | (25,920 | ) | — | ||||||||||||||||||||||||||||||||||||
Repurchases of common stock | (14,121 | ) | — | (14,121 | ) | — | — | (14,121 | ) | 665,964 | — | — | — | (14,121 | ) | — | (14,121 | ) | — | — | (14,121 | ) | 665,964 | — | — | — | ||||||||||||||||||||||||||||||||||||
| | | | | | | | | | | | | | | | | | | | | | | | | | | | | | | | | | | | | | | | | | | | | | | | | | | | | | | | | | | | | | | |
Balance as of December 31, 2014 | $ | 420,348 | $ | 36,305 | $ | 384,043 | $ | 595 | 59,463,200 | $ | (35,034 | ) | 2,363,324 | $ | 201,834 | $ | 235,945 | $ | (19,297 | ) | $ | 420,348 | $ | 36,305 | $ | 384,043 | $ | 595 | 59,463,200 | $ | (35,034 | ) | 2,363,324 | $ | 201,834 | $ | 235,945 | $ | (19,297 | ) | ||||||||||||||||||||||
Net income | 75,227 | 1,912 | 73,315 | — | — | — | — | — | 73,315 | — | ||||||||||||||||||||||||||||||||||||||||||||||||||||
Other comprehensive loss, net of tax | (10,781 | ) | (1,769 | ) | (9,012 | ) | — | — | — | — | — | — | (9,012 | ) | ||||||||||||||||||||||||||||||||||||||||||||||||
Non-cash compensation expense | 13,470 | — | 13,470 | — | — | — | — | 13,470 | — | — | ||||||||||||||||||||||||||||||||||||||||||||||||||||
Dividends paid to noncontrolling interest | (3,030 | ) | (3,030 | ) | — | — | — | — | — | — | — | — | ||||||||||||||||||||||||||||||||||||||||||||||||||
Issuance of common stock upon exercise of stock options | 221 | — | 221 | — | 11,084 | — | — | 221 | — | — | ||||||||||||||||||||||||||||||||||||||||||||||||||||
Issuance of common stock upon vesting of restricted stock units, net of withholding taxes | (4,333 | ) | — | (4,333 | ) | 4 | 379,649 | — | — | (4,337 | ) | — | — | |||||||||||||||||||||||||||||||||||||||||||||||||
Change in excess tax benefits from stock-based awards | 1,855 | — | 1,855 | — | — | — | — | 1,855 | — | — | ||||||||||||||||||||||||||||||||||||||||||||||||||||
Deferred stock compensation | 251 | — | 251 | — | — | — | — | 251 | — | — | ||||||||||||||||||||||||||||||||||||||||||||||||||||
Cash dividends declared | (27,586 | ) | — | (27,586 | ) | — | — | — | — | 795 | (28,381 | ) | — | |||||||||||||||||||||||||||||||||||||||||||||||||
Increase in redemption value of redeemable non-controlling interest | (231 | ) | — | (231 | ) | — | — | — | — | — | (231 | ) | — | |||||||||||||||||||||||||||||||||||||||||||||||||
| | | | | | | | | | | | | | | | | | | | | | | | | | | | | | | | | |||||||||||||||||||||||||||||||
Balance as of December 31, 2015 | $ | 465,411 | $ | 33,418 | $ | 431,993 | $ | 599 | 59,853,933 | $ | (35,034 | ) | 2,363,324 | $ | 214,089 | $ | 280,648 | $ | (28,309 | ) | ||||||||||||||||||||||||||||||||||||||||||
| | | | | | | | | | | | | | | | | | | | | | | | | | | | | | | | | | | | | | | | | | | | | | | | | | | | | | | | | | | | | | | | |
| | | | | | | | | | | | | | | | | | | | | | | | | | | | | | | | | | | | | | | | | | | | | | | | | | | | | | | | | | | | | | | |
The accompanying Notes to Consolidated Financial Statements are an integral part of these statements.
INTERVAL LEISURE GROUP, INC. AND SUBSIDIARIES
CONSOLIDATED STATEMENTS OF CASH FLOWS
| | Year Ended December 31, | Year Ended December 31, | ||||||||||||||||||
|---|---|---|---|---|---|---|---|---|---|---|---|---|---|---|---|---|---|---|---|---|
| | 2014 | 2013 | 2012 | 2015 | 2014 | 2013 | ||||||||||||||
| | (In thousands) | (In thousands) | ||||||||||||||||||
Cash flows from operating activities: | ||||||||||||||||||||
Net income | $ | 81,948 | $ | 81,782 | $ | 40,709 | $ | 75,248 | $ | 81,948 | $ | 81,782 | ||||||||
Adjustments to reconcile net income to net cash provided by operating activities: | ||||||||||||||||||||
Amortization expense of intangibles | 12,301 | 8,133 | 23,041 | 13,954 | 12,301 | 8,133 | ||||||||||||||
Amortization of debt issuance costs | 830 | 783 | 1,376 | 1,534 | 830 | 783 | ||||||||||||||
Depreciation expense | 15,712 | 14,531 | 13,429 | 17,449 | 15,712 | 14,531 | ||||||||||||||
Accretion of original issue discount | — | — | 1,840 | |||||||||||||||||
Provision for loan losses | 1,898 | — | — | |||||||||||||||||
Non-cash compensation expense | 11,363 | 10,428 | 10,931 | 13,470 | 11,363 | 10,428 | ||||||||||||||
Non-cash interest expense | 14 | 342 | 433 | |||||||||||||||||
Non-cash interest income | 41 | — | (850 | ) | ||||||||||||||||
Deferred income taxes | 7,150 | (1,569 | ) | 6,507 | 2,692 | 7,150 | (1,569 | ) | ||||||||||||
Equity in earnings from unconsolidated entities | (4,630 | ) | — | — | (4,916 | ) | (4,630 | ) | — | |||||||||||
Excess tax benefits from stock-based awards | (1,900 | ) | (2,869 | ) | (3,017 | ) | (1,903 | ) | (1,900 | ) | (2,869 | ) | ||||||||
Loss (gain) on disposal of property and equipment | 18 | 191 | (256 | ) | ||||||||||||||||
Loss on extinguishment of debt | — | — | 18,527 | |||||||||||||||||
Loss on disposal of property and equipment | 233 | 18 | 191 | |||||||||||||||||
Change in fair value of contingent consideration | (1,606 | ) | 485 | (544 | ) | — | (1,606 | ) | 485 | |||||||||||
Changes in operating assets and liabilities: | ||||||||||||||||||||
Restricted cash | 3,346 | (7,611 | ) | (73 | ) | |||||||||||||||
Accounts receivable | 2,906 | (661 | ) | (2,945 | ) | (2,701 | ) | 2,906 | (661 | ) | ||||||||||
Vacation ownership mortgages receivable | 125 | — | — | 2,367 | 125 | — | ||||||||||||||
Vacation ownership inventory | 1,742 | — | — | 7,055 | 1,742 | — | ||||||||||||||
Prepaid expenses and other current assets | 5,877 | 5,512 | (918 | ) | 4,216 | 5,877 | 5,512 | |||||||||||||
Prepaid income taxes and income taxes payable | (10,407 | ) | 4,231 | (7,947 | ) | 10,049 | (10,407 | ) | 4,231 | |||||||||||
Accounts payable and other current liabilities | 2,989 | 29 | (18,004 | ) | 1,236 | 10,600 | 102 | |||||||||||||
Payment of contingent consideration | (1,184 | ) | — | (443 | ) | — | (1,184 | ) | — | |||||||||||
Deferred revenue | (6,688 | ) | (13,934 | ) | (5,414 | ) | (7,637 | ) | (6,688 | ) | (13,934 | ) | ||||||||
Other, net | (5,943 | ) | 2,450 | 3,983 | 5,132 | (5,888 | ) | 2,792 | ||||||||||||
| | | | | | | | | | | | | | | | | | | | | |
Net cash provided by operating activities | 110,658 | 109,864 | 80,438 | 142,722 | 110,658 | 109,864 | ||||||||||||||
| | | | | | | | | | | | | | | | | | | | | |
Cash flows from investing activities: | ||||||||||||||||||||
Acquisitions, net of cash acquired | (208,523 | ) | (127,266 | ) | (39,963 | ) | — | (208,523 | ) | (127,266 | ) | |||||||||
Acquisition of assets | — | (1,952 | ) | — | — | — | (1,952 | ) | ||||||||||||
Contributions to investments in unconsolidated entities | (4,125 | ) | 69 | (4,125 | ) | |||||||||||||||
Capital expenditures | (19,087 | ) | (14,700 | ) | (15,040 | ) | (20,297 | ) | (19,087 | ) | (14,700 | ) | ||||||||
Proceeds from disposal of property and equipment | — | 10 | 230 | — | — | 10 | ||||||||||||||
Investment in financing receivables | (15,897 | ) | — | (9,480 | ) | (250 | ) | (15,897 | ) | — | ||||||||||
Payments received on financing receivables | — | 9,876 | 16,989 | — | — | 9,876 | ||||||||||||||
Purchases of trading investments | (10,667 | ) | — | — | (127 | ) | (10,667 | ) | — | |||||||||||
Other, net | (15 | ) | — | — | ||||||||||||||||
| | | | | | | | | | | | | | | | | | | | | |
Net cash used in investing activities | (258,299 | ) | (134,032 | ) | (47,264 | ) | (20,620 | ) | (258,299 | ) | (134,032 | ) | ||||||||
| | | | | | | | | | | | | | | | | | | | | |
Cash flows from financing activities: | ||||||||||||||||||||
Principal payments on term loan | — | — | (56,000 | ) | ||||||||||||||||
Redemption of senior notes | — | — | (300,000 | ) | ||||||||||||||||
Proceeds from issuance of senior notes | 350,000 | — | — | |||||||||||||||||
Borrowings (payments) on revolving credit facility, net | 235,000 | (7,000 | ) | 260,000 | (413,000 | ) | 235,000 | (7,000 | ) | |||||||||||
Payments of debt issuance costs | (1,711 | ) | — | (3,912 | ) | (6,703 | ) | (1,711 | ) | — | ||||||||||
Purchases of treasury stock | (14,121 | ) | — | — | — | (14,121 | ) | — | ||||||||||||
Dividend payments | (25,243 | ) | (18,934 | ) | (28,366 | ) | ||||||||||||||
Payment of contingent consideration | (7,272 | ) | — | (1,057 | ) | |||||||||||||||
Dividend payments to stockholders | (27,586 | ) | (25,243 | ) | (18,934 | ) | ||||||||||||||
Dividend payments to noncontrolling interest | (3,030 | ) | — | — | ||||||||||||||||
Payments of contingent consideration | — | (7,272 | ) | — | ||||||||||||||||
Withholding taxes on vesting of restricted stock units | (3,943 | ) | (5,234 | ) | (6,182 | ) | (4,333 | ) | (3,943 | ) | (5,234 | ) | ||||||||
Proceeds from the exercise of stock options | 341 | 835 | 659 | 221 | 341 | 835 | ||||||||||||||
Excess tax benefits from stock-based awards | 1,900 | 2,869 | 3,017 | 1,903 | 1,900 | 2,869 | ||||||||||||||
| | | | | | | | | | | | | | | | | | | | | |
Net cash provided by (used in) financing activities | 184,951 | (27,464 | ) | (131,841 | ) | (102,528 | ) | 184,951 | (27,464 | ) | ||||||||||
| | | | | | | | | | | | | | | | | | | | | |
Effect of exchange rate changes on cash and cash equivalents | (5,279 | ) | (1,068 | ) | 4,312 | (6,979 | ) | (5,279 | ) | (1,068 | ) | |||||||||
| | | | | | | | | | | | | | | | | | | | | |
Net increase (decrease) in cash and cash equivalents | 32,031 | (52,700 | ) | (94,355 | ) | 12,595 | 32,031 | (52,700 | ) | |||||||||||
Cash and cash equivalents at beginning of period | 48,462 | 101,162 | 195,517 | |||||||||||||||||
Cash and cash equivalents at beginning of year | 80,493 | 48,462 | 101,162 | |||||||||||||||||
| | | | | | | | | | | | | | | | | | | | | |
Cash and cash equivalents at end of period | $ | 80,493 | $ | 48,462 | $ | 101,162 | ||||||||||||||
Cash and cash equivalents at end of year | $ | 93,088 | $ | 80,493 | $ | 48,462 | ||||||||||||||
| | | | | | | | | | | | | | | | | | | | | | |
| | | | | | | | | | | | | | | | | | | | | |
See Note 17 for supplemental cash flow information.
The accompanying Notes to Consolidated Financial Statements are an integral part of these statements.
INTERVAL LEISURE GROUP, INC. AND SUBSIDIARIES
NOTES TO CONSOLIDATED FINANCIAL STATEMENTS
DECEMBER 31, 20142015
NOTE 1—ORGANIZATION AND BASIS OF PRESENTATION
Organization
Interval Leisure Group, Inc., or ILG, is a leading global provider of non-traditional lodging, encompassing a portfolio of leisure businesses from exchange and vacation rental to vacation ownership. At the end of 2014, we re-aligned our operating segments to encompass the vacation ownership sales and marketing capabilities with the acquisition of the Hyatt Vacation Ownership business in October 2014. As of December 31, 2014, we operate in the following two segments: Exchange and Rental, and Vacation Ownership. Exchange and Rental offers access to vacation accommodations and other travel-related transactions and services to leisure travelers, by providing vacation exchange services and vacation rental, working with resort developers and operating vacation rental properties. Vacation Ownership engages in the management of vacation ownership resorts; sales, marketing, and financing of vacation ownership interests; and related services to owners and associations.
On February 28, 2012, we acquired all of the equity of Vacation Resorts International, or VRI, a non-developer provider of resort and homeowners association management services to the shared ownership industry. VRI was consolidated into our financial statements as of the acquisition date with its assets and results of operations primarily included in our Vacation Ownership operating segment.
On November 4, 2013, VRI Europe Limited, or VRI Europe, a subsidiary of ILG, purchased the European shared ownership resort management business of CLC World Resorts and Hotels (CLC). As part of this transaction, ILG issued to CLC shares totaling 24.5% of VRI Europe Limited.
On December 12, 2013, we acquired all of the equity of Aqua Hospitality LLC and Aqua Hotels and Resorts, Inc., referred to as Aqua, a Hawaii-based hotel and resort management company representing more than 25 properties in Hawaii and Guam.
On October 1, 2014, we acquired the Hyatt Vacation Ownership business, or HVO, which provides vacation ownership services at 16 Hyatt Residence Club resorts, from subsidiaries of Hyatt Hotels Corporation. In connection with the acquisition, we entered into a long-term exclusive license for use of the Hyatt® brand with respect to the shared ownership business.
ILG was incorporated as a Delaware corporation in May 2008 in connection with a plan by IAC/InterActiveCorp, or IAC, to separate into five publicly traded companies, referred to as the "spin-off." ILG commenced trading on The NASDAQ Stock Market in August 2008 under the symbol "IILG."
The Exchange and Rental operating segment consists of Interval International (referred to as Interval), the Hyatt Residence Club, the Trading Places International (known as TPI) operated exchange business, Aston Hotels & Resorts,and Aqua-Aston Holdings, Inc. (referred to as Aston), and Aqua.Aqua-Aston). The Vacation Ownership operating segment consists of the management related lines of business of VRI,Vacation Resorts International (or VRI), TPI, VRI Europe and HVO, as well as the HVO sales and financing of vacation ownership interests.
On October 27, 2015, we entered into a merger agreement pursuant to which we will acquire the vacation ownership business of Starwood Hotels & Resorts Worldwide, Inc., or Starwood, to be known as Vistana Signature Experiences or Vistana. Upon closing, Starwood will spin-off Vistana to its stockholders then immediately following the spin-off Vistana will merge with a wholly owned subsidiary of ILG. In the merger, the Vistana common stock to which Starwood stockholders are entitled in the spin-off will automatically convert in to ILG common stock. At the close of the proposed transactions, Starwood stockholders will own approximately 55% of ILG common stock and ILG stockholders will own approximately 45% of ILG common stock, in each case, on a fully diluted basis.
Basis of Presentation
Principles of Consolidation
The accompanying consolidated financial statements include the accounts of ILG, our wholly-owned subsidiaries, and companies in which we have a controlling interest, including variable interest
INTERVAL LEISURE GROUP, INC. AND SUBSIDIARIES
NOTES TO CONSOLIDATED FINANCIAL STATEMENTS (Continued)
DECEMBER 31, 20142015
NOTE 1—ORGANIZATION AND BASIS OF PRESENTATION (Continued)
entities ("VIEs") where we are the primary beneficiary in accordance with consolidation guidance. All significant intercompany balances and transactions have been eliminated in the consolidated financial statements. References in these financial statements to net income attributable to common stockholders and ILG stockholders' equity do not include noncontrolling interests, which represent the outside ownership of our consolidated non-wholly owned entities and are reported separately.
Accounting Estimates
ILG's management is required to make certain estimates and assumptions during the preparation of its consolidated financial statements in accordance with generally accepted accounting principles ("GAAP"). These estimates and assumptions impact the reported amounts of assets and liabilities and disclosures of contingent assets and liabilities as of the date of the consolidated financial statements. They also impact the reported amount of net earnings during any period. Actual results could differ from those estimates.
Significant estimates underlying the accompanying consolidated financial statements include: the recovery of long-lived assets, as well asvacation ownership inventory and goodwill and other intangible assets; purchase price allocations of business combinations; loan loss reserves for vacation ownership mortgages receivable; the determination of deferred income taxes including related valuation allowances; the determination of deferred revenue and deferred membership costs; and the determination of stock-based compensation. In the opinion of ILG's management, the assumptions underlying the historical consolidated financial statements of ILG and its subsidiaries are reasonable.
Seasonality
Revenue at ILG is influenced by the seasonal nature of travel. Within our Exchange and Rental segment, our vacation exchange businesses recognize exchange and Getaway revenue based on confirmation of the vacation, with the first quarter generally experiencing higher revenue and the fourth quarter generally experiencing lower revenue. Our vacation rental businesses recognize rental revenue based on occupancy, with the first and third quarters generally generating higher revenue as a result of increased leisure travel to our Hawaii-based managed properties during these periods, and the second and fourth quarters generally generating lower revenue.
Within our Vacation Ownership segment, our sales and financing business experiences a modest impact from seasonality, with higher sales volumes during the traditional vacation periods, largely the third quarter (summer months).periods. Our vacation ownership management businesses by and large do not experience significant seasonality.
NOTE 2—SIGNIFICANT ACCOUNTING POLICIES
Revenue Recognition
Exchange and Rental
Revenue, net of sales incentives, from membership fees from our Exchange and Rental segment is deferred and recognized over the terms of the applicable memberships, typically ranging from one to five years, on a straight-line basis. When multiple member benefits and services are provided over the term of the membership, revenue is recognized for each separable deliverable ratably over the
INTERVAL LEISURE GROUP, INC. AND SUBSIDIARIES
NOTES TO CONSOLIDATED FINANCIAL STATEMENTS (Continued)
DECEMBER 31, 20142015
NOTE 2—SIGNIFICANT ACCOUNTING POLICIES (Continued)
membership period, as applicable. Generally, memberships are cancelable and refundable on a pro-rata basis, with the exception of our Platinum tier which is non-refundable. Direct costs of acquiring members (primarily commissions) and certain direct fulfillment costs related to deferred membership revenue are also deferred and amortized on a straight-line basis over the terms of the applicable memberships or benefit period, whichever is shorter. The recognition of previously deferred revenue and expense is based on estimates derived from an aggregation of member-level data. However, in the fourth quarter of 2014 upon implementation of a proprietary IT platform, recognition of deferred membership revenue and expense on new memberships sold is at the individual member-level.
Revenue from exchange and Getaway transactions is recognized when confirmation of the transaction is provided as the earnings process is complete. Reservation servicing revenue is recognized when the service is performed or on a straight-line basis over the applicable service period. All taxable revenue transactions are presented on a net-of-tax basis.
Revenue from our vacation rental management businesses areis comprised of base management fees which are typically either (i) fixed amounts, (ii) amounts based on a percentage of adjusted gross lodging revenue, or (iii) various revenue sharing arrangements with condominium owners based on stated formulas. Base management fees are recognized when earned in accordance with the terms of the contract. Incentive management fees for certain hotels and condominium resorts are generally a percentage of operating profits or improvement in operating profits. We recognize incentive management fees as earned throughout the incentive period based on actual results which are trued-up at the culmination of the incentive period. Service fee revenue is based on the services provided to owners including reservations, sales and marketing, property accounting and information technology services either internally or through third party providers. Service fee revenue is recognized when the service is provided.
In certain instances we arrange services which are provided directly to property owners. Transactions for these services do not impact our consolidated financial statements as they are not included in our results of operations. Additionally, in most cases we employ on-site personnel to provide services such as housekeeping, maintenance and administration to property owners under our management agreements. For such services, we recognize revenue in an amount equal to the expenses incurred.
Vacation Ownership
The Vacation Ownership segment's revenue is derived principally from sales of vacation ownership intervals,interests (VOIs), fees for timeshare resort and homeowners' association management, and other management related services. Management fees in this segment consist of base management fees, service fees, and annual maintenance fees, as applicable.
ILG recognizes revenue from sales of vacation ownership intervalsVOIs in accordance with Financial Accounting Standard Board (FASB) Accounting Standards Codification (ASC) 970,Real Estate—General, and FASB ASC 978,Real Estate—Time-Sharing Activities. The stated sales price of the vacation ownership interests (VOI)VOI is divided into separate revenue components, which include the revenue earned on the sale of the VOI and the revenue earned on the sales incentive given to the customer as motivation to purchase the VOI. ILG
INTERVAL LEISURE GROUP, INC. AND SUBSIDIARIES
NOTES TO CONSOLIDATED FINANCIAL STATEMENTS (Continued)
DECEMBER 31, 2015
NOTE 2—SIGNIFICANT ACCOUNTING POLICIES (Continued)
offers several types of sales incentives, including Hyatt Gold Passport Points, free bonus week, down payment credits to buyers, and waiver of first year maintenance fees.
INTERVAL LEISURE GROUP, INC. AND SUBSIDIARIES
NOTES TO CONSOLIDATED FINANCIAL STATEMENTS (Continued)
DECEMBER 31, 2014
NOTE 2—SIGNIFICANT ACCOUNTING POLICIES (Continued)
Consolidated VOI sales are recognized and included in revenues after a binding sales contract has been executed, a 10% minimum down payment has been received as a measure of substantiating the purchaser's commitment, the rescission period has expired, and construction is substantially complete. Pursuant to accounting rules for real estate time-sharing transactions, as part of determining when we have met the criteria necessary for revenue recognition we must also take into consideration the fair value of certain incentives provided to the purchaser when assessing the adequacy of the purchaser's initial investment. The agreement for sale generally provides for a down payment and a note secured by a mortgage payable in monthly installments, including interest, over a period of up to 10 years. All payments received prior to the recognition of the sale as revenue are recognized in deferred revenue in the accompanying consolidated balance sheets. Customer deposits relating to contracts cancelled after the applicable rescission period are forfeited and recorded in revenue at the time of forfeiture.
The provision for loan losses is recorded as an adjustment to sales of vacation ownership intervalsVOIs in the accompanying consolidated income statements rather than as an adjustment to bad debt expense. ILG records an estimate of uncollectible amounts at the time of the interval sale. The amount of the provision for loan losses recorded within sales of vacation ownership intervals in the accompanying consolidated statement of income was $1.9 million and $0.3 million for the yearyears ended December 31, 2014.2015 and 2014, respectively.
Annual maintenance fees are amounts paid by timeshare owners for maintaining and operating the respective properties, which includes management services, and are recognized on a straight-line basis over the respective annual maintenance period.
Deferred Revenue in a Business Combination
When we acquire a business which records deferred revenue on their historical financial statements, we are required to re-measure that deferred revenue as of the acquisition date pursuant to rules related to accounting for business combinations, as described further below. The post-acquisition impact of that remeasurement results in recognizing revenue which solely comprises the cost of the associated legal performance obligation we assumed as part of the acquisition, plus a normal profit margin. At times, this purchase accounting treatment results in lower amounts of revenue recognized in a reporting period following the acquisition than would have otherwise been recognized on a historical basis.
Multiple-Element Arrangement
When we enter into multiple-element arrangements, we are required to determine whether the deliverables in these arrangements should be treated as separate units of accounting for revenue recognition purposes and, if so, how the contract price should be allocated to each element. We analyze our contracts upon execution to determine the appropriate revenue recognition accounting treatment. Our determination of whether to recognize revenue for separate deliverables will depend on the terms and specifics of our products and arrangements as well as the nature of changes to our existing products and services, if any. The allocation of contract revenue to the various elements does not change the total revenue recognized from a transaction or arrangement, but may impact the timing of revenue recognition.
INTERVAL LEISURE GROUP, INC. AND SUBSIDIARIES
NOTES TO CONSOLIDATED FINANCIAL STATEMENTS (Continued)
DECEMBER 31, 20142015
NOTE 2—SIGNIFICANT ACCOUNTING POLICIES (Continued)
change the total revenue recognized from a transaction or arrangement, but may impact the timing of revenue recognition.
Cash and Cash Equivalents
Cash and cash equivalents include cash and highly liquid investments with original maturities of three months or less.
Restricted Cash and Cash Equivalents
Restricted cash and cash equivalents at December 31, 20142015 and 20132014 primarily includes maintenance fees, escrow deposits received on sales of VOI that are held in escrow until the applicable statutory rescission period has expired, the funds have been released from escrow and the deeding process has begun, as well as amounts held in trust and lock box accounts in connection with certain transactions related to management of vacation rental properties.
Accounts Receivable
Accounts receivable are stated at amounts due from customers, principally resort developers, members and managed properties, net of an allowance for doubtful accounts. Accounts receivable outstanding longer than the contractual payment terms are considered past due. ILG determines its allowance by considering a number of factors, including the length of time accounts receivable are past due, ILG's previous loss history, our judgment as to the specific customer's current ability to pay its obligation to ILG and the condition of the general economy. More specifically, ILG's policy for determining its allowance for doubtful accounts consists of both general and specific reserves. The general reserve methodology is distinct for each ILG business based on its historical collection experience and past practice. Predominantly, receivables greater than 120 days past due are applied a general reserve factor, while receivables 180 days or more past due are fully reserved. The determination of when to apply a specific reserve requires judgment and is directly related to the particular customer collection issue identified, such as known liquidity constraints, insolvency concerns or litigation.
The allowance for bad debt is included within general and administrative expense within our consolidated statements of income. ILG writes off accounts receivable when they become uncollectible once we have exhausted all means of collection.
Vacation Ownership Inventory
Inventory is composed of unsold vacation ownership intervals at our Hyatt-branded vacation ownership resorts. This inventory is carried at the lower of cost or market, based on relative sales value, or net realizable value, less expected direct selling costs. Cost includes development, real estate, and content costs. Costs are allocated to units sold using the relative sales value method. This method calculates cost of sales as a percentage of projected gross sales using a cost-of-sales percentage, which is determined by dividing inventory cost into total estimated revenue projected for interval sales. Remaining inventory is a pool of costs that will be charged against future revenues.
INTERVAL LEISURE GROUP, INC. AND SUBSIDIARIES
NOTES TO CONSOLIDATED FINANCIAL STATEMENTS (Continued)
DECEMBER 31, 2015
NOTE 2—SIGNIFICANT ACCOUNTING POLICIES (Continued)
It is possible that future changes in our sales strategies or project development plans could have a material effect on the carrying value of inventory. Consequently, we monitor the carrying value of our inventory on a quarterly basis to ensure the inventory is stated at the lower of cost or market.
INTERVAL LEISURE GROUP, INC. AND SUBSIDIARIES
NOTES TO CONSOLIDATED FINANCIAL STATEMENTS (Continued)
DECEMBER 31, 2014
NOTE 2—SIGNIFICANT ACCOUNTING POLICIES (Continued)
Vacation Ownership Mortgages Receivable and Allowance for Loan Losses
Vacation ownership mortgages receivable consist of loans to eligible customers who purchase vacation ownership interestsVOIs and choose to finance their purchase. These mortgage receivables are collateralized by the underlying vacation ownership interest,VOI, generally bear interest at a fixed rate, have a typical term ranging from 5 - 5—10 years and are generally made available to customers who make a down payment on the purchase price within established credit guidelines.
Vacation ownership mortgages receivable are composed of mortgage loans related to our financing of vacation ownership interval sales. Included within our vacation ownership mortgages receivable are originated loans and loans acquired in connection with our acquisition of HVO.
Acquired loans are segregated between those with deteriorated credit quality at acquisition and those deemed as performing. To make this determination, we consider such factors as credit collection history, past due status, non-accrual status, credit risk ratings, interest rates and the underlying collateral securing the loans. The fair value of acquired loans deemed performing is determined by discounting cash flows, both principal and interest, for the loan pool at market interest rates while giving consideration to anticipated future defaults. The difference between fair value and principal balances due at acquisition date is accreted to interest income, within consolidated revenue, over the estimated life of the loan pool.
Allowance for Loan Losses
For originated loans, we record an estimate of uncollectability as a reduction of sales of vacation ownership intervalsVOIs in the accompanying consolidated statements of income at the time revenue is recognized on a vacation ownership intervalVOI sale. We evaluate our originated loan portfolio collectively as they are largely homogeneous, smaller-balance, vacation ownership mortgages receivable. We use a technique referred to as static pool analysis, which tracks uncollectibles over the entire life of those mortgage receivable, as the basis for determining our general reserve requirements on our vacation ownership mortgages receivable. The adequacy of the related allowance is determined by management through analysis of several factors, such as current economic conditions and industry trends, as well as the specific risk characteristics of the portfolio, including defaults, aging, and historical write-offs of these receivables. The allowance is maintained at a level deemed adequate by management based on a periodic analysis of the mortgage portfolio.
We determine our originated vacation ownership mortgages receivable to be nonperforming if either interest or principal is more than 120 days past due. All non-performing loans are placed on non-accrual status and we do not resume interest accrual until the receivable becomes contractually current. We apply payments we receive for vacation ownership notes receivable on non-performing status first to interest, then to principal, and any remainder to fees.
Loans acquired in connection with a business combination are recorded at their estimated fair value on their purchase date with no carryover of the related allowance for loan losses. Performing acquired loans are subsequently evaluated for any required allowance at each reporting date. An allowance for loan losses on acquired loans is calculated using a similar methodology for originated loans.
INTERVAL LEISURE GROUP, INC. AND SUBSIDIARIES
NOTES TO CONSOLIDATED FINANCIAL STATEMENTS (Continued)
DECEMBER 31, 20142015
NOTE 2—SIGNIFICANT ACCOUNTING POLICIES (Continued)
allowance for loan losses on acquired loans is calculated using a similar methodology for originated loans.
Investments in Unconsolidated Entities
We consolidate entities under our control, including variable interest entities (VIEs) where we are deemed to be the primary beneficiary as a result of qualitative and/or quantitative characteristics. The primary beneficiary is the party who has the power to direct the activities of a VIE that most significantly impact the entity's economic performance and who has an obligation to absorb losses of the entity or a right to receive benefits from the entity that could potentially be disproportionate to the entity. Investments in unconsolidated affiliates over which we exercise significant influence, but do not control, including joint ventures, are accounted for by the equity method. In addition, our limited partnership investments in which we hold more than a minimal investment are accounted for under the equity method of accounting.
We assess investments in unconsolidated entities for impairment quarterly to determine whether there is an indication that a loss in value that is other-than-temporary has occurred. If so, we evaluate the carrying value compared to the estimated fair value of the investment. Fair value is based upon internally developed discounted cash flow models, third-party appraisals, or if appropriate, current estimated net sales proceeds from pending offers. If the estimated fair value is less than carrying value, we use our judgment to determine if the decline in value is other-than-temporary. In making this determination, we consider factors including, but not limited to, the length of time and extent of the decline, loss of values as a percentage of the cost, financial condition and near-term financial projections, our intent and ability to recover the lost value, and current economic conditions. Impairments that are deemed other-than-temporary are charged to equity in losses from unconsolidated entities in our accompanying consolidated statements of income.
Property and Equipment
Property and equipment, including capitalized improvements, are recorded at cost. Repairs and maintenance and any gains or losses on dispositions are included in results of operations.
Depreciation is recorded on a straight-line basis to allocate the cost of depreciable assets to operations over their estimated useful lives. The following table summarizes depreciable life by asset category.
Asset Category | Depreciation Period | |
|---|---|---|
Computer equipment | 3 to 5 Years | |
Capitalized software (including internally-developed software) | 3 to 7 Years | |
Buildings and leasehold improvements | 1 to 40 Years | |
Furniture and other equipment | 3 to 10 Years |
In accordance with ASC Topic 350, "Intangibles-Goodwill and Other" ("ASC 350"), we capitalize certain qualified costs incurred in connection with the development of internal use software. Capitalization of internal use software costs begins when the preliminary project stage is completed, management with the relevant authority authorizes and commits to the funding of the software project,
INTERVAL LEISURE GROUP, INC. AND SUBSIDIARIES
NOTES TO CONSOLIDATED FINANCIAL STATEMENTS (Continued)
DECEMBER 31, 2015
NOTE 2—SIGNIFICANT ACCOUNTING POLICIES (Continued)
and it is probable that the project will be completed and the software will be used to perform the function intended.
INTERVAL LEISURE GROUP, INC. AND SUBSIDIARIES
NOTES TO CONSOLIDATED FINANCIAL STATEMENTS (Continued)
DECEMBER 31, 2014
NOTE 2—SIGNIFICANT ACCOUNTING POLICIES (Continued)
Fair Value Measurements
In accordance with ASC Topic 820, "Fair Value Measurement," ("ASC 820") the fair value of an asset is considered to be the price at which the asset could be sold in an orderly transaction between unrelated knowledgeable and willing parties. A liability's fair value is defined as the amount that would be paid to transfer the liability to a new obligor, not the amount that would be paid to settle the liability with the creditor. We categorize assets and liabilities recorded at fair value using a three-tier fair value hierarchy, which prioritizes the inputs used in measuring fair value. These tiers include:
Our non-financial assets, such as goodwill, intangible assets and long-lived assets, are adjusted to fair value only when an impairment charge is recognized. Such fair value measurements are based predominantly on Level 3 inputs.
Accounting for Business Combinations
In accordance with ASC Topic 805, "Business Combinations," when accounting for business combinations we are required to recognize the assets acquired, liabilities assumed, contractual contingencies, noncontrolling interests and contingent consideration at their fair value as of the acquisition date. These items are recorded on our consolidated balance sheets as of the respective acquisition dates based upon their estimated fair values at such dates. The results of operations of acquired businesses are included in the consolidated statements of income since their respective acquisition dates.
The purchase price allocation process requires management to make significant estimates and assumptions with respect to intangible assets, estimated contingent consideration payments and/or pre-acquisition contingencies, all of which ultimately affect the fair value of goodwill established as of the acquisition date. Goodwill acquired in business combinations is assigned to the reporting unit(s) expected to benefit from the combination as of the acquisition date and is then subsequently tested for impairment at least annually.
As part of our accounting for business combinations we are required to determine the useful lives of identifiable intangible assets recognized separately from goodwill. The useful life of an intangible asset is the period over which the asset is expected to contribute directly or indirectly to the future cash flows of the acquired business. An intangible asset with a finite useful life shall be amortized; an intangible asset with an indefinite useful life shall not be amortized. We base the estimate of the useful
INTERVAL LEISURE GROUP, INC. AND SUBSIDIARIES
NOTES TO CONSOLIDATED FINANCIAL STATEMENTS (Continued)
DECEMBER 31, 2015
NOTE 2—SIGNIFICANT ACCOUNTING POLICIES (Continued)
life of an intangible asset on an analysis of all pertinent factors, in particular, all of the following factors with no one factor being more presumptive than the other:
INTERVAL LEISURE GROUP, INC. AND SUBSIDIARIES
NOTES TO CONSOLIDATED FINANCIAL STATEMENTS (Continued)
DECEMBER 31, 2014
NOTE 2—SIGNIFICANT ACCOUNTING POLICIES (Continued)
If no legal, regulatory, contractual, competitive, economic, or other factors limit the useful life of an intangible asset to the reporting entity, the useful life of the asset shall be considered to be indefinite. The term indefinite does not mean the same as infinite or indeterminate. The useful life of an intangible asset is indefinite if that life extends beyond the foreseeable horizon—that is, there is no foreseeable limit on the period of time over which it is expected to contribute to the cash flows of the acquired business.
Although we believe the assumptions and estimates we have made have been reasonable and appropriate, they are based in part on historical experience and information obtained from the management of the acquired entity and are inherently uncertain. Examples of critical estimates in accounting for acquisitions include but are not limited to:
Unanticipated events and circumstances may occur which could affect the accuracy or validity of our assumptions, estimates or actual results. Additionally, any change in the fair value of the acquisition-related contingent consideration subsequent to the acquisition date, including changes resulting from events that occur after the acquisition date, such as changes in our estimated fair value of the targets that are expected to be achieved, will be recognized in earnings in the period of the change in estimated fair value.
INTERVAL LEISURE GROUP, INC. AND SUBSIDIARIES
NOTES TO CONSOLIDATED FINANCIAL STATEMENTS (Continued)
DECEMBER 31, 2015
NOTE 2—SIGNIFICANT ACCOUNTING POLICIES (Continued)
Additionally, when acquiring a company who has recorded deferred revenue in its historical, pre-acquisition financial statements, we are required as part of purchase accounting to re-measure the deferred revenue as of the acquisition date. Deferred revenue is re-measured to represent solely the cost that relates to the associated legal performance obligation which we assumed as part of the acquisition, plus a normal profit margin representing the level of effort or assumption of risk assumed. Legal performance obligations that simply relate to the passage of time would not result in recognized deferred revenue as there is little to no associated cost.
INTERVAL LEISURE GROUP, INC. AND SUBSIDIARIES
NOTES TO CONSOLIDATED FINANCIAL STATEMENTS (Continued)
DECEMBER 31, 2014
NOTE 2—SIGNIFICANT ACCOUNTING POLICIES (Continued)
Goodwill and Other Intangible Assets
Goodwill and other intangible assets are significant components of our consolidated balance sheets. Our policies regarding the valuation of intangible assets affect the amount of future amortization and possible impairment charges we may incur. Assumptions and estimates about future values and remaining useful lives of our intangible and other long-lived assets are complex and subjective. They can be affected by a variety of factors, including external factors such as consumer spending habits and general economic trends, and internal factors such as changes in our business strategy and our internal forecasts.
Goodwill acquired in business combinations is assigned to the reporting unit(s) expected to benefit from the combination as of the acquisition date. In accordance with ASC 350, we review the carrying value of goodwill and other intangible assets of each of our reporting units on an annual basis as of October 1, or more frequently upon the occurrence of certain events or substantive changes in circumstances, based on either a qualitative assessment or a two-step impairment test. As of December 31, 2014, upon re-alignment of our operating segments, we identified two reporting units within each of our Exchange and Rental, and Vacation Ownership operating segments as follows:
| OPERATING SEGMENTS | ||
|---|---|---|
| Exchange and Rental | Vacation Ownership | |
| Vacation exchange reporting unit | VO management reporting unit | |
| Vacation rental reporting unit | VO sales and financing reporting unit | |
During the year, we monitor the actual performance of our reporting units relative to the fair value assumptions used in our annual impairment test, including potential events and changes in circumstance affecting our key estimates and assumptions.
Qualitative Assessment
The qualitative assessment may be elected in any given year pursuant to ASU 2011-08, "Intangibles—Goodwill and Other (Topic 350): Testing Goodwill for Impairment" ("ASU 2011-08"). ASU 2011-08 amended the testing of goodwill for impairment.ASC 350. Under the revisedthis guidance, entities testing goodwill for impairment have the option of performing a qualitative assessment before calculating the fair value of a reporting unit. If entities determine, on the basis of qualitative factors, that it is more-likely-than-not (i.e., a likelihood of more than 50 percent) that the fair value of the reporting unit is below the carrying amount, the two-step impairment test would be required. The guidance also provides the option to skip the qualitative assessment in any given year and proceed directly with the two-step impairment test at our discretion.
Our qualitative assessment is performed for the purpose of assessing whether events or circumstances have occurred in the intervening period between the date of our last two-step
INTERVAL LEISURE GROUP, INC. AND SUBSIDIARIES
NOTES TO CONSOLIDATED FINANCIAL STATEMENTS (Continued)
DECEMBER 31, 2015
NOTE 2—SIGNIFICANT ACCOUNTING POLICIES (Continued)
impairment test (the "Baseline Valuation") and the date of our current annual impairment test which could adversely affect the comparison of our reporting units' fair value with its carrying amount. Examples of events and circumstances that might indicate that a reporting unit's fair value is less than its carrying amount include macro-economic conditions such as deterioration in the entity's operating environment, industry or overall market conditions; reporting unit specific events such as increasing
INTERVAL LEISURE GROUP, INC. AND SUBSIDIARIES
NOTES TO CONSOLIDATED FINANCIAL STATEMENTS (Continued)
DECEMBER 31, 2014
NOTE 2—SIGNIFICANT ACCOUNTING POLICIES (Continued)
costs, declining financial performance, or loss of key personnel or contracts; or other events such as pending litigation, access to capital in the credit markets or a sustained decrease in ILG's stock price on either an absolute basis or relative to peers. If it is determined, as a result of the qualitative assessment, that it is more-likely-than-not that the fair value of a reporting unit is less than its carrying amount, we are then required to perform a two-step impairment test on goodwill.
Two-step Impairment Test
The first step of the impairment test compares the fair value of each reporting unit with its carrying amount, including goodwill. The fair value of each reporting unit is calculated using the average of an income approach and a market comparison approach which utilizes similar companies as the basis for the valuation. If the carrying amount exceeds fair value, then the second step of the impairment test is performed to measure the amount of any impairment loss. The impairment loss is determined by comparing the implied fair value of goodwill to the carrying value of goodwill. The implied fair value of goodwill represents the excess of the fair value of the reporting unit over amounts assigned to its net assets.
The determination of fair value utilizes an evaluation of historical and forecasted operating results and other estimates. Fair value measurements are generally determined through the use of valuation techniques that may include a discounted cash flow approach, which reflects our own assumptions of what market participants would use in pricing the asset or liability.
Indefinite-Lived Intangible Assets
Our intangible assets with indefinite lives relate principally to trade names, trademarks and certain resort management contracts. Pursuant to ASC 350, if an intangible asset is determined to have an indefinite useful life, it shall not be amortized until its useful life is determined to no longer be indefinite. Accordingly, we evaluate the remaining useful life of an intangible asset that is not being amortized each reporting period to determine whether events or circumstances continue to support an indefinite useful life. As of December 31, 2014,2015, there have been no changes to the indefinite life determination pertaining to these intangible assets.
In addition, an intangible asset that is not subject to amortization shall be tested for impairment annually, or more frequently if events or changes in circumstances indicate that the asset might be impaired. The impairment test consists of a comparison of the fair value of an intangible asset with its carrying amount. If the carrying amount of an indefinite-lived intangible asset exceeds its estimated fair value, an impairment loss equal to the excess is recorded. However, subsequent to the issuance of Accounting Standards Update (ASU) 2012-02 ("ASU 2012-022012-02") in July 2012, entities testing an indefinite-lived intangible asset for impairment have the option of performing a qualitative assessment before calculating the fair value of the asset. If entities determine, on the basis of qualitative factors, that the likelihood of the indefinite-lived intangible asset being impaired is below a "more-likely-than-not"
INTERVAL LEISURE GROUP, INC. AND SUBSIDIARIES
NOTES TO CONSOLIDATED FINANCIAL STATEMENTS (Continued)
DECEMBER 31, 2015
NOTE 2—SIGNIFICANT ACCOUNTING POLICIES (Continued)
"more-likely-than-not" threshold (i.e., a likelihood of more than 50 percent), the entity would not need to calculate the fair value of the asset.
INTERVAL LEISURE GROUP, INC. AND SUBSIDIARIES
NOTES TO CONSOLIDATED FINANCIAL STATEMENTS (Continued)
DECEMBER 31, 2014
NOTE 2—SIGNIFICANT ACCOUNTING POLICIES (Continued)
Long-Lived Assets and Intangible Assets with Definite Lives
We review the carrying value of all long-lived assets, primarily property and equipment and definite-lived intangible assets, for impairment whenever events or changes in circumstances indicate that the carrying value of a long-lived asset (asset group) may be impaired. In accordance with guidance included within ASC Topic 360, "Property Plant and Equipment," ("ASC 360"), recoverability of assets to be held and used is measured by a comparison of the carrying amount of an asset (asset group) to future undiscounted cash flows expected to be generated by the asset (asset group). An asset group is the lowest level of assets and liabilities for which identifiable cash flows are largely independent of the cash flows of other assets and liabilities. When estimating future cash flows, we consider:
If an asset (asset group) is considered to be impaired, the impairment to be recognized is measured by the amount by which the carrying amount of the asset (asset group) exceeds its fair value. When determining the fair value of the asset (asset group), we consider the highest and best use of the assets from a market-participant perspective. The fair value measurement is generally determined through the use of independent third party appraisals or an expected present value technique, both of which may include a discounted cash flow approach, which reflects our own assumptions of what market participants would utilize to price the asset (asset group).
Assets to be disposed of are reported at the lower of the carrying amount or fair value less costs to sell. Assets to be abandoned, or from which no further benefit is expected, are written down to zero at the time that the determination is made and the assets are removed entirely from service.
Advertising
Advertising and promotional expenditures primarily include printing and postage costs of directories and magazines, promotions, tradeshows, agency fees, and related commissions. Direct-response advertising consists primarily of printing, postage, and freight costs related to our member resort directories. Advertising costs are expensed in the period incurred, except for magazine related costs that are expensed at time of mailing when the advertising takes place, and direct-response advertising, which are amortized ratably over the twelve-monthapplicable period following the mailing of the directories.
Advertising expense was $16.4 million, $15.6 million $17.0 million and $16.8$17.0 million for the years ended December 31, 2015, 2014 2013 and 2012,2013, respectively, of which $2.1$2.7 million, $4.1$2.1 million and $4.1 million, respectively, pertained to expenses related to our direct-response advertising. As of December 31, 20142015
INTERVAL LEISURE GROUP, INC. AND SUBSIDIARIES
NOTES TO CONSOLIDATED FINANCIAL STATEMENTS (Continued)
DECEMBER 31, 20142015
NOTE 2—SIGNIFICANT ACCOUNTING POLICIES (Continued)
and 2013,2014, we had $2.4$4.3 million and $3.6$2.4 million, respectively, of capitalized advertising costs recorded in prepaid expenses and other current assets on our consolidated balance sheets.
Income Taxes
ILG accounts for income taxes under the liability method, and deferred tax assets and liabilities are recognized for the future tax consequences attributable to differences between the financial statement carrying amounts of existing assets and liabilities and their respective tax bases. Deferred tax assets and liabilities are measured using enacted tax rates in effect for the year in which those temporary differences are expected to be recovered or settled. A valuation allowance is provided on deferred tax assets if it is determined that it is more likely than not that the deferred tax asset will not be realized. ILG records interest on potential income tax contingencies as a component of income tax expense and records interest net of any applicable related income tax benefit.
Pursuant to ASC Topic 740 "Income Taxes" ("ASC 740"), ILG recognizes liabilities for uncertain tax positions based on the two-step process prescribed by the interpretation. The first step is to evaluate the tax position for recognition by determining if the weight of available evidence indicates it is more likely than not that the position will be sustained on audit, including resolution of related appeals or litigation processes, if any. The second step is to measure the tax benefit as the largest amount that is more than 50% likely of being realized upon settling the uncertain tax position.
Foreign Currency Translation and Transaction Gains and Losses
The financial position and operating results of substantially all foreign operations are consolidated using the local currency as the functional currency. Local currency assets and liabilities are translated at the rates of exchange as of the balance sheet date, and local currency revenue and expenses are translated at average rates of exchange during the period. Resulting translation gains or losses are included as a component of accumulated other comprehensive income (loss), a separate component of ILG stockholders' equity. Accumulated other comprehensive income (loss) is solely related to foreign currency translation. Only the accumulated other comprehensive income (loss) exchange rate adjustment related to Venezuela is tax effected as required by the FASB guidance codified in ASC 740 since the earnings in Venezuela are not indefinitely reinvested in that jurisdiction.
Transaction gains and losses arising from transactions and/or assets and liabilities denominated in a currency other than the functional currency of the entity involved are included in the consolidated statements of income. Operating foreign currency exchange attributable to foreign currency remeasurements of operating assets and liabilities denominated in a currency other than their functional currency, primarily related to Euro denominated value added tax liabilities, resulted in net gains of $0.2 million for the year ended December 31, 2015, net gains of $0.4 million for the year ended December 31, 21042014 and in a net lossesloss of $0.1 million for each of the yearsyear ended December 31, 2013, and 2012, which is included in general and administrative expenses. Non-operating foreign currency exchange included a net gaingains of $3.8 million, $2.3 million and $0.6 million for the years ended December 31, 2015, 2014 and 2013, respectively, and a net loss of $2.2 million for the year ended December 31, 2012, included in other income (expense) in the accompanying consolidated statements of income.
INTERVAL LEISURE GROUP, INC. AND SUBSIDIARIES
NOTES TO CONSOLIDATED FINANCIAL STATEMENTS (Continued)
DECEMBER 31, 20142015
NOTE 2—SIGNIFICANT ACCOUNTING POLICIES (Continued)
Stock-Based Compensation
Stock-based compensation is accounted for under ASC Topic 718, "Compensation—Stock Compensation" ("ASC 718"). Non-cash compensation expense for stock-based awards is measured at fair value on date of grant and recognized over the service period for awards expected to vest. The fair value of restricted stock and restricted stock units ("RSUs") is determined based on the number of shares granted and the quoted price of our common stock on that date, except for RSUs subject to relative total shareholder return performance criteria, which the fair value is based on a Monte Carlo simulation analysis as further discussed in Note 13. We grant awards subject to graded vesting (i.e., portions of the award vest at different times during the vesting period) or to cliff vesting (i.e., all awards vest at the end of the vesting period). Certain RSUs, in addition, are subject to attaining specific performance criteria. For RSUs to be settled in stock, the accounting charge is measured at the grant date fair value and expensed as non-cash compensation over the vesting term using the straight-line basis for service-only awards and the accelerated basis for performance-based awards with graded vesting. For certain cliff vesting awards with performance criteria, we also use anticipated future results in determining the fair value of the award. Such value is recognized as expense over the service period, net of estimated forfeitures, using the straight-line recognition method. The amount of stock-based compensation expense recognized in the consolidated statements of income is reduced by estimated forfeitures, as the amount recorded is based on awards ultimately expected to vest. The expense associated with RSU awards to be settled in cash is initially measured at fair value at the grant date and expensed ratably over the vesting term, recording a liability subject to mark-to-market adjustments for changes in the price of the respective common stock as compensation expense.
Stock-based compensation is recorded within the same line item in our consolidated statements of income as the employee-related compensation of the award recipient, as disclosed in tabular format in Note 13.
Management must make certain estimates and assumptions regarding stock awards that will ultimately vest, and to the extent actual results or updated estimates differ from our current estimates, such amounts will be recorded as a cumulative adjustment in the period estimates are revised. We consider many factors when estimating expected forfeitures, including types of awards, employee class, and historical experience. The forfeiture rate is estimated at the grant date based on historical experience and revised, if necessary, in subsequent periods for any changes to the estimated forfeiture rate from that previously estimated. For any vesting tranche of an award, the cumulative amount of compensation cost recognized is at least equal to the portion of the grant-date value of the award tranche that is actually vested at that date. Tax benefits resulting from tax deductions in excess of the stock-based compensation expense recognized in the consolidated statements of income are reported as a component of financing cash flows. For the years ended December 31, 2015, 2014 2013 and 2012,2013, gross excess tax benefits from stock-based compensation reported as a component of financing cash flows were $1.9 million, $2.9$1.9 million and $3.0$2.9 million, respectively.
Earnings per Share
Basic earnings per share attributable to common stockholders is computed by dividing the net income attributable to common stockholders by the weighted average number of shares of common stock outstanding for the period. Treasury stock is excluded from the weighted average number of shares of common stock outstanding. Diluted earnings per share attributable to common stockholders is
INTERVAL LEISURE GROUP, INC. AND SUBSIDIARIES
NOTES TO CONSOLIDATED FINANCIAL STATEMENTS (Continued)
DECEMBER 31, 20142015
NOTE 2—SIGNIFICANT ACCOUNTING POLICIES (Continued)
shares of common stock outstanding. Diluted earnings per share attributable to common stockholders is computed based on the weighted average number of shares of common stock and dilutive securities outstanding during the period. Dilutive securities are common stock equivalents that are freely exercisable into common stock at less than market prices or otherwise dilute earnings if converted. The net effect of common stock equivalents is based on the incremental common stock that would be issued upon the assumed exercise of common stock options and the vesting of RSUs using the treasury stock method. Common stock equivalents are not included in diluted earnings per share when their inclusion is antidilutive. The computations of diluted earnings per share available to common stockholders do not include approximately 0.2 million stock options and 0.3 million RSUs for the year ended December 31, 2015, 0.8 million stock options and 0.2 million RSUs for the year ended December 31, 2014 and 0.8 million stock options for the year ended December 31, 2013, and 0.9 million stock options and 0.1 million RSUs for the year ended December 31, 2012, as the effect of their inclusion would have been antidilutive to earnings per share.
In connection with the spin-off, stock options to purchase ILG common stock were granted to non-ILG employees for which there is no future compensation expense to be recognized by ILG. As of December 31, 20142015, there were no stock options outstanding, and 2013,as of December 31, 2014, 0.8 million of stock options remained outstanding.
The computation of weighted average common and common equivalent shares used in the calculation of basic and diluted earnings per share is as follows (in thousands):
| | Year Ended December 31, | Year Ended December 31, | ||||||||||||||||||
|---|---|---|---|---|---|---|---|---|---|---|---|---|---|---|---|---|---|---|---|---|
| | 2014 | 2013 | 2012 | 2015 | 2014 | 2013 | ||||||||||||||
Basic weighted average shares of common stock outstanding | 57,343 | 57,243 | 56,549 | 57,400 | 57,343 | 57,243 | ||||||||||||||
Net effect of common stock equivalents assumed to be vested related to RSUs | 606 | 581 | 685 | 588 | 606 | 581 | ||||||||||||||
Net effect of common stock equivalents assumed to be exercised related to stock options held by non-employees | 4 | 8 | 14 | 1 | 4 | 8 | ||||||||||||||
| | | | | | | | | | | | | | | | | | | | | |
Diluted weighted average shares of common stock outstanding | 57,953 | 57,832 | 57,248 | 57,989 | 57,953 | 57,832 | ||||||||||||||
| | | | | | | | | | | | | | | | | | | | | | |
| | | | | | | | | | | | | | | | | | | | | |
Certain Risks and Concentrations
Geographic Risk
In regards to our Exchange and Rental segment, a substantial percentage of the vacation ownership resorts in the Interval Network are located in Florida, Hawaii, Las Vegas, Mexico and Southern California, while the majority of the revenue from our vacation rental businesses is derived from vacation properties located in Hawaii. In regards to our Vacation Ownership segment, the largest concentration of revenue derived from the management of vacation ownership properties resides in Spain with regard to our VRI Europe business. From an ILG perspective, approximately $231.6 million, $211.1 million and $146.6 million of 2015, 2014 and $127.0 million of 2014, 2013 and 2012 revenue, respectively, (excluding pass-through revenue) was generated from travel to properties located in all of these locations, together with vacation ownership management services and sales and financing activities performed in these locations.
INTERVAL LEISURE GROUP, INC. AND SUBSIDIARIES
NOTES TO CONSOLIDATED FINANCIAL STATEMENTS (Continued)
DECEMBER 31, 2014
NOTE 2—SIGNIFICANT ACCOUNTING POLICIES (Continued)
Business Risk
ILG also depends on relationships with developers and vacation property owners, as well as third party service providers for processing certain fulfillment services. We do not consider our overall
INTERVAL LEISURE GROUP, INC. AND SUBSIDIARIES
NOTES TO CONSOLIDATED FINANCIAL STATEMENTS (Continued)
DECEMBER 31, 2015
NOTE 2—SIGNIFICANT ACCOUNTING POLICIES (Continued)
business to be dependent on any one of these resort developers, provided, that the loss of a few large developers (particularly those from which Interval receives membership renewal fees directly) could materially impact our business. The loss of one or more of our largest management agreements could materially impact our businesses.
ILG's business also is subject to certain risks and concentrations including exposure to risks associated with online commerce security and credit card fraud.
Credit Risk
ILG is exposed to credit risk in relation to its portfolio of mortgage receivables associated with its vacation ownership business. We offer financing to purchasers of VOIs at our Hyatt-branded vacation ownership resorts and, as a result, ILG bears the risk of default on these loans. Should a purchaser default, ILG has the ability to foreclose and attempt to resell the associated VOI at its own cost to resell.
Other financial instruments that potentially subject ILG to concentration of credit risk consist primarily of cash and cash equivalents and restricted cash, which are maintained with high quality financial institutions. Financial instruments also contain secured loans that are recorded at the time of origination for the principal amount financed and are carried at amortized cost, net of any allowance for credit losses, as further discussed in Note 10.
Interest Rate Risk
ILG is exposed to interest rate risk through borrowings under our amended credit agreement which bears interest at variable rates. The interest rate on the amended credit agreement is based on (at our election) either LIBOR plus a predetermined margin that ranges from 1.25% to 2.25%2.5%, or the Base Rate as defined in the amended credit agreement plus a predetermined margin that ranges from 0.25% to 1.25%1.5%, in each case based on ILG's total leverage ratio.
Recent Accounting Pronouncements
With the exception of those discussed below, there have been no recent accounting pronouncements or changes in accounting pronouncements during the year ended December 31, 20142015 that are of significance, or potential significance, to ILG based on our current operations. The following summary of recent accounting pronouncements is not intended to be an exhaustive description of the respective pronouncement.
In February 2016, the FASB issued ASU 2016-02, "Leases (Topic 842)" ("ASU 2016-02"). ASU 2016-02 amends the existing accounting standards for lease accounting, including requiring lessees to recognize most leases on their balance sheets and making targeted changes to lessor accounting. The new guidance will be effective for public entities for annual periods beginning after December 15, 2018 and interim periods therein. Early adoption of ASU 2016-02 as of its issuance is permitted. The new leases standard requires a modified retrospective transition approach for all leases existing at, or entered into after, the date of initial application, with an option to use certain transition relief. We are currently evaluating the methods and impact of adopting the new leases standard on our consolidated financial statements.
INTERVAL LEISURE GROUP, INC. AND SUBSIDIARIES
NOTES TO CONSOLIDATED FINANCIAL STATEMENTS (Continued)
DECEMBER 31, 2015
NOTE 2—SIGNIFICANT ACCOUNTING POLICIES (Continued)
In January 2016, the FASB issued ASU 2016-01, "Financial Instruments—Overall (Subtopic 825-10)," which amends the guidance in U.S. GAAP on the classification and measurement of financial instruments. Although the ASU retains many current requirements, it significantly revises an entity's accounting related to (1) the classification and measurement of investments in equity securities and (2) the presentation of certain fair value changes for financial liabilities measured at fair value. The ASU also amends certain disclosure requirements associated with the fair value of financial instruments. The amendments in this update are effective for fiscal years beginning after December 31, 2017, including interim periods within those fiscal years. We are currently assessing the future impact of this new accounting standard update on our consolidated financial statements.
In September 2015, the FASB issued ASU 2015-16, "Business Combinations (Topic 805): Simplifying the Accounting for Measurement-Period Adjustments." The purpose of the ASU is to simplify the accounting for measurement-period adjustments related to business combinations. ASU 2015-16 requires an acquirer to recognize adjustments to provisional amounts that are identified during the measurement period, in the reporting period in which the adjustment amounts are determined. The amendments in this update are effective for fiscal years beginning after December 31, 2015, including interim periods within the fiscal year and should be applied prospectively. We do not currently anticipate the adoption of this guidance will have a material impact on our consolidated financial statements; however, we will continue to assess through the effective date the future impact, if any, of this new accounting update to our consolidated financial statements.
In August 2015, the FASB issued ASU 2015-14, "Revenue from Contracts with Customers (Topic 606): Deferral of the Effective Date," which defers by one year the effective date of ASU 2014-09, "Revenue from Contracts with Customers (Topic 606)" to annual reporting periods beginning after December 15, 2017, including interim periods within that reporting period. ASU 2014-09 supersedes revenue recognition requirements in Topic 605, "Revenue Recognition." The purpose of the ASU 2014-09 is to clarify the principles for recognizing revenue and to develop a common revenue standard for U.S. GAAP and IFRS that would remove inconsistencies and weaknesses in revenue requirement; provide a more robust framework for addressing revenue issues; improve comparability of revenue recognition practices across entities and industries; provide more useful information to users of financial statements through improved disclosure requirements and to simplify the preparation of financial statements. Given the complexities of this new standard, we are unable to determine, at this time, whether adoption of this standard will have a material impact on our consolidated financial position, results of operations, cash flows or related disclosures; however, we will continue to assess through the effective date the future impact, if any, of this new accounting update to our consolidated financial statements.
In April 2015, the FASB issued ASU 2015-05, "Intangibles—Goodwill and Other—Internal-Use Software (Subtopic 350-40): Customer's Accounting for Fees Paid in a Cloud Computing Arrangement." The FASB amended its guidance on internal use software to clarify how customers in cloud computing arrangements should determine whether the arrangement includes a software license. The guidance also eliminates the existing requirement for customers to account for software licenses they acquire by analogizing to the guidance on leases. Instead, entities will account for these arrangements as licenses of intangible assets. The ASU is effective for annual periods, including interim periods within those annual periods, beginning after December 15, 2015. Early adoption is permitted. We do not currently anticipate the adoption of this guidance will have a material impact on our
INTERVAL LEISURE GROUP, INC. AND SUBSIDIARIES
NOTES TO CONSOLIDATED FINANCIAL STATEMENTS (Continued)
DECEMBER 31, 2015
NOTE 2—SIGNIFICANT ACCOUNTING POLICIES (Continued)
consolidated financial statements; however, we will continue to assess through the effective date the future impact, if any, of this new accounting update to our consolidated financial statements.
In February 2015, the FASB issued ASU 2015-02, "Consolidation (Topic 810): Amendments to the Consolidation Analysis" ("ASU 2015-02"). The amendments in this topic are intended to improve and simplify targeted areas of the consolidation guidance. ASU 2015-02 modifies the method for determining whether limited partnerships and similar legal entities are variable interest entities ("VIEs") or voting interest entities. Further, it eliminates the presumption that a general partner should consolidate a limited partnership and impacts the consolidation analysis of reporting entities that are involved with VIEs, particularly those that have fee arrangements and related party relationships. The ASU is effective for fiscal years beginning after December 15, 2015 (and interim periods within those fiscal years). Early adoption is permitted. We do not currently anticipate the adoption of this guidance will have a material impact on our consolidated financial statements; however, we will continue to assess through the effective date the future impact, if any, of this new accounting update to our consolidated financial statements.
In January 2015, the FASB issued Accounting Standards Update ("ASU")ASU 2015-01, "Income Statement—Extraordinary and Unusual Items (Subtopic 225-20): Simplifying Income Statement Presentation by Eliminating the Concept of Extraordinary Items" ("ASU 2015-01"). ASU 2015-01 eliminates from generally accepted accounting principles (GAAP) the concept of extraordinary items as part of the FASB's initiative to reduce complexity in accounting standards (the Simplification Initiative).
INTERVAL LEISURE GROUP, INC. AND SUBSIDIARIES
NOTES TO CONSOLIDATED FINANCIAL STATEMENTS (Continued)
DECEMBER 31, 2014
NOTE 2—SIGNIFICANT ACCOUNTING POLICIES (Continued)
ASC 225-20 requires a reporting entity to separately classify, present and disclose extraordinary events and transactions if the event or transaction meets both of the following criteria for extraordinary item classification: unusual nature and infrequency of occurrence. If an event or transaction meets the criteria for extraordinary classification, a reporting entity is required to segregate the extraordinary item from the results of ordinary operations and show them separately in the income statement, net of tax, after from income from continuing operations. Under ASU 2015-01, the concept of extraordinary item is eliminated from the ASC Master Glossary and replaced with definitions for infrequency of occurrence and unusual nature. The presentation and disclosure guidance in ASC 225-20 for items that are unusual in nature or incur infrequently will be retained and will be expanded to include items that are both unusual in nature and infrequently occurring. The ASU is effective for fiscal years beginning after December 15, 2015 (and interim periods within those fiscal years). A reporting entity may apply the amendments in the ASU prospectively and also may apply the amendments retrospectively to all prior periods presented in the financial statements. Early adoption is permitted. We do not currently anticipate the adoption of this guidance will have a material impact on our consolidated financial position, results of operations, cash flows or related disclosures.
In November 2014, the FASB issued ASU 2014-17, "Business Combinations (Topic 815)—Pushdown Accounting: A Consensus of the FASB Emerging Issues Task Force" ("ASU 2014-17"). ASU 2014-17 provides an acquired entity with an optionstatements; however, we will continue to apply pushdown accounting in its separate financial statements upon occurrence of an event in which an acquirer obtains control of the acquired entity. An acquired entity may elect the option to apply pushdown accounting in the reporting period in which the change-in-control event occurs. An acquired entity should determine whether to elect to apply pushdown accounting for each individual change-in-control event in which an acquirer obtains control of the acquired entity. If pushdown accounting is not applied in the reporting period in which the change-in-control event occurs, an acquired entity will have the option to elect to apply pushdown accounting in a subsequent reporting period to the acquired entity's most recent change-in-control event. An election to apply pushdown accounting in a reporting period after the reporting period in which the change-in-control event occurred should be considered a change in accounting principle in accordance with ASC 250, "Accounting Changes and Error Corrections." The ASU was effective on November 18, 2014. Afterassess through the effective date an acquired entity can make an electionthe future impact, if any, of this new accounting update to apply the guidance to future change-in-control events or to its most recent change-in-control event. However, if the financial statements for the period in which the most recent change-in-control event occurred already have been issued or made available to be issued, the application of the ASU would be a change in accounting principle. On the effective date, we made the election to apply the guidance in the ASU to future change-in-control events. We do not anticipate the adoption of the ASU will have a material impact on our consolidated financial position, results of operations, cash flows or related disclosures.statements.
In August 2014, the FASB issued ASU 2014-15, "Presentation of Financial Statements—Going Concern (Subtopic 205-40): Disclosure of Uncertainties About an Entity's Ability to Continue as a Going Concern ("ASU 2014-15")." ASU 2014-15 requires management to perform interim and annual assessments on whether there are conditions or events that raise substantial doubt about the entity's ability to continue as a going concern within one year of the date the financial statements are issued and to provide related disclosures, if required. The ASU is effective for fiscal years beginning after December 15, 2016 (and interim periods within those fiscal years), with early adoption permitted. The
INTERVAL LEISURE GROUP, INC. AND SUBSIDIARIES
NOTES TO CONSOLIDATED FINANCIAL STATEMENTS (Continued)
DECEMBER 31, 2015
NOTE 2—SIGNIFICANT ACCOUNTING POLICIES (Continued)
standard allows for either a full retrospective or modified retrospective transition method. We do not currently anticipate the adoption of this guidance will have a material impact on our consolidated financial position, results of operations, cash flows or related disclosures.
INTERVAL LEISURE GROUP, INC. AND SUBSIDIARIES
NOTES TO CONSOLIDATED FINANCIAL STATEMENTS (Continued)
DECEMBER 31, 2014
NOTE 2—SIGNIFICANT ACCOUNTING POLICIES (Continued)
In June 2014, the FASB issued ASU No. 2014-12, "Compensation—Stock Compensation (Topic 718): Accounting for share-based payments when the terms of an award provide that a performance target could be achieved after the requisite service period ("ASU 2014-12")." ASU 2014-12 clarifies that entities should treat performance targets that can be met after the requisite service period of a share-based payment award as performance conditions that affect vesting. Therefore, an entity would not record compensation expense (measured as of the grant date without taking into account the effect of the performance target) related to an award for which transfer to the employee is contingent on the entity's satisfaction of a performance target until it becomes probable that the performance target will be met. No new disclosures are required under ASU 2014-12. The ASU is effective for fiscal years beginning after December 15, 2015 (and interim periods within that period), with early adoption permitted. In addition, all entities will have the option of applying the guidance either prospectively (i.e. only to awards granted or modified on or after the effective date of the issue) or retrospectively. Retrospective application would only apply to awards with performance targets outstanding at or after the beginning of the first annual period presented (i.e., the earliest presented comparative period). We do not currently anticipate the adoption of this guidance will have a material impact on our consolidated financial position, results of operations, cash flows or related disclosures; however, we will continue to assess through the effective date the future impact, if any, of this new accounting update to our consolidated financial statements.
In May 2014, the FASB issued ASU No. 2014-09, "Revenue from Contracts with Customers (Topic 606) ("ASU 2014-09"). The FASB and the International Accounting Standards Board ("IASB") initiated a joint project to clarify the principles for recognizing revenue and to develop a common revenue standard for U.S. GAAP and IFRS that would: (i) remove inconsistencies and weaknesses in revenue requirements; (ii) provide a more robust framework for addressing revenue issues; (iii) improve comparability of revenue recognition practices across entities, industries, jurisdictions, and capital markets; (iv) provide more useful information to users of financial statements through improved disclosure requirements; and (v) simplify the preparation of financial statements by reducing the number of requirements to which an entity must refer. To meet those objectives, the FASB amended the FASB Accounting Standards Codification ("Codification") and created a new Topic 606, Revenue from Contracts with Customers. The core principle of the guidance in ASU 2014-09 is that an entity should recognize revenue to depict the transfer of promised goods or services to customers in an amount that reflects the consideration to which the entity expects to be entitled in exchange for those goods or services. The guidance in this ASU supersedes the revenue recognition requirements in Topic 605, Revenue Recognition, and most industry specific guidance throughout the Industry Topics of the Codification. Additionally, ASU 2014-09 supersedes some cost guidance included in Subtopic 605-35, Revenue Recognition—Construction-Type and Production-Type Contracts. The ASU is effective for fiscal years beginning after December 15, 20162017 (and interim periods within that period); early adoption is not permitted. Given the complexities of this new standard, we are unable to determine, at this time, whether adoption of this standard will have a material impact on our consolidated financial position, results of operations, cash flows or related disclosures; however, we will continue to assess through the effective date the future impact, if any, of this new accounting update to our consolidated financial statements.
INTERVAL LEISURE GROUP, INC. AND SUBSIDIARIES
NOTES TO CONSOLIDATED FINANCIAL STATEMENTS (Continued)
DECEMBER 31, 2015
NOTE 2—SIGNIFICANT ACCOUNTING POLICIES (Continued)
Adopted Accounting Pronouncements
In November 2015, FASB issued ASU 2015-17, Income Taxes (Topic 740) Balance Sheet Classification of Deferred Taxes ("ASU 2015-17") which requires that deferred tax assets and liabilities be classified as noncurrent in a classified balance sheet. ASU 2015-17 is effective for public companies for fiscal years beginning after December 15, 2016 with early adoption permitted. ILG has elected to early adopt ASU 2015-17 prospectively in the fourth quarter of 2015. As a result, we have presented all deferred tax assets and related valuation allowances, and liabilities as noncurrent on our consolidated balance sheet as of December 31, 2015, but have not reclassified current deferred tax assets and liabilities on our consolidated balance sheet as of December 31, 2014.
In August 2015, the FASB issued ASU 2015-15, "Interest—Imputation of Interest (Subtopic 835-30): Presentation and Subsequent Measurement of Debt Issuance Costs Associated with Line-of-Credit Arrangements," to clarify the SEC staff's position on presenting and measuring debt issuance costs incurred in connection with line-of-credit arrangements given the lack of guidance on this topic in ASU 2015-03. The SEC staff noted that it would not object to an entity deferring and presenting debt issuance costs as an asset and subsequently amortizing the deferred debt issuance costs ratably over the term of the line-of-credit arrangement, regardless of whether there are any outstanding borrowings on the line-of-credit arrangement. This ASU was effective upon issuance. The adoption of this guidance did not have a material impact on our consolidated financial statements.
In June 2015, the FASB issued ASU 2015-10, "Technical Corrections and Improvements." The purpose of this ASU is to clarify guidance, correct unintended application of guidance, or make minor improvements to guidance that are not expected to have a significant effect on current accounting practice or create a significant administrative cost to most entities. Additionally, some of the amendments are intended to simplify guidance by making it easier to understand and easier to apply by eliminating inconsistencies, providing needed clarifications, and improving the presentation of guidance in the Codification. Transition guidance varies based on the amendments in this update. The amendments in this update that require transition guidance are effective for all entities for fiscal years, and interim periods within those fiscal years, beginning after December 15, 2015. Early adoption is permitted, including adoption in an interim period. All other amendments will be effective upon the issuance of this update. The adoption of this guidance did not have a material impact on our consolidated financial statements.
In April 2015, the FASB issued ASU 2015-03, "Interest—Imputation of Interest (Subtopic 835-30): Simplifying the Presentation of Debt Issuance Costs" ("ASU 2015-03"). ASU 2015-03 simplifies presentation of debt issuance costs, requiring debt issuance costs related to a recognized debt liability be presented in the balance sheet as a direct deduction from the carrying amount of that debt liability, consistent with debt discounts. The guidance in the standard is limited to the presentation of debt issuance costs and does not affect the recognition and measurement of debt issuance costs. The amortization of such costs are to continue being calculated using the interest method and be reported as interest expense. The ASU is effective for fiscal years beginning after December 15, 2015 (and interim periods within those fiscal years). Early adoption is permitted for financial statements that have not been previously issued and will be applied on a retrospective basis. We adopted the provisions of the ASU as of June 30, 2015 retrospectively and the adoption did not have a material impact on our consolidated financial position, results of operations, cash flows or related disclosures. Other
INTERVAL LEISURE GROUP, INC. AND SUBSIDIARIES
NOTES TO CONSOLIDATED FINANCIAL STATEMENTS (Continued)
DECEMBER 31, 2015
NOTE 2—SIGNIFICANT ACCOUNTING POLICIES (Continued)
non-current assets and long-term debt on our consolidated balance sheet as of December 31, 2014 has been retrospectively adjusted by $3.6 million to effectuate the adoption of this ASU as described above.
In April 2014, the FASB issued ASU No. 2014-08, "Presentation of Financial Statements (Topic 205) and Property, Plant, and Equipment (Topic 360)" ("ASU 2014-08"). The amendments in ASU 2014-08 change the requirements for reporting and disclosing discontinued operations. Among other items, this new guidance defines a discontinued operation as a disposal of a component or group of components
INTERVAL LEISURE GROUP, INC. AND SUBSIDIARIES
NOTES TO CONSOLIDATED FINANCIAL STATEMENTS (Continued)
DECEMBER 31, 2014
NOTE 2—SIGNIFICANT ACCOUNTING POLICIES (Continued)
that is disposed of or is classified as held for sale and "represents a strategic shift that has (or will have) a major effect on an entity's operations and financial results." The standard states that a strategic shift could include a disposal of (i) a major geographical area of operations, (ii) a major line of business, (iii) a major equity method investment, or (iv) other major parts of an entity. The ASU is effective for fiscal years beginning after December 15, 2014 (and interim periods within those fiscal years), with early adoption permitted. We do not currently anticipate theThe adoption of this guidance willdid not have a material impact on our consolidated financial position, results of operations, cash flows or related disclosures; however, we will continue to assess through the effective date the future impact, if any, of this new accounting update to our consolidated financial statements.
In January 2014, the FASB issued ASU No. 2014-04, "Receivables—Troubled Debt Restructurings by Creditors (Subtopic 310-40): Reclassification of Residential Real Estate Collateralized Consumer Mortgage Loans upon Foreclosure" ("ASU 2014-04"). Current US GAAP requires a loan to be reclassified to Other Real Estate Owned ("OREO") upon a troubled debt restructuring that is "in substance a repossession or foreclosure," where the creditor receives "physical possession" of the debtor's assets regardless of whether formal foreclosure proceedings take place. The amendments in ASU 2014-04 clarify when an "in substance a repossession or foreclosure" and "physical possession" has occurred as these terms are not defined in US GAAP, in addition to requiring certain supplementary interim and annual disclosures. The ASU is effective for fiscal years beginning after December 15, 2014 (and interim periods within those fiscal years) and shall be applied prospectively, with early adoption permitted. We do not currently anticipate theThe adoption of this guidance will have a material impact on our consolidated financial position, results of operations, cash flows or related disclosures; however, we will continue to assess through the effective date the future impact, if any, of this new accounting update to our consolidated financial statements.
Adopted Accounting Pronouncements
In March 2013, the FASB issued ASU 2013-05, "Foreign Currency Matters (Topic 830): Parent's Accounting for the Cumulative Translation Adjustment ("CTA") upon Derecognition of Certain Subsidiaries or Groups of Assets within a Foreign Entity or of an Investment in a Foreign Entity (a consensus of the FASB Emerging Issues Task Force)" ("ASU 2013-05"). ASU 2013-05 applies to the release of the CTA into net income when a parent either sells a part or all of its investment in a foreign entity or no longer holds a controlling financial interest in a subsidiary or group of assets that is a business (other than a sale of in substance real estate or conveyance of oil and gas mineral rights) within a foreign entity. The ASU does not change the requirement to release a pro rata portion of the CTA of the foreign entity into earnings for a partial sale of an equity method investment in a foreign entity. The adoption of ASU 2013-02 did not have a material impact on our consolidated financial position, resultsstatements.
NOTE 3—BUSINESS COMBINATIONS
Vistana Pending Acquisition
On October 27, 2015, we entered into an Agreement and Plan of operations, cash flows or related disclosures.
In February 2013,Merger (Merger Agreement), with Starwood Hotels & Resorts Worldwide, Inc. (Starwood), Vistana Signature Experiences, Inc. (Vistana) and our newly formed subsidiary, pursuant to which we will acquire Vistana, the FASB issued ASU 2013-02, "Comprehensive Income (Topic 220): Reportingvacation ownership business of Amounts Reclassified OutStarwood. Pursuant to ASC 805, we have identified ILG as the acquirer for purposes of Accumulated Other Comprehensive Income" ("ASU 2013-02"). ASU 2013-02 adds new disclosure requirements for items reclassified outapplying the acquisition method of accumulated other comprehensive income/loss ("AOCI"), including (1) disaggregatingaccounting. The acquisition will be effected through a "Reverse Morris Trust" structure, which means that Vistana will be spun-off to Starwood's shareholders pursuant to a Separation Agreement and separately presenting changes in AOCI balances by component and (2) presenting significant items reclassified outthen merged with our subsidiary with Vistana shareholders receiving stock of AOCI either onILG. Vistana will be the facesurviving entity of the statement where net income is presentedmerger. Prior to the spin-off, a cash payment will be made to Starwood of approximately $132 million, subject to adjustment. In consideration for the sale of certain assets and liabilities related to the Vistana business to one or more ILG subsidiaries, ILG will make a cash payment equal to the fair market value of those assets and liabilities. If the purchase price of the assets exceeds the $132 million payment, as a separate disclosureadjusted, Starwood will contribute the difference in cash to Vistana and if the notes$132 million payment, as adjusted, exceeds the purchase price of the assets, Vistana will distribute the difference to Starwood. Included in the
INTERVAL LEISURE GROUP, INC. AND SUBSIDIARIES
NOTES TO CONSOLIDATED FINANCIAL STATEMENTS (Continued)
DECEMBER 31, 20142015
NOTE 2—SIGNIFICANT ACCOUNTING POLICIES (Continued)
financial statements. It does not amend any existing requirements for reporting net income or other comprehensive income in the financial statements. The ASU is effective for fiscal years beginning after December 15, 2012 (and interim periods within those years), and shall be applied prospectively. The adoption of ASU 2013-02 did not have a material impact on our consolidated financial position, results of operations, cash flows or related disclosures.
In July 2012, the FASB issued ASU 2012-02, "Intangibles—Goodwill and Other (Topic 350): Testing Indefinite-Lived Intangible Assets for Impairment" ("ASU 2012-02"). ASU 2012-02 amends the guidance on testing indefinite-lived intangible assets, other than goodwill, for impairment. Under the revised guidance, entities testing an indefinite-lived intangible asset for impairment have the option of performing a qualitative assessment before calculating the fair value of the asset. If entities determine, on the basis of qualitative factors, that the likelihood of the indefinite-lived intangible asset being impaired is below a "more likely than not" threshold (i.e., a likelihood of more than 50 percent), the entity would not need to calculate the fair value of the asset. The ASU does not revise the requirement to test indefinite-lived intangible assets annually for impairment and does not amend the requirement to test these assets for impairment between annual tests if there is a change in events or circumstances. The amendments in this ASU are effective for annual and interim impairment tests performed for fiscal years beginning after September 15, 2012. Early adoption is permitted. We adopted this guidance as of October 1, 2012—the date of our 2012 annual impairment test. The adoption of this guidance did not have a material impact on our consolidated financial position, results of operations, cash flows or related disclosures.
NOTE 3—BUSINESS COMBINATIONS (Continued)
assets being purchased by ILG and transferred to Vistana prior to the merger are the vacation ownership business and five hotels that are expected to be converted into vacation ownership properties over time. The combination will result in Starwood shareholders owning, at the closing, approximately 55% of the combined company on a fully diluted basis, with existing shareholders of ILG owning approximately 45% of the combined company. Completion of the merger, expected to occur during the second quarter of 2016, is subject to customary closing conditions, including regulatory and ILG shareholder approvals. Liberty Interactive Corp and certain of ILG's senior executives have entered into Voting and Support Agreements, which provide for them to vote in favor of the issuance of ILG shares pursuant to the merger. During the year ended December 31, 2015, we incurred approximately $7 million of transaction costs related to the Vistana pending acquisition.
The Merger Agreement contains certain termination rights including Starwood's right to terminate if ILG's board changes its recommendation regarding issuance of ILG common stock for the merger or ILG's termination in order to enter into an agreement for a superior proposal, in each case prior to stockholder approval. For these terminations, ILG would be required to pay Starwood a termination fee of $40 million, which could also be payable for certain other terminations if ILG enters into an agreement with respect to a competing proposal within 12 months of termination of the Merger Agreement.
In connection with the transaction, Vistana will enter into an 80-year exclusive global license agreement for the use of the Westin and Sheraton brands in vacation ownership in addition to the non-exclusive license for the existing St. Regis and The Luxury Collection vacation ownership properties. Under the terms of the license agreement, Starwood will receive an annual base royalty fee of $30 million plus 2% of vacation ownership interest sales. Vistana will also enter into an agreement regarding its continued participation in the Starwood Preferred Guest loyalty program. Also, Starwood and ILG will enter into a Noncompetition Agreement that will restrict, for ten years, Starwood from competing with ILG's vacation ownership business and restrict ILG from competing with Starwood's hotel business, subject to specified exceptions.
Additional transaction-related agreements include, among others:
HVO Acquisition
On October 1, 2014, we completed the acquisition of Hyatt Residential Group, now operating as Hyatt Vacation Ownership or HVO, from wholly-owned subsidiaries of Hyatt Hotels Corporation. In connection with the acquisition, a subsidiary of ILG entered into a global Master License Agreement which provides for an exclusive license for use of the Hyatt® brand with respect to the shared ownership business in exchange for license fees. Additionally, in connection with the acquisition, we
INTERVAL LEISURE GROUP, INC. AND SUBSIDIARIES
NOTES TO CONSOLIDATED FINANCIAL STATEMENTS (Continued)
DECEMBER 31, 2015
NOTE 3—BUSINESS COMBINATIONS (Continued)
have agreed to guarantee up to $36.7 million of the construction loan for the Maui project. The aggregate purchase price was approximately $218 million in cash, which was subject to final adjustment for working capital.
TheAs disclosed in our 2014 Annual Report on Form 10-K, the HVO acquisition iswas recorded on our consolidated balance sheet as of October 1, 2014 based upon estimated fair values as of such date. The results of operations related to this business are included in our consolidated statements of income since October 1, 2014 and within our Exchange and Rental and Vacation Ownership segments for segment reporting purposes on the basis of its respective business activities.
2013 Business Combinations
During the fourth quarter of 2013 we completed two acquisitions that were not individually significant which were accounted for as business combinations ("2013 acquisitions"). We purchased the European shared ownership resort management business of CLC and all of the equity of Aqua, a
INTERVAL LEISURE GROUP, INC. AND SUBSIDIARIES
NOTES TO CONSOLIDATED FINANCIAL STATEMENTS (Continued)
DECEMBER 31, 2014
NOTE 3—BUSINESS COMBINATIONS (Continued)
Hawaii-based hotel and resort management company, for an aggregate purchase price of $167.2 million. The aggregate purchase price for the 2013 acquisitions consisted of $128.1 million in cash, $7.8 million of accrued additional purchase price, and, as part of the CLC transaction, equity in the form of a noncontrolling interest with a fair value of $31.3 million. The fair value of the noncontrolling interest in VRI Europe was determined based on the total purchase price, less cash consideration paid by ILG. The initial purchase price for the CLC transaction was subject to adjustment for actual results of the business for the year ended December 31, 2013 and working capital excess or deficit on the acquisition date. As of December 31, 2013, we accrued approximately $8.0 million of net additional purchase price consideration related to these items.
These acquisitions are recorded on our consolidated balance sheets as of their respective fourth quarter of 2013 acquisition dates and based upon their estimated fair values at such dates. The results of operations of these acquired businesses are included in our consolidated statements of income since their respective acquisition dates and, for segment reporting purposes, within our Vacation Ownership segment for VRI Europe and Exchange and Rental segment for Aqua.
Contingent Consideration
In connection with the VRI Europe transaction, we had an obligation to transfer additional cash consideration, resulting in incremental noncontrolling interest value in VRI Europe, based on final results of the acquired business for the twelve months ended December 31, 2013. During the second quarter of 2014, the parties reached final agreement resulting in a downward adjustment to the amount of contingent consideration by approximately $1.3 million, net of noncontrolling interest, which was recognized in earnings during that quarter. The final agreed upon liability of $6.5 million was settled in full during the second quarter of 2014.
Additionally, in connection with our fourth quarter 2013 acquisitions, certain amounts related to the purchase consideration paid at closing were deposited into escrow to be held subject to specified future events which could occur over a period ranging from the respective acquisition dates up to 36 months thereafter, as applicable. Pursuant to ASC 805, we consider these escrowed funds to be contingent consideration whereby their release from escrow is subject to future performance. During the second quarter of 2014, the performance related to these escrowed funds was completed and consequently, the escrowed funds were released to the respective third parties and our contingent consideration liability (and corresponding asset representing the prepayment into escrow) was relieved on our consolidated balance sheet as of June 30, 2014.
INTERVAL LEISURE GROUP, INC. AND SUBSIDIARIES
NOTES TO CONSOLIDATED FINANCIAL STATEMENTS (Continued)
DECEMBER 31, 2014
NOTE 3—BUSINESS COMBINATIONS (Continued)
Purchase Price Allocation
The following table presents the allocation of total purchase price consideration to the assets acquired and liabilities assumed, based on their estimated fair values as of their respective acquisition dates (in thousands):
| | HVO acquisition | 2013 acquisitions | |||||
|---|---|---|---|---|---|---|---|
Cash | $ | 16,828 | $ | 1,167 | |||
Other current assets | 110,956 | 10,233 | |||||
Goodwill(1) | 22,539 | 34,533 | |||||
Intangible assets | 61,500 | 131,857 | |||||
Other noncurrent assets | 47,471 | 15,759 | |||||
Current liabilities | (26,863 | ) | (11,355 | ) | |||
Other noncurrent liabilities | (10,910 | ) | (14,946 | ) | |||
| | | | | | | | |
Net assets acquired | $ | 221,521 | $ | 167,248 | |||
| | | | | | | | |
| | | | | | | | |
| | | | | | | | |
The purchase price allocated to the fair value of goodwill and identifiable intangible assets associated with the HVO and 2013 acquisitions are as follows (in thousands):
HVO acquisition | Cost | Useful Life (Years) | |||||
|---|---|---|---|---|---|---|---|
Goodwill | $ | 22,539 | N/A | ||||
Customer relationships | 38,900 | 22 | |||||
Resorts management contracts | 22,600 | 22 | |||||
| | | | | | | | |
Total | $ | 84,039 | |||||
| | | | | | | | |
| | | | | | | | |
| | | | | | | | |
2013 acquisitions | Cost | Useful Life (Years) | |||
|---|---|---|---|---|---|
Goodwill | $ | 34,533 | N/A | ||
Trademarks | 3,000 | N/A | |||
Resort management contracts (indefinite-lived) | 90,237 | N/A | |||
Resort management contracts (definite-lived) | 34,640 | 3 - 30 | |||
Other intangibles | 3,980 | 4 - 10 | |||
| | | | | | |
Total | $ | 166,390 | |||
| | | | | | |
| | | | | | |
| | | | | | |
In connection with the HVO acquisition we recorded total goodwill of $22.5 million and identifiable intangible assets of $61.5 million, all of which were definite-lived intangible assets, related to HVO's membership base in their Hyatt Residence Club (described in table above as customer relationships) and their resort management contracts. The amortization period, as of the respective acquisition date, for the definite-lived customer relationships and resort management contracts intangible assets noted in the table above is 22 years for each. The valuation of the assets acquired and liabilities assumed in connection with these acquisitions was based on their fair values at the acquisition
INTERVAL LEISURE GROUP, INC. AND SUBSIDIARIES
NOTES TO CONSOLIDATED FINANCIAL STATEMENTS (Continued)
DECEMBER 31, 2014
NOTE 3—BUSINESS COMBINATIONS (Continued)
date. The assets purchased and liabilities assumed for the HVO acquisitions have been reflected in the accompanying consolidated balance sheet as of December 31, 2014.
Additionally, as part of the HVO acquisition, ILG and Hyatt have agreed to make a joint election under Internal Revenue Code Section 338(h)(10), and comparable state and local tax code provisions, and as such ILG will receive a step-up in tax basis in the assets equal to the purchase price paid. In regards to the $22.5 million of HVO related goodwill, all is expected to be deductible for income tax purposes.
In connection with the 2013 acquisitions we recorded total goodwill of $34.5 million and identifiable intangible assets of $131.9 million, of which $93.2 million were indefinite-lived intangible assets and primarily related to management contracts and trademarks. The indefinite-lived resort management contracts were acquired in connection with the VRI Europe transaction and no legal, regulatory, contractual, competitive, economic, or other factors limit, over the foreseeable horizon, the period of time over which these resort management contracts are expected to contribute future cash flows. Of the $34.5 million of goodwill, $20.7 million is expected to be deductible for income tax purposes. The weighted average amortization period, as of the respective acquisition date, for the definite-lived resort management contracts and other intangible assets noted in the table above is 17.5 and 4.9 years, respectively. The valuation of the assets acquired and liabilities assumed in connection with these acquisitions was based on their fair values at the acquisition date. The assets purchased and liabilities assumed for the 2013 acquisitions have been reflected in the accompanying consolidated balance sheet as of December 31, 2013.
Results of Operations
Revenue and earnings before income taxes and noncontrolling interests related to these acquisitions were recognized in our consolidated statements of income totaling $29.4 million and $3.5 million, respectively, for the year ended December 31, 2014 and $12.2 million and $3.1 million, respectively, for the year ended December 31, 2013. Transaction costs, consisting primarily of professional fees, directly related to these acquisitions and expensed as incurred totaled $6.4 million and $2.3 million which are classified within the general and administrative expense line item in our consolidated statements of income for the year ended December 31, 2014 and 2013, respectively.
Pro forma financial information (unaudited)
The following unaudited pro forma financial information presents the consolidated results of ILG and HVO as if the acquisition had occurred on January 1, 2013. The pro forma results presented below for 2014 and 2013 are based on the historical financial statements of ILG and HVO, adjusted to reflect the purchase method of accounting. The pro forma information is not necessarily indicative of the consolidated results of operations that might have been achieved for the periods or dates indicated, nor is it necessarily indicative of the future results of the combined company. It does not reflect cost savings expected to be realized from the elimination of certain expenses and from synergies expected to be created or the costs to achieve such cost savings or synergies, if any. Income taxes do not reflect the amounts that would have resulted had ILG and HVO filed consolidated income tax returns during the
INTERVAL LEISURE GROUP, INC. AND SUBSIDIARIES
NOTES TO CONSOLIDATED FINANCIAL STATEMENTS (Continued)
DECEMBER 31, 2014
NOTE 3—BUSINESS COMBINATIONS (Continued)
periods presented. Pro forma adjustments are tax-effected at the ILG's estimated statutory tax rate of 38.9% for 2014 and 38.8% for 2013.
| | For the Year Ended | ||||||
|---|---|---|---|---|---|---|---|
(in thousands, except per share data | December 31, 2014 | December 31, 2013 | |||||
Revenue | $ | 696,681 | $ | 591,821 | |||
Net income attributable to common stockholders | $ | 74,974 | $ | 76,018 | |||
Earnings per share: | |||||||
Basic | $ | 1.31 | $ | 1.33 | |||
Diluted | $ | 1.29 | $ | 1.31 | |||
The unaudited pro forma financial information for 2014 and 2013 also includes $9.5 million and $3.4 million, respectively, of non-recurring charges related to the HVO acquisition, which are comprised of acquisition-related costs such as professional fees.
NOTE 4—GOODWILL AND OTHER INTANGIBLE ASSETS
Goodwill
Pursuant to FASB guidance as codified within ASC 350, Intangibles—Goodwill and Other ("ASC 350"), goodwill acquired in business combinations is assigned to the reporting unit(s) expected to benefit from the combination as of the acquisition date.
As discussed in Note 15, "Segment Information," ILG reorganized its management reporting structure in the fourth quarter of 2014 resulting in the following two operating and reportable segments: Exchange and Rental and Vacation Ownership. As a result of the change in operating segments, ILG's reporting units were also reorganized. The Exchange and Rental, and Vacation Ownership operating segments now each contain two reporting units as follows:
| OPERATING SEGMENTS | ||
|---|---|---|
| Exchange and Rental | Vacation Ownership | |
| Exchange reporting unit | VO management reporting unit | |
| Rental reporting unit | VO sales and financing reporting unit | |
In accordance with ASC 350, we reassigned our existing goodwill to these new reporting units utilizing a relative fair value allocation approach as of December 31, 2014. With the assistance of a third party specialist, we allocated goodwill based on their relative fair values as of December 31, 2014 to each new reporting unit as follows (in thousands):
| | Balance as of December 31, 2014 | |||
|---|---|---|---|---|
Exchange and Rental segment | ||||
Exchange reporting unit | $ | 495,748 | ||
Rental reporting unit | 20,396 | |||
Vacation Ownership segment | ||||
VO management reporting unit | 39,160 | |||
VO sales and financing reporting unit | 6,946 | |||
| | | | | |
Total goodwill | $ | 562,250 | ||
| | | | | |
| | | | | |
| | | | | |
INTERVAL LEISURE GROUP, INC. AND SUBSIDIARIES
NOTES TO CONSOLIDATED FINANCIAL STATEMENTS (Continued)
DECEMBER 31, 2014
NOTE 4—GOODWILL AND OTHER INTANGIBLE ASSETS (Continued)
The following tables present the balance of goodwill by reporting unit, including the changes in carrying amount of goodwill, for the years ended December 31, 20142015 and 20132014 (in thousands):
| | Balance as of January 1, 2014 | Additions | Deductions | Foreign Currency Translation | Goodwill Impairment | Balance as of December 31, 2014 | Balance as of January 1, 2015 | Additions | Deductions | Foreign Currency Translation | Goodwill Impairment | Balance as of December 31, 2015 | ||||||||||||||||||||||||||
|---|---|---|---|---|---|---|---|---|---|---|---|---|---|---|---|---|---|---|---|---|---|---|---|---|---|---|---|---|---|---|---|---|---|---|---|---|---|---|
Exchange | $ | 483,462 | $ | 12,286 | $ | — | $ | — | $ | — | $ | 495,748 | $ | 495,748 | $ | — | $ | — | $ | — | $ | — | $ | 495,748 | ||||||||||||||
Rental | 20,396 | — | — | — | — | 20,396 | 20,396 | — | — | — | — | 20,396 | ||||||||||||||||||||||||||
VO management | 36,981 | 3,307 | — | (1,128 | ) | — | 39,160 | 39,160 | — | — | (837 | ) | — | 38,323 | ||||||||||||||||||||||||
VO sales and financing | — | 6,946 | — | — | — | 6,946 | 6,946 | — | — | — | — | 6,946 | ||||||||||||||||||||||||||
| | | | | | | | | | | | | | | | | | | | | | | | | | | | | | | | | | | | | | | |
Total | $ | 540,839 | $ | 22,539 | $ | — | $ | (1,128 | ) | $ | — | $ | 562,250 | $ | 562,250 | $ | 0 | $ | — | $ | (837 | ) | $ | — | $ | 561,413 | ||||||||||||
| | | | | | | | | | | | | | | | | | | | | | | | | | | | | | | | | | | | | | | | |
| | | | | | | | | | | | | | | | | | | | | | | | | | | | | | | | | | | | | | | |
INTERVAL LEISURE GROUP, INC. AND SUBSIDIARIES
NOTES TO CONSOLIDATED FINANCIAL STATEMENTS (Continued)
DECEMBER 31, 2015
NOTE 4—GOODWILL AND OTHER INTANGIBLE ASSETS (Continued)
| | Balance as of January 1, 2013 | Additions | Deductions | Foreign Currency Translation | Goodwill Impairment | Balance as of December 31, 2013 | Balance as of January 1, 2014 | Additions | Deductions | Foreign Currency Translation | Goodwill Impairment | Balance as of December 31, 2014 | ||||||||||||||||||||||||||
|---|---|---|---|---|---|---|---|---|---|---|---|---|---|---|---|---|---|---|---|---|---|---|---|---|---|---|---|---|---|---|---|---|---|---|---|---|---|---|
Exchange | $ | 483,462 | $ | — | $ | — | $ | — | — | $ | 483,462 | $ | 483,462 | $ | 12,286 | $ | — | $ | — | — | $ | 495,748 | ||||||||||||||||
Rental | 4,796 | 15,600 | — | — | — | 20,396 | 20,396 | — | — | — | — | 20,396 | ||||||||||||||||||||||||||
VO management | 17,516 | 18,933 | — | 532 | — | 36,981 | 36,981 | 3,307 | — | (1,128 | ) | — | 39,160 | |||||||||||||||||||||||||
VO sales and financing | — | — | — | — | — | — | — | 6,946 | — | — | — | 6,946 | ||||||||||||||||||||||||||
| | | | | | | | | | | | | | | | | | | | | | | | | | | | | | | | | | | | | | | |
Total | $ | 505,774 | $ | 34,533 | $ | — | $ | 532 | $ | — | $ | 540,839 | $ | 540,839 | $ | 22,539 | $ | — | $ | (1,128 | ) | $ | — | $ | 562,250 | |||||||||||||
| | | | | | | | | | | | | | | | | | | | | | | | | | | | | | | | | | | | | | | | |
| | | | | | | | | | | | | | | | | | | | | | | | | | | | | | | | | | | | | | | |
In connection with the HVO acquisition, we recorded total goodwill of $22.5 million and identifiable intangible assets of $61.5 million, all of which are definite-lived intangible assets, related to HVO's membership base in their Hyatt Residence Club (referred to as customer relationships in following tables) and their resort management contracts.
The $22.5 million increase in goodwill for the year ended December 31, 2014 is a result of goodwill acquired in connection with the acquisition of HVO, together with the associated foreign currency translation of goodwill carried on the books of an ILG entity whose functional currency is not the US dollar. Goodwill is assigned to reporting units of ILG that are expected to benefit from the combination. The amount of goodwill assigned to a reporting unit is determined in a manner similar to how the amount of goodwill recognized in a business combination is determined, while using a reasonable methodology applied in a consistent manner. Based on the expected benefits from the business combination, we have assigned $12.3 million, $3.3 million and $6.9 million of HVO related goodwill to our Exchange, VO management and VO sales and financing reporting units, respectively.
In connection with the 2013 acquisitions, we recorded total goodwill of $34.5 million and identifiable intangible assets of $131.9 million, of which $93.2 million were indefinite-lived intangible assets and primarily related to management contracts and trademarks. The $35.1 million change in goodwill for the year ended December 31, 2013 is a result of goodwill acquired in connection with acquisitions consummated in 2013 together with the associated foreign currency translation of goodwill carried on the books of an ILG entity whose functional currency is not the US dollar.
INTERVAL LEISURE GROUP, INC. AND SUBSIDIARIES
NOTES TO CONSOLIDATED FINANCIAL STATEMENTS (Continued)
DECEMBER 31, 2014
NOTE 4—GOODWILL AND OTHER INTANGIBLE ASSETS (Continued)
Goodwill Impairment Tests
ILG tests goodwill and other indefinite-lived intangible assets for impairment annually as of October 1, or more frequently if events or changes in circumstances indicate that the assets might be impaired. Goodwill is tested for impairment based on either a qualitative assessment or a two-step impairment test, as more fully described in Note 2 of these consolidated financial statements. When performing the two-step impairment test, if the carrying amount of a reporting unit's goodwill exceeds its implied fair value, an impairment loss equal to the excess is recorded.
As of October 1, 2015, we assessed the carrying value of goodwill and other intangible assets of each of our four reporting units. We performed a qualitative assessment on our Exchange, Rental and VO Management reporting units for our 2015 annual test and concluded that it was more-likely-than-not that the fair value of each reporting exceeded its carrying value and, therefore, a two-step impairment test was not necessary. With regards to our VO Sales and Financing reporting unit, we elected to bypass the qualitative assessment and assessed the carrying value of goodwill pursuant to the two-step impairment approach. The first step of the impairment test concluded the carrying value of this reporting unit did not exceed its fair value; consequently, the second step of the impairment test was not necessary and goodwill was not determined to be impaired.
As of December 31, 2014, as a result of the reorganization of our management reporting structure and reporting units (see Note 15), we assessed the carrying value of goodwill pursuant to the two-step impairment approach. The first step of the impairment test concluded the carrying value of each reporting unit did not exceed its fair value; consequently, the second step of the impairment test was not necessary and goodwill was not determined to be impaired.
As of October 1, 2014, prior to the reorganization of our management reporting structure and reporting units, we assessed the carrying value of goodwill and other intangible assets of each of our
INTERVAL LEISURE GROUP, INC. AND SUBSIDIARIES
NOTES TO CONSOLIDATED FINANCIAL STATEMENTS (Continued)
DECEMBER 31, 2015
NOTE 4—GOODWILL AND OTHER INTANGIBLE ASSETS (Continued)
two reporting units. Goodwill assigned to our then reporting units, Membership and Exchange and Management and Rental, was $483.5 million and $57.4 million, respectively as of October 1, 2014. We performed a qualitative assessment on each of our reporting units for the 2014 annual test and concluded that it was more-likely-than-not that the fair value of each reporting exceeded its carrying value and, therefore, a two-step impairment test was not necessary.
As of October 1, 2013, we assessed the carrying value of goodwill and other intangible assets of each of our two reporting units at that time. Goodwill assigned to the Membership and Exchange, and Management and Rental reporting units as of that date was $483.5 million and $22.3 million, respectively. We elected to bypass the qualitative assessment for the 2013 annual test and performed the first step of the impairment test on both our reporting units. At the conclusion of that impairment test, we concluded that each reporting unit's fair value exceeded its carrying value and, therefore, the second step of the impairment test was not necessary. As of December 31, 2013, we did not identify any triggering events which required an interim impairment test subsequent to our annual impairment test on October 1, 2013.
Accumulated historical goodwill impairment losses as of January 1, 20132014 were $34.3 million which related to components within our vacation rentalRental reporting unit. There were no impairments of goodwill for our vacation rental reporting unit during fiscal year 2014 and 2013, and there have been no accumulated historical impairments of goodwill for any of our other reporting units through December 31, 2014.2015.
Other Intangible Assets
As of October 1, 2015, we performed a qualitative assessment on our indefinite-lived intangible assets and concluded that the likelihood of our indefinite-lived intangible assets being impaired was below the more-likely-than-not threshold stipulated in ASU 2012-02 and, therefore, calculating the fair value of these intangible assets was not warranted as of October 1, 2015.
As of October 1, 2014, we performed a qualitative assessment on our indefinite-lived intangible assets and concluded that the likelihood of our indefinite-lived intangible assets being impaired was below the more-likely-than-not threshold stipulated in ASU 2012-02 and, therefore, calculating the fair value of these intangible assets was not warranted as of October 1, 2014.
INTERVAL LEISURE GROUP, INC. AND SUBSIDIARIES
NOTES TO CONSOLIDATED FINANCIAL STATEMENTS (Continued)
DECEMBER 31, 2014
NOTE 4—GOODWILL AND OTHER INTANGIBLE ASSETS (Continued)
As of October 1, 2013, we elected to bypass the qualitative assessment for the required 2013 annual impairment test with respect to intangible assets with indefinite lives. For the 2013 impairment test we carried out a full impairment test which was comprised of calculating the fair value of these intangible assets and comparing such against their carrying amount. At the conclusion of that impairment test, we determined no impairment was required.
The balance of other intangible assets, net for the years ended December 31, 20142015 and 20132014 is as follows (in thousands):
| | December 31, | December 31, | ||||||||||||
|---|---|---|---|---|---|---|---|---|---|---|---|---|---|---|
| | 2014 | 2013 | 2015 | 2014 | ||||||||||
Intangible assets with indefinite lives | $ | 131,336 | $ | 136,713 | $ | 127,345 | $ | 131,336 | ||||||
Intangible assets with definite lives, net | 137,539 | 89,151 | 123,022 | 137,539 | ||||||||||
| | | | | | | | | | | | | | | |
Total intangible assets, net | $ | 268,875 | $ | 225,864 | $ | 250,367 | $ | 268,875 | ||||||
| | | | | | | | | | | | | | | | |
| | | | | | | | | | | | | | | |
The $5.4$4.0 million decrease in our indefinite-lived intangible assets during the year ended December 31, 20142015 pertains to associated foreign currency translation of intangible assets carried on the books of an ILG entity whose functional currency is not the US dollar.
At December 31, 20142015 and 2013,2014, intangible assets with indefinite lives relate to the following (in thousands):
| | December 31, | December 31, | ||||||||||||
|---|---|---|---|---|---|---|---|---|---|---|---|---|---|---|
| | 2014 | 2013 | 2015 | 2014 | ||||||||||
Resort management contracts | $ | 87,420 | $ | 92,797 | $ | 83,429 | $ | 87,420 | ||||||
Trade names and trademarks | 43,916 | 43,916 | 43,916 | 43,916 | ||||||||||
| | | | | | | | | | | | | | | |
Total | $ | 131,336 | $ | 136,713 | $ | 127,345 | $ | 131,336 | ||||||
| | | | | | | | | | | | | | | | |
| | | | | | | | | | | | | | | |
INTERVAL LEISURE GROUP, INC. AND SUBSIDIARIES
NOTES TO CONSOLIDATED FINANCIAL STATEMENTS (Continued)
DECEMBER 31, 2015
NOTE 4—GOODWILL AND OTHER INTANGIBLE ASSETS (Continued)
At December 31, 2015, intangible assets with definite lives relate to the following (in thousands):
| | Cost | Accumulated Amortization | Net | Weighted Average Remaining Amortization Life (Years) | |||||||||
|---|---|---|---|---|---|---|---|---|---|---|---|---|---|
Customer relationships | $ | 168,400 | $ | (131,710 | ) | $ | 36,690 | 20.8 | |||||
Purchase agreements | 75,879 | (75,879 | ) | — | — | ||||||||
Resort management contracts | 129,168 | (46,576 | ) | 82,592 | 13.7 | ||||||||
Technology | 25,076 | (25,076 | ) | — | — | ||||||||
Other | 21,798 | (18,058 | ) | 3,740 | 2.5 | ||||||||
| | | | | | | | | | | | | | |
Total | $ | 420,321 | $ | (297,299 | ) | $ | 123,022 | ||||||
| | | | | | | | | | | | | | |
| | | | | | | | | | | | | | |
| | | | | | | | | | | | | | |
At December 31, 2014, intangible assets with definite lives relate to the following (in thousands):
| | Cost | Accumulated Amortization | Net | Weighted Average Remaining Amortization Life (Years) | |||||||||
|---|---|---|---|---|---|---|---|---|---|---|---|---|---|
Customer relationships | $ | 168,400 | $ | (129,942 | ) | $ | 38,458 | 21.8 | |||||
Purchase agreements | 75,879 | (75,443 | ) | 436 | 0.9 | ||||||||
Resort management contracts | 129,864 | (36,790 | ) | 93,074 | 13.8 | ||||||||
Technology | 25,076 | (25,076 | ) | — | — | ||||||||
Other | 21,815 | (16,244 | ) | 5,571 | 3.4 | ||||||||
| | | | | | | | | | | | | | |
Total | $ | 421,034 | $ | (283,495 | ) | $ | 137,539 | ||||||
| | | | | | | | | | | | | | |
| | | | | | | | | | | | | | |
| | | | | | | | | | | | | | |
INTERVAL LEISURE GROUP, INC. AND SUBSIDIARIES
NOTES TO CONSOLIDATED FINANCIAL STATEMENTS (Continued)
DECEMBER 31, 2014
NOTE 4—GOODWILL AND OTHER INTANGIBLE ASSETS (Continued)
At December 31, 2013, intangible assets with definite lives relate to the following (in thousands):
| | Cost | Accumulated Amortization | Net | Weighted Average Remaining Amortization Life (Years) | |||||||||
|---|---|---|---|---|---|---|---|---|---|---|---|---|---|
Customer relationships | $ | 129,500 | $ | (129,500 | ) | $ | — | 0.0 | |||||
Purchase agreements | 75,879 | (74,967 | ) | 912 | 1.9 | ||||||||
Resort management contracts | 108,202 | (27,518 | ) | 80,684 | 14.5 | ||||||||
Technology | 25,076 | (25,076 | ) | — | 0.0 | ||||||||
Other | 21,817 | (14,262 | ) | 7,555 | 3.8 | ||||||||
| | | | | | | | | | | | | | |
Total | $ | 360,474 | $ | (271,323 | ) | $ | 89,151 | ||||||
| | | | | | | | | | | | | | |
| | | | | | | | | | | | | | |
| | | | | | | | | | | | | | |
In accordance with our policy on the recoverability of long-lived assets, as further described in Note 2 of these consolidated financial statements, we review the carrying value of all long-lived assets, primarily property and equipment and definite-lived intangible assets, for impairment whenever events or changes in circumstances indicate that the carrying value of a long-lived asset (asset group) may be impaired. For the years ended December 31, 20142015 and 2013,2014, we did not identify any events or changes in circumstances indicating that the carrying value of a long lived asset (or asset group) may be impaired; accordingly, a recoverability test has not been warranted.
Amortization of intangible assets with definite lives is primarily computed on a straight-line basis. Total amortization expense for intangible assets with definite lives was $14.0 million, $12.3 million $8.1 million and $23.0$8.1 million for the years ended December 31, 2015, 2014 2013 and 2012,2013, respectively. Based on the
INTERVAL LEISURE GROUP, INC. AND SUBSIDIARIES
NOTES TO CONSOLIDATED FINANCIAL STATEMENTS (Continued)
DECEMBER 31, 2015
NOTE 4—GOODWILL AND OTHER INTANGIBLE ASSETS (Continued)
December 31, 20142015 balances, amortization expense for the next five years and thereafter is estimated to be as follows (in thousands):
Year Ended December 31, | | | ||||||
|---|---|---|---|---|---|---|---|---|
2015 | $ | 13,927 | ||||||
2016 | 12,659 | $ | 12,629 | |||||
2017 | 11,384 | 11,396 | ||||||
2018 | 10,766 | 10,778 | ||||||
2019 | 10,032 | 10,047 | ||||||
2020 and thereafter | 78,771 | |||||||
2020 | 10,047 | |||||||
2021 and thereafter | 68,125 | |||||||
| | | | | | | | | |
| $ | 137,539 | $ | 123,022 | |||||
| | | | | | | | | | |
| | | | | | | | | |
NOTE 5—VACATION OWNERSHIP INVENTORY
As part of our acquisition of HVO on October 1, 2014, we acquired vacation ownership inventory which primarily consists of unsold vacation ownership intervalsVOIs that have completed the construction
INTERVAL LEISURE GROUP, INC. AND SUBSIDIARIES
NOTES TO CONSOLIDATED FINANCIAL STATEMENTS (Continued)
DECEMBER 31, 2014
NOTE 5—VACATION OWNERSHIP INVENTORY (Continued)
process and are available for sale in their current form. As of December 31, 2015 and 2014, vacation ownership inventory is comprised of the following (in thousands):
| | December 31, 2014 | December 31, 2015 | December 31, 2014 | ||||||||
|---|---|---|---|---|---|---|---|---|---|---|---|
Completed unsold vacation ownership interests | $ | 53,434 | |||||||||
Completed unsold VOIs | $ | 46,379 | $ | 53,434 | |||||||
Land held for development | 627 | 627 | 627 | ||||||||
| | | | | | | | | | | | |
Total inventory | $ | 54,061 | $ | 47,006 | $ | 54,061 | |||||
| | | | | | | | | | | | | |
| | | | | | | | | | | | |
NOTE 6—VACATION OWNERSHIP MORTGAGES RECEIVABLE
Vacation ownership mortgages receivable is comprised of various mortgage loans related to our financing of vacation ownership interval sales. As part of our acquisition of HVO on October 1, 2014, we acquired an existing portfolio of vacation ownership mortgages receivable and determined as of the acquisition date that this acquired loan pool was performing and without evidence of any meaningful credit quality deterioration. Therefore, thesereceivable. These loans are accounted for using the contractualexpected cash flows method of recognizing discount accretion based on the acquired loans' contractualexpected cash flows pursuant to ASC 310-20, "Nonrefundable Fees and Other Costs.310-30, "Loans acquired with deteriorated credit quality." At acquisition, we recorded these acquired performing loans at fair value, including a credit discount which is accreted as an adjustment to yield over the loan pools' estimate life. Originated loans as of December 31, 2015 and 2014 represent vacation ownership mortgages receivable originated by our Vacation Ownership operating segment, subsequent to the acquisition of HVO on October 1, 2014.
INTERVAL LEISURE GROUP, INC. AND SUBSIDIARIES
NOTES TO CONSOLIDATED FINANCIAL STATEMENTS (Continued)
DECEMBER 31, 2015
NOTE 6—VACATION OWNERSHIP MORTGAGES RECEIVABLE (Continued)
Vacation ownership mortgages receivable balances as of December 31, 2015 and 2014 were as follows:
| | December 31, 2015 | December 31, 2014 | |||||
|---|---|---|---|---|---|---|---|
Acquired vacation ownership mortgages receivables at various stated interest rates with varying payment through 2024 (see below) | $ | 23,362 | $ | 33,953 | |||
Originated vacation ownership mortgages receivables at various stated interest rates with varying payment through 2025 (see below) | 10,811 | 2,896 | |||||
Less allowance for loan losses | (1,935 | ) | (347 | ) | |||
| | | | | | | | |
Net vacation ownership mortgages receivable | $ | 32,238 | $ | 36,502 | |||
| | | | | | | | |
| | | | | | | | |
| | | | | | | | |
The fair value of these acquired loans of $37.5 million as of the HVO acquisition date (October 1, 2014) was determined by use of a discounted cash flow approach which calculates a present value of expected future cash flows based on scheduled principal and interest payments over the term of the respective loans, while considering anticipated defaults and early repayments determined based on historical experience. Consequently, the fair value of these acquired loans recorded on our consolidated balance sheet as of the acquisition date embeds an estimate for future loan losses which becomes the historical cost basis for that existing portfolio going forward. GrossAs of December 31, 2015 and 2014, the contractual cash flowsoutstanding balance of the acquired loans, which represents contractually-owned future principal amounts and accrued interest, was $25.8 million and $38.0 million, respectively.
The table below presents a rollforward from December 31, 2014 of the accretable yield (interest income) expected to be earned related to theseour acquired loans, as well as the amount of non-accretable difference at the end of the acquisition date total $42.8 million, with theperiod. Nonaccretable difference to fair valuerepresents estimated contractually required payments in excess of $5.3 million primarily representing estimated contractual cash flows not expected to be collected.
Originated loans as The accretable yield represents the excess of December 31, 2014 represent vacation ownership mortgages receivable originated by ILG, or more specifically our Vacation Ownership segment, subsequentestimated cash flows expected to be collected over the acquisitioncarrying amount of HVO on October 1, 2014.
Vacation ownership mortgages receivable balances as of December 31, 2014 were as follows:the acquired loans.
Accretable Yield | Year Ended December 31, 2015 | |||||||
|---|---|---|---|---|---|---|---|---|
| | December 31, 2014 | (In thousands) | ||||||
Acquired vacation ownership mortgages receivables at various stated interest rates with varying payment through 2031 (see below) | $ | 33,953 | ||||||
Originated vacation ownership mortgages receivables at various stated interest rates with varying payment through 2025 (see below) | 2,896 | |||||||
Less allowance for loan losses | (347 | ) | ||||||
Balance, beginning of period | $ | 15,406 | ||||||
Accretion | (4,257 | ) | ||||||
Reclassification between nonaccretable difference | 557 | |||||||
| | | | | | | | | |
Net vacation ownership mortgages receivable | $ | 36,502 | ||||||
Balance, end of period | $ | 11,706 | ||||||
| | | | | | | | | | |
| | | | | | | | | |
Nonaccretable difference, end of period balance | $ | 5,554 | ||||||
| | | | | | ||||
| | | | | |||||
| | | | | | ||||
INTERVAL LEISURE GROUP, INC. AND SUBSIDIARIES
NOTES TO CONSOLIDATED FINANCIAL STATEMENTS (Continued)
DECEMBER 31, 20142015
NOTE 6—VACATION OWNERSHIP MORTGAGES RECEIVABLE (Continued)
AsThe table below presents a rollforward from October 1, 2014 (date of December 31, 2014,acquisition) of the weighted averageaccretable yield (interest income) expected to be earned related to our acquired loans, as well as the amount of non-accretable difference at the end of the period.
Accretable Yield | October 1, 2014 through December 31, 2014 | |||
|---|---|---|---|---|
Balance, beginning of period | $ | 14,413 | ||
Accretion | (1,293 | ) | ||
Reclassification between nonaccretable difference | 2,286 | |||
| | | | | |
Balance, end of period | $ | 15,406 | ||
| | | | | |
| | | | | |
| | | | | |
Nonaccretable difference, end of period balance | $ | 14,260 | ||
| | | | | |
| | | | | |
| | | | | |
The accretable yield is recognized into interest rate on vacation ownership mortgage receivables was 14.0%income (within consolidated revenue) over the estimated life of the acquired loans using the level yield method. The accretable yield may change in future periods due to changes in the anticipated remaining life of the acquired loans, which may alter the amount of future interest income expected to be collected, and changes in expected future principal and interest cash collections which impacts the predominant range of stated interest rates on vacation ownership mortgages receivables was 8.24% to 17.90%.nonaccretable difference.
Vacation ownership mortgages receivables as of December 31, 20142015 are scheduled to mature as follows (in thousands):
| | Vacation Ownership Mortgages Receivable | |||||||||
|---|---|---|---|---|---|---|---|---|---|---|
Twelve month period ending December 31, | Acquired loans | Originated loans | Total | |||||||
2016 | $ | 5,313 | $ | 600 | $ | 5,913 | ||||
2017 | 4,510 | 685 | 5,195 | |||||||
2018 | 3,665 | 745 | 4,410 | |||||||
2019 | 3,146 | 831 | 3,977 | |||||||
2020 | 3,217 | 925 | 4,142 | |||||||
2021 and thereafter | 7,655 | 7,025 | 14,680 | |||||||
| | | | | | | | | | | |
Total | 27,506 | 10,811 | 38,317 | |||||||
Less: discount on acquired loans(1) | (4,144 | ) | — | (4,144 | ) | |||||
Less: allowance for losses | — | (1,935 | ) | (1,935 | ) | |||||
| | | | | | | | | | | |
Net vacation ownership mortgages receivable | $ | 23,362 | $ | 8,876 | $ | 32,238 | ||||
| | | | | | | | | | | |
| | | | | | | | | | | |
| | | | | | | | | | | |
Weighted average stated interest rate as of December 31, 2015 | 14.0 | % | 13.9 | % | ||||||
Range of stated interest rates as of December 31, 2015 | 12.5% to 17.9 | % | 12.9% to 14.9 | % | ||||||
Year Ended December 31, | | |
|---|---|---|
2015 | $6,135 | |
2016 | 5,353 | |
2017 | 4,636 | |
2018 | 3,795 | |
2019 | 3,338 | |
2020 and thereafter | 13,592 | |
| | | |
Total | 36,849 | |
Less: allowance for losses | (347) | |
| | | |
Net vacation ownership mortgages receivable | $36,502 | |
| | | |
| | | |
| | | |
INTERVAL LEISURE GROUP, INC. AND SUBSIDIARIES
NOTES TO CONSOLIDATED FINANCIAL STATEMENTS (Continued)
DECEMBER 31, 2015
NOTE 6—VACATION OWNERSHIP MORTGAGES RECEIVABLE (Continued)
Allowance for Loan LossesCollectability
We assess our vacation ownership mortgages receivable portfolio of loans for collectability on an aggregate basis. Estimates of uncollectability pertaining to our originated loans are recorded as provisions in the vacation ownership mortgages receivable allowance for losseslosses. For originated loans, we record an estimate of uncollectability as discusseda reduction of sales of VOIs in Note 2the accompanying consolidated statements of income at the time revenue is recognized on a VOI sale. We evaluate our originated loan portfolio collectively as they are largely homogeneous, smaller-balance, vacation ownership mortgages receivable. We use a technique referred to as static pool analysis, which tracks uncollectibles over the entire life of those mortgages receivable, as the basis for determining our general reserve requirements on our vacation ownership mortgages receivable. The adequacy of the related allowance is determined by management through analysis of several factors, such as current economic conditions and industry trends, as well as the specific risk characteristics of the portfolio, including defaults, aging, and historical write-offs of these consolidated financial statements.receivables. The allowance is maintained at a level deemed adequate by management based on a periodic analysis of the mortgage portfolio. As of December 31, 2015 and 2014, a provisionallowance for losses of uncollectability of $1.9 million and $0.3 million, for uncollectabilityrespectively was recorded to the vacation ownership mortgages receivable allowance for losses related solely to loansour originated subsequent to the acquisition of HVO on October 1, 2014 given ourloans.
Our acquired loans as of that date wereare remeasured to fair value usingat period end based on expected future cash flows which uses an estimated measure of future default that remained accurate as of December 31, 2014 in all material respects.anticipated defaults. We consider the provisionsloan loss provision on our originated loans and estimates of defaults used in the remeasurements of our acquired loans to be adequate and based on the economic environment and our assessment of the future collectability of the outstanding loans.
At December 31, 2014, theThe weighted average FICO score (based upon the loan balance) for borrowers within our acquired and originated loan pools was 703 and 716, respectively, at December 31, 2015 and 701 and 718, respectively. The default rate for our vacation ownership mortgages receivable portfoliorespectively at December 31, 2014, based upon the outstanding loan balance at time of loans (as a percentage of our total outstanding loans) for the period subsequent to our acquisition of HVO was 0.7%.origination. The average estimated rate for all future defaults for our outstanding pool of loans as of December 31, 2015 and 2014 was 10.9% and 11.2%, respectively.
On an ongoing basis, we monitor that credit quality of our vacation ownership mortgages receivable portfolio based on payment activity as follows:
INTERVAL LEISURE GROUP, INC. AND SUBSIDIARIES
NOTES TO CONSOLIDATED FINANCIAL STATEMENTS (Continued)
DECEMBER 31, 2014
NOTE 6—VACATION OWNERSHIP MORTGAGES RECEIVABLE (Continued)
INTERVAL LEISURE GROUP, INC. AND SUBSIDIARIES
NOTES TO CONSOLIDATED FINANCIAL STATEMENTS (Continued)
DECEMBER 31, 2015
NOTE 6—VACATION OWNERSHIP MORTGAGES RECEIVABLE (Continued)
Our aged analysis of past-due vacation ownership mortgages receivable and the gross balance of vacation ownership mortgages receivable greater than 90 days past-due as of December 31, 2015 is as follows (in thousands):
| | Vacation Ownership Mortgages Receivable | |||||||||
|---|---|---|---|---|---|---|---|---|---|---|
| | Acquired loans | Originated loans | Total | |||||||
Receivables past due | $ | 1,046 | $ | 243 | $ | 1,289 | ||||
Receivables greater than 90 days past due | $ | 206 | $ | 27 | $ | 233 | ||||
Our aged analysis of past-due vacation ownership mortgages receivable and the gross balance of vacation ownership mortgage receivables on non-performing statusmortgages receivable greater than 90 days past-due as of December 31, 2014 is as follows (in thousands):
| | Receivables past due | Receivables greater than 90 days past due | Receivables on non-performing status | |||||||
|---|---|---|---|---|---|---|---|---|---|---|
Vacation ownership mortgages receivable | $ | 1,301 | $ | 148 | $ | — | ||||
| | | | | | | | | | | |
| | | | | | | | | | | |
| | | | | | | | | | | |
| | Vacation Ownership Mortgages Receivable | |||||||||
|---|---|---|---|---|---|---|---|---|---|---|
| | Acquired loans | Originated loans | Total | |||||||
Receivables past due | $ | 1,152 | $ | 149 | $ | 1,301 | ||||
Receivables greater than 90 days past due | $ | 148 | $ | 0 | $ | 148 | ||||
NOTE 7—INVESTMENTS IN UNCONSOLIDATED ENTITIES
Our investments in unconsolidated entities, recorded under the equity method of accounting in accordance with guidance in ASC 323, "Investments—Equity Method and Joint Ventures," primarily consists of an ownership interest in Maui Timeshare Venture, LLC, a joint venture to develop and operate a vacation ownership resort in the state of Hawaii. This joint venture was acquired in connection with our acquisition of HVO and was recorded at fair value on the acquisition date. Our equity income from investments in unconsolidated entities, recorded in equity in earnings from unconsolidated entities in the accompanying consolidated statement of income, was $4.6$4.9 million for the year ended December 31, 2014.2015.
The ownership percentage of the Maui Timeshare Venture, LLC investment is 33.0% and ownership percentages andof the other investments range from 25.0% to 43.3%. The carrying value of our investments in unconsolidated entities as of December 31, 2015 and 2014 wereis as follows:
| | Ownership Interest | Carrying Value | |||||||||||
|---|---|---|---|---|---|---|---|---|---|---|---|---|---|
| | | (in thousands) | December 31, 2015 | December 31, 2014 | |||||||||
Maui Timeshare Venture, LLC | 33.0% | $ | 32,919 | $ | 37,762 | $ | 32,919 | ||||||
Other | 25.0% - 43.3% | 567 | 557 | 567 | |||||||||
| | | | | | | | | | | | | | |
Total | $ | 33,486 | $ | 38,319 | $ | 33,486 | |||||||
| | | | | | | | | | | | | | | |
| | | | | | | | | | | | | | |
INTERVAL LEISURE GROUP, INC. AND SUBSIDIARIES
NOTES TO CONSOLIDATED FINANCIAL STATEMENTS (Continued)
DECEMBER 31, 20142015
NOTE 8—PROPERTY AND EQUIPMENT
Property and equipment, net is as follows (in thousands):
| | December 31, | December 31, | ||||||||||||
|---|---|---|---|---|---|---|---|---|---|---|---|---|---|---|
| | 2014 | 2013 | 2015 | 2014 | ||||||||||
Computer equipment | $ | 21,389 | $ | 20,084 | $ | 23,172 | $ | 21,389 | ||||||
Capitalized software (including internally-developed software) | 97,561 | 84,067 | 108,614 | 97,561 | ||||||||||
Land, buildings and leasehold improvements | 50,685 | 28,905 | 50,978 | 50,685 | ||||||||||
Furniture and other equipment | 16,638 | 14,830 | 16,681 | 16,638 | ||||||||||
Projects in progress | 10,581 | 8,296 | 18,729 | 10,581 | ||||||||||
| | | | | | | | | | | | | | | |
| 196,854 | 156,182 | 218,174 | 196,854 | |||||||||||
Less: accumulated depreciation and amortization | (110,253 | ) | (96,626 | ) | (126,692 | ) | (110,253 | ) | ||||||
| | | | | | | | | | | | | | | |
Total property and equipment, net | $ | 86,601 | $ | 59,556 | $ | 91,482 | $ | 86,601 | ||||||
| | | | | | | | | | | | | | | | |
| | | | | | | | | | | | | | | |
Capitalized software, net of accumulated amortization, totaled $34.1$38.1 million and $29.0$34.1 million at December 31, 20142015 and 2013,2014, respectively, and is included in "Property and equipment, net" in the accompanying consolidated balance sheets. Depreciation expense for capitalized software recognized in our consolidated income statement for the years ended December 31, 2015, 2014 and 2013 and 2012 was $11.7 million, $10.1 million $9.3 million and $8.5$9.3 million, respectively.
NOTE 9—LONG-TERM DEBT
Long-term debt is as follows (in thousands):
| | December 31, | December 31, 2015 | December 31, 2014 | |||||||||||
|---|---|---|---|---|---|---|---|---|---|---|---|---|---|---|
| | 2014 | 2013 | ||||||||||||
Revolving credit facility (interest rate of 1.92% at December 31, 2014 and 1.67% at December 31, 2013 respectively) | $ | 488,000 | $ | 253,000 | ||||||||||
Revolving credit facility (interest rate of 2.68% at December 31, 2015 and 1.92% at December 31, 2014) | $ | 75,000 | $ | 488,000 | ||||||||||
5.625% senior notes | 350,000 | — | ||||||||||||
Unamortized debt issuance costs (revolving credit facility) | (3,015 | ) | (3,617 | ) | ||||||||||
Unamortized debt issuance costs (senior notes) | (6,285 | ) | — | |||||||||||
| | | | | | | | | | | | | | | |
Total long-term debt | $ | 488,000 | $ | 253,000 | ||||||||||
Total long-term debt, net of unamortized debt issuance costs | $ | 415,700 | $ | 484,383 | ||||||||||
| | | | | | | | | | | | | | | | |
| | | | | | | | | | | | | | | |
Credit Facility
In April 2014, we entered into the first amendment to the June 21, 2012 amended and restated credit agreement (collectively, the "Amended Credit Agreement") which increased the revolving credit facility from $500 million to $600 million, extended the maturity of the credit facility to April 8, 2019 and provided for certain other amendments to covenants. The terms related to interest rates and commitment fees remained unchanged. In November 2014, we entered into a second amendment which primarily provides for a second letter of credit issuer and certain other amendments to covenants. Under this amendment, the financial covenants, interest rates, commitment fees and other significant
INTERVAL LEISURE GROUP, INC. AND SUBSIDIARIES
NOTES TO CONSOLIDATED FINANCIAL STATEMENTS (Continued)
DECEMBER 31, 2015
NOTE 9—LONG-TERM DEBT (Continued)
terms remain unchanged. On April 10, 2015, we entered into a third amendment which changed the leverage-based financial covenant from a maximum consolidated total leverage to EBITDA ratio of 3.5 to 1.0 to a maximum consolidated secured leverage to EBITDA ratio of 3.25 to 1.0. In addition, the amendment adds an incurrence test allowing a maximum consolidated total leverage to EBITDA ratio of 4.5 to 1.0 on a pro forma basis in certain circumstances in which we make acquisitions or investments, incur additional indebtedness or make restricted payments. Also, the amendment added a new pricing level to the pricing grid applicable when the consolidated total leverage to EBITDA ratio equals or exceeds 3.5 to 1.0. This pricing level is either LIBOR plus 2.5% or the base rate plus 1.5% and requires a commitment fee on undrawn amounts of 0.4% per annum. There were no other material changes under this amendment.
Additionally, on May 5, 2015, we entered into a fourth amendment to the Amended Credit Agreement which changed the definition of change of control to remove the provision that certain changes in the composition of the board of directors would constitute a change of control and therefore be a default under the credit agreement. The amendment also included clarifying language regarding provisions that relate to our 5.625% senior notes due in 2023. There were no other material changes under this amendment.
As of December 31, 2014,2015, there was $488$75.0 million outstanding. The increase of $235 million as of December 31, 2014 is primarily attributable to incremental borrowings of $220 million to finance our acquisition of HVO. Any principal amounts outstanding under the revolving credit facility are due at maturity. TheAs of December 31, 2015, the interest rate on the Amended Credit Agreement is based on (at our election) either LIBOR plus a predetermined margin that rangesranged from 1.25% to 2.25%2.5%, or the Base Rate as defined in the Amended Credit Agreement plus a predetermined margin that rangesranged from 0.25% to 1.25%1.5%, in each case based on our consolidated total leverage ratio. As of December 31,
INTERVAL LEISURE GROUP, INC. AND SUBSIDIARIES
NOTES TO CONSOLIDATED FINANCIAL STATEMENTS (Continued)
DECEMBER 31, 2014
NOTE 9—LONG-TERM DEBT (Continued)
2014, 2015, the applicable margin was 1.75%2.25% per annum for LIBOR revolving loans and 0.75%1.25% per annum for Base Rate loans. TheAs of December 31, 2015, the Amended Credit Agreement has a commitment fee on undrawn amounts that rangesranged from 0.25% to 0.375%0.40% per annum based on our leverage ratio and as of December 31, 20142015 the commitment fee was 0.275%0.375%. Interest expense for the years ended December 31, 2014, 2013 and 2012 was $7.1 million, $6.2 million, and $25.6 million, respectively, net of negligible capitalized interest relating to internally-developed software.
Pursuant to the Amended Credit Agreement, all obligations under the revolving credit facility are unconditionally guaranteed by ILG and certain of its subsidiaries. Borrowings are further secured by (1) 100% of the voting equity securities of ILG's U.S. subsidiaries and 65% of the equity in our first-tier foreign subsidiaries and (2) substantially all of our domestic tangible and intangible property.
Senior Notes
On April 10, 2015, we completed a private offering of $350 million in aggregate principal amount of our 5.625% senior notes due in 2023. The net proceeds from the offering, after deducting offering related expenses, were $343.1 million. We used the proceeds to repay indebtedness outstanding on our revolving credit facility. As of December 31, 2015, total unamortized debt issuance costs relating to these senior notes were $6.3 million, which are presented as a direct deduction from the principal amount. Interest on the senior notes is paid semi-annually in arrears on April 15 and October 15 of each year and the senior notes are fully and unconditionally guaranteed on a joint and several basis by our domestic subsidiaries that are required to guarantee the Amended Credit Facility. Additionally, the voting stock of the issuer and the subsidiary guarantors is 100% owned by ILG. The senior notes are redeemable from April 15, 2018 at a redemption price starting at 104.219% which declines over time.
INTERVAL LEISURE GROUP, INC. AND SUBSIDIARIES
NOTES TO CONSOLIDATED FINANCIAL STATEMENTS (Continued)
DECEMBER 31, 2015
NOTE 9—LONG-TERM DEBT (Continued)
Restrictions and Covenants
The senior notes and Amended Credit Agreement has various financial and operating covenants that place significant restrictions on us, including our ability to incur additional indebtedness, incur additional liens, issue redeemable stock and preferred stock, pay dividends or distributions or redeem or repurchase capital stock, prepay, redeem or repurchase debt, make loans and investments, enter into agreements that restrict distributions from our subsidiaries, sell assets and capital stock of our subsidiaries, enter into certain transactions with affiliates and consolidate or merge with or into or sell substantially all of our assets to another person.
The indenture governing the senior notes restricts our ability to issue additional debt in the event we are not in compliance with the minimum fixed charge coverage ratio of 2.0 to 1.0 and limits restricted payments and investments unless we are in compliance with the minimum fixed charge coverage ratio and the amount is within an amount that grows with our consolidated net income. We are in compliance with this covenant as of December 31, 2015. In addition, the Amended Credit Agreement requires us to meet certain financial covenants regarding the maintenance of a maximum consolidated secured leverage ratio of consolidated secured debt, less credit given for a portion of foreign cash, over consolidated Earnings Before Interest, Taxes, Depreciation and Amortization ("EBITDA"), as defined. Additionally, weWe are also required to maintain a minimum consolidated interest coverage ratio of consolidated EBITDA over consolidated interest expense. Currently,As of December 31, 2015, the maximum consolidated secured leverage ratio is 3.5xwas 3.25x and the minimum consolidated interest coverage ratio iswas 3.0x. As of December 31, 2014,2015, ILG was in compliance in all material respects with the requirements of all applicable financial and operating covenants, and our consolidated secured leverage ratio and consolidated interest coverage ratio under the Amended Credit Agreement were 2.880.44 and 20.69,9.10, respectively.
In November 2014, we entered into a second amendment to the Amended Credit Agreement which primarily provides for a second letter of credit issuerInterest Expense and certain other amendments to covenants. Under this amendment, the financial covenants, interest rates, commitment fees and other significant terms remain unchanged.
Extinguishment of Debt
In September 2012, we redeemed all of our $300 million senior notes, issued on August 19, 2008, at a redemption price equal to 100% of the principal amount plus accrued and unpaid interest, amounting to $314.5 million, at which time the senior notes were no longer deemed to be outstanding and our obligations under the indenture, as previously supplemented, terminated. We funded the redemption through the use of $290 million, drawn on our $500 million revolving credit facility, and cash on hand. The extinguishment of the senior notes resulted in a non-cash, pre-tax loss on
INTERVAL LEISURE GROUP, INC. AND SUBSIDIARIES
NOTES TO CONSOLIDATED FINANCIAL STATEMENTS (Continued)
DECEMBER 31, 2014
NOTE 9—LONG-TERM DEBT (Continued)
extinguishment of debt of $17.9 million during the third quarter of 2012 principally pertaining to the acceleration of the original issue discount and the write-off of the related unamortized deferred debt issuance costs. These losses are presented in a separate line item, loss on extinguishment of debt, within other income (expense) in our consolidated statements of income for the year ended December 31, 2012.
Debt Issuance Costs
In connection with entering into the Amended Credit Agreement in June 2012, we incurred $3.9 million of lender and third-party debt issuance costs and wrote-off the remaining unamortized balance of $0.6 million relating to the original revolving credit and term loan facilities. In connection with entering into the first amendment in April 2014, we carried over $2.5 million of unamortized debt issuance costs pertaining to our June 2012 Amended Credit Agreement and incurred and deferred an additional $1.7 million of debt issuance costs. As of December 31, 2015, total unamortized debt issuance costs were $9.3 million, net of $3.5 million of accumulated amortization. As of December 31, 2014, total unamortized debt issuance costs were $3.6 million, net of $2.0 million of accumulated amortization. As of December 31, 2013, total debt issuance costs on outstanding debt were $2.7 million, net of $1.2 million of accumulated amortization. Unamortized debt issuance costs are included in other non-current assetspresented as a reduction of long-term debt in the accompanying consolidated balance sheets, andpursuant to ASC 2015-03 as discussed in Note 2. Unamortized debt issuance costs are amortized to interest expense on a straight-line basis through the maturity date of our respective debt instruments using the effective interest method for those costs related to our senior notes, and on a straight-line basis for costs related to our Amended Credit Agreement. Interest expense for the years ended December 31, 2015, 2014 and 2013 was $21.4 million, $7.1 million, and $6.2 million, respectively, net of negligible capitalized interest relating to internally-developed software.
NOTE 10—FAIR VALUE MEASUREMENTS
Fair Value of Financial Instruments
The estimated fair value of financial instruments below has been determined using available market information and appropriate valuation methodologies, as applicable. There have been no
INTERVAL LEISURE GROUP, INC. AND SUBSIDIARIES
NOTES TO CONSOLIDATED FINANCIAL STATEMENTS (Continued)
DECEMBER 31, 2015
NOTE 10—FAIR VALUE MEASUREMENTS (Continued)
changes in the methods and significant assumptions used to estimate the fair value of financial instruments during the year ended December 31, 2014, other than items respective to HVO subsequent to its October 1, 2014 acquisition.2015. Our financial instruments are detailed in the following table.
| | December 31, 2015 | December 31, 2014 | |||||||||||
|---|---|---|---|---|---|---|---|---|---|---|---|---|---|
| | Carrying Amount | Fair Value | Carrying Amount | Fair Value | |||||||||
| | (In thousands) | ||||||||||||
Cash and cash equivalents | $ | 93,088 | $ | 93,088 | $ | 80,493 | $ | 80,493 | |||||
Restricted cash and cash equivalents | 16,638 | 16,638 | 19,984 | 19,984 | |||||||||
Financing receivables | 16,133 | 16,133 | 15,896 | 15,896 | |||||||||
Vacation ownership mortgages receivable | 32,238 | 33,573 | 36,502 | 37,624 | |||||||||
Investment in marketable securities | 11,392 | 11,392 | 11,368 | 11,368 | |||||||||
Revolving credit facility(1) | (71,985 | ) | (75,000 | ) | (484,383 | ) | (488,000 | ) | |||||
Senior notes(1) | (343,715 | ) | (348,250 | ) | — | — | |||||||
| | December 31, 2014 | December 31, 2013 | |||||||||||
|---|---|---|---|---|---|---|---|---|---|---|---|---|---|
| | Carrying Amount | Fair Value | Carrying Amount | Fair Value | |||||||||
| | (In thousands) | ||||||||||||
Cash and cash equivalents | $ | 80,493 | $ | 80,493 | $ | 48,462 | $ | 48,462 | |||||
Restricted cash and cash equivalents | 19,984 | 19,984 | 7,421 | 7,421 | �� | ||||||||
Loans receivable | 15,896 | 15,896 | — | — | |||||||||
Vacation ownership mortgages receivable | 37,710 | 37,624 | — | — | |||||||||
Investment in marketable securities | 11,368 | 11,368 | — | — | |||||||||
Total debt | (488,000 | ) | (488,000 | ) | (253,000 | ) | (253,000 | ) | |||||
The carrying amounts of cash and cash equivalents and restricted cash and cash equivalents reflected in the accompanying consolidated balance sheets approximate fair value as they are redeemable at par upon notice or maintained with various high-quality financial institutions and have original maturities of three months or less. Under the fair value hierarchy established in ASC 820, cash
INTERVAL LEISURE GROUP, INC. AND SUBSIDIARIES
NOTES TO CONSOLIDATED FINANCIAL STATEMENTS (Continued)
DECEMBER 31, 2014
NOTE 10—FAIR VALUE MEASUREMENTS (Continued)
and cash equivalents and restricted cash and cash equivalents are stated at fair value based on quoted prices in active markets for identical assets (Level 1).
The loan receivablefinancing receivables as of December 31, 20142015 is presented in our consolidated balance sheet within other non-current assets and primarily pertains to a convertible secured loan to CLC that matures five years subsequent to the funding date with interest payable monthly. The CLC loan was funded in October of 2014. The outstanding loan is to be repaid in full at maturity either in cash or by means of a share option exercisable by ILG, at its sole discretion. The carrying value of the loan receivable approximates fair value through inputs inherent to the originating value of thisthe loan, such as interest rates and ongoing credit risk accounted for through non-recurring adjustments for estimated credit losses as necessary (Level 2). The stated fixed interest rate on this loan is comparable to market rate. Interest is recognized within our "Interest income" line item in our consolidated statement of income for the year ended December 31, 2014.2015.
We estimate the fair value of vacation ownership mortgages receivable using a discounted cash flow model. We believe this is comparable to the model that an independent third party would use in the current market. Our model incorporates default rates, prepayment rates, coupon rates and loan terms respective to the portfolio based on current market assumptions for similar types of arrangements. Based upon the availability of market data, we have classified inputs used in the valuation of our vacation ownership mortgages receivable as Level 3. The primary sensitivity in these assumptions relates to forecasted defaults and projected prepayments which could cause the estimated fair value to vary.
INTERVAL LEISURE GROUP, INC. AND SUBSIDIARIES
NOTES TO CONSOLIDATED FINANCIAL STATEMENTS (Continued)
DECEMBER 31, 2015
NOTE 10—FAIR VALUE MEASUREMENTS (Continued)
Investments in marketable securities consists of marketable securities (mutual funds) related to a deferred compensation plan that is funded in a Rabbi trust as of December 31, 2015 and 2014 and classified as other noncurrent assets in the accompanying consolidated balance sheets. This deferred compensation plan was created and funded in connection with the HVO acquisition. Participants in the deferred compensation plan unilaterally determine how their compensation deferrals are invested within the confines of the Rabbi trust which holds the marketable securities. Consequently, management has designated these marketable securities as trading investments, as allowed by applicable accounting guidance, even though there is no intent by ILG to actively buy or sell securities with the objective of generating profits on short-term differences in market prices. These marketable securities are recorded at a fair value of $11.4 million as of December 31, 20142015 based on quoted market prices in active markets for identical assets (Level 1). Unrealized trading gainslosses of $0.7$0.1 million, and the offsetting employee compensation expense,credit, are included within general and administrative expenses in the accompanying consolidated statements of income for the year ended December 31, 2014.2015. See Note 12 for further discussion in regards to this deferred compensation plan.
The carrying value of the outstanding balance under our $600 million revolving credit facility approximates fair value as of December 31, 20142015 and 20132014 through inputs inherent to the debt such as variable interest rates and credit risk (Level 2).
INTERVAL LEISURE GROUP, INC. AND SUBSIDIARIES
NOTES TO CONSOLIDATED FINANCIAL STATEMENTS (Continued)
DECEMBER 31, 2014
NOTE 10—FAIR VALUE MEASUREMENTS (Continued)
The guarantees, surety bonds, and letters of credit represent liabilities that are carried on our balance sheet only when a future related contingent event becomes probable and reasonably estimable. These commitments are in place to facilitate our commercial operations. The related fair value of these liabilities is estimated at the minimum expected cash flows contractually required to satisfy the related liabilities in the future upon occurrence of the applicable contingent events (Level 2).
Fair Value of Contingent Consideration
In connection with the VRI Europe transaction, we had an obligation to transfer additional consideration in the form of cash, resulting in incremental noncontrolling interest value in VRI Europe, based on final results of the acquired business for the twelve months ended December 31, 2013. During the second quarter of 2014, the parties reached final agreement resulting in a downward adjustment to the amount of contingent consideration by approximately $1.3 million, net of noncontrolling interest, which was recognized in earnings during that quarter. The final agreed upon liability of $6.5 million was settled in full during the second quarter of 2014.
Additionally, in connection with our fourth quarter 2013 acquisitions, certain amounts related to the purchase consideration paid at closing were deposited into escrow to be held subject to specified future events which could occur over a period ranging from the respective acquisition dates up to 36 months thereafter, as applicable. Pursuant to ASC 805, we consider these escrowed funds to be contingent consideration whereby their release from escrow is subject to future performance. During the second quarter of 2014, the performance related to these escrowed funds was completed and consequently, the escrowed funds were released to the respective third parties and our contingent consideration liability (and corresponding asset representing the prepayment into escrow) was relieved on our consolidated balance sheet as of June 30, 2014.
NOTE 11—EQUITY
ILG has 300 million authorized shares of common stock, par value of $.01 per share. At December 31, 2015, there were 59.9 million shares of ILG common stock issued, of which 57.5 million are outstanding with 2.4 million shares held as treasury stock. At December 31, 2014, there were 59.5 million shares of ILG common stock issued, of which 57.1 million arewere outstanding with 2.4 million shares held as treasury stock. At December 31, 2013, there were 59.1 million shares of ILG common stock issued, of which 57.4 million were outstanding with 1.7 million shares held as treasury stock.
ILG has 25 million authorized shares of preferred stock, par value $.01 per share, none of which are issued or outstanding as of December 31, 20142015 and 2013.2014. The Board of Directors has the authority to issue the preferred stock in one or more series and to establish the rights, preferences, and dividends.
Dividends Declared
In February, May, August and November 2014,2015, our Board of Directors declared and we paid quarterly dividend payments of $0.11$0.12 per share paid in March, June, September and December 2014, respectively, of $6.3$6.9 million each.each quarter. For the year ended December 31, 2014,2015, we paid $25.2$27.6 million in cash dividends. In February 2015,of 2016, our Board of Directors declared a $0.12 per share dividend payable March 31, 201516, 2016 to shareholders of record on March 17, 2015.
INTERVAL LEISURE GROUP, INC. AND SUBSIDIARIES
NOTES TO CONSOLIDATED FINANCIAL STATEMENTS (Continued)
DECEMBER 31, 2014
NOTE 11—EQUITY (Continued)7, 2016.
In May, August and November 2013,2014, our Board of Directors declared and we paid quarterly dividend payments of $0.11 per share paid in June, September and December 2013, respectively, of $6.3 million each.each quarter. For the year ended December 31, 2013,2014, we paid $18.9$25.2 million in cash dividends.
Stockholder Rights Plan
In June 2009, ILG's Board of Directors approved the creation of a Series A Junior Participating Preferred Stock, adopted a stockholders rights plan and declared a dividend of one right for each
INTERVAL LEISURE GROUP, INC. AND SUBSIDIARIES
NOTES TO CONSOLIDATED FINANCIAL STATEMENTS (Continued)
DECEMBER 31, 2015
NOTE 11—EQUITY (Continued)
outstanding share of common stock held by our stockholders of record as of the close of business on June 22, 2009. The rights attach to any additional shares of common stock issued after June 22, 2009. These rights, which trade with the shares of our common stock, currently are not exercisable. Under the rights plan, these rights will be exercisable if a person or group acquires or commences a tender or exchange offer for 15% or more of our common stock. The rights plan provides certain exceptions for acquisitions by Liberty Interactive Corporation (formerly known as Liberty Media Corporation) in accordance with an agreement entered into with ILG in connection with its spin-off from IAC/InterActiveCorp (IAC). If the rights become exercisable, each right will permit its holder, other than the "acquiring person," to purchase from us shares of common stock at a 50% discount to the then prevailing market price. As a result, the rights will cause substantial dilution to a person or group that becomes an "acquiring person" on terms not approved by our Board of Directors.
Share Repurchase Program
Effective August 3, 2011 and June 4, 2014, ILG's Board of Directors authorized a share repurchase program for up to $25.0 million and $20.0 million, respectively, excluding commissions, of our outstanding common stock. In February 2015, ILG's Board of Directors increased the share repurchase authorization to a total of $25 million. Acquired shares of our common stock are held as treasury shares carried at cost on our consolidated financial statements. Common stock repurchases may be conducted in the open market or in privately negotiated transactions. The amount and timing of all repurchase transactions are contingent upon market conditions, applicable legal requirements and other factors. This program may be modified, suspended or terminated by us at any time without notice.
During the year ended December 31, 2014, we repurchased 0.20.7 million shares of common stock for $4.1$14.1 million, including commissions, under the August 2011 repurchase program and 0.5 million shares of common stock for $10.0 million, including commissions, under the June 2014 repurchase program.commissions. As of December 31, 2014,2015, the remaining availability for future repurchases of our common stock was $10.0$25.0 million. In February 2015, ILG's BoardThere were no repurchases of Directors increasedcommon stock during the share repurchase authorization to a total of $25 million.year ended December 31, 2015.
Accumulated Other Comprehensive Loss
Pursuant to final guidance issued by the FASB in February of 2013, entitiesEntities are required to disclose additional information about reclassification adjustments within accumulated other comprehensive income/loss, referred to as AOCL, for ILG, including (1) changes in AOCL balances by component and (2) significant items reclassified out of AOCL in the period. For the years ended December 31, 2015, 2014 2013 and 2012,2013, there were no significant items reclassified out of AOCL, and the change in AOCL pertains to current period foreign currency translation adjustments as disclosed in our accompanying consolidated statements of comprehensive income.
INTERVAL LEISURE GROUP, INC. AND SUBSIDIARIES
NOTES TO CONSOLIDATED FINANCIAL STATEMENTS (Continued)
DECEMBER 31, 2014
NOTE 11—EQUITY (Continued)
Noncontrolling Interests and Redeemable Noncontrolling Interest
Noncontrolling Interest—VRI Europe
In connection with the VRI Europe transaction on November 4, 2013, CLC was issued a noncontrolling interest in VRI Europe representing 24.5% of the business, which was determined based on the purchase price paid by ILG for its 75.5% ownership interest as of the acquisition date. As of December 31, 20142015 and 2013,2014, this noncontrolling interest amounts to $33.3$31.3 million and $32.7$33.3 million, respectively, and is presented on our consolidated balance sheets as a component of equity. The change
INTERVAL LEISURE GROUP, INC. AND SUBSIDIARIES
NOTES TO CONSOLIDATED FINANCIAL STATEMENTS (Continued)
DECEMBER 31, 2015
NOTE 11—EQUITY (Continued)
from December 31, 20132014 to December 31, 20142015 relates to the recognition of the noncontrolling interest holder's proportional share of VRI Europe's earnings and dividends, as well as the translation effect on the foreign currency based amount, and a $0.4 million adjustment related to contingent consideration as discussed in Note 10 to the consolidated financial statements.amount.
The parties have agreed not to transfer their interests in VRI Europe or CLC's related development business for a period of five years from the acquisition. In addition, they have agreed to certain rights of first refusal, and customary drag along and tag along rights, including a right by CLC to drag along ILG's VRI Europe shares in connection with a sale of the entire CLC resort business subject to minimum returns and a preemptive right by ILG. As of December 31, 2014,2015, there have been no changes in ILG's ownership interest percentage in VRI Europe.
Additionally, in connection with this arrangement, ILG and CLC entered into a loan agreement whereby ILG has made available to CLC a convertible secured loan facility of $15.1 million that matures five years subsequent to the funding date with interest payable monthly. The loan was funded in October 2014. The outstanding loan is to be repaid in full at maturity either in cash or by means of a share option exercisable by ILG, at its sole discretion, which would allow for settlement of the loan in CLC's shares of VRI Europe for contractually determined equivalent value. ILG has the right to exercise this share option at any time prior to maturity of the loan; however, the equivalent value for these shares would be measured at a 20% premium to its acquisition date value. We have determined the value of this embedded derivative is not material to warrant bifurcating from the host instrument (loan) at this time. The funding of this loan was subject to certain conditions precedent that were met as of December 31, 2014 and this loan was funded during the fourth quarter of 2014.
Noncontrolling Interest—Hyatt Vacation Ownership
In connection with the HVO acquisition on October 1, 2014, ILG assumed a noncontrolling interest in a joint venture entity, which we fully consolidate, formed for the purpose of developing and selling vacation ownership interests. The fair value of the noncontrolling interests of $3.3 millioninterest at acquisition was determined based on the noncontrolling party's ownership interest applied against the fair value allocated to the respective joint venture entity. As of December 31, 2015 and 2014, thesethis noncontrolling interests amountinterest amounted to $2.0 million and $3.0 million, respectively, and areis presented on our consolidated balance sheetsheets as a component of equity.
Redeemable Noncontrolling Interest
The redeemable noncontrolling interest is presented as temporary equity in the mezzanine section between liabilities and equity on our consolidated balance sheet. This interest represents a noncontrolling ownership in the parent company of our Aston and Aqua businesses. In connection withAqua-Aston business.
As of December 31, 2015, the estimated redemption value of this redeemable interest was higher than the current carrying value on our consolidated balance sheet. Consequently, pursuant to the applicable accounting guidance, we recorded an adjustment of $0.2 million to increase the balance of this noncontrolling interest for the year ended December 31, 2015.
INTERVAL LEISURE GROUP, INC. AND SUBSIDIARIES
NOTES TO CONSOLIDATED FINANCIAL STATEMENTS (Continued)
DECEMBER 31, 2014
NOTE 11—EQUITY (Continued)
the acquisition of Aston by ILG in May 2007, a member of senior management of this business purchased an ownership interest at the same per share price as ILG, a portion of which accrues preferred dividends at a rate of 10% per annum, and was granted an additional interest vesting over four and a half years. ILG is party to a fair value put and call arrangement with respect to this individual's holdings whereby this member of management could require ILG to purchase their interest or ILG could acquire such interest at fair value. The fair value of these shares upon exercise of the put or call is equal to their fair market value, determined by negotiation or arbitration, reduced by the accreted value of the preferred interest that was taken by ILG upon the purchase of Aston. The initial value of the preferred interest was equal to the acquisition price of Aston. An additional put right by the holder and call right by ILG would require, upon exercise, the purchase of these non-voting common shares by ILG immediately prior to a registered public offering by Aston, at the public offering price.
This put arrangement is exercisable by the counter-party outside the control of ILG and is accounted for in accordance with the ASC Topic 480, "Distinguishing Liabilities from Equity" ("ASC 480"). Pursuant to this guidance, we are required to adjust the carrying value of this noncontrolling interest, once redeemable, to its maximum redemption amount at each balance sheet date with a corresponding adjustment to retained earnings. Furthermore, if the noncontrolling interest is not currently redeemable yet probable of becoming redeemable, we are required to either (1) accrete changes in the redemption value over the period from the date of issuance (or from the date that it becomes probable that the security will become redeemable, if later) to the earliest redemption date of the instrument using an appropriate methodology, usually the interest method, or (2) recognize changes in the redemption value (for example, fair value) immediately as they occur and adjust the carrying value of the security to equal the redemption value at the end of each reporting period. In all periods presented, we elected to use the second approach.
This put and call arrangement became redeemable for the first time in the first quarter of 2013 for a period of 60 days subsequent to the filing of our 2012 Annual Report on Form 10-K and is exercisable annually thereafter. Upon exercise of the put or call, the consideration payable can be denominated in ILG shares, cash or a combination thereof at ILG's option. For the year ended December 31, 2014, no put or call option related to this redeemable noncontrolling interest was exercised.
As of December 31, 2014, the estimated redemption value of this redeemable interest is lower than the current carrying value on our consolidated balance sheet. Consequently, pursuant to the applicable accounting guidance, no adjustment to the balance of this noncontrolling interest was recorded for the year ended December 31, 2014 or any prior period presented.
INTERVAL LEISURE GROUP, INC. AND SUBSIDIARIES
NOTES TO CONSOLIDATED FINANCIAL STATEMENTS (Continued)
DECEMBER 31, 20142015
NOTE 11—EQUITY (Continued)
The balance of the redeemable noncontrolling interest as of December 31, 2015 and 2014 and 2013 was $0.5$0.7 million and $0.4$0.5 million, respectively. Changes during the years then ended are as follows (in thousands):
| | December 31, | December 31, | ||||||||||||
|---|---|---|---|---|---|---|---|---|---|---|---|---|---|---|
| | 2014 | 2013 | 2015 | 2014 | ||||||||||
Balance, beginning of period | $ | 426 | $ | 426 | $ | 457 | $ | 426 | ||||||
Increase in redemption value | 231 | — | ||||||||||||
Net income attributable to redeemable noncontrolling interest | 31 | — | 20 | 31 | ||||||||||
| | | | | | | | | | | | | | | |
Balance, end of period | $ | 457 | $ | 426 | $ | 708 | $ | 457 | ||||||
| | | | | | | | | | | | | | | | |
| | | | | | | | | | | | | | | |
NOTE 12—BENEFIT PLANS
Under a retirement savings plan sponsored by ILG, qualified under Section 401(k) of the Internal Revenue Code, participating employees may contribute up to 50.0% of their pre-tax earnings, but not more than statutory limits. ILG provides a discretionary match under the ILG plan of fifty cents for each dollar a participant contributed into the plan with a maximum contribution of 3% of a participant's eligible earnings, subject to Internal Revenue Service ("IRS") restrictions. Matching contributions for the ILG plan were approximately $2.2 million, $1.8 million $1.6 million and $1.4$1.6 million for the years ended December 31, 2015, 2014 2013 and 2012,2013, respectively. Matching contributions were invested in the same manner as each participant's voluntary contributions in the investment options provided under the plan.
During the three years ended December 31, 2014, 2013 and 2012, we also had or participated in various benefit plans, principally defined contribution plans, for non-U.S. employees. Our contributions for these plans were approximately $0.3 million in each of 2014, 2013 and 2012.
Effective August 20, 2008, a deferred compensation plan (the "Director Plan") was established to provide non-employee directors of ILG an option to defer director fees on a tax-deferred basis. Participants in the Director Plan are allowed to defer a portion or all of their compensation and are 100% vested in their respective deferrals and earnings. With respect to director fees earned for services performed after the date of such election, participants may choose from receiving cash or stock at the end of the deferral period. ILG has reserved 100,000 shares of common stock for issuance pursuant to this plan, of which 46,75852,902 share units were outstanding at December 31, 2014.2015. ILG does not provide matching or discretionary contributions to participants in the Director Plan. Any deferred compensation elected to be received in stock is included in diluted earnings per share.
Effective October 1, 2014, a non-qualified deferred compensation plan (the "DCP") was established to allow certain eligible employees of ILG an option to defer compensation on a tax-deferred basis. The establishment of the DCP was also intended to receive a transfer of deferred compensation liabilities in connection with the acquisition of HVO. Participants in the DCP are currently limited to certain HVO employees. These participants make an election prior to the first of each year to defer an amount of compensation payable for services to be rendered beginning in the next calendar year, or to receive distributions. Participants are fully vested in all amounts held in their individual accounts. The DCP is fully funded in a Rabbi trust. The Rabbi trust is subject to creditor claims in the event of insolvency, but the assets held in the Rabbi trust are not available for general corporate purposes. Amounts in the Rabbi trust are invested in mutual funds, as selected by participants, which are designated as trading securities and carried at fair value. Subsequent to the
INTERVAL LEISURE GROUP, INC. AND SUBSIDIARIES
NOTES TO CONSOLIDATED FINANCIAL STATEMENTS (Continued)
DECEMBER 31, 20142015
NOTE 12—BENEFIT PLANS (Continued)
as selected by participants, which are designated as trading securities and carried at fair value. Subsequent to the acquisition of HVO, there was a net transfer of $10.6 million into the Rabbi trust related to participants acquired with the acquisition. As of December 31, 2015 and 2014, the fair value of the investments in the Rabbi trust was $11.4, million which is recorded in other non-current assets with the corresponding deferred compensation liability recorded in other long-term liabilities in the consolidated balance sheet.sheets. We recorded an unrealized loss of $0.1 million and unrealized gains of $0.7 million in general and administrative expenses related to the investment, gains, and a credit/charge to compensation expense both within general and administrative expense, related to the increase in deferred compensation liabilities to reflect our exposure of the DCP liability, in the consolidated statement of income for the yearyears ended December 31, 2014.2015 and 2014, respectively.
NOTE 13—STOCK-BASED COMPENSATION
On May 21, 2013, ILG adopted the Interval Leisure Group, Inc. 2013 Stock and Incentive Plan and stopped granting awards under the ILG 2008 Stock and Annual Incentive Plan ("2008 Incentive Plan"). Both plans provide for the grant of stock options, stock appreciation rights, restricted stock, restricted stock units, and other stock-based awards. RSUs are awards in the form of phantom shares or units, denominated in a hypothetical equivalent number of shares of ILG common stock and with the value of each award equal to the fair value of ILG common stock at the date of grant. Each RSU is subject to service- basedservice-based vesting, where a specific period of continued employment must pass before an award vests. We grant awards subject to graded vesting (i.e. portions of the award vest at different times during the vesting period) or to cliff vesting (i.e., all awards vest at the end of the vesting period). In addition, certain RSUs are subject to attaining specific performance criteria.
ILG recognizes non-cash compensation expense for all RSUs held by ILG's employees. For RSUs to be settled in stock, the accounting charge is measured at the grant date as the fair value of ILG common stock and expensed as non- cashnon-cash compensation over the vesting term using the straight-line basis for service awards and the accelerated basis for performance-based awards with graded vesting. Certain cliff vesting awards contain performance criteria which are tied to anticipated future results of operations in determining the fair value of the award, while other cliff vesting awards with performance criteria are tied to the achievement of certain market conditions. This value is recognized as expense over the service period, net of estimated forfeitures, using the straight-line recognition method. The expense associated with RSU awards to be settled in cash is initially measured at fair value at the grant date and expensed ratably over the vesting term, recording a liability subject to mark-to-market adjustments for changes in the price of the respective common stock, as compensation expense.
Shares underlying RSUs are not issued or outstanding until vested. In relation to our quarterly dividend, unvested RSUs are credited with dividend equivalents, in the form of additional RSUs, when dividends are paid on our shares of common stock. Such additional RSUs are forfeitable and will have the same vesting dates and will vest under the same terms as the RSUs in respect of which such additional RSUs are credited. Given such dividend equivalents are forfeitable, we do not consider them to be participating securities and, consequently, they are not subject to the two-class method of determining earnings per share.
Under the ILG 2013 Stock and Incentive Compensation Plan, the maximum aggregate number of shares of common stock reserved for issuance as of adoption is 4.1 million shares, less one share for every share granted under any prior plan after December 31, 2012. As of December 31, 2015, ILG has 2.3 million shares available for future issuance under the 2013 Stock and Incentive Compensation Plan.
INTERVAL LEISURE GROUP, INC. AND SUBSIDIARIES
NOTES TO CONSOLIDATED FINANCIAL STATEMENTS (Continued)
DECEMBER 31, 20142015
NOTE 13—STOCK-BASED COMPENSATION (Continued)
every share granted under any prior plan after December 31, 2012. As of December 31, During 2015, 2014 ILG has 2.8 million shares available for future issuance under theand 2013, Stock and Incentive Compensation Plan.
During the first quarter of 2014, 2013 and 2012, the Compensation Committee granted approximately 390,000, 657,000521,000, 692,000 and 586,000689,000 RSUs, respectively, vesting over threeone to fourfive years, to certain officers, employees and employeesconsultants of ILG and its subsidiaries. Of the RSUs granted in 2015, 2014 and 2013, approximately 105,000, 367,609 and 2012, approximately 116,000, 300,000 and 130,000 cliff vest in three years to five years and approximately 84,000,54,000, 202,000 and 58,000 and 73,000 of these RSUs, respectively, are subject to performance criteria that could result between 0% and 200% of these awards being earned either based on defined Adjustedadjusted EBITDA or relative total shareholder return targets over the respective performance period, as specified in the award document.
For the 2015, 2014 2013 and 20122013 RSUs subject to relative total shareholder return performance criteria, the number of RSUs that may ultimately be awarded depends on whether the market condition is achieved. We used a Monte Carlo simulation analysis to estimate a per unit grant date fair value of $40.71 for 2015, $36.90 for 2014 and $29.61 for 2013, for these performance based RSUs of $36.90 for 2014, $29.61 for 2013 and $17.34 for 2012.RSUs. This analysis estimates the total shareholder return ranking of ILG as of the grant date relative to two peer groups approved by the Compensation Committee, over the remaining performance period. The expected volatility of ILG's common stock at the date of grant was estimated based on a historical average volatility rate for the approximate three-year performance period. The dividend yield assumption was based on historical and anticipated dividend payouts. The risk-free interest rate assumption was based on observed interest rates consistent with the approximate three-year performance measurement period.
Non-cash compensation expense related to RSUs for the years ended December 31, 2015, 2014 and 2013 and 2012 was $13.5 million, $11.4 million $10.4 million and $10.9$10.4 million, respectively. At December 31, 2014,2015, there was approximately $18.8$17.2 million of unrecognized compensation cost, net of estimated forfeitures, related to RSUs, which is currently expected to be recognized over a weighted average period of approximately 2.01.8 years.
The amount of stock-based compensation expense recognized in the consolidated statements of income is reduced by estimated forfeitures, as the amount recorded is based on awards ultimately expected to vest. The forfeiture rate is estimated at the grant date based on historical experience and revised, if necessary, in subsequent periods for any changes to the estimated forfeiture rate from that previously estimated. For any vesting tranche of an award, the cumulative amount of compensation cost recognized is at least equal to the portion of the grant-date value of the award tranche that is actually vested at that date.
INTERVAL LEISURE GROUP, INC. AND SUBSIDIARIES
NOTES TO CONSOLIDATED FINANCIAL STATEMENTS (Continued)
DECEMBER 31, 20142015
NOTE 13—STOCK-BASED COMPENSATION (Continued)
Non-cash stock-based compensation expense related to equity awards is included in the following line items in the accompanying consolidated statements of income for the years ended December 31, 2015, 2014 2013 and 20122013 (in thousands):
| | Year Ended December 31, | Year Ended December 31, | ||||||||||||||||||
|---|---|---|---|---|---|---|---|---|---|---|---|---|---|---|---|---|---|---|---|---|
| | 2014 | 2013 | 2012 | 2015 | 2014 | 2013 | ||||||||||||||
Cost of sales | $ | 724 | $ | 686 | $ | 639 | $ | 822 | $ | 724 | $ | 686 | ||||||||
Selling and marketing expense | 1,392 | 1,193 | 1,034 | 1,604 | 1,392 | 1,193 | ||||||||||||||
General and administrative expense | 9,247 | 8,549 | 9,258 | 11,044 | 9,247 | 8,549 | ||||||||||||||
| | | | | | | | | | | | | | | | | | | | | |
Non-cash compensation expense before income taxes | 11,363 | 10,428 | 10,931 | 13,470 | 11,363 | 10,428 | ||||||||||||||
Income tax benefit | (4,330 | ) | (3,960 | ) | (4,222 | ) | (5,195 | ) | (4,330 | ) | (3,960 | ) | ||||||||
| | | | | | | | | | | | | | | | | | | | | |
Non-cash compensation expense after income taxes | $ | 7,033 | $ | 6,468 | $ | 6,709 | $ | 8,275 | $ | 7,033 | $ | 6,468 | ||||||||
| | | | | | | | | | | | | | | | | | | | | | |
| | | | | | | | | | | | | | | | | | | | | |
The following table summarizes RSU activity during the years ended December 31, 2012, 2013, 2014 and 2014:2015:
| | Shares | Weighted-Average Grant Date Fair Value | Shares | Weighted-Average Grant Date Fair Value | ||||||||||
|---|---|---|---|---|---|---|---|---|---|---|---|---|---|---|
| | (In thousands) | | (In thousands) | | ||||||||||
Non-vested RSUs at December 31, 2011 | 2,098 | $ | 12.22 | |||||||||||
Granted | 679 | 13.72 | ||||||||||||
Vested | (1,156 | ) | 11.49 | |||||||||||
Forfeited | (52 | ) | 13.72 | |||||||||||
| | | | | | | | ||||||||
Non-vested RSUs at December 31, 2012 | 1,569 | 13.29 | 1,569 | 13.29 | ||||||||||
Granted | 713 | 20.83 | 713 | 20.83 | ||||||||||
Vested | (766 | ) | 12.16 | (766 | ) | 12.16 | ||||||||
Forfeited | (21 | ) | 17.85 | (21 | ) | 17.85 | ||||||||
| | | | | | | | | | | | | | | |
Non-vested RSUs at December 31, 2013 | 1,495 | 17.33 | 1,495 | 17.33 | ||||||||||
Granted | 726 | 23.99 | 726 | 23.99 | ||||||||||
Vested | (468 | ) | 16.27 | (468 | ) | 16.27 | ||||||||
Forfeited | (59 | ) | 24.01 | (59 | ) | 24.01 | ||||||||
| | | | | | | | | | | | | | | |
Non-vested RSUs at December 31, 2014 | 1,694 | $ | 20.23 | 1,694 | 20.23 | |||||||||
Granted | 568 | 25.64 | ||||||||||||
Vested | (547 | ) | 17.34 | |||||||||||
Forfeited | (30 | ) | 21.98 | |||||||||||
| | | | | | | | | |||||||
Non-vested RSUs at December 31, 2015 | 1,685 | $ | 22.98 | |||||||||||
| | | | | | | | | | | | | | | | |
| | | | | | | | | | | | | | | |
INTERVAL LEISURE GROUP, INC. AND SUBSIDIARIES
NOTES TO CONSOLIDATED FINANCIAL STATEMENTS (Continued)
DECEMBER 31, 20142015
NOTE 14—INCOME TAXES
U.S. and foreign earnings from continuing operations before income taxes and noncontrolling interest are as follows (in thousands):
| | Year Ended December 31, | Year Ended December 31, | ||||||||||||||||||
|---|---|---|---|---|---|---|---|---|---|---|---|---|---|---|---|---|---|---|---|---|
| | 2014 | 2013 | 2012 | 2015 | 2014 | 2013 | ||||||||||||||
U.S. | $ | 100,265 | $ | 112,620 | $ | 55,464 | $ | 90,939 | $ | 100,265 | $ | 112,620 | ||||||||
Foreign | 26,734 | 14,574 | 9,497 | 25,396 | 26,734 | 14,574 | ||||||||||||||
| | | | | | | | | | | | | | | | | | | | | |
Total | $ | 126,999 | $ | 127,194 | $ | 64,961 | $ | 116,335 | $ | 126,999 | $ | 127,194 | ||||||||
| | | | | | | | | | | | | | | | | | | | | | |
| | | | | | | | | | | | | | | | | | | | | |
The components of the provision for income taxes attributable to continuing operations are as follows (in thousands):
| | Year Ended December 31, | Year Ended December 31, | ||||||||||||||||||
|---|---|---|---|---|---|---|---|---|---|---|---|---|---|---|---|---|---|---|---|---|
| | 2014 | 2013 | 2012 | 2015 | 2014 | 2013 | ||||||||||||||
Current income tax provision | ||||||||||||||||||||
Federal | $ | 28,671 | $ | 38,832 | $ | 12,016 | $ | 29,148 | $ | 28,671 | $ | 38,832 | ||||||||
State | 5,400 | 3,808 | 2,931 | 5,592 | 5,400 | 3,808 | ||||||||||||||
Foreign | 3,831 | 4,341 | 2,798 | 3,655 | 3,831 | 4,341 | ||||||||||||||
| | | | | | | | | | | | | | | | | | | | | |
Current income tax provision | 37,902 | 46,981 | 17,745 | 38,395 | 37,902 | 46,981 | ||||||||||||||
| | | | | | | | | | | | | | | | | | | | | |
Deferred income tax provision (benefit) | ||||||||||||||||||||
Federal | 3,609 | (506 | ) | 3,972 | 698 | 3,609 | (506 | ) | ||||||||||||
State | 914 | (1,759 | ) | 1,901 | 778 | 914 | (1,759 | ) | ||||||||||||
Foreign | 2,626 | 696 | 634 | 1,216 | 2,626 | 696 | ||||||||||||||
| | | | | | | | | | | | | | | | | | | | | |
Deferred income tax provision (benefit) | 7,149 | (1,569 | ) | 6,507 | 2,692 | 7,149 | (1,569 | ) | ||||||||||||
| | | | | | | | | | | | | | | | | | | | | |
Income tax provision | $ | 45,051 | $ | 45,412 | $ | 24,252 | $ | 41,087 | $ | 45,051 | $ | 45,412 | ||||||||
| | | | | | | | | | | | | | | | | | | | | | |
| | | | | | | | | | | | | | | | | | | | | |
ILG records a deferred tax asset, or future tax benefit, based on the amount of non-cash compensation expense recognized in the financial statements for stock-based awards. For income tax purposes, ILG receives a tax deduction equal to the stock price on the vesting date of the stock-based awards. Upon vesting of these awards, the deferred tax assets are reversed, and the difference between the deferred tax asset and the realized income tax benefit creates an excess tax benefit or deficiency that increases or decreases the additional paid-in-capital pool ("APIC pool"). If the amount of future tax deficiencies is greater than the available APIC pool, ILG will record the deficiencies in excess of the APIC pool as income tax expense in its consolidated statements of operations.income. During 2015, 2014 2013, and 20122013 net excess tax benefits associated with stock-based awards of approximately $1.9 million, $2.9$1.9 million and $2.6$2.9 million, respectively, were recorded as amounts credited to APIC.
The tax effects of cumulative temporary differences that give rise to significant portions of the deferred tax assets and deferred tax liabilities at December 31, 20142015 and 20132014 are presented below (in
INTERVAL LEISURE GROUP, INC. AND SUBSIDIARIES
NOTES TO CONSOLIDATED FINANCIAL STATEMENTS (Continued)
DECEMBER 31, 20142015
NOTE 14—INCOME TAXES (Continued)
below (in thousands). The valuation allowance is related to items for which it is more likely than not that the tax benefit will not be realized.
| | December 31, | December 31, | ||||||||||||
|---|---|---|---|---|---|---|---|---|---|---|---|---|---|---|
| | 2014 | 2013 | 2015 | 2014 | ||||||||||
Deferred tax assets: | ||||||||||||||
Deferred revenue | $ | 34,278 | $ | 40,607 | $ | 30,384 | $ | 34,278 | ||||||
Provision for accrued expenses | 5,666 | 4,539 | 6,144 | 5,666 | ||||||||||
Non-cash compensation | 6,552 | 5,123 | 8,159 | 6,552 | ||||||||||
Net operating loss and tax credit carryforwards | 1,534 | 675 | 646 | 1,534 | ||||||||||
Other | 916 | 1,737 | 1,601 | 916 | ||||||||||
| | | | | | | | | | | | | | | |
Total deferred tax assets | 48,946 | 52,681 | 46,934 | 48,946 | ||||||||||
Less valuation allowance | (234 | ) | (666 | ) | (247 | ) | (234 | ) | ||||||
| | | | | | | | | | | | | | | |
Net deferred tax assets | 48,712 | 52,015 | 46,687 | 48,712 | ||||||||||
| | | | | | | | | | | | | | | |
Deferred tax liabilities: | ||||||||||||||
Intangible and other assets | (102,594 | ) | (103,986 | ) | (103,383 | ) | (102,594 | ) | ||||||
Deferred membership costs | (6,951 | ) | (7,679 | ) | (6,165 | ) | (6,951 | ) | ||||||
Property and equipment | (10,270 | ) | (8,297 | ) | (9,457 | ) | (10,270 | ) | ||||||
Investments in unconsolidated entities | (2,594 | ) | — | (3,359 | ) | (2,594 | ) | |||||||
Installment sales of vacation ownership interests | (1,054 | ) | — | (1,846 | ) | (1,054 | ) | |||||||
Other | (1,565 | ) | (972 | ) | (1,620 | ) | (1,565 | ) | ||||||
| | | | | | | | | | | | | | | |
Total deferred tax liabilities | (125,028 | ) | (120,934 | ) | (125,830 | ) | (125,028 | ) | ||||||
| | | | | | | | | | | | | | | |
Net deferred tax liability | $ | (76,316 | ) | $ | (68,919 | ) | $ | (79,143 | ) | $ | (76,316 | ) | ||
| | | | | | | | | | | | | | | | |
| | | | | | | | | | | | | | | |
At December 31, 20142015 and 2013,2014, ILG had foreign NOLs of approximately $7.2$2.8 million and $2.0$7.2 million, respectively, available to offset future income, virtually all of which can be carried forward indefinitely. The increase in foreign NOLs is primarily attributable to certain new financial reporting standards adopted for foreign statutory purposes in 2014.
A valuation allowance for deferred tax assets is provided when it is more likely than not that certain deferred tax assets will not be realized. Realization is dependent upon the generation of future taxable income or the reversal of deferred tax liabilities during the periods in which those temporary differences become deductible. We consider the history of taxable income in recent years, the scheduled reversal of deferred tax liabilities, projected future taxable income and tax planning strategies to make this assessment. During 2014, the2015, ILG's valuation allowance decreased primarily due to the liquidation of one of ILG's foreign subsidiaries and its related deferred tax asset and valuation allowance for NOL carryforwards that were ultimatelydid not utilized.significantly change. At December 31, 2014,2015, ILG had a valuation allowance of approximately $0.2 million related to the portion of foreign NOL carryforwards for which, more likely than not, the tax benefit will not be realized.
INTERVAL LEISURE GROUP, INC. AND SUBSIDIARIES
NOTES TO CONSOLIDATED FINANCIAL STATEMENTS (Continued)
DECEMBER 31, 20142015
NOTE 14—INCOME TAXES (Continued)
A reconciliation of total income tax provision to the amounts computed by applying the statutory federal income tax rate to earnings before income taxes and noncontrolling interest is shown as follows (in thousands, except percentages):
| | Year Ended December 31, | Year Ended December 31, | ||||||||||||||||||||||||||||||||||||
|---|---|---|---|---|---|---|---|---|---|---|---|---|---|---|---|---|---|---|---|---|---|---|---|---|---|---|---|---|---|---|---|---|---|---|---|---|---|---|
| | 2014 | 2013 | 2012 | 2015 | 2014 | 2013 | ||||||||||||||||||||||||||||||||
| | Amount | % | Amount | % | Amount | % | Amount | % | Amount | % | Amount | % | ||||||||||||||||||||||||||
Income tax provision at the federal statutory rate of 35% | $ | 44,450 | 35.0 | $ | 44,518 | 35.0 | $ | 22,736 | 35.0 | $ | 40,717 | 35.0 | $ | 44,450 | 35.0 | $ | 44,518 | 35.0 | ||||||||||||||||||||
State income taxes, net of effect of federal tax benefit | 4,104 | 3.2 | 1,332 | 1.1 | 3,141 | 4.8 | 4,140 | 3.5 | 4,104 | 3.2 | 1,332 | 1.1 | ||||||||||||||||||||||||||
Foreign income taxed at a different statutory tax rate | (3,048 | ) | (2.4 | ) | (1,240 | ) | (1.0 | ) | (745 | ) | (1.2 | ) | (4,049 | ) | (3.5 | ) | (3,048 | ) | (2.4 | ) | (1,240 | ) | (1.0 | ) | ||||||||||||||
U.S. tax consequences of foreign operations | (47 | ) | (0.0 | ) | 181 | 0.1 | (291 | ) | (0.4 | ) | 82 | 0.1 | (47 | ) | (0.0 | ) | 181 | 0.1 | ||||||||||||||||||||
Other, net | (408 | ) | (0.3 | ) | 621 | 0.5 | (589 | ) | (0.9 | ) | 197 | 0.2 | (408 | ) | (0.3 | ) | 621 | 0.5 | ||||||||||||||||||||
| | | | | | | | | | | | | | | | | | | | | | | | | | | | | | | | | | | | | | | |
Income tax provision | $ | 45,051 | 35.5 | $ | 45,412 | 35.7 | $ | 24,252 | 37.3 | $ | 41,087 | 35.3 | $ | 45,051 | 35.5 | $ | 45,412 | 35.7 | ||||||||||||||||||||
| | | | | | | | | | | | | | | | | | | | | | | | | | | | | | | | | | | | | | | | |
| | | | | | | | | | | | | | | | | | | | | | | | | | | | | | | | | | | | | | | |
In accordance with ASC 740, no federal and state income taxes have been provided on permanently reinvested earnings of certain foreign subsidiaries aggregating approximately $80.5$107.5 million at December 31, 2014.2015. If, in the future, these earnings are repatriated to the U.S., or if ILG determines such earnings will be repatriated to the U.S. in the foreseeable future, additional tax provisions would be required. Due to complexities in the tax laws and the assumptions that would have to be made, it is not practicable to estimate the amounts of income taxes that would have to be provided.
ASC 740 clarifies the accounting for income taxes by prescribing the minimum recognition threshold a tax position is required to meet before being recognized in the financial statements. ASC 740 provides guidance on derecognition, classification, interest and penalties, accounting in interim periods, disclosure and transition. A reconciliation of the beginning and ending amount of unrecognized tax benefits, excluding interest, is as follows:follows (in thousands):
| | (In thousands) | December 31, | ||||||||||||||||||
|---|---|---|---|---|---|---|---|---|---|---|---|---|---|---|---|---|---|---|---|---|
| | 2014 | 2013 | 2012 | 2015 | 2014 | 2013 | ||||||||||||||
Balance at beginning of year | $ | 509 | $ | 662 | $ | 870 | $ | 257 | $ | 509 | $ | 662 | ||||||||
Additions for tax positions of prior years | 33 | 1,167 | 37 | 311 | 33 | 1,167 | ||||||||||||||
Reductions for tax positions of prior years | — | (1,150 | ) | — | — | — | (1,150 | ) | ||||||||||||
Settlements | — | — | (97 | ) | ||||||||||||||||
Expiration of applicable statute of limitations | (285 | ) | (170 | ) | (148 | ) | (119 | ) | (285 | ) | (170 | ) | ||||||||
| | | | | | | | | | | | | | | | | | | | | |
Balance at end of year | $ | 257 | $ | 509 | $ | 662 | $ | 449 | $ | 257 | $ | 509 | ||||||||
| | | | | | | | | | | | | | | | | | | | | | |
| | | | | | | | | | | | | | | | | | | | | |
As of December 31, 2015, 2014 2013 and 2012,2013, ILG had unrecognized tax benefits of $0.4 million, $0.3 million $0.5 million and $0.7$0.5 million, respectively, which if recognized, would favorably affect the effective tax rate. Also included in the balance of unrecognized tax benefits as of December 31, 2014, 2013 and 2012 are $0.1 million, $0.2 million and $0.4 million, respectively, of unrecognized tax benefits related to the acquisition of TPI. In connection with our acquisition of TPI, the former shareholders have agreed to
INTERVAL LEISURE GROUP, INC. AND SUBSIDIARIES
NOTES TO CONSOLIDATED FINANCIAL STATEMENTS (Continued)
DECEMBER 31, 20142015
NOTE 14—INCOME TAXES (Continued)
indemnify us for all tax liabilities and related interest and penalties for the pre- acquisition period. The net decrease of $0.2 million in 2014 in unrecognized tax benefits is primarily attributable to the decrease in unrecognized tax benefits associated with the expiration of the statute of limitations related to foreign taxes and certain tax credits, partly offset by other income tax items. The net decrease of $0.2 million in 2013 in unrecognized tax benefits is due principally to a decrease in foreign taxes as a result of the expiration of the statute of limitations partly offset by other income tax items. Additionally, during the first quarter of 2013, the unrecognized tax benefits increased by approximately $1.1 million related to state income tax items. During the fourth quarter of 2013, we received a favorable binding technical advisement issued by a state taxing authority on state income tax items, which allowed us to decrease our unrecognized tax benefits by the $1.1 million. The net decrease of $0.2 million in 2012 in unrecognized tax benefits is due principally to both a decrease in foreign taxes as a result of the expiration of the statute of limitations and settlements with taxing authorities related primarily to certain tax credits, partly offset by other income tax items.
ILG recognizes interest and, if applicable, penalties related to unrecognized tax benefits in income tax expense. There were no material accruals for interest during 2015, 2014 2013, and 2012.2013. During these periods, interest and penalties decreased by approximately $0.1 million, $0.2$0.1 million and $0.2 million, respectively, as a result of the expiration of the statute of limitations related to foreign taxes. At December 31, 2015, 2014 2013 and 2012,2013, ILG has accrued $0.2 million, $0.3 million $0.4 million and $0.6$0.4 million, respectively, for the payment of interest and, if applicable, penalties.
ILG believes that it is reasonably possible that its unrecognized tax benefits could decrease by approximately $0.1$0.3 million within twelve months of the current reporting date due primarily to the expiration of the statute of limitations related to state and foreign taxes and other tax credits. An estimate of other changes in unrecognized tax benefits cannot be made, but is not expected to be significant.
ILG has routinely been under audit byfiles income tax returns in the U.S. federal jurisdiction and various state, local, and foreign taxing authorities. These audits include questioning the timing and the amount of deductions and the allocation of income among various tax jurisdictions. Income taxes payable include amounts considered sufficient to pay assessments that may result from examination of prior year returns; however, the amount paid upon resolution of issues raised may differ from the amount provided. Differences between the reserves for tax contingencies and the amounts owed by ILG are recorded in the period they become known. Under a tax sharing agreement, IAC indemnifies ILG for all consolidated tax liabilities and related interest and penalties for the pre-spin period.
The statute of limitations for IAC's federal consolidated tax returns for the years 2001 through 2009, which includes our operations from September 24, 2002, our date of acquisition by IAC, until the spin-off in August 2008, expired on July 1, 2014. Various IAC consolidated tax returns that include our operations, filed with state and local jurisdictions, are currently under examination for various tax years beginning with 2006. The IRS is also currently examining ILG's federal consolidated tax return for the period ended December 31, 2012. As of December 31, 2014,2015, no other open tax years are currently under examination by the IRS or any material state and local jurisdictions.
During 2013,On November 18, 2015, the U.K. Finance (No.2) Act of 20132015 was enacted, which further reduced the U.K. corporate income tax rate to 21%,19% and 18% effective April 1, 20142017 and 20%, effective April 1, 2015.2020, respectively. The impact of these further rate reductions, recorded in the U.K. rate reduction to 21% and 20%, whichcurrent reporting period, reduced our U.K. net deferred tax assetliability and increased
INTERVAL LEISURE GROUP, INC. AND SUBSIDIARIES
NOTES TO CONSOLIDATED FINANCIAL STATEMENTS (Continued)
DECEMBER 31, 2014
NOTE 14—INCOME TAXES (Continued)
decreased income tax expense, was reflected in the 2013 reporting period. The change in the corporatefavorably impacting our effective tax rate initially negatively impacted income tax expense as the future benefit expected to be realized from our U.K. net deferred tax assets decreased; however, goingrate. Going forward, the lower corporate tax rate will continue to decrease income tax expense and favorably impact our effective tax rate.
The FASB issued ASU 2015-17, which requires that deferred tax assets and liabilities be classified as noncurrent in a classified balance sheet. ILG has elected to early adopt ASU 2015-17 prospectively in the fourth quarter of 2015. There was no impact on our results of operations as a result of the adoption of ASU 2015-17. See Note 2 for further discussion.
NOTE 15—SEGMENT INFORMATION
Segment Information
Pursuant to FASB guidance as codified in ASC 280, an operating segment is a component of a public entity (1) that engages in business activities that may earn revenues and incur expenses; (2) for which operating results are regularly reviewed by the entity's chief operating decision maker to make decisions about resources to be allocated to the segments and assess its performance; and (3) for which discrete financial information is available. We also considered how the businesses are organized as to segment management, and the focus of the businesses with regards to the types of products or services offered. In the fourth quarter of 2014, as a result of the acquisition of HVO, ILG reorganized its management reporting structure resulting in the following operating and reportable segments: Exchange and Rental, and Vacation Ownership.
Our Exchange and Rental segment offers access to vacation accommodations and other travel-related transactions and services to leisure travelers, by providing vacation exchange services and vacation rental, working with resort developers and managing vacation properties. Our Vacation
INTERVAL LEISURE GROUP, INC. AND SUBSIDIARIES
NOTES TO CONSOLIDATED FINANCIAL STATEMENTS (Continued)
DECEMBER 31, 2015
NOTE 15—SEGMENT INFORMATION (Continued)
Ownership segment engages in the management, sales, marketing, financing, and development of vacation ownership interests and related services to owners and associations.
ILG provides certain corporate functions that benefit the organization as whole. Such corporate functions include corporate services relating to oversight, accounting, legal, treasury, tax, internal audit, human resources, and certain IT functions. Historically most of these costs have been borne by the Interval business. Beginning in the fourth quarter of 2014, costs relating to such corporate functions that are not directly cross-charged to individual businesses are being allocated to our two operating and reportable segments based on a pre-determined measure of profitability relative to total ILG. All such allocations relate only to general and administrative expenses. The consolidated statements of income are not impacted by this cross-segment allocation. Consequently, for comparative purposes, we have recasted our segment results for 2015, 2014 2013 and 20122013 to include such corporate allocations.
Information on reportable segments and reconciliation to consolidated operating income is presented below (in thousands):
| | Year Ended December 31, | |||||||||
|---|---|---|---|---|---|---|---|---|---|---|
| | 2015 | 2014 | 2013 | |||||||
Exchange and Rental | ||||||||||
Member and other revenue | $ | 356,649 | $ | 352,513 | $ | 365,007 | ||||
Rental management revenue | 50,384 | 48,148 | 29,956 | |||||||
Pass-through revenues | 94,311 | 82,729 | 47,426 | |||||||
| | | | | | | | | | | |
Total revenues | 501,344 | 483,390 | 442,389 | |||||||
Cost of sales | 194,999 | 183,868 | 145,562 | |||||||
| | | | | | | | | | | |
Gross profit | 306,345 | 299,522 | 296,827 | |||||||
Selling and marketing expense | 58,588 | 58,020 | 53,100 | |||||||
General and administrative expense | 103,325 | 102,796 | 93,903 | |||||||
Amortization expense of intangibles | 8,578 | 7,058 | 5,126 | |||||||
Depreciation expense | 15,688 | 14,683 | 14,134 | |||||||
| | | | | | | | | | | |
Segment operating income | $ | 120,166 | $ | 116,965 | $ | 130,564 | ||||
| | | | | | | | | | | |
| | | | | | | | | | | |
| | | | | | | | | | | |
INTERVAL LEISURE GROUP, INC. AND SUBSIDIARIES
NOTES TO CONSOLIDATED FINANCIAL STATEMENTS (Continued)
DECEMBER 31, 20142015
NOTE 15—SEGMENT INFORMATION (Continued)
Information on
| | Year Ended December 31, | |||||||||
|---|---|---|---|---|---|---|---|---|---|---|
| | 2015 | 2014 | 2013 | |||||||
Vacation Ownership | ||||||||||
Management fee revenue | $ | 99,566 | $ | 92,017 | $ | 41,595 | ||||
Vacation ownership sales and financing revenue | 39,041 | 9,478 | — | |||||||
Pass-through revenue | 57,485 | 29,488 | 17,231 | |||||||
| | | | | | | | | | | |
Total revenue | 196,092 | 130,983 | 58,826 | |||||||
Cost of sales | 121,762 | 80,613 | 33,948 | |||||||
| | | | | | | | | | | |
Gross profit | 74,330 | 50,370 | 24,878 | |||||||
Selling and marketing expense | 12,449 | 3,595 | 622 | |||||||
General and administrative expense | 46,766 | 30,374 | 18,671 | |||||||
Amortization expense of intangibles | 5,376 | 5,243 | 3,007 | |||||||
Depreciation expense | 1,761 | 1,029 | 397 | |||||||
| | | | | | | | | | | |
Segment operating income | $ | 7,978 | $ | 10,129 | $ | 2,181 | ||||
| | | | | | | | | | | |
| | | | | | | | | | | |
| | | | | | | | | | | |
| | Year Ended December 31, | |||||||||
|---|---|---|---|---|---|---|---|---|---|---|
| | 2015 | 2014 | 2013 | |||||||
Consolidated | ||||||||||
Revenue | $ | 697,436 | $ | 614,373 | $ | 501,215 | ||||
Cost of sales | 316,761 | 264,481 | 179,510 | |||||||
| | | | | | | | | | | |
Gross profit | 380,675 | 349,892 | 321,705 | |||||||
Direct segment operating expenses | 252,531 | 222,798 | 188,960 | |||||||
| | | | | | | | | | | |
Operating income | $ | 128,144 | $ | 127,094 | $ | 132,745 | ||||
| | | | | | | | | | | |
| | | | | | | | | | | |
| | | | | | | | | | | |
Selected financial information by reportable segments and reconciliation to consolidated operating incomesegment is presented below. Prior period segment financial information presented has been recast to reflect the reorganized reporting structurebelow (in thousands):
| | Year Ended December 31, | |||||||||
|---|---|---|---|---|---|---|---|---|---|---|
| | 2014 | 2013 | 2012 | |||||||
Exchange and Rental | ||||||||||
Membership revenue | $ | 352,513 | $ | 365,007 | $ | 357,732 | ||||
Rental management revenue | 48,148 | 29,956 | 27,075 | |||||||
Pass-through revenues | 82,729 | 47,426 | 43,986 | |||||||
| | | | | | | | | | | |
Total revenues | 483,390 | 442,389 | 428,793 | |||||||
Cost of sales | 183,868 | 145,562 | 141,153 | |||||||
| | | | | | | | | | | |
Gross profit | 299,522 | 296,827 | 287,640 | |||||||
Selling and marketing expense | 58,020 | 53,100 | 53,120 | |||||||
General and administrative expense | 102,796 | 93,903 | 93,237 | |||||||
Amortization expense of intangibles | 7,058 | 5,126 | 20,444 | |||||||
Depreciation expense | 14,683 | 14,134 | 13,185 | |||||||
| | | | | | | | | | | |
Segment operating income | $ | 116,965 | $ | 130,564 | $ | 107,654 | ||||
| | | | | | | | | | | |
| | | | | | | | | | | |
| | | | | | | | | | | |
| | December 31, | ||||||
|---|---|---|---|---|---|---|---|
| | 2015 | 2014 | |||||
Total Assets: | |||||||
Exchange and Rental | $ | 905,021 | $ | 928,081 | |||
Vacation Ownership | 374,086 | �� | 395,921 | ||||
| | | | | | | | |
Total | $ | 1,279,107 | $ | 1,324,002 | |||
| | | | | | | | |
| | | | | | | | |
| | | | | | | | |
| | Year Ended December 31, | |||||||||
|---|---|---|---|---|---|---|---|---|---|---|
| | 2014 | 2013 | 2012 | |||||||
Vacation Ownership | ||||||||||
Management fee revenue | $ | 92,017 | $ | 41,595 | $ | 27,871 | ||||
Vacation ownership sales and financing revenue | 9,478 | — | — | |||||||
Pass-through revenue | 29,488 | 17,231 | 16,675 | |||||||
| | | | | | | | | | | |
Total revenue | 130,983 | 58,826 | 44,546 | |||||||
Cost of sales | 80,613 | 33,948 | 27,106 | |||||||
| | | | | | | | | | | |
Gross profit | 50,370 | 24,878 | 17,440 | |||||||
Selling and marketing expense | 3,595 | 622 | 439 | |||||||
General and administrative expense | 30,374 | 18,671 | 12,033 | |||||||
Amortization expense of intangibles | 5,243 | 3,007 | 2,597 | |||||||
Depreciation expense | 1,029 | 397 | 244 | |||||||
| | | | | | | | | | | |
Segment operating income | $ | 10,129 | $ | 2,181 | $ | 2,127 | ||||
| | | | | | | | | | | |
| | | | | | | | | | | |
| | | | | | | | | | | |
| | Year Ended December 31, | |||||||||
|---|---|---|---|---|---|---|---|---|---|---|
| | 2015 | 2014 | 2013 | |||||||
Capital expenditures | ||||||||||
Exchange and Rental | $ | 16,046 | $ | 18,008 | $ | 14,361 | ||||
Vacation Ownership | 4,251 | 1,079 | 339 | |||||||
| | | | | | | | | | | |
Total | $ | 20,297 | $ | 19,087 | $ | 14,700 | ||||
| | | | | | | | | | | |
| | | | | | | | | | | |
| | | | | | | | | | | |
INTERVAL LEISURE GROUP, INC. AND SUBSIDIARIES
NOTES TO CONSOLIDATED FINANCIAL STATEMENTS (Continued)
DECEMBER 31, 20142015
NOTE 15—SEGMENT INFORMATION (Continued)
| | Year Ended December 31, | |||||||||
|---|---|---|---|---|---|---|---|---|---|---|
| | 2014 | 2013 | 2012 | |||||||
Consolidated | ||||||||||
Revenue | $ | 614,373 | $ | 501,215 | $ | 473,339 | ||||
Cost of sales | 264,481 | 179,510 | 168,259 | |||||||
| | | | | | | | | | | |
Gross profit | 349,892 | 321,705 | 305,080 | |||||||
Direct segment operating expenses | 222,798 | 188,960 | 195,299 | |||||||
| | | | | | | | | | | |
Operating income | $ | 127,094 | $ | 132,745 | $ | 109,781 | ||||
| | | | | | | | | | | |
| | | | | | | | | | | |
| | | | | | | | | | | |
Selected financial information by reportable segment is presented below (in thousands):
| | December 31, | ||||||
|---|---|---|---|---|---|---|---|
| | 2014 | 2013 | |||||
Total Assets: | |||||||
Exchange and Rental | $ | 931,698 | $ | 732,161 | |||
Vacation Ownership | 395,921 | 292,458 | |||||
| | | | | | | | |
Total | $ | 1,327,619 | $ | 1,024,619 | |||
| | | | | | | | |
| | | | | | | | |
| | | | | | | | |
| | Year Ended December 31, | |||||||||
|---|---|---|---|---|---|---|---|---|---|---|
| | 2014 | 2013 | 2012 | |||||||
Capital expenditures | ||||||||||
Exchange and Rental | $ | 18,008 | $ | 14,361 | $ | 14,491 | ||||
Vacation Ownership | 1,079 | 339 | 549 | |||||||
| | | | | | | | | | | |
Total | $ | 19,087 | $ | 14,700 | $ | 15,040 | ||||
| | | | | | | | | | | |
| | | | | | | | | | | |
| | | | | | | | | | | |
Geographic Information
We conduct operations through offices in the U.S. and 15 other countries. For the years ended December 31, 2015, 2014 2013 and 20122013 revenue is sourced from over 100 countries worldwide. Other than the United States and Europe, revenue sourced from any individual country or geographic region did not exceed 10% of consolidated revenue for the years ended December 31, 2015, 2014 2013 and 2012.
Geographic information on revenue, based on sourcing, and long-lived assets, based on physical location, is presented in the table below (in thousands). Amounts in the proceeding table representing
INTERVAL LEISURE GROUP, INC. AND SUBSIDIARIES
NOTES TO CONSOLIDATED FINANCIAL STATEMENTS (Continued)
DECEMBER 31, 2014
NOTE 15—SEGMENT INFORMATION (Continued)
revenue sourced from the United States and Europe versus all other countries for the year ended December 31, 2012 have been reclassified to conform to current period presentation.2013.
| | Year Ended December 31, | Year Ended December 31, | ||||||||||||||||||
|---|---|---|---|---|---|---|---|---|---|---|---|---|---|---|---|---|---|---|---|---|
| | 2014 | 2013 | 2012 | 2015 | 2014 | 2013 | ||||||||||||||
Revenue: | ||||||||||||||||||||
United States | $ | 483,007 | $ | 404,886 | $ | 385,973 | $ | 577,052 | $ | 483,007 | $ | 404,886 | ||||||||
Europe | 73,119 | 34,306 | 26,715 | 68,237 | 73,119 | 34,306 | ||||||||||||||
All other countries(1) | 58,247 | 62,023 | 60,651 | 52,147 | 58,247 | 62,023 | ||||||||||||||
| | | | | | | | | | | | | | | | | | | | | |
Total | $ | 614,373 | $ | 501,215 | $ | 473,339 | $ | 697,436 | $ | 614,373 | $ | 501,215 | ||||||||
| | | | | | | | | | | | | | | | | | | | | | |
| | | | | | | | | | | | | | | | | | | | | |
| | December 31, | December 31, | ||||||||||||
|---|---|---|---|---|---|---|---|---|---|---|---|---|---|---|
| | 2014 | 2013 | 2015 | 2014 | ||||||||||
Long-lived assets (excluding goodwill and intangible assets): | ||||||||||||||
United States | $ | 81,291 | $ | 53,056 | $ | 86,813 | $ | 81,291 | ||||||
Europe | 4,884 | 5,812 | 4,335 | 4,884 | ||||||||||
All other countries | 426 | 688 | 334 | 426 | ||||||||||
| | | | | | | | | | | | | | | |
Total | $ | 86,601 | $ | 59,556 | $ | 91,482 | $ | 86,601 | ||||||
| | | | | | | | | | | | | | | | |
| | | | | | | | | | | | | | | |
NOTE 16—COMMITMENTS AND CONTINGENCIES
In the ordinary course of business, ILG is a party to various legal proceedings. ILG establishes reserves for specific legal matters when it determines that the likelihood of an unfavorable outcome is probable and the loss is reasonably estimable. ILG does not establish reserves for identified legal matters when ILG believes that the likelihood of an unfavorable outcome is not probable. Although management currently believes that an unfavorable resolution of claims against ILG, including claims where an unfavorable outcome is reasonably possible, will not have a material impact on the liquidity, results of operations, or financial condition of ILG, these matters are subject to inherent uncertainties and management's view of these matters may change in the future. ILG also evaluates other contingent matters, including tax contingencies, to assess the probability and estimated extent of potential loss. See Note 14 for a discussion of income tax contingencies.
INTERVAL LEISURE GROUP, INC. AND SUBSIDIARIES
NOTES TO CONSOLIDATED FINANCIAL STATEMENTS (Continued)
DECEMBER 31, 2015
NOTE 16—COMMITMENTS AND CONTINGENCIES (Continued)
Lease Commitments
ILG leases office space, computers and equipment used in connection with its operations under various operating leases, many of which contain escalation clauses. We account for leases under ASC Topic 840, "Leases" ("ASC 840").
INTERVAL LEISURE GROUP, INC. AND SUBSIDIARIES
NOTES TO CONSOLIDATED FINANCIAL STATEMENTS (Continued)
DECEMBER 31, 2014
NOTE 16—COMMITMENTS AND CONTINGENCIES (Continued)
Future minimum payments under operating lease agreements are as follows (in thousands):
Years Ending December 31, | | | ||||||
|---|---|---|---|---|---|---|---|---|
2015 | $ | 14,308 | ||||||
2016 | 12,684 | $ | 12,465 | |||||
2017 | 9,527 | 10,407 | ||||||
2018 | 7,868 | 8,274 | ||||||
2019 | 6,728 | 6,794 | ||||||
2020 | 6,133 | |||||||
Thereafter through 2021 | 9,833 | 9,478 | ||||||
| | | | | | | | | |
Total | $ | 60,948 | $ | 53,551 | ||||
| | | | | | | | | | |
| | | | | | | | | |
Expense charged to operations under these agreements was $12.1 million, $12.7 million $11.1 million and $10.8$11.1 million for the years ended December 31, 2015, 2014 2013 and 2012,2013, respectively. Lease expense is recognized on a straight-line basis over the term of the lease, including any option periods, as appropriate. The same lease term is used for lease classification, the amortization period of related leasehold improvements, and the estimation of future lease commitments.
Other items, such as certain purchase commitments and guarantees are not recognized as liabilities in our consolidated financial statements but are required to be disclosed in the footnotes to the financial statements. These funding commitments could potentially require our performance in the event of demands by third parties or contingent events. The following table summarizes these items, on an undiscounted basis, at December 31, 20142015 and the future periods in which such obligations are expected to be settled in cash. In addition, the table reflects the timing of principal and interest payments on outstanding borrowings.
Years Ending December 31, | Total | 2015 | 2016 | 2017 | 2018 | 2019 | Thereafter | Total | 2016 | 2017 | 2018 | 2019 | 2020 | Thereafter | ||||||||||||||||||||||||||||||
|---|---|---|---|---|---|---|---|---|---|---|---|---|---|---|---|---|---|---|---|---|---|---|---|---|---|---|---|---|---|---|---|---|---|---|---|---|---|---|---|---|---|---|---|---|
| | (Dollars in thousands) | (Dollars in thousands) | ||||||||||||||||||||||||||||||||||||||||||
Debt principal | $ | 488,000 | $ | — | $ | — | $ | — | $ | — | $ | 488,000 | $ | — | $ | 425,000 | $ | — | $ | — | $ | — | $ | 75,000 | $ | — | $ | 350,000 | ||||||||||||||||
Debt interest (projected) | 42,583 | 9,970 | 9,997 | 9,969 | 9,970 | 2,677 | — | 158,138 | 23,906 | 23,895 | 23,895 | 20,817 | 19,687 | 45,938 | ||||||||||||||||||||||||||||||
Guarantees, surety bonds, and letters of credit | 65,315 | 57,473 | 4,661 | 1,353 | 1,148 | 596 | 84 | 88,680 | 65,122 | 7,894 | 7,488 | 6,511 | 1,623 | 42 | ||||||||||||||||||||||||||||||
Purchase obligations | 80,044 | 19,609 | 11,626 | 19,717 | 7,772 | 7,320 | 14,000 | |||||||||||||||||||||||||||||||||||||
Purchase obligations and other commitments | 81,860 | 21,995 | 22,583 | 10,164 | 9,601 | 8,992 | 8,525 | |||||||||||||||||||||||||||||||||||||
| | | | | | | | | | | | | | | | | | | | | | | | | | | | | | | | | | | | | | | | | | | | | |
Total commitments | $ | 675,942 | $ | 87,052 | $ | 26,284 | $ | 31,039 | $ | 18,890 | $ | 498,593 | $ | 14,084 | $ | 753,678 | $ | 111,023 | $ | 54,372 | $ | 41,547 | $ | 111,929 | $ | 30,302 | $ | 404,505 | ||||||||||||||||
| | | | | | | | | | | | | | | | | | | | | | | | | | | | | | | | | | | | | | | | | | | | | |
| | | | | | | | | | �� | | | | | | | | | | | | | | | | | | | | | | | |||||||||||||
| | | | | | | | | | | | | | | | | | | | | | | | | | | | | | | | | | | | | | | | | | | | | |
At December 31, 2014,2015, guarantees, surety bonds and letters of credit totaled $65.3$88.7 million, with the highest annual amount of $57.5$65.1 million occurring in year one. The total includes a guarantee by us of up to $36.7 million of the construction loan for the Maui project. The total also includes maximum exposure under guarantees of $17.9$41.3 million which primarily relates to our Exchange and Rental
INTERVAL LEISURE GROUP, INC. AND SUBSIDIARIES
NOTES TO CONSOLIDATED FINANCIAL STATEMENTS (Continued)
DECEMBER 31, 2015
NOTE 16—COMMITMENTS AND CONTINGENCIES (Continued)
segment's rental management agreements, including those with guaranteed dollar amounts, and accommodation leases supporting the segment's management activities that are entered into on behalf of the property owners for which either party generally may terminate such leases upon 60 to 90 days prior written notice to the other party. In addition, certain of our rental management agreements provide that owners receive specified percentages of the rental revenue generated under its management. In these cases, the operating expenses for the rental operations are paid from the
INTERVAL LEISURE GROUP, INC. AND SUBSIDIARIES
NOTES TO CONSOLIDATED FINANCIAL STATEMENTS (Continued)
DECEMBER 31, 2014
NOTE 16—COMMITMENTS AND CONTINGENCIES (Continued)
revenue generated by the rentals, the owners are then paid their contractual percentages or guaranteed amounts, and our vacation rental business either retain the balance (if any) as its fee or makes up the deficit. Although such deficits are reasonably possible in a few of these agreements, as of December 31, 2014,2015, future amounts are not expected to be significant either individually or in the aggregate.
Additionally, as of December 31, 2014,2015, our letters of credit totaled $8.3$8.6 million and were principally related to our Vacation Ownership sales and financing activities. More specifically, these letter of credits provide alternate assurance on amounts held in escrow which enable our developer entities to access purchaser deposits prior to closings, as well as provide a guarantee of maintenance fees owed by our developer entities during subsidy periods at a particular vacation ownership resort, among other items.
The purchase obligations primarily relate to future guaranteed purchases of rental inventory, operational support services, marketing related benefits and membership fulfillment benefits. Certain of our vacation rental businesses also enter into agreements, as principal, for services purchased on behalf of property owners for which it is subsequently reimbursed. As such, we are the primary obligor and may be liable for unreimbursed costs. As of December 31, 2014,2015, amounts pending reimbursements are not significant.
European Union Value Added Tax Matter
In 2009, the European Court of Justice issued a judgment related to Value Added Tax ("VAT") in Europe against an unrelated party. The judgment affects companies who transact within the European Union ("EU"), specifically providers of vacation interest exchange services, and altered the manner in which the Exchange and Rental segment accounts for VAT on its revenues as well as to which EU country VAT is owed.
As of December 31, 20142015 and December 31, 2013,2014, ILG had an accrual of $2.3$0.4 million and $2.9$2.3 million, respectively, representing accrued VAT liabilities, net of any VAT reclaim refund receivable related to this matter. The net change of $0.6$2.0 million in the accrual from December 31, 20132014 primarily relates to a decrease in the change in estimate primarily to update the periods for which the accrued VAT liabilities are due, and the resolution with the respective taxing authority of a specific methodology that is to be utilized, as well as the effect of foreign currency remeasurements. Changes in estimates resulted in favorable adjustments of $2.1 million, $0.7 million $1.1 million and $1.2$1.1 million to our consolidated statements of income for the years ended December 31, 2015, 2014 2013 and 2012,2013, respectively.
Because of the uncertainty surrounding the ultimate outcome and settlement of these VAT liabilities, it is reasonably possible that future costs to settle these VAT liabilities as of December 31, 20142015 may range from $2.3$0.4 million up to approximately $3.5$0.8 million based on quarter-endyear-end exchange rates. ILG believes that the $2.3$0.4 million accrual at December 31, 20142015 is our best estimate of probable future
INTERVAL LEISURE GROUP, INC. AND SUBSIDIARIES
NOTES TO CONSOLIDATED FINANCIAL STATEMENTS (Continued)
DECEMBER 31, 2015
NOTE 16—COMMITMENTS AND CONTINGENCIES (Continued)
obligations for the settlement of these VAT liabilities. The difference between the probable and reasonably possible amounts is primarily attributable to the assessment of certain potential penalties.
NOTE 17—SUPPLEMENTAL CASH FLOW INFORMATION
| | Year Ended December 31, | |||||||||
|---|---|---|---|---|---|---|---|---|---|---|
| | 2015 | 2014 | 2013 | |||||||
| | (In thousands) | |||||||||
Cash paid during the period for: | ||||||||||
Interest, net of amounts capitalized | $ | 15,408 | $ | 6,376 | $ | 5,358 | ||||
Income taxes, net of refunds | $ | 28,313 | $ | 48,309 | $ | 42,750 | ||||
Non-cash financing activity: | ||||||||||
Issuance of noncontrolling interest in connection with an acquisition | $ | — | $ | — | $ | 31,347 | ||||
NOTE 18—RELATED PARTY TRANSACTIONS
Agreements with Liberty
In connection with the transactions contemplated by the Merger Agreement and Separation Agreement, ILG and Liberty Interactive Corp. agreed to amend and restate that certain Spinco Agreement, dated May 13, 2008, by and among Liberty, certain affiliates of Liberty and IAC/InterActive Corp., as subsequently assigned to ILG on August 20, 2008. This amended agreement provides that, at the closing of the Vistana transaction, Liberty will be entitled to appoint two directors to the Board (rather than the three designees Liberty currently has the right to appoint). So long as Liberty continues to beneficially own at least 10% of ILG's common stock, Liberty will have the right to nominate a proportionate number of directors to ILG's board of directors. The amended agreement restricts Liberty and its affiliates from acquiring in excess of 35% of ILG's outstanding shares of common stock without ILG's consent.
The amended agreement with Liberty, and the respective rights and obligations thereunder, will terminate if Liberty's beneficial ownership falls below 10% of ILG's outstanding equity, unless Liberty's ownership was reduced below 10% not in conjunction with Liberty transferring its shares. In that event, Liberty's rights will terminate three years from the date of the amended agreement.
Also in connection with the transactions contemplated by the Merger Agreement and Separation Agreement, ILG and Liberty agreed to amend and restate that certain registration rights agreement, dated as of August 20, 2008, by and among ILG, Liberty and an affiliate of Liberty. The Amended Registration Rights Agreement provides Liberty with four demand registration rights and sets the aggregate offering price threshold for any demand registration statement at $50 million. Pursuant to the Amended Registration Rights Agreement, ILG must prepare a demand registration statement requested by Liberty no earlier than upon termination of the Merger Agreement or sixty days following the consummation of the transactions contemplated by the Merger Agreement. For the year ended December 31, 2015, we have incurred approximately $7 million of transaction costs related to this pending acquisition.
INTERVAL LEISURE GROUP, INC. AND SUBSIDIARIES
NOTES TO CONSOLIDATED FINANCIAL STATEMENTS (Continued)
DECEMBER 31, 20142015
NOTE 17—SUPPLEMENTAL CASH FLOW INFORMATION
| | Year Ended December 31, | |||||||||
|---|---|---|---|---|---|---|---|---|---|---|
| | 2014 | 2013 | 2012 | |||||||
| | (In thousands) | |||||||||
Non-cash financing activity: | ||||||||||
Issuance of noncontrolling interest in connection with an acquisition | $ | — | $ | 31,347 | $ | — | ||||
Cash paid during the period for: | ||||||||||
Interest, net of amounts capitalized | $ | 6,376 | $ | 5,358 | $ | 31,363 | ||||
Income taxes, net of refunds | $ | 48,309 | $ | 42,750 | $ | 25,693 | ||||
NOTE 18—RELATED PARTY TRANSACTIONS (Continued)
Agreements with Liberty
In connection with the spin-off, ILG entered into a "Spinco Agreement" with Liberty Interactive Corporation, formerly known as Liberty Media Corporation, and assumed from IAC certain rights and obligations relating to post-spin-off governance arrangements and acquisitions, including:
As required by the Spinco Agreement, ILG also entered into a registration rights agreement with Liberty at the time of the spin-off. Under the registration rights agreement, Liberty and its permitted transferees (the "Holders") are entitled to three demand registration rights (and unlimited piggyback registration rights) in respect of the shares of ILG common stock received by Liberty as a result of the spin-off and other shares of ILG common stock acquired by Liberty consistent with the Spinco Agreement (collectively, the "Registrable Shares"). The Holders are permitted to exercise their registration rights in connection with certain hedging transactions that they may enter into in respect of the Registrable Shares. ILG is obligated to indemnify the Holders, and each selling Holder is obligated to indemnify ILG, against specified liabilities in connection with misstatements or omissions in any registration statement.
CLC World Resorts and Hotels
Effective November 4, 2013, CLC became a related party of ILG when VRI Europe Limited, a subsidiary of ILG, purchased CLC's European shared ownership resort management business and, in connection with this purchase, issued to CLC a noncontrolling interest in VRI Europe. As part of this arrangement, VRI Europe and CLC entered into a shared services arrangement whereby each party provides certain services to one another at an agreed upon cost. VRI Europe's corresponding income and expense resulting from this shared services arrangement is recorded on a straight-line basis
INTERVAL LEISURE GROUP, INC. AND SUBSIDIARIES
NOTES TO CONSOLIDATED FINANCIAL STATEMENTS (Continued)
DECEMBER 31, 2014
NOTE 18—RELATED PARTY TRANSACTIONS (Continued)
throughout the year. Additionally, we have an ongoing business relationship with CLC as part of their Interval Network affiliation.
During the year ended December 31, 2015, VRI Europe recorded $0.6 million and $2.6 million of income and expense, respectively, in shared services with CLC, which is included within our Vacation Ownership segment. Additionally, we recorded $0.6 million of Exchange and Rental revenue in 2015 related to membership enrollments and sales of marketing materials. As of December 31, 2015, we had a trade payable of less than $0.1 million due to CLC, and a receivable of $0.5 million due from CLC.
During the year ended December 31, 2014, VRI Europe recorded $0.7 million and $3.1 million of income and expense, respectively, in shared services with CLC, which is included within our Vacation Ownership segment. Additionally, we recorded $0.6 million of Exchange and Rental revenue in 2014 related to membership enrollments and sales of marketing materials. As of December 31, 2014, we had a trade payable of $0.1 million due to CLC, and a receivable of $0.5 million due from CLC.
During the year ended December 31, 2013, VRI Europe recorded $0.1 million and $0.5 million of income and expense, respectively, in shared services with CLC, which is included within our Vacation Ownership segment. Additionally, we recorded $0.7 million of Exchange and Rental revenue in 2013 related to membership enrollments and sales of marketing materials. As of December 31, 2013,2015 and 2014, we had a trade payable of $0.6 million due to CLC, and a receivable of $1.8 million due from CLC.
As of December 31, 2014, we have a loan of $15.1 million due from CLC. The loan is secured and matures five years subsequent to the funding date with a fixed interest rate payable monthly. The outstanding loan is to be repaid in full at maturity either in cash or by means of a share option exercisable by ILG, at its sole discretion, which would allow for settlement of the loan in CLC's shares of VRI Europe for contractually determined equivalent value. The funding of this loan was in October 2014. We recorded interest income of $0.9 million and $0.2 million in the consolidated statement of income for the year ended December 31, 2014.
Royal Caribbean Cruises
Royal Caribbean Cruises Ltd. ("RCCL") is a related party of ILG as one of our board members is currently employed at RCCL. Through the travel services we offer, we sell RCCL cruises at either net or published fares. We recognize revenue for such transactions on a net basis. During each of the years ended December 31, 20142015 and 2013, we recorded revenue of $0.9 million for such RCCL cruises sold to Interval members and others. As of December 31, 2014 and 2013, we had a trade payable of $1.7 million and $1.4 million, respectively, due to RCCL, relating to net fare transactions, and as of each of the respective year ends, a receivable of $0.1million, for commissions due from RCCL, relating to sales transactions at published fares.2014.
Maui Timeshare Venture and Host Hotels and Resorts
In connection with the acquisition of HVO in October of 2014, we acquired a noncontrolling ownership interest in Maui Timeshare Venture, LLC, a joint venture to develop and operate a vacation ownership resort in the state of Hawaii. Host Hotels and Resorts Inc. controls the majority ownership interest in this joint venture. Consequently, we've determined both entities represent related parties of ILG.
During the year ended December 31, 2014,2015, we recorded revenue of $9.9$21.8 million from this joint venture related primarily to resort management and vacation ownership sales and marketing services performed on behalf of the joint venture pursuant to contractual arrangements at market rates. As of December 31, 2014,2015, we had a trade payable of $2.0$0.3 million due to the joint venture and a receivable of $1.5$0.4 million owed from the joint venture.
INTERVAL LEISURE GROUP, INC. AND SUBSIDIARIES
NOTES TO CONSOLIDATED FINANCIAL STATEMENTS (Continued)
DECEMBER 31, 20142015
NOTE 19—QUARTERLY RESULTS (UNAUDITED)
Revenue at ILG is influenced by the seasonal nature of travel. The vacation exchange business generally recognize exchange and Getaway revenue based on confirmation of the vacation, with the first quarter generally experiencing higher revenue and the fourth quarter generally experiencing lower revenue. The vacation rental business recognize rental revenue based on occupancy, with the first and third quarters generally generating higher revenue and the second and fourth quarters generally generating lower revenue. The timeshare management part of this business does not experience significant seasonality.
| | Quarter Ended | Quarter Ended | ||||||||||||||||||||||||
|---|---|---|---|---|---|---|---|---|---|---|---|---|---|---|---|---|---|---|---|---|---|---|---|---|---|---|
| | March 31 | June 30 | September 30 | December 31 | March 31 | June 30 | September 30 | December 31 | ||||||||||||||||||
| | (In thousands, except for share data) | (In thousands, except for share data) | ||||||||||||||||||||||||
2015 | ||||||||||||||||||||||||||
Revenue | $ | 184,552 | $ | 173,745 | $ | 174,040 | $ | 165,099 | ||||||||||||||||||
Gross profit | 102,195 | 93,322 | 98,427 | 86,731 | ||||||||||||||||||||||
Operating income | 40,322 | 31,361 | 33,023 | 23,438 | ||||||||||||||||||||||
Net income attributable to common stockholders | 25,262 | 16,641 | 19,100 | 12,312 | ||||||||||||||||||||||
Earnings per share attributable to common stockholders(1): | ||||||||||||||||||||||||||
Basic | 0.44 | 0.29 | 0.33 | 0.21 | ||||||||||||||||||||||
Diluted | 0.44 | 0.29 | 0.33 | 0.21 | ||||||||||||||||||||||
2014 | ||||||||||||||||||||||||||
Revenue | $ | 157,041 | $ | 143,528 | $ | 146,683 | $ | 167,121 | $ | 157,041 | $ | 143,528 | $ | 146,683 | $ | 167,121 | ||||||||||
Gross profit | 93,191 | 83,767 | 87,688 | 85,246 | 93,191 | 83,767 | 87,688 | 85,246 | ||||||||||||||||||
Operating income | 40,425 | 31,937 | 34,905 | 19,827 | 40,425 | 31,937 | 34,905 | 19,827 | ||||||||||||||||||
Net income attributable to common stockholders | 23,175 | 18,360 | 21,295 | 15,560 | 23,715 | 18,360 | 21,295 | 15,560 | ||||||||||||||||||
Earnings per share attributable to common stockholders(1): | ||||||||||||||||||||||||||
Basic | 0.41 | 0.32 | 0.37 | 0.27 | 0.41 | 0.32 | 0.37 | 0.27 | ||||||||||||||||||
Diluted | 0.41 | 0.32 | 0.37 | 0.27 | 0.41 | 0.32 | 0.37 | 0.27 | ||||||||||||||||||
2013 | ||||||||||||||||||||||||||
Revenue(2) | $ | 134,881 | $ | 124,983 | $ | 119,156 | $ | 122,195 | ||||||||||||||||||
Gross profit | 88,505 | 81,562 | 77,165 | 74,473 | ||||||||||||||||||||||
Operating income | 42,789 | 33,471 | 31,378 | 25,107 | ||||||||||||||||||||||
Net income attributable to common stockholders | 25,004 | 20,570 | 17,101 | 18,542 | ||||||||||||||||||||||
Earnings per share attributable to common stockholders(1): | ||||||||||||||||||||||||||
Basic | 0.44 | 0.36 | 0.30 | 0.32 | ||||||||||||||||||||||
Diluted | 0.44 | 0.36 | 0.29 | 0.32 | ||||||||||||||||||||||
Item 9. Changes in and Disagreements with Accountant on Accounting and Financial Disclosure.
Not applicable.
Item 9A. Controls and Procedures.
Evaluation of Disclosure Controls and Procedures
We monitor and evaluate on an ongoing basis our disclosure controls and internal control over financial reporting in order to improve our overall effectiveness. In the course of this evaluation, we modify and refine our internal processes as conditions warrant.
As required by Rule 13a-15(b) under the Securities Exchange Act of 1934, as amended (the "Exchange Act"), our management, including our Chief Executive Officer, Chief Financial Officer and Chief Accounting Officer, evaluated the effectiveness of our disclosure controls and procedures (as defined by Rule 13a-15(e) and 15d-15(e) under the Exchange Act). Based upon that evaluation, our Chief Executive Officer, Chief Financial Officer and Chief Accounting Officer concluded that as of the end of the period covered by this report, our disclosure controls and procedures were effective in providing reasonable assurance that information we are required to disclose in our filings with the Securities and Exchange Commission under the Exchange Act is recorded, processed, summarized and reported within the time periods specified in the Commission's rules and forms, and include controls and procedures designed to ensure that information required to be disclosed by us in the reports that we file or submit under the Exchange Act is accumulated and communicated to our management, including our principal executive and principal financial officers, as appropriate to allow timely decisions regarding required disclosure.
Management's Report on Internal Control over Financial Reporting
Our management is responsible for establishing and maintaining adequate internal control over financial reporting (as defined in Rule 13a-15(f) under the Exchange Act). Our internal control over financial reporting is a process designed to provide reasonable assurance regarding the reliability of financial reporting and the preparation of financial statements for external purposes in accordance with accounting principles generally accepted in the United States. Management assessed the effectiveness of our internal control over financial reporting as of December 31, 2014,2015, based on the framework set forth by the Committee of Sponsoring Organizations of the Treadway Commission in Internal Control—Integrated Framework (the "2013 framework"). In making this assessment, our management used the criteria for effective internal control over financial reporting described in "Internal Control—Integrated Framework" issued by the Committee of Sponsoring Organizations of the Treadway Commission. Based on this assessment, management has determined that, as of December 31, 2014,2015, our internal control over financial reporting is effective based on the criteria established in the 2013 framework. Our assessment of and conclusion on the effectiveness of internal control over financial reporting did not include the internal controls of our Hyatt Vacation Ownership business acquired in October 2014. This business is included in our 2014 consolidated financial statements and constituted $281.2 million and $227.8 million of total and net assets, respectively, as of December 31, 2014 and $29.4 million and $2.2 million of revenue and net income, respectively, for the year then ended.
The effectiveness of our internal control over financial reporting as of December 31, 20142015 has been audited by Ernst & Young LLP, an independent registered public accounting firm that audited our consolidated financial statements included in this Annual Report on Form 10-K, as stated in their attestation report, included herein.
Changes in Internal Control over Financial Reporting
We monitor and evaluate on an ongoing basis our disclosure controls and internal control over financial reporting in order to improve our overall effectiveness. In the course of this evaluation, we modify and refine our internal processes as conditions warrant.
As required by Rule 13a-15(d) of the Exchange Act, we, under the supervision and with the participation of our management, including the Chief Executive Officer, Chief Financial Officer and Chief Accounting Officer, also evaluated whether any changes occurred to our internal control over
financial reporting during the period covered by this report that have materially affected, or are reasonably likely to materially affect, such control. Based on that evaluation, there have been no material changes to internal controls over financial reporting.
Limitation on Controls
A control system, no matter how well conceived and operated, can provide only reasonable, not absolute, assurance that the objectives of the control system are met. The inherent limitations of these systems include the realities that judgments in decision-making may be flawed and that breakdowns may occur because of simple error or mistake. Additionally, controls could be circumvented by the individual acts of some persons or by collusion of two or more people. Therefore, even those systems determined to be effective can provide only reasonable assurance with respect to financial statement preparation and presentation.
REPORT OF INDEPENDENT REGISTERED PUBLIC ACCOUNTING FIRM
The Board of Directors and Stockholders of Interval Leisure Group, Inc. and subsidiaries
We have audited Interval Leisure Group, Inc. and subsidiaries' internal control over financial reporting as of December 31, 2014,2015, based on criteria established in Internal Control—Integrated Framework issued by the Committee of Sponsoring Organizations of the Treadway Commission (2013 framework) (the COSO criteria). Interval Leisure Group, Inc. and subsidiaries' management is responsible for maintaining effective internal control over financial reporting, and for its assessment of the effectiveness of internal control over financial reporting included in the accompanying Management's Report on Internal Control over Financial Reporting. Our responsibility is to express an opinion on the Company's internal control over financial reporting based on our audit.
We conducted our audit in accordance with the standards of the Public Company Accounting Oversight Board (United States). Those standards require that we plan and perform the audit to obtain reasonable assurance about whether effective internal control over financial reporting was maintained in all material respects. Our audit included obtaining an understanding of internal control over financial reporting, assessing the risk that a material weakness exists, testing and evaluating the design and operating effectiveness of internal control based on the assessed risk, and performing such other procedures as we considered necessary in the circumstances. We believe that our audit provides a reasonable basis for our opinion.
A company's internal control over financial reporting is a process designed to provide reasonable assurance regarding the reliability of financial reporting and the preparation of financial statements for external purposes in accordance with generally accepted accounting principles. A company's internal control over financial reporting includes those policies and procedures that (1) pertain to the maintenance of records that, in reasonable detail, accurately and fairly reflect the transactions and dispositions of the assets of the company; (2) provide reasonable assurance that transactions are recorded as necessary to permit preparation of financial statements in accordance with generally accepted accounting principles, and that receipts and expenditures of the company are being made only in accordance with authorizations of management and directors of the company; and (3) provide reasonable assurance regarding prevention or timely detection of unauthorized acquisition, use, or disposition of the company's assets that could have a material effect on the financial statements.
Because of its inherent limitations, internal control over financial reporting may not prevent or detect misstatements. Also, projections of any evaluation of effectiveness to future periods are subject to the risk that controls may become inadequate because of changes in conditions, or that the degree of compliance with the policies or procedures may deteriorate.
As indicated in the accompanying Management's Report on Internal Control over Financial Reporting, management's assessment of and conclusion on the effectiveness of internal control over financial reporting did not include the internal controls of the Hyatt Vacation Ownership business which is included in the 2014 consolidated financial statements of Interval Leisure Group, Inc. and subsidiaries and constituted $281.2 million and $227.8 million of total and net assets, respectively, as of December 31, 2014 and $29.4 million and $2.2 million of revenues and net income, respectively, for the year then ended. Our audit of internal control over financial reporting of Interval Leisure Group, Inc. and subsidiaries also did not include an evaluation of the internal control over the Hyatt Vacation Ownership business.
In our opinion, Interval Leisure Group, Inc. and subsidiaries maintained, in all material respects, effective internal control over financial reporting as of December 31, 2014,2015, based on the COSO criteria.
We also have audited, in accordance with the standards of the Public Company Accounting Oversight Board (United States), the consolidated balance sheets of Interval Leisure Group, Inc. and subsidiaries as of December 31, 20142015 and 2013,2014, and the related consolidated statements of income, comprehensive income, stockholders' equity, and cash flows for each of the three years in the period ended December 31, 20142015 of Interval Leisure Group, Inc. and subsidiaries and our report dated February 27, 201526, 2016 expressed an unqualified opinion thereon.
/s/ ERNST & YOUNG LLP Certified Public Accountants |
Miami, Florida
February 27, 201526, 2016
None.
The information required by Part III (Items 10, 11, 12, 13 and 14) has been incorporated herein by reference to ILG's definitive Proxy Statement to be used in connection with its 20152016 Annual Meeting of Stockholders, or the 20152016 Proxy Statement, as set forth below, in accordance with General Instruction G(3) of Form 10-K.
Item 10. Directors, Executive Officers and Corporate Governance.
Information relating to directors of ILG and the compliance of our directors and executive officers with Section 16(a) of the Exchange Act is set forth in the sections entitled "Election of Directors" and "Section 16(a) Beneficial Ownership Reporting Compliance," respectively, in the 20152016 Proxy Statement and is incorporated herein by reference. The information required by subsections (c)(3), (d)(4) and (d)(5) of Item 407 of Regulation S-K is set forth in the section entitled "Corporate Governance" in the 20152016 Proxy Statement and is incorporated herein by reference. We have included information regarding our executive officers and our Code of Ethics below.
Item 11. Executive Compensation.
The information required by Item 402 of Regulation S-K is set forth in the sections entitled "Executive Compensation," "Compensation Discussion and Analysis" and "Director Compensation" in the 20152016 Proxy Statement and is incorporated herein by reference. The information required by subsections (e)(4) and (e)(5) of Item 407 of Regulation S-K is set forth in the sections entitled: "Committees of the Board of Directors," "Compensation Committee Interlocks and Insider Participation" and "Compensation Committee Report," respectively, in the 20152016 Proxy Statement and is incorporated herein by reference; provided, that the information set forth in the section entitled "Compensation Committee Report" shall be deemed furnished herein and shall not be deemed incorporated by reference into any filing under the Securities Act or the Exchange Act.
Item 12. Security Ownership of Certain Beneficial Owners and Management and Related Stockholder Matters.
Information regarding ownership of ILG common stock, and securities authorized for issuance under ILG's equity compensation plans, is set forth in the sections entitled "Security Ownership of Certain Beneficial Owners and Management" and "Equity Compensation Plan Information," respectively, in the 20152016 Proxy Statement and is incorporated herein by reference.
Item 13. Certain Relationships and Related Transactions, and Director Independence.
Information regarding certain relationships and related transactions with ILG and director independence is set forth in the sections entitled "Certain Relationships and Related Person Transactions" and "Corporate Governance," respectively, in the 20152016 Proxy Statement and is incorporated herein by reference.
Item 14. Principal Accountant Fees and Services.
Information regarding the fees and services of ILG's independent registered public accounting firm and the pre-approval policies and procedures applicable to services provided to ILG by such firm is set forth in the section entitled "Independent Registered Public Accountants' Fees" in the 20152016 Proxy Statement and is incorporated herein by reference.
Executive Officers of the Registrant
The following information about ILG's executive officers and certain other key personnel is as of February 25, 2015.2016.
Craig M. Nash, age 61,62, has served as President and Chief Executive Officer of ILG since May 2008 and as Chairman of the Board of ILG since August 2008 and served as President of Interval from August 1989 until September 2014. Prior to assuming this role, Mr. Nash served in a series of increasingly significant roles with Interval, including as General Counsel. Mr. Nash joined Interval in 1982. Mr. Nash serves on the Board of Directors of the American Resort Development Association and is also a member of its Executive Committee.
Jeanette E. Marbert, age 58,59, has served as a Director of ILG since February 2015, as Chief Operating Officer of ILG since August 2008 and as Executive Vice President since June 2009. She has served in such capacity for Interval since June 1999. Prior to her tenure as Chief Operating Officer, Ms. Marbert served as General Counsel of Interval from 1994 to 1999. Ms. Marbert joined Interval in 1984.
William L. Harvey, age 58,59, has served as Chief Financial Officer of ILG since August 2008 and as Executive Vice President since June 2009. Prior to joining ILG in June 2008, Mr. Harvey served as the Chief Financial Officer for TrialGraphix, Inc., a Miami-based litigation support firm from August 2006 through November 2007. Between June 2003 and July 2006, Mr. Harvey served as a Vice President at LNR Property Corporation, a Miami-based diversified real estate and finance company, managing various financial and accounting units. From September 1992 through February 2003, Mr. Harvey served as the Executive Vice President and Chief Financial Officer of Pan Am International Flight Academy, Inc., a private provider of flight training services. Mr. Harvey is a registered CPA who began his professional career at Deloitte & Touche and was a partner in their Miami office prior to September 1992. Prior to June 2014, Mr. Harvey was a member of the Board of Directors of Summit Financial Services Group, Inc. and chair of the audit committee.
Victoria J. Kincke, age 59,60, has served as Secretary of ILG since May 2008 and as Senior Vice President and General Counsel of ILG since August 2008 and has served as Senior Vice President and General Counsel of Interval since May 2005. Prior to this time, Ms. Kincke served as General Counsel of Interval from July 1999. Ms. Kincke joined Interval in 1997.
John A. Galea, age 59,60, has served as Chief Accounting Officer of ILG since August 2008 and as Senior Vice President and Treasurer of ILG since June 2009. He has served as Chief Financial Officer for Interval since October 2006. Prior to this appointment, Mr. Galea served as Interval's Vice President and Chief Accounting Officer from January 2004. Mr. Galea joined Interval in 2000 as its Vice President, Accounting and Corporate Controller.
David C. Gilbert, age 60,61, has served as President of Interval International since September 2014. Mr. Gilbert originally joined Interval in 1987 and was most recently Executive Vice President of Resort Sales and Marketing. Mr. Gilbert is a trustee of ARDA, the ARDA International Foundation, and the Caribbean Hotel and Tourism Association Education Foundation.
John Burlingame, age 59,60, has served as President of the Hyatt Vacation Ownership business since its acquisition in October 2014. Mr. Burlingame served as the Global Head-Residential Development for Hyatt Hotels Corporation until October 2014. Mr. Burlingame has served on the board of directors of the American Resort Development Association (ARDA) for over 14 years and was a member of ARDA's Executive Committee for eight years. Mr. Burlingame served as ARDA's Chairman from May 2003 through May 2005. Mr. Burlingame is also a Trustee of the Aquila Three Peaks High Income Fund and the Aquila Three Peaks Opportunity Growth Fund and was a consulting editor for the Handbook of Real Estate Portfolio Management.
Kelvin M. Bloom, age 55,56, has served as President of AHR Hospitality Partners,Aqua-Aston Holdings, Inc., which owns Aqua and Aston, since December 2013. Mr. Bloom has served as CEO for Aston Hotels & ResortsAqua-Aston Hospitality, LLC for over 15 years, and also served as President of Aston Hotels and ResortsAqua-Aston Hospitality, LLC until March 2014. Prior to joining Aston, Mr. Bloom served as founding President of Castle Resorts & Hotels and Chief Operating Officer of The Castle Group. Mr. Bloom serves on the board of directors of Waikiki Improvement Association and previously served on the board of the Hawaii Tourism Authority.
Code of Ethics.
Our code of business conduct and ethics, which applies to all employees, including all executive officers and senior financial officers (including ILG's CFO, CAO and Controller) and directors, is posted on the Corporate Governance section of our website atwww.iilg.com. The code of ethics complies with Item 406 of SEC Regulation S-K and the rules of The NASDAQ Stock Market. Any changes to the code of ethics that affect the provisions required by Item 406 of Regulation S-K, and any waivers of the code of ethics for ILG's executive officers, directors or senior financial officers, will also be disclosed on ILG's website.
Item 15. Exhibits and Financial Statement Schedules
Report of Independent Registered Public Accounting Firm.
Consolidated Statements of Income for the years ended December 31, 2015, 2014 2013 and 2012.2013.
Consolidated Statements of Comprehensive Income for the years ended December 31, 2015, 2014 2013 and 2012.2013.
Consolidated Balance Sheets as of December 31, 20142015 and 2013.2014.
Consolidated Statements of Stockholders' Equity for the years ended December 31, 2015, 2014 2013 and 2012.2013.
Consolidated Statements of Cash Flows for the years ended December 31, 2015, 2014 2013 and 2012.2013.
Notes to Consolidated Financial Statements.
Schedule Number II Valuation and Qualifying Accounts.
All other financial statements and schedules not listed have been omitted since the required information is included in the Consolidated Financial Statements or the notes thereto, or is not applicable or required.
The documents set forth below in the Index of Exhibits, numbered in accordance with Item 601 of Regulation S-K, are filed herewith or incorporated herein by reference to the location indicated.
Pursuant to the requirements of Section 13 or 15(d) of the Securities Exchange Act of 1934, the registrant has duly caused this report to be signed on its behalf by the undersigned, thereunto duly authorized on February 26, 2015.2016.
| INTERVAL LEISURE GROUP, INC. | |||
By: | /s/ CRAIG M. NASH Craig M. Nash Chairman, Chief Executive Officer and President | ||
Pursuant to the requirements of the Securities Act of 1933, as amended, this report has been signed below by the following persons on behalf of the registrant and in the capacities and on the dates indicated.
Signature | Title | Date | ||
|---|---|---|---|---|
| /s/ CRAIG M. NASH Craig M. Nash | Chairman, President and Chief Executive Officer (Principal Executive Officer) | February 26, | ||
/s/ WILLIAM L. HARVEY William L. Harvey | Executive Vice President and Chief Financial Officer (Principal Financial Officer) | February 26, | ||
/s/ JOHN A. GALEA John A. Galea | Senior Vice President and Chief Accounting Officer (Principal Accounting Officer) | February 26, | ||
/s/ DAVID FLOWERS David Flowers | Director | February 26, | ||
/s/ VICTORIA L. FREED Victoria L. Freed | Director | February 26, | ||
/s/ CHAD HOLLINGSWORTH Chad Hollingsworth | Director | February 26, 2016 | ||
/s/ GARY S. HOWARD Gary S. Howard | Director | |||
February 26, |
Signature | Title | Date | ||
|---|---|---|---|---|
| /s/ LEWIS J. KORMAN Lewis J. Korman | Director | February 26, 2016 | ||
/s/ THOMAS J. KUHN Thomas J. Kuhn | Director | February 26, | ||
/s/ JEANETTE E. MARBERT Jeanette E. Marbert | Executive Vice President, Chief Operating Officer and Director | February 26, 2016 | ||
/s/ THOMAS J. MCINERNEY Thomas J. McInerney | Director | February 26, | ||
/s/ THOMAS P. MURPHY, JR. Thomas P. Murphy, Jr. | Director | February 26, | ||
/s/ AVY H. STEIN Avy H. Stein | Director | February 26, | ||
| Exhibit | Description | Incorporated By Reference Location | |||
|---|---|---|---|---|---|
| 2.1 | Business Transfer Deed, dated August 3, 2013, among CLC Resort Management Limited, Gorvines Limited, VRI Europe Limited and the other parties thereto | ILG's Quarterly Report on Form 10-Q filed on November 5, 2013 | |||
| 2.2 | Equity Interest Purchase Agreement, dated May 6, 2014 among Hyatt Corporation, HTS-Aspen, L.L.C., S.O.I. Acquisition Corp. and Interval Leisure Group. | ILG's Quarterly Report on Form 10-Q filed on August 6, 2014 | |||
| 2.3 | Agreement and Plan of Merger, dated as of October 27, 2015, by and among Interval Leisure Group, Inc., Iris Merger Sub, Inc., Starwood Hotels & Resorts Worldwide, Inc. and Vistana Signature Experiences, Inc. | Exhibit 2.1 to the Current Report on Form 8-K filed by Starwood Hotels & Resorts Worldwide, Inc. on November 3, 2015 | |||
| 2.4 | Separation Agreement, dated as of October 27, 2015, by and among Interval Leisure Group, Inc., Starwood Hotels & Resorts Worldwide, Inc. and Vistana Signature Experiences, Inc. | Exhibit 2.2 to the Current Report on Form 8-K filed by Starwood Hotels & Resorts Worldwide, Inc. on November 3, 2015 | |||
| 3.1 | Amended and Restated Certificate of Incorporation of Interval Leisure Group, Inc. | ILG's Current Report on Form 8-K filed on August 25, 2008 | |||
| 3.2 | Fourth Amended and Restated By-laws of Interval Leisure Group, Inc. | ILG's Current Report on Form 8-K filed on December 12, | |||
| 3.3 | Certificate of Designation, Preferences and Rights of Series A Junior Participating Preferred Stock | ILG's Quarterly Report on Form 10-Q filed on August 11, | |||
| 4.1 | Rights Agreement dated as of June 10, 2009, between Interval Leisure Group, Inc. and the Bank of New York Mellon, as Rights Agent, which includes the Form of Certificate of Designation, Preferences and Rights of Series A Junior Participating Preferred Stock as Exhibit A, the Form of Rights Certificate as Exhibit B and the Summary of Rights to Purchase Preferred Stock as Exhibit C | ILG's Current Report on Form 8-K filed on June 11, | |||
| 4.2 | Indenture, dated April 10, 2015, among Interval Acquisition Corp., Interval Leisure Group, Inc., the other Guarantors party thereto and HSBC Bank USA, National Association | ILG's Current Report on Form 8-K filed on April 10, 2015 | |||
| Exhibit | Description | Incorporated By Reference Location | |||
|---|---|---|---|---|---|
| 4.3 | Registration Rights Agreement among Interval Acquisition Corp., Interval Leisure Group, Inc., the other Guarantors party thereto, and Wells Fargo Securities, LLC, dated April 10, 2015 | ILG's Current Report on Form 8-K filed on April 10, 2015 | |||
| 4.4 | Form of 5.625% Senior Note due 2023 | Exhibit A to Exhibit 4.2 hereof | |||
| 10.1 | Tax Sharing Agreement among HSN, Inc., Interval Leisure Group, Inc., Ticketmaster, Tree.com, Inc. and IAC/InterActiveCorp | ILG's Current Report on Form 8-K filed on August 25, | |||
| Employee Matters Agreement among HSN, Inc., Interval Leisure Group, Inc., Ticketmaster, Tree.com, Inc. and IAC/InterActiveCorp | ILG's Current Report on Form 8-K filed on August 25, | ||||
| 10.3 | ILG Spinco Agreement, dated as of October 27, 2015, by and among Interval Leisure Group, Inc., Liberty Interactive Corporation and Liberty USA Holding, LLC | ILG's Quarterly Report on Form 10-Q filed on November 11, 2015 | |||
| 10.4 | |||||
| Employment Agreement between Interval Leisure Group, Inc. and Craig M. Nash, dated as of July 31, 2008† | ILG's Registration Statement on Form S-1 (File No. 333-152699) | ||||
| Employment Agreement between Interval Leisure Group, Inc. and Jeanette E. Marbert, dated as of July 31, 2008† | ILG's Registration Statement on Form S-1 (File No. 333-152699). | ||||
| Severance Agreement between Interval Acquisition Corp. and John A. Galea, dated as of July 31, 2008† | ILG's Registration Statement on Form S-1 (File No. 333-152699) | ||||
| Severance Agreement between Interval Acquisition Corp. and Victoria J. Kincke, dated as of July 31, 2008† | ILG's Registration Statement on Form S-1 (File No. 333-152699) | ||||
| Interval Leisure Group, Inc. 2008 Stock and Annual Incentive Plan, as amended† | ILG's Annual Report on Form 10-K filed on March 31, | ||||
| Amended and Restated Lease Agreement between Guilford Development Group, L.L.C. and Interval International, Inc., dated as | ILG's | ||||
| Deferred Compensation Plan for Non-Employee Directors† | ILG's Registration Statement on Form S-1 (File No. 333-152699) | ||||
| ILG's | |||||
| Exhibit | Description | Incorporated By Reference Location | |||
|---|---|---|---|---|---|
| Employment Agreement between Interval Leisure Group, Inc. and William L. Harvey, dated as of August 25, 2008† | ILG's Current Report on Form 8-K filed on August 25, | ||||
| Form of Amendment to Employment Agreement between the Registrant and each of Craig M. Nash, Jeanette E. Marbert and William L. Harvey† | ILG's Current Report on Form 8-K filed on January 5, | ||||
| Form of Terms and Conditions of Annual Vesting Restricted Stock Units under the Interval Leisure Group, Inc. 2008 Stock and Annual Incentive Plan† | ILG's Quarterly Report on Form 10-Q filed on May 14, | ||||
| Form of Terms and Conditions of Cliff Performance Restricted Stock Units under the Interval Leisure Group, Inc. 2008 Stock and Annual Incentive Plan† | ILG's Quarterly Report on Form 10-Q filed on May 14, | ||||
| Second Amendment to Employment Agreement, dated June 18, 2009 between the Registrant and Craig M. Nash† | ILG's Current Report on Form 8-K filed on June 19, | ||||
| Second Amendment to Employment Agreement, dated June 18, 2009 between the Registrant and Jeanette E. Marbert† | ILG's Current Report on Form 8-K filed on June 19, | ||||
| Second Amendment to Employment Agreement, dated June 18, 2009 between the Registrant and William L. Harvey† | ILG's Current Report on Form 8-K filed on June 19, | ||||
| Form of Terms and Conditions of Performance Restricted Stock Units under the Interval Leisure Group, Inc. 2008 Stock and Annual Incentive Plan.† | ILG's Current Report on Form 8-K filed on March 8, | ||||
| Form of Terms and Conditions of TSR Performance Restricted Stock Units under the Interval Leisure Group, Inc. 2008 Stock and Annual Incentive Plan.† | ILG's Annual Report on Form 10-K filed on March 9, | ||||
| Exhibit | Description | Incorporated By Reference Location | |||
|---|---|---|---|---|---|
| Amended and Restated Credit Agreement among Interval Acquisition Corp, as Borrower, Interval Leisure Group, Inc., Certain Subsidiaries of the Borrower, as Guarantors, The Lenders Party thereto, Wells Fargo Bank, National Association, as Administrative Agent and Collateral Agent; Bank of America, N.A., PNC Bank, National Association, and SunTrust Bank, each as a Syndication Agent; Fifth Third Bank, KeyBank National Association, and Union Bank, N.A., each as a Documentation Agent; and Wells Fargo Securities, LLC, Merrill Lynch, Pierce, Fenner & Smith Incorporated, PNC Capital Markets, LLC and SunTrust Robinson Humphrey, Inc. as Joint Lead Arrangers and Joint Bookrunners, dated as of June 21, 2012 | ILG's Current Report on Form 8-K filed on June 21, | ||||
| Form of Terms and Conditions of Leadership Restricted Stock Units under the Interval Leisure Group, Inc. 2008 Stock and Annual Incentive Plan† | ILG's Quarterly Report on Form 10-Q filed on May 7, | ||||
| Interval Leisure Group, Inc. 2013 Stock and Incentive Compensation Plan† | ILG's Registration Statement on Form S-8 filed on May 21, | ||||
| Form of Terms and Conditions of Director Restricted Stock Units under the Interval Leisure Group, Inc. 2013 Stock and Incentive Compensation Plan† | ILG's Quarterly Report on Form 10-Q filed on August 8, | ||||
| Master License Agreement, dated October 1, 2014 between Hyatt Franchising, L.L.C. and S.O.I. Acquisitions Corp. | ILG's Annual Report on Form 10-K filed on February 27, 2012 | ||||
| Employment Agreement between Interval Leisure Group, Inc. and David Gilbert, effective September 1, 2014† | ILG's Annual Report on Form 10-K filed on March 9, 2012 | ||||
| Employment Agreement between Interval Leisure Group, Inc. and John M. Burlingame, effective October 1, 2014† | ILG's Annual Report on Form 10-K filed on March 9, 2012 | ||||
| Exhibit | Description | Incorporated By Reference Location | |||
|---|---|---|---|---|---|
| 10.28 | First Amendment to Credit Agreement and Incremental Revolving Commitment Agreement, dated as of April 8, 2014, among Interval Acquisition Corp., as Borrower; Interval Leisure Group, Inc. and certain subsidiaries of the Borrower as Guarantors, the lenders who are party to the Amendment, and Wells Fargo Bank, National Association, as Administrative Agent for the lender. | ILG's Current Report on Form 8-K filed on April 8, 2014 | |||
| 10.29 | Second Amendment to Credit Agreement, dated as of November 6, 2014, among Interval Acquisition Corp., as Borrower; Interval Leisure Group, Inc. and certain subsidiaries of the Borrower as Guarantors, the lenders who are party to the Amendment, and Wells Fargo Bank, National Association, as Administrative Agent for the lenders | ILG's Current Report on Form 8-K filed on November 7, 2014 | |||
| 10.30 | Interval Leisure Group, Inc. Deferred Compensation Plan, effective October 1, 2014† | ILG's Amendment No. 1 to Annual Report on Form 10-K/A filed on April 7, 2015 | |||
| 10.31 | Interval Leisure Group, Inc. Non-Employee Director Stock Compensation Plan, effective May 20, 2015† | ILG's Quarterly Report on Form 10-Q filed on August 6, 2015 | |||
| 10.32 | Purchase Agreement among Interval Acquisition Corp., Interval Leisure Group, Inc., the other Guarantors party thereto, and Wells Fargo Securities, LLC, dated April 2, 2015 | ILG's Current Report on Form 8-K filed on April 10, 2015 | |||
| 10.33 | Third Amendment to Credit Agreement, dated as of April 10, 2015, among Interval Acquisition Corp., as Borrower; Interval Leisure Group, Inc. and certain subsidiaries of the Borrower as Guarantors, the lenders who are party to the Amendment, and Wells Fargo Bank, National Association, as Administrative Agent for the lenders | ILG's Current Report on Form 8-K filed on April 10, 2015 | |||
| Exhibit | Description | Incorporated By Reference Location | |||
|---|---|---|---|---|---|
| 10.34 | Fourth Amendment to Credit Agreement, dated as of May 5, 2015, among Interval Acquisition Corp., as Borrower; Interval Leisure Group, Inc. and certain subsidiaries of the Borrower as Guarantors, the lenders who are party to the Amendment, and Wells Fargo Bank, National Association, as Administrative Agent for the lenders | ILG's Current Report on Form 8-K filed on May 6, 2015 | |||
| 21.1 | * | Subsidiaries of Interval Leisure Group, Inc. | |||
| 23.1 | * | Consent of Independent Registered Public Accounting Firm | |||
| 31.1 | * | Certification of the Chief Executive Officer pursuant to Rule 13a-14(a) or Rule 15d-14(a) of the Securities Exchange Act of 1934 as adopted pursuant to Section 302 of the Sarbanes-Oxley Act. | |||
| 31.2 | * | Certification of the Chief Financial Officer pursuant to Rule 13a-14(a) or Rule 15d-14(a) of the Securities Exchange Act of 1934 as adopted pursuant to Section 302 of the Sarbanes-Oxley Act. | |||
| 31.3 | * | Certification of the Chief Accounting Officer pursuant to Rule 13a-14(a) or Rule 15d-14(a) of the Securities Exchange Act of 1934 as adopted pursuant to Section 302 of the Sarbanes-Oxley Act. | |||
| 32.1 | ** | Certification of the Chief Executive Officer pursuant to 18 U.S.C. Section 1350 as adopted pursuant to Section 906 of the Sarbanes-Oxley Act. | |||
| 32.2 | ** | Certification of the Chief Financial Officer pursuant to 18 U.S.C. Section 1350 as adopted pursuant to Section 906 of the Sarbanes-Oxley Act. | |||
| 32.3 | ** | Certification of the Chief Accounting Officer pursuant to 18 U.S.C. Section 1350 as adopted pursuant to Section 906 of the Sarbanes-Oxley Act. | |||
| 101.INS | * | XBRL Instance Document | |||
| 101.SCH | * | XBRL Taxonomy Extension Schema Document | |||
| 101.CAL | * | XBRL Taxonomy Calculation Linkbase Document | |||
| Exhibit | Description | Incorporated By Reference Location | |||
|---|---|---|---|---|---|
| 101.LAB | * | XBRL Taxonomy Label Linkbase Document | |||
| 101.PRE | * | XBRL Taxonomy Presentation Linkbase Document | |||
| 101.DEF | * | XBRL Taxonomy Extension Definition Linkbase Document | |||
INTERVAL LEISURE GROUP, INC. AND SUBSIDIARIES
VALUATION AND QUALIFYING ACCOUNTS
Description | Balance at Beginning of Period | Charges (Credits) to Earnings | Charges (Credits) to Other Accounts | Deductions(1) | Balance at End of Period | Balance at Beginning of Period | Charges (Credits) to Earnings | Charges (Credits) to Other Accounts | Deductions(1) | Balance at End of Period | ||||||||||||||||||||||
|---|---|---|---|---|---|---|---|---|---|---|---|---|---|---|---|---|---|---|---|---|---|---|---|---|---|---|---|---|---|---|---|---|
| | (In thousands) | (In thousands) | ||||||||||||||||||||||||||||||
2015 | ||||||||||||||||||||||||||||||||
Allowance for doubtful accounts on trade receivables | $ | 193 | $ | (235 | ) | $ | 205 | $ | — | $ | 163 | |||||||||||||||||||||
Allowance for loan losses on mortgages receivable | $ | 347 | $ | 1,898 | $ | (122 | ) | $ | (188 | ) | $ | 1,935 | ||||||||||||||||||||
Deferred tax valuation allowance | $ | 234 | $ | 13 | $ | — | $ | — | $ | 247 | ||||||||||||||||||||||
2014 | ||||||||||||||||||||||||||||||||
Allowance for doubtful accounts on trade receivables | $ | 290 | $ | 234 | $ | (297 | ) | $ | (34 | ) | $ | 193 | $ | 290 | $ | 234 | $ | (297 | ) | $ | (34 | ) | $ | 193 | ||||||||
Allowance for loan losses on mortgages receivable | $ | — | $ | 347 | $ | — | $ | — | $ | 347 | $ | — | $ | 347 | $ | — | $ | — | $ | 347 | ||||||||||||
Deferred tax valuation allowance | $ | 666 | $ | (47 | ) | $ | (385 | ) | $ | — | $ | 234 | $ | 666 | $ | (47 | ) | $ | (385 | ) | $ | — | $ | 234 | ||||||||
2013 | ||||||||||||||||||||||||||||||||
Allowance for doubtful accounts on trade receivables | $ | 409 | $ | 63 | $ | (182 | ) | $ | — | $ | 290 | $ | 409 | $ | 63 | $ | (182 | ) | $ | — | $ | 290 | ||||||||||
Allowance for loan losses on mortgages receivable | N/A | N/A | N/A | N/A | N/A | N/A | N/A | N/A | N/A | N/A | ||||||||||||||||||||||
Deferred tax valuation allowance | $ | 681 | $ | 2 | $ | (17 | ) | — | $ | 666 | $ | 681 | $ | 2 | $ | (17 | ) | — | $ | 666 | ||||||||||||
2012 | ||||||||||||||||||||||||||||||||
Allowance for doubtful accounts on trade receivables | $ | 302 | $ | 153 | $ | (46 | ) | $ | — | $ | 409 | |||||||||||||||||||||
Allowance for loan losses on mortgages receivable | N/A | N/A | N/A | N/A | N/A | |||||||||||||||||||||||||||
Deferred tax valuation allowance | $ | 682 | — | $ | (1 | ) | — | $ | 681 | |||||||||||||||||||||||