they can select from among our modular functionalities, such as order routing, trade reporting or clearing on specific products or exchanges where they may not have up-to-date technology to offer their customers a comprehensive, global range of services and products. The emerging complexity of multiple trading venuesmarket centers provided us with the opportunity of building and continuously adapting our order routing software to secure excellent execution prices. This has becomeprices for our major focus.customers.
- •
- As a market maker, we provide continuous bid and offer quotations on
over one millionsecurities and futures products listed on some electronic exchanges around the world. Our quotes are driven by proprietary mathematical models that assimilate market data and reevaluate our outstanding quoteseachmany times per second.Unlike firms that trade over-the-counter ("OTC") derivative products, our business creates liquidity and transparency on electronic exchanges.In the past several years our market making business has suffered from competitive pressures and, along with the rapid increaseofin our electronic brokerage business,its significance has diminished.we decided to discontinue our market making activities globally. On March 8, 2017 we announced our intention to discontinue our options market making activities globally and we are currently in the process of winding down these operations. Additionally, as we previously announced, we entered into a definitive transaction to transfer our U.S. options market making operations to Two Sigma Securities, LLC. This transaction closed on September 29, 2017. We intend to continue conducting certain proprietary trading activities in stocks and related instruments to facilitate our electronic brokerage customers' trading in products such as ETFs, ADRs, CFDs and other financial instruments.
Our electronic brokerage and market making businesses are complementary. Both benefitbusiness benefits from our combined scale and volume, as well as from our proprietary technology. Our brokerage customers benefit from the technology, and market structure expertise developed in our market making business. The expenseover the last 40 years. Our focus on the development and maintenance of developing and maintaining our unique technology for trading, risk management, clearing, settlement, banking and regulatory structure required by any specific exchange or market center is shared by both of our businesses. These economies, in turn, enablecompliance enables us to provide lower transaction costs to our customers than our competitors. In addition, we believe we gain a competitive advantage by applying the software features we have developed for a specific product or market to newly-introduced products and markets over others who may have less automated facilities in one or both of our businesses or who operate only in a subset of the exchanges and market centers on which we operate. Our tradingbrokerage system contains unique architectural aspects that together with our massive trading volume in markets worldwide, may impose a significant barrier to entry for firms wishing to compete in our specific businessesthis business and permit us to compete favorably against our competitors. In addition, many of our regulatory and compliance functions have been built into our integrated order routing and custodial systems.
Our internet address is www.interactivebrokers.com and the investor relations section of our web sitewebsite is located at www.interactivebrokers.com/ir. We make available free of charge, on or through the investor relations section of our web site,website, this Annual Report on Form 10-K, Quarterly Reports on Form 10-Q, related Interactive Data exhibits, Current Reports on Form 8-K and amendments to those reports filed or furnished pursuant to Section 13(a) or 15(d) of the Securities Exchange Act of 1934, as well as proxy statements, registration statements, prospectus supplements, and Section 16 filings for our directors and officers, as soon as reasonably practicable after we electronically file such material with, or furnish it to, the U.S. Securities and Exchange Commission ("SEC"). Also posted on our web sitewebsite are our Bylaws, our Amended and Restated Certificate of Incorporation, charters for the Audit Committee, Compensation Committee and Nominating and Corporate Governance Committee of our board of directors, our Accounting Matters Complaint Policy, our Whistle Blower Hotline, our Corporate Governance Guidelines and our Code of Business Conduct and Ethics governing our directors, officers and employees. Within the time periods required by SEC and the NASDAQ Stock Market ("NASDAQ"), we will post on our web sitewebsite any amendment to the Code of Business Conduct and Ethics and any waiver applicable to any executive officer, director or senior financial officer. In addition, our web sitewebsite includes information concerning purchases and sales of our equity securities by our executive officers and directors, as well as disclosure relating to certain non-GAAP financial measures (as defined in Regulation G) promulgated under the Securities Act of 1933, as amended (the "Securities Act") and the Securities Exchange Act of 1934, as amended (the "Exchange Act") that we may make public orally, telephonically, by webcast, by broadcast or by similar means from time to time.
Our Investor Relations Department can be contacted at Interactive Brokers Group, Inc., Eight Greenwich Office Park, Greenwich, Connecticut 06831, Attn: Investor Relations, telephone: 203-618-4070, e-mail: investor- relations@interactivebrokers.com.
Table of Contentsinvestor-relations@interactivebrokers.com.
Our Organizational Structure and Overview of Recapitalization Transactions
The graphic below illustrates our current ownership structure and reflects current ownership percentages. The graphic below does not display the subsidiaries of IBG LLC.
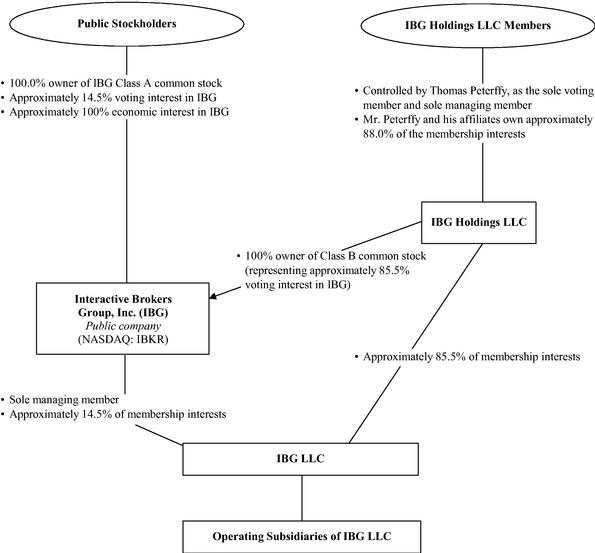
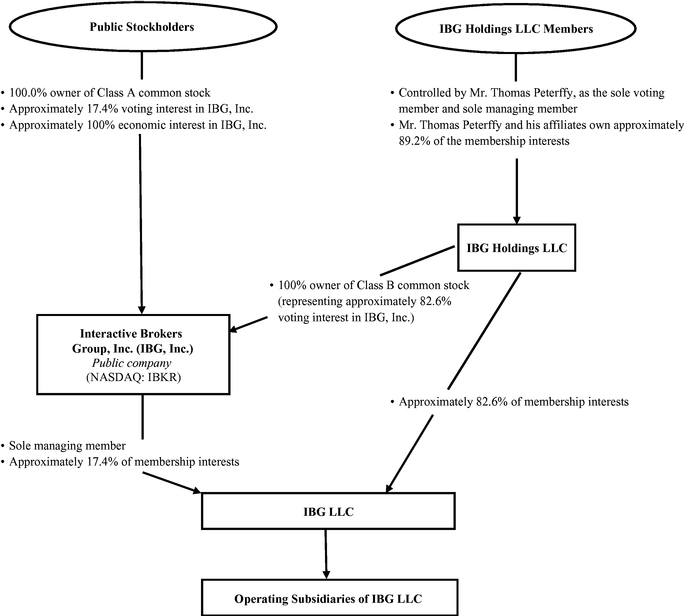
Prior to the IPO, we had historically conducted our business through a limited liability company structure. Our primary assets are our ownership of approximately 14.5%17.4% of the membership interests of IBG LLC, the current holding company for our businesses, and our controlling interest and related contractual rights as the sole managing member of IBG LLC. The remaining approximately 85.5%82.6% of IBG LLC membership interests are held by IBG Holdings LLC ("Holdings"), a holding company that is owned by our founder, Chairman and Chief Executive Officer, Mr. Thomas Peterffy and his affiliates, management and other employees of IBG LLC, and certain other members. The IBG LLC membership interests held by Holdings will be subject to purchase by us over time in connection with
offerings by us of shares of our common stock. The below table shows the amount of IBG LLC membership interests held by IBG, Inc. and Holdings as of December 31, 2014.2017.
| | Public | Holdings | Total | IBG, Inc. | Holdings | Total | ||||||||||||||
|---|---|---|---|---|---|---|---|---|---|---|---|---|---|---|---|---|---|---|---|---|
Ownership % | 14.5 | % | 85.5 | % | 100.0 | % | 17.4 | % | 82.6 | % | 100.0 | % | ||||||||
Membership interests | 58,473,186 | 346,062,282 | 404,535,468 | 71,479,604 | 340,229,444 | 411,709,048 | ||||||||||||||
Purchases of IBG LLC membership interests, held by Holdings, by the Company are governed by the exchange agreement among us, IBG LLC, Holdings and the historical members of IBG LLC, (the "Exchange Agreement"), a copy of which was filed as an exhibit to our Quarterly Report on Form 10-Q for the quarter ended September 30, 2009 and filed with the SEC on November 9, 2009. The Exchange Agreement, as amended June 6, 2012, provides that the Company may facilitate the redemption by Holdings of interests held by its members through the issuance of shares of common stock through a public offering in exchange for the interests in IBG LLC being redeemed by Holdings. The June 6, 2012 amendment (the "Amendment"), which was filed as an exhibit to our Form 8-K filed with the SEC on June 6, 2012, eliminated from the Exchange Agreement an alternative funding method, which provided that upon approval by the board of directors and by agreement of the Company, IBG LLC and Holdings, redemptions could be made in cash.
At the time of the Company's IPO in 2007, three hundred sixty (360) million shares of authorized common stock were reserved for future sales and redemptions. From 2008 through 2010, Holdings redeemed 5,013,259 IBG LLC shares for a total of $114 million, which redemptions were funded using cash on hand at IBG LLC. Upon cash redemption these IBG LLC shares were retired.
In June 2011, with the consent of Holdings and the Company (on its own behalf and acting as the sole managing member of IBG LLC), IBG LLC agreed to redeem certain membership interests from Holdings through the sale of common stock and to distribute the proceeds of such sale to the beneficial owners of such membership interests. On August 4, 2011 the Company filed a "shelf" Registration Statement on Form S-3 (File Number 333-176053) with the SEC for the issuance of additional shares in connection with Holdings requesting redemption of a portion of its member interests in IBG LLC. On August 4, 2011, a Prospectus Supplement was filed by the Company with the SEC to issue 1,983,624 shares of common stock (with a fair value of $29 million) in exchange for an equivalent number of shares of member interests in IBG LLC.
In November 2013, with the consent of Holdings and the Company (on its own behalf and acting as the sole managing member of IBG LLC), IBG LLC agreed to redeem certain membership interests from Holdings through the sale of common stock and to distribute the proceeds of such sale to the beneficial owners of such membership interests. On November 12, 2013 the Company filed a "shelf" Registration StatementStatements on Form S-3 (File Number 333-176053 and 333-192275) with the SEC for the issuance of additional shares in connection with Holdings requesting redemption of a portion of its member interests in IBG LLC. On November 12, 2013, a Prospectus Supplement was filed byUnder these shelf registration statements, the Company with the SEC to issue 4,683,415issued 12,643,495 shares of common stock (with a fair value of $109.7$362 million) to Holdings in exchange for an equivalent number of shares of member interests in IBG LLC.
On October 24, 2014July 28, 2017, the Company filed a Prospectus Supplement"shelf" Registration Statement on Form S-3 (File Number 333-219552) with the SEC to issue 1,358,478for the issuance of additional shares in connection with Holdings requesting redemption of a portion of its member interests in IBG LLC. Under this shelf registration statement, in 2017, the Company issued 1,214,860 shares of common stock (with a fair value of $35.2$49 million) to Holdings in exchange for an equivalent number of shares of member interests in IBG LLC.
Segment Operating Results
| | | Year Ended December 31, | | Year Ended December 31, | ||||||||||||||||||||
|---|---|---|---|---|---|---|---|---|---|---|---|---|---|---|---|---|---|---|---|---|---|---|---|---|
| | | 2014 | 2013 | 2012 | | 2017 | 2016 | 2015 | ||||||||||||||||
| | | (in millions) | | (in millions) | ||||||||||||||||||||
Electronic Brokerage | Net revenues(1) | $ | 952.3 | $ | 818.5 | $ | 672.2 | Net revenues | $ | 1,405 | $ | 1,239 | $ | 1,097 | ||||||||||
| Non-interest expenses(2) | 363.8 | 422.7 | 328.7 | Non-interest expenses(1) | 545 | 483 | 561 | |||||||||||||||||
| | | | | | | | | | | | | | | | | | | | | | ||||
| Income before income taxes | $ | 588.5 | $ | 395.8 | $ | 343.5 | Income before income taxes | $ | 860 | $ | 756 | $ | 536 | |||||||||||
| | | | | | | | | | | | | | | | | | | | | | | |||
| | | | | | | | | | | | | | | | | | | | | | ||||
| Pre-tax profit margin | 62 | % | 48 | % | 51 | % | Pre-tax profit margin | 61 | % | 61 | % | 49 | % | |||||||||||
Market Making | Net revenues(1) | $ | 284.4 | $ | 361.1 | $ | 490.5 | Net revenues | $ | 86 | $ | 190 | $ | 298 | ||||||||||
| Non-interest expenses | 170.3 | 202.6 | 271.0 | Non-interest expenses | 113 | 146 | 168 | |||||||||||||||||
| | | | | | | | | | | | | | | | | | | | | | ||||
| Income before income taxes | $ | 114.1 | $ | 158.5 | $ | 219.5 | Income (loss) before income taxes | $ | (27 | ) | $ | 44 | $ | 130 | ||||||||||
| | | | | | | | | | | | | | | | | | | | | | | |||
| | | | | | | | | | | | | | | | | | | | | | ||||
| Pre-tax profit margin | 40 | % | 44 | % | 45 | % | Pre-tax profit (loss) margin | (31 | )% | 23 | % | 44 | % | |||||||||||
Corporate | Net revenues(1) | $ | (193.4 | ) | $ | (103.4 | ) | $ | (32.2 | ) | Net revenues | $ | 211 | $ | (33 | ) | $ | (206 | ) | |||||
| Non-interest expenses | 3.1 | (0.4 | ) | 3.8 | Non-interest expenses | (5 | ) | 6 | 2 | |||||||||||||||
| | | | | | | | | | | | | | | | | | | | | | ||||
| Loss before income taxes | $ | (196.5 | ) | $ | (103.0 | ) | $ | (36.0 | ) | Income (loss) before income taxes | $ | 216 | $ | (39 | ) | $ | (208 | ) | ||||||
| | | | | | | | | | | | | | | | | | | | | | | |||
| | | | | | | | | | | | | | | | | | | | | | ||||
Total | Net revenues | $ | 1,043.3 | $ | 1,076.2 | $ | 1,130.5 | Net revenues | $ | 1,702 | $ | 1,396 | $ | 1,189 | ||||||||||
| Non-interest expenses | 537.2 | 624.9 | 603.5 | Non-interest expenses | 653 | 635 | 731 | |||||||||||||||||
| | | | | | | | | | | | | | | | | | | | | | ||||
| Income before income taxes | $ | 506.1 | $ | 451.3 | $ | 527.0 | Income before income taxes | $ | 1,049 | $ | 761 | $ | 458 | |||||||||||
| | | | | | | | | | | | | | | | | | | | | | | |||
| | | | | | | | | | | | | | | | | | | | | | ||||
| Pre-tax profit margin | 49 | % | 42 | % | 47 | % | Pre-tax profit margin | 62 | % | 55 | % | 39 | % | |||||||||||
- (1)
Certain reclassifications have been made to previously reported amounts to conform with the current presentationElectronic brokerage non-interest expenses include an unusual loss ofcurrency translation gains and losses related to our currency diversification strategy.$137 million in 2015. See "Management's Discussion and Analysis of Financial Condition and Results ofOperations—Presentation of Foreign Currency Effects"Operations" in Part II Item 7 of this Annual Report on Form 10-K.- (2)
Electronic brokerage non-interest expenses in 2013 included an unusual loss of $64 million. See "Management's Discussion and Analysis of Financial Condition and Results of Operations—Financial Overview" in Part II Item 7 of this Annual Report on Form 10-K.(3)- The
Corporatecorporate segment includes corporate related activities, inter-segment eliminations and net gains and losses onforeign currency contractspositions held as part of our overall currency diversification strategy. Corporate net revenues include a $93 million gain from the remeasurement of our Tax Receivable Agreement liability as a result of the enactment of the Tax Cuts and Jobs Act. See "Management's Discussion and Analysis of Financial Condition and Results of Operations" in Part II Item 7 and Note 4 and to the audited consolidated financial statements in Part II, Item 8 of this Annual Report on Form 10-K.
Financial information concerning our business segments for each of 2014, 20132017, 2016, and 20122015 is set forth in "Management's Discussion and Analysis of Financial Condition and Results of Operations," and the audited consolidated financial statements and the notes thereto, which are in Part II, Items 7 and 8 of this Annual Report on Form 10-K.
Electronic Brokerage—Interactive Brokers
Electronic brokerage represented 77%94% of 2014 net revenues and 84%103% of 2014 income before income taxes from electronic brokerage and market making combined.combined during 2017. We conduct our electronic brokerage business through our Interactive Brokers ("IB") subsidiaries. As an electronic broker, we execute, clear and settle trades globally for both institutional and individual customers. Capitalizing on theour proprietary technology originally developed for our market making business, IB'sour systems provide our customers with the capability to monitor multiple markets around the world simultaneously and to
execute trades electronically in these markets at a low cost in multiple products and currencies from a single trading account.
Since launching this business in 1993, we have grown to approximately 281,000483 thousand institutional and individual brokerage customers. We provide our customers with what we believe to be one of the most
effective and efficient electronic brokerage platforms in the industry. The following are key highlights of our electronic brokerage business:
- •
- Low Costs—We provide our customers with among the industry's lowest overall transaction costs in two ways. First, we offer among the lowest execution, commission and financing costs in the industry. Second, our customers benefit from our advanced routing of orders designed to achieve the best available trade price. In order to illustrate this advantage,
in 2014weexpanded our publishedpublish monthly brokerage metricsto includeincluding our customers' average net trade cost for Reg.-NMS stocks. In2014,2017, customers' total all-in cost of executing and clearing U.S. Reg.-NMS stocks through IB, including brokerage commissions, regulatory and exchange fees and market impact, was11.3 basispointpoints of trade money, as measured against a dailyVWAPvolume-weighted average price ("VWAP") benchmark. - •
- Automated Risk Controls—Throughout the trading day, we calculate margin requirements for each of our customers on a real-time basis across all product classes (stocks, options, futures, bonds, forex and mutual funds) and across all currencies. Our customers are alerted to approaching margin violations and if a customer's equity falls below what is required to support that customer's margin, we attempt to automatically liquidate positions on a real-time basis to bring the customer's account into margin compliance. This is done to protect IB, as well as the customer, from excessive losses.
- •
- IB Universal AccountSM—From a single point of entry in one IB Universal AccountSM our customers are able to
trade products denominatedtransact in2123 currencies, across multiple classes of tradable, primarily exchange-listed products, including stocks, options, futures, bonds, forex and mutual funds traded on more than100120 exchanges and market centersandin2426 countries around the world seamlessly. - •
- IB SmartRoutingSM—Our customers benefit from our advanced order routing technology. IB SmartRoutingSM retains control of the customer's order, continuously searches for the best available price and, unlike most other routers, dynamically routes and re-routes all or parts of a customer's order to achieve optimal execution and among the lowest execution and commission costs in the industry. To highlight the quality of our price executions, we publish on our website independent measurements performed by a third party provider of transaction analysis to illustrate IB's net price improvement versus the industry.
In 2014, weWe alsolaunchedoffer Transaction Cost Analysis reporting to allow customers to track execution performance by criteria including trade date, trade price, underlying security and exchange. - •
- Flexible and Customizable System—Our platform is designed to provide an efficient customer experience, beginning with a highly automated account opening process and ending with a fast trade execution, with real-time position monitoring. Our sophisticated interface provides interactive real-time views of account balances, positions, profits or losses, buying power and "what-if" scenarios to enable our customers to more easily make informed investment decisions and trade efficiently. Our system is configured to remember the user's preferences and is specifically designed for multi-screen systems. When away from their main workstations, customers are able to access their accounts through our IB WebTraderSM or MobileTraderSM interfaces.
- •
- Interactive AnalyticsSM and IB
OptionsOption AnalyticsSM—We offer our customers state-of-the-art tools, which include a customizable trading platform, advanced analytic tools and over 60 sophisticated order types and algorithms.IBWe alsoprovidesprovide a real-time option analytics window which displays
values that reflect the rate of change of an option's price with respect to a unit change in each of a number of risk dimensions.
- •
- Probability
LabSMLab® (Patent Pending)—The Probability Lab providesclientscustomers with an intuitive, visual method to analyze market participants' future stock price forecasts based on current option prices. This tool compares aclient'scustomer's stock price forecast versus that of the market, and scans the entire option universe for the highest Sharpe ratio multi-leg option strategies that take advantage of theclient'scustomer's forecast. - •
- IB Risk NavigatorSM—We offer free to all customers our real-time market risk management platform that unifies exposure across multiple asset classes around the globe. The system is capable of identifying overexposure to risk by starting at the portfolio level and drilling down into successively greater detail within multiple report views. Report data is updated every ten seconds or upon changes to portfolio composition. Predefined reports allow the summarization of a portfolio from different risk perspectives, and allow views of Exposure, Value at Risk ("VaR"), Delta, Gamma, Vega and Theta, profit and loss and position quantity measures for the different portfolio views. The system also offers the customer the ability to modify positions through "what-if" scenarios that show hypothetical changes to the risk summary.
- •
- White Branding—Our large financial advisor and broker-dealer customers may "white brand" our trading interface, account management and reports with their firm's identity. Broker-dealer
clientscustomers can also select from among our modular functionalities, such as order routing, trade reporting or clearing, on specific products or exchanges where they may not have up-to-date technology, in order to offer to their customers a complete global range of services and products. - •
- Securities Financing Services—We offer a suite of automated Stock Borrow and Lending tools, including
IB'sour depth of availability, transparent rates, global reach and dedicated service representatives.IB'sOur Stock Yield Enhancement Program allows our customers to lend theirfully- paidfully-paid stock shares toIBus in exchange for cash collateral. In turn,IB lendswe lend these stocks in exchange for collateral andearnsearn stock lending fees.Customers receiveWe pay our customers a rebate on the cash collateral generally equal to 50% of thefees collectedincome we earn from lendingtheir stocks.the shares. This allows customers holding fully-paid long stock positions to enhance their returns. - •
- Investors' Marketplace—The Investors' Marketplace is an expansion of our Money Manager Marketplace and our Hedge Fund Capital Introduction program. This program is the first electronic meeting place that brings together individual investors, financial advisors, money managers, fund managers, research analysts, technology providers, business developers and administrators, allowing them to interact to form connections and conduct business.
- •
- Trade
DeskDesk——IB offersWe offer broker-assisted trading through our block trade desk, which is ideal when customers are away from their computer, or if they just want another set of eyes watching their orders and updating them on market changes. - •
- Model Portfolios—Model Portfolios offer advisors an efficient and time-saving approach to investing customer assets. They allow advisors to create groupings of financial instruments based on specific investment themes, and then invest customer funds into these models.
- •
- Portfolio Builder—Portfolio Builder allows our customers to set up an investment strategy based on research and rankings from top buy-side providers and fundamental data; use filters to define the universe of equities that will comprise their strategy and back-test their strategy using up to three years of historical performance; work in hypothetical mode to adjust the strategy until the historical performance meets their standards; and with the click of a button let the system create the orders to invest in a strategy and track its performance in their portfolio.
- •
- Greenwich Compliance—Greenwich Advisor Compliance Services ("Greenwich Compliance") offers direct expert registration and start-up compliance services, as well as answers to basic day-to-day compliance questions for experienced investors and traders looking to start their own investment advisor firms. Greenwich Compliance professionals have regulatory and industry experience, and can help investment advisors trading on the IB platform meet their registration and compliance needs.
- •
- IB Asset Management—IB Asset Management (formerly known as Covestor) recruits registered financial advisors, vets them, analyzes their investment track records, and groups them by their risk profile. Retail investors who are interested in having their individual accounts robo-traded are grouped by their risk and return preferences. Retail investors can assign their accounts to be traded by one or more advisors. IB Asset Management also offers to IB customers Smart Beta Portfolios which combine the benefits of actively managed fund stock selection techniques with passive ETF low cost automation to provide broad market exposure and potentially higher returns.
- •
- Interactive Brokers Debit Mastercard®—Interactive Brokers Debit Mastercard® allows customers to spend and borrow directly against their account at lower rates than credit cards, personal loans and home equity lines of credit, with no monthly minimum payments and no late fees. Customers can use their card to make purchases and ATM withdrawals anywhere Debit Mastercard® is accepted around the world.
- •
- Insured Bank Deposit Sweep Program—Our Insured Bank Deposit Sweep Program provides eligible IB customers with up to $2,500,000 of Federal Deposit Insurance Corporation ("FDIC") insurance on their eligible cash balances in addition to the existing $250,000 Securities Investor Protection Corporation ("SIPC") coverage for total coverage of $2,750,000. Customers continue earning the same competitive interest rates currently applied to cash held in IB accounts. IB sweeps each participating customer's eligible credit balances daily to one or more banks, up to $246,500 per bank, allowing for the accrual of interest and keeping within the FDIC protected threshold. Cash balances above $2,750,000 remain subject to safeguarding under the SEC's Customer Protection Rule 15c3-3.
IB isWe are able to provide itsour customers with high-speed trade execution at low commission rates, in large part because it utilizes the backbone technology developed for Timber Hill's market making operations.of our proprietary technology. As a result of our advanced electronic brokerage platform, IB attractswe attract sophisticated and active investors. No single customer represented more than 1%1.5% of our commissions and execution fees in 2014.2017.
Market Making—Timber Hill
Market making represented 23%6% of 2014 net revenues from electronic brokerage and market making combined.combined during 2017. We conduct our market making business primarily through our Timber Hill ("TH") subsidiaries. On March 8, 2017 we announced our intention to discontinue our options market making activities globally, and we are currently in the process of winding down these operations. Additionally, as previously announced, we entered into a definitive transaction to transfer our U.S. options market making operations to Two Sigma Securities, LLC. This transaction closed on September 29, 2017. We intend to continue conducting certain proprietary trading activities in stocks and related instruments to facilitate our electronic brokerage customers' trading in products such as ETFs, ADRs, CFDs and other financial instruments. However, we do not expect this activity to be of sufficient size as to require reporting these activities as a separate operating segment after we discontinue our options market making activities.
As one of the largesta market makers on many of the world's leading electronic exchanges,
maker, we provide liquidity by offering competitively tight bid/offer spreads over a broad base of over one million tradable, exchange-listed products, including equity derivative products, equity index derivative products, equity securities and futures. As principal, we commit our own capital and derive revenues or
incur losses from the difference between the price paid when securities are bought and the price received when those securities are sold. Historically, our profits have been principally a function of transaction volume and price volatility of electronic exchange- tradedexchange-traded products rather than the direction of price movements. Other factors, including the ratio of actual to implied volatility and shifts in foreign currency exchange rates, can also have a meaningful impact on our results, as described further in "Business Environment" in Part II, Item 7 of this Annual Report on Form 10-K.
Our strategy is to calculate quotes at which supply and demand for a particular security are likely to be in balance a few seconds ahead of the market and execute small trades at tiny but favorable differentials. Because we provide continuous bid and offer quotations and we are continuously both buying and selling quoted securities, we may have either a long or a short position in a particular product at a given point in time. As a matter of practice, we will generally not take portfolio positions in either the broad market or the financial instruments of specific issuers in anticipation that prices will either rise or fall. Our entire portfolio is evaluated eachmany times per second and continuously rebalanced throughout the trading day, thus minimizing the risk of our portfolio at all times. This real-time rebalancing of our portfolio, together with our real-time proprietary risk management system, enables us to curtail risk and to be profitable in both up-market and down-market scenarios.trade efficiently. Our quotes are based on our proprietary model rather than customer order flow, andflow.
As of December 31, 2017, we believe that this approach provides us with a competitive advantage.
We are a market leader in exchange-traded equity options and equity-index options and futures. Together with our electronic brokerage customers, in 2014 we accounted for approximately 8.5% of exchange-listed equity options traded worldwide accordingcontinue to data received from exchanges worldwide. Our ability to make markets in such a large number of exchanges and market centers simultaneously around the world is one of our core strengths and has contributed to the large volumes in our market making business. We engage inconduct market making operations in North and South America, Europe and in the Asia/Pacific regions as described below.
North and South American Market Making Activities. Our U.S. market making activities are conducted through Timber Hill LLC ("TH LLC"), a SEC-registered securities broker-dealer that conducts market making in equity derivative products, equity index derivative products and equity securities. Since its inception in 1982, TH LLC has grown to become one of the largest listed options market makers in the United States. As of December 31, 2014, TH LLC held specialist, primary market maker or lead market maker designations in options on approximately 1,080 underlying securities listed in the United States. TH LLC is a member of the Boston Options Exchange, BATS exchange, Chicago Board Options Exchange, Chicago Mercantile Exchange, Chicago Board of Trade, International Securities Exchange, NYSE AMEX Options Exchange, NYSE Arca, OneChicago, NASDAQ OMX's PHLX and NOM option markets and the New York Mercantile Exchange. TH LLC also conducts market making activities in Mexico at the MEXDER and the Mexican Stock Exchange and in Brazil at BM&F BOVESPA S.A. We conduct market making activities in Canada through our Canadian subsidiary, Timber Hill Canada Company ("THC") at the Toronto Stock Exchange and Canadian Derivatives Exchange Bourse de Montreal Exchange. In addition, we participate in stock trading at various notable Electronic Communications Networks ("ECNs") in both the U.S. and Canada.
European, Asian, and Australian Market Making Activities. Our European, Asian, and Australian market making subsidiaries, primarily Timber Hill Europe AG ("THE"), conduct operations in 22 countries, comprising the major securities markets in these regions.
We began our market making operations in Europe in 1990. In Germany and Switzerland, we have been among the largest equity options market makers in terms of volume on Eurex, one of the world's
largest futures and options exchanges, which is jointly operated by Deutsche Börse AG and SIX Swiss Exchange. We have also been active in trading German stocks and warrants as a member of XETRA, the German electronic stock trading system, and the Frankfurt and Stuttgart stock exchanges; and in Switzerland as a member of the SIX Swiss Exchange. Our other European operations are conducted on the London Stock Exchange; the Weiner Börse AG; the Copenhagen Stock Exchange; the Helsinki Stock Exchange; the NYSE Euronext exchanges in Amsterdam, Paris, Brussels and London; NASDAQ OMX Nordic exchanges in Sweden, Finland and Denmark; the MEFF and Bolsa de Valores Madrid in Spain; the IDEM and Borsa Valori de Milano in Milan; and the ÖTOB in Vienna.
Since 1995, we have conducted market making operations in Hong Kong. Our Hong Kong subsidiary, Timber Hill Securities Hong Kong Ltd ("THSHK"), is a member of the cash and derivatives markets of the Hong Kong Exchanges. Since 1997, we have conducted operations in Australia. Our Australian subsidiary, Timber Hill Australia Pty Ltd ("THA"), is a member of the Australian Stock Exchange, and routes orders for its trading on ASX 24 through its affiliate, Interactive Brokers LLC. We commenced trading in Japan during 2002, Korea and Singapore during 2004 and Taiwan in 2007. In 2008, we began our market making operationInc.; in India through our subsidiary, Interactive Brokers (India) Private Limited ("IBI"), which is a member of the National Stock Exchange of India Ltd. and the Bombay Stock Exchange; and in Hong Kong through our subsidiary, Interactive Brokers Hong Kong Limited, a member of the cash and derivatives markets of the Hong Kong Exchange. All other options market making operations we previously conducted were discontinued during 2017. We expect to continue assessing whether and when to discontinue the remaining operations.
Most of the above trading activities take place on exchanges, and all securities and commodities that we trade are cleared by exchange owned or authorized clearing houses. Recently, the emergence of High Frequency Traders and others who compete with us but do not regularly provide liquidity have put our market making operations under pressure and its relative significance has diminished
Technology
Our proprietary technology is the key to our success. We built our business on the belief that a fully computerized market making system that could integrate pricing and risk exposure information quickly and continuously would enable us to make markets profitably in many different financial instruments simultaneously. We believe that integrating our system with electronic exchanges and market centers results in transparency, liquidity and efficiencies of scale. Together with the IB SmartRoutingSM system and our low commissions, these features reducethis approach reduces overall transaction costs to our customers and, in turn, increases our transaction volume and profits. Over the past 3740 years, we have developed an integrated trading system and communications network and have positioned our company as an efficient conduit for the global flow of risk capital across asset and product classes on electronic exchanges around the world, permitting us to have one of the lowest cost structures in the industry. We believe that developing, maintaining and continuing to enhance our proprietary technology provides us and our customers with the competitive advantage of being able to adapt quickly to the changing environment of our industry and to take advantage of opportunities presented by new exchanges, products or regulatory changes before our competitors.
The quotes that we provide as market makers are driven by proprietary mathematical models that assimilate market data and re-evaluate our outstanding quotes each second. Because our technology infrastructure enables us to process large volumes of pricing and risk exposure information rapidly, we are able to make markets profitably in securities with relatively low spreads between bid and offer prices. As market makers, we must ensure that our interfaces connect effectively and efficiently with each exchange and market center where we make markets and that they are in complete conformity with all the applicable rules of each local venue. Utilizing up-to-date computer and telecommunications systems, we transmit continually updated pricing information directly to exchange computer devices and receive trade and quote information for immediate processing by our systems. As a result, we are able to maintain more effective control over our exposure to price and volatility movements on a real-time basis than many of our competitors. This control is important, not only because our system must process, clear and settle several hundred thousand market maker trades per day with a minimal number
of errors, but also because the system monitors and manages the risk on the entire portfolio, which generally consists of more than ten million open contracts distributed among many hundred thousand different products. Using our system, which we believe affords an optimal interplay of decentralized trading activity and centralized risk management, we quote markets in over one million securities and futures products traded around the world.
In our electronic brokerage business, ourOur proprietary technology infrastructure enables us to provide our customers with the ability to execute trades at among the lowest commission costs in the industry. Additionally, our customers benefit from real-time systems optimization for our market making business. Customer trades are both automatically captured and reported in real time in our system. Our customers trade on more than 100120 exchanges and market centers in 2426 countries around the world. All of theseThese exchanges and market centers are all partially or fully electronic, meaning that a customer can buy or sell a product traded on that exchange via an electronic link from his or her computer terminal through our system to the exchange. We offer our products and services through a global communications network that is designed to provide secure, reliable and timely access to the most current market information. We provide our customers with a variety of means to connect to our brokerage systems, including dedicated point-to-point data lines, virtual private networks and the Internet.
Specifically, our customers receive worldwide electronic access connectivity through our Trader Workstation (our real-time Java-based trading platform), our proprietary Application Programming Interface ("API"), and/or industry standard Financial Information Exchange ("FIX") connectivity. Customers who want a professional quality trading application with a sophisticated user interface utilize our Trader Workstation, which can be accessed through a desktop or variety of mobile devices. Customers interested in developing program trading applications in MS-Excel, Java, Visual Basic or C++ utilize our API. Large institutions with FIX infrastructure prefer to use our FIX solution for seamless integration of their existing order gathering and reporting applications.
While many brokerages, including some online brokerages, rely on manual procedures to execute many day-to-day functions, IB employswe employ proprietary technology to automate, or otherwise facilitate, many of the following functions:
- •
- account opening process;
- •
- order routing and best execution;
- •
- seamless trading across all types of securities and currencies around the world from one account;
- •
- order types and analytical tools offered to customers;
- •
- delivery of customer information, such as confirmations, customizable real-time account statements and audit trails;
- •
- customer service; and
- •
- risk management through automated real-time credit management of all new orders and margin monitoring.
Research and Development
One of our core strengths is our expertise in the rapid development and deployment of automated technology for the financial markets. Our core software technology is developed internally, and we do not generally rely on outside vendors for software development or maintenance. To achieve optimal performance from our systems, we are continuously rewriting and upgrading our software. Use of the best available technology not only improves our performance but also helps us attract and retain talented developers. Our software development costs are low because the employees who oversee the
development of the software are often the same employees who design the application, and evaluate its performance. This alsoperformance, and participate along with our quality assurance professionals in our robust quality assurance testing procedures. The involvement of our developers in each of these processes enables us to add features and further refine our software rapidly.
Our internally-developed, fully integrated trading and risk management systems are unique and transact across all product classes on more than 100 markets120 electronic exchanges and market centers and in 2123 currencies around the world. These systems have the flexibility to assimilate new exchanges and new product classes without compromising transaction speed or fault tolerance. Fault tolerance, or the ability to maintain system performance despite exchange malfunctions or hardware failures, is crucial to successful market making and ensuring best executions for brokerageour customers. Our systems are designed to detect exchange malfunctions and quickly take corrective actions by re-routing pending orders.
Our company is technology-focused, and our management team is hands-on and technology-savvy. Most members of the management team write detailed program specifications for new applications. The development queue is prioritized and highly disciplined. Progress on programming initiatives is generally tracked on a weeklybi-weekly basis by a steering committee consisting of senior executives. This enables us to prioritize key initiatives and achieve rapid results. All new business starts as a software development project. We generally do not engage in any business that we cannot automate and incorporate into our platform prior to entering into the business.
The rapid software development and deployment cycle is achieved by our ability to leverage a highly integrated, object orientedobject-oriented development environment. The software code is modular, with each object providing a specific function and being reusable in multiple applications. New software releases are tracked and tested with proprietary automated testing tools. We are not hindered by disparate and often limiting legacy systems assembled through acquisitions. Virtually all of our software has been developed and maintained with a unified purpose.
For over 3640 years, we have built and continuously refined our automated and integrated, real-time systems for world-wide trading, risk management, clearing and cash management, among others. We have also assembled a proprietary connectivity network between us and exchanges around the world. Efficiency and speed in performing prescribed functions are always crucial requirements for our systems. As a result, our trading systems are able to assimilate market data, recalculate and distribute streaming quotes for tradable products in all product classes eachmany times per second.
Risk Management Activities
The core of our risk management philosophy is the utilization of our fully integrated computer systems to perform critical, risk-management activities on a real-time basis. In our market making business, our real-time integrated risk management system seeks to ensure that our overall IBG positions are continuously hedged at all times, curtailing risk. In our electronic brokerage business, integrated risk management seeks to ensure that each customer's positions are continuously credit checked and brought into compliance if equity falls short of margin requirements, curtailing bad debt losses.
We actively manage our global currency exposure on a continuous basis by maintaining our equity in a basket of currencies we call the GLOBAL. In 2011, we expanded the composition of the GLOBAL from six to 16 currencies to better reflect the expanding breadth of our businesses around the world. We define the GLOBAL as consisting of fractions of a U.S. dollar, Euro, Japanese yen, British pound, Canadian dollar, Australian dollar, Swiss franc, Hong Kong dollar, Canadian dollar, Indian rupee, Swiss franc, Chinese renminbi, Australian dollar, Mexican peso, Swedish krona, Mexican peso, Danish krone, Norwegian krone, South Korean won, Brazilian real, Indian rupee and Singapore dollar. The CompanyDanish krone. We currently transactstransact business and isare required to manage balances in each of these 1614 currencies. The currencies comprising the GLOBAL and their relative proportions can change over time. For example, in light of our decision to wind down our options market making activities globally, we removed the Singapore dollar (SGD) and realigned the relative weight of the U.S. dollar (USD) versus the other currency components to better reflect our businesses going forward. The new composition went into effect as of the close of business on March 31, 2017. Additional information regarding our currency diversification strategy is set forth in "Quantitative and Qualitative Disclosures Aboutabout Market Risk" in Part II, Item 7A of this Annual Report on Form 10-K.
Electronic Brokerage
IB calculatesWe calculate margin requirements for each of itsour customers on a real-time basis across all product classes (stocks, options, futures, forex, bonds and mutual funds) and across all currencies. Recognizing that IB'sour customers are experienced investors, we expect our customers to manage their positions proactively and we provide tools to facilitate our customers' position management. However, if a customer's equity falls below what is required to support that customer's margin, IBwe will automatically liquidate positions on a real-time basis to bring the customer's account into margin compliance. We do this to protect IB,us, as well as the customer, from excessive losses. These systems further contribute to our low-cost structure. The entire credit management process is completely automated.
As a safeguard, all liquidations are displayed on custom built liquidation monitoring screens that are part of the toolset our technical staff uses to monitor performance of our systems at all times the markets around the world are open. In the event our systems absorb erroneous market data from exchanges, which prompts liquidations, risk specialists on our technical staff have the capability to halt liquidations that meet specific criteria. The liquidation halt function is highly restricted.
Our customer interface includes color coding on the account screen and pop-up warning messages to notify customers that they are approaching their margin limits. This feature allows customers to take action, such as entering margin reducing trades, to avoid having IBus liquidate their positions. These tools and real-time margining allow IB'sour customers to understand their trading risk at any moment of the day and help IBus maintain low commissions.
Market Making
We employ certain hedging and risk management techniques to protect us from a severe market dislocation. Our risk management policies are developed and implemented by our Chairman and our steering committee, which is comprised of senior executives of our various companies. Our strategy is to calculate quotes a few seconds ahead of the market and execute small trades at a tiny but favorable differential as a result. This strategy is made possible by our proprietary pricing model, which evaluates and monitors the risks inherent in our portfolio, assimilates market data and reevaluates the outstanding quotes in our portfolio eachmany times per second. Our model automatically rebalances our positions throughout each trading day to manage risk exposures both on our options and futures positions and the underlying securities, and it will price the increased risk that a position would add to the overall portfolio into the bid and offer prices we post. Under risk management policies implemented and monitored primarily through our computer systems, reports to management, including risk profiles, profit and loss analysis and trading performance, are prepared on a real-time basis as well as daily and periodical bases. Although our market making is completely automated, the trading process and our risk are monitored by a team of individuals who, in real-time, observe various risk parameters of our consolidated positions. Our assets and liabilities are marked-to-market daily for financial reporting purposes and re-valued continuously throughout the trading day for risk management and asset/liability management purposes.
Over the years, we have expanded our market presence and the number of financial instruments in which we make markets. This diversification acts as a passive form of portfolio risk management.
We trade primarily the options on stocks (and individual stocks) whose underlying equity market capitalization is greater than $500 million. Throughout the trading day we produce online, real-time profit and loss, risk evaluation, activity and other management reports. Our software assembles from external sources a balance sheet and income statements for our accounting department and to reconcile to the trading system results.
The adaptability of our portfolio risk management system and our trading methods have allowed us to expand the number of financial instruments traded and the number of markets on which we trade.
Operational Controls
We have automated the full cycle of controls surrounding the market making and brokerageour businesses. Key automated controls include the following:
- •
- Our technical operations
sectionteam continuously monitors our network and the proper functioning of each of our nodes (exchanges and market centers, internet service providers ("ISPs"), leased customer lines and our own data centers) around the world. - •
- Our real-time credit manager software provides
pre-pre and post-execution controls by:- •
- testing every customer order to ensure that the customer's account holds enough equity to support the execution of the order, rejecting the order if equity is insufficient or directing the order to an execution destination without delay if equity is sufficient; and
- •
- continuously updating a customer account's equity and margin requirements and, if the account's equity falls below its minimum margin requirements, automatically issuing liquidating orders in a smart sequence designed to minimize the impact on
accountthe account's equity.
- •
- Our market making system continuously evaluates
over one millionsecurities and futures products in which we provide bid and offer quotes and changesitsour bids and offers in such a way as to maintain an overall hedge and a low-risk profile. The speed of communicating with exchanges and market centers is maximized through continuous software and network engineeringinnovation,maintenance, thereby allowingthe firmus to achieve real-time controls over market exposure. - •
- Our clearing system captures trades in real-time and performs automated reconciliation of trades and positions, corporate action processing, customer account transfer, options exercise, securities lending and inventory management, allowing
the firmus to effectively manage operational risk.
- •
- Our accounting system operates with automated data feeds from clearing and banking systems, allowing
the firmus to produce financial statements for all parts of our business every day by mid-day on the day following trade date. - •
- Software developed to interface with the accounting and market making systems performs daily profit and loss reconciliations, which provide tight financial controls over market making functions.
Transaction Processing
Our transaction processing is automated over the full life cycle of a trade. Our market making software generates and disseminates to exchanges and market centers continuous bid and offer quotes on over one million tradable, exchange-listed products. Our fully automated smart router system searches for the best possible combination of prices available at the time a customer order is placed and immediately seeks to execute that order electronically or send it where the order has the highest possibility of execution at the best price. Our market making software generates and disseminates to exchanges and market centers continuous bid and offer quotes on tradable, exchange-listed products.
At the moment a trade is executed, our systems capture and deliver this information back to the source, either to the market making system orcustomer via the brokerage system toor the customer,market making system, in most cases within a fraction of a second. Simultaneously, the trade record is written into our clearing system, where it flows through a chain of control accounts that allow us to reconcile trades, positions and money until the final settlement occurs. Our integrated software tracks other important activities, such
as dividends, corporate actions, options exercises, securities lending, margining, risk management and funds receipt and disbursement.
IB SmartRoutingSM
IB SmartRoutingSM searches for the best destination price in view of the displayed prices, sizes and accumulated statistical information about the behavior of market centers at the time an order is placed, and IB SmartRoutingSM immediately seeks to execute that order electronically. Unlike other smart routers, IB SmartRoutingSM never relinquishes control of the order, and constantly searches for the best price. It continuously evaluates fast-changing market conditions and dynamically re-routes all or parts of the order seeking to achieve optimal execution. IB SmartRoutingSM represents each leg of a spread order independently and enters each leg at the best possible venue. IB SmartRouting AutorecoverySM re-routes a customer's U.S. options order in the case of an exchange malfunction, with IB undertakingand we undertake the risk of double executions. In addition, IB SmartRoutingSM checks each new order to see if it could be executed against any of its pending orders. As the system gains more users, this feature becomes more important for customers in a world of multiple exchanges, trading venuesmarket centers and penny priced orders because it increases the possibility of best executions for our customers ahead of customers of other brokers. As a result of this feature, our customers have a greater chance of executing limit orders and can do so sooner than those who use other routers.
Clearing and Margining
Our activities in the United StatesU.S. are entirely self-cleared. We are a full clearing member of The OCC (Options(the Options Clearing Corporation), the Chicago Mercantile Exchange Clearing House ("CMECH"), The Depository Trust & Clearing Corporation and ICE Clear U.S.
Due to our large positions in broad based index products, we benefit from the cross-margin system maintained by OCC and CMECH. For example, if we hold a position in an OCC-cleared product and have an offsetting position in a CMECH cleared product, the cross-margin computation takes both positions into account, thereby reducing the overall margin requirement. The reduced margin benefit proves especially useful during times of market stress, such as on days with large price movements when intra-day margin calls may be reduced or eliminated by the cross-margin calculation.
In addition, we are fully or partially self-cleared in Canada, Great Britain,the United Kingdom, Switzerland, France, Germany, Belgium, Austria, the Netherlands, Norway, Sweden, Denmark, Finland, India, Hong Kong, and India.Australia.
Customers
We established our electronic brokerage subsidiary, Interactive Brokers LLC ("IB LLC"), in 1993 to enhance the use of our global network of trading interfaces, exchange and clearinghouse memberships, and regulatory registrations assembled over the prior 1617 years to serve our market making business. We realized that electronic access to market centers worldwide through our network could easily be utilized by the very same floor traders and trading desk professionals who, in the coming years, would be displaced by the conversion of exchanges from open outcry to electronic systems.
We currently service approximately 281,000483 thousand cleared customer accounts. Our customers reside in over 190200 countries and territories around the world.
The Our target IB customer is one that requires the latest in trading technology, worldwide access and expects low overall transaction costs. IB'sOur customers are mainly comprised of "self-service" individuals, former floor traders, trading desk professionals, electronic retail brokers, hedge funds, financial advisors who are comfortable with technology, as well as introducing brokers and banks that require global access, and hedge funds.
Table of Contentsaccess.
Our customers primarily fall into threetwo groups based on services provided: cleared customers and non-cleared customers, the latter also known as trade execution customers and wholesale customers. By offering portfolio margining and other institutional services, we have been able to persuade moremany of our trade execution hedge fund customers to utilize our cleared business solution, which benefits the hedge funds in terms of cost savings. Many primePrime brokers once offeredmay offer increased leverage over Regulation T credit limitations and NYSEthe Financial Industry Regulatory Authority ("FINRA") margin requirements through offshore entities and joint back office arrangements. Following the market turmoil of late 2008 and the resulting tightening of credit, we observed competition in this area diminish. Through portfolio margining, IB iswe are able to offer similar leverage with lower margin requirements that reflect the reduced risk of a hedged portfolio.
- •
- Cleared Customers: We provide trade execution and clearing services to our cleared customers who are generally attracted to our low commissions, low financing rates, high interest paid and best price execution. From small market making groups and individual market makers, our cleared customer base has expanded over the years to include institutional and individual traders and investors, financial advisors and introducing brokers.
- •
- Trade Execution Customers: We offer trade execution for customers who choose to clear with another prime broker or a custodian bank; these customers are able to take advantage of our low commissions for trade execution as well as our best price execution.
•Wholesale Customers: Our wholesale customers, which include some of the largest banks and retail electronic brokers, are generally self-clearing. These customers count on us for our superior options and option/stock combination trade routing and execution and our ability to assist them in satisfying their regulatory requirements to provide best execution to their customers.
Our non-cleared customers include large online brokers and increasing numbers of the proprietary and customer trading units of U.S., Canadian and European commercial banks. These customers are attracted by theour IB SmartRoutingSM technology as well as our direct access to stock, options, futures, forex and bond markets worldwide.
Our customers receive worldwide electronic access connectivity in one of three ways: the Trader Workstation via desktop or mobile device, our proprietary API, and/or industry standard FIX connectivity.
Employees and Culture
We take pride in our technology-focused company culture and embrace it as one of our fundamental strengths. We remain committed to improving our technology and we try to minimize corporate hierarchy to facilitate efficient communication among employees. We have assembled what we believe is a highly talented group of employees. As we grow, we expect to continue to provide significant rewards for our employees who provide substantial value to us and the world's financial markets.
As of December 31, 2014,2017, we had 9601,228 employees, of which 1,213 own shares of the Company either vested, unvested or both, all of whom were employed on a full-time basis. None of our employees are covered by collective bargaining agreements. We believe that our relations with our employees are good.
Competition
Electronic Brokerage
The market for electronic brokerage services is rapidly evolving and highly competitive. IB believesWe believe that it fitswe fit neither within the definition of a traditional broker nor that of a traditional prime broker. IB'sOur primary competitors include offerings targeted to professional traders by large retail online brokers (such as TD
Ameritrade's thinkorswim, E*TRADE Pro business, and The Charles Schwab Corporation's StreetSmart Edge and optionsXpress businesses) and the prime brokerage and electronic brokerage arms of major commercial and investment banks and brokers, (suchsuch as Goldman Sachs' Electronic Trading (GSET), REDIPlus,Sachs, Morgan Stanley and Morgan Stanley's Passport business).JP Morgan; and offerings to target professional traders by large retail online brokers. We also encounter competition to a lesser extent from full commission brokerage firms, including Bank of America Merrill Lynch and Morgan Stanley, Smith Barney, as well as other financial institutions, most of which provide online brokerage services. The electronic brokerage businesses of many of our competitors are relatively insignificant in the totality of their firms' business and many impose significant account equity minimums, which IB does not. IB provides access to a global range of products from a single IB Universal AccountSM and professional level executions and pricing, which positions it in competition with niche direct-access providers and prime brokers. In addition to offering low commissions and financing rates, IB provides sophisticated order types and analytical tools that give a competitive edge to its customers.business.
Market Making
Historically, competition has come from registered market making firms which range from sole proprietors with very limited resources to large, integrated broker-dealers. Today, Timber Hill's major competitors continue to be large broker-dealers, such as Goldman Sachs, Morgan Stanley, UBS, Citigroup, Bank of America Merrill Lynch, and niche players such as Citadel, Susquehanna, Virtu, Wolverine Trading, Group One Trading, Peak6 and Knight Capital Group. Some of our competitors in market making are larger than we are and have more captive order flow, although this is less true with respect to our narrow focus on options, futures and ETFs listed on electronic exchanges.
The competitive environment for market makers has evolved considerably in the past several years, most notably with the rise in high frequency trading firmstraders ("HFTs"), which transact significant trading volume on electronic exchanges by using complex algorithms and high speedhigh-speed execution software that analyzes market conditions. HFTs that are not registered market makers operate with fewer regulatory restrictions and are able to move more quickly and trade more cheaply. This issue is currentlyhas been an area of focus amongst regulators who are examiningexamine the practices of HFTs and their impact on market structure.
To compete successfully,As previously described we believe that we must have more sophisticated, versatile and robust software thanare in the process of discontinuing our competitors. This is our primary focus, as contrasted with many of our competitors. With respect to these competitors, Timber Hill maintains the advantage of having had much longer experience with the development and usage of its proprietary electronic brokerage andoptions market making systems. Market conditions that are difficult for other market participants often present Timber Hill with the opportunities inherent in diminished competition. Our advantage is our expertise and decades of single-minded focus on developing our technology. This enables us to have a unique platform specializing strictly in electronic market making and brokerage.activities globally.
Regulation
Our securities and derivatives businesses are extensively regulated by U.S. federal and state regulators, foreign regulatory agencies, numerous exchanges and self-regulatory organizations ("SROs") of which our subsidiaries are members. In the current era of heightened regulation of financial institutions, we expect to incur increasing compliance costs, along with the industry as a whole. Our approach has been to build many of our regulatory and compliance functions into our integrated market making, order routing and custodial systems.
Overview
As a registered U.S. broker-dealers, Interactive Brokersbroker-dealer, IB LLC and Timber Hill LLC ("IBTH LLC") and TH LLC are subject to the rules and regulations of the Exchange Act, and as members of various exchanges, we are also subject to such exchanges' rules and requirements. Additionally, as registered futures commission merchants, IB LLC and TH LLC areis subject to the Commodity Exchange Act and rules promulgated
by the Commodity Futures Trading Commission ("CFTC") and the various commodity exchanges of which theyit is a member. We are members. Finally, we arealso subject to the requirements of various self-regulatory organizations such as the Financial Industry Regulatory Authority ("FINRA")FINRA and the National Futures Association ("NFA"). Our foreign affiliates are similarly regulated under the laws and institutional framework of the countries in which they operate.
U.S. broker-dealers and futures commission merchants are subject to laws, rules and regulations that cover all aspects of the securities and derivatives business, including:
- •
- sales methods;
- •
- trade practices;
- •
- use and safekeeping of customers' funds and securities;
- •
- capital structure;
- •
capital structure;risk management;- •
- record-keeping;
- •
- financing of customers' purchases; and
- •
- conduct of directors, officers and employees.
In addition, the businesses that we may conduct are limited by our agreements with and our oversight by regulators. Participation in new business lines, including trading of new products or participation on new exchanges or in new countries often requires governmental and/or exchange approvals, which may take significant time and resources. As a result, we may be prevented from entering new businesses that may be profitable in a timely manner, or at all.
As certain of our subsidiaries are members of FINRA, we are subject to certain regulations regarding changes in control of our ownership. FINRA Rule 1017 generally provides that FINRA approval must be obtained in connection with any transaction resulting in a change in control of a member firm. The FINRA defines control as ownership of 25% or more of the firm's equity by a single entity or person and would include a change in control of a parent company. As a result of these regulations, our future efforts to sell shares or raise additional capital may be delayed or prohibited by FINRA.
Net Capital Rule
The SEC, FINRA, CFTC and various other regulatory agencies within the United StatesU.S. have stringent rules and regulations with respect to the maintenance of specific levels of net capital by regulated entities. Generally, a broker-dealer's capital is net worth plus qualified subordinated debt less deductions for certain types of assets. The Net Capital Rule requires that at least a minimum part of a broker-dealer's assets be maintained in a relatively liquid form.
If these net capital rules are changed or expanded, or if there is an unusually large charge against our net capital, our operations that require the intensive use of capital would be limited. A large operating loss or charge against our net capital could adversely affect our ability to expand or even maintain these current levels of business, which could have a material adverse effect on our business and financial condition.
The U.S. regulators impose rules that require notification when net capital falls below certain predefined criteria. These rules also dictate the ratio of debt-to-equity in the regulatory capital composition of a broker-dealer, and constrain the ability of a broker-dealer to expand its business under certain circumstances. If a firm fails to maintain the required net capital, it may be subject to suspension or revocation of registration by the applicable regulatory agency, and suspension or expulsion by these regulators could ultimately lead to the firm's liquidation. Additionally, the Net
Capital Rule and certain FINRA rules impose requirements that may have the effect of prohibiting a broker-dealer from distributing or withdrawing capital and requiring prior notice to U.S. regulators and approval from FINRA for certain capital withdrawals.
AtAs of December 31, 2014,2017, aggregate excess regulatory capital for all of the operating companies was $3.27$4.5 billion.
THIB LLC and IBTH LLC are subject to the Uniform Net Capital Rule (Rule 15c3-1) under the Exchange Act and IB LLC to the CFTC's minimum financial requirements (Regulation 1.17) under the Commodities Exchange Act,Act; and THE is subject to the Swiss Financial Market Supervisory Authority eligible equity requirement. Additionally, THSHKInteractive Brokers Hong Kong Limited ("IBHK") is subject to the Hong Kong Securities and Futures Commission financial resource requirement, THArequirement; Interactive Brokers Australia Pty Limited ("IBA") is subject to the Australian StockSecurities Exchange liquid capital requirement,
requirement; Timber Hill (Lichtenstein) AG is subject to the Financial Market Authority Liechtenstein eligible capital requirements, THCrequirements; Timber Hill Canada Company ("THC") and Interactive Brokers Canada Inc. ("IBC") are subject to the Investment Industry Regulatory Organization of Canada risk adjusted capital requirement,requirement; Interactive Brokers (U.K.) Limited ("IBUK") is subject to the U.K. Financial Conduct Authority ("FCA") financial resources requirement, IBIrequirement; Interactive Brokers (India) Private Limited ("IBI") is subject to the National Stock Exchange of India net capital requirements"requirements; and Interactive Brokers Securities Japan, Inc. ("IBSJ") is subject to the Japanese Financial Supervisory Agency capital requirements.
The following table summarizes capital, capital requirements and excess regulatory capital:
| | Net Capital/ Eligible Equity | Requirement | Excess | Net Capital/ Eligible Equity | Requirement | Excess | ||||||||||||||
|---|---|---|---|---|---|---|---|---|---|---|---|---|---|---|---|---|---|---|---|---|
| | (in millions) | (in millions) | ||||||||||||||||||
IB LLC | $ | 2,333.9 | $ | 279.0 | $ | 2,054.9 | $ | 3,548 | $ | 495 | $ | 3,053 | ||||||||
TH LLC | 374.2 | 63.6 | 310.6 | 279 | 1 | 278 | ||||||||||||||
THE | 661.7 | 205.3 | 456.4 | 614 | 92 | 522 | ||||||||||||||
Other regulated Operating Companies | 486.0 | 36.1 | 449.9 | |||||||||||||||||
Other regulated operating companies | 773 | 121 | 652 | |||||||||||||||||
| | | | | | | | | | | | | | | | | | | | | |
| $ | 3,855.8 | $ | 584.0 | $ | 3,271.8 | $ | 5,214 | $ | 709 | $ | 4,505 | |||||||||
| | | | | | | | | | | | | | | | | | | | | | |
| | | | | | | | | | | | | | | | | | | | | |
AtAs of December 31, 2014,2017, all of the operating companies were in compliance with their respective regulatory capital requirements. For additional information regarding our net capital requirements see Note 1714 to the audited consolidated financial statements in Part II, Item 8 of this Annual Report on Form 10-K.
Protection of Customer Assets
To conduct customer activities, IB LLC is obligated under rules mandated by its primary regulators, the SEC and the CFTC, to segregate cash or qualified securities belonging to customers. In accordance with the Securities Exchange Act of 1934, IB LLC is required to maintain separate bank accounts for the exclusive benefit of customers. In accordance with the Commodity Exchange Act, IB LLC is required to segregate all monies, securities and property received from commodities customers in specially designated accounts. IBC, IBUK, IBHK, IBSJ, IBI and IBSJIBA are subject to similar requirements within their respective jurisdictions.
To further enhance the protection of our customers' assets, in 2011, IB LLC sought and received approval from FINRA to perform the customer reserve computation on a daily basis, instead of once per week. IB LLC has been performing daily computations since December 2011, along with daily adjustments of the money set aside in safekeeping for our customers.
Supervision and Compliance
Our Compliance Department supports and seeks to ensure proper operations of our market making and electronic brokerage businesses. The philosophy of the Compliance Department, and our company as a whole, is to build automated systems to try to eliminate manual steps in the compliance process and then to augment these systems with experienced staff members who apply their judgment where needed. We have built automated systems to handle wide-ranging compliance issues such as trade and audit trail reporting, financial operations reporting, enforcement of short sale rules, enforcement of margin rules and pattern day trading restrictions, review of employee correspondence, archival of required records, execution quality and order routing reports, approval and documentation of new customer accounts, and anti-money laundering and anti-fraud surveillance. In light of our automated operations and our automated compliance systems, we have a smaller and more efficient Compliance Department than many traditional securities firms. Nonetheless, we have increased the staffing in our Compliance Department over the past several years to meet the increased regulatory burdens faced by all industry participants.
Our electronic brokerage and market making companies have Chief Compliance Officers who report to the Company's CEO, General Counsel and its Audit and Compliance Committee. TheseIn the U.S., these Chief Compliance Officers, plus certain other senior staff members, are FINRA and NFA registered principals with supervisory responsibility over the various aspects of our businesses. Similar roles are undertaken by staff in certain non-U.S. locations as well. Staff members in the Compliance Department and in other departments of the firm are also registered with FINRA, NFA or other regulatory organizations.
Patriot Act and Increased Anti-Money Laundering ("AML") and "Know Your Customer" Obligations
Registered broker-dealers traditionally have been subject to a variety of rules that require that they "know their customers" and monitor their customers' transactions for potential suspicious activities. With the passage of the Uniting and Strengthening America by Providing Appropriate Tools Required to Intercept and Obstruct Terrorism Act of 2001 (the "Patriot Act"), broker-dealers are subject to even more stringent requirements. Likewise, the SEC, CFTC, foreign regulators, and the various exchanges and SROs,self-regulatory organizations, of which IB companies are members, have passed numerous AML and customer due diligence rules. Significant criminal and civil penalties can be imposed for violations of the Patriot Act, and significant fines and regulatory penalties can also be imposed for violations of other governmental and SROself-regulatory organization AML rules.
As required by the Patriot Act and other rules, we have established comprehensive anti-money laundering and customer identification procedures, designated AML compliance officers, trained our employees and conducted independent audits of our programs. Our anti-money laundering screening is conducted using a mix of automated and manual reviews and has been structured to comply with regulations in various jurisdictions. We collect required information through our new account opening process and screen accounts against databases for the purposes of identity verification and for review of negative information and appearance on government lists, including the Office of Foreign Assets and Control, Specially Designated Nationals and Blocked Persons lists. Additionally, we have developed methods for risk control and continue to add upon specialized processes, queries and automated reports designed to identify money laundering, fraud and other suspicious activities.
Dodd-Frank Reform Act
The Dodd-Frank Wall Street Reform and Consumer Protection Act imposes strict reporting and disclosure requirements on the financial services industry. We have enhanced the evidence of our supervisory review of controls over financial reporting and Management is monitoring this and othercontinues to monitor accounting and regulatory rulemaking developments for their potential effect on the Company'sour financial statements and internal controls over financial reporting.
Business Continuity Planning
Federal regulators and industry self-regulatory organizations have passed a series of rules in the past several years requiring regulated firms to maintain business continuity plans that describe what actions firms would take in the event of a disaster (such as a fire, natural disaster or terrorist incident) that might significantly disrupt operations. IB hasWe have developed business continuity plans that describe steps that the firmwe and itsour employees would take in the event of various scenarios. The firm hasWe have built a backup site for certain key operations at itsour Chicago facilities that would be utilized in the event of a significant outage at the firm'sour Greenwich headquarters. In addition, the firm haswe have strengthened the infrastructure at itsour Greenwich headquarters and hashave built redundancy of systems so that certain operations can be handled from multiple offices. The firmWe continually evaluatesevaluate opportunities to further itsour business continuity planning efforts.
Foreign Regulation
Our international subsidiaries are subject to extensive regulation in the various jurisdictions where they have operations. The most significant of our international subsidiaries are: THE, registered to do business in Switzerland as a securities dealer; THSHK, registered to do business in Hong Kong as a securities dealer; THA, registered to do business in Australia as a securities dealer and futures broker; IBUK, registered to do business in the U.K. as a broker; IBC and THC, registered to do business in Canada as an investment dealer and securities dealer, respectively; IBUK, registered to do business in the U.K. as a broker; THE, registered to do business in Switzerland as a securities dealer; IBI, registered to do business in India as a stock brokerbroker; IBHK, registered to do business in Hong Kong as a securities dealer; IBA, registered to do business in Australia as a securities dealer and futures broker; and IBSJ, registered in Japan as a financial instruments firm with the Kanto Regional Finance Bureau and the Financial Supervisory Agency.
In Canada, both THC and IBC are subject to the Investment Industry Regulatory Organization of Canada ("IIROC") risk adjusted capital requirement. In the United Kingdom, IBUK is subject to the U.K Financial Conduct Authority financial resources requirement. In Switzerland, THE is subject to the Swiss Financial Market Supervisory Authority eligible equity requirement. In India, IBI is subject to the National Stock Exchange and Bombay Stock Exchange capital requirements. In Hong Kong, the Securities and Futures Commission ("SFC") regulates our subsidiary, THSHK,IBHK, as a securities dealer. The compliance requirements of the SFC include, among other things, net capital requirements and stockholders' equity requirements. The SFC regulates the activities of the officers, directors, employees and other persons affiliated with THSHKIBHK and requires the registration of such persons.
In Canada, both THC and IBC are subject to the Investment Industry Regulatory Organization of Canada ("IIROC") risk adjusted capital requirement. In Switzerland, THE is subject to the Swiss Financial Market Supervisory Authority eligible equity requirement. In Australia, THAIBA is subject to the Australian StockSecurities Exchange liquid capital requirement. In the United Kingdom, IBUK is subject to the U.K Financial Conduct Authority financial resources requirement.
In India, IBI is subject to the National Stock Exchange and Bombay Stock Exchange capital requirements. In Japan, IBSJ is subject to the Financial Supervisory Agency, the Osaka Securities Exchange and the Tokyo Stock Exchange capital requirements.
Executive Officers and Directors of Interactive Brokers Group, Inc.
The following table sets forth the names, ages and positions of our current directors and executive officers.officers:
Name | Age | Position | |||
|---|---|---|---|---|---|
Thomas Peterffy | Chairman of the Board of Directors and Chief Executive Officer | ||||
Earl H. Nemser | Vice Chairman and Director | ||||
Milan Galik | President and Director | ||||
Paul J. Brody | Chief Financial Officer, Treasurer, Secretary and Director | ||||
Thomas A. Frank | Executive Vice President and Chief Information Officer | ||||
Lawrence E. Harris | |||||
| Director | ||||
Wayne Wagner | Director | ||||
Richard Gates | Director | ||||
Gary Katz | 57 | Director | |||
Thomas Peterffy.Peterffy Thomas—Mr. Peterffy has been at the forefront of applying computer technology to automate trading and brokerage functions since he emigrated from Hungary to the United States in 1965. In 1977, after purchasing a seat on the American Stock Exchange and trading as an individual marker maker in equity options, Mr. Peterffy was among the first to apply a computerized mathematical model to continuously value equity option prices. By 1986, Mr. Peterffy developed and employed a fully integrated, automated market making system for stocks, options and futures. As this pioneering system extended around the globe, online brokerage functions were added and, in 1993, Interactive Brokers was formed.
Earl H. Nemser.Nemser—Mr. Nemser has been our Vice Chairman since November 2006. Mr. Nemser has been the Vice Chairman of the Company since 1988 and also serves as a director and/or officer for various subsidiaries of IBG LLC. Mr. Nemser has served as Special Counsel to the law firm Dechert LLP since January 2005. Prior to such time Mr. Nemser served as Partner at the law firms of Swidler Berlin Shereff Friedman, LLP from 1995 to December 2004 and Cadwalader, Wickersham & Taft LLP prior to 1995. Mr. Nemser received a Bachelor of Arts degree in economics from New York University in 1967 and a Juris Doctor,magna cum laude, from Boston University School of Law in 1970.
Milan Galik.Galik—Mr. Galik joined us in 1990 as a software developer and has served as President of the Company and IBG LLC since October 2014. Mr. Galik served as Senior Vice President, Software Development of IBG LLC from October 2003 to October 2014. In addition, Mr. Galik has served as Vice President of Timber Hill LLC since April 1998 and serves as a member of the board of directors of the Boston Options Exchange. Mr. Galik received a Master of Science degree in electrical engineering from the Technical University of Budapest in 1990.
Paul J. Brody.Brody—Mr. Brody has been our Chief Financial Officer, Treasurer and Secretary since November 2006. Mr. Brody joined usthe Company in 1987 and has served as Chief Financial Officer of IBG LLC since December 2003. Mr. Brody serves as a director and/or officer for various subsidiaries of IBG LLC. From 2005 to 2012, Mr. Brody served as a director, and for a portion of thatthe time as member Vice Chairman, of The Options Clearing Corporation, of which Timber Hill LLC and Interactive Brokers LLC are members. He also servesserved as a director of Quadriserv Inc., an electronic securities lending platform provider.provider, from 2009 to 2015. Mr. Brody received a Bachelor of Arts degree in economics from Cornell University in 1982.
Thomas A. Frank.Frank—Dr. Frank joined us in 1985 and has served since July 1999 as Executive Vice President and Chief Information Officer of Interactive Brokers LLC. In addition, Dr. Frank has served as Vice President of Timber Hill LLC since December 1990. Mr. Frank has served as a director of The Options Clearing Corporation, since 2015. Dr. Frank received a Ph.D. in physics from the Massachusetts Institute of Technology in 1985.
Lawrence E. Harris.Harris—Dr. Harris has been a director since July 2007. He is a professor of Finance and Business Economics at the University of Southern California, where he holds the Fred V. Keenan Chair in Finance at the Marshall School of Business. Dr. Harris also serves as trustee of the Clipper Fund, director of the Selected Funds, and as the research coordinator of the Institute for Quantitative Research in Finance. Dr. Harris formerly served as Chief Economist of the U.S. Securities and Exchange Commission. Dr. Harris earned his Ph.D. in Economics from the University of Chicago, and is a CFA charterholder. He is an expert in the economics of securities market microstructure and the uses of transactions data in financial research. He has written extensively about trading rules, transaction costs, index markets, and market regulation. Dr. Harris is also the author of the widely respected textbook "Trading Trading and Exchanges: Market Microstructure for Practitioners."Practitioners.
Hans R. Stoll.Richard Gates Dr. Stoll—Mr. Gates has been a director since April 2008. He is The Anne Marie and Thomas B. Walker, Jr., Professor of Finance, Emeritus at2012. Mr. Gates co-founded TFS Capital, a registered investment advisor from 1997-2017 that focused on the Owen Graduate School of Management, Vanderbilt University and founderequity markets. During those 20 years, TFS won several awards, including the first-everMorningstar Alternatives Fund Manager of the Financial Markets Research Center. Dr. Stoll has published several booksYear. While at TFS, Mr. Gates worked with the SEC on market structure, short selling regulations, and more than 60 articles on numerous securities and finance related subjects. He is known for developing the put call parity relation and for his work in market microstructure. Dr. Stoll wasother issues. In 2014, Mr. Gates co-founded Elmagin Capital LLC, an asset manager focused on the faculty of the Wharton Schoolwholesale power markets. Mr. Gates graduated from 1966 to 1980 at which time he joined the faculty at Vanderbilt. Dr. Stoll served as a member of the board of directors of the Options Clearing Corporation from 2005 to 2008. He has been President of the American Finance Association. Dr. Stoll received his A.B. degree from Swarthmore College in 1961 and his M.B.A. and Ph.D. degrees from the Graduate School of Business of the University of ChicagoVirginia in 1963 and 1966, respectively.1994 with a bachelor's degree in Chemical Engineering.
Wayne Wagner.Wagner—Mr. Wagner has been a director since April 2014. He is a consultant on issues related to investment management and securities trading. He co-founded Plexus Group, now part of ITG, Inc., in 1986. Plexus provided trading evaluation and advisory services to money managers, brokerage firms and pension plan sponsors. He was also a founding partner of Wilshire Associates and served as the Chief Investment Officer of Wilshire Asset Management. He participated in the design of the operating, balancing and evaluation algorithms for the world's first operational index fund at Wells Fargo Bank. He is recognized as instrumental in pioneering processes to reduce the costs of trading. Mr. Wagner has authored several books on the topic of trading and investment management and is currently the Research Committee Chairman of the CFA-Institute Research Foundation.
Richard Gates. Mr. Gates co-founded TFS Capital in 1997. TFS is an independent advisory firm that has been dedicated to the construction of quantitative models that are designed to identify market inefficiencies. As a portfolio manager at this firm, he oversees several hedge funds and mutual funds that take both long and short positions in equities and futures. At TFS, his focus is on trade execution, factor research and business development. Mr. Gates graduated from the University of Virginia in 1994 with a bachelor's degree in Chemical Engineering.management.
Gary Katz—Mr. Katz has been a director since January 2017. He was the President and Chief Executive Officer of the International Securities Exchange ("ISE") and a co-founder of ISE. Mr. Katz was one of the principal developers of the unique options market structure—an auction market on an electronic platform—used by all three options exchanges; ISE, ISE Gemini and ISE Mercury and was named as inventor or co-inventor on six patents that the ISE received or applied for relating to its proprietary trading system and technology. He served on the Executive Board of Eurex and on the Board of Directors of The Options Clearing Corporation and chaired the Board's newly formed technology committee. Mr. Katz also served on the Board of Directors of Direct Edge. Mr. Katz graduated from New York University with a master's degree in Statistics with Distinction and a bachelor's degree from Queens College. Mr. Katz is currently chairman of the board of Farmer's Pantry LLC, a start-up in the consumer goods industry and additionally serves on the board of Long Island Autism Communities, Inc., a not for profit, 501(c)(3) organization dedicated to developing supportive integrated communities for adults with autism.
We face a variety of risks that are substantial and inherent in our businesses, including market, liquidity, credit, operational, legal and regulatory. In addition to the risks identified elsewhere in this Annual Report on Form 10-K, the following risk factors apply to our business results of operations and financial condition:
Risks Related to Our Company Structure
Control by Mr. Thomas Peterffy of a majority of the combined voting power of our common stock may give rise to conflicts of interests and could discourage a change of control that other stockholders may favor, which could negatively affect our stock price, and adversely affect stockholders in other ways.
Mr. Thomas Peterffy, our founder, Chairman and Chief Executive Officer, and his affiliates beneficially own approximately 88.0%89.2% of the economic interests and all of the voting interests in Holdings, which owns all of our Class B common stock, representing approximately 85.5%82.6% of the combined voting power of all classes of our voting stock. As a result, Mr. Thomas Peterffy has the ability to elect all of the members of our board of directors and thereby to control our management and affairs, including determinations with respect to acquisitions, dispositions, material expansions or contractions of our business, entry into new lines of business, borrowings, issuances of common stock or other securities, and the declaration and payment of dividends on our common stock. In addition, Mr. Thomas Peterffy is able to determine the outcome of all matters requiring stockholder approval and will be able to cause or prevent a change of control of our company or a change in the composition of our board of directors and could preclude any unsolicited acquisition of our company. The concentration of ownership could discourage potential takeover attempts that other stockholders may favor and could deprive stockholders of an opportunity to receive a premium for their common stock as part of a sale of our company and this may adversely affect the market price of our common stock.
Moreover, because of Mr. Thomas Peterffy's substantial ownership, we are eligible to be and are, treated as a "controlled company" for purposes of the NASDAQ Marketplace Rules. As a result, we are not required by NASDAQ to have a majority of independent directors or to maintain Compensation and Nominating and Corporate Governance Committees composed entirely of independent directors to continue to list the shares of our common stock on The NASDAQ Global Select Market ("NASDAQ GS"). Our Compensation Committee is comprised of Messrs. Thomas Peterffy (Chairman of the Compensation Committee) and Earl H. Nemser (our Vice Chairman). Mr. Thomas Peterffy's membership on the Compensation Committee may give rise to conflicts of interests in that Mr. Thomas Peterffy is able to influence all matters relating to executive compensation, including his own compensation.
We are dependent on IBG LLC to distribute cash to us in amounts sufficient to pay our tax liabilities and other expenses.
We are a holding company and our primary assets are our approximately 14.5%17.4% equity interest in IBG LLC and our controlling interest and related rights as the sole managing member of IBG LLC and, as such, we operate and control all of the business and affairs of IBG LLC and are able to consolidate IBG LLC's financial results into our financial statements. We have no independent means of generating revenues. IBG LLC is treated as a partnership for U.S. federal income tax purposes and, as such, is not subject to U.S. federal income tax. Instead, its taxable income is allocated on a pro rata basis to Holdings and us. Accordingly, we incur income taxes on our proportionate share of the net taxable income of IBG LLC, and also incur expenses related to our operations. We intend to cause IBG LLC to distribute cash to its members in amounts at least equal to that necessary to cover their tax liabilities, if any, with respect to the earnings of IBG LLC. To the extent we need funds to pay such taxes, or for any other purpose, and IBG LLC is unable to provide such funds, it could have a material adverse effect on our business, financial condition orand results of operations.
We are required to pay Holdings for the benefit relating to additional tax depreciation or amortization deductions we claim as a result of the tax basis step-up our subsidiaries received in connection with our IPO and certain subsequent redemptions of Holdings membership interests.
In connection with our IPO, we purchased interests in IBG LLC from Holdings for cash. In August 2011, November 2013 and October 2014, in connection with redemptions of Holdings membership interests, we acquired additional interests in IBG LLC by issuing shares of Class A common stock in exchange for an equivalent number of shares of member interests in IBG LLC (the "Redemptions"). In addition, IBG LLC membership interests held by Holdings may be sold in the future to us and financed by our issuances of shares of our common stock. The initial purchase and the Redemptions did, and the subsequent purchases may, result in increases in the tax basis of the tangible and intangible assets of IBG LLC and its subsidiaries that otherwise would not have been available. Such increase will be approximately equal to the amount by which our stock price at the time of the purchase exceeds the income tax basis of the assets of IBG LLC underlying the IBG LLC interests acquired by us. These increases in tax basis will result in increased deductions in computing our taxable income and resulting tax savings for us generally over the 15 year period which commenced with the initial purchase. We have agreed to pay 85% of these tax savings, if any, to Holdings as they are realized as additional consideration for the IBG LLC interests that we acquire.
As a result of the IPO and the redemptionsRedemptions by Holdings, the increase in the tax basis attributable to our interest in IBG LLC is $1.09$1.2 billion. The tax savings that we would actually realize as a result of this increase in tax basis likely would be significantly less than this amount multiplied by our effective tax rate due to a number of factors, including the allocation of a portion of the increase in tax basis to foreign or non-depreciable fixed assets, the impact of the increase in the tax basis on our ability to use foreign tax credits and the rules relating to the amortization of intangible assets, for example. Based on current facts and assumptions as of December 31, 2017, including that subsequent purchases of IBG LLC interests will occur in fully taxable transactions, the potential tax basis increase resulting from the historical and future purchases of the IBG LLC interests held by Holdings could be as much as $6.76$14.5 billion. The tax receivable agreementTax Receivable Agreement requires 85% of such tax savings, if any, to be paid to Holdings, with the balance to be retained by us. The actual increase in tax basis depends, among other factors, upon the price of shares of our common stock at the time of the purchase and the extent to which such purchases are taxable and, as a result, could differ materially from this amount. Our ability to achieve benefits from any such increase, and the amount of the payments to be made under the tax receivable agreement,Tax Receivable Agreement, depends upon a number of factors, as discussed above, including the timing and amount of our future income.
The tax basis of $6.76$14.5 billion assumes that (a) all remaining IBG LLC membership interests held by Holdings are purchased by the Companyus and (b) such purchases in the future are made at prices that reflect the closing share price atas of December 31, 2014.2017. In order to have a $6.76$14.5 billion tax basis, the offering price per share of Class A common stock in such future public offering will need to exceed the then current cost basis per share of Class A common stock by approximately $16.39.$44.89.
If either immediately before or immediately after any purchase or the related issuance of our stock, the Holdings members own or are deemed to own, in the aggregate, more than 20% of our outstanding common stock, then all or part of any increase in the tax basis of goodwill may not be amortizable and, thus, our ability to realize the annual tax savings that otherwise would have resulted if such tax basis were amortizable may be significantly reduced. Although the Holdings members are prohibited under the Exchange Agreement from purchasing shares of Class A common stock, grants of our common stock to employees and directors who are also members or related to members of Holdings and the application of certain tax attribution rules, such as among family members and partners in a partnership, could result in Holdings members being deemed for tax purposes to own shares of Class A common stock.
If the IRSInternal Revenue Services ("IRS") successfully challenges the tax basis increase, under certain circumstances, we could be required to make payments to Holdings under the tax receivable agreementTax Receivable Agreement in excess of our cash tax savings.
Future sales of our common stock in the public market could lower our stock price, and any additional capital raised by us through the sale of equity or convertible securities may dilute your ownership in us.
The members of Holdings have the right to cause the redemption of their Holdings membership interests over time in connection with offerings of shares of our common stock. We intend to sell additional shares of common stock in public offerings in the future, which may include offerings of our common stock to finance future purchases of IBG LLC membership interests which, in turn, will finance corresponding redemptions of Holdings membership interests. These offerings and related transactions wereare anticipated to occur on or about each of the first eight years following the IPO. Given the absence of any public offering subsequent to our IPO in 2007 through 2010 (and the relatively minor amounts associated with the 2011, 2013 and 2014 redemptions) and depending on the timing of redemptions, this offering schedule will be extendedat least annually into the future in accordance with the Exchange Agreement.future. The size and occurrence of these offerings may be affected by market conditions. We may also issue additional shares of common stock or convertible debt securities to finance future acquisitions or business combinations. We currently have approximately 58.571 million outstanding shares of common stock. Assuming no anti-dilution adjustments based on combinations or divisions of our common stock, the offerings referred to above could result in the issuance by us of up to an additional approximately 346.1340 million shares of common stock. It is possible, however, that such shares could be issued in one or a few large transactions.
We cannot predict the size of future issuances of our common stock or the effect, if any, that future issuances and sales of shares of our common stock may have on the market price of our common stock. Sales of substantial amounts of our common stock (including shares issued in connection with an acquisition), or the perception that such sales could occur, may cause the market price of our common stock to decline.
Certain provisions in our amended and restated certificate of incorporation may prevent efforts by our stockholders to change our direction or management.
Provisions contained in our amended and restated certificate of incorporation could make it more difficult for a third party to acquire us, even if doing so might be beneficial to our stockholders. For example, our amended and restated certificate of incorporation authorizes our board of directors to determine the rights, preferences, privileges and restrictions of unissued series of preferred stock, without any vote or action by our stockholders. We could issue a series of preferred stock that could impede the completion of a merger, tender offer or other takeover attempt. These provisions may discourage potential acquisition proposals and may delay, deter or prevent a change of control of us, including through transactions, and, in particular, unsolicited transactions, that some or all of our stockholders might consider to be desirable. As a result, efforts by our stockholders to change our direction or management may be unsuccessful.
Our business may be harmed by global events beyond our control, including overall slowdowns in securities trading.
Like other brokerage and financial services firms, our business and profitability are directly affected by elements that are beyond our control, such as economic and political conditions, broad trends in business and finance, changes in volume of securities and futures transactions, changes in the markets in which such transactions occur and changes in how such transactions are processed. A weakness in equity markets, such as a slowdown causing reduction in trading volume in U.S. or foreign
securities and derivatives, has historically resulted in reduced transaction revenues and would have a material adverse effect on our business, financial condition and results of operations.
Because our revenues and profitability depend on trading volume, they are prone to significant fluctuations and are difficult to predict.Our business could be harmed by a systemic market event.
Our revenues are dependent on the levelSome market participants could be overleveraged. In case of trading activity on securities and derivatives exchangessudden, large price movements, such market participants may not be able to meet their obligations to brokers who, in the United States and abroad. In the past, our revenues and operating results have varied significantly from periodturn, may not be able to period due primarilymeet their obligations to the willingness of competitors to trade more aggressively by decreasing their bid/offer spreads and thereby assuming more risk in order to acquire market share, to movements and trends in the underlying markets, and to fluctuations in trading levels.counterparties. As a result, periodthe financial system or a portion thereof could collapse, and the impact of such an event could be catastrophic to period comparisonsour business.
Our future success will depend on our response to the demand for new services, products and technologies.
The demand for market making services, particularly services that rely on electronic communications gateways, is characterized by:
- •
- rapid technological change;
- •
- changing customer demands;
- •
- the need to enhance existing services and products or introduce new services and products; and
- •
- evolving industry standards.
New services, products and technologies may render our existing services, products and technologies less competitive. Our future success will depend, in part, on our ability to respond to the demand for new services, products and technologies on a timely and cost-effective basis and to adapt to technological advancements and changing standards to address the increasingly sophisticated requirements and varied needs of our revenuescustomers and operating resultsprospective customers. We cannot assure you that we will be successful in developing, introducing or marketing new services, products and technologies. In addition, we may experience difficulties that could delay or prevent the successful development, introduction or marketing of these services and products, and our new service and product enhancements may not be meaningful,achieve market acceptance. Any failure on our part to anticipate or respond adequately to technological advancements, customer requirements or changing industry standards, or any significant delays in the development, introduction or availability of new services, products or enhancements could have a material adverse effect on our business, financial condition and future revenues and profitability may be subject to significant fluctuations or declines.results of operations.
Our reliance on our computer software could cause us great financial harm in the event of any disruption or corruption of our computer software. We may experience technology failures while developing our software.
We rely on our computer software to receive and properly process internal and external data. Any disruption for any reason in the proper functioning or any corruption of our software or erroneous or corrupted data may cause us to make erroneous trades or suspend our services and could cause us great financial harm. To maintain our competitive advantage, our software is under continuous development. As we identify and enhance our software, there is risk that software failures may occur and result in service interruptions and have other unintended consequences.
Our business could be harmed by a systemic market event.
Some market participants could be overleveraged. In case of sudden, large price movements, such market participants may not be able to meet their obligations to brokers who, in turn, may not be able to meet their obligations to their counterparties. As a result, the financial system or a portion thereof could collapse, and the impact of such an event could be catastrophic to our business.
We may incur material trading losses from our market making activities.
A substantial portion of our revenues and operating profits is derived from our trading as principal in our role as a market maker and specialist. We may incur trading losses relating to these activities since each primarily involves the purchase or sale of securities for our own account. In any period, we may incur trading losses in a significant number of securities for a variety of reasons including:
•price changes in securities;•lack of liquidity in securities in which we have positions; and•the required performance of our market making and specialist obligations.
These risks may limit or restrict our ability to either resell securities we purchased or to repurchase securities we sold. In addition, we may experience difficulty borrowing securities to make delivery to purchasers to whom we sold short, or lenders from whom we have borrowed. From time to time, we have large position concentrations in securities of a single issuer or issuers engaged in a specific industry or traded in a particular market. Such a concentration could result in higher trading losses than would occur if our positions and activities were less concentrated.
In our role as a market maker, we attempt to derive a profit from the difference between the prices at which we buy and sell, or sell and buy, securities. However, competitive forces often require us to match the quotes other market makers display and to hold varying amounts of securities in inventory. By having to maintain inventory positions, we are subjected to a high degree of risk. We cannot assure you that we will be able to manage such risk successfully or that we will not experience
significant losses from such activities, which could have a material adverse effect on our business, financial condition and operating results.
Reduced spreads in securities pricing, levels of trading activity and trading through market makers and/or specialists could harm our business.
Computer-generated buy/sell programs and other technological advances and regulatory changes in the marketplace may continue to tighten spreads on securities transactions. Tighter spreads and increased competition could make the execution of trades and market making activities less profitable. In addition, new and enhanced alternative trading systems such as ECNs have emerged as an alternative for individual and institutional investors, as well as broker-dealers, to avoid directing their trades through market makers, and could result in reduced revenues derived from our market making business.
We may incur losses in our market making activities in the event of failures of our proprietary pricing model.
The success of our market making business is substantially dependent on the accuracy of our proprietary pricing mathematical model, which continuously evaluates and monitors the risks inherent in our portfolio, assimilates market data and reevaluates our outstanding quotes each second. Our model is designed to automatically rebalance our positions throughout the trading day to manage risk exposures on our positions in options, futures and the underlying securities. In the event of a flaw in our pricing model and/or a failure in the related software, our pricing model may lead to unexpected and/or unprofitable trades, which may result in material trading losses.
The valuation of the financial instruments we hold may result in large and occasionally anomalous swings in the value of our positions and in our earnings in any period.
The market prices of our long and short positions are reflected on our books at closing prices which are typically the last trade price before the official close of the primary exchange on which each such security trades. Given that we manage a globally integrated portfolio, we may have large and substantially offsetting positions in securities that trade on different exchanges that close at different times of the trading day. As a result, there may be large and occasionally anomalous swings in the value of our positions daily and, accordingly, in our earnings in any period. This is especially true on the last business day of each calendar quarter.
We are exposed to losses due to lack of perfect information.
As market makers, we provide liquidity by buying from sellers and selling to buyers. Quite often, we trade with others who have different information than we do, and as a result, we may accumulate unfavorable positions preceding large price movements in companies. Should the frequency or magnitude of these events increase, our losses will likely increase correspondingly.
Rules governing specialists and designated market makers may require us to make unprofitable trades or prevent us from making profitable trades.
Specialists and designated market makers are granted certain rights and have certain obligations to "make a market" in a particular security. They agree to specific obligations to maintain a fair and orderly market. In acting as a specialist or designated market maker, we are subjected to a high degree of risk by having to support an orderly market. In this role, we may at times be required to make trades that adversely affect our profitability. In addition, we may at times be unable to trade for our own account in circumstances in which it may be to our advantage to trade, and we may be obligated to act as a principal when buyers or sellers outnumber each other. In those instances, we may take a position counter to the market, buying or selling securities to support an orderly market. Additionally, the rules of the markets which govern our activities as a specialist or designated market maker are subject to change. If these rules are made more stringent, our trading revenues and profits as specialist or designated market maker could be adversely affected.
We are subject to potential losses as a result of our clearing and execution activities.
As a clearing member firm providing financing services to certain of our brokerage customers, we are ultimately responsible for their financial performance in connection with various stock, options and futures transactions. Our clearing operations require a commitment of our capital and, despite safeguards implemented by our software, involve risks of losses due to the potential failure of our customers to perform their obligations under these transactions. If our customers default on their obligations, we remain financially liable for such obligations, and although these obligations are collateralized, we are subject to market risk in the liquidation of customer collateral to satisfy those obligations. There can be no assurance that our risk management procedures will be adequate. Any liability arising from clearing operations could have a material adverse effect on our business, financial condition and/or operating results.
As a clearing member firm of securities and commodities clearing houses in the United States and abroad, we are also exposed to clearing member credit risk. Securities and commodities clearing houses require member firms to deposit cash and/or government securities to a clearing fund. If a clearing member defaults in its obligations to the clearing house in an amount larger than its own margin and clearing fund deposits, the shortfall is absorbed pro rata from the deposits of the other clearing members. Many clearing houses of which we are members also have the authority to assess their members for additional funds if the clearing fund is depleted. A large clearing member default could result in a substantial cost to us if we are required to pay such assessments.
We may not pay dividends on our common stock at any time in the foreseeable future.
As a holding company for our interest in IBG LLC, we will be dependent upon the ability of IBG LLC to generate earnings and cash flows and distribute them to us so that we may pay any dividends to our stockholders. To the extent (if any) that we have excess cash, any decision to declare and pay dividends in the future will be made at the discretion of our board of directors and will depend on, among other things, our results of operations, financial conditions, cash requirement, contractual restrictions and other factors that our board of directors may deem relevant. In December 2010 and December 2012, special cash dividends were paid to holders of our common stock. Since the second quarter of 2011, the Company has declared and paid a quarterly cash dividend of $0.10 per share. Although not required, we currently intend to pay quarterly dividends of $0.10 per share to our common stockholders for the foreseeable future.
Regulatory and legal uncertainties could harm our business.
The securities and derivatives businesses are heavily regulated. Firms in financial service industries have been subject to an increasingly regulated environment over recent years, and penalties and fines sought by regulatory authorities have increased accordingly. This regulatory and enforcement environment has created uncertainty with respect to various types of transactions that historically had been entered into by financial services firms and that were generally believed to be permissible and appropriate. Our broker-dealer subsidiaries are subject to regulations in the United States and abroad covering all aspects of their business. Regulatory bodies include, in the United States, the SEC, FINRA, the Board of Governors of the Federal Reserve System, the Chicago Board Options Exchange, the Chicago Mercantile Exchange, the Commodity Futures Trading Commission, and the National Futures Association; in Switzerland, the Swiss Financial Market Supervisory Authority; in the United Kingdom, the Financial Conduct Authority; in Hong Kong, the Securities and Futures Commission; in Australia, the Australian Securities and Investment Commission; in India, the Securities and Exchange Board of India; in Canada, the Investment Industry Regulatory Organization of Canada and various Canadian securities commissions; and in Japan, the Financial Supervisory Agency and the Japan Securities Dealers Association. Our mode of operation and profitability may be directly affected by additional legislation changes in rules promulgated by various domestic and foreign government
agencies and self-regulatory organizations that oversee our businesses, and changes in the interpretation or enforcement of existing laws and rules, including the potential imposition of transaction taxes. Noncompliance with applicable laws or regulations could result in sanctions being levied against us, including fines and censures, suspension or expulsion from a certain jurisdiction or market or the revocation or limitation of licenses. Noncompliance with applicable laws or regulations could adversely affect our reputation, prospects, revenues and earnings. In addition, changes in current laws or regulations or in governmental policies could adversely affect our operations, revenues and earnings.
Domestic and foreign stock exchanges, other self-regulatory organizations and state and foreign securities commissions can censure, fine, issue cease- and-desist orders, suspend or expel a broker-dealer or any of its officers or employees. Our ability to comply with all applicable laws and rules is largely dependent on our internal system to ensure compliance, as well as our ability to attract and retain qualified compliance personnel. We could be subject to disciplinary or other actions in the future due to claimed noncompliance, which could have a material adverse effect on our business, financial condition and results of operations. To continue to operate and to expand our services internationally, we may have to comply with the regulatory controls of each country in which we conduct, or intend to conduct business, the requirements of which may not be clearly defined. The varying compliance requirements of these different regulatory jurisdictions, which are often unclear, may limit our ability to continue existing international operations and further expand internationally.
Our future efforts to sell shares or raise additional capital may be delayed or prohibited by regulations.
As certain of our subsidiaries are members of FINRA, we are subject to certain regulations regarding changes in control of our ownership. FINRA Rule 1017 generally provides that FINRA approval must be obtained in connection with any transaction resulting in a change in control of a member firm. FINRA defines control as ownership of 25% or more of the firm's equity by a single entity or person and would include a change in control of a parent company. Interactive Brokers (U.K.) Limited is subject to similar change in control regulations promulgated by the FCA in the United Kingdom. As a result of these regulations, our future efforts to sell shares or raise additional capital may be delayed or prohibited. We may be subject to similar restrictions in other jurisdictions in which we operate.
We depend on our proprietary technology, and our future results may be impacted if we cannot maintain technological superiority in our industry.
Our success in the past has largely been attributable to our sophisticated proprietary technology that has taken many years to develop. We have benefited from the fact that the type of proprietary technology equivalent to that which we employ has not been widely available to our competitors. If our technology becomes more widely available to our current or future competitors for any reason, our operating results may be adversely affected. Additionally, adoption or development of similar or more advanced technologies by our competitors may require that we devote substantial resources to the development of more advanced technology to remain competitive. The markets in which we compete are characterized by rapidly changing technology, evolving industry standards and changing trading systems, practices and techniques. Although we have been at the forefront of many of these developments in the past, we may not be able to keep up with these rapid changes in the future, develop new technology, realize a return on amounts invested in developing new technologies or remain competitive in the future.
The loss of our key employees would materially adversely affect our business.
Our key executives have substantial experience and have made significant contributions to our business, and our continued success is dependent upon the retention of our key management executives, as well as the services provided by our staff of trading system, technology and programming
specialists and a number of other key managerial, marketing, planning, financial, technical and operations personnel. The loss of such key personnel could have a material adverse effect on our business. Growth in our business is dependent, to a large degree, on our ability to retain and attract such employees.
We may not pay dividends on our common stock at any time in the foreseeable future.
As a holding company for our interest in IBG LLC, we will be dependent upon the ability of IBG LLC to generate earnings and cash flows and distribute them to us so that we may pay any dividends to our stockholders. To the extent (if any) that we have excess cash, any decision to declare and pay dividends in the future will be made at the discretion of our board of directors and will depend on, among other things, our results of operations, financial conditions, cash requirement, contractual restrictions and other factors that our board of directors may deem relevant. Since the second quarter of 2011, we have declared and paid a quarterly cash dividend of $0.10 per share. Although not required, we currently intend to pay quarterly dividends of $0.10 per share to our common stockholders for the foreseeable future.
Our future efforts to sell shares or raise additional capital may be delayed or prohibited by regulations.
As certain of our subsidiaries are members of FINRA, we are subject to certain regulations regarding changes in control of our ownership. FINRA Rule 1017 generally provides that FINRA approval must be obtained in connection with any transaction resulting in a change in control of a member firm. FINRA defines control as ownership of 25% or more of the firm's equity by a single entity or person and would include a change in control of a parent company. IBUK, THC, IBC, and IBHK are subject to similar change in control regulations promulgated by the FCA in the United Kingdom, the IIROC in Canada and the SFC in Hong Kong, respectively. As a result of these regulations, our future efforts to sell shares or raise additional capital may be delayed or prohibited. We may be subject to similar restrictions in other jurisdictions in which we operate.
Regulatory and legal uncertainties could harm our business.
The securities and derivatives businesses are heavily regulated. Firms in financial service industries have been subject to an increasingly regulated environment over recent years, and penalties and fines sought by regulatory authorities have increased accordingly. This regulatory and enforcement environment has created uncertainty with respect to various types of transactions that historically had been entered into by financial services firms and that were generally believed to be permissible and appropriate. Our broker-dealer subsidiaries are subject to regulations in the U.S. and abroad covering all aspects of their business. Regulatory bodies include, in the U.S., the SEC, FINRA, the Board of Governors of the Federal Reserve System, the Chicago Board Options Exchange, the Chicago Mercantile Exchange, the CFTC, and the NFA; in Canada, the Investment Industry Regulatory Organization of Canada and various Canadian securities commissions; in the United Kingdom, the Financial Conduct Authority; in Switzerland, the Swiss Financial Market Supervisory Authority; in India, the Securities and Exchange Board of India; in Hong Kong, the Securities and Futures Commission; in Australia, the Australian Securities and Investment Commission; and in Japan, the Financial Supervisory Agency and the Japan Securities Dealers Association. Our mode of operation and profitability may be directly affected by additional legislation changes in rules promulgated by various domestic and foreign government agencies and self-regulatory organizations that oversee our businesses, and changes in the interpretation or enforcement of existing laws and rules, including the potential imposition of transaction taxes. Noncompliance with applicable laws or regulations could result in sanctions being levied against us, including fines and censures, suspension or expulsion from a certain jurisdiction or market or the revocation or limitation of licenses. Noncompliance with applicable laws or regulations could adversely affect our reputation, prospects, revenues and earnings. In addition, changes in current laws or regulations or in governmental policies could adversely affect our business, financial condition and results of operations.
Domestic and foreign stock exchanges, other self-regulatory organizations and state and foreign securities commissions can censure, fine, issue cease-and-desist orders, suspend or expel a broker-dealer or any of its officers or employees. Our ability to comply with all applicable laws and rules is largely dependent on our internal system to ensure compliance, as well as our ability to attract and retain qualified compliance personnel. We could be subject to disciplinary or other actions in the future due to claimed noncompliance, which could have a material adverse effect on our business, financial condition and results of operations. To continue to operate and to expand our services internationally, we may have to comply with the regulatory controls of each country in which we conduct, or intend to conduct business, the requirements of which may not be clearly defined. The varying compliance requirements of these different regulatory jurisdictions, which are often unclear, may limit our ability to continue existing international operations and further expand internationally.
Our direct market access clearing and non-clearing brokerage operations face intense competition.
With respect to our direct market access brokerage business, the market for electronic and interactive bidding, offering and trading services in connection with equities, options and futures is relatively new, rapidly evolving and intensely competitive. We expect competition to continue and intensify in the future. Our current and potential future competition principally comes from five categories of competitors:
- •
- prime brokers who, in an effort to satisfy the demands of their customers for hands-on electronic trading facilities, universal access to markets, smart routing, better trading tools, lower commissions and financing rates, have embarked upon building such facilities and product enhancements;
- •
- direct market access and online options and futures firms;
- •
- direct market access and online equity brokers;
- •
- software development firms and vendors who create global trading networks and analytical tools and make them available to brokers; and
- •
- traditional brokers.
In addition, we compete with financial institutions, mutual fund sponsors and other organizations, many of which provide online, direct market access or other investing services. A number of brokers provide our technology and execution services to their customers, and these brokers will become our competitors if they develop their own technology. Some of our competitors in this area have greater name recognition, longer operating histories and significantly greater financial, technical, marketing and other resources than we have and offer a wider range of services and financial products than we do. Some of our competitors may also have an ability to charge lower commissions. We cannot assure you that we will be able to compete effectively or efficiently with current or future competitors. These increasing levels of competition in the online trading industry could significantly harm this aspect of our business.
We are subject to potential losses as a result of our clearing and execution activities.
As a clearing member firm providing financing services to certain of our brokerage customers, we are ultimately responsible for their financial performance in connection with various stock, options and futures transactions. Our clearing operations require a commitment of our capital and, despite safeguards implemented by our software, involve risks of losses due to the potential failure of our customers to perform their obligations under these transactions. If our customers default on their obligations, we remain financially liable for such obligations, and although these obligations are collateralized, we are subject to market risk in the liquidation of customer collateral to satisfy those obligations. There can be no assurance that our risk management procedures will be adequate. Any liability arising from clearing operations could have a material adverse effect on our business, financial condition and results of operations.
As a clearing member firm of securities and commodities clearing houses in the U.S. and abroad, we are also exposed to clearing member credit risk. Securities and commodities clearing houses require member firms to deposit cash and/or government securities to a clearing fund. If a clearing member defaults in its obligations to the clearing house in an amount larger than its own margin and clearing fund deposits, the shortfall is absorbed pro rata from the deposits of the other clearing members. Many clearing houses of which we are members also have the authority to assess their members for additional funds if the clearing fund is depleted. A large clearing member default could result in a substantial cost to us if we are required to pay such assessments.
We are exposed to risks associated with our international operations.
During 2014,2017, approximately 27%18% of our net revenues were generated by our operating companies outside the United States.U.S. We are exposed to risks and uncertainties inherent in doing business in international markets, particularly in the heavily regulated brokerage industry. Such risks and uncertainties include political, economic and financial instability; unexpected changes in regulatory requirements, tariffs and other trade barriers; exchange rate fluctuations; applicable currency controls; and difficulties in staffing, including reliance on newly hired local experts, and managing foreign operations. These risks could cause a material adverse effect on our business, financial condition orand results of operations.
We do not have fully redundant systems. System failures could harm our business.
If our systems fail to perform, we could experience unanticipated disruptions in operations, slower response times or decreased customer service and customer satisfaction. Our ability to facilitate transactions successfully and provide high quality customer service also depends on the efficient and uninterrupted operation of our computer and communications hardware and software systems. Our
service has experienced periodic system interruptions, which we believe will continue to occur from time to time. Our systems and operations also are vulnerable to damage or interruption from human error, natural disasters, power loss, telecommunication failures, break-ins, sabotage, computer viruses, intentional acts of vandalism and similar events. While we currently maintain redundant servers to provide limited service during system disruptions, we do not have fully redundant systems, and our formal disaster recovery plan does not include restoration of all services. For example, we have backup facilities at our disaster recovery site that enable us, in the case of complete failure of our main North America data center, to recover and complete all pending transactions, provide customers with access to their accounts to deposit or withdraw money, transfer positions to other brokers and manage their risk by continuing trading through the use of marketable orders. These backup services are currently limited to U.S. markets. We do not currently have separate backup facilities dedicated to our non-U.S. operations. It is our intention to provide for and progressively deploy backup facilities for our global facilities over time. In addition, we do not carry business interruption insurance to compensate for losses that could occur to the extent not required. Any system failure that causes an interruption in our service or decreases the responsiveness of our service could impair our reputation, damage our brand name and materially adversely affect our business, financial condition and results of operations.
Failure of third-party systems on which we rely could adversely affect our business.
We rely on certain third-party computer systems or third-party service providers, including clearing systems, exchange systems, Internet service, communications facilities and other facilities. Any interruption in these third-party services, or deterioration in their performance, could be disruptive to our business. If our arrangement with any third party is terminated, we may not be able to find an alternative source of systems support on a timely basis or on commercially reasonable terms. This could have a material adverse effect on our business, financial condition and results of operations.
Internet-related issues may reduce or slow the growth in the use of our services in the future.
Critical issues concerning the commercial use of the Internet, such as ease of access, security, privacy, reliability, cost, and quality of service, remain unresolved and may adversely impact the growth of Internet use. If Internet usage continues to increase rapidly, the Internet infrastructure may not be able to support the demands placed on it by this growth, and its performance and reliability may decline. Although our larger institutional customers use leased data lines to communicate with us, our ability to increase the speed with which we provide services to consumers and to increase the scope and quality of such services is limited by and dependent upon the speed and reliability of our customers' access to the Internet, which is beyond our control. If periods of decreased performance, outages or delays on the Internet occur frequently or other critical issues concerning the Internet are not resolved, overall Internet usage or usage of our web based products could increase more slowly or decline, which could have a material adverse effect on our business, financial condition and results of operations.
Our computer infrastructure may be vulnerable to security breaches. Any such problems could jeopardize confidential information transmitted over the Internet, cause interruptions in our operations or cause us to have liability to third persons.
Our computer infrastructure is potentially vulnerable to physical or electronic computer break-ins, viruses and similar disruptive problems and security breaches. Any such problems or security breaches could cause us to have liability to one or more third parties, including our customers, and disrupt our operations. A party able to circumvent our security measures could misappropriate proprietary information or customer information, jeopardize the confidential nature of information transmitted over the Internet or cause interruptions in our operations. Concerns over the security of Internet transactions and the privacy of users could also inhibit the growth of the Internet or the electronic brokerage industry in general, particularly as a means of conducting commercial transactions. To the
extent that our activities involve the storage and transmission of proprietary information such as personal financial information, security breaches could expose us to a risk of financial loss, litigation and other liabilities. Our estimated annual losses from reimbursements to customers whose accounts have been negatively affected by unauthorized access have historically been less than $500,000 annually and effectively zero since the widespread introduction of our Secure Transaction Program. Our current insurance program may protect us against some, but not all, of such losses. Any of these events, particularly if they (individually or in the aggregate) result in a loss of confidence in our company or electronic brokerage firms in general, could have a material adverse effect on our business, financial condition and results of operations.
We may not be able to protect our intellectual property rights or may be prevented from using intellectual property necessary for our business.
We rely primarily on trade secret, contract, copyright, patent and trademark laws to protect our proprietary technology. It is possible that third parties may copy or otherwise obtain and use our proprietary technology without authorization or otherwise infringe on our rights. We may also face claims of infringement that could interfere with our ability to use technology that is material to our business operations.
In the future, we may have to rely on litigation to enforce our intellectual property rights, protect our trade secrets, determine the validity and scope of the proprietary rights of others or defend against claims of infringement or invalidity. Any such litigation, whether successful or unsuccessful, could result in substantial costs and the diversion of resources and the attention of management, any of which could negatively affect our business.
We are subject to risks relating to litigation and potential securities laws liability.
We are exposed to substantial risks of liability under federal and state securities laws, other federal and state laws and court decisions, as well as rules and regulations promulgated by the SEC, the CFTC, the Federal Reserve, state securities regulators, self-regulatory organizations and foreign regulatory agencies. We are also subject to the risk of litigation and claims that may be without merit. We could incur significant legal expenses in defending ourselves against and resolving lawsuits or claims. An adverse resolution of any future lawsuits or claims against us could result in a negative perception of our company and cause the market price of our common stock to decline or otherwise have an adverse effect on our business, financial condition and results of operations. See "Legal Proceedings and Regulatory Matters" in Part I Item 3 of this Annual Report on Form 10-K.
We are subject to counterparty risk whereby defaults by parties with whom we do business can have an adverse effect on our business, financial condition and results of operations.
In our electronic brokerage business, our customer margin credit exposure is to a great extent mitigated by our policy of automatically evaluating each account throughout the trading day and closing out positions automatically for accounts that are found to be under-margined. While this methodology is effective in most situations, it may not be effective in situations in which no liquid market exists for the relevant securities or commodities or in which, for any reason, automatic liquidation for certain accounts has been disabled. If no liquid market exists or automatic liquidation has been disabled, we are subject to risks inherent in extending credit, especially during periods of rapidly declining markets. Any loss or expense incurred due to defaults by our customers in failing to repay margin loans or to maintain adequate collateral for these loans would cause harm to our business, financial condition and results of operations.
Any future acquisitions may result in significant transaction expenses, integration and consolidation risks and risks associated with entering new markets, and we may be unable to profitably operate our consolidated company.
Although our growth strategy has not focused historically on acquisitions, we may in the future engage in evaluations of potential acquisitions and new businesses. We may not have the financial resources necessary to consummate any acquisitions in the future or the ability to obtain the necessary funds on satisfactory terms. Any future acquisitions may result in significant transaction expenses and risks associated with entering new markets in addition to integration and consolidation risks. Because acquisitions historically have not been a core part of our growth strategy, we have little experience in successfully utilizing acquisitions. We may not have sufficient management, financial and other resources to integrate any such future acquisitions or to successfully operate new businesses and we may be unable to profitably operate our expanded company.
Because our revenues and profitability depend on trading volume, they are prone to significant fluctuations and are difficult to predict.
Our revenues are dependent on the level of trading activity on securities and derivatives exchanges in the U.S. and abroad. In the past, our revenues and operating results have varied significantly from period to period primarily due to the willingness of market maker competitors to trade more aggressively by decreasing their bid/offer spreads and thereby assuming more risk in order to acquire market share, to movements and trends in the underlying markets, to fluctuations in trading levels and also due to the curtailing of our market making activities. As a result, period to period comparisons of our revenues and operating results may not be meaningful, and future revenues and profitability may be subject to significant fluctuations or declines.
We may incur material trading losses from our market making activities.
A portion of our revenues and operating profits is derived from our trading as principal in our role as a market maker and specialist. We may incur trading losses relating to these activities since each primarily involves the purchase or sale of securities for our own account. In any period, we may incur trading losses in a significant number of securities for a variety of reasons including:
- •
- price changes in securities;
- •
- lack of liquidity in securities in which we have positions; and
- •
- the required performance of our market making and specialist obligations.
These risks may limit or restrict our ability to either resell securities we purchased or to repurchase securities we sold. In addition, we may experience difficulty borrowing securities to make delivery to purchasers to whom we sold short, or lenders from whom we have borrowed. From time to time, we have large position concentrations in securities of a single issuer or issuers engaged in a specific industry or traded in a particular market. Such a concentration could result in higher trading losses than would occur if our positions and activities were less concentrated.
In our role as a market maker, we attempt to derive a profit from the difference between the prices at which we buy and sell, or sell and buy, securities. However, competitive forces often require us to match the quotes other market makers display and to hold varying amounts of securities in inventory. By having to maintain inventory positions, we are subjected to a high degree of risk. We cannot assure you that we will be able to manage such risk successfully or that we will not experience significant losses from such activities, which could have a material adverse effect on our business, financial condition and results of operations.
Reduced spreads in securities pricing, levels of trading activity and trading through market makers and/or specialists could harm our business.
Computer-generated buy/sell programs and other technological advances and regulatory changes in the marketplace may continue to tighten spreads on securities transactions. Tighter spreads and increased competition could make the execution of trades and market making activities less profitable. In addition, alternative trading systems such as ECNs are an alternative for individual and institutional investors, as well as broker-dealers, to avoid directing their trades through market makers, and could result in reduced revenues derived from our market making business.
We may incur losses in our market making activities in the event of failures of our proprietary pricing model.
The success of our market making business is substantially dependent on the accuracy of our proprietary pricing mathematical model, which continuously evaluates and monitors the risks inherent in our portfolio, assimilates market data and reevaluates our outstanding quotes many times per second. Our model is designed to automatically rebalance our positions throughout the trading day to manage risk exposures on our positions in options, futures and the underlying securities. In the event of a flaw in our pricing model and/or a failure in the related software, our pricing model may lead to unexpected and/or unprofitable trades, which may result in material trading losses.
The valuation of the financial instruments we hold may result in large and occasionally anomalous swings in the value of our positions and in our earnings in any period.
The market prices of our long and short positions are reflected on our books at closing prices which are typically the last trade price before the official close of the primary exchange on which each such security trades. Given that we manage a globally integrated portfolio, we may have large and substantially offsetting positions in securities that trade on different exchanges that close at different times of the trading day. As a result, there may be large and occasionally anomalous swings in the value of our positions daily and, accordingly, in our earnings in any period. This is especially true on the last business day of each calendar quarter.
We are exposed to losses due to lack of perfect information.
As market makers, we provide liquidity by buying from sellers and selling to buyers. Quite often, we trade with others who have different information than we do, and as a result, we may accumulate unfavorable positions preceding large price movements in companies. Should the frequency or magnitude of these events increase, our losses will likely increase correspondingly.
Rules governing specialists and designated market makers may require us to make unprofitable trades or prevent us from making profitable trades.
Specialists and designated market makers are granted certain rights and have certain obligations to "make a market" in a particular security. They agree to specific obligations to maintain a fair and orderly market. In acting as a specialist or designated market maker, we are subjected to a high degree of risk by having to support an orderly market. In this role, we may at times be required to make trades that adversely affect our profitability. In addition, we may at times be unable to trade for our own account in circumstances in which it may be to our advantage to trade, and we may be obligated to act as a principal when buyers or sellers outnumber each other. In those instances, we may take a position counter to the market, buying or selling securities to support an orderly market. Additionally, the rules of the markets which govern our activities as a specialist or designated market maker are subject to change. If these rules are made more stringent, our trading revenues and profits as specialist or designated market maker could be adversely affected.
We face competition in our market making activities.
In our market making activities, we compete with other firms based on our ability to provide liquidity at competitive prices and to attract order flow. These firms include registered market makers as well as high frequency trading firms ("HFTs")HFTs that act as market makers. Both types of competitors
range from sole proprietors with very limited resources to a few highly sophisticated groups which have substantially greater financial and other resources, including research and development personnel, than we do. These larger and better capitalized competitors may be better able to respond to changes in the market making industry, to compete for skilled professionals, to finance acquisitions, to fund internal growth and to compete for market share generally. HFTs that are not registered market makers have certain advantages over registered market making firms that may allow them to bypass regulatory restrictions and trade more quickly and cheaply than registered market makers at some exchanges. We may not be able to compete effectively against HFTs or market makers with greater financial resources, and our failure to do so could materially and adversely affect our business, financial condition and results of operations. As in the past, we may in the future face enhanced competition, resulting in narrowing bid/offer spreads in the marketplace that may adversely impact our financial performance. This is especially likely if HFTs continue to receive advantages in capturing order flow or if others can acquire systems that enable them to predict markets or process trades more efficiently than we can.
Our direct market access clearing and non-clearing brokerage operations face intense competition.
With respect to our direct market access brokerage business, the market for electronic and interactive bidding, offering and trading services in connection with equities, options and futures is relatively new, rapidly evolving and intensely competitive. We expect competition to continue and intensify in the future. Our current and potential future competition principally comes from five categories of competitors:
•prime brokers who, in an effort to satisfy the demands of their customers for hands-on electronic trading facilities, universal access to markets, smart routing, better trading tools, lower commissions and financing rates, have embarked upon building such facilities and product enhancements;•direct market access and online options and futures firms;•direct market access and online equity brokers;•software development firms and vendors who create global trading networks and analytical tools and make them available to brokers; and•traditional brokers.
In addition, we compete with financial institutions, mutual fund sponsors and other organizations, many of which provide online, direct market access or other investing services. A number of brokers provide our technology and execution services to their customers, and these brokers will become our competitors if they develop their own technology. Some of our competitors in this area have greater name recognition, longer operating histories and significantly greater financial, technical, marketing and other resources than we have and offer a wider range of services and financial products than we do. Some of our competitors may also have an ability to charge lower commissions. We cannot assure you that we will be able to compete effectively or efficiently with current or future competitors. These increasing levels of competition in the online trading industry could significantly harm this aspect of our business.
We are subject to risks relating to litigation and potential securities laws liability.
We are exposed to substantial risks of liability under federal and state securities laws, other federal and state laws and court decisions, as well as rules and regulations promulgated by the SEC, the CFTC, the Federal Reserve, state securities regulators, the self-regulatory organizations and foreign regulatory agencies. We are also subject to the risk of litigation and claims that may be without merit. We could incur significant legal expenses in defending ourselves against and resolving lawsuits or claims. An adverse resolution of any future lawsuits or claims against us could result in a negative perception of
our company and cause the market price of our common stock to decline or otherwise have an adverse effect on our business, financial condition and/or operating results. See Part I, Item 3, "Legal Proceedings and Regulatory Matters."
Any future acquisitions may result in significant transaction expenses, integration and consolidation risks and risks associated with entering new markets, and we may be unable to profitably operate our consolidated company.
Although our growth strategy has not focused historically on acquisitions, we may in the future engage in evaluations of potential acquisitions and new businesses. We may not have the financial resources necessary to consummate any acquisitions in the future or the ability to obtain the necessary funds on satisfactory terms. Any future acquisitions may result in significant transaction expenses and risks associated with entering new markets in addition to integration and consolidation risks. Because acquisitions historically have not been a core part of our growth strategy, we have no material experience in successfully utilizing acquisitions. We may not have sufficient management, financial and other resources to integrate any such future acquisitions or to successfully operate new businesses and we may be unable to profitably operate our expanded company.
Internet-related issues may reduce or slow the growth in the use of our services in the future.
Critical issues concerning the commercial use of the Internet, such as ease of access, security, privacy, reliability, cost, and quality of service, remain unresolved and may adversely impact the growth of Internet use. If Internet usage continues to increase rapidly, the Internet infrastructure may not be able to support the demands placed on it by this growth, and its performance and reliability may decline. Although our larger institutional customers use leased data lines to communicate with us, our ability to increase the speed with which we provide services to consumers and to increase the scope and quality of such services is limited by and dependent upon the speed and reliability of our customers' access to the Internet, which is beyond our control. If periods of decreased performance, outages or delays on the Internet occur frequently or other critical issues concerning the Internet are not resolved, overall Internet usage or usage of our web based products could increase more slowly or decline, which would cause our business, results of operations and financial condition to be materially and adversely affected.
Our computer infrastructure may be vulnerable to security breaches. Any such problems could jeopardize confidential information transmitted over the Internet, cause interruptions in our operations or cause us to have liability to third persons.
Our computer infrastructure is potentially vulnerable to physical or electronic computer break-ins, viruses and similar disruptive problems and security breaches. Any such problems or security breaches could cause us to have liability to one or more third parties, including our customers, and disrupt our operations. A party able to circumvent our security measures could misappropriate proprietary information or customer information, jeopardize the confidential nature of information transmitted over the Internet or cause interruptions in our operations. Concerns over the security of Internet transactions and the privacy of users could also inhibit the growth of the Internet or the electronic brokerage industry in general, particularly as a means of conducting commercial transactions. To the extent that our activities involve the storage and transmission of proprietary information such as personal financial information, security breaches could expose us to a risk of financial loss, litigation and other liabilities. Our estimated annual losses from reimbursements to customers whose accounts have been negatively affected by unauthorized access have historically been less than $500,000 annually, but instances of unauthorized access of customer accounts have been increasing recently on an industry-wide basis. Our current insurance program may protect us against some, but not all, of such losses. Any of these events, particularly if they (individually or in the aggregate) result in a loss of
confidence in our company or electronic brokerage firms in general, could have a material adverse effect on our business, results of operations and financial condition.
We may not be able to protect our intellectual property rights or may be prevented from using intellectual property necessary for our business.
We rely primarily on trade secret, contract, copyright, patent and trademark laws to protect our proprietary technology. It is possible that third parties may copy or otherwise obtain and use our proprietary technology without authorization or otherwise infringe on our rights. We may also face claims of infringement that could interfere with our ability to use technology that is material to our business operations.
In the future, we may have to rely on litigation to enforce our intellectual property rights, protect our trade secrets, determine the validity and scope of the proprietary rights of others or defend against claims of infringement or invalidity. Any such litigation, whether successful or unsuccessful, could result in substantial costs and the diversion of resources and the attention of management, any of which could negatively affect our business.
Our future success will depend on our response to the demand for new services, products and technologies.
The demand for market making services, particularly services that rely on electronic communications gateways, is characterized by:
•rapid technological change;•changing customer demands;•the need to enhance existing services and products or introduce new services and products; and•evolving industry standards.
New services, products and technologies may render our existing services, products and technologies less competitive. Our future success will depend, in part, on our ability to respond to the demand for new services, products and technologies on a timely and cost-effective basis and to adapt to technological advancements and changing standards to address the increasingly sophisticated requirements and varied needs of our customers and prospective customers. We cannot assure you that we will be successful in developing, introducing or marketing new services, products and technologies. In addition, we may experience difficulties that could delay or prevent the successful development, introduction or marketing of these services and products, and our new service and product enhancements may not achieve market acceptance. Any failure on our part to anticipate or respond adequately to technological advancements, customer requirements or changing industry standards, or any significant delays in the development, introduction or availability of new services, products or enhancements could have a material adverse effect on our business, financial condition and operating results.
Market making in forex-based products entails significant risk, and unforeseen events in such business could have an adverse effect on our business, financial condition and results of operation.
Our activities in market making for forex-based products include the trading of cash in foreign currencies with banks and exchange-listed futures, options on futures, options on cash deposits and currency-based ETFs. All of the risks that pertain to our market making activities in equity-based products also apply to our forex-based market making. In addition, we have comparatively less experience in the forex markets and even though we have expanded this activity slowly, any kind of unexpected event can occur that can result in great financial loss.
We are subject to counterparty risk whereby defaults by parties with whom we do business can have an adverse effect on our business, financial condition and/or operating results.
In our electronic brokerage business, our customer margin credit exposure is to a great extent mitigated by our policy of automatically evaluating each account throughout the trading day and closing out positions automatically for accounts that are found to be under-margined. While this methodology is effective in most situations, it may not be effective in situations in which no liquid market exists for the relevant securities or commodities or in which, for any reason, automatic liquidation for certain accounts has been disabled. If no liquid market exists or automatic liquidation has been disabled, we are subject to risks inherent in extending credit, especially during periods of rapidly declining markets. Any loss or expense incurred due to defaults by our customers in failing to repay margin loans or to maintain adequate collateral for these loans would cause harm to our business.
ITEM 1B. UNRESOLVED STAFF COMMENTS
None.
Our headquarters are located in Greenwich, Connecticut. We also lease facilities in 1419 other locations throughout parts of the world where we conduct our operations as set forth below. Unless otherwise indicated, all properties are used by both our market making and electronic brokerage segments. We believe our present facilities, together with our current options to extend lease terms, are adequate for our current needs.
The following table sets forth certain information with respect to our leased facilities:
Location | Space (sq. feet) | Expiration | Principal Usage | Space (sq. feet) | Expiration | Principal Usage | ||||||||||
|---|---|---|---|---|---|---|---|---|---|---|---|---|---|---|---|---|
North America | ||||||||||||||||
Greenwich, CT | 81,266 | 2019 | Headquarters and data center | 162,273 | 2030 | Headquarters and data center | ||||||||||
Greenwich, CT | 37,404 | 2019 | Office space | 42,196 | 2019 | Office space | ||||||||||
Jersey City, NJ | 5,869 | 2018 | Office space | |||||||||||||
Chicago, IL | 61,492 | 2017 | Office space and data center | 48,275 | 2026 | Office space | ||||||||||
Washington, D.C. | 1,035 | 2015 | Office space | 8,884 | 2024 | Office space | ||||||||||
West Palm Beach, FL | 8,509 | 2027 | Office space | |||||||||||||
Montreal, Canada | 4,566 | 2019 | Office space | 4,566 | 2019 | Office space | ||||||||||
Vancouver, Canada | 2,737 | 2021 | Office space | |||||||||||||
Boston, MA | 2,348 | 2021 | Office space | |||||||||||||
San Francisco, CA | 833 | 2019 | Office space | |||||||||||||
Secaucus, NJ | 785 | 2022 | Office space | |||||||||||||
Europe |
| |||||||||||||||
Zug, Switzerland | 19,246 | 2018 | Office space and data center | |||||||||||||
Zug, Switzerland | 4,435 | 2021 | Office space | |||||||||||||
London, United Kingdom | 2,283 | 2015 | Office space | 12,969 | 2023 | Office space | ||||||||||
Zug, Switzerland | 23,672 | 2017 | Office space and data center | |||||||||||||
Vaduz, Liechtenstein | 2,370 | 2017 | Office space | |||||||||||||
Sydney, Australia | 2,649 | 2016 | Office space | |||||||||||||
Hong Kong | 9,336 | 2018 | Office space and data center | |||||||||||||
Tallinn, Estonia | 7,875 | 2023 | Office space | |||||||||||||
Budapest, Hungary | 4,297 | 2018 | Office space | 6,412 | 2018 | Office space | ||||||||||
St. Petersburg, Russia | 2,742 | 2015 | Office space | 2,742 | 2018 | Office space | ||||||||||
Tallinn, Estonia | 4,844 | 2016 | Office space | |||||||||||||
Vaduz, Liechtenstein | 2,370 | 2018 | Data center | |||||||||||||
Asia—Pacific |
| |||||||||||||||
Mumbai, India | 5,700 | 2017 | Office space | 12,061 | 2020 | Office space | ||||||||||
Mumbai, India | 11,229 | 2022 | Office space | |||||||||||||
Hong Kong | 8,872 | 2018 | Office space | |||||||||||||
Hong Kong | 6,739 | 2019 | Office space | |||||||||||||
Shanghai, China | 3,635 | 2021 | Office space | |||||||||||||
Sydney, Australia | 3,400 | 2023 | Office space | |||||||||||||
Tokyo, Japan | 2,161 | 2016 | Office space | 2,161 | 2019 | Office space | ||||||||||
Shanghai, China | 3,635 | 2018 | Office space | |||||||||||||
ITEM 3. LEGAL PROCEEDINGS AND REGULATORY MATTERS
The securities and commodities industry is highly regulated and many aspects of our business involve substantial risk of liability. In recent years, there has been an increasing incidence of litigation involving the brokerage industry, including class action suits that generally seek substantial damages, including in some cases punitive damages. Compliance and trading problems that are reported to federal, state and provincial regulators, exchanges or other self-regulatory organizations by dissatisfied customers are investigated by such regulatory bodies, and, if pursued by such regulatory body or such customers, may rise to the level of arbitration or disciplinary action. We are also subject to periodic regulatory audits and inspections.
Like other brokerage firms, we have been named as a defendant in lawsuits and from time to time we have been threatened with, or named as a defendant in, arbitrations and administrative proceedings.
The following contains information regarding potentially material pending litigation and pending regulatory inquiries. We may in the future become involved in additional litigation or regulatory proceedings in the ordinary course of our business, including litigation or regulatory proceedings that could be material to our business.
Trading Technologies Matter
On February 3, 2010, Trading Technologies International, Inc. ("Trading Technologies") filed a complaint in the United StatesU.S. District Court for the Northern District of Illinois, Eastern Division, against Interactive Brokers Group,IBG, Inc., IBG LLC, Holdings, and Interactive BrokersIB LLC. Thereafter, Trading Technologies dismissed Interactive Brokers Group,IBG, Inc. and Holdings from the case, leaving
only IBG LLC and Interactive BrokersIB LLC as defendants ("Defendants"). The operative complaint, as amended, alleges that the Defendants have infringed and continue to infringe twelve U.S. patents held by Trading Technologies. Trading Technologies is seeking, among other things, unspecified damages and injunctive relief ("the Litigation").
The Defendants filed an answer to Trading Technologies' amended complaint, as well as related counterclaims. The defendantsDefendants deny Trading Technologies' claims, assert that the asserted patents are not infringed and are invalid, and assert several other defenses as well.
Trading Technologies also filed patent infringement lawsuits against approximately a dozen other companies in the same court, many of which are still pending.court. The Litigation was consolidated with the other lawsuits filed by Trading Technologies.
On June 2, 2014, theThe Defendants and/or certain codefendants filed a motion to stay the Litigation pursuant to Section 18(b) of the America Invents Act in light of petitions for Covered Business Method ("CBM") Review on five asserted patents filed with the United States Patent and Trademark Office ("USPTO") by other defendants in the consolidated cases. Some of the other defendants have similarly requested a stay in light of such petitions. On December 2, 2014, the USPTO issued decisions instituting for Covered Business Method Review ("CBM ReviewReview") on four of the asserted patents for which CBM petitions were filed, declining to institute CBM Review on one of the asserted patents. The District Court hasgranted the Defendants' motion to stay the Litigation pending the CBM Reviews. The USPTO Patent Trial and Appeal Board found ten of the twelve asserted patents to be not yet ruledpatentable and two patents to be patentable. The Defendants have filed appeals on the motionsclaims that were held to stay.be patentable.
The caseIt is in the early stages and discovery has yet to begin. While it is too earlydifficult to predict the outcome of the matter, we believe we havehowever, the Company believes it has meritorious defenses to the allegations made in the complaint and intendintends to defend ourselvesitself vigorously against them. However, litigation is inherently uncertain and there can be no guarantee that the Company will prevail or that the litigationLitigation can be settled on favorable terms.
Class Action Matter
On December 18, 2015, a former individual customer filed a purported class action complaint against IB LLC, IBG, Inc., and Thomas Frank, PhD, the Company's Executive Vice President and Chief Information Officer, in the U.S. District Court for the District of Connecticut. The complaint alleges that the former customer and members of the purported class of IB LLC's customers were harmed by alleged "flaws" in the computerized system used by the Company to close out (i.e., liquidate) positions in customer brokerage accounts that have margin deficiencies. The complaint seeks, among other things, undefined compensatory damages and declaratory and injunctive relief.
On February 19, 2016, the Company filed a motion to dismiss the class action complaint. On September 28, 2016, the Court issued an order granting the Company's motion to dismiss and dismissing the complaint in its entirety, and without providing plaintiff leave to amend. On October 5, 2016, the Court entered judgment in the Company's favor. On October 12, 2016, plaintiff filed motions for leave to file an amended complaint and to vacate or amend judgment. On November 14, 2016, plaintiff also filed a motion to disqualify the district judge. The Company opposed all three motions. In memoranda of decision dated August 29, 2017 and September 5, 2017, the Court denied the motions. On September 28, 2017, plaintiff appealed the order of dismissal and subsequent judgment to the United States Court of Appeals for the Second Circuit. On January 9, 2018, the plaintiff filed his appellate brief. The opposition brief is currently due on April 10, 2018. We believe that the appeal, like the original complaint, lacks merit. Further, even if the Court's dismissal were to be overturned on
appeal, we do not believe that a purported class action is appropriate given the great differences in portfolios, markets and many other circumstances surrounding the liquidation of any particular customer's margin-deficient account. IB LLC and the related defendants intend to continue to defend themselves vigorously against the case and, consistent with past practice in connection with this type of unwarranted action, any potential claims for counsel fees and expenses incurred in defending the case shall be fully pursued against the plaintiff.
Pending Regulatory Inquiries
IB'sOur businesses are heavily regulated by state, federal and foreign regulatory agencies as well as numerous exchanges and self-regulatory organizations ("SRO"). IB's variousorganizations. Most of our companies are regulated under some or all of the following: state securities laws, U.S. and foreign securities, commodities and financial services laws and under the rules of the more than 25120 exchanges, market centers and SROs.self-regulatory organizations of which one or more of our companies may be members. In the current era of dramatically heightened regulatory scrutiny of financial institutions, IB haswe have incurred sharply increased compliance costs, along with the industry as a whole. Increased regulation also creates increased barriers to entry, however, and IB haswe have built human and automated infrastructure to handle increased regulatory scrutiny, which provides IB anus with a possible advantage over potential newcomers to the business.
IB receivesWe receive hundreds or thousands of regulatory inquiries each year in addition to being subject to frequent regulatory examinations. The great majority of these inquiries do not lead to fines or any further action against IB.us. Most often, regulators do not inform IBus as to when and if an inquiry has been concluded. IB isWe are currently the subject of regulatory inquiries regarding topics such as order audit trail reporting, trade reporting, best execution, short sales, margin lending, anti-money laundering, technology development practices, business continuity planning and other topics of recent regulatory interest. IB isWe are unaware of any specific regulatory matter that, itself, or together with similar regulatory matters on the same specific topic, would have a material impact on IB'sour business, financial condition.condition and results of operations. Nonetheless, in the current climate, we expect to pay significant and increasing regulatory fines on various topics on an ongoing basis, as other regulated financial services businesses do. The amount of any fines, and when and if they will be incurred, is impossible to predict given the nature of the regulatory process.
ITEM 4. MINE SAFETY DISCLOSURES
Not applicable.
ITEM 5. MARKET FOR REGISTRANT'S COMMON EQUITY; RELATED STOCKHOLDER MATTERS AND ISSUER PURCHASES OF EQUITY SECURITIES
Common Stock Information
The following table shows the high and low sale prices for the periods indicated for the Company'sour common stock, as reported by NASDAQ.NASDAQ :
| | Sales Price | Sales Price | ||||||||||||
|---|---|---|---|---|---|---|---|---|---|---|---|---|---|---|
| | High | Low | High | Low | ||||||||||
| | (in dollars) | (in dollars) | ||||||||||||
2013 | ||||||||||||||
2016 | ||||||||||||||
First Quarter | $ | 15.14 | $ | 13.61 | $ | 43.14 | $ | 29.50 | ||||||
Second Quarter | $ | 16.60 | $ | 14.07 | $ | 41.40 | $ | 33.75 | ||||||
Third Quarter | $ | 18.89 | $ | 16.16 | $ | 37.39 | $ | 33.66 | ||||||
Fourth Quarter | $ | 24.98 | $ | 18.91 | $ | 39.68 | $ | 31.97 | ||||||
2014 | ||||||||||||||
2017 | ||||||||||||||
First Quarter | $ | 20.73 | $ | 21.67 | $ | 39.51 | $ | 34.11 | ||||||
Second Quarter | $ | 24.33 | $ | 21.15 | $ | 38.23 | $ | 33.01 | ||||||
Third Quarter | $ | 26.21 | $ | 22.12 | $ | 45.08 | $ | 36.23 | ||||||
Fourth Quarter | $ | 29.57 | $ | 23.59 | $ | 62.33 | $ | 44.80 | ||||||
2015 | ||||||||||||||
Year-to-date February 24, 2015 | $ | 32.63 | $ | 28.09 | ||||||||||
The closing price of our common stock on February 24, 2015,22, 2018, as reported by NASDAQ, was $32.13$67.52 per share.
Holders
On February 20, 2015,2018, there were foursix holders of record, which does not reflect those shares held beneficially or those shares held in "street" name. Accordingly, the number of beneficial owners of our common stock exceeds this number.
Dividends and Other Restrictions
In December 2010, the Company effected a series of dividend payments, including a dividend of $1.79 per share, which was paid to the Company's common shareholders. In December 2012, the Company paid a special dividend of $1.00 per share to the Company's common shareholders. During the second quarter of 2011, the Companywe declared and paid a cash dividend of $0.10 per share and hashave continued this quarterly dividend policy through the current fiscal year end and into the first quarter of 2015.2018. We currently intend to pay quarterly dividends of $0.10 per share to our common stockholders for the foreseeable future.
Stockholder Return Performance Graph
The following graph compares cumulative total stockholder return on our common stock, the S&P 500 Index and the NASDAQ Financial-100 Index from December 31, 20092012 to December 31, 2014.29, 2017. The comparison assumes $100 was invested on December 31, 20092012 in our common stock and each of the foregoing indices and assumes reinvestment of dividends before consideration of income taxes.
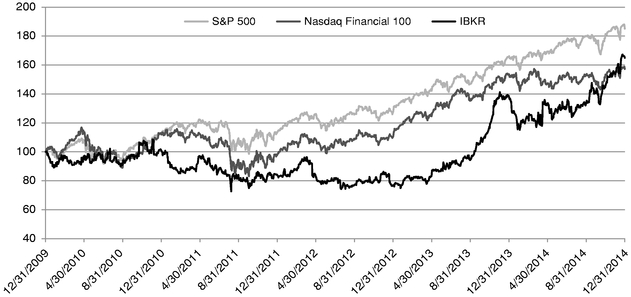
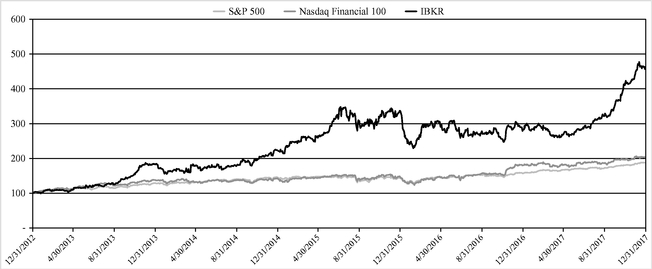
- (1)
- The NASDAQ Financial-100 Index includes 100 of the largest domestic and international financial securities listed on The NASDAQ Stock Market based on market capitalization. They include companies classified according to the Industry Classification Benchmark as Financials, which are included within the NASDAQ Bank, NASDAQ Insurance, and NASDAQ Other Finance Indexes.
- (2)
- The S&P 500 Index includes 500 large cap common stocks actively traded in the
United States.U.S. The stocks included in the S&P 500 are those of large publicly held companies that trade on either of the two largest American stock markets, the New York Stock Exchange and NASDAQ.
The stock performance depicted in the graph above is not to be relied upon as indicative of future performance. The stock performance graph shall not be deemed to be incorporated by reference into any of our filings under the Securities Act or the Exchange Act, except to the extent that we specifically incorporate the same by reference, nor shall it be deemed to be "soliciting material" or to be "filed" with the SEC or subject to Regulations 14A or 14C or to the liabilities of Section 18 of the Exchange Act.
Use of Proceeds from Member Redemption
Purchases of IBG LLC membership interests, held by Holdings, by the Company are governed by the Exchange Agreement, a copy of which was filed as an exhibit to our Quarterly Report on Form 10-Q for the quarter ended September 30, 2009 and filed with the SEC on November 9, 2009. The Exchange Agreement, as amended June 6, 2012 and July 23, 2015, provides that the Company may facilitate the redemption by Holdings of interests held by its members through the issuance of shares of common stock through a public offering in exchange for the interests in IBG LLC being redeemed by Holdings. The June 6, 2012 amendment (the "Amendment"), which was filed as an exhibit to our Form 8-K filed with the SEC on June 6, 2012, eliminated from the Exchange Agreement an alternative funding method, which provided that upon approval by the board of directors and by agreement of the Company, IBG LLC and Holdings, redemptions could be made in cash.
At the time of the Company's IPO in 2007, three hundred sixty (360) million shares of authorized common stock were reserved for future sales and redemptions.
On an annual basis, each holder of a membership interest may request that Holdings redeem the liquefiable portion of that holder's interest be redeemed by Holdings.interest. We expect Holdings to use the net proceeds it receives from such sales to redeem an identical number of Holdings membership interests from the requesting holders.
At the consenttime of the Company's IPO in 2007, three hundred sixty (360) million shares of authorized common stock were reserved for future sales and redemptions. From 2008 through 2016, Holdings and the Company (on its own behalf and acting as the sole managing member of IBG LLC),redeemed 17,656,754 IBG LLC agreed in October 2014 to redeem certain membership interests from Holdingsshares with an approximate total value of $476 million, which redemptions were funded using cash on hand at IBG LLC and through the saleissuances of common stock and the distribution of the proceeds of such sale to the beneficial owners of such membership interests.stock.
On October 24, 2014,July 28, 2017, the Company issued 1,358,4781,214,860 shares of Class A common stock (with a fair value of $35.2$49 million) to Holdings, for sale for the benefit of, certain of its members in exchange for membership interests in IBG LLC equal in number to such number of shares of common stock issued by the Company. It is intended that theThe acquired shares will bewere sold for the benefit of certain of the members of Holdings who have elected to redeem a portion of their Holdings membership interests. The shares to be sold are sold in open market transactions pursuant to a Rule 10b5-1 trading plan (the "Plan").
Certain officers and directors are among the members of Holdings who have elected to redeem a portion of their Holdings membership interests and therefore have an interest in open market transactions pursuant to one or more Rule 10b5-1 trading plans (collectively, the proceeds of sale of 225,095 shares of the Class A common stock to be sold"Plans"). All sales made pursuant to the Plan. In addition, certain currentPlans are disclosed publicly in accordance with applicable securities laws, rules and former employees ofregulations through appropriate filings with the Company and its subsidiaries also elected the redemption of a portion of their membership interests in Holdings and therefore have an interest in the balance of the shares to be sold under the Plan and/or distributed by Holdings. Neither Mr. Thomas Peterffy nor his affiliates have elected to redeem any of their Holdings membership interests and therefore have no interest in the proceeds of sale or distribution of the shares of Class A common stock acquired by Holdings on November October 24, 2014.SEC, as applicable.
As a consequence of this transaction, IBG, Inc.'s interest in IBG LLC increased to approximately 14.5%17.4%, with Holdings owning the remaining 85.5%82.6%. The redemptions also resulted in an increase in the Holdings interest held by Mr. Thomas Peterffy and his affiliates from approximately 87.6%89.1% to approximately 88.0%89.2%.
On October 13, 2015, the Company filed a Post-Effective Amendment to multiple Registration Statements filed under the Securities Act of 1933, as amended (the "Securities Act") on Form S-8 that registered shares of the Company's Class A common stock, $0.01 par value, for issuance under the Company's 2007 Stock Incentive Plan (the "Plan"): Registration No. 333-142686, filed on May 7, 2007; Registration No. 333-174913, filed on June 15, 2011; and Registration No. 333-203358, filed on April 10, 2015.
The redemptionsPlan provides employees with two options to pay for their withholding tax obligations, which become due when restricted stock units vest into shares: either (1) reimburse the Company via cash payment, or (2) elect to have the Selling Stockholder withhold a portion of the vesting shares. In the case of employees who elect to have the IBG LLC withhold shares to cover their tax obligations, those shares are transferred to IBG LLC, which in turn, sells those shares in open market transactions to recover the amount paid to the tax authorities on the employees' behalf. For the year ended December 31, 2017 the Company sold 596,135 shares of its Class A common stock withheld from employees (with a fair value of $21 million) in open market transactions. The proceeds were completed during October, 2014.used to reimburse the Company for withholding taxes paid by the Company on the employees' behalf.
As per General Instruction C of Form S-8, the sale of the shares described above constitutes a resale or reoffer of the Company's Class A common stock. The Post-Effective Amendment contains a reoffer prospectus that registers 6,400,000 shares of the Company's Class A common stock which represents the Company's estimate of shares that will be withheld from employees related to the vesting of Plan shares over the next nine years based on current tax rates and historical employee elections. The Company has re-issued 1,517,011 shares under this reoffer prospectus supplement. The reoffer prospectus allows for future sales by IBG LLC, on a continuous or delayed basis, to the public without restriction.
Securities Authorized for Issuance under Equity Compensation Plans
The following table provides information about shares of common stock available for future awards under all of the Company's equity compensation plans as of December 31, 2014.2017. The Company has not made grants of common stock outside of its equity compensation plans:plans.
| | Number of securities to be issued upon exercise of outstanding options, warrants and rights | Weighted-average exercise price of outstanding options warrants and rights | Number of securities remaining available for future equity compensation plans(1) | |||||||
|---|---|---|---|---|---|---|---|---|---|---|
Equity compensation plans approved by security holders | N/A | N/A | ||||||||
Equity compensation plans not approved by security holders | N/A | N/A | ||||||||
| | | | | | | | | | | |
Total | — | — | ||||||||
| | | | | | | | | | | |
| | | | | | | | | | | |
| | | | | | | | | | | |
- (1)
- In 2017, the Company amended the 2007 Stock Incentive Plan (the "Stock Incentive Plan") to extend its term for a ten-year period through April, 24, 2027, pending stockholders' approval at the Company's 2018 Annual Meeting. Amount represents
sharesrestricted stock units available for future issuance of grants under the Company's2007Stock Incentive Plan,("SIP"). The amount excludes shares purchased from employees to satisfy their tax withholding obligations for vested shares, which are heldastreasury stock. On April 24, 2014, the Company's stockholders approved an additional 10,000,000 shares to be distributed under the SIP. This increased the total number of shares available to be distributed under this plan to 30,000,000 shares, from 20,000,000 shares. There are no shares available for future issuance of grants under the 2007 ROI Unit Stock Plan; all shares under this plan have been granted.amended.
ITEM 6. SELECTED FINANCIAL DATA
The following tables set forth selected historical consolidated financial and other data of IBG, Inc.the Company. They are presented for the years ended, and as of, December 31, 2010, 2011, 2012, 2013, 2014, 2015, 2016, and 2014.2017.
| | Year Ended December 31, | |||||||||||||||
|---|---|---|---|---|---|---|---|---|---|---|---|---|---|---|---|---|
| | 2017 | 2016 | 2015 | 2014 | 2013 | |||||||||||
| | (in millions, except share and per share amounts) | |||||||||||||||
Consolidated Statement of Comprehensive Income Data | ||||||||||||||||
Revenues | ||||||||||||||||
Trading gains | $ | 40 | $ | 163 | $ | 269 | $ | 261 | $ | 331 | ||||||
Commissions | 647 | 612 | 617 | 549 | 502 | |||||||||||
Interest income | 908 | 606 | 492 | 416 | 304 | |||||||||||
Other (loss) income(1) | 332 | 94 | (122 | ) | (111 | ) | (9 | ) | ||||||||
| | | | | | | | | | | | | | | | | |
Total revenues | 1,927 | 1,475 | 1,256 | 1,115 | 1,128 | |||||||||||
Interest expense | 225 | 79 | 67 | 72 | 52 | |||||||||||
| | | | | | | | | | | | | | | | | |
Total net revenues | 1,702 | 1,396 | 1,189 | 1,043 | 1,076 | |||||||||||
| | | | | | | | | | | | | | | | | |
Non-interest expenses | ||||||||||||||||
Execution and clearing | 241 | 244 | 231 | 212 | 243 | |||||||||||
Fixed expenses | 410 | 385 | 354 | 322 | 315 | |||||||||||
Customer bad debt(2) | 2 | 6 | 146 | 3 | 67 | |||||||||||
| | | | | | | | | | | | | | | | | |
Total non-interest expenses | 653 | 635 | 731 | 537 | 625 | |||||||||||
| | | | | | | | | | | | | | | | | |
Income before income taxes | 1,049 | 761 | 458 | 506 | 451 | |||||||||||
Income tax expense(1) | 256 | 62 | 43 | 47 | 33 | |||||||||||
| | | | | | | | | | | | | | | | | |
Net income | 793 | 699 | 415 | 459 | 418 | |||||||||||
Less net income attributable to noncontrolling interests | 717 | 615 | 366 | 414 | 381 | |||||||||||
| | | | | | | | | | | | | | | | | |
Net income available for common stockholders | $ | 76 | $ | 84 | $ | 49 | $ | 45 | $ | 37 | ||||||
| | | | | | | | | | | | | | | | | |
| | | | | | | | | | | | | | | | | |
| | | | | | | | | | | | | | | | | |
Earnings per share | ||||||||||||||||
Basic | $ | 1.09 | $ | 1.28 | $ | 0.80 | $ | 0.79 | $ | 0.74 | ||||||
| | | | | | | | | | | | | | | | | |
| | | | | | | | | | | | | | | | | |
| | | | | | | | | | | | | | | | | |
Diluted | $ | 1.07 | $ | 1.25 | $ | 0.78 | $ | 0.77 | $ | 0.73 | ||||||
| | | | | | | | | | | | | | | | | |
| | | | | | | | | | | | | | | | | |
| | | | | | | | | | | | | | | | | |
Comprehensive income available for common stockholders | $ | 87 | $ | 80 | $ | 39 | $ | 30 | $ | 34 | ||||||
| | | | | | | | | | | | | | | | | |
| | | | | | | | | | | | | | | | | |
| | | | | | | | | | | | | | | | | |
Comprehensive income attributable to noncontrolling interests | $ | 771 | $ | 594 | $ | 313 | $ | 322 | $ | 356 | ||||||
| | | | | | | | | | | | | | | | | |
| | | | | | | | | | | | | | | | | |
| | | | | | | | | | | | | | | | | |
Comprehensive earnings per share | ||||||||||||||||
Basic | $ | 1.24 | $ | 1.21 | $ | 0.64 | $ | 0.52 | $ | 0.69 | ||||||
| | | | | | | | | | | | | | | | | |
| | | | | | | | | | | | | | | | | |
| | | | | | | | | | | | | | | | | |
Diluted | $ | 1.22 | $ | 1.19 | $ | 0.62 | $ | 0.51 | $ | 0.67 | ||||||
| | | | | | | | | | | | | | | | | |
| | | | | | | | | | | | | | | | | |
| | | | | | | | | | | | | | | | | |
Weighted average common shares outstanding | ||||||||||||||||
Basic | 69,926,933 | 66,013,247 | 61,043,071 | 56,492,381 | 49,742,428 | |||||||||||
| | | | | | | | | | | | | | | | | |
| | | | | | | | | | | | | | | | | |
| | | | | | | | | | | | | | | | | |
Diluted | 70,904,921 | 67,299,413 | 62,509,796 | 57,709,668 | 50,924,736 | |||||||||||
| | | | | | | | | | | | | | | | | |
| | | | | | | | | | | | | | | | | |
| | | | | | | | | | | | | | | | | |
- (1)
- The
following selected historical consolidated financialresults for 2017 include the impact of the Tax Cuts andother data should be readJob Act ("Tax Act") which was enacted on December 22, 2017. The Tax Act resulted inconjunctionadditional income tax expense of $62 million for the one-time transition tax on deemed repatriation of earnings of some of our foreign subsidiaries and $115 million from the remeasurement of the Company's deferred tax assets at the reduced corporate income tax rate of 21%. Other income includes a $93 million gain from the remeasurement of Tax Receivable Agreement liability, payable to Holdings, which is associated with"Management's DiscussionandAnalysisoffsetting to the expense on remeasurement ofFinancial Conditiondeferred tax assets. See Note 4 andResults of Operations," andNote 10 to the audited consolidated financial statements,and related notes included elsewhere in this Annual Report on Form 10-K.Year Ended December 31, 2014 2013 2012 2011 2010 (in millions except share and per share data) Consolidated Statement of Comprehensive Income Data
Revenues
Trading gains(1)
$ 261.2 $ 331.2 $ 466.0 $ 633.7 $ 554.6 Commissions and execution fees
548.8 502.1 412.6 456.2 386.8 Interest income(1)
416.2 303.4 270.3 280.1 172.5 Other (loss) income(1)
(110.7 ) (8.8 ) 43.6 74.6 (125.6 ) Total revenues
1,115.5 1,127.9 1,192.5 1,444.6 988.3 Interest expense
72.2 51.7 62.0 86.3 66.2 Total net revenues
1,043.3 1,076.2 1,130.5 1,358.3 922.1 Non-interest expenses
Execution and clearing
211.5 242.5 251.0 281.3 272.6 Employee compensation and benefits
204.8 205.3 244.5 216.3 203.6 Occupancy, depreciation and amortization
39.4 38.9 38.8 37.1 37.3 Communications
24.2 23.1 23.3 23.6 23.5 General and administrative(2)
57.3 115.1 45.9 58.9 47.7 Total non-interest expenses
537.2 624.9 603.5 617.2 584.7 Income before income taxes
506.1 451.3 527.0 741.1 337.4 Income tax expense
47.3 33.7 30.0 53.9 60.3 Net income
458.8 417.6 497.0 687.2 277.1 Less net income attributable to noncontrolling interests
414.3 380.6 456.3 625.3 286.7 Net income attributible to common stockholders(3)
$ 44.5 $ 37.0 $ 40.7 $ 61.9 $ (9.6 ) Earnings per share(3)
Basic
$ 0.79 $ 0.74 $ 0.89 $ 1.39 $ (0.23 ) Diluted
$ 0.77 $ 0.73 $ 0.89 $ 1.37 $ (0.23 ) Comprehensive income attributable to common stockholders
$ 41.8 $ 34.3 $ 52.0 $ 59.2 $ 0.7 Comprehensive income attributable to noncontrolling interests
$ 322.3 $ 355.9 $ 473.3 $ 597.5 $ 418.9 Comprehensive earnings per share
Basic
$ 0.52 $ 0.39 $ 1.13 $ 1.33 $ 0.01 Diluted
$ 0.51 $ 0.38 $ 1.13 $ 1.31 $ 0.01 Weighted average common shares outstanding
Basic
56,492,381 49,742,428 46,814,676 43,924,554 41,870,926 Diluted
57,709,668 50,924,736 47,070,522 44,364,902 42,498,705 (1)Certain reclassifications have been made to previously reported amounts to conform with the current presentation of currency translation gains and losses related to our currency diversification strategy. See "Management's Discussion and Analysis of Financial Condition and Results of Operations—Presentation of Foreign Currency Effects"in Part II, Item78 of this Annual Report on Form 10-K.
- (2)
In 2013, general and administrative expensesThe results for 2015 include an unusual loss of$64 million. See$137 million as further described in "Management's Discussion and Analysis of Financial Condition and Results ofOperations—Financial Overview"Operations" in Part II Item 7 of this Annual Report on Form 10-K.(3)- In
2011, earnings per shareOctober 2013, a small number of the Company's brokerage customers had taken relatively large positions in four securities listed on the Singapore Exchange. In early October, within a very short timeframe, these securities lost over 90% of their value. The customer accounts wereimpacted by a tax benefit thatmargined and fell into deficits totaling $64 million prior to the time the Companyrecognized during preparationtook possession ofits 2010 income tax returns. In connection with the special dividend paid by our Swiss operating company in December 2010, we were able to capture additional foreign tax credits, which resulted in an estimated $0.12 increase in diluted earnings per share.their securities positions.
In December 2010, we effected a series of dividend payments, culminating in a cash dividend of $1.79 per share, which was paid to holders of IBKR common stock. Funding for this dividend originated with our Swiss company and was made from earnings that were not previously taxed in the U.S. As a result, this triggered a U.S. federal income tax liability for the Company, which was reported as income tax expense in the consolidated statement of comprehensive income. This income tax liability was funded by reserving a portion of the dividend that the Company received. The remaining after-tax amount was paid to the Company's common stockholders. The result was cash-flow neutral for the public company.During 2010, the Company also paid a dividend equivalent to employees holding unvested shares in our Stock Incentive Plan which was recorded as compensation expense.In summary, the 2010 transactions reduced diluted EPS by approximately $0.71 for the year ended December 31, 2010.On a Non-GAAP basis, which excludes the effect of this non-operating item, diluted earnings per share were:Year ended
December 31,
2010(in dollars) Diluted earnings per share as reported
$ (0.23 ) Effect of special dividend on earnings per share
0.71 Adjusted diluted earnings per share
$ 0.48 This Non-GAAP measure is discussed in further detail in "Non-GAAP Financial Measures" and for a full GAAP to Non-GAAP reconciliation see "GAAP to Non-GAAP Reconciliation and Footnotes" in "Management's Discussion and Analysis of Financial Condition and Results of Operations" on page 76 in this Annual Report on Form 10-K.December 31, December 31, 2014 2013 2012 2011 2010 2017 2016 2015 2014 2013 (in millions) (in millions) Consolidated Statement of Financial Condition Data
Cash, cash equivalents and short-term investments(1)
$ 17,059.1 $ 15,591.3 $ 14,525.9 $ 12,140.8 $ 9,578.6 $ 23,999 $ 26,053 $ 23,105 $ 17,059 $ 15,591 Total assets(2)(3)
$ 43,385.0 $ 37,870.7 $ 33,199.6 $ 30,404.4 $ 28,500.0 $ 61,162 $ 54,673 $ 48,734 $ 43,385 $ 37,871 Total liabilities(3)
$ 38,200.3 $ 32,778.5 $ 28,386.5 $ 25,592.4 $ 24,207.0 $ 54,729 $ 48,853 $ 43,390 $ 38,200 $ 32,779 Redeemable noncontrolling interests(4)
$ 0.0 $ 0.0 $ 0.0 $ 5,269.6 $ 6,320.8 Stockholders' equity (deficit)(4)(5)
$ 4,418.3 $ 4,384.9 $ 598.5 $ (459.5 ) $ (2,029.2 ) Stockholders' equity
$ 1,090 $ 974 $ 863 $ 766 $ 707 Noncontrolling interests
$ 766.3 $ 707.3 $ 4,214.6 $ 1.8 $ 1.5 $ 5,343 $ 4,846 $ 4,481 $ 4,419 $ 4,385
- (1)
- Cash, cash equivalents and short-term investments represent cash and cash equivalents, cash and securities segregated under federal and other regulations, short-term investments and securities purchased under agreements to resell.
- (2)
AtAs of December 31,2014,2017, approximately$42.95$60.8 billion, or99.0%99.3%, of total assets were consideredto beliquid and consisted primarily of cash, marketable securities and collateralized receivables.- (3)
- As a result of
ourthe Company's acquisition from Holdings of IBG LLC membership interests,wethe Company received not only an interest in IBG LLC but also, for federal income tax purposes, a step-up to the federal income tax basis of the assets of IBG LLC underlying such additional interest. This increased tax basis is expected to result in tax benefits as a result of increased amortization deductions.WeThe Company will retain 15% of the tax benefits actually realized. As set forth in thetax receivable agreement weTax Receivable Agreement the Company entered into with Holdings,wethe Company will pay the remaining 85% of the realized tax benefits relating to any applicable tax year to Holdings. The deferred tax asset was$278.8$146 million,$294.7$273 million,$281.6$288 million,$297.9$279 million, and$313.6$295 million and the corresponding payable to Holdings was
$277.4 $187 million, $287.2$285 million, $258.6$291 million, $271.6$277 million, and $284.9$287 million atas of December 31, 2017, 2016, 2015, 2014, and 2013, 2012, 2011respectively. See "Management's Discussion and 2010, respectively.
(4)As discussedAnalysis of Financial Condition and Results of Operations" inNote 4 to the consolidated financial statements included elsewhere inPart II Item 7 of this Annual Report on Form 10-Kpriorfor additional details related toJune 6, 2012,theCompany reported Holdings' interests in IBG LLC as redeemable noncontrolling interests, at redemption value and separate from equity. Redemption value for these redeemable noncontrolling interests was measured as the number of equivalent shares of IBG LLC member interests owned by Holdings multiplied by the then current market price per shareimpact of theCompany's common stock. The excess ofTax Act on theredemption value over the book value of these interests, which did not affect net income attributable to common stockholders or cash flows, was required to be accounted for as a reduction of the Company's stockholders' equity in the consolidated statements of financial condition. These fair value adjustments had the effect of decreasing reported stockholders' equity by $1.0 billion, $2.5 billion and $1.9 billion as of December 31, 2011, 2010 and 2009, respectively. Accordingly, the above condensed consolidated statement of financial condition information is presented as if ASC 810-10 and ASC 480-10-S99 had been applied historically. Subsequent to June 6, 2012, the Company has reported noncontrolling interests attributable to Holdings as a component of the Company's total equity, valued based on Holding's proportionate ownership in IBG LLC.(5)In December of 2010 and 2012, the Company paid special cash dividends of $1.79 and $1.00 per share, respectively, to holders of the Company's common stock. The payment of these dividends resulted in a decrease in the Company's stockholders' equity (deficit) balances from prior years.Company.
ITEM 7. MANAGEMENT'S DISCUSSION AND ANALYSIS OF FINANCIAL CONDITION AND RESULTS OF OPERATIONS
The following discussion should be read in conjunction with the audited consolidated financial statements and the related notes in Item 8, included elsewhere in this report. In addition to historical information, the following discussion also contains forward-looking statements that include risks and uncertainties. Our actual results may differ materially from those anticipated in these forward-looking statements as a result of certain factors, including those set forth under the heading "Risk Factors" in Part I, Item 1A of this Annual Report on Form 10-K.
Business Overview
We are an automated global electronic broker and market maker (although, we have substantially exited the options market making business—see Note 2—Discontinued Operations and broker.Costs Associated with Exit or Disposal Activities to the audited consolidated financial statements in Part II, Item 8 of this Annual Report on Form 10-K). We custody and service accounts for hedge and mutual funds, RIAs,registered investment advisers, proprietary trading group,groups, introducing brokers and individual investors. We specialize in routing orders and executing and processing trades in securities, futures and foreign exchange instruments on more than 100120 electronic exchanges and trading venuesmarket centers around the world. Since our inception in 1977, we have focused on developing proprietary software to automate broker-dealer functions. The adventproliferation of electronic exchanges in the last 2427 years has provided us with the opportunity to integrate our software with an increasing number of exchanges and trading venuesmarket centers into one automatically functioning, computerized platform that requires minimal human intervention.
In connection with our IPO priced on May 3, 2007, IBG, Inc. purchased 10.0% of the membership interests in IBG LLC, became the sole managing member of IBG LLC and began to consolidate IBG LLC's financial results into its financial statements. Our primary assets are our ownership of approximately 14.5%17.4% of the membership interests of IBG LLC, the current holding company for our businesses, and our controlling interest and related contractual rights as the sole managing member of IBG LLC. The remaining approximately 85.5%82.6% of IBG LLC membership interests are held by Holdings, a holding company that is owned by our founder, Chairman and Chief Executive Officer, Mr. Thomas Peterffy and his affiliates, management and other employees of IBG LLC, and certain other members. The IBG LLC membership interests held by Holdings will be subject to purchase by us over time in connection with offerings by us of shares of our common stock.
Business Segments
The Company reports itsWe report our results in two operating business segments, electronic brokerage and market making.making (being discontinued). These segments are analyzed separately as these are the two principal business activities from which we derive our revenues and to which we allocate resources.
•Electronic Brokerage. We conduct our electronic brokerage business through
our IBcertain Interactive Brokers ("IB") subsidiaries. As an electronic broker, we execute, clear and settle trades globally for both institutional and individual customers. Capitalizing ontheour proprietary technology originally developed for our market making business, IB's systems provide our customers with the capability to monitor multiple markets around the world simultaneously and to execute trades electronically in these markets at a low cost, in multiple products and currencies from a single trading account. We offer our customers access to all classes of tradable, primarily exchange-listed products, including stocks, bonds, options, futures, forex and mutual funds traded on more than100120 exchanges and market centers in 26 countries and in24 countries23 currencies seamlessly around theworld seamlessly.world. The emerging complexity of multipletrading venuesmarket centers has provided us with the opportunity of building and continuously adapting our order routing software to secure excellent execution prices.This has becomeOur customer base is diverse with respect to geography and segments. Currently, more than half of our
major focus.customers reside outside the U.S. in over 200 countries and territories, with over 50% of new customers coming from outside the U.S. Approximately 64% of our customers' equity is in institutional accounts such as hedge funds, financial advisors, proprietary trading desks and introducing brokers. Specialized products and services that we have developed are successfully attracting these accounts. For example, we offer prime brokerage services, including capital introduction and securities lending to hedge funds; and our model portfolio technology and automated share allocation and rebalancing tools are particularly attractive to financial advisors.We provide a host of analytical tools such as IB Investors' MarketplaceSM, which allows wealth advisors to search for money managers and assign them to customer accounts based on their investment strategy. IB EmployeeTrackSM is widely used by compliance officers of financial institutions to streamline the process of tracking their employees' brokerage activities. The Probability LabSM allows our customers to analyze option strategies under various market assumptions. IB Portfolio Builder allows our customers to set up an investment strategy based on research and rankings from top research providers and fundamental data. IB Asset Management recruits registered financial advisors, vets them, analyzes their investment track records, groups them by their risk profile, and allows retail investors to assign their accounts to be traded by one or more advisors. In addition, Greenwich Compliance offers direct expert registration and start-up compliance services, as well as answers to basic day-to-day compliance questions for experienced investors and traders looking to start their own investment advisor firms. Greenwich Compliance professionals have regulatory and industry experience, and they can help investment advisors trading on the IB platform meet their registration and compliance needs. In 2017, we launched the IB Debit Mastercard® which allows customers to spend and borrow directly against their account and to make purchases and ATM withdrawals anywhere Debit Mastercard® is accepted around the world. In 2017, we also launched our Insured Bank Deposit Sweep Program, which provides customers with up to $2,500,000 of FDIC insurance on their eligible cash balances in addition to the existing $250,000 SIPC coverage for a maximum coverage of $2,750,000.
•Market Making. On March 8, 2017 we announced our intention to discontinue our options market making activities globally and we are currently in the process of winding down these operations. Additionally, as we previously announced, we entered into a definitive transaction to transfer our U.S. options market making operations to Two Sigma Securities, LLC. This transaction closed on September 29, 2017. We intend to continue conducting certain proprietary trading activities in stocks and related instruments to facilitate our electronic brokerage customers' trading in products such as ETFs, ADRs, CFDs and other financial instruments. However, we do not expect this activity to be of sufficient size as to require reporting these activities as a separate segment after we discontinue our options market making activities.
We conduct our market making business primarily through our
THTimber Hill subsidiaries. Asone of the largesta marketmakers on many of the world's leading exchanges,maker we provide liquidity by offering competitively tight bid/offer spreads over a broad base ofover one milliontradable, exchange-listed products. As principal, we commit our own capital and derive revenues or incur
losses from the difference between the price paid when securities are bought and the price received when those securities are sold. Because we provide continuous bid and offer quotations and we are continuously both buying and selling quoted securities, we may have either a long or a short position in a particular product at a given point in time. Our entire portfolio is evaluated eachmany times per second and continuously rebalanced throughout the trading day, thus minimizing the risk of our portfolio at all times. This real-time rebalancing of our portfolio, together with our real-time proprietary risk management system, enables us to curtail risk and to be profitable in both up-market and down-market scenarios. In the past several years our market making business has suffered from competitive pressures and along with the rapid increase of our brokerage business, its significance has diminished.risk.
The operating business segments are supported by our corporate segment which provides centralized services and executes Company'sour currency diversification strategy.
Business Environment
The operatingAgainst a backdrop of a still sluggish trading environment for our brokerage business continued to exhibit positive trends in 2014. Rising investor optimism, strong valuation gains in the equity markets and brief periods of increasedamid historically low market volatility, contributed to the favorable operating environment.
Wewe maintained our position as the largest U.S. electronic broker as measured by the number of customer revenue trades. Customer trading volumestrades and increased 17% over the prior year, outpacing the industry and driving a 9% increase in commission revenue. This growth was most pronounced in stock trading, followedour Daily Average Revenue Trades ("DARTs") by options and futures. Market values continued to rise as U.S. indexes added to their gains4% from 2013, with the S&P 500 Index climbing 11% over its year-ago level, contributing to our 24% increase in customer equity.
2016. New customer account growth continued to gain momentumremained robust as total customer accounts increased 18% in 2014.25% from 2016 to 483 thousand. Institutional customers, such as hedge funds, mutual funds, introducing brokers, proprietary trading groups and financial advisors, comprised approximately 29%48% of total accounts and approximately 64% of total customer equity at the end of 2014.2017. Our customer base continues to be geographically diverse, with customers residing in over 200 countries and territories and over 50% of new customers come from outside the U.S. Average equity per account increased by 6%,16% from 2016 to $202,000, at year-end. Our customer base is geographically diversified. Our customers reside in over 190 countries and over 60% of new customers came from outside the U.S.
Customers$258 thousand, as we continued to take advantage ofattract larger customers that seek our superior technology and low costs as well as our securities finance services, including margin lending and short sale support.
Electronic brokerage net interest income grew 30%, compared to 2016. The Federal Reserve's increases in the Federal Funds target rate in December 2016, March 2017, June 2017 and December 2017, together with higher average customer credit and margin loan balances, generated significantly more net interest income than in 2016. Our low margin lending rates which are tied to benchmark rates, such as the Federal Funds rate in the U.S. In 2014,2017, our customers paid 0.5%0.8% to 1.6%2.9% for their U.S. dollar margin loans with us. This drove growthAverage customer credit balances rose 14% due to an inflow of ournew accounts, and average customer margin loan balances increased by 41% from 2016 due to a record high of $16.9 billion, an increase of 25% over the prior year. Brokerage net interest income grew 39% in 2014.customers' appetite for increased leverage, along with expanded prime broker financing.
Market making segment results declineddecreased in 2014 due to2017 on lower trading gains, as expected, reflecting the continuationwinding down of a difficult operating environment forour options market makers with strong competition from high frequency traders (HFT's) and historically low volatility levels, which depressed our trading gains.making operations.
The following is a summary of the key profit drivers that affect our business and how they compared to the prior year:2016:
Global trading volumes. According to data received from exchanges worldwide, volumes in exchange-listed equity-based options increased by approximately 3%7% globally and 4%3% in the U.S. for the year ended December 31, 2014, as2017, compared to 2013.2016. During 2014 (2013)2017 we accounted for approximately 8.5% (9.1%)5.1% (7.9% in 2016) of the exchange-listed equity-based options volume traded worldwide (including options on ETFs and stock index products) volume traded worldwide, and approximately 11.2% (11.8%)7.7% (10.9% in 2016) of exchange-listed equity-based options volume traded in the U.S. The decreases in both measures were driven by our pull-back in options market making. It is important to note that this metric is not directly correlated with our profits. A discussion of our approach for managing foreign currency exposure is contained in Part II, Item 7A of this Annual Report on Form 10-K entitled "Quantitative and Qualitative Disclosures about Market Risk."
See the tables on pages 60-6162-63 of this Annual Report on Form 10-K for additional details regarding our trade volumes, contract and share volumes and brokerage statistics.
Volatility. OurSince we typically maintain an overall long volatility position, our market making profits are generally correlated with market volatility, since we typically maintain an overall long volatility position, which protectsprotecting us against a severe market dislocation in either direction. Based on the Chicago Board Options Exchange Volatility Index ("VIX®"), the average volatility remained at historically low levels, averaging 14.2decreased to 11.1 in 2014, unchanged2017, down 30% from the average of 15.9 in 2013.
The ratio2016. As we had begun to wind down our market making activities, volatility had less of actualan impact in 2017 than in 2016. Lower volatility also impacts our electronic brokerage segment because it results in fewer trading opportunities for our customers. Despite an 8% decline in average DARTS per account, our total DARTs increased 4% compared to implied volatility is also meaningful to our results. Because the cost of hedging our positions is based on implied volatility, while our trading profits are, in part, based on actual market volatility, a higher ratio is generally favorable and a lower ratio generally has a negative effect on our trading gains. This ratio averaged approximately 79% during 2014, slightly higher than the average of 77% in 2013.2016.
Currency fluctuations. As a global electronic broker and market maker trading on exchanges around the world in multiple currencies, we are exposed to foreign currency risk. We actively manage this exposure by keeping our net worth in proportion to a defined basket of 1614 currencies we call the "GLOBAL" in order to diversify our risk and to align our hedging strategy with the currencies that we use in our business. Because we report our financial results in U.S. dollars, the change in the value of the GLOBAL toversus the U.S. dollar affects our earnings. TheDuring 2017 the value of the GLOBAL, as measured in U.S. dollars, at December 31, 2014 declined 6%increased 3.06% compared to its value atas of December 31, 2013. This2016, which had a negativepositive impact on our comprehensive earnings in 2014.for 2017.
Presentation of Foreign Currency Effects
In this reporting period, we have taken several steps to improve the transparencyA discussion of our approach for managing foreign currency diversification strategy.
1.We transferred nearly allexposure is contained in Part II, Item 7A ofthe currency spot positions held as part of our GLOBAL basket of currencies from the primary market making company to the parent holding company, IBG LLC.2.We reclassified all currency translation gainsthis Annual Report on Form 10-K entitled "Quantitative andlosses related to the GLOBAL as other income instead of trading gains.3.We elected to report gains and losses from currency hedging in the corporate segment instead of the market making segment.
These actions place the income statement effects of our currency diversification in the corporate segment, thereby providing a clearer picture of the core operating results in the market making segment.
For comparative purposes, certain reclassifications have been made to previously reported amounts to conform with the current presentation. These changes had no effect on total consolidated net revenues or on net income.Qualitative Disclosures about Market Risk."
Financial Overview
Diluted earnings per share were $0.77$1.07 for the year ended December 31, 2014.2017 ("current year"), compared to diluted earnings per share of $1.25 for the year ended December 31, 2016 ("prior year"). The calculation of diluted earnings per share is detailed in Note 4 to the audited consolidated financial statements, in Part II, Item 8 of this Annual Report on Form 10-K. Diluted earnings per share were $0.73 for the year ended December 31, 2013.
On a comprehensive basis, which includes the effect of changes in the U.S. dollar value of the Company's non-U.S. subsidiaries,other comprehensive income ("OCI"), diluted earnings per share were $0.51$1.22 for the current year, ended December 31, 2014, compared to diluted earnings per share of $0.67$1.19 for the same period in 2013.prior year.
For the year ended December 31, 2014, our net revenues were $1,043.3 million and income before income taxes was $506.1 million, compared to net revenues of $1,076.2 million and income before income taxes of $451.3 million for 2013. Compared to 2013, trading gains decreased 21% in 2014, commissions and execution fees increased 9% and net interest income increased 37%. Our pretax margin for the year ended December 31, 2014 was 49%, compared to 42% for 2013.
Our net revenues were negatively impacted by currency translation effects from the strengthening of the U.S. dollar against other currencies. Currency translation effects are largely a result ofIn connection with our currency diversification strategy. We have determined to base our net worth in GLOBALs, a self-defined basket of currencies in which we maintain our equity. As a result,strategy (i.e., GLOBALs) at December 31, 2017 approximately 59%30% of our equity iswas denominated in currencies other than the U.S. dollar. In the current year, our currency diversification strategy increased our comprehensive earnings by $175 million (versus a decrease of $65 million in the prior year), as the U.S. dollar value of the GLOBAL increased by approximately 3.06%, compared to its value as of December 31, 2016. The effects of our currency diversification strategy appear in two places in the financial statements:are reported as (1) as a component of other income in the consolidated statement of comprehensive income and (2) as other comprehensive income ("OCI")OCI in the consolidated statement of financial condition and the consolidated statement of comprehensive income. The full effect of the GLOBAL is captured in comprehensive income.
In light of our decision to wind down our options market making activities globally, we removed the Singapore dollar (SGD) and realigned the relative weight of the U.S. dollar (USD) versus the other currency components to better reflect our businesses going forward. The new composition, which was effective as of the close of business on March 31, 2017, contains 14 currencies, one fewer than the prior composition.
Consolidated: For the current year, ended December 31, 2014our net revenues were $1,702 million and income before income taxes was $1,049 million, compared to net revenues of $1,396 million and income before income taxes of $761 million in the valueprior year. The increase in income before income taxes in the current year was mainly driven by a 30% increase in net interest income and a 253% increase in other income, partially offset by a 75% decrease in trading gains. Our pre-tax profit margin was 62%, compared to 55% for the prior year.
The results for the year were negatively impacted by the effects of the GLOBAL as measuredTax Cuts and Jobs Act (the "Tax Act"), enacted on December 22, 2017. The Tax Act significantly revised U.S. corporate income tax law by, among other things, reducing the corporate income tax rate from 35% to 21% and implementing a modified territorial tax system that includes a one-time transition tax on deemed repatriated earnings of foreign subsidiaries. As a result of the Tax Act, the current year includes a net reduction in U.S. Dollars decreasedconsolidated earnings of approximately 6% as compared$84 million, of which $62 million is due to the same period last year.one-time repatriation tax and a net $22 million is related to the remeasurement of our U.S. deferred tax assets at lower enacted corporate tax rates. The impact of the Tax Act recognized this year may differ, possibly materially, due to, among other things, changes in interpretations and assumptions the Company has made, guidance that may be issued and actions we may take as a result of the Tax Act. The effects of the Tax Act are further detailed in Note 10 to the audited consolidated financial statements, in Part II, Item 8 of this Annual Report on Form 10-K.
DuringElectronic Brokerage: For the current year, ended December 31, 2014, income before income taxes in our electronic brokerage segment increased by 49%$104 million, or 14%, compared to 2013. Commissions and execution fees increased by 9% on higher customer trade volumes and net interest income grew by 39% from the prior year, driven by higher net interest income and commissions, partially offset by lower other income and higher execution and clearing, general and administrative, and employee compensation and benefits expenses. Net revenues increased 13%, mainly from a 30% increase in net interest income, driven by higher Federal Funds rates and higher average customer credit and margin loan balances, and a 6% increase in commissions, primarily driven by higher customer borrowings. Pretax margin increasedoptions contract and stock share volumes; partially offset by a 16% decrease in other income, driven by a $12 million net mark-to-market loss on our U.S. government securities portfolio (compared to 62% from 48%a $26 million net mark-to-market gain in the same time periods.prior year). Pre-tax profit margin was 61% for both the current year and the prior year. Customer accounts grew 18% from the prior year25%, and customer equity increased 24% during 2014. Total Daily Average Revenue Trades ("DARTs")46% from the prior year. For the current year, total DARTs for cleared and execution-only customers increased 16%4% to 566688 thousand, during the year ended December 31, 2014, compared to 486660 thousand duringfor the year ended December 31, 2013.prior year.
In October 2013, a small number ofMarket Making: For the Company's brokerage customers had taken relatively large positions in four securities listed on the Singapore Exchange. In early October, within a very short timeframe, these securities lost over 90% of their value. The customer accounts were margined and fell into deficits totaling $64 million prior to the time the Company took possession of their securities positions. At December 31, 2014, the Company has recognized an aggregate loss of approximately $82 million. The maximum aggregate loss, which would occur if the securities' prices all fell to zero and none of the debts were collected, would be approximately $84 million. The Company is currently pursuing the collection of the debts. The ultimate effect of this incident on the Company's results will depend upon market conditions and the outcome of the Company's debt collection efforts.
During thecurrent year, ended December 31, 2014, income before income taxes in our market making segment decreased 28%,$71 million, compared with 2013.to the prior year, to a loss of $27 million. Trading gains decreased 75% on lower trading volumes, as we wind down our options market making activities. In addition, the results for the current year include approximately $25 million in one-time exit costs, primarily consisting of the write-down of the value of exchange trading rights, included in general and administrative expenses, and severance costs for employee terminations, included in employee compensation and benefits expense. These exit costs were negatively impactedpartially offset by low volatility levels,a $13 million net recovery of costs related to the wind-down of our U.S. options market making operations included in other income.
On March 8, 2017, the Company announced its intention to discontinue its options market making activities globally. We will continue to access the phase-out of our market making operations outside of the U.S substantially over the coming months. Consistent with earlier estimates, we recognized approximately $25 million in one-time restructuring costs in the current year. A substantial portion of these exit costs is expected to be defrayed by continuing certain market making operations until the restructuring is complete. In addition, as measureda result of discontinuing our options market making activities, we expect that approximately $40 million in annual net expenses will be absorbed by the VIX®;electronic brokerage segment, of which approximately $11 million was absorbed during the current year. As of December 31, 2017, on a prospective basis, approximately 82% of the resources related to the $40 million in annual net expenses have been transferred to the electronic brokerage segment.
We intend to continue conducting certain proprietary trading activities in stocks and low ratiorelated instruments to facilitate our electronic brokerage customers' trading in products such as ETFs, ADRs, CFDs and other financial instruments. However, we do not expect this activity to be of actualsufficient size as to implied volatility. Pretax margin decreasedrequire reporting these activities as a separate segment after we discontinue our options market making activities.
Sale of U.S. Options Market Making Operations: In connection with the sale of our U.S. options market making operations to 40%Two Sigma Securities, LLC on September 29, 2017, during the current year we recorded a gain of $11 million and consulting fees of $2 million, reflecting the recovery of costs we incurred during the transition of these operations to Two Sigma Securities, LLC. As of the end of the current year, we had discontinued nearly all of our U.S. and the majority of our non-U.S. options market making operations.
Under the agreement with Two Sigma Securities, LLC, we have the opportunity for future income from an earn-out agreement, based on the performance of the options market making business under Two Sigma Securities, LLC's control. Under the agreement, we would earn a share of any U.S. profits after variable costs and other agreed-upon costs for three years; and a separate share of any non-U.S. profits after variable costs for four years. The agreement provides Two Sigma Securities, LLC the opportunity to enter non-U.S. parts of this business and, while it does not preclude us from participating in 2014, as compared to 44%those markets, the earn-out would be effective only in 2013.markets where we did not compete.
Market making, by its nature, does not produce predictable earnings. Our results in any given period may be materially affected by volumes in the global financial markets, the level of competition and other factors. Electronic brokerage is more predictable, but it is dependent on customer activity, growth in customer accounts and assets, interest rates and other factors. For a further discussion of the factors that may affect our future operating results, please see the description of risk factors in Part I, Item 1A of this Annual Report on Form 10-K.
The following two tables present net revenues and income before income taxes for each of our business segments for the periods indicated.
Net revenues of each of our segments and our total net revenues are summarized below:
| | Year Ended December 31, | Year Ended December 31, | ||||||||||||||||||
|---|---|---|---|---|---|---|---|---|---|---|---|---|---|---|---|---|---|---|---|---|
| | 2014 | 2013 | 2012 | 2017 | 2016 | 2015 | ||||||||||||||
| | (in millions) | (in millions) | ||||||||||||||||||
Electronic brokerage | $ | 952.3 | $ | 818.5 | $ | 672.2 | $ | 1,405 | $ | 1,239 | $ | 1,097 | ||||||||
Market making | 284.4 | 361.1 | 490.5 | 86 | 190 | 298 | ||||||||||||||
Corporate | (193.4 | ) | (103.4 | ) | (32.2 | ) | 211 | (33 | ) | (206 | ) | |||||||||
| | | | | | | | | | | | | | | | | | | | | |
Total | $ | 1,043.3 | $ | 1,076.2 | $ | 1,130.5 | $ | 1,702 | $ | 1,396 | $ | 1,189 | ||||||||
| | | | | | | | | | | | | | | | | | | | | | |
| | | | | | | | | | | | | | | | | | | | | |
- (1)
Certain reclassifications have been made to previously reported amounts to conform with the current presentation of the impact our currency diversification strategy.(2)- The corporate segment includes corporate related activities, inter-segment eliminations, and gains and losses on positions held as part of our overall currency diversification strategy.
Income before income taxes of each of our segments and our total income before income taxes are summarized below:
| | Year Ended December 31, | Year Ended December 31, | ||||||||||||||||||
|---|---|---|---|---|---|---|---|---|---|---|---|---|---|---|---|---|---|---|---|---|
| | 2014 | 2013 | 2012 | 2017 | 2016 | 2015 | ||||||||||||||
| | (in millions) | (in millions) | ||||||||||||||||||
Electronic brokerage | $ | 588.5 | $ | 395.8 | $ | 343.5 | $ | 860 | $ | 756 | $ | 536 | ||||||||
Market making | 114.1 | 158.5 | 219.5 | (27 | ) | 44 | 130 | |||||||||||||
Corporate | (196.5 | ) | (103.0 | ) | (36.0 | ) | 216 | (39 | ) | (208 | ) | |||||||||
| | | | | | | | | | | | | | | | | | | | | |
Total | $ | 506.1 | $ | 451.3 | $ | 527.0 | $ | 1,049 | $ | 761 | $ | 458 | ||||||||
| | | | | | | | | | | | | | | | | | | | | | |
| | | | | | | | | | | | | | | | | | | | | |
- (1)
Certain reclassifications have been made to previously reported amounts to conform with the current presentation of the impact our currency diversification strategy.(2)- The corporate segment includes corporate related activities, inter-segment eliminations, and gains and losses on positions held as part of our overall currency diversification strategy.
RevenueNet Revenues
Trading Gains
Trading gains are generated in the normal course of our market making.making business. Trading revenues are, in general, proportional to the trading activity in the markets. Our revenue base is highly diversified and comprised of millions of relatively small individual trades of various financial products traded on electronic exchanges, primarily in stocks, options and futures. Trading gains accounted for approximately 23%2%, 29%12%, and 39%23% of our total net revenues for the years ended December 31, 2014, 20132017, 2016, and 2012,2015, respectively.
Trading gains also include revenues from net dividends. Market making activities require us to hold a substantial inventory of equity securities. We derive significant revenues in the form of dividend income from these equity securities. This dividend income is largely offset by dividend expense incurred when we make significant payments in lieu of dividends on short positions in securities in our portfolio. Dividend income and expense arise from holding market making positions over dates on which dividends are paid to
dividends are paid to shareholders of record. When a stock pays a dividend, its market price is generally adjusted downward to reflect the value paid to the shareholders of record, which will not be received by those who purchase the stock on or after the dividendex-dividend date. Hence, the apparent gains and losses due to these price changes must be taken together with the dividends paid and received, respectively, to accurately reflect the results of our market making operations.activities.
As a result of the way we have integrated our market making and securities lending systems, our trading gains and our net interest income from the market making segment are interchangeable and depend on the mix of market making positions in our portfolio. When implied interest rates in the equity and equity options and futures markets exceed the actual interest rates available to us, our market making systems tend to buy stock and sell it forward, which produces higher trading gains and lower net interest income. When these rates are inverted, our market making systems tend to sell stock and buy it forward, which produces lower trading gains and higher net interest income.
Our trading gains are geographically diversified. In 2014, 2013 and 2012, we generated 37%, 41% and 36%, respectively, of our trading gains from operations conducted internationally.
Commissions and Execution Fees
We earn commissions and execution fees from our cleared customers for whom we act as an executing and clearing broker and from our non-cleared customers for whom we act as an execution-only broker. We have a commission structure that allows customers to choose between an all-inclusive fixed, or "bundled", rate and a tiered, or an "unbundled", rate that offers lower commissions for high volume customers. For "unbundled" commissions, we chargepass through regulatory and exchange fees at our cost, separately from our commissions, adding transparency to our fee structure. Commissions and execution fees accounted for 49%38%, 45%44%, and 35%52% of our total net revenues for the years ended December 31, 2014, 20132017, 2016, and 2012,2015, respectively.
Our commissions and execution fees are geographically diversified. In 2014, 20132017, 2016, and 20122015 we generated 25%32%, 26%30%, and 28%26%, respectively, of commissions and execution fees from operations conducted internationally.
Interest Income and Interest Expense
We earn interest on customer funds segregated in safekeeping accounts; on customer borrowings on margin, secured by marketable securities these customers hold with us; from our investmentinvestments in U.S. and foreign government treasury securities; from borrowing and lending securities in the general course of our brokerage and market making and brokerage activities,activities; and on bank balances.deposits with banks. Interest income accounted for 37%53%, 27%43%, and 23%41% of our total net revenues for the years ended December 31, 2014, 20132017, 2016, and 2012,2015, respectively. Interest income is partially offset by interest expense.
We pay interest on cash balances customers hold with us; for cash received fromborrowing and lending securities in the general course of our market making and brokerage activities; and on our borrowings. Interest expense was 7%accounted for 13%, 5%6%, and 5%6% of our total net revenues for the years ended December 31, 2014, 20132017, 2016, and 2012,2015, respectively.
We have automated and integrated our securities lending system with our trading system. As a result, we have been able to tailor our securities lending activity to produce more optimal results when taken together with trading gains (see description under "Trading Gains" above).
Our netNet interest income accounted for approximately 33%40%, 23%38%, and 18%36% of our total net revenues for the years ended December 31, 2014, 20132017, 2016, and 2012,2015, respectively.
Other Income (Loss)
The largestA primary component of other income (loss) is foreign exchange currency translation gains and losses from our currency diversification strategy. A discussion of our approach to managing foreign currency exposure is contained in Part II, Item 7A of this Annual Report on Form 10-K entitled "Quantitative and Qualitative Disclosures about Market Risk."
Other income (loss) also consists of mark-to-market gains and losses on our U.S. government securities portfolio; income from market data fee income, paymentfees, account activity fees, risk exposure fees and payments for order flow income, minimum activity fee income from customersflow; gains and mark-to-market gains or losses on non-marketfinancial instruments at fair value and on other financial instruments that are not held for our market making securities (generally, strategic investments andactivities. In addition, 2017 includes a net gain on the sale of the U.S. government securities). Our otheroptions market making operations. Other income (loss) accounted for approximately –10%20%, –1%7%, and 4%(10%) of our total net revenues for each of the years ended December 31, 2014, 20132017, 2016, and 2012,2015, respectively.
Costs andNon-Interest Expenses
Execution and Clearing Expenses
Our largest single expense category is executionExecution and clearing expenses which includesinclude the costs of executing and clearing our market making and electronic brokerage trades, as well as other direct expenses, including paymentliquidity rebates received from various exchanges and market centers, regulatory fees, market data fees, and payments for order flow, regulatory fees and market data fees.flow. Execution fees are paid primarily to electronic exchanges and market centers on which we trade. Clearing fees are paid to clearing houses and clearing agents. Payments for order flow are made as part of exchange-mandated programs and to otherwise attract order volume to our system. Market data fees are fees paid to third parties to receive streaming price quotes and related information. Payments for order flow are paid primarily as part of exchange-mandated programs.
Employee Compensation and Benefits
Employee compensation and benefits includesinclude salaries, bonuses and other incentive compensation plans, group insurance, contributions to benefit programs and other related employee costs.
Occupancy, Depreciation and Amortization
Occupancy expense consistsexpenses consist primarily of rental payments on office and data center leases and related occupancy costs, such as utilities. Depreciation and amortization expense resultsexpenses result from the depreciation of fixed assets, such as computing and communications hardware, as well as amortization of leasehold improvements, and capitalized in-house software development.development and acquired intangible assets.
Communications
Communications expense consistsexpenses consist primarily of the cost of voice and data telecommunications lines supporting our business, including connectivity to exchanges around the world.
General and Administrative and Customer Bad Debt
Expenses in this category areGeneral and administrative expenses consist primarily incurred forof advertising, professional services expenses, such as legal and audit work, bad debts, and other operating expenses. Customer bad debt expenses such as advertising and exchange membership lease expenses.consist primarily of losses incurred by customers in excess of their assets with us, net of amounts recovered by us.
Income Tax Expense
We pay U.S. federal, state and local income taxes on our taxable income, which is proportional to the percentage we own of IBG LLC owned by IBG, Inc. OurLLC. Also, our subsidiaries are subject to income tax in the respective jurisdictions in which they operate.
Table of ContentsNoncontrolling Interest
Subsequent Event
On January 15, 2015, due to the sudden move in the value of the Swiss Franc that followed an unprecedented action by the Swiss National Bank, several of the Company's customers who held currency futures and spot positions suffered losses in excess of their deposits with the Company. The Company took immediate action to hedge its exposure to the foreign currency receivables from these customers. The Company estimates unsecured receivables, net of hedging activity, to be approximately $129 million. The Company is actively pursuing collection of the debts. The ultimate effect of this incident on the Company's results will depend upon the outcome of the Company's debt collection efforts.
Noncontrolling Interest
We are the sole managing member of IBG LLC and, as such, operate and control all of the business and affairs of IBG LLC and its subsidiaries and consolidate IBG LLC's financial results into our financial statements. We holdAs of December 31, 2017, we held approximately 14.5%17.4% ownership interest in
IBG LLC. Holdings is owned by the original members of IBG LLC and holds approximately 85.5%82.6% ownership interest in IBG LLC. We reflect Holdings' ownership as a noncontrolling interest in our consolidated statement of financial condition, consolidated statement of comprehensive income, consolidated statement of changes in equity and consolidated statement of cash flows. Our share of IBG LLC's net income, excluding Holdings' noncontrolling interest, for 2014the current year was approximately 14.0% and similarly, outstanding shares of our common stock represent17.0%, compared to approximately 14.5% of16.2% for the outstanding membership interests of IBG LLC.prior year.
Certain Trends and Uncertainties
We believe that our continuingcurrent operations may be favorably or unfavorably impacted by the following trends that may affect our financial condition and results of operations.operations:
- •
- Our market making activities will continue to be impacted by the following trends until we complete its wind-down.
- •
- Over the past several years, the effects of market structure changes, competition (in particular, from
HFTs)high frequency traders) and market conditions have, during certain periods, exerted downward pressure on bid/offer spreads realized by market makers. - •
Retail broker-dealer participation in the equity markets has fluctuated over the past few years due to investor sentiment, market conditions and a variety of other factors. Retail transaction volumes may not be sustainable and are not predictable.•- In recent years, in an effort to improve the quality of their executions as well as to increase efficiencies, market makers have increased the level of automation within their operations, which may allow them to compete more effectively with us.
- •
Scrutiny of equity and option market makers, hedge funds and soft dollar practices by regulatory and legislative authorities has increased. New legislation or modifications to existing regulations and rules could occur in the future.•Additional consolidation among market centers may adversely affect the value of our smart routing software.•- A driver of our market making profits is the relationship between actual and implied volatility in the equities markets. The cost of maintaining our conservative risk profile is based on implied volatility, while our profitability, in part, is based on actual volatility. Hence, our profitability is increased when actual volatility runs above implied volatility and it is decreased when actual volatility falls below implied volatility. Implied volatility tends to lag actual volatility.
- •
- Retail broker-dealer participation in the equity markets has fluctuated over the past few years due to investor sentiment, market conditions and a variety of other factors. Retail transaction volumes may not be sustainable and are not predictable.
- •
- Scrutiny of equity and option market makers, hedge funds and soft dollar practices by regulatory and legislative authorities has increased. New legislation or modifications to existing regulations and rules could occur in the future.
- •
- Additional consolidation among market centers may adversely affect the value of our SmartRoutingSM software.
- •
- Benchmark interest rates have fluctuated over the past years due to economic conditions. Changes in interest rates may not be predictable.
See "Risk Factors" in Part I, Item 1A of this Annual Report on Form 10-K for a discussion of other risks that may affect our financial condition and results of operations.
Results of Operations
The tables in the period comparisons below provide summaries of our consolidated results of operations. The period-to-period comparisons below of financial results are not necessarily indicative of future results.
| | Year Ended December 31, | |||||||||
|---|---|---|---|---|---|---|---|---|---|---|
| | 2014 | 2013 | 2012 | |||||||
| | (in millions except share and per share data) | |||||||||
Revenues: | ||||||||||
Trading gains(1) | $ | 261.2 | $ | 331.2 | $ | 466.0 | ||||
Commissions and execution fees | 548.8 | 502.1 | 412.6 | |||||||
Interest income(1) | 416.2 | 303.4 | 270.3 | |||||||
Other income(1) | (110.7 | ) | (8.8 | ) | 43.6 | |||||
| | | | | | | | | | | |
Total revenues | 1,115.5 | 1,127.9 | 1,192.5 | |||||||
Interest expense | 72.2 | 51.7 | 62.0 | |||||||
| | | | | | | | | | | |
Total net revenues | 1,043.3 | 1,076.2 | 1,130.5 | |||||||
| | | | | | | | | | | |
Non-interest expenses: | ||||||||||
Execution and clearing | 211.5 | 242.5 | 251.0 | |||||||
Employee compensation and benefits | 204.8 | 205.3 | 244.5 | |||||||
Occupancy, depreciation and amortization | 39.4 | 38.9 | 38.8 | |||||||
Communications | 24.2 | 23.1 | 23.3 | |||||||
General and administrative | 57.3 | 115.1 | 45.9 | |||||||
| | | | | | | | | | | |
Total non-interest expenses | 537.2 | 624.9 | 603.5 | |||||||
| | | | | | | | | | | |
Income before income taxes | 506.1 | 451.3 | 527.0 | |||||||
Income tax expense | 47.3 | 33.7 | 30.0 | |||||||
| | | | | | | | | | | |
Net income | 458.8 | 417.6 | 497.0 | |||||||
Less net income attributable to noncontrolling interests | 414.3 | 380.6 | 456.3 | |||||||
| | | | | | | | | | | |
Net income attributable to common stockholders | $ | 44.5 | $ | 37.0 | $ | 40.7 | ||||
| | | | | | | | | | | |
| | | | | | | | | | | |
| | | | | | | | | | | |
Earnings per share: | ||||||||||
Basic | $ | 0.79 | $ | 0.74 | $ | 0.89 | ||||
| | | | | | | | | | | |
| | | | | | | | | | | |
| | | | | | | | | | | |
Diluted | $ | 0.77 | $ | 0.73 | $ | 0.89 | ||||
| | | | | | | | | | | |
| | | | | | | | | | | |
| | | | | | | | | | | |
Weighted average common shares outstanding: | ||||||||||
Basic | 56,492,381 | 49,742,428 | 46,814,676 | |||||||
| | | | | | | | | | | |
| | | | | | | | | | | |
| | | | | | | | | | | |
Diluted | 57,709,668 | 50,924,736 | 47,070,522 | |||||||
| | | | | | | | | | | |
| | | | | | | | | | | |
| | | | | | | | | | | |
Comprehensive income: | ||||||||||
Net income attributable to common stockholders | $ | 44.5 | $ | 37.0 | $ | 40.7 | ||||
| | | | | | | | | | | |
Other comprehensive income: | ||||||||||
Cumulative translation adjustment, before income taxes | (15.3 | ) | (3.2 | ) | 2.2 | |||||
Income taxes related to items of other comprehensive income | (0.3 | ) | (0.5 | ) | (9.1 | ) | ||||
| | | | | | | | | | | |
Other comprehensive income (loss), net of tax | (15.0 | ) | (2.7 | ) | 11.3 | |||||
| | | | | | | | | | | |
Comprehensive income attributable to common stockholders | $ | 29.5 | $ | 34.3 | $ | 52.0 | ||||
| | | | | | | | | | | |
| | | | | | | | | | | |
| | | | | | | | | | | |
Comprehensive income attributable to noncontrolling interests: | ||||||||||
Net income attributable to noncontrolling interests | $ | 414.3 | $ | 380.6 | $ | 456.3 | ||||
Other comprehensive income (loss)—cumulative translation adjustment | (92.0 | ) | (24.7 | ) | 17.0 | |||||
| | | | | | | | | | | |
Comprehensive income attributable to noncontrolling interests | $ | 322.3 | $ | 355.9 | $ | 473.3 | ||||
| | | | | | | | | | | |
| | | | | | | | | | | |
| | | | | | | | | | | |
(1)Certain reclassifications have been made to previously reported amounts to conform with the current presentation of currency translation gains and losses related to our currency diversification strategy.
| | Year Ended December 31, | |||||||||
|---|---|---|---|---|---|---|---|---|---|---|
| | 2017 | 2016 | 2015 | |||||||
| | (in millions, except share and per share amounts) | |||||||||
Revenues | ||||||||||
Trading gains | $ | 40 | $ | 163 | $ | 269 | ||||
Commissions | 647 | 612 | 617 | |||||||
Interest income | 908 | 606 | 492 | |||||||
Other income (loss) | 332 | 94 | (122 | ) | ||||||
| | | | | | | | | | | |
Total revenues | 1,927 | 1,475 | 1,256 | |||||||
Interest expense | 225 | 79 | 67 | |||||||
| | | | | | | | | | | |
Total net revenues | 1,702 | 1,396 | 1,189 | |||||||
| | | | | | | | | | | |
Non-interest expenses | ||||||||||
Execution and clearing | 241 | 244 | 231 | |||||||
Employee compensation and benefits | 249 | 242 | 227 | |||||||
Occupancy, depreciation and amortization | 47 | 51 | 44 | |||||||
Communications | 28 | 30 | 25 | |||||||
General and administrative | 86 | 62 | 58 | |||||||
Customer bad debt | 2 | 6 | 146 | |||||||
| | | | | | | | | | | |
Total non-interest expenses | 653 | 635 | 731 | |||||||
| | | | | | | | | | | |
Income before income taxes | 1,049 | 761 | 458 | |||||||
Income tax expense | 256 | 62 | 43 | |||||||
| | | | | | | | | | | |
Net income | 793 | 699 | 415 | |||||||
Less net income attributable to noncontrolling interests | 717 | 615 | 366 | |||||||
| | | | | | | | | | | |
Net income available for common stockholders | $ | 76 | $ | 84 | $ | 49 | ||||
| | | | | | | | | | | |
| | | | | | | | | | | |
| | | | | | | | | | | |
Earnings per share | ||||||||||
Basic | $ | 1.09 | $ | 1.28 | $ | 0.80 | ||||
| | | | | | | | | | | |
| | | | | | | | | | | |
| | | | | | | | | | | |
Diluted | $ | 1.07 | $ | 1.25 | $ | 0.78 | ||||
| | | | | | | | | | | |
| | | | | | | | | | | |
| | | | | | | | | | | |
Weighted average common shares outstanding | ||||||||||
Basic | 69,926,933 | 66,013,247 | 61,043,071 | |||||||
| | | | | | | | | | | |
| | | | | | | | | | | |
| | | | | | | | | | | |
Diluted | 70,904,921 | 67,299,413 | 62,509,796 | |||||||
| | | | | | | | | | | |
| | | | | | | | | | | |
| | | | | | | | | | | |
Comprehensive income | ||||||||||
Net income available for common stockholders | $ | 76 | $ | 84 | $ | 49 | ||||
| | | | | | | | | | | |
Other comprehensive income | ||||||||||
Cumulative translation adjustment, before income taxes | 11 | (4 | ) | (10 | ) | |||||
Income taxes related to items of other comprehensive income | — | — | — | |||||||
| | | | | | | | | | | |
Other comprehensive income (loss), net of tax | 11 | (4 | ) | (10 | ) | |||||
| | | | | | | | | | | |
Comprehensive income available for common stockholders | $ | 87 | $ | 80 | $ | 39 | ||||
| | | | | | | | | | | |
| | | | | | | | | | | |
| | | | | | | | | | | |
Comprehensive income attributable to noncontrolling interests | ||||||||||
Net income attributable to noncontrolling interests | $ | 717 | $ | 615 | $ | 366 | ||||
Other comprehensive income—cumulative translation adjustment | 54 | (21 | ) | (53 | ) | |||||
| | | | | | | | | | | |
Comprehensive income attributable to noncontrolling interests | $ | 771 | $ | 594 | $ | 313 | ||||
| | | | | | | | | | | |
| | | | | | | | | | | |
| | | | | | | | | | | |
The following table sets forth our consolidated results of operations as a percent of our total net revenues for the indicated periods:
| | Year Ended December 31, | Year Ended December 31, | ||||||||||||||||||
|---|---|---|---|---|---|---|---|---|---|---|---|---|---|---|---|---|---|---|---|---|
| | 2014 | 2013 | 2012 | 2017 | 2016 | 2015 | ||||||||||||||
Revenues | ||||||||||||||||||||
Trading gains | 25.0 | % | 30.8 | % | 41.2 | % | 2 | % | 12 | % | 23 | % | ||||||||
Commissions and execution fees | 52.6 | % | 46.7 | % | 36.5 | % | ||||||||||||||
Commissions | 38 | % | 44 | % | 52 | % | ||||||||||||||
Interest income | 39.9 | % | 28.2 | % | 23.9 | % | 53 | % | 43 | % | 41 | % | ||||||||
Other (loss) income | –10.6 | % | –0.8 | % | 3.9 | % | ||||||||||||||
Other income (loss) | 20 | % | 7 | % | (10 | )% | ||||||||||||||
| | | | | | | | | | | | | | | | | | | | | |
Total revenues | 106.9 | % | 104.9 | % | 105.6 | % | 113 | % | 106 | % | 106 | % | ||||||||
Interest expense | 6.9 | % | 4.9 | % | 5.6 | % | 13 | % | 6 | % | 6 | % | ||||||||
| | | | | | | | | | | | | | | | | | | | | |
Total net revenues | 100.0 | % | 100.0 | % | 100.0 | % | 100 | % | 100 | % | 100 | % | ||||||||
| | | | | | | | | | | | | | | | | | | | | |
Non-interest expenses | ||||||||||||||||||||
Execution and clearing | 20.3 | % | 22.5 | % | 22.2 | % | 14 | % | 17 | % | 19 | % | ||||||||
Employee compensation and benefits | 19.6 | % | 19.1 | % | 21.6 | % | 15 | % | 17 | % | 19 | % | ||||||||
Occupancy, depreciation and amortization | 3.8 | % | 3.6 | % | 3.4 | % | 3 | % | 4 | % | 4 | % | ||||||||
Communications | 2.3 | % | 2.1 | % | 2.1 | % | 2 | % | 2 | % | 2 | % | ||||||||
General and administrative | 5.6 | % | 10.7 | % | 4.1 | % | 5 | % | 4 | % | 5 | % | ||||||||
Customer bad debt | 0 | % | 0 | % | 12 | % | ||||||||||||||
| | | | | | | | | | | | | | | | | | | | | |
Total non-interest expenses | 51.6 | % | 58.0 | % | 53.4 | % | 38 | % | 45 | % | 61 | % | ||||||||
| | | | | | | | | | | | | | | | | | | | | |
Income before income taxes | 48.4 | % | 42.0 | % | 46.6 | % | 62 | % | 55 | % | 39 | % | ||||||||
Income tax expense | 4.5 | % | 3.1 | % | 2.7 | % | 15 | % | 4 | % | 4 | % | ||||||||
Net Income | 43.9 | % | 38.9 | % | 43.9 | % | 47 | % | 50 | % | 35 | % | ||||||||
Less net income attributable to noncontrolling interests | 39.7 | % | 35.4 | % | 40.4 | % | 42 | % | 44 | % | 31 | % | ||||||||
| | | | | | | | | | | | | | | | | | | | | |
Net income (loss) attributable to common stockholders | 4.2 | % | 3.5 | % | 3.5 | % | ||||||||||||||
Net income available for common stockholders | 4 | % | 6 | % | 4 | % | ||||||||||||||
| | | | | | | | | | | | | | | | | | | | | | |
| | | | | | | | | | | | | | | | | | | | | |
Year Ended December 31, 2014 Compared2017 ("current year") compared to the Year Ended December 31, 20132016 ("prior year")
Net Revenues
Total net revenues, for the current year, ended December 31, 2014 decreased $32.9increased $306 million, or 3%22%, compared to $1,043.3 million from $1,076.2 million during the prior year, ended December 31, 2013.to $1,702 million. The decreaseincrease in net revenues was primarily due to lower trading gainshigher net interest income, other income and currency translation losses,commissions, partially offset by increased net interest income and commissions and execution fees.lower trading gains. Trading volume is an important driver of revenues and costs for both our electronic brokerage and market making segments. During the current year, ended December 31, 2014 our electronic brokerage options contract and stock share volumes in options decreased 4%increased 11% and 50% (largely driven by low-priced U.S. and Hong Kong shares), respectively, while futures contracts and stock sharescontract volume increased 1% and 61%decreased 8%, respectively, as compared to the year-ago period.prior year. Market making trading volumes were significantly down as we began to wind down our market making activities globally during the current year.
Trading Gains.Gains
Trading gains, for the current year, ended December 31, 2014 decreased $70.0$123 million, or 21%75%, compared to $261.2 million from $331.2 million for the prior year, ended December 31, 2013. Asto $40 million. Reflecting the wind-down of our options market makers, we provide liquidity by buying from sellers and selling to buyers. Duringmaking activities during the current year, ended December 31, 2014, our market making operations executed 64.531.3 million trades a decrease of 1% as compared to the number of64.0 million trades executed in the year ended December 31, 2013. Marketprior year. In addition, market making options and futures contract and stock share volumes decreased 15%67%, 14%60%, and 6%45%, respectively, compared to the prior year.
Trading gains were also unfavorably impacted by decreases in volatility and in the actual-to-implied volatility ratio as compared to the year-ago period.
Trading gains were negatively impacted by aprior year. Through our announcement on March 8, 2017, the market making environment with intense competitionsegment had incurred net losses and low volatility. the segment was not expected to return to meaningful profitability; however, the rate of continuing losses was substantially reduced after we began curtailing these activities.
The VIX®, which measures perceived U.S. equity market volatility, was unchanged at 14.2decreased 30% to an average of 11.1 for the current year, ended December 31, 2014 as compared to an average of 15.9 for the year-ago period.prior year. The ratio of actual to implied volatility was up slightly at 79%decreased to an average of 60% for 2014 asthe current year, compared to 77%an average of 83% for 2013. An
Tablethe prior year. Both of Contents
approximate $16 million loss due to a trading errorthese were negative trends for market making performance, but had less of an impact in the third quarter also negatively impacted trading gains.current year than in the prior year as we curtailed our market making activities.
Included in trading gains are net dividends. Dividend income and expense arise from holding market making positions over dates on which dividends are paid to shareholders of record. When a stock pays a dividend, its market price is generally adjusted downward to reflect the value paid, which will not be received by those who purchase stock on or after the ex-dividend date. Hence, the apparent gains and losses due to these price changes, reflecting the value of dividends paid to shareholders, must be taken together with the dividends paid and received, respectively, to accurately reflect the results of our market making activities.
Commissions
Commissions, for the current year, increased $35 million, or 6%, compared to the prior year, to $647 million, driven by higher customer trading volumes in options and stocks, continued customer account growth and higher average commission per customer order. Cleared customer options contract and stock share volumes increased 11% and 51%, respectively, while futures contract volume decreased 9%, compared to the prior year. Total DARTs for cleared and execution-only customers, for the current year, increased 4% to 688 thousand, compared to 660 thousand for the prior year. DARTs for cleared customers, i.e., customers for whom we execute trades, as well as, clear and carry positions, for the current year, increased 5% to 639 thousand, compared to 609 thousand for the prior year. Average commission per DART for cleared customers, for the current year, increased by 1% to $3.97, compared to $3.92 for the prior year, reflecting larger average order sizes in stocks.
Interest Income and Interest Expense
Net interest income (interest income less interest expense), for the current year, increased $156 million, or 30%, compared to the prior year, to $683 million. The increase in net interest income was driven by higher average customer credit and margin loan balances and higher benchmark interest rates.
Net interest income on customer balances, for the current year, increased $141 million, compared to the prior year, driven by a $5.5 billion increase in average customer credit balances, a portion of which were invested in interest-bearing U.S. government securities, a $6.8 billion increase in average customer margin loans, and a 61 basis point increase in the average Federal Funds effective rate to 1.00%, compared to the prior year. As a result of the increases in the Federal Funds effective rate since December 2016, interest expense on customer credit balances increased from the prior year, in part, as certain customer credit balances that were not eligible to earn interest in the prior year became eligible to earn interest in the current year. The increase in benchmark rates also drove higher interest income earned on the investment of customer segregated cash and on margin lending to customers.
We earn income on securities loaned and borrowed to support customer long and short stock holdings in margin accounts. In addition, our Stock Yield Enhancement Program provides an opportunity for customers with fully-paid stock to allow us to lend it out. We pay customers a rebate on the cash collateral generally equal to 50% of the income we earn from lending the shares. We place cash collateral securing the loans in the customer's account.
In the current year, average securities borrowed decreased 5%, to $4.0 billion and average securities loaned increased 35%, to $3.9 billion, compared to the prior year. Net interest earned from securities lending is also affected by the level of demand for securities positions held by our customers and in our market making business. During the current year, net fees earned by our electronic brokerage and market making segments from securities lending transactions increased $5 million, or 3%, compared to the prior year. The increase in net interest income from securities lending transactions was attributable to the electronic brokerage segment. It should be noted that securities lending transactions entered into to support customer activity may produce interest income (expense) that is offset by interest expense (income) related to customer balances.
The Company measures return on interest-earning assets using net interest margin ("NIM"). NIM is computed by dividing the annualized net interest income by the average interest-earning assets for the period. Interest-earning assets consist of cash and securities segregated for regulatory purposes (including U.S. government securities and securities purchased under agreements to resell), customer margin loans, securities borrowed and other interest-earning assets (solely firm assets).
The following table presents net interest income information corresponding to interest-earning assets and interest-bearing liabilities for the three years ended December 31, 2017, 2016 and 2015:
| | Year Ended December 31, | |||||||||
|---|---|---|---|---|---|---|---|---|---|---|
| | 2017 | 2016 | 2015 | |||||||
| | (in millions) | |||||||||
Average interest-earning assets | ||||||||||
Segregated cash and securities | $ | 23,824 | $ | 24,134 | $ | 18,314 | ||||
Customer margin loans | 23,289 | 16,506 | 17,247 | |||||||
Securities borrowed | 3,964 | 4,155 | 3,511 | |||||||
Other interest-earning assets | 2,930 | 2,495 | 2,004 | |||||||
| | | | | | | | | | | |
| $ | 54,007 | $ | 47,290 | $ | 41,076 | |||||
| | | | | | | | | | | |
| | | | | | | | | | | |
| | | | | | | | | | | |
Average interest-bearing liabilities | ||||||||||
Customer credit balances | $ | 45,515 | $ | 39,980 | $ | 34,276 | ||||
Securities loaned | 3,917 | 2,897 | 3,000 | |||||||
| | | | | | | | | | | |
| $ | 49,432 | $ | 42,877 | $ | 37,276 | |||||
| | | | | | | | | | | |
| | | | | | | | | | | |
| | | | | | | | | | | |
Net Interest income | ||||||||||
Segregated cash and securities, net | $ | 226 | $ | 149 | $ | 68 | ||||
Customer margin loans | 392 | 217 | 199 | |||||||
Securities borrowed and loaned, net | 161 | 156 | 149 | |||||||
Customer credit balances | (123 | ) | (12 | ) | (11 | ) | ||||
Other net interest income(1) | 32 | 17 | 20 | |||||||
| | | | | | | | | | | |
Net interest income | $ | 688 | $ | 527 | $ | 425 | ||||
| | | | | | | | | | | |
| | | | | | | | | | | |
| | | | | | | | | | | |
Net interest margin ("NIM") | 1.27 | % | 1.11 | % | 1.03 | % | ||||
| | | | | | | | | | | |
| | | | | | | | | | | |
| | | | | | | | | | | |
Annualized Yields | ||||||||||
Segregated cash and securities | 0.95 | % | 0.62 | % | 0.37 | % | ||||
Customer margin loans | 1.68 | % | 1.31 | % | 1.15 | % | ||||
Customer credit balances | 0.27 | % | 0.03 | % | 0.03 | % | ||||
- (1)
- Includes income from financial instruments which has the same characteristics as interest, but is reported in other income.
Other Income
Other income, for the current year, increased $238 million, or 253%, compared to the prior year, to $332 million, mainly driven by a gain of $110 million from our currency diversification strategy for the current year, compared to a loss of $40 million for the prior year, a gain of $93 million from the remeasurement of our Tax Receivable Agreement liability, payable to Holdings, as a result of the Tax Act, and a $13 million recovery of costs related to the wind-down of our U.S. options market making operations, partially offset by a $12 million net mark-to-market loss on our U.S. government securities portfolio in the current year, compared to $26 million net mark-to-market gain in the prior year. Despite an increase in average medium term interest rates during the current year, the net mark-to-market loss on our U.S. government securities portfolio was only $12 million, reflecting a reduction in the size and average duration of the portfolio. In general, mark-to-market gains and losses on U.S. government securities are expected to reverse when, as intended, these securities are held to maturity. A discussion of our approach to managing foreign currency exposure is contained in Part II, Item 7A of this Annual Report on Form 10-K entitled "Quantitative and Qualitative Disclosures about Market Risk.
Non-Interest Expenses
Non-interest expenses, for the current year, increased $18 million, or 3%, compared to the prior year, to $653 million, mainly due to a $24 million increase in general and administrative expenses and a $7 million increase in employee compensation and benefits, partially offset by a $4 million decrease in occupancy expenses and a $4 million decrease in customer bad debt, compared to the prior year. As a percentage of total net revenues, non-interest expenses were 38% for the current year and 45% for the prior year.
Execution and Clearing
Execution and clearing expenses, for the current year, decreased $3 million, or 1%, compared to the prior year, to $241 million, driven by lower trading volume in our market making segment as we began to wind down our market making activities globally. Market making options and futures contract and stock share volumes decreased 67%, 60% and 45%, respectively, from the prior year. This was largely offset by higher execution and clearing expenses in our electronic brokerage segment, where customer options contract and stock share volumes increased 11% and 50%, respectively. In addition, the electronic brokerage segment received lower liquidity rebates from exchanges operating a make-or-take pricing model, in which we are paid for adding liquidity and charged for removing liquidity, as trading volume shifted away from orders that added liquidity to orders that removed liquidity in the current year compared to the prior year.
Employee Compensation and Benefits
Employee compensation and benefits expenses, for the current year, increased $7 million, or 3%, compared to the prior year, to $249 million, mainly due to one-time exit costs related to the wind-down of our options market making activities and a 5% increase in the average number of employees to 1,213, for the current year, compared to 1,154 for the prior year. Within the operating business segments, we continued to add staff in customer service, legal and compliance, and software development to support electronic brokerage and reduce staff in market making. As we continue to grow, our focus on automation has allowed us to maintain a relatively small staff. As a percentage of total net revenues, employee compensation and benefits expenses were 15% for the current year and 17% for the prior year.
Occupancy, Depreciation and Amortization
Occupancy, depreciation and amortization expenses, for the current year, decreased $4 million, or 8%, compared to the prior year, to $47 million, mainly due to lower office rent expenses and equipment related costs. As a percentage of total net revenues, occupancy, depreciation and amortization expenses were 3% for the current year and 4% for the prior year.
Communications
Communications expenses, for the current year, decreased $2 million, or 7%, compared to the prior year, to $28 million, mainly due to lower costs of data lines to exchanges during the current year as we wound down our market making activities. As a percentage of total net revenues, communications expenses were 2% for both the current year and the prior year.
General and Administrative
General and administrative expenses, for the current year, increased $24 million, or 39%, compared to the prior year, to $86 million, mainly due to a $21 million write-down of the value of exchange trading rights related to the wind-down of our U.S. options market making operations and higher advertising expenditures. As a percentage of total net revenues, general and administrative expenses were 5% for the current year and 4% for the prior year.
Customer Bad Debt
Customer bad debt expense, for the current year, decreased $4 million, or 67%, compared to the prior year, to $2 million.
Income Tax Expense
Income tax expense, for the current year, increased $194 million, or 313%, to $256 million, compared to the prior year, primarily due to the effects of the Tax Act, which was enacted on December 22, 2017. The Tax Act significantly revised U.S. corporate income tax law by, among other things, reducing the corporate income tax rate from 35% to 21% and implementing a modified territorial tax system that includes a one-time transition tax on deemed repatriated earnings of foreign subsidiaries. See Note 10 to the audited consolidated financial statements, in Part II, Item 8 of this Annual Report on Form 10-K.
As a result of the Tax Act, the current year results include a net reduction of approximately $84 million related to the following: (1) the one-time transition tax on deemed repatriation of earnings on some of our foreign subsidiaries resulted in an additional income tax expense of $62 million, to be paid over an eight-year period, (2) the remeasurement of deferred tax assets and liabilities at the reduced corporate income tax rate of 21% resulted in additional income tax expense of $115 million, and (3) in connection with the remeasurement of our deferred tax asset arising from the acquisition of interests in IBG LLC, we also remeasured the related Tax Receivable Agreement liability, payable to Holdings, resulting in the recognition of a $93 million gain, which is reported in other income in the consolidated statements of comprehensive income (see Note 4 to the audited consolidated financial statements in Part II, Item 8 of this Annual Report on Form 10-K).
The following table presents information about our income tax expense for the three years ended December 31, 2017, 2016 and 2015.
| | Year Ended December 31, | |||||||||
|---|---|---|---|---|---|---|---|---|---|---|
| | 2017 | 2016 | 2015 | |||||||
| | (in millions, except %) | |||||||||
Consolidated | ||||||||||
Consolidated income before income taxes | $ | 1,049 | $ | 761 | $ | 458 | ||||
IBG, Inc. stand-alone income before income taxes | 92 | (1) | (1 | ) | — | |||||
Gains (losses) on the Company's common stock held by Operating Companies | — | (1 | ) | 4 | ||||||
| | | | | | | | | | | |
Operating Companies income before income taxes | $ | 957 | $ | 761 | $ | 462 | ||||
| | | | | | | | | | | |
| | | | | | | | | | | |
| | | | | | | | | | | |
Operating Companies | ||||||||||
Income before income taxes | $ | 957 | $ | 761 | $ | 462 | ||||
Income tax expense | 31 | 30 | 25 | |||||||
Income tax expense—effect of the Tax Act | 62 | — | — | |||||||
| | | | | | | | | | | |
Net income available to members | $ | 864 | $ | 731 | $ | 437 | ||||
| | | | | | | | | | | |
| | | | | | | | | | | |
| | | | | | | | | | | |
IBG, Inc. | ||||||||||
Average ownership percentage in IBG LLC | 17.0 | % | 16.2 | % | 15.1 | % | ||||
| | | | | | | | | | | |
Net income available to IBG, Inc. from Operating Companies | $ | 147 | $ | 117 | $ | 67 | ||||
IBG, Inc. stand-alone income before income taxes | 92 | (1) | (1 | ) | — | |||||
| | | | | | | | | | | |
Income before income taxes | 239 | 116 | 67 | |||||||
| | | | | | | | | | | |
Income tax expense | 48 | 32 | 18 | |||||||
Income tax expense—effect of the Tax Act | 115 | — | — | |||||||
| | | | | | | | | | | |
Net income available to common stockholders | $ | 76 | $ | 84 | $ | 49 | ||||
| | | | | | | | | | | |
| | | | | | | | | | | |
| | | | | | | | | | | |
Consolidated income tax expense | ||||||||||
Income tax expense attributable to Operating Companies | $ | 93 | $ | 30 | $ | 25 | ||||
Income tax expense attributable IBG, Inc. | 163 | 32 | 18 | |||||||
| | | | | | | | | | | |
Consolidated income tax expense | $ | 256 | $ | 62 | $ | 43 | ||||
| | | | | | | | | | | |
| | | | | | | | | | | |
| | | | | | | | | | | |
Consolidated effects of the Tax Act | ||||||||||
One-time repatriation tax expense | $ | 62 | $ | — | $ | — | ||||
Remeasurement of U.S. deferred tax assets | 115 | — | — | |||||||
Remeasurement of liability under the Tax Receivable Agreement | (93 | ) | — | — | ||||||
| | | | | | | | | | | |
Total decrease in earnings resulting from the Tax Act | $ | 84 | $ | — | $ | — | ||||
| | | | | | | | | | | |
| | | | | | | | | | | |
| | | | | | | | | | | |
- (1)
- Includes a $93 million gain from the remeasurement of the Tax Receivable Agreement liability as a result of the Tax Act, included in other income.
Our operating results, for the current year, excluding the effects of our currency diversification strategy, the net mark-to-market gains and losses from our U.S. government securities portfolio, the one-time net costs related to the wind-down of our options market making activities, and the remeasurement gain on our Tax Receivable Agreement liability due to the Tax Act, compared to the prior year, were as follows: net revenues were $1,500 million, up 6%; non-interest expenses were $628 million, down 1%; income before income taxes was $872 million, up 13%; and pre-tax profit margin increased to 58% for the current year, from 55% for the prior year.
Year Ended December 31, 2016 compared to the Year Ended December 31, 2015
Net Revenues
Total net revenues, in 2016, increased $207 million, or 17%, compared to 2015, to $1,396 million. The increase in net revenues was primarily due to higher other income (driven by lower losses on our currency diversification strategy and net mark-to-market gains on our U.S. government securities portfolio), and net interest income; partially offset by lower trading gains and commissions. Trading volume is an important driver of revenues and costs for both our electronic brokerage and market making segments. During 2016, our futures contract volume increased 2%, while options contract and stock share volumes each decreased 10%, compared to 2015.
Trading Gains
Trading gains, in 2016, decreased $106 million, or 39%, compared to 2015, to $163 million. As market makers, we provide liquidity by buying from sellers and selling to buyers. During 2016, our market making operations executed 64.0 million trades compared to 65.9 million trades executed in 2015. Market making options and futures contract and stock share volumes decreased 8%, 5%, and 15%, respectively, compared to 2015.
Trading gains were unfavorably impacted by lower trading volumes, a divergence in price behavior among a significant number of individual stocks during the first quarter of 2016, and decreases in volatility and in the actual-to-implied volatility ratio as compared to 2015. The VIX®, which measures perceived U.S. equity market volatility, decreased 5% to an average of 15.9 in 2016, compared to an average of 16.7 in 2015. The ratio of actual to implied volatility decreased to an average of 83% in 2016, compared to an average of 88% in 2015.
Included in trading gains are net dividends. Dividend income and expense arise from holding market making positions over dates on which dividends are paid to shareholders of record. When a stock pays a dividend, its market price is generally adjusted downward to reflect the value paid, which will not be received by those who purchase stock on or after the ex-dividend date. Hence, the apparent gains and losses due to these price changes, reflecting the value of dividends paid to shareholders, must be taken together with the dividends paid and received, respectively, to accurately reflect the results of our market making operations.
Commissions
Commissions, and Execution Fees. Commissions and execution fees for the year ended December 31, 2014 increased $46.7in 2016, decreased $5 million, or 9%1%, to $548.8 million, as compared to the year ended December 31, 2013,2015, to $612 million, driven by mixed customer trading volumes and lower average commission per customer order, but moderated by continued customer account growth and increased customer activity, but moderated by lower commissions per customer order.growth. Cleared customer options and futures contract volumes and stock share volumes increased 25%, 4%decreased 7% and 74%10%, respectively, from the same period last year.while futures contract volume increased 3%, compared to 2015. Total DARTs for cleared and execution-only customers, for the year ended December 31, 2014in 2016, increased 16%2% to 566, as660 thousand, compared to 486647 thousand during the year ended December 31, 2013.2015. DARTs for cleared customers, i.e., customers for whom we execute trades, as well as, clear and carry positions, in 2016, increased 17%3% to 515609 thousand, for the year ended December 31, 2014, as compared to 441589 thousand for the year-ago period.in 2015. Average commission per DART for cleared customers, for the year ended December 31, 2014,in 2016, decreased by 6%4% to $4.16, as$3.92, compared to $4.41 for the same period last year.$4.07 in 2015, reflecting smaller average order sizes across most product types.
Interest Income and Interest Expense.Expense
Net interest income (interest income less interest expense) for the year ended December 31, 2014, in 2016, increased $92.3$102 million, or 37%24%, to $344.0 million, as compared to the year ended December 31, 2013.2015, to $527 million. The increase in net interest income was driven by higher customer cash and margin balances and higher net fees earned from securities lending transactions.
Net interest income on customer balances, in 2016, increased $43.4$100 million, compared to the year-ago period. Average2015, driven by a $5.3 billion increase in average customer cash balances, increased by 20%, to $28.22 billion andthe majority of which were invested in interest-bearing U.S. government securities, while average customer fully secured margin borrowings increased 36% to $16.18 billion, fordecreased $1.5 billion. In addition, the year ended December 31, 2014, as compared to $23.59 billion and $11.88 billion, respectively, for the year ended December 31, 2013. The average Fed Funds effective rate decreasedincreased by approximately two26 basis points to 0.09% for the year ended December 31, 2014, as0.39% in 2016, compared to the prior year.2015.
We earn feesincome on securities loaned and borrowed to support customer long and short stock holdings in margin accounts. In addition, our Stock Yield Enhancement Program provides an opportunity for customers with fully-paid stock to allow IBus to lend it out. In exchange for lending out their stock, ourWe pay customers receivea rebate on the cash collateral generally equal to 50% of the stock loan fees. IB placesincome we earn from lending the shares. We place cash collateral securing the loans in the customer's account.
In the market making segment, as a result of the way we have integrated our market making and securities lending systems, our trading income and our net interest income are interchangeable and depend on the mix of market making positions in our portfolio. When implied interest rates in the equity and equity options and futures markets exceed the actual interest rates available to us, our market making systems tend to buy stock and sell it forward, which produces higher trading gains and lower net interest income. When these rates are inverted, our market making systems tend to sell stock and buy it forward, which produces lower trading gains and higher net interest income.
AverageIn 2016, average securities borrowed decreasedincreased by 8%19%, to $3.18$4.2 billion and average securities loaned increaseddecreased by 34%3%, to $2.93$2.9 billion, for the year ended December 31, 2014 from the same period last year.compared to 2015. Net interest earned from securities lending is also affected by the level of demand for securities positions in our market making business and held by our market making companies and our customers. During the year ended December 31, 2014,2016, net fees earned by our electronic brokerage and market making segments from securities
lending transactions increased by 49%,$6 million or $46.5 million, as4%, compared to the year ended December 31, 2013.2015. The bulk of the increase in net interest income from securities lending transactions came fromwas attributable to the brokeragemarket making segment.
Other Income.Income
Other income, for the year ended December 31, 2014, decreased $101.9in 2016, increased $216 million, to $94 million, compared to a loss of $110.7$122 million as compared to the year ended December 31, 2013. To improve the transparency of the financial impact ofin 2015, mainly driven by $166 million lower losses on our currency diversification strategy we report currency translation(loss of $40 million in 2016, compared to a loss of $206 million in 2015), and $26 million net mark-to-market gains on our U.S. government securities portfolio in 2016, compared to $33 million net mark-to-market losses in 2015 due to a decline in average medium term interests rates during 2016; partially offset by the non-recurrence of an $18 million gain from hedging activities related to the Swiss franc event in 2015. In general, mark-to-market gains and losses relatedon U.S. government securities are expected to the GLOBALreverse when, as other income instead of trading gains, as previously presented. The decrease in other income was driven by a $93.6 million increase in currency translation lossesintended, these securities are held to a $185.2 loss million during the year ended December 31, 2014, compared to a $91.6 million loss in 2013.maturity. A discussion of our approach to managing foreign currency exposure is contained in Part II, Item 7A of this Annual Report on Form 10-K entitled "Quantitative and Qualitative Disclosures about Market Risk." Other income was also impacted by lower market date fee income, losses on other investments and lower dividend income paid on an investment, partially offset by exposure fees collected from customers.
Non-Interest Expenses
Non-interest expenses, for the year ended December 31, 2014,in 2016, decreased by $87.7$96 million, or 14%13%, compared to $537.22015, to $635 million, from $624.9 million, during the year ended December 31, 2013. The decrease was primarilymainly due to lowerthe non-recurrence of $137 million in customer bad debt expense due to the Swiss franc event in 2015, as described above; partially offset by higher execution and clearing feesexpenses and general and administrativefixed expenses. As a percentage of total net revenues, non-interest expenses decreased to 51% for the year ended December 31, 2014 from 58%were 45% in the year ago period.2016 and 61% in 2015.
Execution and Clearing.Clearing
Execution and clearing expenses, for the year ended December 31, 2014, decreased $31.0in 2016, increased $13 million, or 13%6%, to $211.5 million, as compared to 2015, to $244 million, driven by higher trading volume in futures in the year ended December 31, 2013. The decrease reflects lower overall trading volumeselectronic brokerage segment and a reduction in options and an increaseliquidity rebates from exchanges operating a make-or-take pricing model, in our executions on exchanges and ECN's with make-or-take revenue models. Under the make-or take fee model,which we are paid for providing liquidity.adding liquidity and charged for removing liquidity, as the options trading volume shifted away from orders that added liquidity to orders that removed liquidity in 2016 compared to 2015.
Employee Compensation and Benefits.Benefits
Employee compensation and benefits expenses, for the year ended December 31, 2014, decreased by $0.5in 2016, increased $15 million, to $204.8 million, asor 7%, compared to 2015, to $242 million, mainly due to an 11% increase in the year ended December 31, 2013, largely a result of lower insurance related expenses, partially offset by increased salaries. The number of employees increased 9% to 960 for the year ended1,204, compared to 1,087 as of December 31, 2014, as compared to 880 for the corresponding period in 2013.2015. Within the operating business segments, we continued to add staff in customer service, legal and compliance, and software development to support electronic brokerage and reduce staff in market making. As we continue to grow, our focus on automation has allowed us to maintain a relatively small staff. As a percentage of total net revenues, employee compensation and benefits expenses were 20%17% in 2016 and 19% for the year ended December 31, 2014 and 2013, respectively.in 2015.
Occupancy, Depreciation and Amortization.Amortization
Occupancy, depreciation and amortization expenses, in 2016, increased $0.5$7 million, to $39.4 million for the year ended December 31, 2014 asor 16%, compared to 2015, to $51 million, mainly due to higher office rent expenses during 2016 as we continue to increase the year ended December 31, 2013.number of employees and expand into other regions. As a percentage of total net revenues, occupancy, depreciation and amortization expense wasexpenses were 4% for both 20142016 and 2013.2015.
Communications.Communications
Communications expenses, in 2016, increased $1.1$5 million, or 5%20%, to $24.2 million for the year ended December 31, 2014, as compared to the year ended December 31, 2013.2015, to $30 million, mainly due to higher costs of data lines to exchanges during 2016. As a percentage of total net revenues, communications expenses were 2% for both 20142016 and 2013.2015.
General and Administrative.Administrative
General and administrative expenses, for the year ended December 31, 2014, decreased $57.8in 2016, increased $4 million, or 50%7%, to $57.3 million, as compared to the year ended December 31, 2013. The decrease in2015, to $62 million, mainly due to higher professional services fees and expenses related to legal and regulatory matters. As a percentage of total net revenues, general and administrative expenses waswere 4% in 2016 and 5% in 2015.
Customer Bad Debt
Customer bad debt expense, in 2016, decreased $140 million, or 96%, compared to 2015, to $6 million, primarily due to the non-recurrence of unsecured customer bad debt recognizedlosses of $137 million caused by the sudden move in 2013 relatedthe value of the Swiss franc in 2015, as described below.
Sudden Move in the Value of the Swiss Franc
On January 15, 2015, in an unprecedented action, the Swiss National Bank removed a previously instituted and repeatedly confirmed cap of the currency relative to the Singapore stock issue,euro, causing a sudden move in the value of the Swiss franc. Several of our customers holding currency futures and spot positions suffered losses in excess of their deposits with us. We took immediate action to hedge our exposure to the foreign currency receivables from these customers. As of December 31, 2017, we have incurred cumulative losses, net of hedging activity and debt collection efforts, of $116 million. We continue to actively pursue collection of the debts. The ultimate effect of this incident on our results will depend upon the outcome of our debt collection efforts.
Income Tax Expense
Income tax expense, in 2016, increased $19 million, or 44%, to $62 million, compared to 2015, as income before taxes increased $303 million, or 66%, during the same period.
Our operating results, in 2016, excluding the effects of our currency diversification strategy, the net mark-to-market gains and losses from our U.S. government securities portfolio and the Swiss franc related customer losses in 2015 were as follows: net revenues were $1,410 million, unchanged from 2015; non-interest expenses were $635 million, up 7%; income before income taxes was $775 million, down 5%; and pre-tax profit margin decreased to 55% in 2016, from 58% in 2015.
described above in the "Financial Overview", partially offset by increases in advertisingTrading Volumes and professional services expenses.
Income Tax ExpenseBrokerage Statistics
Income tax expense for the year ended December 31, 2014 increased $13.6 million, or 40%, compared to income tax expense for the year ended December 31, 2013, while income before taxes increased by $54.8 million, or 12%, during the same period. The increase in income taxes is due to additional amortization of the deferred tax asset arising from the step-up in tax basis of our interests in IBG LLC, as a result of the 2013 and 2014 membership interest redemptions from Holdings. In addition, in 2013, we recognized greater tax benefits related to prior years, than in 2014.
Year Ended December 31, 2013 Compared to the Year Ended December 31, 2012
To provide meaningful comparisons, prior period amounts have been revised for changes in the presentation of currency translation classifications.
Net Revenues
Total net revenues for the year ended December 31, 2013 decreased $54.3 million or 5%, to $1,076.2 million from $1,130.5 million during the year ended December 31, 2012. The decrease in net revenues was primarily due to lower trading gains compared to the prior year, partially offset by increases in commissions and execution fees and net interest income. Trading volume is an important driver of revenues and costs for both our electronic brokerage and market making segments. During the year ended December 31, 2013 our volumes in options decreased 6% from prior year levels while futures contracts and stock shares volumes increased 23% and 45%, respectively.
Trading Gains. Trading gains for the year ended December 31, 2013 decreased $134.8 million, or 29%, to $331.2 million from $466.0 million for the year ended December 31, 2012. As market makers, we provide liquidity by buying from sellers and selling to buyers. During the year ended December 31, 2013, our market making operations executed 65.3 million trades, an increase of 8% as compared to the number of trades executed in the year ended December 31, 2012. Market making options contract volume decreased 12% while futures contracts and stock shares volumes increased 44% and 38%, respectively, as compared to the year-ago period.
Trading gains were negatively impacted by a market making environment with persistent low volatility and low actual-to-implied volatility. The VIX®, which measures perceived U.S. equity market volatility, decreased by 15% in the year ended December 31, 2013 as compared to the year-ago period.
Included in trading gains are net dividends. Dividend income and expense arise from holding market making positions over dates on which dividends are paid to shareholders of record. When a stock pays a dividend, its market price is generally adjusted downward to reflect the value paid, which will not be received by those who purchase stock after the ex-dividend date. Hence, the apparent gains and losses due to these price changes, reflecting the value of dividends paid to shareholders, must be taken together with the dividends paid and received, respectively, to accurately reflect the results of our market making operations.
Commissions and Execution Fees. Commissions and execution fees for the year ended December 31, 2013 increased $89.5 million, or 22%, to $502.1 million, as compared to the year ended December 31, 2012, driven by continued customer account growth and increased customer activity. Cleared customer options, futures and stock volumes increased 25%, 20% and 45%, respectively. Total DARTs for cleared and execution-only customers for the year ended December 31, 2013 increased 18% to 486 thousand, as compared to 413 thousand during the year ended December 31, 2012. Average commission per DART for cleared customers, for the year ended December 31, 2013, increased by 6%
to $4.41, as compared to $4.17 for the year ended December 31, 2012. DARTs for cleared customers, i.e., customers for whom we execute trades as well as clear and carry positions, increased 15% to 441 thousand, for the year ended December 31, 2013, as compared to 384 thousand for the year ended December 31, 2012.
Interest Income and Interest Expense. Net interest income (interest income less interest expense) for the year ended December 31, 2013 increased $43.4 million, or 21%, to $251.7 million, as compared to the year ended December 31, 2012. The increase in net interest income was driven by higher customer cash and margin balances and higher net fees earned from securities borrowed and loaned transactions.
Net interest income on customer balances increased $18.4 million compared to the year-ago quarter. Average customer cash balances increased by 21%, to $23.59 billion, while average customer fully secured margin borrowings increased 37% to $11.88 billion, for the year ended December 31, 2013, as compared to $19.54 billion and $8.67 billion, respectively, for the year ended December 31, 2012. The average Fed Funds effective rate decreased by approximately three basis points to 0.11% for the year ended December 31, 2013.
We earn fees on securities loaned and borrowed to support customer long and short stock holdings in margin accounts. In addition, our Stock Yield Enhancement Program provides an opportunity for customers with fully-paid stock to allow IB to lend it out. In exchange for lending out their stock, our customers receive generally 50% of the stock loan fees. IB places cash collateral securing the loans in the customer's account.
In the market making segment, as a result of the way we have integrated our market making and securities lending systems, our trading income and our net interest income are interchangeable and depend on the mix of market making positions in our portfolio. When implied interest rates in the equity and equity options and futures markets exceed the actual interest rates available to us, our market making systems tend to buy stock and sell it forward, which produces higher trading gains and lower net interest income. When these rates are inverted, our market making systems tend to sell stock and buy it forward, which produces lower trading gains and higher net interest income.
Average securities borrowed increased by 19%, to $3.47 billion and average securities loaned increased by 24%, to $2.19 billion, for the year ended December 31, 2013. Net interest earned from securities borrowed and loaned is also affected by the level of demand for securities positions held by our market making companies and by our customers. During the year ended December 31, 2013, net fees earned by our brokerage and market making segments from securities borrowed and loaned transactions increased $26.4 million as compared to the year ended December 31, 2012.
Other Income. Other income, for the year ended December 31, 2013, decreased $52.4 million, or 120%, to a loss of $8.8 million, as compared to the year ended December 31, 2012. To improve the transparency of the financial impact from our currency diversification strategy, we report currency translation gains and losses related to the GLOBAL as other income instead of trading gains, as previously presented. The decrease in other income was driven by a $61.7 million increase in currency to a $91.6 million loss during the year ended December 31, 2013, compared to a $29.9 million loss in 2012. A discussion of our approach to managing foreign currency exposure is contained in Part II, Item 7A of this Annual Report on Form 10-K entitled "Quantitative and Qualitative Disclosures about Market Risk."
Non-Interest Expenses
Non-interest expenses, for the year ended December 31, 2013, increased by $21.4 million, or 4%, to $624.9 million from $603.5 million, during the year ended December 31, 2012. The increase was primarily due to higher customer bad debt expenses (contained in general and administrative expenses),
partially offset by lower employee compensation and benefits expenses and lower execution and clearing fees in the market making segment. As a percentage of total net revenues, non-interest expenses increased to 58% for the year ended December 31, 2013 from 53% in 2012.
Execution and Clearing. Execution and clearing expenses for the year ended December 31, 2013, decreased $8.5 million, or 3%, to $242.5 million, as compared to the year ended December 31, 2012. The decrease reflects lower options volume in the market making segment, partially offset by higher volume across product types and market data fees in the electronic brokerage segment.
Employee Compensation and Benefits. Employee compensation and benefits expenses, for the year ended December 31, 2013, decreased by $39.2 million, or 16%, to $205.3 million, as compared to the year ended December 31, 2012, reflecting the non-recurrence of a special employee Stock Incentive Plan grant made in 2012, a payment made on unvested shares in our Stock Incentive plan in lieu of the December 2012 special dividend and lower incentive compensation related expenses. The number of employees decreased 1% to 880 for the year ended December 31, 2013, as compared to 891 for the corresponding period in 2012. Within the operating segments, we continued to add staff in electronic brokerage and reduce staff in market making. As we continue to grow, our focus on automation has allowed us to maintain a relatively small staff. As a percentage of total net revenues, employee compensation and benefits expenses were 19% and 22% for the year ended December 31, 2013 and 2012, respectively.
Occupancy, Depreciation and Amortization. Occupancy, depreciation and amortization expenses increased $0.1 million to $38.9 million for the year ended December 31, 2013 as compared to the year ended December 31, 2012. As a percentage of total net revenues, occupancy, depreciation and amortization expense was 4% and 3% for the years ended December 31, 2013 and 2012, respectively.
Communications. Communications expenses decreased $0.2 million, or 1%, to $23.1 million for the year ended December 31, 2013, as compared to the year ended December 31, 2012. As a percentage of total net revenues, communications expenses were 2% for both 2013 and 2012.
General and Administrative. General and administrative expenses, for the year ended December 31, 2013, increased $69.2 million to $115.1 million, as compared to the year ended December 31, 2012. The increase in general and administrative expenses was primarily due to increases in customer bad debt related to the Singapore stock issue, as described above in the "Financial Overview" section.
Income Tax Expense
Income tax expense for the year ended December 31, 2013 increased $3.7 million, or 12%, compared to income tax expense for the year ended December 31, 2012, while income before taxes decreased by $75.5 million, or 14%, during the same period. In 2012, we recognized greater tax benefits related to prior years, than in 2013.
Supplemental Information
The following tables present historical trading volumes and brokerage statistics for our business. However, volumes are not the only drivers in our business.
TRADE VOLUMES:
(in 000's, except %)
Period | Market Making Trades | % Change | Brokerage Cleared Trades | % Change | Brokerage Non Cleared Trades | % Change | Total Trades | % Change | Avg. Trades per U.S. Trading Day | Market Making Trades | % Change | Brokerage Cleared Trades | % Change | Brokerage Non Cleared Trades | % Change | Total Trades | % Change | Avg. Trades per U.S. Trading Day | ||||||||||||||||||||||||||||||||||||||
|---|---|---|---|---|---|---|---|---|---|---|---|---|---|---|---|---|---|---|---|---|---|---|---|---|---|---|---|---|---|---|---|---|---|---|---|---|---|---|---|---|---|---|---|---|---|---|---|---|---|---|---|---|---|---|---|---|
2010 | 75,169 | 133,658 | 18,732 | 227,559 | 905 | |||||||||||||||||||||||||||||||||||||||||||||||||||
2011 | 63,602 | –15 | % | 160,567 | 20 | % | 19,187 | 2 | % | 243,356 | 7 | % | 968 | |||||||||||||||||||||||||||||||||||||||||||
2012 | 60,421 | –5 | % | 150,000 | –7 | % | 16,118 | –16 | % | 226,540 | –7 | % | 904 | |||||||||||||||||||||||||||||||||||||||||||
2013 | 65,320 | 8 | % | 173,849 | 16 | % | 18,489 | 15 | % | 257,658 | 14 | % | 1,029 | 65,320 | 173,849 | 18,489 | 257,658 | 1,029 | ||||||||||||||||||||||||||||||||||||||
2014 | 64,530 | –1 | % | 206,759 | 19 | % | 18,055 | –2 | % | 289,344 | 12 | % | 1,155 | 64,530 | (1 | )% | 206,759 | 19 | % | 18,055 | (2 | )% | 289,344 | 12 | % | 1,155 | ||||||||||||||||||||||||||||||
2015 | 65,937 | 2 | % | 242,846 | 17 | % | 18,769 | 4 | % | 327,553 | 13 | % | 1,305 | |||||||||||||||||||||||||||||||||||||||||||
2016 | 64,038 | (3 | )% | 259,932 | 7 | % | 16,515 | (12 | )% | 340,485 | 4 | % | 1,354 | |||||||||||||||||||||||||||||||||||||||||||
2017 | 31,282 | (51 | )% | 265,501 | 2 | % | 14,835 | (10 | )% | 311,618 | (8 | )% | 1,246 | |||||||||||||||||||||||||||||||||||||||||||
CONTRACT AND SHARE VOLUMES:
(in 000's, except %)
TOTAL
Period | Options (contracts) | % Change | Futures (contracts) | % Change | Stocks (shares) | % Change | Options (contracts) | % Change | Futures(1) (contracts) | % Change | Stocks (shares) | % Change | ||||||||||||||||||||||||||
|---|---|---|---|---|---|---|---|---|---|---|---|---|---|---|---|---|---|---|---|---|---|---|---|---|---|---|---|---|---|---|---|---|---|---|---|---|---|---|
2010 | 678,856 | 96,193 | 84,469,874 | |||||||||||||||||||||||||||||||||||
2011 | 789,370 | 16 | % | 106,640 | 11 | % | 77,730,974 | –8 | % | |||||||||||||||||||||||||||||
2012 | 698,140 | –12 | % | 98,801 | –7 | % | 65,872,960 | –15 | % | |||||||||||||||||||||||||||||
2013 | 659,673 | –6 | % | 121,776 | 23 | % | 95,479,739 | 45 | % | 659,673 | 121,776 | 95,479,739 | ||||||||||||||||||||||||||
2014 | 631,265 | –4 | % | 123,048 | 1 | % | 153,613,174 | 61 | % | 631,265 | (4 | )% | 123,048 | 1 | % | 153,613,174 | 61 | % | ||||||||||||||||||||
2015 | 634,388 | 0 | % | 140,668 | 14 | % | 172,742,520 | 12 | % | |||||||||||||||||||||||||||||
2016 | 572,834 | (10 | )% | 143,287 | 2 | % | 155,439,227 | (10 | )% | |||||||||||||||||||||||||||||
2017 | 395,885 | (31 | )% | 124,123 | (13 | )% | 220,247,921 | 42 | % | |||||||||||||||||||||||||||||
MARKET MAKING
Period | Options (contracts) | % Change | Futures(1) (contracts) | % Change | Stocks (shares) | % Change | |||||||||||||
|---|---|---|---|---|---|---|---|---|---|---|---|---|---|---|---|---|---|---|---|
2013 | 404,490 | 18,184 | 12,849,729 | ||||||||||||||||
2014 | 344,741 | (15 | )% | 15,668 | (14 | )% | 12,025,822 | (6 | )% | ||||||||||
2015 | 335,406 | (3 | )% | 14,975 | (4 | )% | 15,376,076 | 28 | % | ||||||||||
2016 | 307,377 | (8 | )% | 14,205 | (5 | )% | 13,082,887 | (15 | )% | ||||||||||
2017 | 102,025 | (67 | )% | 5,696 | (60 | )% | 7,139,622 | (45 | )% | ||||||||||
BROKERAGE TOTAL
Period | Options (contracts) | % Change | Futures (contracts) | % Change | Stocks (shares) | % Change | |||||||||||||
|---|---|---|---|---|---|---|---|---|---|---|---|---|---|---|---|---|---|---|---|
2010 | 435,184 | 15,371 | 19,165,000 | ||||||||||||||||
2011 | 503,053 | 16 | % | 15,519 | 1 | % | 11,788,769 | –38 | % | ||||||||||
2012 | 457,384 | –9 | % | 12,660 | –18 | % | 9,339,465 | –21 | % | ||||||||||
2013 | 404,490 | –12 | % | 18,184 | 44 | % | 12,849,729 | 38 | % | ||||||||||
2014 | 344,741 | –15 | % | 15,668 | –14 | % | 12,025,822 | –6 | % | ||||||||||
Period | Options (contracts) | % Change | Futures(1) (contracts) | % Change | Stocks (shares) | % Change | |||||||||||||
|---|---|---|---|---|---|---|---|---|---|---|---|---|---|---|---|---|---|---|---|
2013 | 255,183 | 103,592 | 82,630,010 | ||||||||||||||||
2014 | 286,524 | 12 | % | 107,380 | 4 | % | 141,587,352 | 71 | % | ||||||||||
2015 | 298,982 | 4 | % | 125,693 | 17 | % | 157,366,444 | 11 | % | ||||||||||
2016 | 265,457 | (11 | )% | 129,082 | 3 | % | 142,356,340 | (10 | )% | ||||||||||
2017 | 293,860 | 11 | % | 118,427 | (8 | )% | 213,108,299 | 50 | % | ||||||||||
Notes:
- (1)
- Futures contract volume includes options on
futuresfutures.
BROKERAGE TOTAL
Period | Options (contracts) | % Change | Futures (contracts) | % Change | Stocks (shares) | % Change | |||||||||||||
|---|---|---|---|---|---|---|---|---|---|---|---|---|---|---|---|---|---|---|---|
2010 | 243,672 | 80,822 | 65,304,874 | ||||||||||||||||
2011 | 286,317 | 18 | % | 91,121 | 13 | % | 65,942,205 | 1 | % | ||||||||||
2012 | 240,756 | –16 | % | 86,141 | –5 | % | 56,533,495 | –14 | % | ||||||||||
2013 | 255,183 | 6 | % | 103,592 | 20 | % | 82,630,010 | 46 | % | ||||||||||
2014 | 286,524 | 12 | % | 107,380 | 4 | % | 141,587,352 | 71 | % | ||||||||||
BROKERAGE CLEARED
Period | Options (contracts) | % Change | Futures (contracts) | % Change | Stocks (shares) | % Change | Options (contracts) | % Change | Futures(1) (contracts) | % Change | Stocks (shares) | % Change | ||||||||||||||||||||||||||
|---|---|---|---|---|---|---|---|---|---|---|---|---|---|---|---|---|---|---|---|---|---|---|---|---|---|---|---|---|---|---|---|---|---|---|---|---|---|---|
2010 | 103,054 | 79,144 | 62,077,741 | |||||||||||||||||||||||||||||||||||
2011 | 145,993 | 42 | % | 89,610 | 13 | % | 63,098,072 | 2 | % | |||||||||||||||||||||||||||||
2012 | 144,539 | –1 | % | 84,794 | –5 | % | 54,371,351 | –14 | % | |||||||||||||||||||||||||||||
2013 | 180,660 | 25 | % | 101,732 | 20 | % | 78,829,785 | 45 | % | 180,660 | 101,732 | 78,829,785 | ||||||||||||||||||||||||||
2014 | 225,662 | 25 | % | 106,074 | 4 | % | 137,153,132 | 74 | % | 225,662 | 25 | % | 106,074 | 4 | % | 137,153,132 | 74 | % | ||||||||||||||||||||
2015 | 244,356 | 8 | % | 124,206 | 17 | % | 153,443,988 | 12 | % | |||||||||||||||||||||||||||||
2016 | 227,413 | (7 | )% | 128,021 | 3 | % | 138,523,932 | (10 | )% | |||||||||||||||||||||||||||||
2017 | 253,304 | 11 | % | 116,858 | (9 | )% | 209,435,662 | 51 | % | |||||||||||||||||||||||||||||
Notes:
- (1)
- Futures contract volume includes options on
futuresfutures.
BROKERAGE STATISTICS:
(in 000's, except % and where noted)
| | 4Q2014 | 4Q2013 | % Change | 4Q2017 | 4Q2016 | % Change | |||||||||||||||||||||||||||||||||||||||||||||||||||||||||||||||||||||||||||||||||||||||||||||||||||||||||||||||||||||||||||||||||||||||||||||||||||||||||||||||||||||||||||||||||||||||||||||||||||||||||||||||||||||||||||||||||||||||||||||||||||||||||||||||||||||||||||||||||||||||||||||||||||||||||||||||||||||||||||||||||||||||||||||||||||||||||||||||||||||||||||||||||||||||||||||||||||||||||||||||||||||||||||||||||||||||||||||||||||||||||||||||||||||||||||||||||||||||||||||||||||||||||||||||||||||||||||||||||||||||||||||||||||||||||||||||||||||||||||||||||||||||||||||||||||||||||||||||||||||||||||||||||||||||||||||||||||||||||||||||||||||||||||||||||||||||||||||||||||||||||||||||||||||||||||||||||||||||||||||||||||||||||||||||||||||||||||||||||||||||||||||||||||||||||||||||||||||||||||||||||||||||||||||||||||||||||||||||||||||||||||||||||||||||||||||||||||||||||||||||||||||||||||||||||||||||||||||||||||||||||||||||||||||||||||||||||||||||||||||||||||||||||||||||||||||||||||||||||
|---|---|---|---|---|---|---|---|---|---|---|---|---|---|---|---|---|---|---|---|---|---|---|---|---|---|---|---|---|---|---|---|---|---|---|---|---|---|---|---|---|---|---|---|---|---|---|---|---|---|---|---|---|---|---|---|---|---|---|---|---|---|---|---|---|---|---|---|---|---|---|---|---|---|---|---|---|---|---|---|---|---|---|---|---|---|---|---|---|---|---|---|---|---|---|---|---|---|---|---|---|---|---|---|---|---|---|---|---|---|---|---|---|---|---|---|---|---|---|---|---|---|---|---|---|---|---|---|---|---|---|---|---|---|---|---|---|---|---|---|---|---|---|---|---|---|---|---|---|---|---|---|---|---|---|---|---|---|---|---|---|---|---|---|---|---|---|---|---|---|---|---|---|---|---|---|---|---|---|---|---|---|---|---|---|---|---|---|---|---|---|---|---|---|---|---|---|---|---|---|---|---|---|---|---|---|---|---|---|---|---|---|---|---|---|---|---|---|---|---|---|---|---|---|---|---|---|---|---|---|---|---|---|---|---|---|---|---|---|---|---|---|---|---|---|---|---|---|---|---|---|---|---|---|---|---|---|---|---|---|---|---|---|---|---|---|---|---|---|---|---|---|---|---|---|---|---|---|---|---|---|---|---|---|---|---|---|---|---|---|---|---|---|---|---|---|---|---|---|---|---|---|---|---|---|---|---|---|---|---|---|---|---|---|---|---|---|---|---|---|---|---|---|---|---|---|---|---|---|---|---|---|---|---|---|---|---|---|---|---|---|---|---|---|---|---|---|---|---|---|---|---|---|---|---|---|---|---|---|---|---|---|---|---|---|---|---|---|---|---|---|---|---|---|---|---|---|---|---|---|---|---|---|---|---|---|---|---|---|---|---|---|---|---|---|---|---|---|---|---|---|---|---|---|---|---|---|---|---|---|---|---|---|---|---|---|---|---|---|---|---|---|---|---|---|---|---|---|---|---|---|---|---|---|---|---|---|---|---|---|---|---|---|---|---|---|---|---|---|---|---|---|---|---|---|---|---|---|---|---|---|---|---|---|---|---|---|---|---|---|---|---|---|---|---|---|---|---|---|---|---|---|---|---|---|---|---|---|---|---|---|---|---|---|---|---|---|---|---|---|---|---|---|---|---|---|---|---|---|---|---|---|---|---|---|---|---|---|---|---|---|---|---|---|---|---|---|---|---|---|---|---|---|---|---|---|---|---|---|---|---|---|---|---|---|---|---|---|---|---|---|---|---|---|---|---|---|---|---|---|---|---|---|---|---|---|---|---|---|---|---|---|---|---|---|---|---|---|---|---|---|---|---|---|---|---|---|---|---|---|---|---|---|---|---|---|---|---|---|---|---|---|---|---|---|---|---|---|---|---|---|---|---|---|---|---|---|---|---|---|---|---|---|---|---|---|---|---|---|---|---|---|---|---|---|---|---|---|---|---|---|---|---|---|---|---|---|---|---|---|---|---|---|---|---|---|---|---|---|---|---|---|---|---|---|---|---|---|---|---|---|---|---|---|---|---|---|---|---|---|---|---|---|---|---|---|---|---|---|---|---|---|---|---|---|---|---|---|---|---|---|---|---|---|---|---|---|---|---|---|---|---|---|---|---|---|---|---|---|---|---|---|---|---|---|---|---|---|---|---|---|---|---|---|---|---|---|---|---|---|---|---|---|---|---|---|---|---|---|---|---|---|---|---|---|---|---|---|---|---|---|---|---|---|---|---|---|---|---|---|---|---|---|---|---|---|---|---|---|---|---|---|---|---|---|---|---|---|---|---|---|---|---|---|---|---|---|---|---|---|---|---|---|---|---|---|---|---|---|---|---|---|---|---|---|---|---|---|---|---|---|---|---|---|---|---|---|---|---|---|---|---|---|---|---|---|---|---|---|---|---|---|---|---|---|---|---|---|---|---|---|---|---|---|---|---|---|---|---|---|---|---|---|---|---|---|---|---|---|---|---|---|---|---|---|---|---|---|---|---|---|---|---|---|---|---|---|---|---|---|---|---|---|---|---|---|---|---|---|---|---|---|---|---|---|---|---|---|---|---|---|---|---|---|---|---|---|---|---|---|---|---|---|---|---|---|---|---|---|---|---|---|---|---|---|---|---|---|---|---|---|---|---|---|---|---|---|---|---|---|---|---|---|---|---|---|---|---|---|---|---|---|---|---|---|---|---|---|---|---|---|---|---|---|---|---|---|---|---|---|---|---|---|---|---|---|---|---|---|---|---|---|---|---|---|---|---|---|---|---|
Year over Year | |||||||||||||||||||||||||||||||||||||||||||||||||||||||||||||||||||||||||||||||||||||||||||||||||||||||||||||||||||||||||||||||||||||||||||||||||||||||||||||||||||||||||||||||||||||||||||||||||||||||||||||||||||||||||||||||||||||||||||||||||||||||||||||||||||||||||||||||||||||||||||||||||||||||||||||||||||||||||||||||||||||||||||||||||||||||||||||||||||||||||||||||||||||||||||||||||||||||||||||||||||||||||||||||||||||||||||||||||||||||||||||||||||||||||||||||||||||||||||||||||||||||||||||||||||||||||||||||||||||||||||||||||||||||||||||||||||||||||||||||||||||||||||||||||||||||||||||||||||||||||||||||||||||||||||||||||||||||||||||||||||||||||||||||||||||||||||||||||||||||||||||||||||||||||||||||||||||||||||||||||||||||||||||||||||||||||||||||||||||||||||||||||||||||||||||||||||||||||||||||||||||||||||||||||||||||||||||||||||||||||||||||||||||||||||||||||||||||||||||||||||||||||||||||||||||||||||||||||||||||||||||||||||||||||||||||||||||||||||||||||||||||||||||||||||||||||||||||||||||||
Total Accounts | 281 | 239 | 18 | % | 483 | 385 | 25 | % | |||||||||||||||||||||||||||||||||||||||||||||||||||||||||||||||||||||||||||||||||||||||||||||||||||||||||||||||||||||||||||||||||||||||||||||||||||||||||||||||||||||||||||||||||||||||||||||||||||||||||||||||||||||||||||||||||||||||||||||||||||||||||||||||||||||||||||||||||||||||||||||||||||||||||||||||||||||||||||||||||||||||||||||||||||||||||||||||||||||||||||||||||||||||||||||||||||||||||||||||||||||||||||||||||||||||||||||||||||||||||||||||||||||||||||||||||||||||||||||||||||||||||||||||||||||||||||||||||||||||||||||||||||||||||||||||||||||||||||||||||||||||||||||||||||||||||||||||||||||||||||||||||||||||||||||||||||||||||||||||||||||||||||||||||||||||||||||||||||||||||||||||||||||||||||||||||||||||||||||||||||||||||||||||||||||||||||||||||||||||||||||||||||||||||||||||||||||||||||||||||||||||||||||||||||||||||||||||||||||||||||||||||||||||||||||||||||||||||||||||||||||||||||||||||||||||||||||||||||||||||||||||||||||||||||||||||||||||||||||||||||||||||||||||||||||||||||||||
Customer Equity (in billions)* | $ | 56.7 | $ | 45.7 | 24 | % | |||||||||||||||||||||||||||||||||||||||||||||||||||||||||||||||||||||||||||||||||||||||||||||||||||||||||||||||||||||||||||||||||||||||||||||||||||||||||||||||||||||||||||||||||||||||||||||||||||||||||||||||||||||||||||||||||||||||||||||||||||||||||||||||||||||||||||||||||||||||||||||||||||||||||||||||||||||||||||||||||||||||||||||||||||||||||||||||||||||||||||||||||||||||||||||||||||||||||||||||||||||||||||||||||||||||||||||||||||||||||||||||||||||||||||||||||||||||||||||||||||||||||||||||||||||||||||||||||||||||||||||||||||||||||||||||||||||||||||||||||||||||||||||||||||||||||||||||||||||||||||||||||||||||||||||||||||||||||||||||||||||||||||||||||||||||||||||||||||||||||||||||||||||||||||||||||||||||||||||||||||||||||||||||||||||||||||||||||||||||||||||||||||||||||||||||||||||||||||||||||||||||||||||||||||||||||||||||||||||||||||||||||||||||||||||||||||||||||||||||||||||||||||||||||||||||||||||||||||||||||||||||||||||||||||||||||||||||||||||||||||||||||||||||||||||||||||||||||
Customer Equity (in billions)(1) | $ | 124.8 | $ | 85.5 | 46 | % | |||||||||||||||||||||||||||||||||||||||||||||||||||||||||||||||||||||||||||||||||||||||||||||||||||||||||||||||||||||||||||||||||||||||||||||||||||||||||||||||||||||||||||||||||||||||||||||||||||||||||||||||||||||||||||||||||||||||||||||||||||||||||||||||||||||||||||||||||||||||||||||||||||||||||||||||||||||||||||||||||||||||||||||||||||||||||||||||||||||||||||||||||||||||||||||||||||||||||||||||||||||||||||||||||||||||||||||||||||||||||||||||||||||||||||||||||||||||||||||||||||||||||||||||||||||||||||||||||||||||||||||||||||||||||||||||||||||||||||||||||||||||||||||||||||||||||||||||||||||||||||||||||||||||||||||||||||||||||||||||||||||||||||||||||||||||||||||||||||||||||||||||||||||||||||||||||||||||||||||||||||||||||||||||||||||||||||||||||||||||||||||||||||||||||||||||||||||||||||||||||||||||||||||||||||||||||||||||||||||||||||||||||||||||||||||||||||||||||||||||||||||||||||||||||||||||||||||||||||||||||||||||||||||||||||||||||||||||||||||||||||||||||||||||||||||||||||||||||
Cleared DARTs | 564 | 453 | 25 | % | 681 | 591 | 15 | % | |||||||||||||||||||||||||||||||||||||||||||||||||||||||||||||||||||||||||||||||||||||||||||||||||||||||||||||||||||||||||||||||||||||||||||||||||||||||||||||||||||||||||||||||||||||||||||||||||||||||||||||||||||||||||||||||||||||||||||||||||||||||||||||||||||||||||||||||||||||||||||||||||||||||||||||||||||||||||||||||||||||||||||||||||||||||||||||||||||||||||||||||||||||||||||||||||||||||||||||||||||||||||||||||||||||||||||||||||||||||||||||||||||||||||||||||||||||||||||||||||||||||||||||||||||||||||||||||||||||||||||||||||||||||||||||||||||||||||||||||||||||||||||||||||||||||||||||||||||||||||||||||||||||||||||||||||||||||||||||||||||||||||||||||||||||||||||||||||||||||||||||||||||||||||||||||||||||||||||||||||||||||||||||||||||||||||||||||||||||||||||||||||||||||||||||||||||||||||||||||||||||||||||||||||||||||||||||||||||||||||||||||||||||||||||||||||||||||||||||||||||||||||||||||||||||||||||||||||||||||||||||||||||||||||||||||||||||||||||||||||||||||||||||||||||||||||||||||
Total Customer DARTs | 619 | 499 | 24 | % | 730 | 640 | 14 | % | |||||||||||||||||||||||||||||||||||||||||||||||||||||||||||||||||||||||||||||||||||||||||||||||||||||||||||||||||||||||||||||||||||||||||||||||||||||||||||||||||||||||||||||||||||||||||||||||||||||||||||||||||||||||||||||||||||||||||||||||||||||||||||||||||||||||||||||||||||||||||||||||||||||||||||||||||||||||||||||||||||||||||||||||||||||||||||||||||||||||||||||||||||||||||||||||||||||||||||||||||||||||||||||||||||||||||||||||||||||||||||||||||||||||||||||||||||||||||||||||||||||||||||||||||||||||||||||||||||||||||||||||||||||||||||||||||||||||||||||||||||||||||||||||||||||||||||||||||||||||||||||||||||||||||||||||||||||||||||||||||||||||||||||||||||||||||||||||||||||||||||||||||||||||||||||||||||||||||||||||||||||||||||||||||||||||||||||||||||||||||||||||||||||||||||||||||||||||||||||||||||||||||||||||||||||||||||||||||||||||||||||||||||||||||||||||||||||||||||||||||||||||||||||||||||||||||||||||||||||||||||||||||||||||||||||||||||||||||||||||||||||||||||||||||||||||||||||||
Cleared Customers (in Business Segments The following sections discuss the results of our operations by business segment, excluding a discussion of corporate segment income and expense. In the following tables, revenues and expenses directly associated with each business segment are included in determining income before income taxes. Due to the integrated nature of the business segments, estimates and judgments have been made in allocating certain revenue and expense items. Transactions between business segments generally result from one subsidiary facilitating the business of another subsidiary through the use of its existing trading memberships and clearing arrangements. In such cases, certain revenue and expense items are eliminated to accurately reflect the external business conducted in each business segment. Rates on transactions between business segments are designed to approximate full costs. In addition to execution and clearing expenses, which are the main cost driver for both the market making Electronic Brokerage The following table sets forth the results of our electronic brokerage operations for the indicated periods: Revenues Commissions and execution fees Interest income(1) Other income(1) Total revenues Interest expense Total net revenues Non-interest expenses Execution and clearing Employee compensation and benefits Occupancy, depreciation and amortization Communications General and administrative Total non-interest expenses Income before income taxes Revenues Commissions Interest income Other income Total revenues Interest expense Total net revenues Non-interest expenses Execution and clearing Employee compensation and benefits Occupancy, depreciation and amortization Communications General and administrative Customer bad debt Total non-interest expenses Income before income taxes Year Ended December 31, Electronic brokerage total net revenues, for the current year, Commissions, Net interest income, for the current year, increased Non-interest expenses, for the current year, Electronic brokerage operating results, for the Year Ended December 31, Electronic brokerage total net revenues, Commissions, Net interest income, in 2016, increased Non-interest expenses, in 2016, decreased $78 million, or 14%, compared to 2015, to $483 million, mainly due to a decrease in bad debt expense of $140 million, or 96%, compared to 2015, to $6 million, on the non-recurrence of $137 million in customer bad debt expense related to the Swiss franc event in 2015. Within non-interest expenses, execution and clearing expenses increased $21 million, or 13%, driven by Electronic brokerage operating results, for 2016, excluding the Market Making The following table sets forth the results of our market making operations for the indicated periods: Revenues Trading gains(1) Interest income Other income(1) Total revenues Interest expense Total net revenues Non-interest expenses Execution and clearing Employee compensation and benefits Occupancy, depreciation and amortization Communications General and administrative Total non-interest expenses Income before income taxes Revenues Trading gains Interest income Other income Total revenues Interest expense Total net revenues Non-interest expenses Execution and clearing Employee compensation and benefits Occupancy, depreciation and amortization Communications General and administrative Total non-interest expenses Income (loss) before income taxes Year Ended December 31, As previously described, in early 2017 we started the process of winding down our options market making operations and the market making results described below were mainly impacted by such pull-back. Market making total net revenues, for the current year, Trading gains, for the current year, Net interest income, for the current year, Other income, for the current year, increased $12 million, compared to the prior year, to $16 million due to an $11 million one-time recovery of costs related to the sale of our U.S. options market making operations to Two Sigma Securities, LLC and $2 million in consulting fees related to the reimbursement of costs incurred during the transition of these operations to Two Sigma Securities, LLC. Year Ended December 31, Market making total net revenues, Trading gains, in 2016, decreased $106 million, or 39%, compared to 2015, to $163 million, unfavorably impacted by lower trading volumes, a divergence in price behavior among a significant number of individual stocks during the Net interest income, percentage of total net revenues for the market making segment, income before income taxes was 23% in 2016 and 44% Liquidity and Capital Resources We maintain a highly liquid balance sheet. The majority of our assets consist of Daily monitoring of liquidity needs and available collateral levels is undertaken to help ensure that an appropriate liquidity cushion, in the form of unpledged collateral, is maintained at all times. Our ability to quickly reduce funding needs by balance sheet contraction without adversely affecting our core businesses and to pledge additional collateral in support of secured borrowings is continuously evaluated to ascertain the adequacy of our capital base. We actively manage our excess liquidity and we maintain significant borrowing facilities through the securities lending markets and with banks. As a general practice, we maintain sufficient levels of cash on hand to provide us with a buffer should we need immediately available funds for any reason. Liability balances, as of December 31, 2017, in connection with our payables to customers and securities loaned were higher than their respective average monthly balances during the current year and short-term borrowings were lower than the average monthly balance during the current year. Cash and cash equivalents held by Historically, Cash Flows The following table sets forth our cash flows from operating activities, investing activities and financing activities for the periods indicated: Net cash provided by operating activities Net cash provided by (used in) investing activities Net cash used in investing activities Net cash used in financing activities Effect of exchange rate changes on cash and cash equivalents Increase (decrease) in cash and cash equivalents (Decrease) increase in cash and cash equivalents Our cash flows from operating activities are largely a reflection of the changes in customer credit and margin loan balances in our electronic brokerage business, and of the size and composition of trading positions held by our market making Year Ended December 31, Year Ended December 31, Year Ended December 31, Regulatory Capital Requirements Our principal operating IB LLC TH LLC THE Other regulated Operating Companies Other regulated operating companies Capital Expenditures Our capital expenditures are comprised of compensation costs of our software engineering staff for development of software for internal use and expenditures for computer, networking and communications hardware. These expenditure items are reported as property, equipment, and Contractual Obligations Summary Our contractual obligations principally include obligations associated with our outstanding indebtedness and interest payments as of December 31, Payable to Holdings under Tax Receivable Agreement(1) Operating leases Transition Tax liability(2) Total contractual cash obligations Seasonality Our businesses are subject to seasonal fluctuations, reflecting varying numbers of market participants at times during the year, Inflation Although we cannot accurately anticipate the We invest in U.S. government securities for the purpose of satisfying U.S. regulatory requirements. As a broker-dealer, unlike banks, we are required to mark these investments to market even though we intend to hold them to maturity. Sudden increases in interest rates will cause mark-to-market losses on these Strategic Investments and Acquisitions We We intend to continue making acquisitions on an opportunistic basis, generally only when the acquisition candidate will, in our opinion, enable us to acquire either technology or customers faster than we could develop them on our own. As of December 31, Certain Information Concerning Off-Balance-Sheet Arrangements in off-balance sheet risk, as Critical Accounting Policies Principles of Consolidation, including Noncontrolling Interests The consolidated financial statements include the accounts of IBG, Inc. and its majority and wholly owned subsidiaries. As sole managing member of IBG LLC, we exert control over the Group's operations. In accordance with Financial Accounting Standards Board ("FASB") Accounting Standards Codification ("ASC") ASC Topic 810, "Consolidation," we consolidate the Group's consolidated financial statements and record as noncontrolling interest the interests in the Group that we do not own. We are the sole managing member of IBG LLC and, as such, operate and control all of the business and affairs of IBG LLC and its subsidiaries and as such, consolidate IBG LLC's financial results into our financial statements. We hold approximately 17.4% ownership interest in IBG LLC. Holdings is owned by the original members of IBG LLC and holds approximately 82.6% ownership interest in IBG LLC. Our current share of IBG LLC's net income is approximately 17.4%. Our policy is to consolidate all other entities in which we own more than 50% unless we do not have control. All inter-company balances and transactions have been eliminated. Use of Estimates The preparation of financial statements in conformity with U.S. GAAP requires management to make estimates and assumptions that affect the reported amounts and disclosures in the consolidated financial statements and accompanying notes. These estimates and assumptions are based on judgment and the best available information at the time. Therefore, actual results could differ materially from those estimates. Such estimates include the allowance for doubtful accounts, valuation of certain investments, compensation accruals, current and deferred income taxes, costs associated with exit or disposal activities, and contingency reserves. Valuation of Financial Instruments Due to the nature of our operations, substantially all of our financial instrument assets, comprised of financial instruments owned, securities purchased under agreements to resell, securities borrowed, receivable from customers, and receivables from brokers, dealers and clearing organizations are carried at fair value based on published market prices and are marked to market daily, or are assets which are short-term in nature and are reported at amounts Earnings per Share Earnings per share ("EPS") are computed in accordance with FASB ASC Topic 260, "Earnings per Share." Stock-Based Compensation Awards granted under the stock-based compensation plans are subject to Contingencies Our policy is to estimate and accrue for potential losses that may arise out of litigation and regulatory proceedings, to the extent that such losses are probable and can be estimated, in accordance with FASB ASC Topic 450, "Contingencies." Significant judgment is required in making these estimates and our final liabilities may ultimately be materially different. Our total liability accrued with respect to litigation and regulatory proceedings is determined on a case-by-case basis and represents an estimate of probable losses based on, among other factors, the progress of each case, our experience with and industry experience with similar cases and the opinions and views of internal and external legal counsel. Given the inherent difficulty of predicting the outcome of our litigation and regulatory matters, particularly in cases or proceedings in which substantial or indeterminate damages or fines are sought, or where cases or proceedings are in the early stages, we cannot estimate losses or ranges of losses for cases or proceedings where there is only a reasonable possibility that a loss may be incurred. We have been from time to time subject to certain pending and legal actions which arise out of the normal course of business. Litigation is inherently unpredictable, particularly in proceedings where claimants seek substantial or indeterminate damages, or which are in their early stages. We cannot predict with certainty the actual loss or range of loss related to such legal proceedings, the manner in which they will be resolved, the timing of final resolution or the ultimate settlement. Consequently, we cannot estimate losses or ranges of losses related to such legal matters, even in instances where it is reasonably possible that a future loss will be incurred. As of December 31, Income Taxes Deferred income tax assets and liabilities arise from temporary differences between the tax and financial statement recognition of the underlying assets and liabilities. In evaluating our ability to recover our deferred tax assets within the jurisdictions from which they arise, we consider all available positive and negative evidence, including scheduled reversals of deferred tax liabilities, projected future taxable income, tax-planning strategies, and results of recent operations. In projecting future taxable income, historical results are adjusted for changes in accounting policies and incorporate assumptions including the amount of future state, federal and foreign are considered. Deferred income taxes have not been provided for U.S. tax liabilities or for additional foreign taxes on the unremitted earnings of foreign subsidiaries that have been indefinitely reinvested. The calculation of our tax liabilities involves dealing with uncertainties in the application of complex tax laws and regulations in a multitude of jurisdictions across our global operations. Changes in tax laws and rates could also affect recorded deferred tax assets and liabilities in the future. We recognize that a tax benefit from an uncertain tax position may be recognized only when it is more likely than not that the position will be sustained upon examination, including resolutions of any related appeals or litigation processes, on the basis of the technical merits. A tax position that meets this standard is measured at the largest amount of benefit that will more likely than not be realized on settlement. Recently Issued Accounting Pronouncements Following is a summary of recently issued FASB Accounting Standards Updates ("ASUs") that have affected or may affect Adoption of those ASUs that became effective during Income Before Income Taxes: As reported Non-GAAP Adjustments for non-operating activities— Payments in lieu of dividends on unvested shares of the Company's Class A Common Stock(a) Pre-tax profit margin Income Tax Expense: As reported Non-GAAP Adjustments for non-operating activities— Income taxes on payments in lieu of dividends(a) The Company's share of taxes payable arising from the payment of dividends by THE AG to IBG LLC(b) U.S. foreign tax credits for Swiss taxes paid(c) Net Income (loss) attributable to common stockholders: As reported Non-GAAP Adjustments for non-operating activities— Payments in lieu of dividends on unvested shares of the Company's Class A Common Stock(a) Income taxes on payments in lieu of dividends(a) The Company's share of taxes payable arising from the payment of dividends by THE AG to IBG LLC(b) U.S. foreign tax credits for Swiss taxes paid(c) Earnings per Share(d): Basic Diluted Weighted Average Shares: Basic Diluted ITEM 7A. QUANTITATIVE AND QUALITATIVE DISCLOSURES ABOUT MARKET RISK We are exposed to various market risks. Our exposures to market risks arise from assumptions built into our pricing models, equity price risk, foreign currency exchange rate fluctuations related to our international operations, changes in interest rates which impact our variable-rate debt obligations, if any, and risks relating to the extension of margin credit to our customers. Market risk refers to the risk that a change in the level of one or more market prices, rates, indices, implied volatilities (the price volatility of the underlying instrument imputed from option prices), correlations or other market factors, such as market liquidity, will result in losses for a position or portfolio. Generally,
We use various risk management tools in managing
Pricing Model Exposure As described above, our proprietary pricing model, which continuously evaluates and monitors the risks inherent in our portfolio, assimilates external market data and reevaluates the outstanding quotes in our entire portfolio Foreign Currency Exposure As a result of our international market making activities and accumulated earnings in our foreign subsidiaries, our income and net worth is exposed to fluctuations in foreign exchange rates.
Historically, we have taken the approach of not hedging the above exposures, based on the notion that the cost of constantly hedging over the years would amount to more than the random impact of rate changes on our non-U.S. dollar balances. For instance, an increase in the value of the Swiss franc would be unfavorable to the earnings of THE but would be counterbalanced to some extent by the fact that the
Because we conduct business in many countries and many currencies and The table below shows a comparison of the U.S. dollar equivalent of the GLOBAL as of December 31, 2017 and 2016.
Changes in the Composition of the "GLOBAL" In light of our decision to discontinue our options market making activities globally, we removed the Singapore dollar (SGD) and realigned the relative weights of the U.S. dollar (USD) versus the other currency components to better reflect our businesses going forward. The new composition contains 14 currencies, one fewer than the prior composition. The new composition was effective as of the close of business on March 31, 2017. The effects of our currency diversification strategy appear in two places in the consolidated financial statements: (1) as a component of other income in the Reported results on a comprehensive basis reflect the U.S. GAAP convention Interest Rate Risk We had no variable-rate debt outstanding We pay our electronic brokerage customers interest based on benchmark overnight interest rates in various
We also face the potential for reduced net interest income from customer deposits due to interest rate spread compression in a low rate environment. We also face substantial interest rate risk due to positions carried in our market making business to the extent that long or short stock positions may have been established for future or forward dates on options or futures contracts and the value of such positions are impacted by interest rates. Dividend Risk We face dividend risk in our market making business as we derive significant revenues and incur significant expenses in the form of dividend income and expense, respectively, from our Margin We extend margin We expect this kind of exposure to increase with the growth We have a comprehensive policy implemented in accordance with regulatory standards to assess and monitor the suitability of investors to engage in various trading activities. To mitigate our risk, we also continuously monitor customer accounts to detect excessive concentration, large orders or positions, patterns of day trading and other activities that indicate increased risk to us. Our credit exposure is to a great extent mitigated by our policy of automatically evaluating each account throughout the trading day and closing out positions automatically for accounts that are found to be under-margined. While this methodology is effective in most situations, it may not be effective in situations where no liquid market exists for the relevant securities or commodities or where, for any reason, automatic liquidation for certain accounts has been disabled. Value-at-Risk
does not reflect the risk of positions that cannot be liquidated or hedged in one day. A small proportion of market risk generated by trading positions is not included in VaR. The modeling of the risk characteristics of some positions relies on approximations that, under certain circumstances, could produce significantly different results from those produced using more precise measures. VaR is most appropriate as a risk measure for trading positions in liquid financial markets and will understate the risk associated with severe events, such as periods of extreme illiquidity. The VaR calculation simulates the performance of the portfolio based on several years of the daily price changes of the underlying assets and determines the VaR as the calculated loss that occurs at the 99th percentile. Since the reported VaR statistics are estimates based on historical data, VaR should not be viewed as predictive of Stress Test
VaR and Stress Test Measures
The "Non-trading" category reflects investment activities and foreign currency exposures held in the equity of the Company's non-market making affiliates, i.e., its The average and high VaR and stress test amounts are based on the four quarter ending
ITEM 8. FINANCIAL STATEMENTS AND SUPPLEMENTARY DATA Index to Consolidated Financial Statements
REPORT OF INDEPENDENT REGISTERED PUBLIC ACCOUNTING FIRM To the Stockholders and the Board of Directors Opinion on the Consolidated Financial Statements We have audited the accompanying consolidated statements of financial condition of Interactive Brokers Group, Inc. and subsidiaries (the "Company") as of December 31,
In our opinion, We have also audited, in accordance with the standards of the Public Company Accounting Oversight Board (United States) (PCAOB), the Company's internal control over financial reporting as of December 31, Basis for Opinion These consolidated financial statements are the responsibility of the Company's management. Our responsibility is to express an opinion on the Company's consolidated financial statements based on our audits. We are a public accounting firm registered with the PCAOB and are required to be independent with respect to the Company in accordance with the U.S. federal securities laws and the applicable rules and regulations of the Securities and Exchange Commission and the PCAOB. We conducted our audits in accordance with the standards of the PCAOB. Those standards require that we plan and perform the audit to obtain reasonable assurance about whether the consolidated financial statements are free of material misstatement, whether due to error or fraud. Our audits included performing procedures to assess the risks of material misstatement of the consolidated financial statements, whether due to error or fraud, and performing procedures that respond to those risks. Such procedures included examining, on a test basis, evidence regarding the amounts and disclosures in the consolidated financial statements. Our audits also included evaluating the accounting principles used and significant estimates made by management, as well as evaluating the overall presentation of the consolidated financial statements. We believe that our audits provide a reasonable basis for our opinion. /s/ Deloitte & Touche LLP We have served as the Company's auditor since 1990.
Consolidated Statements of Financial Condition
See accompanying notes to the consolidated financial statements.
Consolidated Statements of Comprehensive Income
See accompanying notes to the consolidated financial statements.
Consolidated Statements of Cash Flows
See accompanying notes to the consolidated financial statements. Interactive Brokers Group, Inc. and Subsidiaries Consolidated Statements of Changes in Equity Three Years Ended December 31,
See accompanying notes to the consolidated financial statements.
Notes to Consolidated Financial Statements 1. Organization Interactive Brokers Group, Inc. ("IBG, Inc.") is a Delaware holding company whose primary asset is its ownership of approximately IBG LLC is a Connecticut limited liability company that conducts its business through its operating subsidiaries (collectively, the "Operating Companies"): Interactive Brokers LLC ("IB LLC") The Company operates in two business segments: electronic brokerage and market making, both supported by corporate. The Company conducts its electronic brokerage business through certain Interactive Brokers subsidiaries, which provide electronic execution and clearing services to customers worldwide. The Company conducts its market making business principally through its Timber Hill subsidiaries on some of the world's leading exchanges and market centers, primarily in exchange-traded equities, equity options and equity-index options and futures. (See Note 2—Discontinued Operations and Costs Associated with Exit or Disposal Activities.) Corporate enables the Company to operate cohesively and effectively by providing support via development services and control functions to the business segments and also by executing the Company's currency diversification strategy. Certain of the Operating Companies are members of various securities and commodities exchanges in North America, Europe and the Asia/Pacific region and are subject to regulatory capital and other requirements (see Note
Notes to Consolidated Financial Statements (Continued) 2. Significant Accounting Policies Basis of Presentation These consolidated financial statements are presented in U.S. dollars and have been prepared in accordance with accounting principles generally accepted in the U.S. ("U.S. GAAP") and pursuant to the rules and regulations of the U.S. Securities and Exchange Commission ("SEC") regarding financial reporting with respect to Form 10-K.
These consolidated financial statements include the accounts of the Company and its consolidated subsidiaries and reflect all adjustments of a normal and recurring nature that are, in the opinion of management, necessary for the fair presentation of the results for the periods presented.
Principles of Consolidation, including Noncontrolling Interests
The Company's policy is to consolidate all other entities in which it owns more than 50% unless it does not have control. All inter-company balances and transactions have been eliminated. Discontinued Operations and Costs Associated with Exit or Disposal Activities On March 8, 2017, the Company announced its intention to discontinue its options market making activities globally. Additionally, as previously announced, on September 29, 2017 the Company completed the transfer of its U.S. options market making operations to Two Sigma Securities, LLC and a gain on sale of $11 million, reflecting the recovery of exit costs, was recorded in other income in the consolidated statements of comprehensive income. The Company will continue to phase out its options market making operations outside of the U.S. substantially over the coming months and expects to report discontinued operations when it meets the criteria under FASB Topic ASC 205-20, "Discontinued Operations." Consistent with earlier estimates, the Company recognized approximately $25 million in one-time restructuring costs during the year ended December 31, 2017. The one-time restructuring costs include approximately $22 million of non-cash expenditures, consisting of impairment of the carrying value of certain exchange trading rights and stock-based compensation, included in general and administrative expenses and employee compensation and benefits, respectively, and $3 million of cash expenditures primarily related to severance costs for employee terminations, included employee compensation and benefits, in the consolidated statements of comprehensive income. Use of Estimates The preparation of financial statements in conformity with U.S. GAAP requires management to make estimates and assumptions that affect the reported amounts and disclosures in these consolidated financial statements and accompanying notes. These estimates and assumptions are based on judgment and the best available information at the time. Therefore, actual results could differ materially from those estimates. Such estimates include the allowance for doubtful accounts, valuation of certain investments, compensation accruals, current and deferred income taxes, costs associated with exit or disposal activities, and contingency reserves.
Notes to Consolidated Financial Statements (Continued) 2. Significant Accounting Policies (Continued)
Fair Value Substantially all of the Company's assets and liabilities, including financial instruments are carried at fair value based on published market prices and are marked to market, or are assets and liabilities which are short-term in nature and are carried at amounts that approximate fair value. The Company applies the fair value hierarchy in accordance with FASB ASC Topic 820, "Fair Value Measurement" ("ASC Topic 820"), to prioritize the inputs to valuation techniques used to measure fair value. The hierarchy gives the highest priority to unadjusted quoted prices in active markets for identical assets and liabilities and the lowest priority to unobservable inputs. The three levels of the fair value hierarchy are:
Financial instruments owned, at fair value and financial instruments sold, but not yet purchased, at fair value are generally classified as Level 1 of the fair value hierarchy. The Company's Level 1 financial instruments, which are valued using quoted market prices as published by exchanges and clearing houses or otherwise broadly distributed in active markets, include active listed stocks, options, warrants and discount certificates, and U.S. and foreign government Currency forward contracts are valued using broadly distributed bank and broker prices, and are classified as Level 2 of the fair value hierarchy
Earnings Earnings per share ("EPS")
Notes to 2. Significant Accounting Policies (Continued) Stock-Based Compensation The Company follows FASB ASC Topic 718, "Compensation—Stock Compensation" ("ASC Topic 718"), to account for its stock-based compensation plans. ASC Topic 718 requires all share-based payments to employees to be recognized in the consolidated financial statements using a fair value-based method. Grants, which are denominated in U.S. dollars, are communicated to employees in the year of grant, thereby establishing the fair value of each grant. The fair value of awards granted to employees are generally expensed as follows: 50% in the year of grant in recognition of Awards granted under stock-based compensation plans are subject to Cash and Cash Equivalents
Cash and Securities—Segregated for Regulatory Purposes As a result of customer activities, certain Operating Companies are obligated by rules mandated by their primary regulators to segregate or set aside cash or qualified securities to satisfy such regulations, which Securities Borrowed and Securities Loaned Securities borrowed and securities loaned are recorded at the amount of the cash collateral advanced or received. Securities borrowed transactions require the Company to provide counterparties with collateral, which may be in the form of cash, letters of credit or other securities. With respect to securities loaned, the Company receives collateral, which may be in the form of cash or other securities in an amount generally in excess of the fair value of the securities loaned. The Company monitors the market value of securities borrowed and loaned on a daily basis, with additional collateral obtained or refunded as permitted contractually.
Notes to Consolidated Financial Statements (Continued) 2. Significant Accounting Policies (Continued) Securities lending fees received and paid by the Company are included in interest income and interest expense, respectively, in the consolidated statements of comprehensive income. Securities Purchased Under Agreements to Resell and Securities Sold Under Agreements to Repurchase Securities purchased under agreements to resell and securities sold under agreements to repurchase, which are reported as collateralized financing transactions, are recorded at contract value, which approximates fair value. To ensure that the fair value of the underlying collateral remains sufficient, the collateral is valued daily with additional collateral obtained or excess collateral returned, as permitted under contractual provisions. Financial Instruments Owned and Financial Instruments Sold, But Not Yet Purchased, at Fair Value Financial instrument transactions are accounted for on a trade date basis. Financial instruments owned and financial instruments sold, but not yet purchased are stated at fair value based upon quoted market prices.
Customer Receivables and Payables Customer securities transactions are recorded on a settlement date basis and customer commodities transactions are recorded on a trade date basis. Receivables from and payables to customers include amounts due on cash and margin transactions, including futures contracts transacted on behalf of customers. Securities owned by customers, including those that collateralize margin loans or other similar transactions, are not reported in the consolidated statements of financial condition. Amounts receivable from customers that are determined by management to be uncollectible are Receivables from and Payables to Brokers, Dealers and Clearing Organizations Receivables from and payables to brokers, dealers and clearing organizations include net receivables and payables from unsettled trades, including amounts related to futures and options on futures contracts executed on behalf of customers, amounts receivable for securities not delivered by the Company to the purchaser by the settlement date ("fails to deliver") and cash Investments The Company makes certain strategic investments related to its business and accounts for these investments under the cost method of accounting or under the equity method of accounting as required under FASB ASC Topic 323, "Investments—Equity Method and Joint Ventures." Investments accounted for under the equity method, including where the investee is a limited partnership or limited liability company, are recorded at the fair value amount of the Company's initial investment and are
Notes to Consolidated Financial Statements (Continued) 2. Significant Accounting Policies (Continued) adjusted each period for the Company's share of the investee's income or loss. The Company's share of the income or losses from equity method investments is included in other income in the consolidated statements of comprehensive income. The recorded amounts of the Company's equity method investments, The Company also holds exchange memberships and investments in equity securities of certain exchanges, as required to qualify as a clearing member, and strategic investments in corporate stock that do not qualify for equity method accounting. Such investments,
A judgmental aspect of accounting for investments is evaluating whether an other-than-temporary decline in the value of an investment has occurred. The evaluation of an other-than-temporary impairment is dependent on specific quantitative and qualitative factors and circumstances surrounding an investment, including recurring operating losses, credit defaults and subsequent rounds of financing. The Company's equity investments do not have readily determinable market values. All investments are reviewed for changes in circumstances or occurrence of events that suggest the Company's investment may not be recoverable. If an unrealized loss on any investment is considered to be other-than-temporary, the impairment loss is recognized in the period the determination is made.
Property, Equipment, and Property, equipment, and Property and equipment are recorded at historical cost, less accumulated depreciation and amortization. Additions and improvements that extend the lives of assets are capitalized, while expenditures for repairs and maintenance are expensed as incurred. Depreciation and amortization are computed using the straight-line method. Equipment is depreciated over the estimated useful lives of the assets, while leasehold improvements are amortized over the lesser of the estimated economic useful life of the asset or the term of the lease. Computer equipment is depreciated over three to five years and office furniture and equipment are depreciated over five to seven years. Intangible assets with a finite life are amortized on a straight line basis over their estimated useful lives of three years, and tested for recoverability whenever events indicate that the carrying amounts may not be recoverable. Qualifying costs for internally developed software are capitalized and amortized over the expected useful life of the developed software, not to exceed three years. Upon retirement or disposition of property and equipment, the cost and related accumulated depreciation are removed from the consolidated statements of financial condition and any resulting gain or loss is recorded in other income in the consolidated statements of comprehensive income. Fully depreciated (or amortized) assets are retired on an annual basis.
Notes to Consolidated Financial Statements (Continued) 2. Significant Accounting Policies (Continued) Comprehensive Income and Foreign Currency Translation The Company's operating results are reported in the consolidated statements of comprehensive income pursuant to FASB Comprehensive income consists of two components: net income and other comprehensive income ("OCI"). The Company's non-U.S. domiciled subsidiaries have a functional currency that is other than the U.S. dollar. Such subsidiaries' assets and liabilities are translated into U.S. dollars at period-end exchange rates, and revenues and expenses are translated at average exchange rates prevailing during the period. Adjustments that result from translating amounts from a subsidiary's functional currency to the U.S. dollar (as described above) are reported net of tax, where applicable, in accumulated OCI in
the consolidated statements of financial condition. Revenue Recognition Trading Gains Trading gains and losses are recorded on trade date and are reported on a net basis. Trading gains and losses are comprised of changes in the fair value of financial instruments owned, at fair value and financial instruments sold, but not yet purchased, at fair value (i.e., unrealized gains and losses) and realized gains and Commissions Commissions earned for executing Interest Income and Expense The Company earns interest income and incurs interest expense primarily in connection with its electronic brokerage customer business and its securities lending activities, which are recorded on
Notes to Consolidated Financial Statements (Continued) 2. Significant Accounting Policies (Continued) Foreign Currency Gains and Losses
Rebates Rebates consist of volume discounts, credits or payments received from exchanges or other market centers related to the placement and/or removal of liquidity from the order flow in the marketplace and are recorded on an accrual basis. Rebates are recorded net within execution and clearing expenses in the consolidated statements of comprehensive income. Rebates received for trades executed on behalf of customers that elect tiered pricing are passed, in whole or part, to these customers; and such pass-through amounts are recorded net within commissions in the consolidated statements of comprehensive income. Income Taxes The Company accounts for income taxes in accordance with FASB ASC Topic 740, "Income Taxes" ("ASC Topic 740"). The Company's income tax expense, deferred tax assets and liabilities, and reserves for unrecognized tax benefits are based on enacted tax laws (see Note
best assessment of estimated future taxes to be paid. The Company is subject to income taxes in
Deferred income tax assets and liabilities arise from temporary differences between the tax and financial statements recognition of
Notes to Consolidated Financial Statements (Continued) 2. Significant Accounting Policies (Continued) The calculation of the Company's tax liabilities involves dealing with uncertainties in the application of complex tax laws and regulations in a multitude of jurisdictions across the Company's global operations. Changes in tax laws and rates could also affect recorded deferred tax assets and liabilities in the future.
The Company records tax liabilities in accordance with ASC Topic 740 and adjusts these liabilities when management's judgment changes as a result of the evaluation of new information not previously available. Because of the complexity of some of these uncertainties, the ultimate resolution may result in payments that are different from the current estimates of these tax liabilities. These differences will be reflected as increases or decreases to income tax expense in the period in which new information becomes available. The Company recognizes a tax benefit from an uncertain tax position only when it is more likely than not that the position will be sustained upon examination, including resolutions of any related appeals or litigation processes, on the basis of the technical merits. A tax position that meets this standard is measured at the largest amount of benefit that will more likely than not be realized on settlement. The Company recognizes interest related to income tax matters as interest income or interest expense and penalties related to income tax matters as income tax expense in the consolidated statements of comprehensive income. Recently Issued Accounting Pronouncements Following is a summary of recently issued FASB Accounting Standards Updates ("ASUs") that have affected or may affect the Company's consolidated financial statements:
Notes to Consolidated Financial Statements (Continued) 2. Significant Accounting Policies (Continued)
Notes to Consolidated Financial Statements (Continued) 2. Significant Accounting Policies (Continued)
Adoption of those ASUs that became effective during The Company has reviewed the impact of FASB ASC Topic 606, "Revenue from Contracts with Customers" ("ASC Topic 606"), and identified similar performance obligations under ASC Topic 606 as compared with deliverables and separate units of account previously identified, as a result the Company expects the timing of its revenue recognition to remain the same as compared to FASB ASC Topic 605, "Revenue Recognition." The Company adopted ASC Topic 606 using the modified retrospective method, effective January 1, 2018. 3. Trading Activities and Related Risks The Company's trading activities include providing securities market making and brokerage services. Trading activities expose the Company to market and credit risks. These risks are managed in accordance with established risk management policies and procedures. To accomplish this, management has established a risk management process that includes:
Notes to Consolidated Financial Statements (Continued) 3. Trading Activities and Related Risks (Continued) Market Risk The Company is exposed to various market risks. Exposures to market risks arise from equity price risk, foreign currency exchange rate fluctuations and changes in interest rates. The Company seeks to mitigate market risk associated with trading inventories by employing hedging strategies that correlate rate, price and spread movements of trading inventories and related financing and hedging activities. The Company uses a combination of cash instruments and exchange traded derivatives to hedge its market exposures. The Company does not apply hedge accounting. The following discussion describes the types of market risk faced: Equity Price Risk Equity price risk arises from the possibility that equity security prices will fluctuate, affecting the value of equity securities and other instruments that derive their value from a particular stock, a defined basket of stocks, or a stock index. The Company is subject to equity price risk primarily in financial instruments Currency Risk Currency risk arises from the possibility that fluctuations in foreign exchange rates will impact the value of financial instruments. The Company manages this risk using spot (i.e., cash) currency transactions, currency futures contracts and currency forward contracts. As a global electronic broker and market maker trading on exchanges around the world in multiple currencies, the Company is exposed to foreign currency risk. The Company actively manages its currency exposure using Interest Rate Risk Interest rate risk arises from the possibility that changes in interest rates will affect the value of financial instruments. The Company is exposed to interest rate risk on cash and margin balances, positions carried in equity and fixed income securities, options,
Notes to Consolidated Financial Statements (Continued) 3. Trading Activities and Related Risks (Continued) Credit Risk The Company is exposed to risk of loss if an individual, counterparty or issuer fails to perform its obligations under contractual terms ("default risk"). Both cash instruments and derivatives expose the Company to default risk. The Company has established policies and procedures for mitigating credit risk on principal transactions, including reviewing and establishing limits for credit exposure, maintaining collateral, and continually assessing the creditworthiness of counterparties. The Company's credit risk is limited in that substantially all of the contracts entered into are settled directly at securities and commodities clearing houses and a small portion is settled through member firms and banks with substantial financial and operational resources. The Company seeks to control the risks associated with its customer margin activities by requiring customers to maintain collateral in compliance with regulatory and internal guidelines. In the normal course of business, the Company executes, settles, and finances various customer securities transactions. Execution of these transactions includes the purchase and sale of securities which exposes the Company to default risk arising from the potential that customers or counterparties may fail to satisfy their obligations. In these situations, the Company may be required to purchase or sell financial instruments at unfavorable market prices to satisfy obligations to customers or counterparties. Liabilities to other brokers and dealers related to unsettled transactions (i.e., securities fails to receive) are recorded at the amount for which the securities were purchased, and are paid upon receipt of the securities from other brokers or dealers. In the case of aged securities fails to receive, the Company may purchase the underlying security in the market and seek reimbursement for any losses from the counterparty. For cash management purposes, the Company enters into short-term securities purchased under agreements to resell and securities sold under agreements to repurchase transactions ("repos") in addition to securities borrowing and lending arrangements, all of which may result in credit exposure in the event the counterparty to a transaction is unable to fulfill its contractual obligations. Repos are collateralized by securities with a market value in excess of the obligation under the contract. Similarly, securities lending agreements are collateralized by deposits of cash or securities. The Company attempts to minimize credit risk associated with these activities by monitoring collateral values on a daily basis and requiring additional collateral to be deposited with or returned to the Company as permitted under contractual provisions. Concentrations of Credit Risk The Company's exposure to credit risk associated with its trading and other activities is measured on an individual counterparty basis, as well as by groups of counterparties that share similar attributes. Concentrations of credit risk can be affected by changes in political, industry, or economic factors. To reduce the potential for risk concentration, credit limits are established and exposure is monitored in light of changing counterparty and market conditions. As of December 31,
Notes to Consolidated Financial Statements (Continued) 3. Trading Activities and Related Risks (Continued) Off-Balance Sheet Risks The Company may be exposed to a risk of loss not reflected in the consolidated financial statements to settle futures and certain over-the-counter contracts at contracted prices, which may require repurchase or sale of the underlying products in the market at prevailing prices. Accordingly, these transactions result in off-balance sheet risk as the Company's cost to liquidate such contracts may exceed the amounts reported in the Company's consolidated statements of financial condition. 4. Equity and Earnings In connection with IBG, Inc.'s initial public offering of Class A common stock ("IPO") in May 2007, it purchased 10.0% of the membership interests in IBG LLC from IBG Holdings LLC ("Holdings"), became the sole managing member of IBG LLC and began to consolidate IBG LLC's financial results into its financial statements. Holdings owns all of IBG, Inc.'s Class B common stock, which has voting rights in proportion to its ownership interests in IBG LLC. The table below shows the amount of IBG LLC
These consolidated financial statements reflect the results of operations and financial position of IBG, Inc., including consolidation of its investment in IBG LLC and its subsidiaries. Recapitalization and Post-IPO Capital Structure Immediately prior to and immediately following the consummation of the IPO, IBG, Inc., Holdings, IBG LLC and the members of IBG LLC consummated a series of transactions collectively referred to herein as the "Recapitalization." In connection with the Recapitalization, IBG, Inc., Holdings and the historical members of IBG LLC entered into an exchange agreement, dated as of May 3, 2007 (the "Exchange Agreement"), pursuant to which the historical members of IBG LLC received membership interests in Holdings in exchange for their membership interests in IBG LLC. Additionally, IBG, Inc. became the sole managing member of IBG LLC. In connection with the consummation of the IPO, Holdings used the net proceeds to redeem 10.0% of members' interests in Holdings in proportion to their interests. Immediately following the Recapitalization and IPO, Holdings owned approximately 90% of IBG LLC and 100% of IBG, Inc.'s Class B common stock, which has voting power in IBG, Inc. in proportion to Holdings' ownership of IBG LLC.
Notes to Consolidated Financial Statements (Continued) 4. Equity and Earnings per Share (Continued) Since consummation of the IPO and Recapitalization, IBG, Inc.'s equity capital structure has been comprised of Class A and Class B common stock. All shares of common stock have a par value of $0.01 per share and have identical rights to earnings and dividends and in liquidation. As
As a result of a federal income tax election made by IBG LLC applicable to the acquisition of IBG LLC member interests by IBG, Inc., the income tax basis of the assets of IBG LLC acquired by IBG, Inc. have been adjusted based on the amount paid for such interests. Deferred tax assets were recorded as of the IPO date and in connection with subsequent redemptions of Holdings member interests in exchange for common stock. These deferred tax assets are included in other assets in the Company's consolidated statements of financial condition and are being amortized as additional deferred income tax expense over 15 years from the IPO date and from the additional redemption dates, respectively, as allowable under current tax law. As of December 31, IBG, Inc. also entered into an agreement (the "Tax Receivable Agreement") with Holdings to pay Holdings (for the benefit of the former members of IBG LLC) 85% of the tax savings that IBG, Inc. actually realizes as the result of tax basis increases. These payables The cumulative amounts of deferred tax assets, payables to Holdings and additional paid-in capital arising from stock offerings from the date of the IPO through December 31, The Exchange Agreement, as amended,
Notes to Consolidated Financial Statements (Continued) 4. Equity and Earnings per Share (Continued) At the time of IBG, Inc.'s IPO in 2007, three hundred sixty (360) million shares of authorized common stock were reserved for future sales and redemptions. From 2008 through 2010, Holdings redeemed 5,013,259 IBG LLC As a consequence of these redemption transactions, and distribution of shares to employees (see Note Earnings per Share Basic earnings per share is calculated utilizing net income available for common stockholders divided by the weighted average number of shares of Class A and Class B common stock outstanding for that period.
Notes to Consolidated Financial Statements (Continued) 4. Equity and Earnings
Diluted earnings per share are calculated utilizing the Company's basic net income available for common stockholders divided by diluted weighted average shares outstanding with no adjustments to net income available to common stockholders for potentially dilutive common shares.
Member Distributions and Stockholder Dividends During the three years ended December 31, On January
5. Comprehensive Income The following table presents comprehensive income and earnings per share on comprehensive
Notes to Consolidated Financial Statements (Continued) 6. Financial Assets and Financial Liabilities Financial Assets and Liabilities Measured at Fair Value on a Recurring Basis The following tables set forth, by level within the fair value hierarchy (see Note 2), financial assets and liabilities, measured at fair value on a recurring basis as of December 31, 2017 and December 31, 2016. As required by ASC Topic 820, financial assets and financial liabilities are classified in their entirety based on the lowest level of input that is significant to the respective fair value measurement.
Notes to Consolidated Financial Statements (Continued) 6. Financial Assets and Financial Liabilities (Continued)
Transfers between Level 1 and Level 2 Transfers of financial assets and financial liabilities at fair value to or from Levels 1 and 2 arise where the market for a specific financial instrument has become active or inactive during the period. The fair values transferred are ascribed as if the financial assets or financial liabilities had been transferred as of the end of the period. During the years ended December 31, 2017 and 2016, there were no transfers between levels for financial assets and liabilities, at fair value. Level 3 Financial Assets and Financial Liabilities The Company's Level 3 financial assets are comprised of delisted and illiquid securities reported within financial instruments owned, at fair value in the consolidated statements of financial condition. During the year ended December 31, 2017 financial assets included $1 million of Level 3 securities which were transferred from Level 1 as certain stocks were no longer tradable in active markets and were valued by the Company based on internal estimates. In addition, the Company purchased a $2 million convertible bond in a private placement, which is classified as Level 3. During the year ended December 31, 2016 financial assets included $1 million of Level 3 securities which were transferred from Level 2 as a result of a security becoming illiquid.
Notes to Consolidated Financial Statements (Continued) 6. Financial Assets and Financial Liabilities (Continued)
Trading Gains from Market Making Transactions
losses from market making transactions reported in the statements of comprehensive income, by major product type, are comprised of:
These transactions are related to the Company's financial instruments owned and financial instruments sold, but not yet purchased, at fair value and include both derivative and non-derivative financial instruments, including exchange traded options and futures. These gains and losses also include market making related dividend and fixed income trading related interest income and expense. The gains (losses) in the table above
Notes to Consolidated Financial Statements (Continued) 6. Financial Assets and Financial Liabilities (Continued) Financial Assets and Liabilities Not Measured at Fair Value The following tables represent the carrying value, fair value, and fair value hierarchy category of certain financial assets and liabilities that are not recorded at fair value in the Company's consolidated statements of financial condition. The following table excludes certain financial instruments such as equity investments and all non-financial assets and
Notes to Consolidated Financial Statements (Continued) 6. Financial Assets and Financial Liabilities (Continued)
Netting of Financial Assets and Financial Liabilities
Notes to Consolidated Financial Statements (Continued) 6. Financial Assets and Financial Liabilities (Continued) The following tables
Notes to Consolidated Financial Statements (Continued) 6. Financial Assets and Financial Liabilities (Continued)
Notes to Consolidated Financial Statements (Continued) 6. Financial Assets and Financial Liabilities (Continued) Secured Financing Transactions—Maturities and Collateral Pledged
7. Collateralized Transactions The Company enters into securities borrowing and lending transactions and agreements to repurchase and resell securities to finance trading inventory, to obtain securities for settlement and to earn residual interest rate spreads. In addition, the Company's customers pledge their securities owned to collateralize margin loans. Under these transactions, the Company either receives or provides collateral, including equity, corporate debt and U.S. government securities. Under
The Company also engages in securities financing transactions with and for customers through margin lending. Customer receivables generated from margin lending activity are collateralized by customer-owned securities held by the Company. Customers' required margin levels and established credit limits are monitored continuously by risk management staff using automated systems. Pursuant to the Company's policy and as enforced by such systems, customers are required to deposit additional collateral or reduce positions, when necessary to avoid automatic liquidation of their positions.
Notes to Consolidated Financial Statements (Continued) 7. Collateralized Transactions (Continued) Margin loans are extended to customers on a demand basis and are not committed facilities. Factors considered in the acceptance or rejection of margin loans are the amount of the loan, the degree of leverage being employed in the customer account and an overall evaluation of the customer's portfolio to ensure proper diversification or, in the case of concentrated positions, appropriate liquidity of the underlying collateral. Additionally, transactions relating to concentrated or restricted positions are limited or prohibited by raising the level of required margin collateral (to 100% in the extreme case). Underlying collateral for margin loans is evaluated with respect to the liquidity of the collateral positions, valuation of securities, volatility analysis and an evaluation of industry concentrations. Adherence to the Company's collateral policies significantly limits the Company's credit exposure to margin loans in the event of a customer's default. Under margin lending agreements, the Company may request additional margin collateral from customers and may sell securities that have not been paid for or purchase securities sold but not delivered from customers, if necessary. The following table summarizes the amounts related to collateralized transactions
In the normal course of business, the Company pledges qualified securities with clearing organizations to satisfy daily margin and clearing fund requirements.
Notes to Consolidated Financial Statements (Continued) 7. Collateralized Transactions (Continued) Financial instruments owned and pledged as collateral, including amounts pledged to affiliates, where the counterparty has the right to repledge,
8.
Market data fees are charged to customers for market data services they subscribe to and are largely offset by the related costs paid to obtain market data from third party vendors. Account activity fees are charged to customers that do not generate the minimum monthly commission. The fee is the difference between the minimum required commission and the actual commissions generated. Risk exposure fees are earned from a small minority of customer accounts carrying positions with market risk that exceeds defined thresholds. Payments for order flow are earned from various options exchanges based upon options trading volume originated by the Operating Companies. Gains (losses) on financial instruments, at fair value and other investments, net include (1) realized and unrealized gains and losses on financial instruments that (a) are held for purposes other than the Company's market making activities, (b) are subject to restrictions, or (c) are accounted for under the equity method and (2) dividends on investments accounted for under cost method. Other, net includes a gain on the sale of the Company's U.S. market making operations to Two Sigma Securities, LLC of $11 million,
Notes to Consolidated Financial Statements (Continued)
2007 ROI Unit Stock Plan In connection with the IPO, the Company adopted the IBG, Inc. 2007 ROI Unit Stock Plan ("ROI Unit Stock Plan").
As of December 31, 2007 Stock Incentive Plan
As a result of the Company's organizational structure, a description of which can be found in "Business—Our Organizational Structure" in Part I Item 1 of this
no dilutive effect upon ownership of
Notes to Consolidated Financial Statements (Continued) 9. Employee Incentive Plans (Continued) The Stock Incentive Plan is administered by the Compensation Committee of the Company's Board of Directors. The Compensation Committee has discretionary authority to determine the eligibility to participate in the Stock Incentive Plan and establishes the terms and conditions of the The Stock Incentive Plan provides that, upon a change in control, the Compensation Committee may, at its discretion, fully vest any granted but not yet earned awards under the Stock Incentive Plan, or provide that any such granted but not yet earned awards will be honored or assumed, or new rights substituted by the new employer on a substantially similar basis and on terms and conditions substantially comparable to those of the Stock Incentive Plan. The Company expects to continue to grant awards on or about December 31 of each year to eligible participants as part of an overall plan of equity compensation.
Awards granted to external directors vest, and are distributed, over a five-year period (20% per year) commencing one year after the date of grant. A total of Stock Incentive Plan awards granted (excluding 21,009 shares issued pursuant to the ROI Unit Stock Plan described above) and the related fair values since the plan's inception are presented in the table below:
Notes to Consolidated Financial Statements (Continued)
Estimated future grants under the Stock Incentive Plan are accrued for ratably during each year (see Note 2). In accordance with the vesting schedule, outstanding awards vest and are distributed to participants yearly on or about May 9 of each year. At the end of each year, there are no vested awards that remain undistributed. Compensation expense related to the Stock Incentive Plan recognized in the consolidated statements of comprehensive income was The following summarizes the Stock Incentive Plan and ROI Unit Stock Plan activities from December 31, 2014 through December 31, 2017:
Awards previously granted but not yet earned under the stock plans are
Notes to Consolidated Financial Statements (Continued)
Income tax expense for the three years ended December 31, Deferred income taxes arise primarily due to the amortization of the deferred tax assets recognized in connection with the common stock offerings (see Note 4), differences in the valuation of financial assets and liabilities, and for other temporary differences arising from the deductibility of compensation and depreciation expenses in different time periods for The Tax Act, as previously described, makes broad and complex changes to the U.S. tax code, including, but not limited to, (1) reducing the U.S. federal corporate tax rate to 21%, effective January 1, 2018; (2) requiring a one-time transition tax on certain undistributed earnings of foreign subsidiaries to be paid over eight years; (3) generally eliminating U.S. federal income taxes on dividends from foreign subsidiaries; (4) requiring a current inclusion in U.S. federal taxable income of certain earnings of controlled foreign corporations; (5) eliminating the corporate alternative minimum tax ("AMT") and changing how existing AMT credits can be realized; (6) creating the base erosion anti-abuse tax, a new minimum tax; (7) creating a new limitation on deductible interest expense; (8) changing rules related to uses and limitations of net operating loss carryforwards created in tax years beginning after December 31, 2017; (9) repealing the Section 199 manufacturing deduction; and (10) full expensing of qualified property for tax return purposes. The SEC staff issued Staff Accounting Bulletin 118 ("SAB 118"), which provides guidance on accounting for the tax effects of the Tax Act. SAB 118 provides a measurement period that should not extend beyond one year from the enactment of the Tax Act for entities to complete the accounting under ASC Topic 740. In accordance with SAB 118, an entity must reflect the income tax effects of those aspects of the Tax Act for which the accounting under ASC Topic 740 is complete. To the extent that an entity's accounting for certain income tax effects of the Tax Act is incomplete but it is able to determine a reasonable estimate, the entity must record a provisional estimate on its financial statements. However, if an entity cannot determine a provisional estimate to be included on its financial statements, the entity should continue to apply ASC Topic 740 on the basis of the provisions of the tax laws that were in effect immediately before the enactment of the Tax Act. The Company's accounting for the following elements of the Tax Act is incomplete. However, the Company has made reasonable estimates of certain effects and, therefore, recorded provisional adjustments as follows: Reduction of U.S. federal corporate tax rate: The Tax Act reduces the corporate tax rate to 21%, effective January 1, 2018. For certain of the Company's deferred tax assets and liabilities, the Company has recognized a provisional net decrease of $115 million with a corresponding adjustment to deferred income tax expense (or deferred tax benefit) for the year ended December 31, 2017. While the Company has made a reasonable estimate of the impact of the reduction in corporate rate, it may be
Notes to Consolidated Financial Statements (Continued) 10. Income Taxes (Continued) affected by other analyses related to the Tax Act, including, but not limited to, the calculation of deemed repatriation of deferred foreign income and the state tax effect of adjustments made to federal temporary differences. The Company is still analyzing certain aspects of the Tax Act and refining its calculations, which could potentially affect the measurement of these balances or potentially give rise to new deferred tax amounts. In connection with the remeasurement of its deferred tax asset arising from the acquisition of interests in IBG LLC, the Company also remeasured the related Tax Receivable Agreement liability, payable to Holdings, resulting in the recognition of a $93 million gain which is reported in other income in the consolidated statements of comprehensive income (see Note 4). Deemed Repatriation Transition Tax: The Deemed Repatriation Transition Tax ("Transition Tax") is a tax on previously untaxed accumulated and current earnings of certain foreign subsidiaries. To determine the amount of the Transition Tax, the Company must determine, in addition to other factors, the amount of post-1986 earnings of the relevant foreign subsidiaries, as well as the amount of non-U.S. income taxes paid on such earnings. The Company has made a reasonable estimate of the Transition Tax and recorded a provisional Transition Tax obligation of $62 million. This amount may change when the calculation of post-1986 foreign earnings and profits previously deferred from U.S. federal taxation and the amounts held in cash or other specified assets are finalized. The Company does not expect any significant changes, but it is continuing to gather additional information to more precisely compute the amount of the Transition Tax. The Tax Act creates a new requirement that global intangible low taxes income ("GILTI") earned by controlled foreign corporations ("CFC"s) must be included currently in the gross income of the CFC's U.S. shareholder. GILTI is the excess of the shareholder's "net CFC-tested income" over the deemed tangible income return, which is currently defined as the excess of (1) 10 percent of the aggregate of the U.S shareholder's pro rata share of the qualified business asset investment in each CFC with respect to which it is a U.S shareholder over (2) the amount of certain interest expense taken into account in the determination of net CFC-tested income. Because of the complexity of the new GILTI tax rules, the Company is continuing to evaluate this provision of the Tax Act and the application of ASC Topic 740. Under U.S. GAAP, the Company is allowed to make an accounting policy election of either (1) treating taxes due on future U.S. inclusions in taxable income related to GILTI as a current-period expense when incurred (the "period cost method") or (2) factoring such amounts into the Company's measurement of its deferred taxes (the "deferred method"). The Company selected the deferred method. The Company's calculation of the deferred balance with respect to the new GILTI tax rules will depend, in part, on analyzing its global income to determine whether it expects to have future U.S. inclusions in taxable income related to GILTI and, if so, what the impact is expected to be. Because whether the Company expects to have future U.S. inclusions in taxable income related to GILTI depends on, not only its current structure and estimated future results of global operations, but its intent and ability to modify its structure and/or its business, the Company is not yet able to reasonably estimate the effect of this provision of the Tax Act. Therefore, the Company has not made any adjustments related to potential GILTI tax in its financial statements.
Notes to Consolidated Financial Statements (Continued) 10. Income Taxes (Continued) For the three years ended December 31,
A reconciliation of the statutory U.S. Federal income tax rate of 35% to the Company's effective tax rate for the three years ending December 31,
Notes to Consolidated Financial Statements (Continued)
Significant components of the Company's deferred tax assets
As of and for the years ended December 31,
Notes to Consolidated Financial Statements (Continued)
Property, equipment and
Depreciation and amortization of
On January 15, 2015, due to the sudden move in the value of the Swiss franc that followed an unprecedented action by the Swiss National Bank, which removed a Litigation The Company is subject to certain pending and threatened legal actions which arise out of the normal course of business. Litigation is inherently unpredictable, particularly in proceedings where claimants seek substantial or indeterminate damages, or which are in their early stages. The Company has not
Notes to Consolidated Financial Statements (Continued) 12. Commitments, Contingencies and Guarantees (Continued) been able to quantify the actual loss or range of loss related to such legal proceedings, the manner in which they will be resolved, the timing of final resolution or the ultimate settlement. Management believes that the resolution of these actions will not have a material effect, if any, on the Company's business or financial condition, but may have a material impact on the results of operations for a given period. The Company accounts for potential losses related to litigation in accordance with FASB ASC Topic 450, "Contingencies." As of December 31,
Trading Technologies Matter On February 3, 2010, Trading Technologies International, Inc. ("Trading Technologies") filed a complaint in the The Defendants filed an answer to Trading Technologies' amended complaint, as well as related counterclaims. The Trading Technologies also filed patent infringement lawsuits against approximately a dozen other companies in the same
Class Action Matter On December 18, 2015, a former individual customer filed a purported class action complaint against IB LLC, IBG, Inc., and Thomas Frank, PhD, the Company's Executive Vice President and Chief Information Officer, in the U.S. District Court for the District of Connecticut. The complaint alleges that the former customer and members of the purported class of IB LLC's customers were harmed by alleged "flaws" in the computerized system used by the Company to close out (i.e., liquidate) positions in customer brokerage accounts that have margin deficiencies. The complaint seeks, among other things, undefined compensatory damages and declaratory and injunctive relief.
Notes to Consolidated Financial Statements (Continued) 12. Commitments, Contingencies and Guarantees (Continued) On February 19, 2016, the Company filed a motion to dismiss the class action complaint. On September 28, 2016, the Court issued an order granting the Company's motion to dismiss and dismissing the complaint in its entirety, and without providing plaintiff leave to amend. On October 5, 2016, the Court entered judgment in the Company's favor. On October 12, 2016, plaintiff filed motions for leave to file an amended complaint and to vacate or amend judgment. On November 14, 2016, plaintiff also filed a motion to disqualify the district judge. The Company opposed all three motions. In memoranda of decision dated August 29, 2017 and September 5, 2017, the Court denied the motions. On September 28, 2017, plaintiff appealed the order of dismissal and subsequent judgment to the United States Court of Appeals for the Second Circuit. On January 9, 2018, the plaintiff filed his appellate brief. The opposition brief is currently due on April 10, 2018. We believe that the appeal, like the original complaint, lacks merit. Further, even if the Court's dismissal were to be overturned on appeal, we do not believe that a purported class action is appropriate given the great differences in portfolios, markets and many other circumstances surrounding the liquidation of any particular customer's margin-deficient account. IB LLC and the related defendants intend to continue to defend themselves vigorously against the case and, consistent with past practice in connection with this type of unwarranted action, any potential claims for counsel fees and expenses incurred in defending the case shall be fully pursued against the plaintiff. Leases Operating Companies have non-cancelable operating leases covering office space. All but one of the office space leases are subject to escalation clauses based on specified costs incurred by the respective landlords and contain renewal elections. Rent expense calculated on a straight-line basis for the Company was
amortization expenses in the consolidated statements of comprehensive income. As of December 31,
Guarantees Certain of the Operating Companies provide guarantees to securities and commodities clearing houses and exchanges which meet the accounting definition of a guarantee under FASB ASC Topic 460, "Guarantees." Under standard membership agreements, clearing house and exchange members are required to guarantee collectively the performance of other members. Under the agreements, if a member becomes unable to satisfy its obligations, other members would be required to meet shortfalls. In the opinion of management, the Operating Companies' liability under these arrangements is not
Notes to Consolidated Financial Statements (Continued) 12. Commitments, Contingencies and Guarantees (Continued) quantifiable and could exceed the cash and securities they have posted as collateral. However, the potential for these Operating Companies to be required to make payments under these arrangements is remote. Accordingly, no contingent liability is carried in the consolidated statements of financial condition for these arrangements. In connection with its retail brokerage business, IB LLC or other electronic brokerage Operating Companies perform securities and commodities execution, clearance and settlement on behalf of their customers for whom they commit to settle trades submitted by such customers with the respective clearing houses. If a customer fails to fulfill its settlement obligations, the respective Operating Company must fulfill those settlement obligations. No contingent liability is carried on the consolidated statements of financial condition for such customer obligations. Other Commitments Certain clearing houses,
The Company has two operating business segments: electronic brokerage and market making. These segments are supported by The Company conducts its electronic brokerage business through
the world's leading exchanges and market centers, primarily in exchange-traded equities, equity options and equity-index options and futures. Significant transactions and balances between the Operating Companies occur, primarily as a result of certain Operating Companies holding exchange or clearing organization memberships, which are utilized to provide execution and clearing services to affiliates. Charges for transactions between segments are designed to approximate full costs. Intra-segment and intra-region income and expenses and related balances have been eliminated in this segment and geographic information to reflect the external business conducted in each segment or
Notes to Consolidated Financial Statements (Continued) 13. Segment and Geographic Information (Continued) Management believes that the following information by business segment provides a reasonable representation of each segment's contribution to total net revenues and income before income taxes for the
The Company operates its automated global business in the U.S. and international markets on more than
Notes to Consolidated Financial Statements (Continued) 13. Segment and Geographic Information (Continued)
IB LLC, TH LLC and IB
Regulatory capital requirements could restrict the Operating Companies from expanding their business and declaring dividends if their net capital does not meet regulatory requirements. Also, certain
Notes to Consolidated Financial Statements (Continued) 15. Related Party Transactions Receivable from affiliate, reported in other assets in the consolidated statement of financial condition, represents amounts advanced to Holdings and payable to affiliate represents amounts payable to Holdings under the Tax Receivable Agreement (see Note 4). Included in receivables from and payables to customers in the
As required by FASB ASC Topic 855, "Subsequent
***** Unaudited Quarterly results The Company's unaudited quarterly results for
ITEM 9. CHANGES IN AND DISAGREEMENTS WITH ACCOUNTANTS ON ACCOUNTING AND FINANCIAL DISCLOSURE None. ITEM 9A. CONTROLS AND PROCEDURES Conclusion Regarding the Effectiveness of Disclosure Controls and Procedures The Company maintains disclosure controls and procedures that are designed to provide reasonable assurance that information required to be disclosed in the reports it files or submits under the Securities Exchange Act of 1934 (the "Exchange Act") is recorded, processed, summarized and reported accurately and within the time periods specified in the SEC's rules and forms. Disclosure controls and procedures include, without limitation, controls and procedures designed to ensure that information required to be disclosed by the Company in the reports that it files or submits under the Exchange Act is accumulated and communicated to management, including the Chief Executive Officer ("CEO") and Chief Financial Officer ("CFO"), as appropriate, to allow timely decisions regarding required disclosure. Under the supervision and with the participation of our management, including our CEO and our CFO, we conducted an evaluation of our disclosure controls and procedures; as such term is defined under Exchange Act Rule 13a-15(e). Based on this evaluation, our CEO and our CFO concluded that our disclosure controls and procedures were effective as of the end of the period covered by this annual report. Management's Report on Internal Control over Financial Reporting Our management is responsible for establishing and maintaining adequate internal control over financial reporting. IBG, Inc.'s internal control over financial reporting is designed to provide reasonable assurance regarding the reliability of financial reporting and the preparation of financial statements for external purposes in accordance with U.S. generally accepted accounting principles. Our internal control over financial reporting includes those policies and procedures that pertain to the maintenance of records that, in reasonable detail, accurately and fairly reflect the transactions and dispositions of the assets of IBG, Inc.; provide reasonable assurance that transactions are recorded as necessary to permit preparation of financial statements in accordance with U.S. generally accepted accounting principles, and that our receipts and expenditures are being made only in accordance with authorizations of IBG, Inc.'s management and directors; and provide reasonable assurance regarding prevention or timely detection of unauthorized acquisition, use or disposition of our assets that could have a material effect on our financial statements. In 2012, the Company's management created the Accounting Policy Committee (the "APC") to provide a robust framework for the design and implementation of all relevant controls. The APC is comprised of Because of its inherent limitations, internal control over financial reporting may not prevent or detect misstatements. Projections of any evaluation of effectiveness to future periods are subject to the risk that controls may become inadequate because of changes in conditions, or that the degree of compliance with the policies or procedures may deteriorate. Management, including our CEO and our CFO, assessed the effectiveness of IBG, Inc.'s internal control over financial reporting as of December 31, The effectiveness of the Company's internal control over financial reporting as of December 31, Changes to Internal Control
To the Stockholders and the Board of Directors Opinion on Internal Control over Financial Reporting We have audited the internal control over financial reporting of Interactive Brokers Group, Inc. and subsidiaries (the "Company") as of December 31, We have also audited, in accordance with the standards of the Public Company Accounting Oversight Board (United States), the consolidated statements of financial condition as of December 31, 2017 and 2016 and the related consolidated statements of comprehensive income, cash flows, and changes in equity for each of the three years in the period ended December 31, 2017, of the Company and our report dated February 28, 2018, expressed an unqualified opinion on those financial statements. Basis for Opinion The Company's management is responsible for maintaining effective internal control over financial reporting and for its assessment of the effectiveness of internal control over financial reporting, included in the accompanying Management's Report on Internal Control over Financial Reporting. Our responsibility is to express an opinion on the Company's internal control over financial reporting based on our audit. We are a public accounting firm registered with the PCAOB and are required to be independent with respect to the Company in accordance with the U.S. federal securities laws and the applicable rules and regulations of the Securities and Exchange Commission and the PCAOB. We conducted our audit in accordance with the standards of the Definition and Limitations of Internal Control over Financial Reporting A company's internal control over financial reporting is a process designed Because of
Not applicable. ITEM 10. DIRECTORS, EXECUTIVE OFFICERS AND CORPORATE GOVERNANCE Information related to the Company's directors and nominees under the following captions in the Company's Proxy Statement is incorporated by reference
Code of Ethics IBG, Inc.'s Code of Ethics and Business Conduct applies to all directors, officers and employees, including its Chief Executive Officer, its Chief Financial Officer and its ITEM 11. EXECUTIVE COMPENSATION Information relating to director and executive officer compensation under the following captions in the Company's Proxy Statement is incorporated by reference
ITEM 12. SECURITY OWNERSHIP OF CERTAIN BENEFICIAL OWNERS AND MANAGEMENT AND RELATED STOCKHOLDER MATTERS Other information relating to security ownership of certain beneficial owners and management is set forth under the caption "Beneficial Ownership of Directors, Executive Officers and Owners of More than Five Percent" in the Company's Proxy Statement and such information is incorporated by reference herein. ITEM 13. TRANSACTIONS WITH RELATED PERSONS, PROMOTERS AND CERTAIN CONTROL PERSONS Information regarding certain relationships and related transactions under the following caption in the Company's Proxy Statement and such information is incorporated by reference
ITEM 14. PRINCIPAL ACCOUNTANT FEES AND SERVICES Information regarding principal accounting fees and under the following caption in the Company's Proxy Statement is incorporated by reference
ITEM 15. EXHIBITS AND FINANCIAL STATEMENT SCHEDULES Documents filed as part of this report 1. Consolidated Financial Statements The consolidated financial statements required to be filed in the Annual Report on Form 10-K are listed on page F-1 hereof and in Part II, Item 8 hereof. 2. Financial Statement Schedule The financial statement schedule required in the Annual Report on Form 10-K is listed on page F-1 hereof. The required schedule appears on pages F-1 through F-5 hereof. 3. Exhibits
ITEMS. 15 (a)(1) and 15 (a)(2) INDEX TO FINANCIAL STATEMENTS AND FINANCIAL STATEMENT SCHEDULE Financial Statement Schedule
REPORT OF INDEPENDENT REGISTERED PUBLIC ACCOUNTING FIRM To the Stockholders and the Board of Directors Opinion on the Financial Statement Schedules We have audited the consolidated financial statements of Interactive Brokers Group, Inc. and subsidiaries (the "Company") as of December 31, /s/ Deloitte & Touche LLP We have served as the Company's auditor since 1990.
(Parent Company Only) CONDENSED STATEMENTS OF FINANCIAL CONDITION
See accompanying notes to the condensed financial statements.
(Parent Company Only) CONDENSED STATEMENTS OF COMPREHENSIVE INCOME
See accompanying notes to the condensed financial statements.
(Parent Company Only) CONDENSED STATEMENTS OF CASH FLOWS
See accompanying notes to the condensed financial statements.
(Parent Company Only) NOTES TO CONDENSED FINANCIAL STATEMENTS
1. Basis of Presentation The accompanying condensed financial statements (the "Parent Company Financial Statements") of Interactive Brokers Group, Inc. ("IBG, Inc."), a Delaware holding company, including the notes thereto, should be read in conjunction with the consolidated financial statements of The preparation of the Parent Company Financial Statements in conformity with accounting principles generally accepted in the United States requires management to make estimates and assumptions that affect the reported amounts and disclosures in the condensed financial statements and accompanying notes. Income Taxes Refer to Note 2 to the consolidated financial statements. 2. Related Party Transactions As of December 31, As of December 31, 3. Stockholders' Equity Refer to Note 4 to the consolidated financial statements. 4. Employee Refer to Note 5. Commitments, Contingencies and Guarantees Refer to Note 6. Subsequent Events As required by FASB ASC Topic, Except as disclosed in Note 4 and Note 12 to the consolidated financial statements, no other recordable or disclosable events **** Pursuant to the requirements of Section 13 or 15(d) the Securities Exchange Act of 1934, the registrant has duly caused this report to be signed on its behalf by the undersigned thereunto duly authorized.
Date: Pursuant to the requirements of the Securities Exchange Act of 1934, this report has been signed by the following persons on behalf of the registrant and in the capacities and on the dates
s, except DART per account) | |||||||||||||||||||||||||||||||||||||||||||||||||||||||||||||||||||||||||||||||||||||||||||||||||||||||||||||||||||||||||||||||||||||||||||||||||||||||||||||||||||||||||||||||||||||||||||||||||||||||||||||||||||||||||||||||||||||||||||||||||||||||||||||||||||||||||||||||||||||||||||||||||||||||||||||||||||||||||||||||||||||||||||||||||||||||||||||||||||||||||||||||||||||||||||||||||||||||||||||||||||||||||||||||||||||||||||||||||||||||||||||||||||||||||||||||||||||||||||||||||||||||||||||||||||||||||||||||||||||||||||||||||||||||||||||||||||||||||||||||||||||||||||||||||||||||||||||||||||||||||||||||||||||||||||||||||||||||||||||||||||||||||||||||||||||||||||||||||||||||||||||||||||||||||||||||||||||||||||||||||||||||||||||||||||||||||||||||||||||||||||||||||||||||||||||||||||||||||||||||||||||||||||||||||||||||||||||||||||||||||||||||||||||||||||||||||||||||||||||||||||||||||||||||||||||||||||||||||||||||||||||||||||||||||||||||||||||||||||||||||||||||||||||||||||||||||||||||||||||||
Commission per DART | $ | 4.28 | $ | 4.23 | 1 | % | $ | 3.92 | $ | 4.01 | (2 | )% | |||||||||||||||||||||||||||||||||||||||||||||||||||||||||||||||||||||||||||||||||||||||||||||||||||||||||||||||||||||||||||||||||||||||||||||||||||||||||||||||||||||||||||||||||||||||||||||||||||||||||||||||||||||||||||||||||||||||||||||||||||||||||||||||||||||||||||||||||||||||||||||||||||||||||||||||||||||||||||||||||||||||||||||||||||||||||||||||||||||||||||||||||||||||||||||||||||||||||||||||||||||||||||||||||||||||||||||||||||||||||||||||||||||||||||||||||||||||||||||||||||||||||||||||||||||||||||||||||||||||||||||||||||||||||||||||||||||||||||||||||||||||||||||||||||||||||||||||||||||||||||||||||||||||||||||||||||||||||||||||||||||||||||||||||||||||||||||||||||||||||||||||||||||||||||||||||||||||||||||||||||||||||||||||||||||||||||||||||||||||||||||||||||||||||||||||||||||||||||||||||||||||||||||||||||||||||||||||||||||||||||||||||||||||||||||||||||||||||||||||||||||||||||||||||||||||||||||||||||||||||||||||||||||||||||||||||||||||||||||||||||||||||||||||||||||||||||
DART per Avg. Account (Annualized) | 511 | 483 | 6 | % | 363 | 394 | (8 | )% | |||||||||||||||||||||||||||||||||||||||||||||||||||||||||||||||||||||||||||||||||||||||||||||||||||||||||||||||||||||||||||||||||||||||||||||||||||||||||||||||||||||||||||||||||||||||||||||||||||||||||||||||||||||||||||||||||||||||||||||||||||||||||||||||||||||||||||||||||||||||||||||||||||||||||||||||||||||||||||||||||||||||||||||||||||||||||||||||||||||||||||||||||||||||||||||||||||||||||||||||||||||||||||||||||||||||||||||||||||||||||||||||||||||||||||||||||||||||||||||||||||||||||||||||||||||||||||||||||||||||||||||||||||||||||||||||||||||||||||||||||||||||||||||||||||||||||||||||||||||||||||||||||||||||||||||||||||||||||||||||||||||||||||||||||||||||||||||||||||||||||||||||||||||||||||||||||||||||||||||||||||||||||||||||||||||||||||||||||||||||||||||||||||||||||||||||||||||||||||||||||||||||||||||||||||||||||||||||||||||||||||||||||||||||||||||||||||||||||||||||||||||||||||||||||||||||||||||||||||||||||||||||||||||||||||||||||||||||||||||||||||||||||||||||||||||||||||||||
Net Revenue per Avg. Account (Annualized) | $ | 3,700 | $ | 3,375 | 10 | % | $ | 3,318 | $ | 3,205 | 4 | % | |||||||||||||||||||||||||||||||||||||||||||||||||||||||||||||||||||||||||||||||||||||||||||||||||||||||||||||||||||||||||||||||||||||||||||||||||||||||||||||||||||||||||||||||||||||||||||||||||||||||||||||||||||||||||||||||||||||||||||||||||||||||||||||||||||||||||||||||||||||||||||||||||||||||||||||||||||||||||||||||||||||||||||||||||||||||||||||||||||||||||||||||||||||||||||||||||||||||||||||||||||||||||||||||||||||||||||||||||||||||||||||||||||||||||||||||||||||||||||||||||||||||||||||||||||||||||||||||||||||||||||||||||||||||||||||||||||||||||||||||||||||||||||||||||||||||||||||||||||||||||||||||||||||||||||||||||||||||||||||||||||||||||||||||||||||||||||||||||||||||||||||||||||||||||||||||||||||||||||||||||||||||||||||||||||||||||||||||||||||||||||||||||||||||||||||||||||||||||||||||||||||||||||||||||||||||||||||||||||||||||||||||||||||||||||||||||||||||||||||||||||||||||||||||||||||||||||||||||||||||||||||||||||||||||||||||||||||||||||||||||||||||||||||||||||||||||||
*(1)- Excludes non-customers.
Business Segments
The following sections discuss the results of our operations by business segment, excluding a discussion of corporate segment income and expense. In the following tables, revenues and expenses directly associated with each business segment are included in determining income before income taxes. Due to the integrated nature of the business segments, estimates and judgments have been made in allocating certain revenue and expense items. Transactions between business segments generally result from one subsidiary facilitating the business of another subsidiary through the use of its existing trading memberships and clearing arrangements. In such cases, certain revenue and expense items are eliminated to accurately reflect the external business conducted in each business segment. Rates on transactions between business segments are designed to approximate full costs. In addition to execution and clearing expenses, which are the main cost driver for both the market making segment and the electronic brokerage segment,segments, each business segment's operating expenses includeinclude: (i) employee compensation and benefits expenses that are incurred directly in support of the businesses,each business segment, (ii) general and administrative expenses, which include directly incurred expenses for property leases, professional fees, travel and entertainment, communications and information services, equipment, and (iii) indirect support costs (including compensation and other related operating expenses) for administrative services provided by IBG LLC.corporate segment subsidiaries. Such administrative services include, but are not limited to, computer software development and support, accounting, tax, legal and facilities management.
Electronic Brokerage
The following table sets forth the results of our electronic brokerage operations for the indicated periods:
| | Year Ended December 31, | |||||||||
|---|---|---|---|---|---|---|---|---|---|---|
| | 2014 | 2013 | 2012 | |||||||
| | (in millions) | |||||||||
Revenues | ||||||||||
Commissions and execution fees | $ | 549.0 | $ | 502.1 | $ | 412.6 | ||||
Interest income(1) | 352.0 | 254.2 | 213.1 | |||||||
Other income(1) | 81.4 | 85.0 | 74.5 | |||||||
| | | | | | | | | | | |
Total revenues | 982.4 | 841.3 | 700.2 | |||||||
Interest expense | 30.1 | 22.8 | 28.0 | |||||||
| | | | | | | | | | | |
Total net revenues | 952.3 | 818.5 | 672.2 | |||||||
| | | | | | | | | | | |
Non-interest expenses | ||||||||||
Execution and clearing | 147.7 | 159.1 | 135.8 | |||||||
Employee compensation and benefits | 79.9 | 74.5 | 81.6 | |||||||
Occupancy, depreciation and amortization | 11.2 | 12.5 | 12.1 | |||||||
Communications | 11.5 | 9.7 | 8.9 | |||||||
General and administrative | 113.5 | 166.9 | 90.3 | |||||||
| | | | | | | | | | | |
Total non-interest expenses | 363.8 | 422.7 | 328.7 | |||||||
| | | | | | | | | | | |
Income before income taxes | $ | 588.5 | $ | 395.8 | $ | 343.5 | ||||
| | | | | | | | | | | |
| | | | | | | | | | | |
| | | | | | | | | | | |
(1)Certain reclassifications have been made to previously reported amounts to conform with the current presentation of currency translation gains and losses related to our currency diversification strategy.
| | Year Ended December 31, | |||||||||
|---|---|---|---|---|---|---|---|---|---|---|
| | 2017 | 2016 | 2015 | |||||||
| | (in millions) | |||||||||
Revenues | ||||||||||
Commissions | $ | 648 | $ | 613 | $ | 618 | ||||
Interest income | 829 | 537 | 431 | |||||||
Other income | 108 | 128 | 79 | |||||||
| | | | | | | | | | | |
Total revenues | 1,585 | 1,278 | 1,128 | |||||||
Interest expense | 180 | 39 | 31 | |||||||
| | | | | | | | | | | |
Total net revenues | 1,405 | 1,239 | 1,097 | |||||||
| | | | | | | | | | | |
Non-interest expenses | ||||||||||
Execution and clearing | 210 | 181 | 160 | |||||||
Employee compensation and benefits | 122 | 113 | 97 | |||||||
Occupancy, depreciation and amortization | 18 | 21 | 16 | |||||||
Communications | 15 | 14 | 12 | |||||||
General and administrative | 178 | 148 | 130 | |||||||
Customer bad debt | 2 | 6 | 146 | |||||||
| | | | | | | | | | | |
Total non-interest expenses | 545 | 483 | 561 | |||||||
| | | | | | | | | | | |
Income before income taxes | $ | 860 | $ | 756 | $ | 536 | ||||
| | | | | | | | | | | |
| | | | | | | | | | | |
| | | | | | | | | | | |
Year Ended December 31, 2014 Compared2017 ("current year") compared to the Year Ended December 31, 20132016 ("prior year")
Electronic brokerage total net revenues, for the current year, ended December 31, 2014 increased $133.8$166 million, or 16%13%, compared to $952.3the prior year, to $1,405 million, from $818.5 million during the year ended December 31, 2014, primarily due to higher net interest income and commission revenue. commissions, partially offset by lower other income.
Commissions, and execution feesfor the current year, increased $46.9$35 million, or 9%6%, as a result ofcompared to the prior year, to $648 million, driven by higher cleared customer volumetrading volumes in options and stock, partially offset by a lowerstocks, continued customer account growth, and higher average commission per customer order. Cleared customer volume rose in options and futures contractscontract and stock shares by 25%, 4%share volumes increased 11% and 74%51%, respectively, for the year ended December 31, 2014 fromwhile futures contract volume decreased 9%, compared to the prior year. Total DARTs fromfor cleared and execution-only customers, for the current year, ended December 31, 2014 increased 16%4% to 566688 thousand, as compared to 486660 thousand duringfor the prior year. DARTs for cleared customers, i.e., customers for whom we execute trades, as well as, clear and carry positions, for the current year, ended December 31, 2013. DARTs fromincreased 5% to 639 thousand, compared to 609 thousand for the prior year. Average commission per DART for cleared customers, for the current year, ended December 31, 2014 increased 17%1% to 515 thousand, as$3.97, compared to 441 thousand during$3.92 for the prior year, ended December 31, 2013.reflecting larger average order sizes in stocks.
Net interest income, for the current year, increased $90.5$151 million, or 39% in the year ended December 31, 2014 as30%, compared to the corresponding period in 2013. The increase in net interest income was attributableprior year, to higher net customer interest of $43.4$649 million driven by a $4.65$5.5 billion increase in average customer credit balances, and a $4.31portion of which were invested in interest-bearing U.S. government securities, a $6.8 billion increase in average customer margin borrowings; as well as higher net fees from securities lending transactions of $46.1 million. Theloans, and a 61 basis point increase in the average FedFederal Funds effective rate decreased by approximately two basis points to 0.09% for1.00%. As a result of increases in the year endedFederal Funds effective rate since December 31, 20142016, interest expense on customer credit balances increased from the prior year, period. In 2014,in part, as certain customer credit balances that were not eligible to earn interest in the company purchased U.S. government securities forprior year became eligible to earn interest in the purpose of satisfying regulatory requirements, which improved the yieldcurrent year. The increase in benchmark rates also drove higher interest income earned on the investment of customer funds.segregated cash and on margin lending to customers.
Electronic brokerage non-interestOther income, for the current year, decreased $20 million, or 16%, compared to the prior year, to $108 million, mainly driven by a $12 million net mark-to-market loss on our U.S. government securities portfolio in the current year, compared to a $26 million net mark-to-market gain in the prior year, partially offset by higher exposure fee and market data fee income. Despite an increase in average medium term interest rates during the current year the net mark-to-market loss on our U.S. Government securities portfolio was only $12 million, reflecting a reduction in the size and average duration of the portfolio. In general, mark-to-market gains and losses on U.S. government securities are expected to reverse when, as intended, these securities are held to maturity.
Non-interest expenses, for the current year, ended December 31, 2014 decreased $58.9increased $62 million, or 14%13%, as compared to the prior year, ended December 31, 2013.to $545 million. Within non-interest expenses, execution and clearing expenses decreasedincreased $29 million, or 16% driven by $11.4 million duehigher trading volumes in options and stocks and a reduction in liquidity rebates from exchanges operating a make-or-take pricing model, in which we are paid for adding liquidity and charged for removing liquidity, as the options trading volume shifted away from orders that added liquidity to continued price competition between U.S. stock and options exchanges. Employeeorders that removed liquidity in the current year. A 10% increase in the number of employees providing services to the electronic brokerage segment led to increased employee compensation and benefits expenses increased by $5.4of $9 million, or 7% during8% and increased general and administrative expenses of $30 million, where the latter includes software development provided by the corporate segment on a consulting basis, which accounted for $18 million of this increase. In addition, general and administrative expenses for the current year ended December 31, 2014 asinclude higher advertising expenditures and professional services fees, compared to the prior year. The increase in employee compensation and benefits expense reflects an 11% increase in the average number of brokerage employees from the same period last year. General and administrative expenses decreased $53.4 million during the year ended December 31, 2014 as compared to the year ago period, primarily due to the non-recurrence of a $64 million bad debt expense recorded in 2013, offset by minor increases across other general and administrative expenses. As a percentage of total net revenues, non-interest expenses decreased to 38% from 52%were 39% for both the current year ended December 31, 2014 as compared to 2013.and the prior year.
Electronic brokerage incomeIncome before income taxes, for the current year, increased $192.7$104 million, or 49%14%, compared to $588.5 million for the prior year, ended December 31, 2014 from $395.8 million for the year ended December 31, 2013.to $860 million. As a percentage of total net revenues for the electronic brokerage segment, income before income taxes was 62%61% for both the current year and 48%the prior year.
Electronic brokerage operating results, for the years ended December 31, 2014current year, excluding the net mark-to-market gains and 2013, respectively.losses from our U.S. government securities portfolio, compared to the prior year were as follows: net revenues were $1,417 million, up 17%; income before income taxes was $872 million, up 19%; and pre-tax profit margin increased to 62% for the current year from 60% for the prior year.
Year Ended December 31, 2013 Compared2016 compared to the Year Ended December 31, 20122015
Electronic brokerage total net revenues, for the year ended December 31, 2013in 2016, increased $146.3$142 million, or 22%13%, compared to $818.52015, to $1,239 million, from $672.2 million during the year ended December 31, 2012, primarily due to higher commissions and execution fees and higher net interest income and other income.
Commissions, and execution fees increased $89.5in 2016, decreased $5 million, or 22%1%, directly attributablecompared to higher cleared2015, to $613 million, driven by mixed customer volume, which rose intrading volumes and lower average commission per customer order, but moderated by continued customer account growth. Cleared customer options and futures contractscontract and stock shares by 25%, 20%share volumes decreased 7% and 45%10%, respectively, for the year ended December 31, 2013 from the corresponding period in 2012.while futures contract volume increased 3% compared to 2015. Total DARTs fromfor cleared and execution-only customers, for the year ended December 31, 2013in 2016, increased 18%2% to 486660 thousand, as compared to 413647 thousand during the year ended December 31, 2012.2015. DARTs fromfor cleared customers, i.e., customers for the year ended December 31, 2013whom we execute trades, as well as, clear and carry positions, in 2016, increased 15%3% to 441609 thousand, as compared to 384589 thousand during the year ended December 31, 2012.in 2015. Average commission per DART for cleared customers, in 2016, decreased 4% to $3.92, compared to $4.07 in 2015, reflecting smaller average order sizes across product types.
Net interest income, in 2016, increased $ 46.3$98 million, or 25% in the year ended December 31, 2013 as compared to 2012.2015, to $498 million. The increase in net interest income was attributable to an increasehigher net customer interest of $26.4$100 million, in net fees from securities borrowed and loaned transactions as well asdriven by a $4.05$5.3 billion increase in average customer creditcash balances, and an increasethe majority of $3.21 billionwhich were invested in interest-bearing U.S. government securities, while average customer margin borrowings. Theborrowings decreased by $1.5 billion. In addition, the average Fed Funds effective rate decreasedincreased by approximately three26 basis points to 0.11% for the year ended December 31, 2013 from the prior year.0.39% in 2016, compared to 2015.
Electronic brokerage non-interest expenses for the year ended December 31, 2013Other income, in 2016, increased $94.0$49 million, or 29%62%, as compared to 2015, to $128 million, mainly driven by $26 million net mark-to-market gains on our U.S. government securities portfolio compared to $33 million net mark-to-market losses in 2015 due to a decline in average medium-term interest rates, partially offset by the year ended December 31, 2012.non-recurrence of an $18 million gain from hedging activities related to the Swiss franc event in 2015. In general, mark-to-market gains and losses on U.S. government securities are expected to reverse when, as intended, these securities are held to maturity.
Non-interest expenses, in 2016, decreased $78 million, or 14%, compared to 2015, to $483 million, mainly due to a decrease in bad debt expense of $140 million, or 96%, compared to 2015, to $6 million, on the non-recurrence of $137 million in customer bad debt expense related to the Swiss franc event in 2015. Within non-interest expenses, execution and clearing expenses increased $21 million, or 13%, driven by $23.3 million, driven primarily by anhigher trading volume in futures and a reduction in liquidity rebates from exchanges operating a make-or-take pricing model, in which we are paid for adding liquidity and charged for removing liquidity, as the options trading volume shifted away from orders that added liquidity to orders that removed liquidity in 2016 compared to 2015. A 16% increase in customer trading volume. Employeethe number of employees providing services to the electronic brokerage segment led to increased employee compensation and benefits expenses decreased by $7.1of $16 million, or 9% during the year ended December 31, 2013 as compared to 2012. The decrease16%, and in employee compensation and benefits expense reflects the non-recurrence of the special discretionary grant of restricted stock units awarded in January 2012, a payment made on unvested shares in our Stock Incentive plan in lieu of the December 2012 special dividend and lower incentive compensation related expenses. Generalgeneral and administrative expenses increased $76.6of $18 million, duringwhere the year ended December 31, 2013 aslatter includes software development provided by the corporate segment on a consulting basis. In addition, general and administrative expenses in 2016 include higher professional fees and expenses related to legal and regulatory matters, compared to 2012, primarily due to bad debt expense related to the Singapore stock issue, explained in further detail in the "Financial Overview" section.2015. As a percentage of total net revenues, non-interest expenses increased to 52% from 49% for the year ended December 31, 2013 as compared to the corresponding periodwere 39% in 2012.
Table of Contents2016 and 51% in 2015.
Electronic brokerage incomeIncome before income taxes, in 2016, increased $52.3$220 million, or 15%41%, compared to $395.8 million for the year ended December 31, 2012 from $343.5 million for the year ended December 31, 2012.2015, to $756 million. As a percentage of total net revenues for the electronic brokerage segment, income before income taxes was 48%61% in 2016 and 51%49% in 2015.
Electronic brokerage operating results, for 2016, excluding the years ended December 31, 2013net mark-to-market gains and 2012, respectively.losses from our U.S. government securities portfolio and the Swiss franc related customer losses in 2015 were as follows: net revenues were $1,213 million, up 9%; non-interest expenses were $483 million up 14%; income before income taxes was $730 million, up 6%; and pre-tax profit margin decreased to 60% in 2016 from 62% in 2015.
Market Making
The following table sets forth the results of our market making operations for the indicated periods:
| | Year Ended December 31, | |||||||||
|---|---|---|---|---|---|---|---|---|---|---|
| | 2014 | 2013 | 2012 | |||||||
| | (in millions) | |||||||||
Revenues | ||||||||||
Trading gains(1) | $ | 261.5 | $ | 331.8 | $ | 466.0 | ||||
Interest income | 64.9 | 50.8 | 57.9 | |||||||
Other income(1) | 1.9 | 7.7 | 2.6 | |||||||
| | | | | | | | | | | |
Total revenues | 328.3 | 390.3 | 526.5 | |||||||
Interest expense | 43.9 | 29.2 | 36.0 | |||||||
| | | | | | | | | | | |
Total net revenues | 284.4 | 361.1 | 490.5 | |||||||
| | | | | | | | | | | |
Non-interest expenses | ||||||||||
Execution and clearing | 63.8 | 84.0 | 117.8 | |||||||
Employee compensation and benefits | 40.8 | 45.9 | 66.8 | |||||||
Occupancy, depreciation and amortization | 6.3 | 6.1 | 7.1 | |||||||
Communications | 9.6 | 8.8 | 10.2 | |||||||
General and administrative | 49.8 | 57.8 | 69.1 | |||||||
| | | | | | | | | | | |
Total non-interest expenses | 170.3 | 202.6 | 271.0 | |||||||
| | | | | | | | | | | |
Income before income taxes | $ | 114.1 | $ | 158.5 | $ | 219.5 | ||||
| | | | | | | | | | | |
| | | | | | | | | | | |
| | | | | | | | | | | |
(1)Certain reclassifications have been made to previously reported amounts to conform with the current presentation of currency translation gains and losses related to our currency diversification strategy.
| | Year Ended December 31, | |||||||||
|---|---|---|---|---|---|---|---|---|---|---|
| | 2017 | 2016 | 2015 | |||||||
| | (in millions) | |||||||||
Revenues | ||||||||||
Trading gains | $ | 40 | $ | 163 | $ | 269 | ||||
Interest income | 89 | 71 | 62 | |||||||
Other income | 16 | 4 | 10 | |||||||
| | | | | | | | | | | |
Total revenues | 145 | 238 | 341 | |||||||
Interest expense | 59 | 48 | 43 | |||||||
| | | | | | | | | | | |
Total net revenues | 86 | 190 | 298 | |||||||
| | | | | | | | | | | |
Non-interest expenses | ||||||||||
Execution and clearing | 32 | 63 | 72 | |||||||
Employee compensation and benefits | 25 | 31 | 38 | |||||||
Occupancy, depreciation and amortization | 3 | 4 | 4 | |||||||
Communications | 7 | 10 | 10 | |||||||
General and administrative | 46 | 38 | 44 | |||||||
| | | | | | | | | | | |
Total non-interest expenses | 113 | 146 | 168 | |||||||
| | | | | | | | | | | |
Income (loss) before income taxes | $ | (27 | ) | $ | 44 | $ | 130 | |||
| | | | | | | | | | | |
| | | | | | | | | | | |
| | | | | | | | | | | |
Year Ended December 31, 2014 Compared2017 ("current year") compared to the Year Ended December 31, 20132016 ("prior year")
As previously described, in early 2017 we started the process of winding down our options market making operations and the market making results described below were mainly impacted by such pull-back.
Market making total net revenues, for the current year, ended December 31, 2014 decreased $76.7$104 million, or 21%55%, compared to $284.4the prior year, to $86 million, from $361.1 million during the year ended December 31, 2013. primarily due to lower trading gains.
Trading gains, for the current year, ended December 31, 2014 decreased $70.3$123 million, or 21% from75% compared to the year-ago period. Trading gains were negativelyprior year, to $40 million, unfavorably impacted by alower trading volumes, as we began to wind down our market making environment with intense competitionactivities in March 2017, and, lowto a lesser extent, by decreases in volatility and in the actual-to-implied volatility ratio, compared to the prior year. The VIX®, which measures perceived U.S. equity market volatility, decreased 30% to an average volatility. The VIX® was unchanged at 14.2of 11.1 for the current year, compared to an average of 15.9 for 2014 as compared to the prior year. The ratio of actual to implied volatility was up slightly at 79%decreased to an average of 60% for 2014 asthe current year, compared to 77%an average of 83% for 2013. An approximate $16 million loss due to a trading error in the third quarter also negatively impacted trading gains.
Market making optionsprior year. Options and futures contract volume and stock share volumes decreased 15%67%, 14%60%, and 6%45%, respectively, in the year ended December 31, 2014 as compared to the prior year.
Net interest income, for the current year, ended December 31, 2014 decreased by $0.6increased $7 million, or 3%30%, compared to $21.0the prior year, to $30 million. As described above, our trading gains and our net interest income are interchangeable and depend on the mix of market making positions in our portfolio and on relative interest rates in the stock and options markets.
Other income, for the current year, increased $12 million, compared to the prior year, to $16 million due to an $11 million one-time recovery of costs related to the sale of our U.S. options market making operations to Two Sigma Securities, LLC and $2 million in consulting fees related to the reimbursement of costs incurred during the transition of these operations to Two Sigma Securities, LLC.
stock and options markets. In the year ended December 31, 2014, these factors, together with securities lending activity, produced less net interest income than in 2013.
Market making non-interestNon-interest expenses, for the current year, ended December 31, 2014 decreased $32.3$33 million, or 16%23%, as compared to the prior year, ended December 31, 2013. The decrease was primarily from a $20.2 million decrease into $113 million. Within non-interest expenses, execution and clearing fees decreased $31 million, or 49%, on lower trading volumes across product types. Employee compensation and an $8.0benefits expenses decreased $6 million, decrease in general and administrative expenses during the year ended December 31, 2014 as compared to the same period last year. The decrease in execution and clearing fees wasor 19%, driven by lower volume across all product classes.continued reductions in staff. General and administrative expenses reflectincreased $8 million, or 21%, due to a reduction in administrative and$21 million write-down of the value of exchange trading rights related to the wind-down of our U.S. options market making operations, partially offset by lower consulting fees,expenses, primarily for internal software development from the year-ago period.development. As a percentage of total net revenues, market making non-interest expenses were 60% and 56%131% for the years ended December 31, 2014current year and 2013, respectively.77% for the prior year.
Market making incomeIncome before income taxes, decreased $44.4 million, or 28%, to $114.1 million for the current year, ended December 31, 2014 from $158.5decreased $71 million, forcompared to the prior year, ended December 31, 2013. Asto a percentageloss of total net revenues for the market making segment, income before income taxes was 40% and 44% for the years ended December 31, 2014 and 2013, respectively.$27 million.
Year Ended December 31, 2013 Compared2016 compared to the Year Ended December 31, 20122015
Market making total net revenues, for the year ended December 31, 2013in 2016, decreased $129.4$108 million, or 26%36%, compared to $361.12015, to $190 million, from $490.5primarily due to lower trading gains, partially offset by higher net interest income.
Trading gains, in 2016, decreased $106 million, or 39%, compared to 2015, to $163 million, unfavorably impacted by lower trading volumes, a divergence in price behavior among a significant number of individual stocks during the year ended December 31, 2012. Trading gains for the year ended December 31, 2013 decreased $134.2 million, or 29% from the prior year.
Trading gains were negatively impacted by a 15% decreasefirst quarter of 2016 and decreases in volatility as measured byand in the VIX®, which decreased to 14.2, for the year ended December 31, 2013actual-to-implied volatility ratio as compared to the year-ago period. As a result, our trading gains, after removing the effects2015. The VIX®, which measures perceived U.S. equity market volatility, decreased 5% to an average of currency translation, were 30% lower than those15.9 in 2016, compared to an average of the prior year.
Market making options16.7 in 2015. The ratio of actual to implied volatility decreased to an average of 83% in 2016, compared to an average of 88% in 2015. Options and futures contract volume decreased 12%, while futures contracts and stock sharesshare volumes increased 44%decreased 8%, 5%, and 38%15%, respectively, in the year ended December 31, 2013 as compared to 2012.2015.
Net interest income, for the year ended December 31, 2013 decreased by $0.3in 2016, increased $4 million, or 1%21%, compared to $21.62015, to $23 million. The decrease was driven by lower interest earned on firm cash balances, partially offset by an increase in net fees earned from securities borrowed and loaned transactions. As described above, our trading gains and our net interest income are interchangeable and depend on the mix of market making positions in our portfolio and on relative interest rates in the stock and options markets. In the year ended December 31, 2013,2016, these factors together with securities lending activity, produced lessmore net interest income than in 2012.2015.
Market makingNon-interest expenses, in 2016, decreased $22 million, or 13%, compared to 2015, to $146 million. Within non-interest expenses, for the year ended December 31, 2013 decreased $68.4 million, or 25%, as compared to the year ended December 31, 2012. The decrease primarily resulted from a $33.8 million decrease in execution and clearing fees and a $20.9decreased $9 million, decrease in employeeor 13%, on lower trading volumes across product types. Employee compensation and benefits during the year ended December 31, 2013 as compared to 2012. The decrease in execution and clearing fees wasexpenses decreased $7 million, or 18%, driven by continued reductions in staff. General and administrative expenses decreased $6 million, or 14%, due to lower options volume. The decrease in employee compensation and benefits expense reflects staff reductions as well as the non-recurrence of the special discretionary grant of restricted stock units awarded in January 2012, a payment made on unvested shares in our Stock Incentive plan in lieu of the December 2012 special dividend and lower incentive compensation related expenses.consulting expenses, primarily for internal software development. As a percentage of total net revenues, market making non-interest expenses increased to 74% from 59% for the year ended December 31, 2013were 77% in 2016 and 2012, respectively.56% in 2015.
Market making incomeIncome before income taxes, in 2016, decreased $61.0$86 million, or 28%66%, compared to $158.5 million for the year ended December 31, 2013 from $219.5 million for the year ended December 31, 2012.2015, to $44 million. As a
percentage of total net revenues for the market making segment, income before income taxes was 23% in 2016 and 44% and 45% for the years ended December 31, 2013 and 2012, respectively.in 2015.
Liquidity and Capital Resources
We maintain a highly liquid balance sheet. The majority of our assets consist of exchange-listed marketable securities inventories, which are marked-to-market daily, investmentinvestments of customer funds, and collateralized receivables arising from customer-related and proprietary securities transactions.transactions, and exchange-listed marketable securities, which are marked-to-market daily. Collateralized receivables consist primarily of customer margin loans, securities borrowed, and, to a lesser extent, receivables from clearing houses for settlement of securities transactions, and securities purchased under agreements to resell. AtAs of December 31, 2014,2017, total assets were $43.39$61.2 billion of which approximately $42.95$60.8 billion, or 99.0%99.3%, were considered liquid.
Daily monitoring of liquidity needs and available collateral levels is undertaken to help ensure that an appropriate liquidity cushion, in the form of unpledged collateral, is maintained at all times. Our ability to quickly reduce funding needs by balance sheet contraction without adversely affecting our core businesses and to pledge additional collateral in support of secured borrowings is continuously evaluated to ascertain the adequacy of our capital base.
We actively manage our excess liquidity and we maintain significant borrowing facilities through the securities lending markets and with banks. As a general practice, we maintain sufficient levels of cash on hand to provide us with a buffer should we need immediately available funds for any reason.
Liability balances in connection with our securities loaned and payables to customers were greater than their respective average monthly balances during the year ended December 31, 2014. Liability balances in connection with our short term borrowings were lower than their respective average monthly balances during the year ended December 31, 2014. Based on our current level of operations, we believe our cash flows from operations, available cash and available borrowings under our senior secured revolving credit facility will be adequate to meet our future liquidity needs for more than the next twelve months.
Liability balances, as of December 31, 2017, in connection with our payables to customers and securities loaned were higher than their respective average monthly balances during the current year and short-term borrowings were lower than the average monthly balance during the current year.
Cash and cash equivalents held by the Company'sour non-U.S. operating companies atas of December 31, 20142017 were $439.5$590 million ($421.2448 million atas of December 31, 2013)2016). These funds are primarily intended to finance each individual operating company's local operations, and thus would not be available to fund U.S. domestic operations unless repatriated through payment of dividends to IBG LLC. In June 2016, December 2012, a dividend2016, and September 2017 dividends of $131.6$40 million, was$22 million, and $32 million, respectively, were paid to IBG LLC from atwo of our non-U.S. subsidiary as partsubsidiaries. As of the $400 million funding for the special cash dividend. The majority of the underlying earnings of this subsidiaryDecember 31, 2017, we had previously been subject to U.S. income taxes. Therefore, additional U.S. income taxes were required to be provided on a minority portion of this dividend. It is not currently the Company'sno intention to repatriate further amounts from non-U.S. operating companies. InWith the enactment of the Tax Act, we recognized a $62 million liability for the one-time transition tax on deemed repatriation of earnings of some of our foreign subsidiaries. As a result, in the event dividends were to be paid to the Company in the future by a non-U.S. operating company, as occurred in connection with the special dividend in December 2010, the Company would not be required to accrue and pay income taxes on such dividends, toexcept for foreign taxes in the extent that U.S. income taxes had not been paid previouslyform of dividend withholding tax, if any, imposed on the incomerecipient of the paying company.distribution or dividend distribution tax imposed on the payor of the distribution.
Historically, IBG, Inc.'sour consolidated equity has consisted primarily of accumulated retained earnings, which to date have been sufficient to fund our operations and growth. IBG, Inc.'sOur consolidated equity increased 2%10% to $5.18$6.4 billion at December 2014 from $5.09 billion atas of December 31, 2013.2017 from $5.8 billion as of December 31, 2016. This increase is attributable to total comprehensive income, for 2014,partially offset by distributions and dividends paid during 2014.
Table of Contents2017.
Cash Flows
The following table sets forth our cash flows from operating activities, investing activities and financing activities for the periods indicated:
| | Year Ended December 31, | |||||||||
|---|---|---|---|---|---|---|---|---|---|---|
| | 2014 | 2013 | 2012 | |||||||
| | (in millions) | |||||||||
Net cash provided by operating activities | $ | 417.0 | $ | 140.9 | $ | 725.4 | ||||
Net cash provided by (used in) investing activities | 54.1 | (32.4 | ) | (52.4 | ) | |||||
Net cash used in financing activities | (308.0 | ) | (248.5 | ) | (605.2 | ) | ||||
Effect of exchange rate changes on cash and cash equivalents | (107.0 | ) | (27.4 | ) | 28.2 | |||||
| | | | | | | | | | | |
Increase (decrease) in cash and cash equivalents | $ | 56.1 | $ | (167.4 | ) | $ | 96.0 | |||
| | | | | | | | | | | |
| | | | | | | | | | | |
| | | | | | | | | | | |
| | Year-Ended December 31, | |||||||||
|---|---|---|---|---|---|---|---|---|---|---|
| | 2017 | 2016 | 2015 | |||||||
| | (in millions) | |||||||||
Net cash provided by operating activities | $ | 142 | $ | 544 | $ | 725 | ||||
Net cash used in investing activities | (26 | ) | (6 | ) | (35 | ) | ||||
Net cash used in financing activities | (374 | ) | (189 | ) | (295 | ) | ||||
Effect of exchange rate changes on cash and cash equivalents | 65 | (25 | ) | (63 | ) | |||||
| | | | | | | | | | | |
(Decrease) increase in cash and cash equivalents | $ | (193 | ) | $ | 324 | $ | 332 | |||
| | | | | | | | | | | |
| | | | | | | | | | | |
| | | | | | | | | | | |
Our cash flows from operating activities are largely a reflection of the changes in customer credit and margin loan balances in our electronic brokerage business, and of the size and composition of trading positions held by our market making subsidiaries, and of the changes in customer cash and margin debit balances in our electronic brokerage business.subsidiaries. Our cash flows from investing activities are primarily related to our currency diversification strategy, other investments, capitalized internal software development, purchases and sales of memberships at exchanges where we trade, and strategic investments where such investments may enable us to offer better execution alternatives to our current and prospective customers, or create new opportunities for ourselves as market makers or where we can influence exchanges to provide competing products at better prices using sophisticated technology. Our cash flows from financing activities are comprised of short-term borrowings long-term borrowings and capital transactions. Short-term borrowings from banks are part of our daily cash management in support of operating activities. Other borrowings provide us with flexible sources of excess liquidity and regulatory capital. Capital transactions consist primarily of the approximately $400 million special dividend paid in December 2012 as well as the quarterly dividends beginning in June 2011 and continuing through December 2014 paid to common stockholders and related cash distributions paid to Holdings.
Year Ended December 31, 2014:2017: Our cash and cash equivalents increaseddecreased by $56.1$193 million to $1,269.3 million at$1.7 billion for the end of 2014.year ended December 31, 2017. We raised $417.0$142 million in net cash from operating activities. We used net cash of $253.9$400 million in our investing and financing activities, primarily for distributions to noncontrolling interests, dividends paid to our common stockholders and noncontrolling interests and payments made to Holdings under the Tax Receivable Agreement, partially offset by cash generated by otherAgreement. Investing activities mainly consisted of distributions received from investments and an increase in short term borrowings. Under investing activities, purchases of property, equipment and sales of other investments mainly consisted transactions in marketable securities held for investment purposes.intangible assets.
Year Ended December 31, 2013:2016: Our cash and cash equivalents decreasedincreased by $167.4$324 million to $1,213.2 million at$1.9 billion for the end of 2013.year ended December 31, 2016. We raised $140.9$544 million in net cash from operating activities. We used net cash of $32.4$195 million in our investing activities to purchase other investments and for capital expenditures. We used $248.5 million in financing activities, primarily for distributions to noncontrolling interests, dividends paid to our common stockholders and to reduce short-term borrowings.payments made under the Tax Receivable Agreement. Under investing activities, purchases and sales of other investments mainly consisted of transactions in marketable securities held for investment purposes and distributions received from investments.
Year Ended December 31, 2012:2015: Our cash and cash equivalents increased by $96.0$332 million to $1,380.6$1,601 million atfor the end of 2012.year ended December 31, 2015. We raised $725.4$725 million in net cash from operating activities. We used net cash of $52.4$330 million in our investing activities to purchase other investments and for capital expenditures. We used $605.2 million in financing activities, primarily infor distributions to noncontrolling interests, dividends paid the repayment of senior notes outstandingto our common stockholders, and payments made to Holdings under the Tax receivableReceivable Agreement.
Table Under investing activities, purchases and sales of Contentsother investments mainly consisted of transactions in marketable securities held for investment purposes.
Regulatory Capital Requirements
Our principal operating subsidiariescompanies are subject to separate regulation and capital requirements in the United StatesU.S. and other jurisdictions. THIB LLC and IBTH LLC are registered U.S. broker-dealers and futures commission merchants, and their primary regulators include the SEC, the Commodity Futures Trading Commission, the Chicago Board Options Exchange, and FINRA. Additionally, IB LLC is regulated by the CFTC and the Chicago Mercantile Exchange,Exchange. IB LLC is also a registered U.S. futures commission merchant, as such it is regulated by the Financial Industry Regulatory Authority and the National Futures Association.NFA. THE is registered to do business in Switzerland as a securities dealer and is regulated by the Swiss Financial Market Supervisory Authority. IBUK is subject to regulation by the U.K. Financial Conduct Authority. Our various other operating subsidiariescompanies are similarly regulated. See the notes to the audited consolidated financial statements in Part II, Item 8 of this Annual Report on Form 10-K for further information regarding our regulated subsidiaries.operating companies.
AtAs of December 31, 2014,2017, aggregate excess regulatory capital for all of the operating companies was $3.27$4.5 billion, and all of the operating companies were in compliance with their respective regulatory capital requirements.
| | Net Capital/ Eligible Equity | Requirement | Excess | |||||||
|---|---|---|---|---|---|---|---|---|---|---|
| | (in millions) | |||||||||
IB LLC | $ | 2,333.9 | $ | 279.0 | $ | 2,054.9 | ||||
TH LLC | 374.2 | 63.6 | 310.6 | |||||||
THE | 661.7 | 205.3 | 456.4 | |||||||
Other regulated Operating Companies | 486.0 | 36.1 | 449.9 | |||||||
| | | | | | | | | | | |
| $ | 3,855.8 | $ | 584.0 | $ | 3,271.8 | |||||
| | | | | | | | | | | |
| | | | | | | | | | | |
| | | | | | | | | | | |
| | Net Capital/ Eligible Equity | Requirement | Excess | |||||||
|---|---|---|---|---|---|---|---|---|---|---|
| | (in millions) | |||||||||
IB LLC | $ | 3,548 | $ | 495 | $ | 3,053 | ||||
TH LLC | 279 | 1 | 278 | |||||||
THE | 614 | 92 | 522 | |||||||
Other regulated operating companies | 773 | 121 | 652 | |||||||
| | | | | | | | | | | |
| $ | 5,214 | $ | 709 | $ | 4,505 | |||||
| | | | | | | | | | | |
| | | | | | | | | | | |
| | | | | | | | | | | |
Principal Indebtedness
Senior Secured Revolving Credit Facility
On May 17, 2012, IBG LLC entered into a $100 million three-year senior secured revolving credit facility with a syndicate of banks. This credit facility replaced a similar two-year facility that expired on May 18, 2012. On August 8, 2014 IBG LLC elected to terminate this credit facility.
Senior Notes
Prior to January 2012, IBG LLC periodically issued senior notes in private placements to certain qualified customers of IB LLC. IBG LLC used the proceeds from sales of the senior notes to provide capital to IBG LLC's broker-dealer subsidiaries in the form of subordinated loans and for other general purposes. Based on a review of its available liquidity resources, which resulted in a determination of a strong liquidity position, in January 2012 the Company decided to discontinue the Senior Notes Program. It is the Company's current intention that no new Senior Notes will be issued.
Capital Expenditures
Our capital expenditures are comprised of compensation costs of our software engineering staff for development of software for internal use and expenditures for computer, networking and communications hardware. These expenditure items are reported as property, equipment, and equipment.intangible assets. Capital expenditures for property, equipment, and equipmentintangible assets were approximately $19.4, $16.8$28 million, $27 million, and $18.0$30 million for the three years ended December 31, 2014, 20132017, 2016, and 2012,2015, respectively. In the future, we plan to meet capital expenditure needs as we continue our focus on technology infrastructure initiatives to further enhance our competitive position. We anticipate that we will fund capital expenditures with cash from operations and cash on hand. In response to changing economic conditions, we believe we have the flexibility to modify our capital expenditures by adjusting them (either upward or downward) to match our actual performance. If we pursue any strategic acquisitions, we may incur additional capital expenditures.
Contractual Obligations Summary
Our contractual obligations principally include obligations associated with our outstanding indebtedness and interest payments as of December 31, 2014.2017.
| | Payments Due by Year | ||||||||||||
|---|---|---|---|---|---|---|---|---|---|---|---|---|---|
| | Total | 2015 - 2016 | 2017 - 2018 | Thereafter | |||||||||
| | (in Millions) | ||||||||||||
Payable to Holdings under Tax Receivable Agreement(1) | $ | 277.4 | $ | 41.1 | $ | 45.9 | $ | 190.4 | |||||
Operating leases | 41.9 | 22.9 | 18.4 | 0.6 | |||||||||
| | | | | | | | | | | | | | |
Total contractual cash obligations | $ | 319.3 | $ | 64.0 | $ | 64.3 | $ | 191.0 | |||||
| | | | | | | | | | | | | | |
| | | | | | | | | | | | | | |
| | | | | | | | | | | | | | |
| | Payments Due by Year | ||||||||||||
|---|---|---|---|---|---|---|---|---|---|---|---|---|---|
| | Total | 2018 - 2019 | 2020 - 2021 | Thereafter | |||||||||
| | (in millions) | ||||||||||||
Payable to Holdings under Tax Receivable Agreement(1) | $ | 187 | $ | 49 | $ | 34 | $ | 104 | |||||
Operating leases | 154 | 25 | 20 | 109 | |||||||||
Transition Tax liability(2) | 62 | 10 | 10 | 42 | |||||||||
| | | | | | | | | | | | | | |
Total contractual cash obligations | $ | 403 | $ | 84 | $ | 64 | $ | 255 | |||||
| | | | | | | | | | | | | | |
| | | | | | | | | | | | | | |
| | | | | | | | | | | | | | |
- (1)
- As of December 31,
2014,2017, contractual amounts owed under thetax receivable agreementTax Receivable Agreement of$277.4$187 million have been recorded in payable to affiliate in the consolidated financial statements representing management's best estimate of the amounts currently expected to be owed under thetax receivable agreement.Tax Receivable Agreement. Through December 31,2014,2017, approximately$86.2$131 million of cumulative cash payments have been made. - (2)
- The Tax Act implemented a modified territorial tax system that includes a one-time transition tax on deemed repatriated earnings of foreign subsidiaries to be paid over an eight-year period. We believe this tax will not have a material impact on our liquidity.
Seasonality
Our businesses are subject to seasonal fluctuations, reflecting varying numbers of market participants at times during the year, and varying numbers of trading days from quarter-to-quarter, includingand declines in trading activity due to holidays. Typical seasonal trends may be superseded by market or world events, which can have a significant impact on prices and trading volume.
Inflation
Although we cannot accurately anticipate the effecteffects of inflation on our operations, we believe that, inflation has not had for the three most recent years, and isinflation has not likely in the foreseeable future to have,had a material impact on our results of operations.operations and will not likely have a material impact in the foreseeable future.
The company purchasedInvestments in U.S. Government Securities
We invest in U.S. government securities for the purpose of satisfying U.S. regulatory requirements. As a broker-dealer, unlike banks, we are required to mark these investments to market even though we intend to hold them to maturity. Sudden increases in interest rates will cause mark-to-market losses on these securities.securities, which are recovered if we hold them to maturity, as currently intended. The impact of changes in interest rates is further described in ITEM 7A. QUANTITATIVE AND QUALITATIVE DISCLOSURES ABOUT MARKET RISK.7A of this Annual Report on Form 10-K entitled "Quantitative and Qualitative Disclosures about Market Risk."
Strategic Investments and Acquisitions
We periodically engage in evaluations ofregularly evaluate potential strategic investments and acquisitions. The Company holdsWe hold strategic investments in electronic trading exchanges including: BostonBOX Options Exchange, LLC; OneChicago LLC and CBOE Stock Exchange,OneChicago LLC. The Company has also made anIn addition, on September 20, 2017, we announced our agreement to make a strategic investment in Quadriserv Inc.,Tiger Brokers, an electronic securities lending platform provider.online stock brokerage established for global Chinese retail and institutional clients.
We intend to continue making acquisitions on an opportunistic basis, generally only when the acquisition candidate will, in our opinion, enable us to acquire either technology or customers faster than we could develop them on our own. At
As of December 31, 2014,2017, there were no other definitive agreements with respect to any material acquisition.
Certain Information Concerning Off-Balance-Sheet Arrangements
IBG, Inc.We may be exposed to a risk of loss not reflected in theour consolidated financial statements for futures products, which represent our obligations of the Company to settle at contracted prices, and which may require us to repurchase or salesell in the market at prevailing prices. Accordingly, these transactions result
in off-balance sheet risk, as IBG, Inc.'sour cost to liquidate such futures contracts may exceed the amounts reported in our consolidated statements of financial condition.
Critical Accounting Policies
Principles of Consolidation, including Noncontrolling Interests
The consolidated financial statements include the accounts of IBG, Inc. and its majority and wholly owned subsidiaries. As sole managing member of IBG LLC, we exert control over the Group's operations. In accordance with Financial Accounting Standards Board ("FASB") Accounting Standards Codification ("ASC") ASC Topic 810, "Consolidation," we consolidate the Group's consolidated financial statements and record as noncontrolling interest the interests in the Group that we do not own.
We are the sole managing member of IBG LLC and, as such, operate and control all of the business and affairs of IBG LLC and its subsidiaries and as such, consolidate IBG LLC's financial results into our financial statements. We hold approximately 17.4% ownership interest in IBG LLC. Holdings is owned by the original members of IBG LLC and holds approximately 82.6% ownership interest in IBG LLC. Our current share of IBG LLC's net income is approximately 17.4%.
Our policy is to consolidate all other entities in which we own more than 50% unless we do not have control. All inter-company balances and transactions have been eliminated.
Use of Estimates
The preparation of financial statements in conformity with U.S. GAAP requires management to make estimates and assumptions that affect the reported amounts and disclosures in the consolidated financial statements and accompanying notes. These estimates and assumptions are based on judgment and the best available information at the time. Therefore, actual results could differ materially from those estimates. Such estimates include the allowance for doubtful accounts, valuation of certain investments, compensation accruals, current and deferred income taxes, costs associated with exit or disposal activities, and contingency reserves.
Valuation of Financial Instruments
Due to the nature of our operations, substantially all of our financial instrument assets, comprised of financial instruments owned, securities purchased under agreements to resell, securities borrowed, receivable from customers, and receivables from brokers, dealers and clearing organizations are carried at fair value based on published market prices and are marked to market daily, or are assets which are short-term in nature and are reported at amounts approximatingthat approximate fair value. Similarly, all of our financial instrument liabilities that arise from financial instruments sold but not yet purchased, securities sold under agreements to repurchase, securities loaned, payables to customers, and payables to brokers, dealers and clearing organizations are carried at fair value based on published market prices and are marked to market daily, or are liabilities which are short-term in nature and are reported at quoted market prices or at amounts approximatingthat approximate fair value. Our long and short positions are mainly valued at either the last consolidated trade price at the close of regular trading hours, in their respective markets. Given that we manage a globally integrated market making portfolio, we may have large and substantially offsetting positions in securities and commodities that trade on different exchanges that close at different times of the trading day. As a result, there may be large and anomalous swings in the value of our positions daily and, accordingly, in our earnings in any period. This is especially true on the last business day of each calendar quarter or year, although such swings tend to come back into equilibrium on the first business day of the succeeding calendar quarter.
Principles of Consolidation, including Noncontrolling Interests
The consolidated financial statements include the accounts of IBG, Inc. and its majority and wholly owned subsidiaries. As sole managing member of IBG LLC, IBG, Inc. exerts control over the Group's operations. In accordance with Financial Accounting Standards Board ("FASB") Accounting Standards Codification ("ASC") ASC Topic 810, "Consolidation", the Company consolidates the Group's consolidated financial statements and records as noncontrolling interest the interests in the Group that IBG, Inc. does not own.
We are the sole managing member of IBG LLC and, as such, operate and control all of the business and affairs of IBG LLC and its subsidiaries and consolidate IBG LLC's financial results into our financial statements. We hold approximately 14.5% ownership interest in IBG LLC. Holdings is owned by the original members of IBG LLC and holds approximately 85.5% ownership interest in IBG LLC. Our share of IBG LLC's net income is approximately 14.5% and similarly, outstanding shares of our common stock represent approximately 14.5% of the outstanding membership interests of IBG LLC.
Prior to the June 6, 2012 amendment to the Exchange Agreement (see Note 4 to the consolidated financial statements), the Company was required to report Holdings' ownership as redeemable noncontrolling interests (i.e., temporary equity), outside of total equity in the consolidated financial statements. Redemption value of these redeemable noncontrolling interests was measured as the number of equivalent shares of member interests in IBG LLC owned by Holdings multiplied by the then current market price per share of the Company's common stock. The excess of the redemption value over the book value of these interests, which did not affect net income attributable to common stockholdersquarter or cash flows, was required to be accounted for as a reduction of the Company's stockholders' equity in the consolidated statement of financial condition.
The Company elected to recognize changes in redemption value in each reporting period immediately as they occurred as if the end of each reporting period was also the redemption date for the entire redeemable noncontrolling interest, notwithstanding that the redeemable noncontrolling
interests are redeemable over a period of time pursuant to a redemption schedule (see Note 4 to the consolidated financial statements).
For periods after the Amendment, the noncontrolling interests in IBG LLC attributable to Holdings will be reported as a component of total equity.
The Company's policy is to consolidate all other entities in which it owns more than 50% unless it does not have control. All inter-company balances and transactions have been eliminated.year.
Earnings per Share
Earnings per share ("EPS") are computed in accordance with FASB ASC Topic 260, "Earnings per Share." Shares of Class A and Class B common stock share proportionately inBasic EPS is computed by dividing the earnings of IBG, Inc. Basic earnings per share are calculated utilizing net income available for common stockholders divided by the weighted average number of shares of Class A and Class B common stock outstanding for that period. Diluted earnings per share areEPS is calculated utilizingby dividing the Company's basic net income available for common stockholders divided by the diluted weighted average shares outstanding for that period. Diluted EPS includes the determinants of the basic EPS and, in addition, reflects the dilutive effect of shares of common stock estimated to be distributed in the future under our stock-based compensation plans, with no adjustments to net income available tofor common stockholders for dilutive potential common shares.
For periods prior to June 6, 2012, the Company has determined to reflect Topic D-98 measurement adjustments for non-fair value redemption rights through applicationTable of the two-class method of calculating earnings per share in lieu of recognizing the impact through the determination of net income attributable to common shareholders. Furthermore, the Company has elected to treat only the portion of the periodic measurement adjustments that reflect a redemption in excess of fair value as being akin to a dividend, reducing net income attributable to common stockholders for purposes of applying the two-class method. Decreases in the carrying amount of redeemable noncontrolling interests through Topic D-98 measurement adjustments are reflected in the application of the two-class method only to the extent they represent recoveries of amounts previously accounted for by applying the two-class method.Contents
Stock-Based Compensation
IBG, Inc. followsWe follow FASB ASC Topic 718, "Compensation—Stock Compensation" ("ASC Topic 718"), to account for itsour stock-based compensation plans. ASC Topic 718 requires all share-based payments to employees to be recognized in the consolidated financial statements using a fair value-based method. Grants, which are denominated in U.S. dollars, are communicated to employees in the year of grant, thereby establishing the fair value of each grant. The fair value of awards granted to employees are generally expensed as follows—follows: 50% in the year of grant in recognition of plan forfeiturethe plans' post-employment provisions (described(as described below) and the remaining 50% over the related vesting period utilizing the "graded vesting" method permitted under ASC Topic 718. In the case of "retirement eligible" employees (those employees older than 59), 100% of awards are expensed when granted.
Awards granted under the stock-based compensation plans are subject to forfeiturethe plans' post-employment provisions in the event an employee ceases employment with the Company.us. The plans provide that employees who discontinue employment with the Companyus without cause and continue to meet the terms of the plans' post-employment provisions will forfeitbe eligible to earn 50% of unvested previously granted, but not yet earned awards, unless the employee is over the age of 59, in which case the employee would be eligible to receive 100% of unvested awards previously granted.granted, but not yet earned awards.
Contingencies
Our policy is to estimate and accrue for potential losses that may arise out of litigation and regulatory proceedings, to the extent that such losses are probable and can be estimated, in accordance with FASB ASC Topic 450, "Contingencies." Significant judgment is required in making these estimates
and our final liabilities may ultimately be materially different. Our total liability accrued with respect to litigation and regulatory proceedings is determined on a case-by-case basis and represents an estimate of probable losses based on, among other factors, the progress of each case, our experience with and industry experience with similar cases and the opinions and views of internal and external legal counsel. Given the inherent difficulty of predicting the outcome of our litigation and regulatory matters, particularly in cases or proceedings in which substantial or indeterminate damages or fines are sought, or where cases or proceedings are in the early stages, we cannot estimate losses or ranges of losses for cases or proceedings where there is only a reasonable possibility that a loss may be incurred.
We have been from time to time subject to certain pending and legal actions which arise out of the normal course of business. Litigation is inherently unpredictable, particularly in proceedings where claimants seek substantial or indeterminate damages, or which are in their early stages. We cannot predict with certainty the actual loss or range of loss related to such legal proceedings, the manner in which they will be resolved, the timing of final resolution or the ultimate settlement. Consequently, we cannot estimate losses or ranges of losses related to such legal matters, even in instances where it is reasonably possible that a future loss will be incurred. As of December 31, 2014,2017, we, along with certain of our subsidiaries, have been named parties to legal actions, which we and/or such subsidiaries intend to defend vigorously. Although the results of legal actions cannot be predicted with certainty, it is the opinion of management that the resolution of these actions is not expected to have a material adverse effect, if any, on our business or financial condition, but may have a material impact on the results of operations for a given period. As of December 31, 20142017 and December 31, 2013,2016, reserves provided for potential losses related to litigation matters were not material.
Use of Estimates
The preparation of financial statements in conformity with U.S. GAAP requires management to make estimates and assumptions that affect the reported amounts and disclosures in the consolidated financial statements and accompanying notes. These estimates and assumptions are based on judgment and the best available information at the time. Therefore, actual results could differ materially from those estimates. Such estimates include the allowance for doubtful accounts, valuation of certain investments, compensation accruals, current and deferred income taxes and estimated contingency reserves.
Income Taxes
IBG, Inc. accountsWe account for income taxes in accordance with FASB ASC Topic 740, "Income Taxes" ("ASC Topic 740"). The Company'sOur income tax expense, deferred tax assets and liabilities, and reserves for unrecognized tax benefits are based on enacted tax laws and reflect management's best assessment of estimated future taxes to be paid. We are subject to income taxes in both the United StatesU.S. and numerous foreign jurisdictions. Determining income tax expense requires significant judgments and estimates.
Deferred income tax assets and liabilities arise from temporary differences between the tax and financial statement recognition of the underlying assets and liabilities. In evaluating our ability to recover our deferred tax assets within the jurisdictions from which they arise, we consider all available positive and negative evidence, including scheduled reversals of deferred tax liabilities, projected future taxable income, tax-planning strategies, and results of recent operations. In projecting future taxable income, historical results are adjusted for changes in accounting policies and incorporate assumptions including the amount of future state, federal and foreign pretaxpre-tax operating income, the reversal of temporary differences, and the implementation of feasible and prudent tax-planning strategies. These assumptions require significant judgment about the forecasts of future taxable income and are consistent with the plans and estimates we are using to manage the underlying businesses. In evaluating the objective evidence that historical results provide, three years of cumulative operating income (loss)
are considered. Deferred income taxes have not been provided for U.S. tax liabilities or for additional foreign taxes on the unremitted earnings of foreign subsidiaries that have been indefinitely reinvested.
The calculation of our tax liabilities involves dealing with uncertainties in the application of complex tax laws and regulations in a multitude of jurisdictions across our global operations. Changes in tax laws and rates could also affect recorded deferred tax assets and liabilities in the future. Management isThe enactment of the Tax Act on December 22, 2017 significantly revised the U.S corporate income tax law by, among other things, reducing the corporate income tax rate from 35% to 21% and implementing a modified territorial tax system that includes a one-time transition tax on deemed repatriated earnings of foreign subsidiaries. See Note 10 to the audited consolidated financial statements in Part II, Item 8 of this Annual Report on Form 10-K. We record tax liabilities in accordance with ASC Topic 740 and adjust these liabilities when management's judgment changes as a result of the evaluation of new information not awarepreviously available. Because of any such changesthe complexity of some of these uncertainties, the ultimate resolution may result in payments that would have a material effect onare different from the Company's resultscurrent estimates of operations, cash flows,these tax liabilities. These differences will be reflected as increases or financial position.decreases to income tax expense in the period in which new information becomes available.
We recognize that a tax benefit from an uncertain tax position may be recognized only when it is more likely than not that the position will be sustained upon examination, including resolutions of any related appeals or litigation processes, on the basis of the technical merits. A tax position that meets this standard is measured at the largest amount of benefit that will more likely than not be realized on settlement.
The Company records tax liabilities in accordance with ASC Topic 740 and adjusts these liabilities when management's judgment changes as a result of the evaluation of new information not previously available. Because of the complexity of some of these uncertainties, the ultimate resolution may result in payments that are different from the current estimates of these tax liabilities. These differences will be reflected as increases or decreasesWe recognize interest related to income tax matters as interest income or interest expense in the period in which new information becomes available.and penalties related to income tax matters as income tax expense.
Recently Issued Accounting Pronouncements
Following is a summary of recently issued FASB Accounting Standards Updates ("ASUs") that have affected or may affect the Company'sour consolidated financial statements:
| | Affects | Status | |||
|---|---|---|---|---|---|
| ASU | Effective for fiscal years beginning after December 15, 2017. | ||||
ASU 2016-02 | Leases (Topic 842): Requires the recognition of a right-of-use asset and a lease liability for leases previousely classified as operating leases in the statements of financial condition. | Effective for fiscal years beginning after December 15, 2018. | |||
ASU 2016-08 | Revenue from Contracts with Customers (Topic 606): Principal versus Agent Considerations (Reporting Revenue Gross versus Net). | Effective for annual reporting periods beginning after December 15, 2017. | |||
ASU 2016-10 | Revenue from Contracts with Customers (Topic 606): Identifying Performance Obligations and Licensing. | Effective for annual reporting periods beginning after December 15, 2017. | |||
ASU 2016-13 | Financial Instruments—Credit Losses (Topic 326): Measurement of Credit Losses on Financial Instruments. | Effective for fiscal years beginning after December 15, 2019. | |||
ASU 2016-15 | Statement of Cash Flows (Topic 230): Classification of Certain Cash Receipts and Cash Payments. | Effective for fiscal years beginning after December 15, 2017. | |||
ASU 2016-16 | Income Taxes (Topic 740): Intra-Entity Transfers of Assets Other Than Inventory. | Effective for annual reporting periods beginning after December 15, 2017. | |||
ASU 2017-01 | Business Combinations (Topic 805): Clarifying the Definition of a Business. | Effective for annual periods beginning after December 15, 2017. | |||
ASU 2017-04 | Intangibles—Goodwill and Other (Topic 350): Simplifying the Test for Goodwill Impairment. | Effective for fiscal years beginning after December 15, 2019. | |||
ASU 2017-05 | Other Income—Gains and Losses from the Derecognition of Nonfinancial Assets (Subtopic 610-20): Clarifying the Scope of Asset Derecognition Guidance and Accounting for Partial Sales of Nonfinancial Assets. | Effective for annual reporting periods beginning after December 15, 2017. | |||
ASU 2017-08 | Receivables—Nonrefundable Fees and Other Costs (Subtopic 310-20): Amending the amortization period for certain purchased callable debt securities held at a premium. | Effective for fiscal years, and interim periods within those fiscal years, beginning after December 15, | |||
| ASU | Effective for annual periods, and interim periods within those annual periods, beginning after December 15, | |||||||||
ASU | Effective for | |||||||||
ASU | Effective for | |||||||||
ASU | Effective for | |||||||||
Adoption of those ASUs that became effective during 20142017 and 20152018 prior to the issuance of the Company'sour consolidated financial statements, did not have a material effect on these financial statements.
Non-GAAP Financial Measures
Non-GAAP measures are used to isolate items that the Company's management views as non-operating in nature, which is intended to give a clearer presentation of operating results. Given its material impact on our reported financial results, the following non-GAAP measure is presented for 2010:
In December 2010, we effected a series of dividend payments, culminating in a cash dividend of $1.79 per share, which was paid to holders of IBKR common stock. In total, IBG LLC paid out about $1 billion. Funding for this dividend originated with our Swiss company, which paid a dividend to IBG LLC, its parent company. IBG LLC, in turn, paid a dividend to its members, including Interactive Brokers Group, Inc., the public company. On a consolidated reporting basis, these dividends had no
effect on the Company's reported income. However, the original dividend from the Swiss company was made from earnings that were not previously taxed in the U.S. As a result, this triggered a U.S. federal income tax liability for the Company, which is reported as income tax expense in the consolidated statement of comprehensive income. This income tax liability was funded by reserving a portion of the dividend that the Company received. The remaining after-tax amount was paid to the Company's common stockholders. The result was cash-flow neutral for the public company.
The Company also paid a dividend equivalent to employees holding unvested shares in our Stock Incentive Plan at that time. This amounted to approximately $10 million and was recorded as compensation expense.
In summary, this item reduced diluted EPS by approximately $0.71 for the 2010 year.
The Company believes that it is appropriate to adjust this non-operating item in the consolidated statement of comprehensive income in order to achieve a proper representation of the Company's financial performance. For a reconciliation of our accounting principles generally accepted in the United States of America ("U.S. GAAP") to non-GAAP results for 2010 see the 'GAAP to Non-GAAP Reconciliation and Footnotes' later in this section this Annual Report on Form 10-K.
GAAP to NON-GAAP Reconciliation and Footnotes
IBG, Inc. Consolidated
| | 2010 | |||||||||
|---|---|---|---|---|---|---|---|---|---|---|
| | (In thousands, except shares or per share amounts) | |||||||||
| | As Reported | Non-GAAP Adjustments | Non-GAAP Financial Performance Measures | |||||||
Income Before Income Taxes: | ||||||||||
As reported | $ | 337,415 | ||||||||
| | | | | | | | | | | |
| | | | | | | | | | | |
| | | | | | | | | | | �� |
Non-GAAP Adjustments for non-operating activities— | ||||||||||
Payments in lieu of dividends on unvested shares of the Company's Class A Common Stock(a) | $ | 9,456 | ||||||||
| | | | | | | | | | | |
| $ | 337,415 | $ | 9,456 | $ | 346,871 | |||||
| | | | | | | | | | | |
| | | | | | | | | | | |
| | | | | | | | | | | |
Pre-tax profit margin | 37 | % | 38 | % | ||||||
| | | | | | | | | | | |
| | | | | | | | | | | |
| | | | | | | | | | | |
Income Tax Expense: | ||||||||||
As reported | $ | 60,281 | ||||||||
| | | | | | | | | | | |
| | | | | | | | | | | |
| | | | | | | | | | | |
Non-GAAP Adjustments for non-operating activities— | ||||||||||
Income taxes on payments in lieu of dividends(a) | $ | 678 | ||||||||
The Company's share of taxes payable arising from the payment of dividends by THE AG to IBG LLC(b) | (46,112 | ) | ||||||||
U.S. foreign tax credits for Swiss taxes paid(c) | 16,608 | |||||||||
| | | | | | | | | | | |
| $ | 60,281 | $ | (28,826 | ) | $ | 31,455 | ||||
| | | | | | | | | | | |
| | | | | | | | | | | |
| | | | | | | | | | | |
Net Income (loss) attributable to common stockholders: | ||||||||||
As reported | $ | (9,550 | ) | |||||||
| | | | | | | | | | | |
| | | | | | | | | | | |
| | | | | | | | | | | |
Non-GAAP Adjustments for non-operating activities— | ||||||||||
Payments in lieu of dividends on unvested shares of the Company's Class A Common Stock(a) | $ | 1,010 | ||||||||
Income taxes on payments in lieu of dividends(a) | (368 | ) | ||||||||
The Company's share of taxes payable arising from the payment of dividends by THE AG to IBG LLC(b) | 46,112 | |||||||||
U.S. foreign tax credits for Swiss taxes paid(c) | (16,608 | ) | ||||||||
| | | | | | | | | | | |
| $ | (9,550 | ) | $ | 30,146 | $ | 20,596 | ||||
| | | | | | | | | | | |
| | | | | | | | | | | |
| | | | | | | | | | | |
Earnings per Share(d): | ||||||||||
Basic | $ | (0.23 | ) | $ | 0.72 | $ | 0.49 | |||
| | | | | | | | | | | |
| | | | | | | | | | | |
| | | | | | | | | | | |
Diluted | $ | (0.23 | ) | $ | 0.71 | $ | 0.48 | |||
| | | | | | | | | | | |
| | | | | | | | | | | |
| | | | | | | | | | | |
Weighted Average Shares: | ||||||||||
Basic | 41,870,926 | 41,870,926 | ||||||||
| | | | | | | | | | | |
| | | | | | | | | | | |
| | | | | | | | | | | |
Diluted | 42,498,705 | 42,498,705 | ||||||||
| | | | | | | | | | | |
| | | | | | | | | | | |
| | | | | | | | | | | |
(a)Holders of unvested Class A shares of the Company's common stock were paid $1.79 per share in lieu of the cash dividend paid on outstanding shares on December 23, 2010. The Company's share of these payments was $1.0 million, on which it realized a tax benefit of $0.4 million.
(b)On December 21, 2010, Timber Hill Europe AG ("THE AG") paid its sole shareholder, IBG LLC, a dividend of $990.3 million. THE AG's pretax earnings had not previously been subject to taxation in the United States. U.S. federal income taxes on the Company's share of this dividend were $40.8 million. In addition, the Company incurred $5.3 million in non- refundable taxes withheld by the Swiss government.(c)The provision for income taxes is reported net of available foreign tax credits of $16.6 million.(d)The non-GAAP diluted EPS for 2010 of $0.48 differs from the $0.72 by $0.24, which representedWe have reviewed the impact ofcurrency translation now included inFASB ASU Topic 606, "Revenue from Contracts with Customers" ("ASC Topic 606"), and identified similar performance obligations under ASC Topic 606 as compared with deliverables and separate units of account previously identified, as a result we expect theGAAP Comprehensive Income. See Note 5timing of our revenue to remain theconsolidated financial statements in this section for further information regarding comprehensive income.
ITEM 7A. QUANTITATIVE AND QUALITATIVE DISCLOSURES ABOUT MARKET RISK
We are exposed to various market risks. Our exposures to market risks arise from assumptions built into our pricing models, equity price risk, foreign currency exchange rate fluctuations related to our international operations, changes in interest rates which impact our variable-rate debt obligations, if any, and risks relating to the extension of margin credit to our customers.
Market risk refers to the risk that a change in the level of one or more market prices, rates, indices, implied volatilities (the price volatility of the underlying instrument imputed from option prices), correlations or other market factors, such as market liquidity, will result in losses for a position or portfolio. Generally, the Company incurswe incur trading-related market risk as a result of activities in the market making segment, where the substantial majority of the Company'sour Value-at-Risk ("VaR") for market risk exposures is generated. In addition, the Company incurswe incur non-trading-related market risk primarily from investment activities and from foreign currency exposure held in the equity of the Company's non-market makingour foreign affiliates, i.e., itsour non-U.S. brokerage affiliates and information technology affiliates, and held to meet target balances in itsour currency diversification strategy.
The Company usesTable of Contents
We use various risk management tools in managing itsour market risk, which are embedded in itsour real-time market making systems. We employ certain hedging and risk management techniques to protect us from a severe market dislocation. Our risk management policies are developed and implemented by our Chairman and our steering committee, which is comprised of senior executives of our various companies. Our strategy is to calculate quotes a few seconds ahead of the market and execute small trades at a tiny but favorable differential as a result. This is made possible by our proprietary pricing model, which evaluates and monitors the risks inherent in our portfolio, assimilates external market data and reevaluates the outstanding quotes in our portfolio eachmany times per second. Our model automatically rebalances our positions throughout each trading day to manage risk exposures on our options and futures positions and the underlying securities, and will price the increased risk that a position would add to the overall portfolio into the bid and offer prices we post. Under risk management policies implemented and monitored primarily through our computer systems, reports to management, including risk profiles, profit and loss analysis and trading performance, are prepared on a real-time basis as well as daily and periodical bases. Although our market making is completely automated, the trading process and our risk are monitored by a team of individuals who, in real time, observe various risk parameters of our consolidated positions. Our assets and liabilities are marked-to-market daily for financial reporting purposes and re-valued continuously throughout the trading day for risk management and asset/liability management purposes.
The Company usesWe use a covariant VaR methodology to measure, monitor and review the market risk of itsour market making portfolios, with the exception of fixed income products, and itsour currency exposures. The risk of fixed income products, which comprise primarily U.S. corporate bonds and U.S. Treasurygovernment securities, is measured using a stress test.
Pricing Model Exposure
As described above, our proprietary pricing model, which continuously evaluates and monitors the risks inherent in our portfolio, assimilates external market data and reevaluates the outstanding quotes in our entire portfolio eachmany times per second. Certain aspects of the model rely on historical prices of securities. If the behavior of price movements of individual securities diverges substantially from what their historical behavior would predict, we might incur trading losses. We attempt to limit such risks by diversifying our portfolio across many different options, futures and underlying securities and avoiding concentrations of positions based on the same underlying security. Historically, our losses from these events have been immaterial in comparison to our annual trading profits.
Foreign Currency Exposure
As a result of our international market making activities and accumulated earnings in our foreign subsidiaries, our income and net worth is exposed to fluctuations in foreign exchange rates. OurFor example, our European operations and some of our Asian operations are conducted by our Swiss subsidiary, THE. THE is regulated by the Swiss Financial Market Supervisory Authority as a securities dealer and its financial statements are presented in Swiss francs. Accordingly, THE is exposed to certain foreign exchange risks as described below:
- •
- THE buys and sells futures contracts and securities denominated in various currencies and carries bank balances and borrows and lends such currencies in its regular course of business. At the end of each accounting period, THE's assets and liabilities are
translatedrevalued into Swiss francs for presentation in its financial statements. The resulting foreign currency gains or losses are reportedas translation gain or lossin THE's incomestatement. When we prepare our consolidated financial statements, THE's Swiss franc balances arestatement and, as translated into U.S. dollars for U.S. GAAPpurposes. THE's translation gains or losses appear as such on IBG, Inc.'spurposes, in our consolidated statement of comprehensive income,included inas a component of other income.
- •
- THE's
net worth is carried on THE's booksfinancial statements are presented in Swiss francsin accordance with Swiss accounting standards.(i.e., its functional currency) as noted above. At the end of each accounting period, THE's net worth is translated at the then prevailing exchange rate into U.S. dollars and the resulting translation gain or loss is reported as OCI in our consolidated statement of financial condition and consolidated statement of comprehensive income.To a smaller extent,OCI is also produced by our other non-U.S. subsidiaries.
Historically, we have taken the approach of not hedging the above exposures, based on the notion that the cost of constantly hedging over the years would amount to more than the random impact of rate changes on our non-U.S. dollar balances. For instance, an increase in the value of the Swiss franc would be unfavorable to the earnings of THE but would be counterbalanced to some extent by the fact that the yearly translation gain or loss into U.S. dollars is likely to move in the opposite direction.
Since 2005, we have expanded ourOur market making systems to incorporate cash forex and forex options to hedge our currency exposure at little or no cost and to hedge our currency exposure throughout each day on a continuous basis. The majority of currency spot positions held as part of our currency diversification strategy are regularly transferred from the market making unitsegment to the parent holding company, IBG LLC, where they are held and reported in the corporate segment. In connection with the development of our currency diversification strategy, we determined to base our net worth in GLOBALs, a basket of currencies. Periodically, we re-evaluate the composition of the GLOBAL; in
2011 we expanded the composition of the GLOBAL from six to 16 currencies. The table below shows a comparison of the U.S. dollar equivalent of the GLOBAL as December 31, 2014 and 2013.
| | | As of 12/31/2013 | As of 12/31/2014 | | |||||||||||||||||||||||||||
|---|---|---|---|---|---|---|---|---|---|---|---|---|---|---|---|---|---|---|---|---|---|---|---|---|---|---|---|---|---|---|---|
Currency | Composition | FX Rate | GLOBAL in USD Equiv. | % of Comp. | Net Equity (in USD millions) | FX Rate | GLOBAL in USD Equiv. | % of Comp. | Net Equity (in USD millions) | CHANGE in % of Comp. | |||||||||||||||||||||
USD | 0.41 | 1.0000 | 0.410 | 38.2 | % | 1,944.9 | 1.0000 | 0.410 | 40.6 | % | 2,107.4 | 1.0 | % | ||||||||||||||||||
EUR | 0.17 | 1.3745 | 0.234 | 21.8 | % | 1,108.4 | 1.2098 | 0.206 | 20.4 | % | 1,057.1 | 1.6 | % | ||||||||||||||||||
JPY | 10.00 | 0.0095 | 0.095 | 8.8 | % | 450.5 | 0.0084 | 0.084 | 8.3 | % | 429.4 | –2.2 | % | ||||||||||||||||||
GBP | 0.03 | 1.6559 | 0.050 | 4.6 | % | 235.7 | 1.5577 | 0.047 | 4.6 | % | 240.2 | 0.1 | % | ||||||||||||||||||
CAD | 0.04 | 0.9415 | 0.038 | 3.5 | % | 178.6 | 0.8608 | 0.034 | 3.4 | % | 177.0 | –0.1 | % | ||||||||||||||||||
BRL | 0.08 | 0.4234 | 0.034 | 3.2 | % | 160.7 | 0.3763 | 0.030 | 3.0 | % | 154.7 | –0.2 | % | ||||||||||||||||||
INR | 2.00 | 1.1199 | 0.034 | 3.1 | % | 159.4 | 0.0159 | 0.032 | 3.1 | % | 163.1 | –0.5 | % | ||||||||||||||||||
CHF | 0.03 | 0.0162 | 0.032 | 3.0 | % | 153.5 | 1.0058 | 0.030 | 3.0 | % | 155.1 | 0.2 | % | ||||||||||||||||||
HKD | 0.25 | 0.1290 | 0.032 | 3.0 | % | 152.9 | 0.1290 | 0.032 | 3.2 | % | 165.7 | 0.1 | % | ||||||||||||||||||
AUD | 0.03 | 0.8915 | 0.027 | 2.5 | % | 126.9 | 0.8169 | 0.025 | 2.4 | % | 126.0 | –0.2 | % | ||||||||||||||||||
KRW | 28.00 | 0.0009 | 0.027 | 2.5 | % | 125.8 | 0.0009 | 0.026 | 2.5 | % | 131.5 | 0.1 | % | ||||||||||||||||||
MXN | 0.30 | 0.0767 | 0.023 | 2.1 | % | 109.2 | 0.0678 | 0.020 | 2.0 | % | 104.6 | 0.0 | % | ||||||||||||||||||
SEK | 0.09 | 0.1553 | 0.014 | 1.3 | % | 66.3 | 0.1282 | 0.012 | 1.1 | % | 59.3 | 0.1 | % | ||||||||||||||||||
NOK | 0.06 | 0.1648 | 0.010 | 0.9 | % | 46.9 | 0.1338 | 0.008 | 0.8 | % | 41.3 | 0.0 | % | ||||||||||||||||||
SGD | 0.01 | 0.7916 | 0.008 | 0.7 | % | 37.6 | 0.7544 | 0.008 | 0.7 | % | 38.8 | 0.0 | % | ||||||||||||||||||
DKK | 0.04 | 0.1842 | 0.007 | 0.7 | % | 35.0 | 0.1625 | 0.006 | 0.6 | % | 33.4 | 0.0 | % | ||||||||||||||||||
| | | | | | | | | | | | | | | | | | | | | | | | | | | | | | | | |
| 1.073 | 100.0 | % | 5,092.1 | 1.009 | 100.0 | % | 5,184.6 | 0.0 | % | ||||||||||||||||||||||
| | | | | | | | | | | | | | | | | | | | | | | | | | | | | | | | |
| | | | | | | | | | | | | | | | | | | | | | | | | | | | | | | | |
| | | | | | | | | | | | | | | | | | | | | | | | | | | | | | | | |
Because we conduct business in many countries and many currencies and we actively manage our global currency exposure by maintaining our equity in GLOBALs,because we consider ourselves a global enterprise based in a diversified basket of currencies rather than a U.S. dollar based company.company, we actively manage our global currency exposure by maintaining our equity in GLOBALs. The U.S. dollar value of the GLOBAL decreasedincreased from $1.07$0.949 to $ 1.01,$0.978, or 6%3.06%, in 2014. Atas of December 31, 2014,2017 compared to December 31, 2016. As of December 31, 2017, approximately 59%30% of our equity was denominated in currencies other than the U.S. dollars.dollar.
The table below shows a comparison of the U.S. dollar equivalent of the GLOBAL as of December 31, 2017 and 2016.
| | | As of 12/31/2016 | | As of 12/31/2017 | | |||||||||||||||||||||||||||||
|---|---|---|---|---|---|---|---|---|---|---|---|---|---|---|---|---|---|---|---|---|---|---|---|---|---|---|---|---|---|---|---|---|---|---|
Currency | Composition | FX Rate | GLOBAL in USD Equiv. | % of Comp. | Net Equity (in USD millions) | New Composition | FX Rate | GLOBAL in USD Equiv. | % of Comp. | Net Equity (in USD millions) | CHANGE in % of Comp. | |||||||||||||||||||||||
USD | 0.45 | 1.0000 | 0.450 | 47.4 | % | $ | 2,759 | 0.68 | 1.0000 | 0.680 | 69.5 | % | $ | 4,471 | 22.1 | % | ||||||||||||||||||
EUR | 0.17 | 1.0519 | 0.179 | 18.8 | % | 1,096 | 0.09 | 1.1998 | 0.108 | 11.0 | % | 710 | –7.8 | % | ||||||||||||||||||||
JPY | 8.00 | 0.0086 | 0.068 | 7.2 | % | 420 | 4.41 | 0.0089 | 0.039 | 4.0 | % | 257 | –3.2 | % | ||||||||||||||||||||
GBP | 0.03 | 1.2341 | 0.037 | 3.9 | % | 227 | 0.02 | 1.3514 | 0.027 | 2.8 | % | 178 | –1.1 | % | ||||||||||||||||||||
HKD | 0.26 | 0.1290 | 0.034 | 3.5 | % | 206 | 0.14 | 0.1280 | 0.018 | 1.8 | % | 118 | –1.7 | % | ||||||||||||||||||||
INR | 2.00 | 0.0147 | 0.029 | 3.1 | % | 180 | 1.10 | 0.0157 | 0.017 | 1.8 | % | 113 | –1.3 | % | ||||||||||||||||||||
CHF | 0.03 | 0.9819 | 0.029 | 3.1 | % | 181 | 0.02 | 1.0263 | 0.021 | 2.1 | % | 135 | –1.0 | % | ||||||||||||||||||||
CAD | 0.04 | 0.7445 | 0.030 | 3.1 | % | 183 | 0.02 | 0.7950 | 0.016 | 1.6 | % | 105 | –1.5 | % | ||||||||||||||||||||
CNH | 0.19 | 0.1434 | 0.027 | 2.9 | % | 167 | 0.10 | 0.1535 | 0.015 | 1.6 | % | 101 | –1.3 | % | ||||||||||||||||||||
AUD | 0.03 | 0.7216 | 0.022 | 2.3 | % | 133 | 0.02 | 0.7802 | 0.016 | 1.6 | % | 103 | –0.7 | % | ||||||||||||||||||||
MXN | 0.30 | 0.0482 | 0.014 | 1.5 | % | 89 | 0.17 | 0.0509 | 0.009 | 0.9 | % | 57 | –0.6 | % | ||||||||||||||||||||
SEK | 0.09 | 0.1098 | 0.010 | 1.0 | % | 61 | 0.05 | 0.1219 | 0.006 | 0.6 | % | 40 | –0.4 | % | ||||||||||||||||||||
SGD | 0.01 | 0.6905 | 0.007 | 0.7 | % | 42 | 0.00 | –0.7 | % | |||||||||||||||||||||||||
NOK | 0.06 | 0.1158 | 0.007 | 0.7 | % | 43 | 0.03 | 0.1218 | 0.004 | 0.4 | % | 24 | –0.4 | % | ||||||||||||||||||||
DKK | 0.04 | 0.1416 | 0.006 | 0.6 | % | 35 | 0.02 | 0.1612 | 0.003 | 0.3 | % | 21 | –0.3 | % | ||||||||||||||||||||
| | | | | | | | | | | | | | | | | | | | | | | | | | | | | | | | | | | |
| 0.949 | 100.0 | % | $ | 5,820 | 0.978 | 100.0 | % | $ | 6,433 | 0.0 | % | |||||||||||||||||||||||
| | | | | | | | | | | | | | | | | | | | | | | | | | | | | | | | | | | |
| | | | | | | | | | | | | | | | | | | | | | | | | | | | | | | | | | | |
| | | | | | | | | | | | | | | | | | | | | | | | | | | | | | | | | | | |
Changes in the Composition of the "GLOBAL"
In light of our decision to discontinue our options market making activities globally, we removed the Singapore dollar (SGD) and realigned the relative weights of the U.S. dollar (USD) versus the other currency components to better reflect our businesses going forward. The new composition contains 14 currencies, one fewer than the prior composition. The new composition was effective as of the close of business on March 31, 2017.
The effects of our currency diversification strategy appear in two places in the consolidated financial statements: (1) as a component of other income in the condensed consolidated statement of comprehensive income and (2) as OCI in the condensed consolidated statement of financial condition.condition and the consolidated statement of comprehensive income. The full effect of the GLOBAL is captured in comprehensive income and the consolidated statement of comprehensive income.
Reported results on a comprehensive basis reflect the U.S. GAAP convention adopted in 2011 that requires the reporting of currency translation results contained in OCI as part of reportable earnings. Previously, currency translation results were reported only as a component of changes in Total Equity in the condensed consolidated statement of financial condition.
Interest Rate Risk
We had no variable-rate debt outstanding atas of December 31, 2014.2017.
We pay our electronic brokerage customers interest based on benchmark overnight interest rates in various currencies.currencies, on balances above $10 thousand, or equivalent, and on accounts holding more than $100 thousand (or equivalent) net asset value. In a normal rate environment, we typically invest a portion of these funds in U.S. government treasury securities with maturities of up to two years. If interest rates were to increase rapidly and substantially, our net interest income willwould not increase proportionally with the interest rates for the portion of the funds invested in the treasuryU.S. government securities with fixed yields. In addition, the mark-to-market changes in the value of thethese fixed rate securities will be reflected in other income. However, we do not payincome, instead of net interest on individual customer balances below $10 thousand.income. Based on customer balances and investments outstanding atas of December 31, 2014,2017, and assuming reinvestment of maturing instruments in instruments of short-term duration, an increase of 0.5% in the0.25% over current U.S. benchmarkdollar interest ratesrate levels would result in a net increase in our net interest income ofby approximately $79$11 million over the first year and $15 million on an annualized basis. Ifbasis, assuming the benchmarkfull effect of reinvestment at higher rates. Our interest rate sensitivity estimate has been updated to separate assumptions for U.S. dollar rates werefrom other currencies' rates and to isolate the effects of a rate increase by 1.0% from current
levels, our net interest income would increase by approximately $71 million on an annualized basis. The company didreinvestments. We do not approximate mark to marketmark-to-market impact from interest rate changes; if treasuryU.S. government securities whose prices were to fall under these scenarios were held to maturity, as intended, then the reduction in net interestother income would be temporary, as the securities would mature at par value.
We also face the potential for reduced net interest income from customer deposits due to interest rate spread compression in a low rate environment. Due to a currently low rate environment,Based on customer balances and investments outstanding as of December 31, 2017, and assuming reinvestment of maturing instruments in instruments of short-term duration, a decrease of benchmarkin U.S. dollar interest rates by 0.05%,of 0.25% would reducedecrease our net interest income by approximately $11.7$7 million over the first year and $16 million on an annualized basis.basis, assuming the full effect of reinvestment at lower rates.
We also face substantial interest rate risk due to positions carried in our market making business to the extent that long or short stock positions may have been established for future or forward dates on options or futures contracts and the value of such positions are impacted by interest rates. We hedge such risks by entering into interest rate futures contracts. To the extent that these futures positions do not perfectly hedge this interest rate risk, our trading gains may be adversely affected. The amount of such risk cannot be quantified.quantified, however, the reduction of market making positions has substantially reduced this exposure.
Dividend Risk
We face dividend risk in our market making business as we derive significant revenues and incur significant expenses in the form of dividend income and expense, respectively, from our substantial inventory of equity securities, and must make significant payments in lieu of dividends on short positions in equity securities inwithin our portfolio. Projected future dividends are an important component of pricing equity options and other derivatives, and incorrect projections may lead to trading losses. The amount of these riskssuch risk cannot be quantified.
Margin CreditLoans
We extend margin creditloans to our customers, which isare subject to various regulatory requirements. Margin credit isloans are collateralized by cash and securities in the customers' accounts. The risks associated with margin credit increase during periods of fast market movements or in cases where collateral is concentrated and market movements occur. During such times, customers who utilize margin creditloans and who have collateralized their obligations with securities may find that the securities have a rapidly depreciating value and may not be sufficient to cover their obligations in the event of a liquidation. We are also exposed to credit risk when our customers execute transactions, such as short sales of options and equities that can expose them to risk beyond their invested capital.
We expect this kind of exposure to increase with the growth inof our overall business. Because we indemnify and hold harmless our clearing firms from certain liabilities or claims, the use of margin creditloans and short sales may expose us to significant off-balance-sheet risk in the event that collateral requirements are not sufficient to fully cover losses that customers may incur and those customers fail to satisfy their obligations. As of December 31, 2014,2017, we had $16.9$29.8 billion in margin creditloans extended to our customers. The amount of risk to which we are exposed from the margin creditloans we extend to our customers and from short sale transactions by our customers is unlimited and not quantifiable as the risk is dependent upon analysis of a potential significant and undeterminable rise or fall in stock prices. Our account level margin credit requirements meet or exceed those required by Regulation T of the Board of Governors of the Federal Reserve.Reserve and SEC portfolio margin rules, as applicable. As a matter of practice, we enforce real-time margin compliance monitoring and liquidate customers' positions if their equity falls below required margin requirements.
We have a comprehensive policy implemented in accordance with regulatory standards to assess and monitor the suitability of investors to engage in various trading activities. To mitigate our risk, we also continuously monitor customer accounts to detect excessive concentration, large orders or positions, patterns of day trading and other activities that indicate increased risk to us.
Our credit exposure is to a great extent mitigated by our policy of automatically evaluating each account throughout the trading day and closing out positions automatically for accounts that are found to be under-margined. While this methodology is effective in most situations, it may not be effective in situations where no liquid market exists for the relevant securities or commodities or where, for any reason, automatic liquidation for certain accounts has been disabled.
Value-at-Risk
The Company estimatesWe estimate VaR using an historical approach, which uses the historical daily price returns of underlying assets as well as estimates of the end of day implied volatility for options. The Company'sOur one-day VaR is defined as the unrealized loss in portfolio value that, based on historically observed market risk factors, would have been exceeded with a frequency of one percent, based on a calculation with a confidence interval of 99%.
The Company'sOur VaR model generally takes into account exposures to equity and commodity price risk and foreign exchange rates.
The Company usesWe use VaR as one of a range of risk management tools. Among their benefits, VaR models permit estimation of a portfolio's aggregate market risk exposure, incorporating a range of varied market risks and portfolio assets. One key element of the VaR model is that it reflects risk reduction due to portfolio diversification or hedging activities. However, VaR has various strengths and limitations, which include, but are not limited to: use of historical changes in market risk factors, which may not be accurate predictors of future market conditions, and may not fully incorporate the risk of extreme market events that are outsized relative to observed historical market behavior or reflect the historical distribution of results beyond the confidence interval; and reporting of losses in a single day, which
does not reflect the risk of positions that cannot be liquidated or hedged in one day. A small proportion of market risk generated by trading positions is not included in VaR. The modeling of the risk characteristics of some positions relies on approximations that, under certain circumstances, could produce significantly different results from those produced using more precise measures. VaR is most appropriate as a risk measure for trading positions in liquid financial markets and will understate the risk associated with severe events, such as periods of extreme illiquidity.
The VaR calculation simulates the performance of the portfolio based on several years of the daily price changes of the underlying assets and determines the VaR as the calculated loss that occurs at the 99th percentile.
Since the reported VaR statistics are estimates based on historical data, VaR should not be viewed as predictive of the Company'sour future revenues or financial performance or of itsour ability to monitor and manage risk. There can be no assurance that the Company'sour actual losses on a particular day will not exceed the indicated VaR or that such losses will not occur more than one time in 100 trading days. VaR does not predict the magnitude of losses which, should they occur, may be significantly greater than the VaR amount.
Stress Test
The Company estimatesWe estimate the market risk to itsof our fixed income portfolio using a risk analysis model provided by a leading external vendor. ThisFor corporate bonds, this stress test is configured to calculate the change in value of each bondfixed income security in the portfolio over one day in eightseven scenarios each of which represents a parallel shift of the U.S. Treasury yield curve. The scenarios are shifts of +/–100, +/–200 and +/–300 basis points.
Table For U.S. government securities, the stress test is configured to calculate the change in value of Contentseach fixed income security in the portfolio over one day in three scenarios each of which represents a parallel shift of the U.S. Treasury yield curve. The scenarios are shifts of +/–25 basis points.
VaR and Stress Test Measures
Market Risk Category | At December 31, 2014 | At December 31, 2013 | Average 2014 | High 2014 | |||||||||
|---|---|---|---|---|---|---|---|---|---|---|---|---|---|
| | (USD in millions) | ||||||||||||
Trading(1) | |||||||||||||
Equities and Currencies(2) | 4.5 | 19.6 | 18.6 | 24.3 | |||||||||
Fixed Income(3) | 0.5 | 2.0 | 1.5 | 2.2 | |||||||||
| | | | | | | | | | | | | | |
Trading Total | 5.0 | 21.6 | 20.1 | 26.5 | |||||||||
Non-Trading(1) | |||||||||||||
Equities and Currencies | 18.8 | 1.4 | 6.5 | 18.8 | |||||||||
Fixed Income, Other | — | 0.1 | — | — | |||||||||
| | | | | | | | | | | | | | |
Non-Trading Total | 18.8 | 1.5 | 6.5 | 18.8 | |||||||||
Market Risk Category | At December 31, 2017 | At December 31, 2016 | Average 2017 | High 2017 | |||||||||
|---|---|---|---|---|---|---|---|---|---|---|---|---|---|
| | (in millions) | ||||||||||||
Trading(1) | |||||||||||||
Equities and Currencies(2) | $ | 7 | $ | 7 | $ | 7 | $ | 8 | |||||
Fixed Income(3) | — | — | — | — | |||||||||
| | | | | | | | | | | | | | |
Trading Total | $ | 7 | $ | 7 | $ | 7 | $ | 8 | |||||
Non-Trading(1) | |||||||||||||
Equities and Currencies | $ | 13 | $ | 22 | $ | 13 | $ | 13 | |||||
Fixed Income, Other(4) | 8 | 11 | 8 | 12 | |||||||||
| | | | | | | | | | | | | | |
Non-Trading Total | $ | 21 | $ | 33 | $ | 21 | $ | 25 | |||||
- (1)
- The product categories displayed in the table as "Trading" reflect activities undertaken in the Company's market making segment.
VaR amounts reported for December 31, 2014 reflect certain foreign currency transactions and the Company's reclassification related to its currency diversification strategy, as disclosed in ITEM 7 herein. For periods prior to the quarter ending December 31, 2014, the effects of this currency diversification are reported in the market making segment and the corresponding VaR measures are reported in the Trading category. For periods ending at or after December 31, 2014, the currency effects are reported in the corporate segment and the corresponding VaR measures are reported in the Non-Trading category.
The "Non-trading" category reflects investment activities and foreign currency exposures held in the equity of the Company's non-market making affiliates, i.e., its non-U.S. brokerage affiliates and information technology affiliates. As stated above, as of December 31, 2014 thisThis category also includes corporate segment activities in foreign exchange designed to achieve the Company's currency diversification strategy.
The average and high VaR and stress test amounts are based on the four quarter ending VaR calculations performed in 2014.2017.
- (2)
- Equities and currencies held for market making purposes are combined because these products are part of an integrated, hedged market making portfolio, on which the risk is measured using VaR.
- (3)
For theThe Trading—Fixed Income categorywhichcontains primarily foreign government securities held in connection with market making activities and a small value of corporatebonds and U.S. Treasury securities, thebonds. The risks on these products were managed separately and measured using the stress test analysis.Corporate bond positions- (4)
- The Non-Trading—Fixed Income, Other category contains primarily U.S. government securities held in segregated safekeeping accounts for the
market maker segment were substantially eliminated at December 31, 2014.exclusive benefit of our brokerage customers, on which the risk is measured using a stress test analysis.
ITEM 8. FINANCIAL STATEMENTS AND SUPPLEMENTARY DATA
Index to Consolidated Financial Statements
Report of Independent Registered Public Accounting Firm | ||||
Consolidated Statements of Financial Condition as of December 31, | ||||
Consolidated Statements of Comprehensive Income for the years ended December 31, | ||||
Consolidated Statements of Cash Flows for the years ended December | ||||
Consolidated Statements of | ||||
Notes to Consolidated Financial Statements | ||||
Supplementary Data—Unaudited Quarterly Results |
REPORT OF INDEPENDENT REGISTERED PUBLIC ACCOUNTING FIRM
To the Stockholders and the Board of Directors and Stockholders of
Interactive Brokers Group, Inc.
Greenwich, CT
Opinion on the Consolidated Financial Statements
We have audited the accompanying consolidated statements of financial condition of Interactive Brokers Group, Inc. and subsidiaries (the "Company") as of December 31, 20142017 and 2013, and2016, the related consolidated statements of comprehensive income, changes in equity, and cash flows, for each of the three years in the period ended December 31, 2014. These2017 and the related notes (collectively referred to as the "consolidated financial statements are the responsibility of the Company's management. Our responsibility is to express an opinion on these financial statements based on our audits.
We conducted our audits in accordance with the standards of the Public Company Accounting Oversight Board (United States)statements"). Those standards require that we plan and perform the audit to obtain reasonable assurance about whether the financial statements are free of material misstatement. An audit includes examining, on a test basis, evidence supporting the amounts and disclosures in the financial statements. An audit also includes assessing the accounting principles used and significant estimates made by management, as well as evaluating the overall financial statement presentation. We believe that our audits provide a reasonable basis for our opinion.
In our opinion, suchthe consolidated financial statements present fairly, in all material respects, the financial position of Interactive Brokers Group, Inc. and subsidiaries atthe Company as of December 31, 20142017 and 2013,2016, and the results of their operations and their cash flows for each of the three years in the period ended December 31, 2014,2017, in conformity with accounting principles generally accepted in the United States of America.
We have also audited, in accordance with the standards of the Public Company Accounting Oversight Board (United States) (PCAOB), the Company's internal control over financial reporting as of December 31, 2014,2017, based on the criteria established inInternal Control—Integrated Framework (1992)(2013) issued by the Committee of Sponsoring Organizations of the Treadway Commission and our report dated March 2, 2015February 28, 2018 expressed an unqualified opinion on the Company's internal control over financial reporting.
Basis for Opinion
These consolidated financial statements are the responsibility of the Company's management. Our responsibility is to express an opinion on the Company's consolidated financial statements based on our audits. We are a public accounting firm registered with the PCAOB and are required to be independent with respect to the Company in accordance with the U.S. federal securities laws and the applicable rules and regulations of the Securities and Exchange Commission and the PCAOB.
We conducted our audits in accordance with the standards of the PCAOB. Those standards require that we plan and perform the audit to obtain reasonable assurance about whether the consolidated financial statements are free of material misstatement, whether due to error or fraud. Our audits included performing procedures to assess the risks of material misstatement of the consolidated financial statements, whether due to error or fraud, and performing procedures that respond to those risks. Such procedures included examining, on a test basis, evidence regarding the amounts and disclosures in the consolidated financial statements. Our audits also included evaluating the accounting principles used and significant estimates made by management, as well as evaluating the overall presentation of the consolidated financial statements. We believe that our audits provide a reasonable basis for our opinion.
/s/ Deloitte & Touche LLP
New York, New York
February 28, 2018
We have served as the Company's auditor since 1990.
Interactive Brokers Group, Inc. and Subsidiaries
Consolidated Statements of Financial Condition
| | December 31, | ||||||
|---|---|---|---|---|---|---|---|
(in thousands, except share amounts) | 2014 | 2013 | |||||
Assets | |||||||
Cash and cash equivalents | $ | 1,269,317 | $ | 1,213,241 | |||
Cash and securities—segregated for regulatory purposes | 15,403,512 | 13,991,711 | |||||
Securities borrowed | 3,659,766 | 2,751,501 | |||||
Securities purchased under agreements to resell | 386,221 | 386,316 | |||||
Financial instruments owned, at fair value: | |||||||
Financial instruments owned | 1,998,427 | 3,285,313 | |||||
Financial instruments owned and pledged as collateral | 1,935,722 | 1,163,531 | |||||
| | | | | | | | |
Total financial instruments owned, at fair value | 3,934,149 | 4,448,844 | |||||
| | | | | | | | |
Receivables: | |||||||
Customers, less allowance for doubtful accounts of $6,613 and $67,999 at December 31, 2014 and 2013 | 17,051,452 | 13,596,650 | |||||
Brokers, dealers and clearing organizations | 1,131,177 | 858,189 | |||||
Interest | 36,785 | 26,489 | |||||
| | | | | | | | |
Total receivables | 18,219,414 | 14,481,328 | |||||
| | | | | | | | |
Other assets | 512,647 | 597,759 | |||||
| | | | | | | | |
Total assets | $ | 43,385,026 | $ | 37,870,700 | |||
| | | | | | | | |
| | | | | | | | |
| | | | | | | | |
Liabilities and equity | |||||||
Short-term borrowings | $ | 33,791 | $ | 24,635 | |||
Financial instruments sold, but not yet purchased, at fair value | 2,560,787 | 3,153,673 | |||||
Securities loaned | 3,199,106 | 2,563,653 | |||||
Payables | |||||||
Customers | 31,795,853 | 26,319,420 | |||||
Brokers, dealers and clearing organizations | 234,098 | 330,956 | |||||
Payable to affiliate | 277,400 | 287,242 | |||||
Accounts payable, accrued expenses and other liabilities | 95,401 | 96,026 | |||||
Interest | 3,962 | 2,969 | |||||
| | | | | | | | |
Total payables | 32,406,714 | 27,036,613 | |||||
| | | | | | | | |
Total liabilities | 38,200,398 | 32,778,574 | |||||
| | | | | | | | |
Commitments, contingencies and guarantees (see Note 15) | |||||||
Equity | |||||||
Stockholders' equity | |||||||
Common stock, $0.01 par value per share: | |||||||
Class A—Authorized—1,000,000,000, Issued—58,612,245 and 54,788,049 shares, Outstanding—58,473,186 and 54,664,095 shares at December 31, 2014 and 2013 | 586 | 548 | |||||
Class B—Authorized, Issued and Outstanding—100 shares at December 31, 2014 and 2013 | — | — | |||||
Additional paid-in capital | 636,150 | 583,312 | |||||
Retained earnings | 120,670 | 98,868 | |||||
Accumulated other comprehensive income, net of income taxes of $651 and $936 at December 31, 2014 and 2013 | 11,982 | 27,028 | |||||
Treasury stock, at cost, 139,059 and 123,954 shares at December 31, 2014 and 2013 | (3,064 | ) | (2,492 | ) | |||
| | | | | | | | |
Total stockholders' equity | 766,324 | 707,264 | |||||
Noncontrolling interests | 4,418,304 | 4,384,862 | |||||
| | | | | | | | |
Total equity | 5,184,628 | 5,092,126 | |||||
| | | | | | | | |
Total liabilities and equity | $ | 43,385,026 | $ | 37,870,700 | |||
| | | | | | | | |
| | | | | | | | |
| | | | | | | | |
| | December 31, | ||||||
|---|---|---|---|---|---|---|---|
(in millions, except share amounts) | 2017 | 2016 | |||||
Assets | |||||||
Cash and cash equivalents | $ | 1,732 | $ | 1,925 | |||
Cash and securities—segregated for regulatory purposes | 20,232 | 24,017 | |||||
Securities borrowed | 2,957 | 3,629 | |||||
Securities purchased under agreements to resell | 2,035 | 111 | |||||
Financial instruments owned, at fair value: | |||||||
Financial instruments owned | 1,950 | 2,104 | |||||
Financial instruments owned and pledged as collateral | 1,204 | 1,933 | |||||
| | | | | | | | |
Total financial instruments owned, at fair value | 3,154 | 4,037 | |||||
| | | | | | | | |
Receivables: | |||||||
Customers, less allowance for doubtful accounts of $40 and $97 as of December 31, 2017 and 2016 | 29,821 | 19,409 | |||||
Brokers, dealers and clearing organizations | 823 | 1,040 | |||||
Interest | 116 | 57 | |||||
| | | | | | | | |
Total receivables | 30,760 | 20,506 | |||||
| | | | | | | | |
Other assets | 292 | 448 | |||||
| | | | | | | | |
Total assets | $ | 61,162 | $ | 54,673 | |||
| | | | | | | | |
| | | | | | | | |
| | | | | | | | |
Liabilities and equity | |||||||
Short-term borrowings | $ | 15 | $ | 74 | |||
Securities loaned | 4,444 | 4,293 | |||||
Securities sold under agreements to repurchase | 1,316 | — | |||||
Financial instruments sold, but not yet purchased, at fair value | 767 | 2,145 | |||||
Payables: | |||||||
Customers | 47,548 | 41,731 | |||||
Brokers, dealers and clearing organizations | 283 | 239 | |||||
Affiliate | 187 | 285 | |||||
Accounts payable, accrued expenses and other liabilities | 147 | 80 | |||||
Interest | 22 | 6 | |||||
| | | | | | | | |
Total payables | 48,187 | 42,341 | |||||
| | | | | | | | |
Total liabilities | 54,729 | 48,853 | |||||
| | | | | | | | |
Commitments, contingencies and guarantees (see Note 12) | |||||||
Equity | |||||||
Stockholders' equity | |||||||
Common stock, $0.01 par value per share: | |||||||
Class A—Authorized—1,000,000,000, Issued—71,609,049 and 68,119,412 shares, Outstanding—71,475,755 and 67,984,973 shares as of December 31, 2017 and 2016 | 1 | 1 | |||||
Class B—Authorized, Issued and Outstanding—100 shares as of December 31, 2017 and 2016 | — | — | |||||
Additional paid-in capital | 832 | 775 | |||||
Retained earnings | 251 | 203 | |||||
Accumulated other comprehensive income, net of income taxes of $1 and $0 as of December 31, 2017 and 2016 | 9 | (2 | ) | ||||
Treasury stock, at cost, 133,294 and 134,439 shares as of December 31, 2017 and 2016 | (3 | ) | (3 | ) | |||
| | | | | | | | |
Total stockholders' equity | 1,090 | 974 | |||||
Noncontrolling interests | 5,343 | 4,846 | |||||
| | | | | | | | |
Total equity | 6,433 | 5,820 | |||||
| | | | | | | | |
Total liabilities and equity | $ | 61,162 | $ | 54,673 | |||
| | | | | | | | |
| | | | | | | | |
| | | | | | | | |
See accompanying notes to the consolidated financial statements.
Interactive Brokers Group, Inc. and Subsidiaries
Consolidated Statements of Comprehensive Income
Three Years Ended December 31, 2014
(in thousands, except for shares or per share amounts) | 2014 | 2013 | 2012 | |||||||
|---|---|---|---|---|---|---|---|---|---|---|
Revenues | ||||||||||
Trading gains | $ | 261,147 | $ | 331,233 | $ | 465,973 | ||||
Commissions and execution fees | 548,830 | 502,116 | 412,614 | |||||||
Interest income | 416,152 | 303,356 | 270,319 | |||||||
Other (loss) income | (110,581 | ) | (8,845 | ) | 43,564 | |||||
| | | | | | | | | | | |
Total revenues | 1,115,548 | 1,127,860 | 1,192,470 | |||||||
Interest expense | 72,272 | 51,720 | 61,950 | |||||||
| | | | | | | | | | | |
Total net revenues | 1,043,276 | 1,076,140 | 1,130,520 | |||||||
| | | | | | | | | | | |
Non-interest expenses | ||||||||||
Execution and clearing | 211,498 | 242,426 | 250,990 | |||||||
Employee compensation and benefits | 204,805 | 205,329 | 244,504 | |||||||
Occupancy, depreciation and amortization | 39,369 | 38,923 | 38,875 | |||||||
Communications | 24,196 | 23,130 | 23,258 | |||||||
General and administrative | 57,285 | 115,054 | 45,893 | |||||||
| | | | | | | | | | | |
Total non-interest expenses | 537,153 | 624,862 | 603,520 | |||||||
| | | | | | | | | | | |
Income before income taxes | 506,123 | 451,278 | 527,000 | |||||||
Income tax expense | 47,254 | 33,685 | 30,014 | |||||||
| | | | | | | | | | | |
Net income | 458,869 | 417,593 | 496,986 | |||||||
Less net income attributable to noncontrolling interests | 414,336 | 380,590 | 456,318 | |||||||
| | | | | | | | | | | |
Net income attributable to common stockholders | $ | 44,533 | $ | 37,003 | $ | 40,668 | ||||
| | | | | | | | | | | |
| | | | | | | | | | | |
| | | | | | | | | | | |
Earnings per share | ||||||||||
Basic | $ | 0.79 | $ | 0.74 | $ | 0.89 | ||||
| | | | | | | | | | | |
| | | | | | | | | | | |
| | | | | | | | | | | |
Diluted | $ | 0.77 | $ | 0.73 | $ | 0.89 | ||||
| | | | | | | | | | | |
| | | | | | | | | | | |
| | | | | | | | | | | |
Weighted average common shares outstanding | ||||||||||
Basic | 56,492,381 | 49,742,428 | 46,814,676 | |||||||
| | | | | | | | | | | |
| | | | | | | | | | | |
| | | | | | | | | | | |
Diluted | 57,709,668 | 50,924,736 | 47,070,522 | |||||||
| | | | | | | | | | | |
| | | | | | | | | | | |
| | | | | | | | | | | |
Comprehensive income | ||||||||||
Net income attributable to common stockholders | $ | 44,533 | $ | 37,003 | $ | 40,668 | ||||
Other comprehensive income | ||||||||||
Cumulative translation adjustment, before income taxes | (15,331 | ) | (3,207 | ) | 2,231 | |||||
Income taxes related to items of other comprehensive income | (285 | ) | (481 | ) | (9,036 | ) | ||||
| | | | | | | | | | | |
Other comprehensive income (loss), net of tax | (15,046 | ) | (2,726 | ) | 11,267 | |||||
| | | | | | | | | | | |
Comprehensive income attributable to common stockholders | $ | 29,487 | $ | 34,277 | $ | 51,935 | ||||
| | | | | | | | | | | |
| | | | | | | | | | | |
| | | | | | | | | | | |
Comprehensive income attributable to noncontrolling interests | ||||||||||
Net income attributable to noncontrolling interests | $ | 414,336 | $ | 380,590 | $ | 456,318 | ||||
Other comprehensive income (loss)—cumulative translation adjustment | (91,992 | ) | (24,643 | ) | 16,955 | |||||
| | | | | | | | | | | |
Comprehensive income attributable to noncontrolling interests | $ | 322,344 | $ | 355,947 | $ | 473,273 | ||||
| | | | | | | | | | | |
| | | | | | | | | | | |
| | | | | | | | | | | |
| | Year-Ended December 31, | |||||||||
|---|---|---|---|---|---|---|---|---|---|---|
(in millions, except share or per share amounts) | 2017 | 2016 | 2015 | |||||||
Revenues | ||||||||||
Trading gains | $ | 40 | $ | 163 | $ | 269 | ||||
Commissions | 647 | 612 | 617 | |||||||
Interest income | 908 | 606 | 492 | |||||||
Other income (loss) | 332 | 94 | (122 | ) | ||||||
| | | | | | | | | | | |
Total revenues | 1,927 | 1,475 | 1,256 | |||||||
Interest expense | 225 | 79 | 67 | |||||||
| | | | | | | | | | | |
Total net revenues | 1,702 | 1,396 | 1,189 | |||||||
| | | | | | | | | | | |
Non-interest expenses | ||||||||||
Execution and clearing | 241 | 244 | 231 | |||||||
Employee compensation and benefits | 249 | 242 | 227 | |||||||
Occupancy, depreciation and amortization | 47 | 51 | 44 | |||||||
Communications | 28 | 30 | 25 | |||||||
General and administrative | 86 | 62 | 58 | |||||||
Customer bad debt | 2 | 6 | 146 | |||||||
| | | | | | | | | | | |
Total non-interest expenses | 653 | 635 | 731 | |||||||
| | | | | | | | | | | |
Income before income taxes | 1,049 | 761 | 458 | |||||||
Income tax expense | 256 | 62 | 43 | |||||||
| | | | | | | | | | | |
Net income | 793 | 699 | 415 | |||||||
Less net income attributable to noncontrolling interests | 717 | 615 | 366 | |||||||
| | | | | | | | | | | |
Net income available for common stockholders | $ | 76 | $ | 84 | $ | 49 | ||||
| | | | | | | | | | | |
| | | | | | | | | | | |
| | | | | | | | | | | |
Earnings per share | ||||||||||
Basic | $ | 1.09 | $ | 1.28 | $ | 0.80 | ||||
| | | | | | | | | | | |
| | | | | | | | | | | |
| | | | | | | | | | | |
Diluted | $ | 1.07 | $ | 1.25 | $ | 0.78 | ||||
| | | | | | | | | | | |
| | | | | | | | | | | |
| | | | | | | | | | | |
Weighted average common shares outstanding | ||||||||||
Basic | 69,926,933 | 66,013,247 | 61,043,071 | |||||||
| | | | | | | | | | | |
| | | | | | | | | | | |
| | | | | | | | | | | |
Diluted | 70,904,921 | 67,299,413 | 62,509,796 | |||||||
| | | | | | | | | | | |
| | | | | | | | | | | |
| | | | | | | | | | | |
Comprehensive income | ||||||||||
Net income available for common stockholders | $ | 76 | $ | 84 | $ | 49 | ||||
Other comprehensive income | ||||||||||
Cumulative translation adjustment, before income taxes | 11 | (4 | ) | (10 | ) | |||||
Income taxes related to items of other comprehensive income | — | — | — | |||||||
| | | | | | | | | | | |
Other comprehensive income (loss), net of tax | 11 | (4 | ) | (10 | ) | |||||
| | | | | | | | | | | |
Comprehensive income available for common stockholders | $ | 87 | $ | 80 | $ | 39 | ||||
| | | | | | | | | | | |
| | | | | | | | | | | |
| | | | | | | | | | | |
Comprehensive income attributable to noncontrolling interests | ||||||||||
Net income attributable to noncontrolling interests | $ | 717 | $ | 615 | $ | 366 | ||||
Other comprehensive income—cumulative translation adjustment | 54 | (21 | ) | (53 | ) | |||||
| | | | | | | | | | | |
Comprehensive income attributable to noncontrolling interests | $ | 771 | $ | 594 | $ | 313 | ||||
| | | | | | | | | | | |
| | | | | | | | | | | |
| | | | | | | | | | | |
See accompanying notes to the consolidated financial statements.
Interactive Brokers Group, Inc. and Subsidiaries
Consolidated Statements of Cash Flows
| | Year-Ended December 31, | |||||||||
|---|---|---|---|---|---|---|---|---|---|---|
(in thousands) | 2014 | 2013 | 2012 | |||||||
Cash flows from operating activities | ||||||||||
Net income | $ | 458,869 | $ | 417,593 | $ | 496,986 | ||||
Adjustments to reconcile net income to net cash provided by (used in) operating activities | ||||||||||
Deferred income taxes | 18,168 | 11,730 | 17,784 | |||||||
Depreciation and amortization | 19,679 | 19,244 | 19,269 | |||||||
Employee stock plan compensation | 40,621 | 40,272 | 67,092 | |||||||
Unrealized losses on other investments, net | 9,664 | 5,561 | 2,164 | |||||||
Bad debt expense | 3,174 | 67,166 | 758 | |||||||
Change in operating assets and liabilities | ||||||||||
Cash and securities—segregated for regulatory purposes | (1,409,364 | ) | (1,275,330 | ) | (2,235,490 | ) | ||||
Securities borrowed | (908,265 | ) | 81,644 | (171,474 | ) | |||||
Securities purchased under agreements to resell | 95 | 42,588 | (53,538 | ) | ||||||
Financial instruments owned, at fair value | 512,058 | 95,892 | 2,070,342 | |||||||
Receivables from customers | (3,457,976 | ) | (3,745,632 | ) | (2,826,226 | ) | ||||
Other receivables | (283,284 | ) | (16,700 | ) | 550,874 | |||||
Other assets | (7,745 | ) | (75,489 | ) | (2,886 | ) | ||||
Financial instruments sold, but not yet purchased, at fair value | (592,886 | ) | (1,132,587 | ) | (1,869,888 | ) | ||||
Securities loaned | 635,453 | 724,379 | 453,215 | |||||||
Payable to customers | 5,476,433 | 4,897,442 | 4,121,873 | |||||||
Other payables | (97,728 | ) | (16,873 | ) | 84,609 | |||||
| | | | | | | | | | | |
Net cash provided by operating activities | 416,966 | 140,900 | 725,464 | |||||||
| | | | | | | | | | | |
Cash flows from investing activities | ||||||||||
Purchases of other investments | (443,154 | ) | (263,499 | ) | (453,161 | ) | ||||
Proceeds from sales of other investments | 515,223 | 236,818 | 417,158 | |||||||
Distributions received from and redemptions of equity investments | 1,484 | 11,054 | 1,567 | |||||||
Purchase of property and equipment | (19,428 | ) | (16,812 | ) | (17,997 | ) | ||||
| | | | | | | | | | | |
Net cash provided by (used in) investing activities | 54,125 | (32,439 | ) | (52,433 | ) | |||||
| | | | | | | | | | | |
Cash flows from financing activities | ||||||||||
Dividends paid to stockholders | (22,731 | ) | (20,207 | ) | (66,298 | ) | ||||
Distributions to noncontrolling interests | (278,650 | ) | (142,458 | ) | (525,253 | ) | ||||
Redemptions of senior notes | — | (101,411 | ) | |||||||
Short-term borrowings, net | 9,156 | (85,785 | ) | 103,882 | ||||||
Payments made under the Tax Receivable Agreement | (15,752 | ) | — | (16,115 | ) | |||||
| | | | | | | | | | | |
Net cash used in financing activities | (307,977 | ) | (248,450 | ) | (605,195 | ) | ||||
| | | | | | | | | | | |
Effect of exchange rate changes on cash and cash equivalents | (107,038 | ) | (27,369 | ) | 28,221 | |||||
| | | | | | | | | | | |
Net increase (decrease) in cash and cash equivalents | 56,076 | (167,358 | ) | 96,057 | ||||||
Cash and cash equivalents at beginning of period | 1,213,241 | 1,380,599 | 1,284,542 | |||||||
| | | | | | | | | | | |
Cash and cash equivalents at end of period | $ | 1,269,317 | $ | 1,213,241 | $ | 1,380,599 | ||||
| | | | | | | | | | | |
| | | | | | | | | | | |
| | | | | | | | | | | |
Supplemental disclosures of cash flow information | ||||||||||
Cash paid for interest | $ | 72,856 | $ | 53,258 | $ | 63,858 | ||||
| | | | | | | | | | | |
| | | | | | | | | | | |
| | | | | | | | | | | |
Cash paid for taxes | $ | 36,787 | $ | 52,086 | $ | 23,110 | ||||
| | | | | | | | | | | |
| | | | | | | | | | | |
| | | | | | | | | | | |
Non-cash financing activities | ||||||||||
Issuance of Common Stock in exchange of member interests in IBG LLC | $ | 35,185 | $ | 109,684 | $ | — | ||||
| | | | | | | | | | | |
| | | | | | | | | | | |
| | | | | | | | | | | |
Redemption of member interests from IBG Holdings LLC | $ | (35,185 | ) | $ | (109,684 | ) | $ | — | ||
| | | | | | | | | | | |
| | | | | | | | | | | |
| | | | | | | | | | | |
Adjustments to additional paid-in capital for changes in proportionate ownership in IBG LLC | $ | 10,476 | $ | (30,350 | ) | $ | 13,800 | |||
| | | | | | | | | | | |
| | | | | | | | | | | |
| | | | | | | | | | | |
Adjustments to noncontrolling interests for changes in proportionate ownership in IBG LLC | $ | (10,476 | ) | $ | 30,350 | $ | (13,800 | ) | ||
| | | | | | | | | | | |
| | | | | | | | | | | |
| | | | | | | | | | | |
Changes in redemption value of redeemable noncontrolling interests | $ | $ | $ | (5,269,619 | ) | |||||
| | | | | | | | | | | |
| | | | | | | | | | | |
| | | | | | | | | | | |
Changes to total equity for the change in redemptions value of redeemable noncontrolling interests | $ | — | $ | — | $ | 5,269,519 | ||||
| | | | | | | | | | | |
| | | | | | | | | | | |
| | | | | | | | | | | |
| | Year-Ended December 31, | |||||||||
|---|---|---|---|---|---|---|---|---|---|---|
(in millions) | 2017 | 2016 | 2015 | |||||||
Cash flows from operating activities | ||||||||||
Net income | $ | 793 | $ | 699 | $ | 415 | ||||
Adjustments to reconcile net income to net cash from operating activities | ||||||||||
Deferred income taxes | 147 | 27 | 15 | |||||||
Depreciation and amortization | 25 | 25 | 22 | |||||||
Employee stock plan compensation | 53 | 51 | 50 | |||||||
Unrealized (gain) loss on other investments, net | (4 | ) | 1 | 7 | ||||||
Gain on remeasurement of Tax Receivable Agreement liability | (93 | ) | — | — | ||||||
Bad debt expense | 2 | 6 | 146 | |||||||
Impairment loss | 21 | — | — | |||||||
Change in operating assets and liabilities | ||||||||||
Cash and securities—segregated for regulatory purposes | 3,785 | (2,708 | ) | (5,905 | ) | |||||
Securities borrowed | 672 | 295 | (264 | ) | ||||||
Securities purchased under agreements to resell | (1,924 | ) | 84 | 191 | ||||||
Financial instruments owned, at fair value | 886 | (647 | ) | 568 | ||||||
Receivables from customers | (10,414 | ) | (2,365 | ) | (144 | ) | ||||
Other receivables | 158 | (342 | ) | 413 | ||||||
Other assets | (3 | ) | 3 | 13 | ||||||
Securities loaned | 151 | 1,399 | (305 | ) | ||||||
Securities sold under agreement to repurchase | 1,316 | — | — | |||||||
Financial instruments sold, but not yet purchased, at fair value | (1,378 | ) | (454 | ) | 38 | |||||
Payable to customers | 5,817 | 4,647 | 5,288 | |||||||
Other payables | 132 | (177 | ) | 177 | ||||||
| | | | | | | | | | | |
Net cash provided by operating activities | 142 | 544 | 725 | |||||||
| | | | | | | | | | | |
Cash flows from investing activities | ||||||||||
Purchases of other investments | — | (17 | ) | (16 | ) | |||||
Distributions received and proceeds from sales of other investments | 2 | 38 | 11 | |||||||
Purchase of property, equipment and intangible assets | (28 | ) | (27 | ) | (30 | ) | ||||
| | | | | | | | | | | |
Net cash used in investing activities | (26 | ) | (6 | ) | (35 | ) | ||||
| | | | | | | | | | | |
Cash flows from financing activities | ||||||||||
Short-term borrowings, net | (59 | ) | 74 | (34 | ) | |||||
Dividends paid to stockholders | (28 | ) | (26 | ) | (25 | ) | ||||
Distributions to noncontrolling interests | (272 | ) | (219 | ) | (227 | ) | ||||
Repurchases of common stock for employee tax withholdings under stock incentive plans | (21 | ) | (26 | ) | (25 | ) | ||||
Proceeds from the sale of treasury stock | 21 | 25 | 29 | |||||||
Payments made under the Tax Receivable Agreement | (15 | ) | (17 | ) | (13 | ) | ||||
| | | | | | | | | | | |
Net cash used in financing activities | (374 | ) | (189 | ) | (295 | ) | ||||
| | | | | | | | | | | |
Effect of exchange rate changes on cash and cash equivalents | 65 | (25 | ) | (63 | ) | |||||
| | | | | | | | | | | |
Net increase (decrease) in cash and cash equivalents | (193 | ) | 324 | 332 | ||||||
Cash and cash equivalents at beginning of period | 1,925 | 1,601 | 1,269 | |||||||
| | | | | | | | | | | |
Cash and cash equivalents at end of period | $ | 1,732 | $ | 1,925 | $ | 1,601 | ||||
| | | | | | | | | | | |
| | | | | | | | | | | |
| | | | | | | | | | | |
Supplemental disclosures of cash flow information | ||||||||||
Cash paid for interest | $ | 209 | $ | 77 | $ | 68 | ||||
| | | | | | | | | | | |
| | | | | | | | | | | |
| | | | | | | | | | | |
Cash paid for taxes, net | $ | 47 | $ | 29 | $ | 31 | ||||
| | | | | | | | | | | |
| | | | | | | | | | | |
| | | | | | | | | | | |
Non-cash financing activities | ||||||||||
Issuance of Common Stock in exchange of member interests in IBG LLC | $ | 49 | $ | 56 | $ | 132 | ||||
| | | | | | | | | | | |
| | | | | | | | | | | |
| | | | | | | | | | | |
Redemption of member interests from IBG Holdings LLC | $ | (49 | ) | $ | (56 | ) | $ | (132 | ) | |
| | | | | | | | | | | |
| | | | | | | | | | | |
| | | | | | | | | | | |
Adjustments to additional paid-in capital for changes in proportionate ownership in IBG LLC | $ | 28 | $ | 25 | $ | 26 | ||||
| | | | | | | | | | | |
| | | | | | | | | | | |
| | | | | | | | | | | |
Adjustments to noncontrolling interests for changes in proportionate ownership in IBG LLC | $ | (28 | ) | $ | (25 | ) | $ | (26 | ) | |
| | | | | | | | | | | |
| | | | | | | | | | | |
| | | | | | | | | | | |
Non-cash distribution to noncontrolling interests | $ | — | $ | (5 | ) | $ | — | |||
| | | | | | | | | | | |
| | | | | | | | | | | |
| | | | | | | | | | | |
See accompanying notes to the consolidated financial statements.
Interactive Brokers Group, Inc. and Subsidiaries
Consolidated Statements of Changes in Equity
Three Years Ended December 31, 20142017, 2016, and 2015
| | Common Stock | | | | | | | | | ||||||||||||||||||||||
|---|---|---|---|---|---|---|---|---|---|---|---|---|---|---|---|---|---|---|---|---|---|---|---|---|---|---|---|---|---|---|---|
| | | | | Accumulated Other Comprehensive Income | | | | | |||||||||||||||||||||||
(in thousands, except for share amounts) | Issued Shares | Par Value | Additional Paid-In Capital | Treasury Stock | Retained Earnings | Total Stockholders' Equity | Non- controlling Interests | Total Equity | Redeemable Noncontrolling Interests | ||||||||||||||||||||||
Balance, December 31, 2011 | 46,061,256 | $ | 460 | $ | — | $ | (13,310 | ) | $ | (465,138 | ) | $ | 18,487 | $ | (459,501 | ) | $ | 1,837 | $ | (457,664 | ) | $ | 5,269,619 | ||||||||
Adjustment of redeemable noncontrolling interests from temporary to permanent equity (Note 4) | 472,409 | 572,840 | 1,045,249 | 4,322,304 | 5,367,553 | (5,269,619 | ) | ||||||||||||||||||||||||
Common stock distributed pursuant to stock plans | 1,736,588 | 18 | (18 | ) | 5,592 | 5,592 | 5,592 | ||||||||||||||||||||||||
Compensation for stock grants vesting in the future | 7,226 | 7,226 | 29,096 | 36,322 | |||||||||||||||||||||||||||
Deferred tax benefit retained | 495 | 495 | 495 | ||||||||||||||||||||||||||||
Dividends paid to stockholders | (66,298 | ) | (66,298 | ) | (66,298 | ) | |||||||||||||||||||||||||
Distributions from IBG LLC to noncontrolling interests | (490,261 | ) | (490,261 | ) | |||||||||||||||||||||||||||
Adjustments for changes in proportionate ownership in IBG LLC | 13,800 | 13,800 | (59 | ) | 13,741 | ||||||||||||||||||||||||||
Comprehensive income | 40,668 | 11,267 | 51,935 | 351,732 | 403,667 | ||||||||||||||||||||||||||
| | | | | | | | | | | | | | | | | | | | | | | | | | | | | | | | |
Balance, December 31, 2012 | 47,797,844 | 478 | 493,912 | (7,718 | ) | 82,072 | 29,754 | 598,498 | 4,214,649 | 4,813,147 | — | ||||||||||||||||||||
| | | | | | | | | | | | | | | | | | | | | | | | | | | | | | | | |
| | | | | | | | | | | | | | | | | | | | | | | | | | | | | | | | |
| | | | | | | | | | | | | | | | | | | | | | | | | | | | | | | | |
Issuance of Common Stock in follow-on offering | 4,683,415 | 47 | 109,639 | 109,686 | (109,686 | ) | — | ||||||||||||||||||||||||
Common stock distributed pursuant to stock plans | 2,306,790 | 23 | (23 | ) | 5,226 | 5,226 | 5,226 | ||||||||||||||||||||||||
Compensation for stock grants vesting in the future | 5,128 | 5,128 | 36,060 | 41,188 | |||||||||||||||||||||||||||
Deferred tax benefit retained—follow-on offering | 5,006 | 5,006 | 5,006 | ||||||||||||||||||||||||||||
Dividends paid to stockholders | (20,207 | ) | (20,207 | ) | (20,207 | ) | |||||||||||||||||||||||||
Distributions from IBG LLC to noncontrolling interests | (142,458 | ) | (142,458 | ) | |||||||||||||||||||||||||||
Adjustments for changes in proportionate ownership in IBG LLC | (30,350 | ) | (30,350 | ) | 30,350 | — | |||||||||||||||||||||||||
Comprehensive income | 37,003 | (2,726 | ) | 34,277 | 355,947 | 390,224 | |||||||||||||||||||||||||
| | | | | | | | | | | | | | | | | | | | | | | | | | | | | | | | |
Balance, December 31, 2013 | 54,788,049 | 548 | 583,312 | (2,492 | ) | 98,868 | 27,028 | 707,264 | 4,384,862 | 5,092,126 | — | ||||||||||||||||||||
| | | | | | | | | | | | | | | | | | | | | | | | | | | | | | | | |
| | | | | | | | | | | | | | | | | | | | | | | | | | | | | | | | |
| | | | | | | | | | | | | | | | | | | | | | | | | | | | | | | | |
Issuance of Common Stock in follow-on offering | 1,358,478 | 14 | 35,171 | 35,185 | (35,185 | ) | — | ||||||||||||||||||||||||
Common stock distributed pursuant to stock plans | 2,445,200 | 24 | (24 | ) | 178 | 178 | 178 | ||||||||||||||||||||||||
Compensation for stock grants vesting in the future | 5,671 | 5,671 | 34,951 | 40,622 | |||||||||||||||||||||||||||
Stock incentive plan adjustment | 20,518 | 75 | (750 | ) | (675 | ) | 458 | (217 | ) | ||||||||||||||||||||||
Deferred tax benefit retained—follow-on offering | 998 | 998 | 998 | ||||||||||||||||||||||||||||
Deferred tax benefit on stock incentive plans | 471 | 471 | 471 | ||||||||||||||||||||||||||||
Dividends paid to stockholders | (22,731 | ) | (22,731 | ) | (22,731 | ) | |||||||||||||||||||||||||
Distributions from IBG LLC to noncontrolling interests | (278,650 | ) | (278,650 | ) | |||||||||||||||||||||||||||
Adjustments for changes in proportionate ownership in IBG LLC | 10,476 | 10,476 | (10,476 | ) | — | ||||||||||||||||||||||||||
Comprehensive income | 44,533 | (15,046 | ) | 29,487 | 322,344 | 351,831 | |||||||||||||||||||||||||
| | | | | | | | | | | | | | | | | | | | | | | | | | | | | | | | |
Balance, December 31, 2014 | 58,612,245 | $ | 586 | $ | 636,150 | $ | (3,064 | ) | $ | 120,670 | $ | 11,982 | $ | 766,324 | $ | 4,418,304 | $ | 5,184,628 | $ | — | |||||||||||
| | | | | | | | | | | | | | | | | | | | | | | | | | | | | | | | |
| | | | | | | | | | | | | | | | | | | | | | | | | | | | | | | | |
| | | | | | | | | | | | | | | | | | | | | | | | | | | | | | | | |
| | Common Stock | | | | | | | | ||||||||||||||||||||
|---|---|---|---|---|---|---|---|---|---|---|---|---|---|---|---|---|---|---|---|---|---|---|---|---|---|---|---|---|
| | | | | Accumulated Other Comprehensive Income | | | | |||||||||||||||||||||
(in millions, except share amounts) | Issued Shares | Par Value | Additional Paid-In Capital | Treasury Stock | Retained Earnings | Total Stockholders' Equity | Non- controlling Interests | Total Equity | ||||||||||||||||||||
Balance, December 31, 2014 | 58,612,245 | $ | 1 | $ | 635 | $ | (3 | ) | $ | 121 | $ | 12 | $ | 766 | $ | 4,419 | $ | 5,185 | ||||||||||
Issuance of common stock in follow-on offering | 3,021,778 | 39 | 39 | (39 | ) | — | ||||||||||||||||||||||
Common stock distributed pursuant to stock incentive plans | 2,487,127 | — | — | |||||||||||||||||||||||||
Compensation for stock grants vesting in the future | 9 | 9 | 41 | 50 | ||||||||||||||||||||||||
Deferred tax benefit retained—follow-on offering | 5 | 5 | 5 | |||||||||||||||||||||||||
Repurchases of common stock for employee tax withholdings under stock incentive plan | (25 | ) | (25 | ) | (25 | ) | ||||||||||||||||||||||
Sales of treasury stock | 4 | 25 | 29 | 29 | ||||||||||||||||||||||||
Dividends paid to stockholders | (25 | ) | (25 | ) | (25 | ) | ||||||||||||||||||||||
Distributions from IBG LLC to noncontrolling interests | — | (227 | ) | (227 | ) | |||||||||||||||||||||||
Adjustments for changes in proportionate ownership in IBG LLC | 26 | 26 | (26 | ) | — | |||||||||||||||||||||||
Comprehensive income | 49 | (10 | ) | 39 | 313 | 352 | ||||||||||||||||||||||
| | | | | | | | | | | | | | | | | | | | | | | | | | | | | |
Balance, December 31, 2015 | 64,121,150 | 1 | 718 | (3 | ) | 145 | 2 | 863 | 4,481 | 5,344 | ||||||||||||||||||
| | | | | | | | | | | | | | | | | | | | | | | | | | | | | |
| | | | | | | | | | | | | | | | | | | | | | | | | | | | | |
| | | | | | | | | | | | | | | | | | | | | | | | | | | | | |
Issuance of common stock in follow-on offering | 1,596,200 | 22 | 22 | (22 | ) | — | ||||||||||||||||||||||
Common stock distributed pursuant to stock incentive plans | 2,402,062 | — | — | |||||||||||||||||||||||||
Compensation for stock grants vesting in the future | 8 | 8 | 43 | 51 | ||||||||||||||||||||||||
Deferred tax benefit retained—follow-on offering | 2 | 2 | 2 | |||||||||||||||||||||||||
Repurchases of common stock for employee tax withholdings under stock incentive plan | (26 | ) | (26 | ) | (26 | ) | ||||||||||||||||||||||
Sales of treasury stock | 26 | 26 | (1 | ) | 25 | |||||||||||||||||||||||
Dividends paid to stockholders | (26 | ) | (26 | ) | (26 | ) | ||||||||||||||||||||||
Distributions from IBG LLC to noncontrolling interests | — | (224 | ) | (224 | ) | |||||||||||||||||||||||
Adjustments for changes in proportionate ownership in IBG LLC | 25 | 25 | (25 | ) | — | |||||||||||||||||||||||
Comprehensive income | 84 | (4 | ) | 80 | 594 | 674 | ||||||||||||||||||||||
| | | | | | | | | | | | | | | | | | | | | | | | | | | | | |
Balance, December 31, 2016 | 68,119,412 | 1 | 775 | (3 | ) | 203 | (2 | ) | 974 | 4,846 | 5,820 | |||||||||||||||||
| | | | | | | | | | | | | | | | | | | | | | | | | | | | | |
| | | | | | | | | | | | | | | | | | | | | | | | | | | | | |
| | | | | | | | | | | | | | | | | | | | | | | | | | | | | |
Issuance of common stock in follow-on offering | 1,214,860 | 18 | 18 | (18 | ) | — | ||||||||||||||||||||||
Common stock distributed pursuant to stock incentive plans | 2,274,777 | — | — | |||||||||||||||||||||||||
Compensation for stock grants vesting in the future | 9 | 9 | 44 | 53 | ||||||||||||||||||||||||
Deferred tax benefit retained—follow-on offering | 2 | 2 | 2 | |||||||||||||||||||||||||
Repurchases of common stock for employee tax withholdings under stock incentive plans | (21 | ) | (21 | ) | (21 | ) | ||||||||||||||||||||||
Sales of treasury stock | 21 | 21 | 21 | |||||||||||||||||||||||||
Dividends paid to stockholders | (28 | ) | (28 | ) | (28 | ) | ||||||||||||||||||||||
Distributions from IBG LLC to noncontrolling interests | — | (272 | ) | (272 | ) | |||||||||||||||||||||||
Adjustments for changes in proportionate ownership in IBG LLC | 28 | 28 | (28 | ) | — | |||||||||||||||||||||||
Comprehensive income | 76 | 11 | 87 | 771 | 858 | |||||||||||||||||||||||
| | | | | | | | | | | | | | | | | | | | | | | | | | | | | |
Balance, December 31, 2017 | 71,609,049 | $ | 1 | $ | 832 | $ | (3 | ) | $ | 251 | $ | 9 | $ | 1,090 | $ | 5,343 | $ | 6,433 | ||||||||||
| | | | | | | | | | | | | | | | | | | | | | | | | | | | | |
| | | | | | | | | | | | | | | | | | | | | | | | | | | | | |
| | | | | | | | | | | | | | | | | | | | | | | | | | | | | |
See accompanying notes to the consolidated financial statements.
Interactive Brokers Group, Inc. and Subsidiaries
Notes to Consolidated Financial Statements
1. Organization and Nature of Business
Interactive Brokers Group, Inc. ("IBG, Inc.") is a Delaware holding company whose primary asset is its ownership of approximately 14.5%17.4% of the membership interests of IBG LLC, which, in turn, owns operating subsidiaries (collectively, "IBG LLC"). IBG, Inc. together with IBG LLC and its consolidated subsidiaries (collectively, "the Company"), is an automated global electronic broker and market maker specializing in executing and clearing trades in securities, futures, foreign exchange instruments, bonds and mutual funds on more than 100120 electronic exchanges and trading venuesmarket centers around the world and offering custody, prime brokerage, securities and margin lending services to customers. In the United States of America ("U.S."), the Company'sCompany conducts its business is conductedprimarily from its headquarters in Greenwich, Connecticut and from Chicago, Illinois and from Jersey City, New Jersey.Illinois. Abroad, the Company conducts its business is conducted through offices located in Canada, England,the United Kingdom, Switzerland, Liechtenstein, India, China (Hong Kong and Shanghai), Japan, India, and Australia. AtAs of December 31, 2014,2017, the Company had 9601,228 employees worldwide.
IBG LLC is a Connecticut limited liability company that conducts its business through its operating subsidiaries (collectively, the "Operating Companies"): Interactive Brokers LLC ("IB LLC") and its subsidiary, Interactive Brokers Corp. ("IB Corp"); Interactive Brokers Canada Inc. ("IBC"); Interactive Brokers (U.K.) Limited and its subsidiary, Interactive Brokers (U.K.) Nominee Limited (collectively, "IBUK"); Interactive Brokers Securities Japan, Inc. ("IBSJ"); Interactive Brokers (India) Private Limited ("IBI"); Timber Hill LLC ("TH LLC"); Timber Hill Europe AG and its subsidiary, Timber Hill (Liechtenstein) AG (collectively, "THE"); Timber Hill Securities Hong Kong Limited ("THSHK"); Timber Hill Australia Pty Limited ("THA"); Timber Hill Canada Company ("THC"); Interactive Brokers Financial Products S.A. ("IBFP"); Interactive Brokers Hungary KFTSoftware Services (India) Private Limited ("IBH"IBSSI"); IB Exchange Corp. ("IBEC") and its subsidiaries; Interactive Brokers Canada Inc. ("IBC"); Interactive Brokers Securities Japan, Inc. ("IBSJ"); Interactive Brokers Hong Kong Limited ("IBHK"); Interactive Brokers Australia Pty Limited and its subsidiary, Interactive Brokers Australia Nominees Pty Limited (collectively, "IBA"); IB Business Services (Shanghai) Company Limited ("IBBSS"); Timber Hill Europe AG and its subsidiary, Timber Hill (Liechtenstein) AG (collectively, "THE"); Interactive Brokers Hungary KFT ("IBH"); Interactive Brokers Software Services Estonia OU ("IBEST") and; Interactive Brokers Software Services Russia ("IBRUS"); Interactive Brokers Corp. ("IB Corp"), Covestor, Inc. and its subsidiary, Covestor Limited (collectively, "Covestor"), and Greenwich Advisor Compliance Services Corp. ("Greenwich Compliance").
The Company operates in two business segments: electronic brokerage and market making, both supported by corporate. The Company conducts its electronic brokerage business through certain Interactive Brokers subsidiaries, which provide electronic execution and clearing services to customers worldwide. The Company conducts its market making business principally through its Timber Hill subsidiaries on some of the world's leading exchanges and market centers, primarily in exchange-traded equities, equity options and equity-index options and futures. (See Note 2—Discontinued Operations and Costs Associated with Exit or Disposal Activities.) Corporate enables the Company to operate cohesively and effectively by providing support via development services and control functions to the business segments and also by executing the Company's currency diversification strategy.
Certain of the Operating Companies are members of various securities and commodities exchanges in North America, Europe and the Asia/Pacific region and are subject to regulatory capital and other requirements (see Note 17)14). IB LLC, IBC, IBUK, IBC,IBSJ, IBHK, IBI and IBSJIBA carry securities accounts for customers or perform custodial functions relating to customer securities.
Interactive Brokers Group, Inc. and Subsidiaries
Notes to Consolidated Financial Statements (Continued)
2. Significant Accounting Policies
Basis of Presentation
These consolidated financial statements are presented in U.S. dollars and have been prepared in accordance with accounting principles generally accepted in the U.S. ("U.S. GAAP") and pursuant to the rules and regulations of the U.S. Securities and Exchange Commission ("SEC") regarding financial reporting with respect to Form 10-K.
Interactive Brokers Group, Inc. and Subsidiaries
Notes to Consolidated Financial Statements (Continued)
2. Significant Accounting Policies (Continued)
These consolidated financial statements include the accounts of the Company and its consolidated subsidiaries and reflect all adjustments of a normal and recurring nature that are, in the opinion of management, necessary for the fair presentation of the results for the periods presented.
In connection with the Company's currency diversification strategy, the Company's net worth is held in a basket of 16 currencies (referred to by management as the "GLOBAL"). For the year ended December 31, 2014, the Company has improved the transparency of its currency diversification strategy results by (1) reporting nearly all translation gains and losses from this strategy as other income (previously reported as a component of trading gains) in the consolidated statements of comprehensive income, and (2) reporting these gains and losses in the corporate segment instead of the market making segment. These changes in presentation resulted in certain reclassifications to previously reported amounts.
Principles of Consolidation, including Noncontrolling Interests
TheThese consolidated financial statements include the accounts of IBG, Inc. and its majority and wholly owned subsidiaries. As sole managing member of IBG LLC, IBG, Inc. exerts control over IBG LLC's operations. In accordance with Financial Accounting Standards Board ("FASB") Accounting Standards Codification ("ASC") Topic 810, "Consolidation","Consolidation," the Company consolidates IBG LLC's financial statements and records the interests in IBG LLC that it does not own as noncontrolling interests.
Prior to the June 6, 2012 amendment (the "Amendment") to the Exchange Agreement (see Note 4), the Company was required to report IBG Holdings LLC's ("Holdings") ownership as redeemable noncontrolling interests (i.e., temporary equity), outside of total equity. Redemption value of these redeemable noncontrolling interests was measured as the number of equivalent shares of member interests in IBG LLC owned by Holdings multiplied by the then current market price per share of the Company's common stock. The excess of the redemption value over the book value of these interests, which did not affect net income attributable to common stockholders or cash flows, was required to be accounted for as a reduction of the Company's stockholders' equity.
The Company elected to recognize changes in redemption value in each reporting period immediately as they occurred as if the end of each reporting period was also the redemption date for the entire redeemable noncontrolling interest, notwithstanding that the redeemable noncontrolling interests are redeemable over a period of time pursuant to a redemption schedule (see Note 4).
For periods after the Amendment, the noncontrolling interests in IBG LLC attributable to Holdings are reported as a component of equity.
The Company's policy is to consolidate all other entities in which it owns more than 50% unless it does not have control. All inter-company balances and transactions have been eliminated.
Discontinued Operations and Costs Associated with Exit or Disposal Activities
On March 8, 2017, the Company announced its intention to discontinue its options market making activities globally. Additionally, as previously announced, on September 29, 2017 the Company completed the transfer of its U.S. options market making operations to Two Sigma Securities, LLC and a gain on sale of $11 million, reflecting the recovery of exit costs, was recorded in other income in the consolidated statements of comprehensive income. The Company will continue to phase out its options market making operations outside of the U.S. substantially over the coming months and expects to report discontinued operations when it meets the criteria under FASB Topic ASC 205-20, "Discontinued Operations."
Consistent with earlier estimates, the Company recognized approximately $25 million in one-time restructuring costs during the year ended December 31, 2017. The one-time restructuring costs include approximately $22 million of non-cash expenditures, consisting of impairment of the carrying value of certain exchange trading rights and stock-based compensation, included in general and administrative expenses and employee compensation and benefits, respectively, and $3 million of cash expenditures primarily related to severance costs for employee terminations, included employee compensation and benefits, in the consolidated statements of comprehensive income.
Use of Estimates
The preparation of financial statements in conformity with U.S. GAAP requires management to make estimates and assumptions that affect the reported amounts and disclosures in these consolidated financial statements and accompanying notes. These estimates and assumptions are based on judgment and the best available information at the time. Therefore, actual results could differ materially from those estimates. Such estimates include the allowance for doubtful accounts, valuation of certain investments, compensation accruals, current and deferred income taxes, costs associated with exit or disposal activities, and contingency reserves.
Interactive Brokers Group, Inc. and Subsidiaries
Notes to Consolidated Financial Statements (Continued)
2. Significant Accounting Policies (Continued)
investments, compensation accruals, current and deferred income taxes, and estimated contingency reserves.
Fair Value
Substantially all of the Company's assets and liabilities, including financial instruments are carried at fair value based on published market prices and are marked to market, or are assets and liabilities which are short-term in nature and are carried at amounts that approximate fair value.
The Company applies the fair value hierarchy in accordance with FASB ASC Topic 820, "Fair Value Measurement" ("ASC Topic 820"), to prioritize the inputs to valuation techniques used to measure fair value. The hierarchy gives the highest priority to unadjusted quoted prices in active markets for identical assets and liabilities and the lowest priority to unobservable inputs. The three levels of the fair value hierarchy are:
| Level 1 | Unadjusted quoted prices in active markets that are accessible at the measurement date for identical, unrestricted assets or liabilities. | |
Level 2 | Quoted prices for similar assets in an active market, quoted prices in markets that are not considered to be active or financial instruments for which all significant inputs are observable, either directly or indirectly. | |
Level 3 | Prices or valuations that require inputs that are both significant to fair value measurement and unobservable. |
Financial instruments owned, at fair value and financial instruments sold, but not yet purchased, at fair value are generally classified as Level 1 of the fair value hierarchy. The Company's Level 1 financial instruments, which are valued using quoted market prices as published by exchanges and clearing houses or otherwise broadly distributed in active markets, include active listed stocks, options, warrants and discount certificates, and U.S. and foreign government securities and corporate and municipal bonds.securities. The Company does not adjust quoted prices for financial instruments classified as Level 1 of the fair value hierarchy, even in the event that the Company may hold a large position whereby a purchase or sale could reasonably impact quoted prices.
Currency forward contracts are valued using broadly distributed bank and broker prices, and are classified as Level 2 of the fair value hierarchy as such instruments are not exchange-traded.since inputs to their valuation can be generally corroborated by market data. Other securities that are not traded in active markets are also classified in Level 2 of the fair value hierarchy. Level 3 financial instruments are comprised of securities that have been delisted or otherwise are no longer tradable in active markets and have been valued by the Company based on internal estimates.
Other fair value investments and other fair value liabilities, included in other assets and other liabilities and accrued expenses, respectively, in the consolidated statements of financial condition, are comprised of listed stocks, options, foreign currency contracts and corporate and municipal bonds that the Company does not carry in its market making business. These investments are generally reported as Level 2 of the fair value hierarchy, except for unrestricted listed securities, which are classified as Level 1 of the fair value hierarchy, and delisted securities which are classified as Level 3 of the fair value hierarchy.
Interactive Brokers Group, Inc. and Subsidiaries
Notes to Consolidated Financial Statements (Continued)
2. Significant Accounting Policies (Continued)
Earnings Perper Share
Earnings per share ("EPS") areis computed in accordance with FASB ASC Topic 260, "Earnings per Share." Basic EPS is computed by dividing the net income available for common stockholders by the weighted average number of shares outstanding for that period. Diluted EPS is calculated by dividing the net income available for common stockholders by the diluted weighted average shares outstanding for that period. Diluted EPS includes the determinants of the basic EPS and, in addition, reflects the dilutive effect of shares of common stock estimated to be distributed in the future under the Company's stock-based compensation plans, with no adjustments to net income available for common stockholders for dilutive potential common shares.
For periods priorTable of Contents
Interactive Brokers Group, Inc. and Subsidiaries
Notes to June 6, 2012 (see Note 4), the Company has determined to reflect measurement adjustments for non-fair value redemption rights through application of the two-class method of calculating earnings per share in lieu of recognizing the impact through the determination of net income attributable to common shareholders. Furthermore, the Company has elected to treat only the portion of the periodic measurement adjustments that reflect a redemption in excess of fair value as being akin to a dividend, reducing net income attributable to common stockholders for purposes of applying the two-class method. Decreases in the carrying amount of redeemable noncontrolling interests through measurement adjustments are reflected in the application of the two-class method only to the extent they represent recoveries of amounts previously accounted for by applying the two-class method.Consolidated Financial Statements (Continued)
2. Significant Accounting Policies (Continued)
Stock-Based Compensation
The Company follows FASB ASC Topic 718, "Compensation—Stock Compensation" ("ASC Topic 718"), to account for its stock-based compensation plans. ASC Topic 718 requires all share-based payments to employees to be recognized in the consolidated financial statements using a fair value-based method. Grants, which are denominated in U.S. dollars, are communicated to employees in the year of grant, thereby establishing the fair value of each grant. The fair value of awards granted to employees are generally expensed as follows: 50% in the year of grant in recognition of plan forfeiturethe plans' post-employment provisions (as described below) and the remaining 50% over the related vesting period utilizing the "graded vesting" method permitted under ASC Topic 718. In the case of "retirement eligible" employees (those employees older than 59), 100% of awards are expensed when granted.
Awards granted under stock-based compensation plans are subject to forfeiturethe plans' post-employment provisions in the event an employee ceases employment with the Company. The plans provide that employees who discontinue employment with the Company without cause and continue to meet the terms of the plans' post-employment provisions will forfeitbe eligible to earn 50% of unvested previously granted but not yet earned awards, unless the employee is over the age of 59, in which case the employee would be eligible to receive 100% of unvested awards previously granted.granted but not yet earned awards.
Cash and Cash Equivalents
The Company considersCash and cash equivalents consist of deposits with banks and all highly liquid investments, with maturities of three months or less, that are not segregated and deposited for regulatory purposes or to meet margin requirements at clearing houses to be cash equivalents.
Interactive Brokers Group, Inc. and Subsidiaries
Notes to Consolidated Financial Statements (Continued)
2. Significant Accounting Policies (Continued)houses.
Cash and Securities—Segregated for Regulatory Purposes
As a result of customer activities, certain Operating Companies are obligated by rules mandated by their primary regulators to segregate or set aside cash or qualified securities to satisfy such regulations, which regulations have been promulgated to protect customer assets. Securities segregated for regulatory purposes consisted of U.S. Treasurygovernment securities of $6.68$4.5 billion and $1.30$7.4 billion atas of December 31, 20142017 and December 31, 2013,2016, respectively, and securities purchased under agreements to resell in the amount of $3.87$9.2 billion and $6.73$11.0 billion as of December 31, 20142017 and December 31, 2013,2016, respectively, which amounts approximate fair value.
Securities Borrowed and Securities Loaned
Securities borrowed and securities loaned are recorded at the amount of the cash collateral advanced or received. Securities borrowed transactions require the Company to provide counterparties with collateral, which may be in the form of cash, letters of credit or other securities. With respect to securities loaned, the Company receives collateral, which may be in the form of cash or other securities in an amount generally in excess of the fair value of the securities loaned. The Company monitors the market value of securities borrowed and loaned on a daily basis, with additional collateral obtained or refunded as permitted contractually. The Company does notIt is the Company's policy to net, in the consolidated statements of financial condition, securities borrowed and securities loaned entered into with the same counterparty.counterparty that meet the offsetting requirements prescribed in FASB ASC Topic 210-20, "Balance Sheet—Offsetting" ("ASC Topic 210-20").
Interactive Brokers Group, Inc. and Subsidiaries
Notes to Consolidated Financial Statements (Continued)
2. Significant Accounting Policies (Continued)
Securities lending fees received and paid by the Company are included in interest income and interest expense, respectively, in the consolidated statements of comprehensive income.
Securities Purchased Under Agreements to Resell and Securities Sold Under Agreements to Repurchase
Securities purchased under agreements to resell and securities sold under agreements to repurchase, which are reported as collateralized financing transactions, are recorded at contract value, which approximates fair value. To ensure that the fair value of the underlying collateral remains sufficient, the collateral is valued daily with additional collateral obtained or excess collateral returned, as permitted under contractual provisions. The Company does notIt is the Company's policy to net, in the consolidated statements of financial condition, securities purchased under agreements to resell transactions and securities sold under agreements to repurchase transactions entered into with the same counterparty.counterparty that meet the offsetting requirements prescribed in ASC Topic 210-20.
Financial Instruments Owned and Financial Instruments Sold, But Not Yet Purchased, at Fair Value
Financial instrument transactions are accounted for on a trade date basis. Financial instruments owned and financial instruments sold, but not yet purchased are stated at fair value based upon quoted market prices. All firm-ownedThe Company's financial instruments pledged to counterparties where the counterparty has the right, by contract or custom, to sell or repledge the financial instruments are reported as financial instruments owned and pledged as collateral in the consolidated statements of financial condition.
The Company also enters into currency forward contracts. These transactions, which are also accounted for on a trade date basis, are agreements to exchange a fixed amount of one currency for a specified amount of a second currency at completion of the currency forward contract term. Unrealized mark-to-market gains and losses on currency forward contracts are included in financial instruments
Interactive Brokers Group, Inc. and Subsidiaries
Notes to Consolidated Financial Statements (Continued)
2. Significant Accounting Policies (Continued)
owned, at fair value or financial instruments sold, but not yet purchased, at fair value in the consolidated statements of financial condition.
Customer Receivables and Payables
Customer securities transactions are recorded on a settlement date basis and customer commodities transactions are recorded on a trade date basis. Receivables from and payables to customers include amounts due on cash and margin transactions, including futures contracts transacted on behalf of customers. Securities owned by customers, including those that collateralize margin loans or other similar transactions, are not reported in the consolidated statements of financial condition. Amounts receivable from customers that are determined by management to be uncollectible are expensed and included in general and administrativerecorded as customer bad debt expense in the consolidated statements of comprehensive income.
Receivables from and Payables to Brokers, Dealers and Clearing Organizations
Receivables from and payables to brokers, dealers and clearing organizations include net receivables and payables from unsettled trades, including amounts related to futures and options on futures contracts executed on behalf of customers, amounts receivable for securities not delivered by the Company to the purchaser by the settlement date ("fails to deliver") and cash margin deposits. Payables to brokers, dealers and clearing organizations also include amounts payable for securities not received by the Company from a seller by the settlement date ("fails to receive").
Investments
The Company makes certain strategic investments related to its business and accounts for these investments under the cost method of accounting or under the equity method of accounting as required under FASB ASC Topic 323, "Investments—Equity Method and Joint Ventures." Investments accounted for under the equity method, including where the investee is a limited partnership or limited liability company, are recorded at the fair value amount of the Company's initial investment and are
Interactive Brokers Group, Inc. and Subsidiaries
Notes to Consolidated Financial Statements (Continued)
2. Significant Accounting Policies (Continued)
adjusted each period for the Company's share of the investee's income or loss. The Company's share of the income or losses from equity method investments is included in other income in the consolidated statements of comprehensive income. The recorded amounts of the Company's equity method investments, $37.3$23 million atas of December 31, 20142017 ($27.522 million atas of December 31, 2013)2016), which are included in other assets in the consolidated statements of financial condition, increase or decrease accordingly. Contributions paid to and distributions received from equity method investees are recorded as additions or reductions, respectively, to the respective investment balance.
The Company also holds exchange memberships and investments in equity securities of certain exchanges, as required to qualify as a clearing member, and strategic investments in corporate stock that do not qualify for equity method accounting. Such investments, $30.7$11 million atas of December 31, 20142017 ($27.633 million atas of December 31, 2013)2016), are recorded at cost or, if an other-than-temporary impairment in value has occurred, at a value that reflects management's estimate of the impairment, and are also included in other assets in the consolidated statements of financial condition. Dividends received from cost basis investments are included in other income in the consolidated statements of comprehensive income when such dividends are received.
Interactive Brokers Group, Inc. and Subsidiaries
Notes to Consolidated Financial Statements (Continued)
2. Significant Accounting Policies (Continued)
A judgmental aspect of accounting for investments is evaluating whether an other-than-temporary decline in the value of an investment has occurred. The evaluation of an other-than-temporary impairment is dependent on specific quantitative and qualitative factors and circumstances surrounding an investment, including recurring operating losses, credit defaults and subsequent rounds of financing. The Company's equity investments do not have readily determinable market values. All investments are reviewed for changes in circumstances or occurrence of events that suggest the Company's investment may not be recoverable. If an unrealized loss on any investment is considered to be other-than-temporary, the impairment loss is recognized in the period the determination is made.
The Company also has certain investments (which are not considered core business activities) that are accounted for at fair value (see Note 6) and included in other assets in the consolidated statements of financial condition. Gains and losses related to these investments are included in other income in the consolidated statements of comprehensive income.
Property, Equipment, and EquipmentIntangible Assets
Property, equipment, and equipment,intangible assets, which isare included in other assets in the consolidated statements of financial condition, consistsconsist of purchased technology hardware and software, internally developed software, leasehold improvements, andcomputer equipment, software developed for the Company's internal use, office furniture, equipment and equipment.acquired technology.
Property and equipment are recorded at historical cost, less accumulated depreciation and amortization. Additions and improvements that extend the lives of assets are capitalized, while expenditures for repairs and maintenance are expensed as incurred. Depreciation and amortization are computed using the straight-line method. Equipment is depreciated over the estimated useful lives of the assets, while leasehold improvements are amortized over the lesser of the estimated economic useful life of the asset or the term of the lease. Computer equipment is depreciated over three to five years and office furniture and equipment are depreciated over five to seven years. Intangible assets with a finite life are amortized on a straight line basis over their estimated useful lives of three years, and tested for recoverability whenever events indicate that the carrying amounts may not be recoverable. Qualifying costs for internally developed software are capitalized and amortized over the expected useful life of the developed software, not to exceed three years. Upon retirement or disposition of property and equipment, the cost and related accumulated depreciation are removed from the consolidated statements of financial condition and any resulting gain or loss is recorded in other income in the consolidated statements of comprehensive income. Fully depreciated (or amortized) assets are retired on an annual basis.
Interactive Brokers Group, Inc. and Subsidiaries
Notes to Consolidated Financial Statements (Continued)
2. Significant Accounting Policies (Continued)
Comprehensive Income and Foreign Currency Translation
The Company's operating results are reported in the consolidated statements of comprehensive income pursuant to FASB Accounting Standards Update 2011-05,ASC Topic 220, "Comprehensive Income."
Comprehensive income consists of two components: net income and other comprehensive income ("OCI"). OCI is comprised of revenues, expenses, gains and losses that are reported in the comprehensive income section of the statements of comprehensive income, but are excluded from reported net income. The Company's OCI is comprised of gains and losses resulting from translating foreign currency financial statements of non-U.S. subsidiaries, net of related income taxes, where applicable. In general, the practice and intention of the Company is to reinvest the earnings of its non-U.S. subsidiaries in those operations, therefore no tax is accrued.usually not accrued on OCI.
The Company's non-U.S. domiciled subsidiaries have a functional currency that is other than the U.S. dollar. Such subsidiaries' assets and liabilities are translated into U.S. dollars at period-end exchange rates, and revenues and expenses are translated at average exchange rates prevailing during the period. Adjustments that result from translating amounts from a subsidiary's functional currency to the U.S. dollar (as described above) are reported net of tax, where applicable, in accumulated OCI in
Interactive Brokers Group, Inc. and Subsidiaries
Notes to Consolidated Financial Statements (Continued)
2. Significant Accounting Policies (Continued)
the consolidated statements of financial condition. During 2013, the Company derecognized accumulated OCI of a $5.2 million loss attributable to its Brazilian subsidiary, IB Brasil Participações Ltda, which was liquidated during the year, and recognized a foreign currency translation loss, before taxes, which is included in other income in the consolidated statements of comprehensive income.
Revenue Recognition
Trading Gains
Trading gains and losses are recorded on trade date and are reported on a net basis. Trading gains and losses are comprised of changes in the fair value of financial instruments owned, at fair value and financial instruments sold, but not yet purchased, at fair value (i.e., unrealized gains and losses) and realized gains and losses.losses related to the Company's market making business segment. Included in trading gains are net gains and losses on stocks, U.S. and foreign government securities, corporate and municipal bonds, options, futures, foreign exchange and other derivative instruments. Dividends are integral to the valuation of stocks and interest is integral to the valuation of fixed income instruments. Accordingly, both dividends and interest income and expense attributable to financial instruments owned, at fair value and financial instruments sold, but not yet purchased, at fair value are reported on a net basis in trading gains in the consolidated statements of comprehensive income.
Commissions and Execution Fees
Commissions earned for executing andand/or clearing transactions are accrued on a trade date basis and are reported as commissions and execution fees in the consolidated statements of comprehensive income.
Interest Income and Expense
The Company earns interest income and incurs interest expense primarily in connection with its electronic brokerage customer business and its securities lending activities, which are recorded on thean accrual basis and are included in interest income and interest expense, respectively, in the consolidated statements of comprehensive income.
Interactive Brokers Group, Inc. and Subsidiaries
Notes to Consolidated Financial Statements (Continued)
2. Significant Accounting Policies (Continued)
Foreign Currency Gains and Losses
Currency translation refersForeign currency balances are assets and liabilities in currencies other than the Company's functional currency. At every reporting date, the Company revalues its foreign currency balances to its functional currency at the spot exchange rate and records the associated foreign currency gains and losses. These foreign currency gains and losses resulting fromare reported in the consolidated statements of comprehensive income, as follows: (a) foreign currency transactions. Foreign currency translation gains and losses related to the Company's currency diversification strategy are includedreported in other income in the consolidated statements of comprehensive income. Foreignincome; (b) foreign currency translation gains and losses related to the market making core-business activities are includedreported in trading gains in the consolidated statements of comprehensive income. Electronic brokeragegains; (c) foreign currency translation gains and losses arising from currency swap transactions in the electronic brokerage business are includedreported in interest incomeincome; and (d) all other foreign currency gains and losses are reported in other income.
Rebates
Rebates consist of volume discounts, credits or payments received from exchanges or other market centers related to the placement and/or removal of liquidity from the order flow in the marketplace and are recorded on an accrual basis. Rebates are recorded net within execution and clearing expenses in the consolidated statements of comprehensive income. Rebates received for trades executed on behalf of customers that elect tiered pricing are passed, in whole or part, to these customers; and such pass-through amounts are recorded net within commissions in the consolidated statements of comprehensive income.
Income Taxes
The Company accounts for income taxes in accordance with FASB ASC Topic 740, "Income Taxes" ("ASC Topic 740"). The Company's income tax expense, deferred tax assets and liabilities, and reserves for unrecognized tax benefits are based on enacted tax laws (see Note 13)10) and reflect management's
Interactive Brokers Group, Inc. and Subsidiaries
Notes to Consolidated Financial Statements (Continued)
2. Significant Accounting Policies (Continued)
best assessment of estimated future taxes to be paid. The Company is subject to income taxes in both the U.S. and numerous foreign jurisdictions. Determining income tax expense requires significant judgments and estimates.
The Company recognizes interest related to income tax matters as interest income or interest expense and penalties related to income tax matters as income tax expense.
Deferred income tax assets and liabilities arise from temporary differences between the tax and financial statements recognition of the underlying assets and liabilities. In evaluating the ability to recover deferred tax assets within the jurisdictions from which they arise, the Company considers all available positive and negative evidence, including scheduled reversals of deferred tax liabilities, projected future taxable income, tax-planning strategies, and results of recent operations. In projecting future taxable income, historical results are adjusted for changes in accounting policies and incorporate assumptions including the amount of future state, federal and foreign pretaxpre-tax operating income, the reversal of temporary differences, and the implementation of feasible and prudent tax-planning strategies. These assumptions require significant judgment about the forecasts of future taxable income and are consistent with the plans and estimates the Company is using to manage the underlying businesses. In evaluating the objective evidence that historical results provide, three years of cumulative operating income (loss) are considered. Deferred income taxes have not been provided for U.S. tax liabilities or for additional foreign taxes on the unremitted earnings of foreign subsidiaries that have been indefinitely reinvested.
Interactive Brokers Group, Inc. and Subsidiaries
Notes to Consolidated Financial Statements (Continued)
2. Significant Accounting Policies (Continued)
The calculation of the Company's tax liabilities involves dealing with uncertainties in the application of complex tax laws and regulations in a multitude of jurisdictions across the Company's global operations. Changes in tax laws and rates could also affect recorded deferred tax assets and liabilities in the future. The Company is not awareOn December 22, 2017, the Tax Cuts and Jobs Act (the "Tax Act") was enacted, significantly revising the U.S corporate income tax law by, among other things, reducing the corporate income tax rate from 35% to 21% and implementing a modified territorial tax system that includes a one-time transition tax on deemed repatriated earnings of any such changes that would have a material effect on the Company's results of operations, cash flows, or financial position.foreign subsidiaries (see Note 10).
The Company recognizes that a tax benefit from an uncertain tax position only when it is more likely than not that the position will be sustained upon examination, including resolutions of any related appeals or litigation processes, on the basis of the technical merits. A tax position that meets this standard is measured at the largest amount of benefit that will more likely than not be realized on settlement.
The Company records tax liabilities in accordance with ASC Topic 740 and adjusts these liabilities when management's judgment changes as a result of the evaluation of new information not previously available. Because of the complexity of some of these uncertainties, the ultimate resolution may result in payments that are different from the current estimates of these tax liabilities. These differences will be reflected as increases or decreases to income tax expense in the period in which new information becomes available.
The Company recognizes a tax benefit from an uncertain tax position only when it is more likely than not that the position will be sustained upon examination, including resolutions of any related appeals or litigation processes, on the basis of the technical merits. A tax position that meets this standard is measured at the largest amount of benefit that will more likely than not be realized on settlement.
The Company recognizes interest related to income tax matters as interest income or interest expense and penalties related to income tax matters as income tax expense in the consolidated statements of comprehensive income.
Recently Issued Accounting Pronouncements
Following is a summary of recently issued FASB Accounting Standards Updates ("ASUs") that have affected or may affect the Company's consolidated financial statements:
| Affects | Status | |||
|---|---|---|---|---|
| ASU 2016-01 | Financial Instruments—Overall (Subtopic 825-10): Recognition and Measurement of Financial Assets and Financial Liabilities. | Effective for fiscal years beginning after December 15, 2017. | ||
ASU 2016-02 | Leases (Topic 842): Requires the recognition of a right-of-use asset and a lease liability for leases previously classified as operating leases in the statements of financial condition. | Effective for fiscal years beginning after December 15, 2018. | ||
ASU 2016-08 | Revenue from Contracts with Customers (Topic 606): Principal versus Agent Considerations (Reporting Revenue Gross versus Net). | Effective for annual reporting periods beginning after December 15, 2017. | ||
ASU 2016-10 | Revenue from Contracts with Customers (Topic 606): Identifying Performance Obligations and Licensing. | Effective for annual reporting periods beginning after December 15, 2017. |
Interactive Brokers Group, Inc. and Subsidiaries
Notes to Consolidated Financial Statements (Continued)
2. Significant Accounting Policies (Continued)
Recently Issued Accounting Pronouncements
Following is a summary of recently issued FASB Accounting Standards Updates ("ASUs") that have affected or may affect the Company's consolidated financial statements:
| | Affects | Status | ||
|---|---|---|---|---|
| ASU | Effective for fiscal years beginning after December 15, 2019. | |||
ASU 2016-15 | Statement of Cash Flows (Topic 230): Classification of Certain Cash Receipts and Cash Payments. | Effective for fiscal years beginning after December 15, 2017. | ||
ASU 2016-16 | Income Taxes (Topic 740): Intra-Entity Transfers of Assets Other Than Inventory. | Effective for annual reporting periods beginning after December 15, 2017. | ||
ASU 2017-01 | Business Combinations (Topic 805): Clarifying the Definition of a Business. | Effective for annual periods beginning after December 15, 2017. | ||
ASU 2017-04 | Intangibles—Goodwill and Other (Topic 350): Simplifying the Test for Goodwill Impairment. | Effective for fiscal years beginning after December 15, 2019. | ||
ASU 2017-05 | Other Income—Gains and Losses from the Derecognition of Nonfinancial Assets (Subtopic 610-20): Clarifying the Scope of Asset Derecognition Guidance and Accounting for Partial Sales of Nonfinancial Assets. | Effective for annual reporting periods beginning after December 15, 2017. | ||
ASU 2017-08 | Receivables—Nonrefundable Fees and Other Costs (Subtopic 310-20): Amending the amortization period for certain purchased callable debt securities held at a premium. | Effective for fiscal years, and interim periods within those fiscal years, beginning after December 15, | ||
ASU | Effective for annual periods, and interim periods within those annual periods, beginning after December 15, | |||
ASU | Effective for | |||
ASU | Effective for |
Interactive Brokers Group, Inc. and Subsidiaries
Notes to Consolidated Financial Statements (Continued)
2. Significant Accounting Policies (Continued)
| Affects | Status | |||
|---|---|---|---|---|
| ASU | Effective for |
Adoption of those ASUs that became effective during 20142017 and 2015,2018, prior to the issuance of the Company's consolidated financial statements, did not have a material effect on these financial statements.
The Company has reviewed the impact of FASB ASC Topic 606, "Revenue from Contracts with Customers" ("ASC Topic 606"), and identified similar performance obligations under ASC Topic 606 as compared with deliverables and separate units of account previously identified, as a result the Company expects the timing of its revenue recognition to remain the same as compared to FASB ASC Topic 605, "Revenue Recognition." The Company adopted ASC Topic 606 using the modified retrospective method, effective January 1, 2018.
3. Trading Activities and Related Risks
The Company's trading activities include providing securities market making and brokerage services. Trading activities expose the Company to market and credit risks. These risks are managed in accordance with established risk management policies and procedures. To accomplish this, management has established a risk management process that includes:
- •
- a regular review of the risk management process by executive management as part of its oversight role;
- •
- defined risk management policies and procedures supported by a rigorous analytic framework; and
Interactive Brokers Group, Inc. and Subsidiaries
Notes to Consolidated Financial Statements (Continued)
3. Trading Activities and Related Risks (Continued)
- •
- articulated risk tolerance levels as defined by executive management that are regularly reviewed to ensure that the Company's risk-taking is consistent with its business strategy, capital structure, and current and anticipated market conditions.
Interactive Brokers Group, Inc. and Subsidiaries
Notes to Consolidated Financial Statements (Continued)
3. Trading Activities and Related Risks (Continued)
Market Risk
The Company is exposed to various market risks. Exposures to market risks arise from equity price risk, foreign currency exchange rate fluctuations and changes in interest rates. The Company seeks to mitigate market risk associated with trading inventories by employing hedging strategies that correlate rate, price and spread movements of trading inventories and related financing and hedging activities. The Company uses a combination of cash instruments and exchange traded derivatives to hedge its market exposures. The Company does not apply hedge accounting. The following discussion describes the types of market risk faced:
Equity Price Risk
Equity price risk arises from the possibility that equity security prices will fluctuate, affecting the value of equity securities and other instruments that derive their value from a particular stock, a defined basket of stocks, or a stock index. The Company is subject to equity price risk primarily in financial instruments held.owned, at fair value and financial instruments sold, but not yet purchased, at fair value. The Company attempts to limit such risks by continuously reevaluating prices and by diversifying its portfolio across many different options, futures and underlying securities and avoiding concentrations of positions based on the same underlying security.
Currency Risk
Currency risk arises from the possibility that fluctuations in foreign exchange rates will impact the value of financial instruments. The Company manages this risk using spot (i.e., cash) currency transactions, currency futures contracts and currency forward contracts. As a global electronic broker and market maker trading on exchanges around the world in multiple currencies, the Company is exposed to foreign currency risk. The Company actively manages its currency exposure using hedging strategiesa currency diversification strategy that areis based on a defined basket of 1614 currencies internally referred to as the "GLOBAL." These strategies minimize the fluctuation of the Company's net worth as expressed in GLOBALs, thereby diversifying its risk in alignment with these global currencies, weighted by the Company's view of their importance. As the Company's financial results are reported in U.S. dollars, the change in the value of the GLOBAL as expressed in U.S. dollars affects the Company's earnings. The impact of this currency diversification strategy in the Company's earnings is included in other income in the consolidated statements of comprehensive income. In light of the Company's decision to discontinue its options market making activities globally, the Company removed the Singapore dollar (SGD) and realigned the relative weight of the U.S. dollar (USD) versus the other currency components to better reflect its businesses going forward. The new composition went into effect as of the close of business on March 31, 2017.
Interest Rate Risk
Interest rate risk arises from the possibility that changes in interest rates will affect the value of financial instruments. The Company is exposed to interest rate risk on cash and margin balances, positions carried in equity and fixed income securities, options, and futures and on its debt obligations.borrowings. These risks are managed through investment policies and by entering into interest rate futures contracts.