Ordinary Shares, No Par Value Ordinary Shares, No Par Value We are a globally-recognized, leading provider of innovative design, engineering, manufacturing, and supply chain services and solutions that spanfrom sketch to scaletm; from conceptual sketch to full-scale production. We design, build, ship and service complete packaged consumer We provide our advanced design, manufacturing and supply chain services through a network of over 100 facilities in approximately 30 countries across four continents. We have established this extensive network of design and manufacturing facilities in the world's major consumer electronics and industrial products markets (Asia, the Americas, and Europe) in order to serve the outsourcing needs of both multinational and regional OEMs. Our services increase our customers' competitiveness by delivering improved product quality, increased flexibility, leading manufacturability, improved performance, faster time-to-market, and competitive costs. Our OEM customers leverage our services to meet their requirements throughout their products' entire life cycles. For the fiscal year ended March 31, (Mark One)
ý
ANNUAL REPORT PURSUANT TO SECTION 13 OR 15(d) OF THE SECURITIES EXCHANGE ACT OF 1934
For the fiscal year ended March 31, 20152016
Or
o
TRANSITION REPORT PURSUANT TO SECTION 13 OR 15(d) OF THE SECURITIES EXCHANGE ACT OF 1934
Title of Each Class Name of Each Exchange on Which Registered 26, 2014,25, 2015, the aggregate market value of the Company's ordinary shares held by non-affiliates of the registrant was approximately $6.1$5.8 billion based upon the closing sale price as reported on the NASDAQ Stock Market LLC (NASDAQ Global Select Market).Class Outstanding at May 14, 201511, 2016 563,994,126542,802,845Document Parts into Which Incorporated Proxy Statement to be delivered to shareholders in connection with the Registrant's 20152016 Annual General Meeting of Shareholders Part III Page PART IForward-Looking Statements 3Page Item 1. BusinessRisk Factors16Properties31 Signatures"Flextronics,"Flex," "the Company," "we," "us," "our" and similar terms mean Flextronics International Ltd. and its subsidiaries.OVERVIEWelectronics and industrial products for original equipment manufacturers ("OEMs"), through our activities in the following business groups:segments:•medical equipment,consumer health, digital health, disposables, drug delivery, diagnostics, life sciences and diagnostics;imaging equipment; our automotive business, including automotivevehicle electronics, automotive lightingconnectivity, and power electronics;clean technologies; and our defense and aerospace businesses, focused on commercial aviation, defense civil aviation, and homeland security;military;•TechnologyTechnologies Group ("CTG"), which includes our mobile devices business, including smart phones; our consumer electronics business, including connected living, wearable electronics including digital sport, game consoles, and connectivity devices; and our high-volume computing business, including various supply chain solutions for notebook personal computingcomputers ("PC"), tablets, and printers; in addition, our CTG group is expanding its business relationships to include supply chain optimization for non-electronics products such as shoes and clothing;•test and measurement, household industrial and lifestyle, industrial automation and kiosks, energy and metering, and lighting; and•("INS"(“INS”), which includes radio access base stations, remote radio heads, (RRH), and small cells for wireless infrastructure; optical, routing, broadcasting, and switching products for the data and video network;networks; server and storage platforms for both enterprise and cloud based deployments; next generation storage and security appliance products; and rack level solutions, converged infrastructure and software defined product solutions. As of March 31, 2015 the above described business groups comprised our reportable segments.2015,2016, we had revenue of $26.1$24.4 billion and net income of $600.8$444.1 million.
•
•- Reduced design and development costs and lead time;
•Accelerated time-to-market and time-to-volume production;•Reduced capital investment requirements and fixed costs;•Improved inventory management and purchasing power;•Access to worldwide design, engineering, manufacturing, and after-market service capabilities; and•Ability to focus on core branding and R&D initiatives.We believe that growth in the EMS industry will be largely driven by the need for OEMs to respond to rapidly changing markets and technologies, the increasing complexity of supply chains and the continued pressure to be cost competitive. Additionally, we believe that there are significant opportunities for global EMS providers to win additional business from OEMs in markets or industry segments that have yet to substantially utilize such providers.SERVICE OFFERINGSWe offer a broad range of customizable services to OEMs. We believe thatFlextronicsFlex has the broadest worldwide end-to-end supply chainsolutionssolution capabilities in the industry, from concept design resources to aftermarket services. We believe a keycompetitive advantage is theFlextronicsFlex Platform, which is our system for improving customer competitiveness by providing superior speed, scope, and scale:•
Speed: Our sophisticated supply chain management tools and expertise allow us to provide customers with access to real-time information that increases visibility throughout the entireprocess,product lifecycle, reducing risk while accelerating execution.• Scope: Our end-to-end services, from sketch to scaletm, include design and innovation services, engineering, logistics, and supply chain management. Our deep industry knowledge and multi-domain expertise accelerates the entire process of producing increasingly complex products for increasingly interconnected industries.•Scope:Our end-to-end services,from sketch to scale, include design and innovation services, engineering, logistics, and supply chain management. Our deep industry knowledge and multi-domain expertise further accelerates the entire process of producing increasingly complex products for increasingly interconnected industries.•- Scale: Our physical infrastructure includes over 100 facilities in approximately 30 countries, staffed by approximately
150,000 permanent200,000 employees, providing our customers with truly global scale and strategic geographicdistribution.distribution capabilities.We offerbothglobal economies of scale in procurement, manufacturing and after-market services, as well as market-focused expertise and capabilities in design and engineering. As a result of our extensive experience in specific markets, we have developed deep understanding of complex market dynamics, giving us the ability to anticipate trends that impact our customers' businesses. Our expertise can help improve our customers' market positioning by effectively adjusting product plans and roadmaps to efficiently and cost-effectively deliver high quality products that meet their time-to-market requirements.Our services include all processes necessary to design, build, ship and service complete packaged consumer electronics and industrial products for our OEM customers. These services include:Innovation Services. We provide a comprehensive set of services that enable companies, from startups to multinationals, to successfully innovate, create new products and solutions, and gain access to new markets. These services span the entire product introduction and solution lifecycle by providing access to new technologies, accelerating product development from early concepts to final production-ready design, and providing advanced manufacturing and testing for new product introduction and market access to grow our customers'bases.offerings. We launched the Silicon Valley Open Innovation Initiativeto create an ecosystem of customers, suppliers and design tool makers to drive new product innovation technologies that improve productivity, cost and time-to-market. As part of this initiative, we founded the Silicon Valley Open Innovation Summit.
In fiscal year2015,2016, we continued to expand our Innovation Centers worldwide and further enhanced our flagship Customer Innovation Center in Silicon Valley. OurInnovationinnovation services include:•
Innovations Labs. Innovation Labs is a design and engineering organization that specializes in supporting customer design and product development services from early concept stages, with the ability to accommodate highly ambiguous requirements. Customers gain access to our design and engineering facilities, technical subject matterexperts,expertise, and rapid prototyping resources such as metal and plastic 3D printers and soft tooling capabilities.•- Collective Innovation Platform. The Collective Innovation Platform is an ecosystem of qualified technology solutions that helps customers reduce time-to-market and enhance product functionality by leveraging technology building blocks that have been qualified by
FlextronicsFlex as part our technology Centers of Excellence. By joining theFlextronicsFlex Collective Innovation Program, technology providers can monetize their investments and gain access toFlextronics'our large, global customer base. Program members include technology suppliers, startups, software/application providers, research labs/institutes and universities.•- Lab IX. A startup accelerator program that invests in the next generation of disruptive
technology,technologies, giving startups a competitive advantage by providing them the necessary resources and connections to grow their business. By bringing together startups, OEMs and technology partners, we provide Lab IX portfolio companies with access to our global end-to-end supply chain solutions, our wealth of experience in hardware design, our manufacturing services and logistics across a wide range of markets, and additional benefits from our specialized partners.•- Centers of Excellence.
StrategicCenters of Excellence provide strategic technology capabilities developed byFlextronicsFlex in critical solutions areas which are leveraged across multiple industries, for integration into our customers' products. Centers of Excellence include Human Machine Interface, Wireless and Connectivity, Semiconductors, Sensors&and Actuators, Power&and Battery Management, Smart Software, Flexible Technology, Computing, and Mechanicals&and Plastics.•- Interconnect Technology Center. The Interconnect Technology Center provides expertise in both rigid and flexible circuits for next generation printed circuits technology, testing methods, and designs. The Center's state-of-the-art labs
are specifically designed for printed circuit innovation, with a focus on embedded components, integration and transfer, wearable and stretchable design, thermal management, system integration and simulation.•- CloudLabs. The CloudLabs initiative provides cloud infrastructure companies with engineering and design services to optimize rack-level solutions, especially in the case of multi-vendor equipment integration. CloudLabs enables customers to accelerate a spectrum of cloud, converged infrastructure, and datacenter strategies.
Design and Engineering Services. We offer a comprehensive range of value-added design and engineering services, tailored to the specific markets and needs of our customers. These services can be delivered by one of two primary business models:•
Contract Design Services, where customers purchase engineering and development services on a time and materials basis; or•- Joint Development Manufacturing Services, where
Flextronics'our engineering and development teams work jointly with our customers' teams to ensure product development integrity, seamless manufacturing handoffs, and faster time to market.Our design and engineering services are provided by our global market-based engineering teams and cover a broad range of technical competencies:•
System Architecture, User Interface and Industrial Design. We help our customers design and develop innovative and cost-effective products that address the needs of the user and the market. These services include product definition, analysis and optimization of performance and functional requirements, 2-D sketch level drawings, 3-D mock-ups and proofs of concept, interaction and interface models, detailed hard models, and product packaging.•- Mechanical Engineering, Technology, Enclosure Systems, Thermal and Tooling Design. We offer detailed mechanical, structural, and thermal design solutions for enclosures that encompass a wide range of plastic, metal and other material technologies. These capabilities and technologies are increasingly important to our customers' product differentiation goals and are increasingly required to be successful in today's competitive marketplace. Additionally, we provide design and development services for prototype and production tooling equipment used in manufacturing.
•- Electronic System Design. We provide complete electrical and hardware design for products ranging in size from small handheld consumer devices to large, high-speed, carrier-grade, telecommunications equipment,
which includesincluding embedded microprocessors, memory, digital signal processing design, high-speed digital interfaces, analog circuit design, power management solutions, wired and wireless communication protocols, display imaging, audio/video, and radio frequency systems and antenna design.•- Reliability and Failure Analysis. We provide comprehensive design for manufacturing, test, and reliability services leveraging robust, internally-developed tools and databases. These services leverage our core manufacturing competencies to help our customers achieve their time-to-revenue goals.
•- Component Level Development Engineering. We have developed substantial engineering competencies for product development and lifecycle management of various component technologies, such as power solutions, and printed circuit board and interconnection technologies, both rigid and flexible.
We are exposed to different or greater potential liabilities from our various design services than those we face in our core assembly and manufacturing services. See "Risk Factors—The success of certain of our activities depends on our ability to protect our intellectual property rights; intellectual property infringement claims against our customers or us could harm our business."Systems Assembly and Manufacturing. Our assembly and manufacturing operations, which generate the majority of our revenues, include printed circuit board assembly and assembly of systems and subsystems that incorporate printed circuit boards and complex electromechanical components. We often assemble electronics products with our proprietary printed circuit boards and custom electronic enclosures on either a build-to-order or configure-to-order basis. In these operations, we employ just-in-time, ship-to-stock and ship-to-line programs, continuous flow manufacturing, demand flow processes, and statistical process controls. As OEMs seek to provide greater functionality in physically smaller products, they increasingly require more sophisticated manufacturing technologies and processes. Our investment in advanced manufacturing equipment and our expertise in innovative miniaturization, packaging and interconnect technologies, enables us to offer a variety of advanced manufacturing solutions. We support a wide range of product demand profiles, from low-volume, high-complexity programs, to high-volume production. Continuous focus on lean manufacturing, and a systematicapproach to identifying and eliminating
waste (non-value-added activities) through continuous improvement based on customer demand allows us to increase our efficiency and flexibility to meetour customers'dynamic customer requirements. Our systems assembly and manufacturing expertise includes the following:•
Enclosures. We offer a comprehensive set of custom electronics enclosures and related products and services. Our services include the design, manufacture and integration of electronics packaging systems, including custom enclosure systems, power and thermal subsystems, interconnect subsystems, cabling, and cases. In addition to standard sheet metal and plastic fabrication services, we assist in the design of electronics packaging systems that protect sensitive electronics and enhance functionality. Our enclosure design services focus on functionality, manufacturability and testing. These services are integrated with our other assembly and manufacturing services to provide our customers with improved overallimprovedsupply chain management.•- Testing Services. We offer computer-aided testing services for assembled printed circuit boards, systems and subsystems. These services significantly improve our ability to deliver high-quality products on a consistent basis. Our test services include management defect analysis, in-circuit testing and functional testing as well as environmental stress tests of board and system assemblies. We also offer design for test, manufacturing, and
environmentenvironmental services to jointly improve customer product design and manufacturing.•- Materials Procurement and Inventory Management. Our manufacturing and assembly operations capitalize on our materials inventory management expertise and volume procurement capabilities. As a result, we believe that we are able to achieve highly competitive cost reductions and reduce total manufacturing cycle time for our OEM customers. Materials procurement and management consist of the planning, purchasing, expediting, and warehousing of components and materials used in the manufacturing process. In addition, our strategy includes having third-party suppliers of custom components located in our industrial parks to reduce material and transportation costs, simplify logistics and facilitate inventory management. We also use a sophisticated automated manufacturing resource planning system and enhanced electronic data interchange capabilities to ensure inventory control and optimization. Through our manufacturing resources planning system, we have real-time visibility of material availability and are able to track
thework in process. We utilize electronic data interchange with our customers and suppliers to implement a variety of supply chain management programs. Electronic data interchange allows customers to share demand and product forecasts, deliver purchase orders and assists suppliers with satisfying just-in-time delivery and supplier-managed inventory requirements. This also enables us to implement vendor-managed inventory solutions to increase flexibility and reduce overall capital allocation in the supply chain. We procure a wide assortment of materials, including electronic components, plastics and metals. There are a number of sources for these materials, including customers for whom we are providing systems assembly and manufacturing services. On some occasions, there have been shortages in certain electronic components, most recently with regard to connectors, capacitors, LCD panels and memory (both DRAM and Flash). However, such shortages have not had a material impact on our operating results for any periods presented. See "Risk Factors—We may be adversely affected by shortages of required electronic components."Component businesses. We offer the following components product solutions:•
Rigid and Flexible Printed Circuit Board ("PCB") Fabrication. Printed circuit boards areplatformscomposed of laminated materials that provide the interconnection for integratedcircuits, passive and other electronic components and thus are at the heart of almost every electrical system. They are formed out of multi-layered epoxy resin and glass cloth systems with very fine traces,
andspaces, and plated holes (called vias),which interconnect the different layers into an extremely dense circuit network that carries the electrical signals between components. As semiconductor designs become more complex and signal speeds increase, there is an increasing demand for higher density integration on printed circuit boards, requiring higher layer counts, finer lines and spacings, smaller vias (microvias) and base materials with very low electrical loss characteristics. The manufacturing of these complex multilayer interconnect products often requires the use of sophisticated circuit interconnections between layers, and adherence to strict electrical characteristics to maintain consistent transmission speeds and impedances. The global demand for wireless devices and the complexity of wireless products are driving the demand for more flexible printed circuits. Flexible circuit boards facilitate a reduction in the weight of a finished electronic product and allow the designer to use the third dimension in designing new products or product features. Flexible circuits have become a very attractive design alternative for many new and emerging application spaces such as automotive rear light-emitting diode ("LED") lighting, tablet computers, and miniaturized radio frequency identification tags or smart cards. We are an industry leader in high-density interconnect with Every Layer Inter Connect ("ELIC") technology, which is widely used in smart phone designs, and multilayer constructions which are used in advanced routers and switches, telecom equipment, servers, storage, and flexible printed circuit boards and flexible printed circuit board assemblies. Our PCB business (Multek) manufactures printed circuit boards on a low-volume, quick-turn basis, as well as on a high-volume production basis. We provide quick-turn prototype services that allow us to provide small test quantities to meet theneeds of customers' product development groups in aslittlequickly as 48 hours. Our extensive range of services enables us to respond to our customers' demands for an accelerated transition from prototype to volume production. Multek offers a one-stop solution from design to manufacturing of PCB, flexible circuits and rigid flex circuits and sub-assemblies. We have printed circuit board and flexible circuit fabrication service capabilities in North America and Asia. During fiscal year 2014, we completed the closing of our Multek factories in Germany and Brazil.We believe this will driveThis drove operational efficiencies, andresultresulted in an optimization of our system, which will reduce the revenue level required to achieve better margins. Going forward, our PCB capabilities will be centered in Asia and North America.•
Power Supplies. We have a full service power supply business ("Flex Power") that is a key player in the mobile revolution, with expertise in high efficiency and high density switching power supplies ranging from 1 to 3,000 watts. Our product portfolio includes chargers for smartphones and tablets, adapters for notebooks and gaming, and power supplies for server, storage, and networking markets. We pride ourselves on our ability to service the needs of industry leaders in these markets through valuable technology, design expertise, collaborative development, and efficient execution. Our products are fully compliant with the environmental and Energy Star requirements that drive efficiency specifications in our industry. Customers who engage with Flex Power gain access to compelling innovations and intellectual property in digital control and smart power.Logistics. Our
FlextronicsFlex Global Services business is a provider of after-market supply chain logistics services. Our comprehensive suite of servicesareis tailored to customers operating in the computing, consumer digital, infrastructure, industrial, mobile and medical markets. Our expansive global infrastructureconsists of 25includes 27 sites andmore than 12,000approximately 11,000 employees strategically located throughout the Americas, Europe, and Asia. By leveraging our operational infrastructure, supply chain network, and IT systems, we are able to offer our customers globally consistent logistics solutions. By linking the flow of information from these supply chains, we create supply chain insight for our customers. We provide multiple logistics solutions including supplier-managed inventory, inbound freight management, product postponement, build/configure to order, order fulfillment and distribution, and supply chain network design.Reverse Logistics and Repair Services. We offer a suite of integrated reverse logistics and repair solutions that use globally consistent processes, which helpprotectincrease our customers' brand loyalty by improving turnaround times and raising end-customer satisfaction levels. Our objective is tomaintain maximummaximize asset value retentionoffor our customers' products throughout their product life cycle while simultaneously minimizing non-value added repair inventory levels and handling in the supply chain. With our suite of end-to-end solutions, we can effectively manage our customers' reverse logistics requirements, while providing criticaldatafeedback to their supply chain constituents,anddelivering continuous improvement and efficiencies for both existing and next generation products. Our reverse logistics and repair solutions include returns management, exchange programs, complex repair, asset recovery, recycling and e-waste management. We provide repair expertise to multiple product lines such as consumer and midrange products, printers, smart phones, consumer medical devices, notebooks, PC's, set-top boxes, game consoles and highly complex infrastructure products. With our service parts logistics business, we manage all of the logistics and restocking processes essential to the efficient operation of repair and refurbishment services.STRATEGYWe build intelligent products for a connected world. We do this by providing our customers with end-to-end product development services, from innovation, design, and engineering, to manufacturing, logistics, and supply chain solutions. We strive to help create a smarter, more connected world, enabling simpler, richer lives through technology. Our strategy is to enable and scale innovation for our customers, maintain our leadership in our core capabilities, and build extended offerings in high-growth sectors.Talent. To maintain our competitiveness and world-class capabilities, we focus on hiring and retaining the world's best talent. We empower talented employees to develop global supply chain solutions that transform industries and companies. We have taken steps to attract the best functional and operational leaders and have accelerated efforts to develop the future leaders of the company.Customer-Focus. We believe that serving aspiring leaders in dynamic industries fosters the development of our core skills and results in superior growth and profitability. Our customers come first, and we have a relentless focus on delivering distinctive products and services in a cost-effective manner with fast time-to-market.Market Focus. We apply a rigorous approach to managing our portfolio of opportunities by focusing on companies that are leaders in their industry and value our superior capabilities in design, manufacturing, supply chain and aftermarket services. We focus our energy and efforts on high-growth markets where we have distinctive competence and compelling valueproposition.propositions. Examples include our investments in energy, healthcare, automotive, industrial markets, and a number of enabling components technologies. Our market-focused approach to managing ourbusiness increases our customers' competitiveness by
leveraging our deep industry expertise, as well as global scale and sensitivity and rapid response to changes in market dynamics.Global Operations Capabilities. We continue to invest in maintaining the leadership of our world-class manufacturing and services capabilities. We constantly push the state of the art in manufacturing technology, process development and operations management. We believe these skills, IP, and assets contribute to our significant competitive advantage. We continue to capitalize on our industrial park concept, where we co-locate our manufacturing, design, and service resources in low-cost regions, to provide a competitive advantage by minimizing logistics, manufacturing costs, and cycle times while increasing flexibility and responsiveness. Our ability to cost effectively manage such a massive worldwide system is itself a major competitive advantage.Extended Value Propositions. We continue to extend our distinctiveness in manufacturing into new value propositions that leverage our core capabilities. We opportunistically invest in new capabilities and services to provide our customers with a broader value-added suite of services and solutions to meet their product and market requirements. We continue to develop manufacturing process technologies that reduce cost and improve product performance.COMPETITIVE STRENGTHSWe continue to enhance our business through the development and expansion of our product and service offerings. We strive to maintain the efficiency and flexibility of our organization, with repeatable execution that adapts to macro-economic changes providing clear value to our customers, while increasing their competitiveness. We have a focused strategy on delivering scale, scope and speed to our customers through world-class operations, innovation and design services, supply chain solutions, and industry and market expertise. We provide real-time supply chain applications that enable improved supply chain visibility, allowing customers to better monitor and mitigate risks. We believe the following capabilities further differentiate us from our competitors and enable us to better serve our customers' requirements:Significant Scale and Global Integrated System. We believe that scale is a significant competitive advantage, as our customers' solutions increasingly require cost structures and capabilities that can only be achieved through size and global reach. We are a leader in global procurement, purchasing approximately$22.4$22.6 billion of materials during our fiscal year ended March 31,2015.2016. As a result, we are able to use our worldwide supplier relationships to achieve advantageous pricing and supply chain flexibility for our OEM customers.We have established an extensive, integrated network of design, manufacturing and logistics facilities in the world's major consumer electronics and industrial markets to serve the outsourcing needs of both multinational and regional OEMs. Our extensive global network of over 100 facilities in approximately 30 countries with approximately150,000 permanent200,000 employees, helps increase our customers' competitiveness by simplifying their global product development processes while delivering improved product quality with improved performance and accelerated time to market.End-to-End Solutions. We offer a comprehensive range of worldwide supply chain services that simplify and improvetheglobal product developmentprocess,processes, providing meaningful time and cost savings to our OEM customers. Our broad-based, end-to-end services enable us to cost effectively design, build, ship and service a complete packaged product. We believe that our capabilities help our customers improve product quality, manufacturability and performance, while reducing costs. We have expanded and enhanced our service offering by adding capabilities in 3D printing, automation, innovation labs, real-time supply chain software, plastics, machining, and mobile charging, and by introducing new capabilities in areas such as solar equipment, large format stamping, and chargers.*Motorola Mobility includes net sales from its parent Google up to the point in time when Motorola Mobility was acquired by Lenovo and including net sales from Lenovo thereafter•••- IEI, which is comprised of
oursemiconductor and capital equipment, office solutions,test and measurement,household, industrial, and lifestyle, industrial automation and kiosks, energy and metering, and lighting; and•CEC, formerly referred to as INS, which includes radio access base stations, remote radio heads,(RRH)and small cells for wirelessinfrastructure,infrastructure; optical, routing, broadcasting, and switching products for the data and videonetwork,networks; server and storage platforms for both enterprise and cloud baseddeployments,deployments; next generation storage and security applianceproductsproducts; and rack level solutions, converged infrastructure, and software defined product solutions.Factors affecting any of these industries in general or our customers in particular, could adversely impact us. These factors include:•
rapid changes in technology, evolving industry standards, and requirements for continuous improvement in products and services that result in short product life cycles;•demand for our customers' products may be seasonal;•our customers may fail to successfully market their products, and our customers' products may fail to gain widespread commercial acceptance;our customers' products may have supply chain issues;•our customers may experience dramatic market share shifts in demand which may cause them to lose market share or exitthe business;businesses; and•there may be recessionary periods in our customers' markets, such as the recent global economic downturn.Our customers may cancel their orders, change production quantities or locations, or delay production, and our current and potential customers may decide to manufacture some or all of their products internally, which could harm our business.Cancellations, reductions, or delays by a significant customer or by a group of customers have harmed, and may in the future harm, our results of operations by reducing the volumes of products we manufacture and deliver for these customers, by causing a delay in the repayment of our expenditures for inventory in preparation for customer orders, and by lowering our asset utilization resulting in lower gross margins. Additionally, current and prospective customers continuously evaluate our capabilities against other providers as well as against the merits of manufacturing products themselves. Our business would be adversely affected if OEMs decide to perform these functions internally or transfer their business to another provider. In addition, we face competition from the manufacturing operations of some of our current and potential customers, who are continually evaluating the merits of manufacturing products internally against the advantages of outsourcing. In the past, some of our customers moved a portion of their manufacturing from us in order to more fully utilize their excess internal manufacturing capacity. Any of these developments could cause a decline in our sales, loss of market acceptance of our products or services,compressiondecreases of our profits or loss of our market share.As a provider of design and manufacturing services and components for electronics, we must provide increasingly rapid product turnaround time for our customers. We generally do not obtain firm, long-term purchase commitments from our customers, and we often experience reduced lead times in customer orders which may be less than the lead time we require to procure necessary components and materials.The short-term nature of our customers' commitments and the rapid changes in demand for their products reduces our ability to accurately estimate the future requirements of our customers. This makes it difficult to schedule production and maximize utilization of our manufacturing capacity. In that regard, we must make significant decisions, including determining the levels of business that wewill seek and accept, setting production schedules, making component procurement commitments, and allocating personnel and other resources based on our estimates of our customers' requirements.
On occasion, customers require rapid increases in production or require that manufacturing of their products be transitioned from one facility to another to reduce costs or achieve other objectives. These demands stress our resources, can cause supply chain management issues, and reduce our margins. We may not have sufficient capacity at any given time to meet our customers' demands, and transfers from one facility to another can result in inefficiencies and costs due to excess capacity in one facility and corresponding capacity constraints at another.Due to manyMany of our costs and operating expensesbeingare relatively fixed, thus customer order fluctuations, deferrals, and transfers of demand from one facility to another, as described above, have had a material adverse effect on our operating results in the past and we may experience such effects in the future.Our industry is extremely competitive; if we are not able to continue to provide competitive services, we may lose business.We compete with a number of different companies, depending on the type of service we provide or the location of our operations. For example, we compete with major global EMS providers, other smaller EMS companies that have a regional or product-specific focus and ODMs with respect to some of the services that we provide. We also compete with our current and prospective customers, who evaluate our capabilities in light of their own capabilities and cost structures. Our industry is extremely competitive, many of our competitors have achieved substantial market share, and some may have lower cost structures or greater design, manufacturing, financial or other resources than we do. We face particular competition from Asian-based competitors, including Taiwanese ODM suppliers who compete in a variety of our end markets and have a substantial share of global information technology hardware production. If we are unable to provide comparable manufacturing services and improved products at lower cost than the other companies in our market, our net sales could decline.The majorityA significant percentage of our sales come from a small number of customers and a decline in sales to any of these customers could adversely affect our business.Sales to our ten largest customers represent a significant percentage of our net sales. Our ten largest customers accounted for approximately50%46%,52%50% and47%52% of net sales in fiscal years 2016, 20152014and2013,2014, respectively. Only Lenovo/MotorolaMobility(including net sales from its former parent, Google, up to the point in time when Motorola Mobility was acquired by Lenovo and including net sales from Lenovo thereafter), which is reflected in our CTGbusiness group,segment, accounted for more than 10% of net sales in fiscal year 2016, 2015 andfiscal year2014.No customer accounted for greater than 10% of the Company's net sales in fiscal year 2013.Our principal customers have varied from year to year. These customers may experience dramatic declines in their market shares or competitive position, due to economic or other forces, that may cause them to reduce their purchases from us or, in some cases, result in the termination of their relationship with us. Significant reductions in sales to any of these customers, or the loss of major customers, would materially harm our business. If we are not able to timely replace expired, canceled or reduced contracts with new business, our revenues and profitability could be harmed.Our components business is dependent on our ability to quickly launch world-class components products, and our investment in the development of our component capabilities, together with the start-up and integration costs necessary to achieve quick launches of world-class components products, may adversely affect our margins and profitability.Our components business, which includes rigid and flexible printed circuit board fabrication, and power supply manufacturing, is part of our strategy to improve our competitive position and to grow our future margins, profitability and shareholder returns by expanding our capabilities. The success ofour components business is dependent on our ability to design and introduce world- class components that have performance characteristics which are suitable for a broad market and that offer significant price and/or performance advantages over competitive products.
To create these world class components offerings, we must continue to make substantial investments in the development of our components capabilities, in resources such as research and development, technology licensing, test and tooling equipment, facility expansions and personnel requirements. We may not be able to achieve or maintain market acceptance for any of our components offerings in any of our current or target markets. The success of our components business will also depend upon the level of market acceptance of our customers' end products, which incorporate our components, and over which we have no control.In addition, OEMs often require unique configurations or custom designs, which must be developed and integrated in the OEM's product well before the OEM launches the product. Thus, there is often substantial lead-time between the commencement of design efforts for a customized component and the commencement of volume shipments of the component to the OEM. As a result, we may make substantial investments in the development and customization of products for our customers, and no revenue may be generated from these efforts if our customers do not accept the customized component. Even if our customers accept the customized component, if our customers do not purchase anticipated levels of products, we may not realize any profits.Our achievement of anticipated levels of profitability in our components business is also dependent on our ability to achieve efficiencies in our manufacturing as well as to manufacture components in commercial quantities to the performance specifications demanded by our OEM customers. As a result of these and other risks, we have been, and in the future may be, unable to achieve anticipated levels of profitability in our components business.Our exposure to financially troubled customers or suppliers may adversely affect our financial results.We provide manufacturing services to companies and industries that have in the past, and may in the future, experience financial difficulty. If some of our customers experience financial difficulty, we could have difficulty recovering amounts owed to us from these customers, or demand for our products from these customers could decline. Additionally, if our suppliers experience financial difficulty we could have difficulty sourcingsupplysupplies necessary to fulfill production requirements and meetscheduled shipments. If one or more of our customers were to become insolvent or otherwise were unable to pay for the services provided by us on a timely basis, or at all, our operating results and financial condition could be adversely affected. Such adverse effects could include one or more of the following: an increase in our provision for doubtful accounts, a charge for inventory write-offs, a reduction in revenue, and an increase in our working capital requirements due to higher inventory levels and increases in days our accounts receivable are outstanding.On April 21, 2016, SunEdison, Inc. and certain of its subsidiaries ("SunEdison") filed for protection under Chapter 11 of the U.S. Bankruptcy Code. For the fiscal year ended March 31, 2016, we recognized approximately $61.0 million in charges for provisions of accounts receivable associated with our outstanding SunEdison receivables. The estimates underlying our recorded provisions, as well as consideration of other potential customer bankruptcy-related contingencies associated with the SunEdison bankruptcy proceedings, are based on the facts currently known to us. If these facts change, the provisions are subject to change or we could recognize additional charges, either of which could be material.
We may be adversely affected by shortages of required electronic components.From time to time, we have experienced shortages of some of the electronic components that we use. These shortages can result from strong demand for those components or from problems experienced by suppliers, such as shortages of raw materials. These unanticipated component shortages could result in curtailed production or delays in production, which may prevent us from making scheduled shipments to customers. Our inability to make scheduled shipments could cause us to experience a reduction in sales, increase in inventory levels and costs, and could adversely affect relationships with existing and prospective customers. Component shortages may also increase our cost of goods sold because we may be required to pay higher prices for components in short supply and redesign or reconfigure products to accommodate substitute components. As a result, componentshortages could adversely affect our operating results. Our performance depends, in part, on our ability to incorporate changes in component costs into the selling prices for our products.
Our supply chain may also be impacted by other events outside our control, including macro-economic events, political crises or natural or environmental occurrences.Our margins and profitability may be adversely affected due to substantial investments, start-up and productionrampingramp costs in our design services.As part of our strategy to enhance our end-to-end service offerings, we continue to expand our design and engineering capabilities. Providing these services can expose us to different or greater potential risks than those we face when providing our manufacturing services.Although we enter into contracts with our design services customers, we may design and develop products for these customers prior to receiving a purchase order or other firm commitment from them. We are required to make substantial investments in the resources necessary to design and develop these products, and no revenue may be generated from these efforts if our customers do not approve the designs in a timely manner or at all. Even if our customers accept our designs, if they do not then purchase anticipated levels of products, we may not realize any profits. Our design activities often require that we purchase inventory for initial production runs before we have a purchase commitment from a customer. Even after we have a contract with a customer with respect to a product, these contracts may allow the customer to delay or cancel deliveries and may not obligate the customer to any particular volume of purchases. These contracts can generally be terminated on short notice. In addition, some of the products we design and develop must satisfy safety and regulatory standards and some must receive government certifications. If we fail to obtain these approvals or certifications on a timely basis, we would be unable to sell these products, which would harm our sales, profitability and reputation.Due to the increased risks associated with ourOur design services offeringswe may not be able to achieve a high enough level of sales for this business, and therequire significant investments in research and development, technology licensing, test and tooling equipment, patent applications, facility expansion andrecruitment that it requires,recruitment. We may not be able to achieve a high enough level of sales for this business to be profitable. The initial costs of investing in the resources necessary to expand our design and engineering capabilities, and in particular to support our design services offerings, have historically adversely affected our profitability, and may continue to do so as we continue to make investmentsinto grow these capabilities.In addition, we agree to certain product price limitations and cost reduction targets in connection with these services. Inflationary and other increases in the costs of the raw materials and labor required to produce the products have occurred and may recur from time to time. Also, the production ramps for these programs are typically significant and negatively impact our margin in early stages as the manufacturing volumes are lower and result in inefficiencies and unabsorbed manufacturing overhead costs. We may not be able to reduce costs, incorporate changes in costs into the selling prices of our products, or increase operating efficiencies as we ramp production of our products, which would adversely affect our margins and our results of operations.We conduct operations in a number of countries and are subject to the risks inherent in international operations.The geographic distances between the Americas, Asia and Europe create a number of logistical and communications challenges for us. These challenges include managing operations across multiple time zones, directing the manufacture and delivery of products across distances, coordinating procurement of components and raw materials and their delivery to multiple locations, and coordinating the activities and decisions of the core management team, which is based in a number of different countries.Facilities in several different locations may be involved at different stages of the production process of a single product, leading to additional logistical difficulties.
Because our manufacturing operations are located in a number of countries throughout the Americas, Asia and Europe, we are subject to risks of changes in economic and political conditions in those countries, including:•
fluctuations in the value of local currencies;•labor unrest, difficulties in staffing and geographic labor shortages;•longer payment cycles;•cultural differences;•increases in duties and taxation levied on our products;•increased scrutiny by the media and other third parties of labor practices within our industry (including but not limited to working conditions) which may result in allegations of violations, more stringent and burdensome labor laws and regulations and inconsistency in the enforcement and interpretation of such laws and regulations, higher labor costs, and/or loss of revenues if our customers become dissatisfied with our labor practices and diminish or terminate their relationship with us;•imposition of restrictions on currency conversion or the transfer of funds;•limitations on imports or exports of components or assembled products, or other travel restrictions;•expropriation of private enterprises;ineffective legal protection of our intellectual property rights in certain countries;•natural disasters;exposure to infectious disease and epidemics;•political unrest; and•a potential reversal of current favorable policies encouraging foreign investment or foreign trade by our host countries.The attractiveness of our services to U.S. customers can be affected by changes in U.S. trade policies, such as most favored nation status and trade preferences for some Asian countries. In addition, some countries in which we operate, such as Brazil, Hungary, India, Mexico, Malaysia and Poland, have experienced periods of slow or negative growth, high inflation, significant currency devaluations or limited availability of foreign exchange. Furthermore, in countries such as China, Brazil and Mexico, governmental authorities exercise significant influence over many aspects of the economy, and their actions could have a significant effect on us. We could be seriously harmed by inadequate infrastructure, including lack of adequate power and water supplies, transportation, raw materials and parts in countries in which we operate. In addition, we may encounter labor disruptions and rising labor costs, in particular within the lower-cost regions in which we operate. Any increase in labor costs that we are unable to recover in our pricing to our customers could adversely impact our operating results.Operations in foreign countries also present risks associated with currency exchange and convertibility, inflation and repatriation of earnings. In some countries, economic and monetary conditions and other factors could affect our ability to convert our cash distributions to U.S. dollars or other freely convertible currencies, or to move funds from our accounts in these countries. Furthermore, the central bank of any of these countries may have the authority to suspend, restrict or otherwise impose conditions on foreign exchange transactions or to approve distributions to foreign investors.The success of certain of our activities depends on our ability to protect our intellectual property rights; intellectual property infringement claims against our customers or us could harm our business.We retain certain intellectual property rights to some of the technologies that we develop as part of our engineering, design and manufacturing services and components offerings. The measures we have taken to prevent unauthorized use of our technology may not be successful. If we are unable to protect our intellectual property rights, this could reduce or eliminate the competitive advantages of our proprietary technology, which would harm our business.Our engineering, design and manufacturing services and components offerings involve the creation and use of intellectual property rights, which subject us to the risk of claims of intellectual property infringement from third parties, as well as claims arising from the allocation of intellectual property rights among us and our customers. In addition, our customers are increasingly requiring us to indemnify them against the risk of intellectual property infringement. If any claims are brought against us or our customers for such infringement, whether or not these have merit, we could be required to expend significant resources in defense of such claims. In the event of such an infringement claim, we may be required to spend a significant amount of money to develop non-infringing alternatives or obtainlicenses.licenses or to resolve the issue through litigation. We may not be successful in developing such alternatives or obtaining such licenses on reasonable terms or atall.all, and any such litigation might not be resolved in our favor. Additionally, litigation could be lengthy and costly, and could materially harm our financial condition regardless of outcome.
If our IT or physical security systems are breached, we may incur significant legal and financial exposure.We regularly face attempts by others to gain unauthorized access through the Internet or to introduce malicious software to our information systems. We are also a target of malicious attackers who attempt to gain access to our network or data centers or those of our customers or end users; steal proprietary information related to our business, products, employees, and customers; or interrupt our systems and services or those of our customers or others. We believe such attempts are increasing in number and in technical sophistication. In some instances, we, our customers, and the users of our products and services might be unaware of an incident or its magnitude and effects. We have implemented security systems with the intent of maintaining the physical security of our facilities and inventory and protecting our customers' and our suppliers' confidential information. In addition, while we seek to detect and investigate all unauthorized attempts and attacks against our network, products, and services, and to prevent their recurrence where practicable through changes to our internal processes andtools; Wetools, we are subject to, and at times have suffered from, breach of these security systems which have in the past and may in the future result in unauthorized access to our facilities and/or unauthorized use or theft of the inventory or information we are trying to protect. If unauthorized parties gain physical access to our inventory or if they gain electronic access to our information systems or if such information or inventory is used in an unauthorized manner, misdirected, lost or stolen during transmission or transport, any theft or misuse of such information or inventory could result in, among other things, unfavorable publicity, governmental inquiry and oversight, difficulty in marketing our services, allegations by our customers that we have not performed our contractual obligations, litigation by affected parties including our customers and possible financial obligations for damages related to the theft or misuse of such information or inventory, any of which could have a material adverse effect on our profitability and cash flow.We believe that we have adopted appropriate measures to mitigate potential risks to our technology and our operations from the breach of our security systems.If our compliance policies are breached, we may incur significant legal and financial exposure.We have implemented local and global compliance policies to ensure compliance with our legal obligations across our operations. A significant legal risk resulting from our international operations is compliance with the U.S. Foreign Corrupt Practices Act or similar local laws of the countries in which we do business, including the UK Anti-Bribery Act, which prohibits covered companies from makingpayments to foreign government officials to assist in obtaining or retaining business. Our Code of Business Conduct prohibits corrupt payments on a global basis and precludes us from offering or giving anything of value to a government official for the purpose of obtaining or retaining business, to win a business advantage or to improperly influence a decision regarding
Flextronics.Flex. Nevertheless, there can be no assurance that all of our employees and agents will refrain from taking actions in violation of this and our related anti-corruption policies and procedures. Any such violation could have a material adverse effect on our business.We are subject to risks relating to litigation, which may have a material adverse effect on our business.From time to time, we are involved in various claims, suits, investigations and legal proceedings. Additional legal claims or regulatory matters may arise in the future and could involve matters relating to commercial disputes, government regulatory and compliance, intellectual property, antitrust, tax, employment or shareholder issues, product liability claims and other issues on a global basis. Regardless of the merits of the claims, litigation may be both time- consuming and disruptive to our business. The defense and ultimate outcome of any lawsuits or other legal proceedings may result in higher operating expenses and a decrease in operating margin, which could have a material adverse effect on our business, financial condition, or results of operations.Compliance with government regulations regarding the use of "conflict minerals" may result in increased costs and risks to us.As part of the Dodd-Frank Act, the SEC has promulgated disclosure requirements regarding the use of certain minerals ("Minerals"), which may be mined from the Democratic Republic of Congo and adjoining countries. In May 2014, we filed our initial report on Form SD to report that our products were "DRC Conflict Undeterminable" based on our diligence review. We expect to undertake further diligence of our supply chain in20152016 and beyond as we will have to publicly disclose whether the products we sell contain these Minerals and have and may continue to incur significant costs related to implement a process that will meet the mandates of the Dodd-Frank Act. Additionally, customers rely on us to provide critical data regarding the products they purchase andwill likelyrequest information on such Minerals. Our materials sourcing is broad-based and multi-tiered, and we may not be able to easily verify the origins of the Minerals used in the products we sell. We have many suppliers and each may provide the required information in a different manner, if at all. Accordingly, because the supply chain is complex, our reputation may suffer if we are unable to sufficiently verify the origins of the Minerals, if any, used in our products. Additionally, customers may demand that the products they purchase be free of any Minerals originating in the specified countries. The implementation of this requirement could affect the sourcing and availability of products we purchase from our suppliers. This may reduce the number of suppliers that may be able to provide products and may affect our ability to obtain products in sufficient quantities to meet customer demand or at competitive prices.We may not meet regulatory quality standards applicable to our manufacturing and quality processes for medical devices, which could have an adverse effect on our business, financial condition or results of operations.As a medical device manufacturer, we have additional compliance requirements. We are required to register with the U.S. Food and Drug Administration ("FDA") and are subject to periodic inspection by the FDA for compliance with the FDA's Quality System Regulation ("QSR") requirements, which require manufacturers of medical devices to adhere to certain regulations, including testing, quality control and documentation procedures. Compliance with applicable regulatory requirements is subject to continual review and is rigorously monitored through periodic inspections and product field monitoring by the FDA. If any FDA inspection reveals noncompliance with QSR or other FDA regulations, and the Company does not address the observation adequately to the satisfaction of theFDA, the FDA may take action against us. FDA actions may include issuing a letter of inspectional observations, issuing a warning letter, imposing fines, bringing an action against the Company and its officers, requiring a recall of the products we manufactured for our customers, refusing requests for clearance or approval of new products or withdrawal of clearance or approval previously granted, issuing an import detention on products entering the U.S. from an offshore facility, or shutting down a manufacturing facility. If any of these actions were to occur, it would harm our reputation and cause our business to suffer.
In the European Union ("EU"), we are required to maintain certain standardized certifications in order to sell our products and must undergo periodic inspections to obtain and maintain these certifications. Continued noncompliance to the EU regulations could stop the flow of products into the EU from us or from our customers. In China, the Safe Food and Drug Administration controls and regulates the manufacture and commerce of healthcare products. We must comply with the regulatory laws applicable to medical device manufactures or our ability to manufacture products in China could be impacted. In Japan, the Pharmaceutical Affairs Laws regulate the manufacture and commerce of healthcare products. These regulations also require that subcontractors manufacturing products intended for sale in Japan register with authorities and submit to regulatory audits. Other Asian countries where we operate have similar laws regarding the regulation of medical device manufacturing.We are subject to the risk of increased income taxes.We are subject to taxes in numerous jurisdictions. Our future effective tax rates could be affected by changes in the mix of earnings in countries with differing statutory rates and changes in tax laws or their interpretation including changes related to tax holidays or tax incentives. Our taxes could increase if certain tax holidays or incentives are not renewed upon expiration, or if tax rates applicable to us in such jurisdictions are otherwise increased. Our continued ability to qualify for specific tax holiday extensions will depend on, among other things, our anticipated investment and expansion in these countries and the manner in which the local governments interpret the requirements for modifications, extensions or new incentives.In addition, the Company and its subsidiaries are regularly subject to tax return audits and examinations by various taxing jurisdictions around the world. In determining the adequacy of our provision for income taxes, we regularly assess the likelihood of adverse outcomes resulting from tax examinations. While it is often difficult to predict the final outcome or the timing of the resolution of a tax examination, we believe that our reserves for uncertain tax benefits reflect the outcome of tax positions that are more likely than not to occur. However, we cannot assure you that the final determination of any tax examinations will not be materially different than that which is reflected in our income tax provisions and accruals. Should additional taxes be assessed as a result of a current or future examination, there could be a material adverse effect on our tax provision, operating results, financial position and cash flows in the period or periods for which that determination is made.If our products or components contain defects, demand for our services may decline and we may be exposed to product liability and product warranty liability.Defects in the products we manufacture or design, whether caused by a design, engineering, manufacturing or component failure or deficiencies in our manufacturing processes, could result in product or component failures, which may damage our business reputation and expose us to product liability or product warranty claims.Product liability claims may include liability for personal injury or property damage. Product warranty claims may include liability to pay for the recall, repair or replacement of a product or component. Although we generally allocate liability for these claims in our contracts with our customers, increasingly we are unsuccessful in allocating such liability, and even where we haveallocated liability to our customers, our customers may not have the resources to satisfy claims for costs or liabilities arising from a defective product or component for which they have assumed responsibility.
If we design, engineer or manufacture a product or component that is found to cause any personal injury or property damage or is otherwise found to be defective, we could spend a significant amount of money to resolve the claim. In addition, product liability and product recall insurance coverage are expensive and may not be available for some or all of our services offerings on acceptable terms, in sufficient amounts, or at all. A successful product liability or product warranty claim in excess of our insurance coverage or any material claim for which insurance coverage is denied, limited or is not available could have a material adverse effect on our business, results of operations and financial condition.Our failure to comply with environmental laws could adversely affect our business.We are subject to various federal, state, local and foreign environmental laws and regulations, including regulations governing the use, storage, discharge and disposal of hazardous substances used in our manufacturing processes. We are also subject to laws and regulations governing the recyclability of products, the materials that may be included in products, and our obligations to dispose of these products after end users have finished with them. Additionally, we may be exposed to liability to our customers relating to the materials that may be included in the components that we procure for our customers' products. Any violation or alleged violation by us of environmental laws could subject us to significant costs, fines or other penalties.We are also required to comply with an increasing number of global and local product environmental compliance regulations focused on the restriction of certain hazardous substances. We are subject to the EU directives, including the Restrictions on RoHS, the WEEE as well as the EU's REACH regulation. In addition, new technical classifications of e-Waste being discussed in the Basel Convention technical working group could affect both our customers' abilities and obligations in electronics repair and refurbishment. Also of note is China's Management Methods for Controlling Pollution Caused by EIPs regulation, commonly referred to as "China RoHS", which restricts the importation into and production within China of electrical equipment containing certain hazardous materials. Similar legislation has been or may be enacted in other jurisdictions, including in the United States. RoHS and other similar legislation bans or restricts the use of lead, mercury and certain other specified substances in electronics products and WEEE requires EU importers and/or producers to assume responsibility for the collection, recycling and management of waste electronic products and components. We have developed rigorous risk mitigating compliance programs designed to meet the needs of our customers as well as applicable regulations. These programs may include collecting compliance data from our suppliers, full laboratory testing and public reporting of other environmental metrics such as carbon emissions, electronic waste and water, and we also require our supply chain to comply. Non-compliance could potentially result in significant costs and/or penalties. In the case of WEEE, the compliance responsibility rests primarily with the EU importers and/or producers rather than with EMS companies. However, OEMs may turn to EMS companies for assistance in meeting their obligations under WEEE.In addition, we are responsible for the cleanup of contamination at some of our current and former manufacturing facilities and at some third party sites. If more stringent compliance or cleanup standards under environmental laws or regulations are imposed, or the results of future testing and analyses at our current or former operating facilities indicate that we are responsible for the release of hazardous substances into the air, ground and/or water, we may be subject to additional liability. Additional environmental matters may arise in the future at sites where no problem is currently known or at sites that we may acquire in the future. Our failure to comply with environmental laws and regulations or adequately address contaminated sites could limit our ability to expand our facilities or could require us to incur significant expenses, which would harm our business.If we do not effectively manage changes in our operations, our business may be harmed; we have taken substantial restructuring charges in the past and we may need to take material restructuring charges in the future.
In recent years, we have experienced growth in our business through a combination of internal growth and acquisitions. However, our business also has been negatively impacted by the recent adverse global economic conditions.The expansion of our business, as well as business contractions and other changes in our customers' requirements, have in the past, and may in the future, require that we adjust our business and cost structures by incurring restructuring charges. Restructuring activities involve reductions in our workforce at some locations and closure of certain facilities. All of these changes have in the past placed, and may in the future place, considerable strain on our financial and management controlsystems and resources, including decision support, accounting management, information systems and facilities. If we do not properly manage our financial and management controls, reporting systems and procedures to manage our employees, our business could be harmed.In recent years, including during fiscalyearsyear 2014,and 2013,we undertook initiatives to restructure our business operations through a series of restructuring activities, which were intended to realign our global capacity and infrastructure with demand by our OEM customers and thereby improve our operational efficiency. These activities included reducing excess workforce and capacity, transitioning manufacturing to lower-cost locations and eliminating redundant facilities, and consolidating and eliminating certain administrative facilities.While we incur severance, asset impairment charges and other charges as a result of changes in our customer mix on an ongoing basis, such individual actions were not considered material and did not qualify as restructuring charges per accounting principles generally accepted in the United States to be separately disclosed as restructuring charges in fiscal year 2015, and are included in either cost of sales or selling, general and administrative expenses, as appropriate. Our restructuring activities undertaken during fiscalyearsyear 2014and 2013have been disclosed separately on our statement of operations. We may be required to take additional charges in the future to align our operations and cost structures with global economic conditions, market demands, cost competitiveness, and our geographic footprint as it relates to our customers' production requirements. We may consolidate certain manufacturing facilities or transfer certain of our operations to lower cost geographies. If we are required to take additional restructuring charges in the future, our operating results, financial condition, and cash flows could be adversely impacted. Additionally, there are other potential risks associated with our restructurings that could adversely affect us, such as delays encountered with the finalization and implementation of the restructuring activities, work stoppages, and the failure to achieve targeted cost savings.Fluctuations in foreign currency exchange rates could increase our operating costs.We have manufacturing operations and industrial parks that are located in lower cost regions of the world, such as Asia, Eastern Europe and Mexico. A portion of our purchases and our sale transactions are denominated in currencies other than the United States dollar. As a result, we are exposed to fluctuations in these currencies impacting our fixed cost overhead or our supply base relative to the currencies in which we conduct transactions.Currency exchange rates fluctuate on a daily basis as a result of a number of factors, including changes in a country's political and economic policies. Volatility in the functional and non-functional currencies of our entities and the United States dollar could seriously harm our business, operating results and financial condition. The primary impact of currency exchange fluctuations is on the cash, receivables, payables and expenses of our operating entities. As part of our currency hedging strategy, we use financial instruments, primarily forward exchange and swap contracts, to hedge our foreign currency exposure in order to reduce the short-term impact of foreign currency rate fluctuations on ouroperating results. If our hedging activities are not successful or if we change or reduce these hedging activities in the future, we may experience significant unexpected fluctuations in our operating results as a result of changes in exchange rates.
We are also exposed to risks related to the valuation of the Chinese currency relative to the U.S. dollar. The Chinese currency is the renminbi ("RMB"). A significant increase in the value of the RMB could adversely affect our financial results and cash flows by increasing both our manufacturing costs and the costs of our local supply base.We depend on our executive officers and skilled management personnel.Our success depends to a large extent upon the continued services of our executive officers and other key employees. Generally, our employees are not bound by employment or non-competition agreements, and we cannot assure you that we will retain our executive officers and other key employees. We could be seriously harmed by the loss of any of our executive officers or other key employees. We will need to recruit and retain skilled management personnel, and if we are not able to do so, our business could be harmed. In addition, in connection with expanding our design services offerings, we must attract and retain experienced design engineers. There is substantial competition in our industry for highly skilled employees. Our failure to recruit and retain experienced design engineers could limit the growth of our design services offerings, which could adversely affect our business.Failure to comply with domestic or international employment and related laws could result in the payment of significant damages, which would reduce our net income.We are subject to a variety of domestic and foreign employment laws, including those related to safety, wages and overtime, discrimination, whistle-blowing, classification of employees and severance payments. Enforcement activity relating to these laws, particularly outside of the United States, can increase as a result of increased media attention due to violations by other companies, changes in law, political and other factors. There can be no assurance that we won't be found to have violated such laws in the future, due to a more aggressive enforcement posture by governmental authorities or for any other reason. Anysuch violations could lead to the assessment of fines against us by federal, state or foreign regulatory authorities or damages payable to employees, which fines could be substantial and which would reduce our net income.We may encounter difficulties with acquisitions and divestures, which could harm our business.We have completed numerous acquisitions of businesses and we may acquire additional businesses in the future. Any future acquisitions may require additional equity financing, which could be dilutive to our existing shareholders, or additional debt financing, which could increase our leverage and potentially affect our credit ratings. Any downgrades in our credit ratings associated with an acquisition could adversely affect our ability to borrow by resulting in more restrictive borrowing terms. As a result of the foregoing, we also may not be able to complete acquisitions or strategic customer transactions in the future to the same extent as in the past, or at all.To integrate acquired businesses, we must implement our management information systems, operating systems and internal controls, and assimilate and manage the personnel of the acquired operations. The difficulties of this integration may be further complicated by geographic distances. The integration of acquired businesses may not be successful and could result in disruption to other parts of our business. In addition, the integration of acquired businesses may require that we incur significant restructuring charges.In addition, acquisitions involve numerous risks and challenges, including:•
diversion of management's attention from the normal operation of our business;•- potential loss of key employees and customers of the acquired companies;
•difficulties managing and integrating operations in geographically dispersed locations;•the potential for deficiencies in internal controls at acquired companies;•increases in our expenses and working capital requirements, which reduce our return on invested capital;•lack of experience operating in the geographic market or industry sector of the acquired business;initial dependence on unfamiliar supply chain or relatively small supply chain partners; and•exposure to unanticipated liabilities of acquired companies.In addition, divestitures involve significant risks, including without limitation, difficulty finding financially sufficient buyers or selling on acceptable terms in a timely manner, and the agreed-upon terms could be renegotiated due to changes in business or market conditions. Divestitures could adversely affect our profitability and, under certain circumstances, require us to record impairment charges or a loss as a result of the transaction. In addition, completing divestitures requires expenses and management attention and could leave us with certain continuing liabilities.These and other factors have harmed, and in the future could harm, our ability to achieve anticipated levels of profitability at acquired operations or realize other anticipated benefits of an acquisition or divestiture, and could adversely affect our business and operating results.Our strategic relationships with major customers create risks.In the past, we have completed numerous strategic transactions with OEM customers. Under these arrangements, we generally acquire inventory, equipment and other assets from the OEM, and lease or acquire their manufacturing facilities, while simultaneously entering into multi-year manufacturing and supply agreements for the production of their products. We may pursue these OEM divestiture transactions in the future. These arrangements entered into with divesting OEMs typically involve many risks, including the following:•
we may need to pay a purchase price to the divesting OEMs that exceeds the value we ultimately may realize from the future business of the OEM;•the integration of the acquired assets and facilities into our business may be time-consuming and costly, including the incurrence of restructuring charges;•we, rather than the divesting OEM, bear the risk of excess capacity at the facility;•we may not achieve anticipated cost reductions and efficiencies at the facility;•we may be unable to meet the expectations of the OEM as to volume, product quality, timeliness and cost reductions;•our supply agreements with the OEMs generally do not require any minimum volumes of purchase by the OEMs, and the actual volume of purchases may be less than anticipated; and•if demand for the OEMs' products declines, the OEM may reduce its volume of purchases, and we may not be able to sufficiently reduce the expenses of operating the facility or use the facility to provide services to other OEMs.As a result of these and other risks, we have been, and in the future may be, unable to achieve anticipated levels of profitability under these arrangements. In addition, these strategic arrangements have not, and in the future may not, result in any material revenues or contribute positively to our earnings per share.Our business could be impacted as a result of actions by activist shareholders or others.We may be subject, from time to time, to legal and business challenges in the operation of our company due to actions instituted by activist shareholders or others. Responding to such actions could be costly and time-consuming, may not align with our business strategies and could divert the attention of our Board of Directors and senior management from the pursuit of our business strategies. Perceived uncertainties as to our future direction as a result of shareholder activism may lead to theperception of a change in the direction of the business or other instability and may make it more difficult to attract and retain qualified personnel and business partners and may affect our relationships with vendors, customers and other third parties.
Changes in financial accounting standards or policies have affected, and in the future may affect, our reported financial condition or results of operations.We prepare our financial statements in conformity with U.S. GAAP. These principles are subject to interpretation by the Financial Accounting Standards Board (FASB), the American Institute of Certified Public Accountants (AICPA), the SEC and various bodies formed to interpret and create accounting policies. For example, significant changes to revenue recognition rules have been enacted and will begin to apply to usas early as fiscal year 2018 unless the adoption date is postponed to ourin fiscal year 2019 as the FASB has proposed. Changes to accounting rules or challenges to our interpretation or application of the rules by regulators may have a material adverse effect on our reported financial results or on the way we conduct business.Our business and operations could be adversely impacted by climate change initiatives.Concern over climate change has led to international legislative and regulatory initiatives directed at limiting carbon dioxide and other greenhouse gas emissions. Proposed and existing efforts to address climate change by reducing greenhouse gas emissions could directly or indirectly affect our costs of energy, materials, manufacturing, distribution, packaging and other operating costs, which could impact our business and financial results.Our operating results may fluctuate significantly due to seasonal demand.Two of our significant end markets are the mobile devices market and the consumer devices market. These markets exhibit particular strength generally in the two quarters leading up to the end of the calendar year in connection with the holiday season. As a result, we have historically experienced stronger revenues in our second and third fiscal quarters as compared to our other fiscal quarters. Economic or other factors leading to diminished orders in the end of the calendar year could harm our business.Our debt level may create limitations.As of March 31,2015,2016, our total debt was approximately$2.1$2.8 billion. This level of indebtedness could limit our flexibility as a result of debt service requirements and restrictive covenants, and may limit our ability to access additional capital or execute our business strategy.Changes in our credit rating may make it more expensive for us to raise additional capital or to borrow additional funds. We may also be exposed to interest rate fluctuations on our outstanding borrowings and investments.Our credit is rated by credit rating agencies. Our 4.625% Notes, our 5.000% Notes, and our5.000%4.750% Notes, are currently ratedBB+BBB- by Standard and Poor's ("S&P")and Ba1 by Moody's, and arewhich is considered to be “investment grade” by S&P, while rated Ba1 by Moody’s which is considered below"investment grade" debt“investment grade” byMoody's and S&P.Moody's. Any further decline in our credit rating may make it more expensive for us to raise additional capital in the future on terms that are acceptable to us, if atall;all, negatively impact the price of our ordinaryshares;shares, increase our interest payments under some of our existing debtagreements;agreements, and have other negative implications on our business, many of which are beyond our control. In addition, the interest rate payable on some of our creditfacilities is subject to adjustment from time to time if our credit ratings change. Thus, any potential future negative change in our credit rating may increase the interest rate payable on these credit facilities.In addition, we are exposed to interest rate risk under our variable rate terms loans, bilateral facilities and revolving credit facility for indebtedness we have incurred or may incur under such borrowings. The interest rates under these borrowings are based on either (i) a margin over LIBOR or (ii) the base rate (the greatest of the agent's prime rate, the federal funds rate plus 0.50% and LIBOR for a one-month interest period plus 1.00%) plus an applicable margin, in each case depending on our credit rating. Refer to the discussion in note 7, "Bank Borrowings and Long-Term Debt" to the consolidated financial statements for further details of our debt obligations. We are also exposed to interest rate risk on our invested cash balances, our securitization facilities and our factoring activities.
Weak global economic conditions and instability in financial markets may adversely affect our business, results of operations, financial condition, and access to capital markets.Our revenue and gross margin depend significantly on general economic conditions and the demand for products in the markets in which our customers compete. Adverse worldwide economic conditions may create challenging conditions in the electronics industry. These conditions may result in reduced consumer and business confidence and spending in many countries, a tightening in the credit markets, a reduced level of liquidity in many financial markets and high volatility in credit, fixed income and equity markets. In addition, longer term disruptions in the capital and credit markets could adversely affect our access to liquidity needed for our business. If financial institutions that have extended credit commitments to us are adversely affected by the conditions of the U.S. and international capital markets, they may become unable to fund borrowings under their credit commitments to us, which could have an adverse impact on our financial condition and our ability to borrow additional funds, if needed, for working capital, capital expenditures, acquisitions, research and development and other corporate purposes.Catastrophic events or geopolitical conditions could have a material adverse effect on our operations and financial results.Our operations or systems could be disrupted by naturaldisasters;disasters, geopoliticalconditions;conditions, terroristactivity;activity, public healthissues;issues, cyber securityincidents;incidents, interruptions of service from utilities, transportation or telecommunicationsproviders;providers, or other catastrophic events. Such events could make it difficult or impossible to manufacture or deliver products to our customers, receive production materials from our suppliers, or perform critical functions, which could adversely affect our revenue and require significant recovery time and expenditures to resume operations. While we maintain business recovery plans that are intended to allow us to recover from natural disasters or other events that can be disruptive to our business, some of our systems are not fully redundant and we cannot be sure that our plans will fully protect us from all such disruptions.We maintain a program of insurance coverage for a variety of property, casualty, and other risks. We place our insurance coverage with multiple carriers in numerous jurisdictions. However, one or more of our insurance providers may be unable or unwilling to pay a claim. The types and amounts of insurance we obtain vary depending on availability, cost, and decisions with respect to risk retention. The policies have deductibles and exclusions that result in us retaining a level of self-insurance. Losses not covered by insurance may be large, which could harm our results of operations and financial condition.Our business could be adversely affected by any delays, or increased costs, resulting from issues that our common carriers are dealing with in transporting our materials, our products, or both.We rely on a variety of common carriers to transport our materials from our suppliers to us, and to transport our products from us to our customers. Problems suffered by any of these common carriers, whether due to a natural disaster, labor problem, increased energy prices, criminal activity or some other issue, could result in shipping delays, increased costs, or other supply chain disruptions, and could therefore have a material adverse effect on our operations.We are subject to risks associated with investments.We invest in private funds and companies for strategic reasons and may not realize a return on our investments. We make investments in private funds and companies to further our strategic objectives, support key business initiatives and develop business relationships with related portfolio companies. Many of the instruments in which we invest are non-marketable at the time of our initial investment. If any of the funds or companies in which we invest fail, we could lose all or part of our investment. If we need to determine that an other-than-temporary decline in the fair value exists for an investment, we would need to write down the investment to its fair value and recognize a loss.The market price of our ordinary shares is volatile.The stock market in recent years has experienced significant price and volume fluctuations that have affected the market prices of companies, including technology companies. These fluctuations have often been unrelated to or disproportionately impacted by the operating performance of these companies. The market for our ordinary shares has been and may in the futurebe subject to similar volatility. Factors such as fluctuations in our operating results, announcements of technologicalinnovations or events affecting other companies in the electronics industry, currency fluctuations, general market fluctuations, and macro-economic conditions may cause the market price of our ordinary shares to decline.
The Company'sOur goodwill and identifiable intangible assets could become impaired, which could reduce the value ofitsour assets and reduceitsour net income in the year in which the write-off occurs.Goodwill represents the excess of the cost of an acquisition over the fair value of the net assets acquired.The CompanyWe alsoascribesascribe value to certain identifiable intangible assets, which consist primarily of customer relationships, developed technology and trade names, among others, as a result of acquisitions.The CompanyWe may incur impairment charges on goodwill or identifiable intangible assets ifit determineswe determine that the fair values of goodwill or identifiable intangible assets are less than their current carrying values.The Company evaluates,We evaluate, on a regular basis, whether events or circumstances have occurred that indicate all, or a portion, of the carrying amount of goodwill may no longer be recoverable, in which case an impairment charge to earnings would become necessary.Refer to notes 1 and 2 to the consolidated financial statements and 'critical accounting policies' in management's discussion and analysis of financial condition and results of operations for further discussion of the impairment testing of goodwill and identifiable intangible assets.A decline in general economic conditions or global equity valuations could impact the judgments and assumptions about the fair value ofthe Company'sour businesses andthe Companywe could be required to record impairment charges onitsour goodwill or other identifiable intangible assets in the future, which could impactthe Company'sour consolidated balance sheet, as well asthe Company'sour consolidated statement of operations. Ifthe Company waswe are required to recognize an impairment charge in the future, the charge would not impactthe Company'sour consolidated cash flows,currentliquidity, capital resources, and covenants underitsour existing credit facilities, asset securitization program, and other outstanding borrowings.ITEM 1B. UNRESOLVED STAFF COMMENTSNone.ITEM 2. PROPERTIESOur facilities consist of a global network of industrial parks, regional manufacturing operations, and design, engineering and product introduction centers, providing approximately24.426.0 million square feet of productive capacity as of March 31,2015.2016. We own facilities with approximately7.78.2 million square feet in Asia,3.54.7 million square feet in the Americas and2.12.7 million square feet in Europe. We lease facilities with approximately 5.5 million square feet in Asia,3.83.5 million square feet in the Americas and1.81.4 million square feet in Europe.Our facilities include large industrial parks, ranging in size fromunder 100,0000.3 million to3.24.5 million square feet in Brazil, China, Hungary, India, Israel, Malaysia, Mexico, Poland, Romania, and the Ukraine. We also have regional manufacturing operations, generally ranging in size from under 100,000 to approximately 2.7 million square feet in Austria, Brazil, Canada, China, Czech Republic, Denmark, Hong Kong, Hungary, India, Indonesia, Ireland, Italy, Japan, Malaysia, Mexico, Poland, Romania, Singapore, Sweden, Switzerland, the Ukraine and the United States. We also have smaller design and engineering centers and product introduction centers at a number of locations in the world's major consumer electronics and industrial markets.Our facilities are well maintained and suitable for the operations conducted. The productive capacity of our plants is adequate for current needs.For a description of our material legal proceedings, see note 12 "Commitments and Contingencies" to the consolidated financial statements, which is incorporated herein by reference.ITEM 4. MINE SAFETY DISCLOSURESPART IIITEM 5. MARKET FOR REGISTRANT'S COMMON EQUITY, RELATED SHAREHOLDER MATTERS AND ISSUER PURCHASES OF EQUITY SECURITIESPRICE RANGE OF ORDINARY SHARESOur ordinary shares are quoted on the NASDAQ Global Select Market under the symbol "FLEX." The following table sets forth the high and low per share sales prices for our ordinary shares since the beginning of fiscal year20142015 as reported on the NASDAQ Global Select Market.High Low High Low Fiscal Year Ended March 31, 2016 Fourth Quarter $ 12.06 $ 9.10 Third Quarter 11.79 10.27 Second Quarter 11.56 9.90 First Quarter 12.84 11.53 Fiscal Year Ended March 31, 2015
Fourth Quarter
$ 12.68 $ 10.47 $ 12.68 $ 10.47 Third Quarter
11.35 8.75 11.35 8.75 Second Quarter
11.52 10.30 11.52 10.30 First Quarter
11.35 8.93 11.35 8.93 Fiscal Year Ended March 31, 2014
Fourth Quarter
$ 9.42 $ 7.50 Third Quarter
9.25 7.13 Second Quarter
9.50 7.68 First Quarter
7.89 6.64 As of May14, 201511, 2016 there were3,3563,274 holders of record of our ordinary shares and the closing sales price of our ordinary shares as reported on the NASDAQ Global Select Market was$12.52$12.04 per share.DIVIDENDSSince inception, we have not declared or paid any cash dividends on our ordinary shares. We currently do not have plans to pay any dividends in fiscal year2016.2017.STOCK PRICE PERFORMANCE GRAPH
The following stock price performance graph and accompanying information is not deemed to be "soliciting material" or to be "filed" with the SEC or subject to Regulation 14A under the Securities Exchange Act of 1934 or to the liabilities of Section 18 of the Securities Exchange Act of 1934, and will not be deemed to be incorporated by reference into any filing under the Securities Act of 1933 or the Securities Exchange Act of 1934, regardless of any general incorporation language in any such filing.The graph below compares the cumulative total shareholder return on our ordinary shares, the Standard & Poor's 500 Stock Index and a peer group comprised of Benchmark Electronics, Inc., Celestica, Inc., Jabil Circuit, Inc., and Sanmina-SCI Corporation.The graph below assumes that $100 was invested in our ordinary shares, in the Standard & Poor's 500 Stock Index and in the peer group described above on March 31,20102011 and reflects the annual return through March 31,2015,2016, assuming dividend reinvestment.The comparisons in the graph below are based on historical data and are not indicative of, or intended to forecast, the possible future performances of our ordinary shares.COMPARISON OF 5 YEAR CUMULATIVE TOTAL RETURNFlextronics,Flex, the S&P 500 Index, and Peer Group
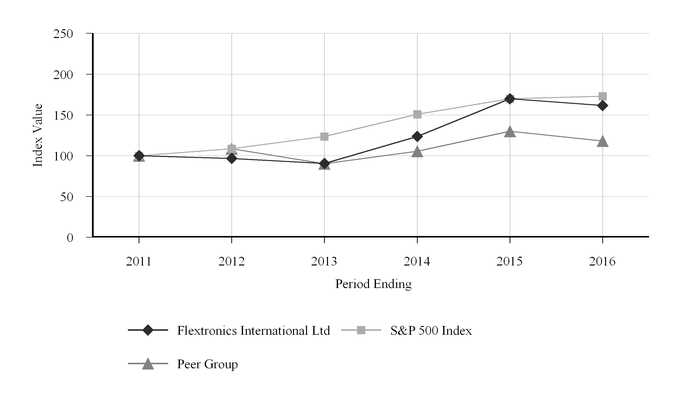
3/10 3/11 3/12 3/13 3/14 3/15 3/11 3/12 3/13 3/14 3/15 3/16 Flextronics International Ltd
100.00 95.28 92.09 86.22 117.86 161.73 100.00 96.65 90.50 123.69 169.75 161.45 S&P 500 Index
100.00 115.65 125.52 143.05 174.31 196.50 100.00 108.54 123.69 150.73 169.92 172.95 Peer Group
100.00 105.14 114.20 94.76 110.86 136.77 100.00 108.61 90.13 105.44 130.08 117.99 Prepared by Zacks Investment Research, Inc. Used with permission. All rights reserved. Copyright1980-20151980-2016Index Data: Copyright Standard and Poor's, Inc. Used with permission. All rights reserved.Issuer Purchases of Equity SecuritiesThe following table provides information regarding purchases of our ordinary shares made by us for the period from January 1,20152016 through March 31,2015.2016.Period (2) Total Number
of Shares
Purchased (1)Average Price
Paid per ShareTotal Number of Shares
Purchased as Part of
Publicly Announced
Plans or ProgramsApproximate Dollar Value
of Shares that May Yet
Be Purchased Under the
Plans or ProgramsJanuary 1 - January 29, 2016 2,971,650 $ 9.75 2,971,650 $ 299,470,835 January 30 - February 26, 2016 3,051,212 10.29 3,051,212 268,074,241 February 27 - March 31, 2016 2,251,188 11.55 2,251,188 242,079,433 Total 8,274,050 8,274,050 PeriodTotal Number
of Shares
PurchasedAverage Price
Paid per ShareTotal Number of Shares
Purchased as Part of
Publicly Announced
Plans or ProgramsApproximate Dollar Value
of Shares that May Yet
Be Purchased Under the
Plans or ProgramsJanuary 1 - January 30, 2015(1)
916,100 $ 10.91 916,100 $ 363,360,432 January 31 - February 27, 2015(1)
3,962,300 11.98 3,962,300 315,892,139 February 28 - March 31, 2015(1)(2)
6,423,038 12.06 6,423,038 238,409,457 Total
11,301,438 11,301,438 (1) During the period from January 1, 2016 through March 31, 2016 all purchases were made pursuant to the program discussed below in open market transactions. All purchases were made in accordance with Rule 10b-18 under the Securities Exchange Act of 1934. (2) On August 20, 2015, our Board of Directors authorized the repurchase of our outstanding ordinary shares for up to $500 million. This is in accordance with the share purchase mandate whereby our shareholders approved a repurchase limit of 20% of our issued ordinary shares outstanding at the Extraordinary General Meeting held on the same date as the Board authorization. As of March 31, 2016, shares in the aggregate amount of $242.1 million were available to be repurchased under the current plan. (1)During the period from January 1, 2015 through March 31, 2015 all purchases were made pursuant to the program discussed below in open market transactions. All purchases were made in accordance with Rule 10b-18 under the Securities Exchange Act of 1934.(2)On August 28, 2014, our Board of Directors authorized the repurchase of our outstanding ordinary shares for up to $500 million. This is in accordance with the share repurchase mandate whereby our shareholders approved a repurchase limit of 20% of our issued ordinary shares outstanding at the Extraordinary General Meeting held on the same date as the Board authorization. As of March 31, 2015, shares in the aggregate amount of $238.4 million were available to be repurchased under the current Board authorization.
RECENT SALES OF UNREGISTERED SECURITIES
None.INCOME TAXATION UNDER SINGAPORE LAWDividends. Singapore does not impose a withholding tax on dividends. All dividends are tax exempt to shareholders.Gains on Disposal. Under current Singapore tax law there is no tax on capital gains, thus any profits from the disposal of shares are not taxable in Singapore unless the gains arising from the disposal of shares are income in nature and subject to tax, especially if they arise from activities which the Inland Revenue Authority of Singapore regards as the carrying on of a trade or business in Singapore (in which case, the profits on the sale would be taxable as trade profits rather than capital gains).Shareholders who apply, or who are required to apply, the Singapore Financial Reporting Standard 39 Financial Instruments—Recognition and Measurement ("FRS 39") for the purposes of Singapore income tax may be required to recognize gains or losses (not being gains or losses in the nature of capital) in accordance with the provisions of FRS 39 (as modified by the applicable provisions of Singapore income tax law) even though no sale or disposal of shares is made.Stamp Duty. There is no stamp duty payable for holding shares, and no duty is payable on theacquisitionissue ofnewly-issuednew shares. When existing shares are acquired in Singapore, a stamp duty of 0.2% is payable on the instrument of transfer of the shares atthe rate of two Singapore dollars ("S$") for every S$1,000 of themarketvalue of the shares.value. The stamp duty is borne by the purchaser unless thereis an agreement to the contrary. If the instrument of transfer is executed outside of Singapore, the stamp duty must be paid only if the instrument of transfer is received in Singapore.
Estate Taxation. The estate duty was abolished for deaths occurring on or after February 15, 2008. For deaths prior to February 15, 2008 the following rules apply:If an individual who is not domiciled in Singapore dies on or after January 1, 2002, no estate tax is payable in Singapore on any of our shares held by the individual.If property passing upon the death of an individual domiciled in Singapore includes our shares, Singapore estate duty is payable to the extent that the value of the shares aggregated with any other assets subject to Singapore estate duty exceeds S$600,000. Unless other exemptions apply to the other assets, for example, the separate exemption limit for residential properties, any excess beyond S$600,000 will be taxed at 5% on the first S$12,000,000 of the individual's chargeable assets and thereafter at 10%.An individual shareholder who is a U.S. citizen or resident (for U.S. estate tax purposes) will have the value of the shares included in the individual's gross estate for U.S. estate tax purposes. An individual shareholder generally will be entitled to a tax credit against the shareholder's U.S. estate tax to the extent the individual shareholder actually pays Singapore estate tax on the value of the shares; however, such tax credit is generally limited to the percentage of the U.S. estate tax attributable to the inclusion of the value of the shares included in the shareholder's gross estate for U.S. estate tax purposes, adjusted further by a pro rata apportionment of available exemptions. Individuals who are domiciled in Singapore should consult their own tax advisors regarding the Singapore estate tax consequences of their investment.Tax Treaties Regarding Withholding. There is no reciprocal income tax treaty between the U.S. and Singapore regarding withholding taxes on dividends and capital gains.ITEM 6. SELECTED FINANCIAL DATAThese historical results are not necessarily indicative of the results to be expected in the future. The following selected consolidated financial data set forth below was derived from our historical audited consolidated financial statements and is qualified by reference to and should be read inconjunction with Item 7, "Management's Discussion and Analysis of Financial Condition and Results of Operations" and Item 8, "Financial Statements and Supplementary Data."
Fiscal Year Ended March 31, 2015 2014 2013 2012(2) 2011(2) (In thousands, except per share amounts) CONSOLIDATED STATEMENT OF OPERATIONS DATA:
Net sales
$ 26,147,916 $ 26,108,607 $ 23,569,475 $ 29,343,029 $ 28,442,633 Cost of sales
24,602,576 24,609,738 22,187,393 27,825,079 26,859,288 Restructuring charges
— 58,648 215,834 — — Gross profit
1,545,340 1,440,221 1,166,248 1,517,950 1,583,345 Selling, general and administrative expenses
844,473 874,796 805,235 877,564 801,772 Intangible amortization
32,035 28,892 29,529 49,572 66,188 Restructuring charges
— 16,663 11,600 — — Other charges (income), net(1)
(53,233 ) 57,512 (65,190 ) (19,935 ) 6,127 Interest and other, net
51,410 61,904 56,259 36,019 74,948 Income from continuing operations before income taxes
670,655 400,454 328,815 574,730 634,310 Provision for income taxes
69,854 34,860 26,313 53,960 22,049 Income from continuing operations
600,801 365,594 302,502 520,770 612,261 Loss from discontinued operations, net of tax
— — (25,451 ) (32,005 ) (16,042 ) Net income
$ 600,801 $ 365,594 $ 277,051 $ 488,765 $ 596,219 Diluted earnings (loss) per share:
Continuing operations
$ 1.02 $ 0.59 $ 0.45 $ 0.72 $ 0.77 Discontinued operations
$ — $ — $ (0.04 ) $ (0.04 ) $ (0.02 ) Total
$ 1.02 $ 0.59 $ 0.41 $ 0.67 $ 0.75 Fiscal Year Ended March 31, 2016 2015 2014 2013 2012(2) (In thousands, except per share amounts) CONSOLIDATED STATEMENT OF OPERATIONS DATA: Net sales $ 24,418,885 $ 26,147,916 $ 26,108,607 $ 23,569,475 $ 29,343,029 Cost of sales 22,810,824 24,602,576 24,609,738 22,187,393 27,825,079 Restructuring charges — — 58,648 215,834 — Gross profit 1,608,061 1,545,340 1,440,221 1,166,248 1,517,950 Selling, general and administrative expenses 954,890 844,473 874,796 805,235 877,564 Intangible amortization 65,965 32,035 28,892 29,529 49,572 Restructuring charges — — 16,663 11,600 — Other charges (income), net (1) 47,738 (53,233 ) 57,512 (65,190 ) (19,935 ) Interest and other, net 84,793 51,410 61,904 56,259 36,019 Income before income taxes 454,675 670,655 400,454 328,815 574,730 Provision for income taxes 10,594 69,854 34,860 26,313 53,960 Income from continuing operations 444,081 600,801 365,594 302,502 520,770 Loss from discontinued operations, net of tax — — — (25,451 ) (32,005 ) Net Income $ 444,081 $ 600,801 $ 365,594 $ 277,051 $ 488,765 Diluted earnings (loss) per share: Continuing operations $ 0.79 $ 1.02 $ 0.59 $ 0.45 $ 0.72 Discontinued operations $ — $ — $ — $ (0.04 ) $ (0.04 ) Total $ 0.79 $ 1.02 $ 0.59 $ 0.41 $ 0.67 As of March 31, 2016 2015 2014 2013 2012 (In thousands) CONSOLIDATED BALANCE SHEET DATA: Working capital (3) $ 1,742,921 $ 1,985,809 $ 1,744,967 $ 1,599,671 $ 2,250,484 Total assets 12,384,981 11,652,891 12,485,035 10,579,107 11,023,194 Total long-term debt, excluding current portion 2,709,389 2,025,970 2,056,233 1,639,580 2,142,842 Shareholders' equity (4) 2,605,530 2,396,250 2,201,679 2,246,758 2,283,979 As of March 31, 2015 2014 2013 2012 2011 (In thousands) CONSOLIDATED BALANCE SHEET DATA:
Working capital(3)
$ 1,984,677 $ 1,743,639 $ 1,598,616 $ 2,246,365 $ 2,225,268 Total assets
11,665,624 12,500,150 10,591,555 11,033,804 11,633,152 Total long-term debt, excluding current portion
2,037,571 2,070,020 1,650,973 2,149,333 2,198,942 Shareholders' equity(4)
2,396,250 2,201,679 2,246,758 2,283,979 2,294,696 (1) For fiscal years 2016, 2015 and 2014, refer to note 15 to the consolidated financial statements for further discussion. Other income, net in the fiscal year 2013 includes the fair value change in warrants to purchase common shares of a certain supplier of $74.4 million and loss on sale of two investments.(1)For fiscal years 2015, 2014 and 2013, refer to note 15 to the consolidated financial statements for further discussion.TheOther income, netother incomein the fiscal year 2012, relates to the $20.0 million gain on sale of certain international entities.
(2) During the fourth quarter of fiscal year 2012, the Company identified certain accounting errors in the statutory-to-U.S. GAAP adjustments at one of its foreign sites that originated in prior annual periods. Management conducted additional procedures and concluded that these errors were isolated to that location. These errors, which primarily understated cost of sales, totaled $10.4 million and $8.0 million for the fiscal years ended March 31, 2011 and 2010 respectively, and were corrected by the Company as an out-of-period adjustment in the fourth quarter of fiscal year 2012. Management believes the impact of this item, to the fiscal year ended March 31, 2012 and to prior fiscal years was not material. As a result of recording these adjustments in the fourth quarter of fiscal year 2012, net income for the year ended March 31, 2012 was reduced by $24.9 million ($0.03 per share). (3) Working capital is defined as current assets less current liabilities. (4) During fiscal year 2014, a previously wholly-owned subsidiary of the Company issued a noncontrolling equity interest to certain third party investors in exchange for $38.6 million in cash for an ownership interest of less than 20% of the outstanding shares in the subsidiary. Accordingly, as of March 31, 2016, 2015 and 2014, the noncontrolling interest has been included on the consolidated balance sheet as a component of total shareholders' equity. Table of ContentsDuring fiscal year 2011, the Company recognized a $13.2 million loss associated with the early redemption of the 6.25% Senior Subordinated Notes and an $11.7 million loss in connection with the divestiture of certain international entities. Additionally, the Company recognized a gain of $18.6 million associated with a sale of an equity investment that was previously fully impaired.(2)During the fourth quarter of fiscal year 2012, the Company identified certain accounting errors in the statutory-to-U.S. GAAP adjustments at one of its foreign sites that originated in prior annual periods. Management conducted additional procedures and concluded that these errors were isolated to that location. These errors, which primarily understated cost of sales, totaled $10.4 million and $8.0 million for the fiscal years ended March 31, 2011 and 2010 respectively, and were corrected by the Company as an out-of-period adjustment in the fourth quarter of fiscal year 2012. Management believes the impact of this item, to the fiscal year ended March 31, 2012 and to prior fiscal years presented was not material. As a result of recording these adjustments in the fourth quarter of fiscal year 2012, net income for the year ended March 31, 2012 was reduced by $24.9 million ($0.03 per share).(3)Working capital is defined as current assets less current liabilities.(4)During fiscal year 2014, a previously wholly-owned subsidiary of the Company issued a non-controlling equity interest to certain third party investors in exchange for $38.6 million in cash for an ownership interest of less than 20% of the outstanding shares in the subsidiary. Accordingly, as of March 31, 2015 and 2014, the non-controlling interest has been included on the consolidated balance sheet as a component of total shareholders' equity.
ITEM 7. MANAGEMENT'S DISCUSSION AND ANALYSIS OF FINANCIAL CONDITION AND RESULTS OF OPERATIONS
This report on Form 10-K contains forward-looking statements within the meaning of Section 21E of the Securities Exchange Act of 1934, as amended, and Section 27A of the Securities Act of 1933, as amended. The words "expects," "anticipates," "believes," "intends," "plans" and similar expressions identify forward-looking statements. In addition, any statements which refer to expectations, projections or other characterizations of future events or circumstances are forward-looking statements. We undertake no obligation to publicly disclose any revisions to these forward-looking statements to reflect events or circumstances occurring subsequent to filing this Form 10-K with the Securities and Exchange Commission. These forward-looking statements are subject to risks and uncertainties, including, without limitation, those discussed in this section and in Item 1A, "Risk Factors." In addition, new risks emerge from time to time and it is not possible for management to predict all such risk factors or to assess the impact of such risk factors on our business. Accordingly, our future results may differ materially from historical results or from those discussed or implied by these forward-looking statements. Given these risks and uncertainties, the reader should not place undue reliance on these forward-looking statements.OVERVIEWOVERVIEWWe are a globally-recognized, leading provider of innovative design, engineering, manufacturing, and supply chain services and solutions that spanfrom sketch to scaletm; from conceptual sketch to full-scale production. We design, build, ship and service complete packaged consumer electronics and industrial products for original equipment manufacturers ("OEMs"), through our activities in the following
business groups:segments: High Reliability Solutions ("HRS"), which is comprised of our medical business includingmedical equipment,consumer health, digital health, disposables, drug delivery, diagnostics, life sciences anddiagnostics;imaging equipment; our automotive business, includingautomotivevehicle electronics,automotive lighting,connectivity, andpower electronics,;clean technologies; and our defense and aerospace businesses, focused on commercial aviation, defensecivil aviation,andhomeland security;military; ConsumerTechnologyTechnologies Group ("CTG"), whichincludes our mobile devices business, including smart phones; our consumerelectronics business, including connected living, wearable electronics including digital sport, game consoles, and connectivity devices; and our high-volume computing business, including various supply chain solutions for notebook personal
computing,computer ("PC"), tablets, and printers; in addition, our CTG group is expanding its business relationships to include supply chain optimization for non-electronics products such as shoes and clothing; Industrial and Emerging Industries ("IEI"), which is comprised of semiconductor and capital equipment, office solutions,test and measurement,household industrial and lifestyle, industrial automation and kiosks, energy and metering, and lighting; and Communications & Enterprise Compute ("CEC"), formerly referred to as Integrated Network Solutions("INS"(“INS”), which includes radio access base stations, remote radio heads, and small cells for wireless infrastructure; optical, routing, broadcasting, and switching products for the data and videonetwork;networks; server and storage platforms for both enterprise and cloud based deployments; next generation storage and security applianceproductsproducts; and rack level solutions, converged infrastructure and software defined product solutions.AsOn July 23, 2015, we introduced our new brand and website to help us more efficiently manage our business opportunities and explain our new product and service offerings. We shortened our brand name from Flextronics to “Flex” to signify that our business continues to evolve past the boundaries and confines ofMarch 31, 2015electronics alone. Our new tag line, “Live Smarter” highlights our belief that all devices are becoming intelligent and that value will ultimately be created in theabove described business groups comprise our reportable“intelligence of things” and the convergence of technologies and digitization of products across multiple industries and market segments.Please refer to note 19 to the consolidated financial statements in Item 8, "Financial Statements and Supplementary Data."Our strategy is to provide customers with a full range of cost competitive, vertically-integrated global supply chain solutions through which we can design, build, ship and service a complete packaged product for our OEM customers. This enables our OEM customers to leverage our supply chain solutions to meet their product requirements throughout the entire product life cycle.Over the past few years, we have seen an increased level of diversification by many companies, primarily in the technology sector. Some companies that have historically identified themselves as software providers, Internet service providers or e-commerce retailers have entered the highly competitive and rapidly evolving technology hardware markets, such as mobile devices, home entertainment and wearable devices. This trend has resulted in a significant change in the manufacturing and supply chain solutions requirements of such companies. While the products have become more complex, the supply chain solutions required by such companies have become more customized and demanding, and it has changed the manufacturing and supply chain landscape significantly.We use a portfolio approach to manage our extensive service offerings. As our OEM customers change the way they go to market, we are able to reorganize and rebalance our business portfolio in order to align with our customers' needs and requirements in an effort to optimize operating results. The objective of our business model is to allow us to be flexible and redeploy and reposition our assets and resources as necessary to meet specific customer's supply chain solutions needs across all of the markets we serve and earn a return on our invested capital above the weighted average cost of that capital.During the past few years, we have made significant efforts to evolve our long-term portfolio towards a higher mix of businesses which possess longer product life cycles and higher margins such as reflected in our IEI and HRS businesses. During the last two fiscal years, we launched several programs broadly across our portfolio of services and in some instances we deployed certain new technologies. Some of these programs have started to yield better results, as demonstrated by our segment operating margin improvementover a comparable base ofwhile our salesduring fiscal year 2015.decreased compared to the prior year. We continue to invest in innovation and we have expanded our design and engineering relationships through our product innovation centers.We believe that our business transformation has strategically positioned us to take advantage of the long-term, future growth prospects for outsourcing of advanced manufacturing capabilities, design and engineering services and after-market services, which remain strong.We are one of the world's largest providers of global supply chain solutions, with revenues of$26.1$24.4 billion in fiscal year2015.2016. We have established an extensive network of manufacturing facilities in the world's major consumer electronics and industrial markets (Asia, the Americas, and Europe) in order to serve the growing outsourcing needs of both multinational and regional OEMs. We design, build, ship, and service consumer electronics and industrial products for our customers through anetwork of over 100 facilities in approximately 30 countries across four continents. As of March 31,
2015,2016, our total manufacturing capacity was approximately24.426.0 million square feet. In fiscal year2015,2016, our net sales in Asia, the Americas and Europe represented approximately50%48%, 34% and16%18%, respectively, of our total net sales, based on the location of the manufacturing site. The following tables set forth net sales and net property and equipment, by country, based on the location of our manufacturing sites and the relative percentages:Fiscal Year Ended March 31, Fiscal Year Ended March 31, Net sales:2015 2014 2013 2016 2015 2014 (In thousands) (In thousands) China
$ 9,550,837 37 % $ 10,521,169 40 % $ 8,132,776 35 % $ 8,471,036 35 % $ 9,550,837 37 % $ 10,521,169 40 % Mexico
3,512,767 13 % 3,565,803 14 % 3,534,067 15 % 3,645,432 15 % 3,512,767 13 % 3,565,803 14 % U.S
2,876,359 11 % 2,829,807 11 % 2,539,460 11 % U.S. 2,767,641 11 % 2,876,359 11 % 2,829,807 11 % Malaysia 2,241,645 9 % 2,300,579 9 % 2,142,437 8 % Brazil
2,474,291 9 % 1,699,209 6 % 1,023,790 4 % 1,839,395 8 % 2,474,291 9 % 1,699,209 6 % Malaysia
2,300,579 9 % 2,142,437 8 % 2,440,902 10 % Other
5,433,083 21 % 5,350,182 21 % 5,898,480 25 % 5,453,736 22 % 5,433,083 21 % 5,350,182 21 % $ 26,147,916 $ 26,108,607 $ 23,569,475 $ 24,418,885 $ 26,147,916 $ 26,108,607 Fiscal Year Ended March 31, Fiscal Year Ended March 31, Property and equipment, net:2015 2014 2016 2015 (In thousands) (In thousands) China
$ 776,914 37 % $ 941,850 41 % $ 789,571 35 % $ 776,914 37 % Mexico
364,435 17 % 326,287 14 % 429,989 19 % 364,435 17 % U.S
314,613 15 % 362,199 16 % U.S. 330,778 15 % 314,613 15 % Malaysia
165,779 8 % 153,194 7 % 159,787 7 % 165,779 8 % Brazil
103,496 5 % 88,867 4 % 121,949 5 % 103,496 5 % Other
366,930 18 % 416,259 18 % 425,559 19 % 366,930 18 % $ 2,092,167 $ 2,288,656 $ 2,257,633 $ 2,092,167 We believe that the combination of our extensive open innovation platform solutions, design and engineering services, advanced supply chain management solutions and services, significant scale and global presence, and industrial campuses in low-cost geographic areas provide us with a competitive advantage and strong differentiation in the market for designing, manufacturing and servicing consumer electronics and industrial products for leading multinational and regional OEMs. Specifically, we have launched multiple product innovation centers ("PIC") focused exclusively on offering our customers the ability to simplify their global product development, manufacturing process, and after sales services, and enable them to meaningfully accelerate their time to market and cost savings.Our operating results are affected by a number of factors, including the following:•
changes in the macro-economic environment and related changes in consumer demand;•the mix of the manufacturing services we are providing, the number and size of new manufacturing programs, the degree to which we utilize our manufacturing capacity, seasonal demand, shortages of components and other factors;•the effects on our business when our customers are not successful in marketing their products, or when their products do not gain widespread commercial acceptance;•our ability to achieve commercially viable production yields and to manufacture components in commercial quantities to the performance specifications demanded by our OEM customers;•the effects on our business due to our customers' products having short product life cycles;•- our customers' ability to cancel or delay orders or change production quantities;
•our customers' decisions to choose internal manufacturing instead of outsourcing for their product requirements;•our exposure to financially troubled customers;•integration of acquired businesses and facilities;•increased labor costs due to adverse labor conditions in the markets we operate; and•changes in tax legislation.We also are subject to other risks as outlined in Item 1A, "Risk Factors."Net sales for fiscal year2015 remained relatively stable2016 declined from the prior year,increasingdecreasing by0.2%6.6% or$39.3 million$1.7 billion to$26.1$24.4 billion.Revenue increased forThe decrease was primarily due to a $1.9 billion decrease in our CTG segment as well as a $0.3 billion decrease in our CEC segment, partially offset by increases in our HRS segment by $0.3 billion and our IEIand HRS business groups, offsetsegment bydecreases for our INS and CTG business groups.$0.2 billion. Our fiscal year20152016 gross profit totaled$1.5$1.6 billion, representing an increase of$105.1$62.7 million, or7.3%4.1%, which reflects a richer mix of business driven primarily from our HRS andourIEI segments and improved operational execution while ramping new customers and programs during fiscal year 2016. Our net incomefrom continuing operationstotaled$600.8$444.1 million, representingan increasea decrease of$235.2$156.7 million, or64.3%26.1%, compared to fiscal year2014. Both gross profit and2015. The decrease in net incomefrom continuing operations increasedduring fiscal year 2016 is primarilyas a result of an improved cost structure and operating efficiencies following our restructuring activities completed in the fiscal years 2014 and 2013 coupled withdue to an increase insales fromstock-based compensation expense, incremental costs associated with ourIEIacquisitions of MCi andHRS business groups which contribute higher margins. Our income before taxes further benefited by the reversal ofNEXTracker, and acustomer contractual obligation in fiscal year 2015 in the amount of $55.0 million, which was accrued in fiscal year 2014, upon execution of an amendmentbad debt expense charge related to thecustomer contract in early fiscal year 2015, which relieved us of this contractual obligation, as discussed in note 15 to the consolidated financial statements in Item 8, "Financial Statements and Supplementary Data".SunEdison bankruptcy announcement.
Cash provided by operationsdecreasedincreased approximately$422.4 million$0.3 billion to $1.1 billion for the fiscal year 2016 compared with $0.8 billion for the fiscal year 2015compared with $1.2 billion for the fiscal year 2014primarily due tounfavorablefavorable changes in operating assets and liabilities. Cash used in investing activities increased approximately $1.2 billion to $1.4 billion for fiscal year 2016 compared with $0.2 billion for fiscal year 2015 primarily from $916.5 million paid for the acquisition of eleven businesses completed during fiscal year 2016. Our average net working capital, defined as accounts receivable, including deferred purchase price receivable from our asset-backed securitization programs plus inventory less accounts payable, as a percentage of annualized salesincreaseddecreased by0.3%0.1% to7.8%7.7%. Our free cash flow, which we define as cash from operating activities less net purchases of property and equipment, was $639.5 million for fiscal year 2016 compared to $554.3 million for fiscal year2015 compared to $701.5 million for fiscal year 2014,2015. The increase in free cash flow is primarily due tothe lowerhigher cash flows from operations offset bylowerhigher net expenditures during fiscal year2015.2016 as we thoughtfully invested in capabilities and capacity in advance of revenue to reinforce our growing automotive, medical, and energy businesses, as well as support our innovation and sketch-to-scale offering. Refer to the Liquidity and Capital Resources section for the free cash flows reconciliation to our most directly comparable GAAP financial measure of cash flows from operations. Cashused inprovided by financing activities amounted to$516.0$249.6 million during fiscal year20152016 which was primarily the result of net proceeds from bank borrowings andincludedlong-term debt of $694.5 million mainly resulting from our new debt issuance discussed further in note 7 to the consolidated financial statements, offset by the repurchases of approximately38.737.9 million ordinary shares at an aggregate purchase value of$415.9$420.3 million.CRITICAL ACCOUNTING POLICIES AND ESTIMATESThe preparation of financial statements in conformity with accounting principles generally accepted in the United States of America ("U.S. GAAP" or "GAAP") requires management to make estimates and assumptions that affect the reported amounts of assets and liabilities, the disclosure of contingent assets and liabilities at the date of the financial statements, and the reported amounts of revenues and expenses during the reporting period. Actual results may differ from those estimates and assumptions.We believe the following critical accounting policies affect our more significant judgments and estimates used in the preparation of our consolidated financial statements. For further discussion of our significant accounting policies, refer to note 2 to the consolidated financial statements in Item 8, "Financial Statements and Supplementary Data."Revenue Recognition
We recognize manufacturing revenue when we ship goods or the goods are received by our customer, title and risk of ownership have passed, the price to the buyer is fixed or determinable and recoverability is reasonably assured. Generally, there are no formal substantive customer acceptance requirements or further obligations related to manufacturing services. If such requirements or obligations exist, then we recognize the related revenues at the time when such requirements are completed and the obligations are fulfilled. Some of our customer contracts allow us to recover certain costs related to manufacturing services that are over and above the prices we charge for the related products. We determine the amount of costs that are recoverable based on historical experiences and agreements with those customers. Also, certain customer contracts may contain certain commitments and obligations that may result in additional expenses or decrease in revenue. We accrue for these commitments and obligations based on facts and circumstances and contractual terms. We also make provisions for estimated sales returns and other adjustments at the time revenue is recognized based upon contractual terms and an analysis of historical returns. Provisions for sales returns and other adjustments were not material to our consolidated financial statements for any of the periods presented.We provide a comprehensive suite of services for our customers that range from advanced product design to manufacturing and logistics to after-sales services. We recognize service revenue when the services have been performed, andthe related costs are expensed as incurred. Our net sales for services were less than 10% of our total sales for all periods presented, and accordingly, are included in net sales in the consolidated statements of operations.Customer Credit RiskWe have an established customer credit policy through which we manage customer credit exposures through credit evaluations, credit limit setting, monitoring, and enforcement of credit limits for new and existing customers. We perform ongoing credit evaluations of our customers' financial condition and make provisions for doubtful accounts based on the outcome of those credit evaluations. We evaluate the collectability of accounts receivable based on specific customer circumstances, current economic trends, historical experience with collections and the age of past due receivables. To the extent we identify exposures as a result of credit or customer evaluations, we also review other customer related exposures, including but not limited to inventory and related contractual obligations.On April 21, 2016, one of our customers, SunEdison, Inc. (together with certain of its subsidiaries, "SunEdison"), filed a petition for reorganization under bankruptcy law. For the fiscal year ended March 31, 2016, we recognized approximately $61.0 million in charges for provisions of accounts receivable associated with our outstanding SunEdison receivables. The estimates underlying our recorded provisions, as well as consideration of other potential customer bankruptcy-related contingencies associated with the SunEdison bankruptcy proceedings, are based on the facts currently known to us. If these facts change, the provisions are subject to change or we could recognize additional charges, either of which could be material.
Restructuring ChargesWe recognize restructuring charges related to our plans to close or consolidate excess manufacturing and administrative facilities and to realign our corporate cost structure. In connection with these activities, we recognize restructuring charges for employee termination costs, long-lived asset impairment and other exit-related costs.The recognition of these restructuring charges requires that we make certain judgments and estimates regarding the nature, timing and amount of costs associated with the planned exit activity. To the extent our actual results differ from our estimates and assumptions, we may be required to revise the estimates of future liabilities, requiring the recognition of additional restructuring charges or the reduction of liabilities already recognized. Such changes to previously estimated amounts may be material to the consolidated financial statements. At the end of each reporting period, we evaluate the remaining accrued balances to ensure that no excess accruals are retained and the utilization of the provisions are for their intended purpose in accordance with developed exit plans.Refer to note 14 to the consolidated financial statements in Item 8, "Financial Statements and Supplementary Data" for further discussion of our restructuring activities.Carrying Value of Long-Lived Assets
We review property and equipment and acquired amortizable intangible assets for impairment at least annually and whenever events or changes in circumstances indicate that the carrying amount of the asset may not be recoverable. An impairment loss is recognized when the carrying amount of these long-lived assets exceeds their fair value. Recoverability of property and equipment and acquired amortizable intangible assets are measured by comparing their carrying amount to the projected cash flows the assets are expected to generate. If such assets areconsidereddetermined to be impaired, the impairment loss recognized, if any, is the amount by which the carrying amount of the property and equipment and acquired amortizable intangible assets exceeds fair value. Our judgments regarding projected cash flows for an extended period of time and the fair value of assets may be impacted by changes in market conditions, general business environment and other factors. To the extent our estimates relating to cash flows and fair value of assets change adversely we may have to recognize additional impairment charges in the future.Goodwill is tested for impairment on an annual basis and whenever events or changes in circumstances indicate that the carrying amount of goodwill may not be recoverable. Recoverability of goodwill is measured at the reporting unit level by comparing the reporting unit's carrying amount, including goodwill, to the fair value of the reporting unit, which is measured based upon, among other factors, market multiples for comparable companies as well as a discounted cash flow analysis.During the fourth quarter of fiscal year 2015, the Company identified four reportable operating segments: HRS, CTG, IEI and INS and concluded these same four segments also represented its reporting units.The Company performed its goodwill impairment assessment on January 1,20152016 and determined that no impairment existed as of the date of the impairment test because the fair value of each reporting unit exceeded its carrying value.Inventory ValuationOur inventories are stated at the lower of cost (on a first-in, first-out basis) or market value. Our industry is characterized by rapid technological change, short-term customer commitments and rapid changes in demand. We purchase our inventory based on forecasted demand, and we estimate write downs for excess and obsolete inventory based on our regular reviews of inventory quantities on hand, and the latest forecasts of product demand and production requirements from our customers. Ifactual market conditions or our customers' product demands are less favorable than those projected, additional write downs may be required. In addition, unanticipated changes in the liquidity or financial position of our customers and/or changes in economic conditions may require additional write downs for inventories due to our customers' inability to fulfill their contractual obligations with regard to inventory procured to fulfill customer demand.Contingent LiabilitiesWe may be exposed to certain liabilities relating to our business operations, acquisitions of businesses and assets and other activities. We make provisions for such liabilities when it is probable that the settlement of the liability will result in an outflow of economic resources or the impairment of an asset. We make these assessments based on facts and circumstances that may change in the future resulting in additional expenses.Income TaxesOur deferred income tax assets represent temporary differences between the carrying amount and the tax basis of existing assets and liabilities, which will result in deductible amounts in future years, including net operating loss carry forwards. Based on estimates, the carrying value of our net deferred tax assets assumes that it is more likely than not that we will be able to generate sufficient futuretaxable income in certain tax jurisdictions to realize these deferred income tax assets. Our judgments regarding future profitability may change due to future market conditions, changes in U.S. or international tax laws and other factors. If these estimates and related assumptions change in the future, we may be required to increase or decrease our valuation allowance against deferred tax assets previously recognized, resulting in additional or lesser income tax expense.
We are regularly subject to tax return audits and examinations by various taxing jurisdictions and around the world, and there can be no assurance that the final determination of any tax examinations will not be materially different than that which is reflected in our income tax provisions and accruals. Should additional taxes be assessed as a result of a current or future examination, there could be a material adverse effect on our tax position, operating results, financial position and cash flows. Refer to note 13 to the consolidated financial statements in Item 8, "Financial Statements and Supplementary Data" for further discussion of our tax position.Translation of Foreign CurrenciesThe financial position and results of operations for certain of our subsidiaries are measured using a currency other than the U.S. dollar as their functional currency. Accordingly, all assets and liabilities for these subsidiaries are translated into U.S. dollars at the current exchange rates as of the respective balance sheet dates. Revenue and expense items are translated at the average exchange rates prevailing during the period. Cumulative gains and losses from the translation of these subsidiaries' financial statements are reported as other comprehensive loss, a component of shareholders' equity. Foreign exchange gains and losses arising from transactions denominated in a currency other than the functional currency of the entity involved, and re-measurement adjustments for foreign operations where the U.S. dollar is the functional currency, are included in operating results.RESULTS OF OPERATIONSThe following table sets forth, for the periods indicated, certain statements of operations data expressed as a percentage of net sales. The financial information and the discussion below should be read in conjunction with the consolidated financial statements and notes thereto included in Item 8, "Financial Statements and Supplementary Data." The data below, and discussion that follows, represents our results from operations.Fiscal Year Ended
March 31,2015 2014 2013 Net sales
100.0 % 100.0 % 100.0 % Cost of sales
94.1 94.3 94.2 Restructuring charges
— 0.2 0.9 Gross profit
5.9 5.5 4.9 Selling, general and administrative expenses
3.2 3.4 3.4 Intangible amortization
0.1 0.1 0.1 Restructuring charges
— 0.1 0.1 Other charges (income), net
(0.2 ) 0.2 (0.2 ) Interest and other, net
0.2 0.2 0.2 Income from continuing operations before income taxes
2.6 1.5 1.3 Provision from income taxes
0.3 0.1 0.1 Income from continuing operations
2.3 1.4 1.2 Loss from discontinued operations, net of tax
— — (0.1 ) Net income
2.3 % 1.4 % 1.1 % Fiscal Year Ended
March 31,2016 2015 2014 Net sales 100.0 % 100.0 % 100.0 % Cost of sales 93.4 94.1 94.3 Restructuring charges — — 0.2 Gross profit 6.6 5.9 5.5 Selling, general and administrative expenses 3.9 3.2 3.4 Intangible amortization 0.3 0.1 0.1 Restructuring charges — — 0.1 Other charges (income), net 0.2 (0.2 ) 0.2 Interest and other, net 0.3 0.2 0.2 Income before income taxes 1.9 2.6 1.5 Provision for income taxes — 0.3 0.1 Net Income 1.9 % 2.3 % 1.4 % Net sales
Net sales during fiscal year 2016 totaled $24.4 billion, representing a decrease of $1.7 billion, or 6.6%, from $26.1 billion during fiscal year 2015. During fiscal year 2016, net sales decreased $1.2 billion in Asia, $0.6 billion in the Americas, and $14.7 million in Europe.Net sales during fiscal year 2015 totaled $26.1 billion, representing an increase of$39$39.3 million, or 0.2%, from $26.1 billion during fiscal year 2014. During fiscal year 2015, net sales increased $0.7 billion in the Americas and $0.1 billion in Europe, offset by a decrease of $0.8 billion in Asia.Net sales during fiscal year 2014 totaled $26.1 billion, representing an increase of $2.5 billion, or 10.8%, from $23.6 billion during fiscal year 2013. During fiscal year 2014, net sales increased $2.0 billion in Asia and $0.9 billion in the Americas, offset by a decrease of $0.4 billion in Europe.The following table sets forth net sales bybusiness groupssegments and their relative percentages. Historical information has been recast to reflect realignment of customers and/or products betweenbusiness groups:segments:Fiscal Year Ended March 31, Business groups:2015 2014 2013 (In thousands) Integrated Network Solutions
$ 9,191,211 35 % $ 9,688,023 37 % $ 9,935,302 42 % Consumer Technology Group
8,940,043 34 % 9,357,635 36 % 7,036,903 30 % Industrial & Emerging Industries
4,459,351 17 % 3,787,838 14 % 3,762,508 16 % High Reliability Solutions
3,557,311 14 % 3,275,111 13 % 2,834,762 12 % $ 26,147,916 $ 26,108,607 $ 23,569,475 Fiscal Year Ended March 31, Segments: 2016 2015 2014 (In thousands) Communications & Enterprise Compute $ 8,841,642 36 % $ 9,191,211 35 % $ 9,688,023 37 % Consumer Technologies Group 6,997,526 29 % 8,940,043 34 % 9,357,635 36 % Industrial & Emerging Industries 4,680,718 19 % 4,459,351 17 % 3,787,838 15 % High Reliability Solutions 3,898,999 16 % 3,557,311 14 % 3,275,111 13 % $ 24,418,885 $ 26,147,916 $ 26,108,607 Net sales during fiscal year 2016 decreased $1.9 billion or 21.7% in the CTG segment and $349.6 million or 3.8% in the CEC segment. The drop in CTG was due to a decline in demand from our largest customer in our mobile business offset by expansion across wearables, connected home and gaming markets. The decrease in CEC is primarily attributable to lower sales within our server and storage business. These decreases were partially offset by a $341.7 million or 9.6% increase in sales from our HRS segment, and by a $221.4 million or 5.0% increase in sales from our IEI segment. These increases in HRS and IEI were attributable to an increase across multiple product categories and customers, most notably in our household, energy, automotive, and medical businesses primarily as a result of our strategic acquisitions in both segments referred to below.Net sales during fiscal year 2015 increased $0.7 billion or 17.7% in the IEIbusiness groupsegment and $0.3 billion or 8.6% in the HRSbusiness group.segment. The increase in revenue from our IEIbusinesssegment is primarily attributable to a broad increase across multiple product categories and customers, most notably in our energy and our household industrial and lifestyle businesses. The increased revenue from our HRSbusinesssegment is primarily due to a higher demand from our medical customers, and greater sales to our automotive customers as a result of an increased use of electronics throughout vehicles in areas such as in-car connectivity, LED lighting, and power management. The increase in thesebusiness groupssegments was partially offset by a $0.5 billion or 5.1% decrease in sales from ourINS business,CEC segment, and by a $0.4 billion or 4.5% decrease in sales from our CTGbusiness.segment. The decrease in revenue in ourINS businessCEC segment is primarily attributable to broad softness in our telecom businesses directly due to decreased demand for our customer products from North American carriers. The decrease in revenue in our CTGbusinesssegment is primarily due to softness in our personal computing business.Net sales during fiscal year 2014 increased (i) $2.3 billion or 33.0% in the CTG business group, (ii) $0.4 billion or 15.5% in the HRS business group and (iii) less than $0.1 billion or 0.7% in the IEI business group. The increase in revenues from the CTG business was primarily as a result of our acquisition of certain manufacturing operations from Google's Motorola Mobility LLC (Motorola Mobility) during the first quarter of fiscal year 2014, which were partially offset by revenue reductions due to our disengagement with Blackberry during fiscal year 2013 which contributed revenues of $0.9 billion in that year. The increase in revenue from our HRS business was attributable to our continued expansion with existing and new customers and our acquisition of Saturn Electronics and Engineering Inc. during the last quarter of fiscal year 2013. The increase in these business groups was partially offset by a decrease in sales from our INS business group amounting to $0.2 billion or 2.5% primarily attributable to broad softness in our connected home and telecom businesses, and server, storage and networking businesses versus the prior year.Our ten largest customers during fiscal years 2016, 20152014and20132014 accounted for approximately50%46%,52%50% and47%52% of net sales, respectively. During fiscal years 2016, 2015 and 2014, only Lenovo/MotorolaMobility(including net sales from its former parent, Google, up to the point in time when Motorola Mobility was acquired by Lenovo and including net sales from Lenovo thereafter), which is reflected in ourCTG
business group,segment, accounted for greater than 10% of net sales.No customer accountedGoing forward, we do not expect Motorola Mobility to account for greater than 10% of our netsales during fiscal year 2013.sales.
Gross profitGross profit is affected by a number of factors, including the number and size of new manufacturing programs, product mix, component costs and availability, product life cycles, unit volumes, pricing, competition, new product introductions, capacity utilization and the expansion and consolidation of manufacturing facilities. The flexible design of our manufacturing processes allows us to build a broad range of products in our facilities and better utilize our manufacturing capacity. In the cases of new programs, profitability normally lags revenue growth due to product start-up costs, lower manufacturing program volumes in the start-up phase, operational inefficiencies, and under-absorbed overhead. Gross margin for these programs often improves over time as manufacturing volumes increase, as our utilization rates and overhead absorption improve, and as we increase the level of manufacturing services content. As a result of these various factors, our gross margin varies from period to period.Gross profit during fiscal year 2016 increased $62.7 million to $1.6 billion from $1.5 billion during fiscal year 2015 reflecting a richer mix of business and improved operational execution while ramping new customers and programs during fiscal year 2016. Gross margin increased to 6.6% of net sales in fiscal year 2016 as compared with 5.9% of net sales in fiscal year 2015. Gross margins improved 70 basis points in fiscal year 2016 compared to that of fiscal year 2015 due to proportionate increased share of our total revenue attributable to our HRS and IEI segments coupled with their increased profitability primarily driven by our acquisitions of Mirror Controls International ("MCi") and NEXTracker Inc. ("NEXTracker").Gross profit during fiscal year 2015 increased $105.1 million to $1.5 billion from $1.4 billion during fiscal year 2014. Gross margin increased to 5.9% of net sales in fiscal year 2015 as compared with 5.5% of net sales in fiscal year 2014. Gross margins improved 40 basis points in fiscal year 2015 compared to that of fiscal year 2014 due to restructuring charges in fiscal year 2014 in the amount of $58.6 million, or 20 basis points included in cost of sales. There were no restructuring charges in fiscal year 2015. Further, gross margin in fiscal year 2015 improved as a result of increased revenue from our IEI and HRSbusinessessegments as a percentage of our total revenues overall, which yield higher margins than our CTG andINS businesses,CEC segments, and better than expected execution on certain products, some of which were reaching end of life.Gross profitSegment incomeAn operating segment's performance is evaluated based on its pre-tax operating contribution, or segment income. Segment income is defined as net sales less cost of sales, and segment selling, general and administrative expenses, and does not include amortization of intangibles, stock based compensation, restructuring charges, certain bad debt charges, other charges (income), net and interest and other, net. A portion of amortization and depreciation is allocated to the respective segment together with other general corporate research and development and administrative expenses.The following table sets forth segment income and margins. Historical information has been recast to reflect realignment of customers and/or products between segments:Fiscal Year Ended March 31, 2016 2015 2014 (In thousands) Segment income & margin: CEC $ 265,076 3.0 % $ 257,323 2.8 % $ 259,329 2.7 % CTG 163,677 2.3 % 218,251 2.4 % 125,171 1.3 % IEI 157,588 3.4 % 131,956 3.0 % 127,085 3.4 % HRS 294,635 7.6 % 227,595 6.4 % 221,402 6.8 % Corporate and Other (89,219 ) (83,988 ) (68,475 ) Total segment income 791,757 3.2 % 751,137 2.9 % 664,512 2.5 % Reconciling items: Intangible amortization 65,965 32,035 28,892 Stock-based compensation 77,580 50,270 40,439 Restructuring charges (2) — — 75,311 Bad debt charge (1) 61,006 — — Other charges (income), net 47,738 (53,233 ) 57,512 Interest and other, net 84,793 51,410 61,904 Income before income taxes $ 454,675 $ 670,655 $ 400,454 (1) On April 21, 2016, one of our customers, SunEdison, filed a petition for reorganization under bankruptcy law. During the fiscal year ended March 31, 2016, we recognized a bad debt reserve charge of $61.0 million associated with our outstanding SunEdison receivables. This charge is included in selling, general and administrative expenses in the consolidated statement of operations but is excluded from the measurement of the Company's operating segment's performance. Refer to note 2 to the consolidated financial statements for additional information regarding this charge. (2) During the fiscal year ended March 31, 2014, the Company recognized restructuring charges of approximately $75.3 million. The costs associated with these restructuring activities include employee severance, other personnel costs, non-cash impairment charges on equipment no longer in use and to be disposed of, and other exit related costs due to facility closures or rationalizations. Refer to note 14 to the consolidated financial statements for additional information regarding these charges. CEC segment margin increased 20 basis points, for fiscal year 2016, from 2.8% during fiscal year 2015. The improvements are driven by favorable product mix changes from new program offerings, higher utilization levels and strong operational execution across multiple customers and facilities, offset by incremental engineering spend as we continue to invest in expanding our capabilities. CEC segment margin increased 10 basis points, for fiscal year 2015, from 2.7% during fiscal year 2014,increased $274.0 million to $1.4 billionalso as a result of favorable product mix changes during fiscal 2015.CTG segment margin slightly decreased 10 basis points for fiscal year 2016, from$1.2 billion2.4% during fiscal year2013. Gross2015, due primarily to the soft macro economy, notably in Brazil, which impacted consumer business, partially offset by a portfolio shift within the CTG product mix focusing on higher margin consumer electronic products. CTG segment margin increasedto 5.5% of net sales in110 basis points for fiscal year 2015, from 1.3% during fiscal year 2014,as comparedprimarily attributable to a portfolio shift within the CTG product mix coupled with4.9%better execution on certain products some ofnet sales inwhich were going end of life.IEI segment margin increased 40 basis points to 3.4% for fiscal year2013. Gross2016, from 3.0% during fiscal year 2015. This is primarily due to strong operational execution and higher utilization levels coupled with contribution from our NEXTracker acquisition that contributed higher marginsimproved 60for the second half of fiscal year 2016. Fiscal year 2015 also included underperformance of certain programs, delayed and inefficient ramps for new programs. IEI segment margin decreased 40 basis pointsinto 3.0% for fiscal year 2015, from 3.4% during fiscal year 2014compareddue tothatoperational challenges and underperformance of certain programs during fiscal year 2015 as mentioned above.HRS segment margin increased 120 basis points to 7.6% for fiscal year 2016, from 6.4% during fiscal year 2015. The improvements are primarily due to additional flow through from the increase in revenue from new programs and contribution from our MCi acquisition starting in our second quarter of fiscal year2013 primarily2016 in addition to greater value-added business engagements due torestructuring chargesgreater design and engineering solutions as part of$58.6 million, or 20our sketch to scaletm offering. HRS segment margindecreased 40 basis pointsinto 6.4% for fiscal year2014 as compared to $215.8 million, or 90 basis points, in2015, from 6.8% for fiscal year2013 included in cost2014 primarily as a result ofsales.comparatively higher ramp costs for new programs during fiscal 2015.
Restructuring chargesIn response to a challenging macroeconomic environment, we initiated certain restructuring activities in fiscal year 2014and 2013to improve our operational efficiencies by reducing excess workforce and capacity. There were no material restructuring activities during fiscalyearyears 2016 and 2015. The fiscal year 2014 restructuring activities were intended to realign our corporate cost structure, and rationalize our global manufacturing capacity and infrastructure which will further shift manufacturing capacity to locations with higher efficiencies.During fiscal year 2014, we recognized $75.3 million of pre-tax restructuring charges comprised of $73.4 million of cash charges predominantly related to employee severance costs and $1.9 million of non-cash charges related to asset impairment. The restructuring charges by geographic region amounted to $34.5 million in Asia, $24.9 million in the Americas and $15.9 million in Europe. We classified $58.6 million of the charges incurred in fiscal year 2014 as a component of cost of sales and $16.7 million as a component of selling, general and administrative expenses.During fiscal year 2013, we recognized $227.4 million of pre-tax restructuring charges comprised of $123.0 million of cash charges predominantly related to employee severance costs and $104.4 million of non-cash charges primarily related to asset impairment and other exit charges. The restructuring charges by geographic region amounted to $108.4 million in Asia, $91.8 million in Europe and$27.2 million in the Americas. We classified $215.8 million of these charges as a component of cost of sales and $11.6 million of these charges as a component of selling, general and administrative expenses during fiscal year 2013.As of March 31, 2014 all plans had been completed. As of March 31, 2016, accrued costs relating to restructuring charges were $13.2 million of which $2.5 million was classified as a current obligation. As of March 31, 2015, accrued costs relating to restructuring charges were $15.1 million of which $3.5 million was classified as a current obligation.
Refer to note 14 to the consolidated financial statements in Item 8, "Financial Statements and Supplementary Data" for further discussion of our restructuring activities.Selling, general and administrative expensesSelling, general and administrative expenses ("SG&A") totaled $954.9 million or 3.9% of net sales, during fiscal year 2016, compared to $844.5 million, or 3.2% of net sales, during fiscal year 2015, increasing by $110.4 million or 13.1%. The increase in SG&A in dollars and as a percentage of net sales is primarily the result of an increase in costs associated with research, development and design activities, as we continued to deploy resources to meet the needs of our customers and explore new product innovations, increases in stock-based compensation expense, incremental costs associated with our acquisitions of MCi and NEXTracker both of which drive a higher proportional SG&A level, and a bad debt reserve charge associated with our outstanding SunEdison receivables of $61.0 million as a result of SunEdison's bankruptcy filing.SG&A totaled $844.5 million or 3.2% of net sales, during fiscal year 2015, compared to $874.8 million, or 3.4% of net sales, during fiscal year 2014, decreasing by $30.3 million or 3.5%. The decrease in SG&A in dollars and as a percentage of net sales is primarily the result of our cost reduction measures that we undertook inthe currentfiscal year 2015 and rationalization efforts carried out in fiscal year 2014, partially offset by an approximate $8.9 million increase in non-cash stock-based compensation.SG&A totaled $874.8We recognized research and development costs primarily related to our design and innovations businesses of $75.5 million,or 3.4%$35.2 million, and $30.0 million for the fiscal years ended March 31, 2016, 2015 and 2014, respectively.Intangible amortizationAmortization ofnet sales, duringintangible assets in fiscal year2014, compared2016 increased by $33.9 million to$805.2$66.0 millionor 3.4% of net sales, duringfrom $32.0 million in fiscal year2013, increasing by $69.6 million or 8.6%. The increase in SG&A in dollars was2015, primarilyattributableas a result of incremental amortization expense on intangibles assets relating to our acquisitionsinvestments in our supply chain solutions, enhancement of our selling and business development activities and incremental corporate infrastructure to supportcompleted during theincreasing complexities of our business.Intangible amortizationfiscal year 2016.
Amortization of intangible assets in fiscal year 2015 increased by $3.1 million to $32.0 million from $28.9 million in fiscal year 2014, primarily as a result ofnewcustomer-related intangibles in connection with our acquisitions and the purchase of certain technology rights during the fiscal year 2015.Amortization of intangible assets in fiscal year 2014 decreased by $0.6 million to $28.9 million from $29.5 million in fiscal year 2013.Other charges (income), netDuring fiscal year 2016, we recognized other charges of $47.7 million primarily due to a $26.8 million loss on the disposition of a non-strategic Western European manufacturing facility which included a non cash foreign currency translation loss of $25.3 million, and $21.8 million from the impairment of a non-core investment. These were offset by a non-cash foreign currency translation gain of $4.2 million, as further discussed in note 15 to the consolidated financial statements.During fiscal year 2015, we recognized other income of $53.2 million principally as a result of the reversal of a contractual obligation with a certain customer recognized during the fiscal year 2014 in the amount of $55.0 million. We executed an amendment to the customer contract during fiscal year 2015 which relieved us of commitment performance as was defined in an existing customer manufacturing agreement. We also recognized an $11.0 million loss in connection with thedisposition of a manufacturing facility in Western Europe. Further, we recognized a net gain for the sale of a certain investment, which primarily comprises the balance for other income in fiscal year 2015 net of the above items.During fiscal year 2014, we recognized other charges of $57.5 million primarily due to the contractual obligation of $55.0 million discussed above. Additionally, we exercised warrants to purchase common shares of a supplier and sold the underlying shares for a loss of $7.1 million,as further discussed below,offset by a gain of $4.6 million recognized in connection with the sales of certain investments.DuringInterest and other, netInterest and other, net was $84.8 million during fiscal year2013, we recognized2016 compared to $51.4 million during fiscal year 2015. The increase in interest and other,incomenet of$65.2$33.4 million was primarily due toan unrealized gaina $23.5 million increase of interest expense from thefair value adjustment of $74.44.750% Notes issued during the current year as further discussed in note 7 to the consolidated financial statements, as well as $8.0 million ofwarrants we held to purchase common sharesacquisition-related costs incurred during fiscal year 2016, primarily for our acquisition ofa supplier. As discussed above we sold the underlying shares in 2014 for total proceeds of $67.3 million. The gain was offset by various losses from sale, or direct impairments ofMCi.certain non-core equity investments and notes receivable, and losses from sales of international entities that are individually immaterial.Interest and other, netInterest and other, net was $51.4 million during fiscal year 2015 compared to $61.9 million during fiscal year 2014. The decrease in interest and other, net
ofwas primarily due to a gain associated with minority interest from an investment, an increase in foreign currency gains relating to the Chinese RMB, and a decrease in interest expense as a result of refinancing of certain debt facilities during the latter part ofthefiscal year 2014.Interest and other, net was $61.9 million during fiscal year 2014, compared to $56.3 million during fiscal year 2013, an increase of $5.6 million that was primarily due to the refinancing of our lower rate floating interest debt with higher rate fixed interest Notes in February of fiscal year 2013. Additionally, the gains on foreign currency transactions attributable to our cross-border foreign currency transactions and the revaluation of RMB denominated net asset positions of our U.S. dollar functional currency sites based in China decreased in fiscal year 2014.(1)Fiscal(1)The goodwill generated from the Company's business combinations completed during the fiscal years 2015 and 2014 are primarily related to value placed on the employee workforce, service offerings and capabilities and expected synergies. The goodwill is not deductible for income tax purposes. Refer to the discussion of the Company's business acquisitions in note 17.(2)Includes adjustments based on management's estimates resulting from their review and finalization of the valuation of assets and liabilities acquired through certain business combinations completed in a period subsequent to the respective acquisition. These adjustments were not individually, nor in the aggregate, significant to the Company.(3)Goodwill is allocated to each of the reporting units based on the relative fair values assessed in conjunction with the goodwill impairment testing conducted as of January 1, 2015.(1)Options to purchase ordinary shares of 6.2 million, 17.1 million and 20.6 million during fiscal years 2015, 2014 and 2013, respectively, and share bonus awards of less than 0.1 million and 0.3 million during fiscal years 2015 and 2013, respectively, were excluded from the computation of diluted earnings per share due to their anti-dilutive impact on the weighted average ordinary shares equivalents. There were no anti-dilutive share bonus awards in fiscal year 2014.(1)Earnings per share are computed independently for each quarter presented; therefore, the sum of the quarterly earnings per share may not equal the total earnings per share amounts for the fiscal year.(a)Evaluation of Disclosure Controls and ProceduresManagement's Annual Report on Internal Control over Financial Reporting(c)Attestation Report of the Registered Public Accounting Firm(d)Changes in Internal Control Over Financial Reporting(a)Documents filed as part of this annual report on Form 10-K:*This exhibit is furnished with this Annual Report on Form 10-K, is not deemed filed with the Securities and Exchange Commission, and is not incorporated by reference into any filing of Flextronics International Ltd. under the Securities Act of 1933, as amended, or the Securities Exchange Act of 1934, as amended, whether made before or after the date hereof and irrespective of any general incorporation language contained in such filing.†Management contract, compensatory plan or arrangement.*This exhibit is furnished with this Annual Report on Form 10-K, is not deemed filed with the Securities and Exchange Commission, and is not incorporated by reference into any filing of Flextronics International Ltd. under the Securities Act of 1933, as amended, or the Securities Exchange Act of 1934, as amended, whether made before or after the date hereof and irrespective of any general incorporation language contained in such filing.†Management contract, compensatory plan or arrangement.
Income taxesCertain of our subsidiaries have, at various times, been granted tax relief in their respective countries, resulting in lower income taxes than would otherwise be the case under ordinary tax rates. The consolidated effective tax rates were10.4%2.3%,8.7%10.4% and8.0%8.7% for the fiscal years 2016, 20152014and2013,2014, respectively. The effective rate varies from the Singapore statutory rate of 17.0% in each year as a result of the following items:Fiscal Year Ended March 31, 2016 2015 2014 Income taxes based on domestic statutory rates 17.0 % 17.0 % 17.0 % Effect of tax rate differential (16.1 ) (12.1 ) (17.1 ) Intangible amortization 2.4 0.8 1.2 Change in liability for uncertain tax positions (3.0 ) 4.4 (0.5 ) Change in valuation allowance 0.2 0.4 6.7 Other 1.8 (0.1 ) 1.4 Provision for income taxes 2.3 % 10.4 % 8.7 % The variation in our effective tax rate each year is primarily a result of recognition of earnings indifferentforeign jurisdictionsoperating loss carry forwards, incomewhich are taxed at rates lower than the Singapore statutory rate including the effect of taxcredits, previously established valuation allowancesholidays and tax incentives we received primarily fordeferredour subsidiaries in China, Malaysia and Israel of $6.6 million, $9.8 million and $15.2 million in fiscal years 2016, 2015 and 2014, respectively. Additionally, our effective taxassets,rate is impacted by changes in our liabilities for uncertain tax positionsas well as becauseofthe effect($13.7) million, $29.7 million, and ($2.2) million and changes in our valuation allowances on deferred tax assets ofcertain tax holidays$1.0 million, $2.5 million andincentives granted to our subsidiaries primarily$26.8 million inChina, Malaysia, Israel,fiscal years 2016, 2015 andSingapore.2014, respectively. We generate most of our revenues and profits from operations outside of Singapore.We are regularly subject to tax return audits and examinations by various taxing jurisdictions and around the world, and there can be no assurance that the final determination of any tax examinations will not be materially different than that which is reflected in our income tax provisions and accruals. Should additional taxes be assessed as a result of a current or future examinations, there could be a material adverse effect on our tax position, operating results, financial position and cash flows.We provide a valuation allowance against deferred tax assets that in our estimation are not more likely than not to be realized. During fiscal year2015,2016, weeliminatedreleased valuation allowances totaling$55.0$20.3 million primarily related to our operations inBrazil, Mexico, Mauritius and ChinaMalaysia as these amounts were deemed to be more likely than not to berealized.realized due to the increased profitability of the Malaysian subsidiary during the past three fiscal years following a period of losses as well as continued forecasted profitability of that subsidiary. In addition, we had a $43.0 million credit to tax expense related to the partial release of valuation allowance on our US operations due to the recording of deferred tax liabilities related to intangibles acquired during fiscal year 2016. However, these valuation allowance eliminations were offset by other current period valuation allowance movements primarily related to current period valuation allowance additions due to increased deferred tax assets related to current period losses in legal entities with existing full valuation allowance positions, and to a lesser extent, current period changes in valuation
allowance positions due to increased negative evidence during the period in legal entities which did not previously have valuation allowance recorded.See note 13, "Income Taxes," to the consolidated financial statements included in Item 8, "Financial Statements and Supplementary Data" for further discussion.LIQUIDITY AND CAPITAL RESOURCESAs of March 31,2015,2016, we had cash and cash equivalents of $1.6 billion and bank and other borrowings of$2.1$2.8 billion. We have a $1.5 billion revolving credit facility, under which we had no borrowings outstanding as of March 31,2015.2016.
Our cash balances are held in numerous locations throughout the world. As of March 31,2015,2016, over half of our cash and cash equivalents were held by foreign subsidiaries outside of Singapore. Although substantially all of the amounts held outside of Singapore could be repatriated, under current laws, a significant amount could be subject to income tax withholdings. We provide for tax liabilities on these amounts for financial statement purposes, except for certain of our foreign earnings that areconsidered indefinitely reinvested outside of Singapore (approximately
$800.0$916.0 million as of March 31,2015)2016). Repatriation could result in an additional income taxpayment,payment; however, our intent is to permanently reinvest these funds outside of Singapore and our current plans do not demonstrate a need to repatriate them to fund our operations in jurisdictions outside of where they are held. Where local restrictions prevent an efficient intercompany transfer of funds, our intent is that cash balances would remain outside of Singapore and we would meet our liquidity needs through ongoing cash flows, external borrowings, or both.Fiscal Year 2016Cash provided by operating activities was $1.1 billion during fiscal year 2016. This resulted primarily from $444.1 million of net income for the period plus $625.4 million of non-cash charges such as depreciation, amortization, other impairment charges, provision for doubtful accounts and stock-based compensation expense that are included in the determination of net income. Depreciation expense comprised $425.7 million of those non-cash charges, which was relatively consistent with our normal annual run rate of approximately $425.0 million. We generated $66.9 million in cash as a result of changes in our operating assets and liabilities, driven primarily by a $423.6 million reduction in accounts receivable due to improved collection efforts and lower business levels, offset by a $365.1 million reduction in accounts payable. Net working capital ("NWC"), defined as net accounts receivable, including deferred purchase price receivables, plus inventory less accounts payable decreased by $37.7 million primarily due to lower business levels during the fourth quarter of fiscal year 2016 as compared to the same quarter of fiscal year 2015, which resulted in slightly lower levels of investments in NWC.Cash used in investing activities was $1.4 billion during fiscal year 2016. This resulted primarily from $916.5 million for the acquisition of eleven businesses completed during fiscal year 2016, including approximately $555.2 million, net of cash acquired, related to the acquisition of MCi, $240.8 million, net of cash acquired, related to the acquisition of NEXTracker, and approximately $67.5 million to acquire an optical transport facility from Alcatel-Lucent. We also paid $510.6 million in gross capital expenditures for property and equipment to support certain programs, offset by $13.7 million of proceeds from the sale of certain buildings and machinery and equipment. Other investing activities also includes $44.7 million paid for the purchase of certain investments, offset by $54.3 million of proceeds from the sale of certain assets that were purchased on behalf of a customer and financed by a third party banking institution, as further discussed in note 17 to the consolidated financial statements.Cash provided by financing activities was $249.6 million during fiscal year 2016, which was primarily the result of net proceeds from bank borrowings and long-term debt of $694.5 million mainly resulting from our new debt issuance discussed further in note 7 to the consolidated financial statements, and $61.3 million from the issuance of our shares for option exercises. These cash inflows were partially offset by $420.3 million of cash paid for the repurchase of our ordinary shares, and $75.8 million of cash paid to a third party banking institution for certain assets that were financed by the third party banking institution on behalf of a customer, which is included in other financing activities.Fiscal Year 2015Cash provided by operating activities was $794.0 million during fiscal year 2015. This resulted primarily from $600.8 million of net income for the period plus $510.9 million of non-cash charges such as depreciation, amortization, other impairment charges and stock-based compensation expense that are included in the determination of net income. Depreciation expense comprised $496.8 million of those non-cash charges, which was higher than our normal annual run rate of approximately $425.0 million due to accelerated depreciation recognized for fixed assets directly associated with certain product exits during the year. These were offset by $317.6 million from changes in our operating assets and liabilities, driven primarily by a $565.1 million reduction in customer deposits that were received in prior periods to support increased working capital requirements in those periods.Net working capital ("NWC"), defined as net accounts receivable, including deferred purchase price receivables, plus inventory less accounts payableNWC decreased by $212.5 million primarily due to lower business levels during thefourth quarter of fiscal year 2015 as compared to the same quarter of fiscal year 2014, which resulted in lower levels of investments in NWC.Cash used in investing activities amounted to $242.2 million during fiscal year 2015. This resulted primarily from $347.4 million in gross capital expenditures for property and equipment to support certain programs, offset by $107.7 million of proceeds from the sale of certain buildings and machinery and equipment. We also paid $52.7 million for the acquisition of four businesses completed during fiscal year 2015. Other investing activities also includes $79.7 million of proceeds from the sale of manufacturing equipment originally purchased on behalf of a customer and financed by a third party banking institution, as further discussed in note 17 to the consolidated financial statements, partially offset by $15.7 million paid for the purchase of certain technology rights as further discussed in note 2 to the consolidated financial statements.Cash used in financing activities was $516.0 million during fiscal year 2015, which was primarily the result of cash paid for the repurchase of our ordinary shares in the amount of $415.9 million and net repayment of debt in the amount of $24.6 million. Included in other financing activities is $88.8 million of cash paid to a third party banking institution for certain manufacturing equipment that was financed by the third party banking institution on behalf of a customer and $11.3 million of cash paid for contingent consideration related to our acquisition of Saturn Electronics and Engineering Inc. The aforementioned cash outflows were partially offset by proceeds from the issuance of our shares for option exercises amounting to $23.5 million.Fiscal Year 2014Cash provided by operating activities was $1.2 billion during fiscal year 2014, which resulted primarily from $365.6 million of net income for the period plus $450.0 million of non-cash charges such as depreciation, amortization, impairment charges and stock-based compensation expense that are included in the determination of net income. We generated $400.9 million in cash as a result of decreases in net operating assets. NWC increased by $233.7 million primarily to support the increase in our customers' forecasted business levels. The increases in accounts receivable and inventory are primarily as a result of the increase in sales in our CTG business, which generally carry higher volumes than our other complexbusiness groups.segments. The cash outflows to support NWC were offset by$540.6$540.6 million of cash received from certain customers as advances during the period. In certain instances, the level of inventory reduction or consumption was lower than expected causing an increase to inventory and usage of cash. In response, we worked with these customers to fund the elevated inventory balances we held on their behalf. We have recorded these advances as other current liabilities in the consolidated balance sheet as of March 31, 2014 and expect these amounts to decrease as we produce or sell the associated inventory in the future.Cash used in investing activities during fiscal year 2014 was $783.9 million. This resulted primarily from $515.0 million in capital expenditures for equipment, net of proceeds on sales. Our capital expenditures were related to investments to support innovation, expanding design capabilities, and improving our mechanicals and automation capabilities. Additionally, we paid $238.0 million for the acquisition of four businesses during the fiscal year, of which the majority relates to the acquisition of certain manufacturing operations from Google's Motorola Mobility LLC for $178.9 million and the acquisition of all outstanding shares of Riwisa AG for a total cash consideration of $44.0 million, net of cash acquired amounting to $9.4 million. Refer to note 17 to the consolidated financial statements included in Item 8, "Financial Statements and Supplementary Data".Cash used in financing activities amounted to $410.8 million during fiscal year 2014, which was primarily attributable to the repurchase of approximately 60.7 million shares for an aggregate purchase value of approximately $475.3 million. Other financing cash inflows of $52.1 million includes $38.6 million received from certain third parties for thenon-controllingnoncontrolling interest in one of our subsidiaries as further discussed in note 5 to the consolidated financial statements included in Item 8, "Financial Statements and Supplementary Data." Additionally, we entered into a $600.0 million term loan agreement due August 30, 2018 and used all of the proceeds to repay the outstanding balances of our term loan due October 2014 and other term loans in full amounting to $170.3 million and $374.5 million, respectively, and part of the term loan due March 2019.Fiscal Year 2013Cash provided by operating activities was $1.1 billion during fiscal year 2013, which resulted primarily from $277.1 million of net income for the period plus $522.5 million of non-cash charges such as depreciation, amortization, impairment charges and stock-based compensation expense that are included in the determination of net income. We generated $315.9 million in cash as a result of decreases in net operating assets. Our changes in operating assets and liabilities, net of acquisitions is primarily due to a decrease of $519.1 million in accounts receivable and a decrease of $596.1 million in inventory, which was partially offset by a decrease in accounts payable of $671.4 million and a decrease in other current and noncurrent liabilities of $189.5 million. The decreases in accounts receivable and inventory are primarily as a result of the decrease in sales in our CTG business, which generally carry higher volumes than our other complex business groups. The decrease in accounts payable is principally related to the decrease in inventory and timing of supplier payments.Cash used in investing activities during fiscal year 2013 was $697.2 million. This resulted primarily from $435.3 million in capital expenditures for equipment, net of proceeds on sales, and $184.1 million paid for the acquisition of four businesses during the fiscal year. We also spent approximately $115.3 million included in other investing cash flows, offset by the receipt of cash included in other financing activities further discussed below to purchase assets financed by a third party banking institution on behalf of a customer.Cash used in financing activities amounted to $339.6 million during fiscal year 2013, which was primarily attributable to the repurchase of approximately 49.9 million shares for an aggregate purchase value of approximately $322.0 million and repayment of the outstanding balance under our revolving line of credit of $140.0 million. These cash outflows were offset by the receipt of $101.9 million included in other financing activities to purchase assets financed by a third party banking institution on behalf of a customer.Key Liquidity Metrics
Free Cash flowWe believe free cash flow is an important liquidity metric because it measures, during a given period, the amount of cash generated that is available to repay debt obligations, make investments, fund acquisitions, repurchase company shares and for certain other activities. Our free cash flow, which is calculated as cash provided by operations less net purchases of property and equipment, was $639.5 million, $554.3 million$701.5 millionand$680.1$701.5 million for fiscal years 2016, 2015 and 2014,and 2013,respectively.Free cash flow is not a measure of liquidity under generally accepted accounting principles in the United States, and may not be defined and calculated by other companies in the same manner. Free cash flow should not be considered in isolation or as an alternative to net cash provided by operating activities. Free cash flows reconcile to the most directly comparable GAAP financial measure of cash flows from operations as follows:Fiscal Year Ended March 31, Fiscal Year Ended March 31, 2015 2014 2013 2016 2015 2014 (In thousands) (In thousands) Net cash provided by operating activities
$ 794,034 $ 1,216,460 $ 1,115,430 $ 1,136,445 $ 794,034 $ 1,216,460 Purchases of property and equipment
(347,413 ) (609,643 ) (488,993 ) (510,634 ) (347,413 ) (609,643 ) Proceeds from the disposition of property and equipment
107,689 94,640 53,665 13,676 107,689 94,640 Free cash flow
$ 554,310 $ 701,457 $ 680,102 $ 639,487 $ 554,310 $ 701,457 Cash Conversion CycleFiscal Year Ended March 31,201520142013Days in trade accounts receivable46 days42 days46 daysDays in inventory58 days54 days52 daysDays in accounts payable77 days70 days72 daysCash conversion cycle27 days26 days26 daysFiscal Year Ended March 31, 2016 2015 2014 Days in trade accounts receivable 45 days 46 days 42 days Days in inventory 59 days 58 days 54 days Days in accounts payable 77 days 77 days 70 days Cash conversion cycle 27 days 27 days 26 days Days in trade accounts receivable was calculated as average accounts receivable for the current and prior quarter, adding back the reduction in accounts receivable resulting from non-cash accounts receivable sales, divided by annualized sales for the current quarter by day. During the fiscal year ended March 31,2015,2016, days in trade accounts receivableincreaseddecreased by4 days1 day to4645 days compared to the fiscal year ended March 31,20142015 primarily due totiming of customers' payments.some improvements in collection efforts, and to a lesser extent, due to the decline in net sales. Non-cash accounts receivable sales or deferred purchase price receivables included for the purposes of the calculation were $501.1 million, $600.7 million$470.9 millionand$412.4$470.9 million for the years ended March 31, 2016, 20152014and2013,2014, respectively. Deferred purchase price receivables were recorded in other current assets in the consolidated balance sheets.Days in inventory was calculated as average inventory for the current and prior quarter divided by annualized cost of sales for the current quarter by day. During the fiscal year ended March 31,2015,2016, days in inventory increased by
4 days1 day to5859 days as compared to the fiscal year ended March 31,2014.2015. The increase was primarily due to timing of demand from certain customers which was pushed out thus resulting in prepositioned raw materials and higher levels of stalled finished goods.Days in accounts payable was calculated as average accounts payable for the current and prior quarter divided by annualized cost of sales for the current quarter by day. During the fiscal year ended March 31,2015,2016, days in accounts payableincreased by 7 days toremained consistent at 77 days compared to the fiscal year ended March 31,2014 primarily due to timing of supplier payments, as well as a decrease in operational levels during the last quarter of fiscal year2015.Our cash conversion cycle was calculated as days in trade receivables plus days in inventory, minus days in accounts payable and is a measure of how efficient we are at managing our working capital. Our cash conversion cycleincreased by 1 day toremained consistent at 27 days for the fiscal year ended March 31,20152016 compared to that of fiscal year20142015 due to the factors affecting each of the components in the calculation discussed above.Liquidity is affected by many factors, some of which are based on normal ongoing operations of the business and some of which arise from fluctuations related to global economics and markets. Cash balances are generated and held in many locations throughout the world. Local government regulations may restrict our ability to move cash balances to meet cash needs under certain circumstances; however, any current restrictions are not material. We do not currently expect such regulations and restrictions to impact our ability to pay vendors and conduct operations throughout the global organization. We believe that our existing cash balances, together with anticipated cash flows from operations and borrowings available under our credit facilities, will be sufficient to fund our operations through at least the next twelve months.Future liquidity needs will depend on fluctuations in levels of inventory, accounts receivable and accounts payable, the timing of capital expenditures for new equipment, the extent to which we utilize operating leases for new facilities and equipment, and the levels of shipments and changes in the volumes of customer orders.Historically, we have funded operations from cash and cash equivalents generated from operations, proceeds from public offerings of equity and debt securities, bank debt and lease financings. We also sell a designatedpoolspool of trade receivables underourasset-backed securitization ("ABS") programs and sell certain trade receivables, which are in addition to the trade receivables sold in connection with these securitization agreements. During fiscal years 2016, 20152014and20132014 we received approximately $5.2 billion, $4.3 billion$4.2 billionand$3.5$4.2 billion, respectively from sales of receivables under our ABS programs, and$4.2$2.3 billion,$3.4$4.2billion and$1.1$3.4 billion, respectively from other sales of receivables. As of March 31,20152016 and2014,2015, the outstanding balance on receivables sold for cash was $1.2 billion,and $1.1 billion, respectively,under all our accounts receivable sales programs, which are removed from accounts receivable balances in our consolidated balance sheets.We anticipate that we will enter into debt and equity financings, sales of accounts receivable and lease transactions to fund acquisitions and anticipated growth.The sale or issuance of equity or convertible debt securities could result in dilution to current shareholders. Further, we may issue debt securities that have rights and privileges senior to those of holders of ordinary shares, and the terms of this debt could impose restrictions on operations and could increase debt service obligations. This increased indebtedness could limit our flexibility as a result of debt service requirements and restrictive covenants, potentially affect our credit ratings, and may limit our ability to access additional capital or execute our business strategy. Any downgrades in credit ratings could adversely affect our ability to borrow as a result of more restrictive borrowing terms. We continue to assess our capital structure and evaluate the merits of redeploying available cash to reduce existing debt or repurchase ordinary shares.Historically we have been successful in refinancing and extending the maturity dates on our term loans and credit facilities. On June 8, 2015, we issued
$600 million of 4.750% Notes ("Notes") due June 15, 2025 in a private offering pursuant to Rule 144A and Regulation S under the Securities Act, at 99.213% of face value, and an effective yield of approximately 4.850%. We received net proceeds of approximately $595.3 million from the issuance which was used for general corporate purposes. During January 2016, we exchanged these notes for new notes with substantially similar terms and completed the registration of these notes with the Securities and Exchange Commission. Further on March 31, 2014,we extendedthe maturity dateto March 2019of our former $2.0 billion credit facilityconsisting of a $1.5 billion revolving credit facility and a $500.0 million term loan,("Credit Facility") which was due to expire in October2016. Further during fiscal year 2013, we issued Notes2016, was extended to March 2019. We also extended the balance of$1 billion with fixed interest rates and used such proceeds to repayour term loanthat was dueassociated tomaturethe Credit Facility as further described inOctober 2014 that carried floating interest rates.our Contractual Obligations and Commitments section.
Under our current share repurchase program, our Board of Directors authorized repurchases of our outstanding ordinary shares for up to$500$500 million in accordance with the share repurchase mandate approved by our shareholders at the date of the most recent Extraordinary General Meeting which was held on August28, 2014.20, 2015. During fiscal year2015,2016, we paid$415.9$420.3 million to repurchase shares (under the current and prior repurchase plans) at an average price of$10.76$11.09 per share. As of March 31,2015, $238.42016, shares in the aggregate amount of $242.1 millionwaswere available to bespent on share repurchasesrepurchased under the currentBoard authorization.plan.
CONTRACTUAL OBLIGATIONS AND COMMITMENTSWe have aOn September 30, 2015, we amended our former $2.0 billion credit facility ("Credit Facility")consisting of a $1.5 billion revolving credit facility and a $500to increase the $500.0 million term loanfacility due to maturematuring in March2019. As of March 31, 2015, there were no borrowings outstanding under the revolving credit facility.2019 by $100.0 million. Quarterly repayments of principal under this term loancommenced on June 30, 2014 in the amount of $6.3were amended to $7.5 millionup tothrough March 31, 2016, and willincreasebe increased to$9.4$11.3 million thereafter with the remainder due upon maturity. As of March 31, 2016, the amended Credit Facility consists of a $1.5 billion revolving credit facility, for which there were no borrowings outstanding, and a $600.0 million term loan, which is due to expire in March 2019.The credit facility requires that we maintain a maximum ratio of total indebtedness to earnings before interest expense, taxes, depreciation and amortization ("EBITDA"), and a minimum interest coverage ratio, as defined therein, during its term. As of March 31,2015,2016, we were in compliance with these covenants. Borrowings under this credit facility bear interest, at the Company's option, either at (i) LIBOR plus the applicable margin for LIBOR loans ranging between 1.125% and 2.125%, based on the Company's credit ratings or (ii) the base rate (the greatest of the agent's prime rate, the federal funds rate plus 0.50% and LIBOR for a one-month interest period plus 1.00%) plus an applicable margin ranging between 0.125% and 1.125%, based on the Company's credit rating. The Company is required to pay a quarterly commitment fee ranging between 0.15% and 0.40% per annum on the daily unused amount of the $1.5 billion Revolving Credit Facility based on the Company's credit rating.In addition, on June 8, 2015, we issued $600 million of 4.750% Notes (the "4.750% Notes") due June 15, 2025 in a private offering pursuant to Rule 144A and Regulation S under the Securities Act, at 99.213%, of face value, and an effective yield of approximately 4.850%. We received net proceeds of approximately $595.3 million from the issuance which has been used for general corporate purposes. During January 2016, we exchanged these 4.750% Notes for new notes with substantially similar terms and completed the registration of these 4.750% Notes with the Securities and Exchange Commission. These 4.750% Notes are governed by the same terms and covenants as for the $1.0 billion notes, consisting of a $500 million 4.625% note and an additional $500 million 5.000% note (the "Previously Issued Notes"), which are described below.Further, we have a $600 million term loan agreement which matures in August 2018. This loan is repayable in quarterly installments of $3.75 million, which commenced in December 2014 through August 2018, with the remaining amount due at maturity. This term loan agreement also requires that we maintain a maximum ratio of total indebtedness to EBITDA, and a minimum interest coverage ratio, as defined therein, during its term. As of March 31,2015,2016, we were in compliance with thecovenants under this term loan agreement. Borrowings under this term loan bear interest, at the Company's option, either at (i) LIBOR plus the applicable margin for LIBOR loans ranging between 1.00% and 2.00%, based on the Company's credit ratings or (ii) the base rate (the greatest of the agent's prime rate, the federal funds rate plus 0.50% and LIBOR for a one-month interest period plus 1.00%) plus an applicable margin ranging between 0.00% and 1.00%, based on the Company's credit rating.Further, during fiscal year 2013, we issued an aggregate amount of $1.0 billion in the Previously Issued Notes which are senior unsecured obligations, rank equally with all of our other existing and future senior and unsecured debt obligations, and are guaranteed, jointly and severally, fully and unconditionally on an unsecured basis, by each of our 100% owned subsidiaries that guarantees indebtedness under, or is a borrower under, our Credit Facility or our $600.0 million term loanfacility.facility due August 30, 2018. In July 2013,the Companywe exchanged thesenotesPreviously Issued Notes for new notes with substantially similar terms and completed the registration of these notes with the Securities and Exchange Commission. As of March 31,2015,2016, we were incompliance with the covenants under these credit facilities. Interest on the these Previously Issued Notes is payable semi-annually, which commenced on August 15, 2013.
On October 1, 2015, we borrowed €50 million (approximately $56.6 million as of March 31, 2016), under a 5-year, unsecured, term-loan agreement due September 30, 2020. Borrowings under this term loan bear interest at EURIBOR plus the applicable margin ranging between 0.80% and 2.00%, based on our credit ratings. The loan is repayable beginning December 30, 2016 in quarterly payments of €312,500 through June 30, 2020 with the remainder due upon maturity. This term loan agreement is unsecured, and is guaranteed by the Company. This term contains customary restrictions on the Company's and its subsidiaries' ability to (i) incur certain debt, (ii) make certain investments, (iii) make certain acquisitions of other entities, (iv) incur liens, (v) dispose of assets, (vi) make non-cash distributions to shareholders, and (vii) engage in transactions with affiliates. This term loan agreement also requires that we maintain a maximum ratio of total indebtedness to EBITDA (earnings before interest expense, taxes, depreciation and amortization), and a minimum interest coverage ratio, as defined therein, during its term. As of March 31,2015,2016, we were in compliance with the covenants under this term loan agreement.As of March 31, 2016, we and certain of our subsidiaries had various uncommitted revolving credit facilities, lines of credit and other loans in the amount of$184.6$166.0 million in the aggregate under which there were no borrowings outstanding as of that date.Refer to the discussion in note 7, "Bank Borrowings and Long-Term Debt" to the consolidated financial statements for further details of our debt obligations.We have purchase obligations that arise in the normal course of business, primarily consisting of binding purchase orders for inventory related items and capital expenditures. Additionally, we have leased certain of our property and equipment under capital lease commitments, and certain of our facilities and equipment under operating lease commitments.Future payments due under our purchase obligations, debt including capital leases and related interest obligations and operatinglease contracts are as follows:lease:Total Less Than
1 Year1 - 3 Years 4 - 5 Years Greater Than
5 YearsTotal Less Than
1 Year1 - 3 Years 4 - 5 Years Greater Than
5 Years(In thousands) (In thousands) Contractual Obligations:
Purchase obligations
$ 2,755,021 $ 2,755,021 $ — $ — $ — $ 3,213,500 $ 3,213,500 $ — $ — $ — Long-term debt and capital lease obligations
Long-term debt
2,083,733 46,162 105,000 1,422,500 510,071 2,791,906 65,166 1,068,617 547,440 1,110,683 Capital lease
5,287 2,816 2,446 25 — 25,054 6,640 10,302 8,112 — Interest on long-term debt obligations
428,430 72,524 168,289 113,543 74,074 673,622 101,460 207,519 191,982 172,661 Operating leases, net of subleases
574,061 115,695 171,827 123,146 163,393 579,201 125,021 191,203 116,974 146,003 Restructuring costs
15,057 3,468 11,589 — — 13,240 2,460 10,780 — — Total contractual obligations
$ 5,861,589 $ 2,995,686 $ 459,151 $ 1,659,214 $ 747,538 $ 7,296,523 $ 3,514,247 $ 1,488,421 $ 864,508 $ 1,429,347 We have excluded$222.4$212.3 million of liabilities for unrecognized tax benefits from the contractual obligations table as we cannot make a reasonably reliable estimate of the periodic settlements with the respective taxing authorities. See note 13, "Income Taxes" to the consolidated financial statements for further details.Our purchase obligations can fluctuate significantly from period to period and can materially impact our future operating asset and liability balances, and our future working capital requirements. We intend to use our existing cash balances, together with anticipated cash flows from operations to fund our existing and future contractual obligations.On April 29, 2015, the Company announced that it has entered into a definitive agreement to acquire Mirror Controls International (MCi) from private equity firm Egeria in an all cash transaction valuing its share capital at approximately $500.0 million. The transaction is expected to close in the second quarter of fiscal year 2016 and will form part of our HRS business group.OFF-BALANCE SHEET ARRANGEMENTSWe sell designated pools of trade receivables to unaffiliated financial institutions under our ABS programs, and in addition to cash, we receive a deferred purchase price receivable for each pool of the receivables sold. Each of these deferred purchase price receivables serves as additional credit support to the financial institutions and is recorded at its estimated fair value. As of March 31,20152016 and2014,2015, the fair value of our deferred purchase price receivable was approximately$600.7$501.1 million and$470.9$600.7 million, respectively. As of March 31,20152016 and2014,2015, the outstanding balance on receivablessold for cash was $1.2 billion,
and $1.1 billion, respectively,under all our accounts receivable sales programs, which were removed from accounts receivable balances in our consolidated balance sheets. For further information, see note 10 to the consolidated financial statements.RECENT ACCOUNTING PRONOUNCEMENTSRefer to note 2 to the consolidated financial statements for recent accounting pronouncements.ITEM 7A. QUANTITATIVE AND QUALITATIVE DISCLOSURES ABOUT MARKET RISKINTEREST RATE RISKA portion of our exposure to market risk for changes in interest rates relates to our investment portfolio, which consists of highly liquid investments or bank deposits with maturities of three months or less from original dates of purchase and are classified as cash equivalents on our consolidated balance sheet. We do not use derivative financial instruments in our investment portfolio. We place cash and cash equivalents with various major financial institutions and highly rated money market accounts. Our investment policy has strict guidelines focusing on preservation of capital. The portfolio is comprised of various instruments including term deposits with banks, marketable securities and money market accounts. Our cash is principally invested in the U.S. dollar and China RMB serving as a natural hedge of our RMB denominated costs. As of March 31,2015,2016, the outstanding amount in the investment portfolio was$0.7$1.1 billion, the largest components of which were USD and RMB denominated money market accounts with an average return of2.45%1.22%. A hypothetical 10% change in interest rates would not be expected to have a material effect on our financial position, results of operations and cash flows over the next fiscal year.We had variable rate debt outstanding of approximately $1.1 billion as of March 31,2015.2016. Variable rate debt obligations consisted of borrowings under our term loans. Interest on these obligations is discussed above.Our variable rate debt instruments create exposures for us related to interest rate risk. Primarily due to the current low interest rates a hypothetical 10% change in interest rates would not be expected to have a material effect on our financial position, results of operations and cash flows over the next fiscal year.As of March 31,2015,2016, the approximate average fair value of our debt outstanding under our term loan facilities that matures in March 2019 and August 2018, and Notes due February 2020, February 2023 and2023June 2025 was102.3%101.0% of the face value of the debt obligations based on broker trading prices.FOREIGN CURRENCY EXCHANGE RISKWe transact business in various foreign countries and are, therefore, subject to risk of foreign currency exchange rate fluctuations. We have established a foreign currency risk management policy to manage this risk. To the extent possible, we manage our foreign currency exposure by evaluating and using non-financial techniques, such as currency of invoice, leading and lagging payments and receivables management. In addition, we may borrow in various foreign currencies and enter into short-term foreign currency forward, swap, andswapoption contracts to hedge only those currency exposures associated with certain assets and liabilities, mainly accounts receivable and accounts payable, and cash flows denominated in non-functional currencies.We endeavor to maintain a partial or fully hedged position for certain transaction exposures. These exposures are primarily, but not limited to, revenues, customer and vendor payments and inter-company balances in currencies other than the functional currency unit of the operating entity. The credit risk of our foreign currency forward and swap contracts is minimized since all contracts are with large financial institutions and accordingly, fair value adjustments related to the credit risk of thecounter-party financial institution were not material. The gains and losses on forward and swap contracts generally offset the losses and gains on the assets, liabilities and transactions hedged. The fair value of currency forward and swap contracts is reported on the balance sheet. The aggregate notional amount of outstanding contracts as of March 31,
20152016amounted to$3.6$4.3 billion and the recorded fair values of the associated assets and liabilities were not material. The majority of these foreign exchange contracts expire in less than three months and all expire within one year. They will settle primarily in Brazilian real, British pound, Canadian dollar, China renminbi, Danishkroner,krone, the Euro, Hungarian forint, Israeli shekel, Japanese yen, Malaysian ringgit, Mexican peso, Singapore dollar, Indian rupee, Swiss franc and the U.S. dollar.Based on our overall currency rate exposures as of March 31,2015,2016, including the derivative financial instruments intended to hedge the nonfunctional currency-denominated monetary assets, liabilities and cash flows, a near-term 10% appreciation or depreciation of the U.S. dollar from its cross-functional rates would not be expected to have a material effect on our financial position, results of operations and cash flows over the next fiscal year.REPORT OF INDEPENDENT REGISTERED PUBLIC ACCOUNTING FIRMTo the Board of Directors and Stockholders ofFlextronics International Ltd.SingaporeWe have audited the accompanying consolidated balance sheets of Flextronics International Ltd. and subsidiaries (the "Company") as of March 31,20152016 and2014,2015, and the related consolidated statements of operations, comprehensive income, shareholders' equity, and cash flows for each of the three years in the period ended March 31,2015.2016. These financial statements are the responsibility of the Company's management. Our responsibility is to express an opinion on these financial statements based on our audits.We conducted our audits in accordance with the standards of the Public Company Accounting Oversight Board (United States). Those standards require that we plan and perform the audit to obtain reasonable assurance about whether the financial statements are free of material misstatement. An audit includes examining, on a test basis, evidence supporting the amounts and disclosures in the financial statements. An audit also includes assessing the accounting principles used and significant estimates made by management, as well as evaluating the overall financial statement presentation. We believe that our audits provide a reasonable basis for our opinion.In our opinion, such consolidated financial statements present fairly, in all material respects, the financial position of Flextronics International Ltd. and subsidiaries as of March 31,20152016 and2014,2015, and the results of their operations and their cash flows for each of the three years in the period ended March 31,2015,2016, in conformity with accounting principles generally accepted in the United States of America.We have also audited, in accordance with the standards of the Public Company Accounting Oversight Board (United States), the Company's internal control over financial reporting as of March 31,2015,2016, based on the criteria established inInternalControl—IntegratedControl-Integrated Framework(2013) issued by the Committee of Sponsoring Organizations of the Treadway Commission and our report dated May 20,20152016 expressed an unqualified opinion on the Company's internal control over financial reporting./s/ DELOITTE & TOUCHE LLPSan Jose, CaliforniaMay 20,20152016FLEXTRONICS INTERNATIONAL LTD.CONSOLIDATED BALANCE SHEETSAs of March 31, As of March 31, 2015 2014 2016 2015 (In thousands, except
share amounts)(In thousands, exceptshare amounts)ASSETS
Current assets:
Cash and cash equivalents
$ 1,628,408 $ 1,593,728 $ 1,607,570 $ 1,628,408 Accounts receivable, net of allowance for doubtful accounts
2,337,515 2,697,985 Accounts receivable, net of allowance for doubtful accounts (Note 2) 2,044,757 2,337,515 Inventories
3,488,752 3,599,008 3,491,656 3,488,752 Other current assets
1,286,225 1,509,605 1,171,143 1,286,225 Total current assets
8,740,900 9,400,326 8,315,126 8,740,900 Property and equipment, net
2,092,167 2,288,656 2,257,633 2,092,167 Goodwill and other intangible assets, net
415,175 377,218 1,345,820 415,175 Other assets
417,382 433,950 466,402 404,649 Total assets
$ 11,665,624 $ 12,500,150 $ 12,384,981 $ 11,652,891 LIABILITIES AND SHAREHOLDERS' EQUITY
Current liabilities:
Bank borrowings and current portion of long-term debt
$ 46,162 $ 32,575 $ 65,166 $ 45,030 Accounts payable
4,561,194 4,747,779 4,248,292 4,561,194 Accrued payroll
339,739 354,889 353,547 339,739 Other current liabilities
1,809,128 2,521,444 1,905,200 1,809,128 Total current liabilities
6,756,223 7,656,687 6,572,205 6,755,091 Long-term debt, net of current portion
2,037,571 2,070,020 2,709,389 2,025,970 Other liabilities
475,580 571,764 497,857 475,580 Commitments and contingencies (Note 12)
Shareholders' equity
Flextronics International Ltd. Shareholders' equity
Ordinary shares, no par value; 613,562,761 and 641,666,347 issued, and 563,323,406 and 591,426,992 outstanding as of March 31, 2015 and 2014, respectively
7,265,827 7,614,515 Treasury stock, at cost; 50,239,355 shares as of March 31, 2015 and 2014, respectively
(388,215 ) (388,215 ) Ordinary shares, no par value; 595,062,966 and 613,562,761 issued, and 544,823,611 and 563,323,406 outstanding as of March 31, 2016 and 2015, respectively 6,987,214 7,265,827 Treasury stock, at cost; 50,239,355 shares as of March 31, 2016 and 2015, respectively (388,215 ) (388,215 ) Accumulated deficit
(4,336,293 ) (4,937,094 ) (3,892,212 ) (4,336,293 ) Accumulated other comprehensive loss
(180,505 ) (126,156 ) (135,915 ) (180,505 ) Total Flextronics International Ltd. shareholders' equity
2,360,814 2,163,050 2,570,872 2,360,814 Noncontrolling interests
35,436 38,629 34,658 35,436 Total shareholders' equity
2,396,250 2,201,679 2,605,530 2,396,250 Total liabilities and shareholders' equity
$ 11,665,624 $ 12,500,150 $ 12,384,981 $ 11,652,891 The accompanying notes are an integral part of these consolidated financial statements.FLEXTRONICS INTERNATIONAL LTD.CONSOLIDATED STATEMENTS OF OPERATIONSFiscal Year Ended March 31, 2015 2014 2013 (In thousands, except per share amounts) Net sales
$ 26,147,916 $ 26,108,607 $ 23,569,475 Cost of sales
24,602,576 24,609,738 22,187,393 Restructuring charges
— 58,648 215,834 Gross profit
1,545,340 1,440,221 1,166,248 Selling, general and administrative expenses
844,473 874,796 805,235 Intangible amortization
32,035 28,892 29,529 Restructuring charges
— 16,663 11,600 Other charges (income), net
(53,233 ) 57,512 (65,190 ) Interest and other, net
51,410 61,904 56,259 Income from continuing operations before income taxes
670,655 400,454 328,815 Provision for income taxes
69,854 34,860 26,313 Income from continuing operations
600,801 365,594 302,502 Loss from discontinued operations, net of tax
— — (25,451 ) Net income
$ 600,801 $ 365,594 $ 277,051 Earnings per share:
Income from continuing operations:
Basic
$ 1.04 $ 0.60 $ 0.46 Diluted
$ 1.02 $ 0.59 $ 0.45 ��� Loss from discontinued operations:
Basic
$ — $ — $ (0.04 ) Diluted
$ — $ — $ (0.04 ) Net income:
Basic
$ 1.04 $ 0.60 $ 0.42 Diluted
$ 1.02 $ 0.59 $ 0.41 Weighted-average shares used in computing per share amounts:
Basic
579,981 610,497 662,874 Diluted
591,556 623,479 675,033 Fiscal Year Ended March 31, 2016 2015 2014 (In thousands, except per share amounts) Net sales $ 24,418,885 $ 26,147,916 $ 26,108,607 Cost of sales 22,810,824 24,602,576 24,609,738 Restructuring charges — — 58,648 Gross profit 1,608,061 1,545,340 1,440,221 Selling, general and administrative expenses 954,890 844,473 874,796 Intangible amortization 65,965 32,035 28,892 Restructuring charges — — 16,663 Other charges (income), net 47,738 (53,233 ) 57,512 Interest and other, net 84,793 51,410 61,904 Income before income taxes 454,675 670,655 400,454 Provision for income taxes 10,594 69,854 34,860 Net income $ 444,081 $ 600,801 $ 365,594 Earnings per share: Basic $ 0.80 $ 1.04 $ 0.60 Diluted $ 0.79 $ 1.02 $ 0.59 Weighted-average shares used in computing per share amounts: Basic 557,667 579,981 610,497 Diluted 564,869 591,556 623,479 The accompanying notes are an integral part of these consolidated financial statements.FLEXTRONICS INTERNATIONAL LTD.CONSOLIDATED STATEMENTS OF COMPREHENSIVE INCOMEFiscal Year Ended March 31, 2015 2014 2013 (In thousands) Net income
$ 600,801 $ 365,594 $ 277,051 Other comprehensive loss:
Foreign currency translation adjustments, net of zero tax
(18,932 ) (34,683 ) (16,289 ) Unrealized loss on derivative instruments and other, net of zero tax
(35,417 ) (13,992 ) (20,755 ) Comprehensive income
$ 546,452 $ 316,919 $ 240,007 Fiscal Year Ended March 31, 2016 2015 2014 (In thousands) Net income $ 444,081 $ 600,801 $ 365,594 Other comprehensive income (loss): Foreign currency translation adjustments, net of zero tax 17,846 (18,932 ) (34,683 ) Unrealized gain (loss) on derivative instruments and other, net of zero tax 26,744 (35,417 ) (13,992 ) Comprehensive income $ 488,671 $ 546,452 $ 316,919 The accompanying notes are an integral part of these consolidated financial statements.FLEXTRONICS INTERNATIONAL LTD.CONSOLIDATED STATEMENTS OF SHAREHOLDERS' EQUITYAccumulated Other Comprehensive
Income (Loss)Ordinary Shares Unrealized gain
(loss) on
derivative
instruments and
otherTotal
accumulated
other
comprehensive
lossTotal Accumulated Other ComprehensiveLossForeign
currency
translation
adjustmentsTotal Flextronics
International Ltd.
Shareholders'
EquityOrdinary Shares Total Shares
OutstandingAmount Accumulated
deficitTotal
accumulated
other
comprehensive
lossShareholders'
EquitySharesOutstandingAmount AccumulateddeficitUnrealized loss onderivativeinstruments andotherForeigncurrencytranslationadjustmentsTotalaccumulatedothercomprehensivelossTotal FlextronicsInternational Ltd.Shareholders'EquityNoncontrollingInterestsShareholders'Equity(In thousands) (In thousands) BALANCE AT MARCH 31, 2012
683,740 $ 7,904,155 $ (5,579,739 ) $ 1,898 $ (42,335 ) $ (40,437 ) $ 2,283,979 $ 2,283,979 Repurchase of Flextronics International Ltd. ordinary shares at cost
(51,725 ) (334,014 ) — — — — (334,014 ) — (334,014 ) Exercise of stock options
5,398 22,257 — — — — 22,257 — 22,257 Issuance of Flextronics International Ltd. vested shares under share bonus awards
1,507 — — — — — — — — Net income
— — 277,051 — — — 277,051 — 277,051 Stock-based compensation, net of tax
— 34,529 — — — — 34,529 — 34,529 Total other comprehensive loss
— — — (20,755 ) (16,289 ) (37,044 ) (37,044 ) — (37,044 ) BALANCE AT MARCH 31, 2013
638,920 7,626,927 (5,302,688 ) (18,857 ) (58,624 ) (77,481 ) 2,246,758 — 2,246,758 638,920 $ 7,626,927 $ (5,302,688 ) $ (18,857 ) $ (58,624 ) $ (77,481 ) $ 2,246,758 $ — $ 2,246,758 Repurchase of Flextronics International Ltd. ordinary shares at cost
(59,546 ) (468,847 ) — — — — (468,847 ) — (468,847 ) (59,546 ) (468,847 ) — — — — (468,847 ) — (468,847 ) Exercise of stock options
6,572 28,140 — — — — 28,140 — 28,140 6,572 28,140 — — — — 28,140 — 28,140 Issuance of Flextronics International Ltd. vested shares under share bonus awards
5,481 — — — — — — — — 5,481 — — — — — — — — Issuance of subsidiary shares
— — — — — — — 38,650 38,650 — — — — — — — 38,650 38,650 Net income
— — 365,594 — — — 365,594 (380 ) 365,214 — — 365,594 — — — 365,594 (380 ) 365,214 Stock-based compensation, net of tax
— 40,080 — — — — 40,080 359 40,439 — 40,080 — — — — 40,080 359 40,439 Total other comprehensive loss
— — — (13,992 ) (34,683 ) (48,675 ) (48,675 ) — (48,675 ) — — — (13,992 ) (34,683 ) (48,675 ) (48,675 ) — (48,675 ) BALANCE AT MARCH 31, 2014
591,427 7,226,300 (4,937,094 ) (32,849 ) (93,307 ) (126,156 ) 2,163,050 38,629 2,201,679 591,427 7,226,300 (4,937,094 ) (32,849 ) (93,307 ) (126,156 ) 2,163,050 38,629 2,201,679 Repurchase of Flextronics International Ltd. ordinary shares at cost
(38,951 ) (421,687 ) — — — — (421,687 ) — (421,687 ) (38,951 ) (421,687 ) — — — — (421,687 ) — (421,687 ) Exercise of stock options
3,601 23,497 — — — — 23,497 11 23,508 3,601 23,497 — — — — 23,497 11 23,508 Issuance of Flextronics International Ltd. vested shares under share bonus awards
7,246 — — — — — — — — 7,246 — — — — — — — — Issuance of subsidiary shares
— — — — — — — 300 300 — — — — — — — 300 300 Net income
— — 600,801 — — — 600,801 (4,272 ) 596,529 — — 600,801 — — — 600,801 (4,272 ) 596,529 Stock-based compensation, net of tax
— 49,502 — — — — 49,502 768 50,270 — 49,502 — — — — 49,502 768 50,270 Total other comprehensive loss
— — — (35,417 ) (18,932 ) (54,349 ) (54,349 ) — (54,349 ) — — — (35,417 ) (18,932 ) (54,349 ) (54,349 ) — (54,349 ) BALANCE AT MARCH 31, 2015
563,323 $ 6,877,612 $ (4,336,293 ) $ (68,266 ) $ (112,239 ) $ (180,505 ) $ 2,360,814 $ 35,436 $ 2,396,250 563,323 6,877,612 (4,336,293 ) (68,266 ) (112,239 ) (180,505 ) 2,360,814 35,436 2,396,250 Repurchase of Flextronics International Ltd. ordinary shares at cost (37,314 ) (412,819 ) — — — — (412,819 ) — (412,819 ) Exercise of stock options 10,244 61,278 — — — — 61,278 486 61,764 Issuance of Flextronics International Ltd. vested shares under share bonus awards 8,570 — — — — — — — — Premium on acquired equity plan — 799 — — — — 799 — 799 Net income — — 444,081 — — — 444,081 (6,715 ) 437,366 Stock-based compensation, net of tax — 72,129 — — — — 72,129 5,451 77,580 Total other comprehensive income — — — 26,744 17,846 44,590 44,590 — 44,590 BALANCE AT MARCH 31, 2016 544,823 $ 6,598,999 $ (3,892,212 ) $ (41,522 ) $ (94,393 ) $ (135,915 ) $ 2,570,872 $ 34,658 $ 2,605,530 The accompanying notes are an integral part of these consolidated financial statements.FLEXTRONICS INTERNATIONAL LTD.CONSOLIDATED STATEMENTS OF CASH FLOWSFiscal Year Ended March 31, Fiscal Year Ended March 31, 2015 2014 2013 2016 2015 2014 (In thousands) (In thousands) Cash flows from operating activities:
Net income
$ 600,801 $ 365,594 $ 277,051 $ 444,081 $ 600,801 $ 365,594 Adjustments to reconcile net income to net cash provided by operating activities:
Depreciation, amortization and other impairment charges
540,490 464,543 566,357 515,367 540,490 464,543 Non-cash other income
(20,628 ) (18,724 ) (45,765 ) Provision for doubtful accounts (Note 2) 72,295 650 2,029 Non-cash other loss (income) 24,521 (21,278 ) (20,753 ) Stock-based compensation
50,270 40,439 34,529 77,580 50,270 40,439 Income taxes
(59,261 ) (36,261 ) (32,647 ) (64,346 ) (59,261 ) (36,261 ) Changes in operating assets and liabilities, net of acquisitions:
Accounts receivable
316,773 (592,346 ) 519,140 317,946 316,773 (592,346 ) Inventories
72,660 (758,846 ) 596,131 84,790 72,660 (758,846 ) Other current and noncurrent assets
125,218 (165,760 ) 61,567 (2,704 ) 125,218 (165,760 ) Accounts payable
(176,941 ) 1,117,449 (671,424 ) (365,051 ) (176,941 ) 1,117,449 Other current and noncurrent liabilities
(655,348 ) 800,372 (189,509 ) 31,966 (655,348 ) 800,372 Net cash provided by operating activities
794,034 1,216,460 1,115,430 1,136,445 794,034 1,216,460 Cash flows from investing activities:
Purchases of property and equipment
(347,413 ) (609,643 ) (488,993 ) (510,634 ) (347,413 ) (609,643 ) Proceeds from the disposition of property and equipment
107,689 94,640 53,665 13,676 107,689 94,640 Acquisition of businesses, net of cash acquired
(61,361 ) (238,031 ) (184,097 ) Proceeds from divestitures of business, net of cash held in divested business
(5,493 ) 4,599 22,585 Acquisition and divestiture of businesses, net of cash acquired and cash held in divested business (910,787 ) (66,854 ) (233,432 ) Other investing activities, net
64,362 (35,497 ) (100,359 ) 11,369 64,362 (35,497 ) Net cash used in investing activities
(242,216 ) (783,932 ) (697,199 ) (1,396,376 ) (242,216 ) (783,932 ) Cash flows from financing activities:
Proceeds from bank borrowings and long-term debt
319,542 1,066,653 1,250,213 884,702 319,542 1,066,653 Repayments of bank borrowings and long-term debt
(344,156 ) (537,580 ) (391,859 ) (190,221 ) (344,156 ) (537,580 ) Payments for early retirement of long-term debt
— (544,840 ) (1,000,000 ) — — (544,840 ) Payments for repurchases of ordinary shares
(415,945 ) (475,314 ) (322,040 ) (420,317 ) (415,945 ) (475,314 ) Proceeds from exercise of stock options
23,508 28,140 22,257 61,278 23,508 28,140 Other financing activities, net
(98,966 ) 52,149 101,851 (85,800 ) (98,966 ) 52,149 Net cash used in financing activities
(516,017 ) (410,792 ) (339,578 ) Net cash provided by (used in) financing activities 249,642 (516,017 ) (410,792 ) Effect of exchange rates on cash
(1,121 ) (15,095 ) (9,895 ) (10,549 ) (1,121 ) (15,095 ) Net change in cash and cash equivalents
34,680 6,641 68,758 (20,838 ) 34,680 6,641 Cash and cash equivalents, beginning of year
1,593,728 1,587,087 1,518,329 1,628,408 1,593,728 1,587,087 Cash and cash equivalents, end of year
$ 1,628,408 $ 1,593,728 $ 1,587,087 $ 1,607,570 $ 1,628,408 $ 1,593,728 The accompanying notes are an integral part of these consolidated financial statements.FLEXTRONICS INTERNATIONAL LTD.NOTES TO CONSOLIDATED FINANCIAL STATEMENTS1. ORGANIZATION OF THE COMPANYFlextronics International Ltd. ("Flextronics"Flex" or the "Company") was incorporated in the Republic of Singapore in May 1990. The Company's operations have expanded over the years through a combination of organic growth and acquisitions. The Company is a globally-recognized, leading provider of innovative design, engineering, manufacturing, and supply chain services and solutions that spanfrom sketch to scaletm; from conceptual sketch to full-scale production. The Company designs, builds, ships and services complete packaged consumer electronics and industrial products for original equipment manufacturers ("OEMs"), through its activities in the followingbusiness groups:segments: High Reliability Solutions ("HRS"), which is comprised ofourmedical business includingmedical equipment,consumer health, digital health, disposables, drug delivery, diagnostics, life sciences anddiagnostics; ourimaging equipment; automotive business, includingautomotivevehicle electronics,automotive lighting,connectivity, andpower electronics;clean technologies; andourdefense and aerospace businesses, focused on commercial aviation, defensecivil aviation,andhomeland security;military; ConsumerTechnologyTechnologies Group ("CTG"), which includesourmobile devices business, including smart phones;ourconsumer electronics business, including connected living, wearable electronics including digital sport, game consoles, and connectivity devices; andourhigh-volume computing business, including various supply chain solutions for notebook personalcomputing,computer ("PC"), tablets, and printers; in addition, CTG group is expanding its business relationships to include supply chain optimization for non-electronics products such as shoes and clothing; Industrial and Emerging Industries ("IEI"), which is comprised of semiconductor and capital equipment, office solutions,test and measurement,household industrial and lifestyle, industrial automation and kiosks, energy and metering, and lighting; and Communications & Enterprise Compute ("CEC"), which was formerly referred to as Integrated Network Solutions("INS"(“INS”),whichincludes radio access base stations, remote radio heads, and small cells for wireless infrastructure; optical, routing, broadcasting, and switching products for the data and videonetwork;networks; server and storage platforms for both enterprise and cloud based deployments; next generation storage and security appliance products; and rack level solutions, converged infrastructure and software defined product solutions. The Company's strategy is to provide customers with a full range of cost competitive, vertically integrated global supply chain solutions through which the Company can design, build, ship and service a complete packaged product for its OEM customers. This enablesourthe Company's OEM customers to leverage the Company's supply chain solutions to meet their product requirements throughout the entire product life cycle.The Company's service offerings include a comprehensive range of value-added design and engineering services that are tailored to the various markets and needs of its customers. Other focused service offerings relate to manufacturing (including enclosures, metals, plastic injection molding, precision plastics, machining, and mechanicals), system integration and assembly and test services, materials procurement, inventory management, logistics and after-sales services (including product repair, warranty services, re-manufacturing and maintenance) and supply chain management software solutions and component product offerings (including rigid and flexible printed circuit boards and power adapters and chargers).2. SUMMARY OF ACCOUNTING POLICIESBasis of Presentation and Principles of ConsolidationThe Company's third fiscal quarter ends on December 31, and the fourth fiscal quarter and year ends on March 31 of each year. The first fiscal quarter ended on June27, 201426, 2015 and June28, 2013,27, 2014, respectively, and the second fiscal quarter ended on September26, 201425, 2015 and September27, 2013,26, 2014, respectively. Amounts included in the consolidated financial statements are expressed in U.S. dollars unless otherwise designated.FLEXTRONICS INTERNATIONAL LTD.NOTES TO CONSOLIDATED FINANCIAL STATEMENTS (Continued)2. SUMMARY OF ACCOUNTING POLICIES (Continued)The accompanying consolidated financial statements include the accounts of
FlextronicsFlex and its majority-owned subsidiaries, after elimination of intercompany accounts and transactions. The Company consolidatesallits majority-owned subsidiaries and investments in entities in which the Company has a controlling interest. For the consolidated majority-owned subsidiaries in which the Company owns less than 100%, the Company recognizes anon-controllingnoncontrolling interest for the ownership of thenon-controllingnoncontrolling owners. As of March 31,2015,2016, thenon-controllingnoncontrolling interest has been included on the consolidated balance sheets as a component of total shareholders' equity. The associatednon-controllingnoncontrolling owners' interest in the income or losses of these companieshas not been material to the Company's results of operations for any of the periods presented, and has beenis classified as a component of interest and other, net, in the consolidated statements of operations.During fiscal year 2013,The Company has certain non-majority-owned equity investments in non-publicly traded companies that are accounted for using theCompany finalized the saleequity method oftwoaccounting. The equity method ofits non-core businesses. In accordance with theaccountingguidance, these non-core businesses represent separate asset groups and the divestitures qualify as discontinued operations, and accordingly,is used when the Company hasreportedtheresultsability to significantly influence the operating decisions ofoperationsthe issuer, or if the Company has an ownership percentage of a corporation equal to or generally greater than 20% but less than 50%, andfinancial positionfor non-majority-owned investments in partnerships when generally greater than 5%. The equity in earnings (losses) ofthese businessesequity method investees are immaterial for all of the periods presented, and are included indiscontinued operations withininterest and other, net in the condensed consolidated statements ofoperations and consolidated balance sheets for all periods presented as applicable.operations.
54FLEXTRONICS INTERNATIONAL LTD.NOTES TO CONSOLIDATED FINANCIAL STATEMENTS (Continued)2. SUMMARY OF ACCOUNTING POLICIES (Continued)Use of EstimatesThe preparation of financial statements in conformity with accounting principles generally accepted in the United States of America ("U.S. GAAP" or "GAAP") requires management to make estimates and assumptions that affect the reported amounts of assets and liabilities, the disclosure of contingent assets and liabilities at the date of the financial statements, and the reported amounts of revenues and expenses during the reporting period. Estimates are used in accounting for, among other things: allowances for doubtful accounts; inventory write-downs; valuation allowances for deferred tax assets; uncertain tax positions; valuation and useful lives of long-lived assets including property, equipment, intangible assets and goodwill; asset impairments; fair values of financial instruments including investments, notes receivable and derivative instruments; restructuring charges; contingencies; fair values of assets obtained and liabilitiesobtainedassumed in business combinations and the fair values of stock options and share bonus awards granted under the Company's stock-based compensation plans. Actual results may differ from previously estimated amounts, and such differences may be material to the consolidated financial statements. Estimates and assumptions are reviewed periodically, and the effects of revisions are reflected in the period they occur.Translation of Foreign CurrenciesThe financial position and results of operations for certain of the Company's subsidiaries are measured using a currency other than the U.S. dollar as their functional currency. Accordingly, all assets and liabilities for these subsidiaries are translated into U.S. dollars at the current exchange rates as of the respective balance sheet dates. Revenue and expense items are translated at the average exchange rates prevailing during the period. Cumulative gains and losses from the translation of these subsidiaries' financial statements are reported as other comprehensive loss, a component of shareholders' equity. Foreign exchange gains and losses arising from transactions denominated in a currency other than the functional currency of the entity involved, and re-measurement adjustments for foreign operations where the U.S. dollar is the functional currency, are included in operating results. Non-functional currency transaction gains and losses, and re-measurement adjustments were notFLEXTRONICS INTERNATIONAL LTD.NOTES TO CONSOLIDATED FINANCIAL STATEMENTS (Continued)2. SUMMARY OF ACCOUNTING POLICIES (Continued)material to the Company's consolidated results of operations for any of the periods presented, and have been classified as a component of interest and other, net in the consolidated statements of operations.
Revenue RecognitionThe Company recognizes manufacturing revenue when it ships goods or the goods are received by its customer, title and risk of ownership have passed, the price to the buyer is fixed or determinable and recoverability is reasonably assured. Generally, there are no formal substantive customer acceptance requirements or further obligations related to manufacturing services. If such requirements or obligations exist, then the Company recognizes the related revenues at the time when such requirements are completed and the obligations are fulfilled. Some of the Company's customer contracts allow the recovery of certain costs related to manufacturing services that are over and above the prices charged for the related products. The Company determines the amount of costs that are recoverable based on historical experiences and agreements with those customers. Also, certain customer contracts may contain certain commitments and obligations that may result in additional expenses or decrease in revenue. The Company accrues for these commitments and obligations based on facts and circumstances and contractual terms. The Company also makes provisions for estimated sales returns and other adjustments at the time revenue is recognized based upon contractual terms and an analysis of historical returns. Provisions for sales returns and other adjustments were not material to the consolidated financial statements for any of the periods presented.The Company provides a comprehensive suite of services for its customers that range from advanced product design to manufacturing and logistics to after-sales services. The Company recognizes service revenue when the services have been performed, and the related costs are expensed as incurred. Sales for services were less than 10% of the Company's total sales for all periods presented, and accordingly, are included in net sales in the consolidated statements of operations.The Company recognized research and development costs primarily related to its design and innovations businesses of $75.5 million, $35.2 million, and $30.0 million for the fiscal years ended March 31, 2016, 2015 and 2014, respectively.
Concentration of Credit RiskFinancial instruments which potentially subject the Company to concentrations of credit risk are primarily accounts receivable, cash and cash equivalents, and derivative instruments.Customer Credit RiskThe Company has an established customer credit policy, through which it manages customer credit exposures through credit evaluations, credit limit setting, monitoring, and enforcement of credit limits for new and existing customers. The55FLEXTRONICS INTERNATIONAL LTD.NOTES TO CONSOLIDATED FINANCIAL STATEMENTS (Continued)2. SUMMARY OF ACCOUNTING POLICIES (Continued)Company performs ongoing credit evaluations of its customers' financial condition and makes provisions for doubtful accounts based on the outcome of those credit evaluations. The Company evaluates the collectability of its accounts receivable based on specific customer circumstances, current economic trends, historical experience with collections and the age of past due receivables. To the extent the Company identifies exposures as a result of credit or customer evaluations, the Company also reviews other customer related exposures, including but not limited to inventory and related contractual obligations.Concentration of Credit RiskFinancial instruments which potentially subject the Company to concentrations of credit risk are primarily accounts receivable, cash and cash equivalents, and derivative instruments.FLEXTRONICS INTERNATIONAL LTD.NOTES TO CONSOLIDATED FINANCIAL STATEMENTS (Continued)2. SUMMARY OF ACCOUNTING POLICIES (Continued)The following table summarizes the activity in the Company's allowance for doubtful accounts during fiscal years 2016, 2015
2014and2013:Balance at
Beginning
of YearCharged to
Costs and
ExpensesDeductions/
Write-OffsBalance at
End of
Year(In thousands) Allowance for doubtful accounts:
Year ended March 31, 2013(1)
$ 38,905 $ 6,643 $ (34,671 ) $ 10,877 Year ended March 31, 2014
$ 10,877 $ 2,029 $ (7,377 ) $ 5,529 Year ended March 31, 2015
$ 5,529 $ 650 $ (1,645 ) $ 4,534
2014:Balance at
Beginning
of YearCharged to
Costs and
ExpensesDeductions/
Write-OffsBalance at
End of
Year(In thousands) Allowance for doubtful accounts: Year ended March 31, 2014 $ 10,877 $ 2,029 $ (7,377 ) $ 5,529 Year ended March 31, 2015 $ 5,529 $ 650 $ (1,645 ) $ 4,534 Year ended March 31, 2016 $ 4,534 $ 72,295 $ (12,221 ) $ 64,608 On April 21st, 2016, one of the Company's customers, SunEdison Inc. (together with certain of its subsidiaries, "SunEdison"), filed a petition for reorganization under bankruptcy law. For the fiscal year2013 includesended March 31, 2016, the Company recognized a$28.0bad debt reserve charge of $61.0 millionwrite off relatedassociated with its outstanding SunEdison receivables, and another charge of $10.5 million relating to afiscal year 2012 charge for aseparate distressed customerand $5.8 millionwhich waspreviously reserved andalso written-off during theunderlying accounts receivable balance was reclassified to non-current assets in fiscal year 2013 and was carried net of its specific reserve.year.One customer (including net sales from its current and former parent companies, through the dates of their respectiveownership during the current fiscal year)ownership), which is within the Company's CTGbusiness group,segment, accounted for approximately 11%, 17%, and 13% of the Company's net sales in fiscal years 2016, 2015 and 2014, respectively, and approximately15%11% and14%15% of the Company's total accounts receivable balances in fiscal years 2016 and 2015,and 2014,respectively.NoAnother customer included in the Company's CEC segment, accounted forgreater than 10%approximately 11% of the Company'snet salestotal accounts receivable balance in fiscal year2013.2016.The Company's ten largest customers accounted for approximately50%46%,52%50% and47%52%, of its net sales in fiscal years 2016, 2015 and 2014, respectively.Derivative InstrumentsThe amount subject to credit risk related to derivative instruments is generally limited to the amount, if any, by which a counterparty's obligations exceed the obligations of the Company with that counterparty. To manage counterparty risk, the Company limits its derivative transactions to those with recognized financial institutions. See additional discussion of derivatives in note 8.Cash and2013, respectively.Cash Equivalents
The Company maintains cash and cash equivalents with various financial institutions that management believes to be of high credit quality. These financial institutions are located in many different locations throughout the world. The Company's investment portfolio, which consists of short-term bank deposits and money market accounts, is classified as cash equivalents on the consolidated balance sheets.The amount subject to credit risk related to derivative instruments is generally limited to the amount, if any, by which a counterparty's obligations exceed the obligations of the Company with that counterparty. To manage counterparty risk, the Company limits its derivative transactions to those with recognized financial institutions. See additional discussion of derivatives in note 8.Cash and Cash EquivalentsAll highly liquid investments with maturities of three months or less from original dates of purchase are carried at cost, which approximates fair market value, and are considered to be cash equivalents. Cash and cash equivalents consist of cash deposited in checking accounts, money market funds and time deposits.FLEXTRONICS INTERNATIONAL LTD.NOTES TO CONSOLIDATED FINANCIAL STATEMENTS (Continued)2. SUMMARY OF ACCOUNTING POLICIES (Continued)Cash and cash equivalents consisted of the following:
56FLEXTRONICS INTERNATIONAL LTD.NOTES TO CONSOLIDATED FINANCIAL STATEMENTS (Continued)2. SUMMARY OF ACCOUNTING POLICIES (Continued)As of March 31, 2015 2014 (In thousands) Cash and bank balances
$ 953,549 $ 1,040,800 Money market funds and time deposits
674,859 552,928 $ 1,628,408 $ 1,593,728 As of March 31, 2016 2015 (In thousands) Cash and bank balances $ 533,438 $ 953,549 Money market funds and time deposits 1,074,132 674,859 $ 1,607,570 $ 1,628,408 InventoriesInventories are stated at the lower of cost (on a first-in, first-out basis) or market value. The stated cost is comprised of direct materials, labor and overhead. The components of inventories, net of lower of cost or market write-downs, were as follows:As of March 31, 2015 2014 (In thousands) Raw materials
$ 2,330,428 $ 2,349,278 Work-in-progress
557,786 608,284 Finished goods
600,538 641,446 $ 3,488,752 $ 3,599,008 As of March 31, 2016 2015 (In thousands) Raw materials $ 2,234,512 $ 2,330,428 Work-in-progress 561,282 557,786 Finished goods 695,862 600,538 $ 3,491,656 $ 3,488,752 Property and Equipment, NetProperty and equipment are stated at cost, less accumulated depreciation and amortization. Depreciation and amortization are recognized on a straight-line basis over the estimated useful lives of the related assets, with the exception of building leasehold improvements, which are amortized over the term of the lease, if shorter. Repairs and maintenance costs are expensed as incurred. Property and equipment was comprised of the following:As of March 31, Depreciable
Life
(In Years)Depreciable
Life
(In Years)As of March 31, 2015 2014 2016 2015 (In thousands) (In thousands) Machinery and equipment
3 - 10 $ 2,928,903 $ 2,929,449 3 - 10 $ 3,187,590 $ 2,928,903 Buildings
30 1,067,837 1,069,376 30 1,144,798 1,067,837 Leasehold improvements
up to 30 459,926 470,960 up to 30 397,340 459,926 Furniture, fixtures, computer equipment and software
3 - 7 440,878 427,038 3 - 7 477,203 440,878 Land
— 123,633 127,567 — 127,927 123,633 Construction-in-progress
— 140,786 88,687 — 178,851 140,786 5,161,963 5,113,077 5,513,709 5,161,963 Accumulated depreciation and amortization
(3,069,796 ) (2,824,421 ) (3,256,076 ) (3,069,796 ) Property and equipment, net
$ 2,092,167 $ 2,288,656 $ 2,257,633 $ 2,092,167 FLEXTRONICS INTERNATIONAL LTD.NOTES TO CONSOLIDATED FINANCIAL STATEMENTS (Continued)2. SUMMARY OF ACCOUNTING POLICIES (Continued)Total depreciation expense associated with property and equipment amounted to approximately $425.7 million, $496.8 million$424.8 millionand$412.3$424.8 million in fiscal years 2016, 2015 and 2014,and 2013,respectively.The Company reviews property and equipment for impairment at least annually and whenever events or changes in circumstances indicate that the carrying amount of an asset may not be recoverable. Recoverability of property and equipment ismeasureddetermined by comparing its carrying amount to the lowest level of identifiable projected undiscounted cash flows the57FLEXTRONICS INTERNATIONAL LTD.NOTES TO CONSOLIDATED FINANCIAL STATEMENTS (Continued)2. SUMMARY OF ACCOUNTING POLICIES (Continued)property and equipment are expected to generate. An impairment loss is recognized when the carrying amount of property and equipment exceeds its fair value.Deferred Income TaxesThe Company provides for income taxes in accordance with the asset and liability method of accounting for income taxes. Under this method, deferred income taxes are recognized for the tax consequences of temporary differences between the carrying amount and the tax basis of existing assets and liabilities by applying the applicable statutory tax rate to such differences. Additionally, the Company assesses whether each income tax position is "more likely than not" of being sustained on audit, including resolution of related appeals or litigation, if any. For each income tax position that meets the "more likely than not" recognition threshold, the Company would then assess the largest amount of tax benefit that is greater than 50% likely of being realized upon effective settlement with the tax authority.Accounting for Business and Asset AcquisitionsThe Company has actively pursued business and asset acquisitions, which are accounted for using the acquisition method of accounting. The fair value of the net assets acquired and the results of the acquired businesses are included in the Company's consolidated financial statements from the acquisition dates forward. The Company is required to make estimates and assumptions that affect the reported amounts of assets and liabilities and results of operations during the reporting period. Estimates are used in accounting for, among other things, the fair value of acquired net operating assets, property and equipment, intangible assets and related deferred tax liabilities, useful lives of plant and equipment and amortizable lives for acquired intangible assets. Any excess of the purchase consideration over the fair value of the identified assets and liabilities acquired is recognized as goodwill.The Company estimates the preliminary fair value of acquired assets and liabilities as of the date of acquisition based on information available at that time. Contingent consideration is recorded at fair value as of the date of the acquisition with subsequent adjustments recorded in earnings. Changes to valuation allowances on acquired deferred tax assets are recognized in the provision for, or benefit from, income taxes. The valuation of these tangible and identifiable intangible assets and liabilities is subject to further management review and may change materially between the preliminary allocation and end of the purchase price allocation period. Any changes in these estimates may have a material effect on the Company's consolidated operating results or financial position.Goodwill and Other Intangible AssetsGoodwill is tested for impairment on an annual basis and whenever events or changes in circumstances indicate that the carrying amount of goodwill may not be recoverable. Recoverability ofFLEXTRONICS INTERNATIONAL LTD.NOTES TO CONSOLIDATED FINANCIAL STATEMENTS (Continued)2. SUMMARY OF ACCOUNTING POLICIES (Continued)goodwill is measured at the reporting unit level by comparing the reporting unit's carrying amount, including goodwill, to the fair value of the reporting unit, which is measured based upon, among other factors, market multiples for comparable companies as well as a discounted cash flow analysis. If the recorded value of the assets, including goodwill, and liabilities ("net book value") of each reporting unit exceeds its fair value, an impairment loss may be required to be recognized. Further, to the extent the net book value of the Company as a whole is greater than its fair value in the aggregate, all, or a significant portion of its goodwill may be considered impaired.
As discussed in note 19, the Company concluded that as of the fourth quarter of fiscal year 2015 it has four reportable operating segments: HRS, CTG, IEI andINSCEC and concluded these same four segments also represented its reporting units. The Company assessed that there was no change to its reporting units in fiscal year 2016 and performed its goodwill impairment assessment on January 1,20152016, and did not elect to perform the qualitative "Step Zero" assessment. Instead, the Company performed a quantitative assessment of its goodwill and determined that no impairment existed as of the date of the impairment test because the fair value of each reporting unit exceeded its carrying value.The Company changed the date58FLEXTRONICS INTERNATIONAL LTD.NOTES TO CONSOLIDATED FINANCIAL STATEMENTS (Continued)2. SUMMARY OF ACCOUNTING POLICIES (Continued)The following table summarizes the activity in the Company's goodwill at the one reporting unit level through December 31, 2014, and at the four reporting unit level from January 1, 2015 through March 31,20152016 (in thousands):HRS CTG IEI INS Total Balance, as of March 31, 2013
$ — $ — $ — $ — $ 262,005 Additions(1)
— — — — 26,270 Purchase accounting adjustments(2)
— — — — 4,034 Foreign currency translation adjustments
— — — — 449 Balance, as of March 31, 2014
— — — — 292,758 Additions(1)
— — — — 36,467 Purchase accounting adjustments(2)
— — — — 8,651 Foreign currency translation adjustments
— — — — (3,393 ) Balance, as of December 31, 2014(3)
93,990 68,234 64,221 108,038 334,483 Purchase accounting adjustments(2)
(656 ) — — — (656 ) Foreign currency translation adjustments
(196 ) — — — (196 ) Balance, as of March 31, 2015
$ 93,138 $ 68,234 $ 64,221 $ 108,038 $ 333,631 HRS CTG IEI CEC Total Balance, as of March 31, 2014 $ — $ — $ — $ — $ 292,758 Additions (1) — — — — 36,467 Purchase accounting adjustments (2) — — — — 8,651 Foreign currency translation adjustments — — — — (3,393 ) Balance, as of December 31, 2014 (3) 93,990 68,234 64,221 108,038 334,483 Purchase accounting adjustments (2) (656 ) — — — (656 ) Foreign currency translation adjustments (196 ) — — — (196 ) Balance, as of March 31, 2015 93,138 68,234 64,221 108,038 333,631 Additions (1) 340,610 — 258,582 3,655 602,847 Purchase accounting adjustments (2) 125 — — — 125 Foreign currency translation adjustments 5,463 — — — 5,463 Balance, as of March 31, 2016 $ 439,336 $ 68,234 $ 322,803 $ 111,693 $ 942,066 FLEXTRONICS INTERNATIONAL LTD.NOTES TO CONSOLIDATED FINANCIAL STATEMENTS (Continued)2. SUMMARY OF ACCOUNTING POLICIES (Continued)(1) The goodwill generated from the Company's business combinations completed during the fiscal years 2016 and 2015 are primarily related to value placed on the employee workforce, service offerings and capabilities and expected synergies. The goodwill is not deductible for income tax purposes. Refer to the discussion of the Company's business acquisitions in note 17. (2) Includes adjustments based on management's estimates resulting from their review and finalization of the valuation of assets and liabilities acquired through certain business combinations completed in a period subsequent to the respective acquisition. These adjustments were not individually, nor in the aggregate, significant to the Company. (3) Goodwill is allocated to each of the reporting units based on the relative fair values assessed in conjunction with the goodwill impairment testing conducted as of January 1, 2015. The Company's acquired intangible assets are subject to amortization over their estimated useful lives and are reviewed for impairment whenever events or changes in circumstances indicate that the carrying amount of an intangible asset may not be recoverable. An impairment loss is recognized when the carrying amount of an intangible asset exceeds its fair value. The Company reviewed the carrying value of its intangible assets as of March 31,20152016 and concluded that such amounts continued to be recoverable.Intangible assets are comprised of customer-related intangible assets, that include contractual agreements and customer relationships; and licenses and other intangible assets, that are primarily comprised of licenses and also includes patents and trademarks, and developed technologies. Generally, both customer-related intangible assetsare amortized on an accelerated method based on expected cash flows, primarily over a period of up to eight years. Licensesand licenses and other intangible assets aregenerallyamortized on a straight line basis, over a period of up toseventen years. No residual value is estimated for any intangible assets. The fair value of the Company's intangible assets purchased through business combinations is determined based on management's estimates of cash flow and recoverability. The components of acquired intangible assets are as follows:59FLEXTRONICS INTERNATIONAL LTD.NOTES TO CONSOLIDATED FINANCIAL STATEMENTS (Continued)2. SUMMARY OF ACCOUNTING POLICIES (Continued)As of March 31, 2015 As of March 31, 2014 As of March 31, 2016 As of March 31, 2015 Gross
Carrying
AmountAccumulated
AmortizationNet
Carrying
AmountGross
Carrying
AmountAccumulated
AmortizationNet
Carrying
AmountGross
Carrying
AmountAccumulated
AmortizationNet
Carrying
AmountGross
Carrying
AmountAccumulated
AmortizationNet
Carrying
Amount(In thousands) (In thousands) Intangible assets:
Customer-related intangibles
$ 133,853 $ (80,506 ) $ 53,347 $ 204,369 $ (140,713 ) $ 63,656 $ 223,046 $ (66,473 ) $ 156,573 $ 133,853 $ (80,506 ) $ 53,347 Licenses and other intangibles
39,985 (11,788 ) 28,197 32,564 (11,760 ) 20,804 285,053 (37,872 ) 247,181 39,985 (11,788 ) 28,197 Total
$ 173,838 $ (92,294 ) $ 81,544 $ 236,933 $ (152,473 ) $ 84,460 $ 508,099 $ (104,345 ) $ 403,754 $ 173,838 $ (92,294 ) $ 81,544 The gross carrying amounts of intangible assets are removed when fully amortized. During fiscal year2015,2016, the gross carrying amounts ofsuchfully amortized intangible assetsfully amortizedtotaled$94.9$51.7 million. During the year ended March 31,2015,2016, theCompany's customer-relatedtotal value of intangible assets increasedby $16.1 millionprimarily in connection with the Company's acquisitions of Mirror Controls International ("MCi") and NEXTracker Inc. ("NEXTracker"). The MCi acquisition contributed an additional $75.5 million in customer-related intangible assets, and $161.3 million in licenses and other intangible assets,increased by $15.7and the NEXTracker acquisition contributed an additional $47.3 millionprimarily as a result of the purchase of certain technology rights.in customer-related intangible assets and $61.4 million in licenses and other intangible assets. Total intangible asset amortization expense recognized incontinuingoperations during fiscal years 2016, 2015 and 2014and 2013was $66.0 million, $32.0 million$28.9 millionand$29.5$28.9 million, respectively. As of March 31,2015,2016, the weighted-average remaining useful lives of the Company's intangible assets were approximately4.66.8 years and4.27.5 years for customer-related intangibles, and licenses and other intangible assets,FLEXTRONICS INTERNATIONAL LTD.NOTES TO CONSOLIDATED FINANCIAL STATEMENTS (Continued)2. SUMMARY OF ACCOUNTING POLICIES (Continued)respectively. The estimated future annual amortization expense for acquired intangible assets is as follows:
Fiscal Year Ending March 31,Amount Amount (In thousands) (In thousands) 2016
$ 27,449 2017
19,701 $ 76,921 2018
14,000 62,474 2019
9,760 55,844 2020
5,224 47,252 2021 42,961 Thereafter
5,410 118,302 Total amortization expense
$ 81,544 $ 403,754 Derivative Instruments and Hedging ActivitiesAll derivative instruments are recognized on the consolidated balance sheets at fair value. If the derivative instrument is designated as a cash flow hedge, effectiveness is tested monthly using a regression analysis of the change in the spot currency rates and the change in the present value of the spot currency rates. The spot currency rates are discounted to present value using functional currencyLIBOR ratesInter-bank Offering Rates over the maximum length of the hedge period. The effective portion of changes in the fair value of the derivative instrument (excluding time value) is recognized in shareholders' equity as a separate component of accumulated other comprehensive income (loss), and recognized in the consolidated statements of operations when the hedged item affects earnings. Ineffective and excluded portions of changes in the fair value of cash flow hedges are recognized in earnings immediately. If the derivative instrument is designated as a fair value hedge, the changes in the fair value of the derivative instrument and of the hedged item attributable to the hedged risk are recognized in earnings in the current period. Additional information is included in note 8.Other Current AssetsOther current assetsincludesinclude approximately$600.7$501.1 million and$470.9$600.7 million as of March 31,20152016 and2014,2015, respectively for the deferred purchase price receivable from the Company's Global and North American Asset-Backed Securitization programs. See note 10 for additional information.Other60FLEXTRONICS INTERNATIONAL LTD.NOTES TO CONSOLIDATED FINANCIAL STATEMENTS (Continued)2. SUMMARY OF ACCOUNTING POLICIES (Continued)Also included in other current assetsasis the value ofMarch 31, 2015 and 2014 includedcertain assets purchased on behalf of a customer and financed by a third party banking institution in the amounts of $83.6 million and $169.2 million as of March 31, 2016 and$267.5 million,2015, respectively, as further described in note 17.Additionally, other current assets as of March 31, 2016 includes an amount of $36.7 million relating to these assets that have been sold to third parties but not yet collected.
InvestmentsThe Company has certain equity investments in, and notes receivable from, non-publicly traded companies which are included within other assets. The equity method of accounting is used when the Company has the ability to significantly influence the operating decisions of the issuer; otherwise the cost method is used. Non-majority-owned investments in corporations are accounted for using the equity method when the Company has an ownership percentage equal to or generally greater than 20% but less than 50%, and for non-majority-owned investments in partnerships when generally greater thanFLEXTRONICS INTERNATIONAL LTD.NOTES TO CONSOLIDATED FINANCIAL STATEMENTS (Continued)2. SUMMARY OF ACCOUNTING POLICIES (Continued)5%. The Company monitors these investments for impairment indicators and makes appropriate reductions in carrying values as required. Fair values of these investments, when required, are estimated using unobservable inputs, primarily comparable company multiples and discounted cash flow projections.
As of March 31,20152016 and2014,2015, the Company's equity investments in non-majority owned companies totaled$87.0$122.9 million and$77.4$87.0 million, respectively. The equity in the earnings or losses of the Company's equity method investments was not material to the consolidated results of operations for any period presented and is included in interest and other, net.Other Current LiabilitiesOther current liabilities include customer working capital advances of$189.6$253.7 million and$754.7$189.6 million, customer-related accruals of$454.8$479.5 million and$327.5$454.8 million, and deferred revenue of$272.6$332.3 million and$296.3$272.6 million as of March 31,20152016 and2014,2015, respectively. The customer working capital advances are not interest bearing, do not have fixed repayment dates and are generally reduced as the underlying working capital is consumed in production. Other current liabilitiesas of March 31, 2015 and 2014also included the outstanding balances due to the third party banking institution related to the financed equipment discussed abovethat amounted toof $122.0 million and $197.7 million as of March 31, 2016 and$286.5 million,2015, respectively, as further described in note 17.Restructuring ChargesThe Company recognizes restructuring charges related to its plans to close or consolidate excess manufacturing and administrative facilities. In connection with these activities, the Company records restructuring charges for employee termination costs, long-lived asset impairment and other exit-related costs.The recognition of restructuring charges requires the Company to make certain judgments and estimates regarding the nature, timing and amount of costs associated with the planned exit activity. To the extent the Company's actual results differ from its estimates and assumptions, the Company may be required to revise the estimates of future liabilities, requiring the recognition of additional restructuring charges or the reduction of liabilities already recognized. Such changes to previously estimated amounts may be material to the consolidated financial statements. At the end of each reporting period, the Company evaluates the remaining accrued balances to ensure that no excess accruals are retained and the utilization of the provisions are for their intended purpose in accordance with developed exit plans. See note 14 for additional information regarding restructuring charges.RecentRecently Adopted Accounting PronouncementsInApril 2015,March 2016, the Financial Accounting Standards Board ("FASB") issued new guidance which eliminates the requirement to apply the equity method of accounting retrospectively when a reporting entity obtains significant influence over a previously held investment. The Company has elected to early adopt this new guidance during the fourth quarter of fiscal year 2016 on a prospective basis as permitted under the new guidance, and the impact was not material.In November 2015, the FASB issued new guidance to eliminate the requirement for companies to separate deferred income tax assets and liabilities into current and noncurrent amounts on the balance sheet. Instead, companies will be required to classify all deferred tax liabilities and assets as noncurrent. The Company elected to early adopt this new guidance during the third quarter of fiscal year 2016 on a prospective basis as permitted under the new guidance, resulting in the reclassification of $66.3 million of deferred income tax assets and $9.1 million of deferred income tax liabilities from current into noncurrent as61FLEXTRONICS INTERNATIONAL LTD.NOTES TO CONSOLIDATED FINANCIAL STATEMENTS (Continued)2. SUMMARY OF ACCOUNTING POLICIES (Continued)of March 31, 2016. Prior periods were not retrospectively adjusted.In September 2015, the FASB issued new guidance to simplify the accounting for adjustments made to provisional amounts recognized in a business combination. Under previous guidance, the acquirer retrospectively adjusted the provisional amounts recognized at the acquisition date with a corresponding adjustment to goodwill, and would have to revise comparative information for prior periods presented in financial statements as needed. The update requires an entity to present separately on the face of the income statement or disclose in the notes the portion of the amount recorded in current-period earnings by line item that would have been recorded in previous reporting periods if the adjustment to the provisional amounts had been recognized as of the acquisition date. The Company has elected to early adopt this new guidance which is effective for the Company beginning the third quarter of fiscal year 2016, and the impact was not material.In April 2015, the FASB issued new guidance which changes the presentation of debt issuance costs in financial statements. Under the new guidance, an entity presents such costs in the balance sheet as a direct deduction from the related debt liability rather than as anasset. Amortizationasset, with amortization of the costsisbeing reported as interest expense. The Company has elected to early adopt during the fourth quarter of fiscal year 2016, and retrospectively adjusted all prior balance sheets presented. As a result of the adoption, $12.7 million of debt issuance costs associated with the Company’s bank borrowings and long-term debt as of March 31, 2015, were reclassified from other noncurrent assets, to short-term and long-term debt in the consolidated balance sheet.Recently Issued Accounting PronouncementsIn March 2016, the FASB issued new guidance intended to reduce the cost and complexity of the accounting for share-based payments. The new guidance simplifies various aspects of the accounting for share-based payments including income tax effects, withholding requirements and forfeitures. The Company will be required to adopt the new guidance beginning with the first quarter of fiscal year 2018, with early adoption permitted. The Company is currently assessing the impact of this update and the timing of adoption.In February 2016, the FASB issued new guidance intended to improve financial reporting on leasing transactions. The new lease guidance will require entities that lease assets to recognize on the balance sheet the assets and liabilities for the rights and obligations created by those leases with lease terms of more than 12 months. The guidance will also enhance existing disclosure requirements relating to those leases. The Company will be required to adopt the new lease guidance beginning with the first quarter of fiscal year 2020, with early adoption permitted. Upon initial evaluation, the Company believes the new guidance will have a material impact on its consolidated balance sheets when adopted. The Company is currently assessing the timing of adoption.In July 2015, the FASB issued new guidance to simplify the measurement of inventory, by requiring that inventory be measured at the lower of cost and net realizable value. Prior to the issuance of the new guidance, inventory was measured at the lower of cost or market. This guidance is effective for the Company beginning in the first quarter of fiscal year2017 and2018, with earlyadoption isapplication permittedin an interim period with any adjustments reflectedas of the beginning ofthe fiscal year that includes thatan interim or annual reporting period. TheguidanceCompany isnot expected to have a significantcurrently assessing the impacttoof this update and theCompany's consolidated financial statements.timing of adoption.FLEXTRONICS INTERNATIONAL LTD.NOTES TO CONSOLIDATED FINANCIAL STATEMENTS (Continued)2. SUMMARY OF ACCOUNTING POLICIES (Continued)In May 2014, the FASB issued new guidance which requires an entity to recognize revenue relating to contracts with customers that depicts the transfer of promised goods or services to customers in an amount reflecting the consideration to which the entity expects to be entitled in exchange for such goods or services. In order to meet this requirement, the entity must apply the following steps: (i) identify the contracts with the customers; (ii) identify performance obligations in the contracts; (iii) determine the transaction price; (iv) allocate the transaction price to the performance obligations per the contracts; and (v) recognize revenue when (or as) the entity satisfies a performance obligation. Additionally, disclosures required for revenue recognition will include qualitative and quantitative information about contracts with customers, significant judgments and changes in judgments, and assets recognized from costs to obtain or fulfill a contract. InAprilJuly 2015, the FASBproposed to deferdeferred the effective date of the standard by a year, andif such proposal is adopted, thisas a result, the guidance is effective for the Company beginning in the first quarter of fiscal year 2019. The Companyis in the process of assessinghas assessed that the impact of the new guidance will result in a change of the Company's revenue recognition model from "point in time" upon physical delivery to an "over time" model and believes this transition will have a material impact onitsthe Company's consolidated financialstatements.In April 2014, the Financial Accounting Standards Board issued guidance which requires an entity to report a disposalstatements upon adoption.62FLEXTRONICS INTERNATIONAL LTD.NOTES TO CONSOLIDATED FINANCIAL STATEMENTS (Continued)3. SHARE-BASED COMPENSATIONEquity Compensation PlansDuring fiscal year 2015, the Company grantedThe Company's primary plan used for granting equity compensation awardsunderis the 2010 Equity Incentive Plan (the "2010 Plan").During fiscal year 2016, in conjunction with the acquisition of NEXTracker, the Company assumed all of the outstanding, unvested share bonus awards and outstanding, unvested options to purchase shares of common stock of NEXTracker, and converted all these shares into Flex awards. As a result, the Company offers an additional equity compensation plan as of March 31, 2016, the 2014 NEXTracker Equity Incentive Plan (the "NEXTracker Plan").Further, during fiscal year 2016, the Company granted equity compensation awards under a third plan, the 2013 Elementum Plan (the "Elementum Plan"). The 2010 Plan is administered by Flextronics International Ltd.,while the Elementum Planwhich is administered by Elementum SCM (Cayman) Limited ("Elementum"), a majority owned subsidiary of the Company.Share-Based Compensation ExpenseThe following table summarizes the Company's share-based compensation expense for all Equity Incentive Plans:Fiscal Year Ended March 31, 2016 2015 2014 (In thousands) Cost of sales $ 8,986 $ 7,503 $ 6,540 Selling, general and administrative expenses 68,594 42,767 33,899 Total share-based compensation expense $ 77,580 $ 50,270 $ 40,439 As required by the authoritative guidance for stock-based compensation, management made an estimate of expected forfeitures and is recognizing compensation costs only for those equity awards expected to vest. When estimating forfeitures, the Company considers voluntary termination behavior as well as an analysis of actual forfeitures.Cash flows resulting from excess tax benefits (tax benefits related to the excess of proceeds from employee exercises of share options over the share-based compensation cost recognized for those options) are classified as financing cash flows. During fiscal years 2016, 2015 and 2014, the Company did not recognize any excess tax benefits as a financing cash inflow.The 2010 Equity Incentive Planof Flextronics International Ltd.As of March 31,2015,2016, the Company had approximately34.627.1 million shares available for grant under the 2010 Plan. Options issued to employees under the 2010 Plan generally vest over four years and expire seven years from the date of grant. Options granted to non-employee directors expire five years from the date of grant.The exercise price of options granted to employees is determined by the Company's Board of Directors or the Compensation Committee and may not be less than the closing price of the Company's ordinary shares on the date of grant.As of March 31, 2016, the total unrecognized compensation cost, net of estimated forfeitures, related to unvested share options granted to employees under the 2010 Plan was not significant and will be amortized on a straight-line basis over a weighted-average period of approximately 2.3 years, adjusted for estimated forfeitures.The Company also grants share bonus awards under its equity compensation plan. Share bonus awards are rights to acquire a specified number of ordinary shares for no cash consideration in exchange for continued service with the Company. Share bonus awards generally vest in installments over a three tofive yearfive-year period and unvested share bonus awards are forfeited upon termination of employment.FLEXTRONICS INTERNATIONAL LTD.NOTES TO CONSOLIDATED FINANCIAL STATEMENTS (Continued)3. SHARE-BASED COMPENSATION (Continued)employment.Vesting for certain share bonus awards is contingent upon both service and market conditions.Share-Based Compensation Expense
Further, vesting for certain share bonus awards granted to certain executive officers is contingent upon meeting certain free cash flow targets.The following table summarizes the Company's share-based compensation expense:63FLEXTRONICS INTERNATIONAL LTD.NOTES TO CONSOLIDATED FINANCIAL STATEMENTS (Continued)3. SHARE-BASED COMPENSATION (Continued)Fiscal Year Ended March 31, 2015 2014 2013 (In thousands) Cost of sales
$ 7,503 $ 6,540 $ 5,163 Selling, general and administrative expenses
42,767 33,899 29,366 Total share-based compensation expense
$ 50,270 $ 40,439 $ 34,529 As required by the authoritative guidance for stock-based compensation, management made an estimate of expected forfeitures and is recognizing compensation costs only for those equity awards expected to vest. When estimating forfeitures, the Company considers voluntary termination behavior as well as an analysis of actual forfeitures.As of March 31,2015, the total unrecognized compensation cost related to unvested share options granted to employees under the Company's 2010 Plan was approximately $0.1 million, net of estimated forfeitures. This cost will be amortized on a straight-line basis over a weighted-average period of approximately 2.0 years and will be adjusted for estimated forfeitures. As of March 31, 2015,2016, the total unrecognized compensation cost related to unvested share bonus awards granted to employees was approximately$90.2$97.9 million, net of estimatedforfeitures. This costforfeitures, under the 2010 Plan. These costs will be amortized generally on a straight-line basis over a weighted-average period of approximately 2.5 years,and will beadjusted for estimated forfeitures. Approximately$15.4$13.7 million of the unrecognized compensation cost related to the 2010 Plan, net of estimated forfeitures, is related to share bonus awards granted to certain key employees whereby vesting is contingent on meeting a certain market condition.Cash flows resulting from excess tax benefits (tax benefits related to the excess of proceeds from employee exercises of share options over the share-based compensation cost recognized for those options) are classified as financing cash flows. During fiscal years 2015, 2014 and 2013, the Company did not recognize any excess tax benefits as a financing cash inflow.Determining Fair Value- Options and share bonus awards
OptionsValuation and Amortization Method—The Company estimates the fair value of share options granted under the 2010 Plan using the Black-Scholes valuation method and a single option award approach. This fair value is then amortized on a straight-line basis over the requisite service periods of the awards, which is generally the vesting period. The fair market value of share bonus awards granted, other than those awards with a market condition, is the closing price of the Company's ordinary shares on the date of grant and is generally recognized as compensation expense on a straight-line basis over the respective vesting period.
FLEXTRONICS INTERNATIONAL LTD.NOTES TO CONSOLIDATED FINANCIAL STATEMENTS (Continued)3. SHARE-BASED COMPENSATION (Continued)Expected Term—The Company's expected term used in the Black-Scholes valuation method represents the period that the Company's share options are expected to be outstanding and is determined based on historical experience of similar awards, giving consideration to the contractual terms of the share options, vesting schedules and expectations of future employee behavior as influenced by changes to the terms of its share options.
Expected Volatility—The Company's expected volatility used in the Black-Scholes valuation method is derived from a combination of implied volatility related to publicly traded options to purchaseFlextronicsFlex ordinary shares and historical variability in the Company's periodic share price.Expected Dividend—The Company has never paid dividends on its ordinary shares and accordingly the dividend yield percentage is zero for all periods.Risk-Free Interest Rate—The Company bases the risk-free interest rate used in the Black-Scholes valuation method on the implied yield currently available on U.S. Treasury constant maturities issued with a term equivalent to the expected term of the option.There were no options granted under the 2010 Plan during fiscalyearyears 2016 and 2014. The fair value of the Company's share options granted to employees for fiscalyearsyear 2015and 2013was estimated using the following weighted-average assumptions:Fiscal Year Ended
March 31,2015 2013 Expected term
6.3 years 4.1 years Expected volatility
46.9% 46.9% Expected dividends
0.0% 0.0% Risk-free interest rate
2.3% 0.9% Weighted-average fair value
$4.85 $2.48 Fiscal Year Ended
March 31,2015 Expected term 6.3 years Expected volatility 46.9% Expected dividends 0.0% Risk-free interest rate 2.3% Weighted-average fair value $4.85 Options granted duringthefiscal year 2015and 2013 fiscal yearshad contractual lives of seven years.Determining Fair Value - Share bonus awards with service and market conditionsValuation and Amortization Method—The Company estimates the fair value of share bonus awards granted under the 2010 Plan whereby vesting is contingent on meeting certain market conditions using Monte Carlo simulation. This fair value is then amortized on a straight-line basis over the vesting period, which is the service period.Expected volatility ofFlextronicsFlex—Volatility used in a Monte Carlo simulation is derived from the historical volatility ofFlextronics'Flex's stock price over a period equal to the service period of the share bonus awards granted. The service period is three years for those share bonus awards granted in fiscal years 2016, 20152014and2013.2014.64FLEXTRONICS INTERNATIONAL LTD.NOTES TO CONSOLIDATED FINANCIAL STATEMENTS (Continued)3. SHARE-BASED COMPENSATION (Continued)Average peer volatility—Volatility used in a Monte Carlo simulation is derived from the historical volatilities of both the S&P 500 index and components of an extended Electronics Manufacturing Services ("EMS") group, comprised of global competitors of the Company within the same industry, forFLEXTRONICS INTERNATIONAL LTD.NOTES TO CONSOLIDATED FINANCIAL STATEMENTS (Continued)3. SHARE-BASED COMPENSATION (Continued)the share bonus awards granted in fiscal years 2016, 2015 and
2014, and historical volatilities of the S&P 500 index for the share bonus awards granted in fiscal year 2013 based on the various service periods.2014.
Average Peer Correlation—Correlation coefficients were used to model the movement ofFlextronics'Flex's stock price relative to both the S&P 500 index and peers in the extended EMS group for the share bonus awards granted in fiscal years 2016, 2015 and2014, and relative to the S&P 500 index for the share bonus awards granted in fiscal year 2013.2014.Expected Dividend—The Company has never paid dividends on its ordinary sharesandaccordingly the dividend yield percentage is zero for all periods.Risk-Free Interest Rate assumptions—
The Company bases the risk-free interest rate used in the Monte Carlo simulation on the yield of zero-coupon U.S. Treasury bills,Same methodology asof the measurement date.discussed above.The fair value of the Company's share-bonus awards under the 2010 Plan, whereby vesting is contingent on meeting certain market conditions, for fiscal years 2016, 20152014and20132014 was estimated using the following weighted-average assumptions:Fiscal Year Ended
March 31,Fiscal Year Ended March 31, 2015 2014 2013 2016 2015 2014 Expected volatility
29.4 % 35.9 % 41.7 % 26.0 % 29.4 % 35.9 % Average peer volatility
25.9 % 35.7 % 19.2 % 23.0 % 25.9 % 35.7 % Average peer correlation
0.6 0.4 0.7 0.6 0.6 0.4 Expected dividends
0.0 % 0.0 % 0.0 % 0.0 % 0.0 % 0.0 % Risk-free interest rate
0.9 % 0.4 % 0.4 % 1.2 % 0.9 % 0.4 % Share-Based Awards ActivityThe following is a summary of option activity for the Company's 2010 Plan ("Price" reflects the weighted-average exercise price):Fiscal Year Ended March 31, 2015 2014 2013 Options Price Options Price Options Price Outstanding, beginning of fiscal year
23,612,872 $ 8.57 34,405,564 $ 8.29 43,933,660 $ 7.78 Granted
15,000 11.11 — — 19,000 6.57 Exercised
(3,600,900 ) 6.53 (6,572,383 ) 4.28 (5,398,331 ) 4.12 Forfeited
(4,034,078 ) 13.17 (4,220,309 ) 12.93 (4,148,765 ) 8.32 Outstanding, end of fiscal year
15,992,894 $ 7.81 23,612,872 $ 8.57 34,405,564 $ 8.29 Options exercisable, end of fiscal year
15,959,173 $ 7.81 23,373,101 $ 8.58 33,662,480 $ 8.31 Fiscal Year Ended March 31, 2016 2015 2014 Options Price Options Price Options Price Outstanding, beginning of fiscal year 15,992,894 $ 7.81 23,612,872 $ 8.57 34,405,564 $ 8.29 Granted — — 15,000 11.11 — — Exercised (10,006,774 ) 6.10 (3,600,900 ) 6.53 (6,572,383 ) 4.28 Forfeited (3,616,484 ) 12.23 (4,034,078 ) 13.17 (4,220,309 ) 12.93 Outstanding, end of fiscal year 2,369,636 $ 8.31 15,992,894 $ 7.81 23,612,872 $ 8.57 Options exercisable, end of fiscal year 2,359,527 $ 8.30 15,959,173 $ 7.81 23,373,101 $ 8.58 The aggregate intrinsic value of options exercised under the Company's 2010 Plan (calculated as the difference between the exercise price of the underlying award and the price of the Company's ordinary shares determined as of the time of option exercise for options exercised in-the-money)under the Company's 2010 Planwas $55.3 million, $16.3 million$24.7 millionand$13.0$24.7 million during fiscal years 2016, 2015 and 2014, respectively.Cash received from option exercises under the 2010 Plan was $61.1 million, $23.5 million and2013$28.1 million for fiscal years 2016, 2015 and 2014, respectively.65FLEXTRONICS INTERNATIONAL LTD.NOTES TO CONSOLIDATED FINANCIAL STATEMENTS (Continued)3. SHARE-BASED COMPENSATION (Continued)Cash received from option exercises was $23.5 million, $28.1 million and $22.3 million for fiscal years 2015, 2014 and 2013, respectively.The following table presents the composition of options outstanding and exercisable under the 2010 Plan as of March 31,2015:2016:Options Outstanding Options Exercisable Range of Exercise PricesNumber of
Shares
OutstandingWeighted
Average
Remaining
Contractual
Life
(In Years)Weighted
Average
Exercise
PriceNumber of
Shares
ExercisableWeighted
Average
Exercise
Price$1.94 - $2.26
4,665,815 0.79 $ 2.12 4,665,815 $ 2.12 $3.39 - $5.75
2,236,960 1.36 5.56 2,233,938 5.56 $5.87 - $7.07
79,118 2.03 6.42 68,217 6.43 $7.08 - $10.59
4,357,646 0.42 10.34 4,349,848 10.35 $10.67 - $11.41
831,555 1.19 11.22 819,555 11.22 $11.53 - $13.98
3,786,800 0.22 12.45 3,786,800 12.45 $14.34 - $23.02
35,000 1.42 15.95 35,000 15.95 $1.94 - $23.02
15,992,894 0.66 $ 7.81 15,959,173 $ 7.81 Options vested and expected to vest
15,989,753 0.66 $ 7.81 Options Outstanding Options Exercisable Range of Exercise Prices Number of
Shares
OutstandingWeighted
Average
Remaining
Contractual
Life
(In Years)Weighted
Average
Exercise
PriceNumber of
Shares
ExercisableWeighted
Average
Remaining
Contractual
Life
(In Years)WeightedAverageExercisePrice$1.94 - $5.75 1,148,421 0.40 $ 5.55 1,148,421 0.40 $ 5.55 $5.87 - $7.07 40,002 1.55 6.55 37,521 1.41 6.54 $7.08 - $10.59 323,646 1.76 8.25 323,646 1.76 8.25 $10.67 - $11.41 549,067 0.34 11.23 541,439 0.27 11.23 $11.53 - $13.98 273,500 0.50 13.37 273,500 0.50 13.37 $14.34 - $23.02 35,000 0.42 15.95 35,000 0.42 15.95 $1.94 - $23.02 2,369,636 0.60 $ 8.31 2,359,527 0.59 $ 8.30 Options vested and expected to vest 2,368,361 0.60 $ 8.31 As of March 31,2015,2016 the aggregate intrinsic value for options outstanding, options vested and expected to vest (which includes adjustments for expected forfeitures), and options exercisable under the Company's 2010 Plan, were$78.1 million, $78.1 million and $77.9$9.4 million, respectively. The aggregate intrinsic value is calculated as the difference between the exercise price of the underlying awards and the quoted price of the Company's ordinary shares as of March 31,20152016 for the approximately15.72.1 million options that were in-the-money at March 31,2015. As of March 31, 2015, the weighted average remaining contractual life for options exercisable was 0.65 years.2016.
The following table summarizes the Company's share bonus award activity under the 2010 Plan ("Price" reflects the weighted-average grant-date fair value):Fiscal Year Ended March 31, Fiscal Year Ended March 31, 2015 2014 2013 2016 2015 2014 Shares Price Shares Price Shares Price Shares Price Shares Price Shares Price Unvested share bonus awards outstanding, beginning of fiscal year
21,848,120 $ 7.32 21,807,069 $ 6.80 15,965,268 $ 6.91 18,993,252 $ 9.01 21,848,120 $ 7.32 21,807,069 $ 6.80 Granted
6,963,125 11.75 8,978,941 8.07 9,582,867 6.74 7,619,722 12.23 6,963,125 11.75 8,978,941 8.07 Vested
(7,246,056 ) 6.97 (5,481,153 ) 6.66 (1,506,234 ) 7.51 (8,529,378 ) 7.93 (7,246,056 ) 6.97 (5,481,153 ) 6.66 Forfeited
(2,571,937 ) 7.70 (3,456,737 ) 7.07 (2,234,832 ) 6.86 (1,083,520 ) 9.67 (2,571,937 ) 7.70 (3,456,737 ) 7.07 Unvested share bonus awards outstanding, end of fiscal year
18,993,252 $ 9.01 21,848,120 $ 7.32 21,807,069 $ 6.80 17,000,076 $ 10.77 18,993,252 $ 9.01 21,848,120 $ 7.32 Of the 7.6 million unvested share bonus awards granted under the 2010 Plan in fiscal year 2016, approximately 0.2 million have an average grant date price of $12.10 per share and represents the target amount of grants made to certain executive officers whereby vesting is contingent on meeting certain free cash flow targets. These awards ultimately vest over a range from zero up to a maximum of 0.4 million of the target payment based on a measurement of cumulative three-year increase of free cash flow from operations of the Company, and will cliff vest after a period of three-years.Another 0.2 million of unvested share bonus awards granted in fiscal year 2016 have an average grant date price of $12.06 per share and represents the target amount of grants made to certain employees whereby vesting is contingent on meeting certain operating profit targets. These awards ultimately vest over a range from zero up to a maximum of 0.4 million of the target payments based on the operating profit achievements of a certain business unit of the Company over a four-year66FLEXTRONICS INTERNATIONAL LTD.NOTES TO CONSOLIDATED FINANCIAL STATEMENTS (Continued)3. SHARE-BASED COMPENSATION (Continued)period. The vesting will begin on March 31, 2016 and occur every year over a period of four years contingent on meeting the agreed targets.Further, 0.7 million of unvested share bonus awards granted in fiscal year 2016 represents the target amount of grants made to certain key employees whereby vesting is contingent on certain market conditions. The average grant date fair value of these awards was estimated to be $14.96 per award and was calculated using a Monte Carlo simulation. Vesting information of these shares are further detailed in the table below.Of the19.017.0 million unvested share bonus awards outstanding under the 2010 Plan as of the fiscal year ended2015,2016, approximately4.93.2 million of unvested share bonus awards under the 2010 Plan represents the target amount of grants made to certain key employees whereby vesting is contingent on meeting certain market conditions summarized as follows:Targeted
number of
awards as of
March 31, 2015
(in shares)Range of shares
that may be issuedTargeted
number of
awards as of
March 31, 2016
(in shares)Range of shares
that may be issuedAverage
grant date
fair value
(per share)Average
grant date
fair value
(per share)Range of shares
that may be issuedYear of grantMarket condition Assessment dates Minimum Market condition Assessment dates Minimum Maximum Fiscal 2016 726,995 $ 14.96 Vesting ranges from zero to 200% based on measurement of Flextronics' total shareholder return against both the Standard and Poor's ("S&P") 500 Composite Index and an Extended Electronics Manufacturing Services ("EMS") Group Index. 1,453,990 Fiscal 2015
962,083 $ 14.77 Vesting ranges from zero to 200% based on measurement of Flextronics' total shareholder return against both the Standard and Poor's ("S&P") 500 Composite Index and an Extended Electronics Manufacturing Services ("EMS") Group Index. — 1,924,166 May 2017 706,747 $ 14.77 Vesting ranges from zero to 200% based on measurement of Flextronics' total shareholder return against both the S&P 500 Composite Index and an EMS Group Index. — 1,413,494 May 2017 Fiscal 2014
1,932,000 $ 9.36 Vesting ranges from zero to 200% based on measurement of Flextronics' total shareholder return against both the Standard and Poor's ("S&P") 500 Composite Index and an Extended Electronics Manufacturing Services ("EMS") Group Index. — 3,864,000 May 2016 1,810,000 $ 9.36 Vesting ranges from zero to 200% based on measurement of Flextronics' total shareholder return against both the S&P 500 Composite Index and an EMS Group Index. — 3,620,000 May 2016 Fiscal 2013
1,591,000 $ 7.60 Vesting ranges from zero to 200% based on measurement of Flextronics' total shareholder return against the S&P 500 Composite Index. — 3,182,000 May 2015 Fiscal 2012
380,000 $ 7.83 Vesting ranges from zero to 150% based on measurement of Flextronics' total shareholder return against the S&P 500 Composite Index. — 570,000 June 2015 (50%) Totals
4,865,083 9,540,166 3,243,742 6,487,484 In accordance with the accounting guidance, the Company will continue to recognize share-based compensation expense for these awards with market conditions regardless of whether such awards will ultimately vest. During fiscal year2015, 0.32016, 2.2 million shares vested in connection with the remaining number of share bonus awards with market conditions granted in fiscal year2011,2013, and0.40.5 million shares vested in connection with half of the share bonus awards with market conditions granted in fiscal year 2012.The total intrinsic value of share bonus awards vested under the Company's 2010 Plan was $103.2 million, $79.0 million$42.4 millionand$9.7$42.4 million during fiscal years 2016, 20152014and2013,2014, respectively, based on the closing price of the Company's ordinary shares on the date vested.The 2014 NEXTracker Equity Incentive PlanAll shares granted during fiscal year 2016 under the NEXTracker plan are the result of the Company's conversion of all outstanding, unvested shares of NEXTracker into unvested shares of the Company, as part of the acquisition. No additional grants will be made out of this plan in the future and therefore there are no shares available for grant under the NEXTracker Plan as of March 31, 2016. Options issued to employees under the NEXTracker Plan generally have a vesting period of two to four years from vesting commencement date and expire ten years from the date of grant.67FLEXTRONICS INTERNATIONAL LTD.NOTES TO CONSOLIDATED FINANCIAL STATEMENTS (Continued)3. SHARE-BASED COMPENSATION (Continued)The exercise price of options granted to employees was determined by the Company based on a conversion rate agreed upon in the purchase agreement of NEXTracker.As of March 31, 2016, the total unrecognized compensation cost, net of estimated forfeitures, related to unvested share options granted to employees under the NEXTracker Plan was $18.2 million and will be amortized on a straight-line basis over a weighted-average period of approximately 2.8 years, adjusted for estimated forfeitures.The Company also granted share bonus awards under the NEXTracker Plan. These share bonus awards vest in installments over a three to five-year period from vesting commencement date, and unvested share bonus awards are forfeited upon termination of employment. Vesting for certain of these share bonus awards is contingent on meeting certain performance targets over a three-year period commencing October 1, 2015.As of March 31, 2016, the total unrecognized compensation cost related to unvested share bonus awards granted to employees was approximately $19.1 million under the NEXTracker Plan. These costs will be amortized generally on a straight-line basis over a weighted-average period of approximately 2.4 years, adjusted for estimated forfeitures.Determining Fair ValueThe fair value of the Company's share options granted to employees under the NEXTracker Plan for fiscal year 2016 was estimated using the following weighted-average assumptions:Fiscal Year Ended
March 31, 2016Expected term 2.9 years Expected volatility 28.8% Expected dividends 0.0% Risk-free interest rate 0.9% Weighted-average fair value $7.76 Share-Based Awards ActivityThe following is a summary of option activity for the NEXTracker Plan ("Price" reflects the weighted-average exercise price):Fiscal Year Ended March 31, 2016 Options Price Outstanding, beginning of fiscal year — $ — Granted 3,205,806 3.28 Exercised (237,380 ) 0.99 Forfeited (226,572 ) 3.75 Outstanding, end of fiscal year 2,741,854 $ 3.44 Options exercisable, end of fiscal year 223,869 $ 4.95 Of the 3.2 million unvested share-based awards granted under the NEXTracker Plan in fiscal year 2016, approximately 0.5 million of unvested share-based awards have an average grant date price of $7.76 per share and represents the number of grants made to certain NEXTracker employees whereby the right to exercise is contingent on meeting certain performance targets over a three-year period commencing October 1, 2015.68FLEXTRONICS INTERNATIONAL LTD.NOTES TO CONSOLIDATED FINANCIAL STATEMENTS (Continued)3. SHARE-BASED COMPENSATION (Continued)The aggregate intrinsic value of options exercised under the NEXTracker plan (calculated as the difference between the exercise price of the underlying award and the price of the Company's ordinary shares determined as of the time of option exercise for options exercised in-the-money) was $2.32 million as of March 31, 2016.Cash received from option exercises under the NEXTracker Plan was $0.2 million for fiscal year 2016.The following table presents the composition of options outstanding and exercisable under the NEXTracker Plan as of March 31, 2016:Options Outstanding Options Exercisable Range of Exercise Prices Number of
Shares
OutstandingWeighted
Average
Remaining
Contractual
Life
(In Years)Weighted
Average
Exercise
PriceNumber of
Shares
ExercisableWeighted
Average
Remaining
Contractual
Life
(In Years)Weighted
Average
Exercise
Price$0.08 - $5.24 2,088,258 9.49 $ 1.19 129,376 9.49 $ 0.79 $5.25 - $10.65 653,596 9.49 10.65 94,493 9.49 10.65 $0.08 - $10.65 2,741,854 9.49 $ 3.44 223,869 9.49 $ 4.95 Options vested and expected to vest 2,741,854 9.49 $ 3.44 As of March 31, 2016 the aggregate intrinsic value, for options outstanding, options vested and expected to vest (which includes adjustments for expected forfeitures), and options exercisable under the Company's NEXTracker Plan, were $23.6 million, $23.6 million, and $1.59 million, respectively. The aggregate intrinsic value is calculated as the difference between the exercise price of the underlying awards and the quoted price of the Company's ordinary shares as of March 31, 2016 for the approximately 2.7 million options under the NEXTracker Plan that were in-the-money at March 31, 2016.The following table summarizes the Company's share bonus award activity under the NEXTracker Plan ("Price" reflects the weighted-average grant-date fair value):Fiscal Year Ended March 31, 2016 Shares Price Unvested share bonus awards outstanding, beginning of fiscal year — $ — Granted 2,393,195 10.27 Vested (31,925 ) 10.27 Forfeited (52,174 ) 10.27 Unvested share bonus awards outstanding, end of fiscal year 2,309,096 $ 10.27 Of the 2.4 million unvested share bonus awards granted under the NEXTracker Plan as of the fiscal year ended 2016, approximately 0.9 million of unvested shares bonus awards represents the target amount of grants made to certain NEXTracker employees whereby vesting is contingent on meeting certain performance targets over a three-year period commencing October 1, 2015.The total intrinsic value of share bonus awards vested under the Company's NEXTracker Plan was $0.35 million during fiscal year 2016, based on the closing price of the Company's ordinary shares on the date vested.69FLEXTRONICS INTERNATIONAL LTD.NOTES TO CONSOLIDATED FINANCIAL STATEMENTS (Continued)3. SHARE-BASED COMPENSATION (Continued)The 2013 Equity Incentive Plan of Elementum SCM (Cayman) Ltd.As of March 31,20152016 Elementum had approximately5.05.4 million shares available for future grants under the 2013 Elementum Plan. Options to purchase shares in Elementum issued to employees underthisthe Elementum Planvest overhave a vesting period of two to four years and expire ten years from the grant date. As of March 31,20152016 there were16.026.2 million of options outstanding at a weighted average exercise price of$0.27$0.35 per option. Cash received from option exercises under the Elementum Plan was $0.5 million for fiscal year 2016. Total unrecognized compensation expenses relating to stock options granted to certain employees under the Elementum Plan as of March 31,20152016 is$2.1$5.2 million, and will be recognized over a weighted average period of3.292.7 years.4. EARNINGS PER SHAREBasic earnings per sharefor both continuing and discontinued operations excludeexcludes dilution and are computed by dividing net income by the weighted-average number of ordinary shares outstanding during the applicable periods.Diluted earnings per sharefor both continuing and discontinued operations reflectreflects the potential dilution from stock options and share bonus awards. The potential dilution from stock options exercisable into ordinary share equivalents and share bonus awards was computed using the treasury stock method based on the average fair market value of the Company's ordinary shares for the period.FLEXTRONICS INTERNATIONAL LTD.NOTES TO CONSOLIDATED FINANCIAL STATEMENTS (Continued)4. EARNINGS PER SHARE (Continued)The following table reflects the basic weighted-average ordinary shares outstanding and diluted weighted-average ordinary share equivalents used to calculate basic and diluted income
from continuing and discontinued operationsper share:Fiscal Year Ended March 31, 2015 2014 2013 (In thousands, except
per share amounts)Basic earnings from continuing and discontinued operations per share:
Income from continuing operations
$ 600,801 $ 365,594 $ 302,502 Loss from discontinued operations
$ — $ — $ (25,451 ) Net income
$ 600,801 $ 365,594 $ 277,051 Shares used in computation:
Weighted-average ordinary shares outstanding
579,981 610,497 662,874 Basic earnings from continuing operations per share
$ 1.04 $ 0.60 $ 0.46 Basic loss from discontinued operations per share
$ — $ — $ (0.04 ) Basic earnings per share
$ 1.04 $ 0.60 $ 0.42 Diluted earnings from continuing and discontinued operations per share:
Income from continuing operations
$ 600,801 $ 365,594 $ 302,502 Loss from discontinued operations
$ — $ — $ (25,451 ) Net income
$ 600,801 $ 365,594 $ 277,051 Shares used in computation:
Weighted-average ordinary shares outstanding
579,981 610,497 662,874 Weighted-average ordinary share equivalents from stock options and awards(1)
11,575 12,982 12,159 Weighted-average ordinary shares and ordinary share equivalents outstanding
591,556 623,479 675,033 Diluted earnings from continuing operations per share
$ 1.02 $ 0.59 $ 0.45 Diluted loss from discontinued operations per share
$ — $ — $ (0.04 ) Diluted earnings per share
$ 1.02 $ 0.59 $ 0.41 Fiscal Year Ended March 31, 2016 2015 2014 (In thousands, exceptper share amounts)Basic earnings per share: Net income $ 444,081 $ 600,801 $ 365,594 Shares used in computation: Weighted-average ordinary shares outstanding 557,667 579,981 610,497 Basic earnings per share $ 0.80 $ 1.04 $ 0.60 Diluted earnings per share: Net income $ 444,081 $ 600,801 $ 365,594 Shares used in computation: Weighted-average ordinary shares outstanding 557,667 579,981 610,497 Weighted-average ordinary share equivalents from stock options and awards (1) 7,202 11,575 12,982 Weighted-average ordinary shares and ordinary share equivalents outstanding 564,869 591,556 623,479 Diluted earnings per share $ 0.79 $ 1.02 $ 0.59 (1) Options to purchase ordinary shares of 2.0 million, 6.2 million and 17.1 million during fiscal years 2016, 2015 and 2014, respectively, and share bonus awards of less than 0.1 million during fiscal year 2015, were excluded from the computation of diluted earnings per share due to their anti-dilutive impact on the weighted average ordinary shares equivalents. There were no anti-dilutive share bonus awards in fiscal year 2016 and 2014. 70FLEXTRONICS INTERNATIONAL LTD.NOTES TO CONSOLIDATED FINANCIAL STATEMENTS (Continued)5.NON-CONTROLLINGNONCONTROLLING INTERESTSDuring fiscal year 2014, a previously wholly-owned subsidiary of the Company received $38.6 million in exchange for issuing anon-controllingnoncontrolling equity interest to certain third party investors for an ownership interest of less than 20% of the outstanding shares in the subsidiary. The Company continues to own a majority of the subsidiary's outstanding equity and also controls the subsidiary's board of directors. Accordingly, the consolidated financial statements include the financial position and results of operations of this subsidiary as of March 31,20152016 and for the year then ended.The Company has recognized the carrying value of thenon-controllingnoncontrolling interest as a component of total shareholders' equity. The operating results of the subsidiary attributable to thenon-controlling interests are immaterialnoncontrolling interest were losses of $6.7 million, $4.3 million, and $0.4 million forallfiscal years 2016, 2015 and 2014, respectively, which were classified as a component ofthe periods presented and are included ininterest and other,net.net, in the Company's consolidated statements of operations.
6. SUPPLEMENTAL CASH FLOW DISCLOSURESThe following table represents supplemental cash flow disclosures and non-cash investing and financing activities:Fiscal Year Ended March 31, Fiscal Year Ended March 31, 2015 2014 2013 2016 2015 2014 (In thousands) (In thousands) Net cash paid for:
Interest
$ 87,179 $ 86,406 $ 66,071 $ 114,578 $ 87,179 $ 86,406 Income taxes
$ 70,621 $ 87,561 $ 52,306 $ 105,453 $ 70,621 $ 87,561 Non-cash investing activity:
Unpaid purchases of property and equipment
$ 115,757 $ 42,902 $ 89,718 $ 93,310 $ 115,757 $ 42,902 7. BANK BORROWINGS AND LONG-TERM DEBTBank borrowings and long-term debt are as follows:As of March 31, As of March 31, 2015 2014 2016 2015 (In thousands) (In thousands) Term Loan, including current portion, due in installments through August 2018
$ 592,500 $ 600,000 $ 577,500 $ 592,500 Term Loan, including current portion, due in installments through March 2019
475,000 500,000 547,500 475,000 4.625% Notes due February 2020
500,000 500,000 500,000 500,000 5.000% Notes due February 2023
500,000 500,000 500,000 500,000 4.750% Notes due June 2025 595,589 — Other
16,233 2,595 71,317 16,233 Debt issuance costs (17,351 ) (12,733 ) 2,083,733 2,102,595 2,774,555 2,071,000 Current portion
(46,162 ) (32,575 ) Current portion, net of debt issuance costs (65,166 ) (45,030 ) Non-current portion
$ 2,037,571 $ 2,070,020 $ 2,709,389 $ 2,025,970 Theweighted averageweighted-average interest rates for the Company's long-term debtwaswere 3.5% and 3.2% as ofbothMarch 31, 2016 and 2015,and 2014.respectively.FLEXTRONICS INTERNATIONAL LTD.NOTES TO CONSOLIDATED FINANCIAL STATEMENTS (Continued)7. BANK BORROWINGS AND LONG-TERM DEBT (Continued)Repayments of the Company's long-term debt are as follows:
71FLEXTRONICS INTERNATIONAL LTD.NOTES TO CONSOLIDATED FINANCIAL STATEMENTS (Continued)7. BANK BORROWINGS AND LONG-TERM DEBT (Continued)Fiscal Year Ending March 31,Amount Amount (In thousands) (In thousands) 2016
$ 46,162 2017
52,500 $ 65,166 2018
52,500 63,522 2019
922,500 1,005,095 2020
500,000 498,287 2021 49,153 Thereafter
510,071 1,110,683 Total
$ 2,083,733 $ 2,791,906 Capital lease obligations of $5.3 million and $8.9 million, consisting of short-term obligations of $2.8 million and $4.2 million and long term obligations of $2.5 million and $4.7 million are included in current and non-current liabilities on the Company's balance sheets as of March 31, 2015 and 2014, respectively.Term Loan due August 2018On August 30, 2013, the Company entered into a $600 million term loan agreement due August 30, 2018 and used these proceeds to repay certain term loans in full that were outstanding at that time in the amount of $544.8 million. The remaining $55.2 million was used to repay part of the term loan due March 2019 and upfront bank fees. This loan is repayable in quarterly installments of $3.75 million, which commenced in December 2014 and continue through August 2018, with the remaining amount due at maturity.Borrowings under this term loan bear interest, at the Company's option, either at (i) LIBOR plus the applicable margin for LIBOR loans ranging between 1.00% and 2.00%, based on the Company's credit ratings or (ii) the base rate (the greatest of the U.S. prime rate, the federal funds rate plus 0.50% and LIBOR for a one-month interest period plus 1.00%) plus an applicable margin ranging between 0.00% and 1.00%, based on the Company's credit rating.This term loan is unsecured, and contains customary restrictions on the Company's and its subsidiaries' ability to (i) incur certain debt, (ii) make certain investments, (iii) make certain acquisitions of other entities, (iv) incur liens, (v) dispose of assets, (vi) make non-cash distributions to shareholders, and (vii) engage in transactions with affiliates. These covenants are subject to a number of exceptions and limitations. This term loan agreement also requires that the Company maintain a maximum ratio of total indebtedness to EBITDA (earnings before interest expense, taxes, depreciation and amortization), and a minimum interest coverage ratio, as defined therein, during its term. As of March 31,2015,2016, the Company was in compliance with the covenants under this term loan agreement.Term Loan Agreement due March 2019 and Revolving Line of CreditThe Company'sOn September 30, 2015, the Company amended its former $2.0 billion credit facility ("Credit Facility") to increase the $500.0 million term loan maturing in March 2019 by $100.0 million. Quarterly repayments of principal under this term loan were amended to $7.5 million through March 31, 2016, and will be increased to $11.3 million thereafter with the remainder due upon maturity. As of March 31, 2016 the amended Credit Facility consists of a $1.5 billion revolving credit facility and a$500.0$600.0 million term loan, which is due to expire in March 2019.FLEXTRONICS INTERNATIONAL LTD.NOTES TO CONSOLIDATED FINANCIAL STATEMENTS (Continued)7. BANK BORROWINGS AND LONG-TERM DEBT (Continued)On March 31, 2014, the Company borrowed an incremental amount of $63.4 million under the term loan thereby increasing the total amount outstanding under the term loan to $500 million in conjunction with the extension of the maturity date to March 2019. Quarterly repayments of principal under this term loan commenced on June 30, 2014 in the amount of $6.3 million up to March 31, 2016 and will increase to $9.4 million thereafter with the remainder due upon maturity.Borrowings under this facility bear interest, at the Company's option, either at (i) LIBOR plus the applicable margin for LIBOR loans ranging between 1.125% and 2.125%, based on the Company's credit ratings or (ii) the base rate (the greatest of the agent's prime rate, the federal funds rate plus 0.50% and LIBOR for a one-month interest period plus 1.00%) plus an applicable margin ranging between 0.125% and 1.125%, based on the Company's credit rating. The Company is required to pay a quarterly commitment fee ranging between 0.15% and 0.40% per annum on the daily unused amount of the $1.5 billion Revolving Credit Facility based on the Company's credit rating.This Credit Facility is unsecured, and contains customary restrictions on the Company's and its subsidiaries' ability to (i) incur certain debt, (ii) make certain investments, (iii) make certain acquisitions of other entities, (iv) incur liens, (v) dispose of assets, (vi) make non-cash distributions to shareholders, and (vii) engage in transactions with affiliates. These covenants are subject to a number of exceptions and limitations. This Credit Facility also requires that the Company maintain a maximum ratio of total indebtedness to EBITDA (earnings before interest expense, taxes, depreciation and amortization), and a minimum interest coverage ratio, as defined therein, during its term. As of March 31,2015,2016, the Company was in compliance with the covenants under this loan agreement.Notes due February 2020 and February 202372FLEXTRONICS INTERNATIONAL LTD.NOTES TO CONSOLIDATED FINANCIAL STATEMENTS (Continued)7. BANK BORROWINGS AND LONG-TERM DEBT (Continued)On February 20, 2013, the Company issued $500.0 million of 4.625% Notes due February 15, 2020 and $500.0 million of 5.000% Notes due February 15, 2023 (collectively the "Notes") in a private offering pursuant to Rule 144A and Regulation S under the Securities Act. In July 2013, the Company exchanged these notes for new notes with substantially similar terms and completed the registration of these notes with the Securities and Exchange Commission. The Company received net proceeds of approximately $990.6 million from the issuance and used those proceeds, together with $9.4 million of cash on hand, to repay $1.0 billion of outstanding borrowings under its previous term loan that was due October 2014.Interest on the Notes is payable semi-annually, which commenced on August 15, 2013. The Notes are senior unsecured obligations of the Company, rank equally with all of the Company's other existing and future senior and unsecured debt obligations, and are guaranteed, jointly and severally, fully and unconditionally on an unsecured basis, by each of the Company's 100% owned subsidiaries that guarantees indebtedness under, or is a borrower under, the Company's Credit Facility or the Company's Term Loan due 2018.At any time prior to maturity, the Company may redeem some or all of the Notes at a redemption price equal to 100% of the principal amount of the Notes redeemed, plus an applicable premium accrued and unpaid interest, if any, to the applicable redemption date. Upon the occurrence of a change of control repurchase event (as defined in the Notes indenture), the Company must offer to repurchase the Notes at a repurchase price equal to 101% of the principal amount of the Notes repurchased, plus accrued and unpaid interest, if any, to the applicable repurchase date.FLEXTRONICS INTERNATIONAL LTD.NOTES TO CONSOLIDATED FINANCIAL STATEMENTS (Continued)7. BANK BORROWINGS AND LONG-TERM DEBT (Continued)The indenture governing the Notes contains covenants that, among other things, restrict the ability of the Company and certain of the Company's subsidiaries to create liens; enter into sale-leaseback transactions; create, incur, issue, assume or guarantee any funded debt; and consolidate or merge with, or convey, transfer or lease all or substantially all of the Company's assets to, another person. These covenants are subject to a number of significant limitations and exceptions set forth in the indenture. The indenture also provides for customary events of default, including, but not limited to, cross defaults to certain specified other debt of the Company and its subsidiaries. In the case of an event of default arising from specified events of bankruptcy or insolvency, all outstanding Notes will become due and payable immediately without further action or notice. If any other event of default under the indenture occurs or is continuing, the applicable trustee or holders of at least 25% in aggregate principal amount of the then outstanding Notes may declare all of the Notes to be due and payable immediately. As of March 31,
2015,2016, the Company was in compliance with the covenants in the indenture governing the Notes.Notes due June 2025Other Credit LinesOn June 8, 2015, the Company issued$600 million of 4.750% Notes ("Notes") due June 15, 2025 in a private offering pursuant to Rule 144A and Regulation S under the Securities Act, at 99.213% of face value, and an effective yield of approximately 4.850%. The Company received net proceeds of approximately $595.3 million from the issuance which was used for general corporate purposes. During January 2016, the Company exchanged these notes for new notes with substantially similar terms and completed the registration of these notes with the Securities and Exchange Commission.
The Company incurred approximately $7.9 million of costs in conjunction with the issuance of the Notes. The issuance costs were capitalized and presented on the balance sheet as a direct deduction from the carrying amount of the Notes.Interest on the Notes is payable semi-annually, commencing on December 15, 2015. The Notes are senior unsecured obligations of the Company, rank equally with all of the Company's other existing and future senior and unsecured debt obligations, and are guaranteed, jointly and severally, fully and unconditionally on an unsecured basis, by each of the Company's 100% owned subsidiaries that guarantees indebtedness under, or is a borrower under, the Company's Term Loan Agreement and Revolving Line of Credit.At any time prior to March 15, 2025, the Company may redeem some or all of the Notes at a redemption price equal to 100% of the principal amount of the Notes redeemed, plus an applicable premium and accrued and unpaid interest, if any, to the applicable redemption date. Upon the occurrence of a change of control repurchase event (as defined in the Notes indenture), the Company must offer to repurchase the Notes at a repurchase price equal to 101% of the principal amount of the Notes repurchased, plus accrued and unpaid interest, if any, to the applicable repurchase date.The indenture governing the Notes contains covenants that, among other things, restrict the ability of the Company and certain of the Company's subsidiaries to create liens; enter into sale-leaseback transactions; create, incur, issue, assume or guarantee any funded debt; and consolidate or merge with, or convey, transfer or lease all or substantially all of the Company's assets to, another person, or permit any other person to consolidate, merge, combine or amalgamate with or into the Company. These covenants are subject to a number of significant limitations and exceptions set forth in the indenture. The indenture also73FLEXTRONICS INTERNATIONAL LTD.NOTES TO CONSOLIDATED FINANCIAL STATEMENTS (Continued)7. BANK BORROWINGS AND LONG-TERM DEBT (Continued)provides for customary events of default, including, but not limited to, cross defaults to certain specified other debt of the Company and its subsidiaries. In the case of an event of default arising from specified events of bankruptcy or insolvency, all outstanding Notes will become due and payable immediately without further action or notice. If any other event of default under the agreement occurs or is continuing, the applicable trustee or holders of at least 25% in aggregate principal amount of the then outstanding Notes may declare all of the Notes to be due and payable immediately, but upon certain conditions such declaration and its consequences may be rescinded and annulled by the holders of a majority in principal amount of the Notes. As of March 31, 2016, the Company was in compliance with the covenants in the indenture governing the Notes.Other Credit LinesOn October 1, 2015, the Company borrowed €50 million (approximately $56.6 million as of March 31, 2016), under a 5-year, term-loan agreement due September 30, 2020. Borrowings under this term loan bear interest at EURIBOR plus the applicable margin ranging between 0.80% and 2.00%, based on the Company’s credit ratings. The loan is repayable beginning December 30, 2016 in quarterly payments of €312,500 through June 30, 2020 with the remainder due upon maturity. This loan is included in the "Other" category in the table above.This term loan is unsecured, and is guaranteed by the Company. This term loan agreement contains customary restrictions on the Company's and its subsidiaries' ability to (i) incur certain debt, (ii) make certain investments, (iii) make certain acquisitions of other entities, (iv) incur liens, (v) dispose of assets, (vi) make non-cash distributions to shareholders, and (vii) engage in transactions with affiliates. These covenants are subject to a number of exceptions and limitations. This term loan agreement also requires that the Company maintain a maximum ratio of total indebtedness to EBITDA (earnings before interest expense, taxes, depreciation and amortization), and a minimum interest coverage ratio, as defined therein, during its term. As of March 31, 2016, the Company was in compliance with the covenants under this term loan agreement.As of March 31, 2016, the Company and certain of its subsidiaries had various uncommitted revolving credit facilities, lines of credit and otherloanscredit facilities in the amount of$184.6$166.0 million in the aggregate. There were no borrowings outstanding under these facilities as of March 31,20152016 and2014.2015. These unsecured credit facilities, and lines of credit and otherloanscredit facilities bear annual interest at the respective country's inter-bank offering rate, plus an applicable margin, and generally have maturities that expire on various dates in future fiscal years.8. FINANCIAL INSTRUMENTSForeign Currency ContractsThe Company transacts business in various foreign countries and is therefore, exposed to foreign currency exchange rate risk inherent in forecasted sales, cost of sales, and monetary assets and liabilities denominated in non-functional currencies. The Company has established risk management programs to protect against volatility in the value of non-functional currency denominated monetary assets and liabilities, and of future cash flows caused by changes in foreign currency exchange rates. The Company tries to maintain a partial or fully hedged position for certain transaction exposures, which are primarily, but not limited to, revenues, customer and vendor payments and inter-company balances in currencies other than the functional currency unit of the operating entity. The Company enters into short-term foreign currency forward and swap contracts to hedge only those currency exposures associated with certain assets and liabilities, primarily accounts receivable and accounts payable, and cash flows denominated in non-functional currencies. Gains and losses on the Company's forward and swap contracts are designed to offset losses and gains on the assets, liabilities and transactions hedged, and accordingly, generally do not subject the Company to risk of significant accounting losses. The Company hedges committed exposures and does not engage in speculative transactions. The credit risk of these forward and swap contracts is minimized since the contracts are with large financial institutions and accordingly, fair value adjustments related to the credit risk of the counterparty financial institution were not material.74FLEXTRONICS INTERNATIONAL LTD.NOTES TO CONSOLIDATED FINANCIAL STATEMENTS (Continued)8. FINANCIAL INSTRUMENTS (Continued)As of March 31,2015,2016, the aggregate notional amount of the Company's outstanding foreign currency forward and swap contracts was$3.6$4.3 billion as summarized below:Foreign Currency
AmountNotional Contract
Value in USDForeign Currency
AmountNotional Contract
Value in USDCurrencyBuy Sell Buy Sell Buy Sell Buy Sell (In thousands) (In thousands) Cash Flow Hedges
CNY
2,038,000 — $ 327,916 $ — 1,076,000 — $ 165,373 $ — EUR 15,030 75,135 16,977 85,374 HUF
16,064,000 — 58,340 — 14,759,000 — 53,090 — ILS
110,200 — 27,786 — 122,000 — 32,072 — MXN
1,706,500 275,000 112,366 18,108 1,503,000 — 86,823 — MYR
285,000 33,000 77,341 8,955 180,000 18,200 45,023 4,552 SGD
27,700 — 20,234 — RON
88,300 — 21,768 — PLN 56,400 — 15,004 — Other
N/A N/A 47,774 7,837 N/A N/A 40,621 — 693,525 34,900 454,983 89,926 Other Forward/Swap Contracts
BRL
— 534,000 — 165,330 — 440,000 — 120,892 CAD
168,467 165,795 134,286 131,992 CHF 8,420 24,760 8,716 25,629 CNY
760,113 — 120,710 — 885,136 — 135,739 — DKK 203,100 157,200 30,777 23,821 EUR
553,629 758,846 606,019 831,531 959,000 1,213,691 1,080,754 1,364,808 GBP
32,794 61,161 48,840 91,283 34,693 58,825 49,810 84,354 HUF 20,063,000 17,734,000 72,169 63,791 ILS 79,900 69,520 21,004 18,276 INR 2,843,900 20,170 42,708 300 MXN
1,306,400 793,212 86,021 52,228 1,885,860 746,330 108,940 43,113 MYR
237,837 39,200 64,542 10,638 391,491 79,400 97,922 19,860 PLN 137,548 84,861 36,593 22,576 RON 78,424 66,870 19,836 16,913 SEK
411,292 707,248 48,065 83,294 473,954 821,132 57,697 99,637 Other
N/A N/A 219,114 178,321 N/A N/A 54,157 31,296 1,327,597 1,544,617 1,816,822 1,935,266 Total Notional Contract Value in USD
$ 2,021,122 $ 1,579,517 $ 2,271,805 $ 2,025,192 As of March 31,20152016 and2014,2015, the fair value of the Company's short-term foreign currency contracts wasnot material andincluded in other current assets or other current liabilities, as applicable, in the consolidated balance sheets. Certain of these contracts are designed to economically hedge the Company's exposure to monetary assets and liabilities denominated in non-functional currencies and are not accounted for as hedges under the accounting standards. Accordingly, changes in fair value of these instruments are recognized in earnings during the period of change as a component of interest and other, net in the consolidated statements of operations. As of March 31,20152016 and2014,2015, the Company also has included net deferred gains and losses, in accumulated other comprehensive loss, a component of shareholders' equity in the consolidated balance sheets, relating to changes in fair value of its foreign currency contracts that are accounted for as cash flow hedges. These deferredlossesgains totaled$17.3$2.7 million as of March 31,2015,2016, and are expected to be recognized primarily as a component of cost of sales in the consolidated statement of operations over the nexttwelve monthtwelve-month period. The gains and losses recognized in earnings due to75FLEXTRONICS INTERNATIONAL LTD.NOTES TO CONSOLIDATED FINANCIAL STATEMENTS (Continued)8. FINANCIAL INSTRUMENTS (Continued)hedge ineffectiveness were not material for all fiscal years presented and are included as a component of interest and other, net in the consolidated statements of operations.FLEXTRONICS INTERNATIONAL LTD.NOTES TO CONSOLIDATED FINANCIAL STATEMENTS (Continued)8. FINANCIAL INSTRUMENTS (Continued)The following table presents the fair value of the Company's derivative instruments utilized for foreign currency risk management purposes at March 31,
2015:20152016 and2014:Fair Values of Derivative Instruments Fair Values of Derivative Instruments Asset Derivatives Liability Derivatives Asset Derivatives Liability Derivatives Fair Value Fair Value Fair Value Fair Value Balance Sheet
LocationMarch 31,
2015March 31,
2014Balance Sheet
LocationMarch 31,
2015March 31,
2014Balance Sheet
LocationMarch 31,
2016March 31,
2015Balance Sheet
LocationMarch 31,
2016March 31,
2015(In thousands) (In thousands) Derivatives designated as hedging instruments
Foreign currency contracts
Other current assets $ 2,896 $ 3,464 Other current liabilities $ 19,729 $ 10,457 Other current assets $ 5,510 $ 2,896 Other current liabilities $ 2,446 $ 19,729 Derivatives not designated as hedging instruments
Foreign currency contracts
Other current assets $ 22,933 $ 4,722 Other current liabilities $ 11,328 $ 6,949 Other current assets $ 17,138 $ 22,933 Other current liabilities $ 18,645 $ 11,328 The Company has financial instruments subject to master netting arrangements, which provides for the net settlement of all contracts with a single counterparty. The Company does not offset fair value amounts for assets and liabilities recognized for derivative instruments under these arrangements, and as such, the asset and liability balances presented in the table above reflect the gross amounts of derivatives in the consolidated balance sheets. The impact of netting derivative assets and liabilities is not material to the Company's financial position for any of the periods presented.9. ACCUMULATED OTHER COMPREHENSIVE LOSSThe changes in accumulated other comprehensive loss by component, net of tax, during fiscal years ended March 31, 2016, 2015 and 2014 are as follows:Fiscal Year Ended March 31, 2015 Unrealized loss on
derivative
instruments and
otherForeign currency
translation
adjustmentsTotal (In thousands) Beginning balance
$ (32,849 ) $ (93,307 ) $ (126,156 ) Other comprehensive loss before reclassifications
(76,470 ) (9,318 ) (85,788 ) Net (gains) losses reclassified from accumulated other comprehensive loss
41,053 (9,614 ) 31,439 Net current-period other comprehensive loss
(35,417 ) (18,932 ) (54,349 ) Ending balance
$ (68,266 ) $ (112,239 ) $ (180,505 ) Fiscal Year Ended March 31, 2016 Unrealized loss on
derivative
instruments and
otherForeign currency
translation
adjustmentsTotal (In thousands) Beginning balance $ (68,266 ) $ (112,239 ) $ (180,505 ) Other comprehensive loss before reclassifications (2,199 ) (3,145 ) (5,344 ) Net losses reclassified from accumulated other comprehensive loss 28,943 20,991 49,934 Net current-period other comprehensive gain 26,744 17,846 44,590 Ending balance $ (41,522 ) $ (94,393 ) $ (135,915 ) 76FLEXTRONICS INTERNATIONAL LTD.NOTES TO CONSOLIDATED FINANCIAL STATEMENTS (Continued)9. ACCUMULATED OTHER COMPREHENSIVE LOSS (Continued)Fiscal Year Ended March 31, 2014 Unrealized loss on
derivative
instruments and
otherForeign currency
translation
adjustmentsTotal (In thousands) Beginning balance
$ (18,857 ) $ (58,624 ) $ (77,481 ) Other comprehensive loss before reclassifications
(15,851 ) (34,683 ) (50,534 ) Net losses reclassified from accumulated other comprehensive loss
1,859 — 1,859 Net current-period other comprehensive loss
(13,992 ) (34,683 ) (48,675 ) Ending balance
$ (32,849 ) $ (93,307 ) $ (126,156 ) Fiscal Year Ended March 31, 2015 Unrealized loss on
derivative
instruments and
otherForeign currency
translation
adjustmentsTotal (In thousands) Beginning balance $ (32,849 ) $ (93,307 ) $ (126,156 ) Other comprehensive loss before reclassifications (76,470 ) (9,318 ) (85,788 ) Net (gains) losses reclassified from accumulated other comprehensive loss 41,053 (9,614 ) 31,439 Net current-period other comprehensive loss (35,417 ) (18,932 ) (54,349 ) Ending balance $ (68,266 ) $ (112,239 ) $ (180,505 ) Fiscal Year Ended March 31, 2014 Unrealized loss on
derivative
instruments and
otherForeign currency
translation
adjustmentsTotal (In thousands) Beginning balance $ (18,857 ) $ (58,624 ) $ (77,481 ) Other comprehensive loss before reclassifications (15,851 ) (34,683 ) (50,534 ) Net losses reclassified from accumulated other comprehensive loss 1,859 — 1,859 Net current-period other comprehensive loss (13,992 ) (34,683 ) (48,675 ) Ending balance $ (32,849 ) $ (93,307 ) $ (126,156 ) Net losses reclassified from accumulated other comprehensive loss during the fiscal year20152016 relating to derivative instruments and other includes$36.2$26.9 million attributable to the Company's cash flow hedge instruments which were recognized as a component of cost of sales in thecondensedconsolidated statement of operations.During fiscal year 2016, the Company recognized a loss of $26.8 million in connection with the disposition of a non-strategic Western European manufacturing facility, which included a $25.3 million cumulative foreign currency translation loss. This loss was offset by the release of certain cumulative foreign currency translation gains of $4.2 million, which has been reclassified from accumulated other comprehensive loss during the period and is included in other charges (income), net in consolidated statement of operations.During fiscal year 2015, the Company recognized a loss of $11.0 million in connection with the disposition of a manufacturing facility in Western Europe. This loss includes the settlement of unrealized losses of $4.2 million on an insignificant defined benefit plan associated with the disposed facility offset by the release of cumulative foreign currency translation gains of $9.3 million, both of which have been reclassified from accumulated other comprehensive loss during the period. The loss on sale is included in other charges (income), net in thecondensedconsolidated statement of operations.10. TRADE RECEIVABLES SECURITIZATIONThe Company sells trade receivables under two asset-backed securitization programs and an accounts receivable factoring program.Asset-Backed Securitization ProgramsThe Company continuously sells designated pools of trade receivables under its Global Asset-Backed Securitization Agreement (the "Global Program") and its North American Asset-Backed Securitization Agreement (the "North American Program," collectively, the "ABS Programs") to affiliated special purpose entities, each of which in turn sells 100% of the receivables to unaffiliated financial institutions. These programs allow the operating subsidiaries to receive a cash payment and a deferred purchase price receivable for sold receivables. Following the transfer of the receivables to the special purpose77FLEXTRONICS INTERNATIONAL LTD.NOTES TO CONSOLIDATED FINANCIAL STATEMENTS (Continued)10. TRADE RECEIVABLES SECURITIZATION (Continued)entities, the transferred receivables are isolated from the Company and its affiliates, and upon the sale of the receivables from the special purpose entities to the unaffiliated financial institutions effective control of the transferred receivables is passed to the unaffiliated financial institutions, which has the right to pledge or sell the receivables. Although the special purpose entities are consolidated by the Company, they are separate corporate entities and their assets are available first to satisfy the claims of their creditors. The investment limits set by the financial institutions are$550.0$700.0 million for the Global Program, of which $600.0 million is committed and$225.0$100.0 million is uncommitted, and $265.0 million for the North AmericanProgram.Program, of which $225.0 million is committed and $40.0 million is uncommitted. Both programs require a minimum level of deferred purchase price receivable to be retained by the Company in connection with the sales.FLEXTRONICS INTERNATIONAL LTD.NOTES TO CONSOLIDATED FINANCIAL STATEMENTS (Continued)10. TRADE RECEIVABLES SECURITIZATION (Continued)The Company services, administers and collects the receivables on behalf of the special purpose entities and receives a servicing fee of 0.1% to 0.5% of serviced receivables per annum. Servicing fees recognized during the fiscal years ended March 31, 2016, 2015
2014and20132014 were not material and are included in interest and other, net within the consolidated statements of operations. As the Company estimates the fee it receives in return for its obligation to service these receivables is at fair value, no servicing assets or liabilities are recognized.As of March 31,20152016 and2014,2015, the accounts receivable balances that were sold under the ABS Programs were removed from the consolidated balance sheets and the net cash proceeds received by the Company during fiscal years ended March 31, 2016, 20152014and20132014 were included as cash provided by operating activities in the consolidated statements of cash flows.As of March 31,2015,2016, approximately$1.3$1.4 billion of accounts receivable had been sold to the special purpose entities under the ABS Programs for which the Company had received net cash proceeds of$740.7$880.8 million and deferred purchase price receivables of$600.7$501.1 million. As of March 31,2014,2015, approximately$1.2$1.3 billion of accounts receivable had been sold to the special purpose entities for which the Company had received net cash proceeds of$729.3$740.7 million and deferred purchase price receivables of$470.9$600.7 million. The portion of the purchase price for the receivables which is not paid by the unaffiliated financial institutions in cash is a deferred purchase price receivable, which is paid to the special purpose entity as payments on the receivables are collected from account debtors. The deferred purchase price receivable represents a beneficial interest in the transferred financial assets and is recognized at fair value as part of the sale transaction. The deferred purchase price receivables are included in other current assets as of March 31,20152016 and2014,2015, and were carried at the expected recovery amount of the related receivables. The difference between the carrying amount of the receivables sold under these programs and the sum of the cash and fair value of the deferred purchase price receivables received at time of transfer is recognized as a loss on sale of the related receivables and recorded in interest and other, net in the consolidated statements of operations; such amounts were $9.2 million for the fiscal year ended March 31, 2016, and $7.1 million for both fiscal years ended March 31, 2015 and2014, and $7.2 million for the fiscal year ended March 31, 2013.2014.
For the fiscal years ended March 31, 2016, 20152014and2013,2014, cash flows from sales of receivables under the ABS Programs consisted of approximately $5.2 billion, $4.3 billion$4.2 billionand$3.5$4.2 billion, respectively, for transfers of receivables (of which approximately $0.4 billion, $0.3 billion$0.4 billionand$0.7$0.4 billion, respectively, represented new transfers and the remainder proceeds from collections reinvested in revolving period transfers).The following table summarizes the activity in the deferred purchase price receivables account during the fiscal years ended March 31,20152016 and2014:2015:As of March 31, As of March 31, 2015 2014 2016 2015 (In thousands) (In thousands) Beginning balance
$ 470,908 $ 412,357 $ 600,672 $ 470,908 Transfers of receivables
3,599,768 3,778,420 3,475,400 3,599,768 Collections
(3,470,004 ) (3,719,869 ) (3,574,975 ) (3,470,004 ) Ending balance
$ 600,672 $ 470,908 $ 501,097 $ 600,672 FLEXTRONICS INTERNATIONAL LTD.NOTES TO CONSOLIDATED FINANCIAL STATEMENTS (Continued)10. TRADE RECEIVABLES SECURITIZATION (Continued)Trade Accounts Receivable Sale ProgramsThe Company also sold accounts receivables to certain third-party banking institutions. The outstanding balance of receivables sold and not yet collected was approximately$485.6$339.4 million and$341.8$485.6 million as of March 31,20152016 and2014,2015, respectively. For the years ended March 31, 2016, 20152014and2013,2014, total accounts receivables sold to certain third party banking78FLEXTRONICS INTERNATIONAL LTD.NOTES TO CONSOLIDATED FINANCIAL STATEMENTS (Continued)10. TRADE RECEIVABLES SECURITIZATION (Continued)institutions was approximately $2.3 billion, $4.2 billion$3.4 billionand$1.1$3.4 billion, respectively. The receivables that were sold were removed from the consolidated balance sheets and were reflected as cash provided by operating activities in the consolidated statements of cash flows.11. FAIR VALUE MEASUREMENT OF ASSETS AND LIABILITIESFair value is defined as the price that would be received from selling an asset or paid to transfer a liability in an orderly transaction between market participants at the measurement date. When determining the fair value measurements for assets and liabilities required or permitted to be recorded at fair value, the Company considers the principal or most advantageous market in which it would transact, and it considers assumptions that market participants would use when pricing the asset or liability. The accounting guidance for fair value establishes a fair value hierarchy based on the level of independent, objective evidence surrounding the inputs used to measure fair value. A financial instrument's categorization within the fair value hierarchy is based upon the lowest level of input that is significant to the fair value measurement. The fair value hierarchy is as follows:Level 1—Applies to assets or liabilities for which there are quoted prices in active markets for identical assets or liabilities.The Company has deferred compensation plans for its officers and certain other employees. Amounts deferred under the plans are invested in hypothetical investments selected by the participant or the participant's investment manager. The Company's deferred compensation plan assets are included in other noncurrent assets on the consolidated balance sheets and include investments in equity securities that are valued using active market prices.Level 2—Applies to assets or liabilities for which there are inputs other than quoted prices included within level 1 that are observable for the asset or liability such as quoted prices for similar assets or liabilities in active markets; quoted prices for identical assets or liabilities in markets with insufficient volume or infrequent transactions (less active markets) such as cash and cash equivalents and money market funds; or model- derived valuations in which significant inputs are observable or can be derived principally from, or corroborated by, observable market data.The Company values foreign exchange forward contracts using level 2 observable inputs which primarily consist of an income approach based on the present value of the forward rate less the contract rate multiplied by the notional amount.The Company's cash equivalents are comprised of bank deposits and money market funds, which are valued using level 2 inputs, such as interest rates and maturity periods. Due to their short-term nature, their carrying amount approximates fair value.The Company's deferred compensation plan assets also include money market funds, mutual funds, corporate and government bonds and certain convertible securities that are valued using prices obtained from various pricing sources. These sources price these investments using certainFLEXTRONICS INTERNATIONAL LTD.NOTES TO CONSOLIDATED FINANCIAL STATEMENTS (Continued)11. FAIR VALUE MEASUREMENT OF ASSETS AND LIABILITIES (Continued)market indices and the performance of these investments in relation to these indices. As a result, the Company has classified these investments as level 2 in the fair value hierarchy.
Level 3—Applies to assets or liabilities for which there are unobservable inputs to the valuation methodology that are significant to the measurement of the fair value of the assets or liabilities.The Companyaccrueshas accrued for contingent consideration in connection with its business acquisitions as applicable, which is measured at fair value based on certain internal models and unobservable inputs.The Company accrued $84.3 million of contingent consideration, of which $81.0 million related to the acquisition of NEXTracker on the date of acquisition. Additionally, an incremental fair value adjustment of $3.7 million also related to NEXTracker, was recorded in the consolidated statement of operations during fiscal year 2016. The Company reduced the accrual by $19.0 million for a contractual release from the obligation executed subsequent to the acquisition. The fair value of the liability was estimated using a simulation-based measurement technique with significant inputs that are not observable in the market and thus represents a level 3 fair value measurement. The significant inputs in the fair value measurement not supported by market activity included the Company's probability assessments of expected future revenue during the earn-out period and associated volatility, appropriately discounted considering the uncertainties associated with the obligation, and calculated in accordance with the terms of the Merger Agreement. Significant decreases in expected revenue during the earn-out period, or significant increases in the discount rate or volatility in isolation would result in lower fair value estimates. The interrelationship between these inputs is not considered significant.79FLEXTRONICS INTERNATIONAL LTD.NOTES TO CONSOLIDATED FINANCIAL STATEMENTS (Continued)11. FAIR VALUE MEASUREMENT OF ASSETS AND LIABILITIES (Continued)During fiscal year 2015, the Company paid $11.3 million of contingent consideration related to the acquisition of Saturn Electronics and Engineering Inc. The following table summarizes the activities related to contingent consideration:As of March 31, 2015 2014 (In thousands) Beginning balance
$ 11,300 $ 25,000 Additions to accrual
4,500 — Payments
(11,300 ) — Fair value adjustments
— (13,700 ) Ending balance
$ 4,500 $ 11,300 As of March 31, 2016 2015 (In thousands) Beginning balance $ 4,500 $ 11,300 Additions to accrual 84,261 4,500 Payments and settlements (19,008 ) (11,300 ) Fair value adjustments 3,670 — Ending balance $ 73,423 $ 4,500 The Company values deferred purchase price receivables relating to its Asset-Backed Securitization Program based on a discounted cash flow analysis using unobservable inputs (i.e. level 3 inputs), which are primarily risk free interest rates adjusted for the credit quality of the underlying creditor. Due to its high credit quality and short term maturity, their fair value approximates carrying value. Significant increases in either of the significant unobservable inputs (credit spread or risk free interest rate) in isolation would result in lower fair value estimates, however the impact is insignificant. The interrelationship between these inputs is also insignificant. Refer to note 10 for a reconciliation of the change in the deferred purchase price receivable.There were no transfers between levels in the fair value hierarchy during fiscal years20152016 and2014.2015.FLEXTRONICS INTERNATIONAL LTD.NOTES TO CONSOLIDATED FINANCIAL STATEMENTS (Continued)11. FAIR VALUE MEASUREMENT OF ASSETS AND LIABILITIES (Continued)Financial Instruments Measured at Fair Value on a Recurring Basis
The following table presents the Company's assets and liabilities measured at fair value on a recurring basis as of March 31,20152016 and2014:2015:�� Fair Value Measurements as of March 31, 2015 Fair Value Measurements as of March 31, 2016 Level 1 Level 2 Level 3 Total Level 1 Level 2 Level 3 Total (In thousands) (In thousands) Assets:
Money market funds and time deposits (Note 2)
$ — $ 674,859 $ — $ 674,859 $ — $ 1,074,132 $ — $ 1,074,132 Deferred purchase price receivable (Note 10)
— — 600,672 600,672 — — 501,097 501,097 Foreign exchange forward contracts (Note 8)
— 25,829 — 25,829 — 22,648 — 22,648 Deferred compensation plan assets:
Mutual funds, money market accounts and equity securities
9,068 37,041 — 46,109 9,228 40,556 — 49,784 Liabilities:
Foreign exchange forward contracts (Note 8)
$ — $ (31,057 ) $ — $ (31,057 ) $ — $ (21,091 ) $ — $ (21,091 ) Contingent consideration in connection with acquistions
— — (4,500 ) (4,500 ) Contingent consideration in connection with acquisitions — — (73,423 ) (73,423 ) 80FLEXTRONICS INTERNATIONAL LTD.NOTES TO CONSOLIDATED FINANCIAL STATEMENTS (Continued)11. FAIR VALUE MEASUREMENT OF ASSETS AND LIABILITIES (Continued)Fair Value Measurements as of March 31, 2014 Fair Value Measurements as of March 31, 2015 Level 1 Level 2 Level 3 Total Level 1 Level 2 Level 3 Total (In thousands) (In thousands) Assets:
Money market funds and time deposits (Note 2)
$ — $ 552,928 $ — $ 552,928 $ — $ 674,859 $ — $ 674,859 Deferred purchase price receivable (Note 10)
— — 470,908 470,908 — — 600,672 600,672 Foreign exchange forward contracts (Note 8)
— 8,186 — 8,186 — 25,829 — 25,829 Deferred compensation plan assets:
Mutual funds, money market accounts and equity securities
9,456 36,751 — 46,207 9,068 37,041 — 46,109 Liabilities:
Foreign exchange forward contracts (Note 8)
$ — $ (17,406 ) $ — $ (17,406 ) $ — $ (31,057 ) $ — $ (31,057 ) Contingent consideration in connection with acquistions
— — (11,300 ) (11,300 ) Contingent consideration in connection with acquisitions — — (4,500 ) (4,500 ) Assets Measured at Fair Value on a Nonrecurring BasisThe Company has certain long-lived assets that are measured at fair value on a nonrecurring basis, and are as follows:Fair Value Measurements as of March 31,
2014Fair Value Measurements as of March 31, 2016 Level 1 Level 2 Level 3 Total Level 1 Level 2 Level 3 Total (In thousands) (In thousands) Assets:
Assets held for sale
$ — $ 43,504 $ — $ 43,504 $ — $ 5,576 $ — $ 5,576 FLEXTRONICS INTERNATIONAL LTD.NOTES TO CONSOLIDATED FINANCIAL STATEMENTS (Continued)11. FAIR VALUE MEASUREMENT OF ASSETS AND LIABILITIES (Continued)Assets held for sale
Assets held for sale are recorded at the lesser of the carrying value or fair value, which is based on comparable sales from prevailing market data (level 2 inputs).These assets primarily represent manufacturing facilities that have been closed as part of the Company's historical facility consolidations and that met the criteria to be classified as held for sale.During fiscal year2014,2016, the Company transferred$59.4$5.6 million of assets to assets held for sale, relating to a building andexpectedland which has been identified tosell these within a period of twelve months.be sold.Disposals of assets held for sale totaled$41.5$0.3 million and$24.5$41.5 million during fiscal year20152016 and2014,2015, respectively, which resulted in an immaterial loss in fiscal year 2016, and a gain of $12.1 millionand $9.2 million, respectively, andin fiscal year 2015 that was included as a component of cost of sales in the consolidated statement of operations. No impairment charges were recorded for assets held for sale during fiscalyearyears 2016 and 2015.Impairment charges during fiscal year 2014 were not significant for assets that were no longer in use and held for sale.Assets held for sale as of the2015fiscalyear endyears 2016 and 2015 were not significant.There were no material fair value adjustments or other transfers between levels in the fair value hierarchy for these long-lived assets during the fiscal years20152016 and2014.2015.
81FLEXTRONICS INTERNATIONAL LTD.NOTES TO CONSOLIDATED FINANCIAL STATEMENTS (Continued)11. FAIR VALUE MEASUREMENT OF ASSETS AND LIABILITIES (Continued)Other financial instrumentsThe following table presents the Company's liabilities not carried at fair value as at March 31,20152016 and2014:2015:As of March 31, 2015 As of March 31, 2014 As of March 31, 2016 As of March 31, 2015 Carrying
AmountFair
ValueCarrying
AmountFair
ValueFair Value
HierarchyCarrying
AmountFair
ValueCarrying
AmountFair
ValueFair Value
Hierarchy(In thousands) (In thousands) (In thousands) (In thousands) Term Loan, including current portion, due in installments through August 2018
$ 592,500 $ 582,131 $ 600,000 $ 591,750 Level 1 $ 577,500 $ 573,533 $ 592,500 $ 582,131 Level 1 Term Loan, including current portion, due in installments through March 2019
475,000 465,500 500,000 497,190 Level 1 547,500 542,709 475,000 465,500 Level 1 4.625% Notes due February 2020
500,000 523,750 500,000 504,688 Level 1 500,000 524,735 500,000 523,750 Level 1 5.000% Notes due February 2023
500,000 543,150 500,000 517,650 Level 1 500,000 507,500 500,000 543,150 Level 1 4.750% Notes due June 2025 595,589 604,926 — — Level 1 Total
$ 2,067,500 $ 2,114,531 $ 2,100,000 $ 2,111,278 $ 2,720,589 $ 2,753,403 $ 2,067,500 $ 2,114,531 All of the above debtsThe term loans and Notes due February 2020, February 2023 and June 2025 are valued based on broker trading prices in active markets.The Company values its €50 million (approximately $56.6 million as of March 31, 2016), 5-year, unsecured, term-loan due September 30, 2020 based on the current market rate, and as of March 31, 2016, the carrying amount approximates fair value.12. COMMITMENTS AND CONTINGENCIESCommitmentsCapital lease obligations of $25.0 million and $5.3 million, consisting of short-term obligations of $6.6 million and $2.8 million and long term obligations of $18.4 million and $2.5 million are included in current and non-current liabilities on the Company's balance sheets as of March 31, 2016 and 2015, respectively.As of March 31,20152016 and2014,2015, the gross carrying amount and associated accumulated depreciation of the Company's property and equipment financed under capital leases, and the related obligations was not material. The Company also leases certain of its facilities and equipment underFLEXTRONICS INTERNATIONAL LTD.NOTES TO CONSOLIDATED FINANCIAL STATEMENTS (Continued)12. COMMITMENTS AND CONTINGENCIES (Continued)non-cancelable operating leases. These operating leases expire in various years through
20282035 and require the following minimum lease payments:Fiscal Year Ending March 31,Operating Lease Operating Lease (In thousands) (In thousands) 2016
$ 115,695 2017
91,272 $ 125,021 2018
80,555 106,287 2019
65,780 84,916 2020
57,366 69,194 2021 47,780 Thereafter
163,393 146,003 Total minimum lease payments
$ 574,061 $ 579,201 Total rent expense amounted to $124.2 million, $133.1 million$150.1 millionand$138.8$150.1 million in fiscal years 2016, 2015 and 2014,and 2013,respectively.82FLEXTRONICS INTERNATIONAL LTD.NOTES TO CONSOLIDATED FINANCIAL STATEMENTS (Continued)12. COMMITMENTS AND CONTINGENCIES (Continued)Litigation and other legal mattersOn December 11, 2013, Xilinx, Inc. (plaintiff) filed a lawsuit in Santa Clara County, California, Superior Court against Flextronics International Ltd.; Flextronics International USA, Inc.; and Flextronics Corporation (Case No. 113CV257431). The complaint asserts various claims, including fraud, negligent misrepresentation, breach of contract, and unfair competition, based on specific alleged incidents concerning our purchases and sales of Xilinx products. The plaintiff seeks an unspecified amount of compensatory, statutory, punitive, and other forms of damages, injunctive relief, and attorneys' fees and costs. The plaintiff also seeks a jury trial. On June 25, 2014, the Company filed motions for demurrer and to strike asking the court to dismiss the claims against itself. The court held a hearing on March 18, 2015 on the Company's motion for demurrer and to strike Xilinx's complaint. On March 26, 2015, the court granted the Company's motion, rejecting most of Xilinx's complaint, but allowing Xilinx the opportunity to file an amended complaint by April 25, 2015. Xilinx filed its amended complaint on April 27, 2015, and the Company's response is due May 29, 2015. Discovery is ongoing. Although the outcome of this matter is currently not determinable, management expects that any losses that are probable or reasonably possible of being incurred as a result of this matter, which are in excess of amounts already accrued in the Company's consolidated balance sheets, would not be material to the financial statements.During the fourth quarter of fiscal 2014, one ofourthe Company's Brazilian subsidiaries received an assessment for certain sales and import taxes. The tax assessment notice is for nine months of calendar year2010.2010 for an alleged amount of 50 million Brazilian reals (approximately $13.8 million based on the exchange rate as of March 31, 2016) plus interest. This assessment is in the second stage of the review process at the administrative level, andwe planthe Company plans to continue to vigorously oppose it as well as any future assessments.We are,The Company is, however, unable to determine the likelihood of an unfavorable outcome of these assessments against our Brazilian subsidiary. While we believe there is no legal basis for the alleged liabilities, due to the complexities and uncertainty surrounding the administrative-review and judicial processes in Brazil and the nature of the claims,we areit is unable to reasonably estimate a range of lossif any. We dofor this assessment or any future assessments that are reasonably possible. The Company does not expect final judicial determination on these claims for several years.FLEXTRONICS INTERNATIONAL LTD.NOTES TO CONSOLIDATED FINANCIAL STATEMENTS (Continued)12. COMMITMENTS AND CONTINGENCIES (Continued)During fiscal year 2015, one of
ourthe Company's non-operating Brazilian subsidiaries received an assessment of approximately $100 million related to income and social contribution taxes, interest and penalties. The Company believes there is no legal basis for the assessment and expects that any losses are remote. The Company plans to vigorously defend itself through the administrative and judicial processes.In addition, from time to time, the Company is subject to legal proceedings, claims, and litigation arising in the ordinary course of business. The Company defends itself vigorously against any such claims. Although the outcome of these matters is currently not determinable, management expects that any losses that are probable or reasonably possible of being incurred as a result of these matters, which are in excess of amounts already accrued in the Company's consolidated balancesheet,sheets, would not be material to the financial statements as a whole.13. INCOME TAXESThe domestic (Singapore) and foreign components of incomefrom continuing operationsbefore income taxes were comprised of the following:Fiscal Year Ended March 31, 2015 2014 2013 (In thousands) Domestic
$ 67,482 $ 314,639 $ 170,071 Foreign
603,173 85,815 158,744 Total
$ 670,655 $ 400,454 $ 328,815 Fiscal Year Ended March 31, 2016 2015 2014 (In thousands) Domestic $ 199,283 $ 67,482 $ 314,639 Foreign 255,392 603,173 85,815 Total $ 454,675 $ 670,655 $ 400,454 The provision for income taxesfrom continuing operationsconsisted of the following:Fiscal Year Ended March 31, Fiscal Year Ended March 31, 2015 2014 2013 2016 2015 2014 (In thousands) (In thousands) Current:
Domestic
$ 87 $ (681 ) $ 680 $ 56 $ 87 $ (681 ) Foreign
129,863 73,992 60,466 74,706 129,863 73,992 129,950 73,311 61,146 74,762 129,950 73,311 Deferred:
Domestic
(4,734 ) 9 (1,187 ) 3,779 (4,734 ) 9 Foreign
(55,362 ) (38,460 ) (33,646 ) (67,947 ) (55,362 ) (38,460 ) (60,096 ) (38,451 ) (34,833 ) (64,168 ) (60,096 ) (38,451 ) Provision for income taxes
$ 69,854 $ 34,860 $ 26,313 $ 10,594 $ 69,854 $ 34,860 83FLEXTRONICS INTERNATIONAL LTD.NOTES TO CONSOLIDATED FINANCIAL STATEMENTS (Continued)13. INCOME TAXES (Continued)The domestic statutory income tax rate was approximately 17.0% in fiscal years 2016, 20152014and2013.2014. The reconciliation of the income tax expensefrom continuing operationsexpected based onFLEXTRONICS INTERNATIONAL LTD.NOTES TO CONSOLIDATED FINANCIAL STATEMENTS (Continued)13. INCOME TAXES (Continued)domestic statutory income tax rates to the expense for income taxes included in the consolidated statements of operations is as follows:
Fiscal Year Ended March 31, Fiscal Year Ended March 31, 2015 2014 2013 2016 2015 2014 (In thousands) (In thousands) Income taxes based on domestic statutory rates
$ 114,011 $ 68,077 $ 55,899 $ 77,295 $ 114,011 $ 68,077 Effect of tax rate differential
(80,842 ) (68,654 ) (120,785 ) (73,286 ) (80,842 ) (68,654 ) Intangible amortization
5,143 4,750 4,881 11,214 5,143 4,750 Change in liability for uncertain tax positions
29,729 (2,178 ) 15,268 (13,724 ) 29,729 (2,178 ) Change in valuation allowance
2,495 26,838 68,596 1,049 2,495 26,838 Other
(682 ) 6,027 2,454 8,046 (682 ) 6,027 Provision for income taxes
$ 69,854 $ 34,860 $ 26,313 $ 10,594 $ 69,854 $ 34,860 A number of countries in which the Company is located allow for tax holidays or provide other tax incentives to attract and retain business. In general, these holidays were secured based on the nature, size and location of theCompany'sCompany’s operations. The aggregate dollar effect on theCompany'sCompany’s income resulting from tax holidays and tax incentives to attract and retain business for the fiscal years ended March 31,2015, 2014 and 2013 was $9.8 million, $15.2 million and $22.6 million, respectively. The effect on basic earnings per share was $0.02 for both fiscal years ended March 31,2016, 2015 and 2014 was $6.6 million, $9.8 million and$0.03 for the$15.2 million, respectively. For fiscal year ended March 31,2013. The2016, the effect on basic and diluted earnings per share was$0.02 for both$0.01 and $0.01, respectively, and the effect on basic and diluted earnings per share during fiscal yearsended March 31,2015 and 2014, were $0.02 and$0.03 for the fiscal year ended March 31, 2013.$0.02 and $0.02 and $0.02, respectively. Unless extended or otherwise renegotiated, the Company's existing holidays will expire in the fiscalyearsyear ending March 31,20162017 through fiscal year 2022.For fiscal years ended March 31, 2016, 2015 and 2014, the Company released valuation allowances totaling $63.3 million, $55.0 million and $37.4 million, respectively. These valuation allowance releases were primarily related to our operations that were deemed to be more likely than not to realize the respective deferred tax assets due to the increased profitability during the prior three fiscal years as well as continued forecasted profitability of that subsidiary. During fiscal year ended March 31, 2016, $43.0 million of the valuation allowance release was related to the recording of deferred tax liabilities in the US related to intangibles acquired during fiscal year 2016. However, these valuation allowance eliminations were offset by other current period valuation allowance movements primarily related to current period valuation allowance additions due to increased deferred tax assets related to current period losses in legal entities with existing full valuation allowance positions, and to a lesser extent, current period changes in valuation allowance positions due to increased negative evidence during the period in legal entities which did not previously have valuation allowance recorded. For fiscal years ended March 31, 2016, 2015 and 2014, the offsetting amounts totaled $64.3 million, $57.5 million and $64.2 million, respectively.Under its territorial tax system, Singapore generally does not tax foreign sourced income until repatriated to Singapore. The Company has included the effects of Singapore's territorial tax system in the rate differential line above. The tax effect of foreign income not repatriated to Singapore for the fiscal years 2016, 2015 and 2014 were $36.6 million, $0.0 million and2013 were$51.5 million,and $26.7 million,respectively.Due to the lack of sufficient foreign source income, tax effect for the fiscal year 2015 was zero.84FLEXTRONICS INTERNATIONAL LTD.NOTES TO CONSOLIDATED FINANCIAL STATEMENTS (Continued)13. INCOME TAXES (Continued)The components of deferred income taxes are as follows:As of March 31, As of March 31, 2015 2014 2016 2015 (In thousands) (In thousands) Deferred tax liabilities:
Fixed assets
$ (73,327 ) $ (76,524 ) $ (74,316 ) $ (73,327 ) Intangible assets (88,760 ) — Others
(44,603 ) (54,900 ) (29,472 ) (44,603 ) Total deferred tax liabilities
(117,930 ) (131,424 ) (192,548 ) (117,930 ) Deferred tax assets:
Fixed assets
80,370 80,801 65,004 80,370 Intangible assets
28,954 62,951 3,795 28,954 Deferred compensation
13,618 10,263 15,892 13,618 Inventory valuation
11,864 9,255 10,124 11,864 Provision for doubtful accounts
3,149 3,558 1,300 3,149 Net operating loss and other carryforwards
2,394,456 2,613,095 2,332,894 2,394,456 Others
264,781 201,906 271,272 264,781 2,797,192 2,981,829 2,700,281 2,797,192 Valuation allowances
(2,521,763 ) (2,749,040 ) (2,385,489 ) (2,521,763 ) Net deferred tax assets, net of valuation allowance
275,429 232,789 Net deferred tax assets 314,792 275,429 Net deferred tax asset
$ 157,499 $ 101,365 $ 122,244 $ 157,499 The net deferred tax asset is classified as follows:
Current asset (classified as other current assets)
$ 63,910 $ 13,522 $ — $ 63,910 Long-term asset (classified as other assets)
211,519 219,267 Long-term liability (classified as other liabilities)
(117,930 ) (131,424 ) Long-term asset 222,772 211,519 Long-term liability (100,528 ) (117,930 ) Total
$ 157,499 $ 101,365 $ 122,244 $ 157,499 Utilization of the Company's deferred tax assets is limited by the future earnings of the Company in the tax jurisdictions in which such deferred assets arose. As a result, management is uncertain as to when or whether these operations will generate sufficient profit to realize any benefit from the deferred tax assets. The valuation allowance provides a reserve against deferred tax assets that are not more likely than not to be realized by the Company. However, management has determined that it is more likely than not that the Company will realize certain of these benefits and, accordingly, has recognized a deferred tax asset from these benefits. The change in valuation allowance is net of certain increases and decreases to prior year losses and other carryforwards that have no current impact on the tax provision. Approximately $34.0 million of the valuation allowance relates to income tax benefits arising from the exercise of stock options, which if realized will be credited directly toshareholders'shareholders’ equity and will not be available to benefit the income tax provision in any future period.85FLEXTRONICS INTERNATIONAL LTD.NOTES TO CONSOLIDATED FINANCIAL STATEMENTS (Continued)13. INCOME TAXES (Continued)The Company has recorded deferred tax assets of approximately $2.4 billion related to tax losses and other carryforwards against which the Company has recorded a valuation allowance for all butFLEXTRONICS INTERNATIONAL LTD.NOTES TO CONSOLIDATED FINANCIAL STATEMENTS (Continued)13. INCOME TAXES (Continued)$45.4$79.3 million of the deferred tax assets. These tax losses and other carryforwardson a tax return basis,will expire at various dates as follows:Expiration dates of deferred tax assets related to operating losses and other carryforwards (In thousands) 2016 - 2021
$ 344,790 2022 - 2027
939,453 2028 and post
660,072 Indefinite
482,527 $ 2,426,842 Expiration dates of deferred tax assets related to operating losses and other carryforwards (In thousands) 2017 - 2022 $ 558,108 2023 - 2028 742,981 2029 and post 622,339 Indefinite 436,092 $ 2,359,520 The amount of deferred tax assets considered realizable, however, could be reduced or increased in the near-term if facts, including the amount of taxable income or the mix of taxable income between subsidiaries, differ frommanagement'smanagement’s estimates.The Company does not provide for income taxes on approximately$800.0$916.0 million of undistributed earnings of its subsidiaries which are considered to be indefinitely reinvested outside of Singapore as management has plans for the use of such earnings to fund certain activities outside of Singapore. Determination of the amount of the unrecognized deferred tax liability on these undistributed earnings is not practicable. During the fiscal year 2015, we changed our intent with regard to the indefinite reinvestment of foreign earnings from certain of our Chinese subsidiaries which are scheduled to bede-registeredde-registrated or liquidated in the near future. As a result, as of March 31, 2016, we have provided for applicable foreign withholding taxes on$145.9$106.7 million of undistributed foreign earnings,for 2015 and prior years,and recorded a deferred tax liability of approximately$12.6$11.2 million.A reconciliation of the beginning and ending amount of unrecognized tax benefits is as follows:Fiscal Year Ended
March 31,Fiscal Year Ended
March 31,2015 2014 2016 2015 (In thousands) (In thousands) Balance, beginning of fiscal year
$ 243,864 $ 230,018 $ 222,373 $ 243,864 Additions based on tax position related to the current year
27,048 16,823 21,273 27,048 Additions for tax positions of prior years
24,354 36,689 20,453 24,354 Reductions for tax positions of prior years
(16,388 ) (19,755 ) (9,578 ) (16,388 ) Reductions related to lapse of applicable statute of limitations
(11,891 ) (10,261 ) (22,312 ) (11,891 ) Settlements
(24,049 ) (8,964 ) (12,797 ) (24,049 ) Impact from foreign exchange rates fluctuation
(20,565 ) (686 ) (7,086 ) (20,565 ) Balance, end of fiscal year
$ 222,373 $ 243,864 $ 212,326 $ 222,373 TheCompany'sCompany’s unrecognized tax benefits are subject to change over the next twelve months primarily as a result of the expiration of certain statutes of limitations and as audits are settled. The Company believes it is reasonably possible that the total amount of unrecognized tax benefits could decrease by an estimated range of$25an additional $13.0 million to$52$41.0 million within the next twelve months primarily due to potential settlements of various audits and the expiration of certain statutes of limitations.FLEXTRONICS INTERNATIONAL LTD.NOTES TO CONSOLIDATED FINANCIAL STATEMENTS (Continued)13. INCOME TAXES (Continued)The Company and its subsidiaries file federal, state, and local income tax returns in multiple jurisdictions around
theworld. With few exceptions, the Company is no longer subject to income tax examinations by tax authorities for years before2005.2006.
Of the$222.4$212.3 million of unrecognized tax benefits at March 31,2015, $186.82016, $185.7 million will affect the annual effective tax rate ("ETR") if the benefits are eventually recognized. The amount thatdoes notdoesn’t impact theeffective tax rateETR relates to positions that would be settled with a tax loss carryforward previously subject to a valuation allowance.86FLEXTRONICS INTERNATIONAL LTD.NOTES TO CONSOLIDATED FINANCIAL STATEMENTS (Continued)13. INCOME TAXES (Continued)The Company recognizes interest and penalties accrued related to unrecognized tax benefits within the Company's tax expense. During the fiscal years ended March 31, 2016, 20152014and2013,2014, the Company recognized interest and penalties of approximately ($2.4) million and $2.5 million and $8.4million and $5.1million, respectively. The Company had approximately $14.6 million, $17.0 million$15.6 millionand$11.9$15.6 million accrued for the payment of interest and penalties as of the fiscal years ended March 31, 2016, 2015 and 2014,and 2013,respectively.14. RESTRUCTURING CHARGESThe Company initiated certain restructuring activities during fiscalyearsyear 2014and 2013intended to improve its operational efficiencies by reducing excess workforce and capacity and realign the corporate cost structure. There were no material restructuring activities during fiscalyearyears 2016 and 2015. Restructuring charges are recorded based upon employee termination dates, site closure and consolidation plans generally in conjunction with an overall corporate initiative to drive cost reduction and realign the Company's global footprint.Fiscal Year 2014During the fiscal year ended March 31, 2014, the Company recognized restructuring charges of approximately $75.3 million. The costs associated with these restructuring activities include employee severance, other personnel costs, non-cash impairment charges on equipment no longer in use and to be disposed of, and other exit related costs due to facility closures or rationalizations. Pre-tax restructuring charges comprised $73.4 million of cash charges predominantly related to employee severance and $1.9 million of non-cash charges related to impairment of long-lived assets. Employee severance costs were associated with the terminations of 6,758 identified employees. The identified employee terminations by reportable geographic region amounted to approximately 5,073, 1,482 and 203 for Asia, the Americas and Europe, respectively.FLEXTRONICS INTERNATIONAL LTD.NOTES TO CONSOLIDATED FINANCIAL STATEMENTS (Continued)14. RESTRUCTURING CHARGES (Continued)The components of the restructuring charges by geographic region incurred in fiscal year 2014 are as follows:
First
QuarterFourth
QuarterTotal FirstQuarterFourthQuarterTotal (In thousands) (In thousands) Americas:
Severance
$ 11,331 $ 11,290 $ 22,621 $ 11,331 $ 11,290 $ 22,621 Other exit costs
2,248 — 2,248 2,248 — 2,248 Total restructuring charges
13,579 11,290 24,869 13,579 11,290 24,869 Asia:
Severance
16,205 13,214 29,419 16,205 13,214 29,419 Long-lived asset impairment
1,900 — 1,900 1,900 — 1,900 Other exit costs
3,157 — 3,157 3,157 — 3,157 Total restructuring charges
21,262 13,214 34,476 21,262 13,214 34,476 Europe:
Severance
4,631 10,047 14,678 4,631 10,047 14,678 Other exit costs
1,288 — 1,288 1,288 — 1,288 Total restructuring charges
5,919 10,047 15,966 5,919 10,047 15,966 Total
Severance
32,167 34,551 66,718 32,167 34,551 66,718 Long-lived asset impairment
1,900 — 1,900 1,900 — 1,900 Other exit costs
6,693 — 6,693 6,693 — 6,693 Total restructuring charges
$ 40,760 $ 34,551 $ 75,311 $ 40,760 $ 34,551 $ 75,311 During the fiscal year ended March 31, 2014, the Company recognized approximately $66.7 million of severance costs related to employee terminations of which approximately $50.2 million was recognized in cost of sales.87FLEXTRONICS INTERNATIONAL LTD.NOTES TO CONSOLIDATED FINANCIAL STATEMENTS (Continued)14. RESTRUCTURING CHARGES (Continued)During the fiscal year ended March 31, 2014, the Company recognized approximately $1.9 million for the write-down of property and equipment, and was classified as a component of cost of sales. The property and equipment were sold as of March 31, 2014.During the fiscal year ended March 31, 2014, the Company recognized approximately $6.7 million of other exit costs, which primarily were comprised of $3.8 million related to personnel costs and $2.9 million of contractual obligations that resulted from facility closures. The majority of these costs were classified as a component of cost of sales.Fiscal Year 2013During the fiscal year ended March 31, 2013, the Company recognized restructuring charges of approximately $227.4 million, of which $110.1 million was associated with the terminations of 9,138 identified employees. The identified employee terminations by reportable geographic region amounted to approximately 4,467, 2,282, and 2,389 for Asia, the Americas and Europe, respectively. The costs associated with these restructuring activities include employee severance, other personnel costs, non-cash impairment charges on facilities and equipment that are not recoverable through future cash flowsFLEXTRONICS INTERNATIONAL LTD.NOTES TO CONSOLIDATED FINANCIAL STATEMENTS (Continued)14. RESTRUCTURING CHARGES (Continued)or are no longer in use and are to be disposed of, and other exit related costs due to facility closures or rationalizations. Pre-tax restructuring charges comprised $123.0 million of cash charges predominantly related to employee severance costs and $104.4 million of non-cash charges primarily related to asset impairment and other exit charges. The activities associated with these charges were completed by the first quarter of fiscal year 2014.The components of the restructuring charges by geographic region incurred in fiscal year 2013 are as follows:Third
QuarterFourth
QuarterTotal (In thousands) Americas:
Severance
$ 863 $ 13,156 $ 14,019 Long-lived asset impairment
— 6,302 6,302 Other exit costs
322 6,533 6,855 Total restructuring charges
1,185 25,991 27,176 Asia:
Severance
8,572 18,076 26,648 Long-lived asset impairment
46,250 5,268 51,518 Other exit costs
28,818 1,443 30,261 Total restructuring charges
83,640 24,787 108,427 Europe:
Severance
6,142 63,301 69,443 Long-lived asset impairment
9,851 1,782 11,633 Other exit costs
1,873 8,882 10,755 Total restructuring charges
17,866 73,965 91,831 Total
Severance
15,577 94,533 110,110 Long-lived asset impairment
56,101 13,352 69,453 Other exit costs
31,013 16,858 47,871 Total restructuring charges
$ 102,691 $ 124,743 $ 227,434 During the fiscal year ended March 31, 2013, the Company recognized approximately $110.1 million of severance costs related to employee terminations. Approximately $98.5 million of this was classified as a component of cost of sales for fiscal year 2013.During the fiscal year ended March 31, 2013, the Company recognized approximately $69.5 million for the write-down of property and equipment and other manufacturing assets. The majority of this amount was classified as a component of cost of sales.During the fiscal year ended March 31, 2013, the Company recognized approximately $47.9 million of other exit costs, which primarily were comprised of $22.8 million for the write-down of certain customer specific assets that were determined to be unrecoverable based on a specific product exit and resulting declining customer volumes. Additionally, for fiscal year 2013, other exit costs include $24.7FLEXTRONICS INTERNATIONAL LTD.NOTES TO CONSOLIDATED FINANCIAL STATEMENTS (Continued)14. RESTRUCTURING CHARGES (Continued)million of customer disengagement costs primarily related to inventory that resulted from a product exit as well as contractual obligations from facility closures.The following table summarizes the provisions, respective payments, and remaining accrued balance as of March 31,
20152016 for charges incurred in fiscal years 2016, 2015 and 20142013and prior periods:Severance Long-Lived
Asset
ImpairmentOther
Exit CostsTotal (In thousands) Severance Long-Lived
Asset
ImpairmentOther
Exit CostsTotal Balance as of March 31, 2012
$ 4,620 $ — $ 8,067 $ 12,687 Provision for charges incurred in fiscal year 2013
110,110 69,453 47,871 227,434 Cash payments for charges incurred in fiscal year 2013
(28,586 ) — (3,832 ) (32,418 ) Cash payments for charges incurred in fiscal year 2010 and prior
(2,455 ) — (2,902 ) (5,357 ) Non-cash charges incurred in fiscal year 2013
— (69,453 ) (34,993 ) (104,446 ) (In thousands) Balance as of March 31, 2013
83,689 — 14,211 97,900 $ 83,689 $ — $ 14,211 $ 97,900 Provision for charges incurred in fiscal year 2014
66,718 1,900 6,693 75,311 66,718 1,900 6,693 75,311 Cash payments for charges incurred in fiscal year 2014
(40,273 ) — (4,296 ) (44,569 ) (40,273 ) — (4,296 ) (44,569 ) Cash payments for charges incurred in fiscal year 2013
(71,470 ) — (8,755 ) (80,225 ) (71,470 ) — (8,755 ) (80,225 ) Cash payments for charges incurred in fiscal year 2010 and prior
(2,171 ) — (1,950 ) (4,121 ) (2,171 ) — (1,950 ) (4,121 ) Non-cash charges incurred in fiscal year 2014
— (1,900 ) — (1,900 ) — (1,900 ) — (1,900 ) Balance as of March 31, 2014
36,493 — 5,903 42,396 36,493 — 5,903 42,396 Cash payments for charges incurred in fiscal year 2014
(18,558 ) — (2,212 ) (20,770 ) (18,558 ) — (2,212 ) (20,770 ) Cash payments for charges incurred in fiscal year 2013
(4,560 ) — (1,685 ) (6,245 ) (4,560 ) — (1,685 ) (6,245 ) Cash payments for charges incurred in fiscal year 2010 and prior
(12 ) — (312 ) (324 ) (12 ) — (312 ) (324 ) Balance as of March 31, 2015
13,363 — 1,694 15,057 13,363 — 1,694 15,057 Cash payments for charges incurred in fiscal year 2014 (290 ) — — (290 ) Cash payments for charges incurred in fiscal year 2013 (1,168 ) — (185 ) (1,353 ) Cash payments for charges incurred in fiscal year 2010 and prior — — (174 ) (174 ) Balance as of March 31, 2016 11,905 — 1,335 13,240 Less: Current portion (classified as other current liabilities)
3,078 — 390 3,468 2,212 — 248 2,460 Accrued restructuring costs, net of current portion (classified as other liabilities)
$ 10,285 $ — $ 1,304 $ 11,589 $ 9,693 $ — $ 1,087 $ 10,780 15. OTHER CHARGES (INCOME), NETDuring fiscal year 2016, the Company incurred net losses of $47.7 million primarily due to $26.8 million loss on disposition of a non-strategic Western European manufacturing facility which included a non-cash foreign currency translation loss of $25.3 million, and $21.8 million from the impairment of a non-core investment. These were offset by currency translation gains of $4.2 million.During fiscal year 2015, an amendment to a customer contract to reimburse a customer for certain performance provisions was executed which included the removal of a $55.0 million contractual obligation recognized during fiscal year 2014. Accordingly, the Company reversed this charge with a corresponding credit to other charges (income), net in the consolidated statement of operations. Additionally, during fiscal year 2015, the Company recognized a loss of $11.0 million in connection with the disposition of a manufacturing facility in Western Europe. The Company received $11.5 million in cash for the sale of $27.2 million in net assets of the facility. The loss also includes $4.6 million of estimated transaction costs, partially offset by a gain of $9.3 million for the release of cumulative foreign currency translation gains triggered by the disposition.88FLEXTRONICS INTERNATIONAL LTD.NOTES TO CONSOLIDATED FINANCIAL STATEMENTS (Continued)15. OTHER CHARGES (INCOME), NET (Continued)During fiscal year 2014, the Company recognized $55.0 million of other charges for the contractual obligation to reimburse a customer for certain performance provisions as described above. Additionally,FLEXTRONICS INTERNATIONAL LTD.NOTES TO CONSOLIDATED FINANCIAL STATEMENTS (Continued)15. OTHER CHARGES (INCOME), NET (Continued)the Company exercised warrants to purchase common shares of a certain supplier and sold the underlying shares for total proceeds of $67.3 million resulting in a loss of $7.1 million. Further, the Company recognized a gain of $4.6 million on the sale of certain investments.
During fiscal year 2013, the Company recognized a net gain of $74.4 million for the fair value adjustment of the warrants referred to above.16. INTEREST AND OTHER, NETFor the fiscal years ended March 31, 2016, 20152014and2013,2014, the Company recognized interest income of $12.3 million, $18.7 million and $17.6million and $20.0million.For the fiscal years ended March 31, 2016, 20152014and2013,2014, the Company recognized interest expense of $98.0 million, $76.4 million$79.9 millionand$68.9$79.9 million, respectively, on its debt obligations outstanding during the period.For the fiscal years ended March 31, 2016, 20152014and2013,2014, the Company recognized gains on foreign exchange transactions of $24.4 million, $19.7 million and $11.8 million, respectively.For the fiscal years ended March 31, 2016, 2015 and$19.92014, the Company recognized $11.0 million,respectively.$9.9 million and $9.5 million of expense related to its ABS and AR Sales Programs.
For the fiscal years ended March 31, 2016, the Company incurred $8.0 million of acquisition-related costs.17. BUSINESS AND ASSET ACQUISITIONSBusiness AcquisitionsThe business and asset acquisitions described below were accounted for using the purchase method of accounting, and accordingly, the fair value of the net assets acquired and the results of the acquired businesses were included in the Company's consolidated financial statements from the acquisition dates forward. The Company has not finalized the allocation of the consideration for certain of its recently completed acquisitions andgenerally expects to completecompletes these allocationswithinin less than one year of the respective acquisition dates.Fiscal year 2016 business acquisitionsAcquisition of Mirror Controls InternationalOn June 29, 2015, the Company completed its acquisition of 100% of the outstanding share capital of MCi, and paid approximately $555.2 million, net of $27.7 million of cash acquired. This acquisition expanded the Company's capabilities in the automotive market, and was included in the HRS segment. The allocation of the purchase price to the tangible and identifiable intangible assets acquired and liabilities assumed was based on their estimated fair values as of the date of acquisition. The excess of the purchase price over the tangible and identifiable intangible assets acquired and liabilities assumed has been allocated to goodwill.The following represents the Company's allocation of the total purchase price to the acquired assets and liabilities of MCi (in thousands):89FLEXTRONICS INTERNATIONAL LTD.NOTES TO CONSOLIDATED FINANCIAL STATEMENTS (Continued)17. BUSINESS AND ASSET ACQUISITIONS (Continued)Current assets: Accounts receivable $ 41,559 Inventories 19,897 Other current assets 2,856 Total current assets 64,312 Property and equipment, net 38,832 Other assets 2,463 Intangibles 236,800 Goodwill 323,357 Total assets $ 665,764 Current liabilities: Accounts payable $ 28,002 Accrued liabilities & other current liabilities 21,113 Total current liabilities 49,115 Other liabilities 61,492 Total aggregate purchase price $ 555,157 The intangible assets of $236.8 million is comprised of customer relationships of $75.5 million and licenses and other intangible assets of $161.3 million. Customer relationships and licenses and other intangibles are each amortized over a weighted-average estimated useful life of 10 years. In addition to net working capital, the Company acquired $38.8 million of machinery and equipment and assumed $61.5 million of other liabilities primarily comprised of deferred tax liabilities. The Company incurred $6.6 million in acquisition-related costs related to the acquisition of MCi during fiscal year 2016.Acquisition of a facility from Alcatel-LucentOn July 1, 2015, the Company acquired an optical transport facility from Alcatel-Lucent for approximately $67.5 million, which expanded its capabilities in the telecom market and was included in the CEC segment. The Company acquired primarily $55.1 million of inventory, $10.0 million of property and equipment primarily comprised of a building and land, and recorded goodwill and intangible assets for a customer relationship of $3.6 million and $2.1 million, respectively, and assumed $3.3 million in other net liabilities in connection with this acquisition. The customer relationship intangible will amortize over a weighted-average estimated useful life of 5 years.Acquisition of NextrackerOn September 28, 2015, the Company acquired 100% of the outstanding share capital of NEXTracker, a provider of smart solar tracking solutions. The initial cash consideration was approximately $240.8 million, net of $13.2 million of cash acquired, with an additional $81.0 million of estimated potential contingent consideration, for a total purchase consideration of $321.8 million. At the date of the acquisition, the maximum possible consideration under the agreement was $97.2 million upon achievement of future revenue performance targets. Subsequent to the acquisition date, the Company adjusted its estimate of the contingent consideration by $3.7 million, as described further in note 11, which was recorded as an expense in the consolidated statement of operations. The Company also acquired NEXTracker’s equity incentive plan. The financial results of NEXTracker were included in the IEI segment. The allocation of the purchase price to the tangible and identifiable intangible assets acquired and liabilities assumed was based on their estimated fair values as of the date of acquisition. The excess of the purchase price over the tangible and identifiable intangible assets acquired and liabilities assumed has been allocated to goodwill.The following represents the Company's preliminary allocation of the total purchase price to the acquired assets and liabilities of NEXTracker (in thousands):90FLEXTRONICS INTERNATIONAL LTD.NOTES TO CONSOLIDATED FINANCIAL STATEMENTS (Continued)17. BUSINESS AND ASSET ACQUISITIONS (Continued)Current assets: Accounts receivable $ 60,298 Inventories 3,235 Other current assets 19,272 Total current assets 82,805 Property and equipment, net 1,382 Other assets 70 Intangibles 108,700 Goodwill 255,601 Total assets $ 448,558 Current liabilities: Accounts payable $ 17,226 Other current liabilities 63,870 Total current liabilities 81,096 Other liabilities 45,712 Total aggregate purchase price $ 321,750 The intangible assets of $108.7 million is comprised of customer-related intangibles of $47.3 million and licenses and other intangible assets of $61.4 million. Customer-related intangibles are amortized over a weighted-average estimated useful life of 4 years while licenses and other intangibles are amortized over a weighted-average estimated useful life of 6 years.Other business acquisitionsAdditionally, during fiscal year 2016, the Company completed eight acquisitions that were not individually, nor in the aggregate, significant to the consolidated financial position, results of operations and cash flows of the Company. Four of the acquired businesses expanded the Company’s capabilities in the medical devices market, particularly precision plastics and molding within the HRS segment, two of them strengthened capabilities in the consumer electronics market within the CTG segment, one strengthened the capabilities in the communications market within the CEC segment, and the last one strengthened capabilities in the household industrial and lifestyle market within the IEI segment. The Company paid $53.3 million, net of $3.7 million of cash held by the targets. The Company acquired $14.4 million of property and equipment, assumed liabilities of $17.7 million and recorded goodwill and intangibles of $57.4 million. These intangibles will amortize over a weighted-average estimated useful life of 4 years.The results of operations for all of the acquisitions completed in fiscal year 2016 were included in the Company’s consolidated financial results beginning on the date of each acquisition. The total amount of net income for all of the acquisitions completed in fiscal year 2016, collectively, was $41.4 million. The total amount of revenue of these acquisitions, collectively, was not material to the Company’s consolidated financial results for the fiscal year 2016.On a pro-forma basis, and assuming the acquisitions occurred on the first day of the prior comparative period, or April 1, 2014, net income would have been estimated to be $410.1 million, and $586.4 million for fiscal years 2016 and 2015, respectively. The estimated pro-forma net income for all periods presented does not include the $43.0 million tax benefit for the release of the valuation allowance on deferred tax assets relating to the NEXTracker acquisition, recognized in fiscal year 2016 as discussed further in note 13, to promote comparability. Pro-forma revenue for the acquisitions in fiscal year 2016 and 2015 have not been presented because the effect, collectively, was not material to the Company’s consolidated revenues for all periods presented.Fiscal year 2015 business acquisitionsDuring the fiscal year 2015, the Company completed four acquisitions that were not individually, nor in the aggregate, significant to the consolidated financial position, results of operations and cash flows of the Company. All of the acquired91FLEXTRONICS INTERNATIONAL LTD.NOTES TO CONSOLIDATED FINANCIAL STATEMENTS (Continued)17. BUSINESS AND ASSET ACQUISITIONS (Continued)businesses expanded the Company's capabilities in the medical devices market, particularly precision plastics, within the HRSbusiness group.segment. The Company paid $52.7 million net of $5.9 million of cash held by the acquired businesses, and recorded an accrual of $4.5 million for contingent consideration relating to one of the acquisitions. The Company primarily acquired $29.4 million of current assets, $9.0 million of property and equipment, recorded goodwill of $35.8 million and intangibles of $16.1 million, and assumed certain liabilities relating to payables and debt in connection with these acquisitions. The results of operations were included in the Company's consolidated financial results beginning on the date of these acquisitions. Pro-forma results of operations for these acquisitions have not been presented because the effects of the acquisitions were immaterial to the Company's consolidated financial results for all periods presented. The Company also paid $7.5 million as a deposit to acquireanothera certain businessexpected to closethat closed in fiscal year 2016which isand that strengthened capabilities in the household industrial market within the IEI segment. This deposit was included in otherassets.assets during fiscal year 2015.FLEXTRONICS INTERNATIONAL LTD.NOTES TO CONSOLIDATED FINANCIAL STATEMENTS (Continued)17. BUSINESS AND ASSET ACQUISITIONS (Continued)Fiscal year 2014 business acquisitions
Acquisition of Motorola Mobility LLC from GoogleOn April 16, 2013, the Company completed the acquisition of certain manufacturing operations from Google's Motorola Mobility LLC. The Company also entered into a manufacturing and services agreement with Motorola Mobility for mobile devices in conjunction with this acquisition. This acquisition expanded the Company's relationship with Google's Motorola Mobility and the Company's capabilities in the mobile devices market, within the CTGbusiness group. The results of operations were included in the Company's consolidated financial results beginning on the date of acquisition. Revenues were approximately 11.5% of total revenue for the fiscal year ended March 31, 2014. Income before tax of the acquired operations for the fiscal year ended March 31, 2014 was not significant to the consolidated financial results of the Company. On a pro forma basis, the estimated increase to our previously reported revenue amounts to reflect the acquisition of this business as of the first day of the prior comparative period is $3.3 billion for the year-ended March 31, 2013, and operating results for the same period was immaterial.segment.
The cash consideration for this acquisition amounted to $178.9 million. The allocation of the purchase price to the tangible and identifiable intangible assets acquired and liabilities assumed was based on their estimated fair values as of the date of acquisition. The excess of the purchase price over the tangible and identifiable intangible assets acquired and liabilities assumed has been allocated to goodwill.The following represents the Company's allocation of the total purchase price to the acquired assets and liabilities assumed of Google's Motorola Mobility LLC (in thousands):Current assets:
Inventories
$ 97,740 $ 97,740 Other current assets
24,280 24,280 Total current assets
122,020 122,020 Property and equipment
45,198 45,198 Goodwill
2,844 2,844 Other intangible assets (useful life—6 years)
2,948 2,948 Other assets
7,414 7,414 Total assets
$ 180,424 $ 180,424 Current liabilities:
Other current liabilities
$ 317 $ 317 Total current liabilities
317 317 Other liabilities
1,202 1,202 Total aggregate purchase price
$ 178,905 $ 178,905 Acquisition of Riwisa AGOn November 4, 2013, the Company acquired all of the outstanding shares of Riwisa AG, a company registered in Switzerland for total cash consideration of $44.0 million, net of cash acquiredFLEXTRONICS INTERNATIONAL LTD.NOTES TO CONSOLIDATED FINANCIAL STATEMENTS (Continued)17. BUSINESS AND ASSET ACQUISITIONS (Continued)amounting to$9.4 million. This acquisition expanded the Company's capabilities in the medical devices market, particularly precision plastics within the HRSbusiness group.segment. The Company primarily acquired inventory, property and equipment and assumed certain liabilities relating to payables and debt. The results of operations were included in the Company's consolidated financial results beginning on the date of acquisition. Proforma results of operations for this acquisition have not been presented because the effects of the acquisition were not material to the Company's consolidated financial results.92FLEXTRONICS INTERNATIONAL LTD.NOTES TO CONSOLIDATED FINANCIAL STATEMENTS (Continued)17. BUSINESS AND ASSET ACQUISITIONS (Continued)The initial allocation of the purchase price to the tangible and identifiable intangible assets acquired and liabilities assumed was based on their estimated fair values as of the date of acquisition. The excess of the purchase price over the tangible and identifiable intangible assets acquired and liabilities assumed has been allocated to goodwill. During fiscal year 2014 the Company recorded $22.7 million as intangible assets and $18.5 million as goodwill based on a preliminary assessment of fair value of assets acquired and liabilities assumed. During fiscal year 2015, the Company further adjusted the purchase allocation for the acquisition resulting in a $2.6 million increase in the total cash consideration from $44.0 million to $46.6 million, and an $8.7 million fair value adjustment for assets acquired, increasing total goodwill to $27.2 million. Intangible assets are comprised of customer-relationships of $15.8 million amortized over a period of 10 years and developed technology and trade names of $6.9 million amortized over a period of 7 years.Other business acquisitionsFurther, during fiscal year 2014, the Company completed two other acquisitions for total cash consideration of $15.1 million. Neither of these acquisitions were significant to the Company's consolidated financial position, results of operations and cash flows. These businesses expanded the Company's capabilities primarily in manufacturing operations for precision plastics, components and molds. The Company acquired primarily property and equipment and inventory and recorded goodwill amounting to $5.0 million in connection with these acquisitions. The results of operations were included in the Company's consolidated financial results beginning on the dates of these acquisitions. Proforma results of operations for these acquisitions have not been presented because the effects of the acquisitions were immaterial to the Company's consolidated financial results. Additionally, transaction costs related to all acquisitions completed during the periods presented were immaterial to the Company's financial results.The Company continues to evaluate certain assets and liabilities related to business combinations completed during recent periods. Additional information, which existed as of the acquisition date, may become known to the Company during the remainder of the measurement period, a period not to exceed 12 months from the acquisition date. Changes to amounts recorded as assets or liabilities, as a result of such additional information, may result in a corresponding adjustment to goodwill.The goodwill generated from the Company's business combinations completed during the fiscal year ended March 31, 2014 is primarily related to value placed on the employee workforce, service offerings and capabilities, and expected synergies and is not deductible for income tax purposes.FLEXTRONICS INTERNATIONAL LTD.NOTES TO CONSOLIDATED FINANCIAL STATEMENTS (Continued)17. BUSINESS AND ASSET ACQUISITIONS (Continued)Fiscal year 2013 business acquisitionsAcquisition of Saturn Electronics and Engineering Inc.During the fiscal year 2013, the Company completed its acquisition of all outstanding common stock of Saturn Electronics and Engineering, Inc. ("Saturn"), a supplier of electronics manufacturing services, solenoids and wiring for the automotive, appliance, consumer, energy and industrial markets. The acquisition of Saturn broadened the Company's service offering and strengthened its capabilities in the automotive and consumer electronics businesses within the HRS business group. The results of operations were included in the Company's consolidated financial results beginning on the date of acquisition which amounted to approximately $100.9 million in revenue for the year ended March 31, 2013. Net income of the acquired business during the fiscal year ended March 31, 2013 was not significant to the consolidated operating results of the Company.The initial cash consideration for this acquisition amounted to $193.7 million with up to an additional $15.0 million of estimated potential contingent consideration, for a total purchase consideration of $208.7 million. During fiscal year 2015, the Company paid $11.3 million to settle all remaining contingent consideration.The allocation of the purchase price to Saturn's tangible and identifiable intangible assets acquired and liabilities assumed was based on their estimated fair values as of the date of acquisition. Management determined the value of acquired intangible assets with the assistance of a third-party appraisal firm. The excess of the purchase price over the tangible and identifiable intangible assets acquired and liabilities assumed has been allocated to goodwill.The following represents the Company's allocation of the total purchase price to the acquired assets and liabilities assumed of Saturn (in thousands):Current assets:
Cash and cash equivalents
$ 2,191 Accounts receivable
44,879 Inventories
23,350 Other current assets
1,970 Total current assets
72,390 Property and equipment
40,392 Goodwill
102,725 Other intangible assets
57,200 Other assets
925 Total assets
$ 273,632 Current liabilities:
Accounts payable
$ 29,616 Other current liabilities
1,740 Total current liabilities
31,356 Other liabilities
33,585 Total aggregate purchase price
$ 208,691 FLEXTRONICS INTERNATIONAL LTD.NOTES TO CONSOLIDATED FINANCIAL STATEMENTS (Continued)17. BUSINESS AND ASSET ACQUISITIONS (Continued)The intangible assets of $57.2 million is comprised of customer-relationships of $46.4 million and developed technology amounting to $10.8 million. Customer relationships are amortized over an estimated useful life of 5 years and developed technology is amortized over an estimated useful life of 7 years.Other business acquisitionsAdditionally, during the fiscal year 2013, the Company completed three other acquisitions that were not individually, nor in the aggregate, significant to the Company's consolidated financial position, results of operations and cash flows. The total consideration, which was paid in cash for these acquisitions, and earn outs related to certain prior period acquisitions amounted to $72.7 million. The total amount of cash acquired from these acquisitions amounted to $80.1 million, resulting in net cash of $7.4 million acquired from these acquisitions during the fiscal year ended 2013. One of the acquired businesses expanded the Company's capabilities primarily in the medical and defense markets; another acquired business supports the hardware product manufacturing needs of an existing customer in the technology industry; and the other acquired business expanded the Company's capabilities primarily in the LED design and manufacturing market. The Company primarily acquired cash, inventory and certain other manufacturing assets, and recorded goodwill of $61.9 million in connection with these acquisitions. The aggregate results of operations for these acquisitions were included in the Company's consolidated financial results beginning on the dates of acquisition which amounted to approximately $231.3 million in revenue for the fiscal year ended March 31, 2013. Operating results of these acquisitions during the fiscal year ended March 31, 2013 was not significant, individually or in the aggregate, to the consolidated operating results of the Company.In connection with one
of thebusinesses acquiredbusinesses,during fiscal year 2013, the Company entered into an agreement with an existing customer and a third party banking institution to procure certain manufacturing equipment that was financed by the third party banking institution, acting as an agent of the customer. The manufacturing equipment was used exclusively for the benefit of this customer. The Companyhas the ability to settle the obligation related to these financed assets by returning the equipment to the customer andcannot be required to pay cash by either the customer or the third party banking institution. During fiscal year 2015, the Company ceased manufacturing of the product related to the financed equipment. As a result, pursuant an agreement with the customer, the Company as an agent on behalf of the customeris in the process of dispositioningdispositioned the equipment via sales to third parties andforwardingused the proceeds to reduce the obligation to the third party bankinginstitution reducing the outstanding obligation.institution. Accordingly, the residual valueofdue from the customer related to the equipment financed by the third party banking institution decreased to$169.2$83.6 million from$267.5$169.2 million as of March 31,20152016 and2014,2015, respectively, and has been included in other current assets. The outstanding balance due to the third party banking institution related to the financed equipment correspondingly decreased to$197.7$122.0 million from$286.5$197.7 million as of March 31,20152016 and2014,2015, respectively, and has been included in other current liabilities. The cash inflows from the sale of the manufacturing equipment originally purchased on behalf of the customer and financed by the third party banking institution amounting to $54.3 million and $79.7 million have been included in other investing cash flows for the fiscalyearyears ended March 31,2015.2016 and 2015, respectively. The cash outflows relating to the purchase of the manufacturing equipment by the Company on behalf of the customeramounting toof $37.3million and $115.3million have also been included in other investing cash flows for the fiscalyearsyear ended March 31,2014 and 2013, respectively.2014. The cash outflows to repay the third party banking institution on behalf of the customer upon cessation of manufacturing operationsamounting toof $75.8 million and $88.8FLEXTRONICS INTERNATIONAL LTD.NOTES TO CONSOLIDATED FINANCIAL STATEMENTS (Continued)17. BUSINESS AND ASSET ACQUISITIONS (Continued)million have been included in cash flows from other financing activities during the fiscal
yearyears ended March 31,2015.2016 and 2015, respectively. Net cash inflows amounting to $13.5million and $101.9million relating to the funding of these assets by the financial institution on behalf of the customer have been included in cash flows from other financing activities during the fiscalyearsyear ended March 31,2014 and 2013, respectively.Acquisition of Mirror Controls InternationalOn April 29, 2015, the Company announced that it has entered into a definitive agreement to acquire Mirror Controls International (MCi) from private equity firm Egeria in an all cash transaction valuing its share capital at approximately $500.0 million. The transaction is expected to close in the second quarter of fiscal year 2016 and will be included as part of our HRS business group. A preliminary purchase price allocation is not yet available for this acquisition.2014.
18. SHARE REPURCHASE PLANDuring fiscal year2015,2016, the Company repurchased approximately39.037.3 million shares for an aggregate purchase value of approximately$421.7$412.8 million under two separate repurchase plans as further discussed below.93FLEXTRONICS INTERNATIONAL LTD.NOTES TO CONSOLIDATED FINANCIAL STATEMENTS (Continued)18. SHARE REPURCHASE PLAN (Continued)During the second quarter of fiscal year2015,2016, the Company repurchased the entire remaining amount under a prior share repurchase plan that was approved by the Company's Board of Directors onJuly 24, 2013August 28, 2014 and the Company's shareholders at the20132014 Extraordinary General Meeting held onJuly 29, 2013,August 28, 2014, or approximately15.913.2 million shares for an aggregate purchase value of approximately$160.1$154.9 million, and retired all of these shares.Under theCompany'sCompany’s current share repurchase program, the Board of Directors authorized repurchases of its outstanding ordinary shares for up to$500$500 million in accordance with the share repurchase mandate approved by theCompany'sCompany’s shareholders at the date of the most recent Extraordinary General Meeting held on August28, 2014.20, 2015. During fiscal year2015,2016, the Company repurchased approximately23.024.1 million shares for an aggregate purchase value of approximately$261.6$257.9 million under this plan, including amounts accrued but not paid, and retired all of these shares. As of March 31,2015,2016, shares in the aggregate amount of$238.4$242.1 million were available to be repurchased under the currentBoard authorization.plan.
19. SEGMENT REPORTINGOperating segments are defined as components of an enterprise for which separate financial information is available that is evaluated regularly by the Chief Operating Decision Maker ("CODM"), or a decision making group, in deciding how to allocate resources and in assessing performance. Resource allocation decisions and the Company's performance are assessed by its Chief Executive Officer ("CEO"), with support from his direct staff who oversee certain operations of the business, collectively identified as the CODM or the decision making group.FLEXTRONICS INTERNATIONAL LTD.NOTES TO CONSOLIDATED FINANCIAL STATEMENTS (Continued)19. SEGMENT REPORTING (Continued)During the fourth quarter of fiscal year 2015, the Company
reassessed its conclusion around what constitutes the CODM for the Company. It was concluded that the CODM group is collectively the CEO, as supported by his direct staff who oversee the operations of the Company's four business groups. Based on this reassessment, the Companyconcluded it has four reportable operatingsegments which are aligned to its four business groups:segments: HRS, CTG, IEI, andINS.CEC. The Company assessed that there was no change to its operating segments in fiscal year 2016. These segments represent components of the Company for which separate financial information is available that is utilized on a regular basis by the CODM. These segments are determined based on several factors, including the nature of products and services, the nature of production processes, customer base, delivery channels and similar economic characteristics. Refer to note 1 to the financial statements for a description of the various product categories manufactured under each of these segments.An operating segment's performance is evaluated based on its pre-tax operating contribution, or segment income. Segment income is defined as net sales less cost of sales, and segment selling, general and administrative expenses, and does not include amortization of intangibles, stock-based compensation, restructuring charges, certain bad debt charges, other charges (income), net and interest and other, net.A portion of amortization and depreciation is allocated to the respective segment together with other general corporate research and development and administrative expenses. As property and equipment is not allocated to the segment, amortization and depreciation is not separately reviewed by the CODM group.94FLEXTRONICS INTERNATIONAL LTD.NOTES TO CONSOLIDATED FINANCIAL STATEMENTS (Continued)19. SEGMENT REPORTING (Continued)Selected financial information by segment is as follows:Fiscal Year Ended March 31, 2015 2014 2013 (In thousands) Net sales:
Integrated Network Solutions
$ 9,191,211 $ 9,688,023 $ 9,935,302 Consumer Technology Group
8,940,043 9,357,635 7,036,903 Industrial & Emerging Industries
4,459,351 3,787,838 3,762,508 High Reliability Solutions
3,557,311 3,275,111 2,834,762 $ 26,147,916 $ 26,108,607 $ 23,569,475 Segment income and reconciliation of income before tax:
Integrated Network Solutions
$ 257,323 $ 259,329 $ 270,270 Consumer Technology Group
218,251 125,171 41,339 Industrial & Emerging Industries
131,956 127,085 157,881 High Reliability Solutions
227,595 221,402 168,166 Corporate and Other
(83,988 ) (68,475 ) (26,280 ) Total segment income
751,137 664,512 611,376 Reconciling items:
Intangible amortization
32,035 28,892 29,529 Stock-based compensation
50,270 40,439 34,529 Restructuring charges
— 75,311 227,434 Other charges (income), net
(53,233 ) 57,512 (65,190 ) Interest and other, net
51,410 61,904 56,259 Income from continuing operations before income taxes
$ 670,655 $ 400,454 $ 328,815 Fiscal Year Ended March 31, 2016 2015 2014 (In thousands) Net sales: Communications & Enterprise Compute $ 8,841,642 $ 9,191,211 $ 9,688,023 Consumer Technologies Group 6,997,526 8,940,043 9,357,635 Industrial & Emerging Industries 4,680,718 4,459,351 3,787,838 High Reliability Solutions 3,898,999 3,557,311 3,275,111 $ 24,418,885 $ 26,147,916 $ 26,108,607 Segment income and reconciliation of income before tax: Communications & Enterprise Compute $ 265,076 $ 257,323 $ 259,329 Consumer Technologies Group 163,677 218,251 125,171 Industrial & Emerging Industries 157,588 131,956 127,085 High Reliability Solutions 294,635 227,595 221,402 Corporate and Other (89,219 ) (83,988 ) (68,475 ) Total income 791,757 751,137 664,512 Reconciling items: Intangible amortization 65,965 32,035 28,892 Stock-based compensation 77,580 50,270 40,439 Restructuring charges (2) — — 75,311 Bad debt charge (1) 61,006 — — Other charges (income), net 47,738 (53,233 ) 57,512 Interest and other, net 84,793 51,410 61,904 Income before income taxes $ 454,675 $ 670,655 $ 400,454 Asset information on a segment basis is not disclosed as this information is not separately identified and is not internally reported to the Company's CODM.(1) During fiscal year 2016, the Company incurred a charge of $61.0 million related to SunEdison which had declared bankruptcy. This charge is included in selling, general and administrative expenses in the consolidated statement of operations but is excluded from the measurement of the Company's operating segment's performance. Refer to note 2 for additional information regarding this charge. (2) During the fiscal year ended March 31, 2014, the Company recognized restructuring charges of approximately $75.3 million. The costs associated with these restructuring activities include employee severance, other personnel costs, non-cash impairment charges on equipment no longer in use and to be disposed of, and other exit related costs due to facility closures or rationalizations. Refer to note 14 for additional information regarding this charge. Corporate and other primarily includes corporate services costs that are not included in the CODM's assessment of the performance of each of the identified reporting segments.Property and equipment on a segment basis is not disclosed as it is not separately identified and is not internally reported by segment to the Company's CODM. During fiscal year 2016, 2015 and 2014, depreciation expense included in the segment's measure of operating performance above is as follows:95FLEXTRONICS INTERNATIONAL LTD.NOTES TO CONSOLIDATED FINANCIAL STATEMENTS (Continued)19. SEGMENT REPORTING (Continued)Fiscal Year Ended March 31, 2016 2015 2014 (In thousands) Depreciation expense Communications & Enterprise Compute $ 117,710 $ 130,311 $ 131,807 Consumer Technologies Group 123,139 203,808 160,684 Industrial & Emerging Industries 72,415 64,541 55,692 High Reliability Solutions 80,935 62,831 50,296 Corporate and Other 31,530 35,334 26,359 Total depreciation expense $ 425,729 $ 496,825 $ 424,838 Geographic information is as follows:Fiscal Year Ended March 31, Fiscal Year Ended March 31, 2015 2014 2013 2016 2015 2014 (In thousands) (In thousands) Net sales:
Asia
$ 12,953,004 50 % $ 13,714,187 53 % $ 11,743,140 50 % $ 11,788,992 48 % $ 12,953,004 50 % $ 13,714,187 53 % Americas
8,897,868 34 % 8,189,414 31 % 7,193,063 30 % 8,347,514 34 % 8,897,868 34 % 8,189,414 31 % Europe
4,297,044 16 % 4,205,006 16 % 4,633,272 20 % 4,282,379 18 % 4,297,044 16 % 4,205,006 16 % $ 26,147,916 $ 26,108,607 $ 23,569,475 $ 24,418,885 $ 26,147,916 $ 26,108,607 Revenues are attributable to the country in which the product is manufactured or service is provided.FLEXTRONICS INTERNATIONAL LTD.NOTES TO CONSOLIDATED FINANCIAL STATEMENTS (Continued)19. SEGMENT REPORTING (Continued)During fiscal years 2016, 2015
2014and2013,2014, net sales generated from Singapore, the principal country of domicile, were approximately $519.1 million, $553.4 million and $504.6 million, respectively.During fiscal year 2016, China, Mexico, and$551.7 million,the United States accounted for approximately 35%, 15%, and 11% of consolidated net sales, respectively.��No other country accounted for more than 10% of net sales in fiscal year 2016.During fiscal year 2015, China, Mexico, and the United States accounted for approximately 37%, 13%, and 11% of consolidated net sales, respectively. No other country accounted for more than 10% of net sales in fiscal year 2015.During fiscal year 2014, China, Mexico, and the United States accounted for approximately 40%, 14%,and 11% of consolidated net sales, respectively. No other country accounted for more than 10% of net sales in fiscal year 2014.During fiscal year 2013, China, Mexico, the United States and Malaysia accounted for approximately 35%, 15%, 11% and 10% of consolidated net sales, respectively. No other country accounted for more than 10% of net sales in fiscal year 2013.As of March 31, As of March 31, 2015 2014 2016 2015 (In thousands) (In thousands) Property and equipment, net:
Asia
$ 997,806 48 % $ 1,154,467 50 % $ 1,013,317 45 % $ 997,806 48 % Americas
782,839 37 % 785,753 34 % 886,305 39 % 782,839 37 % Europe
311,522 15 % 348,436 16 % 358,011 16 % 311,522 15 % $ 2,092,167 $ 2,288,656 $ 2,257,633 $ 2,092,167 As of March 31,20152016 and2014,2015, property and equipment, net held in Singapore were approximately $13.4 million and $19.3 million,and $17.0 million,respectively.96FLEXTRONICS INTERNATIONAL LTD.NOTES TO CONSOLIDATED FINANCIAL STATEMENTS (Continued)19. SEGMENT REPORTING (Continued)As of March 31,2015,2016, China, Mexico and the United States accounted for approximately37%35%,17%19% and 15%, respectively, of property and equipment, net. No other country accounted for more than 10% of property and equipment, net as of March 31,2015.2016.
As of March 31,2014,2015, China, Mexico and the United Statesand Mexicoaccounted for approximately41%37%,16%17% and14%15%, respectively, of consolidated property and equipment, net. No other country accounted for more than 10% of property and equipment, net as of March 31,2014.20. DISCONTINUED OPERATIONSDuring fiscal year 2013, the Company finalized the sale of two of its non-core businesses. Total proceeds received from these sales amounted to $27.2 million, net of $1.0 million of cash sold. The Company recognized an aggregate loss of $12.1 million on these sales, which is included in interest and other, net within the results from discontinued operations in fiscal year 2013.
2015.In accordance with the accounting guidance applicable at the time, these non-core businesses qualify as discontinued operations, and accordingly, the Company has reported the results of operations and financial position of these businesses in discontinued operations within the consolidated statements of operations and the consolidated balance sheets for all periods presented as applicable.FLEXTRONICS INTERNATIONAL LTD.NOTES TO CONSOLIDATED FINANCIAL STATEMENTS (Continued)20. DISCONTINUED OPERATIONS (Continued)The results from discontinued operations were as follows:Fiscal Year Ended
2013(In thousands) Net sales
$ 40,593 Cost of sales
42,793 Gross loss
(2,200 ) Selling, general and administrative expenses
1,930 Intangibles amortization and impairment
11,000 Interest and other, net
11,280 Loss before income taxes
(26,410 ) Benefit from income taxes
(959 ) Net loss of discontinued operations
$ (25,451 ) 21.20. SUPPLEMENTAL GUARANTOR AND NON-GUARANTOR CONSOLIDATED FINANCIAL STATEMENTSFlextronics International Ltd. ("Parent") hastwothree tranches of Notes of $500 million, $500 million and $600 million, respectively, each outstanding, which mature on February 15, 2020,andFebruary 15, 2023 and June 15, 2025, respectively. These notes are senior unsecured obligations, and are guaranteed, fully and unconditionally, jointly and severally, on an unsecured basis, by certain of the Company's 100% owned subsidiaries (the "guarantor subsidiaries"). These subsidiary guarantees will terminate upon 1) a sale or other disposition of the guarantor or the sale or disposition of all or substantially all the assets of the guarantor (other than to the Parent or a subsidiary); 2) such guarantor ceasing to be a guarantor or a borrower under the Company'sCredit FacilityTerm Loan Agreement and theCompany's Term Loan due 2018;Revolving Line of Credit; 3) defeasance or discharge of the Notes, as provided in the Notes indenture; or 4) if at any time the notes are rated investment grade.In lieu of providing separate financial statements for the guarantor subsidiaries, the Company has included the accompanying condensed consolidating financial statements, which are presented using the equity method of accounting. The principal elimination entries relate to investment in subsidiaries and intercompany balances and transactions, including transactions with the Company's non-guarantor subsidiaries.During the year ended March 31, 2016, and in conjunction with the new $600 million Notes, a new entity was added as a guarantor subsidiary for all three tranches of the Notes. Accordingly, the Company recast the condensed consolidating financial statements presented below to reflect this change.97FLEXTRONICS INTERNATIONAL LTD.NOTES TO CONSOLIDATED FINANCIAL STATEMENTS (Continued)21.20. SUPPLEMENTAL GUARANTOR AND NON-GUARANTOR CONSOLIDATED FINANCIAL STATEMENTS (Continued)Condensed Consolidating Balance Sheets as of March 31, 2016Parent Guarantor
SubsidiariesNon-Guarantor
SubsidiariesEliminations Consolidated (in thousands) ASSETS Current assets: Cash and cash equivalents $ 734,869 $ 148,201 $ 724,500 $ — $ 1,607,570 Accounts receivable — 729,331 1,315,426 — 2,044,757 Inventories — 1,482,410 2,009,246 — 3,491,656 Inter company receivable 9,105,728 5,568,392 12,404,722 (27,078,842 ) — Other current assets 2,951 180,842 987,350 — 1,171,143 Total current assets 9,843,548 8,109,176 17,441,244 (27,078,842 ) 8,315,126 Property and equipment, net — 553,072 1,704,561 — 2,257,633 Goodwill and other intangible assets, net 175 60,895 1,284,750 — 1,345,820 Other assets 2,249,145 267,034 2,004,437 (4,054,214 ) 466,402 Investment in subsidiaries 2,815,426 3,014,634 18,175,348 (24,005,408 ) — Total assets $ 14,908,294 $ 12,004,811 $ 40,610,340 $ (55,138,464 ) $ 12,384,981 LIABILITIES AND SHAREHOLDERS' EQUITY Current liabilities: Bank borrowings and current portion of long-term debt $ 58,836 $ 946 $ 5,384 $ — $ 65,166 Accounts payable — 1,401,835 2,846,457 — 4,248,292 Accrued payroll — 114,509 239,038 — 353,547 Inter company payable 9,562,405 7,999,335 9,517,102 (27,078,842 ) — Other current liabilities 33,008 869,470 1,002,722 — 1,905,200 Total current liabilities 9,654,249 10,386,095 13,610,703 (27,078,842 ) 6,572,205 Long term liabilities 2,683,173 2,063,988 2,514,299 (4,054,214 ) 3,207,246 Flextronics International Ltd. shareholders' equity 2,570,872 (445,272 ) 24,450,680 (24,005,408 ) 2,570,872 Noncontrolling interests — — 34,658 — 34,658 Total shareholders' equity 2,570,872 (445,272 ) 24,485,338 (24,005,408 ) 2,605,530 Total liabilities and shareholders' equity $ 14,908,294 $ 12,004,811 $ 40,610,340 $ (55,138,464 ) $ 12,384,981 98FLEXTRONICS INTERNATIONAL LTD.NOTES TO CONSOLIDATED FINANCIAL STATEMENTS (Continued)20. SUPPLEMENTAL GUARANTOR AND NON-GUARANTOR CONSOLIDATED FINANCIAL STATEMENTS (Continued)Condensed Consolidating Balance Sheets as of March 31, 2015Parent Guarantor
SubsidiariesNon-Guarantor
SubsidiariesEliminations Consolidated Parent Guarantor
SubsidiariesNon-Guarantor
SubsidiariesEliminations Consolidated (in thousands) (in thousands) ASSETS
Current assets:
Cash and cash equivalents
$ 608,971 $ 168,272 $ 851,165 $ — $ 1,628,408 $ 608,971 $ 168,272 $ 851,165 $ — $ 1,628,408 Accounts receivable
— 1,193,491 1,144,024 — 2,337,515 — 1,208,632 1,128,883 — 2,337,515 Inventories
— 1,729,593 1,759,159 — 3,488,752 — 1,729,593 1,759,159 — 3,488,752 Inter company receivable
6,417,410 4,774,526 10,218,788 (21,410,724 ) — 6,417,410 4,759,062 10,099,057 (21,275,529 ) — Other current assets
8,143 200,476 1,077,606 — 1,286,225 8,143 202,161 1,075,921 — 1,286,225 Total current assets
7,034,524 8,066,358 15,050,742 (21,410,724 ) 8,740,900 7,034,524 8,067,720 14,914,185 (21,275,529 ) 8,740,900 Property and equipment, net
— 471,052 1,621,115 — 2,092,167 — 471,052 1,621,115 — 2,092,167 Goodwill and other intangible assets, net
475 60,782 353,918 — 415,175 475 64,830 349,870 — 415,175 Other assets
2,223,402 155,172 2,131,523 (4,092,715 ) 417,382 2,210,669 155,172 2,131,523 (4,092,715 ) 404,649 Investment in subsidiaries
1,799,956 1,666,759 16,652,951 (20,119,666 ) — 1,799,956 1,654,226 16,640,427 (20,094,609 ) — Total assets
$ 11,058,357 $ 10,420,123 $ 35,810,249 $ (45,623,105 ) $ 11,665,624 $ 11,045,624 $ 10,413,000 $ 35,657,120 $ (45,462,853 ) $ 11,652,891 LIABILITIES AND SHAREHOLDERS' EQUITY
Current liabilities:
Bank borrowings and current portion of long-term debt
$ 40,000 $ 917 $ 5,245 $ — $ 46,162 $ 38,868 $ 917 $ 5,245 $ — $ 45,030 Accounts payable
— 1,772,695 2,788,499 — 4,561,194 — 1,758,305 2,802,889 — 4,561,194 Accrued payroll
— 112,692 227,047 — 339,739 — 112,692 227,047 — 339,739 Inter company payable
6,559,569 7,309,944 7,541,211 (21,410,724 ) — 6,559,569 7,250,235 7,465,725 (21,275,529 ) — Other current liabilities
30,553 772,015 1,006,560 — 1,809,128 30,553 845,156 933,419 — 1,809,128 Total current liabilities
6,630,122 9,968,263 11,568,562 (21,410,724 ) 6,756,223 6,628,990 9,967,305 11,434,325 (21,275,529 ) 6,755,091 Long term liabilities
2,067,421 2,102,483 2,435,962 (4,092,715 ) 2,513,151 2,055,820 2,102,483 2,435,962 (4,092,715 ) 2,501,550 Flextronics International Ltd. shareholders' equity
2,360,814 (1,650,623 ) 21,770,289 (20,119,666 ) 2,360,814 2,360,814 (1,656,788 ) 21,751,397 (20,094,609 ) 2,360,814 Noncontrolling interests
— — 35,436 — 35,436 — — 35,436 — 35,436 Total shareholders' equity
2,360,814 (1,650,623 ) 21,805,725 (20,119,666 ) 2,396,250 2,360,814 (1,656,788 ) 21,786,833 (20,094,609 ) 2,396,250 Total liabilities and shareholders' equity
$ 11,058,357 $ 10,420,123 $ 35,810,249 $ (45,623,105 ) $ 11,665,624 $ 11,045,624 $ 10,413,000 $ 35,657,120 $ (45,462,853 ) $ 11,652,891 Condensed Consolidating Statements of Operations for Fiscal Year Ended March 31, 2016Parent Guarantor
SubsidiariesNon-Guarantor
SubsidiariesEliminations Consolidated (in thousands) Net sales $ — $ 16,841,405 $ 19,286,221 $ (11,708,741 ) $ 24,418,885 Cost of sales — 15,278,265 19,241,300 (11,708,741 ) 22,810,824 Gross profit — 1,563,140 44,921 — 1,608,061 Selling, general and administrative expenses — 330,194 624,696 — 954,890 Intangible amortization 300 3,598 62,067 — 65,965 Interest and other, net (191,859 ) 1,016,302 (691,912 ) — 132,531 Income (loss) before income taxes 191,559 213,046 50,070 — 454,675 Provision for income taxes 26 (41,584 ) 52,152 — 10,594 Equity in earnings in subsidiaries 252,548 (168,886 ) 397,831 (481,493 ) — Net income $ 444,081 $ 85,744 $ 395,749 $ (481,493 ) $ 444,081 99FLEXTRONICS INTERNATIONAL LTD.NOTES TO CONSOLIDATED FINANCIAL STATEMENTS (Continued)21.20. SUPPLEMENTAL GUARANTOR AND NON-GUARANTOR CONSOLIDATED FINANCIAL STATEMENTS (Continued)Condensed Consolidating Balance Sheets as of March 31, 2014Parent Guarantor
SubsidiariesNon-Guarantor
SubsidiariesEliminations Consolidated (in thousands) ASSETS
Current assets:
Cash and cash equivalents
$ 638,714 $ 210,462 $ 744,552 $ — $ 1,593,728 Accounts receivable
— 1,229,242 1,468,743 — 2,697,985 Inventories
— 1,705,872 1,893,136 — 3,599,008 Inter company receivable
8,867,520 6,963,002 9,528,158 (25,358,680 ) — Other current assets
246 383,590 1,125,769 — 1,509,605 Total current assets
9,506,480 10,492,168 �� 14,760,358 (25,358,680 ) 9,400,326 Property and equipment, net
— 490,166 1,798,490 — 2,288,656 Goodwill and other intangible assets, net
775 46,917 329,526 — 377,218 Other assets
2,585,169 120,738 4,692,157 (6,964,114 ) 433,950 Investment in subsidiaries
3,350,690 758,612 15,995,623 (20,104,925 ) — Total assets
$ 15,443,114 $ 11,908,601 $ 37,576,154 $ (52,427,719 ) $ 12,500,150 LIABILITIES AND SHAREHOLDERS' EQUITY
Current liabilities:
Bank borrowings and current portion of long-term debt
$ 32,500 $ 60 $ 15 $ — $ 32,575 Accounts payable
— 1,614,383 3,133,396 — 4,747,779 Accrued payroll
— 106,046 248,843 — 354,889 Inter company payable
8,607,486 10,126,691 6,624,503 (25,358,680 ) — Other current liabilities
24,868 756,767 1,739,809 — 2,521,444 Total current liabilities
8,664,854 12,603,947 11,746,566 (25,358,680 ) 7,656,687 Long term liabilities
4,615,210 2,140,985 2,849,703 (6,964,114 ) 2,641,784 Flextronics International Ltd. shareholders' equity
2,163,050 (2,836,331 ) 22,941,256 (20,104,925 ) 2,163,050 Noncontrolling interests
— — 38,629 — 38,629 Total shareholders' equity
2,163,050 (2,836,331 ) 22,979,885 (20,104,925 ) 2,201,679 Total liabilities and shareholders' equity
$ 15,443,114 $ 11,908,601 $ 37,576,154 $ (52,427,719 ) $ 12,500,150 Condensed Consolidating Statements of Operations for Fiscal Year Ended March 31, 2015Parent Guarantor
SubsidiariesNon-Guarantor
SubsidiariesEliminations Consolidated Parent Guarantor
SubsidiariesNon-Guarantor
SubsidiariesEliminations Consolidated (in thousands) (in thousands) Net sales
$ — $ 17,620,300 $ 19,669,882 $ (11,142,266 ) $ 26,147,916 $ — $ 19,016,750 $ 19,543,163 $ (12,411,997 ) $ 26,147,916 Cost of sales
— 16,133,224 19,611,618 (11,142,266 ) 24,602,576 — 17,502,863 19,511,710 (12,411,997 ) 24,602,576 Gross profit
— 1,487,076 58,264 — 1,545,340 — 1,513,887 31,453 — 1,545,340 Selling, general and administrative expenses
— 233,767 610,706 — 844,473 — 258,212 586,261 — 844,473 Intangible amortization
300 2,891 28,844 — 32,035 300 3,808 27,927 — 32,035 Interest and other, net
10,086 850,886 (862,795 ) — (1,823 ) 10,086 901,059 (912,968 ) — (1,823 ) Income (loss) before income taxes
(10,386 ) 399,532 281,509 — 670,655 (10,386 ) 350,808 330,233 — 670,655 Provision for income taxes
— 14,143 55,711 — 69,854 — 14,143 55,711 — 69,854 Equity in earnings in subsidiaries
611,187 (142,451 ) 467,940 (936,676 ) — 611,187 (141,074 ) 471,575 (941,688 ) — Net income
$ 600,801 $ 242,938 $ 693,738 $ (936,676 ) $ 600,801 $ 600,801 $ 195,591 $ 746,097 $ (941,688 ) $ 600,801 FLEXTRONICS INTERNATIONAL LTD.NOTES TO CONSOLIDATED FINANCIAL STATEMENTS (Continued)21. SUPPLEMENTAL GUARANTOR AND NON-GUARANTOR CONSOLIDATED FINANCIAL STATEMENTS (Continued)Condensed Consolidating Statements of Operations for Fiscal Year Ended March 31, 2014Parent Guarantor
SubsidiariesNon-Guarantor
SubsidiariesEliminations Consolidated Parent Guarantor
SubsidiariesNon-Guarantor
SubsidiariesEliminations Consolidated (in thousands) (in thousands) Net sales
$ — $ 17,648,879 $ 21,600,240 $ (13,140,512 ) $ 26,108,607 $ — $ 18,393,436 $ 21,569,406 $ (13,854,235 ) $ 26,108,607 Cost of sales
— 16,225,232 21,525,018 (13,140,512 ) 24,609,738 — 16,961,211 21,502,762 (13,854,235 ) 24,609,738 Restructuring charges
— 9,609 49,039 — 58,648 — 9,609 49,039 — 58,648 Gross profit
— 1,414,038 26,183 — 1,440,221 — 1,422,616 17,605 — 1,440,221 Selling, general and administrative expenses
— 230,041 644,755 — 874,796 — 250,909 623,887 — 874,796 Intangible amortization
300 4,124 24,468 — 28,892 300 4,659 23,933 — 28,892 Restructuring charges
800 (271 ) 16,134 — 16,663 800 (271 ) 16,134 — 16,663 Interest and other, net
(502,028 ) 864,095 (242,651 ) — 119,416 (502,028 ) 875,119 (253,675 ) — 119,416 Income (loss) before income taxes
500,928 316,049 (416,523 ) — 400,454 500,928 292,200 (392,674 ) — 400,454 Provision for income taxes
52 42,944 (8,136 ) — 34,860 52 42,950 (8,142 ) — 34,860 Equity in earnings in subsidiaries
(135,282 ) (255,941 ) 369,429 21,794 — (135,282 ) (262,871 ) 368,268 29,885 — Net income (loss)
$ 365,594 $ 17,164 $ (38,958 ) $ 21,794 $ 365,594 $ 365,594 $ (13,621 ) $ (16,264 ) $ 29,885 $ 365,594 Condensed Consolidating Statements ofOperationsComprehensive Income for Fiscal Year Ended March 31,20132016Parent Guarantor
SubsidiariesNon-Guarantor
SubsidiariesEliminations Consolidated (in thousands) Net sales
$ — $ 15,379,151 $ 17,033,974 $ (8,843,650 ) $ 23,569,475 Cost of sales
— 13,886,798 17,144,245 (8,843,650 ) 22,187,393 Restructuring charges
— 26,295 189,539 — 215,834 Gross profit
— 1,466,058 (299,810 ) — 1,166,248 Selling, general and administrative expenses
— 195,560 609,675 — 805,235 Intangible amortization
300 7,840 21,389 — 29,529 Restructuring charges
— 1,646 9,954 — 11,600 Interest and other, net
(880,051 ) 702,305 168,815 — (8,931 ) Income (loss) from continuing operations before income taxes
879,751 558,707 (1,109,643 ) — 328,815 Provision for income taxes
— 15,396 10,917 — 26,313 Equity in earnings in subsidiaries
(602,700 ) (391,748 ) 591,825 402,623 — Income from continuing operations
277,051 151,563 (528,735 ) 402,623 302,502 Loss from discontinued operations, net of tax
— — (25,451 ) — (25,451 ) Net income (loss)
$ 277,051 $ 151,563 $ (554,186 ) $ 402,623 $ 277,051 Parent Guarantor
SubsidiariesNon-Guarantor
SubsidiariesEliminations Consolidated (in thousands) Net income $ 444,081 $ 85,744 $ 395,749 $ (481,493 ) $ 444,081 Other comprehensive income (loss): Foreign currency translation adjustments, net of zero tax 17,846 (16,979 ) (15,735 ) 32,714 17,846 Unrealized loss on derivative instruments and other, net of zero tax 26,744 15,195 26,744 (41,939 ) 26,744 Comprehensive income $ 488,671 $ 83,960 $ 406,758 $ (490,718 ) $ 488,671 100FLEXTRONICS INTERNATIONAL LTD.NOTES TO CONSOLIDATED FINANCIAL STATEMENTS (Continued)21.20. SUPPLEMENTAL GUARANTOR AND NON-GUARANTOR CONSOLIDATED FINANCIAL STATEMENTS (Continued)Condensed Consolidating Statements of Comprehensive Income for Fiscal Year Ended March 31, 2015Parent Guarantor
SubsidiariesNon-Guarantor
SubsidiariesEliminations Consolidated Parent Guarantor
SubsidiariesNon-Guarantor
SubsidiariesEliminations Consolidated (in thousands) (in thousands) Net income
$ 600,801 $ 242,938 $ 693,738 $ (936,676 ) $ 600,801 $ 600,801 $ 195,591 $ 746,097 $ (941,688 ) $ 600,801 Other comprehensive income (loss):
Foreign currency translation adjustments, net of zero tax
(18,932 ) 256,652 221,418 (478,070 ) (18,932 ) (18,932 ) 256,652 221,418 (478,070 ) (18,932 ) Unrealized loss on derivative instruments and other, net of zero tax
(35,417 ) (33,769 ) (35,417 ) 69,186 (35,417 ) (35,417 ) (33,769 ) (35,417 ) 69,186 (35,417 ) Comprehensive income
$ 546,452 $ 465,821 $ 879,739 $ (1,345,560 ) $ 546,452 $ 546,452 $ 418,474 $ 932,098 $ (1,350,572 ) $ 546,452 Condensed Consolidating Statements of Comprehensive Income for Fiscal Year Ended March 31, 2014Parent Guarantor
SubsidiariesNon-Guarantor
SubsidiariesEliminations Consolidated (in thousands) Net income (loss)
$ 365,594 $ 17,164 $ (38,958 ) $ 21,794 $ 365,594 Other comprehensive income:
Foreign currency translation adjustments, net of zero tax
(34,683 ) (89,282 ) (89,635 ) 178,917 (34,683 ) Unrealized loss on derivative instruments and other, net of zero tax
(13,992 ) (5,221 ) (13,993 ) 19,214 (13,992 ) Comprehensive income (loss)
$ 316,919 $ (77,339 ) $ (142,586 ) $ 219,925 $ 316,919 Condensed Consolidating Statements of Comprehensive Income for Fiscal Year Ended March 31, 2013Parent Guarantor
SubsidiariesNon-Guarantor
SubsidiariesEliminations Consolidated (in thousands) Net income (loss)
$ 277,051 $ 151,563 $ (554,186 ) $ 402,623 $ 277,051 Other comprehensive income (loss):
Foreign currency translation adjustments, net of zero tax
(16,289 ) 5,207 10,377 (15,584 ) (16,289 ) Unrealized loss on derivative instruments and other, net of zero tax
(20,755 ) (15,910 ) (20,755 ) 36,665 (20,755 ) Comprehensive income (loss)
$ 240,007 $ 140,860 $ (564,564 ) $ 423,704 $ 240,007 Parent Guarantor
SubsidiariesNon-Guarantor
SubsidiariesEliminations Consolidated (in thousands) Net income (loss) $ 365,594 $ (13,621 ) $ (16,264 ) $ 29,885 $ 365,594 Other comprehensive loss: Foreign currency translation adjustments, net of zero tax (34,683 ) (89,282 ) (89,635 ) 178,917 (34,683 ) Unrealized loss on derivative instruments and other, net of zero tax (13,992 ) (5,221 ) (13,993 ) 19,214 (13,992 ) Comprehensive income (loss) $ 316,919 $ (108,124 ) $ (119,892 ) $ 228,016 $ 316,919 101FLEXTRONICS INTERNATIONAL LTD.NOTES TO CONSOLIDATED FINANCIAL STATEMENTS (Continued)21.20. SUPPLEMENTAL GUARANTOR AND NON-GUARANTOR CONSOLIDATED FINANCIAL STATEMENTS (Continued)Condensed Consolidating Statements of Cash Flows for Fiscal Year Ended March 31, 2016Parent Guarantor
SubsidiariesNon-Guarantor
SubsidiariesEliminations Consolidated (In thousands) Net cash provided by operating activities $ 162,275 $ 427,259 $ 546,911 $ — $ 1,136,445 Cash flows from investing activities: Purchases of property and equipment, net of proceeds from disposal — (151,383 ) (345,584 ) 9 (496,958 ) Acquisition and divestiture of businesses, net of cash acquired and cash held in divested business — (809,272 ) (101,515 ) — (910,787 ) Investing cash flows to affiliates (1,596,210 ) (1,609,342 ) (1,408,610 ) 4,614,162 — Other investing activities, net (500 ) (31,011 ) 42,880 — 11,369 Net cash used in investing activities (1,596,710 ) (2,601,008 ) (1,812,829 ) 4,614,171 (1,396,376 ) Cash flows from financing activities: Proceeds from bank borrowings and long-term debt 824,618 — 60,084 — 884,702 Repayments of bank borrowings and long-term debt and capital lease obligations (179,920 ) (3,059 ) (7,242 ) (190,221 ) Payments for repurchases of ordinary shares (420,317 ) — — — (420,317 ) Proceeds from exercise of stock options 61,278 — — — 61,278 Financing cash flows from affiliates 1,240,145 2,162,840 1,211,186 (4,614,171 ) — Other financing activities, net — (8,800 ) (77,000 ) — (85,800 ) Net cash provided by financing activities 1,525,804 2,150,981 1,187,028 (4,614,171 ) 249,642 Effect of exchange rates on cash and cash equivalents 34,529 2,697 (47,775 ) — (10,549 ) Net increase (decrease) in cash and cash equivalents 125,898 (20,071 ) (126,665 ) — (20,838 ) Cash and cash equivalents, beginning of period 608,971 168,272 851,165 — 1,628,408 Cash and cash equivalents, end of period $ 734,869 $ 148,201 $ 724,500 $ — $ 1,607,570 102FLEXTRONICS INTERNATIONAL LTD.NOTES TO CONSOLIDATED FINANCIAL STATEMENTS (Continued)20. SUPPLEMENTAL GUARANTOR AND NON-GUARANTOR CONSOLIDATED FINANCIAL STATEMENTS (Continued)Condensed Consolidating Statements of Cash Flows for Fiscal Year Ended March 31, 2015Parent Guarantor
SubsidiariesNon-Guarantor
SubsidiariesEliminations Consolidated Parent Guarantor
SubsidiariesNon-Guarantor
SubsidiariesEliminations Consolidated (In thousands) (In thousands) Net cash provided by (used in) operating activities
$ (73,356 ) $ 448,685 $ 418,705 $ — $ 794,034 $ (73,356 ) $ 75,775 $ 791,615 $ — 794,034 Cash flows from investing activities:
Purchases of property and equipment, net of proceeds from disposal
— (85,876 ) (153,833 ) (15 ) (239,724 ) — (85,876 ) (153,833 ) (15 ) (239,724 ) Acquisition of businesses, net of cash acquired
— (20,589 ) (40,772 ) — (61,361 ) Proceeds from divestitures of business, net of cash held in divested business
— — (5,493 ) — (5,493 ) Acquisition and divestiture of businesses, net of cash acquired and cash held in divested business — (20,589 ) (46,265 ) — (66,854 ) Investing cash flows from (to) affiliates
(1,703,983 ) (2,284,175 ) 1,178,606 2,809,552 — (1,703,983 ) (1,900,810 ) 796,493 2,808,300 — Other investing activities, net
(1,500 ) (13,821 ) 79,683 — 64,362 (1,500 ) (13,821 ) 79,683 — 64,362 Net cash provided by (used in) investing activities
(1,705,483 ) (2,404,461 ) 1,058,191 2,809,537 (242,216 ) (1,705,483 ) (2,021,096 ) 676,078 2,808,285 (242,216 ) Cash flows from financing activities:
Proceeds from bank borrowings and long-term debt
303,000 4,737 11,805 — 319,542 303,000 4,737 11,805 — 319,542 Repayments of bank borrowings and long-term debt and capital lease obligations
(335,500 ) (3,127 ) (5,529 ) — (344,156 ) (335,500 ) (3,127 ) (5,529 ) — (344,156 ) Payments for early repurchase of long-term debt — — — — — Payments for repurchases of ordinary shares
(415,945 ) — — — (415,945 ) (415,945 ) — — — (415,945 ) Proceeds from exercise of stock options
23,497 — 11 — 23,508 23,497 — 11 — 23,508 Financing cash flows from (to) affiliates
2,420,952 1,914,619 (1,526,034 ) (2,809,537 ) — 2,420,952 1,904,164 (1,516,831 ) (2,808,285 ) — Other financing activities, net
— — (98,966 ) — (98,966 ) — — (98,966 ) — (98,966 ) Net cash provided by (used in) financing activities
1,996,004 1,916,229 (1,618,713 ) (2,809,537 ) (516,017 ) 1,996,004 1,905,774 (1,609,510 ) (2,808,285 ) (516,017 ) Effect of exchange rates on cash and cash equivalents
(246,908 ) (2,643 ) 248,430 — (1,121 ) (246,908 ) (2,643 ) 248,430 — (1,121 ) Net increase (decrease) in cash and cash equivalents
(29,743 ) (42,190 ) 106,613 — 34,680 (29,743 ) (42,190 ) 106,613 — 34,680 Cash and cash equivalents, beginning of period
638,714 210,462 744,552 — 1,593,728 638,714 210,462 744,552 — 1,593,728 Cash and cash equivalents, end of period
$ 608,971 $ 168,272 $ 851,165 $ — $ 1,628,408 $ 608,971 $ 168,272 $ 851,165 $ — $ 1,628,408 103FLEXTRONICS INTERNATIONAL LTD.NOTES TO CONSOLIDATED FINANCIAL STATEMENTS (Continued)21.20. SUPPLEMENTAL GUARANTOR AND NON-GUARANTOR CONSOLIDATED FINANCIAL STATEMENTS (Continued)Condensed Consolidating Statements of Cash Flows for Fiscal Year Ended March 31, 2014Parent Guarantor
SubsidiariesNon-Guarantor
SubsidiariesEliminations Consolidated Parent Guarantor
SubsidiariesNon-Guarantor
SubsidiariesEliminations Consolidated (In thousands) (In thousands) Net cash provided by (used in) operating activities
$ 459,748 $ (543,426 ) $ 1,299,587 $ 551 1,216,460 $ 459,748 $ (126,813 ) $ 882,974 $ 551 1,216,460 Cash flows from investing activities:
Purchases of property and equipment, net of proceeds from disposal
— (222,197 ) (292,221 ) (585 ) (515,003 ) — (222,197 ) (292,221 ) (585 ) (515,003 ) Acquisition of businesses, net of cash acquired
— (61,587 ) (176,444 ) — (238,031 ) Proceeds from divestitures of business, net of cash held in divested business
— — 4,599 — 4,599 Acquisition and divestiture of businesses, net of cash acquired and cash held in divested business — (61,587 ) (171,845 ) — (233,432 ) Investing cash flows from (to) affiliates
35,262 (510,168 ) (1,790,609 ) 2,265,515 — 35,262 (1,237,006 ) (1,075,938 ) 2,277,682 — Other investing activities, net
— (5,342 ) (30,155 ) — (35,497 ) — (10,842 ) (24,655 ) — (35,497 ) Net cash provided by (used in) investing activities
35,262 (799,294 ) (2,284,830 ) 2,264,930 (783,932 ) 35,262 (1,531,632 ) (1,564,659 ) 2,277,097 (783,932 ) Cash flows from financing activities:
Proceeds from bank borrowings and long-term debt
1,066,359 277 17 — 1,066,653 1,066,359 277 17 — 1,066,653 Repayments of bank borrowings and long-term debt and capital lease obligations
(492,034 ) (525 ) (45,021 ) — (537,580 ) (492,034 ) (525 ) (45,021 ) — (537,580 ) Payments for early repurchase of long-term debt
(503,423 ) (41,417 ) — — (544,840 ) (503,423 ) (41,417 ) — — (544,840 ) Payments for repurchases of ordinary shares
(475,314 ) — — — (475,314 ) (475,314 ) — — — (475,314 ) Proceeds from exercise of stock options
28,140 — — — 28,140 28,140 — — — 28,140 Financing cash flows from (to) affiliates
(277,594 ) 1,365,834 1,177,241 (2,265,481 ) — (277,594 ) 1,681,559 873,683 (2,277,648 ) — Other financing activities, net
— — 52,149 — 52,149 — — 52,149 — 52,149 Net cash provided by (used in) financing activities
(653,866 ) 1,324,169 1,184,386 (2,265,481 ) (410,792 ) (653,866 ) 1,639,894 880,828 (2,277,648 ) (410,792 ) Effect of exchange rates on cash and cash equivalents
57,055 2,641 (74,791 ) — (15,095 ) 57,055 2,641 (74,791 ) — (15,095 ) Net increase (decrease) in cash and cash equivalents
(101,801 ) (15,910 ) 124,352 — 6,641 (101,801 ) (15,910 ) 124,352 — 6,641 Cash and cash equivalents, beginning of period
740,515 226,372 620,200 — 1,587,087 740,515 226,372 620,200 — 1,587,087 Cash and cash equivalents, end of period
$ 638,714 $ 210,462 $ 744,552 $ — $ 1,593,728 $ 638,714 $ 210,462 $ 744,552 $ — $ 1,593,728 FLEXTRONICS INTERNATIONAL LTD.NOTES TO CONSOLIDATED FINANCIAL STATEMENTS (Continued)21. SUPPLEMENTAL GUARANTOR AND NON-GUARANTOR CONSOLIDATED FINANCIAL STATEMENTS (Continued)Condensed Consolidating Statements of Cash Flows for Fiscal Year Ended March 31, 2013Parent Guarantor
SubsidiariesNon-Guarantor
SubsidiariesEliminations Consolidated (In thousands) Net cash provided by (used in) operating activities
$ 836,830 $ 695,596 $ (416,280 ) $ (716 ) 1,115,430 Cash flows from investing activities:
Purchases of property and equipment, net of proceeds from disposal
— (137,921 ) (297,937 ) 530 (435,328 ) Acquisition of businesses, net of cash acquired
— (20,150 ) (163,947 ) — (184,097 ) Proceeds from divestitures of business, net of cash held in divested business
— — 22,585 — 22,585 Investing cash flows from (to) affiliates
(1,228,773 ) 965,298 1,166,809 (903,334 ) — Other investing activities, net
— 6,412 (106,771 ) — (100,359 ) Net cash provided by (used in) investing activities
(1,228,773 ) 813,639 620,739 (902,804 ) (697,199 ) Cash flows from financing activities:
Proceeds from bank borrowings and long-term debt
1,250,000 150 63 — 1,250,213 Repayments of bank borrowings and long-term debt and capital lease obligations
(379,399 ) (3,875 ) (8,585 ) (391,859 ) Payments for early repurchase of long-term debt
(756,855 ) (243,145 ) — (1,000,000 ) Payments for repurchases of ordinary shares
(322,040 ) — — — (322,040 ) Proceeds from exercise of stock options
22,257 — — — 22,257 Financing cash flows from (to) affiliates
693,185 (1,213,350 ) (383,355 ) 903,520 — Other financing activities, net
— — 101,851 — 101,851 Net cash provided by (used in) financing activities
507,148 (1,460,220 ) (290,026 ) 903,520 (339,578 ) Effect of exchange rates on cash and cash equivalents
(23,942 ) (1,801 ) 15,848 — (9,895 ) Net increase (decrease) in cash and cash equivalents
91,263 47,214 (69,719 ) — 68,758 Cash and cash equivalents, beginning of period
649,252 179,158 689,919 — 1,518,329 Cash and cash equivalents, end of period
$ 740,515 $ 226,372 $ 620,200 $ — $ 1,587,087 FLEXTRONICS INTERNATIONAL LTD.NOTES TO CONSOLIDATED FINANCIAL STATEMENTS (Continued)22.21. QUARTERLY FINANCIAL DATA (UNAUDITED)The following table contains unaudited quarterly financial data for fiscal years20152016 and2014.Fiscal Year Ended March 31, 2015 Fiscal Year Ended March 31, 2014 First Second Third Fourth First Second Third Fourth (In thousands, except per share amounts) Net sales
$ 6,642,745 $ 6,528,517 $ 7,025,054 $ 5,951,600 $ 5,791,125 $ 6,410,106 $ 7,183,442 $ 6,723,934 Gross profit
380,785 377,081 408,657 378,817 311,035 368,423 398,619 362,144 Net income
173,887 138,903 152,899 135,112 59,257 118,205 145,157 42,975 Earnings per share(1):
Net income:
Basic
$ 0.30 $ 0.24 $ 0.26 $ 0.24 $ 0.09 $ 0.19 $ 0.24 $ 0.07 Diluted
$ 0.29 $ 0.23 $ 0.26 $ 0.23 $ 0.09 $ 0.19 $ 0.23 $ 0.07
2015.Fiscal Year Ended March 31, 2016 Fiscal Year Ended March 31, 2015 First Second Third Fourth First Second Third Fourth Net sales $ 5,566,248 $ 6,316,762 $ 6,763,177 $ 5,772,698 $ 6,642,745 $ 6,528,517 $ 7,025,054 $ 5,951,600 Gross profit 352,341 396,916 452,467 406,337 380,785 377,081 408,657 378,817 Net income 110,850 122,977 148,910 61,344 173,887 138,903 152,899 135,112 Earnings per share (1): Net income: Basic $ 0.20 $ 0.22 $ 0.27 $ 0.11 $ 0.30 $ 0.24 $ 0.26 $ 0.24 Diluted $ 0.19 $ 0.22 $ 0.27 $ 0.11 $ 0.29 $ 0.23 $ 0.26 $ 0.23 The Company recorded restructuring charges during fiscal year 2014. The Company classified approximately $35.1 million and $23.5 million of these charges as a component of cost of sales during the first and fourth quarters of fiscal year 2014, respectively, and approximately $5.6 million and $11.1 million of these charges as a component of selling, general and administrative expenses during the first and fourth quarters of fiscal year 2014, respectively.(1) Earnings per share are computed independently for each quarter presented; therefore, the sum of the quarterly earnings per share may not equal the total earnings per share amounts for the fiscal year. Table of ContentsITEM 9. CHANGES IN AND DISAGREEMENTS WITH ACCOUNTANTS ON ACCOUNTING AND FINANCIAL DISCLOSURE
Not applicable.(a) Evaluation of Disclosure Controls and Procedures Under the supervision and with the participation of the Company's management, including the Company's Chief Executive Officer and Chief Financial Officer, the Company has evaluated the effectiveness of the Company's disclosure controls and procedures (as defined in Rule 13a-15(e) under the Exchange Act) as of March 31,2015.2016. Based on that evaluation, the Company's Chief Executive Officer and Chief Financial Officer concluded that, as of March 31,2015,2016, such disclosure controls and procedures were effective in ensuring that information required to be disclosed by the Company in reports that it files or submits under the Securities Exchange Act of 1934, as amended, is (i) recorded, processed, summarized and reported within the time periods specified in the Securities and Exchange Commission's rules and forms and (ii) accumulated and communicated to our management, including our principal executive officer and principal financial officer, as appropriate to allow timely decisions regarding required disclosure.(b) Management's Annual Report on Internal Control over Financial Reporting (b)Management is responsible for establishing and maintaining adequate internal control over financial reporting, as such term is defined in Rule 13a- 15(f) under the Securities Exchange Act of 1934, as amended. As of March 31,
2015,2016, under the supervision and with the participation of management, including the Company's Chief Executive Officer and Chief Financial Officer, an evaluation was conducted of the effectiveness of the Company's internal control over financial reporting based on the framework inInternal Control—Integrated Framework (2013) issued by the Committee of Sponsoring Organizations of the Treadway Commission ("COSO"). Based on that evaluation, management concluded that the Company's internal control over financial reporting was effective as of March 31,2015.2016.Because of its inherent limitations, a system of internal control over financial reporting can provide only reasonable assurance and may not prevent or detect misstatements or prevent or detect instances of fraud. These inherent limitations include the realities that judgments in decision-making can be faulty, and that breakdowns can occur because of simple error or mistake. Additionally, controls may be circumvented by the individual acts of some persons, by collusion of two or more people, or by management override of the control. The projections of any evaluation of effectiveness to future periods are subject to the risk that controls may become inadequate because of changes in conditions, or that the degree of compliance with the policies or procedures may deteriorate.Management's annual assessment of the effectiveness of our internal control over financial reporting as of March 31,20152016 excluded the internal control over financial reporting ofall foureight of our acquisitions that were completed during the year ended March 31,2015,2016, which constitute, in the aggregate,less than 1%5% ofbothtotal assets and 3% of net sales of the consolidated financial statements amount as of, and for the fiscal year ended March 31,2015.2016.
(c) Attestation Report of the Registered Public Accounting Firm The effectiveness of the Company's internal control over financial reporting as of March 31,20152016 has been audited by Deloitte & Touche LLP, an independent registered public accounting firm, as stated in their report which appears in this Item under the heading "Report of Independent Registered Public Accounting Firm."(d) Changes in Internal Control Over Financial Reporting There were no changes in the Company's internal controls over financial reporting that occurred during the year ended March 31,
20152016 that have materially affected, or are reasonably likely to materially affect, its internal controls over financial reporting.REPORT OF INDEPENDENT REGISTERED PUBLIC ACCOUNTING FIRMTo the Board of Directors and Stockholders ofFlextronics International Ltd.SingaporeWe have audited the internal control over financial reporting of Flextronics International Ltd. and subsidiaries (the "Company") as of March 31,2015,2016, based on criteria established inInternalControl—Control - Integrated Framework (2013)issued by the Committee of Sponsoring Organizations of the Treadway Commission. As described inManagement'sManagement’s Annual Report on Internal Control over Financial Reporting, management excluded from its assessment the internal control over financial reporting ofall foureight acquisitions that were completed during the year ended March 31,2015,2016, which constitute, in aggregate,less than 1%5% ofbothtotal assets and 3% of net sales of the consolidated financial statement amounts as of and for the fiscal year ended March 31,2015.2016. Accordingly, our audit did not include the internal control over financial reporting ofall foureight acquisitions. The Company's management is responsible for maintaining effective internal control over financial reporting and for its assessment of the effectiveness of internal control over financial reporting, included in the accompanyingManagement'sManagement’s Annual Report on Internal Control over Financial Reporting. Our responsibility is to express an opinion on the Company's internal control over financial reporting based on our audit.We conducted our audit in accordance with the standards of the Public Company Accounting Oversight Board (United States). Those standards require that we plan and perform the audit to obtain reasonable assurance about whether effective internal control over financial reporting was maintained in all material respects. Our audit included obtaining an understanding of internal control over financial reporting, assessing the risk that a material weakness exists, testing and evaluating the design and operating effectiveness of internal control based on the assessed risk, and performing such other procedures as we considered necessary in the circumstances. We believe that our audit provides a reasonable basis for our opinion.A company's internal control over financial reporting is a process designed by, or under the supervision of, the company's principal executive and principal financial officers, or persons performing similar functions, and effected by the company's board of directors, management, and other personnel to provide reasonable assurance regarding the reliability of financial reporting and the preparation of financial statements for external purposes in accordance with generally accepted accounting principles. A company's internal control over financial reporting includes those policies and procedures that (1) pertain to the maintenance of records that, in reasonable detail, accurately and fairly reflect the transactions and dispositions of the assets of the company; (2) provide reasonable assurance that transactions are recorded as necessary to permit preparation of financial statements in accordance with generally accepted accounting principles, and that receipts and expenditures of the company are being made only in accordance with authorizations of management and directors of the company; and (3) provide reasonable assurance regarding prevention or timely detection of unauthorized acquisition, use, or disposition of the company's assets that could have a material effect on the financial statements.Because of the inherent limitations of internal control over financial reporting, including the possibility of collusion or improper management override of controls, material misstatements due to error or fraud may not be prevented or detected on a timely basis. Also, projections of any evaluation of the effectiveness of the internal control over financial reporting to future periods are subject to the risk that the controls may become inadequate because of changes in conditions, or that the degree of compliance with the policies or procedures may deteriorate.In our opinion, the Company maintained, in all material respects, effective internal control over financial reporting as of March 31,2015,2016, based on the criteria established inInternalControl—Control - IntegratedFramework (2013)Framework(2013) issued by the Committee of Sponsoring Organizations of the Treadway Commission.We have also audited, in accordance with the standards of the Public Company Accounting Oversight Board (United States), the consolidated financial statements as of and for the year ended March 31,
20152016, of the Company and our report dated May 20,20152016 expressed an unqualified opinion on those financial statements./s/ DELOITTE & TOUCHE LLPSan Jose, CaliforniaMay 20,20152016Not applicable.PART IIIITEM 10. DIRECTORS, EXECUTIVE OFFICERS AND CORPORATE GOVERNANCEInformation with respect to this item may be found in our definitive proxy statement to be delivered to shareholders in connection with our20152016 Annual General Meeting of Shareholders. Such information is incorporated by reference.ITEM 11. EXECUTIVE COMPENSATIONInformation with respect to this item may be found in our definitive proxy statement to be delivered to shareholders in connection with our20152016 Annual General Meeting of Shareholders. Such information is incorporated by reference.ITEM 12. SECURITY OWNERSHIP OF CERTAIN BENEFICIAL OWNERS AND MANAGEMENT AND RELATED SHAREHOLDER MATTERSInformation with respect to this item may be found in our definitive proxy statement to be delivered to shareholders in connection with our20152016 Annual General Meeting of Shareholders. Such information is incorporated by reference.ITEM 13. CERTAIN RELATIONSHIPS AND RELATED TRANSACTIONS, AND DIRECTOR INDEPENDENCEInformation with respect to this item may be found in our definitive proxy statement to be delivered to shareholders in connection with our20152016 Annual General Meeting of Shareholders. Such information is incorporated by reference.ITEM 14. PRINCIPAL ACCOUNTANT FEES AND SERVICESInformation with respect to this item may be found in our definitive proxy statement to be delivered to shareholders in connection with our20152016 Annual General Meeting of Shareholders. Such information is incorporated by reference.PART IVITEM 15. EXHIBITS AND FINANCIAL STATEMENT SCHEDULES(a) Documents filed as part of this annual report on Form 10-K: 1. Financial Statements. See Item 8, "Financial Statements and Supplementary Data."2. Financial Statement Schedules. "Schedule II—Valuation and Qualifying Accounts" is included in the financial statements, see Concentration of Credit Risk in Note 2, "Summary of Accounting Policies" of the Notes to Consolidated Financial Statements in Item 8, "Financial Statements and Supplementary Data."3. Exhibits. The following exhibits are filed with this annual report on Form 10-K:Incorporated by Reference Exhibit No. Filed Herewith Exhibit No. Exhibit Form File No. Filing Date 3.01
Memorandum of Association, as amended 10-K 000-23354 05-29-07 3.01 3.02
Amended and Restated Articles of Association of Flextronics International Ltd. 8-K 000-23354 10-11-06 3.01 4.01
Indenture, dated as of February 20, 2013, by and between the Company, the Guarantors party thereto and U.S. Bank National Association, as Trustee. 8-K 000-23354 02-22-13 4.01 4.02
Form of 4.625% Note due 2020 8-K 000-23354 02-22-13 4.02 4.03
Form of 5.000% Note due 2023 8-K 000-23354 02-22-13 4.03 4.04
Registration Rights Agreement, dated as of February 20, 2013, by and between the Company, the Guarantors named therein, and Merrill Lynch, Pierce, Fenner & Smith Incorporated, Citigroup Global Markets Inc. and J.P. Morgan Securities LLC, as representatives of the initial purchasers named therein 8-K 000-23354 02-22-13 4.04 Incorporated by Reference Exhibit No. Exhibit Form File No. Filing Date Exhibit No. Filed Herewith 3.01 Memorandum of Association, as amended 10-K 000-23354 5/29/2007 3.01 3.02 Amended and Restated Articles of Association of Flextronics International Ltd. 8-K 000-23354 10/11/2006 3.01 4.01 Indenture, dated as of February 20, 2013, by and between the Company, the Guarantors party thereto and U.S. Bank National Association, as Trustee. 8-K 000-23354 2/22/2013 4.01 4.02 Form of 4.625% Note due 2020 8-K 000-23354 2/22/2013 4.02 4.03 Form of 5.000% Note due 2023 8-K 000-23354 2/22/2013 4.03 4.04 First Supplemental Indenture, dated as of March 28, 2013, among the Company, the Guarantor party thereto and U.S. Bank National Association, as Trustee, to the Indenture, dated as of February 20, 2013, by and between the Company, the Guarantors party thereto and U.S. Bank National Association, as Trustee, related to the Company's 4.625% Notes due 2020 and 5.000% Notes due 2023 10-K 000-23354 5/28/2013 4.11 4.05 Second Supplemental Indenture, dated as of August 25, 2014, among the Company, the Guarantor party thereto and U.S. Bank National Association, as Trustee, to the Indenture, dated as of February 20, 2013, by and between the Company, the Guarantors party thereto and U.S. Bank National Association, as Trustee, related to the Company's 4.625% Notes due 2020 and 5.000% Notes due 2023 10-Q 000-23354 10/30/2014 4.01 4.06 Third Supplemental Indenture, dated as of September 11, 2015, among the Company, the Guarantor party thereto and U.S. Bank National Association, as Trustee, related to the Company’s 4.625% Notes due 2020 and 5.000% Notes due 2023 S-4 333-207067 9/22/2015 4.11 4.07 Indenture, dated as of June 8, 2015, by and between the Company, the Guarantors party thereto and U.S. Bank National Association, as Trustee 8-K 000-23354 6/8/2015 4.1 4.08 Form of 4.750% Note due 2025 8-K 000-23354 6/8/2015 4.2 Incorporated by Reference Exhibit No. Filed Herewith Exhibit No. Exhibit Form File No. Filing Date 4.05
First Supplemental Indenture, dated as of March 28, 2013, among the Company, the Guarantor party thereto and U.S. Bank National Association, as Trustee, to the Indenture, dated as of February 20, 2013, by and between the Company, the Guarantors party thereto and U.S. Bank National Association, as Trustee, related to the Company's 4.625% Notes due 2020 and 5.000% Notes due 2023 10-K 000-23354 05-28-2013 4.11 4.06
Second Supplemental Indenture, dated as of August 25, 2014, among the Company, the Guarantor party thereto and U.S. Bank National Association, as Trustee, to the Indenture, dated as of February 20, 2013, by and between the Company, the Guarantors party thereto and U.S. Bank National Association, as Trustee, related to the Company's 4.625% Notes due 2020 and 5.000% Notes due 2023 10-Q 000-23354 10-30-14 4.01 4.07
Term Loan Agreement, dated as of August 30, 2013, among Flextronics International Ltd., as Borrower, The Bank of Tokyo-Mitsubishi UFJ, Ltd., as Administrative Agent, Lead Arranger and Bookrunner, and the other Lenders party thereto 8-K 000-23354 09-04-13 10.01 4.08
Amendment No. 1, dated May 21, 2014 to Term Loan Agreement dated as of August 30, 2013, among Flextronics International Ltd., as Borrower, The Bank of Tokyo-Mitsubishi UFJ, Ltd., as Administrative Agent, Lead Arranger and Bookrunner, and the other Lenders party thereto 8-K 000-23354 7-28-14 4.01 4.09
Credit Agreement, dated as of March 31, 2014, among Flextronics International Ltd. and certain of its subsidiaries, as borrowers, Bank of America, N.A., as Administrative Agent and Swing Line Lender, and the other Lenders party thereto 8-K 000-23354 04- 01-14 10.01 Incorporated by Reference Exhibit No. Exhibit Form File No. Filing Date Exhibit No. Filed Herewith 4.09 Registration Rights Agreement, dated as of June 8, 2015, by and between the Company, the Guarantors named therein, and Merrill Lynch, Pierce, Fenner & Smith Incorporated, J.P. Morgan Securities LLC, BNP Paribas Securities Corp. and Citigroup Global Markets Inc., as representatives of the initial purchasers named therein 8-K 000-23354 6/8/2015 4.3 4.10 First Supplemental Indenture, dated as of September 11, 2015, among the Company, the Guarantor party thereto and U.S. Bank National Association, as Trustee, related to the Company’s 4.750% Notes due 2025 S-4 333-207067 9/22/2015 4.04 4.11 Term Loan Agreement, dated as of August 30, 2013, among Flextronics International Ltd., as Borrower, The Bank of Tokyo-Mitsubishi UFJ, Ltd., as Administrative Agent, Lead Arranger and Bookrunner, and the other Lenders party thereto 8-K 000-23354 9/4/2013 10.01 4.12 Amendment No. 1, dated May 21, 2014 to Term Loan Agreement dated as of August 30, 2013, among Flextronics International Ltd., as Borrower, The Bank of Tokyo-Mitsubishi UFJ, Ltd., as Administrative Agent, Lead Arranger and Bookrunner, and the other Lenders party thereto 8-K 000-23354 7/28/2014 4.01 4.13 Credit Agreement, dated as of March 31, 2014, among Flextronics International Ltd. and certain of its subsidiaries, as borrowers, Bank of America, N.A., as Administrative Agent and Swing Line Lender, and the other Lenders party thereto 8-K 000-23354 4/1/2014 10.01 4.14 Amendment No. 1, dated as of September 30, 2015, to Credit Agreement, dated as of March 31, 2014, among Flextronics International Ltd. and certain of its subsidiaries, as borrowers, Bank of America, N.A., as Administrative Agent and Swing Line Lender, and the other Lenders party thereto 10-Q 000-23354 2/1/2016 4.01 10.01 Form of Indemnification Agreement between the Registrant and its Directors and certain officers.† 10-K 000-23354 5/20/2009 10.10 10.02 Form of Indemnification Agreement between Flextronics Corporation and Directors and certain officers of the Registrant.† 10-K 000-23354 5/20/2009 10.20 10.03 Flextronics International Ltd. 2001 Equity Incentive Plan, as amended.† 10-Q 000-23354 11/3/2009 10.01 10.04 Registrant's 2002 Interim Incentive Plan, as amended.† 8-K 000-23354 7/14/2009 10.02 10.05 Registrant's 2004 Award Plan for New Employees, as amended.† 8-K 000-23354 7/14/2009 10.09 10.06 Flextronics International Ltd. 2010 Equity Incentive Plan.† 8-K 000-23354 7/28/2010 10.01 10.07 Form of Share Option Award Agreement under 2010 Equity Incentive Plan† 10-Q 000-23354 8/5/2010 10.02 10.08 Form of Restricted Share Unit Award Agreement under 2010 Equity Incentive Plan† 10-Q 000-23354 8/5/2010 10.03 10.09 Flextronics International USA, Inc. Third Amended and Restated 2005 Senior Management Deferred Compensation Plan† 10-Q 000-23354 2/5/2009 10.02 Incorporated by Reference Exhibit No. Filed Herewith Exhibit No. Exhibit Form File No. Filing Date 10.01
Form of Indemnification Agreement between the Registrant and its Directors and certain officers.† 10-K 000-23354 05-20-09 10.1 10.02
Form of Indemnification Agreement between Flextronics Corporation and Directors and certain officers of the Registrant.† 10-K 000-23354 05-20-09 10.2 10.03
Registrant's 1993 Share Option Plan, as amended.† 8-K 000-23354 07-14-09 10.04 10.04
Flextronics International Ltd. 2001 Equity Incentive Plan, as amended.† 10-Q 000-23354 11-03-09 10.01 10.05
Registrant's 2002 Interim Incentive Plan, as amended.† 8-K 000-23354 07-14-09 10.02 10.06
Flextronics International USA, Inc. 401(k) Plan.† S-1 33-74622 01-31-94 10.52 10.07
Registrant's 2004 Award Plan for New Employees, as amended.† 8-K 000-23354 07-14-09 10.09 10.08
Flextronics International Ltd. 2010 Equity Incentive Plan.† 8-K 000-23354 07-28-10 10.01 10.09
Form of Share Option Award Agreement under 2010 Equity Incentive Plan† 10-Q 000-23354 08-05-10 10.02 10.12
Form of Restricted Share Unit Award Agreement under 2010 Equity Incentive Plan† 10-Q 000-23354 08-05-10 10.03 10.13
Form of Share Bonus Award Agreement under 2001 Equity Incentive Plan† 10-Q 000-23354 08-05-10 10.04 10.14
Flextronics International USA, Inc. Third Amended and Restated 2005 Senior Management Deferred Compensation Plan† 10-Q 000-23354 02-05-09 10.02 10.15
Flextronics International USA, Inc. Third Amended and Restated Senior Executive Deferred Compensation Plan† 10-Q 000-23354 02-05-09 10.01 10.16
Summary of Directors' Compensation† X 10.17
Solectron Corporation 2002 Stock Plan, as amended.† 10-Q 000-23354 11-03-09 10.02 Incorporated by Reference Exhibit No. Exhibit Form File No. Filing Date Exhibit No. Filed Herewith 10.10 Flextronics International USA, Inc. Third Amended and Restated Senior Executive Deferred Compensation Plan† 10-Q 000-23354 2/5/2009 10.01 10.11 Summary of Directors' Compensation† 10-K 000-23354 5/21/2015 10.16 10.12 Solectron Corporation 2002 Stock Plan, as amended.† 10-Q 000-23354 11/3/2009 10.02 10.13 Executive Incentive Compensation Recoupment Policy† 10-Q 000-23354 8/5/2010 10.06 10.14 Francois Barbier Offer Letter, dated as of July 1, 2010† 8-K 000-23354 9/3/2010 10.01 10.15 Francois Barbier Relocation Expenses Addendum, dated as of March 5, 2013† 10-K 000-23354 5/28/2013 10.27 10.16 Francois Barbier Confirmation Date Letter, dated as of August 30, 2010† 8-K 000-23354 9/3/2010 10.03 10.17 2010 Flextronics International USA, Inc. Deferred Compensation Plan† 10-Q 000-23354 11/3/2010 10.04 10.18 Form of Restricted Stock Unit Award Under 2010 Equity Incentive Plan† 10-Q 000-23354 8/9/2011 10.01 10.19 Form of Amendment to certain senior executive Restricted Share Unit Agreements under the 2010 Equity Incentive Plan† 10-Q 000-23354 2/4/2013 10.02 10.20 Form of Restricted Share Unit Award Agreement under the 2010 Equity Incentive Plan for certain performance based awards† 10-Q 000-23354 2/4/2013 10.03 10.21 Form of Award Agreement under 2010 Deferred Compensation Plan† 10-Q 000-23354 7/30/2012 10.01 10.22 Compensation Arrangements of Certain Executive Officers of Flextronics International Ltd.† 10-K 000-23354 5/21/2015 10.29 10.23 Form of Restricted Share Unit Award Agreement under the 2010 Equity Incentive Plan for time-based vesting awards† 10-Q 000-23354 11/1/2013 10.02 10.24 Form of Performance-Based Restricted Stock Unit Award (S&P500/Extended EMS Group)† 10-Q 000-23354 8/2/2013 10.01 10.25 Form of 2010 Deferred Compensation Plan Award Agreement (performance targets, cliff vesting)† 10-Q 000-23354 8/2/2013 10.02 10.26 Form of 2010 Deferred Compensation Plan Award Agreement (non-performance, periodic vesting, continuing Participant)† 10-Q 000-23354 8/2/2013 10.03 10.27 Award Agreement under the 2010 Deferred Compensation Plan† 10-Q 000-23354 7/28/2014 10.01 10.28 Form of Restricted Share Unit Award Agreement under the 2010 Equity Incentive Plan for certain executive fiscal year 2015 performance-based awards† 10-Q 000-23354 10/30/2014 10.01 10.29 Form of Restricted Share Unit Award Agreement under the 2010 Equity Incentive Plan for CEO FY15 performance-based award† 10-Q 000-23354 10/30/2014 10.01 10.30 Description of Annual Bonus Incentive Plan for Fiscal 2016† 10-Q 000-23354 7/27/2015 10.01 10.31 Description of Performance Long Term Incentive Plan for Fiscal 2016† 10-Q 000-23354 7/27/2015 10.02 10.32 Nextracker Inc. 2014 Equity Incentive Plan† S-8 333-207325 10/7/2015 99.01 Incorporated by Reference Exhibit No. Filed Herewith Exhibit No. Exhibit Form File No. Filing Date 10.18
Award Agreement for Francois Barbier under Senior Management Deferred Compensation Plan, dated July 22, 2005.† 10-Q 000-23354 08-05-10 10.08 10.19
Executive Incentive Compensation Recoupment Policy† 10-Q 000-23354 08-05-10 10.06 10.20
Francois Barbier Offer Letter, dated as of July 1, 2010† 8-K 000-23354 09-03-10 10.01 10.21
Francois Barbier Relocation Expenses Addendum, dated as of March 5, 2013† 10-K 000-23354 05-28-13 10.27 10.22
Francois Barbier Confirmation Date Letter, dated as of August 30, 2010† 8-K 000-23354 09-03-10 10.03 10.23
2010 Flextronics International USA, Inc. Deferred Compensation Plan† 10-Q 000-23354 11-03-10 10.04 10.24
Form of Restricted Stock Unit Award Under 2010 Equity Incentive Plan† 10-Q 000-23354 08-09-11 10.01 10.25
Form of Amendment to certain senior executive Share Bonus Award Agreements under the 2001 Equity Incentive Plan† 10-Q 000-23354 02-04-13 10.01 10.26
Form of Amendment to certain senior executive Restricted Share Unit Agreements under the 2010 Equity Incentive Plan† 10-Q 000-23354 02-04-13 10.02 10.27
Form of Restricted Share Unit Award Agreement under the 2010 Equity Incentive Plan for certain performance based awards† 10-Q 000-23354 02-04-13 10.03 10.28
Form of Award Agreement under 2010 Deferred Compensation Plan† 10-Q 000-23354 07-30-12 10.01 10.29
Compensation Arrangements of Certain Executive Officers of Flextronics International Ltd.† X 10.30
Award Agreement for Christopher Collier under Senior Management Deferred Compensation Plan dated June 30, 2005† 10-Q 000-23354 08-08-07 10.02 Incorporated by Reference Exhibit No. Exhibit Form File No. Filing Date Exhibit No. Filed Herewith 10.33 Form of Elementum Holding Ltd. Restricted Share Purchase Agreement† 10-Q 000-23354 10/26/2015 10.02 21.01 Subsidiaries of Registrant. X 23.01 Consent of Deloitte & Touche LLP. X 24.01 Power of Attorney (included on the signature page to this Form 10-K) X 31.01 Certification of Chief Executive Officer pursuant to Rule 13a-14(a) of the Exchange Act X 31.02 Certification of Chief Financial Officer pursuant to Rule 13a-14(a) of the Exchange Act X 32.01 Certification of Chief Executive Officer and Chief Financial Officer pursuant to Rule 13a-14(b) of the Exchange Act and 18 U.S.C. Section 1350* X 101.INS XBRL Instance Document X 101.SCH XBRL Taxonomy Extension Scheme Document X 101.CAL XBRL Taxonomy Extension Calculation Linkbase Document X 101.DEF XBRL Taxonomy Extension Definition Linkbase Document X 101.LAB XBRL Taxonomy Extension Label Linkbase Document X 101.PRE XBRL Taxonomy Extension Presentation Linkbase Document X Incorporated by Reference Exhibit No. Filed Herewith Exhibit No. Exhibit Form File No. Filing Date 10.31
Award Agreement for Paul Humphries under Senior Management Deferred Compensation Plan dated June 30, 2005† 10-Q 000-23354 07-30-12 10.04 10.32
Jonathan Hoak Offer Letter dated December 8, 2010† 10-Q 000-23354 07-30-12 10.05 10.33
Form of Restricted Share Unit Award Agreement under the 2010 Equity Incentive Plan for time-based vesting awards† 10-Q 000-23354 11-01-13 10.02 10.34
Form of Performance-Based Restricted Stock Unit Award (S&P500/Extended EMS Group)† 10-Q 000-23354 08-02-13 10.01 10.35
Form of 2010 Deferred Compensation Plan Award Agreement (performance targets, cliff vesting)† 10-Q 000-23354 08-02-13 10.02 10.36
Form of 2010 Deferred Compensation Plan Award Agreement (non-performance, periodic vesting, continuing Participant)† 10-Q 000-23354 08-02-13 10.03 10.37
Award Agreement under the 2010 Deferred Compensation Plan† 10-Q 000-23354 07-28-14 10.01 10.38
Form of Restricted Share Unit Award Agreement under the 2010 Equity Incentive Plan for certain executive fiscal year 2015 performance-based awards† 10-Q 000-23354 10-30-14 10.01 10.39
Form of Restricted Share Unit Award Agreement under the 2010 Equity Incentive Plan for CEO FY15 performance-based award† 10-Q 000-23354 10-30-14 10.01 10.40
Description of Annual Bonus Incentive Plan for Fiscal 2015† X 10.41
Description of Performance Long Term Incentive Plan for Fiscal 2015† X 21.01
Subsidiaries of Registrant. X 23.01
Consent of Deloitte & Touche LLP. X 24.01
Power of Attorney (included on the signature page to this Form 10-K) X * This exhibit is furnished with this Annual Report on Form 10-K, is not deemed filed with the Securities and Exchange Commission, and is not incorporated by reference into any filing of Flextronics International Ltd. under the Securities Act of 1933, as amended, or the Securities Exchange Act of 1934, as amended, whether made before or after the date hereof and irrespective of any general incorporation language contained in such filing. Incorporated by ReferenceExhibit No.Filed HerewithExhibit No.ExhibitFormFile No.Filing Date† 31.01Certification of Chief Executive Officer pursuant to Rule 13a-14(a) of the Exchange ActX31.02Certification of Chief Financial Officer pursuant to Rule 13a-14(a) of the Exchange ActX32.01*Certification of the Chief Executive Officer pursuant to Rule 13a-14(b) of the Exchange Act and 18 U.S.C. Section 1350X32.02*Certification of the Chief Financial Officer pursuant to Rule 13a-14(b) of the Exchange Act and 18 U.S.C. Section 1350X101.INSXBRL Instance DocumentX101.SCHXBRL Taxonomy Extension Scheme DocumentX101.CALXBRL Taxonomy Extension Calculation Linkbase DocumentX101.DEFXBRL Taxonomy Extension Definition Linkbase DocumentX101.LABXBRL Taxonomy Extension Label Linkbase DocumentX101.PREXBRL Taxonomy Extension Presentation Linkbase DocumentXManagement contract, compensatory plan or arrangement. SIGNATURESPursuant to the requirement of Section 13 or 15(d) of the Securities Exchange Act of 1934, the Registrant has duly caused this Report to be signed on its behalf by the undersigned, thereunto duly authorized.Flextronics International Ltd.
By:By:
/s/ MICHAEL M. MCNAMARAMichael M. McNamaraChief Executive OfficerDate: May 20,20152016
POWER OF ATTORNEYKNOW ALL PERSONS BY THESE PRESENTS, that each person whose signature appears below constitutes and appoints jointly and severally, Michael M. McNamara and Christopher Collier and each one of them, his attorneys-in-fact, each with the power of substitution, for him in any and all capacities, to sign any and all amendments to this Report, and to file the same, with exhibits thereto and other documents in connection therewith, with the Securities and Exchange Commission, hereby ratifying and confirming all that each of said attorneys- in-fact, or his substitutes, may do or cause to be done by virtue hereof.Pursuant to the requirements of the Securities Exchange Act of 1934, this report has been signed below by the following persons on behalf of the Registrant and in the capacities and on the dates indicated.Signature TitleDate
Title
Date/s/ MICHAEL M. MCNAMARA Michael M. McNamaraChief Executive Officer and Director (Principal Executive Officer) May 20, 20152016
Michael M. McNamara/s/ CHRISTOPHER COLLIER Christopher Collier
Chief Financial Officer (Principal Financial Officer)
May 20,20152016
Christopher Collier/s/ DAVID BENNETT David Bennett
Senior Vice President and Chief Accounting Officer (Principal Accounting Officer)
May 20,20152016
David Bennett/s/ H. RAYMOND BINGHAM H. Raymond Bingham
Chairman of the Board
May 20,20152016
H. Raymond Bingham/s/ MICHAEL D. CAPELLAS Michael D. CapellasDirectorMay 20, 2015SignatureTitleDate/s/ MARC A. ONETTOMarc A. OnettoDirector May 20, 20152016
Michael D. Capellas/s/ MARC A. ONETTO Director May 20, 2016 Marc A. Onetto /s/ DANIEL H. SCHULMAN Director May 20, 2016 Daniel H. Schulman
Director
May 20, 2015/s/ WILLY SHIH, PH.D. Director May 20, 2016 Willy Shih, Ph.D.
Director
May 20, 2015/s/ LAY KOON TAN Director May 20, 2016 Lay Koon Tan
Director
May 20, 2015/s/ WILLIAM D. WATKINS Director May 20, 2016 William D. Watkins
Director
May 20, 2015/s/ LAWRENCE A. ZIMMERMAN Director May 20, 2016 Lawrence A. Zimmerman
Director
May 20, 2015EXHIBIT INDEXIncorporated by Reference Exhibit
No.Filed
HerewithExhibit No. Exhibit Form File No. Filing Date 3.01 Memorandum of Association, as amended 10-K 000-23354 05-29-07 3.01
3.02
Amended and Restated Articles of Association of Flextronics International Ltd.
8-K
000-23354
10-11-06
3.01
4.01
Indenture, dated as of February 20, 2013, by and between the Company, the Guarantors party thereto and U.S. Bank National Association, as Trustee.
8-K
000-23354
02-22-13
4.01
4.02
Form of 4.625% Note due 2020
8-K
000-23354
02-22-13
4.02
4.03
Form of 5.000% Note due 2023
8-K
000-23354
02-22-13
4.03
4.04
Registration Rights Agreement, dated as of February 20, 2013, by and between the Company, the Guarantors named therein, and Merrill Lynch, Pierce, Fenner & Smith Incorporated, Citigroup Global Markets Inc. and J.P. Morgan Securities LLC, as representatives of the initial purchasers named therein
8-K
000-23354
02-22-13
4.04
4.05
First Supplemental Indenture, dated as of March 28, 2013, among the Company, the Guarantor party thereto and U.S. Bank National Association, as Trustee, to the Indenture, dated as of February 20, 2013, by and between the Company, the Guarantors party thereto and U.S. Bank National Association, as Trustee, related to the Company's 4.625% Notes due 2020 and 5.000% Notes due 2023
10-K
000-23354
05-28-2013
4.11
4.06
Second Supplemental Indenture, dated as of August 25, 2014, among the Company, the Guarantor party thereto and U.S. Bank National Association, as Trustee, to the Indenture, dated as of February 20, 2013, by and between the Company, the Guarantors party thereto and U.S. Bank National Association, as Trustee, related to the Company's 4.625% Notes due 2020 and 5.000% Notes due 2023
10-Q
000-23354
10-30-14
4.01
Incorporated by Reference Exhibit No. Exhibit Form File No. Filing Date Exhibit No. Filed Herewith 3.01 Memorandum of Association, as amended 10-K 000-23354 5/29/2007 3.01 3.02 Amended and Restated Articles of Association of Flextronics International Ltd. 8-K 000-23354 10/11/2006 3.01 4.01 Indenture, dated as of February 20, 2013, by and between the Company, the Guarantors party thereto and U.S. Bank National Association, as Trustee. 8-K 000-23354 2/22/2013 4.01 4.02 Form of 4.625% Note due 2020 8-K 000-23354 2/22/2013 4.02 4.03 Form of 5.000% Note due 2023 8-K 000-23354 2/22/2013 4.03 4.04 First Supplemental Indenture, dated as of March 28, 2013, among the Company, the Guarantor party thereto and U.S. Bank National Association, as Trustee, to the Indenture, dated as of February 20, 2013, by and between the Company, the Guarantors party thereto and U.S. Bank National Association, as Trustee, related to the Company's 4.625% Notes due 2020 and 5.000% Notes due 2023 10-K 000-23354 5/28/2013 4.11 4.05 Second Supplemental Indenture, dated as of August 25, 2014, among the Company, the Guarantor party thereto and U.S. Bank National Association, as Trustee, to the Indenture, dated as of February 20, 2013, by and between the Company, the Guarantors party thereto and U.S. Bank National Association, as Trustee, related to the Company's 4.625% Notes due 2020 and 5.000% Notes due 2023 10-Q 000-23354 10/30/2014 4.01 4.06 Third Supplemental Indenture, dated as of September 11, 2015, among the Company, the Guarantor party thereto and U.S. Bank National Association, as Trustee, related to the Company’s 4.625% Notes due 2020 and 5.000% Notes due 2023 S-4 333-207067 9/22/2015 4.11 4.07 Indenture, dated as of June 8, 2015, by and between the Company, the Guarantors party thereto and U.S. Bank National Association, as Trustee 8-K 000-23354 6/8/2015 4.1 4.08 Form of 4.750% Note due 2025 8-K 000-23354 6/8/2015 4.2 4.09 Registration Rights Agreement, dated as of June 8, 2015, by and between the Company, the Guarantors named therein, and Merrill Lynch, Pierce, Fenner & Smith Incorporated, J.P. Morgan Securities LLC, BNP Paribas Securities Corp. and Citigroup Global Markets Inc., as representatives of the initial purchasers named therein 8-K 000-23354 6/8/2015 4.3 4.10 First Supplemental Indenture, dated as of September 11, 2015, among the Company, the Guarantor party thereto and U.S. Bank National Association, as Trustee, related to the Company’s 4.750% Notes due 2025 S-4 333-207067 9/22/2015 4.04 4.11 Term Loan Agreement, dated as of August 30, 2013, among Flextronics International Ltd., as Borrower, The Bank of Tokyo-Mitsubishi UFJ, Ltd., as Administrative Agent, Lead Arranger and Bookrunner, and the other Lenders party thereto 8-K 000-23354 9/4/2013 10.01 Incorporated by Reference Exhibit
No.Filed
HerewithExhibit No. Exhibit Form File No. Filing Date 4.07 Term Loan Agreement, dated as of August 30, 2013, among Flextronics International Ltd., as Borrower, The Bank of Tokyo-Mitsubishi UFJ, Ltd., as Administrative Agent, Lead Arranger and Bookrunner, and the other Lenders party thereto 8-K 000-23354 09-04-13 10.01
4.08
Amendment No. 1, dated May 21, 2014 to Term Loan Agreement dated as of August 30, 2013, among Flextronics International Ltd., as Borrower, The Bank of Tokyo-Mitsubishi UFJ, Ltd., as Administrative Agent, Lead Arranger and Bookrunner, and the other Lenders party thereto
8-K
000-23354
7-28-14
4.01
4.09
Credit Agreement, dated as of March 31, 2014, among Flextronics International Ltd. and certain of its subsidiaries, as borrowers, Bank of America, N.A., as Administrative Agent and Swing Line Lender, and the other Lenders party thereto
8-K
000-23354
04-01-14
10.01
10.01
Form of Indemnification Agreement between the Registrant and its Directors and certain officers.†
10-K
000-23354
05-20-09
10.1
10.02
Form of Indemnification Agreement between Flextronics Corporation and Directors and certain officers of the Registrant.†
10-K
000-23354
05-20-09
10.2
10.03
Registrant's 1993 Share Option Plan, as amended.†
8-K
000-23354
07-14-09
10.04
10.04
Flextronics International Ltd. 2001 Equity Incentive Plan, as amended.†
10-Q
000-23354
11-03-09
10.01
10.05
Registrant's 2002 Interim Incentive Plan, as amended.†
8-K
000-23354
07-14-09
10.02
10.06
Flextronics International USA, Inc. 401(k) Plan.†
S-1
33-74622
01-31-94
10.52
10.07
Registrant's 2004 Award Plan for New Employees, as amended.†
8-K
000-23354
07-14-09
10.09
10.08
Flextronics International Ltd. 2010 Equity Incentive Plan.†
8-K
000-23354
07-28-10
10.01
Incorporated by Reference Exhibit No. Exhibit Form File No. Filing Date Exhibit No. Filed Herewith 4.12 Amendment No. 1, dated May 21, 2014 to Term Loan Agreement dated as of August 30, 2013, among Flextronics International Ltd., as Borrower, The Bank of Tokyo-Mitsubishi UFJ, Ltd., as Administrative Agent, Lead Arranger and Bookrunner, and the other Lenders party thereto 8-K 000-23354 7/28/2014 4.01 4.13 Credit Agreement, dated as of March 31, 2014, among Flextronics International Ltd. and certain of its subsidiaries, as borrowers, Bank of America, N.A., as Administrative Agent and Swing Line Lender, and the other Lenders party thereto 8-K 000-23354 4/1/2014 10.01 4.14 Amendment No. 1, dated as of September 30, 2015, to Credit Agreement, dated as of March 31, 2014, among Flextronics International Ltd. and certain of its subsidiaries, as borrowers, Bank of America, N.A., as Administrative Agent and Swing Line Lender, and the other Lenders party thereto 10-Q 000-23354 2/1/2016 4.01 10.01 Form of Indemnification Agreement between the Registrant and its Directors and certain officers.† 10-K 000-23354 5/20/2009 10.10 10.02 Form of Indemnification Agreement between Flextronics Corporation and Directors and certain officers of the Registrant.† 10-K 000-23354 5/20/2009 10.20 10.03 Flextronics International Ltd. 2001 Equity Incentive Plan, as amended.† 10-Q 000-23354 11/3/2009 10.01 10.04 Registrant's 2002 Interim Incentive Plan, as amended.† 8-K 000-23354 7/14/2009 10.02 10.05 Registrant's 2004 Award Plan for New Employees, as amended.† 8-K 000-23354 7/14/2009 10.09 10.06 Flextronics International Ltd. 2010 Equity Incentive Plan.† 8-K 000-23354 7/28/2010 10.01 10.07 Form of Share Option Award Agreement under 2010 Equity Incentive Plan† 10-Q 000-23354 8/5/2010 10.02 10.08 Form of Restricted Share Unit Award Agreement under 2010 Equity Incentive Plan† 10-Q 000-23354 8/5/2010 10.03 10.09 Flextronics International USA, Inc. Third Amended and Restated 2005 Senior Management Deferred Compensation Plan† 10-Q 000-23354 2/5/2009 10.02 10.10 Flextronics International USA, Inc. Third Amended and Restated Senior Executive Deferred Compensation Plan† 10-Q 000-23354 2/5/2009 10.01 10.11 Summary of Directors' Compensation† 10-K 000-23354 5/21/2015 10.16 10.12 Solectron Corporation 2002 Stock Plan, as amended.† 10-Q 000-23354 11/3/2009 10.02 10.13 Executive Incentive Compensation Recoupment Policy† 10-Q 000-23354 8/5/2010 10.06 10.14 Francois Barbier Offer Letter, dated as of July 1, 2010† 8-K 000-23354 9/3/2010 10.01 10.15 Francois Barbier Relocation Expenses Addendum, dated as of March 5, 2013† 10-K 000-23354 5/28/2013 10.27 10.16 Francois Barbier Confirmation Date Letter, dated as of August 30, 2010† 8-K 000-23354 9/3/2010 10.03 10.17 2010 Flextronics International USA, Inc. Deferred Compensation Plan† 10-Q 000-23354 11/3/2010 10.04 Incorporated by Reference Exhibit
No.Filed
HerewithIncorporated by Reference Exhibit No. Exhibit No. Exhibit Form File No. Filing Date Exhibit Form File No. Filing Date Exhibit No. Filed Herewith 10.09 Form of Share Option Award Agreement under 2010 Equity Incentive Plan† 10-Q 000-23354 08-05-10 10.02
10.12
Form of Restricted Share Unit Award Agreement under 2010 Equity Incentive Plan†
10-Q
000-23354
08-05-10
10.03
10.13
Form of Share Bonus Award Agreement under 2001 Equity Incentive Plan†
10-Q
000-23354
08-05-10
10.04
10.14
Flextronics International USA, Inc. Third Amended and Restated 2005 Senior Management Deferred Compensation Plan†
10-Q
000-23354
02-05-09
10.02
10.15
Flextronics International USA, Inc. Third Amended and Restated Senior Executive Deferred Compensation Plan†
10-Q
000-23354
02-05-09
10.01
10.16
Summary of Directors' Compensation†
X
10.17
Solectron Corporation 2002 Stock Plan, as amended.†
10-Q
000-23354
11-03-09
10.02
10.18
Award Agreement for Francois Barbier under Senior Management Deferred Compensation Plan, dated July 22, 2005.†
10-Q
000-23354
08-05-10
10.08
10.19
Executive Incentive Compensation Recoupment Policy†
10-Q
000-23354
08-05-10
10.06
10.20
Francois Barbier Offer Letter, dated as of July 1, 2010†
8-K
000-23354
09-03-10
10.01
10.21
Francois Barbier Relocation Expenses Addendum, dated as of March 5, 2013†
10-K
000-23354
05-28-13
10.27
10.22
Francois Barbier Confirmation Date Letter, dated as of August 30, 2010†
8-K
000-23354
09-03-10
10.03
��
10.23
2010 Flextronics International USA, Inc. Deferred Compensation Plan†
10-Q
000-23354
11-03-10
10.04
10.24
Form of Restricted Stock Unit Award Under 2010 Equity Incentive Plan†
10-Q
000-23354
08-09-11
10.01
10.25
Form of Amendment to certain senior executive Share Bonus Award Agreements under the 2001 Equity Incentive Plan†
10-Q
000-23354
02-04-13
10.01
10.18 Form of Restricted Stock Unit Award Under 2010 Equity Incentive Plan† 10-Q 000-23354 8/9/2011 10.01 10.19 Form of Amendment to certain senior executive Restricted Share Unit Agreements under the 2010 Equity Incentive Plan† 10-Q 000-23354 2/4/2013 10.02 10.20 Form of Restricted Share Unit Award Agreement under the 2010 Equity Incentive Plan for certain performance based awards† 10-Q 000-23354 2/4/2013 10.03 10.21 Form of Award Agreement under 2010 Deferred Compensation Plan† 10-Q 000-23354 7/30/2012 10.01 10.22 Compensation Arrangements of Certain Executive Officers of Flextronics International Ltd.† 10-K 000-23354 5/21/2015 10.29 10.23 Form of Restricted Share Unit Award Agreement under the 2010 Equity Incentive Plan for time-based vesting awards† 10-Q 000-23354 11/1/2013 10.02 10.24 Form of Performance-Based Restricted Stock Unit Award (S&P500/Extended EMS Group)† 10-Q 000-23354 8/2/2013 10.01 10.25 Form of 2010 Deferred Compensation Plan Award Agreement (performance targets, cliff vesting)† 10-Q 000-23354 8/2/2013 10.02 10.26 Form of 2010 Deferred Compensation Plan Award Agreement (non-performance, periodic vesting, continuing Participant)† 10-Q 000-23354 8/2/2013 10.03 10.27 Award Agreement under the 2010 Deferred Compensation Plan† 10-Q 000-23354 7/28/2014 10.01 10.28 Form of Restricted Share Unit Award Agreement under the 2010 Equity Incentive Plan for certain executive fiscal year 2015 performance-based awards† 10-Q 000-23354 10/30/2014 10.01 10.29 Form of Restricted Share Unit Award Agreement under the 2010 Equity Incentive Plan for CEO FY15 performance-based award† 10-Q 000-23354 10/30/2014 10.01 10.30 Description of Annual Bonus Incentive Plan for Fiscal 2016† 10-Q 000-23354 7/27/2015 10.01 10.31 Description of Performance Long Term Incentive Plan for Fiscal 2016† 10-Q 000-23354 7/27/2015 10.02 10.32 Nextracker Inc. 2014 Equity Incentive Plan† S-8 333-207325 10/7/2015 99.01 10.33 Form of Elementum Holding Ltd. Restricted Share Purchase Agreement† 10-Q 000-23354 10/26/2015 10.02 21.01 Subsidiaries of Registrant. X 23.01 Consent of Deloitte & Touche LLP. X 24.01 Power of Attorney (included on the signature page to this Form 10-K) X 31.01 Certification of Chief Executive Officer pursuant to Rule 13a-14(a) of the Exchange Act X 31.02 Certification of Chief Financial Officer pursuant to Rule 13a-14(a) of the Exchange Act X 32.01 Certification of Chief Executive Officer and Chief Financial Officer pursuant to Rule 13a-14(b) of the Exchange Act and 18 U.S.C. Section 1350* X 101.INS XBRL Instance Document X 101.SCH XBRL Taxonomy Extension Scheme Document X Incorporated by Reference Exhibit
No.Filed
HerewithExhibit No. Exhibit Form File No. Filing Date 10.26 Form of Amendment to certain senior executive Restricted Share Unit Agreements under the 2010 Equity Incentive Plan† 10-Q 000-23354 02-04-13 10.02
10.27
Form of Restricted Share Unit Award Agreement under the 2010 Equity Incentive Plan for certain performance based awards†
10-Q
000-23354
02-04-13
10.03
10.28
Form of Award Agreement under 2010 Deferred Compensation Plan†
10-Q
000-23354
07-30-12
10.01
10.29
Compensation Arrangements of Certain Executive Officers of Flextronics International Ltd.†
X
10.30
Award Agreement for Christopher Collier under Senior Management Deferred Compensation Plan dated June 30, 2005†
10-Q
000-23354
08-08-07
10.02
10.31
Award Agreement for Paul Humphries under Senior Management Deferred Compensation Plan dated June 30, 2005†
10-Q
000-23354
07-30-12
10.04
10.32
Jonathan Hoak Offer Letter dated December 8, 2010†
10-Q
000-23354
07-30-12
10.05
10.33
Form of Restricted Share Unit Award Agreement under the 2010 Equity Incentive Plan for time-based vesting awards†
10-Q
000-23354
11-01-13
10.02
10.34
Form of Performance-Based Restricted Stock Unit Award (S&P500/Extended EMS Group)†
10-Q
000-23354
08-02-13
10.01
10.35
Form of 2010 Deferred Compensation Plan Award Agreement (performance targets, cliff vesting)†
10-Q
000-23354
08-02-13
10.02
10.36
Form of 2010 Deferred Compensation Plan Award Agreement (non-performance, periodic vesting, continuing Participant)†
10-Q
000-23354
08-02-13
10.03
10.37
Award Agreement under the 2010 Deferred Compensation Plan†
10-Q
000-23354
07-28-14
10.01
Incorporated by Reference Exhibit
No.Filed
HerewithExhibit No. Exhibit Form File No. Filing Date 10.38 Form of Restricted Share Unit Award Agreement under the 2010 Equity Incentive Plan for certain executive fiscal year 2015 performance-based awards† 10-Q 000-23354 10-30-14 10.01
10.39
Form of Restricted Share Unit Award Agreement under the 2010 Equity Incentive Plan for CEO FY15 performance-based award†
10-Q
000-23354
10-30-14
10.01
10.40
Description of Annual Bonus Incentive Plan for Fiscal 2015†
X
10.41
Description of Performance Long Term Incentive Plan for Fiscal 2015†
X
21.01
Subsidiaries of Registrant.
X
23.01
Consent of Deloitte & Touche LLP.
X
24.01
Power of Attorney (included on the signature page to this Form 10-K)
X
31.01
Certification of Chief Executive Officer pursuant to Rule 13a-14(a) of the Exchange Act
X
31.02
Certification of Chief Financial Officer pursuant to Rule 13a-14(a) of the Exchange Act
X
32.01
*
Certification of the Chief Executive Officer pursuant to Rule 13a-14(b) of the Exchange Act and 18 U.S.C. Section 1350
X
32.02
*
Certification of the Chief Financial Officer pursuant to Rule 13a-14(b) of the Exchange Act and 18 U.S.C. Section 1350
X
101.INS
XBRL Instance Document
X
101.SCH
XBRL Taxonomy Extension Scheme Document
X
101.CAL
XBRL Taxonomy Extension Calculation Linkbase Document
X
101.DEF
XBRL Taxonomy Extension Definition Linkbase Document
X
101.LAB
XBRL Taxonomy Extension Label Linkbase Document
XIncorporated by Reference ExhibitNo.FiledHerewithExhibit No. Exhibit Form File No. Filing Date Exhibit No. Filed Herewith 101.CAL XBRL Taxonomy Extension Calculation Linkbase Document X 101.DEF XBRL Taxonomy Extension Definition Linkbase Document X 101.LAB XBRL Taxonomy Extension Label Linkbase Document X 101.PRE XBRL Taxonomy Extension Presentation Linkbase Document X * This exhibit is furnished with this Annual Report on Form 10-K, is not deemed filed with the Securities and Exchange Commission, and is not incorporated by reference into any filing of Flextronics International Ltd. under the Securities Act of 1933, as amended, or the Securities Exchange Act of 1934, as amended, whether made before or after the date hereof and irrespective of any general incorporation language contained in such filing. † Management contract, compensatory plan or arrangement. 117
Long-Standing Customer Relationships. We believe that maintaining our long-term relationships with key customers is a critical requirement for maintaining our market position, growth and profitability. We believe that our ability to maintain and grow these customer relationships results from our history and reputation of creating value for our customers while increasing their own competitiveness. We achieve this through our market-focused approach, our broad range of service offerings and solutions, and our deep industry expertise, which
allowsallow us to provide innovative solutions to all of the manufacturing and related service needs of our customers. We continue to receive numerous service and quality awards that further validate the strength of our customer relationships.Extensive Design and Engineering Capabilities. We have an industry-leading global design service offering, with extensive product design engineering resources, that provides design services, product developments, and solutions to satisfy a wide array of customer requirements across all of our key markets. We combine our design and manufacturing services to providesketch to scaletm customized solutions that include services from design concept, through product industrialization and product development, including the manufacture of components and complete products (such as smart phones), which are then sold by our OEM customers under the OEMs' brand names.Geographic, Customer and End Market Diversification. We believe we have created a well-diversified and balanced company.We have diversified ourOur businessacrossspans multiple end markets, significantly expanding our total available market. The world is experiencing rapid changes, and macro-economic disruptions have led to demand shifts and realignments. We believe that we are well-positioned through our market diversification to grow faster than the industry average and successfully navigate through difficult economicclimates.times. Our broad geographic footprint and experiences with multiple product types and complexity levelscreatescreate a significant competitive advantage. We continually look for new ways to diversify our offering within each market segment.Customer and Product Innovation Centers. We have established state-of-the art innovation centers in the Americas, Asia and Europe, with differentiated offerings and specialized services and focus. Some of these offerings include the most advanced 3D plastic printing, 3D metal printing, surface mount technology (SMT), and X-ray and test equipment to support major industries in bringing innovative products to market rapidly. We also have a reliability and failure analysis lab and an automation applications team. Another key feature is our focus on confidentiality and security as we offer dedicated customer-confidential work spaces thatincludeprovide increased security and restricted access to protect our OEM customers' intellectual property ("IP") and the confidentiality of new products being launched into the marketplace. These innovation centers offer our customers a geographically-focused version of oursketch to scaletm services, taking their product from concept to volume production and go-to-market in a rapid, cost effective and low risk manner.Industrial Parks; Low-Cost Manufacturing Services. We have developed self-contained campuses that co-locate our manufacturing and logistics operations with our suppliers at a single, low-cost location. These industrial parks enhance our supply chain management efficiency, while providing a low-cost, multi-technology solution for our customers. This approach increases the competitiveness of our customers by reducing logistical barriers and costs, improving communications, increasing flexibility, lowering transportation costs and reducing turnaround times. We have strategically established our industrial parks in Brazil, China, Hungary, Israel, Malaysia, Mexico, Poland, Romania, and the Ukraine.We havecertain of ourselected manufacturing operations situated in low-cost regions of the world to provide our customers with a wide array of manufacturing solutions and low manufacturing costs. As of March 31,2015,2016, approximately74%76% of our manufacturing capacity was located in low-costlocations, such as Brazil, China, Hungary, India, Malaysia, Mexico, Poland, Romania, and the Ukraine. We believe we are a global industry leader in low-cost production capabilities.
CUSTOMERSOur customers include many of the world's leading technology companies. We have focused on establishing long-term relationships with our customers and have been successful in expanding our relationships to incorporate additional product lines and services. In fiscal year2015,2016, our ten largest customers accounted for approximately50%46% of net sales. Only Lenovo/Motorola,Mobility (including net sales from its parent Google up to the point in time when Motorola Mobility was acquired by Lenovo and including net sales from Lenovo thereafter),a customer in our CTGbusiness group,segment, accounted for greater than 10% of the Company's net sales in fiscal year2015.2016.
The following table lists in alphabetical order a sample of our largest customers in fiscal year20152016 and the end products of those customers for which we provide design, manufacturing and/or after-market services:Customer End ProductsAlcatel-LucentBusiness telecommunications systems, core routers and switches, and optical communicationsEnd ProductsApple Desktop computing, power chargers, and after-market services for notebooks, tablets, and smart phonessmart-phonesCisco Core routers and switches, data center, wireless and enterprise telecommunications infrastructure equipment Ericsson Radio base stations for Long Term Evolution and GSM infrastructure, and optical communications equipment Fitbit Inc Wearable electronics, digital health devices Ford Motor Company In-car connectivity, Lighting Products, Solenoids and Motion Control Electronics Hewlett-Packard Printers, storage devices, and services for computing devices Huawei Technologies Wireless and enterprise telecommunications infrastructure, smartphones, and optical communications equipment Lenovo/Motorola* Mobile communication devices, wearables and connected living devices Microsoft Gaming, computer peripherals, and other consumer electronics devices Motorola Mobility*Nokia/Alcatel-Lucent**Mobile communication, wearablesBusiness telecommunications systems, core routers andconnected living devicesswitches, and optical communications equipmentXerox*Office equipmentLenovo/Motorola includes net sales from its former parent, Google, up to the point in time when Motorola Mobility was acquired by Lenovo andimagingincluding net sales from Lenovo thereafter.** Nokia/Alcatel-Lucent includes net sales from its parent Nokia beginning with the fourth quarter of fiscal year 2016, as Nokia's acquisition of Alcatel-Lucent was closed during January 2016. BACKLOGAlthough we obtain firm purchase orders from our customers, OEM customers typically do not make firm orders for delivery of products more than 30 to 90 days in advance. In addition, OEM customers may reschedule or cancel firm orders depending on contractual arrangements. Therefore, we do not believe that the backlog of expected product sales covered by firm purchase orders is a meaningful measure of future sales.COMPETITIONOur market is extremely competitive and includes many companies, several of which have achieved substantial market share. We compete against numerous domestic and foreign manufacturing service providers, as well as our current and prospective customers, who evaluate our capabilities in light of their own capabilities and cost structures. We face particular competition from Asian-based competitors, including Taiwanese Original Design Manufacturing ("ODM") suppliers who compete in avariety of our end markets and have a substantial share of global information technology hardware production.
We compete with different companies depending on the type of service we are providing or the geographic area in which an activity takes place. We believe that the principal competitive factors in the manufacturing services market are quality and range of services, design and technological capabilities; cost; location of facilities; responsiveness and flexibility. We believe we are extremely competitive with regard to all of these factors.SOCIAL RESPONSIBILITYOur Corporate Social and Environmental Responsibility ("CSR"CSER")practices frameworkmanagement system has several elements, including environmental, health and safety compliance, labor and human rights, ethics, governance, and community engagement.Flextronics' CSRFlex's CSER framework is based upon the principles, policies, and standards prescribed by the Electronics Industry Citizenship Coalition ("EICC"), a worldwide association of electronics companies committed to promoting an industry code of conduct for global electronics supply chains to improve working and environmental, health and safety conditions as well as other relevant international standards (e.g., ISO 14001).FlextronicsFlex is a founding member of the EICC. Social responsibility is also an area of increasing regulation, with specific regulations such as the California Transparency in Supply Chains Act, the U.S. Federal Acquisition Regulation on Human Trafficking and the U.K. Modern Slavery Act of 2015, all creating new compliance and disclosure obligations for the Company and for our customers. Weaccordinglyoperate a number of programs, including compliance audits,data collection, training andcompliance capability buildingleadership programs that focusonupon driving continuous improvements in social, ethical, and environmentalcomplianceperformance throughout all of our global operating units, all in accordance with our Code of Business Conduct and Ethics.As a guide to achieving this end, Flextronics looks at principles, policies, and standards as prescribed by the EICC.Being a good corporate citizen does not mean we should merely conform to standards. We go beyond required responsibilities by offering a wide range of programs and initiatives to engage both our internal and external communities. At the heart of this endeavor lies our pragmatic goal of positively influencing the lives of people in the communities in which we operate. We intend to continue investing in these global communities through grant-making, financial contributions, volunteer work, direct engagement and donation of resources.
The Dodd-Frank Wall Street Reform and Consumer Protection Act of 2010 (the "Dodd-Frank Act"), Section 1502, introduced reporting requirements related to the verification of whetherFlextronics iswe are directly (or indirectly through suppliers of materials) purchasing the following minerals: columbite-tantalite, also known as coltan (the metal ore from which tantalum is extracted); cassiterite (the metal ore from which tin is extracted); gold; wolframite (the metal ore from which tungsten is extracted); or their derivatives; or any other mineral or its derivatives as determined by the Secretary of State associated with financing conflicts in the Democratic Republic of the Congo or an adjoining country.Flextronics isWe are working directly with suppliers, industry groups, and customers to comply with the due diligence reporting requirements necessary to comply withthe newthis law. See "RiskFactor—Factors—Compliance with government regulations regarding the use of"conflict minerals"'conflict minerals' may result in increased costs and risks to us."We have filed Conflict Minerals reports with the Securities and Exchange Commission (SEC) in accordance with the Dodd-Frank Act.
ENVIRONMENTAL REGULATIONOur operations are regulated under various federal, state, local and international laws governing the environment, including laws governing the discharge of pollutants into the air and water, the management and disposal of hazardous substances and wastes and the cleanup of contaminated sites. We havefullyimplemented processes and procedures to ensure that our operations are in compliance with all applicable environmental regulations. We do not believe that costs of compliance with these laws and regulations will have a material adverse effect on our capital expenditures, operating results,or competitive position. In addition, we are responsible for cleanup of contamination at some of our current and former manufacturing facilities and at some third-party sites. We engage environmental consulting firms to assist us in the evaluation of environmental liabilities
ofassociated with our ongoing operations, historical disposal activities and closed sites in order to establish appropriate accruals in our financial statements. We determine the amount of our accruals for environmental matters by analyzing and estimating the probability of occurrence and the reasonable possibility of incurring costs in light of information currently available. The imposition of more stringent standards or requirements under environmental laws or regulations, the results of future testing and analysis undertaken by us at our operating facilities, or a determination that we are potentially responsible for the release of hazardous substances at other sites could result in expenditures in excess of amounts currently estimated to be required for such matters. There can be no assurance that additional environmental matters will not arise in the future or that costs will not be incurred with respect to sites as to which noproblemissue is currently known.We are also required to comply with an increasing number of product environmental compliance regulations focusedonupon the restriction of certain hazardous substances. For example, the electronics industry is subject to the European Union's ("EU") Restrictions on Hazardous Substances ("RoHS") 2011/65/EU, Waste Electrical and Electronic Equipment ("WEEE") 2012/19/EU directives, the regulation EC 1907/2006 EU Directive REACH ("Registration, Evaluation, Authorization, and Restriction of Chemicals"), and China RoHS entitled, Management Methods for Controlling Pollution for Electronic Information Products ("EIPs"). Similar legislation has been or may be enacted in other jurisdictions, includinginthe United States. Our business requires close collaboration with our customers and suppliers to mitigateriskrisks of non-compliance. We have developed rigorousrisk mitigatingcompliance programs designed to meet the needs and specifications of our customers as well as the regulations. These programs vary from collecting compliance or material data from ourFlextronics ownedFlex controlled or managed suppliers to full laboratory testing, and werequireinclude compliance requirements in oursupply chain to comply.standard supplier contracts. Non-compliance could potentially result in significant costs and/or penalties. RoHS and other similar legislation bans or restricts the use of lead, mercury and certain other specified substances in electronics products and WEEE requires EU importers and/or producers to assume responsibility for the collection, recycling and management of waste electronic products and components. In the case of WEEE, although the compliance responsibility rests primarily with the EU importers and/or producers rather than with EMS companies, OEMs may turn to EMS companies for assistance in meeting their WEEE obligations.New technical classifications of e-Waste being discussed in the Basel Convention technical working group could affect both Flextronics and Flextronics' customers' abilities and obligations in electronics repair and refurbishment. FlextronicsFlex continues to monitorthese discussionsdevelopments related to product environmental compliance and is working with our customers and other technical organizations to anticipate and minimizethe impactany impacts tolegal and responsibly managed repairour operations.EMPLOYEESAs of March 31,2015,2016, our global workforce totaled approximately150,000 permanent200,000 employees. In certain international locations, our employees are represented by labor unions and by work councils. We have never experienced a significant work stoppage or strike, and we believe that our employee relations are good.Our success depends to a large extent upon the continued services of key managerial and technical employees. The loss of such personnel could seriously harm our business, results of operations and business prospects. To date, we have not experienced significant difficulties in attracting or retaining such personnel.INTELLECTUAL PROPERTYWe own or license various United States and foreign patents relating to a variety of technologies. For certain of our proprietary processes, we rely on trade secret protection. We also have registered our corporate name and several other trademarks and service marks that we use in our business in the United States and other countries throughout the world. As of March 31,20152016 and2014,2015, the carrying value of our intellectual property was not material.Although we believe that our intellectual property assets and licenses are sufficient for the operation of our business as we currently conduct it, from time to time third parties do assert patent infringement claims against us or our customers. In addition, we provide design and engineering services to our customers and also design and make our own products. As a consequence of these activities, our customers are requiring us to take responsibility for intellectual property to a greater extent than in our manufacturing and assembly businesses. If and when third parties make assertions regarding the ownership or right to use intellectual property, we could be required to either enter into licensing arrangements or to resolve the issue through litigation. Such license rights might not be available to us on commercially acceptable terms, if at all, and any such litigation might not be resolved in our favor. Additionally, litigation could be lengthy and costly and could materially harm our financial condition regardless of the outcome. We also could be required to incur substantial costs to redesign a product or re-perform design services.FINANCIAL INFORMATION ABOUT SEGMENTS AND GEOGRAPHIC AREASRefer to note 19 to our consolidated financial statements included under Item 8 for financial information about our business segments and geographic areas.ADDITIONAL INFORMATIONOur Internet address is http://www.flextronics.com. We make available through our Internet website the Company's annual reports on Form 10-K, quarterly reports on Form 10-Q, current reports on Form 8-K and amendments to those reports filed or furnished pursuant to Section 13(a) of the Securities Exchange Act of 1934 as soon as reasonably practicable after we electronically file such material with, or furnish it to, the Securities and Exchange Commission.We were incorporated in the Republic of Singapore in May 1990. Our principal corporate office is located at 2 Changi South Lane, Singapore 486123. Our U.S. corporate headquarters is located at 6201 America Center Drive, San Jose, CA, 95002.ITEM 1A. RISK FACTORSWe depend on industries that continually produce technologically advanced products with short product life cycles and our business would be adversely affected if our customers' products are not successful or if our customers lose market share.We derive our revenues from customers in the following business groups:HRS, which is comprised of our medical business includingmedical equipment,consumer health, digital health, disposables, drug delivery, diagnostics, life sciences, anddiagnostics;imaging equipment; our automotive business, includingautomotivevehicle electronics,automotive lighting,connectivity, andpower electronics;clean technologies; and our defense and aerospace businesses, focused on commercial aviation, defense,civil aviation,andhomeland security;military;CTG, which includes our mobile devices business, including smart phones; our consumer electronics business, including connected living, wearable electronics including digital sport, game consoles, and connectivity devices; and our high-volume computing business, including various supply chain solutions for notebook personalcomputingcomputers ("PC"), tablets, and printers; in addition, our CTG group is expanding its business relationships to include supply chain optimization for non-electronics products such as shoes and clothing;