We additional option periods thereafter. As a result, the total length of a contract, if all options are exercised, may often range between five and ten years. This provides good visibility in terms of predicting revenue. Most of our contracts are related to long-term, stable programs, such as Medicaid, Medicare, Social Security, the ACA and long-term employment support programs. Our client relationships are frequently decades long. Human Services. 2016. planning. These services comprise less than one percent of the Segment’s revenue. 2016. 2016. seasonality. Demand for our services is contingent upon factors that affect governments, including: The ACA expanded access to health coverage primarily through insurance subsidies and Medicaid expansion. States are not required to expand their Medicaid programs, but the Congressional Budget Office estimates that most will expand coverage over the next several years. The Kaiser Family Foundation increase in civilian agency IT spending. We have seen a substantial increase in long-term sales opportunities as a result of the acquisition. The business has been fully integrated and now operates under the MAXIMUS Federal Services brand. programs. The implementation of the ACA also continues to impact the federal landscape. The ACA requires an independent, evidence-based external review process and the option for individuals to appeal coverage determinations or claims to insurance companies. We are presidential election as a result of the new administration. We believe ongoing Competitive advantages Expertise in competitive bidding. Government agencies typically award contracts through a comprehensive, complex and competitive request for proposals (RFP) and bidding process. Although the bidding criteria which provided 12%. In the U.S., our primary competitors in the Health Services Segment are Xerox, HP, Automated Health Systems and services. Government contracts typically contain provisions permitting government Health Services U.S. Federal Services Human Services Total for currency fluctuations and for estimated amounts associated with our performance-based contracts based upon the latest information that management has at that time. None of our other employees are covered under any such agreement. We consider our relations with our employees to be good. Year Ended September 30, 2015: First Quarter Second Quarter Third Quarter Fourth Quarter Year Ended September 30, 2014: First Quarter Second Quarter Third Quarter Fourth Quarter July 1, 2015 - July 31, 2015 August 1, 2015 - August 31, 2015 September 1, 2015 - September 30, 2015(2) Total Statement of operations data: Revenue Operating income Net income attributable to MAXIMUS Basic earnings per share attributable to MAXIMUS Diluted earnings per share attributable to MAXIMUS Weighted average shares outstanding: Basic Diluted Cash dividends per share of common stock Balance Sheet Data: Cash and cash equivalents Total assets Debt Total MAXIMUS shareholders' equity ITEM 7. Management's Discussion and Analysis of Financial Condition and Results of Operations. In addition, we have acquired businesses which have provided us opportunities to expand our skills, technology and customer relationships to complement our existing business and provide opportunities for further organic growth. 2016: Revenue Gross profit Gross profit margin Selling, general and administrative expense Selling, general and administrative expense as a percentage of revenue Amortization of intangible assets Acquisition-related expenses Operating income Operating income margin Interest expense Other income, net Income before income taxes Provision for income taxes Effective tax rate Net income Income/(loss) attributable to noncontrolling interests Net income attributable to MAXIMUS Basic earnings per share attributable to MAXIMUS Diluted earnings per share attributable to MAXIMUS Adjusted diluted earnings per share attributable to MAXIMUS Earnings Before Interest, Taxes and Amortization (EBITA) Earnings Before Interest, Taxes Depreciation and Amortization (EBITDA) Adjusted EBITDA The following provides an overview of the significant elements of our Fiscal year Revenue for fiscal year 2014 Organic revenue growth Acquired revenue from Acentia and Remploy Currency effect compared to fiscal year 2014 Revenue for fiscal year 2015 Selling, general and administrative expense (SG&A) consists of costs related to general management, marketing and administration. These costs include salaries, benefits, bid and proposal efforts, travel, recruiting, continuing education, employee training, non-chargeable labor costs, facilities costs, printing, reproduction, communications, equipment depreciation, a reduction to SG&A of $4 million. Revenue Gross profit Operating income Gross profit margin Operating profit margin Fiscal year Revenue for fiscal year 2014 Organic revenue growth Currency effect compared to fiscal year 2014 Revenue for fiscal year 2015 scale. Revenue Gross profit Operating income Gross profit margin Operating profit margin revenue and gross profit for fiscal year 2016 are summarized below. Revenue for fiscal year 2014 Organic revenue growth Acquired revenue from Acentia Revenue for fiscal year 2015 our organic revenue growth. The acquisition of Acentia. Revenue Gross profit Operating income Gross profit margin Operating profit margin foreign currency declines. Revenue for fiscal year 2014 Organic revenue growth Acquired revenue from Remploy Currency effect compared to fiscal year 2014 Revenue for fiscal year 2015 As reported Effect of terminated contract Results excluding the effect of the terminated contract Profit margins excluding the effect of the terminated contract. $164.7 million under the credit facility. Our credit facility allows us to borrow up to $400 million, subject to standard covenants. We anticipate that our cash flows from Net cash provided by (used in): Operating activities Investing activities Financing activities Effect of exchange rates on cash and cash equivalents Net (decrease)/increase in cash and cash equivalents Cash provided by operating activities for the years ended September 30, 2016, 2015 and 2014 dividend is dependent upon board discretion and is based upon similar factors which influence share repurchases. To supplement our statements of cash flows presented on a GAAP basis, we use the measure of free cash flow to analyze the funds generated from operations. Cash provided by operating activities Purchases of property and equipment Capitalized software costs Free cash flow Operating leases Debt(1) Deferred compensation plan liabilities(2) Total(3) prior periods would occur at this time. We believe that the likelihood of a significant adjustment to revenue would be remote. U.S. Federal Services Segment. The contract, which has an expected total value of approximately $0.9 billion, has completed its second full year of operations and has up to eight years of operations remaining. Our transaction billing rate for the future periods is approximately 10% lower than that for the first two years. If, at September 30, 2016, our estimate of future volumes had increased or decreased by five percent, it would not have resulted in a significant adjustment to revenue and operating income. Contingencies. From time to time, we are involved in legal proceedings, including contract and employment claims, in the ordinary course of business. We assess the likelihood of any adverse judgments or outcomes to these contingencies, as well as potential ranges of probable losses and establish reserves accordingly. The amount of reserves required may change in future periods due to new developments in each matter or changes in approach to a matter such as a change in settlement strategy. The presentation of these measures is meant to complement, but not replace, other financial measures in this document. The presentation of non-GAAP numbers is not meant to be considered in isolation, nor as an alternative to revenue growth, cash flows from operating activities or net income as measures of performance. These non-GAAP measures, as determined and presented by us, may not be comparable to related or similarly titled measures presented by other companies. Diluted earnings per share attributable to MAXIMUS Acquisition-related expenses Terminated contract Adjusted diluted earnings per share attributable to MAXIMUS Net income attributable to MAXIMUS Interest expense/(income) Provision for income taxes Amortization of intangible assets Stock compensation expense Acquisition-related expenses EBITA Depreciation and amortization of property, plant, equipment and capitalized software EBITDA Effect of terminated contract Adjusted EBITDA ITEM 7A. Quantitative and Qualitative Disclosures About Market Risk. Revenue Cost of revenue Gross profit Selling, general and administrative expenses Amortization of intangible assets Acquisition-related expenses Operating income Interest expense Other income, net Income before income taxes Provision for income taxes Net income Income/(loss) attributable to noncontrolling interests Net income attributable to MAXIMUS Basic earnings per share attributable to MAXIMUS Diluted earnings per share attributable to MAXIMUS Dividends per share Weighted average shares outstanding: Basic Diluted Net income Foreign currency translation adjustments Interest rate hedge, net of income taxes of $16, $— and $— Comprehensive income Comprehensive income/(loss) attributable to noncontrolling interests Comprehensive income attributable to MAXIMUS ASSETS Current assets: Cash and cash equivalents Accounts receivable—billed and billable, net Accounts receivable—unbilled Deferred income taxes Prepaid expenses and other current assets Total current assets Property and equipment, net Capitalized software, net Goodwill Intangible assets, net Deferred contract costs, net Deferred compensation plan assets Other assets Total assets LIABILITIES AND SHAREHOLDERS' EQUITY Current liabilities: Accounts payable and accrued liabilities Accrued compensation and benefits Deferred revenue Income taxes payable Long-term debt, current portion Other liabilities Total current liabilities Deferred revenue, less current portion Deferred income taxes Long-term debt Deferred compensation plan liabilities, less current portion Other liabilities Total liabilities Commitments and contingencies Shareholders' equity: Common stock, no par value; 100,000 shares authorized; 65,437 and 66,613 shares issued and outstanding at September 30, 2015 and 2014, at stated amount, respectively Accumulated other comprehensive income Retained earnings Total MAXIMUS shareholders' equity Noncontrolling interests Total equity Total liabilities and equity Cash flows from operating activities: Net income Adjustments to reconcile net income to net cash provided by operating activities: Depreciation and amortization of property, plant, equipment and capitalized software Amortization of intangible assets Deferred income taxes Stock compensation expense Changes in assets and liabilities, net of effects of business combinations: Accounts receivable—billed and billable Accounts receivable—unbilled Prepaid expenses and other current assets Deferred contract costs Accounts payable and accrued liabilities Accrued compensation and benefits Deferred revenue Income taxes Other assets and liabilities Cash provided by operating activities Cash flows from investing activities: Acquisition of businesses, net of cash acquired Purchases of property and equipment Capitalized software costs Proceeds from note receivable Cash used in investing activities Cash flows from financing activities: Cash dividends paid Repurchases of common stock Stock compensation tax benefit Tax withholding related to RSU vesting Stock option exercises Issuance of debt Repayment of debt Costs for expansion of credit facility Cash provided by/(used in) financing activities Effect of exchange rate changes on cash Net (decrease) increase in cash and cash equivalents Cash and cash equivalents, beginning of period Cash and cash equivalents, end of period Balance at September 30, 2012 Net income Foreign currency translation Cash dividends Dividends on RSUs Repurchases of common stock Stock compensation expense Stock compensation tax benefit Common stock issued pursuant to acquisition of HML Tax withholding related to RSU vesting Stock option exercises and RSU releases Balance at September 30, 2013 Net income Foreign currency translation Cash dividends Dividends on RSUs Repurchases of common stock Stock compensation expense Stock compensation tax benefit Tax withholding relating to RSU vesting Stock option exercises and RSU releases Balance at September 30, 2014 Net income Foreign currency translation Interest rate hedge, net of income taxes Cash dividends Dividends on RSUs Repurchases of common stock Stock compensation expense Stock compensation tax benefit Tax withholding related to RSU vesting Stock option exercises and RSU releases Addition of noncontrolling interest from acquisition Balance at September 30, 2015 We recognize revenue on arrangements as work is performed and amounts are earned. We consider amounts to be earned once evidence of an arrangement has been obtained, services have been delivered, fees are fixed or determinable and collectability of revenue is reasonably assured. earned. Sales and purchases in jurisdictions subject to indirect taxes, such as value added tax, are recorded net of tax collected and paid. Our reporting units are consistent with our operating segments, namely Health Services, U.S. Federal Services and Human Services. We perform our annual impairment test as of July 1 of each year. method. 2014 The results of these segments for the three years ended September 30, Revenue: Health Services U.S. Federal Services Human Services Total Gross Profit: Health Services U.S. Federal Services Human Services Total Selling, general and administrative expense: Health Services U.S. Federal Services Human Services Other Total Operating income Health Services U.S. Federal Services Human Services Amortization of intangible assets Acquisition-related expenses Other Total Depreciation and amortization: Health Services U.S. Federal Services Human Services Total Our revenue was distributed as follows (in thousands): United States United Kingdom Australia Rest of World Total Health Services U.S. Federal Services Human Services Corporate/Other Total United States Australia Canada United Kingdom Rest of World Total In the year ended September 30, U.S. Federal New York Australia California Texas 4. Earnings per share Weighted average shares outstanding Effect of employee stock options and unvested restricted stock awards Denominator for diluted earnings per share acquired 100% of the share capital of Ascend for cash consideration of $44.1 million. Ascend is a provider of independent health assessments and data management tools to government agencies in the U.S. We acquired Ascend to broaden our ability to help our existing government clients deal with the rising demand for long-term care services. This business has been integrated into our Health Services Segment. Management has estimated the fair value of intangible assets acquired as $22.3 million, with an average weighted life of 18 years, and the fair value of goodwill 2014 Cash consideration, net of cash acquired Accounts receivable and unbilled receivables Other current assets Property and equipment Intangible assets—customer relationships Total identifiable assets acquired Accounts payable and other liabilities Deferred revenue Capital lease obligations Total liabilities assumed Net identifiable assets acquired Goodwill Net assets acquired Revenue Net income Basic earnings per share attributable to MAXIMUS Diluted earnings per share attributable to MAXIMUS Cash consideration, net of cash acquired Stock consideration Purchase consideration, net of cash acquired Accounts receivable and unbilled receivables Other current assets Property and equipment Intangible assets Total identifiable assets acquired Accounts payable and other liabilities Deferred revenue Current income tax liability Deferred tax liability Total liabilities assumed Net identifiable assets acquired Goodwill Net assets acquired Customer relationships Technology-based intangible assets Total intangible assets Balance at September 30, 2014 Reduction in estimate Foreign currency translation Balance at September 30, 2015 6. Debt We do not believe that the provisions of the credit agreement represent a significant restriction to the successful operation of the business or to our ability to pay dividends. Derivative Arrangement 2017. comprehensive income. Balance as of September 30, 2013 Adjustment to goodwill acquired with HML Foreign currency translation Balance as of September 30, 2014 Goodwill acquired with Acentia Foreign currency translation Balance as of September 30, 2015 The following table sets forth the components of intangible assets (in thousands): Customer contracts and relationships Trademarks and trade names Technology-based intangible assets Total Year ending September 30, 2016 Year ending September 30, 2017 Year ending September 30, 2018 Year ending September 30, 2019 Year ending September 30, 2020 Land Building and improvements Office furniture and equipment Leasehold improvements Less: Accumulated depreciation and amortization Total property and equipment, net Capitalized software Less: Accumulated amortization Total Software development costs, net Deferred contract costs Less: accumulated amortization Total deferred contract costs, net Accounts receivable reserves Balance at beginning of year Additions to reserve Deductions Balance at end of year At September 30, 2016 and 2015, Year ended September 30, 2016 2017 2018 2019 2020 Thereafter Total minimum lease payments Collective bargaining agreements We grant equity awards to officers, employees and directors in the form of restricted stock units (RSUs). RSUs issued generally vest ratably over one or five years. The fair value of the RSUs, based on our stock price at the grant date, is expensed in equal installments over the vesting period. For the fiscal years ended September 30, 2016, 2015 Non-vested shares outstanding at September 30, 2014 Granted Vested Forfeited Non-vested shares outstanding at September 30, 2015 Outstanding at September 30, 2014 Exercised Expired Outstanding and exercisable at September 30, 2015 stock options will expire if not exercised before October 2017. Aggregate intrinsic value of all stock options exercised Net cash proceeds from exercise of stock options 2014 Income before income taxes: United States Foreign Income before income taxes Current provision: Federal State and local Foreign Total current provision Deferred tax expense (benefit): Federal State and local Foreign Total deferred tax expense (benefit) Provision for income taxes Federal income tax provision at statutory rate of 35% State income taxes, net of federal benefit Foreign taxation Permanent items Tax credits Valuation allowances on net operating loss carryforwards Other Income tax expense 2014 Deferred tax assets—current: Deferred revenue Costs deductible in future periods Net operating loss carryforwards Other Total deferred tax assets—current Deferred tax liabilities—current: Accounts receivable—unbilled Net deferred tax asset—current Deferred tax assets—non-current: Net operating loss carryforwards Valuation allowance on net operating loss carryforwards Net operating loss carryforwards net of valuation reserve Deferred revenue Stock compensation Costs deductible in future periods Other Total deferred tax assets—non-current Deferred tax liabilities—non-current Amortization of goodwill and intangible assets Capitalized software Property and equipment Deferred contract costs Employee benefit costs Other Total deferred tax liability—non-current Net deferred tax liability—non-current a net deferred tax liability. Our net deferred tax position is summarized below (in thousands): 2016 and 2015, respectively. We recognize and present uncertain tax positions on a gross basis (i.e., without regard to likely offsets for deferred tax assets, deductions and/or credits that would result from payment of uncertain tax amounts). The reconciliation of the beginning and ending amount of gross unrecognized tax benefits was as follows (in thousands): Balance at beginning of year Lapse of statute of limitation Reductions for tax positions of prior years Balance at end of year 2011. Earnings per share amounts are computed independently each quarter. As a result, the sum of each quarter's earnings per share amount may not equal the total earnings per share amount for the respective year. Health Services U.S. Federal Services Human Services Revenue Health Services U.S. Federal Services Human Services Gross profit Health Services U.S. Federal Services Human Services Amortization of intangible assets Acquisition-related expenses Other/Corporate Operating Income Net income Net income attributable to MAXIMUS Diluted earnings per share attributable to MAXIMUS Health Services U.S. Federal Services Human Services Revenue Health Services U.S. Federal Services Human Services Gross profit Health Services U.S. Federal Services Human Services Amortization of intangible assets Other/Corporate Operating Income Net income attributable to MAXIMUS Diluted earnings per share attributable to MAXIMUS Equity compensation plans/arrangements approved by the shareholders(2) Equity compensation plans/arrangements not approved by the shareholders Total ITEM 13. Certain Relationships and Related Transactions, and Director Independence.•••the effects of future legislative or government budgetary and spending changes;•difficulties in integrating acquired businesses;••our failure to successfully bid for and accurately price contracts to generate our desired profit;•our ability to maintain relationships with key government entities from whom a substantial portion of our revenue is derived;•the ability of government customers to terminate contracts on short notice, with or without cause;•our ability to manage capital investments and start-up costs incurred before receiving related contract payments;•our ability to maintain technology systems and otherwise protect confidential or protected information;•••Generalprovide business process services (BPS) toare a leading operator of government health and human services agenciesprograms worldwide. We act as a partner to governments under our mission ofHelping Government Serve the People.® We are one of the largest pure-play health and human services BPS providers to governments in the United States, the United Kingdom, Australia, Canada, Saudi Arabia and New Zealand. We use our experience, business process management expertise and advanced technological solutions to help government agencies run efficient and cost-effective programs. Our solutions improve program accountability and outcomes, while enhancing the quality of services provided to program beneficiaries.who can providethat offer efficient and cost-effective solutions to problems,these trends, including:••••in the U.K., which require the implementation of new services and new programs.••sixfour entities operating state-based exchanges and a customer contact center for the federal marketplace;•U.K.;•One of the largest providers of occupational health services in the U.K.;••ArabiaArabia.New Zealand.•••• Much of our revenue is derived from long-term contractual arrangements with governments. Base contracts are typically three to five years and often have additional option periods, which provide good visibility in terms of predicting revenue. Most of our contracts are related to programs that are long-term in nature, such as Medicaid, Medicare, Social Security, the ACA and long-term employment support programs. Our client relationships are frequently decades long.provide. As our business changes, we revise our internal reporting and the manner in which our Chief Executive Officer operates and reviews the results of our business. This reporting forms the basis for our external reporting of our business segments. During the fourth quarter of fiscal year 2015, we revised our reporting structure to accommodate three business segments, adding aprovide: Health Services, U.S. Federal Services Segment that comprises the work we perform for the U.S. Federal Government, as well as some U.S.-based appeals work. The businesses within this new segment were previously included within our Health Services Segment and include the results of the businesses acquired with Acentia in April 2015. We made these changes to our operations and internal reporting due to our acknowledgement that the U.S. Federal Government is a distinct customer with different procurement methods and regulations, the scale of our business with the U.S. Federal Government and the growth of our federal business from a primarily health-focused business to a broader business covering several federal agencies.profit,income, identifiable assets and related financial information for the 2016, 2015 2014 and 20132014 fiscal years, see "Note 2. Business segments" within Item 8 of this Annual Report on Form 10-K, which we incorporate by reference herein.53%54% of our total revenue in fiscal year 2015.programs includeservices support Medicaid, CHIPthe Children's Health Insurance Program (CHIP) and the ACA in the U.S., Health Insurance BC (British Columbia) in Canada and the Health Assessment Advisory Service (HAAS)HAAS and Fit for Work Service in the U.K. The Segment's services help people access, navigate and use health benefitbenefits and other government programs. The Segment also helps governments engage with program recipients, while at the same time helping themgovernments to improve the efficiency, cost effectiveness, quality and accountability of their health and disability benefits programs. Ourprogramsprograms. These services include:••••••• •Medigent® product suite. OurSegment’s revenue is from our independent health review services. These services include:•assessments;assessments, including those related to long-term services and• Ourinclude:•planning, oversight and consulting services; and•Specialized program consulting services.24%25% of our total revenue in fiscal year 2015. In this Segment, The acquisition of Acentia in 2015 provided us with access to twelve new contract vehicles with the U.S. Federal Government. We currently serve nineteen federal agencies.servicesservices. These include:••Documentsrecordsrecord management; and• Ourservicesservices. These include:••• Oursolutionssolutions. These include:•ITinformation technology (IT) infrastructure;•••23%21% of our total revenue in fiscal year 2015. These programs include welfare-to-work, child support, higher education and K-12 special education. The Segment'sinclude:•Comprehensive welfare-to-work services tothat help disadvantaged individuals transition from government assistance programs to sustainable employment and economic independence includingServices include eligibility determination, case management, job-readinessjob‑readiness preparation, job search and employer outreach, job retention and career advancement, and selected educational and training services;services. Programs served include the Work Programme and Work Choice in the U.K.; jobactive, Disability Employment Services and Young Refugee Assistance in Australia; Temporary•Fullservices;••K-12 special education case management solutions;••SegmentSegment's business is not expected to experience seasonality related to its programs.Arabia and New Zealand.Arabia. The distribution of revenue and assets across geographies are included in "Note 2. Business Segments" within Item 8 of this Annual Report on Form 10-K. Health and welfare reform initiatives have created increased demand for our services, a trend we expect to continue over the next several years. In addition, we believe there is an increasing propensity by certain governments to use public-private partnerships and seek help from firms like MAXIMUS as a means to run more effective and efficient programs. We believe that we remain well-positioned to benefit from this increasing demand.•benefitsbenefit programs;•••benefitsbenefit programs as a result of rising caseloads and demographic trends in many developed countries; and• Overpast decade,Organization for Economic Cooperation and Development, health care costs have risen substantially, and this trend is expected to continue. For example,spending in the U.S. still far exceeds that of other high-income countries. The Kaiser Family Foundation noted an acceleration of U.S. health care spending amongin 2014 due, in part, to increased coverage under the highest of all industrialized countries, is increasingACA and predicts that spending growth will continue at a rate that outpaces inflation and national income growth. Stemminghigher rates than in recent years, but not to the double-digit growth seen in previous decades.benefitsbenefit programs. Countries like the U.K. are examining how public health relates to productivity, cost reduction and economic growth. The U.K. Government provides a range of social welfare benefits for people who are unable to work as a result of a disability, long-term illness or other health condition. For individuals with long-term sickness or disabilities, the government requires an independent health assessment provided by a vendor through HAAS. The assessment is used by the Health Assessment Advisory Servicegovernment to determine an individual's level of benefits. For individuals with shorter-term health conditions, the Government requires an occupational health assessment and general health and work advice provided by a vendor partner through the Fit for Work Service to assist employees referred by employers and general practitioners with a wellness and return-to-work plan. We believe there is continued market demand to conduct independent assessments for participants in public benefit programs and to support employers and their employees through our commercial occupational health services.new ACA health insurance exchanges.also estimatesreported that 3031 states and the District of Columbia have already expanded Medicaid. Medicaid as of October 2016. In addition, states have seen an increase in Medicaid participation as a result of the "woodwork effect" as the level of visibility for these programs has increased, more individuals who are eligible for Medicaid have applied for coverage.fundsfunds. The Medicare Access and guaranteesCHIP Reauthorization Act (MACRA) of 2015 provides new federal funding for CHIP through 2015.2017. We currently serve as the administrative CHIP vendor for CHIP in six states.2015,2016, certain states and the District of Columbia operated their own exchanges. Other states participate in a partnership model or have opted to use the federal exchange. We currently operate customer contact centers for the District of Columbia and fivethree state-based exchanges, as well as aexchanges. We also operate one customer contact center as a subcontractor for the federal marketplace. In 2017, states will have access to the State Innovation Waivers, also known as the 1332 Waivers, which give states the most comprehensive and flexible framework for best using federal funding for their public health insurance programs. As a result, we believe that these waivers may create a more palatable path for additional states to contemplate a shiftnew ways to a state-based exchange or partnership modeloperate their health benefit programs over the coming years.overall 2016 federalPresident'sfor information technology (IT) spend is expected to grow by 1.8proposal includes a 1.3 percent while the projected budget forincrease in overall federal IT services shows 2spending and a 1.1 percent growth. address many of the challenges faced by federal agencies today.programs, such as Medicare where MAXIMUS provides conflict-free reviews of appeals.systems—systems and the pressing need for infrastructure as IT modernization continues to grow. Legacy processes and systems are fundamental to government operations, yet they are unsustainably expensive to operate in an environment that requires online agility and rapid response to new demands, requirements and global challenges. We are in a prime position to help agencies modernize and operate their mission-critical systems.presently managing the eligibility appeals process for the Federally Facilitated Marketplace and we are one of the largest providers of evidence-based health insurance appeals to Medicare and 4855 state agencies. We are also presently managing the eligibility appeals process for the Federally Facilitated Marketplace. As previously mentioned, President-elect Trump's campaign platform included a goal to repeal and replace the ACA. The factors that drove the passage of the ACA are still present we believe we are well-positioned to assist the new administration and the federal government in any repeal, replacement or modification of the ACA.••••••ahead offollowing the November 2016 Presidential Election. The Human Services market has experienced increased demand driven by the need for governments to reduce costs and improve efficiency of certain social benefits programs. The most dynamic portion of the market is in the welfare-to-work arena where governments worldwide seek program reform as an important component of comprehensive fiscal austerity measures. Certain governments are modeling new welfare reforms after established programs in Australia, the U.K. and the U.S. Variations of these models, with which we have a substantial amount of experience, knowledge and expertise, are being emulated around the world through public-private partnerships, with MAXIMUS being a leading provider. However, the re-engineering of well-established programs like these may take years to adapt to new program models from conceptualization to implementation.these global welfare-to-work opportunities in Human Services because of our established presence, strong brand recognition, and ability to achieve the requisite performance requirements and outcomes outlined in the new reform measures. We offer clients demonstrated results and decades of proven experience in administering welfare-to-work programs in several states and countries.Arabia and New Zealand.Arabia. In Australia, we are one of the largest and highest rated welfare-to-work providers, with more than 250 locations nationwide.providers. We also have an established presence in the U.K.'s welfare-to-work market and presently provide employment and job training services under the Work Programme, a key component of the coalition government's austerity plan to rein in costly benefits programs and reduce mounting debt.supporthelp people with disabilities and health conditions intoobtain mainstream employment. We believe these services are transferrable to our other geographies and position us well for emerging trends in the disability services market.reform,to work programs, we have seen an increase in initiatives to use private firms for children's services, such as family maintenance and child support. We currently provide services to the Family Maintenance Enforcement Program in British Columbia, as well as several jurisdictions throughout the U.S., including Shelby County, Tennessee and Baltimore, Maryland, two of the largest child support privatization efforts in the nation. reform initiatives and measures to reduce costs and improve efficiencies, combined with our outstanding performance, expertise and proven solutions, will continue to drive demand for our core services across multiple geographies.BPSbusiness process services (BPS), technology solutions and consulting services to government agencies. The key components of our business growth strategy include the following:customersclients and provide us with predictable recurring revenue streams. We believe an incumbent has a considerable advantage in recompetes and that customerclient relationships can last for decades.customerclient base, cross-selling additional services, enhancing our technical capabilities, and establishing or expanding our geographic presence.customers.clients. We continue to seek efficiencies and optimize operations in order to achieve sustainable, profitable growth. We will continue to deliver quality BPS to government clients to improve the cost effectiveness, efficiency and scalability of their programs as they deal with rising demand and increasing caseloads.customers.clients. The following are the competitive advantages that allow us to capitalize on various market opportunities:Management believesWe believe our extensive industry focus and expertise embedded in our systems and processes provide us with a competitive advantage.We maintainOur business provides us with robust cash flows from operating activities as a strong balance sheet, generate consistent annualresult of our profitability and our management of customer receivables. In the event that we have significant cash outlays at the commencement of projects, to fund acquisitions, or where delays in payments have resulted in short-term cash flow and have accessdeclines, we may borrow up to a $400 million revolvingthrough our credit facility. We possesshave the ability to borrow in all of the principal currencies in which we operate. We believe we have strong, constructive relationships with the lenders on our credit facility. We had $230.1 million available to borrow as of September 30, 2016. We believe our financial strength provides reassurance to ensure clients can confidently trust usgovernment agencies that we will be able to safelyestablish and maintain the services they need to operate their high-profile public health and human services programs.services. specificallyalmost exclusively to government customers. Our government program expertise and proven ability to deliver defined, measurable outcomes differentiate us from other firms and non-profit organizations. This includes large consulting firms that serve multiple industries and lack the focus necessary to manage the complexities of serving government agencies efficiently.Arabia and New Zealand.Arabia. Our international efforts are focused on delivering cost effectivecost-effective welfare-to-work and health benefits services to program participants on behalf of governments.variesvary from contract to contract, we believe that typical contracts are awarded based upon a mix of technical solution and price. In some cases, governments award points for past performance tied to program outcomes. With more than 40 years of experience in responding to RFPs, we believe we have the necessary experience and resources to navigate government procurement processes. We possess the expertiseprocesses and experience to assess and allocate the appropriate resources necessary for successful project completion in accordance with contractual terms.customersclients are government agencies, with the majority at the national, provincial and state level and, to a lesser extent, some at the county and municipal level. In the U.S., even when our direct customersclients are state governments, a significant amount of our revenue is ultimately provided by the U.S. Federal Government in the form of cost-sharing arrangements with the states, such as is the case with Medicaid. In the year ended September 30, 2015,2016, approximately 50%46% of our total revenue was derived from state government agencies, many of whose programs received significant federal funding, 22%26% from foreign government agencies, 20%22% from U.S. federal governmentFederal Government agencies and 8%6% from other sources including local municipalities and commercial customers. We were not significantly affected byshut-downevent of a shutdown of the U.S. Federal Government, in October 2013.a portion of our U.S. Federal Services Segment may be impacted. Many of our federally funded health and human services programs are typically deemedTherefore, in the event ofAs a shut-down, aresult, we could incur costs tied to portion of our U.S. Federal Services Segment may incur costswork that is considered discretionary with no certainty of recovery. In all cases, an extended delay may affect certain government programs that rely upon federal funding and may also have an effect on our cash flows from operations if payments are delayed.2015, we derived approximately 20%2016, our most significant clients were the U.S. Federal Government, which provided 22% of our consolidated revenue, from contracts with the U.S. FederalU.K. Government, exclusively within our U.S. Federal Services Segment,which provided 16%, and approximately 10% from the stateState of New York, exclusively within our Health Services Segment.2015, 44%2016, 42% of our contracts were performance-based, 29%33% were cost-plus, 21%18% were fixed-price and 6%7% were time-and-materials.long-term, multi-yearlonger-term and typical contracts, thatincluding option periods, tend to be several years long before they are subject to option years and periodic rebids.be competitively rebid. See the "Backlog" section below for more details.Fanuel.Faneuil. We consider ourselves to be a significant competitor in the markets in which we operate as we are the largest provider of Medicaid and CHIP administrative programs and operate more state-based health insurance exchanges than any other commercial provider. In the U.S. Federal Services Segment, our primary competitors in the BPS market are Serco, General Dynamics Information Technology and FCi. In the U.S. Federal Services Segment, our primary competitors in the technology sector tend to be IBM, Oracle, SRACSRA and other federal contractors. Our primary competitors in the Human Services Segment vary according to specific business line, but are primarily specialized consulting service providers and local non-profit organizations.Serco;Serco, Ingeus, a Providence Service Company; Staffline;Company, Staffline, Shaw Trust;Trust, Sarina Russon;Russon, Advanced Placement Management;Management and other specialized private companies and non-profit organizations such as The Salvation Army and Goodwill Industries. Although the basis for competition varies from contract to contract, we believe that typical contracts are awarded based upon a mix of technicalcomprehensive solution and price. In some cases, customersclients award points for past performance tied to program outcomes.In MarchEnacted in 2010 and upheld through a Supreme Court decision in 2012, the U.S. Federal Government enactedACA introduced comprehensive health care reform known as the ACA, to expand access to health coverage, protect consumer rights, control health care costs and improve the overall health care delivery system. In June 2012, the Supreme Court ofin the United States upheld the ACA while allowingStates. MAXIMUS has helped states to opt out of the previously mandated Medicaid expansion. The law presents several opportunities for MAXIMUS. These includewith the operation of their health insurance exchange operations;exchanges and the expansion of their Medicaid expansion; the extension of CHIP;programs to include new populations, the integration of state eligibility processing for entitlement programs;programs and new long-term services and supports initiatives for long-term care that allow stateshave introduced more flexibility in Medicaid for homehome- and community-based services;services. MAXIMUS has also assisted the expansionfederal government with the operations of a customer contact center for the Federal Marketplace and independent medicaleligibility appeals servicesservices.demonstration projects forexpansion activities in the dual eligible population (people eligible for bothstates where we provide Medicaid and Medicare).20192019. The Medicare Access and CHIP Reauthorization Act of 2015 (MACRA) provides new federal funding has been extendedfor CHIP through 2015, which is two additional years beyond the original CHIPRA.2017. By expanding state options to find and enroll eligible children through "express lane eligibility" and "auto enrollment," CHIPRA has presented MAXIMUS with an opportunity to expand our partnerships with states for the administration of CHIP programs. The advent of state and federal exchanges at the beginning of 2014 has increased participation of eligible children in CHIP. Shift to Medicaid and CHIP Managed Care.Care Regulations. As Medicaid programs become larger, more complex and costly, states look to new models. Estimates fromIn 2016, the Centers for Medicare & Medicaid Services (CMS) indicate that although the fee-for-service system covers less than half of the total Medicaid population, it accounts for more than 80% of all Medicaid spending. In response, several states have initiatives to reduce the current costs of Medicaid by moving different populations of beneficiaries from fixed-fee-for-service models toissued managed care which represents new growth opportunitiesregulations and federal standards for MAXIMUS.Tablethe Medicaid and Children’s Health Insurance programs. These include enhancing support for consumers, improving health care delivery and quality of Contentscare, providing greater access to health care, and ensuring a modern set of rules that better align with the marketplace and Medicare Advantage plans. They also reinforce ongoing efforts to modernize and streamline the enrollment process and the continued value of independent choice counseling.(Temporary Assistance for Needy Families), to help job seekers access the necessary support services and to match employers with skilled workers they need to compete in the global economy. WIOA represents potential new opportunities for us to complement our existing TANF welfare-to-work operations in the U.S.Governmentgovernment to determine the level of benefits for individuals with long-term sickness or disabilities. MAXIMUS has been providing assessments through the resulting HAAS on behalf of the Department for Work and Pensions (DWP) since March 2015.Fit for Work Service (formerly known as the HealthProgramme, Work Choice Programme and Work Service). In 2011, the U.K. Government set up a review of the sickness absence system to help reduce the 140 million days lost to sickness absence every year. The review considered how the current sickness absence system could be changed to help people stay in work, reduce costs and contribute to economic growth. One of the outcomes of the study is the Fit for Work Service that provides occupational health assessments and general health and work advice to employees, employers and general practitioners to help people with a health condition to stay in or return to work. MAXIMUS has been operating the Fit for Work Service on behalf of DWP since August 2014. U.K. WorkHealth Programme. The Work Programme is a government-sponsored welfare-to-work model that consolidates several existing employment programs into a single comprehensive back-to-work program in an effort to achieve higher quality, longer-term and sustainable employment outcomes for job seekers in the U.K. The Work Choice Programme presentedis a voluntary, government-sponsored employment support program for people with disabilities. The U.K. Government has indicated that the two programs will be consolidated into the new opportunities forWork and Health Programme with an increased focus on people with health conditions and disabilities. MAXIMUS expects that the scope of work under Work and we have been delivering employment services throughout Thames Valley, Hampshire andHealth will be smaller than the Isle of Wight and West London since June 2011 and North East Yorkshire and the Humber since February 2015.two previous contracts combined.2015,2016, we estimate that we had approximately $4.6$4.0 billion of revenue in backlog. Backlog represents an estimate of the remaining future revenue from existing signed base contracts and revenue from contracts that have been formally awarded, but not yet signed. Our backlog estimate includes revenue expected under the current terms of executed contracts and revenue from contracts in which the scope and duration of the services required are not definite but estimable (such as performance-based contracts). Our backlog estimate does not assume any contract renewals or option period exercises.itsour estimates related to performance-based contracts and as a result backlog from these contracts may increase or decrease based upon the information that management has at that time. Additionally, backlog estimates may be affected by foreign currency fluctuations.customersclients to terminate contracts on short notice, with or without cause.20152016 and 20142015 was as follows: Backlog as of
September 30, 2015 2014 2016 2015 (In millions) (In millions) $ 2,320 $ 2,330 $ 2,429 $ 2,320 832 570 408 832 1,448 900 1,163 1,448 $ 4,600 $ 3,800 $ 4,000 $ 4,600 BPS businesses typically involve contracts covering a number of years.years, including option periods. Once contracts are signed, they typically take three to six months to begin generating revenue. At September 30, 2015,2016, the average weighted life of these contracts was approximately 5 years, including option periods. Although the exercise of options is uncertain, we believe the incumbent contractor enjoys significant advantages and these options are exercised nearly 100% of the time. The longevity of these contracts assists management in predicting revenue, operating income and cash flows. We expect approximately 45%51% of the backlog balance to be realized as revenue in fiscal 20162017 and, with the inclusion of anticipated option period renewals, to represent approximately 93% of current estimated 2017 revenue. Backlog was adjusted between September 30, 2015 and September 30, 2016 revenue.2015,2016, we had approximately 17,00018,800 employees, consisting of 9,30010,900 employees in the Health Services Segment, 3,0003,500 employees in our U.S. Federal Services Segment, 4,3004,000 employees in the Human Services Segment and 400 corporate administrative employees. Our success depends in large part on attracting, retaining and motivating talented, innovative, experienced and educated professionals at all levels.2015, 4142016, 417 of our employees in Canada were covered under three different collective bargaining agreements, each of which has different components and requirements. There are 402408 employees covered by two collective bargaining agreements with the British Columbia Government and Services Employees' Union and 12nine employees covered by a collective bargaining agreement with the Professional Employees Association. These collective bargaining agreements expire beginning in 2019 through 2020.2015, 1,9172016, 1,795 of our employees in Australia were covered under a Collective Agreement, which is similar in form to a collective bargaining agreement. The Collective Agreement is renewed annually.2015, 7322016, 746 of our employees in the United KingdomU.K. were covered under four different collective bargaining agreements, each of which has different components and requirements. There are 170153 employees covered by a collective bargaining agreement with the Union Public and Commercial Services, sixfive employees covered by a collective bargaining agreement with the Union Prospect, and a total of 556588 employees covered by a collective bargaining agreement with GMB Trade Union and Unite Amicus Trade Union. These collective bargaining agreements do not have expiration dates.SEC.Securities and Exchange Commission (SEC). Our SEC filings may be accessed through the Investor Relations page of our website. These materials, as well as similar materials for other SEC registrants, may be obtained directly from the SEC through their website athttp://www.sec.gov. This information may also be read and copied at the SEC's Public Reference Room at 100 F Street NE, Washington, DCD.C. 20549. Information on the operation of the Public Reference Room may be obtained by calling the SEC at 1-800-SEC-0330.2015,2016, we leased 114 offices in the United StatesU.S. totaling approximately 2.22.4 million square feet. In fivefour countries outside the U.S., we leased 294323 offices totaling approximately 1.11.0 million square feet. The lease terms vary from month-to-month to ten-year leases and are generally at market rates. In the event that a property is used for our services in the U.S., we typically negotiate clauses to allow termination of the lease if the service contract is terminated by our customer. Such clauses are not standard in foreign leases.United StatesU.S. Federal Government, state, local, and foreign governments, and otherwise in connection with performing services in countries outside of the U.S. Adverse findings could lead to criminal, civil or administrative proceedings, and we could be faced with penalties, fines, suspension or disbarment. Adverse findings could also have a material adverse effect on us because of our reliance on government contracts. We are subject to periodic audits by Federal, state, local and foreign governments for taxes. We are also involved in various claims, arbitrations, and lawsuits arising in the normal conduct of our business. These include but are not limited to, bid protests, employment matters, contractual disputes and charges before administrative agencies. Although we can give no assurance, based upon our evaluation and taking into account the advice of legal counsel, we do not believe that the outcome of any existingpending matter would likely have a material adverse effect on our consolidated financial position, results of operations or cash flows. Price Range High Low Dividends Price Range High Low Dividends Year Ended September 30, 2016: First Quarter $ 69.85 $ 47.95 $ 0.045 Second Quarter 55.67 45.15 0.045 Third Quarter 58.14 46.90 0.045 Fourth Quarter 61.68 54.38 0.045 $ 55.97 $ 38.93 $ 0.045 $ 55.97 $ 38.93 $ 0.045 66.93 52.36 0.045 66.93 52.36 0.045 69.04 61.90 0.045 69.04 61.90 0.045 70.00 55.99 0.045 70.00 55.99 0.045
$ 50.55 $ 42.71 $ 0.045 50.24 40.61 0.045 46.48 40.27 0.045 43.40 37.94 0.045 30, 2015,31, 2016, there were 6151 holders of record of our outstanding common stock. The number of holders of record is not representative of the number of beneficial owners due to the fact that many shares are held by depositories, brokers or nominees. We estimate there are approximately 28,00030,800 beneficial owners of our common stock.2015:2016:Period July 1, 2016 - July 31, 2016 — $ — — $ 137,455 August 1, 2016 - August 31, 2016 — — — 137,660 September 1, 2016 - September 30, 2016 (2) 162,016 $57.40 — 137,796 Total 162,016 — (1) Under a resolution adopted in August 2015, the Board of Directors authorized the repurchase, at management's discretion, of up to an aggregate of $200 million of our common stock. This resolution superseded similar authorizations from November 2011 and June 2014. The resolution also authorized the use of option exercise proceeds for the repurchase of our common stock. (2) The total number of shares purchased in September 2016 comprises restricted stock units which vested in this month but which were utilized by the recipients to net-settle personal income tax obligations. The shares were not issued and a payment for this liability was made by us in October 2016. Total
Number of
Shares
Purchased Average
Price Paid
per Share Total Number of
Shares Purchased as
Part of Publicly
Announced Plans(1) Approximate Dollar
Value of Shares that
May Yet Be
Purchased
Under the Plan
(in thousands) — $ — — $ 104,581 643,797 60.13 643,797 182,004 417,265 60.68 222,900 168,568 1,061,062 60.34 866,697 (1)Under a resolution adopted in August 2015, the Board of Directors authorized the repurchase, at management's discretion, of up to an aggregate of $200 million of our common stock. This resolution superseded similar authorizations from November 2011 and June 2014. The resolution also authorized the use of option exercise proceeds for the repurchase of our common stock.(2)The total number of shares purchased in September 2015 includes 194,365 restricted stock units which vested in this month but which were utilized by the recipients to net-settle personal income tax obligations. The shares were not issued and a payment for this liability was made by us in October 2015.20102011 to September 30, 2015,2016, with the cumulative total return for the NYSE Stock Market (U.S. Companies) Index. In addition, we have compared the results of a peer group to our performance. TheOur peer group is comprised ofbased upon the companies noted in our annual proxy statement as entities with whom we compete for executive talent. These companies are SAIC, Unisys,Sapient. TheUnisys.20102011 in our common stock, the NYSE Stock Market (U.S. Companies) Index and our peer groups and assumes dividends are reinvested.
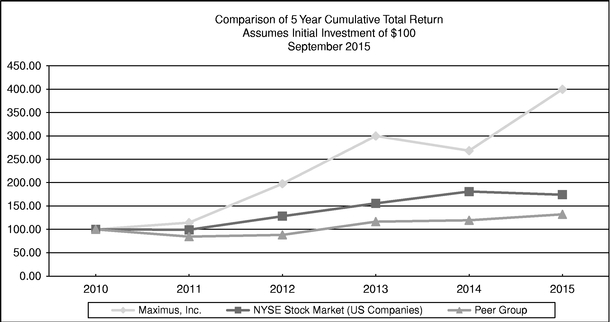
A.The lines represent index levels derived from compounded daily returns that include all dividends.B.The indexes are reweighted daily, using the market capitalization on the previous trading day.C.If the monthly interval, based on the fiscal year-end, is not a trading day, the preceding trading day is used.D.The index level for all series was set to $100.00 on 09/30/2010.A. The lines represent index levels derived from compounded daily returns that include all dividends. B. The indexes are reweighted daily, using the market capitalization on the previous trading day. C. If the monthly interval, based on the fiscal year-end, is not a trading day, the preceding trading day is used. D. The index level for all series was set to $100.00 on September 30, 2011. Year Ended September 30, 2015 2014 2013 2012 2011 Year Ended September 30, (In thousands, except per share data) 2016 2015 2014 2013 2012 (In thousands, except per share data) Consolidated statement of operations data: $ 2,099,821 $ 1,700,912 $ 1,331,279 $ 1,050,145 $ 929,633 $ 2,403,360 $ 2,099,821 $ 1,700,912 $ 1,331,279 $ 1,050,145 259,832 225,308 185,155 127,334 122,401 286,603 259,832 225,308 185,155 127,334 157,772 145,440 116,731 76,133 81,168 178,362 157,772 145,440 116,731 76,133 $ 2.37 $ 2.15 $ 1.71 $ 1.12 $ 1.18 $ 2.71 $ 2.37 $ 2.15 $ 1.71 $ 1.12 $ 2.35 $ 2.11 $ 1.67 $ 1.09 $ 1.14 $ 2.69 $ 2.35 $ 2.11 $ 1.67 $ 1.09 66,682 67,680 68,165 67,734 68,834 65,822 66,682 67,680 68,165 67,734 67,275 69,087 69,893 69,611 71,062 66,229 67,275 69,087 69,893 69,611 $ 0.18 $ 0.18 $ 0.18 $ 0.18 $ 0.15 $ 0.18 $ 0.18 $ 0.18 $ 0.18 $ 0.18 At September 30, 2015 2014 2013 2012 2011 At September 30, (In thousands) 2016 2015 2014 2013 2012 (In thousands) Consolidated balance sheet data: $ 74,672 $ 158,112 $ 125,617 $ 189,312 $ 172,950 $ 66,199 $ 74,672 $ 158,112 $ 125,617 $ 189,312 1,280,171 900,996 857,978 695,293 565,279 1,348,819 1,271,558 900,996 857,978 695,293 210,974 1,217 1,489 1,736 1,696 165,615 210,974 1,217 1,489 1,736 612,378 555,962 529,508 451,106 374,457 749,081 612,378 555,962 529,508 451,106 Table of Contentsprovide business process services (BPS) toare a leading operator of government health and human services agenciesprograms worldwide. We act as a partner to governments under our mission ofHelping Government Serve the People.® We are one of the largest pure-play health and human services BPS providers to governments in the United States, the United Kingdom, Australia, Canada, Saudi Arabia and New Zealand. We use our experience, business process management expertise and advanced technological solutions to help government agencies run effective, efficient and cost-effective programs, improve program accountability and outcomes and enhance the quality of services provided to program beneficiaries.accountable programs.grown significantly.reported significant organic growth. We believe this growth has been driven by economic and demographic factors, such as aging populations and increased demand for health care, and the need for governments to operate programs effectively and efficiently. This growth has been driven bypolitical factors, such as health care reform efforts in the United States including the Affordable Care Act (ACA), as well as internationally with various programsand welfare reform in Australia and the United Kingdom.We believe that a combination ofAs governments look to identify and reward providers based upon results, we see opportunities to expand based upon our innovative technical solutions,technology, deep subject matter expertise, stringent adherence to our Standards of Business Conduct and Ethics, robust financial performance and global experience gives existingworldwide experience.future customers the confidence that MAXIMUS can reliably operate their high-profile public health and human services programs.Significant recent acquisitionsGovernment, andGovernment. This business has been integrated into our U.S. Federal Services Segment.United KingdomU.K. government. This business has been integrated into our Human Services Segment.boththat all four acquisitions will provide us with the ability to complement and expand our existing services in their respective markets. These acquisitions have been integrated into our U.S. Federal Services and Human Services Segments, respectively. On July 1, 2013, we acquired Health Management Limited (HML), a leading provider of independent health assessments within the United Kingdom. We acquired HML in order to expand our independent medical assessment business and to strengthen the presence of our Health Services Segment in the United Kingdom.2015 have been2016 were driven primarily by the following:•The of Acentia, HML and Remploy, which have increased revenue and profit, as well as our working capital, goodwill, intangible asset and intangible asset amortization balances;•NewUnited Kingdom, particularly the HAAS,U.K., which commenced in fiscal year 2015;•New2015, and various contracts in the United States, particularly those related to the ACA,Affordable Care Act (ACA), which resulted in growth in fiscal yearscommenced or expanded through 2014 and 2015;TableThe expansion of Contents•toof our existing work in Australia, partially offset by the initial costs of setting up this work and deferral of initial revenue received;•Additional growth, driven by new work and the expansion of existing contracts;••revenuesrevenue and profitsprofit recorded by our international businesses; and•United StatesU.S. Dollar, principally the British Pound, the Australian Dollar, the Canadian Dollar and the Saudi Arabian Riyal and the New Zealand Dollar.Riyal. During the year ended September 30, 2015,2016, we earned approximately 26%28% and 10%16% of revenue and operating income, respectively, from our foreign subsidiaries. At September 30, 2015,2016, approximately 28%25% of our assets are held by foreign subsidiaries. International business exposes us to certain risks.•International tax ruleslimit thepenalize us if we transfer funds or debt across international borders. Accordingly, we may not be able to use ofour cash in other parts of the business without increasing significant additional tax expense or withholding.locations where it is needed. We mitigate this risk by maintaining sufficient capital and access to capital both within and outside the United StatesU.S. to support the short-term and long-term capital requirements of the businesses.businesses in each region. We establish our legal entities to make efficient use of tax laws and holding companies to minimize this exposure.•year endsyears indicated, selectedinformation derived from our statements of operations data:operations. Year ended September 30, 2015 2014 2013 (dollars in thousands,
except per share data) $ 2,099,821 $ 1,700,912 $ 1,331,279 512,717 452,123 386,033 24.4 % 26.6 % 29.0 % 238,792 220,925 193,827 11.4 % 13.0 % 14.6 % 9,348 5,890 4,883 4,745 — 2,168 259,832 225,308 185,155 12.4 % 13.2 % 13.9 % 1,398 — — 1,385 2,061 3,867 259,819 227,369 189,022 99,770 81,973 71,673 38.4 % 36.1 % 37.9 % 160,049 145,396 117,349 2,277 (44 ) 618 $ 157,772 $ 145,440 $ 116,731 $ 2.37 $ 2.15 $ 1.71 $ 2.35 $ 2.11 $ 1.67 To assist our presentation of the financial statements, we also include the following performance indicators. These items are considered "non-GAAP" numbers. We have also included at the end of this section details on our use of these performance indicators and reconciliations to their respective Generally Accepted Accounting Principles (GAAP) numbers. Year ended September 30, (dollars in thousands, except per share data) 2016 2015 2014 Revenue $ 2,403,360 $ 2,099,821 $ 1,700,912 Cost of revenue 1,841,169 1,587,104 1,248,789 Gross profit 562,191 512,717 452,123 Gross profit margin 23.4 % 24.4 % 26.6 % Selling, general and administrative expense 268,259 238,792 220,925 Selling, general and administrative expense as a percentage of revenue 11.2 % 11.4 % 13.0 % Amortization of intangible assets 13,377 9,348 5,890 Acquisition-related expenses 832 4,745 — Gain on sale of a business 6,880 — — Operating income 286,603 259,832 225,308 Operating income margin 11.9 % 12.4 % 13.2 % Interest expense 4,134 1,398 — Other income, net 3,499 1,385 2,061 Income before income taxes 285,968 259,819 227,369 Provision for income taxes 105,808 99,770 81,973 Effective tax rate 37.0 % 38.4 % 36.1 % Net income 180,160 160,049 145,396 Income/(loss) attributable to noncontrolling interests 1,798 2,277 (44 ) Net income attributable to MAXIMUS $ 178,362 $ 157,772 $ 145,440 Basic earnings per share attributable to MAXIMUS $ 2.71 $ 2.37 $ 2.15 Diluted earnings per share attributable to MAXIMUS $ 2.69 $ 2.35 $ 2.11 Year ended September 30, 2015 2014 2013 (dollars in thousands,
except per share data) $ 2.39 $ 2.11 $ 1.59 $ 289,545 $ 248,766 $ 206,343 336,394 291,544 237,276 336,394 291,544 226,376 Consolidated Statementsconsolidated statements of Operations.operations. As our business segments have different factors driving revenue growth and profitability, the sections that follow cover these segments in greater detail. Our business sections have been updated in fiscal year 2015. Please refer to Note 2. Business segments in Item 8 of this Annual Report on Form 10-K.20152016 compared to fiscal year 20142015 Revenue Cost of Revenue Gross Profit (dollars in thousands) Dollars Percentage change Dollars Percentage change Dollars Percentage change Balance for fiscal year 2015 $ 2,099,821 $ 1,587,104 $ 512,717 Organic growth 194,784 9.3 % 177,732 11.2 % 17,052 3.3 % Acquired growth 157,985 7.5 % 117,425 7.4 % 40,560 7.9 % Currency effect compared to the prior period (49,230 ) (2.3 )% (41,092 ) (2.6 )% (8,138 ) (1.6 )% Balance for fiscal year 2016 $ 2,403,360 14.5 % $ 1,841,169 16.0 % $ 562,191 9.6 % 23%by approximately 14% to $2,099.8$2,403.4 million, with our cost of revenue increasing by approximately 16% to $1,841.2 million. MuchOur gross profit margin declined from 24.4% to 23.4%. We have identifiedorganic, particularly infrom our 2016 acquisitions, Ascend and Assessments Australia, as well as the Health Services Segment, supplemented with acquired growthbenefits of a full year of results from Acentia and Remploy.2015,2016, the United StatesU.S. Dollar gained in strength against the Australian Dollar and Canadian Dollar and, accordingly,all international currencies in which we do business. Accordingly, we received lower revenuesrevenue and incurred lower costs than would have been the case if currency rates had remained stable. Dollars in
Thousands Percentage
change $ 1,700,912 317,653 18.7 % 141,036 8.3 % (59,780 ) (3.5 )% $ 2,099,821 23.5 % Gross profit increased 13% to $512.7 million, representing a profit margin of 24.4% compared to 26.6% in the prior year. This decline in gross margin has been driven by several factors.•Our federal appeals business has declined year-over-year to a normal profit margin, driven by changes in related legislation.•With the acquisition of Acentia, a greater share of our customer portfolio earns income from cost-plus or time-and-materials contracts. These contracts typically offer lower margins in return for lower risk.•The HAAS contract in the United Kingdom has received reduced performance incentives as we encounter challenges in recruiting and retaining trained healthcare professionals.•We have several contracts in 2015 in start-up. We typically see lower margins in the early stages of a contract.intangible amortization, legal expenses and the costs of business combinations. Our SG&A is primarily composed of labor costs. These costs may be incurred at a segment level, for dedicated resources which are not client-facing, or at a corporate level. Corporate costs are allocated to segments on a consistent, rational basis. Unlike cost of revenue, SG&A is not directly driven by fluctuations in our revenue and, as our business expands, we would expect to see SG&A decline as a percentage of revenue as we attain economies of scale.20142015 to 2015,2016, as the revenue growth of the business overall exceeded that of our administrative cost base. InmanagementK-12 Education business, which was previously part of the Company’s Human Services Segment. As a result of this transaction, we recorded a gain of approximately $6.9 million. The K-12 Education business contributed revenue of $2.2 million, $4.7 million and $9.4 million for the years ended September 30, 2016, 2015 and 2014, respectively.bonusbalances, which have declined. Other income is not expected to be significant in future years. Revenue Cost of Revenue Gross Profit (dollars in thousands) Dollars Percentage change Dollars Percentage change Dollars Percentage change Balance for fiscal year 2014 $ 1,700,912 $ 1,248,789 $ 452,123 Organic growth 317,653 18.7 % 288,222 23.1 % 29,431 6.5 % Acquired growth 141,036 8.3 % 102,297 8.2 % 38,739 8.6 % Currency effect compared to the prior period (59,780 ) (3.5 )% (52,204 ) (4.2 )% (7,576 ) (1.7 )% Balance for fiscal year 2015 $ 2,099,821 23.5 % $ 1,587,104 27.1 % $ 512,717 13.4 % 2014. Acquisition-related expenses are costs directly incurred from2014, an increase of 8.1%. This increase was principally driven by the purchasesfollowing factors:2015our IT infrastructure resulted in additional expenditures of approximately $7 million on shared resources; HML2013, as well as any unsuccessful transactions.profitincome margin decline has been driven by the same factors as the operating profitincome decline, as well as increases in costs related to acquisitions and intangible asset amortization.have recorded interest expense in fiscal year 2015. has increased due to a greater share of our income coming from the United States, particularly with the growth of our U.S. Federal Services Segment. In addition, our fiscal year 2014 tax rate received the benefit of the utilization of additional employment-related tax credits in fiscal year, the utilization of a tax net operating loss in Canada which had previously been fully reserved, and a benefit to our state taxes for the difference between the estimates in fiscal year 2013 to the tax returns filed in the fourth quarter of fiscal year 2014. For fiscal year 2016, the Company is anticipating a tax rate between 37% and 39%.Fiscal year 2014 compared to fiscal year 2013 Revenue increased 28% to $1,701 million. Much of the growth was organic, particularly in the Health Services and U.S. Federal Services Segments, supplemented with acquired growth from HML. In fiscal year 2013, we terminated a contract which had been acquired as part of the PSI acquisition, resulting in a one-time benefit of $16.0 million to revenue, $10.9 million to pre-tax profit and $0.09 to diluted earnings per share. This contract was in the Human Services Segment. Gross profit increased 17% to $452.1 million, representing a profit margin of 26.6% compared to 29.0% in the prior year. Gross profit margins declined due to new, cost-plus contracts in the which typically operate at lower margins than performance-based or fixed fee arrangements. Margins in fiscal year 2013 had received the benefit of the terminated contract. Our SG&A as a percentage of revenue has declined between fiscal years 2013 to 2014, as the revenue growth of the business overall exceeded that of our administrative cost base. Operating income increased 22% to $225.3 million representing a profit margin of 13.2% for the year ended September 30, 2014, compared to 13.9% in the prior year. This growth was principally driven by new work tied to the ACA in our Health and U.S. Federal Services Segments. Interest and other income declined due to decreases in our international cash balances, which generated the majority of our interest income. These funds were used to acquire HML in fiscal year 2013. Our tax rate for fiscal year 2014 was 36.1%, compared to 37.9% in 2013. This decline was caused by the utilization of significant additional employment-related tax credits in fiscal year, the utilization of a tax net operating loss in Canada which had previously been fully reserved, and a benefit to our state taxes for the difference between the estimates in fiscal year 2013 to the tax returns filed in the fourth quarter of fiscal year 2014.Health Services Segmentthe Affordable Care ActACA in the U.S., Health Insurance BC (British Columbia) in Canada and the Health Assessment Advisory Service (HAAS)HAAS and Fit for Work Service in the U.K. Year ended September 30, 2015 2014 2013 Year ended September 30, (dollars in thousands) (dollars in thousands) 2016 2015 2014 $ 1,109,238 $ 906,650 $ 691,565 $ 1,298,304 $ 1,109,238 $ 906,650 Cost of revenue 1,006,123 855,130 692,922 254,108 213,728 172,336 292,181 254,108 213,728 Selling, general and administrative expense 107,155 99,815 98,172 154,293 115,556 89,205 185,026 154,293 115,556 22.9 % 23.6 % 24.9 % 13.9 % 12.7 % 12.9 % Gross profit percentage 22.5 % 22.9 % 23.6 % Operating margin percentage 14.3 % 13.9 % 12.7 % 2015 versus2016 compared to fiscal year 20142015 Revenue Cost of Revenue Gross Profit (dollars in thousands) Dollars Percentage change Dollars Percentage change Dollars Percentage change Balance for fiscal year 2015 $ 1,109,238 $ 855,130 $ 254,108 Organic growth 202,928 18.3 % 165,467 19.3 % 37,461 14.7 % Acquired growth 14,881 1.3 % 10,336 1.2 % 4,545 1.8 % Currency effect compared to the prior period (28,743 ) (2.6 )% (24,810 ) (2.9 )% (3,933 ) (1.5 )% Balance for fiscal year 2016 $ 1,298,304 17.0 % $ 1,006,123 17.7 % $ 292,181 15.0 % 22%approximately 17% to $1,109.2$1,298.3 million. Gross profit increased by 19%approximately 15% and operating profitincome increased by 34%approximately 20%. The results for the Segmentnewthree factors.including HAAS, andexpanded on our existing U.S.-based contracts, notably with the expansion of an existing contracts. Dollars
in Thousands Percentage
change $ 906,650 225,285 24.8 % (22,697 ) (2.5 )% $ 1,109,238 22.3 % marginmargins declined year-over-year driven primarily byslightly year-over-year. This expected decline is due, in part, to the ramp-up on the HAAS contract. Thiscontract which operated at lower margins than the remainder of the Segment. As expected, the Fit For Work contract, which commenced in fiscal year 2015, hasalso tempered gross profit margins. Revenue Cost of Revenue Gross Profit (dollars in thousands) Dollars Percentage change Dollars Percentage change Dollars Percentage change Balance for fiscal year 2014 $ 906,650 $ 692,922 $ 213,728 Organic growth 225,285 24.8 % 183,918 26.5 % 41,367 19.4 % Currency effect compared to the prior period (22,697 ) (2.5 )% (21,710 ) (3.1 )% (987 ) (0.5 )% Balance for fiscal year 2015 $ 1,109,238 22.3 % $ 855,130 23.4 % $ 254,108 18.9 % professionals. These difficulties,professionals which resulted in turn, have resulted inadditional costs incurred that were not recovered due to reduced fees from performance incentives in this contract. This detriment was offset by accretive new work and improvements in the performance of an unprofitable contract acquired with PSI and launched in fiscal year 2014. Our operating profit margin improved, as the increase in revenue did not result in an associated increase in the size of SG&A expenses, due to benefits of scale and a decline in the management cash bonus plan. Our performance in fiscal year 2016 will be significantly affected by our ability to address issues related to the HAAS contract, as well as successfully executing other new contracts.Fiscal year 2014 versus fiscal year 2013 Revenue increased by 31% to $906.7 million. incentives.24%approximately 19% to $254.1 million. Our gross profit margin declined by 70 basis points to 22.9%. The HAAS contract would have reduced the segment profit margin by 270 basis points, but this was more than offset by the improvements on the PSI contract and operating profit increased by 30%. The resultsgrowth in other contracts.Segment were driven by:•Work related to the ACA, including new workcompany, and the expansionHealth Services Segment, did not significantly fluctuate year-over-year. Accordingly, the segment’s operating income margin received the benefit from the company’s economies of work on existing contracts;•The benefit of a full year of HML's business, which was acquired in July 2013; and•Other significant new contracts which commenced during the 2013 and 2014 fiscal years. Gross and operating profit margins were lower than in prior years driven by:•Contract start-up activity in late fiscal year 2014, related to the U.K. Health and Work Service (Fit for Work); and•The launch, during fiscal year 2014, of an unprofitable contract which had been acquired with PSI. Year ended September 30, 2015 2014 2013 Year ended September 30, (dollars in thousands) (dollars in thousands) 2016 2015 2014 $ 502,484 $ 341,840 $ 167,258 $ 591,728 $ 502,484 $ 341,840 Cost of revenue 453,560 383,838 231,047 118,646 110,793 73,694 138,168 118,646 110,793 Selling, general and administrative expense 74,792 59,252 47,695 59,394 63,098 42,566 63,376 59,394 63,098 23.6 % 32.4 % 44.1 % 11.8 % 18.5 % 25.4 % Gross profit percentage 23.3 % 23.6 % 32.4 % Operating margin percentage 10.7 % 11.8 % 18.5 % Contents Revenue Cost of Revenue Gross Profit (dollars in thousands) Dollars Percentage change Dollars Percentage change Dollars Percentage change Balance for fiscal year 2015 $ 502,484 $ 383,838 $ 118,646 Organic growth (15,043 ) (3.0 )% (11,133 ) (2.9 )% (3,910 ) (3.3 )% Acquired growth 104,287 20.8 % 80,855 21.1 % 23,432 19.7 % Balance for fiscal year 2016 $ 591,728 17.8 % $ 453,560 18.2 % $ 138,168 16.5 % Revenue Cost of Revenue Gross Profit (dollars in thousands) Dollars Percentage change Dollars Percentage change Dollars Percentage change Balance for fiscal year 2014 $ 341,840 $ 231,047 $ 110,793 Organic growth 56,649 16.6 % 73,131 31.7 % (16,482 ) (14.9 )% Acquired growth 103,995 30.4 % 79,660 34.5 % 24,335 22.0 % Balance for fiscal year 2015 $ 502,484 47.0 % $ 383,838 66.1 % $ 118,646 7.1 % profitincome decreased by 5.9%.Segment. These increases were offset by an expected declineSegment and driving the acquired growth in our Medicare Appeals business. Dollars in
Thousands Percentage
change $ 341,840 56,649 16.6 % 103,995 30.4 % $ 502,484 47.0 % Our profit margins have declined year-over-year due to the anticipated decline in Medicare appeals volumes, which were highly accretive. The addition of Acentia's businesses to our portfolio has also reduced our margins as they have a higher level of cost-plus work, which typically experiences lower margins. For fiscal year 2016, we are anticipating margin improvement from our2015.but overall margins will be closer to thosea subcontract which commenced in fiscal year 2015 and growth on existing contracts, which more than thoseoffset two declines which we had anticipated: approximately $58 million of earlier years.Fiscal year 2014 versus fiscal year 2013 Revenue doubledreductions in the Company’s Medicare appeals business and $20 million from the closure of a customer contact center that supported the Federal Marketplace.$341.8 million. Gross profit increased by 50%the acquisition of Acentia and operating profit increased by 48%.resultsrate of our cost growth exceeded that of our revenue growth for the Segment were driven by growthfollowing reasons:ACA-related business. Our ACA-related work in this Segment has typically been cost-plus work and, accordingly, experienced lower margins than other contracts within the U.S. Federal Services Segment.62%65% of our revenue in this Segment is earned in foreign jurisdictions. Year ended September 30, 2015 2014 2013 Year ended September 30, (dollars in thousands) (dollars in thousands) 2016 2015 2014 $ 488,099 $ 452,422 $ 472,456 $ 513,328 $ 488,099 $ 452,422 Cost of revenue 381,486 348,136 324,820 139,963 127,602 140,003 131,842 139,963 127,602 Selling, general and administrative expense 84,157 79,719 74,444 60,244 53,158 61,033 47,685 60,244 53,158 28.7 % 28.2 % 29.6 % 12.3 % 11.7 % 12.9 % Gross profit percentage 25.7 % 28.7 % 28.2 % Operating margin percentage 9.3 % 12.3 % 11.7 % Revenue Cost of Revenue Gross Profit (dollars in thousands) Dollars Percentage change Dollars Percentage change Dollars Percentage change Balance for fiscal year 2015 $ 488,099 $ 348,136 $ 139,963 Organic growth 6,899 1.4 % 23,398 6.7 % (16,499 ) (11.8 )% Acquired growth 38,817 8.0 % 26,234 7.5 % 12,583 9.0 % Currency effect compared to the prior period (20,487 ) (4.2 )% (16,282 ) (4.7 )% (4,205 ) (3.0 )% Balance for fiscal year 2016 $ 513,328 5.2 % $ 381,486 9.6 % $ 131,842 (5.8 )% TableContents Revenue Cost of Revenue Gross Profit (dollars in thousands) Dollars Percentage change Dollars Percentage change Dollars Percentage change Balance for fiscal year 2014 $ 452,422 $ 324,820 $ 127,602 Organic growth 35,719 7.9 % 31,173 9.6 % 4,546 3.6 % Acquired growth 37,041 8.2 % 22,637 7.0 % 14,404 11.3 % Currency effect compared to the prior period (37,083 ) (8.2 )% (30,494 ) (9.4 )% (6,589 ) (5.2 )% Balance for fiscal year 2015 $ 488,099 7.9 % $ 348,136 7.2 % $ 139,963 9.7 % Gross profit increased by 9.7% and operating profit increased by 13.3%. Revenue movement was driven by:•markets;••rates. Dollars in
Thousands Percentage
change $ 452,422 35,719 7.9 % 37,041 8.2 % (37,083 ) (8.2 )% $ 488,099 7.9 % Our operating marginCost of revenue increased by 7.2% to $348.1 million, consistent with revenue growth. The rate of growth for organic cost of revenue exceeded that of revenue. This was principally due to strong performancethe expansion of the jobactive contract in Australia, which was in start-up. This was tempered by the effect of currency fluctuations.and Remploy. In July 2015, we commenced work under a new Australian welfare-to-work contract which expanded our existing workload. The structure of the reimbursement for this work and the costs of expanding the operations resulted in additional costs and deferral of revenue in this period, which reduced our gross and operating profit margins. In fiscal year 2016, we anticipate that this contract will be fully ramped-up.Fiscal year 2014 versus fiscal year 2013 The results for the Human Services Segment in fiscal year 2013 were affectedwas offset by a one-time benefitmargin dilution from the termination of a system-integration contract acquired with PSI. The termination resulted in a one-time benefit of $16.0jobactive contract. to revenue, $10.9 million to pre-tax profit and $0.09 to diluted earnings per share. Although contract terminations for convenience do occur within our business, they are infrequent. In addition, this termination was unusual due to the significant effectacquisition of the transaction as it involved deferred revenue from the PSI acquisition and does not reflect the underlying operations of the Company. We have provided a reconciliation below showing our results excluding the favorable effect of this contract. Results for Human Services
Segment for year ended
September 30, 2013 Revenue Gross
profit Operating
profit (dollars in thousands) $ 472,456 $ 140,003 $ 61,033 (16,035 ) (10,900 ) (10,900 ) $ 456,421 $ 129,103 $ 50,133 28.3 % 11.0 % Revenue for fiscal year 2014 totaled $452.4 million and was comparable to the same period in the prior year, excluding the terminated contract noted above. Fiscal year 2014 revenue was reduced by approximately $11.0 million by currency fluctuations and was adversely affected by the completion of a large fixed-price contract which came to an end in early 2014. In April 2015, we$225 million fromto fund our revolving credit facility to acquire Acentia, with the balance of the payment being made up with available cash in the U.S. In addition, we have made short-term borrowings as required to cover our immediateongoing operations and working capital requirements. Other outlays, including workingneeds as well as investments in capital capital expenditure, the acquisition of Remploy, repurchases of sharesinfrastructure and cash dividends have been funded from our share repurchases. These operating cash flows. At September 30, 2015, we had outstanding borrowings of $209.7 million under the credit facility. Our operating cash inflowsflows are typically driven by our contracts and influenced bytheir payment terms in contracts.terms. For many contracts, including two new projects in the U.K., we are reimbursed up front for the costs of our start-up operations. Althoughoperations, although there may be a gap between incurring costs and receiving this reimbursement, we have sufficient funds to cover these costs.funds. Other factors thatwhich may cause delaysshortfalls in our realization of customer receiptscash flows include customercontract terms where payments based upon delivering outcomes,are tied to outcome deliveries, which may not correspond with the costs incurred to achieve these outcomes and short-term payment delays where government budgets are constrained. Days sales outstanding, or DSO, ismeasurecredit facility. We used this facility to fund our acquisitions of how efficiently we manage the billingAcentia and collection of our receivable balances. We calculate DSO by dividing billed and unbilled receivable balances at the end of each quarter by revenue per day for the period. Revenue per day for a quarter is determined by dividing total revenue by 91 days. DSO was 67Ascend, as ofwell as short-term borrowings to cover immediate working capital needs. At September 30, 2015, compared to 64 as2016, we had outstanding borrowings of September 30, 2014. Our DSO remains within our stated target range of 65 to 80 days. operations over the course of the next two years2015,2016, our foreign subsidiaries held 80%$63.7 million of our cash and cash equivalents. We have no requirement or intent to remit this cash to the United States.U.S. We consider undistributed earnings of our foreign subsidiaries to be indefinitely reinvested outside of the United StatesU.S. and, accordingly, no U.S. deferred taxes have been recorded with respect to such earnings in accordance with the relevant accounting guidance for income taxes. Should thethese earnings be remitted as dividends, we may be subject to additional U.S. taxes, net of allowable foreign tax credits. It is not practicable to estimate the amount of any additional taxes which may be payable on the undistributed earnings given the various tax planning alternatives we could employ, should we decide to repatriate these earnings in a tax-efficient manner.2015.2016. Year ended September 30, 2015 2014 2013 Year ended September 30, (dollars in thousands) (dollars in thousands) 2016 2015 2014 Net cash provided by/(used in): $ 206,217 $ 213,600 $ 120,938 $ 180,026 $ 206,217 $ 213,600 (393,872 ) (49,389 ) (129,833 ) (87,103 ) (393,872 ) (49,389 ) 111,115 (127,144 ) (41,862 ) (96,842 ) 111,115 (127,144 ) (6,900 ) (4,572 ) (12,938 ) (4,554 ) (6,900 ) (4,572 ) $ (83,440 ) $ 32,495 $ (63,695 ) $ (8,473 ) $ (83,440 ) $ 32,495 and 2013 was $180.0 million, $206.2 million and $213.6 million, respectively. These cash flows were adversely affected by Days Sales Outstanding (DSO) and $120.9by the increase in working capital required by the growth in the volume of our business.respectively. Cash providedat September 30, 2016; therefore a three day increase reduced cash flow by operating activities is driven by changesapproximately $21 million. Our working capital investment also increased in fiscal year 2016 due to the 14% increase in our operating income,revenue. Deferred revenue increased in fiscal year 2015 as wella result of the initial start-up activities for project infrastructure spend for HAAS, Australia and Fit for Work. This caused cash flow from operations to be higher than normal in fiscal year 2015. Deferred revenue decreased in fiscal year 2016 reducing cash flow from operations. The timing of our tax payments in fiscal year 2016, compared to the prior year, has also reduced our cash flows by approximately $25 million.changesa large number of contracts commenced late in the year causing delays in payment, which are common at the beginning of arrangements. These issues were resolved in fiscal year 2014, resulting in significant catch-up in our working capitalcash collections.timingearly days of our 2017 fiscal year. We are anticipating full year operating cash receiptsflows in the range of $230 million to $280 million in fiscal 2017.customers andinvesting activities included significant payments to tax authorities.acquire businesses. In fiscal year 2013,2016, we ended the year with a significant number of new contracts, particularly those relatedpaid $46.7 million to the ACA. As is often the case with new contracts, delays in billingsacquire Ascend and collections resulted in operating cash flows significantly lower than might have been expected, which were then recoveredAssessments Australia; in fiscal year 2014. DSO at September 30, 2014 was 64 days, compared with 69 days at September 30, 2013. These five days accounted for approximately $242015, we paid $289.2 million, of cash flow benefit in fiscal year 2014. DSO at September 30, 2015 was 67 days, the increase of three days resulting in approximately $19 million of reducedprincipally to acquire Acentia. Our cash flows in fiscal year 2015. Cash used in investing activities includes net cash outflows related to acquisitions of businesses of $289.2 million, $2.7 million and $68.1 million in fiscal years 2015 2014 and 2013, respectively. These cash flows principally relate to the acquisitions of Acentia, Remploy and HML. In addition, the Company madewere further affected by significant investments in fiscal year 2015 to improve our IT infrastructure in the U.S. as well as project specific capital build outs in the U.K. and Australia. We expect that capitalThese expenditures will be significantly lowerreturned to normal levels in fiscal year 2016. On April 1, In fiscal year 2016, we received cash of $5.5 million related to the sale of our K-12 Education business.connection withfiscal year 2016 to acquire Ascend, and other borrowings have been made to fund short-term working capital needs. We are currently using cash provided by operating activities to fund capital expenditures and to repay our debt balance. acquisition of Acentia. During the third and fourth fiscal quarters, we have repaid $15.3 million, resulting in net borrowings under our revolving credit facility of $209.7was $164.7 million. We had $189.5$230.1 million available to borrow as of September 30, 2015. We2016, which we believe this will be sufficient to cover our operating and other cashcapital requirements. In addition, we purchased $82.8$111.11.6 million and $33.32.7 million shares of our own common stock induring fiscal years 2016, 2015 and 2014, and 2013, respectively. We have repurchased 5.3 million shares over these three years and,respectively at a total cost of $227.3 million. At September 30, 2015,2016, we had $168.6$137.8 million available for future repurchases under a plan approved by our Board of Directors. This is in addition to our existing dividend, which has provided payments of approximately $12 million per year. Both ourOur share repurchases and cash dividends are at the discretion of our Board of Directors and depend upon our future operations and earnings, capital requirements general financial condition, contractual restrictions and other factors our Board of Directors may deem relevant. During the first quarter of fiscal year 20162017 through November 16, 2015,21, 2016, we acquired an additional 0.30.5 million shares at a cost of $14.4$24.0 million. Based upon our shares repurchased and our expectations for future purchases, we are anticipating that our diluted number of shares for fiscal year 20162017 will be approximately 66.2 million. In addition,declaredhave paid a quarterly dividend of $0.045 per common share whichshare. This has resulted in a regular cash outflow of approximately $12 million per year. Our next dividend will be paid on November 30, 20152016 to shareholders of record on November 13, 2015. Based on15, 2016. Continued payment of the number of shares outstanding, the payment will be approximately $2.9 million.$6.9$4.6 million in the 20152016 fiscal year primarily reflects the strengthening of the United StatesU.S. Dollar against the Australian Dollar and Canadian Dollar.other international currencies utilized by the business. Year ended September 30, 2015 2014 2013 (dollars in thousands) $ 206,217 $ 213,600 $ 120,938 (98,994 ) (36,262 ) (43,580 ) (6,155 ) (10,886 ) (18,596 ) $ 101,068 $ 166,452 $ 58,762 Year ended September 30, (dollars in thousands) 2016 2015 2014 Cash provided by operating activities $ 180,026 $ 206,217 $ 213,600 Purchases of property and equipment and capitalized software costs (46,391 ) (105,149 ) (47,148 ) Free cash flow $ 133,635 $ 101,068 $ 166,452 20152016 that require the Company to make future cash payments (in thousands):payments: Payments due by period (dollars in thousands) Total Less than
1 year 1 - 3
years 3 - 5
years More than
5 yearsOperating leases $ 187,394 $ 70,675 $ 87,705 $ 26,682 $ 2,332 Debt(1) 174,437 2,810 5,298 166,229 100 Deferred compensation plan liabilities(2) 25,815 1,803 2,016 1,376 20,620 Total(3) $ 387,646 $ 75,288 $ 95,019 $ 194,287 $ 23,052 Payments due by period Total Less than
1 year 1 - 3
years 3 - 5
years More than
5 years (Dollars in thousands) $ 221,777 $ 70,892 $ 97,768 $ 48,198 $ 4,919 222,455 2,918 5,540 213,768 229 21,596 961 1,743 1,172 17,720 $ 465,828 $ 74,771 $ 105,051 $ 263,138 $ 22,868 (1) Future interest included in debt was $8.8 million, $2.5 million, $5.0 million and $1.3 million for the total, less than one year, one to three years and three to five years, respectively. These include interest payments that would be made on our revolving credit facility if the current balance and borrowing rate were to continue to prevail. (2) Deferred compensation plan liabilities are typically payable at times elected by the employee at the time of deferral. However, early withdrawal is permitted for certain conditions, including employee hardship or termination, which may accelerate the payment of these liabilities. At September 30, 2016, we held assets of $24.8 million in a Rabbi Trust which could be used to meet these obligations. (3) Due to the uncertainty with respect to the timing of future cash flows associated with the Company's unrecognized income tax benefits at September 30, 2016, we are unable to reasonably estimate settlements with taxing authorities. The above table does not reflect unrecognized income tax benefits of (1)Interest included in debt was $11.4 million, $2.5 million, $5.1 million, $3.8 million and zero for the total, less than one year, one to three years, three to five years and more than five years, respectively. These include interest payments that would be made on our revolving credit facility if the current balance and borrowing rate were to continue to prevail.(2)Deferred compensation plan liabilities are typically payable at times elected by the employee at the time of deferral. However, early withdrawal is permitted for certain conditions, including employee hardship or termination, which may accelerate the payment of these liabilities.(3)Due to the uncertainty with respect to the timing of future cash flows associated with the Company's unrecognized income tax benefits at September 30, 2015, we are unable to reasonably estimate settlements with taxing authorities. The above table does not reflect unrecognized income tax benefits of $1.0$1.1 million, of which approximately $0.5$0.6 million is related interest and penalties. See "Note 15. Income taxes" of the Consolidated Financial Statements for a further discussion on income taxes.up tobefore December 31, 2016. At present, we have reduced our accrual to zero based upon a probability-weighted assessment of our likely payments under this arrangement. At this time, no sales arrangements have been entered into which would require a payment to be made. See "Note 5."made and we have no accrual recorded.Consolidated Financial Statementsacquisition arrangement for additional information.Assessments Australia, which was acquired in fiscal year 2016, we agreed to pay $0.5 million in the event that certain contracts were obtained prior to December 2022. At present, we have recorded a liability of $0.4 million related to this balance.29%33% of our business in fiscal year 20152016 was conducted under cost-reimbursable pricing arrangements that adjust revenue to cover costs increased by inflation. Approximately 6%7% of the business was time-and-material pricing arrangements where labor rates are often fixed for several years. We generally have been able to price these contracts in a manner that accommodates the rates of inflation experienced in recent years. Our remaining contracts are fixed-price and performance-based and are typically priced to mitigate the risk of our business being adversely affected by inflation.United StatesU.S. requires us to make estimates and judgments that affect the amounts reported. We consider the accounting policies below to be the most important to our financial position and results of operations either because of the significance of the financial statement item or because of the need to use significant judgment in recording the balance. We base our estimates on historical experience and on various other assumptions that are believed to be reasonable under the circumstances, the results of which form the basis for making judgments about the carrying values of assets and liabilities. Actual results could differ from those estimates. Our significant accounting policies are summarized in Note 1"Note 1. Business and summary of significant accounting policies" of the Consolidated Financial Statements included in Item 8 in this Annual Report on Form 10-K.29%33% of our business is derived from cost-plus pricing arrangements. Revenue on cost-plus contracts is recognized based on costs incurred plus the negotiated fee earned. For certain arrangements,Our key estimates relate to the nature and allocation of indirect costs. Much of the allocation of allowable indirect costs incurred is subjectbased upon rules established by the relevant contract or by reference to judgmentU.S. Federal Government standards. While the existence of these rules reduces the risk of a significant error, the allocation of indirect costs is typically audited by our customers and differing amounts couldit usually takes a significant period of time for an audit to be recorded if underlying assumptions or estimates were to change.concluded. The Company closely monitors its methodology for recording cost-plus revenue and incorporates the resultsiterative process of client audits where applicablean audit provides us with information to refine these estimates. Changesour estimates for open periods. We have not recorded any significant adjustments to our revenue related to changes in such estimates may resultfor any of the three years ended September 30, 2016. We are current in our submissions of costs to relevant regulators. Although audits of past costs remain open for certain years, wechangesadjustment to revenue.paymentsper-transaction fees may be higher in earlier years to compensate for transactions performed may decline overanticipated higher costs at the lifecommencement of contract operations. Where the contract. Where this occurs, we must identify whether the lowerdiscount in future payments represent a discount which is both significant and incremental. Where a discountfees is considered both significant and incremental, we recognize revenue for each transaction onare required to estimate our total future volumes and revenues and allocate an estimated average effective rate. As thisfee to each transaction. We refine these estimates of total future volumes quarterly and we recognize these changes as a cumulative catch-up to our revenue. The sensitivity of these volume estimates is driven by the length of the contract, the size of the discounts and the maturity of the contract. Our greatest revenue volatility from our estimate is based upon future volumewill typically arise at the mid-point of transactions,the contract; in early periods of contract performance, changes to these anticipatedestimates of future volumes may resultwill have a smaller true-up; in changes to our revenue.Tablelater periods, there is less likelihood of Contents Prior to fiscal year 2014,a significant change in estimate. Although we had some fixed-price contracts, primarily systems design, development and implementation, where we recognized revenue based upon costs incurred to date and our anticipated gross profit. The cumulative impact of any revisions in estimated revenue and costs was recognized in the period in which the facts that give rise to the revision become known. Such contracts required a number of estimates includingcontracts with these terms and conditions during the timing of future work to be performed, the future costs of labor and materials and, where considered to be estimable and probable,three years ended September 30, 2016, no significant adjustments to revenue from change orders or contract incentives. This work is no longerwere recorded in this period. As of September 30, 2016, many of these contracts are close to maturity and, accordingly, the likelihood of a significant partadjustment has diminished. The only significant remaining contract is in our contract with the Department of Education, which is in our business.2015,2016, the Company performed theits annual impairment test and determined that there had been no impairment of goodwill. In performing this assessment, the Company utilizes an income approach. Such an approach requires estimation of future operating cash flows including business growth, utilization of working capital and discount rates. The valuation of the business as a whole is compared to the Company's market capital at the date of the acquisition in order to verify the calculation. In all cases, we determined that the fair value of our reporting units was significantly in excess of our carrying value to the extent that a 25% decline in fair value in any reporting unit would not have resulted in an impairment charge.2015.2016. During the year ended September 30, 2015, the Company2016, we performed assessmentsan impairment assessment on two sets of long-lived assets with carrying values of $17.2 million and $12.8 million, respectively.both asset groups have lives in excess of three years andwe will most likely continue to be reviewed quarterlyreview for indicators of asset impairment over theirits remaining lives.life.non-GAAPnon‑GAAP measures where we believe it will assist the user of our financial statements in understanding our business.the performance of the business excluding the effect of transactions.this. To calculate this,organic revenue growth, we compare current year revenue excluding revenue from these acquisitions to our prior year revenue.provide constant currency revenue movement as a useful basis for assessingbelieve that users of our financial statements wish to understand the performance of the business excludingour foreign operations using a methodology which excludes the effect of foreignyear-over-year exchange rate fluctuations. To calculate this,year-over-year currency movement, we determine the current year's revenueyear’s results for all foreign businesses using the exchange rates in the prior year.information as a useful basis for investors to comparecomplement our performance across periods or against our competitors.statement of cash flows. Free cash flow shows the effects of the Company'sCompany’s operations and routine capital expenditureexpenditures and excludes the cash flow effects of acquisitions, share repurchases, dividend payments and other financing transactions. We have provided a reconciliation of free cash flow to cash provided by operating activities.provide days sales outstanding, or DSO, as a measure of how efficiently we manage the billing and collectionbelieve that users of our receivable balances. Wefinancial statements wish to evaluate our efficiency in converting revenue into cash receipts. Accordingly, we provide DSO, which we calculate DSO by dividing billed and unbilled receivable balances at the end of each quarter by revenue per day for the period. Revenue per day for a quarter is determined by dividing total revenue by 91 days. We have provided an analysis of revenue, gross profit and operating profit excluding a single contract which was terminated in2013. We believe this provides a useful basis for understanding2016, we utilized our credit facility. Our credit agreement includes the performance of our business year-over-year. We have provided a reconciliation of these balances to their respective GAAP numbers. We have provided adjusted diluted earnings per share. Adjusted diluted earnings per share shows our diluted earnings per share excluding the effects of acquisition expenses and the termination of the contract noted above. We believe that this provides a useful basis for understanding the performance of our business excluding the effects of unusual transaction costs. We have provided a reconciliation from diluted earnings per share to adjusted diluted earnings per share below. Year ended September 30, 2015 2014 2013 (dollars in thousands) $ 2.35 $ 2.11 $ 1.67 0.04 — 0.01 — — (0.09 ) $ 2.39 $ 2.11 $ 1.59 We have provideddefined term Consolidated EBITDA and EBITA, as well as their respective margins. EBITDA and EBITA are measures of our performance excluding the effects of taxes, interest expense, amortization and depreciation. We believe that these measures provide a useful basis for assessing the performance of our business excluding the effects of changes in taxation rates, interest rates, cash borrowings, acquisition-related expenses, amortization of intangible assets and fluctuations in capital expenditures. In addition, our calculation of Adjusted EBITDA conforms to the credit agreement definition. We believe our investors appreciate the opportunity to understand the possible restrictions which arise from our credit agreement. Adjusted EBITDA is consistentalso a useful measure of performance which focuses on the cash generating capacity of the business as it excludes the non-cash expenses of depreciation and amortization, and makes for easier comparisons between the operating performance of companies with different capital structures by excluding interest expense and therefore the calculation utilizedimpacts of financing costs. The measure of Adjusted EBITA is a step in calculating Adjusted EBITDA and facilitates comparisons to determine our compliance withsimilar businesses as it isolates the conditions of our Credit Facility, as well as our borrowing rate and the level of security we provide to our lenders. To assist in understanding trends in our underlying business, we have also calculated EBITDA excluding theamortization effect of the terminated contract noted above, resulting in an "Adjusted EBITDA."business combinations. We have provided a reconciliation from net income to Adjusted EBITA EBITDA and Adjusted EBITDA as follows (in thousands): Year ended September 30, 2015 2014 2013 $ 157,772 $ 145,440 $ 116,731 673 (1,815 ) (3,667 ) 99,770 81,973 71,673 9,348 5,890 4,883 17,237 17,278 14,555 4,745 — 2,168 289,545 248,766 206,343 46,849 42,778 30,933 336,394 291,544 237,276 — — (10,900 ) $ 336,394 $ 291,544 $ 226,376 Year ended September 30, (in thousands) 2016 2015 2014 Net income attributable to MAXIMUS $ 178,362 $ 157,772 $ 145,440 Interest expense/(income) 3,466 673 (1,815 ) Provision for income taxes 105,808 99,770 81,973 Amortization of intangible assets 13,377 9,348 5,890 Stock compensation expense 18,751 17,237 17,278 Acquisition-related expenses 832 4,745 — Gain on sale of a business (6,880 ) — — Adjusted EBITA 313,716 289,545 248,766 Depreciation and amortization of property, plant, equipment and capitalized software 58,404 46,849 42,778 Adjusted EBITDA $ 372,120 $ 336,394 $ 291,544 The presentation of these non-GAAP numbers is not meant to be considered in isolation, nor as alternatives to revenue growth, cash flows from operating activities or net income as measures of performance. These non-GAAP financial measures, as determined and presented by us, may not be comparable to related or similarly titled measures presented by other companies.Table of Contents equivalent balances are held in highly rated securities with maturities of three months or less. We manage our exposure to interest rate fluctuations through the use of interest rate swap agreements. At September 30, 2015,2016, we had borrowings under our credit facility of $209.7$164.7 million and we had an interest rate swap agreement fixing a notional $53.3$42.0 million of this balance. Our interest rate varies based upon our leverage, as defined in our agreement with our lenders, but we are currently paying interest at a rate based upon the one-month London Interbank Offering Rate (LIBOR) plus 1%. The one-month LIBOR rate at September 30, 20152016 was 0.19%0.527%. A hypothetical increase in LIBOR byof 10% would increase our annual interest expense and cash flows on our outstanding balance by $0.3approximately $0.1 million.United Kingdom,U.K., Australia Canada and New Zealand.Canada. At September 30, 2015,2016, we held net assets in functional currencies other than the U.S. Dollar of $190.3$203.9 million and, accordingly, in the event of a 10% fluctuation in the value of the local currencies, we would report a $19.0$20.4 million gain or loss in our statement of comprehensive income. Our foreign-based businesses mitigate their currency risks through incurring costs in the same currency as their revenue. The operations of the U.S. business do not depend upon cash flows from the foreign businesses.20152016 and 2014,2015, and the related consolidated statements of operations, comprehensive income, shareholders' equity and cash flows for each of the three years in the period ended September 30, 2015.2016. These financial statements are the responsibility of the Company's management. Our responsibility is to express an opinion on these financial statements based on our audits.20152016 and 2014,2015, and the consolidated results of their operations and their cash flows for each of the three years in the period ended September 30, 2015,2016, in conformity with U.S. generally accepted accounting principles.'s’s internal control over financial reporting as of September 30, 2015,2016, based on criteria established in Internal Control—IntegratedControl-Integrated Framework issued by the Committee of Sponsoring Organizations of the Treadway Commission (2013 framework) and our report dated November 16, 201521, 2016 expressed an unqualified opinion thereon. /s/ Ernst & Young LLP McLean, Virginia November 16, 2015 November 21, 2016 Year ended September 30, 2015 2014 2013 $ 2,099,821 $ 1,700,912 $ 1,331,279 1,587,104 1,248,789 945,246 512,717 452,123 386,033 238,792 220,925 193,827 9,348 5,890 4,883 4,745 — 2,168 259,832 225,308 185,155 1,398 — — 1,385 2,061 3,867 259,819 227,369 189,022 99,770 81,973 71,673 160,049 145,396 117,349 2,277 (44 ) 618 $ 157,772 $ 145,440 $ 116,731 $ 2.37 $ 2.15 $ 1.71 $ 2.35 $ 2.11 $ 1.67 $ 0.18 $ 0.18 $ 0.18 66,682 67,680 68,165 67,275 69,087 69,893 Year ended September 30, 2016 2015 2014 Revenue $ 2,403,360 $ 2,099,821 $ 1,700,912 Cost of revenue 1,841,169 1,587,104 1,248,789 Gross profit 562,191 512,717 452,123 Selling, general and administrative expenses 268,259 238,792 220,925 Amortization of intangible assets 13,377 9,348 5,890 Acquisition-related expenses 832 4,745 — Gain on sale of a business 6,880 — — Operating income 286,603 259,832 225,308 Interest expense 4,134 1,398 — Other income, net 3,499 1,385 2,061 Income before income taxes 285,968 259,819 227,369 Provision for income taxes 105,808 99,770 81,973 Net income 180,160 160,049 145,396 Income/(loss) attributable to noncontrolling interests 1,798 2,277 (44 ) Net income attributable to MAXIMUS $ 178,362 $ 157,772 $ 145,440 Basic earnings per share attributable to MAXIMUS $ 2.71 $ 2.37 $ 2.15 Diluted earnings per share attributable to MAXIMUS $ 2.69 $ 2.35 $ 2.11 Dividends per share $ 0.18 $ 0.18 $ 0.18 Weighted average shares outstanding: Basic 65,822 66,682 67,680 Diluted 66,229 67,275 69,087 Year ended September 30, 2015 2014 2013 $ 160,049 $ 145,396 $ 117,349 (22,570 ) (7,757 ) (12,253 ) (25 ) — — 137,454 137,639 105,096 2,277 (44 ) 618 $ 135,177 $ 137,683 $ 104,478 Year ended September 30, 2016 2015 2014 Net income $ 180,160 $ 160,049 $ 145,396 Foreign currency translation adjustments (13,828 ) (22,570 ) (7,757 ) Interest rate hedge, net of income taxes of $(16), $16 and $— 24 (25 ) — Comprehensive income 166,356 137,454 137,639 Comprehensive income/(loss) attributable to noncontrolling interests 1,798 2,277 (44 ) Comprehensive income attributable to MAXIMUS $ 164,558 $ 135,177 $ 137,683 September 30, September 30, 2015 2014 2016 2015 $ 74,672 $ 158,112 $ 66,199 $ 74,672 396,177 263,011 444,357 396,177 30,929 26,556 36,433 30,929 18,992 28,108 Income taxes receivable 17,273 7,310 60,129 56,673 56,718 52,819 580,899 532,460 620,980 561,907 137,830 80,246 131,569 137,830 32,483 39,734 30,139 32,483 376,302 170,626 397,558 376,302 102,358 39,239 109,027 102,358 19,126 12,046 18,182 19,126 19,310 17,126 23,307 19,310 Deferred income taxes 8,644 11,058 11,863 9,519 9,413 11,184 $ 1,280,171 $ 900,996 $ 1,348,819 $ 1,271,558 $ 155,411 $ 103,181 $ 150,711 $ 155,411 99,700 94,137 96,480 99,700 77,642 55,878 73,692 77,642 11,709 4,693 7,979 11,709 356 157 277 356 11,562 7,275 11,617 11,562 356,380 265,321 340,756 356,380 52,954 32,257 40,007 52,954 15,159 21,383 16,813 6,546 210,618 1,060 165,338 210,618 20,635 18,768 24,012 20,635 8,726 6,022 8,753 8,726 664,472 344,811 595,679 655,859 446,132 429,857 Common stock, no par value; 100,000 shares authorized; 65,223 and 65,437 shares issued and outstanding at September 30, 2016 and 2015, at stated amount, respectively 461,679 446,132 (22,365 ) 230 (36,169 ) (22,365 ) 188,611 125,875 323,571 188,611 612,378 555,962 749,081 612,378 3,321 223 4,059 3,321 615,699 556,185 753,140 615,699 $ 1,280,171 $ 900,996 $ 1,348,819 $ 1,271,558 Year ended September 30, Year ended September 30, 2015 2014 2013 2016 2015 2014 $ 160,049 $ 145,396 $ 117,349 $ 180,160 $ 160,049 $ 145,396 46,849 42,778 30,933 58,404 46,849 42,778 9,348 5,890 4,883 13,377 9,348 5,890 807 2,898 2,396 5,652 807 2,898 17,237 17,278 14,555 18,751 17,237 17,278 Gain on sale of business (6,880 ) — — (103,774 ) (144 ) (87,999 ) (51,986 ) (103,774 ) (144 ) (911 ) 2,056 (14,998 ) (5,590 ) (911 ) 2,056 (6,475 ) (2,540 ) (2,492 ) (2,027 ) (6,475 ) (2,540 ) (7,245 ) 2,254 (5,073 ) (398 ) (7,245 ) 2,254 44,351 (2,928 ) 31,453 (2,371 ) 44,351 (2,928 ) (3,157 ) 12,277 21,308 (869 ) (3,157 ) 12,277 47,948 2,841 6,304 (11,661 ) 47,948 2,841 9,134 (10,974 ) 2,034 (13,125 ) 9,134 (10,974 ) (7,944 ) (3,482 ) 285 (1,411 ) (7,944 ) (3,482 ) 206,217 213,600 120,938 180,026 206,217 213,600 (289,212 ) (2,670 ) (68,055 ) (46,651 ) (289,212 ) (2,670 ) (98,994 ) (36,262 ) (43,580 ) (6,155 ) (10,886 ) (18,596 ) 489 429 398 Purchases of property and equipment and capitalized software costs (46,391 ) (105,149 ) (47,148 ) Proceeds from the sale of a business 5,515 — — Other 424 489 429 (393,872 ) (49,389 ) (129,833 ) (87,103 ) (393,872 ) (49,389 ) (11,927 ) (12,187 ) (12,272 ) Cash dividends paid to MAXIMUS shareholders (11,701 ) (11,852 ) (12,187 ) (82,787 ) (111,141 ) (33,287 ) (33,335 ) (82,787 ) (111,141 ) 9,474 9,665 10,569 5,172 9,474 9,665 (12,451 ) (14,681 ) (8,868 ) (11,614 ) (12,451 ) (14,681 ) 868 1,362 2,168 546 868 1,362 330,993 15,000 — (121,611 ) (15,162 ) (172 ) (1,444 ) — — 111,115 (127,144 ) (41,862 ) Borrowings under credit facility 149,823 330,993 15,000 Repayment of credit facility and other long-term debt (195,200 ) (121,611 ) (15,162 ) Other (533 ) (75 ) — Expansion of credit facility — (1,444 ) — Cash (used in)/provided by financing activities (96,842 ) 111,115 (127,144 ) (6,900 ) (4,572 ) (12,938 ) (4,554 ) (6,900 ) (4,572 ) (83,440 ) 32,495 (63,695 ) Net (decrease)/increase in cash and cash equivalents (8,473 ) (83,440 ) 32,495 158,112 125,617 189,312 74,672 158,112 125,617 $ 74,672 $ 158,112 $ 125,617 $ 66,199 $ 74,672 $ 158,112 Common
Shares
Outstanding Common
Stock Accumulated
Other
Comprehensive
Income Retained
Earnings Noncontrolling
Interest Total 67,971 $ 395,967 $ 20,240 $ 34,899 $ (351 ) $ 450,755 — — — 116,731 618 117,349 — — (12,253 ) — — (12,253 ) — — — (12,272 ) — (12,272 ) — 583 — (583 ) — — (974 ) — — (32,525 ) — (32,525 ) — 14,555 — — — 14,555 — 10,569 — — — 10,569 203 6,425 — — — 6,425 — (14,996 ) — — — (14,996 ) 1,325 2,168 — — — 2,168 Total 68,525 415,271 7,987 106,250 267 529,775 68,525 $ 415,271 $ 7,987 $ 106,250 $ 267 $ 529,775 — — — 145,440 (44 ) 145,396 Net income/(loss) — — — 145,440 (44 ) 145,396 — — (7,757 ) — — (7,757 ) — — (7,757 ) — — (7,757 ) — — — (12,187 ) — (12,187 ) — — — (12,187 ) — (12,187 ) — 493 — (493 ) — — — 493 — (493 ) — — (2,672 ) — — (113,135 ) — (113,135 ) (2,672 ) — — (113,135 ) — (113,135 ) — 17,278 — — — 17,278 — 17,278 — — — 17,278 — 9,665 — — — 9,665 — 9,665 — — — 9,665 — (14,212 ) — — — (14,212 ) — (14,212 ) — — — (14,212 ) 760 1,362 — — — 1,362 760 1,362 — — — 1,362 66,613 429,857 230 125,875 223 556,185 66,613 429,857 230 125,875 223 556,185 — — — 157,772 2,277 160,049 — — — 157,772 2,277 160,049 — — (22,570 ) — — (22,570 ) — — (22,570 ) — — (22,570 ) — — (25 ) — — (25 ) — — (25 ) — — (25 ) — — — (11,852 ) (75 ) (11,927 ) — — — (11,852 ) (75 ) (11,927 ) — 397 — (397 ) — — — 397 — (397 ) — — (1,619 ) — — (82,787 ) — (82,787 ) (1,619 ) — — (82,787 ) — (82,787 ) — 17,237 — — — 17,237 — 17,237 — — — 17,237 — 9,474 — — — 9,474 — 9,474 — — — 9,474 — (11,701 ) — — — (11,701 ) — (11,701 ) — — — (11,701 ) 443 868 — — — 868 443 868 — — — 868 — — — — 896 896 — — — — 896 896 65,437 $ 446,132 $ (22,365 ) $ 188,611 $ 3,321 $ 615,699 65,437 446,132 (22,365 ) 188,611 3,321 615,699 Net income — — — 178,362 1,798 180,160 Foreign currency translation — — (13,828 ) — — (13,828 ) Interest rate hedge, net of income taxes — — 24 — — 24 Cash dividends — — — (11,701 ) (1,060 ) (12,761 ) Dividends on RSUs — 363 — (363 ) — — Repurchases of common stock (587 ) — — (31,338 ) — (31,338 ) Stock compensation expense — 18,751 — — — 18,751 Stock compensation tax benefit — 5,172 — — — 5,172 Tax withholding related to RSU vesting — (9,285 ) — — — (9,285 ) Stock option exercises and RSU releases 373 546 — — — 546 Balance at September 30, 2016 65,223 $ 461,679 $ (36,169 ) $ 323,571 $ 4,059 $ 753,140 2014 and 2013
2014(a) provides business process services (BPS) tois a leading operator of government health and human services agencies in the United States and to foreign governments. programs worldwide.BPS,business process services, appeals and assessments as well as related consulting services, for state, provincial and national government programs, includingprograms. These services support Medicaid, CHIPthe Children's Health Insurance Program (CHIP) and the ACAAffordable Care Act (ACA) in the United States,U.S., Health Insurance BC (British Columbia) in Canada, and the Health Assessment Advisory Service (HAAS) and Fit for Work Service in the United Kingdom.system development, software developmentbusiness process services and program management for variouslarge government programs, independent health review and appeals services for both the U.S. Federal Government and similar state-based programs and technology solutions for civilian U.S. federal programs. agencies.countylocal human services agencies with a variety of business process services and related consulting services for welfare to work, child support, higher education and K-12 special educationgovernment programs.(b) (c) and valuation of acquisition-related contingent consideration liabilities.(d) liabilities and income taxes.including:•performance-based criteria, constituting approximately 44% ofwith total revenue contributions in fiscal year 2015;•(29%(33%);•(21%(18%); and•(6%(7%).MAXIMUS, Inc.Notes to Consolidated Financial Statements (Continued)For the years ended September 30, 2015, 2014 and 20131. Business and summary of significant accounting policies (Continued)goal.obligation. This revenue generally occurs when amounts are billable to customers and may result in revenue being recognized in irregular increments. In certain performance-based contracts, we may negotiate arrangements where we are reimbursed at higher levels at the beginning of an arrangement. Where we believe the rates in the latter part of the contract represent a significant and incremental discount to the customer, we recognize revenue at an average per-transaction rate. This results in a deferred revenue balance and requires us to estimate future volumes over the life of an arrangement. Adjustments to estimates of future volumes result in adjustments to revenue.fixed.MAXIMUS, Inc.Notes to Consolidated Financial Statements (Continued)For the years ended September 30, 2015, 2014 and 20131. Business and summary of significant accounting policies (Continued) In May 2014,issued(FASB).continuing to evaluateevaluating the effect of thisthe standard on our business.revenue.(e) In February 2016, the FASB issued ASU No. 2016-02, Leases. The new standard will change the manner in which we will present our leasing arrangements. This standard will be effective during our 2020 fiscal year; however, early adoption is permitted. We are evaluating the effect of the standard.TheThese restricted cash balance was $13.4balances totaled $14.1 million and $10.6$13.4 million at September 30, 2016 and 2015, and 2014, respectively.(f) Accounts receivable receivables. Billed receivables are balances includes both those balances invoicedwhere an invoice has been prepared and those where amounts are readyissued and is collectible under standard contract terms.invoicedprepared on a monthly basis. Where a significant amount of information needs to be collected prior to billing, it may not be possible to have an invoice prepared, reviewed and issued as of a period end. Where we anticipate that an invoice will be issued within a short period of time and where the funds are considered collectible from within standard contract terms. We record our receivableterms, we include this balance as billable accounts receivable.(g) valued using a third-party consultant.recorded at fair value. These assets are amortized on a straight-line basis over useful lives estimated at the time of the business combination.MAXIMUS, Inc.Notes to Consolidated Financial Statements (Continued)For the years ended September 30, 2015, 2014 and 20131. Business and summary of significant accounting policies (Continued)At July 1, 2015, weWe performed the annual impairment test, as of July 1, 2016, and determined that there had been no impairment of goodwill. In performing this assessment, we utilized an income approach. Such an approach requires estimation of future operating cash flows including business growth, utilization of working capital and discount rates. The valuation of the business as a whole is compared to our market value at the date of the test in order to verify the calculation.(h) 39.539 years for our buildings and seven years for office furniture and equipment. Leasehold improvements are amortized over the shorter of their useful life or the remaining term of the lease. Repairs and maintenance costs are expensed as incurred.amortizeddepreciated using the straight-line method over the estimated useful life of the software, ranging from three to eight years. Costs incurred for upgrades and enhancements that do not result in additional functionality are expensed as incurred.provided. All these assets are depreciated on aprovided using the straight-line basis.2015.(i) 2016.2014 and 20131. Business and summary of significant accounting policies (Continued)(j) income and are typically immaterial.(k) income.(l) value.value under the heading of "Deferred Compensation Plan Assets". These assets have quoted prices in active markets.markets (Level 1). See Note 13"Note 13. Employee benefit plans and deferred compensation" for further details. During 2015, we entereda derivative arrangementarrangements to reduce our exposure to interest rate fluctuations on our credit facility. The related liabilityfair value of less than $0.1 million is recorded on our balance sheetthis derivative instrument was negligible at fair value.September 30, 2016. The inputs to calculate this balance are based upon prices and other factors which are observable in similar markets.markets (Level 2). See Note 6"Note 6. Debt" for further details. In 2010, we acquired DeltaWare Systems, Inc. As part ofprice, we agreed to pay contingent consideration based upon future sales of this business. Thisdate. The related liability is recorded on our consolidated balance sheet as a long-term liability at estimated fair value.value and updated on a quarterly basis. The valuation of this assetliability is derived from internal estimates of futureobservable.observable (Level 3). See Note 5"Note 5. Business combinations and disposal" for further details.MAXIMUS, Inc.Notes to Consolidated Financial Statements (Continued)For the years ended September 30, 2015, 2014 and 20131. Business and summary of significant accounting policies (Continued)(m) Reclassifications Certain financial results have been reclassified to conform to the current year presentation. We have made changes to our segment presentation. See Note 2. "Business segments" for more information. The Companyorganized and managed based upon the services it provides. As our business changes, we revise our internal reporting andconsistent with the manner in which our Chief Executive Officer operates and reviews the results of ourthe business. This reporting forms the basis for our external reporting of our business segments. During the fourth quarter of fiscal year 2015, we revised our reporting structure to accommodate three business segments, adding a U.S. Federal Services Segment that comprises the work we perform for the U.S. Federal Government, as well as some U.S.-based appeals work. The businesses within this new segment were previously included within our Health Services Segment and include the results of the businesses acquired with Acentia, LLC (Acentia) in April 2015. We made these changes to our operations and internal reporting due to our acknowledgement that the U.S. Federal Government is a distinct customer with different procurement methods and regulations, the scale of our business with the U.S. Federal Government and the growth of our federal business from a primarily health-focused business to a broader business covering several federal agencies.the corporate category, which primarily consist ofother categories, including amortization of intangible assets, and the direct costs of acquisitions.acquisitions and the gain on sale of the K-12 Education business. These corporate costs are excluded from measuring each segment's operating performance. We also transferred a small division from our Health Services Segment to our Human Services Segment.MAXIMUS, Inc.Notes to Consolidated Financial Statements (Continued)For the years ended September 30, 2015, 2014 and 20132. Business segments (Continued)20152016 are shown below (in thousands). These results are presented for all years on a basis consistent with our existing business segments. Year ended September 30, Year ended September 30, 2015 2014 2013 2016 2015 2014 $ 1,109,238 $ 906,650 $ 691,565 $ 1,298,304 $ 1,109,238 $ 906,650 502,484 341,840 167,258 591,728 502,484 341,840 488,099 452,422 472,456 513,328 488,099 452,422 $ 2,099,821 $ 1,700,912 $ 1,331,279 $ 2,403,360 $ 2,099,821 $ 1,700,912 $ 254,108 $ 213,728 $ 172,336 $ 292,181 $ 254,108 $ 213,728 118,646 110,793 73,694 138,168 118,646 110,793 139,963 127,602 140,003 131,842 139,963 127,602 $ 512,717 $ 452,123 $ 386,033 $ 562,191 $ 512,717 $ 452,123 $ 99,815 $ 98,172 $ 83,131 $ 107,155 $ 99,815 $ 98,172 59,252 47,695 31,128 74,792 59,252 47,695 79,719 74,444 78,970 84,157 79,719 74,444 6 614 598 2,155 6 614 $ 238,792 $ 220,925 $ 193,827 $ 268,259 $ 238,792 $ 220,925 Operating income: $ 154,293 $ 115,556 $ 89,205 $ 185,026 $ 154,293 $ 115,556 59,394 63,098 42,566 63,376 59,394 63,098 60,244 53,158 61,033 47,685 60,244 53,158 (9,348 ) (5,890 ) (4,883 ) (13,377 ) (9,348 ) (5,890 ) (4,745 ) — (2,168 ) (832 ) (4,745 ) — Gain on sale of a business 6,880 — — (6 ) (614 ) (598 ) (2,155 ) (6 ) (614 ) $ 259,832 $ 225,308 $ 185,155 $ 286,603 $ 259,832 $ 225,308 Operating income as a percentage of revenue: Health Services 14.3 % 13.9 % 12.7 % U.S. Federal Services 10.7 % 11.8 % 18.5 % Human Services 9.3 % 12.3 % 11.7 % Total 11.9 % 12.4 % 13.2 % $ 27,694 $ 23,994 $ 14,768 $ 31,916 $ 27,694 $ 23,994 10,363 9,557 3,355 9,953 10,363 9,557 8,792 9,227 12,810 16,535 8,792 9,227 $ 46,849 $ 42,778 $ 30,933 $ 58,404 $ 46,849 $ 42,778 and HML in 2013, as well as any unsuccessful transactions.United States,U.S., the United Kingdom,U.K., Australia, Canada and Saudi Arabia and New Zealand.Arabia.MAXIMUS, Inc.Notes to Consolidated Financial Statements (Continued)For the years ended September 30, 2015, 2014 and 20132. Business segments (Continued) Year ended September 30, Year ended September 30, 2015 2014 2013 2016 2015 2014 $ 1,559,769 $ 1,306,026 $ 999,419 $ 1,721,261 $ 1,559,769 $ 1,306,026 267,702 128,363 65,718 384,649 267,702 128,363 178,167 170,727 157,383 200,539 178,167 170,727 94,183 95,796 108,759 96,911 94,183 95,796 $ 2,099,821 $ 1,700,912 $ 1,331,279 $ 2,403,360 $ 2,099,821 $ 1,700,912 Year Ended
September 30, Year Ended
September 30, 2015 2014 2016 2015 $ 483,215 $ 415,821 $ 543,361 $ 482,560 441,521 95,367 440,006 441,521 189,855 152,243 153,141 186,406 165,580 237,565 212,311 161,071 $ 1,280,171 $ 900,996 $ 1,348,819 $ 1,271,558 Year Ended
September 30, Year Ended
September 30, 2015 2014 2016 2015 $ 120,130 $ 93,500 $ 118,751 $ 120,130 33,591 8,769 38,852 33,591 19,720 27,043 16,209 19,720 16,141 7,731 11,086 16,141 41 63 117 41 $ 189,623 $ 137,106 $ 185,015 $ 189,623 United States.U.S. Revenue from foreign projects and offices was 26%28%, 23%26% and 25%23% of total revenue for the years ended September 30, 2016, 2015 and 2014, and 2013, respectively.MAXIMUS, Inc.Notes to Consolidated Financial Statements (Continued)For the years ended September 30, 2015, 2014 and 20133. Concentrations of credit risk and major customers (Continued)2015,2016, approximately 50%46% of our total revenue was derived from state government agencies, many of whose programs received significant federal funding, 22%26% from foreign government agencies, 20%22% from U.S.-based Federal Government agencies, and 8%6% from other sources including local municipalities and commercial customers. We believe that the credit risk associated with our receivables is limited due to the credit worthiness of these customers.2015,2016, the U.S. Federal Government, the U.K. Government and the state of New York each provided more than 10% of our annual revenue. Revenue from the U.S. Federal Government was exclusively within the U.S. Federal Segment. Revenue from the U.K. Government was both within the Health Services and Human Services Segments. Revenue from the state of New York was exclusively within our Health Services Segment. The proportion of revenue recognized from customers providing in excess of 10% of our consolidated revenue for each of the three years ended September 30, 20152016 was from the following governments: Year ended
September 30, 2016 2015 2014 U.S. Federal Government 22 % 20 % 17 % United Kingdom 16 % * * New York 12 % 10 % * Australia * * 10 % California * * 10 % Texas * * 10 % * Government provided less than 10% of our consolidated revenue in this year. Year ended
September 30, 2015 2014 2013 20 % 17 % 12 % 10 % * * * 10 % 12 % * 10 % * * 10 % 14 % *Government provided less than 10% of our consolidated revenue in this year. Year ended September 30, 2015 2014 2013 66,682 67,680 68,165 593 1,407 1,728 67,275 69,087 69,893 Year ended September 30, 2016 2015 2014 Weighted average shares outstanding 65,822 66,682 67,680 Effect of employee stock options and unvested restricted stock awards 407 593 1,407 Denominator for diluted earnings per share 66,229 67,275 69,087 yearyears ended September 30, 2016, 2015 and 2014, 21,000, 15,000 and 286,000 unvested restricted stock units, respectively, have been excluded from the calculation of diluted earnings per share as the effect of including them would have been anti-dilutive.TableContents
MAXIMUS, Inc.2014 and 20135. Business combinations(Amounts in thousands) Purchase price allocation Cash consideration, net of cash acquired $ 44,069 Billed and unbilled receivables $ 4,069 Other assets 407 Property and equipment and other assets 707 Intangible assets 22,300 Total identifiable assets acquired 27,483 Accounts payable and other liabilities 1,414 Deferred revenue 554 Total liabilities assumed 1,968 Net identifiable assets acquired 25,515 Goodwill 18,554 Net assets acquired $ 44,069 (Dollars in thousands) Useful life Fair value Customer relationships 19 years $ 20,400 Technology-based intangible assets 8 years 1,700 Trade name 1 year 200 Total intangible assets $ 22,300 atas of the acquisition date with the exception of balances relating to current and deferred taxes (in thousands).As of Updated through Updated through
June 30, 2015 Adjustments Updated through
September 30, 2015 September 30, 2015 Adjustments September 30, 2016 $ 292,815 $ 689 $ 293,504 $ 293,504 $ — $ 293,504 $ 35,060 $ 273 $ 35,333 35,333 — 35,333 5,151 (101 ) 5,050 5,050 (1,959 ) 3,091 1,619 521 2,140 2,140 — 2,140 69,900 — 69,900 69,900 — 69,900 111,730 693 112,423 112,423 (1,959 ) 110,464 32,619 (193 ) 32,426 32,426 (1,076 ) 31,350 251 — 251 251 — 251 — 567 567 567 — 567 Deferred tax liabilities — 6,741 6,741 32,870 374 33,244 33,244 5,665 38,909 78,860 319 79,179 79,179 (7,624 ) 71,555 213,955 370 214,325 214,325 7,624 221,949 $ 292,815 $ 689 $ 293,504 $ 293,504 $ — $ 293,504 $150$175 million of the goodwill balance is anticipated to be deductible for tax purposes. During the year ended September 30, 2015, Acentia contributed $104.0 million and $8.9 million of revenue and operating income, respectively.MAXIMUS, Inc.Notes to Consolidated Financial Statements (Continued)For the years ended September 30, 2015, 2014 and 20135. Business combinations (Continued) The following table presents certain results for the years ended September 30, 2015 and 2014 as though the acquisition of Acentia had occurred on October 1, 2013. The unaudited pro forma information is presented for informational purposes only and is not necessarily indicative of our results if the acquisition had taken place on that date. The pro forma results presented below include amortization charges for acquired intangible assets and adjustments to interest expense incurred and exclude related acquisition expenses (in thousands, except per share data). Unaudited
pro forma
results for the
year ended
September 30, 2015 2014 $ 2,203,347 $ 1,912,423 165,822 155,589 $ 2.48 $ 2.30 $ 2.44 $ 2.25 Remploywill beis being amortized over two years on a straight-line basis.will beare being amortized over the anticipated lives of the customer relationships, which are approximately four years.
Acquisition related contingent considerationTableContentsMAXIMUS, Inc.Notesbusinesses which we have acquired based upon events which may occur subsequent to Consolidated Financial Statements (Continued)For the years ended September 30, 2015, 2014 and 20135. Business combinations (Continued)Health Management Limited On July 1, 2013 (the "HMLacquisition. At the date of acquisition, date"), we acquired 100%include an estimate of the share capitalfair value of Health Management Limited (HML) for total consideration of $77.9 million (£51.1 million). The consideration was comprised of $71.4 million (£46.9 million) in cash and 202,972 shares of MAXIMUS stock worth $6.4 million (£4.2 million). HML provides independent health assessments within the U.K. We acquired HML, among other reasons, to expand the Company's independent medical assessment business and to establish a strong presence in the U.K. health services market. The acquired assets and business have been integrated into our Health Services Segment. We allocated the acquisition pricethese liabilities at that time. Subsequent changes to the fair value of the assets and liabilities of HML at the HML acquisition date. The assets and liabilities of HMLare recorded in our financial statements at theconsolidated statement of operations. date are summarized below (in thousands): HML balance sheet on
HML acquisition date $ 71,435 6,425 $ 77,860 $ 7,671 1,382 2,752 20,542 32,347 6,228 1,149 756 4,701 12,834 19,513 58,347 $ 77,860 The difference between the HML acquisition date fair value of the consideration and the estimated fair value of the net assets acquired was recorded as goodwill. We consider the goodwill to represent benefits that are expected to be realized as a result of the business combination, including, but not limited to, the assembled workforce and the benefit of the enhanced knowledge and capabilities of HML. Goodwill is not deductible for tax purposes.MAXIMUS, Inc.Notes to Consolidated Financial Statements (Continued)For the years ended September 30, 2015, 2014 and 20135. Business combinations (Continued) The valuation of the intangible assets acquired is summarized below (in thousands). Useful life Fair value 20 years $ 19,933 2 years 609 $ 20,542 The weighted average amortization period was 19.5 years.DeltaWare Systems, Inc. On February 10, 2010 (the "DeltaWare acquisition date"), we acquired 100% of the share capital of DeltaWare Systems, Inc. (DeltaWare). As partin 2010, we agreed to make payments of the acquisition agreement, we must pay the former owners of DeltaWare up to $4.0 million (Canadian). These payments, considered contingent consideration, will be if we made based upon sales of DeltaWare's products in particular geographic markets prior to December 31, 2016. No such sales have been made to datemade. At both September 30, 2016 and the likelihood of future sales between this time and December 2016 is considered low. During fiscal year 2015, we have reducedrecorded no liability for this potential obligation.estimateacquisition of our obligationAssessments Australia, we agreed to zero. We reviewpay an additional $0.5 million the likelihoodsellers of future sales onAssessments Australia if sufficient contracts with a quarterly basisspecific government agency are won by MAXIMUS prior to December 2022. Upon acquisition and toat September 30, 2016, we have reported a liability of $0.4 million.extent that sales opportunities are identified, proposals submitted or contracts won, we update our probability weighted assessmentfair value of payment. Changes in this assessment result in an expense or credit to earnings. Thethe contingent consideration payable for any single contract signed would beare based upon the populationprobability-weighted assessments of the area served but would be capped at $1.0 million (Canadian) per sale.likely future sales. As thethese inputs required for the valuation of this liability require significant judgment, they are considered to be Level 3 inputs under the Financial Accounting Standards Board'sFASB's classification of assets and liabilities subject to fair value measurement. The effect on the financial statements is summarized below (in thousands): Contingent
consideration $ 358 (302 ) (56 ) $ — MAXIMUS, Inc.Notes to Consolidated Financial Statements (Continued)For the years ended September 30, 2015, 2014 and 2013 On March 9, 2015, we entered into an amendment to our unsecured (the "Credit Agreement"). The Credit Agreement, as amended, provides for a revolving line of credit up to $400 million that may be used for revolving loans, swingline loans (subject to a sublimit of $5 million), and to request letters of credit, subject to a sublimit of $30 million. The line of credit is available for general corporate purposes, including working capital, capital expenditures and acquisitions. Borrowings are permitted in currencies other than the U.S. Dollar. The arrangementcredit agreement will terminate on March 9, 2020, at which time all outstanding borrowings must be repaid. On April 1, 2015, we borrowed $225 million under the Credit Agreement in order to fund our acquisition of Acentia. Additional borrowings and repayments were subsequently made to fund working capital and capital expenditure requirements. The Credit Agreement permits us to make borrowings in currencies other than the United States Dollar. At September 30, 2015,2016, we havehad U.S. Dollar borrowings of $202 million and Canadian Dollar borrowings of $7.7 million (10.3 million Canadian Dollars). $164.7 million.Credit Facility,credit agreement, we have an outstanding loan of $0.9$0.8 million (1.2(1.0 million Canadian Dollars) with the Atlantic Innovation Fund of Canada. There is no interest charge on this loan. The Atlantic Innovation Fund loan is repayable over 2723 remaining quarterly installments.2015,2016, we held three letters of credit under the Credit Agreementour credit agreement totaling $0.8$5.2 million. Each of these letters of credit may be called by customers or vendors in the event that the Company defaults under the terms of a contract, the probability of which we believe is remote. In addition, two letters of credit totaling $3.0 million, secured with restricted cash balances, are held with another financial institution to cover similar obligations to customers. The Credit Agreement2015.2016. Our obligations under the Credit Agreementcredit agreement are guaranteed by material domestic subsidiaries of the Company. The Credit Facility is currentlyCompany, but are otherwise unsecured. In the event that our total leverage ratio, as defined in the credit agreement, exceeds 2.52.5:1, we would be obliged to 1,provide security in the Credit Agreement will become secured byform of the assets of the parent companyCompany and certain of its subsidiaries. Our credit agreement contains no restrictions on the payment of dividends as long as our leverage ratio does not exceed 2.5:1. At September 30, 2015,2016, our total leverage ratio was less than 1.0:1.0.2015,2016, interest accrued at a rate of 1.19%1.55%.MAXIMUS, Inc.Notes to Consolidated Financial Statements (Continued)For the years ended September 30, 2015, 2014 and 20136. Debt (Continued)enteredenter into a derivative arrangement to fix payments on part of our outstanding loan balance. We willagree to pay a fixed rate of interest to a financial institution and receive a balance equivalent to the floating rate payable. At September 30, 2015,2016, payments on $53.3$42.0 million of our principal balance are fixed. The principal balance subject to this derivative arrangement will decline through SeptemberJune 30, 2016.2015,2016, the fair value of this derivative instrument was less than $0.1 million and included in accounts payable and accrued liabilities in the consolidated balance sheets.negligible. As this cash flow hedge is considered effective, the loss related to the decline in the fair value of this derivative instrument is reported in Accumulated Other Comprehensive Incomeaccumulated other comprehensive income (AOCI) in the Statementconsolidated statement of Comprehensive Income.2015,2016, we made interest payments of $1.2$3.7 million.Capital Leases As of September 30, 2015, we recorded capital lease obligations of $0.4 million, which represent liabilities due under capital leases for fixed assets acquired with Acentia. The gross amount of assets recorded under capital leases was $0.5 million with accumulated amortization of $0.2 million as of September 30, 2015.The future minimum lease payments required to be made under the capital leases as of September 30, 2015 are approximately $0.2 million per fiscal year for the next two years.20152016 and 20142015 are as follows (in thousands): Health
Services U.S. Federal
Services Human
Services Total $ 118,897 $ 6,199 $ 46,771 $ 171,867 31 — — 31 (207 ) — (1,065 ) (1,272 ) 118,721 6,199 45,706 170,626 — 214,325 — 214,325 (5,294 ) — (3,355 ) (8,649 ) $ 113,427 $ 220,524 $ 42,351 $ 376,302 Total Balance as of September 30, 2014 $ 118,721 $ 6,199 $ 45,706 $ 170,626 Goodwill acquired with Acentia — 214,325 — 214,325 Foreign currency translation (5,294 ) — (3,355 ) (8,649 ) Balance as of September 30, 2015 113,427 220,524 42,351 376,302 Acquisitions of Ascend and Assessments Australia, respectively 18,554 — 2,899 21,453 Adjustment to goodwill acquired with Acentia — 7,624 — 7,624 Disposal of K-12 Education business — — (224 ) (224 ) Foreign currency translation (8,302 ) — 705 (7,597 ) Balance as of September 30, 2016 $ 123,679 $ 228,148 $ 45,731 $ 397,558 into our goodwill.MAXIMUS, Inc.Notes to Consolidated Financial Statements (Continued)For the years ended September 30, 2015, 2014 and 20137. Goodwill and intangible assets (Continued) As of September 30, 2015 As of September 30, 2014 As of September 30, 2016 As of September 30, 2015 Cost Accumulated
Amortization Intangible
Assets, net Cost Accumulated
Amortization Intangible
Assets, net Cost Cost $ 114,736 $ 15,100 $ 99,636 $ 42,403 $ 7,821 $ 34,582 $ 132,221 $ 26,238 $ 105,983 $ 114,736 $ 15,100 $ 99,636 Technology-based intangible assets 6,967 4,613 2,354 8,665 7,354 1,311 4,277 2,866 1,411 4,374 2,102 2,272 4,487 3,797 690 4,277 2,866 1,411 8,665 7,354 1,311 9,295 6,910 2,385 $ 127,678 $ 25,320 $ 102,358 $ 56,072 $ 16,833 $ 39,239 $ 143,675 $ 34,648 $ 109,027 $ 127,678 $ 25,320 $ 102,358 The intangible assets include $4.0 million of fully amortized technology-based assets still in use. 12.513.1 years, comprising 12.813.3 years for customer contracts and relationships, 2.05.5 years for technology-based intangible assets and 1.2 years for trademarks and trade names and 2.5 years for technology-based intangible assets.names. Estimated future amortization expense is estimated for the following five fiscal years ending September 30th as follows (in thousands): $ 12,619 11,045 8,797 7,943 6,848 2017 $ 12,234 2018 10,031 2019 9,151 2020 8,054 2021 7,192 As of September 30, As of September 30, 2015 2014 2016 2015 $ 1,738 $ 1,738 $ 1,738 $ 1,738 11,716 11,707 11,726 11,716 245,577 177,939 261,752 245,577 39,569 23,124 52,493 39,569 298,600 214,508 327,709 298,600 (160,770 ) (134,262 ) (196,140 ) (160,770 ) $ 137,830 $ 80,246 $ 131,569 $ 137,830 Fixed asset depreciationand 2013 was $49.2 million, $37.0 million and $32.9 million, and $26.3 million, respectively. In fiscal year 2015, the net assets and expense relating to assets held under capital leases were $0.4 million and $0.2 million, respectively.MAXIMUS, Inc.Notes to Consolidated Financial Statements (Continued)For the years ended September 30, 2015, 2014 and 2013 As of September 30, 2015 2014 $ 73,584 $ 72,758 (41,101 ) (33,024 ) $ 32,483 $ 39,734 As of September 30, 2016 2015 Capitalized software $ 80,646 $ 73,584 Less: Accumulated amortization (50,507 ) (41,101 ) Capitalized software, net $ 30,139 $ 32,483 Capitalized software amortizationand 2013 was $9.9$9.2 million, $9.9 million and $4.6$9.9 million, respectively. Deferred contract costs consist of contractually recoverable direct set-up costs relating to long-term service contracts. These costs include direct and incremental costs incurred prior to the commencement of us providing contracted services to our customers. These costs are expensed over the period the services are provided. As of September 30, 2015 2014 $ 27,282 $ 25,489 (8,156 ) (13,443 ) $ 19,126 $ 12,046 As of September 30, 2016 2015 Deferred contract costs $ 30,114 $ 27,282 Less: accumulated amortization (11,932 ) (8,156 ) Total deferred contract costs, net $ 18,182 $ 19,126 Billed and unbilled receivables current billed, billable and unbilled accounts receivable were as follows (in thousands): Year ended September 30, Year ended September 30, 2015 2014 2013 2016 2015 2014 $ 3,138 $ 3,828 $ 3,975 $ 3,385 $ 3,138 $ 3,828 2,690 1,767 2,334 2,335 2,690 1,767 (2,443 ) (2,457 ) (2,481 ) (1,494 ) (2,443 ) (2,457 ) $ 3,385 $ 3,138 $ 3,828 $ 4,226 $ 3,385 $ 3,138 MAXIMUS, Inc.Notes to Consolidated Financial Statements (Continued)For the years ended September 30, 2015, 2014 and 201311. Billed and unbilled receivables (Continued)and 2014, $12.1$16.2 million and $8.8$12.1 million of our unbilled receivables related to amounts pursuant to contractual retainage provisions. We anticipate that the majority of the fiscal 20152016 balance will be collected during the 20162017 fiscal year.2015,2016, we had performance bond commitments totaling $27.3$23.0 million. These bonds are typically renewed annually and remain in place until the contractual obligations have been satisfied. Although the triggering events vary from contract to contract, in general we would only be liable for the amount of these guarantees in the event of default in our performance of our obligations under each contract, the probability of which we believe is remote.and 2013 was $75.4 million, $67.1 million $61.8 million and $49.0$61.8 million, respectively. Sublease income for the year ended September 30, 20152016 was $0.5$1.1 million. Our operating leases may contain rent escalations or concessions. Lease expense is recorded on a straight-line basis over the life of the respective lease.20152016 are as follows (in thousands): Office space Equipment Total $ 66,172 $ 4,720 $ 70,892 Office space Equipment Total Year ending September 30, 52,745 4,131 56,876 $ 66,200 $ 4,475 $ 70,675 37,475 3,417 40,892 46,185 3,779 49,964 27,004 2,689 29,693 34,604 3,137 37,741 16,971 1,534 18,505 20,670 1,910 22,580 2021 4,089 13 4,102 4,919 — 4,919 2,330 2 2,332 $ 205,286 $ 16,491 $ 221,777 $ 174,078 $ 13,316 $ 187,394 Acquired loss-making contract As part of the acquisition of PSI in April 2012, we acquired a systems-integration contract that was anticipated to record significant future losses. The fair value of the obligation to provide these services at a loss was calculated and recorded on our balance sheet at acquisition as deferred revenue of $15.1 million.MAXIMUS, Inc.Notes to Consolidated Financial Statements (Continued)For the years ended September 30, 2015, 2014 and 201312. Commitments and contingencies (Continued) The contract was an arrangement that included both significant production and customization of software as well as postcontract customer support for these services. As we were unable to estimate the costs of providing these services, management deferred all revenue and costs related to service in anticipation of recognizing revenue at the commencement of the postcontract customer support services. In February 2013, we received a formal notice of termination for convenience for this contract. The work was terminated as part of a broad, state-wide initiative to focus resources on a select number of projects. At the termination of this agreement, we reimbursed the client for certain funds received and undertook to provide future services. All other obligations to provide services have been extinguished and no material future costs will be incurred. Accordingly, revenue of $16.0 million was recognized in the year ended September 30, 2013. In addition, costs of $5.1 million, including costs which had been deferred, were recognized in the same period for an operating profit of $10.9 million.Employment agreements We have an employment agreement with our Chief Executive Officer with a term ending in April 2018.18%16% of our employees are covered by collective bargaining agreements or similar arrangements.companyCompany match, specified companyCompany contributions and discretionary companyCompany contributions. During the years ended September 30, 2016, 2015 2014 and 2013,2014, we contributed $6.0 million, $4.7 million $4.3 million and $3.8$4.3 million to the 401(k) plans, respectively.90%96% of the liabilities as of September 30, 2015.2016. The assets within the rabbi trust include $8.7$11.8 million invested in mutual funds which have quoted prices in active markets. These assets, as well as the related employee liabilities, are recorded at fair value with changes in fair value being recorded in the consolidated statement of operations.2015, 2.12016, 1.7 million shares remained available for grants under our 2011 Equity Incentive Plan. We typically issue new shares in satisfying our obligations under our stock plans.MAXIMUS, Inc.Notes to Consolidated Financial Statements (Continued)For the years ended September 30, 2015, 2014 and 201314. Equity (Continued)2014 and 2013,2014, compensation expense recognized related to RSUs was $18.8 million, $17.2 million and $17.3 million and $14.6 million,EmployeesAll individuals who are granted RSUs also receive dividend-equivalent payments in the form of additional RSUs. However, until the shares are issued, they have no voting rights and employees may not buybe bought or sell these RSUs.sold. In the event that an award is forfeited, the dividend-equivalent payments received by the holder with respect to that award are also forfeited.2015,2016, is as follows: Shares Weighted-Average
Grant-Date
Fair Value 1,884,901 $ 24.32 382,727 50.82 (1,376,096 ) 20.05 (29,992 ) 37.15 861,540 42.48 Shares Non-vested shares outstanding at September 30, 2015 861,540 $ 42.48 Granted 481,901 52.00 Vested (480,873 ) 43.08 Forfeited (53,262 ) 44.75 Non-vested shares outstanding at September 30, 2016 809,306 47.64 nonvestednon-vested shares, certain shareholders held approximately 0.80.9 million vested awards whose issuance has been deferred.2013 was $46.49, and $30.66, respectively. The total fair value of RSUs which vested during the years ended September 30, 2016, 2015 and 2014 and 2013 was $27.1 million, $68.6 million $38.7 million and $40.8$38.7 million, respectively. As of September 30, 2015,2016, the total remaining unrecognized compensation cost related to unvested RSUs was $33.1$38.5 million. This chargeexpense is expected to be realized over the next four years, with a weighted average life of 1.51.4 years.2015,2016, is as follows: Options Weighted Average
Exercise Price 260,000 $ 9.00 (100,000 ) 8.68 — — 160,000 9.18 Options Weighted Average
Exercise PriceOutstanding at September 30, 2015 160,000 $ 9.18 Exercised (80,000 ) 6.82 Outstanding and exercisable at September 30, 2016 80,000 11.55 MAXIMUS, Inc.Notes to Consolidated Financial Statements (Continued)For the years ended September 30, 2015, 2014 and 201314. Equity (Continued)20152016 was $8.1 million with a weighted average$3.6 million. All remaining life of 1.5 years. Year ended September 30, Year ended September 30, 2015 2014 2013 2016 2015 2014 $ 5,536 $ 5,698 $ 7,081 $ 4,077 $ 5,536 $ 5,698 868 1,362 2,168 546 868 1,362 incomeconsolidated statement of operations for share-based compensation arrangements was $7.4 million, $7.1 million $7.0 million and $5.2$7.0 million for the fiscal years ended September 30, 2016, 2015 and 2014, and 2013, respectively.2015,2016, our employees forfeited approximately 195,000162,016 shares in this manner, resulting in a liability of $11.6$9.3 million. Cash flows resulting from the tax benefits generated from tax deductions in excess of the compensation costs recognized for those options and RSUs (excess tax benefits) are classified as financing cash flows.2014 and 2013,2014, we repurchased 0.6 million, 1.6 million 2.7 million and 1.02.7 million common shares at a cost of $31.3 million, $82.8 million $113.1 million and $32.5$113.1 million, respectively. At September 30, 2015, $168.62016, $137.8 million remained available for future stock repurchases. We acquired0.30.5 million common shares at a cost of $14.4 million million between October 1,$24.0 million.November 16, 2015. Year ended September 30, Year ended September 30, 2015 2014 2013 2016 2015 2014 $ 232,359 $ 180,820 $ 139,716 $ 238,871 $ 232,359 $ 180,820 27,460 46,549 49,306 47,097 27,460 46,549 $ 259,819 $ 227,369 $ 189,022 $ 285,968 $ 259,819 $ 227,369 MAXIMUS, Inc.Notes to Consolidated Financial Statements (Continued)For the years ended September 30, 2015, 2014 and 201315. Income taxes (Continued) Year ended September 30, Year ended September 30, 2015 2014 2013 2016 2015 2014 $ 74,050 $ 55,656 $ 43,199 $ 69,025 $ 74,050 $ 55,656 15,332 12,003 11,257 15,595 15,332 12,003 9,581 11,416 14,821 15,536 9,581 11,416 98,963 79,075 69,277 100,156 98,963 79,075 2,233 1,750 2,741 7,778 2,233 1,750 403 181 851 902 403 181 (1,829 ) 967 (1,196 ) (3,028 ) (1,829 ) 967 807 2,898 2,396 5,652 807 2,898 $ 99,770 $ 81,973 $ 71,673 $ 105,808 $ 99,770 $ 81,973 Year ended September 30, Year ended September 30, 2015 2014 2013 2016 2015 2014 $ 90,937 $ 79,579 $ 66,158 $ 100,089 $ 90,937 $ 79,579 9,847 7,920 8,151 10,723 9,847 7,920 (2,208 ) (3,909 ) (3,715 ) (3,976 ) (2,208 ) (3,909 ) 1,602 1,286 708 1,284 1,602 1,286 (961 ) (1,623 ) (217 ) (1,592 ) (961 ) (1,623 ) — (962 ) — — — (962 ) 553 (318 ) 588 (720 ) 553 (318 ) $ 99,770 $ 81,973 $ 71,673 Provision for income taxes $ 105,808 $ 99,770 $ 81,973 2014 and 201315. Income taxes (Continued)20152016 and 20142015 are as follows (in thousands): As of September 30, 2015 2014 $ 12,320 $ 19,815 15,467 14,944 777 207 26 — 28,590 34,966 9,598 6,858 $ 18,992 $ 28,108 $ 139 $ 2,355 — — 139 2,355 9,127 7,089 4,600 4,100 10,429 1,662 441 7,828 24,736 23,034 22,061 20,261 9,781 12,057 6,353 10,045 — 1,762 759 — 941 292 $ 39,895 $ 44,417 $ 15,159 $ 21,383 As of September 30, 2016 2015 Net deferred tax assets/(liabilities) Costs deductible in future periods $ 27,738 $ 25,896 Deferred revenue 23,469 21,446 Stock compensation 5,085 4,600 Net operating loss carryforwards 1,291 1,356 Amortization of goodwill and intangible assets (34,484 ) (22,061 ) Capitalized software (10,126 ) (9,781 ) Accounts receivable - unbilled (13,810 ) (9,598 ) Property and equipment (5,517 ) (6,650 ) Other (1,815 ) (696 ) $ (8,169 ) $ 4,512 TableContentsMAXIMUS, Inc.Notes to Consolidated Financial Statements (Continued)For the years ended September 30, 2015, 2014offset. Accordingly, our presentation of deferred taxes on our consolidated balance sheet is split between jurisdictions which show a net deferred tax asset and 201315. Income taxes (Continued) As of September 30, 2016 2015 Balance of tax jurisdictions with net deferred tax assets $ 8,644 $ 11,058 Balance of tax jurisdictions with net deferred tax liabilities (16,813 ) (6,546 ) Net deferred tax assets/(liabilities) $ (8,169 ) $ 4,512 2015,2016, our foreign subsidiaries held approximately $190$218 million of cumulative earnings. We consider undistributed earnings of our foreign subsidiaries to be indefinitely reinvested outside of the United StatesU.S. and, accordingly, no U.S. deferred taxes have been recorded with respect to such earnings in accordance with the relevant accounting guidance for income taxes. Should the earnings be remitted as dividends, we may be subject to additional U.S. taxes, net of allowable foreign tax credits. It is not practicable to estimate the amount of any additional taxes which may be payable on the undistributed earnings given the various tax planning alternatives we could employ should we decide to repatriate these earnings in a tax-efficient manner. We had $2.1 million and $4.5 million of net operating loss carryforwards in the U.S. at September 30, 2015 and 2014, respectively. These balances resulted in deferred tax assets of $0.7 million and $2.4 million, respectively, and relate exclusively to the losses held by PSI prior to the acquisition in 2012. Although our ability to use these loss carryforwards will be restricted to an annual allowance, we have sufficient profits and time within the jurisdictions where losses have arisen to ensure that these losses will be utilized in full through fiscal year 2017. Accordingly, no reserve has been recorded against these balances. These net operating loss carryforwards expire between 2027 and 2031. We had $0.4 million and $0.8 million of net operating loss carryforwards in Canada at September 30, 2015 and 2014, respectively, resulting in deferred tax assets of $0.1 million and $0.2 million. These net operating loss carryforwards expire through 2027 to 2031.and 2013 was $108.3 million, $81.3 million and $79.4 million, and $58.2 million, respectively.$1.0$1.1 million and $1.1$1.0 million at September 30, 20152016 and 2014,2015, respectively. The total amount of unrecognized tax benefits that, if recognized, would affect our annual effective income tax rate was $1.1 million and $1.0 million at September 30, 2015.2014 and 2013,2014, we recognized interest expense relating to unrecognized tax benefits of less than $0.1 million in each year. The net liability balance at September 30, 20152016 and 20142015 includes approximately $0.5$0.6 million of interest and penalties.MAXIMUS, Inc.Notes to Consolidated Financial Statements (Continued)For the years ended September 30, 2015, 2014 and 201315. Income taxes (Continued) Year Ended September 30, Year ended September 30, 2015 2014 2013 2016 2015 2014 $ 812 $ 812 $ 1,059 $ 529 $ 812 $ 812 (200 ) — (230 ) — (200 ) — (83 ) — (17 ) (81 ) (83 ) — $ 529 $ 812 $ 812 $ 448 $ 529 $ 812 20122013 and to state and local income tax examinations by tax authorities for years before 2010.2011. In international jurisdictions, similar rules apply to filed income tax returns, although the tax examination limitations and requirements may vary. We are no longer subject to audit by tax authorities for foreign jurisdictions for years prior to 2010.20152016 and 2014.2015. We derived this information from unaudited quarterly financial statements that include, in the opinion of our management, all adjustments necessary for a fair presentation of the information for such periods. Results of operations for any fiscal quarter are not necessarily indicative of results for any future period.MAXIMUS, Inc.Notes to Consolidated Financial Statements (Continued)For the years ended September 30, 2015, 2014 and 201316. Quarterly information (unaudited) (Continued) Quarter Ended Quarter Ended Dec. 31,
2014 March 31,
2015 June 30,
2015 Sept. 30,
2015 Dec. 31,
2015 March 31,
2016 June 30,
2016 Sept. 30,
2016 (In thousands, except per share data) (In thousands, except per share data) $ 243,570 $ 270,918 $ 298,549 $ 296,201 $ 291,903 $ 330,567 $ 333,699 $ 342,135 107,729 99,465 141,011 154,279 145,285 150,191 149,601 146,651 115,744 111,411 132,741 128,203 119,534 125,695 133,794 134,305 $ 467,043 $ 481,794 $ 572,301 $ 578,683 $ 556,722 $ 606,453 $ 617,094 $ 623,091
$
59,847
$
69,873
$
69,813
$
54,575 $ 51,972 $ 82,717 $ 76,775 $ 80,717 25,568 22,014 34,780 36,284 28,238 33,421 38,980 37,529 33,852 32,458 39,205 34,448 30,005 31,529 35,624 34,684 $ 119,267 $ 124,345 $ 143,798 $ 125,307 $ 110,215 $ 147,667 $ 151,379 $ 152,930
$
37,840
$
41,476
$
44,470
$
30,507 $ 26,808 $ 56,914 $ 50,430 $ 50,874 13,318 9,637 15,536 20,903 10,716 14,983 19,119 18,558 16,153 13,935 16,803 13,353 9,107 9,794 14,251 14,533 (1,475 ) (1,432 ) (3,275 ) (3,166 ) (3,149 ) (3,262 ) (3,517 ) (3,449 ) (600 ) (1,514 ) (2,459 ) (172 ) (46 ) (529 ) — (257 ) Gain on sale of a business — — 6,453 427 (5 ) (95 ) (8 ) 102 (650 ) — (2,127 ) 622 $ 65,231 $ 62,007 $ 71,067 $ 61,527 $ 42,786 $ 77,900 $ 84,609 $ 81,308
42,350
39,028
42,259
36,412 26,882 49,341 52,750 51,187 41,861 38,808 41,666 35,437 26,609 48,785 52,225 50,743 $ 0.63 $ 0.58 $ 0.62 $ 0.53 $ 0.40 $ 0.74 $ 0.79 $ 0.77 2014 and 201316. Quarterly information (unaudited) (Continued) Quarter Ended Quarter Ended Dec. 31,
2013 March 31,
2014 June 30,
2014 Sept. 30,
2014 Dec. 31,
2014 March 31,
2015 June 30,
2015 Sept. 30,
2015 (In thousands, except per share data) (In thousands, except per share data) $ 216,544 $ 230,953 $ 228,703 $ 230,450 $ 243,570 $ 270,918 $ 298,549 $ 296,201 82,040 92,645 76,550 90,605 107,729 99,465 141,011 154,279 108,008 115,417 114,646 114,351 115,744 111,411 132,741 128,203 $ 406,592 $ 439,015 $ 419,899 $ 435,406 $ 467,043 $ 481,794 $ 572,301 $ 578,683
$
48,194
$
51,616
$
54,900
$
59,018 $ 59,847 $ 69,873 $ 69,813 $ 54,575 28,312 33,252 24,632 24,597 25,568 22,014 34,780 36,284 29,410 35,804 33,071 29,317 33,852 32,458 39,205 34,448 $ 105,916 $ 120,672 $ 112,603 $ 112,932 $ 119,267 $ 124,345 $ 143,798 $ 125,307
$
25,544
$
29,709
$
29,153
$
31,150 $ 37,840 $ 41,476 $ 44,470 $ 30,507 16,787 20,026 14,046 12,239 13,318 9,637 15,536 20,903 12,336 17,276 13,601 9,945 16,153 13,935 16,803 13,353 (1,353 ) (1,468 ) (1,542 ) (1,527 ) (1,475 ) (1,432 ) (3,275 ) (3,166 ) Acquisition-related expenses (600 ) (1,514 ) (2,459 ) (172 ) (17 ) (563 ) (35 ) 1 (5 ) (95 ) (8 ) 102 $ 53,297 $ 64,980 $ 55,223 $ 51,808 $ 65,231 $ 62,007 $ 71,067 $ 61,527
Net income
33,355
41,461
34,428
36,152
42,350 39,028 42,259 36,412 33,859 41,207 34,138 36,236 41,861 38,808 41,666 35,437 $ 0.49 $ 0.59 $ 0.49 $ 0.53 $ 0.63 $ 0.58 $ 0.62 $ 0.53 2, 2015,7, 2016, our Board of Directors declared a quarterly cash dividend of $0.045 for each share of the Company's common stock outstanding. The dividend will be paid on November 30, 20152016 to shareholders of record on November 13, 2015.15, 2016. Based on the number of shares outstanding, the payment will be approximately $2.9 million.(the "Exchange Act")(Exchange Act)) as of the end of the period covered by this Annual Report on Form 10-K. Based on this evaluation, our principal executive officer and principal financial officer concluded that our disclosure controls and procedures are effective and designed to ensure that the information required to be disclosed in our reports filed or submitted under the Exchange Act is recorded, processed, summarized and reported within the time periods specified by the SEC'sSecurities and Exchange Commission's (SEC) rules and forms and that such information is accumulated and communicated to our management, including our principal executive officer and principal financial officer as appropriate, to allow timely decisions regarding required disclosure.2015.2016. In making this assessment, management used the criteria set forth by the Committee of Sponsoring Organizations of the Treadway Commission (COSO) in theInternal Control—Integrated Framework (2013). Based on our assessment, we believe that as of September 30, 2015,2016, our internal control over financial reporting was effective based on those criteria.2015,2016, issued by Ernst & Young LLP, the independent registered public accounting firm who also audited our consolidated financial statements, is included following this Item 9A. In April 2015, the Company acquired Acentia, LLC ("Acentia"). Acentia contributed approximately 4.3% and 3.8% of our total and net assets, respectively, at September 30, 2015 and 5.0% and 6.5% of our revenue and net income, respectively, for the year ended September 30, 2015. As permitted by the Securities and Exchange Commission, we excluded the acquired companies from our assessment of the effectiveness of internal controls over financial reporting at September 30, 2015.20152016 that has materially affected, or is reasonably likely to materially affect, our internal control over financial reporting.'s’s internal control over financial reporting as of September 30, 2015,2016, based on criteria established in Internal Control—IntegratedControl-Integrated Framework issued by the Committee of Sponsoring Organizations of the Treadway Commission (2013 framework) (the COSO criteria). MAXIMUS, Inc'sInc.’s management is responsible for maintaining effective internal control over financial reporting, and for its assessment of the effectiveness of internal control over financial reporting included in the accompanying Management'sManagement’s Report on Internal Control Over Financial Reporting. Our responsibility is to express an opinion on the company'scompany’s internal control over financial reporting based on our audit.company'scompany’s internal control over financial reporting is a process designed to provide reasonable assurance regarding the reliability of financial reporting and the preparation of financial statements for external purposes in accordance with generally accepted accounting principles. A company'scompany’s internal control over financial reporting includes those policies and procedures that (1) pertain to the maintenance of records that, in reasonable detail, accurately and fairly reflect the transactions and dispositions of the assets of the company; (2) provide reasonable assurance that transactions are recorded as necessary to permit preparation of financial statements in accordance with generally accepted accounting principles, and that receipts and expenditures of the company are being made only in accordance with authorizations of management and directors of the company; and (3) provide reasonable assurance regarding prevention or timely detection of unauthorized acquisition, use, or disposition of the company'scompany’s assets that could have a material effect on the financial statements. As indicated in the accompanying Management's Report on Internal Control Over Financial Reporting, management's assessment of and conclusion on the effectiveness of internal control over financial reporting did not include the internal controls of Acentia, Inc., which is included in the 2015 consolidated financial statements of MAXIMUS, Inc. and constituted 4.3% and 3.8% of total and net assets, respectively, as of September 30, 2015 and 5.0% and 6.5% of revenues and net income, respectively, for the year then ended. Our audit of internal control over financial reporting of MAXIMUS, Inc. also did not include an evaluation of the internal control over financial reporting of Acentia, Inc.2015,2016, based on the COSO criteria.20152016 and 2014,2015, and the related consolidated statements of operations, comprehensive income, shareholders' equity and cash flows for each of the three years in the period ended September 30, 20152016 of MAXIMUS, Inc. and our report dated November 16, 201521, 2016 expressed an unqualified opinion thereon. /s/ Ernst & Young LLP McLean, Virginia November 21, 2016 McLean, VirginiaNovember 16, 201520162017 Annual Meeting of Shareholders (the "Proxy Statement")(Proxy Statement) to be filed with the SEC,Securities and Exchange Commission (SEC), except as otherwise indicated below:20152016 with respect to shares of our common stock that may be issued under our existing equity compensation plans: Equity compensation plans/arrangements approved by the shareholders(2) 889,306 $ 1.04 1,653,682 Equity compensation plans/arrangements not approved by the shareholders — — — Total 889,306 $ 1.04 1,653,682 (1) In addition to being available for future issuance upon exercise of options that may be granted after September 30, 2016, all shares under the 2011 Equity Incentive Plan may be issued in the form of restricted stock, performance shares, stock appreciation rights, stock units or other stock-based awards. (2) Includes the 2011 Equity Incentive Plan. Number of securities
to be issued
upon exercise of
outstanding options,
warrants and rights Weighted average
exercise price of
outstanding options,
warrants and rights Number of securities
remaining available
for future issuance
under equity
compensation plans(1) 1,017,132 $ 1.44 2,081,969 — — — 1,017,132 $ 1.44 2,081,969 (1)In addition to being available for future issuance upon exercise of options that may be granted after September 30, 2015, all shares under the 2011 Equity Incentive Plan may be issued in the form of restricted stock, performance shares, stock appreciation rights, stock units or other stock-based awards.(2)Includes the 2011 Equity Incentive Plan.(a) 1. Financial Statements. The consolidated financial statements are listed under Item 8 of this Annual Report on Form 10-K.
(b)2.Financial Statement Schedules.None. Financial statement schedules are not required under the related instructions.3.Exhibits.The Exhibits filed as part of this Annual Report on Form 10-K are listed on the Exhibit Index immediately preceding such Exhibits, which Exhibit Index is incorporated herein by reference.(b)
Exhibits—see Item 15(a)(3) above.
(c)
Financial Statement Schedules—see Item 15(a)(2) above.Dated: November 16, 201521, 2016 MAXIMUS, INC.
By:
/s/ RICHARD A. MONTONISignature TitleDate
Title
Date/s/ RICHARD A. MONTONI Richard A. Montoni President, Chief Executive Officer and Director (principal executive officer) November 16, 201521, 2016
Richard A. Montoni/s/ RICHARD J. NADEAU Richard J. Nadeau
Chief Financial Officer and Treasurer (principal financial and accounting officer)
November 16, 201521, 2016
Richard J. Nadeau/s/ PETER B. POND Peter B. Pond
Chairman of the Board of Directors
November 16, 201521, 2016
Peter B. Pond/s/ RUSSELL A. BELIVEAU Russell A. BeliveauDirectorNovember 16, 2015/s/ JOHN J. HALEYJohn J. HaleyDirectorNovember 16, 2015/s/ PAUL R. LEDERERPaul R. LedererDirectorNovember 16, 2015/s/ RAYMOND B. RUDDYRaymond B. RuddyDirectorNovember 16, 2015SignatureTitleDate/s/ MARILYN R. SEYMANNMarilyn R. Seymann Director November 16, 201521, 2016
Russell A. Beliveau/s/ JOHN J. HALEY Director November 21, 2016 John J. Haley /s/ PAUL R. LEDERER Director November 21, 2016 Paul R. Lederer /s/ RAYMOND B. RUDDY Director November 21, 2016 Raymond B. Ruddy /s/ MARILYN R. SEYMANN Director November 21, 2016 Marilyn R. Seymann /s/ JAMES R. THOMPSON, JR. Director November 21, 2016 James R. Thompson, Jr.
Director
November 16, 2015/s/ WELLINGTON E. WEBB Director November 21, 2016 Wellington E. Webb
Director
November 16, 2015 2.1 Equity Purchase Agreement dated as of March 6, 2015 by and among Acentia, LLC, Certain of the Equity Holders of Acentia, LLC, SPG Acentia Seller Representative, LLC, MAXIMUS Federal Services, Inc. and MAXIMUS, Inc. (18)(15)
3.13.1
Amended and Restated Articles of Incorporation of the Company, as amended.(1)
3.23.2
Articles of Amendment of Amended and Restated Articles of Incorporation.(2)
3.33.3
Amended and Restated Bylaws of the Company.(3)
4.14.1
Specimen Common Stock Certificate.(4)
10.110.1
Form of Indemnification Agreement by and between the Company and each of the directors of the Company.(5)*
10.210.2
Executive Employment, Non-Compete and Confidentiality Agreement by and between the Company and Richard A. Montoni.(6)*
10.310.3
First Amendment to the Executive Employment, Non-Compete and Confidentiality Agreement by and between the Company and Richard A. Montoni.(7)*
10.410.4
Executive Employment, Non-Compete and Confidentiality Agreement by and between the Company and Bruce Caswell.(7)*
10.510.5
First Amendment to the Executive Employment, Non-Compete and Confidentiality Agreement by and between the Company and Bruce Caswell.(7)*
10.610.6
Amended and Restated Income Continuity Program.(8)* Filed herewith.
10.710.7
Deferred Compensation Plan, as amended.(7)*
10.810.8
Extension of Employment Agreement of Richard A. Montoni, dated December 22, 2009.(8)(9)*
10.910.9
2011 Equity Incentive Plan.(9)(10)
10.1010.10First Amendment to 2011 Equity Incentive Plan.(11) 10.11 Amended and Restated Credit Agreement, dated as of March 15, 2013, among MAXIMUS, Inc., SunTrust Bank as Administrative Agent and other lenders party thereto. (10)(12)
10.1210.11
Extension of Employment Agreement of Richard A. Montoni, dated October 7, 2013.(11)(13)*
10.1310.12
Letter Agreement between Richard A. Montoni and MAXIMUS, Inc. dated March 4, 2014.(12)(14)*
10.1410.13
First Amendment to Amended and Restated Credit Agreement dated as of March 9, 2015 among MAXIMUS, Inc., SunTrust Bank as Administrative Agent and other lenders party thereto.(13)(15)
10.1510.131997 Equity Incentive Plan, as amended.(14)*10.14First Amendment to the 1997 Equity Incentive Plan, as amended.(7)*10.151997 Equity Incentive Plan—Restricted Stock Units—Terms and Conditions.(15)*10.161997 Equity Incentive Plan—Non-Qualified Stock Option—Terms and Conditions.(15)*10.171997 Director Stock Option Plan, as amended.(16)*10.181997 Employee Stock Purchase Plan, as amended.(17)*ExhibitNumber10.19 Second Amendment to Amended and Restated Revolving Credit Agreement dated as of October 23, 2015 among MAXIMUS, Inc., certain subsidiaries of MAXIMUS, Inc. party thereto, SunTrust Bank, as Administrative Agent and other lenders party thereto. (19)(16)
10.1621.11997 Equity Incentive Plan, as amended.(17)* 10.17 First Amendment to the 1997 Equity Incentive Plan, as amended.(7)* 10.18 1997 Equity Incentive Plan—Restricted Stock Units—Terms and Conditions.(18)* 10.19 1997 Equity Incentive Plan—Non-Qualified Stock Option—Terms and Conditions.(18)* 10.20 1997 Director Stock Option Plan, as amended.(19)* 10.21 1997 Employee Stock Purchase Plan, as amended.(20)* 21.1 Subsidiaries of the Company. Filed herewith.
23.123.1
Consent of Independent Registered Public Accounting Firm. Filed herewith.
31.131.1
Certification Pursuant to Section 302 of the Sarbanes-Oxley Act of 2002. Filed herewith.
31.231.2
Certification Pursuant to Section 302 of the Sarbanes-Oxley Act of 2002. Filed herewith.
32.132.1
Section 906 Principal Executive Officer Certification. Furnished herewith.
32.232.2
Section 906 Principal Financial Officer Certification. Furnished herewith.
99.199.1
Special Considerations and Risk Factors. Filed herewith.
101101
The following materials from the MAXIMUS, Inc. Annual Report on Form 10-K for the year ended September 30, 20152016 formatted in eXtensible Business Reporting Language (XBRL): (i) Consolidated Statements of Operations, (ii) Consolidated Statements of Comprehensive Income, (iii) Consolidated Balance Sheets, (iv) Consolidated Statements of Cash Flows, (v) Consolidated Statements of Changes in Shareholders' Equity and (vi) Notes to Consolidated Financial Statements. Filed electronically herewith.* Denotes management contract or compensation plan. (1) Filed as an exhibit to the Company's Quarterly Report on Form 10-Q for the quarter ended June 30, 2000 (File No. 1-12997) on August 14, 2000 and incorporated herein by reference. (2) Filed as an exhibit to the Company's Quarterly Report on Form 10-Q for the quarter ended March 31, 2013 (File No. 1-12997) on May 10, 2013 and incorporated herein by reference. (3) Filed as an exhibit to the Company's Current Report on Form 8-K (File No. 1-12997) on June 19, 2015 and incorporated herein by reference. (4) Filed as an exhibit to the Company's Quarterly Report on Form 10-Q for the quarter ended June 30, 1997 (File No. 1-12997) on August 14, 1997 and incorporated herein by reference. (5) Filed as an exhibit to the Company's Registration Statement on Form S-1 (File No. 333-21611) on February 12, 1997 and incorporated herein by reference. (6) Filed as an exhibit to the Company's Current Report on Form 8-K (File No. 1-12997) on April 26, 2006 and incorporated herein by reference. (7) Filed as an exhibit to the Company's Current Report on Form 8-K (File No. 1-12997) on November 27, 2007 and incorporated herein by reference. (8) Filed as an exhibit to the Company's Annual Report on Form 10-K (File No. 1-12997) on November 16, 2015 and incorporated herein by reference. (9) Filed as an exhibit to the Company's Quarterly Report on Form 10-Q for the Quarter ended December 31, 2009 (File No. 1-12997) on February 4, 2010 and incorporated herein by reference. (10) Filed as an exhibit to the Company's Proxy Statement on Schedule 14A (File No. 1-12997) on January 27, 2012 and incorporated herein by reference. (11) Filed as an exhibit to the Company's Current Report on Form 8-K (File No. 1-12997) on December 21, 2015 and incorporated herein by reference. (12) Filed as an exhibit to the Company's Current Report on Form 8-K (File No. 1-12997) on March 21, 2013 and incorporated herein by reference. (13) Filed as an exhibit to the Company's Current Report on Form 8-K (File No. 1-12997) on October 7, 2013 and incorporated herein by reference. (14) Filed as an exhibit to the Company's Current Report on Form 8-K (File No. 1-12997) on March 4, 2014 and incorporated herein by reference. *Denotes management contract or compensation plan.(1)Filed as an exhibit to the Company's Quarterly Report on Form 10-Q for the quarter ended June 30, 2000 (File No. 1-12997) on August 14, 2000 and incorporated herein by reference.(2)Filed as an exhibit to the Company's Quarterly Report on Form 10-Q for the quarter ended March 31, 2013 (File No. 1-12997) on May 10, 2013 and incorporated herein by reference.(3)Filed as an exhibit to the Company's Current Report on Form 8-K (File No. 1-12997) on June 19, 2015 and incorporated herein by reference.(4)Filed as an exhibit to the Company's Quarterly Report on Form 10-Q for the quarter ended June 30, 1997 (File No. 1-12997) on August 14, 1997 and incorporated herein by reference.(5)Filed as an exhibit to the Company's Registration Statement on Form S-1 (File No. 333-21611) on February 12, 1997 and incorporated herein by reference.(6)Filed as an exhibit to the Company's Current Report on Form 8-K (File No. 1-12997) on April 26, 2006 and incorporated herein by reference.(7)Filed as an exhibit to the Company's Current Report on Form 8-K (File No. 1-12997) on November 27, 2007 and incorporated herein by reference.(8)Filed as an exhibit to the Company's Quarterly Report on Form 10-Q for the Quarter ended December 31, 2009 (File No. 1-12997) on February 4, 2010 and incorporated herein by reference.(9)Filed as an exhibit to the Company's Proxy Statement on Schedule 14A (File No. 1-12997) on January 27, 2012 and incorporated herein by reference.(10)Filed as an exhibit to the Company's Current Report on Form 8-K (File No. 1-12997) on March 21, 2013 and incorporated herein by reference.(11)Filed as an exhibit to the Company's Current Report on Form 8-K (File No. 1-12997) on October 7, 2013 and incorporated herein by reference.(15) Filed as an exhibit to the Company's Current Report on Form 8-K (File No. 1-12997) on March 9, 2015 and incorporated herein by reference. (16) Filed as an exhibit to the Company's Current Report on Form 8-K (File No. 1-12997) on October 26, 2015 and incorporated herein by reference. (17) Filed as an exhibit to the Company's Registration Statement on Form S-8 (File No. 333-136400) on August 8, 2006 and incorporated herein by reference. (18) Filed as an exhibit to the Company's Current Report on Form 8-K (File No. 1-12997) on June 23, 2006 and incorporated herein by reference. (19) Filed as an exhibit to the Company's Annual Report on Form 10-K for the year ended September 30, 1997 (File No. 1-12997) on December 22, 1997 and incorporated herein by reference. (20) Filed as an exhibit to the Company's Registration Statement on Form S-8 (File No. 333-122711) on February 10, 2005 and incorporated herein by reference. (12)Filed as an exhibit to the Company's Current Report on Form 8-K (File No. 1-12997) on March 4, 2014 and incorporated herein by reference.(13)Filed as an exhibit to the Company's Current Report on Form 8-K (File No. 1-12997) on March 9, 2015 and incorporated herein by reference.(14)Filed as an exhibit to the Company's Registration Statement on Form S-8 (File No. 333-136400) on August 8, 2006 and incorporated herein by reference.(15)Filed as an exhibit to the Company's Current Report on Form 8-K (File No. 1-12997) on June 23, 2006 and incorporated herein by reference.(16)Filed as an exhibit to the Company's Annual Report on Form 10-K for the year ended September 30, 1997 (File No. 1-12997) on December 22, 1997 and incorporated herein by reference.(17)Filed as an exhibit to the Company's Registration Statement on Form S-8 (File No. 333-122711) on February 10, 2005 and incorporated herein by reference.(18)Filed as an exhibit to the Company's Current Report on Form 8-K (File No. 1-12997) on March 9, 2015 and incorporated herein by reference.(19)Filed as an exhibit to the Company's Current Report on Form 8-K (File No. 1-12997) on October 26, 2015 and incorporated herein by reference.