UNITED STATES
SECURITIES AND EXCHANGE COMMISSION
WASHINGTON, D.C. 20549
FORM 10-K
| | |
(Mark one) | | |
ý☒ |
|
ANNUAL REPORT PURSUANT TO SECTION 13 OR 15(d) OF THE SECURITIES EXCHANGE ACT OF 1934 |
FOR THE FISCAL YEAR ENDED SEPTEMBER 30, 2017 2023 |
OR |
o☐ |
|
TRANSITION REPORT PURSUANT TO SECTION 13 OR 15(d) OF THE SECURITIES EXCHANGE ACT OF 1934 |
For the transition period from to
|
Commission file number 0-52423000-52423
AECOM
(Exact name of Registrant as specified in its charter)
Delaware
State or Other Jurisdiction Of Incorporation or Organization | 61-1088522
I.R.S. Employer Identification Number |
| |
Delaware
(State or other jurisdiction13355 Noel Road | |
Dallas, Texas | 75240 |
Address of
incorporation or organization) Principal Executive Offices | | 61-1088522
(I.R.S. Employer
Identification No.)Zip Code |
(972) 788-1000
Registrant’s Telephone Number, Including Area Code
1999 Avenue of the Stars, Suite 2600
Los Angeles, California 90067
(Former Name, Former Address of principal executive offices, including zip code)
(213) 593-8000
(Registrant's telephone number, including area code)and Former Fiscal Year, if Changed Since Last Report
Securities registered pursuant to Section 12(b) of the Act:
| | | | |
| | | | | |
|---|
Title of Each Class | | each class | | Trading Symbol(s) | | Name of Exchangeeach exchange on Which Registeredwhich registered |
|---|
Common Stock, $0.01 par value $0.01 per share | | ACM | | New York Stock Exchange |
Securities registered pursuant to Section 12(g) of the Act:None
Indicate by check mark if the registrant is a well-known seasoned issuer, as defined in Rule 405 of the Securities Act. ý☒ Yes o☐ No
Indicate by check mark if the registrant is not required to file reports pursuant to Section 13 or Section 15(d) of the Act. o☐ Yes ý☒ No
Indicate by check mark whether the registrant (1) has filed all reports required to be filed by Section 13 or 15(d) of the Securities Exchange Act of 1934 during the preceding 12 months (or for such shorter period that the registrant was required to file such reports), and (2) has been subject to such filing requirements for the past 90 days. ý☒ Yes o☐ No
Indicate by check mark whether the registrant has submitted electronically and posted on its corporate Web site, if any, every Interactive Data File required to be submitted and posted pursuant to Rule 405 of Regulation S-T (§232.405 of this chapter) during the preceding 12 months (or for such shorter period that the registrant was required to submit and post such files). ý☒ Yes o☐ No
Indicate by check mark if disclosure of delinquent filers pursuant to Item 405 of Regulation S-K is not contained herein, and will not be contained to the best of registrant's knowledge, in definitive proxy or information statements incorporated by reference in Part III of this Form 10-K or any amendment to this Form 10-K. ý
Indicate by check mark whether the registrant is a large accelerated filer, an accelerated filer, a non-accelerated filer, a smaller reporting company, or an emerging growth company. See the definitions of "large“large accelerated filer," "accelerated” “accelerated filer," "smaller” “smaller reporting company,"” and "emerging“emerging growth company"company” in Rule 12b-2 of the Exchange Act. (Check one):
| | | | | | |
Large accelerated filer ý | ☒ | Accelerated filer o | ☐ |
Non-accelerated filero
(Do not check if a
smaller reporting company) | ☐ | Smaller reporting companyo | ☐ |
| | Emerging growth company o | ☐ |
If an emerging growth company, indicate by check mark if the registrant has elected not to use the extended transition period for complying with any new or revised financial accounting standards provided pursuant to Section 13(a) of the Exchange Act. Yes o Noo☐
Indicate by check mark whether the registrant has filed a report on and attestation to its management’s assessment of the effectiveness of its internal control over financial reporting under Section 404(b) of the Sarbanes-Oxley Act (15 U.S.C. 7262(b)) by the registered public accounting firm that prepared or issued its audit report. ☒
If securities are registered pursuant to Section 12(b) of the Act, indicate by check mark whether the financial statements of the registrant included in the filing reflect the correction of an error to previously issued financial statements. ☐
Indicate by check mark whether any of those error corrections are restatements that required a recovery analysis of incentive-based compensation received by any of the registrant’s executive officers during the relevant recovery period pursuant to §240.10D-1(b). ☐
Indicate by check mark whether the registrant is a shell company (as defined in Rule 12b-2 of the Exchange Act). oYes ý☐ No☒
The aggregate market value of registrant'sregistrant’s common stock held by non-affiliates on March 31, 20172023 (the last business day of the registrant'sregistrant’s most recently completed second fiscal quarter), based upon the closing price of a share of the registrant'sregistrant’s common stock on such date as reported on the New York Stock Exchange was approximately $5.3$11.7 billion.
Number of shares of the registrant'sregistrant’s common stock outstanding as of November 3, 2017: 157,624,27010, 2023: 135,987,254
DOCUMENTS INCORPORATED BY REFERENCE
Part III incorporates information by reference from the registrant'sregistrant’s definitive proxy statement for the 20182024 Annual Meeting of Stockholders, to be filed within 120 days of the registrant'sregistrant’s fiscal 2017 year end.2023 year-end.
TABLE OF CONTENTS
| | | | | | |
| |
| | Page | |
|---|
ITEM 1.
| | BUSINESS
| | | 2 | Page |
ITEM 1A.1. | | BUSINESS RISK FACTORS
| | | 14 | 3 |
ITEM 1A. | RISK FACTORS | 16 |
ITEM 1B. | |
UNRESOLVED STAFF COMMENTS | | | 30 | |
ITEM 2. | | PROPERTIES PROPERTIES
| | | 30 | |
ITEM 3. | |
LEGAL PROCEEDINGS | | | 31 | 30 |
ITEM 4. | |
MINE SAFETY DISCLOSURE | | | 31 | 30 |
ITEM 5. | |
MARKET FOR REGISTRANT'SREGISTRANT’S COMMON EQUITY, RELATED STOCKHOLDER MATTERS AND ISSUER PURCHASES OF EQUITY SECURITIES | | | 31 | |
ITEM 6. | | [RESERVED] SELECTED FINANCIAL DATA
| | | 34 | 32 |
ITEM 7. | |
MANAGEMENT'SMANAGEMENT’S DISCUSSION AND ANALYSIS OF FINANCIAL CONDITION AND RESULTS OF OPERATIONS
| | | 36 | 33 |
ITEM 7A. | |
QUANTITATIVE AND QUALITATIVE DISCLOSURES ABOUT MARKET RISK | | | 70 | 53 |
ITEM 8. | |
FINANCIAL STATEMENTS AND SUPPLEMENTARY DATA | | | 71 | 54 |
ITEM 9. | |
CHANGES IN AND DISAGREEMENTS WITH ACCOUNTANTS ON ACCOUNTING AND FINANCIAL DISCLOSURE | | | 135 | 94 |
ITEM 9A. | |
CONTROLS AND PROCEDURES | | | 135 | 94 |
ITEM 9B. | |
OTHER INFORMATION | | | 136 | 95 |
ITEM 9C. | DISCLOSURE REGARDING FOREIGN JURISDICTIONS THAT PREVENT INSPECTIONS | 95 |
ITEM 10. | |
DIRECTORS, EXECUTIVE OFFICERS AND CORPORATE GOVERNANCE | | | 136 | 95 |
ITEM 11. | |
EXECUTIVE COMPENSATION | | | 136 | 95 |
ITEM 12. | |
SECURITY OWNERSHIP OF CERTAIN BENEFICIAL OWNERS AND MANAGEMENT AND RELATED STOCKHOLDER MATTERS | | | 136 | 95 |
ITEM 13. | |
CERTAIN RELATIONSHIPS AND RELATED TRANSACTIONS, AND DIRECTOR INDEPENDENCE | | | 136 | 95 |
ITEM 14. | |
PRINCIPAL ACCOUNTANT FEES AND SERVICES | | | 136 | 95 |
ITEM 15. | |
EXHIBITS AND FINANCIAL STATEMENT SCHEDULES | | | 137 | 96 |
ITEM 16. | |
FORM 10-K SUMMARY | | | 143 | 100 |
PART I
ITEM 1. BUSINESS
In this report, we use the terms "the“the Company," "we," "us"” “we,” “us” and "our"“our” to refer to AECOM and its consolidated subsidiaries. Unless otherwise noted, references to years are for fiscal years. Our fiscal year consists of 52 or 53 weeks, ending on the Friday closest to September 30. For clarity of presentation, we present all periods as if the year ended on September 30. We refer to the fiscal year ended September 30, 20162022 as "fiscal 2016"“fiscal 2022” and the fiscal year ended September 30, 20172023 as "fiscal 2017."“fiscal 2023.”
Overview
We are a leading fully integrated firm positioned to design, build, finance and operateglobal provider of professional infrastructure assetsconsulting services for governments, businesses and organizations in more than 150 countries.throughout the world. We provide advisory, planning, consulting, architectural and engineering design, construction and program management services, and investment and development services to commercialpublic- and governmentprivate-sector clients worldwide in major end markets such as transportation, facilities, water, environmental, energy, water and government markets. We also provide construction services, including building construction and energy, infrastructure and industrial construction. In addition, we provide program and facilities management and maintenance, training, logistics, consulting, technical assistance, and systems integration and information technology services, primarily for agencies of the U.S. government and also for national governments around the world. new energy.
According toEngineering News-Record's (ENR's) 2017News-Record’s (ENR’s) 2023 Design Survey, we are the second largest general architectural and engineering design firm in the world, ranked by 20162022 design revenue.revenue, and we are the number one ranked transportation design, facilities design, environmental engineering, environmental consulting and environmental science firm in the world. In addition, we are ranked by ENR as the leading firm in a number of design end markets, including transportationseveral water infrastructure-related markets, as well as the number two green design firm and general building.the number six green contractor in the world. We utilize our scale and the technical strength of our workforce to create innovative solutions for our clients. We are accelerating investments to extend our capabilities, including the expansion of our digital capabilities to create innovative ways of delivering our work and solving the world’s most complex challenges. Clients are turning to us to create solutions to achieve their Environmental, Social, and Governance (ESG) objectives with a focus on sustainability and resilience initiatives, which include supporting the advancement of more energy efficient and less-carbon-intensive infrastructure. With our market leading technical capabilities, we are uniquely well suited to address these challenges.

Our business focuses primarily on providing fee-based knowledge-based services. We were formed in 1980 as Ashland Technology Company, a Delaware corporationprimarily derive income from our ability to generate revenue and a wholly-owned subsidiarycollect cash from our clients through the billing of Ashland, Inc., an oilour employees’ time spent on client projects and gas refiningour ability to manage our costs. AECOM Capital primarily derives its income from real estate development sales and distribution company. Since becoming independentmanagement fees.
During the first fullquarter of fiscal year of independent2020, we reorganized our operating and reporting structure to better align with our ongoing professional services business. This reorganization better reflected our continuing operations to approximately 87,000 employees at September 30, 2017 and $18.2 billion in revenue for fiscal 2017. We completedafter the initial public offeringsale of our common stock in May 2007Management Services segment, the sale of our self-perform at-risk civil infrastructure and these shares are traded on the New York Stock Exchange.
As mentioned above, we have grown in part by strategic mergers and acquisitions. These acquisitions have included URS Corporation, a leading provider of engineering,power construction and technical services for public agencies and private sector companies around the world, acquired in October 2014; Hunt Construction Group, a leading commercial construction firm, acquired in July 2014; and Shimmick Construction Company, Inc., a leading heavy civil construction firm in Californiabusinesses, and the Western U.S., acquiredsale of our oil & gas construction business. Our Management Services and self-perform at-risk construction businesses were part of our former Management Services segment and represented a substantial portion of the revenue of our former Construction Services segment, respectively. These businesses are classified as discontinued operations in July 2017.all periods presented.
OurWe report our continuing business strategy focuses on leveraging our competitive strengths, leadership positions in our core markets, and client relationships across all major geographies. We have created an integrated delivery platform with superior capabilities to design, build, finance and operate infrastructure assets around the world. By integrating and providing a broad range of services, we deliver maximum value to our clients at competitive costs. Also, by coordinating and consolidating our knowledge base, we believe we have the ability to export our leading edge technical skills to any region in the world in which our clients may need them.
Our operations are organized into four reportablethrough three segments, each of which is described in further detail below: Design and Consulting Services (DCS), Construction Services (CS), Management Services (MS),Americas, International, and AECOM Capital (ACAP). During the third quarter of fiscal 2017, operating activities of ACAP achieved a level of significance sufficient to warrant disclosure as a separate reportable segment. Prior to the third quarter of fiscal 2017, ACAP's operating results were included in the corporate segment, and comparable periods have been reclassified to reflect the change. These reportableSuch segments are
Table of Contents
organized by the types of services provided, the differing specialized needs of the respective clients and how we manage the Company manages its businesses.business. We have aggregated various operating segments into our reportable segments based on their similar characteristics, including similar long termlong-term financial performance, the nature of services provided, internal processes for delivering those services, and types of customers.
•Design | ● | Americas:Planning, consulting, architectural and engineering design, construction management and program management services to public and private clients in the United States, Canada, and Latin America in major end markets such as transportation, water, government, facilities, environmental, and energy. |
| ● | International:Planning, consulting, architectural and engineering design services and program management to public and private clients in Europe, the Middle East, India, Africa, and the Asia-Australia-Pacific regions in major end markets such as transportation, water, government, facilities, environmental, and energy. |
| ● | AECOM Capital (ACAP):Primarily invests in and develops real estate projects. |
Our Americas and Consulting Services (DCS):
Planning, consulting, architecturalInternational SegmentsOur Americas and engineering design services to commercial and government clients worldwide in major end markets such as transportation, facilities, environmental, energy, water and government.
•Construction Services (CS): Construction services, including building construction and energy, infrastructure and industrial construction, primarily in the Americas.
•Management Services (MS): Program and facilities management and maintenance, training, logistics, consulting, technical assistance, and systems integration and information technology services, primarily for agenciesInternational segments are comprised of the U.S. government and other national governments around the world.
•AECOM Capital (ACAP): Investing in real estate, public-private partnership (P3) and infrastructure projects.
Our DCS segment comprises a broad array of services, generally provided on a fee-for-service basis. These services include advisory, planning, consulting, architectural and engineering design, program management and construction management for industrial, commercial, institutionalpublic and governmentprivate clients worldwide. For each of these services, our technical expertise includes civil engineering, structural engineering, process engineering, mechanical engineering, geotechnical systems and electrical engineering, architectural, landscape and interior design, urban and regional planning, project economics, cost consulting and environmental, health and safety work.
With our technical, advisory and program management expertise, we are able to provide our clients a broad spectrum of services. For example, within our environmental managementwater service offerings, we provide remediation, regulatory compliance planningwater, wastewater, water supply and management,water resource services, which are necessary in response to climate adaptation and resilience, drought mitigation and other environmental modeling, environmentaland social impact assessment and environmental permitting forfactors as part of major capital/infrastructure projects.
In addition, our industry is undergoing a digital transformation, and we are investing in digital capabilities to extend our advantages, improve overall delivery, and create distinct solutions for clients that differentiate us from competitors and enhance our client experience. These investments include capturing the value of our libraries of data to build more efficient design processes, and innovative and more advanced solutions for increasingly complex challenges, where our digital suite of products are creating a more holistic approach to our work.
Our services may be sequenced over multiple phases.phases or multiple projects in the form of a program. For example, in the area of program management and construction management services, our work for a client may begin with a small consulting or planning contract, and may later develop into an overall management role for the project or a series of projects, which we refer to as a program.
Program and construction management contracts may employ a staff of 10 to more than 100small or large project teams and, in many cases, operate as an outsourcing arrangement with our staff located at the project site.
We provide the services in our DCS segmentthese segments both directly and through joint ventures or similar partner arrangements to the following end markets or business sectors:
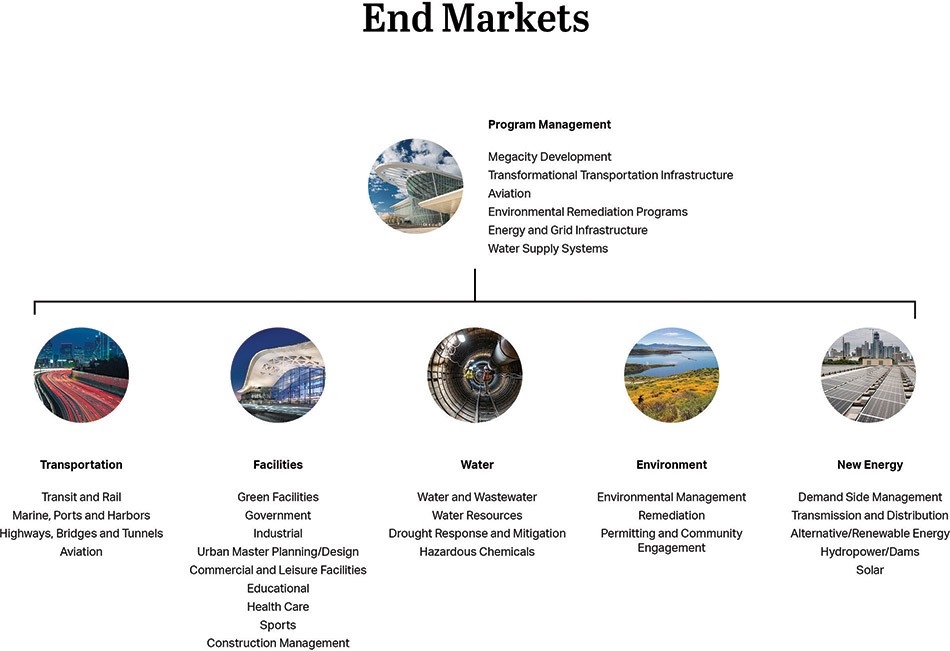
Transportation.
• | ● | Transit and Rail. Light rail, heavy rail (including highspeed, commuter and freight) and multimodal transit projects. |
| ● | Marine, Ports and Harbors. Wharf facilities and container port facilities for private and public port operators. |
| ● | Highways, Bridges and Tunnels. Interstate, primary and secondary urban and rural highway systems and bridge projects. |
| ● | Aviation. Landside terminal and airside facilities, runways, and taxiways. |
Transit and Rail.Facilities.
Light rail, heavy rail (including high-speed, commuter and freight) and multimodal transit projects.
•Marine, Ports and Harbors. Wharf facilities and container port facilities for private and public port operators.
•Highways, Bridges and Tunnels. Interstate, primary and secondary urban and rural highway systems and bridge projects.
•Aviation. Landside terminal and airside facilities, runways and taxiways.
| ● | GreenFacilities. Sustainably-designed new build construction or refurbishment projects, such as office buildings, data centers and other facilities with high energy demands. |
| ● | Government. Emergency response services for the U.S. Department of Homeland Security, including the Federal Emergency Management Agency and engineering and program management services for agencies of the Department of Defense and Department of Energy. |
| ● | Industrial. Industrial facilities for a variety of niche end markets such as manufacturing, distribution, aviation, aerospace, communications, media, pharmaceuticals, renewable energy, chemical, and food and beverage facilities. |
| ● | Urban Master Planning/Design. Strategic planning and master planning services for new cities and major mixed-use developments in locations such as India, China, Southeast Asia, the Middle East, North Africa, the United Kingdom, and the United States. |
| ● | Commercial and Leisure Facilities. Corporate headquarters, high-rise office towers, historic buildings, hotels, leisure, sports and entertainment facilities, and corporate campuses. |
| ● | Educational. College and university campuses and other educational facilities. |
| ● | Health Care. Private and public health facilities. |
| ● | Sports. Sustainable building design for world-class sports arenas and stadiums. |
| ● | Construction Management. Program and construction management services for large scale building facility construction projects primarily in the Americas including: sports arenas, modern office and residential towers, hotels, meeting and exhibition spaces, performance venues, aviation, and other facilities. |
Facilities.Water.
• | ● | Water and Wastewater. Treatment facilities as well as supply, distribution and collection systems, stormwater management, desalinization, and other water reuse technologies. |
| ● | Water Resources. Regional-scale floodplain mapping and analysis for public agencies, along with the analysis and development of protected groundwater resources for companies in the bottled water industry. |
| ● | Drought Response and Mitigation. Designing water re-use and similar systems to enhance resiliency of water supply. |
| ● | Hazardous Chemicals. Treating and addressing disposal of hazardous chemicals in water supplies and surrounding environments, such as per- and polyfluoroalkyl substances (PFAS). |
Government.Environment.
Emergency response services for the U.S. Department | ● | Environmental Management. Waste handling, testing and monitoring of environmental conditions, and environmental construction management. |
| ● | Remediation. Restoring and remediating natural habitats, such as in response to industrial activity related to closed or abandoned mines. |
| ● | Permitting and Community Engagement. Advancing client projects through permitting processes, including implementation of innovative online engagement platforms, such as PlanEngageTM. |
New Energy.
| ● | Demand Side Management. Public K-12 schools and universities, health care facilities, and courthouses and other public buildings, as well as energy conservation systems for utilities. |
| ● | Transmission and Distribution. Power stations and electric transmissions and distribution and cogeneration systems. |
| ● | Alternative/Renewable Energy. Production facilities such as ethanol plants, onshore and offshore wind farms and micro hydropower, and geothermal subsections of regional power grids. |
| ● | Hydropower/Dams. Hydroelectric power stations, dams, spillways, and flood control systems. |
| ● | Solar. Solar photovoltaic projects and environmental permitting services. |
Program Management Agency and engineering and– We provide program management services for agencies of the Department of Defense and Department of Energy.
•Industrial. Industrial facilities for a variety of niche end markets such as manufacturing, distribution, aviation, aerospace, communications, media, pharmaceuticals, renewable energy, chemical, and food and beverage facilities.
•Urban Master Planning/Design. Strategic planning and master planning services for new cities and major mixed use developments in India, China, Southeast Asia, the Middle East, North Africa, the United Kingdom and the United States.
•Commercial and Leisure Facilities. Corporate headquarters, high-rise office towers, historic buildings, hotels, leisure, sports and entertainment facilities and corporate campuses.
•Educational. College and university campuses.
•Health Care. Private and public health facilities.
•Correctional. Detention and correction facilities throughout the world.Environmental.
•Water and Wastewater. Treatment facilities as well as supply, distribution and collection systems, stormwater management, desalinization, and other water re-use technologies.
•Environmental Management. Remediation, waste handling, testing and monitoring of environmental conditions and environmental construction management.
•Water Resources. Regional-scale floodplain mapping and analysis for public agencies, along with the analysis and development of protected groundwater resources for companies in the bottled water industry.
Energy/Power.
•Demand Side Management. Public K-12 schools and universities, health care facilities, and courthouses and other public buildings, as well as energy conservation systems for utilities.
•Transmission and Distribution. Power stations and electric transmissions and distribution and co-generation systems.
•Alternative/Renewable Energy. Production facilities such as ethanol plants, wind farms and micro hydropower and geothermal subsections of regional power grids.
•Hydropower/Dams. Hydroelectric power stations, dams, spillways, and flood control systems.
•Solar. Solar photovoltaic projects and environmental permitting services.
Through our CS segment, we provide construction, program and construction management services, including building construction and energy, infrastructure and industrial construction, primarily in the Americas.
Table of Contents
We provide the services in our CS segment both directly and through joint ventures or similar partner arrangements, to the following end markets and business sectors:
Building. We provide construction, program and construction managementadvisory services for large scale buildingpublic- and facility construction projectsprivate-sector infrastructure programs around the world, including:
•Sports arenas;
•Modern office towers;
•Hotel and gaming facilities;
•Meeting and exhibition spaces;
•Performance venues;
•Education facilities;
•Mass transit terminals; and
•Data centers.
| ● | Transformational transportation infrastructure, such as high-speed rail. |
| ● | Environmental remediation programs. |
| ● | Energy and grid infrastructure. |
Energy. We plan, design, engineer, construct, retrofit and maintain a wide range of power-generating facilities, as well as the systems that transmit and distribute electricity. We provide these services to utilities, industrial co-generators, independent power producers, original equipment manufacturers and government utilities including:
•Fossil fuel power generating facilities;
•Nuclear power generating facilities and decommissioning;
•Hydroelectric power generating facilities;
•Alternative and renewable energy sources, including biomass, geothermal, solar energy and wind systems;
•Transmission and distribution systems; and
•Emissions control systems.
We also provide a wide range of planning, design, engineering, construction, production, and operations and maintenance services across the oil and gas upstream, midstream and downstream supply chain. For downstream refining and processing operations, we design and construct gas treatment and processing, refining and petrochemical facilities, and provide asset management and maintenance services for oil sands production facilities, oil refineries and related chemical, energy, power and processing plants. For oil and gas exploration and production, we provide transportation, engineering, construction, fabrication and installation, commissioning and maintenance services for drilling and well site facilities, equipment and process modules, site infrastructure and off-site support facilities including:
•Construction of access roads and well pads, and field production facilities;
•Pipeline planning, design, construction, installation, maintenance and repair;
•Oil field services; and
•Equipment and process module fabrication, installation and maintenance.
Infrastructure and Industrial. We provide construction, program and construction management services for large scale infrastructure projects around the world. We also provide a wide range of engineering, procurement and construction services for industrial and process facilities and the expansion,
Table of Contents
modification and upgrade of existing facilities. We provide these services to local, state, federal and national governments as well as corporations including:
•Highways, airports, rail and other transit projects;
•Maritime and terminal facilities;
•Dams, water and waste water projects;
•Biotechnology and pharmaceutical research laboratories, pilot plants and production facilities;
•Petrochemical, specialty chemical and polymer facilities;
•Consumer products and food and beverage production facilities;
•Automotive and other manufacturing facilities; and
•Mines and mining facilities.
Through our MS segment, we are a major contractor to the U.S. federal government and we serve a wide variety of government departments and agencies, including the Department of Defense, the Department of Energy (DOE) and other U.S. federal agencies. We also serve departments and agencies of other national governments, such as the U.K. Nuclear Decommissioning Authority (NDA) and the U.K. Ministry of Defense. Our services range from program and facilities management, training, logistics, consulting, systems engineering and technical assistance, and systems integration and information technology.
We provide a wide array of classified and unclassified services in our MS segment, both directly and through joint ventures or similar partner arrangements, including:
•Operation and maintenance of complex government installations, including military bases and test ranges;
•Network and communications engineering, software engineering, IT infrastructure design and implementation, cyber defense and cloud computing technologies;
•Deactivation, decommissioning and disposal of nuclear weapons stockpiles and other nuclear waste;
•Management and operations and maintenance services for complex DOE and NDA programs and facilities;
•Testing and development of new components and platforms, as well as engineering and technical support for the modernization of aging weapon systems;
•Logistics support for government supply and distribution networks, including warehousing, packaging, delivery and traffic management;
•Acquisition support for new weapons platforms;
•Maintenance planning to extend the service life of weapons systems and other military equipment;
•Maintenance, modification and overhaul of military aircraft and ground vehicles;
•Safety analyses for high-hazard facilities and licensing for DOE sites;
•Threat assessments of public facilities and the development of force protection and security systems;
•Planning and conducting emergency preparedness exercises;
Table of Contents
•First responder training for the military and other government agencies;
•Management and operations and maintenance of chemical agent and chemical weapon disposal facilities;
•Installation of monitoring technology to detect the movement of nuclear and radiological materials across national borders;
•Planning, design and construction of aircraft hangars, barracks, military hospitals and other government buildings; and
•Environmental remediation and restoration for the redevelopment of military bases and other government installations.
ACAP was formed in 2013 and invests in and develops real estate, public-private partnership (P3) and infrastructure projects. ACAP typically partners with investors and experienced developers in the United States and Europe as co-general partners. ACAPThese partnerships may, but is not required to, enter into contracts with our other AECOM affiliates to provide design, engineering,owners engineer, construction management, development and operations and maintenance services for ACAP funded projects. ACAP development activity is conducted through joint ventures or subsidiaries that may be consolidated or unconsolidated for financial reporting purposes depending on the extent and nature of our ownership interest. In addition, in connection with the investment activities of ACAP, AECOM providesor an affiliate may provide guarantees of certain financial obligations, including guarantees for completion of projects, repayment of debt, environmental indemnity obligations, and other lender required guarantees. ACAP manageshas focused on investing in co-general partner equity opportunities with high quality partners, primarily targeting “build-to-core” investments in the top U.S. markets across all property types.
During fiscal 2023, we initiated a diverse portfolioprocess to explore strategic options for the AECOM Capital business. This process is consistent with our focus on our professional services business. AECOM Capital will continue to manage existing investment vehicles and investments in a manner consistent with their current obligations.
Thinking and Acting Globally
AECOM is at its best when we think and act globally. Our strategy is focused on setting a new standard of excellence in the professional services industry. First, our operating structure promotes greater connectivity and collaboration across our seven regions and five global business lines. We drive growth by prioritizing our core markets, leaning into our greatest strengths and ensuring our best talent and resources are focused on nurturing client relationships. We are transforming the way we deliver work through technology
and digital platforms improving the client experience and increasing efficiency. Lastly, we are building upon our position as a leading ESG company, unified by our purpose to deliver a better world.

Environmental, Social and Governance Matters
We are committed to being a leader in environmental sustainability, social responsibility, and corporate governance.
We embrace sustainability by striving to make a positive, lasting impact on society and the environment. Sustainability is at the core of what we do and how we operate — focusing on the environmental, social and governance impact of our business. Through our projects and our operations, we have both a significant opportunity and a responsibility to protect, enhance and restore the world’s natural and social systems.
We are committed to addressing the effects of climate change as a key priority for our sustainability program by improving resilience and working to advance increasingly ambitious greenhouse gas emissions reduction targets. To this point, in fiscal 2022, we were among the first companies globally to have set net zero emissions reduction targets approved by the Science Based Targets Initiative (SBTi), which are designed to exceed the goals of the Paris Agreement on climate change. These net zero emissions reduction goals include a near-term target to reduce Scope 1, 2 and 3 emissions by 50% by 2030 and a long-term target to reduce total emissions by 90% by 2040. These commitments build upon our commitments as a signatory to the UN Global Compact.
In addition, we continue to invest in proprietary innovations and digital solutions. This includes a solution to combat globally pervasive emerging contaminants, such as our proprietary DE-FLUOROTM water treatment solution to destroy per and polyfluoroalkyl substances (PFAS) on-site. In addition, we are leading on decarbonization measurement, biodiversity impact and re-wilding through our innovative work at the National Capital Laboratory (NCL) in the U.K., where we are restoring 100 acres of forest and reintroducing lost species. Our work at the NCL won the 2022 Verdantix Innovation Excellence Award for Sustainability Strategy Implementation for success in analyzing and measuring biodiversity impact.
We maintain an internal Global ESG Council to coordinate and drive our ESG initiatives across AECOM worldwide, and our Board has oversight over ESG matters. Additional information regarding our ESG initiatives is located on the investor relations section of our website, at https://investors.aecom.com/esg.
Human Capital Management
Our principal asset is our employees and large percentages of our employees have technical and professional backgrounds and undergraduate and/or advanced degrees. At the end of our fiscal 2023, we employed approximately 52,000 persons, of whom approximately 18,000 were employed in the United States. Over 400 of our domestic employees are covered by collective bargaining agreements or by specific labor agreements, which expire upon completion of the relevant project. We believe that includes numerous active investmentsthe quality and $230 millionlevel of service that our professionals deliver are among the highest in our industry.
We are committed capital.
The following table sets forthattracting and retaining the revenue attributablebest technical professionals in the world. Critical to our continued success is our ability to offer a compelling employee value proposition that promises competitive pay and benefits, an inclusive environment that supports flexibility and well-being and encourages collaboration and innovation, and a shared commitment to technical excellence, continuous learning and career growth. This understanding informs our approach to managing our human capital resources. Our human capital objectives and initiatives are overseen by our Board as per our Corporate Governance Guidelines.
Health and Safety. Core to our corporate values is safeguarding our people and fostering a culture of caring that promotes the wellbeing of our employees, contractors and business segmentspartners. We safeguard our people, projects and reputation by striving for zero employee injuries and illnesses, while operating and delivering our work responsibly and sustainably. We maintain our industry’s best-in-class lost workday case and recordable incident rates, and our safety performance is consistently recognized by key clients across the regions where we work as well as by recognized safety organizations. We have taken and will continue to take critical steps to keep our people, clients and communities safe, including any necessary actions in response to local and global health crises.
Equity, diversity and inclusion. We are committed to advancing equity, diversity and inclusion in our organization and within our industry. We build safe and respectful work environments where our employees are invited to bring their talents, backgrounds and expertise to bear on some of the world’s most complex problems and where every person has the opportunity to thrive personally and professionally. We are advancing efforts globally in four key areas: 1) Building a workforce reflective of the communities we serve through our recruitment efforts, building leadership accountability, and partnering with nonprofit organizations and universities to build the talent pipeline for the periods indicated:future; 2) Enriching communities through pro-bono work, volunteerism, philanthropy and strategic partnerships; 3) Expanding understanding and empathy among employees through employee resource groups, ED&I events and celebrations, and family-friendly benefit policies; and 4) Prioritizing social equity and impact in every project we pursue and the innovative solutions we deliver.

Freedom to Grow. Freedom to Grow is our global framework designed to support employees in finding the balance and flexibility they need to be their best and deliver for clients, and a key factor in our ability to attract and retain talent. Employees and managers can evaluate work schedules and locations and align on an arrangement that prioritizes client and team responsibilities while
| | | | | | | | | | |
| | Year-Ended September 30,
(in millions) | |
|---|
| | 2017 | | 2016 | | 2015 | |
|---|
Design and Consulting Services (DCS) | | $ | 7,566.8 | | $ | 7,655.8 | | $ | 7,962.9 | |
Construction Services (CS) | | | 7,295.6 | | | 6,371.1 | | | 6,539.3 | |
Management Services (MS) | | | 3,341.0 | | | 3,383.9 | | | 3,487.7 | |
| | | | | | | | | | | |
Total | | $ | 18,203.4 | | $ | 17,410.8 | | $ | 17,989.9 | |
| | | | | | | | | | | |
| | | | | | | | | | | |
| | | | | | | | | | | |
Table of Contents
supporting individual needs and includes three days a week in the office or at project sites as an expectation. Our Freedom to Grow program goes far beyond just when and where we work. We consider our people’s holistic experience, respecting diversity in work, communication and thinking styles.

Workplace of the future. Drawing on the experiences of our teams and our clients during the pandemic, we developed a space and technology framework that allows for seamless connectivity between home offices, company offices and client sites, and a new global workplace design that accounts for reduced capacity requirements and prioritizes sustainability, collaboration and engagement. We are also advancing initiatives to enable the digital delivery of our work by establishing best practices and governance protocols for the digital reuse of core elements of the design process.
Technical and professional development. Technical excellence is the foundation of our business—it’s how we harness the power of our teams’ technical skills and expertise to deliver high quality solutions for clients and communities we serve. We strive to be home to our industry's best technical minds — professionals who thrive in an environment that encourages their collaboration and innovation and celebrates great project and client outcomes.
We have invested in a robust learning ecosystem that keeps our employees project-ready with 'on the job' technical training, future-ready with new digital tools, thought leadership and programs that inspire innovation, and globally connected within their technical practice and strategic partnerships.
Our digital learning platform, AECOM University, delivers high-quality and personalized learning experiences, including our Global Technical Academies. Created by us for us, Academies deliver structured and self-directed technical training courses on key
global topics, practices and markets that are relevant to our business. Our Technical Practice Network connects nearly 20,000 professionals every day in a global online community to enable networking, collaboration and problem solving.
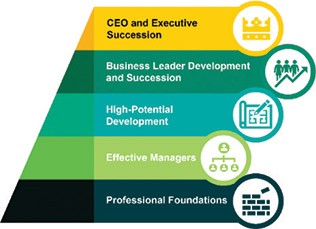
In addition, our full range of professional development programs, called Leadership at all Levels, enhance business and leadership skills. From early career and graduate programs, to practical manager training, and executive coaching and leadership development, we are supporting development at every career level. These programs are based on our four pillars of Leadership Capabilities, which outline the behaviors we want our leaders to demonstrate and exemplify for the collective success as an organization.
Purpose and impact. As the world’s trusted infrastructure consulting firm and a leader in environmental, social and corporate governance (ESG), we are determined and well-positioned to deliver positive, impactful and Sustainable Legacies for our company, our communities and our planet. Through strategic nonprofit partnerships, pro-bono work, skills-based volunteering and philanthropy, our corporate responsibility platform is focused on delivering access to safe and secure infrastructure to those who need it most, creating opportunity for the leaders of tomorrow and protecting our planet so that our company can fulfill its purpose to deliver a better world. As part of our pro-bono program, our technical experts partnered with nonprofit organizations in their local communities to provide critical design, engineering and infrastructure solutions. In addition, we have maintained our commitment to our enterprise strategic nonprofit partners – Engineers Without Borders and Water for People.
Our Clients
Our clients consist primarily of national, state, regional and local governments, public and private institutions and major corporations. The following table sets forth our total revenue attributable to these categories of clients for each of the periods indicated:
| | | | | | | | | | | | | | | | | | | |
| | Year Ended September 30,
($ in millions) | |
|---|
| | 2017 | | 2016 | | 2015 | |
|---|
U.S. Federal Government | | | | | | | | | | | | | | | | | | | |
DCS | | $ | 687.7 | | | 4 | % | $ | 704.4 | | | 4 | % | $ | 764.5 | | | 4 | % |
CS | | | 138.4 | | | 1 | | | 239.1 | | | 1 | | | 291.1 | | | 2 | |
MS | | | 3,122.3 | | | 17 | | | 3,032.8 | | | 18 | | | 3,172.5 | | | 18 | |
| | | | | | | | | | | | | | | | | | | | |
Subtotal U.S. Federal Government | | | 3,948.4 | | | 22 | | | 3,976.3 | | | 23 | | | 4,228.1 | | | 24 | |
U.S. State and Local Governments | | | 2,808.1 | | | 15 | | | 2,598.0 | | | 15 | | | 2,592.4 | | | 14 | |
Non-U.S. Governments | | | 1,980.4 | | | 11 | | | 1,641.5 | | | 9 | | | 2,198.4 | | | 12 | |
| | | | | | | | | | | | | | | | | | | | |
Subtotal Governments | | | 8,736.9 | | | 48 | | | 8,215.8 | | | 47 | | | 9,018.9 | | | 50 | |
Private Entities (worldwide) | | | 9,466.5 | | | 52 | | | 9,195.0 | | | 53 | | | 8,971.0 | | | 50 | |
| | | | | | | | | | | | | | | | | | | | |
Total | | $ | 18,203.4 | | | 100 | % | $ | 17,410.8 | | | 100 | % | $ | 17,989.9 | | | 100 | % |
| | | | | | | | | | | | | | | | | | | | |
| | | | | | | | | | | | | | | | | | | | |
| | | | | | | | | | | | | | | | | | | | |
Other than the U.S. federal government, no
| | | | | | | | | | | | | | | | |
| | Year Ended September 30, | |
| | ($ in millions) | |
| | 2023 | | 2022 | | 2021 | |
U.S. Federal Government | | $ | 790.6 | | 5 | % | $ | 821.3 | | 6 | % | $ | 1,026.6 | | 8 | % |
U.S. State and Local Governments | | | 2,918.9 | | 20 | | | 2,824.0 | | 21 | | | 2,797.9 | | 21 | |
Non-U.S. Governments | | | 2,544.7 | | 18 | | | 1,800.6 | | 14 | | | 1,896.8 | | 14 | |
Subtotal Governments | | | 6,254.2 | | 43 | | | 5,445.9 | | 41 | | | 5,721.3 | | 43 | |
Private Entities (worldwide) | | | 8,124.3 | | 57 | | | 7,702.3 | | 59 | | | 7,619.6 | | 57 | |
Total | | $ | 14,378.5 | | 100 | % | $ | 13,148.2 | | 100 | % | $ | 13,340.9 | | 100 | % |
No single client accounted for 10% or more of our revenue in any of the past five fiscal years. Approximately 22%5%, 23%6%, and 24%8% of our revenue was derived through direct contracts with agencies of the U.S. federal government in the years ended September 30, 2017, 20162023, 2022, and 2015,2021, respectively. One of these contracts accounted for approximately 3%, 3% and 2% of our revenue in the years ended September 30, 2017, 2016 and 2015, respectively. The work attributed to the U.S. federal government includes our work for the Department of Defense, Department of Energy, Department of Justice and the Department of Homeland Security.
Contracts
The price provisions of the contracts we undertake can be grouped into several broad categories: cost-reimbursable contracts, guaranteed maximum price contracts, and fixed-price contracts. For the year ended September 30, 2023, our revenue was comprised of 43%, 34%, and 23% cost-reimbursable, guaranteed maximum price, and fixed-price contracts, respectively.
Cost-Reimbursable Contracts
Cost-reimbursable contracts consist of two similar contract types: (1) cost-plus contracts and (2) time and material price contracts.
Cost-Plus Contracts. We enter into two major types of cost-plus contracts:
Cost-Plus Fixed Fee. Underinclude cost-plus fixed fee, cost-plus fixed rate, and time-and-materials price contracts. Under cost-plus contracts, we charge clients for our costs, including both direct and indirect costs, plus a fixed negotiated fee. The total estimated cost plus the fixed negotiated fee represents the total contract value.or rate. We recognize revenuerevenues based on the actual labor and other direct costs incurred plusand the applicable fixed rate or portion of the fixed fee earned toas of the balance sheet date.
Cost-Plus Fixed Rate. Under cost-plus fixed ratetime-and-materials price contracts, we negotiate hourly billing rates and charge clients for our direct and indirect costs based upon a negotiated rate. We recognize revenue based on the actual total costs expendedtime we expend on the project. In addition, clients reimburse us for materials and other direct incidental expenditures, including payments to subcontractors, incurred in connection with our performance under the applicable fixed rate.contract. Time-and-material price contracts may also have a fixed-price element in the form of not-to-exceed or guaranteed maximum price provisions.
Some cost-plus contracts provide for award fees or a penalty based on performance criteria in lieu of a fixed fee or fixed rate. Other contracts include a base fee component plus a performance-based award fee. In addition, we may share award fees with subcontractors. We record accruals for fee-sharing as fees are earned. We generally recognize revenue to the extent of costs actually incurred plus a proportionate
Table of Contents
amount of the fee expected to be earned. We take the award fee or penalty on contracts into consideration when estimating revenue and profit rates, and record revenue related to the award fees when there is sufficient information to assess anticipated contract performance. On contracts that represent higher than normal risk or technical difficulty, we may defer all award fees until anperformance and a significant reversal of the award fee letter is received.not probable. Once an award fee letter is received, the estimated or accrued fees are adjusted to the actual award amount.
Some cost-plus contracts provide for incentive fees based on performance against contractual milestones. The amount of the incentive fees varies, depending on whether we achieve above, at, or below target results. We originally recognize revenue on these contracts based upon expected results. These estimates are revised when necessary based upon additional information that becomes available as the contract progresses.
Time and Material Price Contracts. Time and material contracts are common for smaller scale engineering and consulting services. Under these types of contracts, we negotiate hourly billing rates and charge our clients based upon actual hours expended on a project. Unlike cost-plus contracts, however, there is no predetermined fee. In addition, any direct project expenditures are passed through to the client and are reimbursed. These contracts may also have a fixed-price element in the form of not-to-exceed or guaranteed maximum price provisions.
Guaranteed maximum price contracts (GMP) are common for design-build and commercial and residential projects. GMP contracts share many of the same contract provisions as cost-plus and fixed-price contracts. A contractor performing work pursuant toAs with cost-plus contracts, clients are provided a cost-plus, GMP or fixed-price contract will enter into trade contracts directly. Both cost-plusdisclosure of all project costs, and GMP contracts generally include an agreeda lump sum or percentage fee which is called out and separately identified and the contracts are considered 'open' book providing the owner with full disclosure of the project costs. A fixed-price contract provides the owner with a single lump sum amount without specifically identifying the breakdown of fee or costs and is typically 'closed' book thereby providing the owner with little detail as to the project costs. In a GMP contract, unlike the cost-plus contract, weidentified. We provide the ownerclients with a guaranteed price for the overall constructionproject (adjusted for change orders issued by the owner)clients) and with a schedule which includes aincluding the expected completion date for the project. In addition, costdate. Cost overruns or costs associated with project delays in a GMP contract wouldcompletion could generally be our responsibility and in the event our actions or inactions result in delays to the project, we may be responsible to the owner for costs associated with such delay.responsibility. For many of our commercial andor residential GMP contracts, the final price is generally not established until we have awardedsubcontracted a substantial percentage of the trade contracts with terms consistent with the master contract, and we have negotiated additional contractualcontract limitations, such as mutual waivers of consequential damages as well as aggregate caps on liabilities and liquidated damages. Revenue is recognized for GMP contracts as project costs are incurred relative to total estimated project costs.
There are typically two types of fixed-priceFixed-price contracts include both lump-sum and fixed-unit price contracts. Lump sumUnder lump-sum contracts, involve performingwe perform all of the work under the contract for a specified lump sum fee andprice. Lump-sum contracts are typically subject to price adjustments if the scope of the project changes or unforeseen conditions arise. In such cases, we will submit formal requests for adjustment of the lump sum via formal change orders or contract amendments. The second type,Under fixed-unit price involves performing an estimatedcontracts, we perform a number of units of work at an agreed price per unit with the total payment under the contract determined by the actual number of units delivered.
Our Revenue is recognized for fixed-price contracts are typically negotiated and arise inusing the design or constructioninput method measured on a cost-to-cost basis as the Company believes this is the best measure of a project with a specified scope rather than hard bid where the client primarily selects the lowest qualified bidder. Fixed-price contracts often arise in the areas of construction management and design-build services. Construction management services are typically in the form of general administrative oversight (in which we do not assume responsibility for construction means and methods). Under our design-build projects, we are typically responsible for the design or construction of a project with the fixed contract price negotiated
Table of Contentsprogress towards completion.
after we have had the opportunity to secure specific bids from various subcontractors including a contingency fee. We may use our own design or a third party design.
Some of our fixed-price contracts require us to provide surety bonds or parent company guarantees to assure our clients that their project will be completed in accordance with the terms of the contracts as further disclosed in Note 18—Commitments and Contingencies. In such cases, we may require our primary subcontractors to provide similar performance bonds and guarantees and to be adequately insured, and we may flow down the terms and conditions set forth in our agreement on to our subcontractors. There may be risks associated with completing these projects profitably if we are not able to perform our services within the fixed-price contract terms.
At September 30, 2017, our contracted backlog was comprised of 42%, 30%, and 28% cost-reimbursable, guaranteed maximum price, and fixed-price contracts, respectively.
Some of our larger contracts may operate under joint ventures or other arrangements under which we team with other reputable companies, typically companies with which we have worked for many years. This is often done where the scale of the project dictates such an arrangement or when we want to strengthen either our market position or our technical skills.
Backlog
Backlog represents revenue we expect to realize for work completed by our consolidated subsidiaries and our proportionate share of work to be performed by unconsolidated joint ventures. Backlog is expressed in terms of gross revenue and, therefore, may include significant estimated amounts of third party or pass-through costs to subcontractors and other parties. Backlog forWe report transaction price allocated to remaining unsatisfied performance obligations (RUPO) of $21.9 billion, as described in Note 4, Revenue Recognition, in the notes to our consolidated subsidiaries is comprised of contractedfinancial statements. The most significant differences between our backlog and awarded backlog. Our contractedRUPO are backlog includes revenue we expect to record in the future from signed contracts, and in the case of a public client, where the project has been funded. Our awarded backlog includescontains revenue we expect to record in the future where we have been awarded the work, but the contractual agreement has not yet been signed. The net results of oursigned, unconsolidated joint ventures are recognized asventure backlog where we expect to realize income through equity earnings rather than revenue, and awarded and contracted backlog representing our proportionate sharerevenue related to service contracts that extend beyond the termination provision of workthose contracts, where RUPO requires us to assume the contract will be performed by unconsolidated joint venturesterminated at its earliest convenience. Accordingly, RUPO is not presented as revenue in our Consolidated Statements of Operations.$19.3 billion lower than backlog. For non-government contracts, our backlog includes future revenue at contract rates, excluding contract renewals or extensions that are at the discretion of the client. For contracts with a not-to-exceed maximum amount, we include revenue from such contracts in backlog to the extent of the remaining estimated amount. We calculate backlog without regard to possible project reductions or expansions or potential cancellations until such changes or cancellations occur. No assurance can be given that we will ultimately realize our full backlog. Backlog fluctuates due to the timing of when contracts are awarded and contracted and when contract revenue is recognized. Many of our contracts require us to provide services over more than one year. Our backlog for the year ended September 30, 20172023 increased $4.7$1.0 billion, or 11.0%2.5%, to $47.5$41.2 billion as compared to $42.8$40.2 billion for the corresponding period last year, primarily due to thean increase in our MS segment.
Table of ContentsInternational design business.
The following summarizes contracted and awarded backlog (in billions):
| | | | | | | |
| | September 30, | |
|---|
| | 2017 | | 2016 | |
|---|
Contracted backlog: | | | | | | | |
DCS segment | | $ | 8.8 | | $ | 8.0 | |
CS segment | | | 12.3 | | | 12.0 | |
MS segment | | | 3.1 | | | 3.7 | |
| | | | | | | | |
Total contracted backlog | | $ | 24.2 | | $ | 23.7 | |
| | | | | | | | |
| | | | | | | | |
| | | | | | | | |
Awarded backlog: | | | | | | | |
DCS segment | | $ | 7.3 | | $ | 6.4 | |
CS segment | | | 4.0 | | | 5.1 | |
MS segment | | | 8.7 | | | 3.9 | |
| | | | | | | | |
Total awarded backlog | | $ | 20.0 | | $ | 15.4 | |
| | | | | | | | |
| | | | | | | | |
| | | | | | | | |
Unconsolidated joint venture backlog: | | | | | | | |
CS segment | | $ | 2.3 | | $ | 2.6 | |
MS segment | | | 1.0 | | | 1.1 | |
| | | | | | | | |
Total unconsolidated joint venture backlog | | $ | 3.3 | | $ | 3.7 | |
| | | | | | | | |
| | | | | | | | |
| | | | | | | | |
Total backlog: | | | | | | | |
DCS segment | | $ | 16.1 | | $ | 14.4 | |
CS segment | | | 18.6 | | | 19.7 | |
MS segment | | | 12.8 | | | 8.7 | |
| | | | | | | | |
Total backlog | | $ | 47.5 | | $ | 42.8 | |
| | | | | | | | |
| | | | | | | | |
| | | | | | | | |
Competition
| | | | | | |
| | September 30, |
| | 2023 | | 2022 |
Backlog: | | | | | | |
Americas segment | | $ | 34.9 | | $ | 35.1 |
International segment | | | 6.3 | | | 5.1 |
Total backlog | | $ | 41.2 | | $ | 40.2 |
Competition
The markets we serve are highly fragmented and we compete with a large number of regional, national and international companies. We have numerous competitors, ranging from small private firms to multi-billion dollar companies, some of which have greater financial resources or that are more specialized and concentrate their resources in particular areas of expertise. The extent of our competition varies according to the particular markets and geographic area. The degree and type of competition we face is also influenced by the type and scope of a particular project. The technical and professional aspects of our services generally do not require large upfront capital expenditures and, therefore, provide limited barriers against new competitors.
We believe that we are well positioned to compete in our markets because of our reputation, our cost effectiveness, our long-term client relationships, our extensive network of offices, our employee expertise, and our broad range of services. In addition, as a result of our extensive national and international network, we are able to offer our clients localized knowledge and expertise, as well as the support of our worldwide professional staff. In addition, through investments in technology and innovation, we are able to bring advanced solutions to clients.
Seasonality
We experience seasonal trends in our business. Our revenue is typically higher in the last half of the fiscal year. The fourth quarter of our fiscal year (July 1 to September 30) is typically our strongest quarter. We find that the U.S. federal government tends to authorize more work during the period preceding the end of our fiscal year, September 30. In addition, many U.S. state governments with fiscal years ending on June 30 tend to accelerate spending during their first quarter, when new funding becomes available. Further, our construction management revenue typically increases during the high construction season of
Table of Contents
the summer months. Within the United States, as well as other parts of the world, our business generally benefits from milder weather conditions in our fiscal fourth quarter, which allows for more productivity from our on-site civil services.quarter. Our construction and project management services also typically expand during the high construction season of the summer months. The first quarter of our fiscal year (October 1 to December 31) is typically our weakestlowest revenue quarter. The harsher weather conditions impact our ability to complete work in parts of North America and the holiday season schedule affects our productivity during this period. For these reasons, coupled with the number and significance of client contracts commenced and completed during a particular period, as well as the timing of expenses incurred for corporate initiatives, it is not unusual for us to experience seasonal changes or fluctuations in our quarterly operating results.
Risk Management and Insurance
Risk management is an integral part of our project management approach and our project execution process. We have an Office of Risk Management that reviews and oversees the risk profile of our operations.operations through a tiered process of formal risk committees with the highest-risk pursuits subject to vetting at each tier. Following contract execution, and commencement of delivery, projects are monitored via a formal monthly or quarterly project-review process designed to ensure project performance and risk mitigation. Also, pursuant to our internal delegations of authority, we have an internal process whereby a group of senior members of our risk management team evaluateevaluates risk through internal risk analyses of higher-risk projects, contracts or other business decisions. We maintain insurance covering professional liability and claims involving bodily injury and property damage.damage, among other coverages. Wherever possible, we endeavor to eliminate or reduce the risk of loss on a project through the use of quality assurance/control, risk management, workplace safety and similar methods.
Regulations
Our business is impacted by environmental, health and safety, government procurement, anti-bribery and other government regulations and requirements. Below is a summary of some of the significant regulations that impact our business.
Environmental, Health and Safety.Our business involves the planning, design, program management, construction and construction management, and operations and maintenance at various project sites, including, but not limited to, pollution control systems, nuclear facilities, hazardous waste and Superfund sites, contract mining sites, hydrocarbon production, distribution and transport sites, military bases and other infrastructure-related facilities. We also regularly perform work including oil field and pipeline construction services in and around sensitive environmental areas, such as rivers, lakes and wetlands. In addition, we have contracts with U.S. federal government entities to destroy hazardous materials, including chemical agents and weapons stockpiles, as well as to decontaminate and decommission nuclear facilities. These activities may require us to manage, handle, remove, treat, transport and dispose of toxic or hazardous substances.
Significant fines, penalties and other sanctions may be imposed for non-compliance with environmental and health and safety laws and regulations, and some laws provide for joint and several strict liabilities for remediation of releases of hazardous substances, rendering a person liable for environmental damage, without regard to negligence or fault on the part of such person. These laws and regulations may expose us to liability arising out of the conduct of operations or conditions caused by others, or for our acts that were in compliance with all applicable laws at the time these acts were performed. For example, there are a number of governmental laws that strictly regulate the handling, removal, treatment, transportation and disposal of toxic and hazardous substances, such as the Comprehensive Environmental Response Compensation and Liability Act of 1980, and comparable national and state laws, that impose strict, joint and several liabilities for the entire cost of cleanup, without regard to whether a company knew of or caused the release of hazardous substances. In addition, some environmental regulations can impose liability for the entire clean-up upon owners, operators, generators, transporters and other persons arranging for the treatment or disposal of such hazardous substances related to contaminated facilities or project sites. Other federal environmental, health and safety laws
Table of Contents
affecting us include, but are not limited to, the Resource Conservation and Recovery Act, the National Environmental Policy Act, the Clean Air Act, the Clean Air Mercury Rule, the Occupational Safety and Health Act, the Toxic Substances Control Act, and the Superfund Amendments and Reauthorization Act, as well as other comparable national and state laws. Liabilities related to environmental contamination or human exposure to hazardous substances, comparable national and state laws or a failure to comply with applicable regulations could result in substantial costs to us, including cleanup costs, fines and civil or criminal sanctions, third-party claims for property damage or personal injury, or cessation of remediation activities.
Some of our business operations are covered by Public Law 85-804, which provides for indemnification by the U.SU.S. federal government against claims and damages arising out of unusually hazardous or nuclear activities performed at the request of the U.S. federal government. Should public policies and laws change, however, U.S. federal government indemnification may not be available in the case of any future claims or liabilities relating to hazardous activities that we undertake to perform.
Government Procurement. The services we provide to the U.S. federal government are subject to Federal Acquisition Regulation, (FAR), the Truth in Negotiations Act, Cost Accounting Standards, (CAS), the Services Contract Act, False Claims Act, export controls rules and Department of Defense (DOD) security regulations, as well as many other laws and regulations. These laws and regulations affect how we transact business with our clients and, in some instances, impose additional costs on our business operations. A violation of specific laws and regulations could lead to fines, contract termination or suspension of future contracts. Our government clients can also terminate, renegotiate, or modify any of their contracts with us at their convenience; and many of our government contracts are subject to renewal or extension annually.
Anti-Bribery and other regulations. We are subject to the U.S. Foreign Corrupt Practices Act, the U.K. Bribery Act of 2010, and similar anti-bribery laws, which generally prohibit companies and their intermediaries from making improper payments to foreign government officials for the purpose of obtaining or retaining business. The U.K. Bribery Act of 2010 prohibits both domestic and international bribery, as well as bribery across both private and public sectors. In addition, an organization that "fails to prevent bribery" committed by anyone associated with the organization can be charged under the U.K. Bribery Act unless the organization can establish the defense of having implemented "adequate procedures" to prevent bribery. To the extent we export technical services, data and products outside of the U.S., we are subject to U.S. and international laws and regulations governing international trade and exports, including, but not limited to, the International Traffic in Arms Regulations, the Export Administration Regulations, and trade sanctions against embargoed countries. We provide services to the DOD and other defense-related entities that often require specialized professional qualifications and security clearances. In addition, as engineering design services professionals, we are subject to a variety of local, state, federal, and foreign licensing and permit requirements and ethics rules.
Personnel
Our principal asset is our employees and large percentages of our employees have technical and professional backgrounds and undergraduate and/or advanced degrees. At the end of our fiscal 2017, we employed approximately 87,000 persons, of whom approximately 45,000 were employed in the United States. Over 10,000 of our domestic employees are covered by collective bargaining agreements or by specific labor agreements, which expire upon completion of the relevant project.
Geographic Information
For financial geographic information, please refer to Note 19 to the notes to our consolidated financial statements found elsewhere in this Form 10-K.
Table of Contents
Raw Materials
We purchase most of the raw materials and components necessary to operate our business from numerous sources. However, the price and availability of raw materials and components may vary from year to year due to customer demand, production capacity, market conditions, and material shortages. While we do not currently foresee the lack of availability of any particular raw materials in the near term, prolonged unavailability of raw materials necessary to our projects and services or significant price increases for those raw materials could have a material adverse effect on our business in the near term.
Government Contracts
Generally, our government contracts are subject to renegotiation or termination of contracts or subcontracts at the discretion of the U.S. federal, state or local governments, and national governments of other countries.
Trade Secrets and Other Intellectual Property
We rely principally on trade secrets, confidentiality policies and other contractual arrangements to protect much of our intellectual property.
Available Information
The reports we file with the Securities and Exchange Commission, including annual reports on Form 10-K, quarterly reports on Form 10-Q, current reports on Form 8-K and proxy materials, including any amendments, are available free of charge on our website atwww.aecom.com as soon as reasonably practicable after we electronically file such material with or furnish it to the SEC. You may read and copy any materials filed with the SEC at the SEC's Public Reference Room at 100 F Street, N.E., Washington, D.C. 20549. Please call the SEC at 1-800-SEC-0330 for further information about the public reference room. The SEC also maintains a web site (website www.sec.gov(www.sec.gov)) containing reports, proxy and information statements, and other information that we file with the SEC. Our Corporate Governance Guidelines and our Code of Ethics are available on our website atwww.aecom.com under the "Investors"“Investors” section. Copies of the information identified above may be obtained without charge from us by writing to AECOM, 1999 Avenue of the Stars,13355 Noel Road, Suite 2600, Los Angeles, California 90067,400, Dallas, Texas 75240, Attention: Corporate Secretary.
ITEM 1A. RISK FACTORS
We operate in a changing global environment that involves numerous known and unknown risks and uncertainties that could materially adversely affect our operations. The risks described below highlight some of the factors that have affected, and in the future could affect our operations. Additional risks we do not yet know of or that we currently thinkbelieve are immaterial may also affect our business operations. If any of the events or circumstances described in the following risks actually occurs, our business, financial condition or results of operations could be materially adversely affected.
Risks Related to Our Markets, Customers and Business
Our industry is highly competitive, and we may be unable to compete effectively, which could result in reduced revenue, profitability and market share.
We are engaged in a highly competitive business. The markets we serve are highly fragmented and we compete with a large number of regional, national and international companies. These competitors may have greater financial and other resources than we do. Others are smaller and more specialized, and concentrate their resources in particular areas of expertise. The extent of our competition varies according to the particular markets and geographic area. In addition, the technical and professional aspects of some of our services generally do not require large upfront capital expenditures and provide limited barriers against new competitors.
The degree and type of competition we face is also influenced by the type and scope of a particular project. Our clients make competitive determinations based upon qualifications, experience, performance, reputation, technology, customer relationships, price and ability to provide the relevant services in a timely, safe and cost-efficient manner. Increased competition may result in our inability to win bids for future projects, increased margin pressure and loss of revenue, profitability and market share.
Our ability to compete in our industry will be harmed if we do not retain the continued services of our senior management and key technical personnel.
We rely heavily upon the expertise and leadership of our people. There is strong competition for qualified technical and management personnel in the sectors in which we compete. We may not be able to continue to attract and retain qualified technical and management personnel, such as engineers, architects and project managers, who are necessary for the development of our business or to replace qualified personnel in the timeframe demanded by our clients. Also, some of our personnel hold government granted eligibility that may be required to obtain government projects. Loss of the services of, or failure to recruit, senior management or key technical personnel could impact the long-term performance of the Company and limit our ability to successfully complete existing projects and compete for new projects.
Demand for our services is cyclical and may be vulnerable to sudden economic downturns and reductions in government and private industry spending. If economic conditions remain uncertain and/or weaken, our revenue and profitability could be adversely affected.
Demand for our services is cyclical and may be vulnerable to sudden economic downturns, interest rate fluctuations and reductions in government and private industry spending that result in clients delaying, curtailing or canceling proposed and existing projects. For example, commodity price volatility has negatively impacted our oil and gas business and business regions whose economies are substantially dependent on commodities prices such as the Middle East and has also impacted North American oil and gas clients' investment decisions. In addition, our clients may find it more difficult to raise capital in the future to fund their projects due to uncertainty in the municipal and general credit markets.
Table of Contents
Where economies are weakening, our clients may demand more favorable pricing or other terms while their ability to pay our invoices or to pay them in a timely manner may be adversely affected. Our government clients may face budget deficits that prohibit them from funding proposed and existing projects. If economic conditions remain uncertain and/or weaken and/or government spending is reduced, our revenue and profitability could be materially adversely affected.
We depend on long-term government contracts, some of which are only funded on an annual basis. If appropriations for funding are not made in subsequent years of a multiple-year contract, we may not be able to realize all of our anticipated revenue and profits from that project.
A substantial majorityportion of our revenue is derived from contracts with agencies and departments of national, state, and local governments. During fiscal 20172023 and 2016,2022, approximately 48%43% and 47%41%, respectively, of our revenue was derived from contracts with government entities.
Most government contracts are subject to the government'ssuch government’s budgetary approval process. Legislatures typically appropriate funds for a given program on a year-by-yearan annual basis, even though contract performance may take more than one year. In addition, public-supported financing such as state and local municipal bonds may be only partially raised to support existing infrastructure projects. As
a result, at the beginning of a program, the related contract is only partially funded, and additional funding is normally committed only as appropriations are made in each fiscal year. These appropriations, and the timing of payment of appropriated amounts, may be influenced by, among other things, the state of the economy, an extended government shutdown, competing priorities for appropriation, changes in administration or control of legislatures, and the timing and amount of tax receipts and the overall level of government expenditures. Similarly, the impact of an economic downturn on state and local governments may make it more difficult for them to fund infrastructure projects. If appropriations are not made in subsequent years on our government contracts, then we will not realize all of our potential revenue and profit from that contract.those contracts.
If we are unable to win or renew government contracts during regulated procurement processes, our operations and financial results would be harmed.
Government contracts are awarded through a regulated procurement process. The federal government has awarded multi-year contracts with pre-established terms and conditions, such as indefinite delivery contracts, that generally require those contractors that have previously been awarded the indefinite delivery contract to engage in an additional competitive bidding process before a task order is issued. In addition, theThe federal government has also awarded federal contracts based on a low-price, technically acceptable criteria emphasizing price over qualitative factors, such as past performance. As a result of these competitive pricing pressures, our profit margins on future federal contracts may be reduced and may require us to make sustained efforts to reduce costs in order to realize revenues and profits under government contracts. If we are not successful in reducing the amount of costs we incur, our profitability on government contracts will be negatively impacted. In addition, we may not be awarded government contracts because of existing government policies designed to protect small businesses and under-represented minority contractors. Our inability to win or renew government contracts during regulated procurement processes could harm our operations and reduce our profits and revenues.
Governmental agencies may modify, curtail or terminate our contracts at any time prior to their completion and, if we do not replace them, we may suffer a decline in revenue.
Most government contracts may be modified, curtailed or terminated by the government either at its discretion or upon the default of the contractor. If the government terminates a contract at its discretion, then we typically are able to recover only costs incurred or committed, settlement expenses and profit on work completed prior to termination, which could prevent us from recognizing all of our potential revenue and profits from that contract. In addition, for certainsome assignments, the U.S. government may attempt to "insource"“insource” the services to government employees rather than outsource to a contractor. If a government
Table of Contents
terminates a contract due to our default, we could be liable for excess costs incurred by the government in obtaining services from another source.
Our contracts with governmental agencies are subject to audit, which could result in adjustments to reimbursable contract costs or, if we are charged with wrongdoing, possible temporary or permanent suspension from participating in government programs.
Our books and records are subject to audit by the various governmental agencies we serve and their representatives. These audits can result in adjustments to the amount of contract costs we believe are reimbursable by the agencies and the amount of our overhead costs allocated to the agencies. If such matters are not resolved in our favor, they could have a material adverse effect on our business. In addition, if one of our subsidiaries is charged with wrongdoing as a result of an audit, that subsidiary, and possibly our company as a whole, could be temporarily suspended or could be prohibited from bidding on and receiving future government contracts for a period of time. Furthermore, as a government contractor, we are subject to an increased risk of investigations, criminal prosecution, civil fraud actions, whistleblower lawsuits, and other legal actions and liabilities to which purely private sector companies are not, the results of which could materially adversely impact our business. For example, afrom time to time we may be subject to qui tam lawsuit related to our affiliate, URS Energy and Construction, was unsealed in 2016. Qui tam lawsuits, which typically allege that we have made false statements or certifications in connection with claims for payment, or improperly retained overpayments, from the government. These suits may remain under seal (and hence, be unknown to us) for some time while the government decides whether to intervene on behalf of the qui tam plaintiff.
Risks Related to our Capital Structure
The agreements governing our debt contain a number of restrictive covenants which will limit our ability to finance future operations, acquisitions or capital needs or engage in other business activities that may be in our interest.
The Credit Agreement (defined below) and the indentures governing our debt contain a number of significant covenants that impose operating and other restrictions on us and our subsidiaries. Such restrictions affect or will affect and, in many respects, limit or prohibit, among other things, our ability and the ability of some of our subsidiaries to:
| ● | incur additional indebtedness; |
| ● | pay dividends and make other distributions in respect of our equity securities; |
| ● | redeem or repurchase our equity securities; |
| ● | distribute excess cash flow from foreign to domestic subsidiaries; |
| ● | make investments or other restricted payments; |
| ● | enter into transactions with affiliates; and |
| ● | effect mergers or consolidations. |
In addition, our Credit Agreement requires us to comply with a consolidated interest coverage ratio and consolidated leverage ratio. Our substantial leverageability to comply with these ratios may be affected by events beyond our control. These restrictions could limit our ability to plan for or react to market or economic conditions or meet capital needs or otherwise restrict our activities or business plans, and significant debt service obligations could adversely affect our financial condition and our ability to fulfillfinance our operations, acquisitions, investments or strategic alliances or other capital needs or to engage in other business activities that would be in our interest. A breach of any of these covenants or our inability to comply with the required financial ratios could result in a default under our debt instruments. If an event of default occurs, our creditors could elect to:
| ● | declare all borrowings outstanding, together with accrued and unpaid interest, to be immediately due and payable; |
| ● | require us to apply all of our available cash to repay the borrowings; or |
| ● | prevent us from making debt service payments on our borrowings. |
If we were unable to repay or otherwise refinance these borrowings when due, the applicable creditors could sell the collateral securing some of our debt instruments, which constitutes substantially all of our domestic and foreign, wholly owned subsidiaries’ assets.
Our variable rate indebtedness subjects us to interest rate risk, which could cause our debt service obligations and operate our business.to increase significantly.
We had approximately $3.9 billion of indebtedness (excluding intercompany indebtedness) outstanding as of September 30, 2017, of which $1.0 billion was secured obligations (exclusive of $58.1 million of outstanding undrawn letters of credit) and we have an additional $991.9 million of availabilityBorrowings under our Credit Agreement (after giving effect to outstanding letters of credit), all of which would be secured debt, if drawn. Our financial performance could be adversely affected by our substantial leverage. We may also incur significant additional indebtedness in the future, subject to certain conditions.
This high level of indebtedness could have important negative consequences to us, including, but not limited to:
•we may have difficulty satisfying our obligations with respect to outstanding debt obligations;
•we may have difficulty obtaining financing in the future for working capital, acquisitions, capital expenditures or other purposes;
•we may need to use all, or a substantial portion, of our available excess cash flow to pay interest and principal on our debt, which will reduce the amount of money available to finance our operations and other business activities, including, but not limited to, working capital requirements, acquisitions, capital expenditures or other general corporate or business activities;
•our debt level increases our vulnerability to general economic downturns and adverse industry conditions;
•our debt level could limit our flexibility in planning for, or reacting to, changes in our business and in our industry in general;
•our substantial amount of debt and the amount we must pay to service our debt obligations could place us at a competitive disadvantage compared to our competitors that have less debt;
•we may have increased borrowing costs;
Table of Contents
•our clients, surety providers or insurance carriers may react adversely to our significant debt level;
•we may have insufficient funds, and our debt level may also restrict us from raising the funds necessary, to retire certain of our debt instruments tendered to us upon maturity of our debt or the occurrence of a change of control, which would constitute an event of default under certain of our debt instruments; and
•our failure to comply with the financial and other restrictive covenants in our debt instruments which, among other things, require us to maintain specified financial ratios and limit our ability to incur debt and sell assets, could result in an event of default that, if not cured or waived, could have a material adverse effect on our business or prospects.
Our high level of indebtedness requires that we use a substantial portion of our cash flow from operations to pay principal of, and interest on, our indebtedness, which will reduce the availability of cash to fund working capital requirements, future acquisitions, capital expenditures or other general corporate or business activities.
In addition, a portion of our indebtedness bears interestare at variable rates including borrowings under our Credit Agreement. If marketof interest and expose us to interest rate risk. In March 2022, the Federal Reserve began and it has continued, and is expected to continue, to raise interest rates in an effort to curb inflation. As interest rates increase, our debt service obligations on the variable rate indebtedness will increase even though the amount borrowed remains the same, and our variable-rate debtnet income and cash flows, including cash available for servicing our indebtedness, will rise, which could adversely affect our cash flow, results of operations and financial position. Although we may employ hedging strategiescorrespondingly decrease. A 1.00% increase in such that a portion of the aggregate principal amount of our term loans carries a fixed rate of interest any hedging arrangement put in place may not offer complete protection from this risk. Additionally, the remaining portion of borrowingsrates would increase total interest expense under our Credit Agreement for the year ended September 30, 2023 by $8.6 million, including the effect of our interest rate swap and interest rate cap agreements. We may, from time to time, enter into additional interest rate swaps that isinvolve the exchange of floating for fixed rate interest payments in order to reduce interest rate volatility. However, we may not hedged willmaintain interest rate swaps with respect to all of our variable rate indebtedness, and any swaps we enter into may not fully mitigate our interest rate risk and could be subject to changes in interest rates.credit risk themselves.
If we are unable to continue to access credit on acceptable terms, our business may be adversely affected.
The Budget Control Actchanging nature of 2011the global credit markets could significantly reduce U.S. government spendingmake it more difficult for the services we provide.
Under the Budget Control Act of 2011, an automatic sequestration process, or across-the-board budget cuts (half of which were defense-related), was triggered when the Joint Select Committee on Deficit Reduction, a committee of twelve members of Congress, failedus to agree on a deficit reduction planaccess funds, refinance our existing indebtedness, enter into agreements for the U.S. federal budget. Although the Bipartisan Budget Act of 2013 provides some sequester relief until the end of 2017, absent additional legislative or other remedial action, the sequestration requires reduced U.S. federal government spending from fiscal year 2017 through fiscal year 2025. A significant reduction in federal government spending or a change in budgetary priorities could reduce demand for our services, cancel or delay federal projects, and result in the closure of federaluncommitted debt bond facilities and significant personnel reductions, which could have a material adverse effectnew indebtedness, replace our existing revolving and term credit agreements or obtain funding through the issuance of our securities. We use credit facilities to support our working capital and other needs. There is no guarantee that we can continue to renew our credit facility on terms as favorable as those in our resultsexisting credit facility and, if we are unable to do so, our costs of operationsborrowing and financial condition.our business may be adversely affected.
Risks Related to our International Operations
Our operations worldwide expose us to legal, political and economic risks in different countries as well as currency exchange rate fluctuations and impacts from inflation that could harm our business and financial results.
During fiscal 2017,2023, revenue attributable to our services provided outside of the United States to non-U.S. clients was approximately 28%29% of our total revenue. There are risks inherent in doing business internationally, including:
•imposition of governmental controls and changes in laws, regulations or policies;
•political and economic instability, such as in the Middle East and Africa;
•civil unrest, acts of terrorism, force majeure, war, or other armed conflict;
•changes in U.S. and other national government trade policies affecting the markets for our services;
•changes in regulatory practices, tariffs and taxes;
•potential non-compliance with a wide variety of laws and regulations, including anti-corruption, export control and anti-boycott laws and similar non-U.S. laws and regulations;
| ● | the ongoing conflict between Russia and Ukraine, which has resulted in the imposition by the U.S. and other nations of restrictive actions against Russia, Belarus and certain banks, companies and individuals; |
| ● | imposition of governmental controls and changes in laws, regulations or policies; |
| ● | political and economic instability, including in the Middle East; |
| ● | civil unrest, acts of terrorism, force majeure, war, or other armed conflict; |
| ● | changes in U.S. and other national government trade policies affecting the markets for our services, such as retaliatory tariffs between the United States and China; |
| ● | political unrest in Hong Kong where we have a significant presence; |
| ● | impact of the Covid-19 pandemic and its related economic impacts; |
| ● | increases in the consumer price index and interest rates; |
| ● | changes in regulatory practices, tariffs and taxes; |
| ● | potential non-compliance with a wide variety of laws and regulations, including anti-corruption, export control and anti-boycott laws and similar non-U.S. laws and regulations; |
| ● | changes in labor conditions; |
Table of Contents
•changes in labor conditions;
•logistical and communication challenges; and
•currency exchange rate fluctuations, devaluations and other conversion restrictions.
| ● | logistical and communication challenges; and |
| ● | currency exchange rate fluctuations, devaluations and other conversion restrictions. |
Any of these factors could have a material adverse effect on our business, results of operations or financial condition.
In addition, Saudi Arabia, the United Arab Emirates (UAE), Bahrain and Egypt have cut diplomatic ties and restricted business with Qatar by closing off access to that country with an air, sea and land traffic embargo. During the economic embargo, products cannot be shipped directly to Qatar from the UAE, Saudi Arabia or Bahrain and financial services may be limited. Our Qatarian business is a significant part of our Middle East operations with approximately one thousand employees. The economic embargo may make it difficult to complete ongoing Qatarian projects and could reduce future demand for our services.
We operate in many different jurisdictions and we could be adversely affected by legislative actions of governments, as well as violations of the U.S. Foreign Corrupt Practices Act and similar worldwide anti-corruption laws.
The U.S. Foreign Corrupt Practices Act (FCPA) and similar worldwide anti-corruption laws, including the U.K. Bribery Act of 2010, generally prohibit companies and their intermediaries from making improper payments to non-U.S. officials for the purpose of obtaining or retaining business. Our internal policies mandate compliance with these anti-corruption laws, including the requirements to maintain accurate information and internal controls which may fall within the purview of the FCPA, its books and records provisions or its anti-bribery provisions. We operate in many parts of the world that have experienced governmental corruption to some degree; and, in certainsome circumstances, strict compliance with anti-corruption laws may conflict with local customs and practices. Despite our training and compliance programs, we cannot assure that our internal control policies and procedures always will protect us from reckless or criminal acts committed by our employees or agents. Our continued expansion outside the U.S., including in developing countries, could increase the risk of such violations in the future. In addition, from time to time, government investigations of corruption in construction-related industries affect us and our peers. Violations of these laws, or allegations of such violations, could disrupt our business and result in a material adverse effect on our results of operations or financial condition.
The Building Safety Act, the primary legislation which introduces a new framework for the regulation of the UK construction industry, became law on April 28, 2022 with certain provisions coming into force on June 28, 2022 and remaining provisions and secondary legislation to follow. The Act extends liability periods for some historical defects in residential properties completed prior to 2022, creates a new government regulatory body responsible for building safety and new legal obligations regarding building safety, reallocates the risk related to design and construction, and requires the development of a more stringent regulatory regime for select buildings. The new legislation may result in new risk, regulatory and cost challenges for our United Kingdom and global operations.
Any of these events could adversely affect our United Kingdom, European operations and overall business and financial results.
We work in international locations where there are high security risks, which could result in harm to our employees and contractors or material costs to us.
Some of our services are performed in high-risk locations, such as the Middle East, Africa, and SouthwestSoutheast Asia, where the country or location is suffering from political, social or economic problems, or war or civil unrest. In those locations where we have employees or operations, we may incur material costs to maintain the safety of our personnel. Despite these precautions, the safety of our personnel in these locations may continue to be at risk. Acts of terrorism and threats of armed conflicts in or around various areas in which we operate could limit or disrupt markets and our operations, including disruptions resulting from the evacuation of personnel, cancellation of contracts, or the loss of key employees, contractors or assets.
Risks Related to Our Operations and Technology
Many of our project sites are inherently dangerous workplaces. Failure to maintain safe work sites and equipment could result in environmental disasters, employee deaths or injuries, reduced profitability, the loss of projects or clients and possible exposure to litigation.
Our project sites often put our employees and others in close proximity with mechanized equipment, moving vehicles, chemical and manufacturing processes, and highly regulated materials. On some project sites, we may be responsible for safety and, accordingly, we have an obligation to implement effective safety procedures. If we fail to implement these procedures or if the procedures we implement are
Table of Contents
ineffective, we may suffer the loss of or injury to our employees, as well as expose ourselves to possible litigation. As a result, our failure to maintain adequate safety standards and equipment could result in reduced profitability or the loss of projects or clients, and could have a material adverse impact on our business, financial condition, and results of operations.
Cyber security breaches of our systems and information technology could adversely impact our ability to operate.
We develop, install and maintainCybersecurity threats, information technology systems for ourselves, as well as for customers. Client contracts for the performanceoutages and data privacy incidents could adversely harm our business.
We may experience errors, outages, or delays of service in our information technology services, as well as varioussystems, which could significantly disrupt our operations, impact our clients and employees, damage our reputation, and result in litigation and regulatory fines or penalties.
Various privacy and securities laws pertaining to client and employee data usage require us to manage and protect sensitive and confidential information, including federal and other government information, from disclosure. We also needproprietary information. For example, the European’s Union General Data Protection Regulation extends the scope of the European Union data protection laws to protect our own internal trade secrets and other business confidential information from disclosure. all companies processing data of European Union residents, regardless of the company’s location. In addition, the California Consumer Privacy Act increased the penalties for data privacy incidents.
We face the threatthreats to our computerinformation technology systems, ofincluding unauthorized access, computer hackers, computer viruses, malicious code, organized cyber-attacks, phishing and other securitycybersecurity problems and system disruptions, including possible unauthorized access to our and our clients'clients’ proprietary or classified information. We rely on industry-accepted security measures and technology to securely maintain all confidential and proprietary information on our information technology systems. WeIn the ordinary course of business, we have devoted and will continue to devote significant resources to the security of our computer systems; but they may still be vulnerable to these threats. A userbeen targeted by malicious cyber-attacks. Anyone who circumvents our security measures could misappropriate confidential or proprietary information, including information regarding us, our personnelemployees and/or our clients, or cause interruptions or malfunctions in our operations. Although we devote significant resources to our cybersecurity programs and have implemented security measures to protect our systems and to prevent, detect and respond to cybersecurity incidents, there can be no assurance that our efforts will prevent these threats. As a result,these security threats continue to evolve, we may be required to expend significantdevote additional resources to protect, prevent, detect and respond against the threat of these system disruptions and security breachesbreaches.
We also rely in part on third-party software and information technology vendors to run our critical accounting, project management and financial information systems. We depend on our software and information technology vendors to provide long-term software and hardware support for our information systems. Our software and information technology vendors may decide to discontinue further development, integration or long-term software and hardware support for our information systems, in which case we may need to alleviate problems caused by these disruptionsabandon one or more of our current information systems and breaches. migrate some or all of our accounting, project management and financial information to other systems, thus increasing our operational expense, as well as disrupting the management of our business operations.
Any of these events could damage our reputation and have a material adverse effect on our business, financial condition, results of operations and cash flows. Furthermore, while we maintain insurance that specifically covers these attacks, our coverage may not sufficiently cover all types of losses or claims that may arise.
An impairment charge of goodwill could have a material adverse impact on our financial conditionRisks Related to Contracts and results of operations.Joint Ventures
Because we have grown in part through acquisitions, goodwill and intangible assets-net represent a substantial portion of our assets. Under generally accepted accounting principles in the United States (GAAP), we are required to test goodwill carried in our Consolidated Balance Sheets for possible impairment on an annual basis based upon a fair value approach and whenever events occur that indicate impairment could exist. These events or circumstances could include a significant change in the business climate, including a significant sustained decline in a reporting unit's market value, legal factors, operating performance indicators, competition, sale or disposition of a significant portion of our business, a significant sustained decline in our market capitalization and other factors.
In addition, if we experience a decrease in our stock price and market capitalization over a sustained period, we would have to record an impairment charge in the future. The amount of any impairment could be significant and could have a material adverse impact on our financial condition and results of operations for the period in which the charge is taken.
Our business and operating results could be adversely affected by losses under fixed-price or guaranteed maximum price contracts.
Fixed-price contracts require us to either perform all work under the contract for a specified lump-sum or to perform an estimated number of units of work at an agreed price per unit, with the total payment determined by the actual number of units performed. In addition, we may enter guaranteed maximum price contracts where we guarantee a price or delivery date. For the year ended September 30, 2023, our revenue was comprised of 43%, 34%, and 23% cost-reimbursable, guaranteed maximum price, and fixed-price contracts, respectively. Fixed-price contracts expose us to a number of risks not inherent in cost-plus and time and material pricecost-reimbursable contracts, including underestimation of costs, ambiguities in specifications, unforeseen increases in or failures in estimating the cost of raw materials, equipment or labor, increased costs or difficulties,as a result of inflation, problems with new technologies, delays beyond our control, fluctuations in profit margins, failures of subcontractors to perform and economic or other changes that may occur during the contract period. In addition,United States and foreign trade policy actions and tariffs such as the 2018 tariffs on steel and aluminum imports in the United States could affect the profitability of our exposure to
Table of Contents
fixed-price construction cost overruns may increase over time as we increase our construction services.projects. Losses under fixed-price or guaranteed contracts could be substantial and adversely impact our results of operations.
Our failure to meet contractual schedule or performance requirements that we have guaranteed could adversely affect our operating results.
In certainsome circumstances, we can incur liquidated or other damages if we do not achieve project completion by a scheduled date. If we or an entity for which we have provided a guarantee subsequently fails to complete the project as scheduled and the matter cannot be satisfactorily resolved with the client, we may be responsible for cost impacts to the client resulting from any delay or the cost to complete the project. Our costs generally increase from schedule delays and/or could exceed our projections for a particular project. In addition, project performance can be affected by a number of factors beyond our control, including unavoidable delays from governmental inaction, public opposition, inability to obtain financing, weather conditions, unavailability of vendor materials, changes in the project scope of services requested by our clients, industrial accidents, environmental hazards, labor disruptions, pandemics including the current coronavirus, and other factors. Material performance problems for existing and future contracts could cause actual results of operations to differ from those anticipated by us and also could cause us to suffer damage to our reputation within our industry and client base.
We may not be able to maintain adequate surety and financial capacity necessary for us to successfully bid on and win contracts.
In line with industry practice, we are often required to provide surety bonds, standby letters of credit or corporate guarantees to our clients that indemnify the customerthem should our affiliate fail to perform its obligations under the terms of a contract. As of September 30, 20172023 and 2016,September 30, 2022, we were contingently liable for $5.7$4.6 billion and $3.3$4.4 billion, respectively, in issued surety bonds primarily to support project execution.execution and we had outstanding letters of credit totaling $883.3 million and $644.7 million, respectively. A surety may issue a performance or payment bond to guarantee to the client that our affiliate will perform under the terms of a contract. If our affiliate fails to perform under the terms of the contract, then the client may demand that the surety or another corporate affiliate provide the contracted services under the performance or payment bond.services. In addition, we would typically have obligations to indemnify the surety for any loss incurred in connection with the bond. If a surety bond or a letter of credit is required for a particular project and we are unable to obtain an appropriate surety bond or letter of credit, we may not be able to pursue that project, which in turn could have a material adverse impact on our business, financial condition, results of operations, and cash flows.
We conduct a portion of our operations through joint venture entities, over which we may have limited control.
Approximately 13%14% of our fiscal 20172023 revenue was derived from our operations through joint ventures or similar partnership arrangements, where control may be shared with unaffiliated third parties. As with most joint venture arrangements, differences in views among the joint venture participants may result in delayed decisions or disputes. We also cannot control the actions of our joint venture partners and we typically have joint and several liability with our joint venture partners under the applicable contracts for joint venture projects. These factors could potentially adversely impact the business and operations of a joint venture and, in turn, our business and operations.
Operating through joint ventures in which we are minority holders results in us having limited control over many decisions made with respect to projects and internal controls relating to projects. Sales of our services provided to our unconsolidated joint ventures were approximately 2% of our fiscal 20172023 revenue. We generally do not have control of these unconsolidated joint ventures. These joint ventures may not be subject to the same requirements regarding internal controls and internal control over financial reporting that we follow. As a result, internal control problems may arise with respect to these joint ventures, which could have a material adverse effect on our financial condition and results of operations and could also affect our reputation in the industries we serve.
Table of Contentsreputation.
We participate in certain joint ventures where we provide guarantees and may be adversely impacted by the failure of the joint venture or its participants to fulfill their obligations.
We have investments in and commitments to certain joint ventures with unrelated parties, including in connection with construction services, government services, and the investment activities of ACAP. RealFor example, real estate and infrastructure joint ventures are inherently risky and may result in future losses since real estate markets are impacted by economic trends and government policies that we do not control. These joint ventures from time to time may borrow money to help finance their activities and, in certainsome circumstances, we are required to provide guarantees of certain obligations of our affiliated entities. In addition, in connection with the investment activities of ACAP, the Company provideswe provide guarantees of certain obligations, including guarantees for completion of projects, repayment of debt, environmental indemnity obligations and other lender required guarantees. If these entities
AECOM Capital’s real estate development and investment activities are not ableinherently risky and may result in a future loss.
ACAP’s real estate business involves managing, sponsoring, investing in and developing commercial real estate projects and joint ventures (Real Estate Joint Ventures) that are inherently risky and may result in future losses based on factors beyond our control, including economic trends, government policies and competition. Our SEC-registered investment adviser jointly manages and sponsors the AECOM-Canyon Equity Fund, L.P. (the ���Fund”), in which the Company indirectly holds an equity interest and which also invests in and develops Real Estate Joint Ventures on behalf of its investors. Real Estate Joint Ventures rely on substantial amounts of third party borrowing to honorfinance their obligations underdevelopment activities and the lenders of such financings typically require AECOM or an affiliate to provide completion guarantees, werepayment guarantees, environmental indemnities and other lender required credit support guarantees to secure the Real Estate Joint Ventures financing. AECOM’s provision of lender guarantees is contingent upon the Real Estate Joint Ventures meeting AECOM’s underwriting criteria, which include an affiliate of AECOM acting as either the construction manager at risk or the owner’s representative for the project. Although the Fund and such Real Estate Joint Ventures have reserves that will be used to share any cost overruns of the Real Estate Joint Ventures, if such reserves are depleted, then AECOM may be required to expendmake support payments to fund non-budgeted cost overruns on behalf of the Fund (but not on behalf of the Fund’s co-partner or any unaffiliated limited partners of the Real Estate Joint Ventures). Some of the Fund’s limited partners may be permitted to make additional resources or suffer losses,equity co-investments in certain Real Estate Joint Ventures for which could be significant.AECOM will provide support payments on behalf of the limited partner co-investor in the event of a cost overrun of the Real Estate Joint Ventures after additional specific reserves have been depleted.
SystemsRisks Related to Laws and information technology interruption and unexpected data or vendor loss could adversely impact our ability to operate.Regulations
We rely heavily on computer, information and communications technology and related systems to properly operate. From time to time, we experience occasional system interruptions and delays. If we are unable to effectively upgrade our systems and network infrastructure and take other steps to protect our systems, the operation of our systems could be interrupted or delayed. Our computer and communications systems and operations could be damaged or interrupted by natural disasters, telecommunications failures, acts of war or terrorism and similar events or disruptions. Any of these or other events could cause system interruption, delays and loss of critical data, or delay or prevent operations, and adversely affect our operating results.
We also rely in part on third-party software and information technology vendors to run our critical accounting, project management and financial information systems. We depend on our software and information technology vendors to provide long-term software and hardware support for our information systems. Our software and information technology vendors may decide to discontinue further development, integration or long-term software and hardware support for our information systems; in which case, we may need to abandon one or more of our current information systems and migrate some or all of our accounting, project management and financial information to other systems, thus increasing our operational expense as well as disrupting the management of our business operations.
Misconduct by our employees, subcontractors, partners or consultants or our failure to comply with laws or regulations applicable to our business could cause us to lose customers or lose our ability to contract with government agencies.
As a government contractor, misconduct, fraud or other improper activities caused by our employees'employees’, partners'subcontractors’, partners’ or consultants'consultants’ failure to comply with laws or regulations could have a significant negative impact on our business and reputation. Such misconduct could include the failure to comply with procurement regulations, environmental regulations, regulations regarding the protection of sensitive government information, legislation regarding the pricing of labor and other costs in government contracts, regulations on lobbying or similar activities, and anti-corruption, anti-competition, export control and other applicable laws or regulations. Our failure to comply with applicable laws or regulations, misconduct by any of our employees, subcontractors, partners or consultants, or our failure to make timely and accurate certifications to government agencies regarding misconduct or potential misconduct could subject us to fines and penalties, loss of government granted eligibility, cancellation of contracts and suspension or debarment from contracting with government agencies, any of which may adversely affect our business.
Table of Contents
We may be required to contribute additional cash to meet our significant underfunded benefit obligations associated with pension benefit plans we manage or multiemployer pension plans in which we participate.
We have defined benefit pension plans for employees in the United States, United Kingdom, Canada, Australia, and Ireland. At September 30, 2017, our defined benefit pension plans had an aggregate deficit (the excess of projected benefit obligations over the fair value of plan assets) of approximately $553.0 million. In the future, our pension deficits may increase or decrease depending on changes in the levels of interest rates, pension plan performance and other factors that may require us to make additional cash contributions to our pension plans and recognize further increases in our net pension cost to satisfy our funding requirements. If we are forced or elect to make up all or a portion of the deficit for unfunded benefit plans, our results of operations could be materially and adversely affected.
A multiemployer pension plan is typically established under a collective bargaining agreement with a union to cover the union-represented workers of various unrelated companies. Our collective bargaining agreements with unions will require us to contribute to various multiemployer pension plans; however, we do not control or manage these plans. For the year ended September 30, 2017, we contributed $48.8 million to multiemployer pension plans. Under the Employee Retirement Income Security Act, an employer who contributes to a multiemployer pension plan, absent an applicable exemption, may also be liable, upon termination or withdrawal from the plan, for its proportionate share of the multiemployer pension plan's unfunded vested benefit. If we terminate or withdraw from a multiemployer plan, absent an applicable exemption (such as for some plans in the building and construction industry), we could be required to contribute a significant amount of cash to fund the multiemployer plan's unfunded vested benefit, which could materially and adversely affect our financial results; however, since we do not control the multiemployer plans, we are unable to estimate any potential contributions that could be required.
New legal requirements could adversely affect our operating results.
Our business and results of operations could be adversely affected by the passage of new climate change, defense, environmental, infrastructure and other laws, policies and regulations. Growing concerns about climate change and greenhouse gases, such as those adopted under the United Nations COP-21 Paris Agreement or the EPA Clean Power Plan, may result in the imposition of additional environmental regulations for our clients' fossil fuel projects. For example, legislation, international protocols, regulation or other restrictions on emissions regulations could increase the costs of projects for our clients or, in some cases, prevent a project from going forward, thereby potentially reducing the need for our services. In addition, relaxation or repeal of laws and regulations, or changes in governmental policies regarding environmental, defense, infrastructure or other industries we serve could result in a decline in demand for our services, which could in turn negatively impact our revenues. We cannot predict when or whether any of these various proposals may be enacted or what their effect will be on us or on our customers.
We may be subject to substantial liabilities under environmental laws and regulations.
Our services are subject to numerous environmental protection laws and regulations that are complex and stringent. Our business involves in part the planning, design, program management, construction and construction management, and operations and maintenance at various sites, including but not limited to, pollution control systems, nuclear facilities, hazardous waste and Superfund sites, contract mining sites, hydrocarbon production, distribution and transport sites, military bases and other infrastructure-related facilities. We also regularly perform work including oil field and pipeline construction services in and around sensitive environmental areas, such as rivers, lakes and wetlands. In addition, we have contracts within support of U.S. federal government entities to destroy hazardous materials, including chemical agents and weapons stockpiles, as well as to decontaminate and decommission nuclear facilities. These activities may require us to manage, handle, remove, treat, transport and dispose of toxic or hazardous substances. We also own and operate several properties in the U.S. and Canada that have been used for the storage and maintenance of equipmentconstruction equipment. In the conduct of operations on these properties, and upon which hydrocarbonsdespite precautions having been taken, it is possible that there have been accidental releases of individually relatively small amounts of fuel, oils, hydraulic fluids and other fluids while storing or other wastesservicing this equipment. Such accidental releases though individually relatively small may have been disposed or
Table of Contents
released.accumulated over time. Past business practices at companies that we have acquired may also expose us to future unknown environmental liabilities.
Significant fines, penalties and other sanctions may be imposed for non-compliance with environmental laws and regulations, and some environmental laws provide for joint and several strict liabilities for remediation of releases of hazardous substances, rendering a person liable for environmental damage, without regard to negligence or fault on the part of such person. These laws and regulations may expose us to liability arising out of the conduct of operations or conditions caused by others, or for our acts that were in compliance with all applicable laws at the time these acts were performed. For example, there are a number of governmental laws that strictly regulate the handling, removal, treatment, transportation and disposal of toxic and hazardous substances, such as Comprehensive Environmental Response Compensation and Liability Act of 1980, and comparable state laws, that impose strict, joint and several liabilities for the entire cost of cleanup, without regard to whether a company knew of or caused the release of hazardous substances. In addition, some environmental regulations can impose liability for the entire cleanup upon owners, operators, generators, transporters and other persons arranging for the treatment or disposal of such hazardous substances related to contaminated facilities or project sites. Other federal environmental, health and safety laws affecting us include, but are not limited to, the Resource Conservation and Recovery Act, the National Environmental Policy Act, the Clean Air Act, the Clean Air Mercury Rule, the Occupational Safety and Health Act, the Toxic Substances Control Act and the Superfund Amendments and Reauthorization Act and the Energy Reorganization Act of 1974, as well as other comparable national and state laws. Liabilities related to environmental contamination or human exposure to hazardous substances, or a failure to comply with applicable regulations could result in substantial costs to us, including cleanup costs, fines and civil or criminal sanctions, third-party claims for property damage or personal injury or cessation of remediation activities. Our continuing work in the areas governed by these laws and regulations exposes us to the risk of substantial liability.
Demand for our oilRisks Related to Climate Change
Climate change, natural disasters and gas services fluctuates.related environmental issues could have a material adverse impact on us.
Demand for our oilClimate-related events, such as an increase in frequency and severity of storms, floods, wildfires, droughts, hurricanes, freezing conditions, and other natural gas services fluctuates, and we dependdisasters, may have a long-term impact on our customers' willingnessbusiness, financial condition and results of operation. While we seek to make future expenditures to explore for, develop and produce oil and natural gas in the U.S. and Canada.mitigate our business risks associated with climate events, we recognize that there are inherent climate-related risks regardless of where we conduct our businesses. For example, a catastrophic natural disaster could negatively impact any of our office locations and the past volatilitylocations of our clients. Accordingly, a natural disaster has the potential to disrupt our and our clients’ businesses and may cause us to experience work stoppages, project delays, financial losses and additional costs to resume operations, including increased insurance costs or loss of cover, legal liability and reputational losses.
There is a rapidly evolving awareness and focus from stakeholders with respect to environmental, social and governance practices, which could affect our business.
Stakeholder expectations with respect to environmental, social and governance matters have been rapidly evolving and increasing. We risk damage to our reputation if we do not act responsibly in key areas including diversity and inclusion, environmental stewardship, support for local communities and corporate governance. A failure to adequately meet stakeholders’ expectations may result in loss of business, and an inability to attract and retain customers and talented personnel, which could have a negative impact on our business, results of operations and financial condition, and potentially on the price of oilour common stock and natural gas has significantly decreased existingcost of capital.
Risks Related to Acquisitions and future projects. Our customers' willingness to undertake future projects depends largely upon prevailing industry conditions that are influenced by numerous factors over which we have no control, such as the anticipated future prices for natural gas and crude oil. The multi-year decline in oil and natural gas prices has decreased spending and drilling activity, which has caused declines in demand for our services and in the prices we are able to charge for our services.Divestitures
Failure to successfully integrate acquisitions could harm our operating results.
We have grown in part as a result of acquisitions. For example, in July 2017 we acquired Shimmick Construction Company, Inc. We cannot assure that suitable acquisitions or investment opportunities will continue to be identified or that any of these transactions can be consummated on favorable terms or at all. Any future acquisitions will involve various inherent risks, such as:
•our ability to accurately assess the value, strengths, weaknesses, liabilities and potential profitability of acquisition candidates;
•the potential loss of key personnel of an acquired business;
•increased burdens on our staff and on our administrative, internal control and operating systems, which may hinder our legal and regulatory compliance activities;
•liabilities related to pre-acquisition activities of an acquired business and the burdens on our staff and resources to comply with, conduct or resolve investigations into such activities;
Table of Contents
•post-acquisition integration challenges; and
•post-acquisition deterioration in an acquired business that could result in lower or negative earnings contribution and/or goodwill impairment charges.
Furthermore, during the acquisition process and thereafter, our management may need to assume significant transaction-related responsibilities, which may cause them to divert their attention from our existing operations. If our management is unable to successfully integrate acquired companies, our operating results could be harmed. In addition, even if the operations of an acquisition are integrated successfully, we may not realize the full benefits of the acquisition, including the synergies, cost savings, or sales or growth opportunities that we expect. These benefits may not be achieved within the anticipated time frame, or at all.
Although we expect to realize certain benefits as a result of our acquisitions, there is the possibility that we may be unable to successfully execute or effectively integrate acquisitions and divestitures may not occur as planned.
We regularly review our portfolio of businesses in orderand pursue growth through acquisitions and seek to realizedivest non-core businesses. We may not be able to complete transactions on favorable terms, on a timely basis, or at all, and during the anticipated benefitsintegration of any acquisition, we may discover regulatory and compliance issues. In addition, our results of operations and cash flows may be adversely impacted by (i) the acquisitionsfailure of acquired businesses to meet or do so withinexceed expected returns; (ii) the intended timeframe.
We have been,failure to integrate acquired businesses on schedule and/or to achieve expected synergies; (iii) the inability to dispose of non-core assets and will continue to be, required to devote significant managementbusinesses on satisfactory terms and conditions; (iv) diversion of attention and resourcesincreased burdens on our employees; and (v) the discovery of unanticipated liabilities or other problems in acquired businesses for which we lack contractual protections, insurance or indemnities, or with regard to integrating the business practices and operations of the acquired companies with our business. Difficultiesdivested businesses, claims by purchasers to whom we have provided contractual indemnification. Additional difficulties we may encounter as part of the integration process include the following:
• | ● | the consequences of a change in tax treatment and the possibility that the full benefits anticipated from the acquisition or disposition will not be realized; |
Table of a change in tax treatment, including the costs of integration and compliance and the possibility that the full benefits anticipated from the acquisition will not be realized;
•any delay in the integration of management teams, strategies, operations, products and services;
•diversion of the attention of each company's management as a result of the acquisition;
•differences in business backgrounds, corporate cultures and management philosophies that may delay successful integration;
•the ability to retain key employees;
•the ability to create and enforce uniform standards, controls, procedures, policies and information systems;
•the challenge of integrating complex systems, technology, networks and other assets into those of ours in a seamless manner that minimizes any adverse impact on customers, suppliers, employees and other constituencies;
•potential unknown liabilities and unforeseen increased expenses or delays associated with the acquisition, including costs to integrate beyond current estimates;
•the ability to deduct or claim certain tax attributes or benefits such as operating losses, business or foreign tax credits; and
•the disruption of, or the loss of momentum in, each company's ongoing businesses or inconsistencies in standards, controls, procedures and policies.Contents
| ● | any delay in the integration or disposition of management teams, strategies, operations, products and services; |
| ● | differences in business backgrounds, corporate cultures and management philosophies that may delay successful integration; |
| ● | the ability to retain key employees; |
| ● | the ability to create and enforce uniform standards, controls, procedures, policies and information systems; |
| ● | the challenge of restructuring complex systems, technology, networks and other assets in a seamless manner that minimizes any adverse impact on customers, suppliers, employees and other constituencies; |
| ● | potential unknown liabilities and unforeseen increased expenses or delays associated with the acquisition, including costs to integrate beyond current estimates; |
| ● | the ability to deduct or claim tax attributes or benefits such as operating losses, business or foreign tax credits; and |
| ● | the disruption of, or the loss of momentum in, each company’s ongoing businesses or inconsistencies in standards, controls, procedures and policies. |
Any of these factors could adversely affect each company'sour ability to maintain relationships with customers, suppliers, employees and other constituencies or our ability to achieve the anticipated benefits of the acquisition or could reduce each company'sour earnings or otherwise adversely affect our business and financial results.
TableOur plans to divest businesses are subject to various risks and uncertainties and may not be completed in accordance with the expected plans or anticipated time frame, or at all, and will involve significant time and expense, which could disrupt or adversely affect our business.
Divesting businesses involve risks and uncertainties, such as the difficulty separating assets related to such businesses from the businesses we retain, employee distraction, the need to obtain regulatory approvals and other third-party consents, which potentially disrupts customer and vendor relationships, and the fact that we may be subject to additional tax obligations or loss of Contents
The agreements governingtax benefits. Because of these challenges, as well as market conditions or other factors, anticipated divestitures may take longer or be costlier or generate fewer benefits than expected and may not be completed at all. If we are unable to complete divestitures or to successfully transition divested businesses, our debt containbusiness and financial results could be negatively impacted. After we dispose of a numberbusiness, we may retain exposure on financial or performance guarantees and other contractual, employment, pension and severance obligations, and potential liabilities that may arise under law because of restrictive covenants which will limitthe disposition or the subsequent failure of an acquirer. Our results of operations, cash flows, working capital, effective tax rate, and financing requirements may be subject to increased volatility and our ability to financefund capital expenditures, investments and service debt may be diminished. In addition, any purchase price adjustments could be unfavorable and other future operations, acquisitionsproceeds owed to us as part of these transactions could be lower than we expect. As a result, performance by the divested businesses or capital needs or engage in other conditions outside of our control could have a material adverse effect on our results of operations. In addition, the divestiture of any business activitiescould negatively impact our profitability because of losses that may beresult from such a sale, the loss of sales and operating income, or a decrease in cash flows.
Other Risks
An impairment charge of goodwill could have a material adverse impact on our financial condition and results of operations.
Because we have grown in part through acquisitions, goodwill and intangible assets-net represent a substantial portion of our assets, and were $3.4 billion and $17.8 million, respectively as of September 30, 2023. Under generally accepted accounting principles in the United States, we are required to test goodwill carried in our interest.
The Credit Agreementconsolidated balance sheets for possible impairment on an annual basis based upon a fair value approach and whenever events occur that indicate impairment could exist. These events or circumstances could include a significant change in the indentures governingbusiness climate, including a significant sustained decline in a reporting unit’s market value, legal factors, operating performance indicators, competition, sale or disposition of a significant portion of our debt containbusiness, a number of significant covenants that impose operatingsustained decline in our market capitalization and other restrictions on us and our subsidiaries. Such restrictions affect or will affect, and in many respects limit or prohibit, among other things, our ability and the abilityfactors.
Table of certain of our subsidiaries to:Contents
•incur additional indebtedness;
•create liens;
•pay dividends and make other distributions in respect of our equity securities;
•redeem our equity securities;
•distribute excess cash flow from foreign to domestic subsidiaries;
•make certain investments or certain other restricted payments;
•sell certain kinds of assets;
•enter into certain types of transactions with affiliates; and
•effect mergers or consolidations.
In addition, if we experience a decrease in our Credit Agreement also requires usstock price and market capitalization over a sustained period, we would have to comply withrecord an impairment charge in the future. The amount of any impairment could be significant and could have a consolidated interest coverage ratiomaterial adverse impact on our financial condition and consolidated leverage ratio. Our ability to comply with these ratiosresults of operations for the period in which the charge is taken.
We may be affected by events beyondrequired to contribute additional cash to meet our control.significant underfunded benefit obligations associated with pension benefit plans we manage or multiemployer pension plans in which we participate.
These restrictions could limitWe have defined benefit pension plans for employees in the United States, United Kingdom, Canada, Australia, and Ireland. At September 30, 2023, our ability todefined benefit pension plans had an aggregate deficit (the excess of projected benefit obligations over the fair value of plan forassets) of approximately $165.3 million. In the future, our pension deficits may increase or react to market or economic conditions or meet capital needs or otherwise restrict our activities or business plans,decrease depending on changes in the levels of interest rates, pension plan performance and could adversely affect our ability to finance our operations, acquisitions, investments or strategic alliances or other capital needs or to engage in other business activitiesfactors that would be in our interest.
A breach of any of these covenants or our inability to comply with the required financial ratios could result in a default under all or certain of our debt instruments. If an event of default occurs, our creditors could elect to:
•declare all borrowings outstanding, together with accrued and unpaid interest, to be immediately due and payable;
•- may require us to
apply all ofmake additional cash contributions to our available cashpension plans and recognize further increases in our net pension cost to repay the borrowings; or
•prevent us from making debt service payments on certain ofsatisfy our borrowings.
funding requirements. If we were unableare forced or elect to repaymake up all or otherwise refinance these borrowings when due,a portion of the applicable creditorsdeficit for unfunded benefit plans, our results of operations could sellbe materially and adversely affected.
A multiemployer pension plan is typically established under a collective bargaining agreement with a union to cover the collateral securing certainunion-represented workers of our debt instruments, which constitutes substantially all of our domestic and foreign, wholly owned subsidiaries' assets.
various unrelated companies. Our variable rate indebtedness subjectscollective bargaining agreements with unions require us to interest rate risk, which could cause our debt service obligationscontribute to increase significantly.
Borrowings under our Credit Agreement are at variable rates of interest and expose us to interest rate risk. If interest rates increase, our debt service obligations on the variable rate indebtedness will increase even though the amount borrowed remains the same, and our net income and cash flows, including cash available for servicing our indebtedness, will correspondingly decrease. A 1.00% increase in such interest rates would increase total interest expense under our Credit Agreement forvarious multiemployer pension plans; however, we do not control or manage these plans. For the year ended September 30, 2017 by $13.42023, we contributed $3.0 million includingto multiemployer pension plans. Under the effectEmployee Retirement Income Security Act, an employer who contributes to a multiemployer pension plan, absent an applicable exemption, may also be liable, upon termination or withdrawal from the plan, for its proportionate share of our interest rate swaps. We may,the multiemployer pension plan’s unfunded vested benefit. If we terminate or withdraw from time to time, enter into additional interest rate swaps that involvea multiemployer plan, absent an applicable exemption (such as for some plans in the exchange of floating for fixed rate interest payments in order
Table of Contents
to reduce interest rate volatility. However,building and construction industry), we may not maintain interest rate swaps with respect to all of our variable rate indebtedness, and any swaps we enter into may not fully mitigate our interest rate risk and could be subjectrequired to credit risk themselves.
Ifcontribute a significant amount of cash to fund the multiemployer plan’s unfunded vested benefit, which could materially and adversely affect our financial results; however, since we do not control the multiemployer plans, we are unable to continue to access credit on acceptable terms, our business mayestimate any potential contributions that could be adversely affected.required.
The changing nature of the global credit markets could make it more difficult for us to access funds, refinance our existing indebtedness, enter into agreements for uncommitted bond facilities and new indebtedness, replace our existing revolving and term credit agreements or obtain funding through the issuance of our securities. We use credit facilities to support our working capital and acquisition needs. There is no guarantee that we can continue to renew our credit facility on terms as favorable as those in our existing credit facility and, if we are unable to do so, our costs of borrowing and our business may be adversely affected.
Our ability to grow and to compete in our industry will be harmed if we do not retain the continued services of our key technical and management personnel and identify, hire, and retain additional qualified personnel.
There is strong competition for qualified technical and management personnel in the sectors in which we compete. We may not be able to continue to attract and retain qualified technical and management personnel, such as engineers, architects and project managers, who are necessary for the development of our business or to replace qualified personnel in the timeframe demanded by our clients. Our planned growth may place increased demands on our resources and will likely require the addition of technical and management personnel and the development of additional expertise by existing personnel. In addition, we may occasionally enter into contracts before we have hired or retained appropriate staffing for that project. Also, some of our personnel hold government granted eligibility that may be required to obtain certain government projects. If we were to lose some or all of these personnel, they would be difficult to replace. In addition, we rely heavily upon the expertise and leadership of our senior management. If we are unable to retain executives and other key personnel, the roles and responsibilities of those employees will need to be filled, which may require that we devote time and resources to identify, hire and integrate new employees. Loss of the services of, or failure to recruit, key technical and management personnel could limit our ability to successfully complete existing projects and compete for new projects.
Our revenue and growth prospects may be harmed if we or our employees are unable to obtain government granted eligibility or other qualifications we and they need to perform services for our customers.
A number of government programs require contractors to have certain kinds of government granted eligibility, such as security clearance credentials. Depending on the project, eligibility can be difficult and time-consuming to obtain. If we or our employees are unable to obtain or retain the necessary eligibility, including local ownership requirements, we may not be able to win new business, and our existing customers could terminate their contracts with us or decide not to renew them. To the extent we cannot obtain or maintain the required security clearances for our employees working on a particular contract, we may not derive the revenue or profit anticipated from such contract.
Our industry is highly competitive and we may be unable to compete effectively, which could result in reduced revenue, profitability and market share.
We are engaged in a highly competitive business. The markets we serve are highly fragmented and we compete with a large number of regional, national and international companies. Certain of these competitors have greater financial and other resources than we do. Others are smaller and more specialized, and concentrate their resources in particular areas of expertise. The extent of our competition varies according to the particular markets and geographic area. In addition, the technical and professional aspects of some of our services generally do not require large upfront capital expenditures and provide limited barriers against new competitors.
Table of Contents
The degree and type of competition we face is also influenced by the type and scope of a particular project. Our clients make competitive determinations based upon qualifications, experience, performance, reputation, technology, customer relationships and ability to provide the relevant services in a timely, safe and cost-efficient manner. Increased competition may result in our inability to win bids for future projects and loss of revenue, profitability and market share.
If we extend a significant portion of our credit to clients in a specific geographic area or industry, we may experience disproportionately high levels of collection risk and nonpayment if those clients in specific geographic areas or industries are adversely affected by factors particular to their geographic area or industry.
Our clients include public and private entities that have been, and may continue to be, negatively impacted by the changing landscape in the global economy. While outside of the U.S. federal government, no one client accounted for over 10% of our revenue for fiscal 2017,2023, we face collection risk as a normal part of our business where we perform services and subsequently bill our clients for such services, or when we make equity investments in majority or minority controlled large-scale client projects and other long-term capital projects before the project completes operational status or completes its project financing. In the event that we have concentrated credit risk from clients in a specific geographic area or industry, continuing negative trends or a worsening in the financial condition of that specific geographic area or industry could make us susceptible to disproportionately high levels of default by those clients. Such defaults could materially adversely impact our revenues, and our results of operations.operations or accounts receivable.
Our services expose us to significant risks of liability and our insurance policies may not provide adequate coverage.
Our services involve significant risks of professional and other liabilities that may substantially exceed the fees that we derive from oursuch services. In addition, we sometimes contractually assume liability to clients on projects under indemnification or guarantee agreements. We cannot predict the magnitude of potential liabilities from the operation of our business. In addition, in the ordinary course of our business, we frequently make professional judgments and recommendations about environmental and engineering conditions of project sites for our clients. We may be deemed to be responsible for these professional judgments and recommendations if such judgments and recommendationsthey are later determined to be inaccurate. Any unfavorable legal ruling against us could result in substantial monetary damages or even criminal violations.
Our professional liability policies cover only claims made during the term of the policy. Additionally, our insurance policies may not protect us against potential liability due to various exclusions in the policies and self-insured retention amounts. Partially or completely uninsured claims, if successful and of significant magnitude, could have a material adverse effect on our business.
Unavailability or cancellation of third-party insurance coverage would increase our overall risk exposure as well as disrupt the management of our business operations.
We maintain insurance coverage from third-party insurers as part of our overall risk management strategy and because some of our contracts require us to maintain specific insurance coverage limits. If any of our third-party insurers fail, suddenly cancel our coverage or otherwise are unable to provide us with adequate insurance coverage, then our overall risk exposure and our operational expenses would increase and the management of our business operations would be disrupted. In addition, there can be no assurance that any of our existing insurance coverage will be renewable upon the expiration of the coverage period or that future coverage will be affordable at the required limits.
If we do not have adequate indemnification for our services related to nuclear materials, it could adversely affect our business and financial condition.
We provide services to the Department of Energy and the nuclear energy industry in the ongoing maintenance and modification, as well as the decontamination and decommissioning, of nuclear energy
Table of Contents
plants. Indemnification provisions under the Price-Anderson Act available to nuclear energy plant operators and Department of Energy contractors do not apply to all liabilities that we might incur while performing services as a radioactive materials cleanup contractor for the Department of Energy and the nuclear energy industry. If the Price-Anderson Act'sAct’s indemnification protection does not apply to our services or if our exposure occurs outside the U.S., our business and financial condition could be adversely affected either by our client'sclient’s refusal to retain us, by our inability to obtain commercially adequate insurance and indemnification, or by potentially significant monetary damages we may incur.
We also provide services to the United Kingdom's Nuclear Decommissioning Authority (NDA) relating to clean-up and decommissioning of the United Kingdom's public sector nuclear sites. Indemnification provisions under the Nuclear Installations Act 1965 available to nuclear site licensees, the Atomic Energy Authority, and the Crown, and contractual indemnification from the NDA do not apply to all liabilities that we might incur while performing services as a clean-up and decommissioning contractor for the NDA. If the Nuclear Installations Act 1965 and contractual indemnification protection does not apply to our services or if our exposure occurs outside the United Kingdom, our business and financial condition could be adversely affected either by our client's refusal to retain us, by our inability to obtain commercially adequate insurance and indemnification, or by potentially significant monetary damages we may incur.
Our backlog of uncompleted projects under contract is subject to unexpected adjustments and cancellations and, thus may not accurately reflect future revenue and profits.
At September 30, 2017, our contracted2023, backlog was approximately $24.2$41.2 billion. We reported transaction price allocated to remaining unsatisfied performance obligations (RUPO) of $21.9 billion, our awarded backlog was approximately $20.0 billion and our unconsolidated joint venture backlog was approximately $3.3 billion for a total backlog of $47.5 billion. Our contracted backlog includes revenue we expect to recordas described in Note 4, Revenue Recognition, in the future from signed contractsnotes to our consolidated financial statements. The most significant differences between our backlog and in the case of a public sector client, where the project has been funded. Our awardedRUPO are backlog includescontains revenue we expect to record in the future where we have been awarded the work, but the contractual agreement has not yet been signed.signed, unconsolidated joint venture backlog where we expect to realize income through equity earnings rather than revenue, and revenue related to service contracts that extend beyond the termination provisions of those contracts, where guidance for the calculation of RUPO requires us to assume the contract will be terminated at its earliest convenience. Accordingly, RUPO is $19.3 billion lower than backlog. We cannot guarantee that future revenue will be realized from either category of backlog or, if realized, will result in profits. Many projects may remain in our backlog for an extended period of time because of the size or long-term nature of the contract. In addition, from time to time, projects are delayed, scaled back or canceled. These types of backlog reductions adversely affect the revenue and profits that we ultimately receive from contracts reflected in our backlog.
We have submittedFrom time to time, we submit claims to clients for work we performed beyond the initial scope of some of our contracts. If these clients do not approve these claims, our results of operations could be adversely impacted.
We typically have pending claims submitted under some of our contracts for payment of work performed beyond the initial contractual requirements for which we have already recorded revenue. In general, we cannot guarantee that such claims will be approved in whole, in part, or at all. Often, these claims can be the subject of lengthy arbitration or litigation proceedings, and it is difficult to accurately predict when these claims will be fully resolved. When these types of events occur and unresolved claims are pending, we have used working capital in projects to cover cost overruns pending the resolution of the relevant claims. If these claims are not approved, our revenue may be reduced in future periods.
In conducting our business, we depend on other contractors, subcontractors and equipment and material providers. If these parties fail to satisfy their obligations to us or other parties or if we are unable to maintain these relationships, our revenue, profitability and growth prospects could be adversely affected.
We depend on contractors, subcontractors and equipment and material providers in conducting our business. There is a risk that we may have disputes with our subcontractors arising from, among other things, the quality and timeliness of work performed by the subcontractor, customer concerns about the subcontractor, or our failure to extend existing task orders or issue new task orders under a subcontract.
Table of Contents
Also, to the extent that we cannot acquire equipment and materials at reasonable costs, or if the amount we are required to pay exceeds our estimates, our ability to complete a project in a timely fashion or at a profit may be impaired. In addition, if any of our subcontractors fail to deliver on a timely basis the agreed-upon supplies and/or perform the agreed-upon services, our ability to fulfill our obligations as a prime contractor may be jeopardized; we could be held responsible for such failures and/or we may be required to purchase the supplies or services from another source at a higher price. This may reduce the profit to be realized or result in a loss on a project for which the supplies or services are needed.
We also rely on relationships with other contractors when we act as their subcontractor or joint venture partner. Our future revenue and growth prospects could be adversely affected if other contractors eliminate or reduce their subcontracts or joint venture relationships with us, or if a government agency terminates or reduces these other contractors'contractors’ programs, does not award them new contracts or refuses to pay under a contract. In addition, due to "pay“pay when paid"paid” provisions that are common in subcontracts in certainmany countries, including the U.S., we could experience delays in receiving payment if the prime contractor experiences payment delays.
If clients use our reports or other work product without appropriate disclaimers or in a misleading or incomplete manner, or if our reports or other work product are not in compliance with professional standards and other regulations, our business could be adversely affected.
The reports and other work product we produce for clients sometimes include projections, forecasts and other forward-looking statements. Such information by its nature is subject to numerous risks and uncertainties, any of which could cause the information produced by us to ultimately prove inaccurate. While we include appropriate disclaimers in the reports that we prepare for our clients, once we produce such written work product, we do not always have the ability to control the manner in which our clients use such information. As a result, if our clients reproduce such information to solicit funds from investors for projects without appropriate disclaimers and the information proves to be incorrect, or if our clients reproduce such information for potential investors in a misleading or incomplete manner, our clients or such investors may threaten to or file suit against us for, among other things, securities law violations. For example, in August 2016, AECOM Australia and other parties entered into a settlement related to, among other things, alleged deficiencies in AECOM Australia's traffic forecast. If we were found to be liable for any claims related to our client work product, our business could be adversely affected.
In addition, our reports and other work product may need to comply with professional standards, licensing requirements, securities regulations and other laws and rules governing the performance of professional services in the jurisdiction where the services are performed. We could be liable to third parties who use or rely upon our reports and other work product even if we are not contractually bound to those third parties. These events could in turn result in monetary damages and penalties.
Failure to adequately protect, maintain, or enforce our rights in our intellectual property may adversely limit our competitive position.
Our success depends, in part, upon our ability to protect our intellectual property. We rely on a combination of intellectual property policies and other contractual arrangements to protect much of our intellectual property where we do not believe that trademark, patent or copyright protection is appropriate or obtainable. Trade secrets are generally difficult to protect. Although our employees are subject to confidentiality obligations, this protection may be inadequate to deter or prevent misappropriation of our confidential information and/or the infringement of our patents and copyrights. Further, we may be unable to detect unauthorized use of our intellectual property or otherwise take appropriate steps to enforce our rights. Failure to adequately protect, maintain, or enforce our intellectual property rights may adversely limit our competitive position.
Our revenue and growth prospects may be harmed if we or our employees are unable to obtain government granted eligibility or other qualifications we and they need to perform services for our customers.
A number of government programs require contractors to have government granted eligibility, such as security clearance credentials. Depending on the project, eligibility can be difficult and time-consuming to obtain. If we or our employees are unable to obtain or retain the necessary eligibility, we may not be able to win new business, and our existing customers could terminate their contracts with us or decide not to renew them. To the extent we cannot obtain or maintain the required security clearances for our employees working on a particular contract, we may not derive the revenue or profit anticipated from such contract.
Negotiations with labor unions and possible work actions could divert management attention and disrupt operations. In addition, new collective bargaining agreements or amendments to agreements could increase our labor costs and operating expenses.
We regularly negotiate with labor unions and enter into collective bargaining agreements. The outcome of any future negotiations relating to union representation or collective bargaining agreements may not be favorable to us. We may reach agreements in collective bargaining that increase our operating expenses and lower our net income as a result of higher wages or benefit expenses. In addition, negotiations with unions could divert management attention and disrupt operations, which may adversely affect our results of operations. If we are unable to negotiate acceptable collective bargaining agreements, we may have to address the threat of union-initiated work actions, including strikes. Depending on the nature of the threat or the type and duration of any work action, these actions could disrupt our operations and adversely affect our operating results.
Our charter documents contain provisions that may delay, defer or prevent a change of control.
Provisions of our certificate of incorporation and bylaws could make it more difficult for a third party to acquire control of us, even if the change in control would be beneficial to stockholders. These provisions include the following:
• | ● | ability of our Board of Directors to authorize the issuance of preferred stock in series without stockholder approval; |
| ● | vesting of exclusive authority in our Board of Directors to determine the size of the board and to fill vacancies; and |
| ● | advance notice requirements for stockholder proposals and nominations for election to our Board of Directors. |
We cannot guarantee the timing, amount or payment of dividends.
Although our Board of Directors has adopted a dividend policy under which we intend to authorizepay a regular quarterly cash dividend, the issuancetiming and amount of preferred stock in series without stockholder approval;
•vestingany subsequently declared dividend (or any special dividend) is subject to the discretion of exclusive authority in ourthe Board of Directors and will be based on a variety of factors, including cash flows, earnings and financial borrowing availability and other restrictions under our outstanding indebtedness. We are not required to determine the size of the board (subject to limited exceptions)declare dividends and to fill vacancies;
•advance notice requirements for stockholder proposalswe are restricted under our outstanding indebtedness and nominations for election to ourcould be restricted under future financing or other arrangements. Our Board of Directors; and
•prohibitionsDirectors may modify or terminate our dividend policy. Accordingly, we cannot provide any assurances that we will pay quarterly or special dividends or the amount or timing thereof. Any reduction or elimination of our dividend policy or dividend payments could have a negative effect on the price of our stockholders from acting by written consent.
common stock.Changes in tax laws could increase our worldwide tax rate and materially affect our results of operations.
ManyWe are subject to tax laws in the U.S. and numerous foreign jurisdictions. The U.S. and many international legislative and regulatory bodies have proposed and/or enactedcontinually propose and enact legislation and begun investigations of the tax practices of multinational companies and, in the European Union (EU), the tax policies of certain EU member states. Since 2013, the European Commission (EC) has been investigating tax rulings granted by tax authorities in a number of EU member states with respect to specificthat could significantly impact how U.S. multinational corporations are taxed.
The Organization for Economic Co-operation and Development (OECD), a global coalition of member countries, has developed a two-pillar framework to determine whetherreform international taxation. The proposal aims to ensure that multinationals pay a minimum rate of tax on their foreign profits through the introduction of a global minimum tax among other provisions. As this framework is subject to further negotiation and implementation by each member country, the timing and ultimate impact of any such rulings comply with EU ruleschanges on state aid, as well as more recent investigations of theour tax regimes of certain EU member states. If the EC determines that a tax ruling or tax regime violates the state aid restrictions, the tax authorities of the affected EU member state may be required to collect back taxes for the period of time covered by the ruling. obligations are uncertain.
Due to the large scale of our U.S. and international business activities, many of these proposed andchanges, if enacted changes to the taxation of our activitiesinto law, could increasehave an adverse impact on our worldwide effective tax rate, income tax expense and harm resultscash flows.
ITEM 1B. UNRESOLVED STAFF COMMENTS
None.
ITEM2.PROPERTIES
Our corporate offices are located in approximately 31,5009,000 square feet of space at 1999 Avenue of the Stars, Los Angeles, California.13355 Noel Road, Dallas, Texas. Our other offices, including smaller administrative or project offices, consist of an aggregate of approximately 11.76.4 million square feet worldwide. Virtually all of our offices are leased.
Table of Contents
See Note 11 in the notes to our consolidated financial statements for information regarding our lease obligations. We believe our current properties are adequate for our business operations and are not currently underutilized. We may add additional facilities from time to time in the future as the need arises.
ITEM 3. LEGAL PROCEEDINGS
As a government contractor, we are subject to various laws and regulations that are more restrictive than those applicable to non-government contractors. Intense government scrutiny of contractors'contractors’ compliance with those laws and regulations through audits and investigations is inherent in government contracting and, from time to time, we receive inquiries, subpoenas, and similar demands related to our ongoing business with government entities. Violations can result in civil or criminal liability as well as suspension or debarment from eligibility for awards of new government contracts or option renewals.
We are involved in various investigations, claims and lawsuits in the normal conduct of our business. We are not always aware if we or our affiliates are under investigation or the status of such matters. Although the outcome of our legal proceedings cannot be predicted with certainty and no assurances can be provided, in the opinion of our management, based upon current information and discussions with counsel, with the exception of the matters noted in Note 18, Commitments and Contingencies, to the financial statements contained in this report to the extent stated therein, none of the investigations, claims and lawsuits in which we are involved is expected to have a material adverse effect on our consolidated financial position, results of operations, cash flows or our ability to conduct business. See Note 18, "CommitmentsCommitments and Contingencies," to the financial statements contained in this report for a discussion of certain matters to which we are a party. The information set forth in such note is incorporated by reference into this Item 3. From time to time, we establish reserves for litigation when we consider it probable that a loss will occur.
ITEM 4. MINE SAFETY DISCLOSURES
The Company does not act as the ownerNone.
PART II
ITEM 5. MARKET FOR REGISTRANT'SREGISTRANT’S COMMON EQUITY, RELATED STOCKHOLDER MATTERS AND ISSUER PURCHASES OF EQUITY SECURITIES
Our common stock is listed on the New York Stock Exchange (NYSE). under the symbol “ACM.” According to the records of our transfer agent, there were 2,4721,467 stockholders of record as of November 3, 2017. The following table sets forth the low and high closing sales prices of a share of our common stock during each of the fiscal quarters presented, based upon quotations on the NYSE consolidated reporting system:
| | | | | | | |
| | Low Sales
Price ($) | | High Sales
Price ($) | |
|---|
Fiscal 2017: | | | | | | | |
First quarter | | | 26.92 | | | 40.13 | |
Second quarter | | | 33.86 | | | 39.13 | |
Third quarter | | | 31.93 | | | 35.39 | |
Fourth quarter | | | 30.47 | | | 37.04 | |
Table of Contents10, 2023.
| | | | | | | |
| | Low Sales
Price ($) | | High Sales
Price ($) | |
|---|
Fiscal 2016: | | | | | | | |
First quarter | | | 28.08 | | | 33.12 | |
Second quarter | | | 22.80 | | | 31.90 | |
Third quarter | | | 29.06 | | | 34.05 | |
Fourth quarter | | | 27.56 | | | 36.20 | |
We have not paid a cash dividend since our inception and our Credit Agreement restricts the Company's ability to pay cash dividends.
On July 28, 2017, the Company acquired Shimmick Construction Company, Inc. (Shimmick), and committed to issue 1,159,322 shares of AECOM common stock to certain accredited shareholders of Shimmick in a private placement exempt from registration pursuant to Section 4(2) and Rule 506 of Regulation D of the Securities Act of 1933, as amended.None.
The following table presents certain information about shares of AECOM common stock that may be issued under our equity compensation plans as of September 30, 2017:2023:
| | | | | | | |
| | Column A | | Column B | | Column C |
| | | | | | | Number of securities |
| | | | | | | remaining available |
| | Number of securities | | Weighted‑average | | for future |
| | to be issued | | exercise price of | | issuance under |
| | upon exercise | | Outstanding | | equity compensation |
| | of outstanding | | options, | | plans (excluding |
| | options, warrants, | | warrants, and | | securities reflected |
Plan Category | | and rights(1) | | Rights | | in Column A) |
Equity compensation plans not approved by stockholders | | N/A | | | N/A | | N/A |
Equity compensation plans approved by stockholders: | | | | | | | |
AECOM Stock Incentive Plans | | 1,576,417 | (1) | | 38.72 | (2) | 10,239,810 |
AECOM Employee Stock Purchase Plan(3) | | N/A | | | N/A | | 8,440,301 |
Total | | 1,576,417 | | $ | 38.72 | | 18,680,111 |
| | | | | | | | | | |
| | Column A | | Column B | | Column C | |
|---|
Plan Category | | Number of securities
to be issued
upon exercise
of outstanding
options, warrants,
and rights(1) | | Weighted-average
exercise price of
outstanding
options,
warrants, and
rights | | Number of securities
remaining available
for future
issuance under
equity compensation
plans (excluding
securities reflected
in Column A) | |
|---|
Equity compensation plans not approved by stockholders: | | | N/A | | | N/A | | | N/A | |
Equity compensation plans approved by stockholders: | | | | | | | | | | |
AECOM Stock Incentive Plans | | | 6,942,224 | (1)(2) | $ | 31.11 | (3) | | 13,610,582 | |
AECOM Employee Stock Purchase Plan(4) | | | N/A | | | N/A | | | 2,923,603 | |
| | | | | | | | | | | |
Total | | | 6,942,224 | | $ | 31.11 | | | 16,534,185 | |
| | | | | | | | | | | |
| | | | | | | | | | | |
| | | | | | | | | | | |
(1)The table does not include information for the 119,723 shares issued under the URS Corporation 2008 Equity Incentive Plan (URS Incentive Plan) assumed by AECOM in connection with its acquisition of URS Corporation. No additional equity awards may be granted under the URS Incentive Plan.
(2)Includes 737,542 shares issuable upon the exercise of stock options, 3,843,520 shares issuable upon the vesting of Restricted Stock Units and 2,361,162 shares issuable if specified performance targets are met under Performance Earnings Program Awards (PEP).
(3)Weighted-average exercise price of outstanding options only.
(4)Amounts only reflected in column (c) and include all shares available for future issuance and subject to outstanding rights.
(1) | Includes 106,194 shares issuable upon the exercise of stock options, 772,818 shares issuable upon the vesting of Restricted Stock Units, and 697,405 shares issuable if specified performance targets are met under Performance Earnings Program Awards (PEP). |
(2) | Weighted-average exercise price of outstanding options only. |
(3) | Amounts only reflected in column (c) and include all shares available for future issuance and subject to outstanding rights. |
Table of Contents
The following chart compares the cumulative total stockholder return of AECOM stock (ACM) with the cumulative total return of the S&P MidCap 400, and the S&P Composite 1500 Construction & Engineering, the S&P 500 Aerospace & Defense and the PHLX Oil Service Sector indices from September 28, 20122018 to September 29, 2017. We added the S&P 500 Aerospace & Defense and the PHLX Oil Service Sector indices to provide additional third party published industry indices reflecting our defense and oil and gas services.2023.
We believe the S&P MidCap 400 on which we are listed,MidCap is an appropriate independent broad market index, since it measures the performance of similar mid-sized companies in numerous sectors. In addition, we believe the S&P Composite 1500 Construction & Engineering the S&P 500 Aerospace & Defense and the PHLX Oil Service Sector indices areindex is an appropriate third party published industry indicesindex since they measureit measures the performance of engineering and construction defense and oil and gas services.companies.
| (1) | This section is not “soliciting material,” is not deemed “filed” with the SEC and is not incorporated by reference in any of our filings under the Securities Act or Exchange Act whether made before or after the date hereof and irrespective of any general incorporation language in any such filing. |
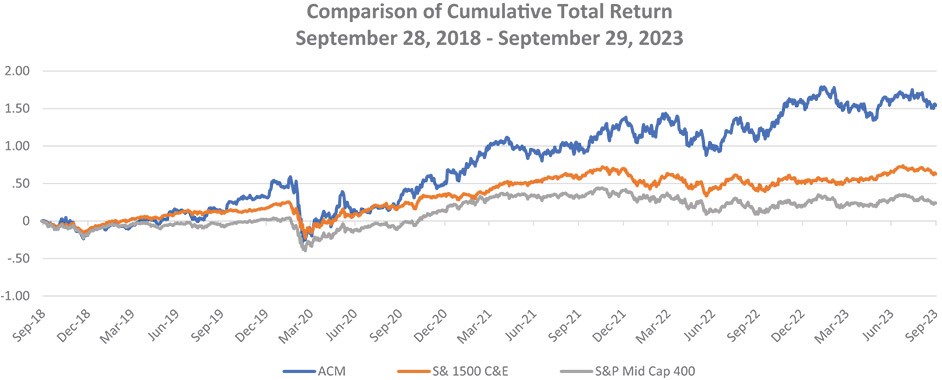
Stock Repurchase Program
On September 21, 2017,22, 2021, the Company'sCompany’s Board of Directors announced a new capital allocation policy that authorizedapproved an increase in the Company’s repurchase authorization of upAECOM common stock to $1.0 billion in AECOM common stock.billion. Stock repurchases can be made through open market purchases or other methods, including pursuant to a Rule 10b5-1 plan. Since August 2011,On November 9, 2023, the Company has purchased a totalBoard approved another increase in the Company’s repurchase authorization back up to $1.0 billion. A summary of 27.4 million shares at an average price of $24.10 per share,the repurchase activity for a total cost of $660.1 million under a previous stock repurchase program. No stock repurchases were made under the new or the previous stock repurchase program in fiscal 2017.three months ended September 30, 2023 is as follows:
(1)This section is not "soliciting material," is not deemed "filed" with the SEC and is not incorporated by reference in any of our filings under the Securities Act or Exchange Act whether made before or after the date hereof and irrespective of any general incorporation language in any such filing.
| | | | | | | | | | |
| | Total Number | | | | | Total Number of Shares | | Maximum Approximate Dollar |
| | of Shares | | Average Price | | Purchased as Part of Publicly | | Value that May Yet Be Purchased |
Period | | Purchased | | Paid Per Share | | Announced Plans or Programs | | Under the Plans or Programs |
July 1 – 31, 2023 | | — | | $ | — | | — | | $ | 452,000,000 |
August 1 – 31, 2023 | | 1,138,926 | | | 87.82 | | 1,138,926 | | | 352,000,000 |
September 1 – 30, 2023 | | 1,551,753 | | | 83.79 | | 1,551,753 | | | 220,200,000 |
Total | | 2,690,679 | | $ | 85.50 | | 2,690,679 | | | |
ITEM 6. RESERVED
ITEM 6. SELECTED FINANCIAL DATA
SELECTED CONSOLIDATED FINANCIAL DATA
You should read the following selected consolidated financial data along with "Management's Discussion and Analysis of Financial Condition and Results of Operations" and our consolidated financial statements and the accompanying notes, which are included in this Form 10-K. We derived the selected consolidated financial data from our audited consolidated financial statements.
| | | | | | | | | | | | | | | | |
| | Year Ended September 30, | |
|---|
| | 2017 | | 2016 | | 2015 | | 2014 | | 2013 | |
|---|
| | (in millions, except share data)
| |
|---|
Consolidated Statement of Operations Data: | | | | | | | | | | | | | | | | |
Revenue | | $ | 18,203 | | $ | 17,411 | | $ | 17,990 | | $ | 8,357 | | $ | 8,153 | |
Cost of revenue | | | 17,519 | | | 16,768 | | | 17,455 | | | 7,954 | | | 7,703 | |
| | | | | | | | | | | | | | | | | |
Gross profit | | | 684 | | | 643 | | | 535 | | | 403 | | | 450 | |
Equity in earnings of joint ventures | | | 142 | | | 104 | | | 106 | | | 58 | | | 24 | |
General and administrative expenses | | | (134 | ) | | (115 | ) | | (114 | ) | | (81 | ) | | (97 | ) |
Acquisition and integration expenses | | | (39 | ) | | (214 | ) | | (398 | ) | | (27 | ) | | — | |
Gain (loss) on disposal activities | | | 1 | | | (43 | ) | | — | | | — | | | — | |
| | | | | | | | | | | | | | | | | |
Income from operations | | | 654 | | | 375 | | | 129 | | | 353 | | | 377 | |
Other income | | | 7 | | | 8 | | | 19 | | | 3 | | | 4 | |
Interest expense | | | (232 | ) | | (258 | ) | | (299 | ) | | (41 | ) | | (45 | ) |
| | | | | | | | | | | | | | | | | |
Income (loss) before income tax expense | | | 429 | | | 125 | | | (151 | ) | | 315 | | | 336 | |
Income tax expense (benefit) | | | 8 | | | (38 | ) | | (80 | ) | | 82 | | | 93 | |
| | | | | | | | | | | | | | | | | |
Net income (loss) | | | 421 | | | 163 | | | (71 | ) | | 233 | | | 243 | |
Noncontrolling interests in income of consolidated subsidiaries, net of tax | | | (82 | ) | | (67 | ) | | (84 | ) | | (3 | ) | | (4 | ) |
| | | | | | | | | | | | | | | | | |
Net income (loss) attributable to AECOM | | $ | 339 | | $ | 96 | | $ | (155 | ) | $ | 230 | | $ | 239 | |
| | | | | | | | | | | | | | | | | |
| | | | | | | | | | | | | | | | | |
| | | | | | | | | | | | | | | | | |
Net income (loss) attributable to AECOM per share: | | | | | | | | | | | | | | | | |
Basic | | $ | 2.18 | | $ | 0.62 | | $ | (1.04 | ) | $ | 2.36 | | $ | 2.38 | |
Diluted | | $ | 2.13 | | $ | 0.62 | | $ | (1.04 | ) | $ | 2.33 | | $ | 2.35 | |
| | | | | | | | | | | | | | | | | |
| | | | | | | | | | | | | | | | | |
| | | | | | | | | | | | | | | | | |
Weighted average shares outstanding:(in millions) | | | | | | | | | | | | | | | | |
Basic | | | 156 | | | 155 | | | 150 | | | 97 | | | 101 | |
Diluted | | | 159 | | | 156 | | | 150 | | | 99 | | | 102 | |
| | | | | | | | | | | | | | | | |
| | Year Ended September 30, | |
|---|
| | 2017 | | 2016 | | 2015 | | 2014 | | 2013 | |
|---|
| | (in millions, except employee data)
| |
|---|
Other Data: | | | | | | | | | | | | | | | | |
Depreciation and amortization(1) | | $ | 279 | | $ | 399 | | $ | 599 | | $ | 95 | | $ | 94 | |
Amortization expense of acquired intangible assets(2) | | | 103 | | | 202 | | | 391 | | | 24 | | | 21 | |
Capital expenditures, net of disposals | | | 78 | | | 137 | | | 69 | | | 63 | | | 52 | |
Contracted backlog | | $ | 24,234 | | $ | 23,710 | | $ | 24,468 | | $ | 11,349 | | $ | 8,753 | |
Number of full-time and part-time employees | | | 87,000 | | | 87,000 | | | 92,000 | | | 43,300 | | | 45,500 | |
(1)Includes amortization of deferred debt issuance costs.
(2)Included in depreciation and amortization above.
Table of Contents
| | | | | | | | | | | | | | | | |
| | As of September 30, | |
|---|
| | 2017 | | 2016 | | 2015 | | 2014 | | 2013 | |
|---|
| | (in millions)
| |
|---|
Consolidated Balance Sheet Data: | | | | | | | | | | | | | | | | |
Cash and cash equivalents | | $ | 802 | | $ | 692 | | $ | 684 | | $ | 574 | | $ | 601 | |
Working capital | | | 1,104 | | | 696 | | | 1,410 | | | 978 | | | 1,078 | |
Total assets | | | 14,397 | | | 13,670 | | | 14,014 | | | 6,123 | | | 5,666 | |
Long-term debt excluding current portion | | | 3,702 | | | 3,702 | | | 4,447 | | | 940 | | | 1,089 | |
AECOM Stockholders' equity | | | 3,996 | | | 3,367 | | | 3,408 | | | 2,187 | | | 2,021 | |
Table of Contents
ITEM 7. MANAGEMENT'SMANAGEMENT’S DISCUSSION AND ANALYSIS OF FINANCIAL CONDITION AND RESULTS OF OPERATIONS
This Annual Report on Form 10-K contains forward-looking statements within the meaning of the safe harbor provisions of the Private Securities Litigation Reform Act of 1995 that are not limited to historical facts, but reflect the Company'sCompany’s current beliefs, expectations or intentions regarding future events. These statements include forward-looking statements with respect to the Company, including the Company'sCompany’s business, and operations and the engineeringstrategy, and constructioninfrastructure consulting industry. Statements that are not historical facts, without limitation, including statements that use terms such as "anticipates," "believes," "expects," "estimates," "intends," "may," "plans," "potential," "projects,"“anticipates,” “believes,” “expects,” “estimates,” “intends,” “may,” “plans,” “potential,” “projects,” and "will"“will” and that relate to our future revenues, expenditures and business trends; future reduction of our self-perform at-risk construction exposure; future accounting estimates; future contractual performance obligations; future conversions of backlog; future capital allocation priorities, including sharecommon stock repurchases, future trade receivables, future debt pay downs; future post-retirement expenses; future tax benefits and expenses;expenses, and the impact of future tax laws; future compliance with regulations; future legal claims and insurance coverage; future effectiveness of our disclosure and internal controls over financial reporting; future costs savings; and other future economic and industry conditions, are forward-looking statements. In light of the risks and uncertainties inherent in all forward-looking statements, the inclusion of such statements in this Annual Report should not be considered as a representation by us or any other person that our objectives or plans will be achieved. Although management believes that the assumptions underlying the forward-looking statements are reasonable, these assumptions and the forward-looking statements are subject to various factors, risks and uncertainties, many of which are beyond our control, including, but not limited to, the fact that our business is cyclical and vulnerable to economic downturns and client spending reductions; we are dependent ongovernment shutdowns; long-term government contracts and subject to uncertainties related to government contract appropriations; governmental agencies may modify, curtail or terminate our contracts; government contracts are subject to audits and adjustments of contractual terms; we may experience losses under fixed-price contracts; we have limited control over operations run through our joint venture entities; we may be liableliability for misconduct by our employees or consultants or ourconsultants; failure to comply with laws or regulations applicable to our business; we may not maintainmaintaining adequate surety and financial capacity; we are highly leveragedpotential high leverage and may not be ableinability to service our debt and guarantees; we haveability to continue payment of dividends; exposure to political and economic risks in different countries, where we operate as well asincluding tariffs; currency exchange rate and interest fluctuations; we may not be able to retainretaining and recruitrecruiting key technical and management personnel; we may be subject to legal claims; we may have inadequate insurance coverage; we are subject to environmental law compliance and may not have adequateinadequate nuclear indemnification; there may be unexpected adjustments and cancellations related to our backlog; we are dependent on partners and third parties who may fail to satisfy their legal obligations; we may not be able to managemanaging pension costs; we may faceAECOM Capital’s real estate development; cybersecurity issues, IT outages and data loss;privacy; risks associated with the benefits and costs of the sale of our Management Services and self-perform at-risk civil infrastructure, power construction, and oil and gas construction businesses, including the risk that any purchase adjustments from those transactions could be unfavorable and any future proceeds owed to us as part of the transactions could be lower than we expect; as well as other additional risks and factors discussed in this Annual Report on Form 10-K and any subsequent reports we file with the SEC. Accordingly, actual results could differ materially from those contemplated by any forward-looking statement.
All subsequent written and oral forward-looking statements concerning the Company or other matters attributable to the Company or any person acting on its behalf are expressly qualified in their entirety by the cautionary statements above. You are cautioned not to place undue reliance on these forward-looking statements, which speak only to the date they are made. The Company is under no obligation (and expressly disclaims any such obligation) to update or revise any forward-looking statement that may be made from time to time, whether as a result of new information, future developments or otherwise. Please review "Part“Part I, Item 1A—Risk Factors"Factors” in this Annual Report for a discussion of the factors, risks and uncertainties that could affect our future results.
Our fiscal year consists of 52 or 53 weeks, ending on the Friday closest to September 30. For clarity of presentation, we present all periods as if the year ended on September 30. We refer to the fiscal year ended September 30, 20162022 as "fiscal 2016"“fiscal 2022” and the fiscal year ended September 30, 20172023 as "fiscal 2017."“fiscal 2023.” Fiscal years 2023, 2022, and 2021 each contained 52, 52, and 52 weeks, respectively, and ended on September 29, September 30, and October 1, respectively.
TableIn this section, we discuss the results of Contentsour operations for the year ended September 30, 2023 compared to the year ended September 30, 2022. For a discussion on the year ended September 30, 2022 compared to the year ended September 30, 2021, please refer to Part II, Item 7, “Management’s Discussion and Analysis of Financial Condition and Results of Operations” in our Annual Report on Form 10-K for the year ended September 30, 2022.
Overview
We are a leading fully integrated firm positioned to design, build, finance and operateglobal provider of professional infrastructure assetsconsulting services for governments, businesses and organizations in more than 150 countries.throughout the world. We provide advisory, planning, consulting, architectural and engineering design, construction and
program management services, and investment and development services to commercialpublic and governmentprivate clients worldwide in major end markets such as transportation, facilities, water, environmental, energy, water and government markets. We also provide construction services, including building construction and energy, infrastructure and industrial construction. In addition, we provide program and facilities management and maintenance, training, logistics, consulting, technical assistance, and systems integration and information technology services, primarily for agencies of the U.S. government and also for national governments around the world.energy.
Our business focuses primarily on providing fee-based planning, consulting, architectural and engineering design services and, therefore, our business is labor intensive.knowledge-based services. We primarily derive income from our ability to generate revenue and collect cash from our clients through the billing of our employees'employees’ time spent on client projects and our ability to manage our costs. AECOM Capital primarily derives its income from real estate development sales.sales and management fees.
We report our continuing business through four segments: Design and Consulting Services (DCS), Construction Services (CS), Management Services (MS),three segments, each of which is described in further detail below: Americas, International, and AECOM Capital (ACAP). Such segments are organized by the types of services provided, the differing specialized needs of the respective clients, and how we manage the business. We have aggregated various operating segments into our reportable segments based on their similar characteristics, including similar long-term financial performance, the nature of services provided, internal processes for delivering those services, and types of customers.
| ● | Americas: Planning, consulting, architectural and engineering design, construction management and program management services to public and private clients in the United States, Canada, and Latin America in major end markets such as transportation, water, government, facilities, environmental, and energy. |
| ● | International: Planning, consulting, architectural and engineering design services and program management to public and private clients in Europe, the Middle East, India, Africa and the Asia-Australia-Pacific regions in major end markets such as transportation, water, government, facilities, environmental, and energy. |
| ● | AECOM Capital (ACAP): Primarily invests in and develops real estate projects. |
Our DCS segment delivers planning, consulting, architectural and engineering design services to commercial and government clients worldwide in major end markets such as transportation, facilities, environmental, energy, water and government. DCS revenue is primarily derived from fees from services that we provide, as opposed to pass-through costs from subcontractors.
Our CS segment provides construction services, including building construction and energy, infrastructure and industrial construction, primarily in the Americas. CS revenue typically includes a significant amount of pass-through costs from subcontractors.
Our MS segment provides program and facilities management and maintenance, training, logistics, consulting, technical assistance, and systems integration and information technology services, primarily for agencies of the U.S. government and also for national governments around the world. MS revenue typically includes a significant amount of pass-through costs from subcontractors.
Our ACAP segment invests in real estate, public-private partnership (P3) and infrastructure projects. ACAP typically partners with investors and experienced developers in the United States and Europe as co-general partners. In addition, ACAP may, but is not required to, enter into contracts with our other AECOM affiliates to provide design, engineering, construction management, development and operations and maintenance services for ACAP funded projects.
In April 2017, ACAP completed a transaction to sell its 50% equity interest in Provost Square I LLC, an unconsolidated joint venture which invested in a real estate development in New Jersey, for $133 million, which resulted in net cash proceeds of $77 million and a gain of $52 million in our fiscal year 2017. Accordingly, we begain reporting ACAP as a separate segment beginning in the third quarter of fiscal 2017. Results of operations for ACAP were not material in prior periods.
During the first quarter of fiscal year 2017, an operation and maintenance related entity previously reported within our CS segment was realigned within our MS segment to reflect present management oversight. Accordingly, approximately $130 million and $137 million of revenue and $124 million and
Table of Contents
$130 million of cost of revenue for the years ended September 30, 2016 and 2015, respectively, were reclassified to conform to the current period presentation.
Our revenue is dependent on our ability to attract and retain qualified and productive employees, identify business opportunities, integrate and maximize the value of our recent acquisitions, allocate our labor resources and capital to profitable and high growth markets, secure new contracts, and renew existing client agreements. Demand for our services is cyclical and may be vulnerable to sudden economic downturns and reductions in government and private industry spending, which may result in clients delaying, curtailing or canceling proposed and existing projects. Moreover, as a professional services company, maintaining the high quality of the work generated by our employees is integral to our revenue generation and profitability. Given the global nature of our business, our revenue is exposed to currency rate fluctuations that could change from period to period and year to year.
Our costs consist primarily of the compensation we pay to our employees, including salaries, fringe benefits, the costs of hiring subcontractors, other project-related expenses and sales, general and administrative costs.
In September 2021, the Board approved an increase in our stock repurchase authorization to $1.0 billion. At September 30, 2023, we have approximately $220 million remaining of the Board’s repurchase authorization. We define revenue provided by acquired companies as revenue included in the current period upintend to twelve months subsequent to their acquisition date. Throughout this section, we refer to companies we acquired in the last twelve months as "acquired companies."deploy future available cash towards dividends and stock repurchases consistent with our return driven capital allocation policy.
Commodity price volatility has negatively impactedWe have exited substantially all of our self-perform at-risk construction businesses and divested our remaining non-core oil and gas businesses in January 2022. As part of our ongoing plan to improve profitability and maintain a reduced risk profile, we continuously evaluate our geographic exposure. In March 2022, we substantially completed our exit of all business especiallyoperations in North AmericanRussia consistent with our announcement on March 7, 2022.
In fiscal year 2023, we initiated a process to explore strategic options for the AECOM Capital business. This process is consistent with our focus on our professional services business. AECOM Capital will continue to support AECOM’s existing investment vehicles and other petro-dollar funded marketsinvestments in a manner consistent with their current obligations. We initiated a project-by-project review of the existing investment portfolio, including an analysis of the incremental cash requirements that might be required to carry the investments on our balance sheet if current market conditions persist. We determined that the incremental investments to these assets did not meet the objectives of our capital allocation policy. We reflected this change in strategy and wethe expected acceleration of these investment exits as an impairment charge of $307.0 million in the third quarter of fiscal 2023. This impairment did not relate to investments in respect of which affiliates of AECOM Capital provide advisory services or manage third party capital.
We expect to incur restructuring costs of approximately $50 million to $70 million in fiscal 2024, primarily related to ongoing actions that existing and future projects will be deferred, suspended or terminated.
In December 2015, the federal legislation referred to as the Fixing America's Surface Transportation Act (the FAST Act) was authorized. The FAST Act is a five-year federal programare expected to provide infrastructure spending on roads, bridges,deliver continued margin improvement and public transitefficiencies. Our estimated restructuring costs include the ongoing optimization of our office real estate portfolio and rail systems. While client spending patterns are likelyexit of certain countries in Southeast Asia, subject to remain uneven, we expect that the passageapplicable laws, as part of the FAST Act will positively impact our transportation services business in the next several years.
Our MS segment fiscal 2016 results benefited from favorable project, pension and legal resolutions, which did not repeat in fiscal 2017. Also, the MS segment wound down several government projects in fiscal 2016, such as our contract to manage the Sellafield nuclear site in the United Kingdom, which impacted 2017 performance.
In 2017, the U.S. federal government proposed significant legislative and executive infrastructure initiatives that, if enacted, could have a positive impact to our infrastructure business.
In September 2017, we announced ourongoing plan to allocate free cash from operations toevaluate our geographic exposure and reduce our long-term debt and lower our overall leverage ratio. After significantly reducing our leverage ratio, we plan to allocate free cash from operations to engage in a stock repurchase program.risk profile.
Table of Contents
We cannot determine if future climate change and greenhouse gas laws and policies, such as the United Nation's COP-21 Paris Agreement, will have a material impact on our business or our clients' business; however, we expect future environmental laws and policies could negatively impact demand for our services related to fossil fuel projects and positively impact demand for our services related to environmental, infrastructure, nuclear and alternative energy projects.
Acquisitions
The aggregate value of all consideration for ourThere were no acquisitions consummated during the years ended September 30, 2017, 20162023, 2022 and 2015 was $166.6 million, $5.5 million, and $5,147.9 million, respectively.2021.
All of our acquisitions have been accounted for as business combinations and the results of operations of the acquired companies have been included in our consolidated results since the dates of the acquisitions.
Table of Contents
Components of Income and Expense
| | | | | | | | | | | | | | | | |
| | Year Ended September 30, | |
|---|
| | 2017 | | 2016 | | 2015 | | 2014 | | 2013 | |
|---|
| | (in millions)
| |
|---|
Other Financial Data: | | | | | | | | | | | | | | | | |
Revenue | | $ | 18,203 | | $ | 17,411 | | $ | 17,990 | | $ | 8,357 | | $ | 8,153 | |
Cost of revenue | | | 17,519 | | | 16,768 | | | 17,455 | | | 7,954 | | | 7,703 | |
| | | | | | | | | | | | | | | | | |
Gross profit | | | 684 | | | 643 | | | 535 | | | 403 | | | 450 | |
Equity in earnings of joint ventures | | | 142 | | | 104 | | | 106 | | | 58 | | | 24 | |
General and administrative expenses | | | (134 | ) | | (115 | ) | | (114 | ) | | (81 | ) | | (97 | ) |
Acquisition and integration expenses | | | (39 | ) | | (214 | ) | | (398 | ) | | (27 | ) | | — | |
Gain (loss) on disposal activities | | | 1 | | | (43 | ) | | — | | | — | | | — | |
| | | | | | | | | | | | | | | | | |
Income from operations | | $ | 654 | | $ | 375 | | $ | 129 | | $ | 353 | | $ | 377 | |
| | | | | | | | | | | | | | | | | |
| | | | | | | | | | | | | | | | | |
| | | | | | | | | | | | | | | | | |
| | | | | | | | | | | | | | | |
| | Year Ended September 30, |
| | 2023 | | 2022 | | 2021 | | 2020 | | 2019 |
|
| | (in millions) |
Other Financial Data: | | |
Revenue | | $ | 14,378 | | $ | 13,148 | | $ | 13,341 | | $ | 13,240 | | $ | 13,642 |
Cost of revenue | | | 13,433 | | | 12,300 | | | 12,543 | | | 12,530 | | | 13,030 |
Gross profit | | | 945 | | | 848 | | | 798 | | | 710 | | | 612 |
Equity in earnings of joint ventures | | | (279) | | | 54 | | | 35 | | | 49 | | | 49 |
General and administrative expenses | | | (154) | | | (147) | | | (155) | | | (190) | | | (148) |
Restructuring cost | | | (188) | | | (108) | | | (48) | | | (188) | | | (95) |
Gain on disposal activities | | | — | | | — | | | — | | | — | | | 3 |
Impairment of long-lived assets | | | — | | | — | | | — | | | — | | | (25) |
Income from operations | | $ | 324 | | $ | 647 | | $ | 630 | | $ | 381 | | $ | 396 |
Revenue
We generate revenue primarily by providing planning, consulting, architectural and engineering design, construction and program management services to commercialpublic and governmentprivate clients around the world. Our revenue consists of both services provided by our employees and pass-through feesrevenues from subcontractors and other direct costs. We generally utilize a cost-to-cost approach in applying the percentage-of-completion methodrecognize revenue over time as performance obligations are satisfied and control over promised goods or services are transferred to our customers. We generally measure progress to completion using an input measure of revenue recognition. Under this approach, revenue is earned in proportion to total costs incurred divided by total costs expected to be incurred.
Cost of revenue reflects the cost of our own personnel (including fringe benefits and overhead expense) and fees from subcontractors and other direct costs associated with revenue.
Included in our cost of revenue is amortization of acquired intangible assets. We have ascribed value to identifiable intangible assets other than goodwill in our purchase price allocations for companies we have acquired. These assets include, but are not limited to, backlog and customer relationships. To the extent we ascribe value to identifiable intangible assets that have finite lives, we amortize those values over the estimated useful lives of the assets. Such amortization expense, although non-cash in the period expensed, directly impacts our results of operations. It is difficult to predict with any precision the amount of expense we may record relating to acquired intangible assets.
Equity in earnings of joint ventures includes our portion of fees charged by our unconsolidated joint ventures to clients for services performed by us and other joint venture partners along with earnings we receive from our return on investments in unconsolidated joint ventures.
General and administrative expenses include corporate expenses, including personnel, occupancy, and administrative expenses.
Restructuring Expenses
Acquisition and integrationRestructuring expenses are comprised of transactionpersonnel and other costs, professional fees,real estate costs, and personnel costs including due diligence and integration activities,associated with the exit of our Russia-related businesses primarily related to business acquisitions.actions that are expected to deliver continued margin improvements and efficiencies.
Geographic Information
For geographic financial information, please refer to Note 4 and Note 19 in the notes to our consolidated financial statements found elsewhere in the Form 10-K.
Goodwill Impairment
See Critical Accounting Policies and Consolidated Results below.
As a global enterprise, income tax (benefit)/expense and our effective tax rates can be affected by many factors, including changes in our worldwide mix of pre-tax losses/earnings, the effect of non-controlling interest in income of consolidated subsidiaries, the extent to which the earnings are indefinitely reinvested outside of the United States, our acquisition strategy, tax incentives and credits available to us, changes in judgment regarding the realizability of our deferred tax assets, changes in existing tax laws and our assessment of uncertain tax positions. Our tax returns are routinely audited by the taxing authorities and settlements of issues raised in these audits can also sometimes affect our effective tax rate.
Critical Accounting Policies
Our financial statements are presented in accordance with accounting principles generally accepted in the United States (GAAP). Highlighted below are the accounting policies, thatincluding those described below, often require management considersto make significant to understandingestimates and assumptions using information available at the time the estimates are made. Such estimates and assumptions significantly affect various reported amounts of assets, liabilities, revenue and expenses. If future experience differs significantly from these estimates and assumptions, our results of operations ofand financial condition could be affected. Our most critical accounting policies and estimates are described below. We have not materially changed our business.estimation methodology during the period presented.
Our accounting policies establish principles for recognizing revenue upon the transfer of control of promised goods or services to customers. We generally utilize a cost-to-cost approach in applying the percentage-of-completion methodrecognize revenues over time as performance obligations are satisfied. We generally measure our progress to completion using an input measure of revenue recognition, under which revenue is earned in proportion to total costs incurred divided by total costs expected to be incurred. RecognitionIn the course of providing these services, we routinely subcontract for services and incur other direct cost on behalf of our clients. These costs are passed through to clients and, in accordance with accounting rules, are included in our revenue and cost of revenue.
Revenue recognition and profit under this method is dependent upon a number of factors, including the accuracy of a variety of estimates includingmade at the balance sheet date, such as engineering progress, material quantities, the achievement of milestones, penalty provisions, labor productivity and cost estimates. DueAdditionally, we are required to uncertainties inherentmake estimates for the amount of consideration to be received, including bonuses, awards, incentive fees, claims, unpriced change orders, penalties and liquidated damages. Variable consideration is included in the estimation process, it is possibleestimate of transaction price only to the extent that actual completion costsa significant reversal would not be probable. We continuously monitor factors that may vary from estimates. If estimated total costs on contracts indicate a loss, we recognize that estimated loss within costaffect the quality of revenueour estimates, and material changes in the period the estimated loss first becomes known.estimates are disclosed accordingly.
Claims are amounts in excess of the agreed contract price (or amounts not included in the original contract price) that we seek to collect from customers or others for delays, errors in specifications and designs, contract terminations, change orders in dispute or unapproved contracts as to both scope and price or other causes of unanticipated additional costs. Judgment is required to estimate the amount, if any, of revenue to be recognized on claims. We record contract revenue related to claims only if it is probable that the claim will result in additional contract revenue and if the amount can be reliably estimated. In such cases, we record revenue only to the extent that contract costs relating to the claim have been incurred.a significant reversal would not be probable. The amounts recorded, if material, are disclosed in the notes to the financial statements. Costs attributable to claims are treated as costs of contract performance as incurred.
Our federal government and certain state and local agency contracts are subject to, among other regulations, regulations issued under the Federal Acquisition Regulations (FAR). These regulations can limit the recovery of certain specified indirect costs on contracts and subject us to ongoing multiple audits
Table of Contents
by government agencies such as the Defense Contract Audit Agency (DCAA). In addition, most of our federal and state and local contracts are subject to termination at the discretion of the client.
Audits by the DCAA and other agencies consist of reviews of our overhead rates, operating systems and cost proposals to ensure that we account for such costs in accordance with the Cost Accounting Standards of the FAR (CAS). If the DCAA determines we have not accounted for such costs consistent with CAS, the DCAA may disallow these costs. There can be no assurance that audits by the DCAA or other governmental agencies will not result in material cost disallowances in the future.
Allowance for Doubtful Accounts and Expected Credit Losses
We record accounts receivable net of an allowance for doubtful accounts. This allowance for doubtful accounts is estimated based on management'smanagement’s evaluation of the contracts involved and the financial condition of our clients. The factors we consider in our contract evaluations include, but are not limited to:
• | ● | Client type—federal or state and local government or commercial client; |
| ● | Historical contract performance; |
| ● | Historical collection and delinquency trends; |
| ● | Client credit worthiness; and |
| ● | General economic conditions. |
Contract Assets and local government or commercial client;
•Historical contract performance;
•Historical collection and delinquency trends;
•Client credit worthiness; and
•General economic conditions.
Unbilled accounts receivable representsContract assets represent the contract revenue recognized but not yet billed pursuant to contract terms or accounts billed after the period end.terms.
Billings in excess of costs on uncompleted contractsContract liabilities represent the billings to date, as allowed under the terms of a contract, but not yet recognized as contract revenue using the percentage-of-completion accounting method.our revenue recognition policy.
We have noncontrolling interests in joint ventures accounted for under the equity method. Fees received for and the associated costs of services performed by us and billed to joint ventures with respect to work done by us for third-party customers are recorded as our revenues and costs in the period in which such services are rendered. In certain joint ventures, a fee is added to the respective billings from both ourselvesus and the other joint venture partners on the amounts billed to the third-party customers. These fees result in earnings to the joint venture and are split with each of the joint venture partners and paid to the joint venture partners upon collection from the third-party customer. We record our allocated share of these fees as equity in earnings of joint ventures.
Additionally, our ACAP segment primarily invests in and develops real estate public-private partnership (P3) and infrastructure projects.
We provide for income taxes in accordance with principles contained in ASC Topic 740, Income Taxes. Under these principles, we recognize the amount of income tax payable or refundable for the current year and deferred tax assets and liabilities for the future tax consequences of events that have been recognized in our financial statements or tax returns.
Deferred tax assets and liabilities are measured using enacted tax rates in effect for the year in which those temporary differences are expected to be recovered or settled. The effect on deferred tax assets and
Table of Contents
liabilities of a change in tax rates is recognized in earnings in the period when the new rate is enacted. Deferred tax assets are evaluated for future realization and reduced by a valuation allowance if it is more likely than not that a portion will not be realized.
We measure and recognize the amount of tax benefit that should be recorded for financial statement purposes for uncertain tax positions taken or expected to be taken in a tax return. With respect to uncertain tax positions, we evaluate the recognized tax benefits for recognition, measurement, derecognition, classification, interest and penalties, interim period accounting and disclosure requirements. Judgment is required in assessing the future tax consequences of events that have been recognized in our financial statements or tax returns.
Valuation Allowance. Deferred income taxes are provided on the liability method whereby deferred tax assets and liabilities are established for the difference between the financial reporting and income tax basis of assets and liabilities, as well as for tax attributes such as operating loss and tax credit carryforwards. Deferred tax assets and liabilities are adjusted for the effects of changes in tax laws and tax rates on the date of enactment of such changes to laws and tax rates.
Deferred tax assets are reduced by a valuation allowance when, in our opinion, it is more likely than not that some portion or all of the deferred tax assets may not be realized. The evaluation of the recoverability of the deferred tax asset requires the Company to weigh all positive and negative evidence to reach a conclusion that it is more likely than not that all or some portion of the deferred tax assets will not be realized. The weight given to the evidence is commensurate with the extent to which it can be objectively verified. Whether a deferred tax asset may be realized requires considerable judgment by us. In considering the need for a valuation allowance, we consider a number of factors including the nature, frequency, and severity of cumulative financial reporting losses in recent years, the future reversal of existing temporary differences, predictability of future taxable income exclusive of reversing temporary differences of the character necessary to realize the asset, relevant carryforward periods, taxable income in carry-back years if carry-back is permitted under tax law, and prudent and feasible tax planning strategies that would be implemented, if necessary, to protect against the loss of the deferred tax asset that would otherwise expire. Whether a deferred tax asset will ultimately be realized is also dependent on varying factors, including, but not limited to, changes in tax laws and audits by tax jurisdictions in which we operate.
If future changes in judgment regarding the realizability of our deferred tax assets lead us to determine that it is more likely than not that we will not realize all or part of our deferred tax asset in the future, we will record an additional valuation allowance. Conversely, if a valuation allowance exists and we determine that the ultimate realizability of all or part of the net deferred tax asset is more likely than not to be realized, then the amount of the valuation allowance will be reduced. This adjustment will increase or decrease income tax expense in the period of such determination.
Undistributed Non-U.S. Earnings. The results of our operations outside of the United States are consolidated for financial reporting; however, earnings from investments in non-U.S. operations are included in domestic U.S. taxable income only when actually or constructively received. No deferred taxes have been provided on the undistributed gross book-tax basis differences of our non-U.S. operations of approximately $1.7$1.3 billion because we have the ability to and intend to permanently reinvest these basis differences overseas. If we were to repatriate these basis differences, additional taxes could be due at that time.
We continually explore initiatives to better align our tax and legal entity structure with the footprint of our non-U.S. operations and we recognize the tax impact of these initiatives, including changes in assessment of its uncertain tax positions, indefinite reinvestment exception assertions and realizability of deferred tax assets, earliest in the period when management believes all necessary internal and external approvals associated with such initiatives have been obtained, or when the initiatives are materially complete.
Table of Contents
Goodwill represents the excess of amounts paid over the fair value of net assets acquired from an acquisition. In order to determine the amount of goodwill resulting from an acquisition, we perform an assessment to determine the value of the acquired company'scompany’s tangible and identifiable intangible assets and liabilities. In our assessment, we determine whether identifiable intangible assets exist, which typically include backlog and customer relationships.
We test goodwill for impairment annually for each reporting unit in the beginning of the fourth quarter of the fiscal year and between annual tests, if events occur or circumstances change which suggest that goodwill should be evaluated. Such events or circumstances include significant changes in legal factors and business climate, recent losses at a reporting unit, and industry trends, among other factors. A reporting unit is defined as an operating segment or one level below an operating segment. Our impairment tests are performed at the operating segment level as they represent our reporting units.
TheGoodwill is evaluated for impairment testeither by assessing qualitative factors or by performing a quantitative assessment. Qualitative factors, such as overall financial performance, industry or market considerations, or other relevant events, are assessed to determine if it is more likely than not that the fair value of the reporting units is less than their carrying amounts. During a two-step process. During the first step,quantitative impairment test, we estimate the fair value of the reporting unit using income and market approaches, and compare that amount to the carrying value of that reporting unit. In the event the fair value of the reporting unit is determined to be less than the carrying value, a second stepgoodwill is required. The second step requires us to perform a hypothetical purchase allocation for that reporting unitimpaired, and to compare the resulting current implied fair value of the goodwillan impairment loss is recognized equal to the current carrying valueexcess, limited to the total amount of the goodwill for thatallocated to the reporting unit. In the event that the current implied fair value of the goodwill is less than the carrying value, an impairment charge is recognized.
During the fourth quarter, we conduct our annual goodwill impairment test. The impairment evaluation process includes, among other things, making assumptions about variables such as revenue growth rates, profitability, discount rates, and industry market multiples, which are subject to a high degree of judgment.
MaterialThere are inherent uncertainties related to each of the above listed assumptions, and our judgment in applying them. Changes in the assumptions used in our goodwill and intangible assets could result in impairment charges that could be material to our consolidated financial statements in any given period. We have not materially changed our estimation methodology during the impairment analysis included the weighted average costperiods presented.
Pension Benefit Obligations
A number of assumptions are necessary to determine our pension liabilities and net periodic costs. These liabilities and net periodic costs are sensitive to changes in those assumptions. The assumptions include discount rates, long-term rates of return on plan assets and inflation levels limited to the United Kingdom and are generally determined based on the current economic environment in each host country at the end of each respective annual reporting period. We evaluate the funded status of each of our retirement plans using these current assumptions and determine the appropriate funding level considering applicable regulatory requirements, tax deductibility, reporting considerations and other factors. Based upon current assumptions, we expect to contribute $26.8$22.2 million to our international plans in fiscal 2018.2024. Our required minimum contributions for our U.S. qualified plans are not significant. In addition, we may make additional discretionary contributions. We currently expect to contribute $12.7$12.9 million to our U.S. plans (including benefit payments to nonqualified plans and postretirement medical plans) in fiscal 2018.2024. If the discount rate was reduced by 25 basis points, plan liabilities would increase by approximately $82.2$26.6 million. If the discount rate and return on plan assets were reduced by 25 basis points, plan expense would decreaseincrease by approximately $0.1$0.3 million and increase by approximately $3.4$2.7 million, respectively. If inflation increased by 25 basis points, plan liabilities in the United Kingdom would increase by approximately $42.7$17.1 million and plan expense would increase by approximately $2.7$2.0 million.
Table of Contents
At each measurement date, all assumptions are reviewed and adjusted as appropriate. With respect to establishing the return on assets assumption, we consider the long termlong-term capital market expectations for each asset class held as an investment by the various pension plans. In addition to expected returns for each asset class, we take into account standard deviation of returns and correlation between asset classes. This is necessary in order to generate a distribution of possible returns which reflects diversification of assets. Based on this information, a distribution of possible returns is generated based on the plan'splan’s target asset allocation.
Capital market expectations for determining the long termlong-term rate of return on assets are based on forward-looking assumptions which reflect a 20-year view of the capital markets. In establishing those capital market assumptions and expectations, we rely on the assistance of our actuaries and our investment consultants. We and the plan trustees review whether changes to the various plans'plans’ target asset allocations are appropriate. A change in the plans'plans’ target asset allocations would likely result in a change in the expected return on asset assumptions. In assessing a plan'splan’s asset allocation strategy, we and the plan trustees consider factors such as the structure of the plan'splan’s liabilities, the plan'splan’s funded status, and the impact of the asset allocation to the volatility of the plan'splan’s funded status, so that the overall risk level resulting from our defined benefit plans is appropriate within our risk management strategy.
Between September 30, 20162022 and September 30, 2017,2023, the aggregate worldwide pension deficit decreased from $696.1$204.4 million to $553.0$165.3 million due to rising global asset prices. Although funding rules are subject to local laws and regulations and vary by location, we expect to reduce this deficit over a period of 7 to 10 years.increased discount rates. If the various plans do not experience future investment gains to reduce this shortfall, the deficit will be reduced by additional contributions.
We carry professional liability insurance policies or self-insure for our initial layer of professional liability claims under our professional liability insurance policies and for a deductible for each claim even after exceeding the self-insured retention. We accrue for our portion of the estimated ultimate liability for the estimated potential incurred losses. We establish our estimate of loss for each potential claim in consultation with legal counsel handling the specific matters and based on historic trends taking into account recent events. We also use an outside actuarial firm to assist us in estimating our future claims exposure. It is possible that our estimate of loss may be revised based on the actual or revised estimate of liability of the claims.
Foreign Currency Translation39
Our functional currency is the U.S. dollar. Results of operations for foreign entities are translated to U.S. dollars using the average exchange rates during the period. Assets and liabilities for foreign entities are translated using the exchange rates in effect as of the date of the balance sheet. Resulting translation adjustments are recorded as a foreign currency translation adjustment into other accumulated comprehensive income/(loss) in stockholders' equity.
We limit exposure to foreign currency fluctuations in most of our contracts through provisions that require client payments in currencies corresponding to the currency in which costs are incurred. As a result of this natural hedge, we generally do not need to hedge foreign currency cash flows for contract work performed. However, we will use foreign exchange derivative financial instruments from time to time to mitigate foreign currency risk. The functional currency of all significant foreign operations is the respective local currency.
Table of Contents
Fiscal year ended September 30, 20172023 compared to the fiscal year ended September 30, 2016
2022
Consolidated Results
| | | | | | | | | | | | |
| | Fiscal Year Ended | | Change | |
| | September 30, | | September 30, | | | | | | |
| | 2023 | | 2022 | | $ | | % | |
|
| | ($ in millions) | |
Revenue | | $ | 14,378.5 | | $ | 13,148.2 | | $ | 1,230.3 | | 9.4 | % |
Cost of revenue | | | 13,433.0 | | | 12,300.2 | | | 1,132.8 | | 9.2 | |
Gross profit | | | 945.5 | | | 848.0 | | | 97.5 | | 11.5 | |
Equity in (losses) earnings of joint ventures | | | (279.4) | | | 53.6 | | | (333.0) | | (621.3) | |
General and administrative expenses | | | (153.6) | | | (147.3) | | | (6.3) | | 4.3 | |
Restructuring cost | | | (188.4) | | | (107.5) | | | (80.9) | | 75.3 | |
Income from operations | | | 324.1 | | | 646.8 | | | (322.7) | | (49.9) | |
Other income | | | 8.3 | | | 5.9 | | | 2.4 | | 40.7 | |
Interest income | | | 40.3 | | | 8.2 | | | 32.1 | | 391.5 | |
Interest expense | | | (159.3) | | | (110.2) | | | (49.1) | | 44.6 | |
Income from continuing operations before taxes | | | 213.4 | | | 550.7 | | | (337.3) | | (61.2) | |
Income tax expense from continuing operations | | | 56.1 | | | 136.1 | | | (80.0) | | (58.8) | |
Net income from continuing operations | | | 157.3 | | | 414.6 | | | (257.3) | | (62.1) | |
Net loss from discontinued operations | | | (57.2) | | | (79.9) | | | 22.7 | | (28.4) | |
Net income | | | 100.1 | | | 334.7 | | | (234.6) | | (70.1) | |
Net income attributable to noncontrolling interests from continuing operations | | | (43.2) | | | (25.5) | | | (17.7) | | 69.4 | |
Net (loss) income attributable to noncontrolling interests from discontinued operations | | | (1.6) | | | 1.4 | | | (3.0) | | (214.3) | |
Net income attributable to noncontrolling interests | | | (44.8) | | | (24.1) | | | (20.7) | | 85.9 | |
Net income attributable to AECOM from continuing operations | | | 114.1 | | | 389.1 | | | (275.0) | | (70.7) | |
Net loss attributable to AECOM from discontinued operations | | | (58.8) | | | (78.5) | | | 19.7 | | (25.1) | |
Net income attributable to AECOM | | $ | 55.3 | | $ | 310.6 | | $ | (255.3) | | (82.2) | % |
| | | | | | | | | | | | | |
| | Fiscal Year Ended | |
| |
| |
|---|
| | Change | |
|---|
| | September 30,
2017 | | September 30,
2016 | |
|---|
| | $ | | % | |
|---|
| | ($ in millions)
| |
|---|
Revenue | | $ | 18,203.4 | | $ | 17,410.8 | | $ | 792.6 | | | 4.6 | % |
Cost of revenue | | | 17,519.7 | | | 16,768.0 | | | 751.7 | | | 4.5 | |
| | | | | | | | | | | | | | |
Gross profit | | | 683.7 | | | 642.8 | | | 40.9 | | | 6.4 | |
Equity in earnings of joint ventures | | | 141.6 | | | 104.0 | | | 37.6 | | | 36.2 | |
General and administrative expenses | | | (133.4 | ) | | (115.1 | ) | | (18.3 | ) | | 15.9 | |
Acquisition and integration expenses | | | (38.7 | ) | | (213.6 | ) | | 174.9 | | | (81.9 | ) |
Gain (loss) on disposal activities | | | 0.6 | | | (42.6 | ) | | 43.2 | | | (101.4 | ) |
| | | | | | | | | | | | | | |
Income from operations | | | 653.8 | | | 375.5 | | | 278.3 | | | 74.1 | |
Other income | | | 6.7 | | | 8.2 | | | (1.5 | ) | | (18.3 | ) |
Interest expense | | | (231.3 | ) | | (258.1 | ) | | 26.8 | | | (10.4 | ) |
| | | | | | | | | | | | | | |
Income before income tax expense | | | 429.2 | | | 125.6 | | | 303.6 | | | 241.7 | |
Income tax expense (benefit) | | | 7.7 | | | (37.9 | ) | | 45.6 | | | (120.3 | ) |
| | | | | | | | | | | | | | |
Net income | | | 421.5 | | | 163.5 | | | 258.0 | | | 157.8 | |
Noncontrolling interests in income of consolidated subsidiaries, net of tax | | | (82.1 | ) | | (67.4 | ) | | (14.7 | ) | | 21.8 | |
| | | | | | | | | | | | | | |
Net income attributable to AECOM | | $ | 339.4 | | $ | 96.1 | | $ | 243.3 | | | 253.2 | % |
| | | | | | | | | | | | | | |
| | | | | | | | | | | | | | |
| | | | | | | | | | | | | | |
The following table presents the percentage relationship of certainstatement of operations items to revenue:
| | | | | | | |
| | Fiscal Year Ended | |
|---|
| | September 30,
2017 | | September 30,
2016 | |
|---|
Revenue | | | 100.0 | % | | 100.0 | % |
Cost of revenue | | | 96.2 | | | 96.3 | |
| | | | | | | | |
Gross profit | | | 3.8 | | | 3.7 | |
Equity in earnings of joint ventures | | | 0.8 | | | 0.6 | |
General and administrative expenses | | | (0.8 | ) | | (0.7 | ) |
Acquisition and integration expenses | | | (0.2 | ) | | (1.2 | ) |
Gain (loss) on disposal activities | | | 0.0 | | | (0.2 | ) |
| | | | | | | | |
Income from operations | | | 3.6 | | | 2.2 | |
Other income | | | — | | | — | |
Interest expense | | | (1.2 | ) | | (1.5 | ) |
| | | | | | | | |
Income before income tax expense | | | 2.4 | | | 0.7 | |
Income tax expense (benefit) | | | 0.1 | | | (0.2 | ) |
| | | | | | | | |
Net income | | | 2.3 | | | 0.9 | |
Noncontrolling interests in income of consolidated subsidiaries, net of tax | | | (0.4 | ) | | (0.3 | ) |
| | | | | | | | |
Net income attributable to AECOM | | | 1.9 | % | | 0.6 | % |
| | | | | | | | |
| | | | | | | | |
| | | | | | | | |
| | | | | |
| | Fiscal Year Ended | |
| | September 30, | | September 30, | |
| | 2023 | | 2022 | |
Revenue | | 100.0 | % | 100.0 | % |
Cost of revenue | | 93.4 | | 93.6 | |
Gross profit | | 6.6 | | 6.4 | |
Equity in (losses) earnings of joint ventures | | (1.9) | | 0.4 | |
General and administrative expenses | | (1.1) | | (1.1) | |
Restructuring costs | | (1.3) | | (0.8) | |
Income from operations | | 2.3 | | 4.9 | |
Other income | | 0.1 | | 0.0 | |
Interest income | | 0.3 | | 0.1 | |
Interest expense | | (1.2) | | (0.8) | |
Income from continuing operations before taxes | | 1.5 | | 4.2 | |
Income tax expense from continuing operations | | 0.4 | | 1.0 | |
Net income from continuing operations | | 1.1 | | 3.2 | |
Net loss from discontinued operations | | (0.4) | | (0.7) | |
Net income | | 0.7 | | 2.5 | |
Net income attributable to noncontrolling interests from continuing operations | | (0.3) | | (0.2) | |
Net (loss) income attributable to noncontrolling interests from discontinued operations | | 0.0 | | 0.0 | |
Net income attributable to noncontrolling interests | | (0.3) | | (0.2) | |
Net income attributable to AECOM from continuing operations | | 0.8 | | 3.0 | |
Net loss attributable to AECOM from discontinued operations | | (0.4) | | (0.7) | |
Net income attributable to AECOM | | 0.4 | % | 2.3 | % |
Table of ContentsRevenue
Our revenue for the year ended September 30, 20172023 increased $792.6$1,230.3 million, or 4.6%9.4%, to $18,203.4$14,378.5 million as compared to $17,410.8$13,148.2 million for the corresponding period last year.
The increase in revenue for the year ended September 30, 2017 was primarily attributable to an increase in our CS segment of $924.5 million, partially offset by a decrease in our DCS segment of $89.0 million and a decrease in our MS segment of $42.9 million, as discussed further below.
In the course of providing our services, we routinely subcontract for services and incur other direct costs on behalf of our clients. These costs are passed through to clients and, in accordance with industry practice and GAAP, are included in our revenue and cost of revenue. Because subcontractor and other direct coststhese pass-through revenues can change significantly from project to project and period to period, changes in revenue may not be indicative of business trends. Subcontractor and other direct costsPass-through revenues for the years ended September 30, 20172023 and 20162022 were $9.2$7.7 billion and $8.4$6.8 billion, respectively. Subcontractor costs and other direct costsPass-through revenue as a percentage of total revenue increased to 51%was 53% and 52% during the year ended September 30, 2017 from 48% during the year ended September 30, 2016 due to increased building construction in our CS segment, as discussed below.2023 and 2022, respectively.
Our gross profit for the year ended September 30, 20172023 increased $40.9$97.5 million, or 6.4%11.5%, to $683.7$945.5 million as compared to $642.8$848.0 million for the corresponding period last year. For the year ended September 30, 2017,2023, gross profit, as a percentage of revenue, increased to 3.8%6.6% from 3.7%6.4% in the year ended September 30, 2016.2022.
Billings in excess of costs on uncompleted contracts includes a margin fair value liability associated with long-term contracts acquired in connection with the acquisition of URS on October 17, 2014. Revenue and the related income from operations related to the margin fair value liability recognized during the year ended September 30, 2017 was $6.3 million, compared with $37.2 million during the year ended September 30, 2016. This amount was offset by a decrease in amortization of intangible assets of $83.6 million during the year ended September 30, 2017, compared with $183.3 million during the year ended September 30, 2016. We do not expect the margin fair value liability recognized in recent business acquisitions will have a significant impact to gross margin in future periods.
Gross profit changes were also due to the reasons noted in DCS, CSAmericas and MS Reportable SegmentsInternational reportable segments below.
Equity in (Losses) Earnings of Joint Ventures
Our equity in losses of joint ventures for the year ended September 30, 2023 was $279.4 million as compared to equity in earnings of $53.6 million in the corresponding period last year.
The decrease in earnings of joint ventures for the year ended September 30, 2017 was $141.6 million as2023 compared to $104.0 millionthe same period in the corresponding period last year.
The increase in earnings of joint ventures for theprior year ended September 30, 2017 was primarily due to the sale of ACAP's 50% equity interest in Provost Square I LLC for $133 million, which resulted in a gain of $52 millionimpairment losses recorded in our fiscal 2017AECOM Capital segment during the third quarter, partially offset by decreased earnings from a United Kingdom nuclear cleanup joint venture for which our work was substantially completed in the second quarter of fiscal 2016.2023. These impairments were primarily as a result of a project-by-project review of the existing investment portfolio, the expected acceleration of exits from certain investments caused by a change in strategy, and volatility in the commercial real estate market caused by higher interest rates and lack of liquidity.
Our general and administrative expenses for the year ended September 30, 20172023 increased $18.3$6.3 million, or 15.9%4.3%, to $133.4$153.6 million as compared to $115.1$147.3 million for the corresponding period last year. AsFor the years ended September 30, 2023 and 2022, general and administrative expenses as a percentage of revenue generalremained unchanged at 1.1%.
Restructuring Costs
Restructuring expenses are comprised of personnel costs, real estate costs, and administrative expenses increased to 0.8% for thecosts associated with business exits. During fiscal year ended September 30, 2017 from 0.7%2023, we incurred total restructuring expenses of $188.4 million primarily related to actions taken to align our real estate portfolio with our employee flexibility initiatives and costs incurred in preparation for the exit of certain countries in Southeast Asia. During fiscal year ended September 30, 2016.
Table2022, we incurred restructuring expenses of Contents
The increase in our general and administrative expenses was$107.5 million, primarily duerelated to increased personnel costs.
Acquisition and integration expenses, resulting from business acquisitions, were comprised of the following (in millions):
| | | | | | | |
| | Year Ended
September 30, | |
|---|
| | 2017 | | 2016 | |
|---|
Severance and personnel costs | | $ | 32.0 | | $ | 23.4 | |
Professional services, real estate-related, and other expenses | | | 6.7 | | | 190.2 | |
| | | | | | | | |
Total | | $ | 38.7 | | $ | 213.6 | |
| | | | | | | | |
| | | | | | | | |
| | | | | | | | |
Our cost savings and acquisition and integration expensescosts associated with the URS integration are complete.
Gain on disposal activitiesexit of Russia-related businesses and management actions to deliver margin improvement and efficiencies that result in the accompanying statements of operations for the year ended September 30, 2017 was $0.6 million compared to loss on disposal activities of $42.6 million for the year ended September 30, 2016. Losses recorded in fiscal year 2016 related to the disposition of non-core energy-related businesses, equipment and other assets that did not repeat in fiscal year 2017.a more agile organization.
Our otherinterest income for the year ended September 30, 2017 decreased $1.52023 increased to $40.3 million to $6.7from $8.2 million as compared to $8.2 millionfor the corresponding period last year.
The increase in interest income for the year ended September 30, 2016.2023 was primarily due to an increase in interest rates on our interest-bearing assets.
Other income is primarily comprised of interest income.
Our interest expense for the year ended September 30, 20172023 was $231.3$159.3 million as compared to $258.1$110.2 million for the year ended September 30, 2016.corresponding period last year.
The decreaseincrease in interest expense for the year ended September 30, 20172023 was primarily due to an increase in interest rates on the write-off of capitalized debt issuance costs related to the amendmentvariable component of our credit agreement in September 2016 and a reduction in our debt balance.debt.
Income Tax Expense / Benefit
Our income tax expense for the year ended September 30, 20172023 was $7.7$56.1 million compared to income tax benefit of $37.9$136.1 million for the year ended September 30, 2016.2022. The effective tax rate was 1.8% and (30.2)% for the years ended September 30, 2017 and 2016, respectively.
The increasedecrease in income tax expense for the year ended September 30, 2017current period compared to the priorcorresponding period last year iswas due primarily to a tax benefit of $65.0 million related to the tax impact ofAECOM Capital impairment charge, including an increase in overall pre-tax incomevaluation allowances of $303.6$21.0 million for the retroactive extensionportion of the federal research creditcharge that is not expected to be realized, and a net tax benefit recorded in fiscal 2022 related to changes in valuation allowances providing a tax benefit of $21.9 million and foreign uncertain tax provisions generating a tax expense of $16.1 million.
During the first quarter of 2016, and the tax impacts from changes in the mix of geographical income. In addition, valuation allowance releases and other benefits recorded each year contributed to the decrease in the overall tax expense in both years. As described further below, three one-time benefits totaling $106.3 million were recognized during 2017 including the release of valuation allowances, indefinitely reinvesting a portion of our non-U.S. undistributed earnings that U.S. tax had previously been provided for, and foreign tax credits expected to be realized in the foreseeable future. In
Table of Contents
addition, two one-time benefits totaling $36.2 million related to valuation allowances were released during 2016.
In the fourth quarter of 2017, we executed international restructuring transactions that resulted in a distribution of current year earnings and profits and the associated foreign tax credits. The distribution resulted in the recognition of a benefit of $25.2 million related to excess foreign tax credits expected to be realized in the foreseeable future. These current year earnings had previously been forecasted to qualify for the indefinite reinvestment exception. The Company's change in assertion for these investments is a one-time event and does not impact our past or future assertions regarding intent and ability to reinvest indefinitely.
In the third quarter of 2017, we recapitalized one of our European subsidiaries which resulted in the Company indefinitely reinvesting a portion of our non-U.S. undistributed earnings that U.S. tax had previously been provided for and released the associated $21.2 million deferred tax liability. These non-U.S. earnings are now intended to be reinvested indefinitely outside of the U.S to meet the current and future cash needs of our European operations.
In the second quarter of 2017,fiscal 2022, valuation allowances in the amount of $59.9$21.9 million primarily related to net operating losses in the United Kingdomcertain foreign entities were released due to sufficient positive evidence. We evaluated theThe positive evidence against any negative evidence and determined that it is more likely than not thatincluded a realignment of our global transfer pricing methodology which resulted in forecasting the deferred tax assets will be realized. This positive evidence includes an improvement in earnings,utilization of the use of net operating losses onwithin the foreseeable future.
We are currently under tax audit in several jurisdictions including the U.S. and believe the outcomes which are reasonably possible within the next twelve months, including lapses in statutes of limitations, could result in future adjustments, but will not result in a taxable basis, and better management of pension liabilities due to positive effects of pension asset management and stabilization of interest rates.
In the third quarter of 2016, valuation allowancesmaterial change in the amount of $23.3 million in the United Kingdom were released due to sufficient positive evidence. We evaluated the positive evidence against any negative evidence and determined the valuation allowances were no longer necessary. This positive evidence includes reaching a position of cumulative income over a three-year period and the use of net operating losses on a taxable basis. In addition, our United Kingdom affiliate has strong projected earnings in the United Kingdom.liability for uncertain tax positions.
Also in the third quarter of 2016, our Australian affiliate made an election in Australia to combine the tax results of the URS Australia business with the AECOM Australia business. This election resulted in the ability to utilize the URS Australia businesses' deferred tax assets against the combined future earnings of the Australian group and accordingly, the valuation allowance of $12.9 million was released.
On December 18, 2015, President Obama signedThe Protecting Americans from Tax Hikes Act into law. This legislation extended various temporary tax provisions expiring on December 31, 2015, including the permanent extension of the United States federal research credit. We recognized a discrete net benefit in the first quarter of 2016 for $10.1 million attributable to the retroactive impact of the extended provisions.
Certain operations in Canada continue to have losses and the associated valuation allowances could be reduced if and when our current and forecast profits trend turns and sufficient evidence exists to support the release of the related valuation allowance (approximately $26 million).
We regularly integrate and consolidate our business operations and legal entity structure, and such internal initiatives could impact the assessment of uncertain tax positions, indefinite reinvestment assertions and the realizability of deferred tax assets.
Net Loss From Discontinued Operations
During the first quarter of fiscal 2020, management approved a plan to dispose of via sale our self-perform at-risk construction businesses. As a result of these strategic actions, the self-perform at-risk construction businesses were classified as discontinued operations. That classification was applied retrospectively for all periods presented.
Net loss from discontinued operations was $57.2 million for the year ended September 30, 2023 and net loss was $79.9 million for the year ended September 30, 2022, a decrease of $22.7 million. The decrease in net loss from discontinued operations for the year ended September 30, 2023 was primarily due to losses related to revisions of estimates for our working capital obligations to be paid and contingent consideration receivable related to the civil infrastructure business recorded in the first half of fiscal 2022 that did not recur to the same extent in fiscal 2023.
Net Income Attributable to AECOM
The factors described above resulted in the net income attributable to AECOM of $339.4$55.3 million for the year ended September 30, 2017,2023, as compared to the net income attributable to AECOM of $96.1$310.6 million for the year ended September 30, 2016.
Table of Contents2022.
Results of Operations by Reportable Segment
Design and Consulting ServicesAmericas
|
| | Fiscal Year Ended | |
| |
| | |
|---|
| | Change | | |
|---|
| | September 30,
2017 | | September 30,
2016 | | |
|---|
| | $ | | % | | |
|---|
| | ($ in millions)
| | |
|---|
Revenue | | $ | 7,566.8 | | $ | 7,655.8 | | $ | (89.0 | ) | | (1.2 | )% | |
Cost of revenue | | 7,172.0 | | 7,273.3 | | (101.3 | ) | | (1.4 | ) | |
| | | | | | | | | | | | | |
Gross profit | | $ | 394.8 | | $ | 382.5 | | $ | 12.3 | | 3.2 | % | |
| | | | | | | | | | | | | | | | | | | | | | | | | |
| | | | | | | | | | | | Fiscal Year Ended | |
| | | | | | | | | | | | | | | September 30, | | September 30, | | Change | |
| | | 2023 | | 2022 | | $ | | % | |
| | | | ( in millions) | |
Revenue | | | $ | 10,975.7 | | $ | 9,939.3 | | $ | 1,036.4 | | 10.4 | % |
Cost of revenue | | | | 10,276.0 | | | 9,299.4 | | | 976.6 | | 10.5 | |
Gross profit | | | $ | 699.7 | | $ | 639.9 | | $ | 59.8 | | 9.3 | % |
The following table presents the percentage relationship of certainstatement of operations items to revenue:
| | | | | | | |
| | Fiscal Year Ended | |
|---|
| | September 30,
2017 | | September 30,
2016 | |
|---|
Revenue | | | 100.0 | % | | 100.0 | % |
Cost of revenue | | | 94.8 | | | 95.0 | |
| | | | | | | | |
Gross profit | | | 5.2 | % | | 5.0 | % |
| | | | | | | | |
| | | | | | | | |
| | | | | | | | |
| | | | | |
| | Fiscal Year Ended | |
| | September 30, | | September 30, | |
| | 2023 | | 2022 | |
Revenue | | 100.0 | % | 100.0 | % |
Cost of revenue | | 93.6 | | 93.6 | |
Gross profit | | 6.4 | % | 6.4 | % |
Revenue
Revenue for our DCSAmericas segment for the year ended September 30, 2017 decreased $89.02023 increased $1,036.4 million, or 1.2%10.4%, to $7,566.8$10,975.7 million as compared to $7,655.8$9,939.3 million for the corresponding period last year.
The decreaseincrease in revenue for the year ended September 30, 20172023 was primarily attributable to decreasesdriven by increased project activity in the Americas of $110 million and a negative foreign currency impact of $70 million mostly due to the strengthening of the U.S. dollar against the British pound. These decreases were offset by an increasedesign business including growth in the Asia Pacific (APAC) region of $100 million.Water, Transportation, and Environment markets.
Gross profit for our DCSAmericas segment for the year ended September 30, 20172023 increased $12.3$59.8 million, or 3.2%9.3%, to $394.8$699.7 million as compared to $382.5$639.9 million for the corresponding period last year. Gross profit, as a percentage of revenue, remained unchanged at 6.4% for the years ended September 30, 2023 and 2022.
The increase in gross profit for the year ended September 30, 2023 was primarily due to revenue growth and execution efficiency. In addition, underlying revenue, excluding pass-through revenues, increased.
International
| | | | | | | | | | | | |
| | Fiscal Year Ended | |
| | September 30, | | September 30, | | Change | |
| | 2023 | | 2022 | | $ | | % | |
|
| | (in millions) | |
Revenue | | $ | 3,402.1 | | $ | 3,206.7 | | $ | 195.4 | | 6.1 | % |
Cost of revenue | | | 3,157.0 | | | 3,000.8 | | | 156.2 | | 5.2 | |
Gross profit | | $ | 245.1 | | $ | 205.9 | | $ | 39.2 | | 19.0 | % |
The following table presents the percentage relationship of statement of operations items to revenue:
| | | | | |
| | Fiscal Year Ended | |
| | September 30, | | September 30, | |
| | 2023 | | 2022 | |
Revenue | | 100.0 | % | 100.0 | % |
Cost of revenue | | 92.8 | | 93.6 | |
Gross profit | | 7.2 | % | 6.4 | % |
Revenue
Revenue for our International segment for the year ended September 30, 2023 increased $195.4 million, or 6.1%, to $3,402.1 million as compared to $3,206.7 million for the corresponding period last year.
The increase in revenue for the year ended September 30, 2023 was primarily due to increased growth in the United Kingdom, Middle East and Australia compared to the prior year, which more than offset the impact of the stronger U.S. dollar as compared to the functional currencies of our foreign operations. Growth was led by the Transportation, Facilities, and Water markets.
Gross Profit
Gross profit for our International segment for the year ended September 30, 2023 increased $39.2 million, or 19.0%, to $245.1 million as compared to $205.9 million for the corresponding period last year. As a percentage of revenue, gross profit increased to 5.2%7.2% of revenue for the year ended September 30, 20172023 from 5.0%6.4% in the corresponding period last year.
The increase in gross profit and gross profit as a percentage of revenue for the year ended September 30, 20172023 was primarily due to decreased intangible amortization expense, net of the margin fair value adjustment, of $47 million, primarily from URS, partially offset by decreased project performance in the Europe, Middle East, Africa (EMEA) region.
Construction Services
| | | | | | | | | | | | | |
| | Fiscal Year Ended | |
| |
| |
|---|
| | Change | |
|---|
| | September 30,
2017 | | September 30,
2016 | |
|---|
| | $ | | % | |
|---|
| | ($ in millions)
| |
|---|
Revenue | | $ | 7,295.6 | | $ | 6,371.1 | | $ | 924.5 | | | 14.5 | % |
Cost of revenue | | | 7,202.7 | | | 6,345.7 | | | 857.0 | | | 13.5 | |
| | | | | | | | | | | | | | |
Gross profit | | $ | 92.9 | | $ | 25.4 | | $ | 67.5 | | | 265.7 | % |
| | | | | | | | | | | | | | |
| | | | | | | | | | | | | | |
| | | | | | | | | | | | | | |
Table of Contents
The following table presents the percentage relationship of certain items to revenue:
| | | | | | | |
| | Fiscal Year Ended | |
|---|
| | September 30,
2017 | | September 30,
2016 | |
|---|
Revenue | | | 100.0 | % | | 100.0 | % |
Cost of revenue | | | 98.7 | | | 99.6 | |
| | | | | | | | |
Gross profit | | | 1.3 | % | | 0.4 | % |
| | | | | | | | |
| | | | | | | | |
| | | | | | | | |
Revenue for our CS segment for the year ended September 30, 2017 increased $924.5 million, or 14.5%, to $7,295.6 million as compared to $6,371.1 million for the corresponding period last year.
Thean increase in revenue for the year ended September 30, 2017 was primarily attributable to approximately $700 millionand reduced costs resulting from country exits, ongoing investments in increased revenue due to the construction of sports arenas in the Americasenterprise capability centers, shared service centers, and the construction of residential high-rise buildings in the city of New York. Additionally, the increase was due to the inclusion of approximately $220 million of revenue from an entity acquired at the end of fiscal 2016.
Gross profit for our CS segment for the year ended September 30, 2017 increased $67.5 million, or 265.7%, to $92.9 million as compared to $25.4 million for the corresponding period last year. As a percentage of revenue, gross profit increased to 1.3% of revenue for the year ended September 30, 2017 from 0.4% in the corresponding period last year.delivery efficiency.
The increase in gross profit and gross profit as a percentage of revenue for the year ended September 30, 2017 was primarily due to increased profitability in our building construction businesses due to the increases in revenue noted above. The increase was also due to improved profitability in our oil and gas business.AECOM Capital
Management Services
| | | | | | | | | | | | |
| | Fiscal Year Ended | |
| | September 30, | | September 30, | | Change | |
| | 2023 | | 2022 | | $ | | % | |
|
| | (in millions) | |
Revenue | | $ | 0.7 | | $ | 2.2 | | $ | (1.5) | | (68.2) | % |
Equity in earnings of joint ventures | | $ | (303.9) | | $ | 24.4 | | $ | (328.3) | | NM | * |
General and administrative expenses | | $ | (12.6) | | $ | (12.6) | | $ | — | | 0.0 | % |
| | | | | | | | | | | | | |
| | Fiscal Year Ended | |
| |
| |
|---|
| | Change | |
|---|
| | September 30,
2017 | | September 30,
2016 | |
|---|
| | $ | | % | |
|---|
| | ($ in millions)
| |
|---|
Revenue | | $ | 3,341.0 | | $ | 3,383.9 | | $ | (42.9 | ) | | (1.3 | )% |
Cost of revenue | | | 3,145.0 | | | 3,149.0 | | | (4.0 | ) | | (0.1 | ) |
| | | | | | | | | | | | | | |
Gross profit | | $ | 196.0 | | $ | 234.9 | | $ | (38.9 | ) | | (16.6 | )% |
| | | | | | | | | | | | | | |
| | | | | | | | | | | | | | |
| | | | | | | | | | | | | | |
The following table presents the percentage relationship of certain items to revenue:
| | | | | | | |
| | Fiscal Year Ended | |
|---|
| | September 30,
2017 | | September 30,
2016 | |
|---|
Revenue | | | 100.0 | % | | 100.0 | % |
Cost of revenue | | | 94.1 | | | 93.1 | |
| | | | | | | | |
Gross profit | | | 5.9 | % | | 6.9 | % |
| | | | | | | | |
| | | | | | | | |
| | | | | | | | |
Table of Contents
Revenue for our MS segment for the year ended September 30, 2017 decreased $42.9 million, or 1.3%, to $3,341.0 million as compared to $3,383.9 million for the corresponding period last year.
The decrease in revenue for the year ended September 30, 2017 was primarily due to the expected accelerated recovery of a pension related entitlement from the federal government of approximately $50 million recorded in the year ended September 30, 2016, which did not repeat in 2017.
Gross profit for our MS segment for the year ended September 30, 2017 decreased $38.9 million, or 16.6%, to $196.0 million as compared to $234.9 million for the corresponding period last year. As a percentage of revenue, gross profit decreased to 5.9% of revenue for the year ended September 30, 2017 from 6.9% in the corresponding period last year.
The decrease in gross profit and gross profit as a percentage of revenue for the year ended September 30, 2017 was primarily due to favorable adjustments from the prior year that did not repeat in the current year. These adjustments included the expected accelerated recovery of a pension related entitlement from the federal government of approximately $50 million and favorable adjustments from an acquisition related environmental legal matter and a pension curtailment gain totaling approximately $17 million, net of noncontrolling interests ($20 million impact to gross profit). These decreases were partially offset by a benefit recorded in the three months ended December 31, 2016 of $35 million from the favorable settlement of a federal lawsuit, net of legal fees.
AECOM Capital
| | | | | | | | | | | | | |
| | Fiscal Year Ended | |
| |
| |
|---|
| | Change | |
|---|
| | September 30,
2017 | | September 30,
2016 | |
|---|
| | $ | | % | |
|---|
| | ($ in millions)
| |
|---|
Equity in earnings of joint ventures | | $ | 57.7 | | $ | — | | $ | 57.7 | | | 0.0 | % |
General and administrative expenses | | | (8.7 | ) | | (6.0 | ) | | (2.7 | ) | | 45.0 | % |
During the three months ended June 30, 2017, AECOM Capital completed a transaction to sell its 50% equity interest in Provost Square I LLC, an unconsolidated joint venture which invested in a real estate development in New Jersey, for $133 million, which resulted in net cash proceeds of $77 million and a gain of $52 million in fiscal year 2017.
Table of Contents
Fiscal year ended September 30, 2016 compared to the fiscal year ended September 30, 2015
| | | | | | | | | | | | | |
| | Fiscal Year Ended | |
| |
| |
|---|
| | Change | |
|---|
| | September 30,
2016 | | September 30,
2015 | |
|---|
| | $ | | % | |
|---|
| | ($ in millions)
| |
|---|
Revenue | | $ | 17,410.8 | | $ | 17,989.9 | | $ | (579.1 | ) | | (3.2 | )% |
Cost of revenue | | | 16,768.0 | | | 17,454.7 | | | (686.7 | ) | | (3.9 | ) |
| | | | | | | | | | | | | | |
Gross profit | | | 642.8 | | | 535.2 | | | 107.6 | | | 20.1 | |
Equity in earnings of joint ventures | | | 104.0 | | | 106.2 | | | (2.2 | ) | | (2.1 | ) |
General and administrative expenses | | | (115.1 | ) | | (114.0 | ) | | (1.1 | ) | | 1.0 | |
Acquisition and integration expenses | | | (213.6 | ) | | (398.4 | ) | | 184.8 | | | (46.4 | ) |
Loss on disposal activities | | | (42.6 | ) | | — | | | (42.6 | ) | | NM | * |
| | | | | | | | | | | | | | |
Income from operations | | | 375.5 | | | 129.0 | | | 246.5 | | | 191.1 | |
Other income | | | 8.2 | | | 19.1 | | | (10.9 | ) | | (57.1 | ) |
Interest expense | | | (258.1 | ) | | (299.6 | ) | | 41.5 | | | (13.9 | ) |
| | | | | | | | | | | | | | |
Income (loss) before income tax expense | | | 125.6 | | | (151.5 | ) | | 277.1 | | | (182.9 | ) |
Income tax benefit | | | (37.9 | ) | | (80.3 | ) | | 42.4 | | | (52.8 | ) |
| | | | | | | | | | | | | | |
Net income (loss) | | | 163.5 | | | (71.2 | ) | | 234.7 | | | (329.6 | ) |
Noncontrolling interests in income of consolidated subsidiaries, net of tax | | | (67.4 | ) | | (83.6 | ) | | 16.2 | | | (19.4 | ) |
| | | | | | | | | | | | | | |
Net income (loss) attributable to AECOM | | $ | 96.1 | | $ | (154.8 | ) | $ | 250.9 | | | (162.1 | )% |
| | | | | | | | | | | | | | |
| | | | | | | | | | | | | | |
| | | | | | | | | | | | | | |
The following table presents the percentage relationship of certain items to revenue:
| | | | | | | |
| | Fiscal Year Ended | |
|---|
| | September 30,
2016 | | September 30,
2015 | |
|---|
Revenue | | | 100.0 | % | | 100.0 | % |
Cost of revenue | | | 96.3 | | | 97.0 | |
| | | | | | | | |
Gross profit | | | 3.7 | | | 3.0 | |
Equity in earnings of joint ventures | | | 0.6 | | | 0.6 | |
General and administrative expenses | | | (0.7 | ) | | (0.7 | ) |
Acquisition and integration expenses | | | (1.2 | ) | | (2.2 | ) |
Loss on disposal activities | | | (0.2 | ) | | — | |
| | | | | | | | |
Income from operations | | | 2.2 | | | 0.7 | |
Other income | | | — | | | 0.1 | |
Interest expense | | | (1.5 | ) | | (1.6 | ) |
| | | | | | | | |
Income (loss) before income tax expense | | | 0.7 | | | (0.8 | ) |
Income tax (benefit) expense | | | (0.2 | ) | | (0.4 | ) |
| | | | | | | | |
Net income (loss) | | | 0.9 | | | (0.4 | ) |
Noncontrolling interests in income of consolidated subsidiaries, net of tax | | | (0.3 | ) | | (0.5 | ) |
| | | | | | | | |
Net income (loss) attributable to AECOM | | | 0.6 | % | | (0.9 | )% |
| | | | | | | | |
| | | | | | | | |
| | | | | | | | |
Table of Contents
Our revenue for the year ended September 30, 2016 decreased $579.1 million, or 3.2%, to $17,410.8 million as compared to $17,989.9 million for the year ended September 30, 2015. Revenue provided by acquired companies was $302.0 million. Excluding the revenue provided by acquired companies, revenue decreased $881.1 million, or 4.9%, from the year ended September 30, 2015.
The decrease in revenue for the year ended September 30, 2016 was primarily attributable to a decrease in our DCS segment of $307.1 million, a decrease in our MS segment of $103.8 million, and a decrease in our CS segment of $168.2 million, as discussed further below.
In the course of providing our services, we routinely subcontract for services and incur other direct costs on behalf of our clients. These costs are passed through to clients and, in accordance with industry practice and GAAP, are included in our revenue and cost of revenue. Because subcontractor and other direct costs can change significantly from project to project and period to period, changes in revenue may not be indicative of business trends. Subcontractor and other direct costs for the years ended September 30, 2016 and 2015 were $8.4 billion and $8.3 billion, respectively. Subcontractor costs and other direct costs as a percentage of revenue, increased to 48% during the year ended September 30, 2016 from 46% during the year ended September 30, 2015 due to increased construction of high-rise buildings and sports arenas in our CS segment, as discussed below.
Our gross profit for the year ended September 30, 2016 increased $107.6 million, or 20.1%, to $642.8 million as compared to $535.2 million for the year ended September 30, 2015. For the year ended September 30, 2016, gross profit, as a percentage of revenue, increased to 3.7% from 3.0% in the year ended September 30, 2015.
Billings in excess of costs on uncompleted contracts includes a margin fair value liability associated with long-term contracts acquired in connection with the acquisition of URS on October 17, 2014. Revenue and the related income from operations related to the margin fair value liability recognized during the year ended September 30, 2016 was $37.2 million, compared with $96.9 million during the year ended September 30, 2015. This amount was offset by a decrease in amortization of intangible assets of $183.3 million during the year ended September 30, 2016, compared with $361.6 million during the year ended September 30, 2015.
Gross profit changes were also due to the reasons noted in DCS, CS and MS Reportable Segments below.
Our equity in earnings of joint ventures for the year ended September 30, 2016 was $104.02023 decreased $328.3 million, asor 1345.5%, to a loss of $303.9 million compared to $106.2earnings of $24.4 million for the corresponding period in the year ended September 30, 2015.
prior year. The decrease in earnings of joint ventures for the year ended September 30, 2016 was primarily due to decreased earnings from a United Kingdom nuclear cleanup project.
Our general and administrative expenses for the year ended September 30, 2016 increased $1.1 million, or 1.0%, to $115.1 million as compared to $114.0 million for the year ended September 30, 2015. As a percentage of revenue, general and administrative expenses was 0.7% for each of the years ended September 30, 2016 and 2015.
Table of Contents
Acquisition and integration expenses, resulting from the acquisition of URS, were comprised of the following (in millions):
| | | | | | | |
| | Year Ended
September 30, | |
|---|
| | 2016 | | 2015 | |
|---|
Severance and personnel costs | | $ | 23.4 | | $ | 223.8 | |
Professional service, real estate-related, and other expenses | | | 190.2 | | | 174.6 | |
| | | | | | | | |
Total | | $ | 213.6 | | $ | 398.4 | |
| | | | | | | | |
| | | | | | | | |
| | | | | | | | |
Severance and personnel costs above include employee termination costs related to reduction-in-force initiatives as a result of the integration of URS. Real estate expenses relate to costs incurred to exit redundant facilities as a result of the URS integration. Professional services and other expenses relate to integration activities such as consolidating and implementing our IT platforms. The severance, real estate, and other disposal activities commenced upon the acquisition of URS and are expected to resultimpairment losses recognized in estimated annual costs savings of approximately $325 million by the end of fiscal 2017.
As of September 30, 2016, our annual run-rate was approximately $290 million in cost savings. Incremental cost savings to achieve our $325 million cost savings target are expected to come primarily from non-labor cost savings. As of September 30, 2016, we had realized approximately $200 million in cumulative labor-related cost savings and approximately $160 million in cumulative real estate-related and all other non-labor cost savings. These cost savings are materially consistent with our prior expectations with respect to amounts and timing.
Loss on disposal activities of $42.6 million in the accompanying statements of operations for the year ended September 30, 2016 included losses on the disposition of non-core energy related businesses, equipment and other assets acquired with URS within the CS segment, which were substantially completed in the quarter ended December 31, 2015.
Our other income for the year ended September 30, 2016 decreased $10.9 million to $8.2 million as compared to $19.1 million for the year ended September 30, 2015.
The decrease in other income for the year ended September 30, 2016 was primarily due to the sale of an infrastructure fund in the prior period.
Our interest expense for the year ended September 30, 2016 was $258.1 million as compared to $299.6 million for the year ended September 30, 2015.
The decrease in interest expense for the year ended September 30, 2016 was primarily due to the absence of a $55.6 million penalty upon prepayment of unsecured senior notes paid in the prior fiscal year.
Our income tax benefit for the year ended September 30, 2016 was $37.9 million compared to $80.3 million for the year ended September 30, 2015. The effective tax rate was (30.2)% and (53.0)% for the years ended September 30, 2016 and 2015, respectively.
Table of Contents
A comparison of the income tax benefit for the year ended September 30, 2016 to the prior year is not meaningful due to the presence of a pretax loss in the prior year compared to the year ended September 30, 2016, a change in mix of pretax (loss)/income, and due to the change in judgment regarding realizability of certain deferred tax assets in the United Kingdom and Australia during the current year.
On December 18, 2015, President Obama signedThe Protecting Americans from Tax Hikes Act into law. This legislation extended various temporary tax provisions expiring on December 31, 2015, including the permanent extension of the United States federal research credit. We recognized a discrete net benefit in the first quarter of 2016 and 2015 for $10.1 million and $19.4 million, respectively, attributable to the retroactive impact of the extended provisions.
Based on a review of positive and negative evidence available to us, we have previously recorded valuation allowances against our deferred tax assets in the United Kingdom, Canada and Australia to reduce them to the amount that in our judgment is more likely than not realizable.
Certain valuation allowances in the amount of $23.3 million in the United Kingdom have been released due to sufficient positive evidence obtained during the third quarter of 2016. We evaluated the new positive evidence against any negative evidence and determined the valuation allowance was no longer necessary. This new positive evidence includes reaching a position of cumulative income over a three year period and the use of net operating losses on a taxable basis. In addition, our United Kingdom affiliate has strong projected earnings in the United Kingdom.fiscal 2023.
During the third quarter of 2016, our Australian affiliate made an election in Australia to combine the tax results of the URS Australia business with the AECOM Australia business. This election resulted in the ability to utilize the URS Australia businesses' deferred tax assets against the combined future earnings of the Australian group and accordingly, the valuation allowance of $12.9 million was released.
Given the current and forecasted earnings trend, and anticipated coming out of cumulative losses in recent years for the remainder of our legal entities in the United Kingdom, sufficient positive evidence in the form of sustained earnings may become available in 2017 to release all (approximately $38 million) or a portion of the related valuation allowance in the United Kingdom for those remaining legal entities. A reversal could result in a significant benefit to tax expense in the quarter released.
Certain operations in Canada continue to have losses and the associated valuation allowances could be reduced if and when our current and forecast profits trend turns and sufficient evidence exists to support the release of the related valuation allowance (approximately $12 million).
We regularly integrate and consolidate our business operations and legal entity structure, and such internal initiatives could impact the assessment of uncertain tax positions, indefinite reinvestment assertions and the realizability of deferred tax assets.
The factors described above resulted in the net income attributable to AECOM of $96.1 million for the year ended September 30, 2016, as compared to the net loss attributable to AECOM of $154.8 million for the year ended September 30, 2015.
Table of Contents
Results of Operations by Reportable Segment
Design and Consulting Services
| | | | | | | | | | | | | |
| | Fiscal Year Ended | |
| |
| |
|---|
| | Change | |
|---|
| | September 30,
2016 | �� | September 30,
2015 | |
|---|
| | $ | | % | |
|---|
| | ($ in millions)
| |
|---|
Revenue | | $ | 7,655.8 | | $ | 7,962.9 | | $ | (307.1 | ) | | (3.9 | )% |
Cost of revenue | | | 7,273.3 | | | 7,663.6 | | | (390.3 | ) | | (5.1 | ) |
| | | | | | | | | | | | | | |
Gross profit | | $ | 382.5 | | $ | 299.3 | | $ | 83.2 | | | 27.8 | % |
| | | | | | | | | | | | | | |
| | | | | | | | | | | | | | |
| | | | | | | | | | | | | | |
The following table presents the percentage relationship of certain items to revenue:
| | | | | | | |
| | Fiscal Year Ended | |
|---|
| | September 30,
2016 | | September 30,
2015 | |
|---|
Revenue | | | 100.0 | % | | 100.0 | % |
Cost of revenue | | | 95.0 | | | 96.2 | |
| | | | | | | | |
Gross profit | | | 5.0 | % | | 3.8 | % |
| | | | | | | | |
| | | | | | | | |
| | | | | | | | |
Revenue for our DCS segment for the year ended September 30, 2016 decreased $307.1 million, or 3.9%, to $7,655.8 million as compared to $7,962.9 million for the year ended September 30, 2015. Revenue provided by acquired companies was $119.2 million. Excluding revenue provided by acquired companies, revenue decreased $426.3 million, or 5.4%, from the year ended September 30, 2015.
The decrease in revenue, excluding revenue provided by acquired companies, for the year ended September 30, 2016 was primarily attributable to a negative foreign currency impact of $200 million, mostly due to the strengthening of the U.S. dollar against the Australian and Canadian dollars and the British pound. Additionally, we experienced a decrease in the Europe, Middle East, and Africa region of approximately $120 million and in the Americas region of approximately $90 million across its end markets, including the transportation, water, and environment segments due to a decrease in public spending on capital projects.
Gross profit for our DCS segment for the year ended September 30, 2016 increased $83.2 million, or 27.8%, to $382.5 million as compared to $299.3 million for the year ended September 30, 2015. As a percentage of revenue, gross profit increased to 5.0% of revenue for the year ended September 30, 2016 from 3.8% in the year ended September 30, 2015.
The increase in gross profit and gross profit as a percentage of revenue for the year ended September 30, 2016 was primarily attributable to decreased intangible amortization expense, net of the margin fair value adjustment of $71.7 million, primarily from URS.
Table of Contents
Construction Services
| | | | | | | | | | | | | |
| | Fiscal Year Ended | |
| |
| |
|---|
| | Change | |
|---|
| | September 30,
2016 | | September 30,
2015 | |
|---|
| | $ | | % | |
|---|
| | ($ in millions)
| |
|---|
Revenue | | $ | 6,371.1 | | $ | 6,539.3 | | $ | (168.2 | ) | | (2.6 | )% |
Cost of revenue | | | 6,345.7 | | | 6,503.4 | | | (157.7 | ) | | (2.4 | ) |
| | | | | | | | | | | | | | |
Gross profit | | $ | 25.4 | | $ | 35.9 | | $ | (10.5 | ) | | (29.2 | )% |
| | | | | | | | | | | | | | |
| | | | | | | | | | | | | | |
| | | | | | | | | | | | | | |
The following table presents the percentage relationship of certain items to revenue:
| | | | | | | |
| | Fiscal Year Ended | |
|---|
| | September 30,
2016 | | September 30,
2015 | |
|---|
Revenue | | | 100.0 | % | | 100.0 | % |
Cost of revenue | | | 99.6 | | | 99.5 | |
| | | | | | | | |
Gross profit | | | 0.4 | % | | 0.5 | % |
| | | | | | | | |
| | | | | | | | |
| | | | | | | | |
Revenue for our CS segment for the year ended September 30, 2016 decreased $168.2 million, or 2.6%, to $6,371.1 million as compared to $6,539.3 million for the year ended September 30, 2015. Revenue provided by acquired companies was $90.8 million. Excluding revenue provided by acquired companies, revenue decreased $259.0 million, or 4.0%, from the year ended September 30, 2015.
The decrease in revenue, excluding the impact of revenue provided by acquired companies, for the year ended September 30, 2016 was primarily attributable to decreased revenue of approximately $600 million primarily driven by weak oil and gas markets in the Americas, $200 million from disposed businesses, and a negative foreign currency impact of $30 million, mostly due to the strengthening of the U.S. dollar against the Canadian dollar. These decreases were partially offset by approximately $570 million in increased revenue due to the construction of residential high-rise buildings in the city of New York and the construction of sports arenas in the Americas.
Gross profit for our CS segment for the year ended September 30, 2016 decreased $10.5 million, or 29.2%, to $25.4 million as compared to $35.9 million for the year ended September 30, 2015. As a percentage of revenue, gross profit decreased to 0.4% of revenue for the year ended September 30, 2016 from 0.5% in the year ended September 30, 2015.
The decrease in gross profit for the year ended September 30, 2016 was primarily due to weak oil and gas markets in the Americas and a decline in award fees on power projects in the Americas, partially offset by decreased intangible amortization expense, net of the margin fair value adjustment of $24 million and favorable resolution of an acquisition related project matter of approximately $8 million for the year ended September 30, 2016.
Table of Contents
Management Services
| | | | | | | | | | | | | |
| | Fiscal Year Ended | |
| |
| |
|---|
| | Change | |
|---|
| | September 30,
2016 | | September 30,
2015 | |
|---|
| | $ | | % | |
|---|
| | ($ in millions)
| |
|---|
Revenue | | $ | 3,383.9 | | $ | 3,487.7 | | $ | (103.8 | ) | | (3.0 | )% |
Cost of revenue | | | 3,149.0 | | | 3,287.7 | | | (138.7 | ) | | (4.2 | ) |
| | | | | | | | | | | | | | |
Gross profit | | $ | 234.9 | | $ | 200.0 | | $ | 34.9 | | | 17.4 | % |
| | | | | | | | | | | | | | |
| | | | | | | | | | | | | | |
| | | | | | | | | | | | | | |
The following table presents the percentage relationship of certain items to revenue:
| | | | | | | |
| | Fiscal Year Ended | |
|---|
| | September 30,
2016 | | September 30,
2015 | |
|---|
Revenue | | | 100.0 | % | | 100.0 | % |
Cost of revenue | | | 93.1 | | | 94.3 | |
| | | | | | | | |
Gross profit | | | 6.9 | % | | 5.7 | % |
| | | | | | | | |
| | | | | | | | |
| | | | | | | | |
Revenue for our MS segment for the year ended September 30, 2016 decreased $103.8 million, or 3.0%, to $3,383.9 million as compared to $3,487.7 million for the year ended September 30, 2015. Revenue provided by acquired companies was $92.0 million. Excluding revenue provided by acquired companies, revenue decreased $195.8 million, or 5.6%, from the year ended September 30, 2015.
The decrease in revenue for the year ended September 30, 2016 was primarily due to decreased services provided to the U.S. government in the Middle East and reduced revenue from chemical demilitarization projects for the Department of Defense, partially offset by the expected recovery of a pension related entitlement as discussed below.
Gross profit for our MS segment for the year ended September 30, 2016 increased $34.9 million, or 17.4%, to $234.9 million as compared to $200.0 million for the year ended September 30, 2015. As a percentage of revenue, gross profit increased to 6.9% of revenue for the year ended September 30, 2016 from 5.7% in the year ended September 30, 2015.
Gross profit and gross profit as a percentage of revenue for the year ended September 30, 2016 benefited by approximately $50 million from the expected accelerated recovery of a pension related entitlement from the federal government, approximately $30 million from the reduction of acquisition related liabilities pertaining to the reassessment of legal matters associated with Department of Energy (DOE) nuclear sites, and $16 million of other favorable adjustments from acquisition related project and legal matters. Additionally, the increase was due to a performance incentive of $27 million related to an ongoing DOE contract and a $23 million decrease in intangible amortization expense, net of the margin fair value adjustment. These increases were partially offset by approximately $40 million in reduced award fees from chemical demilitarization projects for the DOD, approximately $40 million of reduced gross profit from services for the U.S government related to the Affordable Care Act and activities in the Middle East, and approximately $10 million from the favorable resolution of a project related liability in Libya in the prior year.
Table of Contents
Seasonality
We experience seasonal trends in our business. Our revenue is typically higher in the last half of the fiscal year. The fourth quarter of our fiscal year (July 1 to September 30) is typically our strongest quarter. We find that the U.S. Federal Government tends to authorize more work during the period preceding the end of our fiscal year, September 30. In addition, many U.S. state governments with fiscal years ending on June 30 tend to accelerate spending during their first quarter, when new funding becomes available. Further, our construction management revenue typically increases during the high construction season of the summer months. Within the United States, as well as other parts of the world, our business generally benefits from milder weather conditions in our fiscal fourth quarter, which allows for more productivity from our on-site civil services. Our construction and project management services also typically expand during the high construction season of the summer months. The first quarter of our fiscal year (October 1 to December 31) is typically our weakest quarter. The harsher weather conditions impact our ability to complete work in parts of North America and the holiday season schedule affects our productivity during this period. For these reasons, coupled with the number and significance of client contracts commenced and completed during a particular period, as well as the timing of expenses incurred for corporate initiatives, it is not unusual for us to experience seasonal changes or fluctuations in our quarterly operating results.
Liquidity and Capital Resources
Our principal sources of liquidity are cash flows from operations, borrowings under our credit facilities, and access to financial markets. Our principal uses of cash are operating expenses, capital expenditures, working capital requirements, acquisitions, repurchases of common stock, dividend payments, and refinancing or repayment of debt. We believe our anticipated sources of liquidity including operating cash flows, existing cash and cash equivalents, borrowing capacity under our revolving credit facility and our ability to issue debt or equity, if required, will be sufficient to meet our projected cash requirements for at least the next 12twelve months. We expect to spend approximately $110 million in restructuring costs in fiscal 2024 associated with ongoing restructuring actions that are expected to deliver continued margin improvement and efficiencies.
Generally, we do not provide for U.S. taxes or foreign withholding taxes on gross book-tax basis differences in our non-U.S. subsidiaries because such basis differences are able to and intended to be reinvested indefinitely. At September 30, 2023, we have determined that we will continue to indefinitely reinvest the earnings of some foreign subsidiaries and, therefore, we will continue to account for these undistributed earnings based on our existing accounting under ASC 740 and not accrue additional tax. Determination of the amount of any unrecognized deferred income tax liability on this temporary difference is not practicable because of the complexities of the hypothetical calculation. We have a deferred tax liability in the amount of $77.0 million at September 30, 2017 relating to certain foreign subsidiaries for which the basis difference is not intended to be reinvested indefinitely as part of the liabilities assumed in connection with the acquisition of URS. Based on the available sources of cash flows discussed above, we anticipate we will continue to have the ability to permanently reinvest these remaining amounts.
At September 30, 2017,2023, cash and cash equivalents, including cash and cash equivalents included in current assets held for sale, were $802.4$1,262.2 million, an increase of $110.3$85.4 million, or 15.9%7.3%, from $692.1$1,176.8 million at September 30, 2016.2022. The increase in cash and cash equivalents was primarily attributable to a decrease of $93.7 million of cash provided by operating activities, partially offset by net repaymentsused to repurchase common stock, of which $67.9 million was related to a decrease in repurchases under our debt agreements, payments for business acquisitions and capital expenditures, net distributions to noncontrolling interest, and investment in unconsolidated joint ventures.the existing Board repurchase authorization.
Net cash provided by operating activities was $696.7$696.0 million for the year ended September 30, 2017, a decrease of $117.5 million, or 14.4%, from $814.22023 as compared to $713.6 million for the year ended September 30, 2016. Cash2022. The change was primarily attributable to a decrease in cash provided by operating activities was adversely affected by cash payments totalingworking capital of approximately $60$84.2 million, related to a federal lawsuit that was settled in our first quarter of 2017, partially offset by an increase in adjustments for non-cash items of approximately $301.1 million and a distributiondecrease in net income of earnings of $52 million as a result of the sale of our 50% equity interest in Provost Square I LLC, an unconsolidated joint venture. The decrease was also attributable to the timing of receipts and payments of working capital, which include accounts receivable, accounts payable, accrued expenses, and billings in excess of costs on uncompleted contracts.approximately $234.6 million. The sale of trade receivables to financial institutions provided a
Table of Contents
net favorable impact of $0.3 million and a net benefit of $120.1included in operating cash flows increased $50.0 million during the yearsyear ended September 30, 2017 and 2016, respectively.2023 compared to the year ended September 30, 2022. We expect to continue to sell trade receivables in the future as long as the terms continue to remain favorable to the Company.us.
Net cash used in investing activities was $202.7$138.2 million for the year ended September 30, 2017,2023, as compared to $162.6$175.0 million for the year ended September 30, 2016. This change2022. The decrease in cash used in investing activities was primarily attributabledue to an increasecash outflows for sale of discontinued operations of $42.3 million in payments for business acquisitions of $97.5 million and a decreasefiscal year 2022 that did not repeat in proceeds from disposal of property and equipment of $46.7 million, partially offset by decreases in capital expenditures of $105.0 million. Additionally, proceeds from disposal of businesses decreased by $37.5 million, and was offset by increased return of investment in unconsolidated joint ventures of $30.2 million.the current year.
Net cash used in financing activities was $386.5$472.9 million for the year ended September 30, 2017,2023, as compared to $638.0$588.3 million for the year ended September 30, 2016. This change2022. The decrease from the prior year was primarily attributable to decreased stock repurchases under the issuance of $1 billion in 2017 Senior Notes, offset by net repayments ofStock Repurchase Program. Total borrowings under our Credit Agreement of $1,118.4 million for the year ended September 30, 2017 as compared to $493.7 million net repayments of borrowings under credit agreements for the year ended September 30, 2016. In addition, the URS 3.85% Senior Notes were fully redeemed upon their maturity for $179.2 million using proceeds from a $185 million delayed draw term loan A facility tranche under the Credit Agreementmay vary during the quarter ended June 30, 2017.period as we regularly draw and repay amounts to fund working capital.
On February 21, 2017, we completed a private placement offering of $1 billion aggregate principal amount of the unsecured 5.125% Senior Notes due 2027 (the 2017 Senior Notes) and used the note proceeds to immediately retire the remaining $127.6 million outstanding on the term loan B facility as well as repay $600 million of the term loan A facility and $250 million of the revolving credit facility under our Credit Agreement. The 2017 Senior Notes refinancing positively impacted our liquidity by reducing secured borrowings under our Credit Agreement by $1 billion, net of fees, and swapping $1 billion, net of fees, in floating short term interest rates with fixed interest rates for the next ten years. As a result of our 2017 Senior Note offering, our interest expense will be higher due to a higher proportion of our debt subject to higher, fixed long term interest rates compared to short term variable rates.
Acquisition and integration expenses, resulting from business acquisitions, comprised of the following (in millions):
| | | | | | | |
| | Fiscal Year Ended | |
|---|
| | Sept 30,
2017 | | Sept 30,
2016 | |
|---|
Severance and personnel costs | | $ | 32.0 | | $ | 23.4 | |
Professional service, real estate-related, and other expenses | | | 6.7 | | | 190.2 | |
| | | | | | | | |
Total | | $ | 38.7 | | $ | 213.6 | |
| | | | | | | | |
| | | | | | | | |
| | | | | | | | |
Our cost savings and acquisition and integration expenses associated with the URS integration are complete.
Working capital, or current assets less current liabilities, increased $407.8decreased $99.4 million, or 58.6%23.7%, to $1,103.8$319.2 million at September 30, 20172023 from $696.0$418.6 million at September 30, 2016.2022. Net accounts receivable which includes billed and unbilled costs and fees,contract assets, net of billings in excess of costs on uncompleted contracts,contract liabilities, increased $325.4 million, or 8.3%, to $4,224.9$2,880.8 million at September 30, 20172023 from $3,899.5$2,671.9 million at September 30, 2016.
Table of Contents2022.
Days Sales Outstanding (DSO), which includes net accounts receivable and contract assets, net of billings in excess of costs on uncompleted contracts, and excludes the effects of recent acquisitions,contract liabilities, was 7765 days at September 30, 20172023 compared to 8268 days at September 30, 2016.2022.
In Note 4, Accounts Receivable—Net,Revenue Recognition, in the notes to our consolidated financial statements, a comparative analysis of the various components of accounts receivable is provided. SubstantiallyExcept for claims, substantially all unbilled receivablescontract assets are expected to be billed and collected within twelve months.
Unbilled receivablesContract assets related to claims are recorded only if it is probable that the claim will result in additional contract revenue and ifonly to the amount canextent that a significant reversal would not be reliably estimated.probable. In such cases, revenue is recorded only to the extent that contract costs relating to the claim have been incurred. Other than as disclosed, there are no material net receivables related to contract claims as of September 30, 2017 and 2016. Award fees in unbilled receivablescontract assets are accrued only when there is sufficient information to assess contract performance. On contracts that represent higher than normal risk or technical difficulty, award fees are generally deferred until an award fee letter is received.
Because our revenue depends to a great extent on billable labor hours, most of our charges are invoiced following the end of the month in which the hours were worked, the majority usually within 15 days. Other direct costs are normally billed along with labor hours. However, as opposed to salary costs, which are generally paid on either a bi-weekly or monthly basis, other direct costs are generally not paid until payment is received (in some cases in the form of advances) from the customers.
Debt consisted of the following:
| | | | | | |
| | September 30, | | September 30, |
| | 2023 | | 2022 |
|
| | (in millions) |
Credit Agreement | | $ | 1,119.8 | | $ | 1,143.3 |
2027 Senior Notes | | | 997.3 | | | 997.3 |
Other debt | | | 100.2 | | | 84.0 |
Total debt | | | 2,217.3 | | | 2,224.6 |
Less: Current portion of debt and short-term borrowings | | | (89.5) | | | (48.6) |
Less: Unamortized debt issuance costs | | | (14.4) | | | (19.3) |
Long-term debt | | $ | 2,113.4 | | $ | 2,156.7 |
| | | | | | | |
| | September 30,
2017 | | September 30,
2016 | |
|---|
| | (in millions)
| |
|---|
2014 Credit Agreement | | $ | 908.7 | | $ | 1,954.9 | |
2014 Senior Notes | | | 1,600.0 | | | 1,600.0 | |
2017 Senior Notes | | | 1,000.0 | | | — | |
URS Senior Notes | | | 247.7 | | | 427.7 | |
Other debt | | | 140.0 | | | 142.7 | |
| | | | | | | | |
Total debt | | | 3,896.4 | | | 4,125.3 | |
Less: Current portion of debt and short-term borrowings | | | (142.0 | ) | | (366.3 | ) |
Less: Unamortized debt issuance costs | | | (52.3 | ) | | (56.8 | ) |
| | | | | | | | |
Long-term debt | | $ | 3,702.1 | | $ | 3,702.2 | |
| | | | | | | | |
| | | | | | | | |
| | | | | | | | |
The following table presents, in millions, scheduled maturities of our debt as of September 30, 2017:2023:
| | | | |
Fiscal Year | |
| |
|---|
2018 | | $ | 142.0 | |
2019 | | | 154.4 | |
2020 | | | 122.6 | |
2021 | | | 603.7 | |
2022 | | | 256.7 | |
Thereafter | | | 2,617.0 | |
| | | | | |
Total | | $ | 3,896.4 | |
| | | | | |
| | | | | |
| | | | | |
Table of Contents
| | | |
Fiscal Year | | | |
2024 | | $ | 89.5 |
2025 | | | 49.6 |
2026 | | | 412.6 |
2027 | | | 1,009.2 |
2028 | | | 656.4 |
Thereafter | | | — |
Total | | $ | 2,217.3 |
2014 Credit Agreement
WeOn February 8, 2021, we entered into a credit agreement (Credit Agreement) onthe 2021 Refinancing Amendment to the Credit Agreement (as amended, modified or otherwise supplemented, the “Credit Agreement”), pursuant to which we amended and restated our Syndicated Credit Facility Agreement, dated as of October 17, 2014 (as amended prior to February 8, 2021, the “Original Credit Agreement”), between the Company, as amended, consistingborrower, Bank of (i)America, N.A., as administrative agent, and other parties thereto. At the time of amendment, the Credit Agreement consisted of a $1,150,000,000 revolving credit facility (the “Revolving Credit Facility”) and a $246,968,737.50 term loan A facility (the “Term A Facility,” together with the Revolving Credit Facility, the “Credit Facilities”), each of which mature on February 8, 2026. The outstanding loans under the Term A Facility were borrowed in U.S. dollars. Loans under the Revolving Credit Facility may be borrowed, and letters of credit thereunder may be issued, in U.S. dollars or in certain foreign currencies. The proceeds of the Revolving Credit Facility may be used from time to time for ongoing working capital and for other general corporate purposes. The proceeds of the Revolving Credit Facility and the Term A Loan facility borrowed on February 8, 2021 were used to refinance the existing revolving credit facility and the existing term loan facility under the Original Credit Agreement and to pay related fees and expenses. The Credit Agreement permits us to designate certain of our subsidiaries as additional co-borrowers from time to time. Currently, there are no co-borrowers under the Credit Facilities.
On April 13, 2021, we entered into Amendment No. 10 to the Credit Agreement, pursuant to which the lenders thereunder provided a secured term B credit facility (the “Term B Facility”) to the Company in an aggregate principal amount of $1.925 billion, (ii) a term loan$700,000,000. The Term B facilityFacility matures on April 13, 2028. The proceeds of the Term B Facility were used to fund the purchase price, fees and expenses in connection with our cash tender offer to purchase up to $700,000,000 aggregate purchase price (not including any accrued and unpaid interest) of our outstanding 5.875% Senior Notes due 2024.
On June 25, 2021, we entered into Amendment No. 11 to the Credit Agreement, pursuant to which lenders thereunder have provided us with an additional $215,000,000 in aggregate principal amount under the Term A Facility. We used the net proceeds from the increase in the Term A Facility (together with cash on hand), to (i) redeem all of $0.76 billionour remaining 5.875% Senior Notes due 2024 and (iii) a revolving credit facility in an aggregate principal amount of $1.05 billion. These facilities under(ii) pay fees and expenses related to such redemption.
On May 23, 2023, the Company entered into Amendment No. 12 to the Credit Agreement, may be increasedpursuant to which LIBOR as a benchmark rate of interest was replaced by, an additional amountin the case of upUS Dollar-denominated loans, a secured overnight financing rate subject to $500 million. Thea spread adjustment, and, in the case of loans denominated in other currencies, other customary successor rates, subject in certain cases to a spread adjustment. On May 23, 2023, the Company entered into Amendment No. 13 to the Credit Agreement's term extendsAgreement, pursuant to September 29, 2021which the spread adjustments with respect to the revolving credit facilityRevolving Credit Facility and the term loanTerm A facilityFacility was amended.
The applicable interest rate for loans under the Term B Facility is calculated at a per annum rate equal to, at our option, (a) the Term SOFR (as defined in the Credit Agreement) plus 1.75% or (b) the Base Rate (as defined in the Credit Agreement) plus 0.75%.
The applicable interest rate for U.S. Dollar-denominated loans under the Revolving Credit Facility and October 17, 2021the Term A Facility is calculated at a per annum rate equal to, at our option, (a) the Term SOFR (as defined in the Credit Agreement) plus an applicable margin (the “SOFR Applicable Margin”), which is currently at 1.2250% or (b) the Base Rate (as defined in the Credit Agreement) plus an applicable margin (the “Base Rate Applicable Margin,” and together with respectthe SOFR Applicable Margin, the “Applicable Margins”), which is currently at 0.2250%. The applicable interest rate for loans under the Revolving Credit Facility denominated in other currencies is calculated at a per annum rate equal to a customary floating reference rate for such currency specified in the term loan B facility, althoughCredit Agreement plus the term loan B facility was paid in fullSOFR Applicable Margin. The Credit Agreement includes certain environmental, social and governance (ESG) metrics relating to our CO2 emissions and the percentage of employees who identify as women (each, a “Sustainability Metric”). The Applicable Margins
for the Term A Facility and the Revolving Credit Facility and the commitment fees for the Revolving Credit Facility will be adjusted on February 21, 2017. an annual basis based on our achievement of preset thresholds for each Sustainability Metric.
Some of our material subsidiaries (the “Guarantors”) have guaranteed the obligations of the borrowers under the Credit Agreement.Agreement, subject to certain exceptions. The borrowers'borrowers’ obligations under the Credit Agreement are secured by a lien on substantially all of theour assets of the Company and the Guarantors pursuant to a security and pledge agreement (Security Agreement). The collateral under the Security Agreement isGuarantors’ assets, subject to release upon fulfillment of certain conditions specified in the Credit Agreement and Security Agreement.exceptions.
The Credit Agreement contains customary negative covenants that limitinclude, among other things, limitations on our ability and the ability of certain of our subsidiariessubsidiaries’ ability, subject to among other things: (i) create,certain exceptions, to incur assume, or suffer to exist liens; (ii) incur or guarantee indebtedness; (iii) pay dividends or repurchase stock; (iv) enter into transactions with affiliates; (v)liens and debt, make investments, dispositions, and restricted payments, change the nature of our business, consummate asset sales, acquisitions or mergers; (vi) enter into certain types of burdensome agreements; or (vii) make investments.
On July 1, 2015, the Credit Agreement was amended to revise the definition of "Consolidated EBITDA" to increase the allowance for acquisition and integration expenses related to the acquisition of URS.
On December 22, 2015, the Credit Agreement was amended to further revise the definition of "Consolidated EBITDA" by further increasing the allowance for acquisition and integration expenses related to the acquisition of URS and to allow for an internal corporate restructuring primarily involving our international subsidiaries.
On September 29, 2016, the Credit Agreementmergers, consolidations and the Security Agreement were amendedsale of all or substantially all of our respective assets, taken as a whole, and transact with affiliates. We are also required to (1) lower the applicable interest rate margins for the term loan A and the revolving credit facilities, and lower the applicable letter of credit fees and commitment fees to the revised consolidated leverage levels; (2) extend the term of the term loan A and the revolving credit facility to September 29, 2021; (3) addmaintain a new delayed draw term loan A facility tranche in the amount of $185.0 million; (4) replace the then existing $500 million performance letter of credit facility with a $500 million basket to enter into secured letters of credit outside the Credit Agreement; and (5) revise certain covenants, including the Maximum Consolidated Leverage Ratio so that the step down from a 5.00 to a 4.75 leverage ratio is effective as of March 31, 2017 as well as the investment basket for our AECOM Capital business.
On March 31, 2017, the Credit Agreement was amended to (1) expand the ability of restricted subsidiaries to borrow under "Incremental Term Loans"; (2) revise the definition of "Working Capital" as used in "Excess Cash Flow"; (3) revise the definitions for "Consolidated EBITDA" and "Consolidated Funded Indebtedness" to reflect the expected gain and debt repayment of an AECOM Capital disposition, which disposition was completed on April 28, 2017; and (4) amend provisions relating to our ability to undertake certain internal restructuring steps to accommodate changes in tax laws.
Under the Credit Agreement, we are subject to a maximum consolidated leverage ratio and minimum consolidated interest coverage ratio of at least 3.00 to 1.00 and a consolidated leverage ratio of less than or equal to 4.00 to 1.00 (subject to certain adjustments in connection with permitted acquisitions), tested on a quarterly basis (the “Financial Covenants”). The Financial Covenants do not apply to the end of each fiscal quarter.Term B Facility. Our Consolidated Leverage Ratioconsolidated leverage ratio was 4.02.00 to 1.00 at September 30, 2017. Our Consolidated Interest Coverage Ratio was 4.7 at September 30, 2017.2023. As of September 30, 2017,2023, we were in compliance with the covenants of the Credit Agreement.
The Credit Agreement contains customary affirmative covenants, including, among other things, compliance with applicable law, preservation of existence, maintenance of properties and of insurance, and keeping proper books and records. The Credit Agreement contains customary events of default, including, among other things, nonpayment of principal, interest or fees, cross-defaults to other debt, inaccuracies of representations and warranties, failure to perform covenants, events of bankruptcy and insolvency, change of control and unsatisfied judgments, subject in certain cases to notice and cure periods and other exceptions.
At September 30, 20172023 and 2016, outstanding standbySeptember 30, 2022, letters of credit totaled $58.1$4.4 million and $92.3$4.4 million, respectively, under our revolving credit facilities.Revolving Credit Facility. As of September 30, 20172023 and 2016,September 30, 2022, we had $991.9$1,145.6 million and $888.4$1,145.6 million, respectively, available under our revolving credit facility.
Table of Contents
On October 6, 2014,February 21, 2017, we completed a private placement offering of $800,000,000$1,000,000,000 aggregate principal amount of theour unsecured 5.750%5.125% Senior Notes due 2022 (2022 Notes) and $800,000,000 aggregate principal amount of2027 (the “2027 Senior Notes”). On June 30, 2017, we completed an exchange offer to exchange the unsecured 5.875%unregistered 2027 Senior Notes due 2024 (the 2024 Notes and, together with the 2022 Notes, the 2014 Senior Notes).for registered notes, as well as related guarantees.
As of September 30, 2017,2023, the estimated fair value of the 20142027 Senior Notes was approximately $836.0 million for the 2022 Notes and $884.0 million for the 2024 Notes.$939.9 million. The fair value of the 20142027 Senior Notes as of September 30, 20172023 was derived by taking the mid-point of the trading prices from an observable market input (Level 2) in the secondary bond market and multiplying it by the outstanding balance of the 2014 Senior Notes.
At any time prior to October 15, 2017, we may redeem all or part of the 2022 Notes, at a redemption price equal to 100% of their principal amount, plus a "make whole" premium as of the redemption date, and accrued and unpaid interest (subject to the rights of holders of record on the relevant record date to receive interest due on the relevant interest payment date). In addition, at any time prior to October 15, 2017, we may redeem up to 35% of the original aggregate principal amount of the 2022 Notes with the proceeds of one or more equity offerings, at a redemption price equal to 105.750%, plus accrued and unpaid interest. Furthermore, at any time on or after October 15, 2017, we may redeem the 2022 Notes, in whole or in part, at once or over time, at the specified redemption prices plus accrued and unpaid interest thereon to the redemption date. At any time prior to July 15, 2024, we may redeem on one or more occasions all or part of the 2024 Notes at a redemption price equal to the sum of (i) 100% of the principal amount thereof, plus (ii) a "make-whole" premium as of the date of the redemption, plus any accrued and unpaid interest to the date of redemption. In addition, on or after July 15, 2024, the 2024 Notes may be redeemed at a redemption price of 100% of the principal amount thereof, plus accrued and unpaid interest to the date of redemption.
The indenture pursuant to which the 2014 Senior Notes were issued contains customary events of default, including, among other things, payment default, exchange default, failure to provide certain notices thereunder and certain provisions related to bankruptcy events. The indenture also contains customary negative covenants.
On November 2, 2015, we completed an exchange offer to exchange the unregistered 2014 Senior Notes for registered notes, as well as all related guarantees.
We were in compliance with the covenants relating to the 2014 Senior Notes as of September 30, 2017.
On February 21, 2017, we completed a private placement offering of $1,000,000,000 aggregate principal amount of our unsecured 5.125% Senior Notes due 2027 (the 2017 Senior Notes) and used the proceeds to immediately retire the remaining $127.6 million outstanding on the term loan B facility as well as repay $600 million of the term loan A facility and $250 million of the revolving credit facility under our Credit Agreement.
As of September 30, 2017, the estimated fair value of the 2017 Senior Notes was approximately $1,031.3 million. The fair value of the 2017 Senior Notes as of September 30, 2017 was derived by taking the mid-point of the trading prices from an observable market input (Level 2) in the secondary bond market and multiplying it by the outstanding balance of the 2017 Senior Notes. Interest will beis payable on the 20172027 Senior Notes at a rate of 5.125% per annum. Interest on the 20172027 Senior Notes will beis payable semi-annually on March 15 and September 15 of each year, commencing on September 15, 2017. The 20172027 Senior Notes will mature on March 15, 2027.
Table of Contents
At any time and from time to time prior to December 15, 2026, we may redeem all or part of the 20172027 Senior Notes, at a redemption price equal to 100% of their principal amount, plus a "make whole"“make whole” premium as of the redemption date, and accrued and unpaid interest to the redemption date.
In addition, at any time and from time to time prior to March 15, 2020, we may redeem up to 35% of the original aggregate principal amount of the 2017 Senior Notes with the proceeds of one or more qualified equity offerings, at a redemption price equal to 105.125%, plus accrued and unpaid interest. Furthermore, at any time on On or after December 15, 2026, we may redeem on one or more occasions all or part of the 20172027 Senior Notes at a redemption price equal to 100% of their principal amount, plus accrued and unpaid interest.interest on the redemption date.
The indenture pursuant to which the 20172027 Senior Notes were issued contains customary events of default, including, among other things, payment default, exchange default, failure to provide certain notices thereunder and certain provisions related to bankruptcy events. The indenture also contains customary negative covenants.
We and the Guarantors filed a registration statement on Form S-4 with the SEC on May 11, 2017 that was declared effective by the SEC on May 25, 2017 to exchange the unregistered 2017 Senior Notes for registered notes and guarantees having terms substantially identical in all material respects. On June 30, 2017, the Company completed its exchange offer by exchanging $999,074,000 aggregate principal amount of the unregistered 2017 Senior Notes with registered notes, as well as all related guarantees. $926,000 aggregate principal amount of the unregistered 2017 Senior Notes remained outstanding as of September 30, 2017.
We were in compliance with the covenants relating to our 2017the 2027 Senior Notes as of September 30, 2017.
In connection with the URS acquisition, we assumed the URS 3.85% Senior Notes due 2017 (2017 URS Senior Notes) and the URS 5.00% Senior Notes due 2022 (2022 URS Senior Notes), totaling $1.0 billion (URS Senior Notes). The URS acquisition triggered change in control provisions in the URS Senior Notes that allowed the holders of the URS Senior Notes to redeem their URS Senior Notes at a cash price equal to 101% of the principal amount and, accordingly, we redeemed $572.3 million of the URS Senior Notes on October 24, 2014. The remaining 2017 URS Senior Notes matured and were fully redeemed on April 3, 2017 for $179.2 million using proceeds from a $185 million delayed draw term loan A facility tranche under the Credit Agreement. The 2022 URS Senior Notes are general unsecured senior obligations of AECOM Global II, LLC as successor in interest to URS) and are fully and unconditionally guaranteed on a joint-and-several basis by certain former URS domestic subsidiary guarantors.2023.
As of September 30, 2017, the estimated fair value of the 2022 URS Senior Notes was approximately $259.7 million. The carrying value of the 2022 URS Senior Notes on our Consolidated Balance Sheets as of September 30, 2017 was $247.7 million. The fair value of the 2022 URS Senior Notes as of September 30, 2017 was derived by taking the mid-point of the trading prices from an observable market input (Level 2) in the secondary bond market and multiplying it by the outstanding balance of the 2022 URS Senior Notes.
As of September 30, 2017, we were in compliance with the covenants relating to the 2022 URS Senior Notes.
Other debt consists primarily of obligations under capital leases and loans and unsecured credit facilities. OurThe unsecured credit facilities are primarily used for standby letters of credit issued in connection with general and professional liability insurance programs and for payment ofcontract performance guarantees. At September 30, 20172023 and 2016,2022, these outstanding standby letters of credit
Table of Contents
totaled $445.7$878.9 million and $382.2$640.3 million, respectively. As of September 30, 2017,2023, we had $502.3$416.7 million available under these unsecured credit facilities.
Effective Interest Rate
Our average effective interest rate on our total debt, including the effects of the interest rate swap and interest rate cap agreements during the years ended September 30, 2017, 20162023, 2022 and 20152021 was 4.6%5.3%, 4.4%3.8% and 4.2%4.4%, respectively.
Interest expense in the consolidated statements of operations for the years ended September 30, 2017 and 2016 included amortization of deferred debt issuance costs for the years ended September 30, 2023, 2022 and 2021 of $17.5$4.9 million, $4.9 million and $30.9$10.2 million, respectively.
We enter into various joint venture arrangements to provide architectural, engineering, program management, construction management and operations and maintenance services. The ownership percentage of these joint ventures is typically representative of the work to be performed or the amount of risk assumed by each joint venture partner. Some of these joint ventures are considered variable interest.interest entities. We have consolidated all joint ventures for which we have control. For all others, our portion of the earnings is recorded in equity in earnings of joint ventures. See Note 6, Joint Ventures and Variable Interest Entities, in the notes to our consolidated financial statements.
Other than normal property and equipment additions and replacements, expenditures to further the implementation of our Enterprise Resource Planning system,various information technology systems, commitments under our incentive compensation programs, amounts we may expend to repurchase stock under our stock repurchase program and acquisitions from time to time and disposition costs, we currently do not have any significant capital expenditures or outlays planned except as described below. However, if we acquire additional businesses in the future or if we embark on other capital-intensive initiatives, additional working capital may be required.
Under our secured revolving credit facility and other facilities discussed in Other Debt and Other Items above, as of September 30, 2017,2023, there was approximately $503.8$883.3 million including both continuing and discontinued operations, outstanding under standby letters of credit primarily issued primarily in connection with general and professional liability insurance programs and for contract performance guarantees. For those projects for which we have issued a performance guarantee, if the project subsequently fails to meet guaranteed performance standards, we may either incur significant additional costs or be held responsible for the costs incurred by the client to achieve the required performance standards.
We recognized on our balance sheet the funded status of our pension benefit plans, measured as the difference between the fair value of plan assets and the projected benefit obligation. At September 30, 2023, our defined benefit pension plans had an aggregate deficit (the excess of projected benefit obligations over the fair value of plan assets) of approximately $165.3 million. The total amounts of employer contributions paid for the year ended September 30, 2023 were $8.2 million for U.S. plans and $24.8 million for non-U.S. plans. Funding requirements for each plan are determined based on the local laws of the country where such plan resides. In certainsome countries, the funding requirements are mandatory while in other countries, they are discretionary. There is a required minimum contribution for one of our domestic plans; however, we may make additional discretionary contributions. In the future, such pension funding may increase or decrease depending on changes in the levels of interest rates, pension plan performance and other factors. In addition, we have collective bargaining agreements with unions that require us to contribute to various third partythird-party multiemployer pension plans that we do not control or manage. For the year ended September 30, 2023, we contributed $3.0 million to multiemployer pension plans.
Condensed Combined Financial Information
The 2027 Senior Notes are fully and unconditionally guaranteed on a joint and several basis by some of AECOM’s directly and indirectly 100% owned subsidiaries (the Subsidiary Guarantors). Accordingly, AECOM became subject to the requirements of Rule 3-10 of Regulation S-X, as amended, regarding financial statements of guarantors and issuers of guaranteed securities. Other than customary restrictions imposed by applicable statutes, there are no restrictions on the ability of the Subsidiary Guarantors to transfer funds to AECOM in the form of cash dividends, loans or advances.
The following tables present condensed combined summarized financial information for AECOM and the Subsidiary Guarantors. All intercompany balances and transactions are eliminated in the presentation of the combined financial statements. Amounts provided do not represent our total consolidated amounts as of September 30, 2023 and for the twelve months then ended.
Condensed Combined Balance Sheets
Parent and Subsidiary Guarantors
(unaudited - in millions)
| | | |
| | September 30, 2023 |
Current assets | | $ | 2,617.7 |
Non-current assets | | | 3,230.7 |
Total assets | | $ | 5,848.4 |
| | | |
Current liabilities | | $ | 2,414.4 |
Non-current liabilities | | | 2,601.6 |
Total liabilities | | | 5,016.0 |
| | | |
Total stockholders’ equity | | | 832.4 |
Total liabilities and stockholders’ equity | | $ | 5,848.4 |
Condensed Combined Statement of Operations
Parent and Subsidiary Guarantors
(unaudited - in millions)
| | | |
| | For the twelve months ended |
| | September 30, 2023 |
Revenue | | $ | 7,077.5 |
Cost of revenue | | | 6,582.5 |
Gross profit | | | 495.0 |
| | | |
Net income from continuing operations | | | 3.2 |
Net loss from discontinued operations | | | — |
Net income | | $ | 3.2 |
| | | |
Net income attributable to AECOM | | $ | 3.2 |
Commitments and Contingencies
We record amounts representing our probable estimated liabilities relating to claims, guarantees, litigation, audits and investigations. We rely in part on qualified actuaries to assist us in determining the level of reserves to establish for insurance-related claims that are known and have been asserted against the Company,us, and for insurance-related claims that are believed to have been incurred based on actuarial analysis, but have not yet been reported to our claims administrators as of the respective balance sheet dates. We include any adjustments to such insurance reserves in our consolidated results of operations.
Table of Contents
Our reasonably possible loss disclosures are presented on a gross basis prior to the consideration of insurance recoveries. We do not record gain contingencies until they are realized. In the ordinary course of business, we may not be aware that we or our affiliates are under investigation and may not be aware of whether or not a known investigation has been concluded.
In the ordinary course of business, we may enter into various arrangements providing financial or performance assurance to clients, lenders, or partners. Such arrangements include standby letters of credit, surety bonds, and corporate guarantees to support the creditworthiness or the project execution commitments of our affiliates, partnerships and joint ventures. Performance arrangements typically have various expiration dates ranging from the completion of the project contract and extending beyond contract completion in certainsome circumstances such as for warranties. We may also guarantee that a project, when complete, will achieve specified performance standards. If the project subsequently fails to meet guaranteed performance standards, we may incur additional costs, pay liquidated damages or be held responsible for the costs incurred by the client to achieve the required performance standards. The potential payment amount of an outstanding performance arrangement is typically the remaining cost of work to be performed by or on behalf of third parties. Generally, under joint venture arrangements, if a partner is financially unable to complete its share of the contract, the other partner(s) may be required to complete those activities.
At September 30, 2017 and 2016,2023, we were contingently liable in the amount of $503.8approximately $883.3 million and $474.5 million, respectively, in issued standby letters of credit and $5.7$4.6 billion and $3.3 billion, respectively, in issued surety bonds primarily to support project execution. The increase was primarily due to the acquisition of Shimmick Construction Company, Inc.
In the ordinary course of business, we enter into various agreements providing financial or performance assurances to clients on behalf of certain unconsolidated partnerships, joint ventures and other jointly executed contracts. These agreements are entered into primarily to support the project execution commitments of these entities.
Our investment adviser jointly manages and sponsors the AECOM-Canyon Equity Fund, L.P. (the “Fund”), in which we indirectly hold an equity interest and have an ongoing capital commitment to fund investments. At September 30, 2023, we have capital commitments of $8.3 million to the Fund over the next 5 years.
In addition, in connection with the investment activities of ACAP,AECOM Capital, we provide guarantees of certain contractual obligations, including guarantees for completion of projects, repayment of debt, environmental indemnity obligations and other lender required guarantees.
DOEDepartment of Energy Deactivation, Demolition, and Removal Project
Washington Group International, an Ohio company (WGI Ohio), anA former affiliate of URS,the Company, Amentum Environment & Energy, Inc., f/k/a AECOM Energy and Construction, Inc. (“Former Affiliate”), executed a cost-reimbursable task order with the Department of Energy (DOE) in 2007 to provide deactivation, demolition and removal services at a New York State project site that, during 2010, experienced contamination and performance issues and remains uncompleted.issues. In February 2011, WGI Ohiothe Former Affiliate and the DOE executed a Task Order Modification that changed some cost-reimbursable contract provisions to at-risk. The Task Order Modification, including subsequent amendments, requiresrequired the DOE to pay all project costs up to $106 million, requires WGI Ohiorequired the Former Affiliate and the DOE to equally share in all project costs incurred from $106 million to $146 million, and requires WGI Ohiorequired the Former Affiliate to pay all project costs exceeding $146 million.
Due to unanticipated requirements and permitting delays by federal and state agencies, as well as delays and related ground stabilization activities caused by Hurricane Irene in 2011, WGI Ohio has beenthe Former Affiliate was required to perform work outside the scope of the Task Order Modification. In December 2014, WGI Ohiothe Former Affiliate submitted an initial set of claims against the DOE pursuant to the Contracts Disputes Acts seeking recovery of $103 million, including additional fees on changed work scope. WGI Ohio has incurred and continues to incurscope (the “2014 Claims”). On December 6, 2019, the Former Affiliate submitted a second set of claims against the DOE seeking recovery of an additional $60.4 million, including additional project costs and delays outside the scope of the contract as a result of differing site and ground conditions (the “2019 Claims”). The Former Affiliate also submitted three alternative breach of contract claims to the 2014 and 2019 Claims that may entitle the Former Affiliate to recovery of $148.5 million to $329.4 million. On December 30, 2019, the DOE denied the Former Affiliate’s 2014 Claims. On September 25, 2020, the DOE denied the Former Affiliate’s 2019 Claims. The Company filed an appeal of these decisions on December 20, 2020 in the Court of Federal Claims. Deconstruction, decommissioning and site restoration activities are complete.
On January 31, 2020, the Company completed the sale of its Management Services business, including the Former Affiliate who worked on the DOE project, to Maverick Purchaser Sub LLC (MS Purchaser), an affiliate of American Securities LLC and Lindsay Goldberg LLC. The Company and the MS Purchaser agreed that all future DOE project claim recoveries and costs will be split 10% to the MS Purchaser and 90% to the Company with the Company retaining control of all future strategic legal decisions.
The Company intends to submit additional formal claims against the DOE.
Table of Contents
Due to significant delays and uncertainties about responsibilities for the scope of remaining work, final project completion costs and other associated costs have exceed $100 million over the contracted andvigorously pursue all claimed amounts. WGI Ohio assets and liabilities, including the value of the above costs and claims, were measured at their fair value on October 17, 2014, the date AECOM acquired WGI Ohio's parent company, see Note 3 in the consolidated financial statements, which measurement has been reevaluated to account for developments pertaining to this matter.
WGI Ohioamounts but can provide no certainty that itthe Company will recover the claims2014 Claims and 2019 Claims submitted against the DOE, in December 2014, any future claims or any other project costs after December 2014 that WGI Ohio may be obligated to incur including the remaining project completionadditional incurred claims or costs, which could have a material adverse effect on the Company'sCompany’s results of operations.
OneA Former Affiliate of our wholly-owned subsidiaries, URS Corporation,the Company entered into an agreement to perform turnaround maintenance services during a partial fixed costplanned shutdown at a refinery in Montana in December 2017. The turnaround project was completed in February 2019. Due to circumstances outside of the Company’s Former Affiliate’s control, including client directed changes and partial timedelays and material design agreementthe refinery’s condition, the Company’s Former Affiliate performed additional work outside of the original contract over $90 million and is entitled to payment from the refinery owner of approximately $144 million. In March 2019, the refinery owner sent a letter to the Company’s Former Affiliate alleging it incurred approximately $79 million in 2012 withdamages due to the Company’s Former Affiliate’s project performance. In April 2019, the Company’s Former Affiliate filed and perfected a design build contractor$132 million construction lien against the refinery for unpaid labor and materials costs. In August 2019, following a state route highway construction project in Riverside County and Orange County, California. On March 9, 2017, URS Corporationsubcontractor complaint filed a $8.9 million complaint in the SuperiorThirteen Judicial District Court of CaliforniaMontana asserting claims against the design build contractor forrefinery owner and the Company’s Former Affiliate, the refinery owner crossclaimed against the Company’s Former Affiliate and the subcontractor. In October 2019, following the subcontractor’s dismissal of its failureclaims, the Company’s Former Affiliate removed the matter to pay for services performed underfederal court and cross claimed against the design agreement. refinery owner. In December 2019, the refinery owner claimed $93.0 million in damages and offsets against the Company’s Former Affiliate.
On April 17, 2017,January 31, 2020, the design build contractor filed a counterclaim in Superior Court alleging breachesCompany completed the sale of contract, negligent interferenceits Management Services business, including the Former Affiliate, to the MS Purchaser; however, the Refinery Turnaround Project, including related claims and professional negligence pertainingliabilities, has been retained by the Company.
The Company intends to URS Corporation's performance of design services undervigorously prosecute and defend this matter; however, the design agreement, seeking purported damages of $70 million. URS CorporationCompany cannot provide assurancesassurance that itthe Company will be successful in the recoverythese efforts. The resolution of the amounts owed to it under the design agreement or in its defense against the amounts alleged under the counterclaim that URS Corporation believes are without meritthis matter and that it intends to vigorously defend against. Theany potential range of loss in excess of any current accrual cannot be reasonably determined or estimated at this time, primarily because the matter involves unique regulatory issues; thereraises complex legal issues that Company is substantial uncertainty regarding any alleged damages; and the matter is at a preliminary stage of litigation.
The following matter is disclosed pursuantcontinuing to Regulation S-K, Item 103, Instruction 5.C pertaining to a government authority environmental claim exceeding $100,000 against an AECOM affiliate. In September 2017, AECOM USA, Inc., one of our wholly-owned subsidiaries, was advised by the New York State Department of Environmental Conservation ("DEC") of allegations that it committed environmental permit violations pursuant to the New York Environmental Conservation Law ("ECL") associated with AECOM USA, Inc.'s oversight of a water restoration project for Schoharie County, which could result in substantial fines if calculated under the ECL's maximum civil penalty provisions. AECOM USA, Inc. disputes this claim and intends to continue to defend these matters vigorously; however, AECOM USA, Inc., cannot provide assurances that it will be successful in these efforts. The potential range of loss in excess of any current accrual cannot be reasonably estimated at this time, primarily because the matter involves complex and unique environmental and regulatory issues; the project site involves the oversight and involvement of various local, state and federal government agencies; substantial uncertainty regarding any alleged damages; and the preliminary stage of the government's claims.
Table of Contentsassess.
Contractual Obligations and Commitments
The following summarizes our contractual obligations and commercial commitments as of September 30, 2017:2023:
| | | | | | | | | | | | | | | |
| | | | | Less than | | One to | | Three to | | More than |
Contractual Obligations and Commitments | | Total | | One Year | | Three Years | | Five Years | | Five Years |
|
| | (in millions) |
Debt | | $ | 2,217.3 | | $ | 89.5 | | $ | 462.2 | | $ | 1,665.6 | | $ | — |
Interest on debt | | | 483.2 | | | 147.2 | | | 251.0 | | | 85.0 | | | — |
Operating leases | | | 794.3 | | | 164.4 | | | 255.1 | | | 161.7 | | | 213.1 |
Pension funding obligations(1) | | | 35.1 | | | 35.1 | | | — | | | — | | | — |
Total contractual obligations and commitments | | $ | 3,529.9 | | $ | 436.2 | | $ | 968.3 | | $ | 1,912.3 | | $ | 213.1 |
| | | | | | | | | | | | | | | | |
Contractual Obligations and Commitments | | Total | | Less than
One Year | | One to
Three Years | | Three to
Five Years | | More than
Five Years | |
|---|
| | (in millions)
| |
|---|
Debt | | $ | 3,896.4 | | $ | 142.0 | | $ | 277.0 | | $ | 860.4 | | $ | 2,617.0 | |
Interest on debt | | | 1,291.4 | | | 210.4 | | | 407.0 | | | 344.0 | | | 330.0 | |
Operating leases | | | 1,362.8 | | | 259.1 | | | 389.0 | | | 254.6 | | | 460.1 | |
Pension funding obligations(1) | | | 39.5 | | | 39.5 | | | — | | | — | | | — | |
| | | | | | | | | | | | | | | | | |
Total contractual obligations and commitments | | $ | 6,590.1 | | $ | 651.0 | | $ | 1,073.0 | | $ | 1,459.0 | | $ | 3,407.1 | |
| | | | | | | | | | | | | | | | | |
| | | | | | | | | | | | | | | | | |
| | | | | | | | | | | | | | | | | |
(1)Represents expected fiscal 2018 contributions to fund our defined benefit pension and other postretirement plans. Contributions beyond one year have not been included as amounts are not determinable.
(1) | Represents expected fiscal 2024 contributions to fund our defined benefit pension and other postretirement plans. Contributions beyond one year have not been included as amounts are not determinable. |
New Accounting Pronouncements and Changes in Accounting
In May 2014,December 2019, the Financial Accounting Standards Board (FASB) issued new accounting guidance which amendedsimplifies the existing accounting standards for revenue recognition.income taxes. The newguidance amends certain exceptions to the general principles of Accounting Standards Codification (ASC) 740, Income Taxes, and simplifies several areas such as accounting guidance establishes principles for recognizing revenue upon the transfer of promised goodsa franchise tax or services to customers, in an amountsimilar tax that reflects the expected consideration received in exchange for those goods or services. The amendments may be applied retrospectively to each prior period presented or retrospectively with the cumulative effect recognized as of the date of initial application.is partially based on income. We continue to evaluate the impact ofadopted the new accounting guidance on our consolidated financial statements, including the expected impact on our business processes, systems, and controls, and potential differences in the timing or method of revenue recognition on our contracts. We expect to adopt the new standardstarting on October 1, 2018, using the modified retrospective method that may result in a cumulative effect adjustment as of the date of adoption.
In February 2015, the FASB issued amended guidance to the consolidation standard which updates the analysis that a reporting entity must perform to determine whether it should consolidate certain types of legal entities. The amendment modifies the evaluation of whether limited partnerships and similar legal entities are variable interest entities (VIEs) or voting interest entities and affects the consolidation analysis of reporting entities that are involved with VIEs, particularly those that have fee arrangements and related party relationships, among other provisions. This amended guidance was effective for our fiscal year beginning October 1, 2016.2021. The adoption of thisthe new guidance did not have a material impact on our financial statements.
In April 2015, the FASB issued new accounting guidance which requires debt issuance costs to be presented in the balance sheet as a direct deduction from the carrying value of the associated debt liability, consistent with the presentation of a debt discount. Prior to the issuance of the standard, debt issuance costs were required to be presented in the balance sheet as an asset. The guidance requires retrospective application and represents a change in accounting principle. This guidance was effective for our fiscal year beginning October 1, 2016, which resulted in the reclassifications of $52.3 million and $56.8 million of unamortized debt issuance costs at September 30, 2017 and September 30, 2016, respectively, from other non-current assets to long-term debt.
In April 2015, the FASB issued new accounting guidance which provides the use of a practical expedient that permits the entity to measure defined benefit plans assets and obligations using the month-end date that is closest to the entity's fiscal year-end date and apply that practical expedient
Table of Contents
consistently from year to year. This guidance was effective for our fiscal year beginning October 1, 2016 and did not have a materialsignificant impact on our consolidated financial statements.
In February 2016,October 2021, the FASB issued new accountingfinal guidance which changes accounting requirements for leases.to companies that apply ASC 606, Revenue from Contracts with Customers, to recognize and measure contract assets and contract liabilities from contracts with customers acquired in a business combination. The new guidance requires lesseescreates an exception to recognize the general requirement to measure acquired assets and liabilities arising from all leases, including those classified as operating leases under previous accounting guidance,at fair value on the balance sheet. It also requires disclosureacquisition
date. Under this exception, an acquirer applies ASC 606 to increase transparencyrecognize and comparability among organizations. Themeasure contract assets and contract liabilities on the acquisition date. We adopted the new guidance starting on October 1, 2022 on a prospective basis and the revised guidance will be effective for our fiscal year beginning October 1, 2019 with early adoption permitted. The new guidance must be adopted using a modified retrospective transition approach and provides for certain practical expedients. We are currently evaluatingapplied to any business combinations the impact that the new guidance will have on our consolidated financial statements.Company undertakes.
In March 2016, the FASB issued new accounting guidance which simplifies the accounting for employee share-based payments. The new guidance requires all income tax effects of awards to be recognized in the statement of operations when the awards vest or are settled. It also allows an employer to repurchase more of an employee's shares for tax withholding purposes without triggering liability accounting and to make a policy election to account for forfeitures as they occur. We elected early adoption of this standard beginning October 1, 2016. The adoption of this guidance did not have a material impact on our consolidated financial statements.
In June 2016, the FASB issued a new credit loss standard that changes the impairment model for most financial assets and certain other instruments. The new guidance will replace the current "incurred loss" approach with an "expected loss" model for instruments measured at amortized cost. It also simplifies the accounting model for purchased credit-impaired debt securities and loans. The guidance will be effective for our fiscal year starting October 1, 2020. We are currently evaluating the impact that the new guidance will have on our consolidated financial statements.
In August 2016, the FASB issued new accounting guidance clarifying how entities should classify certain cash receipts and cash payments on the statement of cash flows. The new guidance also clarifies how the predominance principle should be applied when cash receipts and cash payments have aspects of more than one class of cash flows. The new guidance will be effective for our fiscal year beginning October 1, 2018, and early adoption is permitted. We are currently evaluating the impact that the new guidance will have on our consolidated statement of cash flows.
In January 2017, the FASB issued new accounting guidance to simplify the test for goodwill impairment. This guidance eliminates step two from the goodwill impairment test. Under the new guidance, an entity should recognize an impairment charge for the amount by which the carrying amount of a reporting unit exceeds its fair value. However, the loss recognized should not exceed the total amount of goodwill allocated to the reporting unit. This guidance is effective for us in the first quarter of fiscal 2021, and earlier adoption is permitted. We are currently evaluating the impact that this guidance will have on our consolidated financial statements.
Off-Balance Sheet Arrangements
We enter into various joint venture arrangements to provide architectural, engineering, program management, construction management and operations and maintenance services. The ownership percentage of these joint ventures is typically representative of the work to be performed or the amount of risk assumed by each joint venture partner. Some of these joint ventures are considered variable interest entities. We have consolidated all joint ventures for which we have control. For all others, our portion of the earnings are recorded in equity in earnings of joint ventures. See Note 6 in the notes to our consolidated financial statements. We do not believe that we have any off-balance sheet arrangements that have or are reasonably likely to have a current or future effect on our financial condition, changes in financial condition, revenues or expenses, results of operations, liquidity, capital expenditures or capital resources that would be material to investors.
Table of Contents
ITEM 7A. QUANTITATIVE AND QUALITATIVE DISCLOSURES ABOUT MARKET RISK
We are exposed to market risk, primarily related to foreign currency exchange rates and interest rate exposure of our debt obligations that bear interest based on floating rates. We actively monitor these exposures. Our objective is to reduce, where we deem appropriate to do so, fluctuations in earnings and cash flows associated with changes in foreign exchange rates and interest rates. In order to accomplish this objective, we sometimes enter into derivative financial instruments, such as forward contracts and interest rate hedge contracts. It is our policy and practice to use derivative financial instruments only to the extent necessary to manage our exposures. We do not use derivative financial instruments for trading purposes.
We are exposed to foreign currency exchange rate risk resulting from our operations outside of the U.S. We use foreign currency forward contracts from time to time to mitigate foreign currency risk. We limit exposure to foreign currency fluctuations in most of our contracts through provisions that require client payments in currencies corresponding to the currency in which costs are incurred. As a result of this natural hedge, we generally do not need to hedge foreign currency cash flows for contract work performed. The functional currency of our significant foreign operations is the respective local currency.
Our Credit Agreement and certain other debt obligations are subject to variable rate interest which could be adversely affected by an increase in interest rates. As of September 30, 20172023 and 2016,2022, we had $908.7$1,119.8 million and $1,954.9$1,143.3 million, respectively, in outstanding borrowings under our term credit agreements and our revolving credit facility. Interest on amounts borrowed under these agreements is subject to adjustment based on certainspecified levels of financial performance. The applicable margin that is added to the borrowing'sborrowing in the base rate can range from 0.75%0.25% to 2.25%1.00% and the applicable margin that is added to borrowings in the eurocurrency rate can range from 1.25% to 2.00%. For the year ended September 30, 2017,2023, our weighted average floating rate borrowings were $1,940.4$1,485.8 million, or $1,340.4$846.3 million excluding borrowings with effective fixed interest rates due to interest rate swap and interest rate cap agreements. If short termshort-term floating interest rates had increased by 1.00%, our interest expense for the year ended September 30, 20172023 would have increased by $13.4$8.6 million. We invest our cash in a variety of financial instruments, consisting principally of money market securities or other highly liquid, short-term securities that are subject to minimal credit and market risk.
ITEM 8. FINANCIAL STATEMENTS AND SUPPLEMENTARY DATA
AECOM
Index to Consolidated Financial Statements
September 30, 2017
2023
| | |
Audited Annual Consolidated Financial Statements | | |
Reports of Independent Registered Public Accounting Firm (PCAOB ID: 42) | | 7255 |
Consolidated Balance Sheets at September 30, 20172023 and 20162022 | | 7458 |
Consolidated Statements of Operations for the Years Ended September 30, 2017, 2016,2023, 2022 and 20152021 | | 7559 |
Consolidated Statements of Comprehensive Income (Loss) for the Years Ended September 30, 2017, 2016,2023, 2022, and 20152021 | | 7660 |
Consolidated Statements of Stockholders'Stockholders’ Equity for the Years Ended September 30, 2017, 2016,2023, 2022, and 20152021 | | 7761 |
Consolidated Statements of Cash Flows for the Years Ended September 30, 2017, 2016,2023, 2022, and 20152021 | | 7862 |
Notes to Consolidated Financial Statements | | 7963 |
Report of Independent Registered Public Accounting Firm
TheTo the Stockholders and the Board of Directors and Stockholders of AECOM
Opinion on the Financial Statements
We have audited the accompanying consolidated balance sheets of AECOM (the "Company")Company) as of September 30, 20172023 and 2016, and2022, the related consolidated statements of operations, comprehensive income, (loss), stockholders'stockholders’ equity and cash flows for each of the three years in the period ended September 30, 2017. Our audits also included2023, and the related notes and financial statement schedule listed in the Index at Item 15(a). These (collectively referred to as the “consolidated financial statements and schedule are the responsibility of the Company's management. Our responsibility is to express an opinion on these financial statements and schedule based on our audits.
We conducted our audits in accordance with the standards of the Public Company Accounting Oversight Board (United States)”). Those standards require that we plan and perform the audit to obtain reasonable assurance about whether the financial statements are free of material misstatement. An audit includes examining, on a test basis, evidence supporting the amounts and disclosures in the financial statements. An audit also includes assessing the accounting principles used and significant estimates made by management, as well as evaluating the overall financial statement presentation. We believe that our audits provide a reasonable basis for our opinion.
In our opinion, the consolidated financial statements referred to above present fairly, in all material respects, the consolidated financial position of AECOMthe Company at September 30, 20172023 and 2016,2022, and the consolidated results of its operations and its cash flows for each of the three years in the period ended September 30, 2017,2023, in conformity with U.S. generally accepted accounting principles. Also, in our opinion, the related financial statement schedule, when considered in relation to the basic financial statements taken as a whole, present fairly in all material respects the information set forth therein.
We also have audited, in accordance with the standards of the Public Company Accounting Oversight Board (United States) (PCAOB), AECOM'sthe Company’s internal control over financial reporting as of September 30, 2017,2023, based on criteria established in Internal Control-Integrated Framework issued by the Committee of Sponsoring Organizations of the Treadway Commission (2013 framework) and our report dated November 14, 20172023 expressed an unqualified opinion thereon.
Basis for Opinion
These financial statements are the responsibility of the Company’s management. Our responsibility is to express an opinion on the Company’s financial statements based on our audits. We are a public accounting firm registered with the PCAOB and are required to be independent with respect to the Company in accordance with the U.S. federal securities laws and the applicable rules and regulations of the Securities and Exchange Commission and the PCAOB.
We conducted our audits in accordance with the standards of the PCAOB. Those standards require that we plan and perform the audit to obtain reasonable assurance about whether the financial statements are free of material misstatement, whether due to error or fraud. Our audits included performing procedures to assess the risks of material misstatement of the financial statements, whether due to error or fraud, and performing procedures that respond to those risks. Such procedures included examining, on a test basis, evidence regarding the amounts and disclosures in the financial statements. Our audits also included evaluating the accounting principles used and significant estimates made by management, as well as evaluating the overall presentation of the financial statements. We believe that our audits provide a reasonable basis for our opinion.
Critical Audit Matter
The critical audit matter communicated below is a matter arising from the current period audit of the financial statements that was communicated or required to be communicated to the audit committee and that: (1) relates to accounts or disclosures that are material to the financial statements and (2)involved our especially challenging, subjective, or complex judgments. The communication of the critical audit matter does not alter in any way our opinion on the consolidated financial statements, taken as a whole, and we are not, by communicating the critical audit matter below, providing a separate opinion on the critical audit matter or on the accounts or disclosures to which it relates.
| |
| Revenue Recognition - Contract cost and claim recovery estimates |
Description of the Matter | For the year ended September 30, 2023, contract revenues recognized by the Company were $14.4 billion. Contract revenues include $3.4 billion which relate to fixed price contracts and $4.9 billion which relate to guaranteed maximum price contracts. As described in Note 4 of the consolidated financial statements, the Company generally recognizes revenues for these contracts over time as performance obligations are satisfied. The Company generally measures its progress to completion using an input measure of total costs incurred divided by total costs expected to be incurred. In addition, the Company’s estimate of transaction price includes variable consideration associated with claims only to the extent that a significant reversal would not be probable. |
| |
| Recognition of revenue and profit over time as performance obligations are satisfied for long-term fixed price contracts is highly judgmental as it requires the Company to prepare estimates of total contract revenue and total contract costs, including costs to complete in-process contracts. These estimates are dependent upon a number of factors, including the accuracy of estimates made at the balance sheet date, such as engineering progress, material quantities, the achievement of milestones, penalty provisions, labor productivity and cost estimates. As of September 30, 2023, significant claims recorded in contract assets and other non-current assets on the consolidated balance sheet were approximately $160.0 million. Revenue recognition relating to claims is highly judgmental as the amount has been disputed by the customer and it requires the Company to prepare estimates of amounts expected to be recovered. Changes in recovery estimates can have a material effect on the amount of revenue recognized. Auditing contract revenue recognition is complex and highly judgmental due to the variability and uncertainty associated with estimating the costs to complete and amounts expected to be recovered from claims. Changes in these estimates would have a significant effect on the amount of contract revenue recognized. |
| |
How We Addressed the Matter in Our Audit | We obtained an understanding, evaluated the design, and tested the operating effectiveness of controls that address the risk of material misstatement of contract revenue including those associated with cost to complete estimates for long-term fixed price contracts and estimates of amounts expected to be recovered from claims. For example, we tested controls over the Company’s review of estimated direct and indirect costs to be incurred and estimates of claim recovery amounts. To evaluate the Company’s determination of estimated costs to complete, we selected a sample of contracts and, among other things, inspected the executed contracts including any significant amendments; conducted interviews with and inspected questionnaires prepared by project personnel; tested key components of the cost to complete estimates, including materials, labor, and subcontractors costs; reviewed support for estimates of project contingencies; compared actual project margins to historical and expected results; and recalculated revenues recognized. To test revenue recognized relating to claims, we selected a sample of projects and evaluated the estimates made by management by reviewing documentation from management’s specialists and external counsel to support the amount of the claim. We also tested management’s estimation process by performing a lookback analysis to evaluate claims settled in the current year compared to management’s prior year estimates. |
/s/ ERNST Ernst& YOUNG YoungLLP
We have served as the Company’s auditor since 1990.
Los Angeles, California
November14, 20172023
Report of Independent Registered Public Accounting Firm
TheTo the Stockholders and the Board of Directors and Stockholders of AECOM
Opinion on Internal Control Over Financial Reporting
We have audited AECOM's (the "Company")AECOM’s internal control over financial reporting as of September 30, 2017,2023, based on criteria established in Internal Control—Control —Integrated Framework issued by the Committee of Sponsoring Organizations of the Treadway Commission (2013 framework) (the "COSO criteria")COSO criteria). AECOM'sIn our opinion, AECOM (the Company) maintained, in all material respects, effective internal control over financial reporting as of September 30, 2023, based on the COSO criteria.
We also have audited, in accordance with the standards of the Public Company Accounting Oversight Board (United States) (PCAOB), the 2023 consolidated financial statements of the Company and our report dated November 14, 2023 expressed an unqualified opinion thereon.
Basis for Opinion
The Company’s management is responsible for maintaining effective internal control over financial reporting and for its assessment of the effectiveness of internal control over financial reporting included in the accompanying Management'sManagement’s Report on Internal Control over Financial Reporting. Our responsibility is to express an opinion on the Company'sCompany’s internal control over financial reporting based on our audit. We are a public accounting firm registered with the PCAOB and are required to be independent with respect to the Company in accordance with the U.S. federal securities laws and the applicable rules and regulations of the Securities and Exchange Commission and the PCAOB.
We conducted our audit in accordance with the standards of the Public Company Accounting Oversight Board (United States).PCAOB. Those standards require that we plan and perform the audit to obtain reasonable assurance about whether effective internal control over financial reporting was maintained in all material respects.
Our audit included obtaining an understanding of internal control over financial reporting, assessing the risk that a material weakness exists, testing and evaluating the design and operating effectiveness of internal control based on the assessed risk, and performing such other procedures as we considered necessary in the circumstances. We believe that our audit provides a reasonable basis for our opinion.
Definition and Limitations of Internal Control Over Financial Reporting
A company'scompany’s internal control over financial reporting is a process designed to provide reasonable assurance regarding the reliability of financial reporting and the preparation of financial statements for external purposes in accordance with generally accepted accounting principles. A company'scompany’s internal control over financial reporting includes those policies and procedures that (1) pertain to the maintenance of records that, in reasonable detail, accurately and fairly reflect the transactions and dispositions of the assets of the company; (2) provide reasonable assurance that transactions are recorded as necessary to permit preparation of financial statements in accordance with generally accepted accounting principles, and that receipts and expenditures of the company are being made only in accordance with authorizations of management and directors of the company; and (3) provide reasonable assurance regarding prevention or timely detection of unauthorized acquisition, use, or disposition of the company'scompany’s assets that could have a material effect on the financial statements.
Because of its inherent limitations, internal control over financial reporting may not prevent or detect misstatements. Also, projections of any evaluation of effectiveness to future periods are subject to the risk that controls may become inadequate because of changes in conditions, or that the degree of compliance with the policies or procedures may deteriorate.
In our opinion, AECOM maintained, in all material respects, effective internal control over financial reporting as of September 30, 2017, based on the COSO criteria.
We also have audited, in accordance with the standards of the Public Company Accounting Oversight Board (United States), the consolidated balance sheets of AECOM as of September 30, 2017 and 2016, and the related consolidated statements of operations, comprehensive income (loss), stockholders' equity, and cash flows for each of the three years in the period ended September 30, 2017 and our report dated November 14, 2017 expressed an unqualified opinion thereon.
/s/ ERNSTErnst & YOUNGYoung LLP
Los Angeles, California
November 14, 2017
2023
AECOM
AECOM
Consolidated Balance Sheets
(in thousands, except share data)
| | | | | | | |
| | September 30,
2017 | | September 30,
2016 | |
|---|
ASSETS | | | | | | | |
CURRENT ASSETS: | | | | | | | |
Cash and cash equivalents | | $ | 665,871 | | $ | 588,644 | |
Cash in consolidated joint ventures | | | 136,491 | | | 103,501 | |
| | | | | | | | |
Total cash and cash equivalents | | | 802,362 | | | 692,145 | |
Accounts receivable—net | | | 5,127,743 | | | 4,531,460 | |
Prepaid expenses and other current assets | | | 696,718 | | | 730,101 | |
Income taxes receivable | | | 55,399 | | | 47,065 | |
| | | | | | | | |
TOTAL CURRENT ASSETS | | | 6,682,222 | | | 6,000,771 | |
PROPERTY AND EQUIPMENT—NET | | | 621,357 | | | 644,992 | |
DEFERRED TAX ASSETS—NET | | | 171,331 | | | 171,508 | |
INVESTMENTS IN UNCONSOLIDATED JOINT VENTURES | | | 364,223 | | | 330,485 | |
GOODWILL | | | 5,992,881 | | | 5,823,843 | |
INTANGIBLE ASSETS—NET | | | 415,096 | | | 479,439 | |
OTHER NON-CURRENT ASSETS | | | 149,846 | | | 218,898 | |
| | | | | | | | |
TOTAL ASSETS | | $ | 14,396,956 | | $ | 13,669,936 | |
| | | | | | | | |
| | | | | | | | |
| | | | | | | | |
LIABILITIES AND STOCKHOLDERS' EQUITY | | | | | | | |
CURRENT LIABILITIES: | | | | | | | |
Short-term debt | | $ | 1,221 | | $ | 26,303 | |
Accounts payable | | | 2,249,872 | | | 1,910,915 | |
Accrued expenses and other current liabilities | | | 2,245,519 | | | 2,384,815 | |
Income taxes payable | | | 38,176 | | | 10,774 | |
Billings in excess of costs on uncompleted contracts | | | 902,812 | | | 631,928 | |
Current portion of long-term debt | | | 140,779 | | | 340,021 | |
| | | | | | | | |
TOTAL CURRENT LIABILITIES | | | 5,578,379 | | | 5,304,756 | |
OTHER LONG-TERM LIABILITIES | | | 322,199 | | | 403,364 | |
DEFERRED TAX LIABILITY—NET | | | 20,515 | | | 13,097 | |
PENSION BENEFIT OBLIGATIONS | | | 559,068 | | | 694,073 | |
LONG-TERM DEBT | | | 3,702,109 | | | 3,702,157 | |
| | | | | | | | |
TOTAL LIABILITIES | | | 10,182,270 | | | 10,117,447 | |
COMMITMENTS AND CONTINGENCIES (Note 18) | | | | | | | |
AECOM STOCKHOLDERS' EQUITY: | | |
| | |
| |
Common stock—authorized, 300,000,000 shares of $0.01 par value as of September 30, 2017 and 2016; issued and outstanding 157,529,419 and 153,901,500 shares as of September 30, 2017 and 2016, respectively | | | 1,575 | | | 1,539 | |
Additional paid-in capital | | | 3,733,572 | | | 3,604,519 | |
Accumulated other comprehensive loss | | | (700,661 | ) | | (857,582 | ) |
Retained earnings | | | 961,640 | | | 618,445 | |
| | | | | | | | |
TOTAL AECOM STOCKHOLDERS' EQUITY | | | 3,996,126 | | | 3,366,921 | |
Noncontrolling interests | | | 218,560 | | | 185,568 | |
| | | | | | | | |
TOTAL STOCKHOLDERS' EQUITY | | | 4,214,686 | | | 3,552,489 | |
| | | | | | | | |
TOTAL LIABILITIES AND STOCKHOLDERS' EQUITY | | $ | 14,396,956 | | $ | 13,669,936 | |
| | | | | | | | |
| | | | | | | | |
| | | | | | | | |
| | | | | | |
| | September 30, | | September 30, |
| | 2023 | | 2022 |
ASSETS | | | | | | |
CURRENT ASSETS: | | | | | | |
Cash and cash equivalents | | $ | 1,030,447 | | $ | 972,661 |
Cash in consolidated joint ventures | | | 229,759 | | | 199,548 |
Total cash and cash equivalents | | | 1,260,206 | | | 1,172,209 |
Accounts receivable—net | | | 2,544,453 | | | 2,317,812 |
Contract assets | | | 1,525,051 | | | 1,405,299 |
Prepaid expenses and other current assets | | | 730,145 | | | 759,402 |
Current assets held for sale | | | 95,221 | | | 79,000 |
Income taxes receivable | | | 14,435 | | | 89,088 |
TOTAL CURRENT ASSETS | | | 6,169,511 | | | 5,822,810 |
PROPERTY AND EQUIPMENT—NET | | | 382,638 | | | 428,239 |
DEFERRED TAX ASSETS—NET | | | 439,604 | | | 284,154 |
INVESTMENTS IN UNCONSOLIDATED JOINT VENTURES | | | 139,236 | | | 354,983 |
GOODWILL | | | 3,418,930 | | | 3,380,761 |
INTANGIBLE ASSETS—NET | | | 17,769 | | | 35,552 |
OTHER NON-CURRENT ASSETS | | | 218,666 | | | 293,043 |
OPERATING LEASE RIGHT-OF-USE ASSETS | | | 447,044 | | | 539,773 |
TOTAL ASSETS | | $ | 11,233,398 | | $ | 11,139,315 |
LIABILITIES AND STOCKHOLDERS’ EQUITY | | | | | | |
CURRENT LIABILITIES: | | | | | | |
Short-term debt | | $ | 3,085 | | $ | 5,032 |
Accounts payable | | | 2,190,755 | | | 2,027,314 |
Accrued expenses and other current liabilities | | | 2,287,546 | | | 2,181,408 |
Income taxes payable | | | 48,161 | | | 46,336 |
Contract liabilities | | | 1,188,742 | | | 1,051,258 |
Current liabilities held for sale | | | 45,625 | | | 49,249 |
Current portion of long-term debt | | | 86,369 | | | 43,574 |
TOTAL CURRENT LIABILITIES | | | 5,850,283 | | | 5,404,171 |
OTHER LONG-TERM LIABILITIES | | | 123,846 | | | 135,795 |
OPERATING LEASE LIABILITIES, NON-CURRENT | | | 548,851 | | | 595,308 |
LONG-TERM LIABILITIES HELD FOR SALE | | | 792 | | | 200 |
DEFERRED TAX LIABILITY-NET | | | 16,960 | | | 9,224 |
PENSION BENEFIT OBLIGATIONS | | | 195,586 | | | 232,552 |
LONG-TERM DEBT | | | 2,113,369 | | | 2,156,686 |
TOTAL LIABILITIES | | | 8,849,687 | | | 8,533,936 |
| | | | | | |
COMMITMENTS AND CONTINGENCIES (Note 18) | | | | | | |
| | | | | | |
AECOM STOCKHOLDERS’ EQUITY: | | | | | | |
Common stock—authorized, 300,000,000 shares of $0.01 par value as of September 30, 2023 and 2022; issued and outstanding 136,210,883 and 138,933,907 shares as of September 30, 2023 and 2022, respectively | | | 1,362 | | | 1,389 |
Additional paid-in capital | | | 4,241,523 | | | 4,156,594 |
Accumulated other comprehensive loss | | | (926,577) | | | (979,675) |
Accumulated deficits | | | (1,103,976) | | | (701,654) |
TOTAL AECOM STOCKHOLDERS’ EQUITY | | | 2,212,332 | | | 2,476,654 |
Noncontrolling interests | | | 171,379 | | | 128,725 |
TOTAL STOCKHOLDERS’ EQUITY | | | 2,383,711 | | | 2,605,379 |
TOTAL LIABILITIES AND STOCKHOLDERS’ EQUITY | | $ | 11,233,398 | | $ | 11,139,315 |
See accompanying Notes to Consolidated Financial Statements.
AECOM
AECOM
Consolidated Statements of Operations
(in thousands, except per share data)
| | | | | | | | | | |
| | Fiscal Year Ended | |
|---|
| | September 30,
2017 | | September 30,
2016 | | September 30,
2015 | |
|---|
Revenue | | $ | 18,203,402 | | $ | 17,410,825 | | $ | 17,989,880 | |
Cost of revenue | | |
17,519,682 | | |
16,768,001 | | |
17,454,692 | |
| | | | | | | | | | | |
Gross profit | | | 683,720 | | | 642,824 | | | 535,188 | |
Equity in earnings of joint ventures | | |
141,582 | | |
104,032 | | |
106,245 | |
General and administrative expenses | | | (133,309 | ) | | (115,088 | ) | | (113,975 | ) |
Acquisition and integration expenses | | | (38,709 | ) | | (213,642 | ) | | (398,440 | ) |
Gain (loss) on disposal activities | | | 572 | | | (42,589 | ) | | — | |
| | | | | | | | | | | |
Income from operations | | | 653,856 | | | 375,537 | | | 129,018 | |
Other income | | |
6,636 | | |
8,180 | | |
19,139 | |
Interest expense | | | (231,310 | ) | | (258,162 | ) | | (299,627 | ) |
| | | | | | | | | | | |
Income (loss) before income tax (benefit) expense | | | 429,182 | | | 125,555 | | | (151,470 | ) |
Income tax expense (benefit) | | | 7,706 | | | (37,917 | ) | | (80,237 | ) |
| | | | | | | | | | | |
Net income (loss) | | | 421,476 | | | 163,472 | | | (71,233 | ) |
Noncontrolling interests in income of consolidated subsidiaries, net of tax | | | (82,086 | ) | | (67,363 | ) | | (83,612 | ) |
| | | | | | | | | | | |
Net income (loss) attributable to AECOM | | $ | 339,390 | | $ | 96,109 | | $ | (154,845 | ) |
| | | | | | | | | | | |
| | | | | | | | | | | |
| | | | | | | | | | | |
Net income (loss) attributable to AECOM per share: | | | | | | | | | | |
Basic | | $ | 2.18 | | $ | 0.62 | | $ | (1.04 | ) |
Diluted | | $ | 2.13 | | $ | 0.62 | | $ | (1.04 | ) |
Weighted average shares outstanding: | | |
| | |
| | |
| |
Basic | | | 155,728 | | | 154,772 | | | 149,605 | |
Diluted | | | 159,135 | | | 156,073 | | | 149,605 | |
| | | | | | | | | |
| | Fiscal Year Ended |
| | September 30, | | September 30, | | September 30, |
| | 2023 | | 2022 | | 2021 |
Revenue | | $ | 14,378,461 | | $ | 13,148,182 | | $ | 13,340,852 |
Cost of revenue | | | 13,432,996 | | | 12,300,208 | | | 12,542,431 |
Gross profit | | | 945,465 | | | 847,974 | | | 798,421 |
| | | | | | | | | |
Equity in (losses) earnings of joint ventures | | | (279,352) | | | 53,640 | | | 35,044 |
General and administrative expenses | | | (153,575) | | | (147,309) | | | (155,072) |
Restructuring costs | | | (188,404) | | | (107,501) | | | (48,840) |
Income from operations | | | 324,134 | | | 646,804 | | | 629,553 |
| | | | | | | | | |
Other income | | | 8,357 | | | 5,942 | | | 10,883 |
Interest income | | | 40,251 | | | 8,210 | | | 6,720 |
Interest expense | | | (159,342) | | | (110,274) | | | (238,352) |
Income from continuing operations before taxes | | | 213,400 | | | 550,682 | | | 408,804 |
Income tax expense for continuing operations | | | 56,052 | | | 136,051 | | | 89,011 |
Net income from continuing operations | | | 157,348 | | | 414,631 | | | 319,793 |
Net loss from discontinued operations | | | (57,207) | | | (79,929) | | | (116,813) |
Net income | | | 100,141 | | | 334,702 | | | 202,980 |
| | | | | | | | | |
Net income attributable to noncontrolling interests from continuing operations | | | (43,262) | | | (25,521) | | | (25,109) |
Net (loss) income attributable to noncontrolling interests from discontinued operations | | | (1,547) | | | 1,430 | | | (4,686) |
Net income attributable to noncontrolling interests | | | (44,809) | | | (24,091) | | | (29,795) |
| | | | | | | | | |
Net income attributable to AECOM from continuing operations | | | 114,086 | | | 389,110 | | | 294,684 |
Net loss attributable to AECOM from discontinued operations | | | (58,754) | | | (78,499) | | | (121,499) |
Net income attributable to AECOM | | $ | 55,332 | | $ | 310,611 | | $ | 173,185 |
| | | | | | | | | |
Net income (loss) attributable to AECOM per share: | | | | | | | | | |
Basic continuing operations per share | | $ | 0.82 | | $ | 2.76 | | $ | 2.00 |
Basic discontinued operations per share | | $ | (0.42) | | $ | (0.55) | | $ | (0.82) |
Basic earnings per share | | $ | 0.40 | | $ | 2.21 | | $ | 1.18 |
| | | | | | | | | |
Diluted continuing operations per share | | $ | 0.81 | | $ | 2.73 | | $ | 1.97 |
Diluted discontinued operations per share | | $ | (0.42) | | $ | (0.55) | | $ | (0.81) |
Diluted earnings per share | | $ | 0.39 | | $ | 2.18 | | $ | 1.16 |
| | | | | | | | | |
Weighted average shares outstanding: | | | | | | | | | |
Basic | | | 138,614 | | | 140,768 | | | 147,279 |
Diluted | | | 140,109 | | | 142,696 | | | 149,676 |
See accompanying Notes to Consolidated Financial Statements.
AECOM
AECOM
Consolidated Statements of Comprehensive Income (Loss)
(in thousands)
| | | | | | | | | | |
| | Fiscal Year Ended | |
|---|
| | September 30,
2017 | | September 30,
2016 | | September 30,
2015 | |
|---|
Net income (loss) | | $ | 421,476 | | $ | 163,472 | | $ | (71,233 | ) |
Other comprehensive income (loss), net of tax: | | | | | | | | | | |
Net unrealized gain (loss) on derivatives, net of tax | | | 4,605 | | | 5,987 | | | (9,196 | ) |
Foreign currency translation adjustments | | | 65,389 | | | (65,224 | ) | | (285,520 | ) |
Pension adjustments, net of tax | | | 87,061 | | | (164,911 | ) | | 12,953 | |
| | | | | | | | | | | |
Other comprehensive income (loss), net of tax | | | 157,055 | | | (224,148 | ) | | (281,763 | ) |
| | | | | | | | | | | |
Comprehensive income (loss), net of tax | | | 578,531 | | | (60,676 | ) | | (352,996 | ) |
Noncontrolling interests in comprehensive income of consolidated subsidiaries, net of tax | | | (82,220 | ) | | (65,697 | ) | | (80,347 | ) |
| | | | | | | | | | | |
Comprehensive income (loss) attributable to AECOM, net of tax | | $ | 496,311 | | $ | (126,373 | ) | $ | (433,343 | ) |
| | | | | | | | | | | |
| | | | | | | | | | | |
| | | | | | | | | | | |
| | | | | | | | | |
| | Fiscal Year Ended |
| | September 30, | | September 30, | | September 30, |
| | 2023 | | 2022 | | 2021 |
Net income | | $ | 100,141 | | $ | 334,702 | | $ | 202,980 |
| | | | | | | | | |
Other comprehensive income (loss), net of tax: | | | | | | | | | |
Net unrealized gain on derivatives, net of tax | | | 2,165 | | | 41,002 | | | 4,541 |
Foreign currency translation adjustments | | | 59,720 | | | (220,043) | | | (12,601) |
Pension adjustments, net of tax | | | (8,719) | | | 98,893 | | | 26,591 |
Other comprehensive income (loss), net of tax | | | 53,166 | | | (80,148) | | | 18,531 |
Comprehensive income, net of tax | | | 153,307 | | | 254,554 | | | 221,511 |
Noncontrolling interests in comprehensive income of consolidated subsidiaries, net of tax | | | (44,877) | | | (23,241) | | | (30,029) |
Comprehensive income attributable to AECOM, net of tax | | $ | 108,430 | | $ | 231,313 | | $ | 191,482 |
See accompanying Notes to Consolidated Financial Statements.
AECOM
AECOM
Consolidated Statements of Stockholders'Stockholders’ Equity
(in thousands)
| | | | | | | | | | | | | | | | | | | | | | |
| | Common
Stock | | Additional
Paid-In
Capital | | Accumulated
Other
Comprehensive
Loss | | Retained
Earnings | | Total
AECOM
Stockholders'
Equity | | Non-
Controlling
Interests | | Total
Stockholder's
Equity | |
|---|
BALANCE AT SEPTEMBER 30, 2014 | | $ | 967 | | $ | 1,864,971 | | $ | (356,602 | ) | $ | 677,181 | | $ | 2,186,517 | | $ | 85,963 | | $ | 2,272,480 | |
Net loss | | | | | | | | | | | | (154,845 | ) | | (154,845 | ) | | 83,612 | | | (71,233 | ) |
Other comprehensive loss | | | | | | | | | (278,498 | ) | | | | | (278,498 | ) | | (3,265 | ) | | (281,763 | ) |
Issuance of stock | | | 525 | | | 1,577,456 | | | | | | | | | 1,577,981 | | | | | | 1,577,981 | |
Repurchases of stock | | | 16 | | | (23,129 | ) | | | | | | | | (23,113 | ) | | | | | (23,113 | ) |
Proceeds from exercise of options | | | 5 | | | 11,068 | | | | | | | | | 11,073 | | | | | | 11,073 | |
Tax benefit from exercise of stock options | | | | | | 2,781 | | | | | | | | | 2,781 | | | | | | 2,781 | |
Stock based compensation | | | | | | 85,852 | | | | | | | | | 85,852 | | | | | | 85,852 | |
Other transactions with noncontrolling interests | | | | | | | | | | | | | | | | | | 201,154 | | | 201,154 | |
Contributions from noncontrolling interests | | | | | | | | | | | | | | | | | | 133 | | | 133 | |
Distributions to noncontrolling interests | | | | | | | | | | | | | | | | | | (144,402 | ) | | (144,402 | ) |
| | | | | | | | | | | | | | | | | | | | | | | |
BALANCE AT SEPTEMBER 30, 2015 | | | 1,513 | | | 3,518,999 | | | (635,100 | ) | | 522,336 | | | 3,407,748 | | | 223,195 | | | 3,630,943 | |
Net income | | | | | | | | | | | | 96,109 | | | 96,109 | | | 67,363 | | | 163,472 | |
Other comprehensive loss | | | | | | | | | (222,482 | ) | | | | | (222,482 | ) | | (1,666 | ) | | (224,148 | ) |
Issuance of stock | | | 21 | | | 28,065 | | | | | | | | | 28,086 | | | | | | 28,086 | |
Repurchases of stock | | | 1 | | | (25,893 | ) | | | | | | | | (25,892 | ) | | | | | (25,892 | ) |
Proceeds from exercise of options | | | 4 | | | 9,942 | | | | | | | | | 9,946 | | | | | | 9,946 | |
Tax benefit from exercise of stock options | | | | | | | | | | | | | | | | | | | | | | |
Stock based compensation | | | | | | 73,406 | | | | | | | | | 73,406 | | | | | | 73,406 | |
Other transactions with noncontrolling interests | | | | | | | | | | | | | | | | | | (155 | ) | | (155 | ) |
Contributions from noncontrolling interests | | | | | | | | | | | | | | | | | | 2,006 | | | 2,006 | |
Distributions to noncontrolling interests | | | | | | | | | | | | | | | | | | (105,175 | ) | | (105,175 | ) |
| | | | | | | | | | | | | | | | | | | | | | | |
BALANCE AT SEPTEMBER 30, 2016 | | | 1,539 | | | 3,604,519 | | | (857,582 | ) | | 618,445 | | | 3,366,921 | | | 185,568 | | | 3,552,489 | |
Net income | | | | | | | | | | | | 339,390 | | | 339,390 | | | 82,086 | | | 421,476 | |
Cumulative effect of accounting standard adoption | | | | | | | | | | | | 3,805 | | | 3,805 | | | | | | 3,805 | |
Other comprehensive income | | | | | | | | | 156,921 | | | | | | 156,921 | | | 134 | | | 157,055 | |
Issuance of stock | | | 41 | | | 66,624 | | | | | | | | | 66,665 | | | | | | 66,665 | |
Repurchases of stock | | | (7 | ) | | (25,071 | ) | | | | | | | | (25,078 | ) | | | | | (25,078 | ) |
Proceeds from exercise of options | | | 2 | | | 4,876 | | | | | | | | | 4,878 | | | | | | 4,878 | |
Tax benefit from exercise of stock options | | | | | | | | | | | | | | | | | | | | | | |
Stock based compensation | | | | | | 83,774 | | | | | | | | | 83,774 | | | | | | 83,774 | |
Acquisition of noncontrolling interests | | | | | | (1,150 | ) | | | | | | | | (1,150 | ) | | | | | (1,150 | ) |
Other noncontrolling interests | | | | | | | | | | | | | | | | | | 9,808 | | | 9,808 | |
Contributions from noncontrolling interests | | | | | | | | | | | | | | | | | | 2,282 | | | 2,282 | |
Distributions to noncontrolling interests | | | | | | | | | | | | | | | | | | (61,318 | ) | | (61,318 | ) |
| | | | | | | | | | | | | | | | | | | | | | | |
BALANCE AT SEPTEMBER 30, 2017 | | $ | 1,575 | | $ | 3,733,572 | | $ | (700,661 | ) | $ | 961,640 | | $ | 3,996,126 | | $ | 218,560 | | $ | 4,214,686 | |
| | | | | | | | | | | | | | | | | | | | | | | |
| | | | | | | | | | | | | | | | | | | | | | | |
| | | | | | | | | | | | | | | | | | | | | | | |
| | | | | | | | | | | | | | | | | | | | | |
| | | | | | Accumulated | | Retained | | Total | | | | |
| | | | Additional | | Other | | Earnings/ | | AECOM | | Non- | | Total |
| | Common | | Paid-In | | Comprehensive | | (Accumulated | | Stockholders’ | | Controlling | | Stockholders’ |
| | Stock | | Capital | | Loss | | Deficits) | | Equity | | Interests | | Equity |
BALANCE AT SEPTEMBER 30, 2020 | | $ | 1,570 | | $ | 4,035,414 | | $ | (918,674) | | $ | 174,248 | | $ | 3,292,558 | | $ | 120,986 | | $ | 3,413,544 |
Net income | | | — | | | — | | | — | | | 173,185 | | | 173,185 | | | 29,795 | | | 202,980 |
Cumulative effect of accounting standard adoption | | | — | | | — | | | — | | | (7,979) | | | (7,979) | | | — | | | (7,979) |
Other comprehensive income | | | — | | | — | | | 18,297 | | | — | | | 18,297 | | | 234 | | | 18,531 |
Issuance of stock | | | 25 | | | 58,733 | | | — | | | — | | | 58,758 | | | — | | | 58,758 |
Repurchases of stock | | | (163) | | | (23,348) | | | — | | | (843,580) | | | (867,091) | | | — | | | (867,091) |
Stock based compensation | | | — | | | 44,742 | | | — | | | — | | | 44,742 | | | — | | | 44,742 |
Other transactions with noncontrolling interests | | | — | | | — | | | — | | | — | | | — | | | 405 | | | 405 |
Disposal of noncontrolling interest of business sold | | | — | | | — | | | — | | | — | | | — | | | (24,039) | | | (24,039) |
Contributions from noncontrolling interests | | | — | | | — | | | — | | | — | | | — | | | 271 | | | 271 |
Distributions to noncontrolling interests | | | — | | | — | | | — | | | — | | | — | | | (10,545) | | | (10,545) |
BALANCE AT SEPTEMBER 30, 2021 | | $ | 1,432 | | $ | 4,115,541 | | $ | (900,377) | | $ | (504,126) | | $ | 2,712,470 | | $ | 117,107 | | $ | 2,829,577 |
Net income | | | — | | | — | | | — | | | 310,611 | | | 310,611 | | | 24,091 | | | 334,702 |
Dividends declared | | | — | | | — | | | — | | | (85,260) | | | (85,260) | | | — | | | (85,260) |
Other comprehensive loss | | | — | | | — | | | (79,298) | | | — | | | (79,298) | | | (850) | | | (80,148) |
Issuance of stock | | | 25 | | | 52,605 | | | — | | | — | | | 52,630 | | | — | | | 52,630 |
Repurchases of stock | | | (68) | | | (50,023) | | | — | | | (422,879) | | | (472,970) | | | — | | | (472,970) |
Stock-based compensation | | | — | | | 38,471 | | | — | | | — | | | 38,471 | | | — | | | 38,471 |
Other transactions with noncontrolling interests | | | — | | | — | | | — | | | — | | | — | | | 772 | | | 772 |
Contributions from noncontrolling interests | | | — | | | — | | | — | | | — | | | — | | | 185 | | | 185 |
Distributions to noncontrolling interests | | | — | | | — | | | — | | | — | | | — | | | (12,580) | | | (12,580) |
BALANCE AT SEPTEMBER 30, 2022 | | $ | 1,389 | | $ | 4,156,594 | | $ | (979,675) | | $ | (701,654) | | $ | 2,476,654 | | $ | 128,725 | | $ | 2,605,379 |
Net income | | | — | | | — | | | — | | | 55,332 | | | 55,332 | | | 44,809 | | | 100,141 |
Dividends declared | | | — | | | — | | | — | | | (100,872) | | | (100,872) | | | — | | | (100,872) |
Other comprehensive loss | | | — | | | — | | | 53,098 | | | — | | | 53,098 | | | 68 | | | 53,166 |
Issuance of stock | | | 19 | | | 64,964 | | | — | | | — | | | 64,983 | | | — | | | 64,983 |
Repurchases of stock | | | (46) | | | (25,917) | | | — | | | (356,782) | | | (382,745) | | | — | | | (382,745) |
Stock-based compensation | | | — | | | 45,882 | | | — | | | — | | | 45,882 | | | — | | | 45,882 |
Contributions from noncontrolling interests | | | — | | | — | | | — | | | — | | | — | | | 17,225 | | | 17,225 |
Distributions to noncontrolling interests | | | — | | | — | | | — | | | — | | | — | | | (19,448) | | | (19,448) |
BALANCE AT SEPTEMBER 30, 2023 | | $ | 1,362 | | $ | 4,241,523 | | $ | (926,577) | | $ | (1,103,976) | | $ | 2,212,332 | | $ | 171,379 | | $ | 2,383,711 |
See accompanying Notes to Consolidated Financial Statements.
AECOM
AECOM
Consolidated Statements of Cash Flows
(in thousands)
| | | | | | | | | | |
| | Fiscal Year Ended | |
|---|
| | September 30,
2017 | | September 30,
2016 | | September 30,
2015 | |
|---|
CASH FLOWS FROM OPERATING ACTIVITIES: | | | | | | | | | | |
Net income (loss) | | $ | 421,476 | | $ | 163,472 | | $ | (71,233 | ) |
Adjustments to reconcile net income (loss) to net cash provided by operating activities: | | | | | | | | | | |
Depreciation and amortization | | | 278,631 | | | 398,730 | | | 599,265 | |
Equity in earnings of unconsolidated joint ventures | | | (141,582 | ) | | (104,032 | ) | | (106,245 | ) |
Distribution of earnings from unconsolidated joint ventures | | | 137,031 | | | 149,215 | | | 157,616 | |
Non-cash stock compensation | | | 83,774 | | | 73,406 | | | 85,852 | |
Prepayment penalty on unsecured senior notes | | | — | | | — | | | 55,639 | |
Excess tax benefit from share-based payment | | | — | | | — | | | (3,642 | ) |
Foreign currency translation | | | 6,007 | | | (25,494 | ) | | (19,632 | ) |
Write-off of debt issuance costs | | | — | | | 7,749 | | | 8,997 | |
Deferred income tax benefit | | | (49,856 | ) | | (110,122 | ) | | (53,034 | ) |
Pension curtailment and settlement gains | | | — | | | (7,818 | ) | | — | |
(Gain) loss on disposal activities | | | (572 | ) | | 42,589 | | | — | |
Other | | | (15,062 | ) | | 2,430 | | | (18,248 | ) |
Changes in operating assets and liabilities, net of effects of acquisitions: | | | | | | | | | | |
Accounts receivable | | | (432,769 | ) | | 337,291 | | | 369,600 | |
Prepaid expenses and other assets | | | (21,780 | ) | | (16,257 | ) | | 7,988 | |
Accounts payable | | | 292,496 | | | 16,616 | | | 142,126 | |
Accrued expenses and other current liabilities | | | (53,126 | ) | | (154,096 | ) | | (118,488 | ) |
Billings in excess of costs on uncompleted contracts | | | 234,116 | | | (22,949 | ) | | (128,371 | ) |
Other long-term liabilities | | | (68,714 | ) | | 53,411 | | | (143,757 | ) |
Income taxes payable | | | 26,584 | | | 10,014 | | | — | |
| | | | | | | | | | | |
Net cash provided by operating activities | | | 696,654 | | | 814,155 | | | 764,433 | |
| | | | | | | | | | | |
CASH FLOWS FROM INVESTING ACTIVITIES: | | | | | | | | | | |
Payments for business acquisitions, net of cash acquired | | | (103,075 | ) | | (5,534 | ) | | (3,293,284 | ) |
Proceeds from disposal of businesses, net of cash disposed | | | 2,200 | | | 39,699 | | | 15,127 | |
Investment in unconsolidated joint ventures | | | (59,684 | ) | | (76,707 | ) | | (44,761 | ) |
Return of investment in unconsolidated joint ventures | | | 35,407 | | | 5,160 | | | 12,056 | |
Proceeds from sales of investments | | | 900 | | | 11,745 | | | 126,370 | |
Payments for purchase of investments | | | — | | | (214 | ) | | (91,810 | ) |
Proceeds from disposal of property and equipment | | | 7,895 | | | 54,622 | | | 44,906 | |
Payments for capital expenditures | | | (86,354 | ) | | (191,386 | ) | | (114,332 | ) |
| | | | | | | | | | | |
Net cash used in investing activities | | | (202,711 | ) | | (162,615 | ) | | (3,345,728 | ) |
| | | | | | | | | | | |
CASH FLOWS FROM FINANCING ACTIVITIES: | | | | | | | | | | |
Proceeds from borrowings under credit agreements | | | 5,953,249 | | | 4,706,225 | | | 6,581,703 | |
Repayments of borrowings under credit agreements | | | (7,071,602 | ) | | (5,199,961 | ) | | (5,158,254 | ) |
Proceeds from issuance of unsecured senior notes | | | 1,000,000 | | | — | | | 1,600,000 | |
Redemption of unsecured senior notes | | | (179,208 | ) | | — | | | — | |
Prepayment penalty on unsecured senior notes | | | — | | | — | | | (55,639 | ) |
Cash paid for debt and equity issuance costs | | | (13,041 | ) | | (10,447 | ) | | (89,567 | ) |
Proceeds from issuance of common stock | | | 30,093 | | | 28,192 | | | 25,561 | |
Proceeds from exercise of stock options | | | 4,878 | | | 9,946 | | | 11,073 | |
Payments to repurchase common stock | | | (25,078 | ) | | (25,892 | ) | | (23,113 | ) |
Excess tax benefit from share-based payment | | | — | | | — | | | 3,642 | |
Net distributions to noncontrolling interests | | | (59,036 | ) | | (103,169 | ) | | (144,269 | ) |
Other financing activities | | | (26,745 | ) | | (42,873 | ) | | (31,373 | ) |
| | | | | | | | | | | |
Net cash (used in) provided by financing activities | | | (386,490 | ) | | (637,979 | ) | | 2,719,764 | |
| | | | | | | | | | | |
EFFECT OF EXCHANGE RATE CHANGES ON CASH | | | 2,764 | | | (5,309 | ) | | (28,764 | ) |
NET INCREASE IN CASH AND CASH EQUIVALENTS | | | 110,217 | | | 8,252 | | | 109,705 | |
CASH AND CASH EQUIVALENTS AT BEGINNING OF YEAR | | | 692,145 | | | 683,893 | | | 574,188 | |
| | | | | | | | | | | |
CASH AND CASH EQUIVALENTS AT END OF YEAR | | $ | 802,362 | | $ | 692,145 | | $ | 683,893 | |
| | | | | | | | | | | |
| | | | | | | | | | | |
| | | | | | | | | | | |
SUPPLEMENTAL CASH FLOW INFORMATION: | | | | | | | | | | |
Common stock issued in acquisitions | | $ | 36,611 | | $ | — | | $ | 1,554,912 | |
| | | | | | | | | | | |
| | | | | | | | | | | |
| | | | | | | | | | | |
Debt assumed from acquisitions | | $ | 31,353 | | $ | 1,805 | | $ | 567,657 | |
| | | | | | | | | | | |
| | | | | | | | | | | |
| | | | | | | | | | | |
Interest paid | | $ | 226,090 | | $ | 216,125 | | $ | 179,939 | |
| | | | | | | | | | | |
| | | | | | | | | | | |
| | | | | | | | | | | |
Net income (taxes paid) tax refunds received | | $ | (11,540 | ) | $ | (13,109 | ) | $ | 27,349 | |
| | | | | | | | | | | |
| | | | | | | | | | | |
| | | | | | | | | | | |
| | | | | | | | | |
| | Fiscal Year Ended |
| | September 30, | | September 30, | | September 30, |
| | 2023 | | 2022 | | 2021 |
CASH FLOWS FROM OPERATING ACTIVITIES: | | | | | | | | | |
Net income | | $ | 100,141 | | $ | 334,702 | | $ | 202,980 |
Adjustments to reconcile net income to net cash provided by operating activities: | | | | | | | | | |
Depreciation and amortization | | | 175,725 | | | 170,886 | | | 176,400 |
Equity in losses (earnings) of unconsolidated joint ventures | | | 282,291 | | | (46,303) | | | (39,104) |
Distribution of earnings from unconsolidated joint ventures | | | 41,178 | | | 27,175 | | | 46,358 |
Non-cash stock compensation | | | 45,882 | | | 38,471 | | | 44,742 |
Prepayment premium on redemption of unsecured senior notes | | | — | | | — | | | 117,500 |
Impairment of long-lived assets | | | 86,199 | | | — | | | 105,194 |
Loss on sale of discontinued operations | | | 43,222 | | | 48,095 | | | 52,532 |
Foreign currency translation | | | 969 | | | (31,529) | | | (42,728) |
Deferred income tax (benefit) expense | | | (135,878) | | | 22,821 | | | (48,265) |
Other | | | 6,388 | | | 15,295 | | | 16,063 |
Changes in operating assets and liabilities: | | | | | | | | | |
Accounts receivable and contract assets | | | (402,498) | | | 236,605 | | | 533,006 |
Prepaid expenses and other assets | | | 131,903 | | | 132,003 | | | (100,526) |
Accounts payable | | | 169,514 | | | (102,873) | | | (250,142) |
Accrued expenses and other current liabilities | | | 97,239 | | | 48,019 | | | (84,073) |
Contract liabilities | | | 137,484 | | | (7,434) | | | 103,999 |
Other long-term liabilities | | | (83,779) | | | (172,297) | | | (129,266) |
Net cash provided by operating activities | | $ | 695,980 | | $ | 713,636 | | $ | 704,670 |
| | | | | | | | | |
CASH FLOWS FROM INVESTING ACTIVITIES: | | | | | | | | | |
Payments for sale of discontinued operations, net of cash disposed | | $ | — | | $ | (42,261) | | $ | (265,876) |
Investment in unconsolidated joint ventures | | | (59,772) | | | (26,672) | | | (57,388) |
Return of investment in unconsolidated joint ventures | | | 20,874 | | | 11,723 | | | 8,110 |
Proceeds from sale of investments | | | 5,977 | | | 10,242 | | | 15,507 |
Proceeds from disposal of property and equipment | | | 344 | | | 8,951 | | | 14,822 |
Payments for capital expenditures | | | (105,600) | | | (137,017) | | | (136,262) |
Net cash used in by investing activities | | $ | (138,177) | | $ | (175,034) | | $ | (421,087) |
| | | | | | | | | |
CASH FLOWS FROM FINANCING ACTIVITIES: | | | | | | | | | |
Proceeds from borrowings under credit agreements | | $ | 3,506,668 | | $ | 3,618,585 | | $ | 3,638,916 |
Repayments of borrowings under credit agreements | | | (3,552,639) | | | (3,657,308) | | | (2,726,347) |
Redemption of unsecured senior notes | | | — | | | — | | | (797,252) |
Prepayment premium on redemption of unsecured senior notes | | | — | | | — | | | (117,500) |
Cash paid for debt issuance costs | | | — | | | (155) | | | (11,280) |
Dividends paid | | | (96,192) | | | (63,288) | | | — |
Proceeds from issuance of common stock | | | 32,897 | | | 26,666 | | | 25,686 |
Proceeds from exercise of stock options | | | 6,168 | | | — | | | 4,038 |
Payments to repurchase common stock | | | (379,284) | | | (472,970) | | | (867,091) |
Net distributions to noncontrolling interests | | | (2,223) | | | (12,395) | | | (10,274) |
Other financing activities | | | 11,670 | | | (27,450) | | | (11,429) |
Net cash used in financing activities | | $ | (472,935) | | $ | (588,315) | | $ | (872,533) |
| | | | | | | | | |
EFFECT OF EXCHANGE RATE CHANGES ON CASH | | | 512 | | | (8,307) | | | 5,493 |
NET INCREASE (DECREASE) IN CASH AND CASH EQUIVALENTS | | | 85,380 | | | (58,020) | | | (583,457) |
CASH AND CASH EQUIVALENTS AT BEGINNING OF YEAR | | | 1,176,772 | | | 1,234,792 | | | 1,818,249 |
CASH AND CASH EQUIVALENTS AT END OF YEAR | | | 1,262,152 | | | 1,176,772 | | | 1,234,792 |
LESS: CASH AND CASH EQUIVALENTS INCLUDED IN CURRENT ASSETS HELD FOR SALE | | $ | (1,946) | | $ | (4,563) | | $ | (5,596) |
CASH AND CASH EQUIVALENTS OF CONTINUING OPERATIONS AT END OF YEAR | | $ | 1,260,206 | | $ | 1,172,209 | | $ | 1,229,196 |
SUPPLEMENTAL CASH FLOW INFORMATION: | | | | | | | | | |
Interest paid | | $ | (153,975) | | $ | (104,644) | | $ | (255,679) |
Net income taxes paid | | $ | (78,448) | | $ | (104,742) | | $ | (114,464) |
See accompanying Notes to Consolidated Financial Statements.
AECOM
AECOM
NOTES TO CONSOLIDATED FINANCIAL STATEMENTS
1. Significant Accounting Policies
Organization—AECOM and its consolidated subsidiaries design, build, finance and operate infrastructure assets for governments, businesses and organizations around the world. The Company providesprovide planning, consulting, architectural and engineering design services to commercialpublic and governmentprivate clients worldwide in major end markets such as transportation, facilities, environmental, energy, water and government. The Company also provides construction services, including building construction and energy, infrastructure and industrial construction, primarily in the Americas. In addition, the Company provides program and facilities management and maintenance, training, logistics, consulting, technical assistance, and systems integration and information technology services, primarily for agencies of the U.S. government and also for national governments around the world.
Fiscal Year—The Company reports results of operations based on 52 or52-or 53-week periods ending on the Friday nearest September 30. For clarity of presentation, all periods are presented as if the year ended on September 30. Fiscal years 2017, 20162023, 2022 and 20152021 each contained 52, 52 and 52 weeks, respectively, and ended on September 29, September 30, and October 2,1, respectively. Certain prior period amounts in the consolidated financial statements and accompanying notes have been reclassified to conform with the current period’s presentation.
Use of Estimates—The preparation of financial statements in conformity with accounting principles generally accepted in the United States (GAAP) requires management to make estimates and assumptions that affect the reported amounts of assets and liabilities and disclosure of contingent assets and liabilities at the date of the financial statements and the reported amounts of revenues and expenses during the reporting period. The more significant estimates affecting amounts reported in the consolidated financial statements relate to revenues under long-term contracts and self-insurance accruals. Actual results could differ from those estimates.
Principles of Consolidation and Presentation—The consolidated financial statements include the accounts of all majority-owned subsidiaries and joint ventures in which the Company is the primary beneficiary. All inter-company accounts have been eliminated in consolidation. Also see Note 6 regarding joint ventures and variable interest entities.
Revenue Recognition—The Company generally utilizes a cost-to-cost approach in applying the percentage-of-completion method of revenue recognition. Under this approach, revenue is earned in proportion to total costs incurred, divided by total costs expected to be incurred. Recognition of revenue and profit is dependent upon a number of factors, including the accuracy of a variety of estimates made at the balance sheet date, engineering progress, material quantities, the achievement of milestones, penalty provisions, labor productivity and cost estimates made at the balance sheet date. Due to uncertainties inherent in the estimation process, actual completion costs may vary from estimates. If estimated total costs on contracts indicate a loss, the Company recognizes that estimated loss within cost of revenues in the period the estimated loss first becomes known. Liabilities recorded related to accrued contract losses were not material as of September 30, 2017 and 2016.
In the course of providing its services, the Company routinely subcontracts for services and incurs other direct costs on behalf of its clients. These costs are passed through to clients and, in accordance with industry practice and GAAP, are included in the Company's revenue and cost of revenue. Because subcontractor services and other direct costs can change significantly from project to project and period to period, changes in revenue may not be indicative of business trends. These subcontractor and other direct costs for the years ended September 30, 2017, 2016 and 2015 were $9.2 billion, $8.4 billion and $8.3 billion, respectively.
Table of Contents
AECOM
NOTES TO CONSOLIDATED FINANCIAL STATEMENTS (Continued)
1. Significant Accounting Policies (Continued)
Cost-reimbursable contracts consists of two similar contract types: (1) cost-plus contracts and (2) time-and-materials price contracts.
Cost-Plus Contracts. The Company enters into two major types of cost-plus contracts:
Cost-Plus Fixed Fee. Under cost-plus fixed fee contracts, the Company charges clients for its costs, including both direct and indirect costs, plus a fixed negotiated fee. The total estimated cost plus the fixed negotiated fee represents the total contract value. The Company recognizes revenue based on the actual labor and other direct costs incurred, plus the portion of the fixed fee it has earned to date.
Cost-Plus Fixed Rate. Under the Company's cost-plus fixed rate contracts, the Company charges clients for its direct and indirect costs based upon a negotiated rate. The Company recognizes revenue based on the actual total costs it has expended and the applicable fixed rate.
Certain cost-plus contracts provide for award fees or a penalty based on performance criteria in lieu of a fixed fee or fixed rate. Other contracts include a base fee component plus a performance-based award fee. In addition, the Company may share award fees with subcontractors. The Company records accruals for fee-sharing as fees are earned. The Company generally recognizes revenue to the extent of costs actually incurred plus a proportionate amount of the fee expected to be earned. The Company takes the award fee or penalty on contracts into consideration when estimating revenue and profit rates, and it records revenue related to the award fees when there is sufficient information to assess anticipated contract performance. On contracts that represent higher than normal risk or technical difficulty, the Company may defer all award fees until an award fee letter is received. Once an award fee letter is received, the estimated or accrued fees are adjusted to the actual award amount.
Certain cost-plus contracts provide for incentive fees based on performance against contractual milestones. The amount of the incentive fees varies, depending on whether the Company achieves above, at, or below target results. The Company originally recognizes revenue on these contracts based upon expected results. These estimates are revised when necessary based upon additional information that becomes available as the contract progresses.
Time-and-Materials Price Contracts. Under time-and-materials contracts, the Company negotiates hourly billing rates and charges its clients based on the actual time that it expends on a project. In addition, clients reimburse the Company for its actual out-of-pocket costs of materials and other direct incidental expenditures that it incurs in connection with its performance under the contract. Profit margins on time-and-materials contracts fluctuate based on actual labor and overhead costs that it directly charges or allocates to contracts compared to negotiated billing rates. Many of the Company's time-and-materials contracts are subject to maximum contract values and, accordingly, revenue relating to these contracts is recognized as if these contracts were a fixed-price contract.
Guaranteed Maximum Price. Guaranteed maximum price contracts (GMP) are common for design-build and commercial and residential projects. GMP contracts share many of the same contract provisions as cost-plus and fixed-price contracts. A contractor performing work pursuant to a cost-plus, GMP or
Table of Contents
AECOM
NOTES TO CONSOLIDATED FINANCIAL STATEMENTS (Continued)
1. Significant Accounting Policies (Continued)
fixed-price contract will all enter into trade contracts directly. Both cost-plus and GMP contracts generally include an agreed lump sum or percentage fee which is called out and separately identified and the contracts are considered 'open' book providing the owner with full disclosure of the project costs. A fixed-price contract provides the owner with a single lump sum amount without specifically identifying the breakdown of fee or costs and is typically 'closed' book thereby providing the owner with little detail as to the project costs. In a GMP contract, unlike the cost-plus contract, the Company provides the owner with a guaranteed price for the overall construction (adjusted for change orders issued by the owner) and with a schedule which includes a completion date for the project. In addition, cost overruns in a GMP contract would generally be the Company's responsibility and in the event the Company's actions or inactions result in delays to the project, the Company may be responsible to the owner for costs associated with such delay. For many of the Company's commercial and residential GMP contracts, the final price is generally not established until the Company have awarded a substantial percentage of the trade contracts and it has negotiated additional contractual limitations, such as mutual waivers of consequential damages as well as aggregate caps on liabilities and liquidated damages.
Fixed-Price. Fixed-price contracting is the predominant contracting method outside of the United States. There are typically two types of fixed-price contracts. The first and more common type, lump-sum, involves performing all of the work under the contract for a specified lump-sum fee. Lump-sum contracts are typically subject to price adjustments if the scope of the project changes or unforeseen conditions arise. The second type, fixed-unit price, involves performing an estimated number of units of work at an agreed price per unit, with the total payment under the contract determined by the actual number of units delivered. The Company recognizes revenue on fixed-price contracts using the percentage-of-completion method described above. Prior to completion, recognized profit margins on any fixed-price contract depend on the accuracy of the Company's estimates and will increase to the extent that its actual costs are below the estimated amounts. Conversely, if the Company's costs exceed these estimates, its profit margins will decrease and the Company may realize a loss on a project. The Company recognizes anticipated losses on contracts in the period in which they become evident.
During the years ended September 30, 2017, 2016 and 2015, the types of contracts comprising the Company's revenue were as follows:
| | | | | | | | | | |
| | Fiscal Year Ended | |
|---|
| | September 30,
2017 | | September 30,
2016 | | September 30,
2015 | |
|---|
Cost reimbursable | | | 48 | % | | 53 | % | | 57 | % |
Guaranteed maximum price | | | 23 | % | | 15 | % | | 15 | % |
Fixed price | | | 29 | % | | 32 | % | | 28 | % |
Cost reimbursable contracts include cost-plus and time-and-materials price contracts.
Contract Claims—Claims are amounts in excess of the agreed contract price (or amounts not included in the original contract price) that the Company seeks to collect from customers or others for delays, errors in specifications and designs, contract terminations, change orders in dispute or unapproved as to both scope and price or other causes of unanticipated additional costs. The Company records contract revenue related to claims only if it is probable that the claim will result in additional contract revenue and if the
Table of Contents
AECOM
NOTES TO CONSOLIDATED FINANCIAL STATEMENTS (Continued)
1. Significant Accounting Policies (Continued)
amount can be reliably estimated. In such cases, the Company records revenue only to the extent that contract costs relating to the claim have been incurred. As of September 30, 2017 and 2016, aggregate receivables related to contract claims were not significant to the overall receivable position of the Company and represented less than 5% of net receivables.
Government Contract Matters—The Company'sCompany’s federal government and certain state and local agency contracts are subject to, among other regulations, regulations issued under the Federal Acquisition Regulations (FAR). These regulations can limit the recovery of certain specified indirect costs on contracts and subjects the Company to ongoing multiple audits by government agencies such as the Defense Contract Audit Agency (DCAA). In addition, most of the Company'sCompany’s federal and state and local contracts are subject to termination at the discretion of the client.
Audits by the DCAA and other agencies consist of reviews of the Company'sCompany’s overhead rates, operating systems and cost proposals to ensure that the Company accounted for such costs in accordance with the Cost Accounting Standards of the FAR (CAS). If the DCAA determines the Company has not accounted for such costs consistent with CAS, the DCAA may disallow these costs. There can be no assurance that audits by the DCAA or other governmental agencies will not result in material cost disallowances in the future.
Cash and Cash Equivalents—The Company'sCompany’s cash equivalents include highly liquid investments which have an initial maturity of three months or less.
Allowance for Doubtful Accounts—The Company records its accounts receivable net of an allowance for doubtful accounts. This allowance for doubtful accounts is estimated based on management'smanagement’s evaluation of the contracts involved and the financial condition of its clients. The factors the Company considers in its contract evaluations include, but are not limited to:
•Client type—federal or state and local government or commercial client;
•Historical contract performance;
•Historical collection and delinquency trends;
•Client credit worthiness; and
•General economic conditions.
| ● | Client type—federal or state and local government or commercial client; |
| ● | Historical contract performance; |
| ● | Historical collection and delinquency trends; |
| ● | Client credit worthiness; and |
| ● | General economic conditions. |
Derivative Financial Instruments—The Company accounts for its derivative instruments as either assets or liabilities and carries them at fair value.
For derivative instruments that hedge the exposure to variability in expected future cash flows that are designated as cash flow hedges, the effective portion of the gain or loss on the derivative instrument is reported as a component of accumulated other comprehensive income in stockholders'stockholders’ equity and reclassified into income in the same period or periods during which the hedged transaction affects earnings. The ineffective portion of the gain or loss on the derivative instrument, if any, is recognized in current income. To receive hedge accounting treatment, cash flow hedges must be highly effective in offsetting changes to expected future cash flows on hedged transactions.
The net gain or loss on the effective portion of a derivative instrument that is designated as an economic hedge of the foreign currency translation exposure generated by the re-measurement of certain
Table of Contents
AECOM
NOTES TO CONSOLIDATED FINANCIAL STATEMENTS (Continued)
1. Significant Accounting Policies (Continued)
assets and liabilities denominated in a non-functional currency in a foreign operation is reported in the same manner as a foreign currency translation adjustment. Accordingly, any gains or losses related to these derivative instruments are recognized in current income.
Derivatives that do not qualify as hedges are adjusted to fair value through current income.
Fair Value of Financial Instruments—The Company determines the fair values of its financial instruments, including short-term investments, debt instruments and derivative instruments, and pension and post-retirement plan assets based on inputs or assumptions that market participants would use in pricing an asset or a liability. The Company categorizes its instruments using a valuation hierarchy for disclosure of the inputs used to measure fair value. This hierarchy prioritizes the inputs into three broad levels as follows: Level 1 inputs are quoted prices (unadjusted) in active markets for identical assets or liabilities; Level 2 inputs are quoted prices for similar assets and liabilities in active markets or inputs that are observable for the asset or liability, either directly or indirectly through market corroboration, for substantially the full term of the financial instrument; Level 3 inputs are unobservable inputs based on the Company'sCompany’s assumptions used to measure assets and liabilities at fair value. The classification of a financial asset or liability within the hierarchy is determined based on the lowest level input that is significant to the fair value measurement.
The carrying amounts of cash and cash equivalents, accounts receivable and accounts payable approximate fair value because of the short maturities of these instruments. The carrying amount of the revolving credit facility approximates fair value because the interest rates are based upon variable reference rates.
The Company'sCompany’s fair value measurement methods may produce a fair value calculation that may not be indicative of net realizable value or reflective of future fair values. Although the Company believes its valuation methods are appropriate and consistent with those used by other market participants, the use of different methodologies or assumptions to determine fair value could result in a different fair value measurement at the reporting date.
Property and Equipment—Property and equipment are recorded at cost and are depreciated over their estimated useful lives using the straight-line method. Expenditures for maintenance and repairs are expensed as incurred. Typically, estimated useful lives range from ten to forty-five years for buildings, three to ten years for furniture and fixtures and three to twelve years for computer systems and equipment. Leasehold improvements are amortized on a straight-line basis over the shorter of their estimated useful lives or the remaining terms of the underlying lease agreement.
Long-livedLong-Lived Assets—Long-lived assets to be held and used are reviewed for impairment whenever events or circumstances indicate that the assets may not be recoverable. The carrying amount of an asset to be held and used is not recoverable if it exceeds the sum of the undiscounted cash flows expected from the use and eventual disposition of the asset. For assets to be held and used, impairment losses are recognized based upon the excess of the asset'sasset’s carrying amount over the fair value of the asset. For long-lived assets to be disposed, impairment losses are recognized at the lower of the carrying amount or fair value less cost to sell.
Goodwill and Acquired Intangible Assets—Goodwill represents the excess of amounts paid over the fair value of net assets acquired from an acquisition. In order to determine the amount of goodwill resulting from an acquisition, the Company performs an assessment to determine the value of the acquired
Table of Contents
AECOM
NOTES TO CONSOLIDATED FINANCIAL STATEMENTS (Continued)
1. Significant Accounting Policies (Continued)
company's company’s tangible and identifiable intangible assets and liabilities. In its assessment, the Company determines whether identifiable intangible assets exist, which typically include backlog and customer relationships. Intangible assets are amortized over the period in which the contractual or economic benefits of the intangible assets are expected to be realized.
The Company tests goodwill for impairment annually for each reporting unit in the fourth quarter of the fiscal year and between annual tests, if events occur or circumstances change which suggest that goodwill should be evaluated. Such events or circumstances include significant changes in legal factors and business climate, recent losses at a reporting unit, and industry trends, among other factors. A reporting unit is defined as an operating segment or one level below an operating segment. The Company'sCompany’s impairment tests are performed at the operating segment level as they represent the Company'sCompany’s reporting units.
TheGoodwill is evaluated for impairment testeither by assessing qualitative factors or by performing a quantitative assessment. Qualitative factors, such as overall financial performance, industry or market considerations, or other relevant events, are assessed to determine if it is more likely than not that the fair value of the reporting units is less than their carrying amounts. During a two-step process. During the first step,quantitative impairment test, the Company estimates the fair value of the reporting unit using income and market approaches, and compares that amount to the carrying value of that reporting unit. In the event the fair value of the reporting unit is determined to be less than the carrying value, a second stepgoodwill is required. The second step requires the Company to perform a hypothetical purchase allocation for that reporting unitimpaired, and to compare the resulting current implied fair value of the goodwillan impairment loss is recognized equal to the current carrying valueexcess, limited to the total amount of the goodwill for thatallocated to the reporting unit. In the event that the current implied fair value of the goodwill is less than the carrying value, an impairment charge is recognized. See also Note 3.
Pension Plans—The Company has certain defined benefit pension plans. The Company calculates the market-related value of assets, which is used to determine the return-on-assets component of annual pension expense and the cumulative net unrecognized gain or loss subject to amortization. This calculation reflects the Company'sCompany’s anticipated long-term rate of return and amortization of the difference between the actual return (including capital, dividends, and interest) and the expected return over a five-year period. Cumulative net unrecognized gains or losses that exceed 10% of the greater of the projected benefit obligation or the fair market related value of plan assets are subject to amortization.
Insurance Reserves—The Company maintains insurance for certain insurable business risks. Insurance coverage contains various retention and deductible amounts for which the Company accrues a liability based upon reported claims and an actuarially determined estimated liability for certain claims incurred but not reported. It is generally the Company'sCompany’s policy not to accrue for any potential legal expense to be incurred in defending the Company'sCompany’s position. The Company believes that its accruals for estimated liabilities associated with professional and other liabilities are sufficient and any excess liability beyond the accrual is not expected to have a material adverse effect on the Company'sCompany’s results of operations or financial position.
Foreign Currency Translation—The Company'sCompany’s functional currency is generally the U.S. dollar, except for foreign operations where the functional currency is generally the local currency. Results of operations for foreign entities are translated to U.S. dollars using the average exchange rates during the period. Assets and liabilities for foreign entities are translated using the exchange rates in effect as of the date of the balance sheet. Resulting translation adjustments are recorded as a foreign currency translation adjustment into other accumulated comprehensive income/(loss) in stockholders'stockholders’ equity.
The Company uses foreign currency forward contracts from time to time to mitigate foreign currency risk. The Company limits exposure to foreign currency fluctuations in most of its contracts through
Table of Contents
AECOM
NOTES TO CONSOLIDATED FINANCIAL STATEMENTS (Continued)
1. Significant Accounting Policies (Continued)
provisions that require client payments in currencies corresponding to the currency in which costs are incurred. As a result of this natural hedge, the Company generally does not need to hedge foreign currency cash flows for contract work performed.
Noncontrolling Interests—Noncontrolling interests represent the equity investments of the minority owners in the Company'sCompany’s joint ventures and other subsidiary entities that the Company consolidates in its financial statements.
Income Taxes—The Company files a consolidated U.S. federal corporate income tax return and combined / consolidated state tax returns and separate company state tax returns. The Company accounts for certain income and expense items differently for financial reporting and income tax purposes. Deferred tax assets and liabilities are determined based on the difference between the financial statement and tax basis of assets and liabilities, applying enacted statutory tax rates in effect for the year in which the differences are expected to reverse. In determining the need for a valuation allowance, management reviews both positive and negative evidence, including the nature, frequency, and severity of cumulative financial reporting losses in recent years, the future reversal of existing temporary differences, predictability of future taxable income exclusive of reversing temporary differences of the character necessary to realize the asset, relevant carryforward periods, taxable income in carry-back years if carry-back is permitted under tax law, and prudent and feasible tax planning strategies that would be implemented, if necessary, to protect against the loss of the deferred tax asset that would otherwise expire. Based upon management'smanagement’s assessment of all available evidence, the Company has concluded that it is more likely than not that the deferred tax assets, net of valuation allowance, will be realized.
On December 22, 2017, the United States enacted the Tax Cuts and Jobs Act, which significantly changed U.S. tax law and included a provision to tax global intangible low-taxed income (GILTI) of foreign subsidiaries. The Company recognizes taxes due under the GILTI provision as a current period expense.
2. New Accounting Pronouncements and Changes in Accounting
In May 2014,December 2019, the Financial Accounting Standards Board (FASB) issued new accounting guidance which amendedsimplifies the existing accounting standards for revenue recognition.income taxes. The guidance amends certain exceptions to the general principles of Accounting Standards Codification (ASC) 740, Income Taxes, and simplifies several areas such as accounting for a franchise tax or similar tax that is partially based on income. The Company adopted the new guidance starting on October 1, 2021. The adoption of the new guidance did not have a significant impact on the Company’s consolidated financial statements.
In October 2021, the FASB issued final guidance to companies that apply ASC 606, Revenue from Contracts with Customers, to recognize and measure contract assets and contract liabilities from contracts with customers acquired in a business combination. The new accounting guidance establishescreates an exception to the general requirement to measure acquired assets and liabilities at fair value on the acquisition date. Under this exception, an acquirer applies ASC 606 to recognize and measure contract assets and contract liabilities on the acquisition date. The Company adopted the new guidance starting on October 1, 2022 on a prospective basis and the revised guidance will be applied to any business combinations the Company undertakes.
3. Discontinued Operations, Goodwill, and Intangible Assets
In the first quarter of fiscal 2020, management approved a plan to dispose of via sale the Company’s self-perform at-risk construction businesses. These businesses include the Company’s civil infrastructure, power, and oil and gas construction businesses that were previously reported in the Company’s Construction Services segment. After consideration of the relevant facts, the Company concluded the assets and liabilities of its self-perform at-risk construction businesses met the criteria for classification as held for sale. The Company concluded the actual and proposed disposal activities represented a strategic shift that would have a major effect on the Company’s operations and financial results and qualified for presentation as discontinued operations in accordance with FASB ASC 205-20. Accordingly, the financial results of the self-perform at-risk construction businesses are presented in the Consolidated Statement of Operations as discontinued operations for all periods presented. Current and non-current assets and liabilities of these businesses not sold as of the balance sheet date are presented in the Consolidated Balance Sheets as assets and liabilities held for sale for both periods presented.
The Company completed the sale of its civil infrastructure construction business to affiliates of Oroco Capital in the second quarter of fiscal 2021. In the first quarter of fiscal 2022, the Company recorded an additional $40.0 million loss primarily related to revisions of estimates for its working capital obligation to be paid and a contingent consideration receivable. In the second quarter of fiscal 2023, the Company recorded a $38.9 million loss related to a revised estimate of its contingent consideration receivable recognized at the sale. Under the terms of the sale agreement, the Company made the required cash payments and delivered the cash and cash equivalents, including cash in consolidated joint ventures, on the balance sheet at closing. As a result, the Company recorded the net cash impact of the sale as a use of cash in the investing section of its statement of cash flows.
On January 28, 2022, the Company completed the sale of its oil and gas construction business to affiliates of Graham Maintenance Services LP for a purchase price of $14 million, subject to cash, debt and working capital adjustments. The Company recorded a pre-tax gain of approximately $3.0 million on the sale, net of transaction costs. During the third quarter of fiscal 2023, the Company collected approximately $9.2 million cash payment for contingent consideration completing this transaction.
The following table represents summarized balance sheet information of assets and liabilities held for sale (in millions):
| | | | | | |
| | September 30, | | September 30, |
| | 2023 | | 2022 |
| | | | | | |
Cash and cash equivalents | | $ | 1.9 | | $ | 4.6 |
Receivables and contract assets | | | 93.3 | | | 66.2 |
Other | | | — | | | 8.2 |
Current assets held for sale | | $ | 95.2 | | $ | 79.0 |
| | | | | | |
Property and equipment, net | | $ | 14.2 | | $ | 8.0 |
Write-down of assets to fair value less cost to sell | | | (14.2) | | | (8.0) |
Non-current assets held for sale | | $ | — | | $ | — |
| | | | | | |
Accounts payable and accrued expenses | | $ | 45.6 | | $ | 49.2 |
Current liabilities held for sale | | $ | 45.6 | | $ | 49.2 |
| | | | | | |
Long-term liabilities held for sale | | $ | 0.8 | | $ | 0.2 |
The following table represents summarized income statement information of discontinued operations (in millions):
| | | | | | | | | |
| | Fiscal Year Ended |
| | September 30, | | September 30, | | September 30, |
| | 2023 | | 2022 | | 2021 |
| | | | | | | | | |
Revenue | | $ | 212.8 | | $ | 347.4 | | $ | 771.5 |
Cost of revenue | | | 223.2 | | | 360.2 | | | 760.5 |
Gross (loss) profit | | | (10.4) | | | (12.8) | | | 11.0 |
Equity in earnings of joint ventures | | | (2.9) | | | (7.4) | | | 4.0 |
Loss on disposal activities | | | (50.6) | | | (48.1) | | | (52.5) |
Transaction costs | | | (0.2) | | | (9.7) | | | (15.3) |
Impairment of long-lived assets | | | — | | | — | | | (105.2) |
Loss from operations | | | (64.1) | | | (78.0) | | | (158.0) |
Other loss | | | (1.0) | | | — | | | — |
Interest expense | | | — | | | (0.1) | | | (0.5) |
Loss before taxes | | | (65.1) | | | (78.1) | | | (158.5) |
Income tax (benefit) expense | | | (7.9) | | | 1.8 | | | (41.7) |
Net loss from discontinued operations | | $ | (57.2) | | $ | (79.9) | | $ | (116.8) |
The significant components included in the Consolidated Statement of Cash Flows for the discontinued operations are as follows (in millions):
| | | | | | | | | |
| | Fiscal Year Ended |
| | September 30, | | September 30, | | September 30, |
| | 2023 | | 2022 | | 2021 |
| | | | | | | | | |
Payments for capital expenditures | | $ | (6.2) | | $ | (2.7) | | $ | (7.3) |
The changes in the carrying value of goodwill by reportable segment for the year ended September 30, 2023 were as follows:
| | | | | | | | | |
| | | | | Foreign | | | |
| | September 30, | | Exchange | | September 30, |
| | 2022 | | Impact | | 2023 |
|
| | (in millions) |
Americas | | $ | 2,610.7 | | $ | 3.3 | | $ | 2,614.0 |
International | | | 770.1 | | | 34.8 | | | 804.9 |
Total | | $ | 3,380.8 | | $ | 38.1 | | $ | 3,418.9 |
The gross amounts and accumulated amortization of the Company’s acquired identifiable intangible assets with finite useful lives as of September 30, 2023 and 2022, included in intangible assets—net, in the accompanying consolidated balance sheets, were as follows:
| | | | | | | | | | | | | | | | | | | | |
| | September 30, 2023 | | September 30, 2022 | | |
| | Gross | | Accumulated | | Intangible | | Gross | | Accumulated | | Intangible | | Amortization |
| | Amount | | Amortization | | Assets, Net | | Amount | | Amortization | | Assets, Net | | Period |
|
| | (in millions) | | (years) |
Customer relationships | | $ | 663.8 | | $ | (646.0) | | $ | 17.8 | | $ | 663.0 | | $ | (627.4) | | $ | 35.6 | | 1 - 11 |
Amortization expense of acquired intangible assets included within cost of revenue was $18.6 million and $18.9 million for the years ended September 30, 2023 and 2022, respectively. The following table presents estimated amortization expense of existing intangible assets for the succeeding years:
| | | |
Fiscal Year | | (in millions) |
2024 | | $ | 17.1 |
2025 | | | 0.7 |
Total | | $ | 17.8 |
4. Revenue Recognition
The Company follows accounting principles for recognizing revenue upon the transfer of control of promised goods or services to customers, in an amount that reflects the expected consideration received in exchange for those goods or services. The amendmentsCompany generally recognizes revenues over time as performance obligations are satisfied. The Company generally measures its progress to completion using an input measure of total costs incurred divided by total costs expected to be incurred, which it believes to be the best measure of progress towards completion of the performance obligation. In the course of providing its services, the Company routinely subcontracts for services and incurs other direct costs on behalf of its clients. These costs are passed through to clients and, in accordance with GAAP, are included in the Company’s revenue and cost of revenue. These pass-through revenues for the years ended September 30, 2023, 2022 and 2021 were $7.7 billion, $6.8 billion and $7.2 billion, respectively.
Recognition of revenue and profit is dependent upon a number of factors, including the accuracy of a variety of estimates made at the balance sheet date, such as engineering progress, material quantities, the achievement of milestones, penalty provisions, labor productivity and cost estimates. Additionally, the Company is required to make estimates for the amount of consideration to be received, including bonuses, awards, incentive fees, claims, unpriced change orders, penalties, and liquidated damages. Variable consideration is included in the estimate of the transaction price only to the extent that a significant reversal would not be probable. Management continuously monitors factors that may be applied retrospectivelyaffect the quality of its estimates, and material changes in estimates are disclosed accordingly. Costs attributable to each prior period presentedclaims are treated as costs of contract performance as incurred.
The following summarizes the Company’s major contract types:
Cost Reimbursable Contracts
Cost reimbursable contracts include cost-plus fixed fee, cost-plus fixed rate, and time-and-materials price contracts. Under cost-plus contracts, the Company charges clients for its costs, including both direct and indirect costs, plus a negotiated fee or retrospectively withrate. The Company recognizes revenue based on actual direct costs incurred and the cumulative effect recognizedapplicable fixed rate or portion of the fixed fee earned as of the date of initial application.balance sheet date. Under time-and-materials price contracts, the Company negotiates hourly billing rates and charges its clients based on the actual time that it expends on a project. In addition, clients reimburse the Company for materials and other direct incidental expenditures incurred in connection with its performance under the contract. The Company continuesmay apply a practical expedient to evaluaterecognize revenue in the impactamount in which it has the right to invoice if its right to consideration is equal to the value of performance completed to date.
Guaranteed Maximum Price Contracts (GMP)
GMP contracts share many of the new guidance on its consolidated financial statements,same contract provisions as cost-plus and fixed-price contracts. As with cost-plus contracts, clients are provided a disclosure of all the project costs, and a lump sum or percentage fee is separately identified. The Company provides clients with a guaranteed price for the overall project (adjusted for change orders issued by clients) and a schedule including the expected impact on our business processes, systems, and controls, and potential differencescompletion date. Cost overruns or costs associated with project delays in completion could generally be the timing or methodCompany’s responsibility.
For many of the date of adoption.
In February 2015,Company’s commercial or residential GMP contracts, the FASB issued amended guidance tofinal price is generally not established until the consolidation standard which updates the analysis thatCompany has subcontracted a reporting entity must perform to determine whether it should consolidate certain types of legal entities. The amendment modifies the evaluation of whether limited partnerships and similar legal entities are variable interest entities (VIEs) or voting interest entities and affects the consolidation analysis of reporting entities that are involved with VIEs, particularly those that have fee arrangements and related party relationships, among other provisions. This amended guidance was effective for the Company's fiscal year beginning October 1, 2016. The adoption of this guidance did not have a material impact on the Company's financial statements.
Table of Contents
AECOM
NOTES TO CONSOLIDATED FINANCIAL STATEMENTS (Continued)
2. New Accounting Pronouncements and Changes in Accounting (Continued)
In April 2015, the FASB issued new accounting guidance which requires debt issuance costs to be presented in the balance sheet as a direct deduction from the carrying valuesubstantial percentage of the associated debt liability,trade contracts with terms consistent with the presentationmaster contract, and it has negotiated additional contractual limitations, such as waivers of consequential damages as well as aggregate caps on liabilities and liquidated damages. Revenue is recognized for GMP contracts as project costs are incurred relative to total estimated project costs.
Fixed-Price Contracts
Fixed-price contracts include both lump-sum and fixed-unit price contracts. Under lump-sum contracts, the Company performs all the work under the contract for a debt discount. Priorspecified fee. Lump-sum contracts are typically subject to price adjustments if the issuancescope of the standard, debt issuance costs were requiredproject changes or unforeseen conditions arise. Under fixed-unit price contracts, the Company performs a number of units of work at an agreed price per unit with the total payment under the contract determined by the actual number of units delivered. Revenue is recognized for fixed-price contracts using the input method measured on a cost-to-cost basis as the Company believes this is the best measure of progress towards completion.
The following tables present the Company’s revenues disaggregated by revenue sources:
| | | | | | | | | |
| | Fiscal Year Ended |
| | September 30, | | September 30, | | September 30, |
| | 2023 | | 2022 | | 2021 |
|
| | (in millions) |
Cost reimbursable | | $ | 6,128.8 | | $ | 5,454.9 | | $ | 5,319.4 |
Guaranteed maximum price | | | 4,887.7 | | | 4,325.0 | | | 4,582.7 |
Fixed price | | | 3,362.0 | | | 3,368.3 | | | 3,438.8 |
Total revenue | | $ | 14,378.5 | | $ | 13,148.2 | | $ | 13,340.9 |
| | | | | | | | | |
| | Fiscal Year Ended |
| | September 30, | | September 30, | | September 30, |
| | 2023 | | 2022 | | 2021 |
|
| | (in millions) |
Americas | | $ | 10,976.4 | | $ | 9,941.6 | | $ | 10,228.3 |
Europe, Middle East, India, Africa | | | 1,937.3 | | | 1,759.8 | | | 1,691.3 |
Asia-Australia-Pacific | | | 1,464.8 | | | 1,446.8 | | | 1,421.3 |
Total revenue | | $ | 14,378.5 | | $ | 13,148.2 | | $ | 13,340.9 |
As of September 30, 2023, the Company had allocated $21.9 billion of transaction price to unsatisfied or partially satisfied performance obligations, of which approximately 55% is expected to be presented insatisfied within the balance sheet as an asset. The guidance requires retrospective application and represents a change in accounting principle. This guidance was effective for the Company's fiscal year beginning October 1, 2016, which resulted in the reclassifications of $52.3 million and $56.8 million of unamortized debt issuance costs at September 30, 2017 and September 30, 2016, respectively, from other non-current assets to long-term debt.
In April 2015, the FASB issued new accounting guidance which provides the use of a practical expedient that permits the entity to measure defined benefit plans assets and obligations using the month-end date that is closest to the entity's fiscal year-end date and apply that practical expedient consistently from year to year. This guidance was effective for the Company's fiscal year beginning October 1, 2016 and did not have a material impact on its consolidated financial statements.
In February 2016, the FASB issued new accounting guidance which changes accounting requirements for leases. The new guidance requires lessees to recognize the assets and liabilities arising from all leases, including those classified as operating leases under previous accounting guidance, on the balance sheet. It also requires disclosure of key information about leasing arrangements to increase transparency and comparability among organizations. The new guidance will be effective for the Company's fiscal year beginning October 1, 2019 with early adoption permitted. The new guidance must be adopted using a modified retrospective transition approach and provides for certain practical expedients. The Company is currently evaluating the impact that the new guidance will have on its consolidated financial statements.
In March 2016, the FASB issued new accounting guidance which simplifies the accounting for employee share-based payments. The new guidance requires all income tax effects of awards to be recognized in the statement of operations when the awards vest or are settled. It also allows an employer to repurchase more of an employee's shares for tax withholding purposes without triggering liability accounting and to make a policy election to account for forfeitures as they occur. The Company elected early adoption of this standard beginning October 1, 2016. The adoption of this guidance did not have a material impact on the Company's consolidated financial statements.
In June 2016, the FASB issued a new credit loss standard that changes the impairment model for most financial assets and certain other instruments. The new guidance will replace the current "incurred loss" approach with an "expected loss" model for instruments measured at amortized cost. It also simplifies the accounting model for purchased credit-impaired debt securities and loans. The guidance will be effective for the Company's fiscal year starting October 1, 2020. The Company is currently evaluating the impact that the new guidance will have on its consolidated financial statements.
In August 2016, the FASB issued new accounting guidance clarifying how entities should classify certain cash receipts and cash payments on the statement of cash flows. The new guidance also clarifies how the predominance principle should be applied when cash receipts and cash payments have aspects of more than one class of cash flows. The new guidance will be effective for the Company in its fiscal year beginning October 1, 2018, and early adoption is permitted. The Company is currently evaluating the impact that the new guidance will have on its consolidated statement of cash flows.
In January 2017, the FASB issued new accounting guidance to simplify the test for goodwill impairment. This guidance eliminates step two from the goodwill impairment test. Under the new
Table of Contents
AECOM
NOTES TO CONSOLIDATED FINANCIAL STATEMENTS (Continued)
2. New Accounting Pronouncements and Changes in Accounting (Continued)
guidance, an entity should recognize an impairment charge for the amount by which the carrying amount of a reporting unit exceeds its fair value. However, the loss recognized should not exceed the total amount of goodwill allocated to the reporting unit. This guidance is effective for the Company in the first quarter of fiscal 2021, and earlier adoption is permitted. The Company is currently evaluating the impact that this guidance will have on its consolidated financial statements.
3. Business Acquisitions, Goodwill, and Intangible Assets
On October 17, 2014, the Company completed the acquisition of the U.S. headquartered URS Corporation (URS), an international provider of engineering, construction, and technical services, by purchasing 100% of the outstanding shares of URS common stock. The Company paid total consideration of approximately $2.3 billion in cash and issued approximately $1.6 billion of AECOM common stock to the former stockholders and certain equity award holders of URS. In connection with the acquisition, the Company also assumed URS's senior notes totaling $0.4 billion, net of Company repayments. The Company repaid in full URS's $0.6 billion 2011 term loan and $0.1 billion of URS's revolving line of credit.
The Company acquired backlog and customer relationship intangible assets valued at $973.8 million representing the fair value of existing contractsnext twelve months and the underlying customer relationships, that have lives ranging from 1remaining 45% thereafter.
Contract liabilities represent amounts billed to 11 years (weighted average lives of approximately 3 years) in connection with the URS acquisition. Acquired accrued expenses and other current liabilities include URS project liabilities and approximately $240 million related to estimated URS legal settlements and uninsured legal damages; see Note 18, Commitments and Contingencies, including legal matters related to former URS affiliates.
Amortization of intangible assets relating to URS, included in cost of revenue, was $83.6 million and $183.3 million during the twelve months ended September 30, 2017 and 2016, respectively. Additionally, included in equity in earnings of joint ventures and noncontrolling interests was intangible amortization expense of $9.4 million and $(8.5) million, respectively, during the twelve months ended September 30, 2017 and $23.0 million and $(13.8) million, respectively, during the twelve months ended September 30, 2016 related to joint venture fair value adjustments.
Billingsclients in excess of costs on uncompleted contracts includes a margin fair value liability associated with long-term contracts acquired in connection with the acquisitionrevenue recognized to date. The Company recognized revenue of URS. This margin fair value liability was $149.1 million at the acquisition date, and its carrying value was $8.6 million at September 30, 2017, and is recognized as revenue on a percentage-of-completion basis as the applicable projects progress. The majority of this liability was recognized over the first two years from the acquisition date. Revenue and the related income from operations related to the margin fair value liability recognized during the twelve months ended September 30, 2017 and 2016 was $6.3$1,043.7 million and $37.2$565.2 million respectively.
Acquisition and integration expenses, relating to business acquisitions, in the accompanying consolidated statements of operations are comprised of the following:
| | | | | | | |
| | Fiscal Year Ended | |
|---|
| | Sept 30, 2017 | | Sept 30, 2016 | |
|---|
| | (in millions)
| |
|---|
Severance and personnel costs | | $ | 32.0 | | $ | 23.4 | |
Professional service, real estate-related, and other expenses | | | 6.7 | | | 190.2 | |
| | | | | | | | |
Total | | $ | 38.7 | | $ | 213.6 | |
| | | | | | | | |
| | | | | | | | |
| | | | | | | | |
Table of Contents
AECOM
NOTES TO CONSOLIDATED FINANCIAL STATEMENTS (Continued)
3. Business Acquisitions, Goodwill, and Intangible Assets (Continued)
Included in severance and personnel costs for the twelve months ended September 30, 2017 and 2016 was $9.8 million and $21.8 million of severance expenses, respectively, of which $6.9 million and $19.3 million was paid as of September 30, 2017 and 2016, respectively. All acquisition and integration expenses are classified within Corporate, as presented in Note 19.
In addition to URS, the Company completed two, one and one business acquisitions during the years ended September 30, 2017, 20162023 and 2015, respectively. These other business acquisitions did not meet the quantitative thresholds to require separate disclosures based on the Company's consolidated assets, investments and net income.
Business acquisitions during the year ended September 30, 2017 included Shimmick Construction Company, Inc. (Shimmick), a leading heavy civil construction firm in California and the Western U.S. for consideration of $165.5 million.
Excluding URS, the aggregate value of all consideration for acquisitions consummated during the years ended September 30, 2017, 2016 and 2015 were $166.6 million, $5.5 million and $27.3 million, respectively. The following table summarizes the estimated fair values of the assets acquired and liabilities assumed, as of the acquisition dates, from acquisitions consummated during the fiscal year presented:
| | | | |
| | Fiscal Year Ended
Sept 30, 2017 | |
|---|
| | (in millions)
| |
|---|
Cash acquired | | $ | 28.0 | |
Other current assets | | | 118.3 | |
Identifiable intangible assets: | | | | |
Customer relationships, contracts and backlog | | | 24.5 | |
Trademark / tradename | | | 1.8 | |
| | | | | |
Total intangible assets | | $ | 26.3 | |
| | | | | |
Goodwill | | | 127.1 | |
Other non-current assets | | | 29.5 | |
Current liabilities | | | (123.1 | ) |
Non-current liabilities | | | (29.3 | ) |
Noncontrolling interest | | | (10.2 | ) |
| | | | | |
Net assets acquired | | $ | 166.6 | |
| | | | | |
| | | | | |
| | | | | |
Consideration for acquisitions above includes the following:
| | | | |
| | Fiscal Year Ended
Sept 30, 2017 | |
|---|
| | (in millions)
| |
|---|
Cash paid | | $ | 130.0 | |
Equity issued | | | 36.6 | |
| | | | | |
Total consideration | | $ | 166.6 | |
| | | | | |
| | | | | |
| | | | | |
All of the above acquisitions were accounted for under the purchase method of accounting. As such, the purchase consideration of each acquired company2022, respectively, that was allocated to acquired tangible and intangible
Table of Contents
AECOM
NOTES TO CONSOLIDATED FINANCIAL STATEMENTS (Continued)
3. Business Acquisitions, Goodwill, and Intangible Assets (Continued)
assets and liabilities based upon their fair values. The excess of the purchase consideration over the fair value of the net tangible and identifiable intangible assets acquired was recorded as goodwill. The determination of fair values of assets and liabilities acquired requires the Company to make estimates and use valuation techniques when market value is not readily available. The results of operations of each company acquired have been included in the Company's financial statements from the date of acquisition. Transaction costs associated with business acquisitions are expensed as they are incurred.
At the time of acquisition, the Company preliminarily estimates the amount of the identifiable intangible assets acquired based upon historical valuations of similar acquisitions and the facts and circumstances available at the time. The Company determines the final value of the identifiable intangible assets as soon as information is available, but not more than 12 months from the date of acquisition. The initial accounting for the Shimmick acquisition is not completecontract liabilities as of September 30, 2017. Post-acquisition adjustments primarily relate2022 and 2021, respectively.
The Company’s timing of revenue recognition may not be consistent with its rights to project related liabilities.
Loss on disposal activities of $42.6 million in the accompanying statements of operations for the twelve months ended September 30, 2016 included lossesbill and collect cash from its clients. Those rights are generally dependent upon advance billing terms, milestone billings based on the dispositioncompletion of non-core energy related businesses, equipment and other assets acquired with URS and reported within the Construction Services segment. Net assets related to the loss on disposal activities were $112.8 million at the datecertain phases of disposal. Income from operations included losses incurred by non-core businesses of $9.4 million and $36.9 million during the twelve months ended September 30, 2017 and 2016, respectively.
work or when services are performed. The changes in the carrying value of goodwill by reportable segment for the fiscal years ended September 30, 2017 and 2016 were as follows:
| | | | | | | | | | | | | | | | |
| | Fiscal Year 2017 | |
|---|
| | September 30,
2016 | | Acquisitions | | Disposed | | Foreign
Exchange
Impact | | September 30,
2017 | |
|---|
| | (in millions)
| |
|---|
Design and Consulting Services | | $ | 3,198.2 | | $ | 3.8 | | $ | (1.8 | ) | $ | 18.7 | | $ | 3,218.9 | |
Construction Services | | | 915.2 | | | 123.3 | | | — | | | 11.4 | | | 1,049.9 | |
Management Services | | | 1,710.4 | | | — | | | — | | | 13.7 | | | 1,724.1 | |
| | | | | | | | | | | | | | | | | |
Total | | $ | 5,823.8 | | $ | 127.1 | | $ | (1.8 | ) | $ | 43.8 | | $ | 5,992.9 | |
| | | | | | | | | | | | | | | | | |
| | | | | | | | | | | | | | | | | |
| | | | | | | | | | | | | | | | | |
| | | | | | | | | | | | | | | | |
| | Fiscal Year 2016 | |
|---|
| | September 30,
2015 | | Post-
Acquisition
Adjustments | | Disposed | | Foreign
Exchange
Impact | | September 30,
2016 | |
|---|
| | (in millions)
| |
|---|
Design and Consulting Services | | $ | 3,163.3 | | $ | 26.7 | | $ | — | | $ | 8.2 | | $ | 3,198.2 | |
Construction Services | | | 918.5 | | | 8.7 | | | (11.3 | ) | | (0.7 | ) | | 915.2 | |
Management Services | | | 1,738.9 | | | 4.0 | | | — | | | (32.5 | ) | | 1,710.4 | |
| | | | | | | | | | | | | | | | | |
Total | | $ | 5,820.7 | | $ | 39.4 | | $ | (11.3 | ) | $ | (25.0 | ) | $ | 5,823.8 | |
| | | | | | | | | | | | | | | | | |
| | | | | | | | | | | | | | | | | |
| | | | | | | | | | | | | | | | | |
Table of Contents
AECOM
NOTES TO CONSOLIDATED FINANCIAL STATEMENTS (Continued)
3. Business Acquisitions, Goodwill, and Intangible Assets (Continued)
The gross amounts and accumulated amortization of the Company's acquired identifiable intangible assets with finite useful lives as of September 30, 2017 and 2016, included in intangible assets—net, in the accompanying consolidated balance sheets, were as follows:
| | | | | | | | | | | | | | | | | | | | |
| | September 30, 2017 | | September 30, 2016 | |
|
|---|
| | Gross
Amount | | Accumulated
Amortization | | Intangible
Assets, Net | | Gross
Amount | | Accumulated
Amortization | | Intangible
Assets, Net | | Amortization
Period
(years) |
|---|
| | (in millions)
| |
|
|---|
Backlog and customer relationships | | $ | 1,283.6 | | $ | (870.2 | ) | $ | 413.4 | | $ | 1,247.1 | | $ | (767.7 | ) | $ | 479.4 | | 1 - 11 |
Trademark / tradename | | | 18.3 | | | (16.6 | ) | | 1.7 | | | 16.4 | | | (16.4 | ) | | — | | 0.3 - 2 |
| | | | | | | | | | | | | | | | | | | | | |
Total | | $ | 1,301.9 | | $ | (886.8 | ) | $ | 415.1 | | $ | 1,263.5 | | $ | (784.1 | ) | $ | 479.4 | | |
| | | | | | | | | | | | | | | | | | | | | |
| | | | | | | | | | | | | | | | | | | | | |
| | | | | | | | | | | | | | | | | | | | | |
Amortization expense of acquired intangible assets included within cost of revenue was $102.7 million, $202.4 million, and $391.0 million for the years ended September 30, 2017, 2016 and 2015, respectively. The following table presents estimated amortization expense of existing intangible assets for the succeeding years:
| | | | |
Fiscal Year | | (in millions) | |
|---|
2018 | | $ | 91.7 | |
2019 | | | 84.5 | |
2020 | | | 70.5 | |
2021 | | | 59.5 | |
2022 | | | 46.3 | |
Thereafter | | | 62.6 | |
| | | | | |
Total | | $ | 415.1 | |
| | | | | |
| | | | | |
| | | | | |
4. Accounts Receivable—Net
NetCompany’s accounts receivable consisted of the following:
| | | | | | | |
| | Fiscal Year Ended | |
|---|
| | September 30,
2017 | | September 30,
2016 | |
|---|
| | (in millions)
| |
|---|
Billed | | $ | 2,317.8 | | $ | 2,267.6 | |
Unbilled | | | 2,293.5 | | | 1,890.2 | |
Contract retentions | | | 568.6 | | | 434.1 | |
| | | | | | | | |
Total accounts receivable—gross | | | 5,179.9 | | | 4,591.9 | |
Allowance for doubtful accounts | | | (52.2 | ) | | (60.4 | ) |
| | | | | | | | |
Total accounts receivable—net | | $ | 5,127.7 | | $ | 4,531.5 | |
| | | | | | | | |
| | | | | | | | |
| | | | | | | | |
Billed accounts receivablereceivables represent amounts billed to clients that have yet to be collected. Unbilled accounts receivable representscollected and represent an unconditional right to cash from its clients. Contract assets represent the amount of contract revenue recognized but not yet billed pursuant to contract terms or accounts billed after the period end. balance sheet date. Contract liabilities represent billings as of the balance sheet date, as allowed under the terms of a contract, but not yet recognized as contract revenue pursuant to the Company’s revenue recognition policy.
Net accounts receivable consisted of the following:
| | | | | | |
| | Fiscal Year Ended |
| | September 30, | | September 30, |
| | 2023 | | 2022 |
|
| | (in millions) |
Billed | | $ | 2,122.2 | | $ | 1,931.4 |
Contract retentions | | | 516.5 | | | 490.4 |
Total accounts receivable—gross | | | 2,638.7 | | | 2,421.8 |
Allowance for doubtful accounts and credit losses | | | (94.2) | | | (104.0) |
Total accounts receivable—net | | $ | 2,544.5 | | $ | 2,317.8 |
Substantially all unbilled receivablescontract assets as of September 30,
Table of Contents
AECOM
NOTES TO CONSOLIDATED FINANCIAL STATEMENTS (Continued)
4. Accounts Receivable—Net (Continued)
2017 2023 and 2016September 30, 2022 are expected to be billed and collected within twelve months.months, except for claims. Significant claims recorded in contract assets and other non-current assets were approximately $160 million and $110 million as of September 30, 2023 and 2022, respectively. The asset related to the Deactivation, Demolition, and Removal Project retained from the MS Purchaser as defined in discussed in Note 18 is presented in prepaid expense and other current assets from continuing operations in the Consolidated Balance Sheet. Contract retentions represent amounts invoiced to clients where payments have been withheld pendingfrom progress payments until the completion of certain milestones, other contractual conditions or upon the completion of the project. These retention agreements vary from project to project and could be outstanding for several months or years.
Allowances for doubtful accounts have been determined through specific identification of amounts considered to be uncollectible and potential write-offs, plus a non-specific allowance for other amounts for which some potential losscontracted work has been determinedcompleted and approved by the client but nonetheless represent an unconditional right to be probablecash.
The Company considers a broad range of information to estimate expected credit losses including the related ages of past due balances, projections of credit losses based on currenthistorical trends, and past experience.collection history and credit quality of its clients. Negative macroeconomic trends or delays in payment of outstanding receivables could result in an increase in the estimated credit losses.
Other than the U.S. government, noNo single client accounted for more than 10% of the Company'sCompany’s outstanding receivables at September 30, 20172023 and 2016.2022.
The Company sold trade receivables to financial institutions, of which $325.2$291.0 million and $356.3$240.3 million were outstanding as of September 30, 20172023 and 2016,2022, respectively. The Company does not retain financial or legal obligations for these receivables that would result in material losses. The Company'sCompany’s ongoing involvement is limited to the remittance of customer payments to the financial institutions with respect to the sold trade receivables.
5. Property and Equipment
Property and equipment, at cost, consists of the following:
| | | | | | | | |
| | Fiscal Year Ended | |
|
|---|
| | September 30,
2017 | | September 30,
2016 | | Useful Lives
(years) |
|---|
| | (in millions)
| |
|
|---|
Building and land | | $ | 63.6 | | $ | 57.9 | | 10 - 45 |
Leasehold improvements | | | 404.6 | | | 381.4 | | 1 - 20 |
Computer systems and equipment | | | 694.6 | | | 652.0 | | 3 - 12 |
Furniture and fixtures | | | 135.9 | | | 129.7 | | 3 - 10 |
| | | | | | | | | |
Total | | | 1,298.7 | | | 1,221.0 | | |
Accumulated depreciation and amortization | | | (677.3 | ) | | (576.0 | ) | |
| | | | | | | | | |
Property and equipment, net | | $ | 621.4 | | $ | 645.0 | | |
| | | | | | | | | |
| | | | | | | | | |
| | | | | | | | | |
| | | | | | | | | | |
| | Fiscal Year Ended | | | | |
| | September 30, | | September 30, | | Useful Lives |
| | 2023 | | 2022 | | (years) |
|
| | (in millions) | | | | |
Building and land | | $ | 10.4 | | $ | 9.9 | | 10 | - | 45 |
Leasehold improvements | | | 329.4 | | | 339.7 | | 1 | - | 20 |
Computer systems and equipment | | | 716.7 | | | 672.1 | | 3 | - | 12 |
Furniture and fixtures | | | 97.9 | | | 103.1 | | 3 | - | 10 |
Total | | | 1,154.4 | | | 1,124.8 | | | | |
Accumulated depreciation and amortization | | | (771.8) | | | (696.6) | | | | |
Property and equipment, net | | $ | 382.6 | | $ | 428.2 | | | | |
Depreciation expense for the fiscal years ended September 30, 2017, 20162023, 2022 and 2015 were $157.12021 was $152.3 million, $171.7$147.0 million, and $191.3$143.6 million, respectively. Depreciation is calculated using primarily the straight-line method over the estimated useful lives of the
assets, or in the case of leasehold improvements and capitalized leases, the lesser of the remaining term of the lease or its estimated useful life.
6. Joint Ventures and Variable Interest Entities
The Company'sCompany’s joint ventures provide architecture, engineering, program management, construction management, operations and maintenance services, and investsinvest in real estate public-private partnership (P3) and infrastructure projects. Joint ventures, the combination of two or more partners, are generally formed for a specific project. Management of the joint venture is typically controlled by a joint venture executive committee, comprised of representatives from the joint venture partners. The joint
Table of Contents
AECOM
NOTES TO CONSOLIDATED FINANCIAL STATEMENTS (Continued)
6. Joint Ventures and Variable Interest Entities (Continued)
venture executive committee normally provides management oversight and controls decisions which could have a significant impact on the joint venture.
Some of the Company'sCompany’s joint ventures have no employees and minimal operating expenses. For these joint ventures, the Company'sCompany’s employees perform work for the joint venture, which is then billed to a third-party customer by the joint venture. These joint ventures function as pass- through entities to bill the third-party customer. For consolidated joint ventures of this type, the Company records the entire amount of the services performed and the costs associated with these services, including the services provided by the other joint venture partners, in the Company'sCompany’s result of operations. For certain of these joint ventures where a fee is added by an unconsolidated joint venture to client billings, the Company'sCompany’s portion of that fee is recorded in equity in earnings of joint ventures.
The Company also has joint ventures that have their own employees and operating expenses, and to which the Company generally makes a capital contribution. The Company accounts for these joint ventures either as consolidated entities or equity method investments based on the criteria further discussed below.
The Company follows guidance on the consolidation of variable interest entities (VIEs) that requires companies to utilize a qualitative approach to determine whether it is the primary beneficiary of a VIE. The process for identifying the primary beneficiary of a VIE requires consideration of the factors that indicate a party has the power to direct the activities that most significantly impact the joint venture'sventure’s economic performance, including powers granted to the joint venture'sventure’s program manager, powers contained in the joint venture governing board and, to a certain extent, a company'scompany’s economic interest in the joint venture. The Company analyzes its joint ventures and classifies them as either:
•a VIE that must be consolidated because the Company is the primary beneficiary or the joint venture is not a VIE and the Company holds the majority voting interest with no significant participative rights available to the other partners; or
•a VIE that does not require consolidation and is treated as an equity method investment because the Company is not the primary beneficiary or the joint venture is not a VIE and the Company does not hold the majority voting interest.
| ● | a VIE that must be consolidated because the Company is the primary beneficiary or the joint venture is not a VIE and the Company holds the majority voting interest with no significant participative rights available to the other partners; or |
| ● | a VIE that does not require consolidation and is treated as an equity method investment because the Company is not the primary beneficiary or the joint venture is not a VIE and the Company does not hold the majority voting interest. |
As part of the above analysis, if it is determined that the Company has the power to direct the activities that most significantly impact the joint venture'sventure’s economic performance, the Company considers whether or not it has the obligation to absorb losses or rights to receive benefits of the VIE that could potentially be significant to the VIE.
Contractually required support provided to the Company'sCompany’s joint ventures is discussed in Note 18.
AECOM
NOTES TO CONSOLIDATED FINANCIAL STATEMENTS (Continued)
6. Joint Ventures and Variable Interest Entities (Continued)
Summary of financial information of the consolidated joint ventures is as follows:
| | | | | | | |
| | September 30,
2017 | | September 30,
2016 | |
|---|
| | (in millions)
| |
|---|
Current assets | | $ | 832.1 | | $ | 684.1 | |
Non-current assets | | | 188.8 | | | 230.8 | |
| | | | | | | | |
Total assets | | $ | 1,020.9 | | $ | 914.9 | |
| | | | | | | | |
| | | | | | | | |
| | | | | | | | |
Current liabilities | | $ | 524.9 | | $ | 407.4 | |
Non-current liabilities | | | 12.4 | | | 12.4 | |
| | | | | | | | |
Total liabilities | | | 537.3 | | | 419.8 | |
Total AECOM equity | | | 274.7 | | | 318.0 | |
Noncontrolling interests | | | 208.9 | | | 177.1 | |
| | | | | | | | |
Total owners' equity | | | 483.6 | | | 495.1 | |
| | | | | | | | |
Total liabilities and owners' equity | | $ | 1,020.9 | | $ | 914.9 | |
| | | | | | | | |
| | | | | | | | |
| | | | | | | | |
| | | | | | |
| | | | | | |
| | September 30, | | September 30, |
| | 2023 | | 2022 |
|
| | (in millions) |
Current assets | | $ | 806.3 | | $ | 630.8 |
Non-current assets | | | 75.9 | | | 73.8 |
Total assets | | $ | 882.2 | | $ | 704.6 |
| | | | | | |
Current liabilities | | $ | 779.6 | | $ | 530.6 |
Non-current liabilities | | | 1.5 | | | 1.5 |
Total liabilities | | | 781.1 | | | 532.1 |
Total AECOM (deficit) equity | | | (54.9) | | | 56.7 |
Noncontrolling interests | | | 156.0 | | | 115.8 |
Total owners’ equity | | | 101.1 | | | 172.5 |
Total liabilities and owners’ equity | | $ | 882.2 | | $ | 704.6 |
Total revenue of the consolidated joint ventures was $1,933.5$1,984.3 million, $1,935.2$1,411.7 million, and $2,368.0$826.8 million for the years ended September 30, 2017, 20162023, 2022 and 2015,2021, respectively. The assets of the Company'sCompany’s consolidated joint ventures are restricted for use only by the particular joint venture and are not available for the general operations of the Company.
Summary of financial information of the unconsolidated joint ventures, as derived from their unaudited financial statements, is as follows:
| | | | | | |
| | September 30, | | September 30, |
| | 2023 | | 2022 |
|
| | (in millions) |
Current assets | | $ | 1,177.4 | | $ | 1,279.4 |
Non-current assets | | | 996.3 | | | 1,128.7 |
Total assets | | $ | 2,173.7 | | $ | 2,408.1 |
| | | | | | |
Current liabilities | | $ | 605.9 | | $ | 751.4 |
Non-current liabilities | | | 441.7 | | | 521.3 |
Total liabilities | | | 1,047.6 | | | 1,272.7 |
Joint ventures’ equity | | | 1,126.1 | | | 1,135.4 |
Total liabilities and joint ventures’ equity | | $ | 2,173.7 | | $ | 2,408.1 |
| | | | | | |
AECOM’s investment in joint ventures | | $ | 139.2 | | $ | 355.0 |
| | | | | | |
| | Twelve Months Ended |
| | September 30, | | September 30, |
| | 2023 | | 2022 |
|
| | (in millions) |
Revenue | | $ | 1,248.2 | | $ | 1,801.5 |
Cost of revenue | | | 1,170.7 | | | 1,743.1 |
Gross profit | | $ | 77.5 | | $ | 58.4 |
Net income | | $ | 72.9 | | $ | 52.1 |
| | | | | | | |
| | September 30,
2017 | | September 30,
2016 | |
|---|
| | (in millions)
| |
|---|
Current assets | | $ | 1,912.2 | | $ | 1,407.0 | |
Non-current assets | | | 749.8 | | | 499.4 | |
| | | | | | | | |
Total assets | | $ | 2,662.0 | | $ | 1,906.4 | |
| | | | | | | | |
| | | | | | | | |
| | | | | | | | |
Current liabilities | | $ | 1,570.2 | | $ | 977.3 | |
Non-current liabilities | | | 185.1 | | | 146.2 | |
| | | | | | | | |
Total liabilities | | | 1,755.3 | | | 1,123.5 | |
Joint ventures' equity | | | 906.7 | | | 782.9 | |
| | | | | | | | |
Total liabilities and joint ventures' equity | | $ | 2,662.0 | | $ | 1,906.4 | |
| | | | | | | | |
| | | | | | | | |
| | | | | | | | |
AECOM's investment in joint ventures | | $ | 364.2 | | $ | 330.5 | |
Table of Contents
AECOM
NOTES TO CONSOLIDATED FINANCIAL STATEMENTS (Continued)
6. Joint Ventures and Variable Interest Entities (Continued)
| | | | | | | |
| | Twelve Months Ended | |
|---|
| | September 30,
2017 | | September 30,
2016 | |
|---|
| | (in millions)
| |
|---|
Revenue | | $ | 5,561.8 | | $ | 4,871.8 | |
Cost of revenue | | | 5,305.5 | | | 4,618.3 | |
| | | | | | | | |
Gross profit | | $ | 256.3 | | $ | 253.5 | |
| | | | | | | | |
Net income | | $ | 244.8 | | $ | 233.9 | |
| | | | | | | | |
| | | | | | | | |
| | | | | | | | |
Summary of AECOM'sAECOM’s equity in earnings of unconsolidated joint ventures is as follows:
| | | | | | | | | | |
| | Fiscal Year Ended | |
|---|
| | September 30,
2017 | | September 30,
2016 | | September 30,
2015 | |
|---|
| | (in millions)
| |
|---|
Pass through joint ventures | | $ | 36.6 | | $ | 21.9 | | $ | 26.2 | |
Other joint ventures | | | 105.0 | | | 82.1 | | | 80.0 | |
| | | | | | | | | | | |
Total | | $ | 141.6 | | $ | 104.0 | | $ | 106.2 | |
| | | | | | | | | | | |
| | | | | | | | | | | |
| | | | | | | | | | | |
Included
| | | | | | | | | | |
| | Fiscal Year Ended | |
| | September 30, | | September 30, | | September 30, | |
| | 2023 | | 2022 | | 2021 | |
|
| | (in millions) | |
Pass-through joint ventures | | $ | 24.5 | | $ | 29.2 | | $ | 23.6 | |
Other joint ventures | | | (303.9) | | | 24.4 | | | 11.4 | |
Total | | $ | (279.4) | | $ | 53.6 | | $ | 35.0 | |
During fiscal 2023, the Company initiated a process to explore strategic options for the AECOM Capital business, consistent with the Company's focus on its professional services business. During the third quarter of fiscal 2023, the Company identified indicators of impairment in the equity method investments held in its AECOM Capital segment. Specifically, the Company identified evidence that the carrying value of earnings above,certain of the investments in its real estate portfolio were in excess of their fair values. The Company concluded it no longer had the intent to retain certain of these investments for a period of time sufficient to allow for an anticipated recovery in market value. In the third quarter of fiscal 2023, the Company recorded a gainan impairment loss of $52$307.0 million from a saleto reduce the carrying value of its 50% equity interestthese investments to their estimated fair values. This impairment did not relate to investments in Provost Square I LLC, an unconsolidated joint venture that investedrespect of which affiliates of AECOM Capital provide advisory services or manage third party capital. AECOM Capital will continue to manage existing investment vehicles and investments in a real estate development in New Jersey, in fiscal year ended September 30, 2017.manner consistent with their current obligations. Fair value was determined using Level 3 inputs such as forecasted cash flows and comparable sales prices.
7. Pension Benefit Obligations
In the U.S., the Company sponsors various qualified defined benefit pension plans. Benefits under these plans generally are based on the employee'semployee’s years of creditable service and compensation; however, all U.S. defined benefit plans are closed to new participants and have frozen accruals. The Company adopted an amendment to freeze benefits under the URS Federal Services, Inc. Employees Retirement Plan during the three months ended December 31, 2015, which resulted in the curtailment gain listed below.
The Company also sponsors various non-qualified plans in the U.S.; all of these plans are frozen. Outside the U.S., the Company sponsors various pension plans, which are appropriate to the country in which the Company operates, some of which are government mandated.
Table of Contents
AECOM
NOTES TO CONSOLIDATED FINANCIAL STATEMENTS (Continued)
7. Pension Benefit Obligations (Continued)
The following tables provide reconciliations of the changes in the U.S. and international plans'plans’ benefit obligations, reconciliations of the changes in the fair value of assets for the last three years ended September 30, and reconciliations of the funded status as of September 30 of each year.
| | | | | | | | | | | | | | | | | | |
| | Fiscal Year Ended |
| | September 30, | | September 30, | | September 30, |
| | 2023 | | 2022 | | 2021 |
| | U.S. | | Int’l | | U.S. | | Int’l | | U.S. | | Int’l |
|
| | (in millions) |
Change in benefit obligation: | | | | | | | | | | | | | | | | | | |
Benefit obligation at beginning of year | | $ | 198.1 | | $ | 791.2 | | $ | 265.4 | | $ | 1,470.8 | | $ | 283.9 | | $ | 1,440.3 |
Service cost | | | — | | | 0.3 | | | — | | | 0.5 | | | — | | | 0.5 |
Participant contributions | | | 0.1 | | | 0.2 | | | 0.1 | | | 0.3 | | | 0.1 | | | 0.3 |
Interest cost | | | 9.8 | | | 47.7 | | | 4.7 | | | 24.1 | | | 4.3 | | | 21.6 |
Benefits and expenses paid | | | (17.2) | | | (42.2) | | | (18.4) | | | (44.3) | | | (18.5) | | | (48.6) |
Actuarial (gain) loss | | | (8.8) | | | (112.5) | | | (51.9) | | | (458.1) | | | (3.7) | | | (4.7) |
Plan settlements | | | (1.5) | | | (1.5) | | | (1.8) | | | (2.2) | | | (0.7) | | | (5.9) |
Transfers in | | | 0.7 | | | — | | | — | | | — | | | — | | | — |
Plan amendments | | | — | | | — | | | — | | | — | | | — | | | 0.4 |
Foreign currency translation (gain) loss | | | — | | | 73.0 | | | — | | | (199.9) | | | — | | | 66.9 |
Benefit obligation at end of year | | $ | 181.2 | | $ | 756.2 | | $ | 198.1 | | $ | 791.2 | | $ | 265.4 | | $ | 1,470.8 |
| | | | | | | | | | | | | | | | | | | |
| | Fiscal Year Ended | |
|---|
| | September 30,
2017 | | September 30,
2016 | | September 30,
2015 | |
|---|
| | U.S. | | Int'l | | U.S. | | Int'l | | U.S. | | Int'l | |
|---|
| | (in millions)
| |
|---|
Change in benefit obligation: | | | | | | | | | | | | | | | | | | | |
Benefit obligation at beginning of year | | $ | 720.0 | | $ | 1,406.2 | | $ | 718.2 | | $ | 1,239.2 | | $ | 217.0 | | $ | 676.6 | |
Service cost | | | 4.3 | | | 1.3 | | | 4.3 | | | 1.0 | | | 6.8 | | | 1.1 | |
Participant contributions | | | 0.1 | | | 0.4 | | | 0.1 | | | 0.5 | | | 0.4 | | | 0.5 | |
Interest cost | | | 19.2 | | | 28.3 | | | 22.0 | | | 39.2 | | | 28.2 | | | 47.1 | |
Benefits and expenses paid | | | (37.9 | ) | | (48.3 | ) | | (37.4 | ) | | (41.9 | ) | | (33.9 | ) | | (41.0 | ) |
Actuarial (gain) loss | | | (22.7 | ) | | (98.6 | ) | | 52.3 | | | 377.1 | | | (41.0 | ) | | 10.6 | |
Plan settlements | | | — | | | — | | | (32.9 | ) | | (0.7 | ) | | (20.1 | ) | | (2.5 | ) |
Plan amendments | | | — | | | — | | | 0.2 | | | — | | | — | | | — | |
Plan curtailments | | | — | | | — | | | (6.8 | ) | | — | | | — | | | — | |
Net transfer in/(out)/acquisitions | | | — | | | — | | | — | | | — | | | 560.8 | | | 618.6 | |
Foreign currency translation loss (gain) | | | — | | | 44.2 | | | — | | | (208.2 | ) | | — | | | (71.8 | ) |
| | | | | | | | | | | | | | | | | | | | |
Benefit obligation at end of year | | $ | 683.0 | | $ | 1,333.5 | | $ | 720.0 | | $ | 1,406.2 | | $ | 718.2 | | $ | 1,239.2 | |
| | | | | | | | | | | | | | | | | | | | |
| | | | | | | | | | | | | | | | | | | | |
| | | | | | | | | | | | | | | | | | | | |
| | | | | | | | | | | | | | | | | | | |
| | Fiscal Year Ended | |
|---|
| | September 30,
2017 | | September 30,
2016 | | September 30,
2015 | |
|---|
| | U.S. | | Int'l | | U.S. | | Int'l | | U.S. | | Int'l | |
|---|
| | (in millions)
| |
|---|
Change in plan assets | | | | | | | | | | | | | | | | | | | |
Fair value of plan assets at beginning of year | | $ | 456.9 | | $ | 973.2 | | $ | 459.0 | | $ | 925.8 | | $ | 139.7 | | $ | 532.6 | |
Actual return on plan assets | | | 39.0 | | | 9.6 | | | 49.6 | | | 215.9 | | | (2.8 | ) | | 49.9 | |
Employer contributions | | | 12.3 | | | 25.8 | | | 18.5 | | | 20.2 | | | 42.1 | | | 24.4 | |
Participant contributions | | | 0.1 | | | 0.4 | | | 0.1 | | | 0.5 | | | 0.4 | | | 0.5 | |
Benefits and expenses paid | | | (37.9 | ) | | (48.3 | ) | | (37.4 | ) | | (41.9 | ) | | (33.9 | ) | | (41.0 | ) |
Plan settlements | | | — | | | — | | | (32.9 | ) | | (0.7 | ) | | (20.1 | ) | | (2.5 | ) |
Net transfer in/(out)/acquisitions | | | — | | | — | | | — | | | — | | | 333.6 | | | 415.5 | |
Foreign currency translation gain (loss) | | | — | | | 32.4 | | | — | | | (146.6 | ) | | — | | | (53.6 | ) |
| | | | | | | | | | | | | | | | | | | | |
Fair value of plan assets at end of year | | $ | 470.4 | | $ | 993.1 | | $ | 456.9 | | $ | 973.2 | | $ | 459.0 | | $ | 925.8 | |
| | | | | | | | | | | | | | | | | | | | |
| | | | | | | | | | | | | | | | | | | | |
| | | | | | | | | | | | | | | | | | | | |
Table of Contents
| | | | | | | | | | | | | | | | | | |
| | Fiscal Year Ended |
| | September 30, | | September 30, | | September 30, |
| | 2023 | | 2022 | | 2021 |
| | U.S. | | Int’l | | U.S. | | Int’l | | U.S. | | Int’l |
|
| | (in millions) |
Change in plan assets | | | | | | | | | | | | | | | | | | |
Fair value of plan assets at beginning of year | | $ | 101.4 | | $ | 683.5 | | $ | 138.9 | | $ | 1,251.8 | | $ | 129.6 | | $ | 1,166.2 |
Actual return on plan assets | | | 7.8 | | | (54.2) | | | (27.2) | | | (374.5) | | | 14.7 | | | 61.1 |
Employer contributions | | | 8.2 | | | 24.8 | | | 9.8 | | | 23.6 | | | 13.7 | | | 25.2 |
Participant contributions | | | 0.1 | | | 0.2 | | | 0.1 | | | 0.3 | | | 0.1 | | | 0.3 |
Benefits and expenses paid | | | (17.2) | | | (42.2) | | | (18.4) | | | (44.3) | | | (18.5) | | | (48.6) |
Plan settlements | | | (1.5) | | | (1.5) | | | (1.8) | | | (2.2) | | | (0.7) | | | (5.9) |
Foreign currency translation (loss) gain | | | — | | | 62.7 | | | — | | | (171.2) | | | — | | | 53.5 |
Fair value of plan assets at end of year | | $ | 98.8 | | $ | 673.3 | | $ | 101.4 | | $ | 683.5 | | $ | 138.9 | | $ | 1,251.8 |
| | | | | | | | | | | | | | | | | | |
| | Fiscal Year Ended |
| | September 30, 2023 | | September 30, 2022 | | September 30, 2021 |
| | U.S. | | Int’l | | U.S. | | Int’l | | U.S. | | Int’l |
|
| | (in millions) |
Reconciliation of funded status: | | | | | | | | | | | | | | | | | | |
Funded status at end of year | | $ | (82.4) | | $ | (82.9) | | $ | (96.7) | | $ | (107.7) | | $ | (126.5) | | $ | (219.0) |
Contribution made after measurement date | | | N/A | | | N/A | | | N/A | | | N/A | | | N/A | | | N/A |
Net amount recognized at end of year | | $ | (82.4) | | $ | (82.9) | | $ | (96.7) | | $ | (107.7) | | $ | (126.5) | | $ | (219.0) |
AECOM
NOTES TO CONSOLIDATED FINANCIAL STATEMENTS (Continued)
7. Pension Benefit Obligations (Continued)
| | | | | | | | | | | | | | | | | | | |
| | Fiscal Year Ended | |
|---|
| | September 30, 2017 | | September 30, 2016 | | September 30, 2015 | |
|---|
| | U.S. | | Int'l | | U.S. | | Int'l | | U.S. | | Int'l | |
|---|
| | (in millions)
| |
|---|
Reconciliation of funded status: | | | | | | | | | | | | | | | | | | | |
Funded status at end of year | | $ | (212.6 | ) | $ | (340.4 | ) | $ | (263.1 | ) | $ | (433.0 | ) | $ | (259.2 | ) | $ | (313.4 | ) |
Contribution made after measurement date | | | N/A | | | N/A | | | N/A | | | N/A | | | N/A | | | N/A | |
| | | | | | | | | | | | | | | | | | | | |
Net amount recognized at end of year | | $ | (212.6 | ) | $ | (340.4 | ) | $ | (263.1 | ) | $ | (433.0 | ) | $ | (259.2 | ) | $ | (313.4 | ) |
| | | | | | | | | | | | | | | | | | | | |
| | | | | | | | | | | | | | | | | | | | |
| | | | | | | | | | | | | | | | | | | | |
The following table sets forth the amounts recognized in the consolidated balance sheets as of September 30, 2017, 20162023, 2022 and 2015:2021:
| | | | | | | | | | | | | | | | | | | |
| | Fiscal Year Ended | |
|---|
| | September 30, 2017 | | September 30, 2016 | | September 30, 2015 | |
|---|
| | U.S. | | Int'l | | U.S. | | Int'l | | U.S. | | Int'l | |
|---|
| | (in millions)
| |
|---|
Amounts recognized in the consolidated balance sheets: | | | | | | | | | | | | | | | | | | | |
Other non-current assets | | $ | 2.3 | | $ | 13.9 | | $ | 2.0 | | $ | 5.3 | | $ | 1.6 | | $ | 1.7 | |
Accrued expenses and other current liabilities | | | (10.1 | ) | | — | | | (9.3 | ) | | — | | | (10.6 | ) | | — | |
Pension benefit obligations | | | (204.8 | ) | | (354.3 | ) | | (255.8 | ) | | (438.3 | ) | | (250.2 | ) | | (315.1 | ) |
| | | | | | | | | | | | | | | | | | | | |
Net amount recognized in the balance sheet | | $ | (212.6 | ) | $ | (340.4 | ) | $ | (263.1 | ) | $ | (433.0 | ) | $ | (259.2 | ) | $ | (313.4 | ) |
| | | | | | | | | | | | | | | | | | | | |
| | | | | | | | | | | | | | | | | | | | |
| | | | | | | | | | | | | | | | | | | | |
| | | | | | | | | | | | | | | | | | |
| | Fiscal Year Ended |
| | September 30, 2023 | | September 30, 2022 | | September 30, 2021 |
| | U.S. | | Int’l | | U.S. | | Int’l | | U.S. | | Int’l |
|
| | (in millions) |
Amounts recognized in the consolidated balance sheets: | | | | | | | | | | | | | | | | | | |
Other non-current assets | | $ | — | | $ | 38.7 | | $ | — | | $ | 36.8 | | $ | — | | $ | 47.5 |
Accrued expenses and other current liabilities | | | (8.4) | | | — | | | (8.6) | | | — | | | (9.1) | | | — |
Pension benefit obligations | | | (74.0) | | | (121.6) | | | (88.1) | | | (144.5) | | | (117.4) | | | (266.5) |
Net amount recognized in the balance sheet | | $ | (82.4) | | $ | (82.9) | | $ | (96.7) | | $ | (107.7) | | $ | (126.5) | | $ | (219.0) |
The following table details the reconciliation of amounts in the consolidated statements of stockholders'stockholders’ equity for the fiscal years ended September 30, 2017, 20162023, 2022 and 2015:2021:
| | | | | | | | | | | | | | | | | | |
| | Fiscal Year Ended |
| | September 30, 2023 | | September 30, 2022 | | September 30, 2021 |
| | U.S. | | Int’l | | U.S. | | Int’l | | U.S. | | Int’l |
|
| | (in millions) |
Reconciliation of amounts in consolidated statements of stockholders’ equity: | | | | | | | | | | | | | | | | | | |
Prior service cost | | $ | (0.1) | | $ | (1.2) | | $ | (0.1) | | $ | (1.2) | | $ | (0.1) | | $ | (1.6) |
Net loss | | | (77.5) | | | (207.1) | | | (91.7) | | | (187.1) | | | (116.5) | | | (279.5) |
Total recognized in accumulated other comprehensive loss | | $ | (77.6) | | $ | (208.3) | | $ | (91.8) | | $ | (188.3) | | $ | (116.6) | | $ | (281.1) |
| | | | | | | | | | | | | | | | | | | |
| | Fiscal Year Ended | |
|---|
| | September 30, 2017 | | September 30, 2016 | | September 30, 2015 | |
|---|
| | U.S. | | Int'l | | U.S. | | Int'l | | U.S. | | Int'l | |
|---|
| | (in millions)
| |
|---|
Reconciliation of amounts in consolidated statements of stockholders' equity: | | | | | | | | | | | | | | | | | | | |
Prior service (cost) credit | | $ | (0.2 | ) | $ | 4.4 | | $ | (0.2 | ) | $ | 4.4 | | $ | — | | $ | 5.3 | |
Net loss | | | (94.6 | ) | | (263.7 | ) | | (129.6 | ) | | (343.3 | ) | | (99.3 | ) | | (183.6 | ) |
| | | | | | | | | | | | | | | | | | | | |
Total recognized in accumulated other comprehensive loss | | $ | (94.8 | ) | $ | (259.3 | ) | $ | (129.8 | ) | $ | (338.9 | ) | $ | (99.3 | ) | $ | (178.3 | ) |
| | | | | | | | | | | | | | | | | | | | |
| | | | | | | | | | | | | | | | | | | | |
| | | | | | | | | | | | | | | | | | | | |
Table of Contents
AECOM
NOTES TO CONSOLIDATED FINANCIAL STATEMENTS (Continued)
7. Pension Benefit Obligations (Continued)
The components of net periodic benefit cost other than the service cost component are included in other income in the consolidated statement of operations. The following table details the components of net periodic benefit cost for the Company'sCompany’s pension plans for fiscal years ended September 30, 2017, 20162023, 2022 and 2015:2021:
| | | | | | | | | | | | | | | | | | | |
| | Fiscal Year Ended | |
|---|
| | September 30, 2017 | | September 30, 2016 | | September 30, 2015 | |
|---|
| | U.S. | | Int'l | | U.S. | | Int'l | | U.S. | | Int'l | |
|---|
| | (in millions)
| |
|---|
Components of net periodic (benefit) cost: | | | | | | | | | | | | | | | | | | | |
Service costs | | $ | 4.3 | | $ | 1.3 | | $ | 4.3 | | $ | 1.0 | | $ | 6.8 | | $ | 1.1 | |
Interest cost on projected benefit obligation | | | 19.2 | | | 28.3 | | | 22.0 | | | 39.2 | | | 28.2 | | | 47.1 | |
Expected return on plan assets | | | (31.0 | ) | | (41.5 | ) | | (30.8 | ) | | (48.0 | ) | | (29.4 | ) | | (49.4 | ) |
Amortization of prior service credits | | | — | | | (0.2 | ) | | — | | | (0.2 | ) | | — | | | (0.2 | ) |
Amortization of net loss | | | 4.3 | | | 13.0 | | | 4.0 | | | 5.4 | | | 4.3 | | | 5.9 | |
Curtailment gain recognized | | | — | | | — | | | (6.8 | ) | | — | | | — | | | — | |
Settlement (gain) loss recognized | | | — | | | — | | | (0.9 | ) | | 0.1 | | | 0.6 | | | 0.7 | |
| | | | | | | | | | | | | | | | | | | | |
Net periodic (benefit) cost | | $ | (3.2 | ) | $ | 0.9 | | $ | (8.2 | ) | $ | (2.5 | ) | $ | 10.5 | | $ | 5.2 | |
| | | | | | | | | | | | | | | | | | | | |
| | | | | | | | | | | | | | | | | | | | |
| | | | | | | | | | | | | | | | | | | | |
| | | | | | | | | | | | | | | | | | |
| | Fiscal Year Ended |
| | September 30, 2023 | | September 30, 2022 | | September 30, 2021 |
| | U.S. | | Int’l | | U.S. | | Int’l | | U.S. | | Int’l |
|
| | (in millions) |
Components of net periodic benefit cost: | | | | | | | | | | | | | | | | | | |
Service costs | | $ | — | | $ | 0.3 | | $ | — | | $ | 0.5 | | $ | — | | $ | 0.5 |
Interest cost on projected benefit obligation | | | 9.8 | | | 47.7 | | | 4.7 | | | 24.1 | | | 4.3 | | | 21.6 |
Expected return on plan assets | | | (5.8) | | | (60.8) | | | (5.6) | | | (41.4) | | | (6.5) | | | (43.5) |
Amortization of prior service costs | | | — | | | 0.1 | | | — | | | 0.1 | | | — | | | 0.1 |
Amortization of net loss (gain) | | | 3.5 | | | (0.6) | | | 5.6 | | | 6.9 | | | 5.9 | | | 9.2 |
Settlement (gain) loss recognized | | | (0.1) | | | 0.2 | | | 0.2 | | | 0.3 | | | 0.2 | | | 0.8 |
Net periodic benefit cost (credit) | | $ | 7.4 | | $ | (13.1) | | $ | 4.9 | | $ | (9.5) | | $ | 3.9 | | $ | (11.3) |
The amount net of applicable deferred income taxes included in other comprehensive income arising from a change in net prior service cost and net gain/loss was $27.6$3.1 million, $26.2$18.8 million, and $6.9$9.3 million in the years ended September 30, 2017, 20162023, 2022 and 2015,2021, respectively.
Amounts included in accumulated other comprehensive loss as of September 30, 20172023 that are expected to be recognized as components of net periodic benefit cost during fiscal 20182024 are (in millions):
| | | | | | | |
| | U.S. | | Int'l | |
|---|
Amortization of prior service credit | | $ | — | | $ | 0.2 | |
Amortization of net actuarial losses | | | (4.0 | ) | | (8.2 | ) |
| | | | | | | | |
Total | | $ | (4.0 | ) | $ | (8.0 | ) |
| | | | | | | | |
| | | | | | | | |
| | | | | | | | |
| | | | | | |
| | U.S. | | Int’l |
Amortization of prior service cost | | $ | — | | $ | (0.1) |
Amortization of net actuarial (losses) gain | | | (3.1) | | | 2.3 |
Total | | $ | (3.1) | | $ | 2.2 |
The table below provides additional year-end information for pension plans with accumulated benefit obligations in excess of plan assets.
| | | | | | | | | | | | | | | | | | | |
| | Fiscal Year Ended | |
|---|
| | September 30,
2017 | | September 30,
2016 | | September 30,
2015 | |
|---|
| | U.S. | | Int'l | | U.S. | | Int'l | | U.S. | | Int'l | |
|---|
| | (in millions)
| |
|---|
Projected benefit obligation | | $ | 658.4 | | $ | 1,158.3 | | $ | 694.8 | | $ | 1,220.3 | | $ | 692.5 | | $ | 1,226.2 | |
Accumulated benefit obligation | | | 658.4 | | | 1,145.7 | | | 694.8 | | | 1,215.7 | | | 686.5 | | | 1,222.0 | |
Fair value of plan assets | | | 466.4 | | | 804.2 | | | 453.2 | | | 782.1 | | | 455.6 | | | 911.2 | |
| | | | | | | | | | | | | | | | | | |
| | Fiscal Year Ended |
| | September 30, | | September 30, | | September 30, |
| | 2023 | | 2022 | | 2021 |
| | U.S. | | Int’l | | U.S. | | Int’l | | U.S. | | Int’l |
|
| | (in millions) |
Projected benefit obligation | | $ | 168.8 | | $ | 628.1 | | $ | 184.8 | | $ | 601.4 | | $ | 247.8 | | $ | 1,248.8 |
Accumulated benefit obligation | | $ | 168.8 | | $ | 628.1 | | $ | 184.8 | | $ | 600.1 | | $ | 247.8 | | $ | 1,243.9 |
Fair value of plan assets | | $ | 98.8 | | $ | 506.5 | | $ | 101.4 | | $ | 456.9 | | $ | 138.9 | | $ | 982.4 |
Funding requirements for each pension plan are determined based on the local laws of the country where such pension plan resides. In certain countries, the funding requirements are mandatory while in other countries, they are discretionary. The Company currently intends to contribute $26.8$22.2 million to the international plans in fiscal 2018.2024. The required minimum contributions for U.S. plans are not significant. In addition, the Company may make discretionary contributions. The Company currently intends to contribute $12.7$12.9 million to U.S. plans in fiscal 2018.
2024.
Table of Contents
AECOM
NOTES TO CONSOLIDATED FINANCIAL STATEMENTS (Continued)
7. Pension Benefit Obligations (Continued)
The table below provides the expected future benefit payments, in millions:
| | | | | | |
Year Ending September 30, | | U.S. | | Int’l |
2024 | | $ | 20.2 | | $ | 47.1 |
2025 | | | 19.3 | | | 45.0 |
2026 | | | 19.1 | | | 46.3 |
2027 | | | 18.1 | | | 47.8 |
2028 | | | 17.4 | | | 49.3 |
2029-2033 | | | 74.3 | | | 267.6 |
Total | | $ | 168.4 | | $ | 503.1 |
| | | | | | | |
Year Ending September 30, | | U.S. | | Int'l | |
|---|
2018 | | $ | 43.0 | | $ | 47.4 | |
2019 | | | 40.4 | | | 47.8 | |
2020 | | | 41.5 | | | 47.2 | |
2021 | | | 41.6 | | | 50.3 | |
2022 | | | 41.8 | | | 52.1 | |
2023 - 2027 | | | 205.0 | | | 291.9 | |
| | | | | | | | |
Total | | $ | 413.3 | | $ | 536.7 | |
| | | | | | | | |
| | | | | | | | |
| | | | | | | | |
The underlying assumptions for the pension plans are as follows:
| | | | | | | | | | | | | | | | | | | |
| | Fiscal Year Ended | |
|---|
| | September 30,
2017 | | September 30,
2016 | | September 30,
2015 | |
|---|
| | U.S. | | Int'l | | U.S. | | Int'l | | U.S. | | Int'l | |
|---|
Weighted-average assumptions to determine benefit obligation: | | | | | | | | | | | | | | | | | | | |
Discount rate | | | 3.64 | % | | 2.67 | % | | 3.41 | % | | 2.35 | % | | 4.10 | % | | 3.80 | % |
Salary increase rate | | | N/A | | | 2.76 | % | | N/A | | | 2.61 | % | | 3.81 | % | | 2.51 | % |
Weighted-average assumptions to determine net periodic benefit cost: | | | | | | | | | | | | | | | | | | | |
Discount rate | | | 3.41 | % | | 2.35 | % | | 4.10 | % | | 3.80 | % | | 3.88 | % | | 3.92 | % |
Salary increase rate | | | N/A | | | 2.61 | % | | N/A | | | 2.65 | % | | 4.50 | % | | 2.65 | % |
Expected long-term rate of return on plan assets | | | 7.00 | % | | 5.10 | % | | 6.72 | % | | 5.74 | % | | 6.73 | % | | 6.00 | % |
| | | | | | | | | | | | | |
| | Fiscal Year Ended | |
| | September 30, | | September 30, | | September 30, | |
| | 2023 | | 2022 | | 2021 | |
| | U.S. | | Int’l | | U.S. | | Int’l | | U.S. | | Int’l | |
|
| | (in millions) | |
Weighted-average assumptions to determine benefit obligation: | | | | | | | | | | | | | |
Discount rate | | 5.76 | % | 5.65 | % | 5.40 | % | 5.27 | % | 2.46 | % | 1.98 | % |
Salary increase rate | | N/A | | 3.06 | % | N/A | | 3.48 | % | N/A | | 3.13 | % |
Weighted-average assumptions to determine net periodic benefit cost: | | | | | | | | | | | | | |
Discount rate | | 5.40 | % | 5.27 | % | 2.46 | % | 1.98 | % | 2.20 | % | 1.67 | % |
Salary increase rate | | N/A | | 3.48 | % | N/A | | 3.13 | % | N/A | | 2.68 | % |
Expected long-term rate of return on plan assets | | 7.00 | % | 6.04 | % | 6.25 | % | 3.93 | % | 6.80 | % | 3.95 | % |
Pension costs are determined using the assumptions as of the beginning of the plan year. The funded status is determined using the assumptions as of the end of the plan year.
The following table summarizes the Company'sCompany’s target allocation for 20172023 and pension plan asset allocation, both U.S. and international, as of September 30, 20172023 and 2016:2022:
| | | | | | | | | | | | | | | | | | | |
| |
| |
| | Percentage of Plan Assets
as of September 30, | |
|---|
| | Target Allocations | | 2017 | | 2016 | |
|---|
| | U.S. | | Int'l | | U.S. | | Int'l | | U.S. | | Int'l | |
|---|
Asset Category: | | | | | | | | | | | | | | | | | | | |
Equities | | | 43 | % | | 28 | % | | 43 | % | | 27 | % | | 42 | % | | 28 | % |
Debt | | | 48 | | | 35 | | | 47 | | | 38 | | | 49 | | | 34 | |
Cash | | | 1 | | | 5 | | | 1 | | | 2 | | | 1 | | | 7 | |
Property and other | | | 8 | | | 32 | | | 9 | | | 33 | | | 8 | | | 31 | |
| | | | | | | | | | | | | | | | | | | | |
Total | | | 100 | % | | 100 | % | | 100 | % | | 100 | % | | 100 | % | | 100 | % |
| | | | | | | | | | | | | | | | | | | | |
| | | | | | | | | | | | | | | | | | | | |
| | | | | | | | | | | | | | | | | | | | |
| | | | | | | | | | | | | |
| | | | Percentage of Plan Assets | |
| | | | | | as of September 30, | |
| | Target Allocations | | 2023 | | 2022 | |
| | U.S. | | Int’l | | U.S. | | Int’l | | U.S. | | Int’l | |
Asset Category: | | | | | | | | | | | | | |
Equities | | 32 | % | 27 | % | 33 | % | 24 | % | 36 | % | 20 | % |
Debt | | 58 | | 61 | | 56 | | 62 | | 48 | | 47 | |
Cash | | 2 | | — | | 2 | | 4 | | 5 | | 15 | |
Property and other | | 8 | | 12 | | 9 | | 10 | | 11 | | 18 | |
Total | | 100 | % | 100 | % | 100 | % | 100 | % | 100 | % | 100 | % |
The Company'sCompany’s domestic and foreign plans seek a competitive rate of return relative to an appropriate level of risk depending on the funded status and obligations of each plan and typically employ
Table of Contents
AECOM
NOTES TO CONSOLIDATED FINANCIAL STATEMENTS (Continued)
7. Pension Benefit Obligations (Continued)
both active and passive investment management strategies. The Company'sCompany’s risk management practices include diversification across asset classes and investment styles and periodic rebalancing toward asset allocation targets. The target asset allocation selected for each plan reflects a risk/return profile that the Company believes is appropriate relative to each plan'splan’s liability structure and return goals.
To develop the expected long-term rate of return on assets assumption, the Company considered the historical returns and the future expectations for returns for each asset class, as well as the target asset allocation of the pension portfolio and the diversification of the portfolio. This resulted in the selection of a 7.00% and 5.10%6.04% weighted-average long-term rate of return on assets assumption for the fiscal year ended September 30, 20172023 for U.S. and non-U.S. plans, respectively.
As of September 30, 2017,2023, the fair values of the Company'sCompany’s pension plan assets by major asset categories were as follows:
| | | | | | | | | | | | | |
| |
| | Fair Value Measurement as of
September 30, 2017 | |
|---|
| | Total
Carrying
Value as of
September 30,
2017 | | Quoted
Prices
in Active
Markets
(Level 1) | | Significant
Other
Observable
Inputs
(Level 2) | | Significant
Unobservable
Inputs
(Level 3) | |
|---|
| | (in millions)
| |
|---|
Cash and cash equivalents | | $ | 22.9 | | $ | 13.1 | | $ | 9.8 | | $ | — | |
Equity securities | | | | | | | | | | | | | |
Global equity securities | | | 0.8 | | | — | | | 0.8 | | | — | |
Domestic equity securities | | | 7.1 | | | 6.2 | | | 0.9 | | | — | |
Investment funds | | | | | | | | | | | | | |
Diversified funds | | | 212.8 | | | — | | | 212.8 | | | — | |
Equity funds | | | 467.9 | | | 6.4 | | | 461.5 | | | — | |
Fixed income funds | | | 610.6 | | | 3.5 | | | 607.1 | | | — | |
Hedge funds | | | 110.1 | | | — | | | 69.9 | | | 40.2 | |
Assets held by insurance company | | | 31.3 | | | — | | | 31.3 | | | — | |
| | | | | | | | | | | | | | |
Total | | $ | 1,463.5 | | $ | 29.2 | | $ | 1,394.1 | | $ | 40.2 | |
| | | | | | | | | | | | | | |
| | | | | | | | | | | | | | |
| | | | | | | | | | | | | | |
Table of Contents
| | | | | | | | | | | | | | | |
| | | | Fair Value Measurement as of | | | |
| | | | September 30, 2023 | | | |
| | Total | | Quoted | | Significant | | | | | |
| | Carrying | | Prices in | | Other | | Significant | | | |
| | Value as of | | Active | | Observable | | Unobservable | | Investments |
| | September 30, | | Markets | | Inputs | | Inputs | | measured at |
| | 2023 | | (Level 1) | | (Level 2) | | (Level 3) | | NAV |
|
| | (in millions) |
Cash and cash equivalents | | $ | 29.5 | | $ | 20.2 | | $ | 9.3 | | $ | — | | $ | — |
Debt securities | | | 338.3 | | | 338.3 | | | — | | | — | | | — |
Investment funds: | | | | | | | | | | | | | | | |
Diversified and equity funds | | | 43.5 | | | 30.3 | | | 13.2 | | | — | | | — |
Fixed income funds | | | 26.1 | | | 21.7 | | | 4.4 | | | — | | | — |
Common collective funds | | | 372.0 | | | — | | | — | | | — | | | 372.0 |
Derivative instruments | | | (37.3) | | | 1.5 | | | (38.8) | | | — | | | — |
Total | | $ | 772.1 | | $ | 412.0 | | $ | (11.9) | | $ | — | | $ | 372.0 |
AECOM
NOTES TO CONSOLIDATED FINANCIAL STATEMENTS (Continued)
7. Pension Benefit Obligations (Continued)
As of September 30, 2016,2022, the fair values of the Company's post-retirement benefitCompany’s pension plan assets by major asset categories arewere as follows:
| | | | | | | | | | | | | |
| |
| | Fair Value Measurement as of September 30, 2016 | |
|---|
| | Total
Carrying
Value as of
September 30,
2016 | | Quoted
Prices
in Active
Markets
(Level 1) | | Significant
Other
Observable
Inputs
(Level 2) | | Significant
Unobservable
Inputs
(Level 3) | |
|---|
| | (in millions)
| |
|---|
Cash and cash equivalents | | $ | 70.6 | | $ | 14.3 | | $ | 56.3 | | $ | — | |
Equity securities | | | | | | | | | | | | | |
Global equity securities | | | 49.4 | | | — | | | 49.4 | | | — | |
Domestic equity securities | | | 57.1 | | | — | | | 57.1 | | | — | |
Investment funds | | | | | | | | | | | | | |
Diversified funds | | | 223.1 | | | — | | | 223.1 | | | — | |
Equity funds | | | 362.0 | | | 5.1 | | | 356.9 | | | — | |
Fixed income funds | | | 548.5 | | | 3.7 | | | 544.8 | | | — | |
Hedge funds | | | 62.5 | | | — | | | 48.4 | | | 14.1 | |
Assets held by insurance company | | | 32.3 | | | — | | | 32.3 | | | — | |
Other | | | 24.6 | | | — | | | 24.6 | | | — | |
| | | | | | | | | | | | | | |
Total | | $ | 1,430.1 | | $ | 23.1 | | $ | 1,392.9 | | $ | 14.1 | |
| | | | | | | | | | | | | | |
| | | | | | | | | | | | | | |
| | | | | | | | | | | | | | |
| | | | | | | | | | | | | | | |
| | | | | Fair Value Measurement as of | | | |
| | | | | September 30, 2022 | | | |
| | Total | | Quoted | | Significant | | | | | |
| | Carrying | | Prices in | | Other | | Significant | | | |
| | Value as of | | Active | | Observable | | Unobservable | | Investments |
| | September 30, | | Markets | | Inputs | | Inputs | | measured at |
| | 2022 | | (Level 1) | | (Level 2) | | (Level 3) | | NAV |
|
| | (in millions) |
Cash and cash equivalents | | $ | 104.8 | | $ | 99.0 | | $ | 5.8 | | $ | — | | $ | — |
Debt securities | | | 339.1 | | | 339.1 | | | — | | | — | | | — |
Investment funds: | | | | | | | | | | | | | | | |
Diversified and equity funds | | | 22.2 | | | 7.3 | | | 14.9 | | | — | | | — |
Fixed income funds | | | 7.9 | | | 5.7 | | | 2.2 | | | — | | | — |
Common collective funds | | | 451.6 | | | — | | | — | | | — | | | 451.6 |
Derivative instruments | | | (140.7) | | | — | | | (140.7) | | | — | | | — |
Total | | $ | 784.9 | | $ | 451.1 | | $ | (117.8) | | $ | — | | $ | 451.6 |
Changes for the year ended September 30, 2017,2022 in the fair value of the Company'sCompany’s recurring post-retirement plan Level 3 assets are as follows:
| | | | | | | | | | | | | | | | | | | | | | |
| | September 30,
2016
Beginning
balance | | Actual return
on plan assets,
relating to
assets still held
at reporting
date | | Actual return
on plan assets,
relating to
assets sold
during the
period | | Purchases,
sales and
settlements | | Transfer
into /
(out of)
Level 3 | | Change
due to
exchange
rate
changes | | September 30,
2017
Ending
balance | |
|---|
| | (in millions)
| |
|---|
Investment funds | | | | | | | | | | | | | | | | | | | | | | |
Hedge funds | | $ | 14.1 | | $ | (0.2 | ) | $ | — | | $ | — | | $ | 26.3 | | $ | — | | $ | 40.2 | |
Changes for the year ended September 30, 2016, in the fair value of the Company's recurring post-retirement plan Level 3 assets are as follows:
| | | | | | | | | | | | | | | | | | | | | | |
| | September 30,
2015
Beginning
balance | | Actual return
on plan assets,
relating to
assets still held
at reporting
date | | Actual return
on plan assets,
relating to
assets sold
during the
period | | Purchases,
sales
and
settlements | | Transfer
into /
(out of)
Level 3 | | Change
due to
exchange
rate
changes | | September 30,
2016
Ending
balance | |
|---|
| | (in millions)
| |
|---|
Investment funds | | | | | | | | | | | | | | | | | | | | | | |
Hedge funds | | $ | 13.6 | | $ | 0.5 | | $ | — | | $ | — | | $ | — | | $ | — | | $ | 14.1 | |
| | | | | | | | | | | | | | | | | | | | | |
| | | | Actual return | | Actual return | | | | | | | | |
| | | | on plan assets, | | on plan assets, | | | | | | Change | | |
| | September 30, | | relating to | | relating to | | | | Transfer | | due to | | | |
| | 2021 | | assets still | | assets sold | | Purchases, | | into / | | exchange | | September 30, |
| | Beginning | | held at | | during the | | sales and | ��� | (out of) | | rate | | 2022 |
| | balance | | reporting date | | period | | settlements | | Level 3 | | changes | | Ending balance |
|
| | (in millions) |
Level 3 Assets | | $ | 4.0 | | $ | — | | $ | (0.2) | | $ | (3.5) | | $ | — | | $ | (0.3) | | $ | — |
Table of Contents
AECOM
NOTES TO CONSOLIDATED FINANCIAL STATEMENTS (Continued)
7. Pension Benefit Obligations (Continued)
Cash equivalents are mostly comprised of short-term money-market instruments and are valued at cost, which approximates fair value.
For equity investment funds not traded on an active exchange, or if the closing price is not available, the trustee obtains indicative quotes from a pricing vendor, broker, or investment manager. These funds are categorized as Level 2 if the custodian obtains
corroborated quotes from a pricing vendor or categorized as Level 3 if the custodian obtains uncorroborated quotes from a broker or investment manager.
Fixed income investment funds, not traded on an active exchange, categorized as Level 2 are valued by the trustee using pricing models that use verifiable observable market data (e.g., interest rates and yield curves observable at commonly quoted intervals), bids provided by brokers or dealers, or quoted prices of securities with similar characteristics.
Hedge funds categorized as Level 3 are valued based on valuation models that include significant unobservable inputs and cannot be corroborated using verifiable observable market data. Hedge funds are valued by independent administrators. Depending on the nature of the assets, the general partners or independent administrators use both the income and market approaches in their models. The market approach consists of analyzing market transactions for comparable assets while the income approach uses earnings or the net present value of estimated future cash flows adjusted for liquidity and other risk factors. As of September 30, 2017,2023, there were no material changes to the valuation techniques.
Common collective funds are valued based on net asset value (NAV) per share or unit as a practical expedient as reported by the fund manager, multiplied by the number of shares or units held as of the measurement date. Accordingly, these NAV-based investments have been excluded from the fair value hierarchy. These collective investment funds have redemption notice periods and are redeemable at the NAV, less transaction fees. There are no significant unfunded commitments related to these investments.
Multiemployer Pension Plans
The Company participates in over 200 construction-industry multiemployer pension plans. Generally, the plans provide defined benefits to substantially all employees covered by collective bargaining agreements. Under the Employee Retirement Income Security Act, a contributor to a multiemployer plan is liable, upon termination or withdrawal from a plan, for its proportionate share of a plan'splan’s unfunded vested liability. The Company'sCompany’s aggregate contributions to these multiemployer plans were $48.8$3.0 million and $49.5$2.9 million for the years ended September 30, 20172023 and 2016,2022, respectively. At September 30, 20172023 and 2016,2022, none of the plans in which the Company participates are individually significant to its consolidated financial statements.
Table of Contents
AECOM
NOTES TO CONSOLIDATED FINANCIAL STATEMENTS (Continued)
8. Debt
Debt consisted of the following:
| | | | | | | |
| | September 30,
2017 | | September 30,
2016 | |
|---|
| | (in millions)
| |
|---|
2014 Credit Agreement | | $ | 908.7 | | $ | 1,954.9 | |
2014 Senior Notes | | | 1,600.0 | | | 1,600.0 | |
2017 Senior Notes | | | 1,000.0 | | | — | |
URS Senior Notes | | | 247.7 | | | 427.7 | |
Other debt | | | 140.0 | | | 142.7 | |
| | | | | | | | |
Total debt | | | 3,896.4 | | | 4,125.3 | |
Less: Current portion of debt and short-term borrowings | | | (142.0 | ) | | (366.3 | ) |
Less: Unamortized debt issuance costs | | | (52.3 | ) | | (56.8 | ) |
| | | | | | | | |
Long-term debt | | $ | 3,702.1 | | $ | 3,702.2 | |
| | | | | | | | |
| | | | | | | | |
| | | | | | | | |
| | | | | | |
| | September 30, | | September 30, |
| | 2023 | | 2022 |
|
| | (in millions) |
Credit Agreement | | $ | 1,119.8 | | $ | 1,143.3 |
2027 Senior Notes | | | 997.3 | | | 997.3 |
Other debt | | | 100.2 | | | 84.0 |
Total debt | | | 2,217.3 | | | 2,224.6 |
Less: Current portion of debt and short-term borrowings | | | (89.5) | | | (48.6) |
Less: Unamortized debt issuance costs | | | (14.4) | | | (19.3) |
Long-term debt | | $ | 2,113.4 | | $ | 2,156.7 |
The following table presents, in millions, scheduled maturities of the Company'sCompany’s debt as of September 30, 2017:2023:
| | | |
Fiscal Year | | | |
2024 | | $ | 89.5 |
2025 | | | 49.6 |
2026 | | | 412.6 |
2027 | | | 1,009.2 |
2028 | | | 656.4 |
Thereafter | | | — |
Total | | $ | 2,217.3 |
| | | | |
Fiscal Year | |
| |
|---|
2018 | | $ | 142.0 | |
2019 | | | 154.4 | |
2020 | | | 122.6 | |
2021 | | | 603.7 | |
2022 | | | 256.7 | |
Thereafter | | | 2,617.0 | |
| | | | | |
Total | | $ | 3,896.4 | |
| | | | | |
| | | | | |
| | | | | |
TheOn February 8, 2021, the Company entered into a credit agreement (Credit Agreement) onthe 2021 Refinancing Amendment to the Credit Agreement (as amended, modified or otherwise supplemented, the “Credit Agreement”), pursuant to which the Company amended and restated its Syndicated Credit Facility Agreement, dated as of October 17, 2014 (as amended prior to February 8, 2021, the “Original Credit Agreement”), between the Company, as amended, consistingborrower, Bank of (i)America, N.A., as administrative agent, and other parties thereto. At the time of amendment, the Credit Agreement consisted of a $1,150,000,000 revolving credit facility (the “Revolving Credit Facility”) and a $246,968,737.50 term loan A facility (the “Term A Facility,” together with the Revolving Credit Facility, the “Credit Facilities”), each of which mature on February 8, 2026. The outstanding loans under the Term A Facility were borrowed in U.S. dollars. Loans under the Revolving Credit Facility may be borrowed, and letters of credit thereunder may be issued, in U.S. dollars or in certain foreign currencies. The proceeds of the Revolving Credit Facility may be used from time to time for ongoing working capital and for other general corporate purposes. The proceeds of the Revolving Credit Facility and the Term A Loan facility borrowed on February 8, 2021 were used to refinance the existing revolving credit facility and the existing term loan facility under the Original Credit Agreement and to pay related fees and expenses. The Credit Agreement permits the Company to designate certain of its subsidiaries as additional co-borrowers from time to time. Currently, there are no co-borrowers under the Credit Facilities.
On April 13, 2021, the Company entered into Amendment No. 10 to the Credit Agreement, pursuant to which the lenders thereunder provided a secured term B credit facility (the “Term B Facility”) to the Company in an aggregate principal amount of $1.925 billion, (ii) a term loan$700,000,000. The Term B facilityFacility matures on April 13, 2028. The proceeds of the Term B Facility were used to fund the purchase price, fees and expenses in connection with the Company’s cash tender offer to purchase up to $700,000,000 aggregate purchase price (not including any accrued and unpaid interest) of its outstanding 5.875% Senior Notes due 2024.
On June 25, 2021, the Company entered into Amendment No. 11 to the Credit Agreement, pursuant to which lenders thereunder have provided the Company an additional $215,000,000 in aggregate principal amount under the Term A Facility. The Company used the net proceeds from the increase in the Term A Facility (together with cash on hand), to (i) redeem all of $0.76 billionthe Company’s remaining 5.875% Senior Notes due 2024 and (iii) a revolving credit facility in an aggregate principal amount of $1.05 billion. These facilities under(ii) pay fees and expenses related to such redemption.
On May 23, 2023, the Company entered into Amendment No. 12 to the Credit Agreement, may be increasedpursuant to which LIBOR as a benchmark rate of interest was replaced by, an additional amountin the case of upUS Dollar-denominated loans, a secured overnight financing rate subject to $500 million. Thea spread adjustment, and, in the case of loans denominated in other currencies, other customary successor rates, subject in certain cases to a spread adjustment. On May 23, 2023, the Company entered into Amendment No. 13 to the Credit Agreement's term extendsAgreement, pursuant to September 29, 2021which the spread adjustments with respect to the revolving credit facilityRevolving Credit Facility and the term loanTerm A facilityFacility was amended.
The applicable interest rate for loans under the Term B Facility is calculated at a per annum rate equal to, at the Company’s option, (a) the Term SOFR (as defined in the Credit Agreement) plus 1.75% or (b) the Base Rate (as defined in the Credit Agreement) plus 0.75%.
The applicable interest rate for U.S. Dollar-denominated loans under the Revolving Credit Facility and October 17, 2021the Term A Facility is calculated at a per annum rate equal to, at the Company’s option, (a) the Term SOFR (as defined in the Credit Agreement) plus an applicable margin (the “SOFR Applicable Margin”), which is currently at 1.2250% or (b) the Base Rate (as defined in the Credit Agreement) plus an applicable margin (the “Base Rate Applicable Margin,” and together with respectthe SOFR Applicable Margin, the “Applicable Margins”), which is currently at 0.2250%. The applicable interest rate for loans under the Revolving Credit Facility denominated in other currencies is calculated at a per annum rate equal to a customary floating reference rate for such currency specified in the Credit Agreement plus the SOFR Applicable Margin. The Credit Agreement includes certain environmental, social and governance (ESG) metrics relating to the term loan B facility, althoughCompany’s CO2 emissions and its percentage of employees who identify as women (each, a “Sustainability Metric”). The Applicable Margins for the term loan B facility was paid in fullTerm A Facility and the Revolving Credit Facility and the commitment fees for the Revolving Credit Facility will be adjusted on February 21, 2017. an annual basis based on the Company’s achievement of preset thresholds for each Sustainability Metric.
Some subsidiaries of the Company (Guarantors)Company’s material subsidiaries (the “Guarantors”) have guaranteed the Company’s obligations of the borrowers under the Credit Agreement.Agreement, subject to certain exceptions. The borrowers'borrowers’ obligations under the Credit Agreement are secured by a lien on substantially all of the Company’s assets of the Company and the Guarantors pursuant to a security and pledge agreement (Security Agreement). The collateral under the Security Agreement isits Guarantors’ assets, subject to release upon fulfillment of certain conditions specified in the Credit Agreement and Security Agreement.exceptions.
The Credit Agreement contains customary negative covenants that limitinclude, among other things, limitations on the ability of the Company and certain of its subsidiaries, subject to among other things: (i) create,certain exceptions, to incur assume,liens and debt, make investments, dispositions, and restricted payments, change the nature of their business, consummate mergers, consolidations and the sale of all or suffer to exist liens; (ii) incur or guarantee indebtedness; (iii) pay dividends or repurchase stock; (iv) enter into transactions with affiliates;substantially all of
AECOM
NOTES TO CONSOLIDATED FINANCIAL STATEMENTS (Continued)
8. Debt (Continued)
(v) consummate asset sales, acquisitions or mergers; (vi) enter into certain types of burdensome agreements; or (vii) make investments.
On July 1, 2015, the Credit Agreement was amended to revise the definition of "Consolidated EBITDA" to increase the allowance for acquisitiontheir respective assets, taken as a whole, and integration expenses related to the acquisition of URS.
On December 22, 2015, the Credit Agreement was amended to further revise the definition of "Consolidated EBITDA" by further increasing the allowance for acquisition and integration expenses related to the acquisition of URS and to allow for an internal corporate restructuring primarily involving its international subsidiaries.
On September 29, 2016, the Credit Agreement and the Security Agreement were amended to (1) lower the applicable interest rate margins for the term loan A and the revolving credit facilities, and lower the applicable letter of credit fees and commitment fees to the revised consolidated leverage levels; (2) extend the term of the term loan A and the revolving credit facility to September 29, 2021; (3) add a new delayed draw term loan A facility tranche in the amount of $185.0 million; (4) replace the then existing $500 million performance letter of credit facilitytransact with a $500 million basket to enter into secured letters of credit outside the Credit Agreement; and (5) revise certain covenants, including the Maximum Consolidated Leverage Ratio so that the step down from a 5.00 to a 4.75 leverage ratio is effective as of March 31, 2017 as well as the investment basket for its AECOM Capital business.
On March 31, 2017, the Credit Agreement was amended to (1) expand the ability of restricted subsidiaries to borrow under "Incremental Term Loans"; (2) revise the definition of "Working Capital" as used in "Excess Cash Flow"; (3) revise the definitions for "Consolidated EBITDA" and "Consolidated Funded Indebtedness" to reflect the expected gain and debt repayment of an AECOM Capital disposition, which disposition was completed on April 28, 2017; and (4) amend provisions relating to the Company's ability to undertake certain internal restructuring steps to accommodate changes in tax laws.
Under the Credit Agreement, theaffiliates. The Company is subjectalso required to maintain a maximum consolidated leverage ratio and minimum consolidated interest coverage ratio of at least 3.00 to 1.00 and a consolidated leverage ratio of less than or equal to 4.00 to 1.00 (subject to certain adjustments in connection with permitted acquisitions), tested on a quarterly basis (the “Financial Covenants”). The Financial Covenants do not apply to the end of each fiscal quarter.Term B Facility. The Company's Consolidated Leverage RatioCompany’s consolidated leverage ratio was 4.02.00 to 1.00 at September 30, 2017. The Company's Consolidated Interest Coverage Ratio was 4.7 at September 30, 2017.2023. As of September 30, 2017,2023, the Company was in compliance with the covenants of the Credit Agreement.
The Credit Agreement contains customary affirmative covenants, including, among other things, compliance with applicable law, preservation of existence, maintenance of properties and of insurance, and keeping proper books and records. The Credit Agreement contains customary events of default, including, among other things, nonpayment of principal, interest or fees, cross-defaults to other debt, inaccuracies of representations and warranties, failure to perform covenants, events of bankruptcy and insolvency, change of control and unsatisfied judgments, subject in certain cases to notice and cure periods and other exceptions.
At September 30, 20172023 and 2016, outstanding standbySeptember 30, 2022, letters of credit totaled $58.1$4.4 million and $92.3$4.4 million, respectively, under the Company's revolving credit facilities.our Revolving Credit Facility. As of September 30, 20172023 and 2016, the CompanySeptember 30, 2022, we had $991.9$1,145.6 million and $888.4$1,145.6 million, respectively, available under itsour revolving credit facility.
On October 6, 2014,February 21, 2017, the Company completed a private placement offering of $800,000,000$1,000,000,000 aggregate principal amount of its unsecured 5.750%5.125% Senior Notes due 2022 (2022 Notes) and $800,000,000 aggregate principal amount of its unsecured 5.875%2027 (the “2027 Senior Notes”). On June 30, 2017, the Company completed an exchange offer to exchange the unregistered 2027 Senior Notes due 2024 (the 2024 Notes and, together with the 2022 Notes, the 2014 Senior Notes).for registered notes, as well as related guarantees.
As of September 30, 2017,2023, the estimated fair value of its 2014the 2027 Senior Notes was approximately $836.0 million for the 2022 Notes and $884.0 million for the 2024 Notes.$939.9 million. The fair value of the 20142027 Senior
Table of Contents
AECOM
NOTES TO CONSOLIDATED FINANCIAL STATEMENTS (Continued)
8. Debt (Continued)
Notes as of September 30, 20172023 was derived by taking the mid-point of the trading prices from an observable market input (Level 2) in the secondary bond market and multiplying it by the outstanding balance of the 2014 Senior Notes.
At any time prior to October 15, 2017, the Company may redeem all or part of the 2022 Notes, at a redemption price equal to 100% of their principal amount, plus a "make whole" premium as of the redemption date, and accrued and unpaid interest (subject to the rights of holders of record on the relevant record date to receive interest due on the relevant interest payment date). In addition, at any time prior to October 15, 2017, the Company may redeem up to 35% of the original aggregate principal amount of the 2022 Notes with the proceeds of one or more equity offerings, at a redemption price equal to 105.750%, plus accrued and unpaid interest. Furthermore, at any time on or after October 15, 2017, the Company may redeem the 2022 Notes, in whole or in part, at once or over time, at the specified redemption prices plus accrued and unpaid interest thereon to the redemption date. At any time prior to July 15, 2024, the Company may redeem on one or more occasions all or part of the 2024 Notes at a redemption price equal to the sum of (i) 100% of the principal amount thereof, plus (ii) a "make-whole" premium as of the date of the redemption, plus any accrued and unpaid interest to the date of redemption. In addition, on or after July 15, 2024, the 2024 Notes may be redeemed at a redemption price of 100% of the principal amount thereof, plus accrued and unpaid interest to the date of redemption.
The indenture pursuant to which the 2014 Senior Notes were issued contains customary events of default, including, among other things, payment default, exchange default, failure to provide certain notices thereunder and certain provisions related to bankruptcy events. The indenture also contains customary negative covenants.
On November 2, 2015, the Company completed an exchange offer to exchange the unregistered 2014 Senior Notes for registered notes, as well as all related guarantees.
The Company was in compliance with the covenants relating to the 2014 Senior Notes as of September 30, 2017.
On February 21, 2017, the Company completed a private placement offering of $1,000,000,000 aggregate principal amount of its unsecured 5.125% Senior Notes due 2027 (the 2017 Senior Notes) and used the note proceeds to immediately retire the remaining $127.6 million outstanding on the term loan B facility as well as repay $600 million of the term loan A facility and $250 million of the revolving credit facility under its Credit Agreement.
As of September 30, 2017, the estimated fair value of the Company's 2017 Senior Notes was approximately $1,031.3 million. The fair value of the Company's 2017 Senior Notes as of September 30, 2017 was derived by taking the mid-point of the trading prices from an observable market input (Level 2) in the secondary bond market and multiplying it by the outstanding balance of the 2017 Senior Notes. Interest will beis payable on the 20172027 Senior Notes at a rate of 5.125% per annum. Interest on the 20172027 Senior Notes will beis payable semi-annually on March 15 and September 15 of each year, commencing on September 15, 2017. The 20172027 Senior Notes will mature on March 15, 2027.
At any time and from time to time prior to December 15, 2026, the Company may redeem all or part of the 20172027 Senior Notes, at a redemption price equal to 100% of their principal amount, plus a "make whole"“make whole” premium as of the redemption date, and accrued and unpaid interest to the redemption date.
Table of Contents
AECOM
NOTES TO CONSOLIDATED FINANCIAL STATEMENTS (Continued)
8. Debt (Continued)
In addition, at any time and from time to time prior to March 15, 2020, the Company may redeem up to 35% of the original aggregate principal amount of the 2017 Senior Notes with the proceeds of one or more qualified equity offerings, at a redemption price equal to 105.125%, plus accrued and unpaid interest. Furthermore, at any time on On or after December 15, 2026, the Company may redeem on one or more occasions all or part of the 20172027 Senior Notes at a redemption price equal to 100% of their principal amount, plus accrued and unpaid interest.interest on the redemption date.
The indenture pursuant to which the 20172027 Senior Notes were issued contains customary events of default, including, among other things, payment default, exchange default, failure to provide certain notices thereunder and certain provisions related to bankruptcy events. The indenture also contains customary negative covenants.
The Company and the Guarantors filed a registration statement on Form S-4 with the SEC on May 11, 2017 that was declared effective by the SEC on May 25, 2017 to exchange the unregistered 2017 Senior Notes for registered notes and guarantees having terms substantially identical in all material respects. On June 30, 2017, the Company completed its exchange offer by exchanging $999,074,000 aggregate principal amount of the unregistered 2017 Senior Notes with registered notes, as well as all related guarantees. $926,000 aggregate principal amount of the unregistered 2017 Senior Notes remained outstanding as of September 30, 2017.
The Company was in compliance with the covenants relating to its 2017the 2027 Senior Notes as of September 30, 2017.
In connection with the URS acquisition, the Company assumed the URS 3.85% Senior Notes due 2017 (2017 URS Senior Notes) and the URS 5.00% Senior Notes due 2022 (2022 URS Senior Notes), totaling $1.0 billion (URS Senior Notes). The URS acquisition triggered change in control provisions in the URS Senior Notes that allowed the holders of the URS Senior Notes to redeem their URS Senior Notes at a cash price equal to 101% of the principal amount and, accordingly, the Company redeemed $572.3 million of the URS Senior Notes on October 24, 2014. The remaining 2017 URS Senior Notes matured and were fully redeemed on April 3, 2017 for $179.2 million using proceeds from a $185 million delayed draw term loan A facility tranche under the Credit Agreement. The 2022 URS Senior Notes are general unsecured senior obligations of AECOM Global II, LLC (as successor in interest to URS) and are fully and unconditionally guaranteed on a joint-and-several basis by certain former URS domestic subsidiary guarantors.2023.
As of September 30, 2017, the estimated fair value of the 2022 URS Senior Notes was approximately $259.7 million. The carrying value of the 2022 URS Senior Notes on the Company's Consolidated Balance Sheets as of September 30, 2017 was $247.7 million. The fair value of the 2022 URS Senior Notes as of September 30, 2017 was derived by taking the mid-point of the trading prices from an observable market input (Level 2) in the secondary bond market and multiplying it by the outstanding balance of the 2022 URS Senior Notes.
As of September 30, 2017, the Company was in compliance with the covenants relating to the 2022 URS Senior Notes.
Table of Contents
AECOM
NOTES TO CONSOLIDATED FINANCIAL STATEMENTS (Continued)
8. Debt (Continued)
Other debt consists primarily of obligations under capital leases and loans, and unsecured credit facilities. The Company'sCompany’s unsecured credit facilities are primarily used for standby letters of credit issued in connection with general and professional liability insurance programs and for payment ofcontract performance guarantees. At September 30, 20172023 and 2016,September 30, 2022, these outstanding standby letters of credit totaled $445.7$878.9 million and $382.2$640.3 million, respectively. As of September 30, 2017,2023, the Company had $502.3$416.7 million available under these unsecured credit facilities.
The Company'sCompany’s average effective interest rate on its total debt, including the effects of the interest rate swap and interest rate cap agreements, during the years ended September 30, 2017, 20162023, 2022 and 20152021 was 4.6%5.3%, 4.4%3.8% and 4.2%4.4%, respectively.
Interest expense in the consolidated statements of operations for the years ended September 30, 2017 and 2016 included amortization of deferred debt issuance costs for the years ended September 30, 2023, 2022 and 2021 of $17.5$4.9 million, $4.9 million and $30.9$10.2 million, respectively.
9. Derivative Financial Instruments and Fair Value Measurements
The Company uses certain interest rate derivative contracts to hedge interest rate exposures on the Company'sCompany’s variable rate debt. The Company enters into foreign currency derivative contracts with financial institutions to reduce the risk that its cash flows and earnings will be adversely affected by foreign currency exchange rate fluctuations. The Company'sCompany’s hedging program is not designated for trading or speculative purposes.
The Company recognizes derivative instruments as either assets or liabilities on the accompanying consolidated balance sheets at fair value. The Company records changes in the fair value (i.e., gains or losses) of the derivatives that have been designated as accounting hedges in the accompanying consolidated statements of operations as cost of revenue, interest expense or to accumulated other comprehensive loss in the accompanying consolidated balance sheets.
The Company uses interest rate swap and interest rate cap agreements designated as cash flow hedges to fix thelimit exposure to variable interest rates on portions of the Company'sCompany’s debt. The Company also uses foreign currency contracts designated as cash flow hedges to hedge forecasted revenue transactions denominated in currencies other than the U.S. dollar. The Company initially reports any gain on the effective portion of a cash flow hedge as a component of accumulated other comprehensive loss. Depending on the type of cash flow hedge, the gain is subsequently reclassified to eitheragainst interest expense when the interest expense on the variable rate debt is recognized, or to cost of revenue when the hedged revenues are recorded.recognized. If the hedged transaction becomes probable of not occurring, any gain or loss related to interest rate swap agreements or foreign currency contractsinterest rate cap agreements would be recognized in other income (expense). Further,income.
During the Company excludesthird quarter of fiscal 2023, the change in the time value of the foreign currency contractshedged debt index was changed from the assessment of hedge effectiveness. The Company records the premium paid or time value of a contract on the date of purchase as an asset. Thereafter, the Company recognizes any changeLIBOR to this time value in cost of revenue.
Table of Contents
AECOM
NOTES TO CONSOLIDATED FINANCIAL STATEMENTS (Continued)
9. Derivative Financial Instruments and Fair Value Measurements (Continued)
SOFR. The notional principal, fixed rates and related effective and expiration dates of the Company'sCompany’s outstanding interest rate swap agreements were as follows:
| | | | | | | | | | |
| | September 30, 2017 | |
|
|---|
| | Notional Amount
(in millions) | | Fixed
Rate | | Expiration
Date | |
|
|---|
| | $ | 300.0 | | | 1.63 | % | June 2018 | | |
| | | 300.0 | | | 1.54 | % | September 2018 | | |
| | | | | | | | | | |
| | September 30, 2016 | |
|
|---|
| | Notional Amount
(in millions) | | Fixed
Rate | | Expiration
Date | |
|
|---|
| | $ | 300.0 | | | 1.63 | % | June 2018 | | |
| | | 300.0 | | | 1.54 | % | September 2018 | | |
| | | | | | | | | |
September 30, 2023 |
Notional Amount | | Notional Amount | | Fixed | | Effective | | Expiration |
Currency | | (in millions) | | Rate | | Date | | Date |
USD | | | 400.0 | | 1.283 | % | February 2023 | | March 2028 |
| | | | | | | | | |
September 30, 2022 |
Notional Amount | | Notional Amount | | Fixed | | Effective | | Expiration |
Currency | | (in millions) | | Rate | | Date | | Date |
USD | | | 200.0 | | 2.60 | % | March 2018 | | February 2023 |
USD | | | 400.0 | | 1.349 | % | February 2023 | | March 2028 |
In the fourth quarter of fiscal 2021, the Company entered into new interest rate swap agreements with a notional value of $400.0 million to manage the interest rate exposure of its variable rate loans. The new swaps will become effective February 2023 and terminate in March 2028. By entering into the swap agreements, the Company converted a portion of the SOFR rate-based liability into a fixed rate liability. The Company will pay a fixed rate of 1.283% and receive payment at the prevailing one-month SOFR.
In the third quarter of fiscal 2022, the Company purchased interest rate cap agreements with a notional principalvalue of outstanding foreign currency contracts$300.0 million to purchase Australian dollars (AUD) was AUD 15.1 million (or $11.3 million) at Septembermanage interest rate exposure of its variable rate loans. The caps became effective on June 30, 2017.2022 and terminate in March 2028. The notional principal of outstanding foreign currency contractscaps reduce the Company’s exposure to purchase Australian dollars with U.S. dollars was AUD 58.6 million (or $43.4 million) at September 30, 2016.one-month SOFR. In the event one-month SOFR exceeds 3.465%, the Company will pay the spread between prevailing one-month SOFR and 3.465%.
The Company uses foreign currency forward contracts which are not designated as accounting hedges to hedge intercompany transactions and other monetary assets or liabilities denominated in currencies other than the functional currency of a subsidiary. Gains and losses on these contracts were not material for the years ended September 30, 2017, 20162023, 2022 and 2015.2021.
The Company'sCompany’s non-pension financial assets and liabilities recorded at fair valuesvalue relate to derivative instrumentsthe interest rate swap and interest rate cap agreements included in other current assets and other non-current assets on September 30, 2023 and were not material at$17.2 million and $37.5 million, respectively. The fair values of the interest rate swap and interest rate cap agreements included in other current assets and other non-current assets on September 30, 2017 or 2016.2022 were $9.4 million and $41.8 million, respectively. The fair values of the interest rate
swap and interest rate cap agreements were derived by taking the net present value of the expected cash flows using observable market inputs (Level 2) such as SOFR rate curves, futures, volatilities and basis spreads (when applicable).
See Note 17 for accumulated balances and reporting period activities of derivatives related to reclassifications out of accumulated other comprehensive income or loss for the years ended September 30, 2017, 20162023, 2022 and 2015. Amounts recognized in accumulated other comprehensive loss from the Company's foreign currency options were immaterial for all years presented. Amounts reclassified from accumulated other comprehensive loss into income from the foreign currency options were immaterial for all years presented.2021. Additionally, there were no material losses recognized in income due to amounts excluded from effectiveness testing from the Company'sCompany’s interest rate swap agreements.
During the year ended September 30, 2015, the Company entered into a contingent consideration arrangement in connection with a business acquisition. Under the arrangement, the Company agreed to pay cash to the sellers if certain financial performance thresholds are achieved in the future. The fair value of the contingent consideration liability, net of amounts paid, as of September 30, 2017 and 2016 was $13 million and $39 million, respectively, which decreased due to payments of approximately $21 million, and a change in estimated fair value during the year ended September 30, 2017. This liability is a Level 3 fair value measurement recorded within other accrued liabilities, and was valued based on estimated future
Table of Contents
AECOM
NOTES TO CONSOLIDATED FINANCIAL STATEMENTS (Continued)
9. Derivative Financial Instruments and Fair Value Measurements (Continued)
net cash flows. Any future changes in the fair value of this contingent consideration liability will be recognized in earnings during the applicable period.
10. Concentration of Credit Risk
Financial instruments which potentially subject the Company to concentrations of credit risk consist principally of cash investments and trade receivables. The Company'sCompany’s cash balances and short-term investments are maintained in accounts held by major banks and financial institutions located primarily in the U.S., Canada, Europe, Australia, Middle East and Hong Kong. If the Company extends significant credit to clients in a specific geographic area or industry, the Company may experience disproportionately high levels of default if those clients are adversely affected by factors particular to their geographic area or industry. Concentrations of credit risk with respect to trade receivables are limited due to the large number of customers comprising the Company'sCompany’s customer base, including, in large part, governments, government agencies and quasi-government organizations, and their dispersion across many different industries and geographies. See Note 194 regarding the Company'sCompany’s foreign revenues. In order to mitigate credit risk, the Company continually reviews the credit worthiness of its major private clients.
11. Leases
The Company and its subsidiaries are lessees in non-cancelable leasing agreements for office buildings and equipment. Substantially all of the Company’s office building leases are operating leases, and its equipment leases are both operating and finance leases. The Company groups lease and non-lease components for its equipment leases into a single lease component but separates lease and non-lease components for its office building leases.
The Company recognizes a right-of-use asset and lease liability for its operating leases at the commencement date equal to the present value of the contractual minimum lease payments over the lease term. The present value is calculated using the rate implicit in the lease, if known, or the Company’s incremental secured borrowing rate. The discount rate used for operating leases is primarily determined based on an analysis of the Company’s incremental secured borrowing rate, while the discount rate used for finance leases is primarily determined by the rate specified in the lease.
The related lease payments are expensed on a straight-line basis over the lease term, including, as applicable, any free-rent period during which the Company has the right to use the asset. For leases with renewal options where the renewal is reasonably assured, the lease term, including the renewal period, is used to determine the appropriate lease classification and to compute periodic rental expense. Leases with initial terms shorter than 12 months are not recognized on the balance sheet, and lease expense is recognized on a straight-line basis.
During the fourth quarter of fiscal 2023, the Company approved a restructuring plan primarily to optimize its office real estate portfolio with its freedom to grow strategy, which initiated a review of the carrying value of right-of-use assets and leasehold improvements. In connection with the review, the Company identified leased assets that were no longer recoverable. The following table presents,Company recorded an impairment charge of $86.2 million to reduce its right-of-use assets and leasehold improvements to their fair values and recorded the expense in millions, amounts payable under non-cancelable operatingrestructuring costs on the Consolidated Statement of Operations. Fair value was determined primarily using Level 3 inputs, such as discounted cash flows.
The components of lease commitments during the following fiscal years:expenses are as follows:
| | | | | | | | | |
| | Fiscal Year Ended |
| | September 30, 2023 | | September 30, 2022 | | September 30, 2021 |
|
| | (in millions) |
Operating lease cost | | $ | 164.0 | | $ | 172.5 | | $ | 186.5 |
Finance lease cost: | | | | | | | | | |
Amortization of right-of-use assets | | | 23.1 | | | 18.0 | | | 13.0 |
Interest on lease liabilities | | | 2.6 | | | 2.2 | | | 2.0 |
Variable lease cost | | | 34.1 | | | 34.0 | | | 35.5 |
Total lease cost | | $ | 223.8 | | $ | 226.7 | | $ | 237.0 |
Additional balance sheet information related to leases is as follows:
| | | | | | | | |
(in millions except as noted) | | Balance Sheet Classification | | September 30, 2023 | | September 30, 2022 |
Assets: | | | | | | | | |
Operating lease assets | | Operating lease right-of-use assets | | $ | 447.0 | | $ | 539.8 |
Finance lease assets | | Property and equipment – net | | | 64.8 | | | 49.4 |
Total lease assets | | | | $ | 511.8 | | $ | 589.2 |
| | | | | | | | |
Liabilities: | | | | | | | | |
Current: | | | | | | | | |
Operating lease liabilities | | Accrued expenses and other current liabilities | | $ | 139.8 | | $ | 145.6 |
Finance lease liabilities | | Current portion of long-term debt | | | 25.0 | | | 18.1 |
Total current lease liabilities | | | | | 164.8 | | | 163.7 |
Non-current: | | | | | | | | |
Operating lease liabilities | | Operating lease liabilities, noncurrent | | | 548.9 | | | 595.3 |
Finance lease liabilities | | Long-term debt | | | 39.8 | | | 32.0 |
Total non-current lease liabilities | | | | $ | 588.7 | | $ | 627.3 |
| | | | | | | |
| | As of | |
| | September 30, 2023 | | September 30, 2022 | | September 30, 2021 | |
Weighted average remaining lease term (in years): | | | | | | | |
Operating leases | | 6.4 | | 6.5 | | 6.9 | |
Finance leases | | 2.9 | | 3.1 | | 3.5 | |
Weighted average discount rates: | | | | | | | |
Operating leases | | 4.3 | % | 4.0 | % | 4.3 | % |
Finance leases | | 4.1 | % | 3.8 | % | 4.3 | % |
Additional cash flow information related to leases is as follows:
| | | | | | | | | |
| | Fiscal Year Ended |
| | September 30, | | September 30, | | September 30, |
| | 2023 | | 2022 | | 2021 |
|
| | (in millions) |
Cash paid for amounts included in the measurement of lease liabilities: | | | | | | | | | |
Operating cash flows from operating leases | | $ | 188.3 | | $ | 201.8 | | $ | 221.4 |
Operating cash flows from finance leases | | | 2.5 | | | 2.2 | | | 2.0 |
Financing cash flows from finance leases | | | 23.7 | | | 19.8 | | | 13.7 |
Right-of-use assets obtained in exchange for new operating leases | | | 96.6 | | | 90.9 | | | 102.7 |
Right-of-use assets obtained in exchange for new finance leases | | | 37.5 | | | 26.2 | | | 28.5 |
Total remaining lease payments under both the Company’s operating and finance leases are as follows:
| | | | | | |
| | Operating Leases | | Finance Leases |
|
Fiscal Year | | (in millions) |
2024 | | $ | 164.4 | | $ | 27.2 |
2025 | | | 142.3 | | | 21.3 |
2026 | | | 112.8 | | | 14.3 |
2027 | | | 86.0 | | | 5.8 |
2028 | | | 75.7 | | | 0.5 |
Thereafter | | | 213.1 | | | — |
Total lease payments | | $ | 794.3 | | $ | 69.1 |
Less: Amounts representing interest | | $ | (105.6) | | $ | (4.3) |
Total lease liabilities | | $ | 688.7 | | $ | 64.8 |
| | | | |
Year Ending September 30, | |
| |
|---|
2018 | | $ | 259.1 | |
2019 | | | 214.8 | |
2020 | | | 174.2 | |
2021 | | | 139.7 | |
2022 | | | 114.9 | |
Thereafter | | | 460.1 | |
| | | | | |
Total | | $ | 1,362.8 | |
| | | | | |
| | | | | |
| | | | | |
Rent expense for leases for the years ended September 30, 2017, 2016 and 2015 was approximately $265.9 million, $383.7 million, and $395.9 million, respectively. When the Company is required to restore leased facilities to original condition, provisions are made over the periodTable of the lease.Contents
12. Stockholders’ Equity
12. Stockholders' Equity
Common Stock Units—Common stock units are only redeemable for common stock. In the event of liquidation of the Company, holders of stock units are entitled to no greater rights than holders of common stock. See also Note 13.
Table of Contents
AECOM
NOTES TO CONSOLIDATED FINANCIAL STATEMENTS (Continued)
13. Share-Based Payments
Defined Contribution Plans—Substantially all permanent domestic employees are eligible to participate in defined contribution plans provided by the Company. Under these plans, participants may make contributions into a variety of funds, including a fund that is fully invested in Company stock. Employees are not required to allocate any funds to Company stock; however, the Company does provide an annual Company match in AECOM shares. Employees may generally reallocate their account balances on a daily basis; however, employees classified as insiders are restricted under the Company'sCompany’s insider trading policy. Compensation expense relating to thesefor the employer contributions related to purchase AECOM stock issued under defined contribution plans forduring fiscal years ended September 30, 2017, 20162023, 2022 and 20152021 was $32.9$23.1 million, $26.8$22.7 million, and $13.3$26.1 million, respectively.
Stock Incentive Plans—Under the 20162020 Stock Incentive Plan, the Company has up to 13.610.2 million securities remaining available for future issuance as of September 30, 2017.2023. Stock options may be granted to employees and non-employee directors with an exercise price not less than the fair market value of the stock on the date of grant. Unexercised options expire seven years after date of grant.
During the three years in the period ended September 30, 2017, option activity was as follows:
| | | | | | | |
| | Number of
Options
(in millions) | | Weighted
Average
Exercise Price | |
|---|
Balance, September 30, 2014 | | | 1.6 | | | 27.69 | |
Granted | | | — | | | — | |
Exercised | | | (0.3 | ) | | 24.98 | |
Cancelled | | | — | | | — | |
| | | | | | | | |
Balance, September 30, 2015 | | | 1.3 | | | 28.26 | |
| | | | | | | | |
| | | | | | | | |
| | | | | | | | |
Granted | | | — | | | — | |
Exercised | | | (0.4 | ) | | 23.96 | |
Cancelled | | | — | | | — | |
| | | | | | | | |
Balance, September 30, 2016 | | | 0.9 | | | 30.36 | |
| | | | | | | | |
| | | | | | | | |
| | | | | | | | |
Granted | | | — | | | — | |
Exercised | | | (0.2 | ) | | 26.42 | |
Cancelled | | | — | | | — | |
| | | | | | | | |
Balance, September 30, 2017 | | | 0.7 | | | 31.11 | |
| | | | | | | | |
| | | | | | | | |
| | | | | | | | |
Exercisable as of September 30, 2015 | | | 0.7 | | | 25.04 | |
| | | | | | | | |
| | | | | | | | |
| | | | | | | | |
Exercisable as of September 30, 2016 | | | 0.3 | | | 26.99 | |
| | | | | | | | |
| | | | | | | | |
| | | | | | | | |
Exercisable as of September 30, 2017 | | | 0.1 | | | 27.79 | |
| | | | | | | | |
| | | | | | | | |
| | | | | | | | |
Table of Contents
AECOM
NOTES TO CONSOLIDATED FINANCIAL STATEMENTS (Continued)
13. Share-Based Payments (Continued)
The following table summarizes information concerning outstanding and exercisable options as of September 30, 2017:
| | | | | | | | | | | | | | | | | | | | | | |
| | Options Outstanding | |
| | Options Exercisable | |
|---|
| | Number
Outstanding
as of
September 30,
2017
(in millions) | | Weighted
Average
Remaining
Contractual
Life | | Weighted
Average
Exercise
Price | | Aggregate
Intrinsic
Value
(in millions) | | Number
Exercisable
as of
September 30,
2017
(in millions) | | Weighted
Average
Remaining
Contractual
Life | | Weighted
Average
Exercise
Price | |
|---|
Range of Exercise Prices | | | | | | | | | | | | | | | | | | | | | | |
$27.54 - $28.44 | | | 0.1 | | | 0.27 | | $ | 27.79 | | $ | 0.9 | | | 0.1 | | | 0.27 | | $ | 27.79 | |
$31.62 | | | 0.6 | | | 6.43 | | | 31.62 | | | 3.3 | | | — | | | — | | | — | |
| | | | | | | | | | | | | | | | | | | | | | | |
| | | 0.7 | | | 5.61 | | | 31.11 | | $ | 4.2 | | | 0.1 | | | 0.27 | | | 27.79 | |
| | | | | | | | | | | | | | | | | | | | | | | |
| | | | | | | | | | | | | | | | | | | | | | | |
| | | | | | | | | | | | | | | | | | | | | | | |
The remaining contractual life of options outstanding at September 30, 2017 range from 0.19 to 6.43 years and have a weighted average remaining contractual life of 5.61 years. The aggregate intrinsic value of stock options exercised during the years ended September 30, 2017, 2016 and 2015 was $1.2 million, $0.6 million, and $2.1 million, respectively.
The fair value of the Company'sCompany’s employee stock option awards is estimated on the date of grant. The expected term of awards granted represents the period of time the awards are expected to be outstanding. The risk-free interest rate is based on U.S. Treasury bond rates with maturities equal to the expected term of the option on the grant date. The Company uses historical data as a basis to estimate the probability of forfeitures. No stock options were granted during the years ended September 30, 2017 and 2016.
The Company grants stock units to employees under its Performance Earnings Program (PEP), whereby units are earned and issued dependent upon meeting established cumulative performance objectives and vest over a three-year service period. Additionally, the Company issues restricted stock units to employees which are earned based on service conditions. The grant date fair value of PEP awards and restricted stock unit awards is primarily based on that day'sday’s closing market price of the Company'sCompany’s common stock. The weighted average grant date fair value of
Restricted stock unit, PEP awards was $38.15, $29.91,unit, and $32.32 duringStock Option activity for the yearsyear ended September 30 2017, 2016 and 2015, respectively. The weighted average grant date fair value of restricted stock unit awards was $37.96, $29.82, and $31.05 during the years ended September 30, 2017, 2016 and 2015, respectively. Included in the restricted stock unit grants during the twelve months ended September 30, 2015 were 2.6 million restricted stock units with a grant date fair value of $30.04 per share that were converted from unvested URS service based restricted stock awards assumed by the Company in connection with the acquisition of URS. as follows:
| | | | | | | | | | | | | | | |
| | | | Weighted | | | | Weighted | | | | | |
| | | | Average | | | | Average | | | | Weighted |
| | Restricted | | Grant-Date | | | | Grant-Date | | | | Average |
| | Stock Units | | Fair Value | | PEP Units | | Fair Value | | Stock Options | | Exercise Price |
| | (in millions) | | | | | (in millions) | | | | | (in millions) | | | |
Outstanding at September 30, 2020 | | 2.1 | | $ | 35.56 | | 1.6 | | $ | 33.86 | | 0.4 | | $ | 36.41 |
Granted | | 0.4 | | $ | 49.21 | | 0.3 | | $ | 52.76 | | — | | $ | — |
PEP units earned (unearned) | | — | | $ | — | | 0.1 | | $ | 37.37 | | — | | $ | — |
Vested / Exercised | | (0.9) | | $ | 36.24 | | (0.6) | | $ | 38.13 | | (0.1) | | $ | 31.62 |
Cancelled | | (0.3) | | $ | 36.89 | | (0.2) | | $ | 37.53 | | — | | $ | — |
Outstanding at September 30, 2021 | | 1.3 | | $ | 38.88 | | 1.2 | | $ | 37.22 | | 0.3 | | $ | 38.72 |
Granted | | 0.3 | | $ | 74.30 | | 0.2 | | $ | 85.46 | | — | | $ | — |
PEP units earned (unearned) | | — | | $ | — | | 0.6 | | $ | 27.90 | | — | | $ | — |
Vested / Exercised | | (0.5) | | $ | 29.44 | | (1.3) | | $ | 27.90 | | — | | $ | — |
Cancelled | | (0.1) | | $ | 49.74 | | — | | $ | 56.64 | | — | | $ | — |
Outstanding at September 30, 2022 | | 1.0 | | $ | 53.05 | | 0.7 | | $ | 60.60 | | 0.3 | | $ | 38.72 |
Granted | | 0.3 | | $ | 83.64 | | 0.2 | | $ | 94.64 | | — | | $ | — |
PEP units earned (unearned) | | — | | $ | — | | 0.2 | | $ | 43.19 | | — | | $ | — |
Vested / Exercised | | (0.4) | | $ | 44.35 | | (0.4) | | $ | 43.19 | | (0.2) | | $ | 38.72 |
Cancelled | | (0.1) | | $ | 62.09 | | — | | $ | 71.71 | | — | | $ | — |
Outstanding at September 30, 2023 | | 0.8 | | $ | 68.34 | | 0.7 | | $ | 75.54 | | 0.1 | | $ | 38.72 |
Total compensation expense related to these share-based payments including stock options was $83.8$45.9 million, $73.4$38.5 million, and $112.2$44.7 million during the years ended September 30, 2017, 20162023, 2022 and 2015,2021, respectively. Included in total compensation expense during the twelve months ended September 30, 2015 was $43.9 million related to the settlement of accelerated URS equity awards with $17.6 million of Company stock and $26.3 million in cash which was classified as acquisition and integration expense. Unrecognized compensation expense related
to total share-based payments outstanding as of September 30, 20172023 and 20162022 was $96.8$48.3 million and $91.8$45.9 million, respectively, to be recognized on a straight-line basis over the awards'awards’ respective vesting periods which are generally three years.
Table of Contents
AECOM
NOTES TO CONSOLIDATED FINANCIAL STATEMENTS (Continued)
14. Income Taxes
Income (loss) before income taxes included income (loss)loss from domestic operations of $322.2$129.2 million, $51.6income of $235.2 million, and $(214.6)income of $98.6 million for fiscal years ended September 30, 2017, 20162023, 2022 and 20152021 and income from foreign operations of $107.0$342.6 million, $74.0$315.4 million, and $63.1$310.2 million for fiscal years ended September 30, 2017, 20162023, 2022 and 2015.2021.
Income tax (benefit) expense was comprised of:
| | | | | | | | | | |
| | Fiscal Year Ended | |
|---|
| | September 30,
2017 | | September 30,
2016 | | September 30,
2015 | |
|---|
| | (in millions)
| |
|---|
Current: | | | | | | | | | | |
Federal | | $ | 10.3 | | $ | 33.7 | | $ | (67.1 | ) |
State | | | 17.9 | | | 12.4 | | | 2.6 | |
Foreign | | | 29.3 | | | 26.1 | | | 37.2 | |
| | | | | | | | | | | |
Total current income tax expense (benefit) | | | 57.5 | | | 72.2 | | | (27.3 | ) |
| | | | | | | | | | | |
Deferred: | | | | | | | | | | |
Federal | | | (8.3 | ) | | (63.4 | ) | | (44.2 | ) |
State | | | 10.4 | | | (5.4 | ) | | 1.2 | |
Foreign | | | (51.9 | ) | | (41.3 | ) | | (10.0 | ) |
| | | | | | | | | | | |
Total deferred income tax (benefit) expense | | | (49.8 | ) | | (110.1 | ) | | (53.0 | ) |
| | | | | | | | | | | |
Total income tax expense (benefit) | | $ | 7.7 | | $ | (37.9 | ) | $ | (80.3 | ) |
| | | | | | | | | | | |
| | | | | | | | | | | |
| | | | | | | | | | | |
Table of Contents
| | | | | | | | | |
| | Fiscal Year Ended |
| | September 30, | | September 30, | | September 30, |
| | 2023 | | 2022 | | 2021 |
|
| | (in millions) |
Current: | | | | | | | | | |
Federal | | $ | 67.7 | | $ | 22.8 | | $ | 32.2 |
State | | | 71.9 | | | 16.0 | | | 6.8 |
Foreign | | | 52.8 | | | 75.8 | | | 53.2 |
Total current income tax expense | | | 192.4 | | | 114.6 | | | 92.2 |
Deferred: | | | | | | | | | |
Federal | | | (71.8) | | | 22.1 | | | (28.8) |
State | | | (84.3) | | | 11.8 | | | 18.8 |
Foreign | | | 19.8 | | | (12.4) | | | 6.8 |
Total deferred income tax benefit | | | (136.3) | | | 21.5 | | | (3.2) |
Total income tax expense | | $ | 56.1 | | $ | 136.1 | | $ | 89.0 |
AECOM
NOTES TO CONSOLIDATED FINANCIAL STATEMENTS (Continued)
14. Income Taxes (Continued)
The major elements contributing to the difference between the U.S. federal statutory rate of 35.0%21% for fiscal years ended September 30, 2023, 2022 and 2021 and the effective tax rate are as follows:
| | | | | | | | | | | | | | | | |
| | Fiscal Year Ended | |
| | September 30, | | September 30, | | September 30, | |
| | 2023 | | 2022 | | 2021 | |
| | Amount | | % | | Amount | | % | | Amount | | % | |
|
| | (in millions) | |
Tax at federal statutory rate | | $ | 44.8 | | 21.0 | % | $ | 115.6 | | 21.0 | % | $ | 85.8 | | 21.0 | % |
State income tax, net of federal benefit | | | (7.1) | | (3.3) | | | 20.2 | | 3.7 | | | 8.0 | | 2.0 | |
Foreign residual income | | | 59.4 | | 27.8 | | | 46.4 | | 8.4 | | | 45.6 | | 11.1 | |
Valuation allowance | | | 16.6 | | 7.8 | | | (18.0) | | (3.3) | | | 12.4 | | 3.0 | |
Nondeductible costs | | | 10.7 | | 5.0 | | | 19.7 | | 3.6 | | | 6.0 | | 1.5 | |
Change in uncertain tax positions | | | 9.4 | | 4.4 | | | 15.4 | | 2.8 | | | 8.5 | | 2.1 | |
Audit settlement | | | 1.9 | | 0.9 | | | (1.5) | | (0.3) | | | 10.4 | | 2.5 | |
Foreign tax rate differential | | | 0.2 | | 0.1 | | | 1.1 | | 0.2 | | | 8.8 | | 2.1 | |
Income tax credits and incentives | | | (68.2) | | (31.9) | | | (51.0) | | (9.3) | | | (51.3) | | (12.5) | |
Exclusion of tax on non-controlling interests | | | (9.4) | | (4.4) | | | (5.1) | | (0.9) | | | (6.1) | | (1.5) | |
Tax exempt income | | | (3.3) | | (1.5) | | | (5.9) | | (1.1) | | | (5.4) | | (1.3) | |
Tax rate changes | | | (3.2) | | (1.5) | | | (4.1) | | (0.7) | | | (26.8) | | (6.5) | |
Return to provision | | | (0.5) | | (0.2) | | | (1.5) | | (0.3) | | | (9.5) | | (2.3) | |
Other items, net | | | 4.8 | | 2.1 | | | 4.8 | | 0.9 | | | 2.6 | | 0.6 | |
Total income tax expense | | $ | 56.1 | | 26.3 | % | $ | 136.1 | | 24.7 | % | $ | 89.0 | | 21.8 | % |
During fiscal 2023, valuation allowances in the amount of $21.0 million related to the AECOM Capital impairment charge were established for the portion of the charge that is not expected to be realized.
During fiscal 2022, valuation allowances in the amount of $21.9 million primarily related to net operating losses in certain foreign entities were released due to sufficient positive evidence. The positive evidence included a realignment of the Company’s global transfer pricing methodology which resulted in forecasting the utilization of the net operating losses within the foreseeable future.
| | | | | | | | | | | | | | | | | | | |
| | Fiscal Year Ended | |
|---|
| | September 30,
2017 | | September 30,
2016 | | September 30,
2015 | |
|---|
| | Amount | | % | | Amount | | % | | Amount | | % | |
|---|
| | (in millions)
| |
|---|
Tax at federal statutory rate | | $ | 150.3 | | | 35.0 | % | $ | 43.9 | | | 35.0 | % | $ | (53.0 | ) | | 35.0 | % |
State income tax, net of federal benefit | | | 24.3 | | | 5.7 | | | 5.6 | | | 4.5 | | | (2.3 | ) | | 1.5 | |
Income tax credits and incentives | | | (56.8 | ) | | (13.2 | ) | | (24.6 | ) | | (19.6 | ) | | (21.2 | ) | | 14.0 | |
Valuation allowance | | | (51.2 | ) | | (11.9 | ) | | (54.8 | ) | | (43.6 | ) | | 30.0 | | | (19.8 | ) |
Exclusion of tax on non-controlling interests | | | (28.2 | ) | | (6.6 | ) | | (24.7 | ) | | (19.7 | ) | | (29.3 | ) | | 19.3 | |
Foreign tax rate differential | | | (19.2 | ) | | (4.5 | ) | | (19.7 | ) | | (15.7 | ) | | (24.8 | ) | | 16.4 | |
Tax exempt income | | | (17.9 | ) | | (4.2 | ) | | (17.6 | ) | | (14.0 | ) | | (13.2 | ) | | 8.7 | |
Foreign residual income | | | (9.2 | ) | | (2.1 | ) | | 17.8 | | | 14.2 | | | 20.1 | | | (13.3 | ) |
Change in uncertain tax positions | | | 9.5 | | | 2.2 | | | (5.0 | ) | | (4.0 | ) | | 6.6 | | | (4.3 | ) |
Nondeductible costs | | | 5.8 | | | 1.4 | | | 6.1 | | | 4.8 | | | 2.8 | | | (1.8 | ) |
Other items, net | | | 0.3 | | | — | | | 0.5 | | | 0.3 | | | 1.2 | | | (0.9 | ) |
Change in tax rates | | | — | | | — | | | 34.6 | | | 27.6 | | | — | | | — | |
Nondeductible transaction costs | | | — | | | — | | | — | | | — | | | 2.8 | | | (1.8 | ) |
| | | | | | | | | | | | | | | | | | | | |
Total income tax expense | | $ | 7.7 | | | 1.8 | % | $ | (37.9 | ) | | (30.2 | )% | $ | (80.3 | ) | | 53.0 | % |
| | | | | | | | | | | | | | | | | | | | |
| | | | | | | | | | | | | | | | | | | | |
| | | | | | | | | | | | | | | | | | | | |
During fiscal 2021, the years ended September 30, 2016United Kingdom enacted a corporate tax rate increase from 19% to 25% beginning April 2023 requiring deferred tax assets and 2015, the Company recognizedliabilities to be remeasured. The remeasurement resulted in a $10.1 million and $19.4$25.9 million tax benefit, which is included in tax rate changes above.
During fiscal 2021, the Company partially settled its U.S. federal audit for fiscal 2015 and 2016 and recorded tax expense of $13.2 million due primarily to changes in tax attributes.
The Company is currently under tax audit in several jurisdictions including the U.S. and believe the outcomes which are reasonably possible within the next twelve months, including lapses in statutes of limitations, could result in adjustments, but will not result in a material change in the liability for uncertain tax positions.
Generally, the Company would reverse its valuation allowance in a particular tax jurisdiction if the positive evidence examined, such as projected and sustainable earnings or a tax-planning strategy that allows for the usage of the deferred tax asset, is sufficient to overcome significant negative evidence, such as large net operating loss carryforwards or a cumulative history of losses in recent years. In the United States, the valued deferred tax assets have a restricted life or use under relevant tax law and, therefore, it is unlikely that the valuation allowance related to U.S.these assets will reverse. In addition, the Company is continually investigating tax incentivesplanning strategies that, if prudent and creditsfeasible, may be implemented to realize a deferred tax asset that previously expired on December 31, 2014would otherwise expire unutilized. The identification and 2013, respectively,internal/external approval (as relevant) of such a prudent and were subsequently extended due tofeasible tax planning strategy could cause a changereduction in tax law.
Table of Contentsthe valuation allowance.
AECOM
NOTES TO CONSOLIDATED FINANCIAL STATEMENTS (Continued)
14. Income Taxes (Continued)
The deferred tax assets (liabilities) are as follows:
| | | | | | | |
| | Fiscal Year Ended | |
|---|
| | September 30,
2017 | | September 30,
2016 | |
|---|
| | (in millions)
| |
|---|
Deferred tax assets: | | | | | | | |
Compensation and benefit accruals not currently deductible | | $ | 144.2 | | $ | 150.5 | |
Net operating loss carryforwards | | | 338.2 | | | 378.0 | |
Self insurance reserves | | | 23.8 | | | 24.7 | |
Research and experimentation and other tax credits | | | 167.5 | | | 125.3 | |
Pension liability | | | 142.1 | | | 180.9 | |
Accrued liabilities | | | 160.7 | | | 221.0 | |
Other | | | 25.0 | | | 4.3 | |
| | | | | | | | |
Total deferred tax assets | | | 1,001.5 | | | 1,084.7 | |
| | | | | | | | |
Deferred tax liabilities: | | | | | | | |
Unearned revenue | | | (190.8 | ) | | (212.6 | ) |
Depreciation and amortization | | | (158.6 | ) | | (113.0 | ) |
Acquired intangible assets | | | (121.7 | ) | | (155.5 | ) |
Investment in subsidiaries | | | (241.2 | ) | | (261.4 | ) |
| | | | | | | | |
Total deferred tax liabilities | | | (712.3 | ) | | (742.5 | ) |
| | | | | | | | |
Valuation allowance | | | (138.4 | ) | | (183.8 | ) |
| | | | | | | | |
Net deferred tax assets | | $ | 150.8 | | $ | 158.4 | |
| | | | | | | | |
| | | | | | | | |
| | | | | | | | |
As a result of certain realization requirements of ASC 718, the table of deferred tax assets and liabilities does not include certain deferred tax assets as of September 30, 2016, that arose directly from tax deductions related to equity compensation that are greater than the compensation recognized for financial reporting. During the first quarter of 2017, the Company adopted a new accounting standard that amended certain aspects of the accounting for employee share-based payments and as a result recorded an adjustment of $3.8 million to equity to recognize net operating loss carryforwards attributable to excess tax benefits on stock compensation that had not been previously recognized to additional paid in capital.
| | | | | | |
| | Fiscal Year Ended |
| | September 30, | | September 30, |
| | 2023 | | 2022 |
|
| | (in millions) |
Deferred tax assets: | | | | | | |
Compensation and benefit accruals not currently deductible | | $ | 92.2 | | $ | 91.6 |
Net operating loss carryforwards | | | 102.3 | | | 113.7 |
Self-insurance reserves | | | 23.2 | | | 4.5 |
Research and experimentation and other tax credits | | | 43.1 | | | 111.4 |
Pension liability | | | 44.7 | | | 52.1 |
Accrued liabilities | | | 295.1 | | | 280.4 |
Capital loss carryforward | | | 64.0 | | | 64.4 |
Partnership investment | | | 102.0 | | | — |
Other | | | 7.1 | | | 5.3 |
Total deferred tax assets | | | 773.7 | | | 723.4 |
Deferred tax liabilities: | | | | | | |
Unearned revenue | | | (7.0) | | | (1.5) |
Depreciation and amortization | | | (13.1) | | | (111.4) |
Acquired intangible assets | | | (5.4) | | | (11.2) |
Investment in subsidiaries | | | (10.7) | | | (10.8) |
Right of use assets | | | (94.0) | | | (125.6) |
Contingent consideration | | | (34.2) | | | (33.6) |
Other | | | (15.5) | | | — |
Total deferred tax liabilities | | | (179.9) | | | (294.1) |
Valuation allowance | | | (171.2) | | | (154.4) |
Net deferred tax assets | | $ | 422.6 | | $ | 274.9 |
As of September 30, 2017,2023, and 2022, the Company has available unused federal, stateforeign and foreignstate net operating loss (NOL) carryforwardsof $368.8 million, $899.6 $757.5 million and $843.8$848.0 million, respectively, which expire at various dates over the next several years;years and capital loss carryforwards of $199.4 million and $205.2 million, respectively, which mostly expire in 2025; some foreign NOL carryforwards never expire. In addition, as of September 30, 2017,2023, the Company has unused federalstate and stateforeign research and development credits of $83.5$27.2 million and $21.8$9.6 million, respectively, foreign taxand other credits of $74.8 million, and California Enterprise Zone Tax Credits of $6.6$10.4 million which expire at various dates over the next several years.
As of September 30, 20172023 and 2016,2022, gross deferred tax assets were $1,001.5$773.7 million and $1,084.7$723.4 million, respectively. The Company has recorded a valuation allowance of $138.4$171.2 million and $183.8$154.4 million atas of September 30, 20172023 and 2016,2022, respectively,
primarily related to stateforeign and foreignstate net operating loss carryforwards, andcapital loss carryforwards, tax credits and other deferred tax assets related to certain pension obligations (primarily in the United Kingdom and Canada).assets. The Company has performed an assessment of positive
Table of Contents
AECOM
NOTES TO CONSOLIDATED FINANCIAL STATEMENTS (Continued)
14. Income Taxes (Continued)
and negative evidence, including the nature, frequency, and severity of cumulative financial reporting losses in recent years, the future reversal of existing temporary differences, predictability of future taxable income exclusive of reversing temporary differences of the character necessary to realize the asset, relevant carryforward periods, taxable income in carry-back years if carry-back is permitted under tax law, and prudent and feasible tax planning strategies that would be implemented, if necessary, to protect against the loss of the deferred tax asset that would otherwise expire. Although realization is not assured, based on the Company'sCompany’s assessment, the Company has concluded that it is more likely than not that the remaining gross deferred tax asset (exclusive of deferred tax liabilities) of $863.1$602.5 million will be realized and, as such, no additional valuation allowance has been provided. The net decreaseincrease in the valuation allowance of $45.3$16.8 million is primarily attributable to the release of $59.9 million of valuation allowances for the United Kingdom and the utilization of $4.1 million of foreign net operating loss carryforwards in the current year, partially offset by increasesan increase in valuation allowances for unbenefitable losses.
Uponof $21.0 million related to the acquisition of URSAECOM Capital impairment charge in October 2014, the Company had previously recordedUS, a decrease in valuation allowance primarily againstallowances on foreign net operating losses and deferred tax assetscurrency translation adjustments of $3.3 million, and decreases in valuation allowances of $0.9 million related to the pension obligation, consistent with those described above. Tax jurisdictions largely contributing to the URS related valuation allowance included $92.8 million recorded for the United Kingdom, $22.5 million recorded for Canada, $9.3 million recorded for the United States and $2.9 million recorded for Australia. In its determination of the realizability of its deferred tax assets, the Company evaluated positive evidence consisting of positive earnings trends over a sustainable period, positive economic conditions in the industries we operate in, possible prudent and feasible tax planning strategies (net of costs to implement the tax planning strategies) and actual usage of net operating loss and tax credit carryforwards. The Company also evaluated negative evidence consisting of significant net operating loss carryforwards, the cumulative history of losses in recent years, restriction on usage of losses under relevant tax laws, projections of future operations and economic downturns in the industries that we operate in. This evaluation was conducted on a tax jurisdictional basis or legal entity basis, as applicable, and based on the weighing of all positive and negative evidence, a determination was made as to the realizability of the deferred tax assets on that same basis.
Generally, the Company would reverse its valuation allowance in a particular tax jurisdiction if the positive evidence examined, such as projected and sustainable earnings or a tax-planning strategy that allows for the usage of the deferred tax asset, is sufficient to overcome significant negative evidence, such as large net operating loss carryforwards or a cumulative history of losses in recent years.
Valuation allowances in the amount of $59.9 million in the United Kingdom were released due to sufficient positive evidence obtained during the second quarter of 2017. The Company evaluated the new positive evidence against any negative evidence and determined that it is more likely than not that the deferred tax assets will be realized. This positive evidence includes an improvement in earnings, the use ofstate net operating losses on a taxable basis, and better management of pension liabilities due to positive effects of pension asset management and stabilization of interest rates.credits.
Valuation allowances in the amount of $23.3 million in the United Kingdom were released due to sufficient positive evidence obtained during the third quarter of 2016. The Company evaluated the new positive evidence against any negative evidence and determined the valuation allowance was no longer necessary. This new positive evidence included reaching a position of cumulative income over a three-year period and the use of net operating losses on a taxable basis. In addition, the Company's United Kingdom affiliate has strong projected earnings in the United Kingdom.
Table of Contents
AECOM
NOTES TO CONSOLIDATED FINANCIAL STATEMENTS (Continued)
14. Income Taxes (Continued)
During the third quarter of 2016, the Company's Australian affiliate made an election in Australia to combine the tax results of the URS Australia business with the AECOM Australia business. This election resulted in the ability to utilize the URS Australia businesses' deferred tax assets against the combined future earnings of the Australian group and accordingly, the valuation allowance of $12.9 million was released.
Certain operations in Canada continue to forecast losses and the valuation allowances could be reduced if the earnings trends reverse. In the United States, the valued deferred tax assets have a restricted life or use under relevant tax law and, therefore, it is unlikely that the valuation allowance related to these assets will reverse. In addition, the Company is continually investigating tax planning strategies that, if prudent and feasible, may be implemented to realize a deferred tax asset that would otherwise expire unutilized. The identification and internal/external approval (as relevant) of such a prudent and feasible tax planning strategy could cause a reduction in the valuation allowance.
In the fourth quarter of 2017, the Company executed international restructuring transactions that resulted in a distribution of current year earnings and profits and the associated foreign tax credits. The distribution resulted in the recognition of a benefit of $25.2 million related to excess foreign tax credits expected to be realized in the foreseeable future. These current year earnings had previously been forecasted to qualify for the indefinite reinvestment criterion. The Company's change in assertion for these investments is a one-time event and does not impact the Company's past or future assertions regarding intent and ability to reinvest indefinitely.
In the third quarter of 2017, the Company recapitalized one of its European subsidiaries which resulted in the Company indefinitely reinvesting a portion of its non-U.S. undistributed earnings that U.S. tax had previously been provided for and released the associated $21.2 million deferred tax liability. These non-U.S. earnings are now intended to be reinvested indefinitely outside of the U.S. to meet the Company's current and future cash needs of its European operations.
Generally, the Company does not provide for U.S. taxes or foreign withholding taxes on gross book-tax differences in its non-U.S. subsidiaries because such basis differences of approximately $1.7$1.3 billion are able to and intended to be reinvested indefinitely. If these basis differences were distributed, foreign tax credits could become available under current law to partially or fully reduce the resulting U.S. income tax liability. There may also be additional U.S. or foreign income tax liability upon repatriation, although the calculation of such additional taxes is not practicable. The Company's deferred tax liability related to certain foreign subsidiaries for which the undistributed earnings are not intended to be reinvested indefinitely was $77.0 million and $113.2 million for the years ended September 30, 2017 and 2016, respectively.
As of September 30, 20172023, and 2016,2022, the Company had a liability for unrecognized tax benefits, including potential interest and penalties, net of related tax benefit, totaling $109.5$79.5 million and $96.8$70.5 million, respectively. The gross unrecognized tax benefits as of September 30, 20172023 and 20162022 were $102.1$62.1 million and $87.9$55.2 million, respectively, excluding interest, penalties, and related tax benefit. Of the
Table of Contents
AECOM
NOTES TO CONSOLIDATED FINANCIAL STATEMENTS (Continued)
14. Income Taxes (Continued)
$102.1 $62.1 million, approximately $86.1$60.7 million would be included in the effective tax rate if recognized. A reconciliation of the beginning and ending amount of gross unrecognized tax benefits is as follows:
| | | | | | | |
| | Fiscal Year Ended | |
|---|
| | September 30,
2017 | | September 30,
2016 | |
|---|
| | (in millions)
| |
|---|
Balance at the beginning of the year | | $ | 87.9 | | $ | 95.2 | |
Gross increase due to acquisitions | | | — | | | — | |
Gross increase in current period's tax positions | | | 10.8 | | | 7.6 | |
Gross increase in prior years' tax positions | | | 5.3 | | | 5.2 | |
Gross decrease in prior years' tax positions | | | — | | | (16.6 | ) |
Decrease due to settlement with tax authorities | | | (1.0 | ) | | (3.2 | ) |
Decrease due to lapse of statute of limitations | | | (1.1 | ) | | (1.8 | ) |
Gross change due to foreign exchange fluctuations | | | 0.2 | | | 1.5 | |
| | | | | | | | |
Balance at the end of the year | | $ | 102.1 | | $ | 87.9 | |
| | | | | | | | |
| | | | | | | | |
| | | | | | | | |
| | | | | | |
| | Fiscal Year Ended |
| | September 30, | | September 30, |
| | 2023 | | 2022 |
|
| | (in millions) |
Balance at the beginning of the year | | $ | 55.2 | | $ | 46.4 |
Gross increase in current period’s tax positions | | | 3.5 | | | 17.4 |
Gross increase in prior years’ tax positions | | | 17.9 | | | 2.4 |
Gross decrease in prior years’ tax positions | | | (13.3) | | | (8.0) |
Decrease due to settlement with tax authorities | | | (1.0) | | | (1.4) |
Decrease due to lapse of statute of limitations | | | — | | | (0.5) |
Gross change due to foreign exchange fluctuations | | | (0.2) | | | (1.1) |
Balance at the end of the year | | $ | 62.1 | | $ | 55.2 |
The Company classifies interest and penalties related to uncertain tax positions within the income tax expense line in the accompanying consolidated statements of operations. As of September 30, 2017,2023, the accrued interest and penalties were $15.1$24.4 million and $4.1$1.5 million, respectively, excluding any related income tax benefits. AtAs of September 30, 2016,2022, the accrued interest and penalties were $12.5$20.5 million and $2.6$1.7 million, respectively, excluding any related income tax benefits.
The Company files income tax returns in numerous tax jurisdictions, including the U.S., and numerous U.S. states and non-U.S. jurisdictions around the world. The statute of limitations varies by jurisdiction in which the Company operates. Because of the number of jurisdictions in which the Company files tax returns, in any given year the statute of limitations in certain jurisdictions may expire without examination within the 12-month period from the balance sheet date.
The Company concluded its examination by the U.S. Internal Revenue Service for the fiscal years ended September 30, 2010 and September 30, 2011 in the fourth quarter of 2016, with no material adjustments. The U.S. Internal Revenue Service initiated an examination of URS for the years ended December 31, 2012, December 31, 2013 and October 17, 2014 in August 2016. With a few exceptions, the Company is no longer subject to U.S. state or non-U.S. income tax examinations by tax authorities for years before fiscal 2011.
While it is reasonably possible that the total amounts of unrecognized tax benefits could significantly increase or decrease within the next twelve months, an estimate of the range of possible change cannot be made.
15. Earnings Per Share
Basic earnings per share (EPS) excludes dilution and is computed by dividing net income attributable to AECOM by the weighted average number of common shares outstanding for the period. Diluted EPS is computed by dividing net income attributable to AECOM by the weighted average number of common shares outstanding and potential common shares for the period. The Company
includes as potential common shares the weighted average dilutive effects of equity awards using the treasury stock method. For
Table of Contents
AECOM
NOTES TO CONSOLIDATED FINANCIAL STATEMENTS (Continued)
15. Earnings Per Share (Continued)
the periods presented, equity awards excluded from the calculation of potential common shares were not significant. The computation of diluted loss per share for the year ended September 30, 2015 excludes 1.7 million of potential common shares due to their antidilutive effect.
The following table sets forth a reconciliation of the denominators of basic and diluted earnings per share:
| | | | | | | | | | |
| | Fiscal Year Ended | |
|---|
| | September 30,
2017 | | September 30,
2016 | | September 30,
2015 | |
|---|
| | (in millions)
| |
|---|
Denominator for basic earnings per share | | | 155.7 | | | 154.8 | | | 149.6 | |
Potential common shares | | | 3.4 | | | 1.3 | | | — | |
| | | | | | | | | | | |
Denominator for diluted earnings per share | | | 159.1 | | | 156.1 | | | 149.6 | |
| | | | | | | | | | | |
| | | | | | | | | | | |
| | | | | | | | | | | |
| | | | | | |
| | Fiscal Year Ended |
| | September 30, | | September 30, | | September 30, |
| | 2023 | | 2022 | | 2021 |
|
| | (in millions) |
Denominator for basic earnings per share | | 138.6 | | 140.8 | | 147.3 |
Potential common shares | | 1.5 | | 1.9 | | 2.4 |
Denominator for diluted earnings per share | | 140.1 | | 142.7 | | 149.7 |
16. Other Financial Information
Accrued expenses and other current liabilities consist of the following:
| | | | | | | |
| | Fiscal Year Ended | |
|---|
| | September 30,
2017 | | September 30,
2016 | |
|---|
| | (in millions)
| |
|---|
Accrued salaries and benefits | | $ | 1,018.5 | | $ | 964.9 | |
Accrued contract costs | | | 911.9 | | | 1,009.8 | |
Other accrued expenses | | | 315.1 | | | 410.1 | |
| | | | | | | | |
| | $ | 2,245.5 | | $ | 2,384.8 | |
| | | | | | | | |
| | | | | | | | |
| | | | | | | | |
| | | | | | |
| | Fiscal Year Ended |
| | September 30, | | September 30, |
| | 2023 | | 2022 |
|
| | (in millions) |
Accrued salaries and benefits | | $ | 599.8 | | $ | 602.2 |
Accrued contract costs | | | 1,340.4 | | | 1,246.0 |
Other accrued expenses | | | 347.3 | | | 333.2 |
| | $ | 2,287.5 | | $ | 2,181.4 |
Accrued contract costs above include balances related to professional liability accruals of $547.9$809.6 million and $611.0$789.3 million as of September 30, 20172023 and 2016,2022, respectively. The remaining accrued contract costs primarily relate to costs for services provided by subcontractors and other non-employees. Liabilities recorded related to accrued contract losses were not material as of September 30, 20172023 and 2016.2022. The Company did not have material revisions to estimates for contracts where revenue is recognized using the percentage-of-completioninput method during the twelve months ended September 30, 2017.
During2023 and 2022. For the twelve monthsyear ended September 30, 2016,2023, the Company recorded revenueincurred restructuring expenses of $188.4 million, included personnel and other costs of $91.6 million and real estate costs of $96.8 million, of which $53.3 million was accrued and unpaid at September 30, 2023. During the year ended September 30, 2022, the Company incurred restructuring expenses of $107.5 million, of which $69.1 million was related to the expected accelerated recoveryexit of a pensionour Russia-related businesses. The remaining $38.4 million related entitlement from the federal governmentto actions to improve margins and deliver efficiencies. These expenses included personnel and other costs of approximately $50$27.5 million and real estate costs of $10.9 million, of which is included in accounts receivable-net$7.9 million was accrued and unpaid at September 30, 2017. The entitlement resulted from pension costs that are reimbursable through certain government contracts in accordance with Cost Accounting Standards. The accelerated recognition resulted from an amendment2022.
On September 13, 2023, the Company’s Board of Directors declared a quarterly cash dividend of $0.18 per share, which was paid on October 20, 2023 to freeze pension benefits under URS Federal Services, Inc. Employees Retirement Plan. The actual amountstockholders of reimbursement may vary fromrecord as of the Company's expectation.
close of business on October 5, 2023. As of September 30, 2023, accrued and unpaid dividends totaled $26.7 million and were classified within other accrued expenses on the consolidated balance sheet.
AECOM
NOTES TO CONSOLIDATED FINANCIAL STATEMENTS (Continued)
17. Reclassifications out of Accumulated Other Comprehensive Loss
The accumulated balances and reporting period activities for the years ended September 30, 2017, 20162023, 2022 and 20152021 related to reclassifications out of accumulated other comprehensive loss are summarized as follows (in millions):
| | | | | | | | | | | | | |
| | Pension
Related
Adjustments | | Foreign
Currency
Translation
Adjustments | | Loss on
Derivative
Instruments | | Accumulated
Other
Comprehensive
Loss | |
|---|
Balances at September 30, 2014 | | $ | (217.0 | ) | $ | (137.8 | ) | $ | (1.8 | ) | $ | (356.6 | ) |
Other comprehensive income (loss) before reclassification | | | 5.8 | | | (282.3 | ) | | (13.3 | ) | | (289.8 | ) |
Amounts reclassified from accumulated other comprehensive loss | | | 7.2 | | | — | | | 4.1 | | | 11.3 | |
| | | | | | | | | | | | | | |
Balances at September 30, 2015 | | $ | (204.0 | ) | $ | (420.1 | ) | $ | (11.0 | ) | $ | (635.1 | ) |
| | | | | | | | | | | | | | |
| | | | | | | | | | | | | | |
| | | | | | | | | | | | | | |
|
| | Pension
Related
Adjustments | | Foreign
Currency
Translation
Adjustments | | Loss on
Derivative
Instruments | | Accumulated
Other
Comprehensive
Loss | | |
|---|
Balances at September 30, 2015 | | $ | (204.0 | ) | $ | (420.1 | ) | $ | (11.0 | ) | $ | (635.1 | ) | |
Other comprehensive income (loss) before reclassification | | (171.5 | ) | | (63.6 | ) | | 1.2 | | (233.9 | ) | |
Amounts reclassified from accumulated other comprehensive loss | | 6.6 | | — | | 4.8 | | 11.4 | | |
| | | | | | | | | | | | | | |
Balances at September 30, 2016 | | $ | (368.9 | ) | $ | (483.7 | ) | $ | (5.0 | ) | $ | (857.6 | ) | |
| | | | | | | | | | | | | | | | | | | | | | | | | | |
| | | | | | | | | | | | | | | Foreign | | | | | Accumulated |
| | | | | | | | | | | | | | | | Pension | | Currency | | Loss on | | Other |
| | | Related | | Translation | | Derivative | | Comprehensive |
| | | Adjustments | | Adjustments | | Instruments | | Loss |
Balances at September 30, 2020 | | | $ | (342.8) | | $ | (567.3) | | $ | (8.6) | | $ | (918.7) |
Other comprehensive income (loss) before reclassification | | | | 14.6 | | | (12.8) | | | 0.8 | | | 2.6 |
Amounts reclassified from accumulated other comprehensive loss | | | | 12.0 | | | — | | | 3.7 | | | 15.7 |
Balances at September 30, 2021 | | | $ | (316.2) | | $ | (580.1) | | $ | (4.1) | | $ | (900.4) |
|
| | Pension
Related
Adjustments | | Foreign
Currency
Translation
Adjustments | | Loss on
Derivative
Instruments | | Accumulated
Other
Comprehensive
Loss | | |
|---|
Balances at September 30, 2016 | | $ | (368.9 | ) | $ | (483.7 | ) | $ | (5.0 | ) | $ | (857.6 | ) | |
Other comprehensive income (loss) before reclassification | | 73.8 | | 65.3 | | 2.3 | | 141.4 | | |
Amounts reclassified from accumulated other comprehensive loss | | 13.2 | | — | | 2.3 | | 15.5 | | |
| | | | | | | | | | | | | | |
Balances at September 30, 2017 | | $ | (281.9 | ) | $ | (418.4 | ) | $ | (0.4 | ) | $ | (700.7 | ) | |
| | | | | | | | | | | | | | | | | | | | | | | | | | |
| | | | | | | | | | | | | | Foreign | | | | Accumulated |
| | | | | | | | | | | | | | | | Pension | | Currency | | Loss on | | Other |
| | | Related | | Translation | | Derivative | | Comprehensive |
| | | Adjustments | | Adjustments | | Instruments | | Loss |
Balances at September 30, 2021 | | | $ | (316.2) | | $ | (580.1) | | $ | (4.1) | | $ | (900.4) |
Other comprehensive income (loss) before reclassification | | | | 89.9 | | | (238.7) | | | 37.9 | | | (110.9) |
Amounts reclassified from accumulated other comprehensive loss | | | | 9.0 | | | 19.5 | | | 3.1 | | | 31.6 |
Balances at September 30, 2022 | | | $ | (217.3) | | $ | (799.3) | | $ | 36.9 | | $ | (979.7) |
| | | | | | | | | | | | |
| | | | Foreign | | | | Accumulated |
| | Pension | | Currency | | Loss on | | Other |
| | Related | | Translation | | Derivative | | Comprehensive |
| | Adjustments | | Adjustments | | Instruments | | Loss |
Balances at September 30, 2022 | | $ | (217.3) | | $ | (799.3) | | $ | 36.9 | | $ | (979.7) |
Other comprehensive (loss) income before reclassification | | | (10.9) | | | 59.6 | | | 10.7 | | | 59.4 |
Amounts reclassified from accumulated other comprehensive loss | | | 2.2 | | | — | | | (8.5) | | | (6.3) |
Balances at September 30, 2023 | | $ | (226.0) | | $ | (739.7) | | $ | 39.1 | | $ | (926.6) |
18. Commitments and Contingencies
The Company records amounts representing its probable estimated liabilities relating to claims, guarantees, litigation, audits and investigations. The Company relies in part on qualified actuaries to assist it in determining the level of reserves to establish for insurance-related claims that are known and have been asserted against it, and for insurance-related claims that are believed to have been incurred based on actuarial analysis, but have not yet been reported to the Company'sCompany’s claims administrators as of the respective balance sheet dates. The Company includes any adjustments to such insurance reserves in its consolidated results of operations. The Company'sCompany’s reasonably possible loss disclosures are presented on a
Table of Contents
AECOM
NOTES TO CONSOLIDATED FINANCIAL STATEMENTS (Continued)
18. Commitments and Contingencies (Continued)
gross basis prior to the consideration of insurance recoveries. The Company does not record gain contingencies until they are realized. In the ordinary course of business, the Company may not be aware that it or its affiliates are under investigation and may not be aware of whether or not a known investigation has been concluded.
In the ordinary course of business, the Company may enter into various arrangements providing financial or performance assurance to clients, lenders, or partners. Such arrangements include standby letters of credit, surety bonds, and corporate guarantees to support the creditworthiness or the project execution commitments of its affiliates, partnerships and joint ventures. The Company’s unsecured credit arrangements are used for standby letters of credit issued in connection with general and professional liability insurance programs and for contract performance guarantees. At September 30, 2023 and 2022, these outstanding standby letters of credit totaled $878.9 million and $640.3 million, respectively. As of September 30, 2023, the Company had $416.7 million available under these unsecured credit facilities. Performance arrangements typically have various expiration dates ranging from the completion of the project contract and extending beyond contract completion in certainsome circumstances such as for warranties. The Company may also guarantee that a project, when complete, will achieve specified performance standards. If the project subsequently fails to meet guaranteed performance standards, the Company may incur additional costs, pay liquidated damages or be held responsible for the costs incurred by the client to achieve the required performance standards. The potential payment amount of an outstanding performance arrangement is typically the remaining cost of work to be performed by or on behalf of third parties. Generally, under joint venture arrangements, if a partner is financially unable to complete its share of the contract, the other partner(s) may be required to complete those activities.
At September 30, 2017,2023, the Company was contingently liable in the amount of approximately $503.8$883.3 million in issued standby letters of credit and $5.7$4.6 billion in issued surety bonds primarily to support project execution.
In the ordinary course of business, the Company enters into various agreements providing financial or performance assurances to clients on behalf of certain unconsolidated partnerships, joint ventures and other jointly executed contracts. These agreements are entered into primarily to support the project execution commitments of these entities.
The Company’s investment adviser jointly manages and sponsors the AECOM-Canyon Equity Fund, L.P. (the “Fund”), in which the Company indirectly holds an equity interest and has an ongoing capital commitment to fund investments. At September 30, 2023, the Company has capital commitments of $8.3 million to the Fund over the next 5 years.
In addition, in connection with the investment activities of AECOM Capital, the Company provides guarantees of certain contractual obligations, including guarantees for completion of projects, repayment of debt, environmental indemnity obligations and other lender required guarantees.
DOEDepartment of Energy Deactivation, Demolition, and Removal Project
Washington Group International, an Ohio company (WGI Ohio), anA former affiliate of URS,the Company, Amentum Environment & Energy, Inc., f/k/a AECOM Energy and Construction, Inc. (“Former Affiliate”), executed a cost-reimbursable task order with the Department of Energy (DOE) in 2007 to provide deactivation, demolition and removal services at a New York State project site that, during 2010, experienced contamination and performance issues and remains uncompleted.issues. In February 2011, WGI Ohiothe Former Affiliate and the DOE executed a Task Order Modification that changed some cost-reimbursable contract provisions to at-risk. The Task Order Modification, including subsequent amendments, requiresrequired the DOE to pay all project costs up to $106 million, requires WGI Ohiorequired the Former Affiliate and the DOE to equally share in all project costs incurred from $106 million to $146 million, and requires WGI Ohiorequired the Former Affiliate to pay all project costs exceeding $146 million.
Due to unanticipated requirements and permitting delays by federal and state agencies, as well as delays and related ground stabilization activities caused by Hurricane Irene in 2011, WGI Ohio has beenthe Former Affiliate was required to perform work outside the scope of the Task Order Modification. In December 2014, WGI Ohiothe Former Affiliate submitted an initial set of claims against the DOE pursuant to the Contracts Disputes Acts seeking recovery of
Table of Contents
AECOM
NOTES TO CONSOLIDATED FINANCIAL STATEMENTS (Continued)
18. Commitments and Contingencies (Continued)
$103 $103 million, including additional fees on changed work scope. WGI Ohio has incurred and continues to incurscope (the “2014 Claims”). On December 6, 2019, the Former Affiliate submitted a second set of claims against the DOE seeking recovery of an additional $60.4 million, including additional project costs and delays outside the scope of the contract as a result of differing site and ground conditions (the “2019 Claims”). The Former Affiliate also submitted three alternative breach of contract claims to the 2014 and 2019 Claims that may entitle the Former Affiliate to recovery of $148.5 million to $329.4 million. On December 30, 2019, the DOE denied the Former Affiliate’s 2014 Claims. On September 25, 2020, the DOE denied the Former Affiliate’s 2019 Claims. The Company filed an appeal of these decisions on December 20, 2020 in the Court of Federal Claims. Deconstruction, decommissioning and site restoration activities are complete.
On January 31, 2020, the Company completed the sale of its Management Services business, including the Former Affiliate who worked on the DOE project, to Maverick Purchaser Sub LLC (MS Purchaser), an affiliate of American Securities LLC and Lindsay Goldberg LLC. The Company and the MS Purchaser agreed that all future DOE project claim recoveries and costs will be split 10% to the MS Purchaser and 90% to the Company with the Company retaining control of all future strategic legal decisions.
The Company intends to submit additional formal claims against the DOE.
Due to significant delays and uncertainties about responsibilities for the scope of remaining work, final project completion costs and other associated costs have exceeded $100 million over the contracted andvigorously pursue all claimed amounts. WGI Ohio assets and liabilities, including the value of the above costs and claims, were measured at their fair value on October 17, 2014, the date AECOM acquired WGI Ohio's parent company, see Note 3, which measurement has been reevaluated to account for developments pertaining to this matter.
WGI Ohioamounts but can provide no certainty that itthe Company will recover the claims2014 Claims and 2019 Claims submitted against the DOE, in December 2014, any future claims or any other project costs after December 2014 that WGI Ohio may be obligated to incur including the remaining project completionadditional incurred claims or costs, which could have a material adverse effect on the Company'sCompany’s results of operations.
OneA Former Affiliate of our wholly-owned subsidiaries, URS Corporation,the Company entered into an agreement to perform turnaround maintenance services during a partial fixed costplanned shutdown at a refinery in Montana in December 2017. The turnaround project was completed in February 2019. Due to circumstances outside of the Company’s Former Affiliate’s control, including client directed changes and partial timedelays and material design agreementthe refinery’s condition, the Company’s Former Affiliate performed additional work outside of the original contract over $90 million and is entitled to payment from the refinery owner of approximately $144 million. In March 2019, the refinery owner sent a letter to the Company’s Former Affiliate alleging it incurred approximately $79 million in 2012 withdamages due to the Company’s Former Affiliate’s project performance. In April 2019, the Company’s Former Affiliate filed and perfected a design build contractor$132 million construction lien against the refinery for unpaid labor and materials costs. In August 2019, following a state route highway construction project in Riverside County and Orange County, California. On March 9, 2017, URS Corporationsubcontractor complaint filed a $8.9 million complaint in the SuperiorThirteen Judicial District Court of CaliforniaMontana
asserting claims against the design build contractor forrefinery owner and the Company’s Former Affiliate, the refinery owner crossclaimed against the Company’s Former Affiliate and the subcontractor. In October 2019, following the subcontractor’s dismissal of its failureclaims, the Company’s Former Affiliate removed the matter to pay for services performed underfederal court and cross claimed against the design agreement. refinery owner. In December 2019, the refinery owner claimed $93.0 million in damages and offsets against the Company’s Former Affiliate.
On April 17, 2017,January 31, 2020, the design build contractor filed a counterclaim in Superior Court alleging breachesCompany completed the sale of contract, negligent interferenceits Management Services business, including the Former Affiliate, to the MS Purchaser; however, the Refinery Turnaround Project, including related claims and professional negligence pertainingliabilities, has been retained by the Company.
The Company intends to URS Corporation's performance of design services undervigorously prosecute and defend this matter; however, the design agreement, seeking purported damages of $70 million. URS CorporationCompany cannot provide assurancesassurance that itthe Company will be successful in the recoverythese efforts. The resolution of the amounts owed to it under the design agreement or in its defense against the amounts alleged under the counterclaim that URS Corporation believes are without meritthis matter and that it intends to vigorously defend against. Theany potential range of loss in excess of any current accrual cannot be reasonably determined or estimated at this time, primarily because the matter involves unique regulatory issues; thereraises complex legal issues that Company is substantial uncertainty regarding any alleged damages; and the matter is at a preliminary stage of litigation.
The following matter is disclosed pursuantcontinuing to Regulation S-K, Item 103, Instruction 5.C pertaining to a government authority environmental claim exceeding $100,000 against an AECOM affiliate. In September 2017, AECOM USA, Inc., one of our wholly-owned subsidiaries, was advised by the New York State Department of Environmental Conservation ("DEC") of allegations that it committed environmental permit violations pursuant to the New York Environmental Conservation Law ("ECL") associated with AECOM USA, Inc.'s oversight of a water restoration project for Schoharie County which could result in substantial fines if calculated under the ECL's maximum civil penalty provisions. AECOM USA, Inc. disputes this claim and intends to continue to defend these matters vigorously; however, AECOM USA, Inc., cannot provide assurances that it will be successful in these efforts. The potential range of loss in excess of any current accrual cannot be reasonably estimated at this time, primarily because the matter involves complex and unique environmental and regulatory issues; the project site involves the
Table of Contentsassess.
AECOM
NOTES TO CONSOLIDATED FINANCIAL STATEMENTS (Continued)
18. Commitments and Contingencies (Continued)
oversight and involvement of various local, state and federal government agencies; substantial uncertainty regarding any alleged damages; and the preliminary stage of the government's claims.
19. Reportable Segments and Geographic Information
The Company's operationsCompany’s reportable segments are organized into four reportable segments: Designpresented according to their geographic regions and Consulting Services (DCS), Construction Services (CS), Management Services (MS), and AECOM Capital (ACAP). During the third quarter of fiscal 2017, operating activities of ACAP achieved a level of significance sufficient to warrant disclosure as a separate reportable segment. Prior to the third quarter of fiscal 2017, ACAP's operating results were included in the corporatebusiness activities. The Americas segment and comparable periods were reclassified to reflect the change. The Company's DCS reportable segment deliversprovides planning, consulting, architectural environmental, and engineering design services, and construction management services to commercialpublic and governmentprivate clients worldwide. The Company's CS reportablein the United States, Canada, and Latin America, while the International segment provides constructionsimilar professional services primarilyto public and private clients in Europe, the Americas. Middle East, India, Africa, and the Asia-Australia-Pacific regions.
The Company's MS reportableCompany’s AECOM Capital (ACAP) segment provides program and facilities management and maintenance, training, logistics, consulting, technical assistance, and systems integration and information technology services, primarily for agencies of the U.S. government. The Company's ACAP segment invests in and develops real estate public-private partnership (P3) and infrastructure projects. These reportable segments are organized by the types of services provided, the differing specialized needs of the respective clients, and how the Company manages its business. The Company has aggregated various operating segments into its reportable segments based on their similar characteristics, including similar long term financial performance, the nature of services provided, internal processes for delivering those services, and types of customers.
During the first quarter of fiscal year 2017, an operation and maintenance related entity previously reported within the CS segment was realigned within the MS segment to reflect present management oversight. Accordingly, approximately $130 million and $137 million of revenue and $124 million and $130 million of cost of revenue for the years ended September 30, 2016 and 2015, respectively, were reclassified to conform to the current period presentation.91
AECOM
NOTES TO CONSOLIDATED FINANCIAL STATEMENTS (Continued)
19. Reportable Segments and Geographic Information (Continued)
The following tables set forth summarized financial information concerning the Company'sCompany’s reportable segments:
| | | | | | | | | | | | | | | | | | | |
Reportable Segments: | | Design and
Consulting
Services | | Construction
Services | | Management
Services | | AECOM
Capital | | Corporate | | Total | |
|---|
| | (in millions)
| |
|---|
Fiscal Year Ended September 30, 2017: | | | | | | | | | | | | | | | | | | | |
Revenue | | $ | 7,566.8 | | $ | 7,295.6 | | $ | 3,341.0 | | $ | — | | $ | — | | $ | 18,203.4 | |
Gross profit | | | 394.8 | | | 92.9 | | | 196.0 | | | — | | | — | | | 683.7 | |
Equity in earnings of joint ventures | | | 16.4 | | | 22.4 | | | 45.1 | | | 57.7 | | | — | | | 141.6 | |
General and administrative expenses | | | — | | | — | | | — | | | (8.7 | ) | | (124.7 | ) | | (133.4 | ) |
Acquisition and integration expenses | | | — | | | — | | | — | | | — | | | (38.7 | ) | | (38.7 | ) |
Gain on disposal activities | | | 0.6 | | | — | | | — | | | — | | | — | | | 0.6 | |
Operating income | | | 411.8 | | | 115.3 | | | 241.1 | | | 49.0 | | | (163.4 | ) | | 653.8 | |
Segment assets | | | 6,992.6 | | | 4,114.5 | | | 2,704.6 | | | 199.1 | | | 386.2 | | | 14,397.0 | |
Gross profit as a % of revenue | | | 5.2 | % | | 1.3 | % | | 5.9 | % | | | | | | | | 3.8 | % |
Fiscal Year Ended September 30, 2016: | | |
| | |
| | |
| | |
| | |
| | |
| |
Revenue | | $ | 7,655.8 | | $ | 6,371.1 | | $ | 3,383.9 | | $ | — | | $ | — | | $ | 17,410.8 | |
Gross profit | | | 382.5 | | | 25.4 | | | 234.9 | | | — | | | — | | | 642.8 | |
Equity in earnings of joint ventures | | | 8.9 | | | 18.2 | | | 76.9 | | | — | | | — | | | 104.0 | |
General and administrative expenses | | | — | | | — | | | — | | | (6.0 | ) | | (109.1 | ) | | (115.1 | ) |
Acquisition and integration expenses | | | — | | | — | | | — | | | — | | | (213.6 | ) | | (213.6 | ) |
Loss on disposal activities | | | — | | | (42.6 | ) | | — | | | — | | | — | | | (42.6 | ) |
Operating income | | | 391.4 | | | 1.0 | | | 311.8 | | | (6.0 | ) | | (322.7 | ) | | 375.5 | |
Segment assets | | | 6,655.7 | | | 3,556.2 | | | 2,692.7 | | | 179.1 | | | 586.2 | | | 13,669.9 | |
Gross profit as a % of revenue | | | 5.0 | % | | 0.4 | % | | 6.9 | % | | | | | | | | 3.7 | % |
Fiscal Year Ended September 30, 2015: | | |
| | |
| | |
| | |
| | |
| | |
| |
Revenue | | $ | 7,962.9 | | $ | 6,539.3 | | $ | 3,487.7 | | $ | — | | $ | — | | $ | 17,989.9 | |
Gross profit | | | 299.3 | | | 35.9 | | | 200.0 | | | — | | | — | | | 535.2 | |
Equity in earnings of joint ventures | | | 6.6 | | | 23.0 | | | 76.6 | | | — | | | — | | | 106.2 | |
General and administrative expenses | | | — | | | — | | | — | | | (4.3 | ) | | (109.7 | ) | | (114.0 | ) |
Acquisition and integration expenses | | | — | | | — | | | — | | | — | | | (398.4 | ) | | (398.4 | ) |
Operating income | | | 305.9 | | | 58.9 | | | 276.6 | | | (4.3 | ) | | (508.1 | ) | | 129.0 | |
Segment assets | | | 7,118.2 | | | 3,382.4 | | | 2,903.9 | | | 111.7 | | | 498.1 | | | 14,014.3 | |
Gross profit as a % of revenue | | | 3.8 | % | | 0.5 | % | | 5.7 | % | | | | | | | | 3.0 | % |
Table of Contents
| | | | | | | | | | | | | | | | |
| | | | | | AECOM | | | | | | | |
Reportable Segments: | | Americas | | International | | Capital | | Corporate | | Total | |
|
| | (in millions) | |
Fiscal Year Ended September 30, 2023: | | | | | | | | | | | | | | | | |
Revenue | | $ | 10,975.7 | | $ | 3,402.1 | | $ | 0.7 | | $ | — | | $ | 14,378.5 | |
Gross profit | | | 699.7 | | | 245.1 | | | 0.7 | | | — | | | 945.5 | |
Equity in earnings of joint ventures | | | 14.9 | | | 9.6 | | | (303.9) | | | — | | | (279.4) | |
General and administrative expenses | | | — | | | — | | | (12.6) | | | (141.0) | | | (153.6) | |
Restructuring costs | | | — | | | — | | | — | | | (188.4) | | | (188.4) | |
Operating income | | | 714.6 | | | 254.7 | | | (315.8) | | | (329.4) | | | 324.1 | |
Segment assets | | | 7,433.1 | | | 2,536.2 | | | 64.5 | | | 1,104.4 | | | | |
Gross profit as a % of revenue | | | 6.4 | % | | 7.2 | % | | — | | | — | | | 6.6 | % |
| | | | | | | | | | | | | | | | |
Fiscal Year Ended September 30, 2022: | | | | | | | | | | | | | | | | |
Revenue | | $ | 9,939.3 | | $ | 3,206.7 | | $ | 2.2 | | $ | — | | $ | 13,148.2 | |
Gross profit | | | 639.9 | | | 205.9 | | | 2.2 | | | — | | | 848.0 | |
Equity in earnings of joint ventures | | | 13.9 | | | 15.3 | | | 24.4 | | | — | | | 53.6 | |
General and administrative expenses | | | — | | | — | | | (12.6) | | | (134.7) | | | (147.3) | |
Restructuring costs | | | — | | | — | | | — | | | (107.5) | | | (107.5) | |
Operating income | | | 653.8 | | | 221.2 | | | 14.0 | | | (242.2) | | | 646.8 | |
Segment assets | | | 7,232.2 | | | 2,467.9 | | | 264.9 | | | 1,095.3 | | | | |
Gross profit as a % of revenue | | | 6.4 | % | | 6.4 | % | | — | | | — | | | 6.4 | % |
| | | | | | | | | | | | | | | | |
Fiscal Year Ended September 30, 2021: | | | | | | | | | | | | | | | | |
Revenue | | $ | 10,226.3 | | $ | 3,112.6 | | $ | 2.0 | | $ | — | | $ | 13,340.9 | |
Gross profit | | | 631.6 | | | 164.8 | | | 2.0 | | | — | | | 798.4 | |
Equity in earnings of joint ventures | | | 11.4 | | | 12.2 | | | 11.4 | | | — | | | 35.0 | |
General and administrative expenses | | | — | | | — | | | (11.1) | | | (143.9) | | | (155.0) | |
Restructuring costs | | | — | | | — | | | — | | | (48.8) | | | (48.8) | |
Operating income | | | 643.0 | | | 177.0 | | | 2.3 | | | (192.7) | | | 629.6 | |
Segment assets | | | 7,204.6 | | | 2,764.5 | | | 234.6 | | | 1,390.9 | | | | |
Gross profit as a % of revenue | | | 6.2 | % | | 5.3 | % | | — | | | — | | | 6.0 | % |
AECOM
NOTES TO CONSOLIDATED FINANCIAL STATEMENTS (Continued)
19. Reportable Segments and Geographic Information (Continued)
Geographic Information:
| | | | | | | | | | | | | | | | | | | |
| | Fiscal Year Ended | |
|---|
| | September 30, 2017 | | September 30, 2016 | | September 30, 2015 | |
|---|
| | Revenue | | Long-Lived
Assets | | Revenue | | Long-Lived
Assets | | Revenue | | Long-Lived
Assets | |
|---|
| | (in millions)
| |
|---|
United States | | $ | 13,042.6 | | | 4,779.0 | | $ | 12,567.0 | | | 4,763.9 | | $ | 12,599.6 | | | 4,852.5 | |
Asia Pacific | | | 1,352.7 | | | 382.9 | | | 1,278.3 | | | 394.0 | | | 1,385.3 | | | 426.4 | |
Canada | | | 1,159.9 | | | 600.4 | | | 866.5 | | | 615.7 | | | 1,308.3 | | | 641.0 | |
Europe | | | 1,869.9 | | | 1,362.8 | | | 1,904.2 | | | 1,368.4 | | | 1,796.9 | | | 1,496.2 | |
Other foreign countries | | | 778.3 | | | 418.3 | | | 794.8 | | | 412.5 | | | 899.8 | | | 352.1 | |
| | | | | | | | | | | | | | | | | | | | |
Total | | $ | 18,203.4 | | | 7,543.4 | | $ | 17,410.8 | | | 7,554.5 | | $ | 17,989.9 | | | 7,768.2 | |
| | | | | | | | | | | | | | | | | | | | |
| | | | | | | | | | | | | | | | | | | | |
| | | | | | | | | | | | | | | | | | | | |
The Company attributes revenue by geography based on the external customer's country of origin.
| | | | | | | | | |
| | | Fiscal Year Ended |
| | | September 30, | | September 30, | | September 30, |
Long-Lived Assets | | | 2023 | | 2022 | | 2021 |
|
| | | (in millions) |
Americas | | $ | 3,478.5 | | $ | 3,906.7 | | $ | 3,922.8 |
Europe, Middle East, India, Africa | | | 803.5 | | | 763.6 | | | 872.3 |
Asia-Australia-Pacific | | | 342.3 | | | 362.1 | | | 405.0 |
Total | | $ | 4,624.3 | | $ | 5,032.4 | | $ | 5,200.1 |
Long-lived assets consist of noncurrent assets excluding deferred tax assets.
20. Major Clients
Other than the U.S. federal government, noNo single client accounted for 10% or more of the Company'sCompany’s revenue in any of the past five fiscal years. Approximately 22%5%, 23%6%, and 24%8% of the Company'sCompany’s revenue was derived through direct contracts with agencies of the U.S. federal government in the years ended September 30, 2017, 20162023, 2022 and 2015,2021, respectively. One of these contracts accounted for approximately 3%, 3%, and 2% of the Company's revenue in the years ended September 30, 2017, 2016 and 2015, respectively.
Table of Contents
AECOM
NOTES TO CONSOLIDATED FINANCIAL STATEMENTS (Continued)
21. Quarterly Financial Information—Unaudited
In the opinion of management, the following unaudited quarterly data reflects all adjustments necessary for a fair statement of the results of operations. All such adjustments are of a normal recurring nature.
| | | | | | | | | | | | | |
Fiscal Year 2017: | | First
Quarter | | Second
Quarter | | Third
Quarter | | Fourth
Quarter | |
|---|
| | (in millions, except per share data)
| |
|---|
Revenue | | $ | 4,358.3 | | $ | 4,427.2 | | $ | 4,561.5 | | $ | 4,856.4 | |
Cost of revenue | | | 4,188.3 | | | 4,258.8 | | | 4,386.3 | | | 4,686.3 | |
| | | | | | | | | | | | | | |
Gross profit | | | 170.0 | | | 168.4 | | | 175.2 | | | 170.1 | |
Equity in earnings of joint ventures | | | 21.4 | | | 21.8 | | | 66.5 | | | 31.9 | |
General and administrative expenses | | | (32.6 | ) | | (29.9 | ) | | (34.0 | ) | | (36.9 | ) |
Acquisition and integration expenses | | | (15.4 | ) | | (20.0 | ) | | — | | | (3.3 | ) |
Gain on disposal activities | | | — | | | 0.6 | | | — | | | — | |
| | | | | | | | | | | | | | |
Income from operations | | | 143.4 | | | 140.9 | | | 207.7 | | | 161.8 | |
Other income | | | 0.8 | | | 1.3 | | | 2.1 | | | 2.5 | |
Interest expense | | | (53.6 | ) | | (61.8 | ) | | (61.6 | ) | | (54.3 | ) |
| | | | | | | | | | | | | | |
Income before income tax expense | | | 90.6 | | | 80.4 | | | 148.2 | | | 110.0 | |
Income tax expense (benefit) | | | 24.8 | | | (35.4 | ) | | 12.1 | | | 6.2 | |
| | | | | | | | | | | | | | |
Net income | | | 65.8 | | | 115.8 | | | 136.1 | | | 103.8 | |
Noncontrolling interest in income of consolidated subsidiaries, net of tax | | | (18.6 | ) | | (13.4 | ) | | (34.8 | ) | | (15.3 | ) |
| | | | | | | | | | | | | | |
Net income attributable to AECOM | | $ | 47.2 | | $ | 102.4 | | $ | 101.3 | | $ | 88.5 | |
| | | | | | | | | | | | | | |
| | | | | | | | | | | | | | |
| | | | | | | | | | | | | | |
Net income attributable to AECOM per share: | | | | | | | | | | | | | |
Basic | | $ | 0.31 | | $ | 0.66 | | $ | 0.65 | | $ | 0.56 | |
Diluted | | $ | 0.30 | | $ | 0.65 | | $ | 0.64 | | $ | 0.55 | |
Weighted average common shares outstanding: | | |
| | |
| | |
| | |
| |
Basic | | | 154.3 | | | 155.4 | | | 155.8 | | | 157.5 | |
Diluted | | | 158.0 | | | 158.7 | | | 158.8 | | | 161.1 | |
Table of Contents
AECOM
NOTES TO CONSOLIDATED FINANCIAL STATEMENTS (Continued)
21. Quarterly Financial Information—Unaudited (Continued)
| | | | | | | | | | | | | |
Fiscal Year 2016: | | First
Quarter | | Second
Quarter | | Third
Quarter | | Fourth
Quarter | |
|---|
| | (in millions, except per share data)
| |
|---|
Revenue | | $ | 4,297.7 | | $ | 4,381.2 | | $ | 4,408.8 | | $ | 4,323.1 | |
Cost of revenue | | | 4,156.8 | | | 4,197.8 | | | 4,237.5 | | | 4,175.9 | |
| | | | | | | | | | | | | | |
Gross profit | | | 140.9 | | | 183.4 | | | 171.3 | | | 147.2 | |
Equity in earnings of joint ventures | | | 25.2 | | | 39.1 | | | 18.5 | | | 21.2 | |
General and administrative expenses | | | (28.7 | ) | | (29.5 | ) | | (28.7 | ) | | (28.2 | ) |
Acquisition and integration expenses | | | (41.0 | ) | | (50.7 | ) | | (50.7 | ) | | (71.2 | ) |
Loss on disposal activities | | | (41.0 | ) | | (1.6 | ) | | — | | | — | |
| | | | | | | | | | | | | | |
Income from operations | | | 55.4 | | | 140.7 | | | 110.4 | | | 69.0 | |
Other income | | | 3.0 | | | 0.8 | | | 1.5 | | | 2.9 | |
Interest expense | | | (59.5 | ) | | (62.7 | ) | | (62.6 | ) | | (73.3 | ) |
| | | | | | | | | | | | | | |
(Loss) / income before income tax expense | | | (1.1 | ) | | 78.8 | | | 49.3 | | | (1.4 | ) |
Income tax (benefit) expense | | | (0.7 | ) | | 12.2 | | | (35.1 | ) | | (14.3 | ) |
| | | | | | | | | | | | | | |
Net (loss) / income | | | (0.4 | ) | | 66.6 | | | 84.4 | | | 12.9 | |
Noncontrolling interest in income of consolidated subsidiaries, net of tax | | | (20.0 | ) | | (24.7 | ) | | (17.0 | ) | | (5.7 | ) |
| | | | | | | | | | | | | | |
Net (loss) / income attributable to AECOM | | $ | (20.4 | ) | $ | 41.9 | | $ | 67.4 | | $ | 7.2 | |
| | | | | | | | | | | | | | |
| | | | | | | | | | | | | | |
| | | | | | | | | | | | | | |
Net (loss) / income attributable to AECOM per share: | | | | | | | | | | | | | |
Basic | | $ | (0.13 | ) | $ | 0.27 | | $ | 0.44 | | $ | 0.05 | |
Diluted | | $ | (0.13 | ) | $ | 0.27 | | $ | 0.43 | | $ | 0.05 | |
Weighted average common shares outstanding: | | |
| | |
| | |
| | |
| |
Basic | | | 153.6 | | | 154.3 | | | 154.9 | | | 156.3 | |
Diluted | | | 153.6 | | | 155.4 | | | 156.2 | | | 157.9 | |
22. Condensed Consolidating Financial Information
In connection with the registration of the Company's 2014 Senior Notes that were declared effective by the SEC on September 29, 2015, AECOM became subject to the requirements of Rule 3-10 of Regulation S-X regarding financial statements of guarantors and issuers of guaranteed securities. Both the 2014 Senior Notes and the 2017 Senior Notes are fully and unconditionally guaranteed on a joint and several basis by certain of AECOM's directly and indirectly 100% owned subsidiaries (the Subsidiary Guarantors). Other than customary restrictions imposed by applicable statutes, there are no restrictions on the ability of the Subsidiary Guarantors to transfer funds to AECOM in the form of cash dividends, loans or advances.
The following condensed consolidating financial information, which is presented for AECOM, the Subsidiary Guarantors on a combined basis and AECOM's non-guarantor subsidiaries on a combined basis, is provided to satisfy the disclosure requirements of Rule 3-10 of Regulation S-X.
Table of Contents
AECOM
NOTES TO CONSOLIDATED FINANCIAL STATEMENTS (Continued)
22. Condensed Consolidating Financial Information (Continued)
Condensed Consolidating Balance Sheets
(in millions)
September 30, 2017
| | | | | | | | | | | | | | | | |
| | Parent | | Guarantor
Subsidiaries | | Non-
Guarantor
Subsidiaries | | Eliminations | | Total | |
|---|
ASSETS | | | | | | | | | | | | | | | | |
CURRENT ASSETS: | | | | | | | | | | | | | | | | |
Total cash and cash equivalents | | $ | 32.6 | | $ | 251.6 | | $ | 518.2 | | $ | — | | $ | 802.4 | |
Accounts receivable—net | | | — | | | 2,159.2 | | | 2,968.5 | | | — | | | 5,127.7 | |
Intercompany receivable | | | 723.6 | | | 90.9 | | | 181.4 | | | (995.9 | ) | | — | |
Prepaid expenses and other current assets | | | 67.5 | | | 338.4 | | | 290.8 | | | — | | | 696.7 | |
Income taxes receivable | | | 4.3 | | | — | | | 51.1 | | | — | | | 55.4 | |
| | | | | | | | | | | | | | | | | |
TOTAL CURRENT ASSETS | | | 828.0 | | | 2,840.1 | | | 4,010.0 | | | (995.9 | ) | | 6,682.2 | |
PROPERTY AND EQUIPMENT—NET | | | 160.2 | | | 207.1 | | | 254.1 | | | — | | | 621.4 | |
DEFERRED TAX ASSETS—NET | | | 239.7 | | | 55.2 | | | 171.0 | | | (294.6 | ) | | 171.3 | |
INVESTMENTS IN CONSOLIDATED JOINT VENTURES | | | 6,606.2 | | | 2,865.0 | | | — | | | (9,471.2 | ) | | — | |
INVESTMENTS IN UNCONSOLIDATED JOINT VENTURES | | | 7.2 | | | 50.3 | | | 306.7 | | | — | | | 364.2 | |
GOODWILL | | | — | | | 3,318.6 | | | 2,674.3 | | | — | | | 5,992.9 | |
INTANGIBLE ASSETS—NET | | | — | | | 271.6 | | | 143.5 | | | — | | | 415.1 | |
OTHER NON-CURRENT ASSETS | | | 8.7 | | | 17.6 | | | 123.6 | | | — | | | 149.9 | |
| | | | | | | | | | | | | | | | | |
TOTAL ASSETS | | $ | 7,850.0 | | $ | 9,625.5 | | $ | 7,683.2 | | $ | (10,761.7 | ) | $ | 14,397.0 | |
| | | | | | | | | | | | | | | | | |
| | | | | | | | | | | | | | | | | |
| | | | | | | | | | | | | | | | | |
LIABILITIES AND STOCKHOLDERS' EQUITY | | | | | | | | | | | | | | | | |
CURRENT LIABILITIES: | | | | | | | | | | | | | | | | |
Short-term debt | | $ | 1.1 | | $ | — | | $ | 0.1 | | $ | — | | $ | 1.2 | |
Accounts payable | | | 33.8 | | | 1,023.7 | | | 1,192.4 | | | — | | | 2,249.9 | |
Accrued expenses and other current liabilities | | | 92.2 | | | 1,112.9 | | | 1,040.4 | | | — | | | 2,245.5 | |
Accrued taxes payable | | | — | | | — | | | 38.2 | | | — | | | 38.2 | |
Intercompany payable | | | 149.2 | | | 787.5 | | | 161.4 | | | (1,098.1 | ) | | — | |
Billings in excess of costs on uncompleted contracts | | | 3.4 | | | 313.1 | | | 586.3 | | | — | | | 902.8 | |
Current portion of long-term debt | | | 110.9 | | | 14.9 | | | 15.0 | | | — | | | 140.8 | |
| | | | | | | | | | | | | | | | | |
TOTAL CURRENT LIABILITIES | | | 390.6 | | | 3,252.1 | | | 3,033.8 | | | (1,098.1 | ) | | 5,578.4 | |
OTHER LONG-TERM LIABILITIES | | | 102.3 | | | 285.7 | | | 493.3 | | | — | | | 881.3 | |
DEFERRED TAX LIABILITY—NET | | | — | | | — | | | 315.1 | | | (294.6 | ) | | 20.5 | |
NOTE PAYABLE INTERCOMPANY—NON CURRENT | | | 0.1 | | | — | | | 467.2 | | | (467.3 | ) | | — | |
LONG-TERM DEBT | | | 3,366.9 | | | 281.6 | | | 53.6 | | | — | | | 3,702.1 | |
| | | | | | | | | | | | | | | | | |
TOTAL LIABILITIES | | | 3,859.9 | | | 3,819.4 | | | 4,363.0 | | | (1,860.0 | ) | | 10,182.3 | |
TOTAL AECOM STOCKHOLDERS' EQUITY | | | 3,990.1 | | | 5,806.1 | | | 3,101.6 | | | (8,901.7 | ) | | 3,996.1 | |
Noncontrolling interests | | | — | | | — | | | 218.6 | | | — | | | 218.6 | |
| | | | | | | | | | | | | | | | | |
TOTAL STOCKHOLDERS' EQUITY | | | 3,990.1 | | | 5,806.1 | | | 3,320.2 | | | (8,901.7 | ) | | 4,214.7 | |
| | | | | | | | | | | | | | | | | |
TOTAL LIABILITIES AND STOCKHOLDERS' EQUITY | | $ | 7,850.0 | | $ | 9,625.5 | | $ | 7,683.2 | | $ | (10,761.7 | ) | $ | 14,397.0 | |
| | | | | | | | | | | | | | | | | |
| | | | | | | | | | | | | | | | | |
| | | | | | | | | | | | | | | | | |
Table of Contents
AECOM
NOTES TO CONSOLIDATED FINANCIAL STATEMENTS (Continued)
22. Condensed Consolidating Financial Information (Continued)
Condensed Consolidating Balance Sheets
(in millions)
September 30, 2016
| | | | | | | | | | | | | | | | |
| | Parent | | Guarantor
Subsidiaries | | Non-
Guarantor
Subsidiaries | | Eliminations | | Total | |
|---|
ASSETS | | | | | | | | | | | | | | | | |
CURRENT ASSETS: | | | | | | | | | | | | | | | | |
Total cash and cash equivalents | | $ | 1.8 | | $ | 183.7 | | $ | 506.6 | | $ | — | | $ | 692.1 | |
Accounts receivable—net | | | — | | | 2,034.0 | | | 2,497.5 | | | — | | | 4,531.5 | |
Intercompany receivable | | | 760.7 | | | 151.7 | | | 152.0 | | | (1,064.4 | ) | | — | |
Prepaid expenses and other current assets | | | 98.7 | | | 336.2 | | | 295.2 | | | — | | | 730.1 | |
Income taxes receivable | | | 28.7 | | | — | | | 18.4 | | | — | | | 47.1 | |
| | | | | | | | | | | | | | | | | |
TOTAL CURRENT ASSETS | | | 889.9 | | | 2,705.6 | | | 3,469.7 | | | (1,064.4 | ) | | 6,000.8 | |
PROPERTY AND EQUIPMENT—NET | | | 169.3 | | | 236.5 | | | 239.2 | | | — | | | 645.0 | |
DEFERRED TAX ASSETS—NET | | | 265.2 | | | — | | | 129.8 | | | (223.5 | ) | | 171.5 | |
INVESTMENTS IN CONSOLIDATED SUBSIDIARIES | | | 6,031.7 | | | 2,681.5 | | | — | | | (8,713.2 | ) | | — | |
INVESTMENTS IN UNCONSOLIDATED JOINT VENTURES | | | 0.7 | | | 48.6 | | | 281.2 | | | — | | | 330.5 | |
GOODWILL | | | — | | | 3,286.6 | | | 2,537.2 | | | — | | | 5,823.8 | |
INTANGIBLE ASSETS—NET | | | — | | | 334.0 | | | 145.4 | | | — | | | 479.4 | |
OTHER NON-CURRENT ASSETS | | | 8.2 | | | 71.5 | | | 139.2 | | | — | | | 218.9 | |
| | | | | | | | | | | | | | | | | |
TOTAL ASSETS | | $ | 7,365.0 | | $ | 9,364.3 | | $ | 6,941.7 | | $ | (10,001.1 | ) | $ | 13,669.9 | |
| | | | | | | | | | | | | | | | | |
| | | | | | | | | | | | | | | | | |
| | | | | | | | | | | | | | | | | |
LIABILITIES AND STOCKHOLDERS' EQUITY | | | | | | | | | | | | | | | | |
CURRENT LIABILITIES: | | | | | | | | | | | | | | | | |
Short-term debt | | $ | 3.1 | | $ | 7.3 | | $ | 15.9 | | $ | — | | $ | 26.3 | |
Accounts payable | | | 45.8 | | | 907.0 | | | 958.1 | | | — | | | 1,910.9 | |
Accrued expenses and other current liabilities | | | 201.2 | | | 1,137.1 | | | 1,046.5 | | | — | | | 2,384.8 | |
Accrued taxes payable | | | — | | | — | | | 10.8 | | | — | | | 10.8 | |
Intercompany payable | | | 114.1 | | | 857.9 | | | 208.8 | | | (1,180.8 | ) | | — | |
Billings in excess of costs on uncompleted contracts | | | — | | | 237.5 | | | 394.4 | | | — | | | 631.9 | |
Current portion of long-term debt | | | 108.2 | | | 222.1 | | | 9.7 | | | — | | | 340.0 | |
| | | | | | | | | | | | | | | | | |
TOTAL CURRENT LIABILITIES | | | 472.4 | | | 3,368.9 | | | 2,644.2 | | | (1,180.8 | ) | | 5,304.7 | |
OTHER LONG-TERM LIABILITIES | | | 115.7 | | | 349.3 | | | 632.4 | | | — | | | 1,097.4 | |
DEFERRED TAX LIABILITY—NET | | | — | | | 236.6 | | | — | | | (223.5 | ) | | 13.1 | |
NOTE PAYABLE INTERCOMPANY—NON CURRENT | | | — | | | — | | | 563.5 | | | (563.5 | ) | | — | |
LONG-TERM DEBT | | | 3,411.2 | | | 273.4 | | | 17.6 | | | — | | | 3,702.2 | |
| | | | | | | | | | | | | | | | | |
TOTAL LIABILITIES | | | 3,999.3 | | | 4,228.2 | | | 3,857.7 | | | (1,967.8 | ) | | 10,117.4 | |
TOTAL AECOM STOCKHOLDERS' EQUITY | | | 3,365.7 | | | 5,136.1 | | | 2,898.4 | | | (8,033.3 | ) | | 3,366.9 | |
Noncontrolling interests | | | — | | | — | | | 185.6 | | | — | | | 185.6 | |
| | | | | | | | | | | | | | | | | |
TOTAL STOCKHOLDERS' EQUITY | | | 3,365.7 | | | 5,136.1 | | | 3,084.0 | | | (8,033.3 | ) | | 3,552.5 | |
| | | | | | | | | | | | | | | | | |
TOTAL LIABILITIES AND STOCKHOLDERS' EQUITY | | $ | 7,365.0 | | $ | 9,364.3 | | $ | 6,941.7 | | $ | (10,001.1 | ) | $ | 13,669.9 | |
| | | | | | | | | | | | | | | | | |
| | | | | | | | | | | | | | | | | |
| | | | | | | | | | | | | | | | | |
Table of Contents
AECOM
NOTES TO CONSOLIDATED FINANCIAL STATEMENTS (Continued)
22. Condensed Consolidating Financial Information (Continued)
Condensed Consolidating Statements of Operations
(in millions)
| | | | | | | | | | | | | | | | |
| | For the Fiscal Year Ended September 30, 2017 | |
|---|
| | Parent | | Guarantor
Subsidiaries | | Non-Guarantor
Subsidiaries | | Eliminations | | Total | |
|---|
Revenue | | $ | — | | $ | 9,367.1 | | $ | 8,905.0 | | $ | (68.7 | ) | $ | 18,203.4 | |
Cost of revenue | | | — | | | 9,000.3 | | | 8,588.1 | | | (68.7 | ) | | 17,519.7 | |
| | | | | | | | | | | | | | | | | |
Gross profit | | | — | | | 366.8 | | | 316.9 | | | — | | | 683.7 | |
Equity in earnings from subsidiaries | | | 439.3 | | | 217.2 | | | — | | | (656.5 | ) | | — | |
Equity in earnings of joint ventures | | | — | | | 25.4 | | | 116.2 | | | — | | | 141.6 | |
General and administrative expenses | | | (124.7 | ) | | — | | | (8.7 | ) | | — | | | (133.4 | ) |
Acquisition and integration expenses | | | (38.7 | ) | | — | | | — | | | — | | | (38.7 | ) |
Gain on disposal activities | | | — | | | — | | | 0.6 | | | — | | | 0.6 | |
| | | | | | | | | | | | | | | | | |
Income from operations | | | 275.9 | | | 609.4 | | | 425.0 | | | (656.5 | ) | | 653.8 | |
Other income | | | 2.2 | | | 31.7 | | | 9.3 | | | (36.5 | ) | | 6.7 | |
Interest expense | | | (203.7 | ) | | (26.5 | ) | | (37.6 | ) | | 36.5 | | | (231.3 | ) |
| | | | | | | | | | | | | | | | | |
Income before income tax (benefit) expense | | | 74.4 | | | 614.6 | | | 396.7 | | | (656.5 | ) | | 429.2 | |
Income tax (benefit) expense | | | (264.9 | ) | | 175.8 | | | 65.1 | | | 31.7 | | | 7.7 | |
| | | | | | | | | | | | | | | | | |
Net income | | | 339.3 | | | 438.8 | | | 331.6 | | | (688.2 | ) | | 421.5 | |
Noncontrolling interests in income of consolidated subsidiaries, net of tax | | | — | | | — | | | (82.1 | ) | | — | | | (82.1 | ) |
| | | | | | | | | | | | | | | | | |
Net income attributable to AECOM | | $ | 339.3 | | $ | 438.8 | | $ | 249.5 | | $ | (688.2 | ) | $ | 339.4 | |
| | | | | | | | | | | | | | | | | |
| | | | | | | | | | | | | | | | | |
| | | | | | | | | | | | | | | | | |
| | | | | | | | | | | | | | | | |
| | For the Fiscal Year Ended September 30, 2016 | |
|---|
| | Parent | | Guarantor
Subsidiaries | | Non-Guarantor
Subsidiaries | | Eliminations | | Total | |
|---|
Revenue | | $ | — | | $ | 9,227.5 | | $ | 8,265.3 | | $ | (82.0 | ) | $ | 17,410.8 | |
Cost of revenue | | | — | | | 8,909.4 | | | 7,940.6 | | | (82.0 | ) | | 16,768.0 | |
| | | | | | | | | | | | | | | | | |
Gross profit | | | — | | | 318.1 | | | 324.7 | | | — | | | 642.8 | |
Equity in earnings from subsidiaries | | | 437.4 | | | 243.6 | | | — | | | (681.0 | ) | | — | |
Equity in earnings of joint ventures | | | — | | | 27.3 | | | 76.7 | | | — | | | 104.0 | |
General and administrative expenses | | | (114.0 | ) | | (1.1 | ) | | — | | | — | | | (115.1 | ) |
Acquisition and integration expenses | | | (213.6 | ) | | — | | | — | | | — | | | (213.6 | ) |
Loss on disposal activities | | | — | | | — | | | (42.6 | ) | | — | | | (42.6 | ) |
| | | | | | | | | | | | | | | | | |
Income from operations | | | 109.8 | | | 587.9 | | | 358.8 | | | (681.0 | ) | | 375.5 | |
Other income | | | 0.8 | | | 34.7 | | | 12.7 | | | (40.0 | ) | | 8.2 | |
Interest expense | | | (231.7 | ) | | (23.6 | ) | | (42.8 | ) | | 40.0 | | | (258.1 | ) |
| | | | | | | | | | | | | | | | | |
Income (loss) before income tax expense | | | (121.1 | ) | | 599.0 | | | 328.7 | | | (681.0 | ) | | 125.6 | |
Income tax (benefit) expense | | | (217.3 | ) | | 114.3 | | | 27.8 | | | 37.3 | | | (37.9 | ) |
| | | | | | | | | | | | | | | | | |
Net income | | | 96.2 | | | 484.7 | | | 300.9 | | | (718.3 | ) | | 163.5 | |
Noncontrolling interests in income of consolidated subsidiaries, net of tax | | | — | | | — | | | (67.4 | ) | | — | | | (67.4 | ) |
| | | | | | | | | | | | | | | | | |
Net income attributable to AECOM | | $ | 96.2 | | $ | 484.7 | | $ | 233.5 | | $ | (718.3 | ) | $ | 96.1 | |
| | | | | | | | | | | | | | | | | |
| | | | | | | | | | | | | | | | | |
| | | | | | | | | | | | | | | | | |
Table of Contents
AECOM
NOTES TO CONSOLIDATED FINANCIAL STATEMENTS (Continued)
22. Condensed Consolidating Financial Information (Continued)
| | | | | | | | | | | | | | | | |
| | For the Fiscal Year Ended September 30, 2015 | |
|---|
| | Parent | | Guarantor
Subsidiaries | | Non-Guarantor
Subsidiaries | | Eliminations | | Total | |
|---|
Revenue | | $ | — | | $ | 8,749.5 | | $ | 9,463.6 | | $ | (223.2 | ) | $ | 17,989.9 | |
Cost of revenue | | | — | | | 8,486.4 | | | 9,191.5 | | | (223.2 | ) | | 17,454.7 | |
| | | | | | | | | | | | | | | | | |
Gross profit | | | — | | | 263.1 | | | 272.1 | | | — | | | 535.2 | |
Equity in earnings from subsidiaries | | | 321.3 | | | 198.9 | | | — | | | (520.2 | ) | | — | |
Equity in earnings of joint ventures | | | — | | | 20.0 | | | 86.2 | | | — | | | 106.2 | |
General and administrative expenses | | | (112.2 | ) | | (1.8 | ) | | — | | | — | | | (114.0 | ) |
Acquisition and integration expenses | | | (346.9 | ) | | (51.5 | ) | | — | | | — | | | (398.4 | ) |
| | | | | | | | | | | | | | | | | |
(Loss) income from operations | | | (137.8 | ) | | 428.7 | | | 358.3 | | | (520.2 | ) | | 129.0 | |
Other income | | | 5.1 | | | 34.9 | | | 14.7 | | | (35.6 | ) | | 19.1 | |
Interest expense | | | (275.4 | ) | | (20.4 | ) | | (39.4 | ) | | 35.6 | | | (299.6 | ) |
| | | | | | | | | | | | | | | | | |
(Loss) income before income tax expense | | | (408.1 | ) | | 443.2 | | | 333.6 | | | (520.2 | ) | | (151.5 | ) |
Income tax (benefit) expense | | | (253.3 | ) | | 66.7 | | | 61.0 | | | 45.3 | | | (80.3 | ) |
| | | | | | | | | | | | | | | | | |
Net (loss) income | | | (154.8 | ) | | 376.5 | | | 272.6 | | | (565.5 | ) | | (71.2 | ) |
Noncontrolling interests in income of consolidated subsidiaries, net of tax | | | — | | | — | | | (83.6 | ) | | — | | | (83.6 | ) |
| | | | | | | | | | | | | | | | | |
Net (loss) income attributable to AECOM | | $ | (154.8 | ) | $ | 376.5 | | $ | 189.0 | | $ | (565.5 | ) | $ | (154.8 | ) |
| | | | | | | | | | | | | | | | | |
| | | | | | | | | | | | | | | | | |
| | | | | | | | | | | | | | | | | |
Consolidating Statements of Comprehensive Income (Loss)
(in millions)
| | | | | | | | | | | | | | | | |
| | For the Fiscal Year Ended September 30, 2017 | |
|---|
| | Parent | | Guarantor
Subsidiaries | | Non-Guarantor
Subsidiaries | | Eliminations | | Total | |
|---|
Net income | | $ | 339.3 | | $ | 438.8 | | $ | 331.6 | | $ | (688.2 | ) | $ | 421.5 | |
Other comprehensive income (loss), net of tax: | | | | | | | | | | | | | | | | |
Net unrealized gain (loss) on derivatives, net of tax | | | 4.9 | | | — | | | (0.3 | ) | | — | | | 4.6 | |
Foreign currency translation adjustments | | | — | | | — | | | 65.4 | | | — | | | 65.4 | |
Pension adjustments, net of tax | | | 7.1 | | | 13.8 | | | 66.1 | | | — | | | 87.0 | |
| | | | | | | | | | | | | | | | | |
Other comprehensive income, net of tax | | | 12.0 | | | 13.8 | | | 131.2 | | | — | | | 157.0 | |
| | | | | | | | | | | | | | | | | |
Comprehensive income, net of tax | | | 351.3 | | | 452.6 | | | 462.8 | | | (688.2 | ) | | 578.5 | |
Noncontrolling interests in comprehensive income of consolidated subsidiaries, net of tax | | | — | | | — | | | (82.2 | ) | | — | | | (82.2 | ) |
| | | | | | | | | | | | | | | | | |
Comprehensive income attributable to AECOM, net of tax | | $ | 351.3 | | $ | 452.6 | | $ | 380.6 | | $ | (688.2 | ) | $ | 496.3 | |
| | | | | | | | | | | | | | | | | |
| | | | | | | | | | | | | | | | | |
| | | | | | | | | | | | | | | | | |
Table of Contents
AECOM
NOTES TO CONSOLIDATED FINANCIAL STATEMENTS (Continued)
22. Condensed Consolidating Financial Information (Continued)
| | | | | | | | | | | | | | | | |
| | For the Fiscal Year Ended September 30, 2016 | |
|---|
| | Parent | | Guarantor
Subsidiaries | | Non-Guarantor
Subsidiaries | | Eliminations | | Total | |
|---|
Net income | | $ | 96.2 | | $ | 484.7 | | $ | 300.9 | | $ | (718.3 | ) | $ | 163.5 | |
Other comprehensive income (loss), net of tax: | | | | | | | | | | | | | | | | |
Net unrealized gain on derivatives, net of tax | | | 2.6 | | | — | | | 3.4 | | | — | | | 6.0 | |
Foreign currency translation adjustments | | | — | | | — | | | (65.3 | ) | | — | | | (65.3 | ) |
Pension adjustments, net of tax | | | (3.3 | ) | | (14.9 | ) | | (146.7 | ) | | — | | | (164.9 | ) |
| | | | | | | | | | | | | | | | | |
Other comprehensive loss, net of tax | | | (0.7 | ) | | (14.9 | ) | | (208.6 | ) | | — | | | (224.2 | ) |
| | | | | | | | | | | | | | | | | |
Comprehensive income (loss), net of tax | | | 95.5 | | | 469.8 | | | 92.3 | | | (718.3 | ) | | (60.7 | ) |
Noncontrolling interests in comprehensive income of consolidated subsidiaries, net of tax | | | — | | | — | | | (65.7 | ) | | — | | | (65.7 | ) |
| | | | | | | | | | | | | | | | | |
Comprehensive income (loss) attributable to AECOM, net of tax | | $ | 95.5 | | $ | 469.8 | | $ | 26.6 | | $ | (718.3 | ) | $ | (126.4 | ) |
| | | | | | | | | | | | | | | | | |
| | | | | | | | | | | | | | | �� | | |
| | | | | | | | | | | | | | | | | |
| | | | | | | | | | | | | | | | |
| | For the Fiscal Year Ended September 30, 2015 | |
|---|
| | Parent | | Guarantor
Subsidiaries | | Non-Guarantor
Subsidiaries | | Eliminations | | Total | |
|---|
Net (loss) income | | $ | (154.8 | ) | $ | 376.5 | | $ | 272.6 | | $ | (565.5 | ) | $ | (71.2 | ) |
Other comprehensive income (loss), net of tax: | | | | | | | | | | | | | | | | |
Net unrealized loss on derivatives, net of tax | | | (6.1 | ) | | — | | | (3.1 | ) | | — | | | (9.2 | ) |
Foreign currency translation adjustments | | | — | | | — | | | (285.6 | ) | | — | | | (285.6 | ) |
Pension adjustments, net of tax | | | 1.8 | | | 6.4 | | | 4.8 | | | — | | | 13.0 | |
| | | | | | | | | | | | | | | | | |
Other comprehensive (loss) income, net of tax | | | (4.3 | ) | | 6.4 | | | (283.9 | ) | | — | | | (281.8 | ) |
| | | | | | | | | | | | | | | | | |
Comprehensive (loss) income, net of tax | | | (159.1 | ) | | 382.9 | | | (11.3 | ) | | (565.5 | ) | | (353.0 | ) |
Noncontrolling interests in comprehensive income of consolidated subsidiaries, net of tax | | | — | | | — | | | (80.3 | ) | | — | | | (80.3 | ) |
| | | | | | | | | | | | | | | | | |
Comprehensive (loss) income attributable to AECOM, net of tax | | $ | (159.1 | ) | $ | 382.9 | | $ | (91.6 | ) | $ | (565.5 | ) | $ | (433.3 | ) |
| | | | | | | | | | | | | | | | | |
| | | | | | | | | | | | | | | | | |
| | | | | | | | | | | | | | | | | |
Table of Contents
AECOM
NOTES TO CONSOLIDATED FINANCIAL STATEMENTS (Continued)
22. Condensed Consolidating Financial Information (Continued)
Condensed Consolidating Statements of Cash Flows
(in millions)
| | | | | | | | | | | | | | | | |
| | For the Fiscal Year Ended September 30, 2017 | |
|---|
| | Parent | | Guarantor
Subsidiaries | | Non-Guarantor
Subsidiaries | | Eliminations | | Total | |
|---|
CASH FLOWS FROM OPERATING ACTIVITIES | | $ | (5.9 | ) | $ | 691.2 | | $ | 11.4 | | $ | — | | $ | 696.7 | |
CASH FLOWS FROM INVESTING ACTIVITIES: | | | | | | | | | | | | | | | | |
Payments for business acquisitions, net of cash acquired | | | — | | | — | | | (103.1 | ) | | — | | | (103.1 | ) |
Proceeds from disposal of business, net of cash disposed | | | — | | | — | | | 2.2 | | | — | | | 2.2 | |
Net investment in unconsolidated joint ventures | | | — | | | (2.6 | ) | | (21.7 | ) | | — | | | (24.3 | ) |
Net purchases of investments | | | — | | | — | | | 0.9 | | | — | | | 0.9 | |
Payments for capital expenditures, net of disposals | | | (21.7 | ) | | (29.3 | ) | | (27.4 | ) | | — | | | (78.4 | ) |
Net investment in intercompany notes | | | (4.6 | ) | | 102.8 | | | 12.2 | | | (110.4 | ) | | — | |
Other intercompany investing activities | | | 139.0 | | | (221.0 | ) | | — | | | 82.0 | | | — | |
| | | | | | | | | | | | | | | | | |
Net cash provided by (used in) investing activities | | | 112.7 | | | (150.1 | ) | | (136.9 | ) | | (28.4 | ) | | (202.7 | ) |
| | | | | | | | | | | | | | | | | |
CASH FLOWS FROM FINANCING ACTIVITIES: | | | | | | | | | | | | | | | | |
Proceeds from borrowings under credit agreements | | | 5,903.5 | | | 13.1 | | | 36.6 | | | — | | | 5,953.2 | |
Repayments of borrowings under credit agreements | | | (6,956.3 | ) | | (51.1 | ) | | (64.2 | ) | | — | | | (7,071.6 | ) |
Issuance of unsecured senior notes | | | 1,000.0 | | | — | | | — | | | — | | | 1,000.0 | |
Redemption of unsecured senior notes | | | — | | | (179.2 | ) | | — | | | — | | | (179.2 | ) |
Cash paid for debt and equity issuance costs | | | (13.0 | ) | | — | | | — | | | — | | | (13.0 | ) |
Proceeds from issuance of common stock | | | 30.1 | | | — | | | — | | | — | | | 30.1 | |
Proceeds from exercise of stock options | | | 4.9 | | | — | | | — | | | — | | | 4.9 | |
Payments to repurchase common stock | | | (25.1 | ) | | — | | | — | | | — | | | (25.1 | ) |
Net distributions to noncontrolling interests | | | — | | | — | | | (59.0 | ) | | — | | | (59.0 | ) |
Other financing activities | | | (24.1 | ) | | (38.3 | ) | | 35.6 | | | — | | | (26.8 | ) |
Net borrowings (repayments) on intercompany notes | | | 4.0 | | | (16.3 | ) | | (98.1 | ) | | 110.4 | | | — | |
Other intercompany financing activities | | | — | | | (201.4 | ) | | 283.4 | | | (82.0 | ) | | — | |
| | | | | | | | | | | | | | | | | |
Net cash (used in) provided by financing activities | | | (76.0 | ) | | (473.2 | ) | | 134.3 | | | 28.4 | | | (386.5 | ) |
| | | | | | | | | | | | | | | | | |
EFFECT OF EXCHANGE RATE CHANGES ON CASH | | | — | | | — | | | 2.8 | | | — | | | 2.8 | |
NET INCREASE IN CASH AND CASH EQUIVALENTS | | | 30.8 | | | 67.9 | | | 11.6 | | | — | | | 110.3 | |
CASH AND CASH EQUIVALENTS AT BEGINNING OF YEAR | | | 1.8 | | | 183.7 | | | 506.6 | | | — | | | 692.1 | |
| | | | | | | | | | | | | | | | | |
CASH AND CASH EQUIVALENTS AT END OF YEAR | | $ | 32.6 | | $ | 251.6 | | $ | 518.2 | | $ | — | | $ | 802.4 | |
| | | | | | | | | | | | | | | | | |
| | | | | | | | | | | | | | | | | |
| | | | | | | | | | | | | | | | | |
Table of Contents
AECOM
NOTES TO CONSOLIDATED FINANCIAL STATEMENTS (Continued)
22. Condensed Consolidating Financial Information (Continued)
| | | | | | | | | | | | | | | | |
| | For the Fiscal Year Ended September 30, 2016 | |
|---|
| | Parent | | Guarantor
Subsidiaries | | Non-Guarantor
Subsidiaries | | Eliminations | | Total | |
|---|
CASH FLOWS FROM OPERATING ACTIVITIES | | $ | (273.6 | ) | $ | 623.7 | | $ | 464.1 | | $ | — | | $ | 814.2 | |
CASH FLOWS FROM INVESTING ACTIVITIES: | | | | | | | | | | | | | | | | |
Payments for business acquisitions, net of cash acquired | | | — | | | (1.0 | ) | | (4.5 | ) | | — | | | (5.5 | ) |
Proceeds from disposal of businesses and property | | | — | | | — | | | 39.7 | | | — | | | 39.7 | |
Net investment in unconsolidated joint ventures | | | — | | | (3.9 | ) | | (67.6 | ) | | — | | | (71.5 | ) |
Net sales of investments | | | — | | | — | | | 11.5 | | | — | | | 11.5 | |
Payments for capital expenditures, net of disposals | | | (82.0 | ) | | (58.7 | ) | | 3.9 | | | — | | | (136.8 | ) |
Net receipts from (investment in) intercompany notes | | | 5.3 | | | 176.1 | | | (13.5 | ) | | (167.9 | ) | | — | |
Other intercompany investing activities | | | 791.2 | | | 140.3 | | | — | | | (931.5 | ) | | — | |
| | | | | | | | | | | | | | | | | |
Net cash provided by (used in) investing activities | | | 714.5 | | | 252.8 | | | (30.5 | ) | | (1,099.4 | ) | | (162.6 | ) |
| | | | | | | | | | | | | | | | | |
CASH FLOWS FROM FINANCING ACTIVITIES: | | | | | | | | | | | | | | | | |
Proceeds from borrowings under credit agreements | | | 4,673.0 | | | 17.6 | | | 15.6 | | | — | | | 4,706.2 | |
Repayments of borrowings under credit agreements | | | (5,124.1 | ) | | (22.8 | ) | | (53.1 | ) | | — | | | (5,200.0 | ) |
Cash paid for debt and equity issuance costs | | | (10.4 | ) | | — | | | — | | | — | | | (10.4 | ) |
Proceeds from issuance of common stock | | | 28.2 | | | — | | | — | | | — | | | 28.2 | |
Proceeds from exercise of stock options | | | 9.9 | | | — | | | — | | | — | | | 9.9 | |
Payments to repurchase common stock | | | (25.9 | ) | | — | | | — | | | — | | | (25.9 | ) |
Excess tax benefit from share-based payment | | | — | | | — | | | — | | | — | | | — | |
Net distributions to noncontrolling interests | | | — | | | — | | | (103.2 | ) | | — | | | (103.2 | ) |
Other financing activities | | | 7.9 | | | (4.5 | ) | | (46.3 | ) | | — | | | (42.9 | ) |
Net borrowings (repayments) on intercompany notes | | | 1.0 | | | 12.5 | | | (181.4 | ) | | 167.9 | | | — | |
Other intercompany financing activities | | | — | | | (858.1 | ) | | (73.4 | ) | | 931.5 | | | — | |
| | | | | | | | | | | | | | | | | |
Net cash used in financing activities | | | (440.4 | ) | | (855.3 | ) | | (441.8 | ) | | 1,099.4 | | | (638.1 | ) |
| | | | | | | | | | | | | | | | | |
EFFECT OF EXCHANGE RATE CHANGES ON CASH | | | — | | | — | | | (5.3 | ) | | — | | | (5.3 | ) |
NET INCREASE (DECREASE) IN CASH AND CASH EQUIVALENTS | | | 0.5 | | | 21.2 | | | (13.5 | ) | | — | | | 8.2 | |
CASH AND CASH EQUIVALENTS AT BEGINNING OF YEAR | | | 1.3 | | | 162.5 | | | 520.1 | | | — | | | 683.9 | |
| | | | | | | | | | | | | | | | | |
CASH AND CASH EQUIVALENTS AT END OF YEAR | | $ | 1.8 | | $ | 183.7 | | $ | 506.6 | | $ | — | | $ | 692.1 | |
| | | | | | | | | | | | | | | | | |
| | | | | | | | | | | | | | | | | |
| | | | | | | | | | | | | | | | | |
Table of Contents
AECOM
NOTES TO CONSOLIDATED FINANCIAL STATEMENTS (Continued)
22. Condensed Consolidating Financial Information (Continued)
| | | | | | | | | | | | | | | | |
| | For the Fiscal Year Ended September 30, 2015 | |
|---|
| | Parent | | Guarantor
Subsidiaries | | Non-Guarantor
Subsidiaries | | Eliminations | | Total | |
|---|
CASH FLOWS FROM OPERATING ACTIVITIES | | $ | (551.2 | ) | $ | 816.9 | | $ | 498.7 | | $ | — | | $ | 764.4 | |
CASH FLOWS FROM INVESTING ACTIVITIES: | | | | | | | | | | | | | | | | |
Payments for business acquisitions, net of cash acquired | | | (3,564.2 | ) | | 109.2 | | | 161.7 | | | — | | | (3,293.3 | ) |
Proceeds from disposal of businesses and property | | | 9.5 | | | 5.6 | | | — | | | — | | | 15.1 | |
Net investment in unconsolidated joint ventures | | | — | | | (4.0 | ) | | (28.7 | ) | | — | | | (32.7 | ) |
Sales (purchases) of investments | | | 37.3 | | | — | | | (2.7 | ) | | — | | | 34.6 | |
Payments for capital expenditures, net of disposals | | | (51.9 | ) | | (15.8 | ) | | (1.7 | ) | | — | | | (69.4 | ) |
Receipts from intercompany notes receivable | | | 95.6 | | | 128.6 | | | — | | | (224.2 | ) | | — | |
Other intercompany investing activities | | | 1,085.8 | | | 160.9 | | | — | | | (1,246.7 | ) | | — | |
| | | | | | | | | | | | | | | | | |
Net cash (used in) provided by investing activities | | | (2,387.9 | ) | | 384.5 | | | 128.6 | | | (1,470.9 | ) | | (3,345.7 | ) |
| | | | | | | | | | | | | | | | | |
CASH FLOWS FROM FINANCING ACTIVITIES: | | | | | | | | | | | | | | | | |
Proceeds from borrowings under credit agreements | | | 6,464.6 | | | 29.9 | | | 87.2 | | | — | | | 6,581.7 | |
Repayments of borrowings under credit agreements | | | (5,031.9 | ) | | (31.2 | ) | | (95.2 | ) | | — | | | (5,158.3 | ) |
Issuance of unsecured senior notes | | | 1,600.0 | | | — | | | — | | | — | | | 1,600.0 | |
Prepayment penalty on Unsecured Senior Notes | | | (55.6 | ) | | — | | | — | | | — | | | (55.6 | ) |
Cash paid for debt and equity issuance costs | | | (89.6 | ) | | — | | | — | | | — | | | (89.6 | ) |
Proceeds from issuance of common stock | | | 25.6 | | | — | | | — | | | — | | | 25.6 | |
Proceeds from exercise of stock options | | | 11.1 | | | — | | | — | | | — | | | 11.1 | |
Payments to repurchase common stock | | | (23.1 | ) | | — | | | — | | | — | | | (23.1 | ) |
Excess tax benefit from share-based payment | | | 3.6 | | | — | | | — | | | — | | | 3.6 | |
Net distributions to noncontrolling interests | | | — | | | — | | | (144.3 | ) | | — | | | (144.3 | ) |
Other financing activities | | | 2.3 | | | (4.1 | ) | | (29.5 | ) | | — | | | (31.3 | ) |
Intercompany notes repayments | | | — | | | — | | | (224.2 | ) | | 224.2 | | | — | |
Other intercompany financing activities | | | — | | | (1,119.3 | ) | | (127.4 | ) | | 1,246.7 | | | — | |
| | | | | | | | | | | | | | | | | |
Net cash provided by (used in) financing activities | | | 2,907.0 | | | (1,124.7 | ) | | (533.4 | ) | | 1,470.9 | | | 2,719.8 | |
| | | | | | | | | | | | | | | | | |
EFFECT OF EXCHANGE RATE CHANGES ON CASH | | | — | | | — | | | (28.8 | ) | | — | | | (28.8 | ) |
NET (DECREASE) INCREASE IN CASH AND CASH EQUIVALENTS | | | (32.1 | ) | | 76.7 | | | 65.1 | | | — | | | 109.7 | |
CASH AND CASH EQUIVALENTS AT BEGINNING OF YEAR | | | 33.4 | | | 85.8 | | | 455.0 | | | — | | | 574.2 | |
| | | | | | | | | | | | | | | | | |
CASH AND CASH EQUIVALENTS AT END OF YEAR | | $ | 1.3 | | $ | 162.5 | | $ | 520.1 | | $ | — | | $ | 683.9 | |
| | | | | | | | | | | | | | | | | |
| | | | | | | | | | | | | | | | | |
| | | | | | | | | | | | | | | | | |
Table of Contents
AECOM Technology Corporation
Schedule II: Valuation and Qualifying Accounts
(amounts in millions)
| | | | | | | | | | | | | | | |
| | Balance at | | Additions | | | | Other and | | Balance at |
| | Beginning | | Charged to Cost | | | | Foreign | | the End of |
| | of Year | | of Revenue | | Deductions(a) | | Exchange Impact | | the Year |
Allowance for Doubtful Accounts | | | | | | | | | | | | | | | |
Fiscal Year 2023 | | $ | 104.0 | | $ | 40.9 | | $ | (50.8) | | $ | 0.1 | | $ | 94.2 |
Fiscal Year 2022 | | $ | 92.8 | | $ | 43.9 | | $ | (29.6) | | $ | (3.1) | | $ | 104.0 |
Fiscal Year 2021 | | $ | 77.9 | | $ | 29.1 | | $ | (14.9) | | $ | 0.7 | | $ | 92.8 |
| (a) | Primarily relates to accounts written-off and recoveries |
| | | | | | | | | | | | | | | | |
| | Balance at
Beginning
of Year | | Additions
Charged to Cost
of Revenue | | Deductions(a) | | Other and
Foreign
Exchange Impact | | Balance at
the End of
the Year | |
|---|
Allowance for Doubtful Accounts | | | | | | | | | | | | | | | | |
Fiscal Year 2017 | | $ | 60.4 | | $ | 13.1 | | $ | (20.7 | ) | $ | (0.6 | ) | $ | 52.2 | |
Fiscal Year 2016 | | $ | 64.1 | | $ | 16.4 | | $ | (20.5 | ) | $ | 0.4 | | $ | 60.4 | |
Fiscal Year 2015 | | $ | 72.1 | | $ | 26.9 | | $ | (31.2 | ) | $ | (3.7 | ) | $ | 64.1 | |
(a)Primarily relates to accounts written-off and recoveries
Table of Contents
ITEM 9. CHANGES IN AND DISAGREEMENTS WITH ACCOUNTANTS ON ACCOUNTING AND FINANCIAL DISCLOSURE
None.
ITEM 9A. CONTROLS AND PROCEDURES
Evaluation of Disclosure Controls and Procedures
Our management,Based on management’s evaluation, with the participation of our CEOChief Executive Officer (CEO) and CFO, are responsible for establishing and maintaining "disclosure controls and procedures" (as defined in Rule 13a-15(e) under the Exchange Act) for our company. Based on their evaluation as of the end of the period covered by this report,Chief Financial Officer (CFO), our CEO and CFO have concluded that our disclosure controls and procedures as defined in Rules 13a-15(e) and 15(d)-15(e) under the Securities Exchange Act of 1934, as amended (Exchange Act), were effective as of September 30, 2023 to ensure that the information required to be disclosed by us in this Annual Report on Form 10-K wasor submitted under the Exchange Act is (i) recorded, processed, summarized and reported within the time periods specified in the SEC'sSecurities and Exchange Commission rules and forms, and (ii) accumulated and communicated to our management, including our principal executive and principal financial officers,officer, as appropriate, to allow timely decisions regarding required disclosures.
Management'sManagement’s Report on Internal Control over Financial Reporting
Our management is responsible for establishing and maintaining adequate internal control over financial reporting. Internal control over financial reporting is defined in Rule 13a-15(f) or 15d-15(f) promulgated under the Securities Exchange Act of 1934, as amended, as a process designed by, or under the supervision of, the company'scompany’s principal executive and principal financial officers and effected by the company'scompany’s board of directors, management and other personnel, to provide reasonable assurance regarding the reliability of financial reporting and the preparation of financial statements for external purposes in accordance with generally accepted accounting principles. Internal control over financial reporting includes those policies and procedures that (i) pertain to the maintenance of records that in reasonable detail accurately and fairly reflect the transactions and dispositions of the assets of the company; (ii) provide reasonable assurance that transactions are recorded as necessary to permit preparation of financial statements in accordance with generally accepted accounting principles, and that receipts and expenditures of the company are being made only in accordance with authorizations of management and directors of the company; and (iii) provide reasonable assurance regarding prevention or timely detection of unauthorized acquisition, use or disposition of the company'scompany’s assets that could have a material effect on the financial statements.
Because of its inherent limitations, internal control over financial reporting may not prevent or detect misstatements. Projections of any evaluation of the effectiveness to future periods are subject to the risk that controls may become inadequate because of changes in conditions, or that the degree of compliance with the policies or procedures may deteriorate.
Our management, with the participation of our CEO and CFO, assessed the effectiveness of our internal control over financial reporting as of September 30, 2017,2023, the end of our fiscal year. Our management based its assessment on criteria established inInternal Control—Integrated Framework (2013) issued by the Committee of Sponsoring Organizations of the Treadway Commission. Our management'smanagement’s assessment included evaluation and testing of the design and operating effectiveness of key financial reporting controls, process documentation, accounting policies, and our overall control environment.
Based on our management'smanagement’s assessment, our management has concluded that our internal control over financial reporting was effective as of September 30, 2017.2023. Our management communicated the results of its assessment to the Audit Committee of our Board of Directors.
Our independent registered public accounting firm, Ernst & Young LLP, audited our financial statements for the fiscal year ended September 30, 20172023 included in this Annual Report on Form 10-K, and
Table of Contents
has issued an audit report with respect to the effectiveness of the Company'sCompany’s internal control over financial reporting, a copy of which is included earlier in this Annual Report on Form 10-K.
Changes in Internal Control Over Financial Reporting
Our management, including our CEO and CFO, confirm that thereThere were no changes in our Company's internal control over financial reporting during the fiscal quarter ended September 30, 20172023 identified in connection with the evaluation required by paragraph (d) of Rules 13a-15 and 15d-15 under the Exchange Act that have materially affected, or are reasonably likely to materially affect, our Company's internal control over financial reporting.
ITEM 9B. OTHER INFORMATION
During the quarterly period ended September 30, 2023, no director or officer of the Company adopted or terminated a Rule 10b5-1 trading arrangement or a non-Rule 10b5-1 trading arrangement as each term is defined in Item 408(a) of Regulation S-K.
None.As previously reported on our Form 8-K filed March 31, 2023, disclosing the Company’s 2023 Annual Meeting of Stockholders (“2023 Annual Meeting”) results, the holders of a majority of the shares of common stock present in person or represented by proxy and entitled to vote on the proposal voted to hold future advisory votes on the Company’s executive compensation every year. In light of these results and in accordance with its previous recommendation in the proxy statement for the 2023 Annual Meeting, the Company’s Board of Directors (the “Board”) determined that the Company will hold future advisory votes on the approval of executive compensation of the Company’s named executive officers on an annual basis. The Board will reevaluate this determination after the next shareholder advisory vote on the frequency of future advisory votes on approval of executive compensation of the Company’s named executive officers, which is required to occur no later than the Company’s 2029 annual meeting of shareholders. This disclosure is intended to satisfy the requirements of Item 5.07(d) of Form 8-K.
The Company expects to incur restructuring costs of approximately $50 million to $70 million in fiscal year 2024 primarily related to ongoing actions that are expected to deliver continued margin improvement and efficiencies. Total cash costs for restructuring in fiscal year 2024 are expected to be approximately $110 million.
ITEM 9C. DISCLOSURE REGARDING FOREIGN JURISDICTIONS THAT PREVENT INSPECTIONS
Not applicable.
PART III
ITEM 10. DIRECTORS, EXECUTIVE OFFICERS AND CORPORATE GOVERNANCE
Incorporated by reference from our definitive proxy statement for the 20182024 Annual Meeting of Stockholders, to be filed within 120 days of our fiscal 20172023 year end.
ITEM 11. EXECUTIVE COMPENSATION
Incorporated by reference from our definitive proxy statement for the 20182024 Annual Meeting of Stockholders, to be filed within 120 days of our fiscal 20172023 year end.
ITEM 12. SECURITY OWNERSHIP OF CERTAIN BENEFICIAL OWNERS AND MANAGEMENT AND RELATED STOCKHOLDERS MATTERS
Other than with respect to the information relating to our equity compensation plans, which is incorporated herein by reference to Part II, Item 5, "Equity“Equity Compensation Plans"Plans” of this Form 10-K, the information required by this item is incorporated by reference from our definitive proxy statement for the 20182024 Annual Meeting of Stockholders, to be filed within 120 days of our fiscal 20172023 year end.
ITEM 13. CERTAIN RELATIONSHIPS AND RELATED TRANSACTIONS, AND DIRECTOR INDEPENDENCE
Incorporated by reference from our definitive proxy statement for the 20182024 Annual Meeting of Stockholders, to be filed within 120 days of our fiscal 20172023 year end.
ITEM 14. PRINCIPAL ACCOUNTANT FEES AND SERVICES
Incorporated by reference from our definitive proxy statement for the 20182024 Annual Meeting of Stockholders, to be filed within 120 days of our fiscal 20172023 year end.
PART IV
PART IV
ITEM 15. EXHIBITS AND FINANCIAL STATEMENT SCHEDULES
(a)Documents filed as part of this report:
(1)The company's Consolidated Financial Statements at September 30, 2017 and 2016 and for each of the three years in the period ended September 30, 2017 and the notes thereto, together with the report of the independent auditors on those Consolidated Financial Statements are hereby filed as part of this report.
(2)Financial Statement Schedule II—Valuation and Qualifying Accounts for the Years Ended September 30, 2017, 2016 and 2015.
(3)See Exhibits and Index to Exhibits, below.
(b)Exhibits.
| (a) | Documents filed as part of this report: |
| (1) | The Company’s Consolidated Financial Statements at September 30, 2023 and 2022 and for each of the three years in the period ended September 30, 2023 and the notes thereto, together with the report of the independent auditors on those Consolidated Financial Statements are hereby filed as part of this report. |
| (2) | Financial Statement Schedule II—Valuation and Qualifying Accounts for the Years Ended September 30, 2023, 2022 and 2021. |
| (3) | See Exhibits and Index to Exhibits, below. |
| | | | | | Incorporated by | | | |
|---|
| | | | | | Reference (Exchange Act | | | |
|---|
| | | | | | Filings Located at File | | | |
|---|
Exhibit | | | | | | No. 0-52423) | | Filed | |
|---|
Number | | Exhibit Description | | Form | | Exhibit | | Filing Date | | Herewith | |
|---|
| | | | | | | | | | | |
|---|
3.1 | | Amended and Restated Certificate of Incorporation of AECOM Technology Corporation. | | 10-K | | 3.1 | | 11/21/2011 | | | |
3.2 | | Certificate of Amendment to Amended and Restated Certificate of Incorporation of AECOM Technology Corporation. | | S-4 | | 3.2 | | 8/1/2014 | | | |
3.3 | | Certificate of Correction of Amended and Restated Certificate of Incorporation of AECOM Technology Corporation. | | 10-K | | 3.3 | | 11/17/2014 | | | |
3.4 | | Certificate of Amendment to the Company’s Certificate of Incorporation. | | 8-K | | 3.1 | | 1/9/2015 | | | |
3.5 | | Certificate of Amendment to the Company’s Certificate of Incorporation. | | 8-K | | 3.1 | | 3/3/2017 | | | |
3.6 | | Third Amended and Restated Bylaws | | 8-K | | 3.1 | | 5/19/2023 | | | |
4.1 | | Form of Common Stock Certificate. | | Form 10 | | 4.1 | | 1/29/2007 | | | |
4.2 | | Description of Registrant’s Securities. | | 10-K | | 4.2 | | 11/19/2020 | | | |
4.3 | | Indenture, dated as of February 21, 2017, by and among AECOM, the Guarantors party thereto and U.S. Bank, National Association, as trustee. | | 8-K | | 4.1 | | 2/21/2017 | | | |
4.4 | | First Supplemental Indenture, dated as of March 13, 2018, by and among AECOM, the guarantors party thereto and U.S. Bank National Association. | | 8-K | | 10.3 | | 3/14/2018 | | | |
4.5 | | Second Supplemental Indenture, dated as of April 23, 2020, by and among AECOM, the guarantors party thereto and U.S. Bank National Association. | | 10-Q | | 10.2 | | 5/6/2020 | | | |
4.6 | | Credit Agreement, dated as of October 17, 2014, among AECOM Technology Corporation and certain of its subsidiaries, as borrowers, certain lenders, Bank of America, N.A., as Administrative Agent, Swing Line Lender and L/C Issuer, MUFG Union Bank, N.A., BNP Paribas, JPMorgan Chase Bank, N.A., and the Bank of Nova Scotia, as Co-Syndication Agents, and BBVA Compass, Credit Agricole Corporate and Investment Bank, HSBC Bank USA, National Association, Sumitomo Mitsui Banking Corporation and Wells Fargo Bank, National Association, as Co-Documentation Agents. | | 8-K | | 10.1 | | 10/17/2014 | | | |
Table of Contents
| | | | | | Incorporated by | | | |
|---|
| | | | | | Reference (Exchange Act | | | |
|---|
| | | | | | Filings Located at File | | | |
|---|
Exhibit | | | | | | No. 0-52423) | | Filed | |
|---|
Number | | Exhibit Description | | Form | | Exhibit | | Filing Date | | Herewith | |
|---|
| | | | | | | | | | | |
|---|
4.7 | | Amendment No. 1 to the Credit Agreement, dated as of July 1, 2015, by and among AECOM and certain of its subsidiaries, as borrowers, certain lenders, Bank of America, N.A., as Administrative Agent, Swing Line Lender and L/C Issuer. | | 8-K | | 10.1 | | 7/7/2015 | | | |
4.8 | | Amendment No. 2 to Credit Agreement, dated as of December 22, 2015, among the Company, the Lenders party thereto, and Bank of America, N.A., as Administrative Agent, Swing Line Lender, and an L/C Issuer. | | 8-K | | 10.1 | | 12/22/2015 | | | |
4.9 | | Amendment No. 3 to Credit Agreement and Amendment No. 1 to the Security Agreement, dated as of September 29, 2016, among the Company, the Lenders party thereto, and Bank of America, N.A., as Administrative Agent, Swing Line Lender, and an L/C Issuer. | | 8-K | | 10.1 | | 9/30/2016 | | | |
4.10 | | Amendment No. 4 to Credit Agreement dated as of March 31, 2017, among the Company, the Lenders party thereto, and Bank of America, N.A., as Administrative Agent, Swing Line Lender, and an L/C Issuer. | | 8-K | | 10.1 | | 4/6/2017 | | | |
4.11 | | Amendment No. 5 to Credit Agreement dated as of March 13, 2018, among AECOM, the Lenders party thereto, and Bank of America, N.A., as Administrative Agent, Swing Line Lender, and an L/C Issuer. | | 8-K | | 10.1 | | 3/14/2018 | | | |
4.12 | | Amendment No. 6 to Credit Agreement, dated as of November 12, 2018, among AECOM, the Lenders party thereto, and Bank of America, N.A., as Administrative Agent, Swing Line Lender, and an L.C. Issuer. | | 10-K | | 4.21 | | 11/13/2018 | | | |
4.13 | | Amendment No. 7 to Credit Agreement, dated as of January 28, 2020, by and among AECOM, each borrower and guarantor party thereto, the lenders party thereto, and Bank of America, N.A, as administrative agent. | | 8-K | | 10.1 | | 2/3/2020 | | | |
4.14 | | Amendment No. 8 to the Credit Agreement, dated as of May 1, 2020, by and among AECOM, each borrower and guarantor party thereto, the lenders party thereto, and Bank of America, N.A., as of administrative agent. | | 10-Q | | 10.3 | | 5/6/2020 | | | |
4.15 | | 2021 Refinancing Amendment to Credit Agreement, dated as of February 8, 2021, by and among AECOM, each borrower and guarantor party thereto, the lenders party thereto, and Bank of America, N.A., as administrative Agent. | | 10-Q | | 10.2 | | 2/10/2021 | | | |
4.16 | | Amendment No. 10 to Credit Agreement, dated as of April 13, 2021, by and among AECOM, each borrower and guarantor party thereto, the lenders party thereto, and Bank of America, N.A., as administrative Agent. | | 8-K | | 10.1 | | 4/13/2021 | | | |
| | | | | | | | | | | |
| |
| |
| | Incorporated by
Reference (Exchange Act
Filings Located at File
No. 0-52423) | |
|
|---|
Exhibit
Number | |
| |
| | Filed
Herewith |
|---|
| | Exhibit Description | | Form | | Exhibit | | Filing Date |
|---|
| | 4.2 | | Indenture, dated as of October 6, 2014, by and among AECOM Technology Corporation, the Guarantors party thereto, and U.S. Bank National Association, as trustee. | | 8-K | | 4.1 | | 10/8/2014 | | |
|
4.3 |
|
First Supplemental Indenture, dated as of October 17, 2014, by and among AECOM Technology Corporation, the guarantors party thereto and U.S. Bank National Association. |
|
10-K |
|
4.10 |
|
11/17/2014 |
|
|
|
4.4 |
|
Second Supplemental Indenture, dated as of June 3, 2015, by and among AECOM, the guarantors party thereto and U.S. Bank National Association. |
|
S-4 |
|
4.3 |
|
7/6/2015 |
|
|
|
4.5 |
|
Third Supplemental Indenture, dated as of June 19, 2015, by and among AECOM, the guarantor party thereto and U.S. Bank National Association. |
|
S-4 |
|
4.4 |
|
7/6/2015 |
|
|
|
4.6 |
† |
Indenture, dated March 15, 2012, between URS Corporation, URS Fox U.S. LP and U.S. Bank National Association. |
|
8-K |
|
4.01 |
|
3/20/2012 |
|
|
|
4.7 |
† |
First Supplemental Indenture, dated March 15, 2012, by and among URS Corporation, URS Fox U.S. LP, the additional guarantor parties thereto and U.S. Bank National Association. |
|
8-K |
|
4.02 |
|
3/20/2012 |
|
|
|
4.8 |
† |
Second Supplemental Indenture, dated March 15, 2012, by and among URS Corporation, URS Fox U.S. LP, the additional guarantor parties thereto and U.S. Bank National Association. |
|
8-K |
|
4.03 |
|
3/20/2012 |
|
|
|
4.9 |
† |
Third Supplemental Indenture, dated as of May 14, 2012, by and among URS Corporation, URS Fox U.S. LP, the additional guarantor parties thereto and U.S. Bank National Association. |
|
8-K |
|
4.6 |
|
5/18/2012 |
|
|
|
4.10 |
† |
Fourth Supplemental Indenture, dated as of September 24, 2012, by and among URS Corporation, URS Fox U.S. LP, the additional guarantor parties thereto and U.S. Bank National Association. |
|
8-K |
|
4.2 |
|
9/26/2012 |
|
|
|
4.11 |
|
Fifth Supplemental Indenture, dated as of October 17, 2014, by and among AECOM Global II, LLC, URS Fox U.S. LP and U.S. Bank National Association. |
|
10-K |
|
4.8 |
|
11/17/2014 |
|
|
Table of Contents
| | | | | | Incorporated by | | | |
|---|
| | | | | | Reference (Exchange Act | | | |
|---|
| | | | | | Filings Located at File | | | |
|---|
Exhibit | | | | | | No. 0-52423) | | Filed | |
|---|
Number | | Exhibit Description | | Form | | Exhibit | | Filing Date | | Herewith | |
|---|
| | | | | | | | | | | |
|---|
4.17 | | Amendment No. 11 to Credit Agreement, dated as of June 25, 2021, by and among AECOM, each borrower and guarantor party thereto, the lenders party thereto, and Bank of America, N.A., as administrative Agent. | | 8-K | | 10.1 | | 6/25/2021 | | | |
4.18 | | Amendment No. 12 to the Credit Agreement, dated as of May 23, 2023, by and among AECOM and Bank of America, N.A., as Administrative Agent | | 10-Q | | 10.1 | | 8/9/2023 | | | |
4.19 | | Amendment No. 13 to Credit Agreement, dated as of May 23, 2023, by and among AECOM and the lenders party thereto, and Bank of America, N.A., as Administrative Agent | | 10-Q | | 10.2 | | 8/9/2023 | | | |
10.1# | | AECOM Technology Corporation Change in Control Severance Policy for Key Executives. | | 10-Q | | 10.1 | | 2/7/2018 | | | |
10.3# | | Amended and Restated 2006 Stock Incentive Plan. | | Schedule 14A | | Annex B | | 1/21/2011 | | | |
10.4# | | Form of Stock Option Standard Terms and Conditions under 2006 Stock Incentive Plan. | | 8-K | | 10.1 | | 12/5/2008 | | | |
10.5# | | Form of Restricted Stock Unit Standard Terms and Conditions under 2006 Stock Incentive Plan. | | 8-K | | 10.2 | | 12/21/2012 | | | |
10.6# | | Standard Terms and Conditions for Performance Earnings Program under AECOM Technology Corporation 2006 Stock Incentive Plan. | | 8-K | | 10.3 | | 12/5/2008 | | | |
10.7# | | AECOM Amended & Restated 2016 Stock Incentive Plan. | | Schedule 14A | | Annex B | | 1/19/2017 | | | |
10.8# | | Form Standard Terms and Conditions for Restricted Stock Units for Non-Employee Directors under the 2016 Stock Incentive. | | 10-Q | | 10.3 | | 5/11/2016 | | | |
10.9# | | Form Standard Terms and Conditions for Restricted Stock Units under the 2016 Stock Incentive Plan. | | 10-Q | | 10.4 | | 5/11/2016 | | | |
10.10# | | Form Standard Terms and Conditions for Performance Earnings Program under the 2016 Stock Incentive Plan. | | 10-Q | | 10.5 | | 5/11/2016 | | | |
10.11# | | Form Standard Terms and Conditions for Non-Qualified Stock Options under the 2016 Stock Incentive Plan. | | 10-Q | | 10.6 | | 5/11/2016 | | | |
10.12# | | Standard Terms and Conditions for Performance Earnings Program and Performance Criteria. | | 8-K | | 10.1 | | 12/15/2016 | | | |
10.13# | | AECOM Technology Corporation Executive Deferred Compensation Plan. | | 8-K | | 10.1 | | 12/21/2012 | | | |
10.14# | | First Amendment to the AECOM Executive Deferred Compensation Plan. | | 10-Q | | 10.3 | | 2/10/2016 | | | |
10.15# | | AECOM Technology Corporation Executive Incentive Plan. | | Schedule 14A | | Annex A | | 1/22/2010 | | | |
10.16# | | Form of Special LTI Award Stock Option Terms and Conditions under the 2006 Stock Incentive Plan. | | 8-K | | 10.2 | | 3/12/2014 | | | |
10.17# | | AECOM Retirement & Savings Plan (amended and restated effective July 1, 2016). | | 10-Q | | 10.1 | | 8/10/2016 | | | |
10.18# | | AECOM Amended and Restated Employee Stock Purchase Plan. | | DEF 14A | | Annex A | | 1/23/2019 | | | |
| | | | | | | | | | | |
| |
| |
| | Incorporated by
Reference (Exchange Act
Filings Located at File
No. 0-52423) | |
|
|---|
Exhibit
Number | |
| |
| | Filed
Herewith |
|---|
| | Exhibit Description | | Form | | Exhibit | | Filing Date |
|---|
| | 4.12 | | Indenture, dated as of February 21, 2017, by and among AECOM, the Guarantors party thereto and U.S. Bank, National Association, as trustee. | | 8-K | | 4.1 | | 2/21/2017 | | |
|
4.13 |
|
Credit Agreement, dated as of October 17, 2014, among AECOM Technology Corporation and certain of its subsidiaries, as borrowers, certain lenders, Bank of America, N.A., as Administrative Agent, Swing Line Lender and L/C Issuer, MUFG Union Bank, N.A., BNP Paribas, JPMorgan Chase Bank, N.A., and the Bank of Nova Scotia, as Co-Syndication Agents, and BBVA Compass, Credit Agricole Corporate and Investment Bank, HSBC Bank USA, National Association, Sumitomo Mitsui Banking Corporation and Wells Fargo Bank, National Association, as Co-Documentation Agents. |
|
8-K |
|
10.1 |
|
10/17/2014 |
|
|
|
4.14 |
|
Amendment No. 1 to the Credit Agreement, dated as of July 1, 2015, by and among AECOM and certain of its subsidiaries, as borrowers, certain lenders, Bank of America, N.A., as Administrative Agent, Swing Line Lender and L/C Issuer. |
|
8-K |
|
10.1 |
|
7/7/2015 |
|
|
|
4.15 |
|
Amendment No. 2 to Credit Agreement, dated as of December 22, 2015, among the Company, the Lenders party thereto, and Bank of America, N.A., as Administrative Agent, Swing Line Lender, and an L/C Issuer. |
|
8-K |
|
10.1 |
|
12/22/2015 |
|
|
|
4.16 |
|
Amendment No. 3 to Credit Agreement and Amendment No. 1 to the Security Agreement, dated as of September 29, 2016, among the Company, the Lenders party thereto, and Bank of America, N.A., as Administrative Agent, Swing Line Lender, and an L/C Issuer. |
|
8-K |
|
10.1 |
|
9/30/16 |
|
|
|
4.17 |
|
Amendment No. 4 to Credit Agreement dated as of March 31, 2017, among the Company, the Lenders party thereto, and Bank of America, N.A., as Administrative Agent, Swing Line Lender, and an L/C Issuer. |
|
8-K |
|
10.1 |
|
4/6/2017 |
|
|
|
10.1 |
# |
1992 Supplemental Executive Retirement Plan, restated as of November 20, 1997. |
|
Form 10 |
|
10.12 |
|
1/29/2007 |
|
|
Table of Contents
| | | | | | | | | | | |
| |
| |
| | Incorporated by
Reference (Exchange Act
Filings Located at File
No. 0-52423) | |
|
|---|
Exhibit
Number | |
| |
| | Filed
Herewith |
|---|
| | Exhibit Description | | Form | | Exhibit | | Filing Date |
|---|
| | 10.2 | # | First Amendment, effective July 1, 1998, to the 1992 Supplemental Executive Retirement Plan. | | Form 10 | | 10.13 | | 1/29/2007 | | |
|
10.3 |
# |
Second Amendment, effective March 1, 2003, to the 1992 Supplemental Executive Retirement Plan. |
|
Form 10 |
|
10.14 |
|
1/29/2007 |
|
|
|
10.4 |
# |
Third Amendment, effective April 1, 2004, to the 1992 Supplemental Executive Retirement Plan. |
|
Form 10 |
|
10.15 |
|
1/29/2007 |
|
|
|
10.5 |
# |
1996 Supplemental Executive Retirement Plan, restated as of November 20, 1997. |
|
Form 10 |
|
10.16 |
|
1/29/2007 |
|
|
|
10.6 |
# |
First Amendment, effective July 1, 1998, to the 1996 Supplemental Executive Retirement Plan. |
|
Form 10 |
|
10.17 |
|
1/29/2007 |
|
|
|
10.7 |
# |
Second Amendment, effective April 1, 2004, to the 1996 Supplemental Executive Retirement Plan. |
|
Form 10 |
|
10.18 |
|
1/29/2007 |
|
|
|
10.8 |
# |
1998 Management Supplemental Executive Retirement Plan. |
|
Form 10 |
|
10.20 |
|
1/29/2007 |
|
|
|
10.9 |
# |
First Amendment, effective January 1, 2002, to the 1998 Management Supplemental Executive Retirement Plan. |
|
Form 10 |
|
10.21 |
|
1/29/2007 |
|
|
|
10.10 |
# |
Second Amendment, effective July 1, 1998, to the 1998 Management Supplemental Executive Retirement Plan. |
|
Form 10 |
|
10.22 |
|
1/29/2007 |
|
|
|
10.11 |
# |
Third Amendment, effective October 31, 2004, to the 1998 Management Supplemental Executive Retirement Plan. |
|
Form 10 |
|
10.23 |
|
1/29/2007 |
|
|
|
10.12 |
# |
AECOM Management Supplemental Executive Retirement Plan, as amended and restated effective January 1, 2005. |
|
10-K |
|
10.12 |
|
11/16/2016 |
|
|
|
10.13 |
# |
First Amendment, effective October 9, 2009, to the AECOM Management Supplemental Executive Retirement Plan, as amended and restated effective January 1, 2005. |
|
10-K |
|
10.13 |
|
11/16/2016 |
|
|
|
10.14 |
# |
Second Amendment, effective December 30, 2015, to the AECOM Management Supplemental Executive Retirement Plan. |
|
10-Q |
|
10.2 |
|
2/10/2016 |
|
|
|
10.15 |
# |
1996 Excess Benefit Plan restated at November 20, 1997. |
|
Form 10 |
|
10.24 |
|
1/29/2007 |
|
|
|
10.16 |
# |
First Amendment, effective July 1, 1998, to the 1996 Excess Benefit Plan. |
|
Form 10 |
|
10.25 |
|
1/29/2007 |
|
|
Table of Contents
| | | | | | | | | | | |
| |
| |
| | Incorporated by
Reference (Exchange Act
Filings Located at File
No. 0-52423) | |
|
|---|
Exhibit
Number | |
| |
| | Filed
Herewith |
|---|
| | Exhibit Description | | Form | | Exhibit | | Filing Date |
|---|
| | 10.17 | # | Second Amendment, effective March 1, 2003, to the 1996 Excess Benefit Plan. | | Form 10 | | 10.26 | | 1/29/2007 | | |
|
10.18 |
# |
Third Amendment, effective April 1, 2004, to the 1996 Excess Benefit Plan. |
|
Form 10 |
|
10.27 |
|
1/29/2007 |
|
|
|
10.19 |
# |
AECOM Technology Corporation Excess Benefit Plan, as amended and restated effective January 1, 2005. |
|
10-K |
|
10.19 |
|
11/16/16 |
|
|
|
10.20 |
# |
First Amendment, effective October 9, 2009, to the AECOM Technology Corporation Excess Benefit Plan. |
|
10-K |
|
10.20 |
|
11/16/16 |
|
|
|
10.21 |
# |
AECOM Technology Corporation Change in Control Severance Policy for Key Executives—Schedule A. |
|
10-Q |
|
10.1 |
|
2/8/2017 |
|
|
|
10.22 |
# |
Employment Agreement, dated as of July 14, 2010, by and among AECOM Technology Corporation, Tishman Construction Corporation and Daniel R. Tishman. |
|
8-K |
|
2.2 |
|
7/14/2010 |
|
|
|
10.23 |
# |
Employment Agreement between AECOM Technology Corporation and Randall A. Wotring, dated as of January 1, 2015. |
|
10-Q |
|
10.2 |
|
2/11/2015 |
|
|
|
10.24 |
# |
Employment Agreement between AECOM Technology Corporation and George L. Nash, Jr., effective as of January 1, 2015. |
|
10-Q |
|
10.1 |
|
2/11/2015 |
|
|
|
10.25 |
# |
AECOM Technology Corporation Employee Stock Purchase Plan. |
|
S-8 |
|
4.3 |
|
5/24/2010 |
|
|
|
10.26 |
# |
Amended and Restated AECOM Technology Corporation Employee Stock Purchase Plan. |
|
10-Q |
|
10.1 |
|
5/11/16 |
|
|
|
10.27 |
# |
Amended and Restated 2006 Stock Incentive Plan. |
|
Schedule 14A |
|
Annex B |
|
1/21/2011 |
|
|
|
10.28 |
# |
Form of Stock Option Standard Terms and Conditions under 2006 Stock Incentive Plan. |
|
8-K |
|
10.1 |
|
12/5/2008 |
|
|
|
10.29 |
# |
Form of Restricted Stock Unit Standard Terms and Conditions under 2006 Stock Incentive Plan. |
|
8-K |
|
10.2 |
|
12/21/2012 |
|
|
|
10.30 |
# |
Standard Terms and Conditions for Performance Earnings Program under AECOM Technology Corporation 2006 Stock Incentive Plan. |
|
8-K |
|
10.3 |
|
12/5/2008 |
|
|
|
10.31 |
# |
AECOM Amended & Restated 2016 Stock Incentive Plan. |
|
Schedule 14A |
|
Annex B |
|
1/19/2017 |
|
|
Table of Contents
Table of Contents
| | | | | | | | | | | |
|
|
|
|
| | Incorporated by
|
| | |
|---|
| | | | | | Reference (Exchange Act
| | | |
|---|
| | | | | | Filings Located at File
| | | |
|---|
Exhibit | | | | | | No. 0-52423) | |
Filed | |
|---|
Number | | Exhibit
Number Description | |
Form | |
Exhibit |
| Filed
Filing Date
| | Herewith | |
|---|
| Exhibit Description | | Form | | Exhibit | | Filing Date | | | | |
|---|
10.19# | 31.1 | Form Standard Terms and Conditions for Performance Earnings Program under the 2016 Stock Incentive Plan (Fiscal Year 2019). | | 10-Q | | 10.1 | | 2/6/2019 | | | |
10.20# | | Form Standard Terms and Conditions for Performance Earnings Program under the 2016 Stock Incentive Plan (Fiscal Year 2020). | | 10-Q | | 10.1 | | 2/5/2020 | | | |
10.23# | | AECOM 2020 Stock Incentive Plan. | | DEF 14A | | Annex A | | 1/23/2020 | | | |
10.24# | | Letter Agreement between AECOM and W. Troy Rudd dated June 13, 2020. | | 10-Q | | 10.1 | | 8/5/2020 | | | |
10.25# | | Letter Agreement between AECOM and Lara Poloni dated June 13, 2020. | | 10-Q | | 10.2 | | 8/5/2020 | | | |
10.26# | | Senior Leadership Severance Plan. | | 10-Q | | 10.3 | | 8/5/2020 | | | |
10.27# | | Form Standard Terms and Conditions for Performance Earnings Program under the 2020 Stock Incentive Plan (Fiscal Year 2021) | | 10-Q | | 10.1 | | 2/10/21 | | | |
10.28# | | Form Standard Terms and Conditions for Performance Earnings Program under the 2020 Stock Incentive Plan (Fiscal Year 2023) | | 10-Q | | 10.1 | | 2/7/2023 | | | |
10.29# | | Form Standard Terms and Conditions for Restricted Stock Units under the 2020 Stock Incentive Plan (Fiscal 2023) | | 10-Q | | 10.2 | | 2/7/2023 | | | |
10.30# | | Employment Agreement, dated March 1, 2023, by and between AECOM and Lara Poloni | | 10-Q | | 10.1 | | 5/9/2023 | | | |
21.1 | | Subsidiaries of AECOM. | | | | | | | | X | |
23.1 | | Consent of Independent Registered Public Accounting Firm. | | | | | | | | X | |
31.1 | | Certification of the Company'sCompany’s Chief Executive Officer pursuant to Section 302 of the Sarbanes-Oxley Act of 2002. | | | | | | | | X | |
31.2 |
31.2 |
|
Certification of the Company'sCompany’s Chief Financial Officer pursuant to Section 302 of the Sarbanes-Oxley Act of 2002. |
|
|
|
|
|
|
|
X | |
32* |
32 |
* |
Certification of the Company'sCompany’s Chief Executive Officer and Chief Financial Officer pursuant to Section 906 of the Sarbanes-Oxley Act of 2002. |
|
|
|
|
|
|
|
X | |
101 |
95 |
The following financial statements from the Company’s Annual Report on Form 10-K for the year ended September 30, 2023 were formatted in iXBRL (Inline eXtensible Business Reporting Language): (i) Consolidated Balance Sheets, (ii) Consolidated Statements of Operations, (iii) Consolidated Statements of Comprehensive Income (Loss), (iv) Consolidated Statements of Stockholders’ Equity, (v) Condensed Consolidated Statements of Cash Flows, and (vi) the Notes to Condensed Consolidated Financial Statements, tagged as blocks of text and including detailed tags. |
Mine Safety Disclosure. |
|
|
|
|
|
|
X |
X |
104 |
101.INS |
The cover page from the Company’s Annual Report on Form 10-K for the year ended September 30, 2023, formatted in Inline XBRL. |
XBRL Instance Document |
|
|
|
|
|
|
X |
X |
# |
101.SCH |
|
XBRL Taxonomy Extension Schema |
|
|
|
|
|
|
|
X |
|
101.CAL |
|
XBRL Taxonomy Extension Calculation Linkbase |
|
|
|
|
|
|
|
X |
|
101.LAB |
|
XBRL Taxonomy Extension Labels Linkbase |
|
|
|
|
|
|
|
X |
|
101.PRE |
|
XBRL Taxonomy Extension Presentation Linkbase |
|
|
|
|
|
|
|
X |
|
101.DEF |
|
XBRL Taxonomy Extension Definition Linkbase |
|
|
|
|
|
|
|
XManagement contract or compensatory plan or arrangement. |
#Management contract or compensatory plan or arrangement.
*Document has been furnished and not filed.
†Indicates a material agreement previously filed by URS Corporation, a public company acquired by AECOM on October 17, 2014.
* | Document has been furnished and not filed. |
ITEM 16. FORM 10-K SUMMARY
None.
SIGNATURE
SIGNATURE
Pursuant to the requirements of Section 13 or 15(d) of the Securities Exchange Act of 1934, the Registrant has duly caused this report to be signed on its behalf by the undersigned, thereunto duly authorized.
| AECOM |
| |
| By: | /s/ GAURAV KAPOOR |
| | | | Gaurav Kapoor |
| | AECOM |
|
|
By: |
|
/s/ W. TROY RUDD
W. Troy Rudd
Executive Vice President and Chief Financial Officer
|
| (Principal Financial Officer) |
|
Date: |
Date: |
|
November 14, 2017 2023 |
Pursuant to the requirements of the Securities Exchange Act of 1934, this report has been signed below by the following persons on behalf of the Registrant in the capacities and on the date indicated.
| | | | | | | | | Signature
| | Title
| | Date
|
|---|
|
|
|
|
| /s/ MICHAEL S. BURKE
Michael S. BurkeSignature |
| Chairman and Chief Executive Officer (Principal Executive Officer)Title |
| November 14, 2017Date | | | | | | /s/ W. TROY RUDD
W. Troy Rudd | | Chief Executive Vice President and Chief Financial Officer (Principal Financial
(Principal Executive Officer) | | November 14, 20172023 | | | | | | /s/ GAURAV KAPOOR
Gaurav Kapoor | | Senior Vice President, Global Controller (PrincipalChief Financial Officer
(Principal Financial Officer,
Principal Accounting Officer)
| | November 14, 20172023 | /s/ JAMES H. FORDYCE
James H. Fordyce | | Director
| | November 14, 2017
| /s/ SENATOR WILLIAM H. FRIST, M.D.
Senator William H. Frist, M.D.BRADLEY W. BUSSBradley W. Buss | | Director | | November 14, 20172023 | /s/ LINDA GRIEGO
Linda Griego | | Director
| | November 14, 2017
|
Table of Contents
| | | | | Signature
| | Title
| | Date
|
|---|
|
|
|
|
| /s/ DAVID W. JOOS
David W. Joos | | Director
| | November 14, 2017
| /s/ ROBERT J. ROUTS
Robert J. RoutsLYDIA H. KENNARDLydia H. Kennard | | Director | | November 14, 20172023 | /s/ CLARENCE T. SCHMITZ
Clarence T. Schmitz | | Director
| | November 14, 2017
| /s/ KRISTY PIPES Kristy Pipes | | Director | | November 14, 2023 | | | | | | /s/ DOUGLAS W. STOTLAR
Douglas W. Stotlar | | Director (Chairman) | | November 14, 20172023 | Douglas W. Stotlar | | | | | | | | | | /s/ DANIEL R. TISHMAN
Daniel R. Tishman | | Director AECOM Vice Chairman | | November 14, 20172023 | | | | | | /s/ SANDER VAN’T NOORDENDE | | Director | | November 14, 2023 | Sander van’t Noordende | | | | | | | | | | /s/ GEN. JANET C. WOLFENBARGER, USAF RET.
Gen. Janet C. Wolfenbarger, USAF Ret. | | Director | | November 14, 20172023 |
|