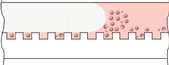
| | | | Sample Preparation of ELISA Sandwich
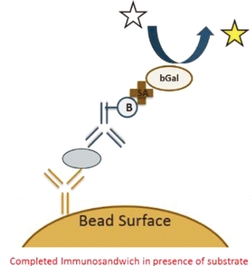 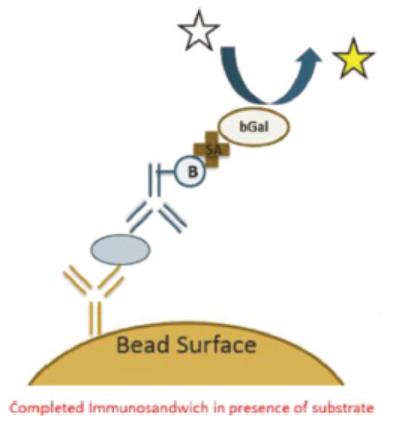
| | Simoa bead-based technology uses beads coated with capture antibodies that bind specifically to the protein being measured. After an enzyme-linked detection antibody binds to the protein, the enzyme substrate is added (as depicted by the white star in the graphic on the left). The enzyme associated with the enzyme-linked detection antibody then reacts with the enzyme substrate causing the enzyme substrate to become fluorescent (as depicted by the change in color of the star in the graphic). |
Table of Contents
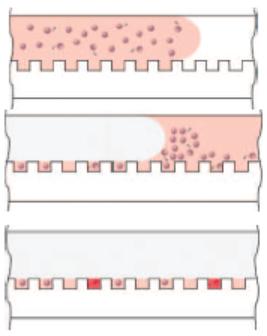
| | | Injection of Bead/Substrate Solution into Simoa Disk
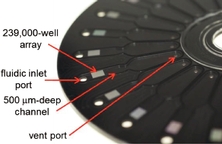 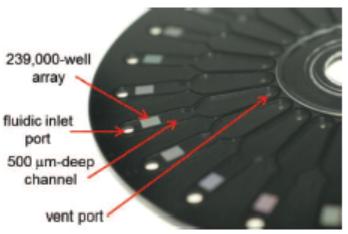
| | This mixture of beads and enzyme substrate is then injected into our proprietary Simoa disk, which contains 24 arrays of microwells arranged radially. Each 3 × 4 millimeter array contains approximately 239,000 microwells, each of which is large enough to accommodate only a single bead. |
Bead/Substrate Solution Settles and Wells are Sealed
|
|
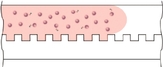
The bead/substrate solution is drawn across the array and the beads settle by gravity onto the surface of the array, and a fraction of them fall into the microwells. The remainder lie on the surface, and oil is introduced into the channel to displace the substrate solution and excess beads, and to seal the wells. |
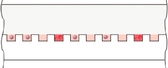
Simoa Readout
|
|
The entire array is then imaged using ultrasensitive digital imaging, and the sealed wells that contain beads associated with captured and enzyme labeled protein molecules are identified. |
Our Simoa bead-based technology offers unprecedented protein detection sensitivity and enables detection of low abundance and previously undetectable biomarkers. The following chart shows examples of the levels of detection, or LoD, of certain Simoa bead-based assays and commercially available ELISA assays comparedThis sensitivity allows researchers to the median lower normal plasma or clinical ranges of variousmeasure critical protein biomarkers. As shown below, the LoD for most of the assays from a leading manufacturer of commercial ELISA assays is above the median lower normal plasma or clinical ranges, making these biomarkers undetectable at normal physiological levels with these assays.
Table of Contents
LoD Comparison
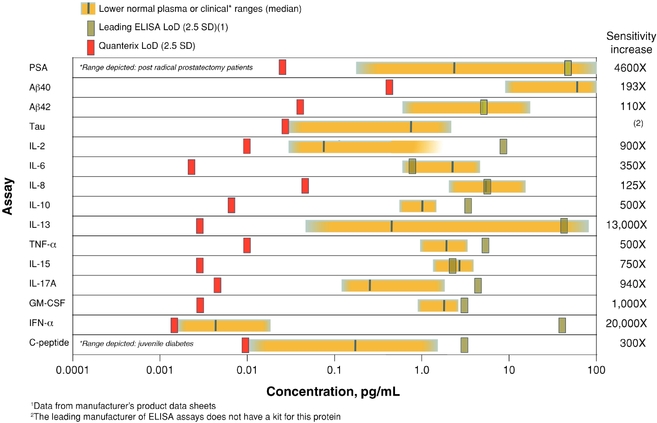
Each of the incrementsearlier stages in the horizontal axisprogression of a disease or injury, which we believe will enable the development of novel therapies and diagnostics and facilitate a paradigm shift in healthcare from an emphasis on treatment to a focus on earlier detection, monitoring, prognosis and, ultimately, prevention. We have published an approach to increase the table above represents a 10-fold increase in sensitivity. Using the protein IL-2 as an example from the graphic above, the LoD for the leading commercially available IL-2 assay is approximately 9 pg/mL, whereas the LoD forsensitivity of our Simoa assay is approximately 0.01 pg/mL, representing a 900-fold increase in sensitivity.technology 100-fold.
The ability to multiplex, or simultaneously measure multiple proteins (or other biomarkers) in a single assay, can be important to researchers to maximize the biological information from a sample, and to develop more specific diagnostic tests. However, one of the main issues with multiplexing can be the loss of sensitivity. Our Simoa platforms maintain single plex precision, while competitive platforms lose sensitivity when multiplexing is used. Multiplexing is achieved with our Simoa bead-based technology by using beads labeled with different fluorescent dyes specific to the biomarker being analyzed. After the assay is run, the array of microwells is imaged across the wavelengths of the different labeled beads. The results are measured for each protein captured by each of the different beads. While we have demonstrated the ability to identify and differentiate up to 35 different bead subpopulations on the HD-1,HD-X, which is a prerequisite to our ability to develop assays with the capacity to detect an equivalent number of proteins in a single sample, we believe that the ability to multiplex above a 6-plex and maintain single-plex sensitivity and precision may be limited using bead-based technology due to constraints in the number of bead-containing wells for each plex that are imaged on the Simoa disk. In 2017, we commercially launched a Simoa neurology 4-plex assay (Nf-L, Tau,tau, GFAP and UCH-L1) bead-based assay for the study of neurodegenerative conditions and traumatic brain injury and other neurodegenerative conditions. Simoa is the only technology with the sensitivity to detect all four of these markers in blood, whereasinjury. Whereas other assay technologies require cerebrospinal fluid, or CSF to detect all four of these markers, or are limited to only single-plex measurement in serum and plasma, due to Simoa’s sensitivity, limitations.this is the only assay that can detect all of these biomarkers directly from serum and plasma samples in a multiplex assay format. This is a significant advantage in terms of ease of use, patient comfort, speed and cost-effectiveness. We plan to introduceIn the first quarter of 2020, we launched a new Simoa 6-plex human cytokine panel using Simoa bead-based assay for the HD-X and SR-X instrument platforms. This assay is the only commercially available product supporting quantitative multiplex measurement of six key immunomodulatory cytokines (IFNg, IL-6, IL-10, IL-12p70, IL-17A and TNFa) at baseline levels in the middle of 2019.
Table of Contentsboth normal healthy individuals and patient cohorts in therapeutic areas spanning cancer, autoimmune disease, neurodegeneration and infectious disease.
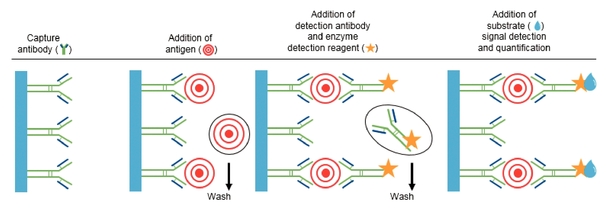
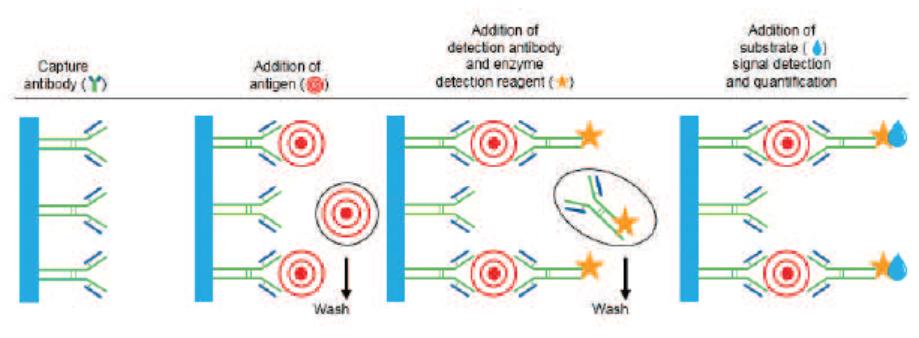
Simoa Planar Array Technology Simoa planar array immunoassays utilize the basic principles of conventional microplate-based sandwich ELISA and require two antibodies: one for capture, which is applied to the beads, and one for detection. Unlike ELISA, which runs the enzyme-substrate reaction on all molecules coating the entire bottom surface in one well, Simoa planar array reactions are run on spatially segregated micro-spots within the bottom of microtiter plate wells that concentrate the signal to a surface area 1,000 times smaller than a traditional ELISA. The small spot size and spatial segregation of each spot enables multiplexing up to 12 different assays within a single sample well. Our Simoa planar array platform is highly flexible, designed to enable practical high-sensitivity multiplex protein analysis for drug discovery and development applications as well as translational biomarker research. The following chart describes the steps through which our Simoa planar array technology detects proteins:
Simoa Planar Array Analytic Process
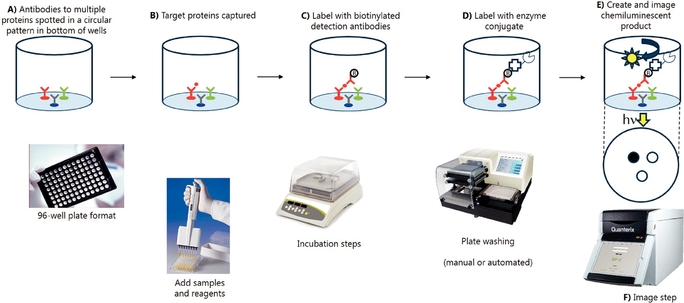 
A)Analyte-specifc| A) | Analyte-specific capture antibodies are printed in microspots (100 microns) in a circular pattern in the bottom of a 96-well microtiter plate. Each microspot contains capture antibodies that are specific for different analytes. Up to 12 spatially resolved microspots can be printed in each well. |
| B) | Samples are added to the plate and incubated with a benchtop plate shaker to bind the target analyte molecules to the microspots. Unbound molecules are removed by washing the plate with a benchtop plate washer or manual wash manifold. |
| C) | A mixture of biotinylated detection antibodies are added to the plate to form the antibody sandwich. Excess detection antibodies are removed by washing. |
12 spatially resolved microspots can be printed in each well.
B)Samples are added to the plate and incubated with a benchtop plate shaker to bind the target analyte molecules to the microspots. Unbound molecules are removed by washing the plate with a benchtop plate washer or manual wash manifold.
C)A mixture of biotinylated detection antibodies are added to the plate to form the antibody sandwich. Excess detection antibodies are removed by washing.
D)Streptavidin-HRP (horseradish peroxidase enzyme) conjugated is added to the plate to bind to the biotin groups forming the complete immunocomplex followed by a washing step.
E)A high-sensitivity chemiluminescent substate reagent is added to each well. The enzyme associated with the enzyme linked detection antibody then reacts with the enzyme substrate causing the enzyme substrate to emit light.
F)The plate is placed into the Quanterix SP-X imaging system. A scientific-grade CCD camera images the entire plate and all micro-spots simultaneously. The low background of the plate
| D) | Streptavidin-HRP (horseradish peroxidase enzyme) conjugated is added to the plate to bind to the biotin groups forming the complete immunocomplex followed by a washing step. |
| E) | A high-sensitivity chemiluminescent substate reagent is added to each well. The enzyme associated with the enzyme linked detection antibody then reacts with the enzyme substrate causing the enzyme substrate to emit light. |
| F) | The plate is placed into the Quanterix SP-X imaging system. A scientific-grade CCD camera images the entire plate and all micro-spots simultaneously. The low background of the plate surface and the high-sensitivity of the camera enable detection of very low levels of light with a high dynamic range. The SP-X imaging software utilizes algorithms to optimize exposure time and combine multiple images in the image analysis. Protein concentrations are determined by comparing the intensity of microspots to known analytical standards. |
surface and the high-sensitivity of the camera enable detection of very low levels of light with a high dynamic range. The SP-X imaging software utilizes algorithms to optimize exposure time and combine multiple images in the image analysis. Protein concentrations are determined by comparing the intensity of microspots to known analytical standards.
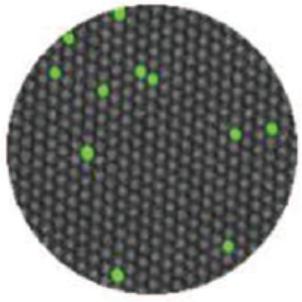
Below is an image of a 96-well Simoa planar array plate containing 12 microspots. Each microspot represents a different analyte measured in each sample well. 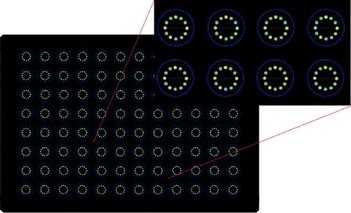 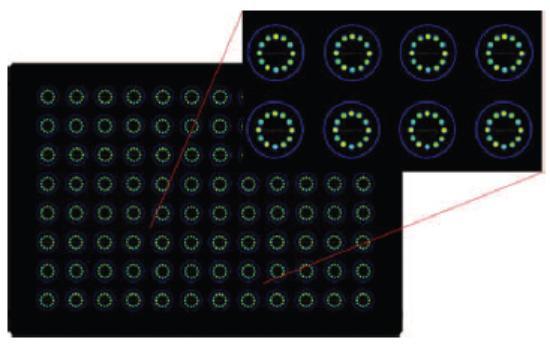
We believe the Simoa planar array technology is well-suited for researchers who value the ability to measure critical immunomodulatory biomarkers in patient serum and plasma with ultra-sensitive detection in a multiplex assay format. The figure below demonstrates 10-plex detection of key cytokines in human serum from normal healthy donors with corresponding assay Limit of Detection (LoD) listed in femtogram per ml. 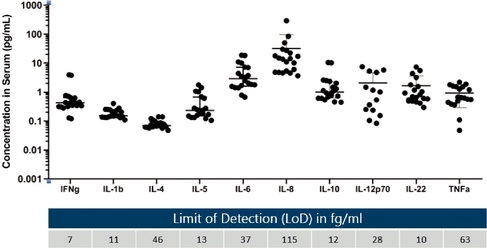 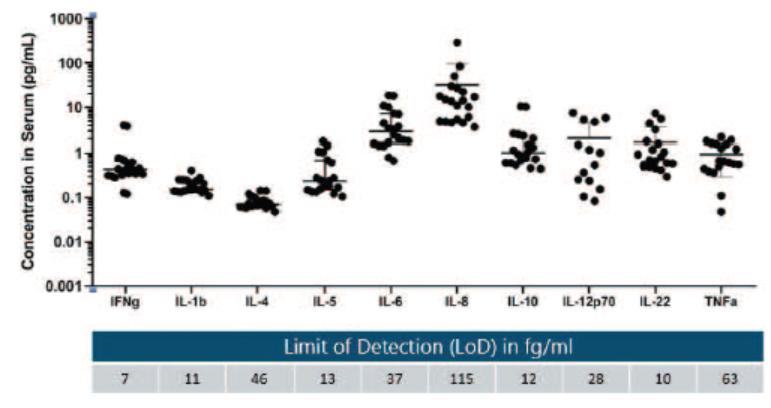
Nucleic Acid Testing Our initial focus has been on the use of Simoa technology to detect protein biomarkers. However, we are also developing our Simoa bead-based technology has also been used to detect nucleic acids in biological samples. While methods for measuring nucleic acid molecules have advanced substantially, currently available techniques still have drawbacks. For example, PCR is a sensitive method that is widely used for measuring gene expression. However, PCR carries the potential for data distortion and bias from the repeated addition of enzymes, and heating and cooling cycles needed to amplify a copy of the nucleic
Table of Contents
acid being measured. In nucleic acid analysis, we believe that Simoa has the potential to provide the same sensitivity as traditional PCR-based assays with the following benefits: •no need for amplification of the targeted nucleic acid, which can result in amplification distortion and bias;
•reduced cross-contamination because of direct detection of single molecules vs. the detection of a large number of copies of the nucleic acid; and
•the ability to detect some samples without requiring purification of the nucleic acid, such as in environmental water.
| ● | no need for amplification of the targeted nucleic acid, which can result in amplification distortion and bias; |
| ● | reduced cross-contamination because of direct detection of single molecules vs. the detection of a large number of copies of the nucleic acid; and |
| ● | the ability to detect some samples without requiring purification of the nucleic acid, such as in environmental water or serum samples. |
For detection of nucleic acids with our Simoa bead-based technology, instead of coating the beads with capture antibodies as is done for detecting proteins, the beads are coated with nucleic acid capture probes. Samples with the target nucleic acid molecules are then added and are captured by the beads. Nucleic acid detection probes (instead of detection antibodies) are then added and attach to the target nucleic acid molecules which are then labeled using an enzyme substrate that is detected and counted using the Simoa disk and instrument. This assay is pictured below:  
Simoa has been used to detect short sequences of RNA, known as microRNA, that are important in a number of biological systems, and are widely used in innovative therapeutic and gene editing technologies. TheFor example, the assay was used to detect microRNA-122 or miR-122,(miR-122), a marker of liver toxicity, from the serum of patients who had overdosed with acetaminophen. As shown in the graph below, these patients had elevated miR-122 levels compared to healthy controls. 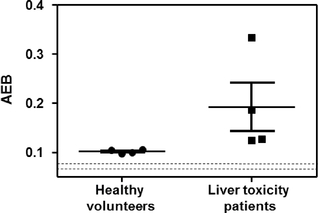 
This approach suggests potential for applications for measuring drug-induced liver injury for both safety testing of drugs in development and for monitoring of approved drugs.
Table of Contents
Our Market Opportunities Our commercial strategy is to pursue the application of our Simoa technology to the life science research, diagnostics and precision health screening markets. Life Science Research Our initial target market is the large and growing life science research market. We believe our Simoa platforms are well-positioned to capture a significant share of this market because of superior sensitivity, automated workflow capabilities, multiplexing and the ability to work with a broader range of sample types. Proteomics, the study of the proteins produced by the body, is important to understanding disease, and researchers study proteins to understand the biological basis for disease and how to improve diagnosis and treatment. The proteins detectable by conventional, analog immunoassay technologies represent a mere fraction of the proteins that can be detected by Simoa technology, and we believe that Simoa can inspire a new level of research into these previously undetectable proteins and their role in disease. By substantially lowering the limit of detection of protein biomarkers, our Simoa platforms hold significant potential to expand research into the diseases associated with the thousands of proteins that were previously undetectable, as well as into earlier detection of the proteins currently detectable by other technologies only after they have reached levels that reflect more advanced disease or injury. Simoa technology provides researchers the ability to see the nuanced continuum of health to disease more efficiently and effectively than any other technology commercially available today, offering the potential for the first time to better understand the onset of disease cascades and catalyzing a new era of medical and life science research, drug discovery and disease prevention. As an indication of the market'smarket’s acceptance of our Simoa technology, researchers at pharmaceutical and biotechnology companies are integrating our platforms into drug development protocols to more efficiently and effectively develop drugs. Using Simoa'sSimoa’s unprecedented sensitivity to measure previously undetectable levels of target biomarkers prior to and following administration of a drug, drug developers can non-invasively and objectively determine whether a drug candidate is having a desired impact on the target biomarker. We estimate that our Simoa technology has been utilized in over 800 clinical trials to date. In addition, researchers can also use Simoa to monitor a drug candidate'scandidate’s unwanted effect on "off-target"“off-target” biomarkers and predict side effects, addressing the significant issue of drug toxicity, which is a leading cause of death in the United States. We estimate that our Simoa technology has been utilized in projects for over 800 clinical trials to date. According to estimates in the Third-Party Research Report, we believe that the totalour pre-COVID addressable neurology, immunology and oncology life science research market including both proteomics and genomics research, is $3was approximately $1 billion per yearyear. Our recent EUA approvals expand our life science research market focus into COVID-19, which we estimate has currently addressable potential of $0.2 billion. As we further expand our life science research focus in other areas of immunology, oncology and hasother therapeutic areas, coupled with growing adoption of decentralized clinical trials, the potentiallife science research addressable market is expected to reach $8 billion per year.expand to approximately $7 billion. Diagnostics The diagnostic market represents a significant future commercial opportunity for our Simoa technology as well. We believe existing biomarker diagnostics can be improved by Simoa'sSimoa’s sensitivity to enable earlier detection of diseases and injuries, and that new diagnostics may be developed using protein biomarkers that are not detectable using conventional, analog immunoassay technologies but are detectable using Simoa technology. We also believe that the ultra-sensitive protein detection provided by our Simoa platforms can enable the development of a new category of non-invasive diagnostic tests and tools based on blood, serum and other fluids that have the potential to replace current more invasive, expensive and inconvenient diagnostic methods, including spinal tap, diagnostic imaging and biopsy.
Table of Contents
For example, researchers have conducted studies using Simoa that indicate that neurological biomarkers, including tau and Nf-L, may someday be able to replace diagnostic imaging to diagnose traumatic brain injury or TBI.(TBI). Our Simoa assays for tau and Nf-L are 3,500-fold and 840-fold more sensitive, respectively, than the leading assay platforms, and are the only assays that can reliably detect these critical protein biomarkers in blood.conventional ELISA technologies. Almost 90% of patients who visit U.S. hospital emergency rooms and receive a computerized tomography or CT,(CT) scan show no structural brain injury. In addition, CT scans have approximately 100 times more radiation than a chest x-ray, and are suspected of causing cancer in up to 29,000 people per year, underscoring the need for development of a safe and accurate blood-based diagnostic test for TBI, which we believe may be enabled by our Simoa technology. Simoa technology also has significant potential in the emerging field of companion diagnostics. A companion diagnostic test is a biomarker test that is specifically linked to a therapeutic drug that can help predict how a patient will respond to the drug. Drug developers can use companion diagnostics to stratify patients and select only those patients to study for whom a drug is expected to be most effective and safe. Companion diagnostics have demonstrated the ability to both improve the probability of approval and accelerate approval of new drugs. Not only cancould Simoa be used to develop companion diagnostics to stratify patients in clinical trials and for treatment, but Simoa'sSimoa’s sensitivity can also enablesenable the development of companion diagnostics based on protein biomarkers that can actively and regularly monitor whether an approved drug is having the desired biological effect. This canwould quickly and efficiently enable doctors to adjust the course of treatment as appropriate by increasing or decreasing dosages or even switching therapies. There has been significant interest from third parties to use our technology to develop applications for the diagnostic market. Precision Health Screening The ability of our Simoa platforms to detect and quantify normal physiological levels of low abundance proteins that are undetectable using conventional, analog immunoassay technologies could enable our technology to be used to monitor protein biomarker levels of seemingly healthy, asymptomatic people, and potentially to signal and provide earlier detection of the onset of disease. This mayhas the potential to facilitate a paradigm shift in healthcare, from an emphasis on treatment to a focus on earlier detection, monitoring, prognosis and, ultimately, prevention, enabling a "precision health"“precision health” revolution. We believe there is the potential for a number of neurological, cardiovascular, oncologic and other protein biomarkers associated with disease to be measured with a simple blood draw on a regular, ongoing basis as part of a patient'spatient’s routine health screening, and for those results to be compared periodically with baseline measurements to predict or detect the early onset of disease, prior to the appearance of symptoms. According to estimates in theThe Third-Party Research Report we believeestimates that the total diagnostic and precision health screening markets addressable using Simoa technology have the potential to reach an aggregate of $30approximately $55 billion per year, with neurology diagnostics estimated at
approximately $18 billion, proteomic liquid biopsy estimated at approximately $20 billion, COVID estimated at approximately $12 billion, and precision health screening estimated at approximately $5 billion, which would be addressable upon receipt of the necessaryany required regulatory approvals, which we have not yet begun the process to obtain.approvals. Our Key Focus Areas We have focused the application of our Simoa technology on areas of high growth and high unmet need and where existing platforms have significant shortcomings that our technology addresses. In particular, we have focused on the following areas: neurology and oncology, as well as COVID, cardiology, infectious disease and inflammation.
Neurology Table of Contents
Neurology
We believe that the ability of our Simoa technology to detect neurological biomarkers in blood at ultra-low levels, which have traditionally only been detectable in cerebrospinal fluid or CSF,(CSF), has the potential to rapidly advance neurology research and drug development, and transform the way brain injuries and diseases are diagnosed and treated. To our knowledge, the brain is the only organ in the body for which there is not currently a blood-based diagnostic test. The challenge with developing blood-based tests for the brain is that the blood-brain barrier, which is formed by endothelial cells lining the cerebral microvasculature, is very tight and severely restricts the movement of proteins and other substances between these endothelial cells and into blood circulation. Accordingly, diagnosis of brain disease and injury has traditionally required either an MRI scan of the brain or a spinal tap to collect CSF, both of which are costly and highly invasive for the patient. The sensitivity of the Simoa technology has enabled researchers to discover that extremely small amounts of critical neural biomarkers diffuse through the blood-brain barrier, and are released into the blood during injury and in connection with many neurodegenerative brain diseases. However, the concentrations of these neural biomarkers in the blood are so low that they are undetectable by conventional, analog immunoassay technologies. As one example,In 2017, we have developed ultra-sensitive protein assayscommercially launched a Simoa neurology 4-plex assay (Nf-L, tau, GFAP and UCH-L1) for the neural biomarkers Ab42study of neurodegenerative conditions and tau thattraumatic brain injury. Whereas other assay technologies require CSF to detect all four of these markers, or are approximately 2,000limited to only single-plex measurement in serum and 3,500-fold more sensitive, respectively, than benchmark commercial assays. Our protein assays areplasma, due to Simoa’s sensitivity, this is the only currently available assays on the market capable of precise measurementassay that can detect all of these neural biomarkers directly from serum and plasma samples in blooda multiplex assay format. This is a significant advantage in diseasedterms of ease of use, patient comfort, speed and healthy individuals.cost-effectiveness.
To date, there have been over 190 neurology related670 neurology-related scientific publications using our Simoa technology,technologies, and we believe that ultra-sensitive digital detection of neural related biomarkers in the blood is becoming an essential research and development tool for an increasing range of neurological disorders, including CTE, Alzheimer'smultiple sclerosis, Alzheimer’s disease, dementia, Parkinson'sParkinson’s disease, multiple sclerosis and TBI. The goal of this research is to eventually develop accurate diagnostic tools, predictive health screens and, ultimately, more effective treatments. Evidence of the potential clinical utility of Nf-L as a biomarker in neurological disease is progressing rapidly, in particular with respect to multiple sclerosis. At the 35th Congress of the European Committee for Treatment and Research in Multiple Sclerosis (ECTRIMS) in September 2019, there were nearly 50 presentations in which our Simoa Nf-L assay was used. In one presentation, Novartis presented positive data from its Phase III ASCLEPIOS I and II studies of its multiple sclerosis drug candidate, ofatumumab. One of the secondary endpoints included serum levels of Nf-L as measured using our Simoa Nf-L assay. Novartis presented data that showed that, starting at three months after initiation of ofatumumab treatment, and then at 12 and 24 months timepoints, patients given ofatumumab had significantly lower blood levels of Nf-L, compared to those in the comparator arm of teriflunomide treated patients. In another ECTRIMS presentation, Roche presented retrospective data from its Phase III OPERA I, OPERA, II AND ORATORIO trials of its approved multiple sclerosis drug OCREVUS (ocrelizumab). OCREVUS was only approved in 2017, but it has already become the multiple sclerosis market leader in its class, recording sales of $1.72 billion in the first half of 2019. By 2025, annual sales of the drug are estimated to reach $6.8 billion. In the data presented at ECTRIMS, it was shown that treatment with OCREVUS lowered blood Nf-L levels and increased proportion of patients reaching healthy donor range for Nf-L in both relapsing multiple sclerosis and primary progressive multiple sclerosis. Roche believes that this data helps advance the understanding of Nf-L as a potential biomarker of disease activity and for treatment monitoring, and may provide insight into the neuroprotective effects of the drug. In an article published by Bjornevik et al in JAMA Neurology in September 2019, researchers presented data that showed that levels of serum Nf-L, as measured by the Simoa Nf-L assay, were increased six years before the clinical onset of multiple sclerosis. The researchers concluded that these data indicate that MS may have a prodromal phase lasting several years and that neuroaxonal damage occurs during this phase, emphasizing the importance of early diagnosis and treatment. In 2017, researchers using Simoa technology published a paper inJAMA Neurology demonstrating that a simple blood test for the neurological biomarker Nf-L exhibited the same level of diagnostic accuracy for diagnosing Alzheimer'sAlzheimer’s disease as currently established CSF biomarkers. The study was a major study of almost 600 patients from the Alzheimer'sAlzheimer’s Disease Neuroimaging Initiative. The graph below depicts the diagnostic accuracy of plasma Simoa Nf-L measurements compared with traditional CSF biomarkers. The diagnostic accuracy of the plasma Simoa Nf-L results approached 90%, in line with the CSF biomarkers on the same patients.
Diagnostic Accuracy
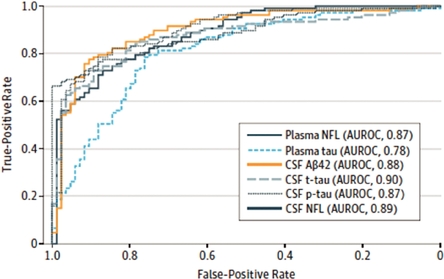
Table of Contents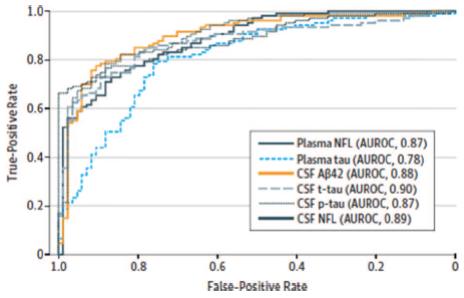
In addition, Simoa plasma Nf-L values were associated with cognitive deficits and neuroimaging hallmarks of Alzheimer'sAlzheimer’s disease at baseline and during follow-up. High plasma Nf-L correlated with poor cognition and Alzheimer'sAlzheimer’s disease -related brain atrophy and with brain hypometabolism (lower neural energy). These data suggest a simple Simoa blood test for Nf-L may have clinical utility as a noninvasive biomarker in Alzheimer'sAlzheimer’s disease. Nf-L is becoming an increasingly important biomarker for neurology research, with over 90 Nf-L-related research publications in 2018 alone, covering a number of neurological disorders, including multiple sclerosis, Alzheimer's disease, ALS, Parkinson's disease and others. Traumatic brain injuries, or TBIs lead to approximately five million individuals visiting emergency rooms per year in the United States alone, often with broad and inconclusive diagnosis. Current methods of TBI diagnosis involve CT scans that fail to diagnose approximately 90% of mild TBI. Simoa technology has demonstrated the sensitivity to identify relevant neurological biomarkers, such as Nf-L, tau, GFAP and UCHL-1,UCH-L1, to more adequately address diagnosis of TBIs and overall brain health.
Leading researchers in neurology have used Simoa technology to study biomarkers in the blood of athletes after concussion in many high-impact sports. Simoa can measure critical neural biomarkers in blood that correlate repeated head trauma from both concussions and subconcussive events with poor patient outcomes, including the potential development of Chronic Traumatic Encephalopathy or CTE,(CTE), which currently can only be diagnosed after death via a brain autopsy. A recent publication by a National Institute of Health researcher indicates that measuring tau in the blood with Simoa may help identify concussed individuals requiring additional rest before they can safely return to play. Eventually, we believe it may be possible to develop a mobile screen enabling clinicians to quickly and accurately determine whether it is safe for concussed athletes to return to play. In 2017, we commercially launched a Simoa neurology 4-plex assay (Nf-L, tau, GFAP and UCH-L1) for the study of traumatic brain injury and other neurodegenerative conditions. Whereas other assay technologies require cerebrospinal fluid, or CSF, to detect all four of these markers, due to Simoa's sensitivity, this is the only assay that can detect all of these biomarkers directly from blood samples. This is a significant advantage in terms of ease of use, patient comfort, speed and cost-effectiveness.
In 2016, Fast Company named Quanterix one of the "World's“World’s Most Innovative Companies"Companies” for our work in concussion detection. We also were awarded two competitive grants from the NFL-GE Head Health Challenge to advance this work in the detection and quantification of mild TBI. We estimate that the total addressable market for Simoa technology in neurology has the potential to reach $6 billion across research, diagnostic and precision health screening indications.18
Oncology Oncology
Our ultra-sensitive Simoa technology has the potential to detect increased levels of oncology biomarkers during the very early stages in disease development. Biomarkers can be useful tools for diagnostics, prognostics and predictive cancer detection. However, many traditional assay technologies can only detect these biomarkers after the disease has progressed and the patient has become symptomatic. Simoa'sSimoa’s highly sensitive detection capability may result in earlier detection, better monitoring and treatment and improved prognoses for patients. Additionally, Simoa technology has shown early promise as ana liquid biopsy alternative to more invasive diagnostic procedures. Simoa technology was used in a recentan unpublished scientific study that indicates it may be possible to eventually replace routine mammograms with a very sensitive, more accurate, low cost, non-invasive blood test. In this retrospective study, researchers found that Simoa assays resulted in significantly fewer false positives and false negatives than mammography. Inaccurate mammography can result in unnecessary stress, additional health care costs from follow up diagnostic mammograms,
Table of Contents
unnecessary biopsies and increased lifetime exposure to radiation. Researchers are also developing ultrasensitive assays for lung and pancreatic cancer biomarkers using Simoa technology, potentially replacing the need for imaging and biopsy. We believe our Simoa technology has the potential to lead to rapid, cost effective, accurate blood-based health screens, further enabling the liquid biopsy market, which is estimated to grow to almost $3 billion by 2026.market. Cancer immunotherapy is a promising new area that is significantly affecting cancer remission rates. One challenge of immunotherapy approaches is that the elicited immune responses are not always predictable and can vary from person to person and protocol to protocol. There exists a significant need to develop biomarker tools to monitor these drugs and their effects. Circulating (serum and plasma) protein biomarkers have the potential to be used in the field of immuno-oncology to stratify patients, predict response, predict recurrence, reveal mechanism of action and monitor for adverse effects. One technical challenge facing the immuno-oncology drug development process has been the availability of immunoassays with sufficient sensitivity to measure immunomodulatory biomarkers directly in serum and plasma. We have developed a set of 38 ultra-sensitiveover 100 tumor biomarker and immune modulation assays (cytokines and chemokines) that can be used to monitor thetumor proliferation and host immune response. In particular key immune regulatory cells (T-regs, dendritic cells, macrophages) secrete very low amounts of the protein Interferon gamma (IFN-gamma) and these levels cannot be reliably measured in serum and plasma using conventional, immunoassay technology, however they can be tracked with our Simoa IFN-gamma assay. Additionally, we have developed an ultra-sensitive assay for IL-6, which is one of the cytokines commonly measured for monitoring cytokine release syndrome as an adverse effect in immunotherapies. Several studies have shown that our ultrasensitive assays can be valuable tools for monitoring immuno-oncology drugs and protocols. We also believe residual cancer cell detection post-surgery or treatmentpost-treatment may significantly improve outcomes for a variety of cancer types, by helping identify and segment patients at a greater risk of reoccurrence post-surgery due to residual cancer. For example, we have developed an ultra-sensitive biomarker assay for Prostate Specific Antigen or PSA,(PSA) that is over 1,000-fold more sensitive than benchmark commercial PSAconventional ELISA assays. This assay is the only currently available technology that can detect levels of PSA in blood samples of prostate cancer patients shortly following radical prostatectomy, and we and researchers from Johns Hopkins and NYU conducted a pilot study on the utility of this assay to predict recurrence of prostate cancer after this procedure. In this study, the blood of prostate cancer patients taken three to six months following a radical prostatectomy at least five years earlier was analyzed with Simoa. The majority of samples had PSA levels below the detectable limits of traditional PSA assays. Our Simoa technology, however, was able to detect and quantify PSA levels in all samples. As shown in the following graph, the study demonstrated that the PSA assay using our Simoa technology has the potential to be highly predictive of prostate cancer recurrence over a five-year period. This has the potential to be a powerful prognostic tool, and allowing adjuvant radiation treatment to be targeted only to the men who actually would benefit. 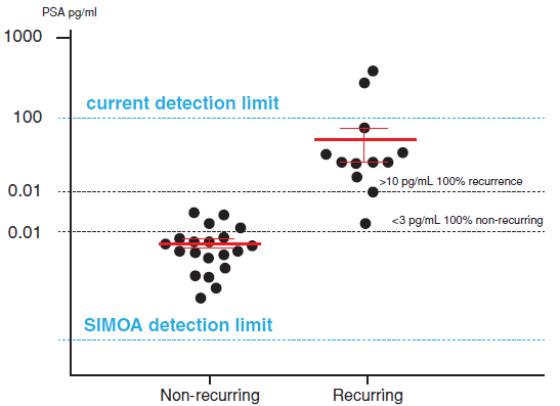
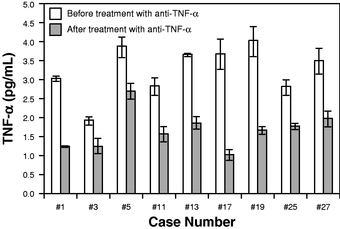
COVID-19 In view of the COVID-19 pandemic, in the second quarter of 2020 we determined that our cytokine assay technology could provide researchers with important and differentiated tools to study disease progression, cytokine release syndrome, and patient-treatment response in the fight against COVID-19, and began developing a SARS-CoV-2 semi-quantitative IgG assay and a SARS-CoV-2 antigen detection assay and prototyping a high-definition multiplex SARS-CoV-2 serology assay. In December 2020, the FDA issued an EUA for our Simoa Semi-Quantitative SARS-CoV-2 IgG Antibody Test that is run on our HD-X instrument. This test targets antibodies that are directed against the region of the novel coronavirus known as the spike protein. The spike protein contains multiple subunits which together mediate entry of the virus into human cells, and for this reason, many candidate and authorized COVID-19 vaccines are designed to elicit an antibody response to the spike protein. Accordingly, we believe that this test may be useful for measuring the antibody response to vaccine therapy. The assay may also be used for measurement of IgG antibodies in patients suspected of previous infection or recent SARS-CoV-2 exposure. The test provides a numerical result representing the concentration of antibodies from 0.21 to 250 mg/mL. In clinical studies, the test demonstrated a 100% positive percent agreement (sensitivity) and 99.2% negative percent agreement (specificity) 15 or more days following a positive PCR test. In January 2021, the FDA issued an EUA for our Simoa SARS-CoV-2 N Protein Antigen Test that is also run on our HD-X instrument. This test detects the presence of the SARS-CoV-2 virus nucleocapsid protein (or N protein) which is known to be elevated in respiratory fluids during the initial acute phase of the infection. We estimatebelieve that direct detection of antigen proteins from the total addressable marketvirus may be a more meaningful measure of infection status than detection of RNA by rRT-PCR because genetic material can linger even after the virus has left the body, resulting in increased risk of false positives. In clinical studies, this test demonstrated a sensitivity of 97.7% and specificity of 100% up to 14 days following onset of symptoms. Under the current EUA, the test is intended for use with nasopharyngeal (NP) samples in individuals suspected of COVID-19 infection by their healthcare providers. We currently intend to pursue authorization for additional sample types, including nasal swabs, saliva, and capillary dried blood obtained from a fingerstick. Preliminary clinical research studies suggest the viral antigen may be readily detectable in asymptomatic and pre-symptomatic patients, and we are exploring extending the test to screening applications, home-based sample collection and pooling to enable larger scale testing. Inflammation Inflammation underlies the response of the body to injury in a variety of diseases. Simoa assays can measure inflammatory and anti-inflammatory molecules in oncologyserum and plasma with unprecedented sensitivity. This has the potential to reach $25 billion across research, diagnosticenable new discoveries into the role of inflammation in the biology of health and precision healthdisease. Our Simoa technology measures low levels of inflammatory proteins, including cytokines and chemokines, that characterize a range of inflammatory diseases, including Crohn’s disease, asthma, rheumatoid arthritis and neuro-inflammation. We believe the sensitivity of Simoa technology can provide a clearer picture of the underlying state of the immune response and disease progression. Our Simoa technology also has the potential to be used by companies developing anti-inflammatory drugs to quantify the effect a drug has on a particular inflammatory cytokine and to monitor therapeutic efficacy. For example, we conducted a study in conjunction with the Mayo Clinic using our Simoa technology on patients with clinically active Crohn’s disease undergoing anti-TNF-α therapy with Remicade, Humira or Enbrel. As shown in the graph below, researchers were able to detect and quantify the TNF-α levels of the patients before and after treatment. These levels were all below the LoD of traditional immunoassays. 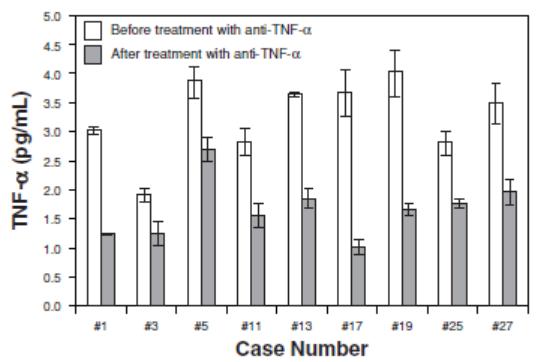
We believe that a better understanding of the inflammatory response will be critical to future opportunities for wellness screening indications.and disease response monitoring. Anti-inflammatory drugs are expensive and can have serious side effects, such as increased risk of infection. By monitoring biomarkers indicative of response, clinicians may be able to adjust dose to reduce side effects or increase efficacy. Cardiology Heart disease and related cardiovascular ailments remain the leading cause of death in the United States, contributing to nearly 1 in 4 deaths in the United States, according to the CDC. A significant need remains for early prediction of heart attacks and other cardiac events. Simoa'sSimoa’s highly sensitive digital measurement capabilities have the potential to be used to predict early cardiac disease. Infectious Disease The ability to detect infectious disease biomarkers before the onset of an immune response, where a virus is most contagious and multiplying rapidly, is critical for controlling the spread of disease. We believe that our Simoa technology has the potential to have a significant impact in reducing the spread of infectious diseases by making early stage detection more specific and widely available. Today, early detection of infectious disease is conducted using nucleic acid testing to detect the nucleic acid of the viral or bacterial organism because the levels of infectious disease specific antigens are too low in the early stage of disease to be detected by traditional immunoassay technology. However, the sensitivity of our single molecule detection capabilities enables the detection of extremely low levels of infectious disease specific antigens with sensitivity that can rival the use of nucleic acid testing in this application, without the potential biases inherent in amplification technologies, such as PCR. For example, we have developed a simple Simoa assay with more than 4,000-fold greater sensitivity than benchmark commercial proteinconventional ELISA assays capable of detecting the HIV-specific antigen, p24. This Simoa p24 sensitivity matches the sensitivity of more expensive and complex nucleic acid testing methods. The following graph shows a comparison that we conducted in 2011 of the Simoa p24 assay with a commercially available nucleic acid testing method, as well as two commercially available p24 immunoassay methods for early detection of HIV infection. The Simoa p24 assay detects infection as early as the nucleic acid testing method (11 days from initial blood draw), and a full week before the earliest signs of infection by the
Table of Contents
conventional p24 immunoassay methods. This early detection of acute HIV infection can be critical for controlling the spread of HIV, as HIV is ten times more infectious in the acute phase. 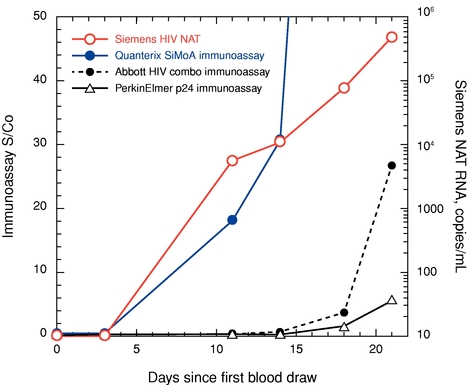 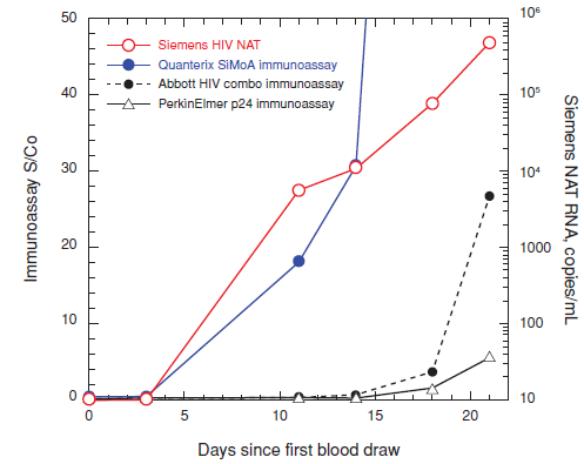
In addition, we believe the detection of a specific protein is more relevant to the determination of the pathogenic effect than detection of the organism itself because someone may carry a pathogenic organism with no pathogenic effect. Researchers have demonstrated that Simoa technology can detectClostridium difficile (C. diff) toxins A and B with sensitivities similar to the PCR detection of theC. diff organism itself. Because theC. diff organism does not always produce toxins, PCR methods that detect theC. diff organism suffer from very high false positive rates, which may result in incorrect diagnoses and the overuse of antibiotics. We believe that using Simoa to detect the toxins rather than the organism has the potential to provide a higher level of sensitivity and specificity, greatly reducing false positives. We will continue to develop Simoa assays for pathogenic antigens that are competitive in sensitivity to PCR but more specific to the pathogenicity of the offending organism. We believe that these Simoa assays could also be invaluable tools for the development of anti-infective drugs and treatment monitoring of anti-viral and anti-bacterial drugs. Inflammation underlies the response of the body to injury in a variety of diseases. Simoa assays can measure inflammatory and anti-inflammatory molecules in serum and plasma with unprecedented sensitivity. This has the potential to enable new discoveries into the role of inflammation in the biology of health and disease. Our Simoa technology measures low levels of inflammatory proteins, including cytokines and chemokines, that characterize a range of inflammatory diseases, including Crohn's disease, asthma, rheumatoid arthritis and neuro-inflammation. We believe the sensitivity of Simoa technology can provide a clearer picture of the underlying state of the immune response and disease progression.
Our Simoa technology also has the potential to be used by companies developing anti-inflammatory drugs to quantify the effect a drug has on a particular inflammatory cytokine and to
Table of Contents monitor therapeutic efficacy. For example, we conducted a study in conjunction with the Mayo Clinic using our Simoa technology on patients with clinically active Crohn's disease undergoing anti-TNF-a therapy with Remicade, Humira or Enbrel. As shown in the graph below, researchers were able to detect and quantify the TNF-a levels of the patients before and after treatment. These levels were all below the limit of detection, or LoD, of traditional immunoassays.
We believe that a better understanding of the inflammatory response will be critical to future opportunities for wellness screening and disease response monitoring. Anti-inflammatory drugs are expensive and can have serious side effects, such as increased risk of infection. By monitoring biomarkers indicative of response, clinicians may be able to adjust dose to reduce side effects or increase efficacy.
Our Products and Services Our Quanterix commercial portfolio includes research use only (ROU) instruments, assay kits and other consumables, and contract research services offered through our Accelerator Laboratory, as follows: | | | | | | | | |
|---|
| | Key attributes |
|---|
HD-1/HD-X | | | | •
| | ● commercially launched the HD-1 in January 2014•
expect to commercially launch the next-generation HD-X in the second half of 2019
to replace the HD-1 launched in 2014 |  | |  | 
| •
| ● Simoa bead-based platform technology •
● most widely referenced ultra-sensitive multiplex immunoassay platform on market •
● fully automated, floor-standing instrument •
● multiplexing capability (up to 6-plex) with small sample volume •
● up to 400 samples per eight-hour shift •
● homebrew capabilities •
HD-1 supports multiplexing up to 4-plex; HD-X will support up to 6-plex
|
Table of Contents
| | | | | Product
| | Key attributes |
|---|
SR-X
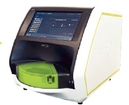 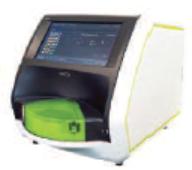
| | •
commercial launch● commercially launched in December 2017 •
● Simoa bead-based platform technology •
● reader only, benchtop instrument with lower price point •
● same sensitivity, dynamic range and homebrew capabilities as HD-1•
HD-X ● multiplexing capability: SR-X currently has up to 6-plex capability •
● sample prep and assay protocol flexibility
| SP-X
 
| | •
early access program in January 2019; commercial launch expected● commercially launched in April 2019 •
● Simoa planar array platform technology •
● reader only, benchtop instrument with lower price point •
● similar sensitivity, dynamic range and homebrew capabilities as HD-1•
HD-X ● multiplexing capability: SP-X currently has up to 10-plex capability •
● sample prep and assay protocol flexibility
|
| | | |
|---|
Product | | Key attributes |
|---|
AssaysSimoa assays and other consumables
  
| | •
over● menu of approximately 87 single-plex and multi-plex bead-based assay kits includes assays for biomarkers in the areas of neurology, infectious disease, immunology and oncology ● Two EUA approved SARS-CoV-2 assays ● menu of Simoa planar array reagent kits includes approximately 120 biomarker assays developed for neurology,biomarkers ranging from 1-10 analytes per assay in the areas of immunology and oncology cardiology, infectious diseases and immunology research •
● homebrew kits containing reagents and supporting user guides enabling customers to develop custom assays •
● proprietary Simoa disk with 24 arrays, each containing approximately 239,000 microwells for Simoa bead-based assays
| Services
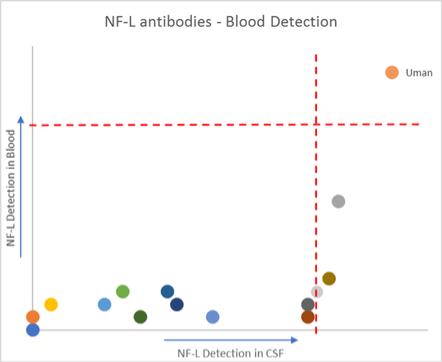
Nf-L antibodies and Nf-L ELISA kits
 
| | ● sold through our wholly-owned subsidiary, Uman, which we acquired in 2019 ● Nf-L capture/detection antibodies with unparalleled sensitivity and specificity ● Nf-L ELISA kits for CSF; CE-certified in Europe; RUO outside of Europe ● licensing and supply arrangement with Siemens Healthineers that will allow Siemens to begin developing blood-based Nf-L clinical tests for future commercialization | Services 
| •
| ● contract research services provided through our Accelerator Laboratory •
● over 5001,300 projects completed to date •
● extended warranty and service contracts •
● CLIA-certified lab available |
Instruments and Consumables HD-1/HD-X
We commercially launched our HD-X instrument in the second half of 2019. The HD-X is an upgraded version of the Simoa HD-1, our very first instrument, which was launched in January 2014. The HD-1HD-X was designed to deliver significant productivity and operational efficiency improvements, as well as greater user flexibility. The HD-X uses our Simoa bead-based technology and is the most sensitive automated multiplex protein detection platform commercially available. Assays for the HD-1HD-X are fully automated (i.e. sample in to result out), and results for up to 66 samples are available in approximately one hour. We believe that this automation
Table of Contents
provides us an additional significant competitive advantage with pharmaceutical and biotechnology customers. Samples can be input into the instrument via 96-well microtiter plates or sample tubes where the system can multiplex and process tests in a variety of assay protocol configurations. Specialized software controls the Simoa instrumentation, analyzes the digital images produced, and provides customers with detailed analysis of their samples, such as the concentration of multiple biological molecules. The HD-1HD-X software automates the processes for running the instrument and analyzing data from the user-defined protocols. Proprietary image analysis software is embedded in the system, which converts the raw images into signals for each biological molecule being analyzed within a sample. Data reduction software automatically converts those signals to concentrations for the different biological molecules. We continually seek to improve our platforms and technology and to that end, we expect to commerciallyFollowing commercial launch our next-generation fully automated, bead-based Simoa instrument,of the HD-X, inwe initiated a trade-in program for installed HD-1 instruments that has been exceeding expectations. By the second halfend of 2019. The2020, approximately 48% of the HD installed base was HD-X will increase the multiplexing capability from 4-plex (current HD-1 limit) to six-plex and will include software features to facilitate compliance with 21 CFR part 11 procedures.instruments.
SR-X We commercially launched the SR-X instrument in the fourth quarter of 2017. The SR-X utilizes the same Simoa bead-based technology and assay kits as the HD-1HD-X in a compact benchtop form with a lower price point designed to address the needs of researchers who value the ultra-sensitive detection capabilities enabled by Simoa. In contrast to the fully automated workflow of the HD-1,HD-X, the assay incubation and washing steps for the SR-X are performed outside of the instruments using conventional liquid handling methods. The offline sample prep provides additional flexibility to enable researchers to apply Simoa detection in an expanded range of applications including direct detection of nucleic acids. The SR-X system automates the steps loading Simoa beads onto Simoa disks with subsequent imaging, detection and data reduction. Processing time for imaging a 96 well plate is approximately 2.5 hours. SP-X We initiated an early-access program forcommercially launched the SP-X instrument in January 2019, with the full commercial launch planned for April 2019. The SP-X uses the Simoa planar array technology developed initially by Aushon Biosystems for multiplex chemiluminescent immunoassay measurement, which we refined by leveraging our proprietary sophisticated Simoa image analysis and data analysis algorithms to provide the same Simoa sensitivity found in our Simoa bead-based platform. The Simoa planar array technology utilizes a 96-well microtiter plate with up to 10 different assay measurements performed in each well of the plate from as little as 12.5 microliters of sample. Similar to the SR-X, the assay prep workflow utilized for the SP-X involves assay incubation and washing steps performed outside of the instrument using the same conventional liquid handling methods as the SR-X. The SP-X instrument automates the imaging, detection and data reduction process. Processing time for imaging a 96 well plate is less than five minutes. Simoa Assays and Consumables Recurring revenue is derived through the sale of consumables used to run assays on our instruments, and from our growing menu of Simoa digital biomarker assays. The current menu of approximately 8087 analyte-specific single-plex and multi-plex assay kits for our bead-based instruments includes assays for biomarkers in the areas of neurology, infectious disease, immunology and oncology for both human and mouse samples. The current menu of assay kits for the planar array instrument includes approximately 50120 biomarkers ranging from 1-10 analytes per assay in the areas of immunology and oncology research.
Table of Contents
In addition to these assays we have developed, both of the Simoa platform allowsplatforms allow ease and flexibility in assay design, enabling our customers to develop their own proprietary in-house assays, called homebrew assays, using our bead-based Homebrew Assay Development Kit.homebrew assay kits. These kits include all components required for customers to run tests using their own antibodies. Our consumables portfolio for our bead-based platform also includes our proprietary Simoa disks that are unique to our bead-based platform, as well as cuvettes, and disposable tips. Our goal is to continue to add to our assay kits to extend our application base. Our consumables portfolio for our planar array platform also includes assay-specific reagent kits as well as the Simoa Planar Array Homebrew Starter Kit which enables our customers to run tests using their own antibodies and reagents in a similar manner to the bead-based homebrew kits. We have staffed our assay development and manufacturing teams to do the upfront work of antibody sourcing, assay development and optimization, sample testing and validation, transfer to manufacturing and final documentation. We outsource some of our assay development activities to other antibody and/or assay development providers and expect to continue to do so to achieve our aggressive menu expansion goals. Nf-L Antibodies and Nf-L ELISA Kits In August 2019, we completed our acquisition of Uman. Uman supplies neurofilament light (Nf-L) antibodies and ELISA kits for Nf-L detection in CSF. Uman’s Nf-L antibodies are widely recognized by researchers and biopharmaceutical and diagnostics companies world-wide as the premier solution for the detection of Nf-L to advance the development of therapeutics and diagnostics for neurodegenerative conditions. Through Uman we sell proprietary Nf-L capture and detection antibodies, as well as two Nf-L ELISA kits for CSF, one of which is CE-certified in Europe. Services Through our Accelerator Laboratory, which includes a CLIA-certified laboratory, we provide customers a contract research option. Researchers, academics and principal investigators can work with our scientists to test specimens with existing Simoa assays, or prototype, develop and optimize new assays. The Accelerator Laboratory supports multiple projects and services, including: •Sample testing. Utilizing commercially available Simoa kits, we have run large studies for customers with thousands of specimens and small experiments with just a few samples. The sample protocol can be tailored precisely to the customer's needs and even large studies can be run quickly. We have extensive experience testing many different sample types where biomarkers may be present at very low levels.
•Homebrew assay development. Utilizing proprietary or commercially available reagents in combination with our Homebrew Assay Development Kit, we can rapidly develop a prototype assay exhibiting improved sensitivity compared to traditional ELISA. The Accelerator Laboratory can also be used to screen reagents to identify the optimal assay format or expand prototype efforts for further assay optimization or validation to ultimately deliver the highest level of performance.
•Custom development. After identifying the optimal assay and conditions, the Accelerator Laboratory can be used to generate qualified bulk reagents or custom assay kits, providing customer access to validated kits for assays not yet commercially available on the Simoa platform.
| ● | Sample testing. Utilizing commercially available Simoa kits, we have run large studies for customers with thousands of specimens and small experiments with just a few samples. The sample protocol can be tailored precisely to the customer’s needs and even large studies can be run quickly. We have extensive experience testing many different sample types where biomarkers may be present at very low levels. |
| ● | Homebrew assay development. Utilizing proprietary or commercially available reagents in combination with our Homebrew Assay Development Kit, we can rapidly develop a prototype assay exhibiting improved sensitivity compared to traditional ELISA. The Accelerator Laboratory can also be used to screen reagents to identify the optimal assay format or expand prototype efforts for further assay optimization or validation to ultimately deliver the highest level of performance. |
| ● | Custom development. After identifying the optimal assay and conditions, the Accelerator Laboratory can be used to generate qualified bulk reagents or custom assay kits, providing customer access to validated kits for assays not yet commercially available on the Simoa platform. |
To date, we have completed over 5001,300 projects for over 179approximately 360 customers from all over the world using our Simoa platforms.platforms, including over 130 projects for clinical studies. In addition to being an important source of revenue, we have also found the Accelerator Laboratory to be a significant catalyst for placing additional instruments, as more than 45a number of customers for whom we have provided contract research services have subsequently purchased an instrument from us. We also generate revenues through extended-warranty and service contracts for our installed base of instruments. Research and Development We continually seek to improve our platform and technology to enable more sensitive detection and measurement of biological molecules. This evaluation includes examining new assay formats and
Table of Contents
instrumentation improvements and upgrades to increase the performance of our Simoa assays and instruments. We have implemented a research and development program that aimspublished an approach to increase the sensitivity of our Simoa technology 100-fold by 2021.. We are also focused on expanding our assay menu to extend the scope of applications for our platform and grow our customer base. Our assay menu expansion is driven by a number of factors, including input from key opinion leaders, customer feedback, homebrew projects, Accelerator Laboratory projects, new publications on biomarkers of industry interest, and feedback from our sales and marketing team. We also intend to continue to develop and market new instruments with different and/or improved capabilities in order to further broaden our market reach. Sales and Marketing We distribute our Simoa instruments and consumables via direct field sales and support organizations located in North America and Europe and through a combination of our own sales force and third-party distributors in additional major markets, such asincluding Australia, Brazil, China, Czech Republic, China, India, Israel, Japan, Lebanon, Mexico, Qatar, Saudi Arabia, Singapore, South Korea Lebanon, Qatar, Singapore and Taiwan. In addition, Uman sells Nf-L antibodies and Nf-L ELISA kits directly, and in conjunction with a distributor worldwide (excluding certain Nordic countries). Our domestic and international sales force informs our current and potential customers of current product offerings, new product and new assay introductions, and technological advances in Simoa systems, workflows, and notable research being performed by our customers or ourselves. As our primary point of contact in the marketplace, our sales force focuses on delivering a consistent marketing message and high level of customer service, while also attempting to help us better understand evolving market and customer needs. As of March 1, 2019,December 31, 2020, we had approximately 78118 people employed in sales, sales support and marketing, including technical field application scientists and field service personnel. This staff is primarily located in North America and Europe. We intend to significantly expand our sales, support, and marketing efforts in the future by expanding our direct footprint in Europe as well as developing a comprehensive distribution and support network in China where significant new market opportunities exist. Additionally, we believe that there is significant opportunity in other Asia-Pacific region countries such as South Korea and Australia as well as in South America. We plan to expand into these regions via initial penetration with distributors and then subsequent support with Quanterix-employed sales and support personnel. Our sales and marketing efforts are targeted at key opinion leaders, laboratory directors and principal investigators at leading biotechnology and pharmaceutical companies and governmental research institutions. In addition to our selling activities, we align with key opinion leaders at leading institutions and clinical research laboratories to help increase scientific and commercial awareness of our technology,technologies, demonstrate itsthe benefits relative to existing technologies and accelerate its adoption. We also seek to increase awareness of our products through participation at trade shows, academic conferences, online webinars and dedicated scientific events attended by prominent users and prospective customers. To develop a thought leadership position in the precision health arena, we have been a Platinum Sponsor of the annual Powering Precision Health (PPH) Summit or PPHS. PPHSsince 2016. PPH is an annual summitorganization founded in 2016 by our President and Chief Executive Officer, Kevin Hrusovsky, that aims to gather many of the world'sworld’s top innovators, scientists, physicians, medical professionals, patient advocates, government officials, regulators and investors to debate and collaborate around crucial issues from neurology, oncology and cardiology to inflammation and infectious disease. At PPHS in 2016, there were 22 cutting edge scientific talks covering neurology, cardiology, oncology and inflammation. There were over 200 registered attendees, including senior scientists, patient advocates, investors, and potential partners. At PPHS in 2017, there were 37 scientific talks and over 425 registered attendees and at PPHS Europe in 2018, there were 20 scientific talks and over 150 registered attendees.
Table of ContentsWe believe that sponsoring this event provides Quanterix significant marketing benefits.
Our systems are relatively new to the life science marketplace and require a capital investment by our customers. The sales process typically involves numerous interactions and demonstrations with multiple people within an organization. Some potential customers conduct in-depth evaluations of the system including running experiments in the Accelerator Laboratory and comparing results from competing systems. In addition, in most countries, sales to academic or governmental institutions require participation in a tender process involving preparation of extensive documentation and a lengthy review process. As a result of these factors and the budget cycles of our customers, our sales cycle, the time from initial contact with a customer to our receipt of a purchase order, can often be six to 12 months, or longer. Manufacturing and Supply Our manufacturing strategy has two components: to outsource the Simoa bead-based instrument development and manufacturing with industry leaders, and to internally develop and manufacture our planar array instrument and all assay kits in our own facilities. Instruments The HD-1 and HD-X instruments areinstrument is manufactured by STRATEC Biomedical AG (STRATEC), based in Birkenfeld, Germany, and is manufactured and shipped from their Birkenfeld and Beringen, Switzerland facilities. See "—“—Key Agreements—Development Agreement and Supply Agreement with STRATEC"STRATEC” for a description of this agreement. HD-1 instruments areour agreement with STRATEC. The SR-X is manufactured by Paramit Corporation (Paramit), based in Morgan Hill, California, and is shipped by STRATEC to our global customers' locations.customers by Paramit. See “—Key Agreements—Paramit Manufacturing Services Agreement” for a description of our agreement with Paramit. Installation of, and training on, our productsinstruments is provided by our employees in the markets where we conduct direct sales, and by distributors in those markets where we operate with distributors. The SR-X is manufactured by Paramit Corporation, based in Morgan Hill, California, and is shipped to global customers by Paramit. We believe this manufacturing strategy is efficient and conserves capital. However, in the event it becomes necessary to utilize a different contract manufacturer for the HD-1, the HD-X or the SR-X, we would experience additional costs, delays and difficulties in doing so, and our business would be harmed. The SP-X instruments are manufactured, tested, shipped and supported by us from our Billerica, Massachusetts facility. All internal components are sourced domestically except one significant component is sourced in Germany. These components are sourced from a limited number of suppliers, including certain single-source suppliers. Although we believe that alternatives would be available, it would take time to identify and validate replacement components, which could negatively affect our ability to supply instruments on a timely basis. To mitigate this risk, we typically carry significant inventory of critical components. Consumables We assemble our assay kits for our bead-based platform in our Lexington,Billerica, Massachusetts facility. Reagents for our bead-based assays include all components required to run an enzyme based immunoassay, such as beads, capture and detector reagents, enzyme reagents and enzyme substrate. These reagents are sourced from a limited number of suppliers, including certain single-source suppliers. Although we believe that alternatives would be available, it would take time to identify and validate replacement reagents for our assay kits, which could negatively affect our ability to supply assay kits on a timely basis. In an effort to mitigate this risk through inventory control, we have increased the shelf life of the vast majority of our bead-based assays from six months to 12 months or more. Simoa disks for our bead-based platform are supplied through a single source supplier pursuant to a long-term supply agreement with STRATEC Consumables, a subsidiary of STRATEC Biomedical.
Table of Contents
This agreement provides for a sufficient notification period to allow for supply continuity and the identification and tech transfer to a new supplier in the event either party wishes to terminate the relationship. Our cuvettes for our bead-based platform are single sourced through STRATEC Biomedical, and the disposable tips used in our bead-based platform are commercially available. We assemble our assay 96 well sample plate kits for our planar array platform in our Billerica, Massachusetts facility. Reagents for our planar array assays include all components required to run an enzyme-based chemiluminescent immunoassay, such as capture antibody printed plates and detector reagents, enzyme reagents and enzyme substrate. These reagents are sourced from a limited number of suppliers, including certain single-source suppliers. Although we believe that alternatives would be available, it would take time to identify and validate replacement reagents for our assay kits, which could negatively affect our ability to supply assay kits on a timely basis. Because our planar array assays have a shelf life of 12 months, we believe we are able to mitigate this risk through inventory control. Nf-L antibodies and Nf-L ELISA Kits The storage of Uman’s proprietary Nf-L antibody producing hybridomas as well as the cultivation and purification of the antibodies is outsourced to a contract manufacturer, and bulk material of purified antibodies is delivered to Uman’s site in Umeå, Sweden. Functional testing and verification of concentration are performed at Uman before the material is approved for use in production activities. The antibodies can be aliquoted and sold as single reagents or used for the production of Uman’s Nf-L ELISA kits. The antibody reagents are labeled and released to market after testing. The contract manufacturer of antibodies is audited regularly, and we have entered into a written supply agreement with the contract manufacturer. The current shelf-life of the antibodies is 18 months. All components in Uman’s Nf-L ELISA kits are manufactured in-house at Uman from starting materials sourced from suppliers that have been evaluated and approved. Uman has entered into supply agreements with critical suppliers. All incoming goods are subject to receipt control and any deviations related to quality deficiencies are registered. The kit components include buffers (sample diluent and wash solution), an ELISA 96-well plate coated with a capture antibody, detector antibody, streptavidine conjugate, substrate (TMB) and stop reagent. The kit components are labeled (either “RUO” or “CE”) and assembled. The final ELISA kit product is subject to quality control which include testing of human CSF quality control samples to assure a high batch consistency. After testing and batch record review, the material is released to market. The current shelf-life of the kits is 18 months. Key Agreements Development Agreement and Supply Agreement with STRATEC In August 2011, we entered into a Strategic Development Services and Equity Participation Agreement or the(the STRATEC Development Agreement,Agreement) with STRATEC, Biomedical Systems AG, pursuant to which STRATEC undertook the development of the Simoa HD-1HD instrument. Under the STRATEC Development Agreement, we were required to pay a fee and issue to STRATEC warrants to purchase our equity securities, all of which have been exercised as of December 31, 2017. These fees and warrants were subject to a milestone based payment schedule. The STRATEC Development Agreement was amended in November 2016. The Amendment reduced our obligation to satisfy a minimum purchase commitment under the STRATEC Supply and Manufacturing Agreement described below. Additionally, the parties agreed on additional development services for an additional fee, which is payable when the additional development is completed. This fee includes the final milestone payment that was associated with the final milestone due under the terms of the STRATEC Development Agreement. The services are expected to bewere completed in and the second halffinal milestone payment was paid in the fourth quarter of 2019. The STRATEC Development Agreement may be terminated on the insolvency of a party, for an uncured material breach, or, by us, on a change of control of our company (subject to certain obligations to compensate STRATEC on such termination) or if we and STRATEC are unable to agree on pricing of the instrument, within certain parameters. In September 2011, we also entered into a Supply and Manufacturing Agreement with STRATEC or the(the STRATEC Supply Agreement,Agreement), pursuant to which STRATEC agreed to supply HD-1HD instruments to us, and we agreed to procure those instruments exclusively from STRATEC, subject to STRATEC'sSTRATEC’s ability to supply the instruments. We are responsible for obtaining any regulatory approval necessary to sell the instruments. We agreed to purchase a certain number of instruments in the seven years following the acceptance of the first validation instrument. The STRATEC Supply Agreement was amended in November 2016 to reduce the number of HD instruments we are committed to procure from STRATEC.STRATEC, and this commitment has been met. The instrument price stipulated in the STRATEC Supply Agreement was established based on certain specified assumptions and is subject to certain adjustments. The STRATEC Supply Agreement is terminable by either party on 12 months'months’ notice to the other party, provided that neither party may terminate the STRATEC Supply Agreement prior to the later of the seven year anniversary of the acceptance of the first prototype instrument and the purchase of the minimum number of instruments which we were committed to procure. The STRATEC Supply Agreement may also be terminated on the insolvency of a party or the uncured material breach of a party, or, by us, on a change of control of our company (subject to certain obligations to compensate STRATEC on such termination). On termination by us for STRATEC'sSTRATEC’s insolvency or uncured material breach or termination by STRATEC for convenience, we are granted a nonexclusive royalty free license of STRATEC intellectual
Table of Contents
property to manufacture the instruments. In certain of these circumstances, we could be obligated to issue warrants to purchase common stock. Paramit Manufacturing Services Agreement In November 2016, we entered into a Manufacturing Services Agreement or the(the Paramit Agreement,Agreement) with Paramit Corporation, or Paramit. Under the terms of the Paramit Agreement, we engaged Paramit to produce and test our SR-X instrument on an as-ordered basis. We also engaged Paramit to supply spare parts. Paramit has no obligation to manufacture our instrument without a purchase order and no obligation to maintain inventory in excess of any open purchase orders or materials in excess of the amount Paramit reasonably determines will be consumed within 90 days or within the lead time of manufacturing our instrument, whichever is greater. We have an obligation to purchase any material or instruments deemed in excess pursuant to the Paramit Agreement. The price is determined according to a mutually agreed-upon pricing formula. The parties agreed to review the pricing methodology yearly or upon a material change in cost. The Paramit Agreement has an initial three-year term with automatic one year extensions. It is terminable by either party for convenience with nine months' written notice to the other party given at least nine months prior to the end of the then-current term. The agreement may also be terminated by us with three months'months’ notice to Paramit upon the occurrence of (i) a failure of Paramit to obtain any necessary governmental licenses, registrations or approvals required to manufacture our instrument or (ii) an assignment by Paramit of its rights or obligations under the agreement without our consent. The Paramit Agreement is terminable by Paramit with 30 days'days’ notice to us in the event of a material breach after written notice and a 60-day opportunity to cure the breach. CompetitionNon-Exclusive License Agreement with Abbott Laboratories
In September 2020, we entered into a Non-Exclusive License Agreement with Abbott. Pursuant to the terms of the License Agreement, we granted Abbott a non-exclusive, worldwide, royalty-bearing license, without the right to sublicense, under our bead-based single molecule detection patents in the field of IVD. Abbott paid us an initial license fee of $10.0 million in connection with the execution of the License Agreement. Abbott has also agreed to pay us milestone fees subject to the achievement by Abbott of certain development, regulatory and commercialization milestones and low single digit royalties on net sales of licensed products. The License Agreement includes customary representations and warranties, covenants and indemnification obligations for a transaction of this nature. The License Agreement became effective upon signing and will continue until expiration of the last-to-expire licensed patent, or the agreement is earlier terminated. Under the terms of the License Agreement, each party has the right to terminate the agreement for uncured material breach by, or insolvency of, the other party. Abbott may also terminate the License Agreement at any time without cause upon sixty (60) days’ notice. Contracts with the NIH under RADx In September 2020, we entered into the Rapid Acceleration of Diagnostics (RADx) workplan 2 award (WP2) with the National Institute of Health (NIH) under the RADx program. This contract, which has a total award value of $18.2 million, is intended to accelerate the continued development, scale-up and deployment of our novel SARS-CoV-2 antigen test. Initial early feasibility of this test was funded in part through the RADx workplan 1 award (WP1) we were granted in June 2020. WP2 supports clinical validation of the test in support of the EUA submissions with the FDA, and provides funding to expand assay kit manufacturing capacity and commercial deployment readiness. Contract funding is subject to achievement of pre-defined milestones and the contract period runs through September 2021. Competition We compete with both established and development-stage life science companies that design, manufacture and market instruments for protein detection, nucleic acid detection and additional applications. For example, companies such as Bio-Techne, Luminex, Corporation, MesoScale Diagnostics, Singulex,Discovery, Gyros, Corporation, Nanostring, Technologies, Inc., and others, have products for protein detection that compete in certain segments of the market in which we sell our products. AsOur Accelerator Laboratory competes with other research laboratories such as Covance, Q2 Solutions, Myriad RBM, Monogram Biosciences, PPD Laboratories, and others, some of whom are customers of ours. In addition, as we or our partners expand the applications for our products to include diagnostics and precision health screening, we expect to compete with companies such as Siemens, Abbott, Roche, Ortho Clinical Diagnostics and Thermo Fisher Scientific. Furthermore, our technology and products are showing promise for non-invasive early disease detection, and in the future, we could experience competition from companies that develop and market imaging and other molecular detection technologies. In addition, a number of other companies and academic groups are in the process of developing novel technologies for the life science research, diagnostic and precision health screening markets. Many of the companies with which we compete or will compete have substantially greater resources than we have. The life science instrumentation industry isand lab services industries are highly competitive and expected to grow more competitive with the increasing knowledge gained from ongoing research and development. We believe the principal competitive factors in our target markets include: •sensitivity;
•cost of instruments and consumables;
•assay menu;
•reputation among customers and key opinion leaders;
•innovation in product offerings;
| ● | cost of instruments and consumables; |
| ● | reputation among customers and key opinion leaders; |
| ● | innovation in product offerings; |
| ● | accuracy and reproducibility of results; and |
| ● | customer support infrastructure. |
Table of Contents
•accuracy and reproducibility of results; and
•customer support infrastructure.
We believe that we are well positioned with respect to these competitive factors and expect to enhance our position through ongoing global expansion, innovative new product introductions and ongoing collaborations and partnerships with key opinion leaders. Intellectual Property Our core Simoa bead-based technology, directed to general methods and devices for single molecule detection, originated at Tufts University (Tufts), in the laboratory of Professor David Walt, who is the founder of Quanterix and a current member of our Board of Directors. Prof. Walt and his students pioneered the single molecule array technology, including technologies that enabled the detection of single enzyme labels in arrays of microwells, thereby facilitating the ultra-sensitive detection of proteins, nucleic acids, and cells. We have exclusively licensed from Tufts the relevant patent filings related to these technologies. (See "—“—License Agreement with Tufts University"University” below). In addition to licensed patents, we have developed our own portfolio of issued patents and patent applications directed to commercial products and technologies for potential development. Our portfolio also includes issued patents and patent applications acquired as part of our 2017 acquisition of Aushon Biosystems. We believe our proprietary platforms are a core strength of our business and our strategy includes the continued development of our patent portfolio. Our patent strategy is multilayered, providing coverage of aspects of the core technology as well as specific uses and applications, some of which are reflected in our current products and some of which are not. The first layer is based on protecting the fundamental methods for detecting single molecules independent of the specific analyte to be detected. The second layer covers embodiments of the core technology directed to the detection of specific analytes. The third layer protects novel instrumentation, consumables, and manufacturing processes used in applying the invention to certain commercial products or future product opportunities. The fourth layer is concerned with specific uses of the core technology (e.g., biomarkers and diagnostics). Our patent strategy is both offensive and defensive in nature; seeking to protect not only technology we currently practice but also alternative, related embodiments. Simoa and Related Technology As of MarchFebruary 1, 2019,2021, we had exclusively licensed 1718 patents and two patent applications from Tufts. These patents and patent applications include eightnine issued U.S. patents and two pending U.SU.S. patent applications, three granted European patents, three granted Japanese patents, two granted Canadian patents and one granted Australian patent. A first patent family licensed from Tufts is directed to methods for detecting single molecules. This patent family includes fivesix granted U.S. patents, twoone pending U.S. patent applications,application, three granted European patents (each nationalized and active in seven or eight countries), three granted Japanese patents, two granted Canadian patents and one granted Australian patent. The standard patent expiration date for U.S. patents in this family is February 16, 2027, and for the non-U.S. patents is February 20, 2027 or August 30, 2027. A second patent family licensed from Tufts is directed to methods for detecting the presence of target analytes in multiple samples. This patent family includes one granted U.S. patent. The standard patent expiration date for the U.S. patent in this family is August 22, 2025. A third patent family licensed from Tufts is directed to methods for analyzing analytes using a sensor system with cross-reactive elements. This patent family includes one granted U.S. patent. The standard patent expiration date for the U.S. patent in this family is March 14, 2021.
Table of Contents
A fourth patent family licensed from Tufts is directed to electro-optical systems including an array and a plurality of electrodes. This patent family includes one granted U.S. patent. The standard patent expiration date for the U.S. patent in this family is February 14, 2023. A fifth patent family licensed from Tufts is directed to methods for detecting short nucleic acids. This patent family includes one pending U.S. patent application. The standard patent expiration date for the U.S. patent in this family is May 29, 2039. As of MarchFebruary 1, 2019,2021, we owned 1924 issued U.S. patents and 1622 pending U.S. patent applications, three pending Patent Cooperation Treaty applications, eight granted European patents and sixthree pending European patent applications, eightnine granted Japanese patents, and one pending Japanese patent applications, four granted Chinese patents and twoone pending Chinese patent applications,application, five granted Canadian patents and twoone pending Canadian patent applications,application, one granted Australian patent, and fourtwo registered Hong Kong patent applications. A first patent family owned by us is directed to methods for determining a measure of the concentration of analyte molecules or particles in a fluid sample, and in particular to methods for analyte capture on beads, including multiplexing. This patent family includes threefour granted U.S. patents and onetwo pending U.S. patent application,applications, two granted European patent (nationalized and active in eight countries) and one pending European application, two granted Japanese patents, two granted Chinese patents, and one granted Canadian patent. The standard patent expiration date for the U.S. patents in this family is March 24, 2030, and for the non-U.S. patents is March 1, 2031. A second patent family owned by us is directed to methods and systems for determining a measure of the concentration of analyte molecules or particles in a fluid sample, and in particular to methods or systems for determining concentration based on either counting or measured intensity (extending the dynamic range). This patent family includes four granted U.S. patents and one pending U.S. patent application, one granted European patent (nationalized and active in seven countries), two granted Japanese patents, one granted Chinese patent, and one granted Canadian patent. The standard patent expiration date for the U.S. patents in this family is March 24, 2030, and for the non-U.S. patents is March 1, 2031. A third patent family owned by us is directed to methods for determining a measure of the concentration of analyte molecules or particles in a fluid sample, and in particular to methods for analyte capture on beads with or without dissociation. This patent family includes two granted U.S. patents. The standard patent expiration date for the U.S. patents in this family is September 28, 2028. A fourth patent family owned by us is directed to methods for determining a measure of the concentration of analyte molecules or particles in a fluid sample, and in particular to methods for determining concentration using multiple binding ligands for the same analyte molecule. This patent family includes one granted U.S. patent. The standard patent expiration date for the U.S. patent in this family is March 24, 2030. A fifth patent family owned by us is directed to instruments and consumables. This patent family includes one granted U.S. patent and one pending U.S. patent application, onetwo granted Japanese patent and one pending Japanese patent application,patents, one granted Chinese patent and twoone pending Chinese patent applications, threeone registered Hong Kong patent applicationsapplication and one pending patent application in each of Europe, and Canada. The standard patent expiration date for any U.S. patents that may issue from this family is February 25, 2031, and for any non-U.S. patents is January 27, 2032. A sixth patent family owned by us is directed to methods and materials for covalently associating a molecular species with a surface. This patent family includes onetwo pending U.S. patent application.applications. The standard patent expiration date for any U.S. patents that may issue from this family is May 9, 2034. A seventh patent family owned by us is directed to methods for improving the accuracy of capture based assays. This patent family includes one pending U.S. patent application. The standard patent expiration date for any U.S. patents that may issue from this family is January 13, 2036.
Table of Contents
An eighth patent family owned by us is directed to methods and systems for reducing and/or preventing signal decay. This patent family includes one pending Patent Cooperation TreatyU.S. patent application. If we pursue protection by filing any national stage applications, theThe standard patent expiration date for any U.S. patents that may issue from this family will be inis September 20, 2038. We own or co-own sevennine patent families directed to the measurement of particular types of analytes, including prostate specific antigen (PSA),b-amyloid β-amyloid peptide, tau protein, toxin B ofC. difficile, neurofilament light, glial fibrillary acidic protein, ubiquitin carboxyl-terminal hydrolase L1, and DNA or RNA molecules. These families include one granted U.S. patent directed to methods for determining treatment protocols and/or a prognosis of a patient’s recovery from a brain injury based on measurements of tau protein in blood and one granted European patent (nationalized and active in three countries) directed to detection of C. difficile. Any patents that may issue from these patent applications would have standard expiration dates between 2032 and 2039. With the acquisition of Aushon in January 2017, we acquired their patent portfolio for our planar array technology. As of MarchFebruary 1, 2019,2021, the acquired patent portfolio includes at least eightnine issued U.S. patents and fiveone pending U.S. patent applications,application, one granted Australian patent, three granted Canadian patents, and one pending Canadian patent application, fivefour granted European patents (each nationalized and active in between eight and 14 countries) and threeone pending European patent applications,application, three granted Japanese patents, and one registered Hong Kong patent application and one pending Patent Cooperation Treaty patent application.patent. We have licensed additional patents and patent applications from third parties. In addition to pursuing patents on our technology, we have taken steps to protect our intellectual property and proprietary technology by entering into confidentiality agreements and intellectual property assignment agreements with our employees, consultants, corporate partners and, when needed, our advisors. License Agreement with Tufts University In June 2007, as amended in April 2013, and August 2017, and September 2020, we entered into a license agreement with Tufts University, or Tufts, pursuant to which we obtained an exclusive, worldwide license to research, develop, commercialize, use, make, or have made, import or have imported, distribute or have distributed, offer or have offered, and sell or have sold products and services covered by patent rights to the Simoa bead-based technology owned by Tufts, as well as a non-exclusive license to related know-how. The rights licensed to us are for all fields of use and are sublicensable for a fee. Under the terms of the agreement, as amended, we paid a one-time, non-refundable upfront fee and issued Tufts shares of our common stock. In addition, in connection with the April 2013 amendment, we issued Tufts shares of our Series C-1 Preferred Stock.Stock, which converted into shares of our common stock in connection with our initial public offering. We are required to pay Tufts low single-digit royalties on all net sales of products and services that use the licensed technology, as well as a portion of any sublicensing revenues. We are also obligated to pay annual maintenance fees, which are fully creditable against any royalty payments made by us, and a milestone payment upon any sublicense by us. We were also required to reimburse Tufts for all patent prosecution cost incurred prior to the agreement and for all future patent prosecution costs. The term of the license agreement will continue on a country-by-country basis so long as there is a valid claim of a licensed patent in such country. Tufts may terminate the agreement or convert to a non-exclusive license in the event (1) we fail to pay any undisputed amount when required and fail to cure such non-payment within 60 days after receipt of notice from Tufts, (2) we are in breach of any material provision of the agreement and fail to remedy such breach within 60 days after receipt of notice from Tufts, (3) we do not demonstrate diligent efforts to develop a product incorporating the licensed technology, (4) we are found on five separate audits to have underpaid pursuant to the terms of the agreement, (5) we cease to carry on the business related to the licensed technology either directly or indirectly, or (6) we are adjudged insolvent, make an assignment for the benefit of creditors or have a petition in bankruptcy filed for or against us that is not removed within 60 days. We may
Table of Contents
terminate the agreement at any time upon at least 60 days'days’ written notice. Upon termination of the agreement, all rights revert to Tufts. Government Regulation OurOther than the COVID assays for which we have received EUAs, our products are currently intended for research use only or RUO,(RUO) applications, although our customers may use our products to develop their own products that are subject to regulation by the FDA.FDA or the Center for Medicare and Medicaid Services (CMS). Although most products intended for RUO are not currently subject to clearance or approval by the FDA, RUO products fall under the FDA's jurisdictionare subject to FDA’s premarket review requirements if they are useddetermined to be intended for use for clinical rather than research purposes. Consequently, our products (other than the COVID assays for which we have received EUAs) are labeled "For“For Research Use Only."”
On November 25, 2013, the FDA issued Final Guidance for Industry and Food and Drug Administration Staff on "Distribution“Distribution of In Vitro Diagnostic Products Labeled for Research Use Only or Investigational Use Only," or the RUO/Only” (RUO/IUO Guidance.Guidance). The purpose of an FDA guidance document is to provide the FDA'sFDA’s current thinking on when IVD products are properly labeled for RUO or for IUO, but as with all FDA guidance documents, this guidance does not establish legally enforceable responsibilities and should be viewed as recommendations unless specific regulatory or statutory requirements are cited. The RUO/IUO Guidance explains that the FDA will review the totality of the circumstances when evaluating whether equipment and testing components are properly labeled as RUO. Merely including a labeling statement that a product is intended for research use only will not necessarily exempt the device from the FDA'sFDA’s 510(k) clearance, premarket approval, or other requirements, if the circumstances surrounding the distribution of the product indicate that the manufacturer intends its product to be used for clinical diagnostic use. These circumstances may include written or verbal marketing claims or links to articles regarding a product'sproduct’s performance in clinical applications, a manufacturer'smanufacturer’s provision of technical support for clinical validation or clinical applications, or solicitation of business from clinical laboratories, all of which could be considered evidence of intended uses that conflict with RUO labeling. Although the RUO/IUO Guidance is a statement of the FDA'sFDA’s thinking with respect to certain RUOs and IUOs in 2013 and was not intended as a compliance requirement, we believe that our labeling and promotion of our products, including the custom assay RUO products developed by the Accelerator Laboratory, is consistent with the RUO/IUO Guidance because we have not promoted our products for clinical use in humans. We also are not promoting or using our products in the development or promotion of laboratory developed test or LDT,(LDT) services. When we develop products for clinical use, we will do so in accordance with FDA requirements applicable to those products at that time. Separately, when we become aware that accredited or licensed clinical laboratories may be using our RUO products either for research or clinical uses, such as part of LDT services, in accordance with the regulations that apply to clinical laboratories, we will continue to review the labeling and promotion of our products for consistency with the RUO/IUO Guidance. When our products are marketed for clinical diagnostic use, our products will be regulated by the FDA as medical devices. The FDA defines a medical device in part as an instrument, apparatus, implement, machine, contrivance, implant, in vitro reagent, or other similar or related article which is intended for the diagnosis of disease or other conditions or in the cure, mitigation, treatment, or prevention of disease in man. This means that the FDA will regulate the development, testing, manufacturing, marketing, post-market surveillance, distribution, advertising and labeling of our clinical products and we will be required to register as a medical device manufacturer and list our marketed products. The FDA classifies medical devices into one of three classes on the basis of the intended use of the device, the risk associated with the use of the device for that indication, as determined by the FDA, and on the controls deemed by the FDA to be necessary to reasonably ensure their safety and effectiveness. Class I devices, which have the lowest level of risk associated with them, are subject to general controls. Class II devices are subject to general controls and special controls, including
Table of Contents
performance standards. Class III devices, which have the highest level of risk associated with them, are subject to general controls and premarket approval. Most Class I devices and some Class II devices are exempt from a requirement that the manufacturer submit a premarket notification or 510(k),(510(k)) and receive clearance from the FDA which is otherwise a premarketing requirement for a Class II device. Class III devices may not be commercialized until a premarket approval application or PMA,(PMA) is submitted to and approved by the FDA. 510(k) Clearance Pathway To obtain 510(k) clearance, a sponsor must submit to the FDA a premarket notification demonstrating that the device is substantially equivalent or SE,(SE), to a device legally marketed in the U.S. for which a PMA was not required. The FDA is supposed to make a SE determination within 90 days of FDA'sFDA’s receipt of the 510(k), but it often takes longer if the FDA requests additional information. Most 510(k)s do not require supporting data from clinical trials, but the FDA may request such data. After a device receives 510(k) clearance, any modification that could significantly affect its safety or effectiveness, or that would constitute a major change in its intended use, will require a new clearance or possibly a pre-market approval. De Novo Classification Medical device types that the FDA has not previously classified as Class I, II or III are automatically classified into Class III regardless of the level of risk they pose. The Food and Drug Administration Modernization Act of 1997 established a new route to market for low to moderate risk medical devices that are automatically placed into Class III due to the absence of a predicate device, called the "Request“Request for Evaluation of Automatic Class III Designation,"” or the de novo classification procedure. This procedure allows a manufacturer whose novel device is automatically classified into Class III to request down-classification of its medical device into Class I or Class II on the basis that the device presents low or moderate risk, rather than requiring the submission and approval of a PMA application. Prior to the enactment of the Food and Drug Administration Safety and Innovation Act of 2012 or FDASIA,(FDASIA), a medical device could only be eligible for de novo classification if the manufacturer first submitted a 510(k) premarket notification and received a determination from the FDA that the device was not substantially equivalent. FDASIA streamlined the de novo classification pathway by permitting manufacturers to request de novo classification directly without first submitting a 510(k) premarket notification to the FDA and receiving a not substantially equivalent determination. Under FDASIA, the FDA is required to classify the device within 120 days following receipt of the de novo application. If the manufacturer seeks reclassification into Class II, the manufacturer must include a draft proposal for special controls that are necessary to provide a reasonable assurance of the safety and effectiveness of the medical device. In addition, the FDA may reject the reclassification petition if it identifies a legally marketed predicate device that would be appropriate for a 510(k) or determines that the device is not low to moderate risk or that general controls would be inadequate to control the risks and special controls cannot be developed. Premarket Approval Pathway A PMA must be submitted if a new device cannot be cleared through the 510(k) process. The PMA process is generally more complex, costly and time consuming than the 510(k) process. A PMA must be supported by extensive data including, but not limited to, technical, preclinical, clinical trials, manufacturing and labeling to demonstrate to the FDA'sFDA’s satisfaction the safety and effectiveness of the device for its intended use. After a PMA is sufficiently complete, the FDA will accept the application for filing and begin an in-depth review of the submitted information. By statute, the FDA has 180 days to review the accepted application, although review of the application generally can take between one
Table of Contents
and three years. During this review period, the FDA may request additional information or clarification of information already provided. Also, during the review period, an advisory panel of experts from outside the FDA may be convened to review and evaluate the application and provide recommendations to the FDA as to the approvability of the device. Although the FDA is not bound by the advisory panel decision, the panel'spanel’s recommendations are important to the FDA'sFDA’s overall decision making process. In addition, the FDA will conduct a preapproval inspection of the manufacturing facility to ensure compliance with its quality system regulations or QSRs.(QSRs). New premarket approval applications or premarket approval application supplements are also required for product modifications that affect the safety and efficacy of the device. Emergency Use Authorization
In emergency situations, such as a pandemic, the FDA has the authority to allow unapproved medical products or unapproved uses of cleared or approved medical products to be used in an emergency to diagnose, treat or prevent serious or life-threatening diseases or conditions caused by chemical, biological, radiological or nuclear warfare threat agents when there are no adequate, approved, and available alternatives. Under this authority, the FDA may issue an EUA for an unapproved device if the following four statutory criteria have been met: (1) a serious or life-threatening condition exists; (2) evidence of effectiveness of the device exists; (3) a risk-benefit analysis shows that the benefits of the product outweigh the risks; and (4) no other alternatives exist for diagnosing, preventing or treating the disease or condition. Evidence of effectiveness includes medical devices that “may be effective” to prevent, diagnose, or treat the disease or condition identified in a declaration of emergency issued by the Secretary of the Department of Health and Human Services (HHS). The “may be effective” standard for EUAs requires a lower level of evidence than the “effectiveness” standard that FDA uses for product clearances or approvals in non-emergency situations. The FDA assesses the potential effectiveness of a possible EUA product on a case-by-case basis using a risk-benefit analysis. In determining whether the known and potential benefits of the product outweigh the known and potential risks, the FDA examines the totality of the scientific evidence to make an overall risk-benefit determination. Such evidence, which could arise from a variety of sources, may include (but is not limited to) results of domestic and foreign clinical trials, in vivo efficacy data from animal models, in vitro data, as well as the quality and quantity of the available evidence. Once granted, an EUA will remain in effect and generally terminate on the earlier of (1) the determination by the Secretary of HHS that the public health emergency has ceased or (2) a change in the approval status of the product such that the authorized use(s) of the product are no longer unapproved. After the EUA is no longer valid, the product is no longer considered to be legally marketed and one of the FDA’s non-emergency premarket pathways would be necessary to resume or continue distribution of the subject product. The FDA also may revise or revoke an EUA if the circumstances justifying its issuance no longer exist, the criteria for its issuance are no longer met, or other circumstances make a revision or revocation appropriate to protect the public health or safety. On January 31, 2020, the Secretary of HHS issued a declaration of a public health emergency related to COVID-19. On February 4, 2020, HHS determined that COVID-19 represents a public health emergency that has a significant potential to affect national security or the health and security of U.S. citizens living abroad and, subsequently, declared on March 24, 2020, that circumstances exist to justify the authorization of emergency use of medical devices, including alternative products used as medical devices, during the COVID-19 pandemic, subject to the terms of any authorization as issued by the FDA.On February 29, 2020, the FDA issued an immediately in effect guidance with policy specific to development of IVD tests during the COVID-19 public health emergency. This guidance was updated on March 16, 2020, May 4, 2020 and May 11, 2020. Clinical Trials Clinical trials are usually required to support a PMA and are sometimes required for a 510(k). In the U.S., if the device is determined to present a "significant“significant risk,"” the manufacturer may not begin a clinical trial until it submits an investigational device exemption application or IDE,(IDE) and obtains approval of the IDE from the FDA. These clinical trials are also subject to the review, approval and oversight of an institutional review board or IRB,(IRB) at each clinical trial site. The clinical trials must be conducted in accordance with the FDA'sFDA’s IDE regulations and good clinical practices. A clinical trial may be suspended by FDA, the sponsor or an IRB at its institution at any time for various reasons, including a belief that the risks to the study participants outweigh the benefits of participation in the trial. Even if a clinical trial is completed, the results may not demonstrate the safety and efficacy of a device to the satisfaction of the FDA, or may be equivocal or otherwise not be sufficient to obtain approval of a device. FDA Enforcement After a medical device is placed on the market, numerous regulatory requirements apply. These include among other things: •establishment registration and device listing;
•the QSR, which requires manufacturers, including third-party manufacturers, to follow stringent design, testing, control, documentation and other quality assurance procedures during all aspects of the manufacturing process;
•labeling regulations and the FDA prohibitions against the promotion of products for uncleared, unapproved or "off-label" uses and other requirements related to promotional activities;
•medical device reporting regulations, which require that manufacture's report to the FDA if their device may have caused or contributed to a death or serious injury, or if their device malfunctioned and the device or a similar device marketed by the manufacturer would be likely to cause or contribute to a death or serious injury if the malfunction were to recur;
•corrections and removal reporting regulations, which require that manufacture's report to the FDA field corrections or removals if undertaken to reduce a risk to health posed by a device or to remedy a violation of the Federal Food, Drug, and Cosmetics Act that may present a risk to health; and
•post market surveillance regulations, which apply to certain Class II or III devices when necessary to protect the public health or to provide additional safety and effectiveness data for the device.
| ● | establishment registration and device listing; |
| ● | the QSR, which requires manufacturers, including third-party manufacturers, to follow stringent design, testing, control, documentation and other quality assurance procedures during all aspects of the manufacturing process; |
| ● | labeling regulations and the FDA prohibitions against the promotion of products for uncleared, unapproved or “off-label” uses and other requirements related to promotional activities; |
| ● | medical device reporting regulations, which require that manufacturers report to the FDA if their device may have caused or contributed to a death or serious injury, or if their device malfunctioned and the device or a similar device marketed by the manufacturer would be likely to cause or contribute to a death or serious injury if the malfunction were to recur; |
| ● | corrections and removal reporting regulations, which require that manufacture’s report to the FDA field corrections or removals if undertaken to reduce a risk to health posed by a device or to remedy a violation of the Federal Food, Drug, and Cosmetics Act that may present a risk to health; and |
| ● | post market surveillance regulations, which apply to certain Class II or III devices when necessary to protect the public health or to provide additional safety and effectiveness data for the device. |
To ensure compliance with regulatory requirements, medical device manufacturers are subject to market surveillance and periodic, pre-scheduled and unannounced inspections by the FDA. Failure to comply with applicable regulatory requirements can result in enforcement action by the FDA, which
Table of Contents
may include sanctions, including but not limited to, warning letters; fines, injunctions, consent decrees and civil penalties; recall or seizure of the device; operating restrictions, partial suspension or total shutdown of production; refusal to grant 510(k) clearance or PMA approvals of new devices; withdrawal of 510(k) clearance or PMA approvals; and civil or criminal prosecution. Clinical Laboratory Improvement Amendments of 1988, Regulation of LDTs and State Regulation Since our acquisition of Aushon Biosystems, Inc. in January 2018, we own and operate a CLIA certified laboratory. The Clinical Laboratory Improvement Amendments of 1988 (CLIA) are federal regulatory standards that apply to all clinical laboratory testing performed on humans in the United States (with the exception of clinical trials and basic research). A clinical laboratory is defined by CLIA as any facility that performs laboratory testing on specimens obtained from humans for the purpose of providing information for health assessment and for the diagnosis, prevention, or treatment of disease. CLIA requires such laboratories to be certified by the federal government and mandates compliance with various operational, personnel, facilities administration, quality and proficiency testing requirements intended to ensure that testing services are accurate, reliable and timely. CLIA certification also is a prerequisite to be eligible to bill state and federal health care programs, as well as many private insurers, for laboratory testing services. In addition, CLIA requires certified laboratories to enroll in an approved proficiency testing program if performing testing in any category for which proficiency testing is required. If a laboratory fails to achieve a passing score on a proficiency test, then it loses its right to perform testing. As a condition of CLIA certification, laboratories are subject to survey and inspection every other year, in addition to being subject to additional random inspections. The biennial survey is conducted by the Centers for Medicare & Medicaid Services ("CMS"(“CMS”), a CMS agent (typically a state agency), or, a CMS-approved accreditation organization. High complexity, CLIA-certified laboratories, such as ours, frequently develop testing procedures to provide diagnostic results to customers. These tests have been traditionally offered by nearly all complex laboratories for the last few decades as Laboratory Developed Tests, or LDTs, which are subject to CMS oversight through its enforcement of CLIA. The FDA also has claimed that it has regulatory authority over LDTs, but has not exercised enforcement with respect to most LDTs offered by high complexity laboratories, and not sought to require these laboratories to comply with FDA regulations regarding medical devices. During 2010, the FDA publicly announced that it had decided to exercise regulatory authority over these LDTs, and that it planned to issue guidance to the industry regarding its regulatory approach. At that time, the FDA indicated that it would use a risk-based approach to regulation and would direct more resources to tests with wider distribution and with the highest risk of injury, but that it would be sensitive to the need to not adversely impact patient care or innovation. In September 2014, the FDA announced its framework and timetable for implementing this guidance. On November 18, 2016, the FDA announced it would not release final guidance at that time and instead would continue to work with stakeholders, the new administration and Congress to determine the right approach. On January 3, 2017, the FDA released a discussion paper outlining a possible risk-based approach for FDA and CMS oversight of LDTs. Later in 2017, the FDA indicated that Congress should enact legislation to address improved oversight of diagnostics, including LTDs, rather than the FDA addressing the issue through administrative proposals. We cannot predict the ultimate timing or form of any such guidance or regulation or their potential impact. If adopted, such a regulatory approach by the FDA may lead to an increased regulatory burden, including additional costs and delays in introducing new tests. While the ultimate impact of the FDA'sFDA’s approach is unknown, it may be extensive and may result in significant change. In addition, some states require that any laboratory be licensed by the appropriate state agency in the state in which it operates. Laboratories must also hold state licenses or permits, as applicable, from
Table of Contents
various states including, but not limited to, California, Florida, New York, Pennsylvania, Rhode Island and Maryland, to the extent that they accept specimens from one or more of these states, each of which requires out-of-state laboratories to obtain licensure. If a laboratory is out of compliance with state laws or regulations governing licensed laboratories or with CLIA, it may be subject to enforcement actions that may include suspension, limitation or revocation of the license or CLIA certificate, assessment of financial penalties or fines, or imprisonment. Loss of a laboratory'slaboratory’s CLIA certificate or state license may also result in the inability to receive payments from state and federal health care programs as well as private third party payors. If, in the future, we perform clinical diagnostic testing, we would also become subject to the Health Insurance Portability and Accountability Act of 1996 or HIPAA,(HIPAA), as well as additional federal and state laws that impose a variety of fraud and abuse prohibitions on healthcare providers, including clinical laboratories. Europe/Rest of World Government Regulation Whether or not we obtain FDA approval for a product, we must obtain the requisite approvals from regulatory authorities in non-U.S. countries prior to the commencement of clinical trials or marketing of our product for clinical diagnostic use in those countries. The regulations in other jurisdictions vary from those in the U.S. and may be easier or more difficult to satisfy and are subject to change. For example, the European Union or EU,(the EU) recently published new regulations that will result in greater regulation of medical devices and IVDs. TheThis new IVD Regulationregulation (new IVD Regulation) is significantly different from the IVD DirectiveEuropean directive for In vitro diagnostic products (IVD Directive) that it replaces in that it will ensure that the new requirements apply uniformly and on the same schedule across the member states, include a risk-based classification system and increase the requirements for conformity assessment. The conformity assessment process resultsCE registration for Uman’s Nf-L ELISA assay kit was approved in March 2014 under the receiptIVD Directive. Under the IVD Directive the assay is classified as a general IVD product, class I and required self-certification with no involvement of a CE designationnotified body/authority. Under the new IVD Regulation, which has been sufficientmust be fully implemented by May 2022, the requirements increase and involve assessment by a notified body. Uman’s Nf-L ELISA assay kit is classified as class B product. The new requirements include an ISO 13485 certification of the quality system (which Uman received July 2018) and increased technical evidence and follow-up of performance of the specific product (e.g. clinical evidence and post-market activities). The work to begin marketing many types of IVDs. That processmeet the new technical requirements is on-going. An internal GAP-analysis is to be performed and work to eliminate the GAPs performed. When completed, the available technical documentation will become more difficultbe assessed by an external consultant. When all requirements are met, a notified body will be contracted and costly to complete.the certification initiated. Other Governmental Regulation We are subject to laws and regulations related to the protection of the environment, the health and safety of employees and the handling, transportation and disposal of medical specimens, infectious and hazardous waste and radioactive materials. For example, the U.S. Occupational Safety and Health Administration or OSHA,(OSHA), has established extensive requirements relating specifically to workplace safety for healthcare employers in the U.S. This includes requirements to develop and implement multi-faceted programs to protect workers from exposure to blood-borne pathogens, including preventing or minimizing any exposure through needle stick injuries. For purposes of transportation, some biological materials and laboratory supplies are classified as hazardous materials and are subject to regulation by one or more of the following agencies: the U.S. Department of Transportation, the U.S. Public Health Service, the United States Postal Service and the International Air Transport Association. We generally use third-party vendors to dispose of regulated medical waste, hazardous waste and radioactive materials that we may use during our research. Employees and Human Capital As of December 31, 2018,2020, we had 177314 full-time employees, of which 78118 work in sales, sales support, field service, and marketing, 3874 work in engineering and research and development, 3672 work in manufacturing and operations and 2550 work in general and administrative. As of December 31, 2018, ofadministration. Of our 177314 full-time employees, 160273 were located in the United States and 1741 were employed outside the United States.located in ten foreign countries. None of our employees isare represented by a labor union or is subject to a collective bargaining agreement.
Historically, we have experienced a turnover rate that is lower than the industry average and attribute that to our unique culture that stresses the impact our work has on the eradication of human diseases including Alzheimer’s, cancer and COVID. We invest in creating a diverse, inclusive and safe work environment where our employees can deliver their workplace best every day. Our success depends upon our ability to attract and retain highly qualified management and technical employees. Talent management is critical to our ability to execute our long-term growth strategy, including providing career growth, on-the-job learning opportunities and competitive compensation. We are committed to an inclusive culture which values equality, opportunity and respect. In support of our inclusive culture, we sponsor an internal Diversity, Equity and Inclusion Committee comprised of employees and executives, provide respectful workplace training to strengthen employee understanding and consciously strive to recruit a diverse talent pool across all levels of the organization. As of December 31, 2020, approximately 45% of our employees were women and approximately 30% were non-white. We are focused on the engagement and empowerment of our employees through the demonstration of our foundational values, which we refer to as AT&T3: Accountability, Trust, Teamwork and Transparency. Workforce Compensation and Pay Equity We provide robust compensation and benefits programs to help meet the needs of our employees. We provide our full-time employees with highly competitive salaries, as well a bonus and/or commission plan, a matching 401(k) Plan, healthcare and insurance benefits, paid time off and family leave. We also provide all of our employees with targeted equity-based grants with vesting conditions designed to facilitate retention through the opportunity to benefit financially from our growth and profitability. Company Culture
We expect all of our employees and contractors to observe the highest levels of business ethics, integrity, mutual respect, tolerance and inclusivity. Our employee handbook and Corporate Code of Conduct and Ethics set forth policies reflecting these values and also provides direction for registering complaints in the event of any violation of our policies. An “open door” policy is maintained at all levels of the organization and any form of retaliation against an employee is strictly prohibited. Employee Engagement and Wellness The success of our business is fundamentally connected to the physical and mental well-being of our people. Accordingly, we are committed to the health, safety and wellness of our employees and contractors. We provide our employees with a wide range of benefits, including benefits directed to their health, safety and long-term financial security. In response to the COVID-19 pandemic, we have implemented significant changes that we determined were in the best interest of our employees, as well as the communities in which we operate, and which comply with government regulations. This includes allowing our employees to work remotely as appropriate, while implementing significant safety measures designed to protect the health of all those working in and entering our facilities. Corporate Information We were incorporated under the laws of the State of Delaware in April 2007 under the name "Digital“Digital Genomics, Inc."” In August 2007, we changed our name to "Quanterix“Quanterix Corporation."” Our principal executive offices are located at 113 Hartwell Avenue, Lexington,900 Middlesex Turnpike, Billerica, Massachusetts 02421,01821, and our telephone number is (617) 301-9400. We expect to relocate our principal executive offices in the second quarter of 2019 to 900 Middlesex Turnpike, Billerica, Massachusetts 01821. Information Available on the Internet Our Internet website address iswww.quanterix.com. The information contained on, or that can be accessed through, our website is not a part of or incorporated by reference in this Annual Report on Form 10-K. We have included our website address in this Annual Report on Form 10-K solely as an inactive textual reference. We make available free of charge through our website our Annual Report on Form 10-K, Quarterly Reports on Form 10-Q, Current Reports on Form 8-K and amendments to those reports filed or furnished pursuant to Sections 13(a) and 15(d) of the Securities Exchange Act of 1934, as amdended, or the Exchange Act.amended (Exchange Act). We make these reports available through the "Investors—“Investors—Financial Information—SEC Filings"Filings” section of our website as soon as reasonably practicable after we electronically file such reports with, or furnish such reports to, the SEC. We also make available, free of charge on our website, the reports filed with the SEC by our executive officers, directors and 10% stockholders pursuant to Section 16 under the Exchange Act as soon as reasonably practicable after copies of those filings are provided to us by those persons. You can also review our electronically filed reports and other information that we file with the SEC on the SEC'sSEC’s website athttp://www.sec.gov. Item 1A. RISK FACTORS
The following risk factors and other information included in this Annual Report on Form 10-K should be carefully considered. The risks and uncertainties described below are not the only ones we face. Additional risks and uncertainties not presently known to us or that we presently deem less significant may also impair our business operations. Please see page ii of this Annual Report on Form 10-K for a discussion of some of the forward-looking statements that are qualified by these risk factors. If any of the following risks occur, our business, financial condition, results of operations and future growth prospects could be materially and adversely affected. Risk Factor Summary Our business is subject to numerous risks and uncertainties. The following summary highlights some of the risks you should consider with respect to our business and prospects. This summary is not complete and the risks summarized below are not the only risks we face. You should review and carefully consider the risks and uncertainties described in more detail below, which includes a more complete discussion of these risks. | ● | We have incurred annual losses since we were formed and expect to incur losses in the future. We cannot be certain that we will achieve or sustain profitability. | |
| ● | Our quarterly and annual operating results and cash flows have fluctuated in the past and might continue to fluctuate, causing the value of our common stock to decline substantially. | |
| ● | We are an early, commercial-stage company and have a limited commercial history, which may make it difficult to evaluate our current business and predict our future performance. | |
| ● | If our products fail to achieve and sustain sufficient market acceptance, our revenue will be adversely affected. | |
| ● | Sales of our assay for the neurological biomarker Nf-L have become increasingly important to our business, and any significant decrease in sales of that assay could have a material adverse effect on our business. | |
| ● | We are subject to extensive regulatory requirements in connection with the EUAs that we have received from the FDA for our COVID-19 antibody and antigen tests. If we fail to comply with these requirements, or if the FDA otherwise determines that the conditions no longer warrant such authorization, we will be unable to market these products pursuant to this authorization and our business may be harmed. | |
| ● | The termination of an EUA, the failure of our tests to gain market acceptance or our inability to match advances in competing products for COVID-19 could adversely impact our business. | |
| ● | Epidemic diseases, such as COVID-19, could negatively affect various aspects of our business, make it more difficult to meet our obligations to our customers, and result in reduced demand from our customers, which could have a material adverse effect on our business, financial condition, results of operations, or cash flows. | |
| ● | Release of the remaining funding under the contract with the NIH under the RADx program is based on the achievement of certain milestones, and there is no assurance that we can meet all of the milestones on a timely basis, if at all. | |
| ● | Our long-term results depend upon our ability to improve existing products and introduce and market new products successfully. | |
| ● | Undetected errors or defects in our products could harm our reputation, decrease market acceptance of our products or expose us to product liability claims. | |
| ● | We may seek to enter into strategic collaborations and licensing arrangements with third parties, but we may not be successful in establishing or maintaining such arrangements. | |
| ● | We expect to generate a substantial portion of our revenue internationally in the future and can become further subject to various risks relating to our international activities, which could adversely affect our business, operating results and financial condition. | |
| ● | We have limited experience in marketing and selling our products, and if we are unable to successfully commercialize our products, our business and operating results will be adversely affected. | |
| ● | We may experience manufacturing problems or delays, or backlogs in deliveries, that could limit the growth of our revenue or increase our losses. | |
| ● | We rely on a single contract manufacturer to manufacture and supply our Simoa HD instruments and rely on a different single contract manufacturer to manufacture and supply our Simoa SR-X. If either of these manufacturers should fail or not perform satisfactorily, our ability to supply these instruments would be negatively and adversely affected. | |
| ● | If the FDA determines that our products are medical devices or if we seek to market our products for clinical diagnostic or health screening use, we will be required to obtain regulatory clearance(s) or approval(s) and may be required to cease or limit sales of our then marketed products, which could materially and adversely affect our business, financial condition and results of operations. Any such regulatory process would be expensive, time-consuming and uncertain both in timing and in outcome. | |
| ● | If we do not comply with governmental regulations applicable to our CLIA-certified laboratory, we may not be able to continue our operations. | |
| ● | If we are unable to protect our intellectual property, it may reduce our ability to maintain any technological or competitive advantage over our competitors and potential competitors, and our business may be harmed. | |
| ● | The measures that we use to protect the security of our intellectual property and other proprietary rights may not be adequate, which could result in the loss of legal protection for, and thereby diminish the value of, such intellectual property and other rights. | |
| ● | If we or any of our partners are sued for infringing intellectual property rights of third parties, it would be costly and time-consuming, and an unfavorable outcome in that litigation could have a material adverse effect on our business. | |
Risks Related to Our Financial Condition and Need for Additional Capital We have incurred annual losses since we were formed and expect to incur losses in the future. We cannot be certain that we will achieve or sustain profitability. We incurred net losses of $31.5 million, $27.0$40.8 million and $23.2$31.5 million for the years ended December 31, 2018, 20172020, 2019, and 2016,2018, respectively. As of December 31, 2018,2020, we had an accumulated deficit of $175.9$247.8 million. We cannot predict if we will achieve sustained profitability in the near future or at all. We expect that our losses will continue at least through the next 24 months as we plan to invest significant additional funds toward expansion of our commercial organization and the development of our technology and related assays.technology. In addition, as a public company, we will incur significant legal, accounting, and other expenses that we didwould not incur as a private company. These increased expenses will make it harder for us to achieve and sustain future profitability. We may incur significant losses in the future for a number of reasons, many of which are beyond our control, including the other risks described in this Annual Report on Form 10-K, the market acceptance of our products, future product development and our market penetration and margins. Our quarterly and annual operating results and cash flows have fluctuated in the past and might continue to fluctuate, causing the value of our common stock to decline substantially. Numerous factors, many of which are outside our control, may cause or contribute to significant fluctuations in our quarterly and annual operating results. These fluctuations may make financial planning and forecasting difficult. In addition, these fluctuations may result in unanticipated decreases in our available cash, which could negatively affect our business and prospects. In addition, one or more of such factors may cause our revenue or operating expenses in one period to be disproportionately higher or lower relative to the others. As a result, comparing our operating results on a period-to-period basis might not be meaningful. You should not rely on our past results as indicative of our future performance. Moreover, our stock price might be based on expectations of future performance that are unrealistic or that we might not meet and, if our revenue or operating results fall below the expectations of investors or securities analysts, the price of our common stock could decline substantially. Our operating results have varied in the past. In addition to other risk factors listed in this section, some of the important factors that may cause fluctuations in our quarterly and annual operating results include: •adoption of our Simoa technology platforms and products by customers;
•the timing of customer orders to purchase our Simoa instruments;
•the rate of utilization of consumables by our customers;
•receipt and timing of revenue for services provided in our Simoa Accelerator Laboratory;
•the timing of the introduction of new products, product enhancements and services; and
•the receipt and timing of revenue from collaborations.
| ● | adoption of our Simoa technology platforms and products by customers; |
| ● | the timing of customer orders to purchase our products and services; |
| ● | the rate of utilization of consumables by our customers; |
| ● | receipt and timing of revenue for services provided in our Simoa Accelerator Laboratory; |
| ● | the timing of the introduction of new products, product enhancements and services; and |
| ● | the receipt and timing of revenue from collaborations, if any. |
In addition, a significant portion of our operating expenses is relatively fixed in nature, and planned expenditures are based in part on expectations regarding future revenue. Accordingly, unexpected revenue shortfalls might decrease our gross margins and could cause significant changes in our operating results from quarter to quarter. If this occurs, the trading price of our common stock could fall substantially. We are an early, commercial-stage company and have a limited commercial history, which may make it difficult to evaluate our current business and predict our future performance.
We are an early, commercial-stage company and have a limited commercial history. Our revenues are derived from sales of our instruments, consumables and services, which are all based on our Simoa technology. We commercially launched our first Simoa instrument and consumables in 2014. Our limited commercial history may make it difficult to evaluate our current business and make predictions about our future success or viability subject to significant uncertainty. We will continue to encounter risks and difficulties frequently experienced by early, commercial-stage companies, including scaling up our infrastructure and headcount. If we do not address these risks successfully, our business will suffer.
If we are unable to maintain adequate revenue growth or do not successfully manage such growth, our business and growth prospects will be harmed. We have experienced significant revenue growth in a short period of time. We may not achieve similar growth rates in future periods. Investors should not rely on our operating results for any prior periods as an indication of our future operating performance. To effectively manage our anticipated future growth, we must continue to maintain and enhance our financial, accounting, manufacturing, customer support and sales administration systems, processes and controls. Failure to effectively
Table of Contents
manage our anticipated growth could lead us to over-invest or under-invest in development, operational, and administrative infrastructure; result in weaknesses in our infrastructure, systems, or controls; give rise to operational mistakes, losses, loss of customers, productivity or business opportunities; and result in loss of employees and reduced productivity of remaining employees. Our continued growth could require significant capital expenditures and might divert financial resources from other projects such as the development of new products and services. As additional products are commercialized, we may need to incorporate new equipment, implement new technology systems, or hire new personnel with different qualifications. Failure to manage this growth or transition could result in turnaround time delays, higher product costs, declining product quality, deteriorating customer service, and slower responses to competitive challenges. A failure in any one of these areas could make it difficult for us to meet market expectations for our products, and could damage our reputation and the prospects for our business. If our management is unable to effectively manage our anticipated growth, our expenses may increase more than expected, our revenue could decline or grow more slowly than expected and we may be unable to implement our business strategy. In addition, the quality of our products and services may suffer, which could negatively affect our reputation and harm our ability to retain and attract customers. Our future capital needs are uncertain and we may need to raise additional funds in the future. We believe that our existing cash and cash equivalents as of December 31, 2018,2020, together with our cash generated from commercial sales, will enable us to fund our operating expenses and capital expenditure requirements for at least the next 24 months. However, we may need to raise substantial additional capital to: •expand our sales and marketing efforts to further commercialize our products;
•strategically acquire companies or technologies that may be complementary to our business;
•expand our research and development efforts to improve our existing products and develop and launch new products, particularly if any of our products are deemed by the United States Food and Drug Administration, or FDA, to be medical devices or otherwise subject to additional regulation by the FDA;
•seek premarket approval, or PMA, or 510(k) clearance from the FDA for our existing products or new products if or when we decide to market products for use in the prevention, diagnosis or treatment of a disease or other condition (see "Risk Factors—If the FDA determines that our products are medical devices or if we seek to market our products for clinical diagnostic or health screening use, we will be required to obtain regulatory clearance(s) or approval(s), and may be required to cease or limit sales of our then marketed products, which could materially and adversely affect our business, financial condition and results of operations. Any such regulatory process would be expensive, time-consuming and uncertain both in timing and in outcome." and "Business—Government Regulation" for further information about the FDA approvals that we may be required to seek and obtain in that circumstance);
•build out our new facility as we continue to grow our employee headcount;
•hire additional personnel;
•enter into collaboration arrangements, if any, or in-license other products and technologies;
•add operational, financial and management information systems; and
•incur increased costs as a result of operating as a public company.
| ● | expand our sales and marketing efforts to further commercialize our products; |
| ● | strategically acquire companies or technologies that may be complementary to our business; |
| ● | expand our research and development efforts to improve our existing products and develop and launch new products, particularly if any of our products are deemed by the FDA to be medical devices or otherwise subject to additional regulation by the FDA; |
| ● | seek PMA or 510(k) clearance from the FDA for our existing products or new products if or when we decide to market products for use in the prevention, diagnosis or treatment of a disease or other condition (see “Risk Factors—If the FDA determines that our products are medical devices or if we seek to market our products for clinical diagnostic or health screening use, we will be required to obtain regulatory clearance(s) or approval(s) and may be required to cease or limit sales of our then marketed products, which could materially and adversely affect our business, financial condition and results of operations. Any such regulatory process would be expensive, time-consuming and uncertain both in timing and in outcome.” and “Business—Government Regulation” for further information about the FDA approvals that we may be required to seek and obtain in that circumstance); |
| ● | hire additional personnel and continue to expand our employee headcount; |
| ● | enter into collaboration arrangements, if any, or in-license other products and technologies; |
| ● | add operational, financial and management information systems; and |
| ● | continue to incur increased costs as a result of operating as a public company. |
Table of Contents
Our future funding requirements will depend on many factors, including: • | ● | market acceptance of our products; |
| ● | the cost and timing of establishing additional sales, marketing and distribution capabilities; |
| ● | the cost of our research and development activities; |
| ● | our ability to enter into collaborations in the future, and the success of any such collaborations; |
| ● | the cost and timing of potential regulatory clearances or approvals that may be required in the future for our products; and |
| ● | the effect of competing technological and market developments. |
We cannot assure you that we will be able to obtain additional funds on acceptable terms, or at all. If we raise additional funds by issuing equity or equity-linked securities, our stockholders may experience dilution. Future debt financing, if available, may involve covenants restricting our operations or our ability to incur additional debt. Any debt or equity financing may contain terms that are not favorable to us or our stockholders. If we raise additional funds through collaboration and licensing arrangements with third parties, it may be necessary to relinquish some rights to our technologies or our products, or grant licenses on terms that are not favorable to us. If we do not have, or are not able to obtain, sufficient funds, we may have to delay development or commercialization of our products. We also may have to reduce marketing, customer support or other resources devoted to our products or cease operations. Any of these factors could have a material adverse effect on our financial condition, operating results and business. Our ability to use net operating losses to offset future income may be subject to certain limitations. As of December 31, 2018,2020, we had federal net operating loss carry forwards, or NOLs,(NOLs) carryforwards to offset future taxable income of approximately $136.8$199.3 million, which begin to expire in 2026,2021, if not utilized. A lack of future taxable income would adversely affect our ability to utilize these NOLs. In addition, under Section 382 of the Internal Revenue Code of 1986, as amended or the Code,(the Code), a corporation that undergoes an "ownership change"“ownership change” is subject to limitations on its ability to utilize its NOLs to offset future taxable income. We have already experienced one or more ownership changes as defined under Section 382 of the Code. Depending on the timing of any future utilization of our NOLs, we may be limited as to the amount that can be utilized each year as a result of such previous ownership changes. In addition, future changes in our stock ownership, including changes that may be outside of our control, could result in additional ownership changes under Section 382 of the Code. Our NOLs may also be impaired under similar provisions of state law. We have recorded a full valuation allowance related to our NOLs and other deferred tax assets due to the uncertainty of the ultimate realization of the future benefits of those assets. U.S. taxation of international business activities or the adoption of tax reform policies could materially impact our future financial position and results of operations. Limitations on the ability of taxpayers to claim and utilize foreign tax credits and the deferral of certain tax deductions until earnings outside of the United States are repatriated to the United States, as well as changes to U.S. tax laws that may be enacted in the future, could impact the tax treatment of future foreign earnings. Should the scale of our international business activities expand, any changes in the U.S. taxation of such activities could increase our worldwide effective tax rate and harm our future financial position and results of operations.
Table of Contents
Provisions of our secured term loan facility with Hercules Capital, Inc. may restrict our ability to pursue our business strategies. In addition, repayment of our outstanding debt and other obligations under our secured term loan facility with Hercules is subject to acceleration upon the occurrence of an event of default, which would have a material adverse effect on our business, financial condition and results of operations.
Our secured term loan facility with Hercules Capital, Inc., or Hercules, requires us, and any debt instruments we may enter into in the future may require us, to comply with various covenants that limit our ability to take on new indebtedness, to permit new liens, to pay dividends, to dispose of our property (including to license in certain situations), to engage in mergers or acquisitions and make certain other changes in our business. Debt instruments we may enter into in the future may also include financial covenants such as a requirement to maintain a specified minimum liquidity level or achieve a minimum annual revenue level. These restrictions could inhibit our ability to pursue our business strategies, including our ability to raise additional capital and make certain dispositions or investments without the consent of our lenders.
The obligations under our secured term loan facility with Hercules are subject to acceleration upon the occurrence of specified events of default, including our failure to make payments when due, our breach or default in the performance of our covenants and obligations under the facility following a cure period, bankruptcy and similar events, and the occurrence of a circumstance that would reasonably be expected to have a material adverse effect on (i) our business, operations, properties, assets or financial condition, (ii) our ability to perform our obligations in accordance with the facility documents, (iii) the lender's ability to enforce any of its rights or remedies with respect to our obligations, or (iv) the collateral, the liens on the collateral or the first priority of the lender's liens. While we do not believe it is probable that the lender would accelerate the obligations under the facility, the definition of a material adverse effect is inherently subjective in nature, and we cannot assure that a material adverse effect will not occur or be deemed to have occurred by the lender.
Risks Related to Our Business If our products fail to achieve and sustain sufficient market acceptance, our revenue will be adversely affected. Our success depends on our ability to develop and market products that are recognized and accepted as reliable, enabling and cost-effective. Most of the potential customers for our products already use expensive research systems in their laboratories that they have used for many years and may be reluctant to replace those systems with ours. MarketContinued market acceptance of our Simoa technology platforms will depend on many factors, including our ability to convince potential customers that our technology is an attractive alternative to other available technologies. Compared to some competing technologies, our Simoa technology is new and complex, and many potential customers have limited knowledge of, or experience with, our products. Prior to adopting our systems, some potential customers may need to devote time and effort to testing and validating our systems. Any failure of our systems to meet these customer benchmarks could result in potential customers choosing to retain their existing systems or to purchase systems other than ours. In addition, it is important that our Simoa technology be perceived as accurate and reliable by the scientific and medical research community as a whole. Historically, a significant part of our sales and marketing efforts has been directed at demonstrating the advantages of our technology to industry leaders and encouraging such leaders to publish or present the results of their evaluation of our system. If we are unable to continue to motivate leading researchers to use Simoa technology, or if such researchers are unable to achieve or unwilling to publish or present significant experimental results using our systems, acceptance and adoption of our systems may be slowed and our ability to increase our revenue would be adversely affected.
Table of Contents
Our future success is dependent upon our ability to further penetrate our existing customer base and attract new customers. Our current customer base is primarily composed of academic and governmental research institutions, as well as biopharmaceutical and contract research companies. Our success will depend upon our ability to respond to the evolving needs of, and increase our market share among, existing customers and additional potential customers, marketingadding new products as we develop them.customers. Identifying, engaging and marketing to customers who are unfamiliar with our current products requires substantial time, expertise and expense and involves a number of risks, including: •our ability to attract, retain and manage the sales, marketing and service personnel necessary to expand market acceptance for our Simoa technology;
•the time and cost of maintaining and growing a specialized sales, marketing and service force; and
•our sales, marketing and service force may be unable to execute successful commercial activities.
| ● | our ability to attract, retain and manage the sales, marketing and service personnel necessary to expand market acceptance for our Simoa technology platforms; |
| ● | the time and cost of maintaining and growing a specialized sales, marketing and service force; and |
| ● | our sales, marketing and service force may be unable to execute successful commercial activities. |
We have utilized third parties to assist with sales, distribution and customer support in certain regions of the world. There is no guarantee, when we enter into such arrangements, that we will be successful in attracting desirable sales and distribution partners. There is also no guarantee that we will be able to enter into such arrangements on favorable terms. Any failure of our sales and marketing efforts, or those of any third-party sales and distribution partners, would adversely affect our business. Sales of our assay for the neurological biomarker Nf-L have become increasingly important to our business, and any significant decrease in sales of that assay could have a material adverse effect on our business. Neurology has been aone of our primary focus areaareas for commercialization of our Simoa technology and the services that we provide to our customers. Sales from neurological-related biomarkers, Nf-L in particular, have become an increasingly important part of our business. We estimate that revenue from services and sales of consumables relating to Nf-L represented approximately 17%8% of our total revenue for the fiscal year ended December 31, 2018.2020. There can be no assurance that we will continue to derive meaningful revenues from the sale of our Nf-L assay, from services related to that assay or from sales of instruments driven by customers desiring access to the Nf-L assay. Further, we rely on a single source supplier for the antibodies used in our Nf-L assay. Although we have a supply agreement with this supplier, any disruption in the supply of this antibody, or theThe adoption by our customers of competitive technologies for detecting biomarkers of neurodegenerative conditions, could negatively impact our revenues and have a material adverse effect on our business. WP2 with the NIH under the RADx program could expose us to unique risks and costs. The NIH launched the RADx program to expedite development, commercialization, and implementation of technologies for COVID-19 testing to help increase testing in the United States. On September 29, 2020, we entered into WP2 with the NIH under the RADx program. The contract, which has a total award value of $18.2 million, will accelerate the continued development, scale-up and deployment of our novel SARS-CoV-2 antigen test. Initial early feasibility of this test was funded in part through WP1, in which we were granted approximately $2.0 million in June 2020. The contract provides funding to expand assay kit manufacturing capacity and commercial deployment readiness. Release of the $18.2 million of funding under WP2 is based on the achievement of certain milestones, and there is no assurance that we can meet all the milestones on a timely basis, if at all. If we do not meet all the milestones, we will not be able access the full $18.2 million in funding under the contract. In addition, other factors that could materially adversely affect our revenue stemming from WP2 include: | ● | budgetary constraints affecting U.S. government spending generally, or the NIH in particular; |
| ● | changes in U.S. government or the NIH fiscal policies or available funding, including due to Congressional appropriations; |
| ● | changes in U.S. government or the NIH programs, requirements or priorities; |
| ● | adoption of new laws or regulations; |
| ● | technological developments; |
| ● | U.S. government shutdowns, threatened shutdowns or budget delays; |
| ● | competition and consolidation in our industry; and |
| ● | general economic conditions. |
These or other factors could cause the NIH to reduce its funding or future activities under WP2, which could have a material adverse effect on the revenue generated by this contract. WP2 also contains certain provisions from the Federal Acquisition Regulations (FAR), some of which are customary or legally required, that give the U.S. government substantial rights and remedies, many of which are not typically found in commercial contracts. For example, WP2 contains provisions permitting unilateral termination or modification, in whole or in part, at the U.S. government’s convenience. In addition, WP2 contains additional requirements that may increase our costs of doing business, reduce our profits, and expose us to liability for failure to comply with these terms and conditions. These requirements include mandatory internal control systems and policies, mandatory socioeconomic compliance requirements, environmental compliance requirements and intellectual property provisions. If we fail to maintain compliance with these requirements, we may be subject to potential contract or False Claims Act liability and to termination of the contract. In addition, we may be required to enter into agreements with third parties, including suppliers, consultants and other third-party contractors in order to satisfy our contractual obligations pursuant to this contract with the NIH. Negotiating and entering into such arrangements can be time-consuming and we may not be able to reach agreement with such third parties. Any such agreement must also be compliant with the terms of WP2. Any delay or inability to enter into such arrangements or entering into such arrangements in a manner that is non-compliant with the terms of our contract, may result in violations of our contract and/or delays in the release of funding. Epidemic diseases, such as COVID-19, could negatively affect various aspects of our business, make it more difficult to meet our obligations to our customers, and result in reduced demand from our customers, which could have a material adverse effect on our business, financial condition, results of operations, or cash flows. Our business could be adversely affected by the effects of a widespread outbreak of contagious disease, such as COVID-19. Potential impacts to our business include disruptions or restrictions on our employees’ and customers’ ability to travel, temporary closures of the facilities of our suppliers or customers, delays in installation of instruments, and delays in shipments to and from affected countries. Any such travel restrictions and business closures could adversely impact our operations locally and worldwide, including our ability to manufacture, sell or distribute our products, as well as cause temporary closures of our foreign distributors, or the facilities of suppliers or customers. Any material disruption of our employees, distributors, suppliers or customers in impacted countries could impact our global sales and operating results. In addition, a significant outbreak of contagious diseases in the human population could result in a widespread health crisis that could adversely affect the economies and financial markets of many countries, resulting in an economic downturn that could affect demand for our products and likely impact our operating results. Some of the reagentscomponents used in our products are labeled for "research“research use only"only” and willmay have to undergo additional testing before wethey could use thembe used in a product intended for clinical use. Some of the materials that are used in our consumable products, including certain reagents, are purchased from suppliers with a restriction that they be used for research use only, or RUO. While we have focused initially on the life sciences research market, part of our future business strategy is to expand our product line, either alone or in collaboration with third parties, to encompass systems and products that can be used for clinical purposes. Whether or not we continue to use the same RUO materials that we currently use, or obtain similar materials that are not labeled with the RUO restriction, we or a collaborator willmay be required to demonstrate that the use of our system and products as a clinical test complies with all applicable requirements. In addition, if the supplier of any material or component used in a clinical test were changed, it would require confirmation through additional testing that the change does not adversely affect the reliability of the test. Any such additional testing may be expensive and time-consuming and delay the introduction of new products based on our technology. In the near term, our business will depend on levels of research and development spending by academic and governmental research institutions and biopharmaceutical companies, a reduction in which could limit demand for our products and adversely affect our business and operating results.
In the near term, we expect that our revenue will be derived primarily from sales of our instruments and consumables to academic and governmental research institutions, as well as biopharmaceutical and contract research companies worldwide for research applications. The demand for our products will depend in part upon the research and development budgets of these customers, which are impacted by factors beyond our control, such as:
•changes in government programs that provide funding to research institutions and companies;
•macroeconomic conditions and the political climate;
•changes in the regulatory environment;
•differences in budgetary cycles; and
•market acceptance of relatively new technologies, such as ours.
For example, in March 2017, the federal government announced the intent to cut federal biomedical research funding by as much as 18%. The uncertainty regarding the availability of research funding for potential customers may adversely affect our operating results. Our operating results may fluctuate substantially due to reductions and delays in research and development expenditures by these customers. Any decrease in customers' budgets or expenditures, or in the size, scope or frequency of capital or operating expenditures, could materially and adversely affect our business, operating results and financial condition.
The sales cycle for our Simoa instruments can be lengthy and variable, which makes it difficult for us to forecast revenue and other operating results. The sales process for our Simoa instruments generally involves numerous interactions with multiple individuals within an organization, and often includes in-depth analysis by potential customers of our technology and products and a lengthy review process. Our customers'customers’ evaluation processes often involve a number of factors, many of which are beyond our control. As a result of these factors, the capital investment required to purchase our systems, and the budget cycles of our customers, the time from initial contact with a customer to our receipt of a purchase order can vary significantly. Given the length and uncertainty of our sales cycle, we have in the past experienced, and expect to in the future experience, fluctuations in our sales on a period-to-period basis. In addition, any failure to meet customer expectations could result in customers choosing to retain their existing systems, use existing assays not requiring capital equipment or purchase systems other than ours. Our long-term results depend upon our ability to improve existing products and introduce and market new products successfully. Our business is dependent on the continued improvement of our existing Simoa products and our development of new products utilizing our Simoa or other potential future technology. As we introduce new products or refine, improve or upgrade versions of existing products, we cannot predict the level of market acceptance or the amount of market share these products will achieve, if any. We cannot assure you that we will not experience material delays in the introduction of new products in the future. In addition, introducing new products could result in a decrease in revenues from our existing products. For example, introduction of the SP-X and the anticipated introduction of the HD-X may result in a decrease in revenue from our SR-X and HD-1 instruments. Consistent with our strategy of offering new products and product refinements, we expect to continue to use a substantial amount of capital for product development and refinement. We may need more capital for product development and
Table of Contents
refinement than is available on terms favorable to us, if at all, which could adversely affect our business, financial condition or results of operations. We generally sell our products in industries that are characterized by rapid technological changes, frequent new product introductions and changing industry standards. If we do not develop new products and product enhancements based on technological innovation on a timely basis, our products may become obsolete over time and our revenues, cash flow, profitability and competitive position will suffer. Our success will depend on several factors, including our ability to: •correctly identify customer needs and preferences and predict future needs and preferences;
•allocate our research and development funding to products with higher growth prospects;
•anticipate and respond to our competitors' development of new products and technological innovations;
•innovate and develop new technologies and applications, and acquire or obtain rights to third-party technologies that may have valuable applications in the markets we serve;
•successfully commercialize new technologies in a timely manner, price them competitively and manufacture and deliver sufficient volumes of new products of appropriate quality on time; and
•convince customers to adopt new technologies.
| ● | correctly identify customer needs and preferences and predict future needs and preferences; |
| ● | allocate our research and development funding to products with higher growth prospects; |
| ● | anticipate and respond to our competitors’ development of new products and technological innovations; |
| ● | innovate and develop new technologies and applications, and acquire or obtain rights to third-party technologies that may have valuable applications in the markets we serve; |
| ● | successfully commercialize new technologies in a timely manner, price them competitively and manufacture and deliver sufficient volumes of new products of appropriate quality on time; and |
| ● | convince customers to adopt new technologies. |
In addition, if we fail to accurately predict future customer needs and preferences or fail to produce viable technologies, we may invest heavily in research and development of products that do not lead to significant revenue. Even if we successfully innovate and develop new products and product enhancements, we may incur substantial costs in doing so, and our profitability may suffer. Our ability to develop new products based on innovation can affect our competitive position and often requires the investment of significant resources. Difficulties or delays in research, development or production of new products and services or failure to gain market acceptance of new products and technologies may reduce future revenues and adversely affect our competitive position. If we do not successfully develop and introduce new assays for our technology, we may not generate new sources of revenue and may not be able to successfully implement our growth strategy. Our business strategy includes the development of new assays for our Simoa instruments. New assays require significant research and development and a commitment of significant resources prior to their commercialization. Our technology is complex, and we cannot be sure that any assays we may intend to develop will be developed successfully, be proven to be effective, offer improvements over currently available tests, meet applicable standards, be produced in commercial quantities at acceptable costs or be successfully marketed. Moreover, development of particular assays may require licenses or access to third-party intellectual property which may not be available on commercially reasonable terms, or at all. In addition, we believe that our future success will depend, in part, on our ability to develop and commercialize multiplex assays that can simultaneously measure multiple biomarkers, particularly for oncology indications. While we have developed, validated and validatedcommercialize a 10-plex assay for the SP-X using our Simoa planar array technology, the most robust multiplex assay that we have commercially launched to date using our Simoa bead-based technology is a 4-plex6-plex assay. If we do not successfully develop new assays for our Simoa instruments, including multiplex assays with the ability to detect an increased number of biomarkers in a single sample, we could lose revenue opportunities with existing or future customers.
Table of Contents
If we do not successfully manage the development and launch of new products, our financial results could be adversely affected. We initiated an early-access program for the SP-X instrument in January 2019, with the full commercial launch planned for April 2019, and intend to launch the HD-X, our next generation bead-based instrument, in the second half of 2019. We face risks associated with launching new products such as the SP-X and HD-X.products. If we encounter development or manufacturing challenges or discover errors during our product development cycle, the product launch dates of new products may be delayed. The expenses or losses associated with unsuccessful product development or launch activities or lack of market acceptance of our new products could adversely affect our business or financial condition.
Undetected errors or defects in our products could harm our reputation, decrease market acceptance of our products or expose us to product liability claims. Our Simoa products may contain undetected errors or defects when first introduced or as new versions or new products are released. Disruptions affecting the introduction or release of, or other performance problems with, our products may damage our customers'customers’ businesses and could harm their and our reputation. If that occurs, we may incur significant costs, the attention of our key personnel could be diverted, or other significant customer relations problems may arise. We may also be subject to warranty and liability claims for damages related to errors or defects in our products. In addition, if we do not meet industry or quality standards, if applicable, our products may be subject to recall. A material liability claim, recall or other occurrence that harms our reputation or decreases market acceptance of our products could harm our business and operating results. Although we do not, and cannot currently, promote the use of our products, or services based on our products, for diagnostic purposes, if our customers develop or use them for diagnostic purposes, someone could file a product liability claim alleging that one of our products contained a design or manufacturing defect that resulted in the failure to adequately perform, leading to death or injury. A product liability claim could result in substantial damages and be costly and time-consuming to defend, either of which could materially harm our business or financial condition. We cannot assure investorsyou that our product liability insurance would adequately protect our assets from the financial impact of defending a product liability claim. Any product liability claim brought against us, with or without merit, could increase our product liability insurance rates or prevent us from securing insurance coverage in the future. We may seek to enter into additional strategic collaborations and licensing arrangements with third parties, but we may not be successful in establishing or maintaining such arrangements. We may seek to enter into additional strategic collaborations and licensing agreements with third parties to develop products based on our Simoa technology, such as for certain in vitro diagnostic, or IVD purposes. However, there is no assurance that we will be successful in doing so. Establishing collaborations and licensing arrangements is difficult and time-consuming, and discussions may not lead to collaborations or licenses on favorable terms, if at all. Even if we establish such relationships, such as our license agreement with Abbott, if our partners do not prioritize and commit sufficient resources to develop and sell products based on our Simoa technology, they may never result in the successful development or commercialization of products based on our Simoa technology. Our reliance on distributors for sales of our products outside of the United States could limit or prevent us from selling our products and could impact our revenue. We have established exclusive distribution agreements for our Simoa instruments and related consumable products within certain foreign countries, including Australia, Brazil, China, Czech Republic, China, India, Israel, Japan, Lebanon, Mexico,
Table of Contents
Qatar, Saudi Arabia, Singapore, South Korea Lebanon, Qatar, Singapore and Taiwan, as well as other foreign countries.Taiwan. We intend to continue to grow our business internationally, and to do so we must attract additional distributors and retain existing distributors to maximize the commercial opportunity for our products. There is no guarantee that we will be successful in attracting or retaining desirable sales and distribution partners or that we will be able to enter into such arrangements on favorable terms. Distributors may not commit the necessary resources to market and sell our products to the level of our expectations or may choose to favor marketing the products of our competitors. If current or future distributors do not perform adequately, or we are unable to enter into effective arrangements with distributors in particular geographic areas, we may not realize long-term international revenue growth. In addition, if our distributors fail to comply with applicable laws and ethical standards, including anti-bribery laws, this could damage our reputation and could have a significant adverse effect on our business and our revenues. We expect to generate a substantial portion of our revenue internationally in the future and can become further subject to various risks relating to our international activities, which could adversely affect our business, operating results and financial condition. For the years ended December 31, 2020, 2019, and 2018, 2017approximately 48%, 50% and 2016, approximately 43%, 45% and 36%, respectively, of our product revenue was generated from customers located outside of North America. We believe that a substantial percentage of our future revenue will come from international sources as we expand our overseas operations and develop opportunities in additional areas. We have limited experience operating internationally and engaging in international business involves a number of difficulties and risks, including: •required compliance with existing and changing foreign regulatory requirements and laws;
• | ● | required compliance with existing and changing U.S. or foreign regulatory requirements and laws; |
| ● | difficulties and costs of staffing and managing foreign operations; |
| ● | a shortage of high-quality salespeople and distributors; |
| ● | pricing pressure that we may experience internationally; |
| ● | difficulties in maintaining consistency with our internal guidelines; |
| ● | difficulties in enforcing our intellectual property rights and in defending against third-party threats and intellectual property enforcement actions against us or any of our distributors, suppliers or collaborators; |
| ● | reduced or varied protection for intellectual property rights in some countries; |
| ● | required compliance with anti-bribery laws, such as the U.S. Foreign Corrupt Practices Act, data privacy requirements, such as the General Data Protection Regulation (the GDPR), labor laws and anti-competition regulations; |
| ● | export or import restrictions; |
| ● | laws and business practices favoring local companies; |
| ● | longer payment cycles and difficulties in enforcing agreements and collecting receivables through certain foreign legal systems; |
| ● | the imposition of restrictions on the activities of foreign agents, representatives and distributors; |
| ● | foreign currency exchange rate fluctuations; |
| ● | the imposition of U.S. or international sanctions against a country, company, person or entity with whom we do business that would restrict or prohibit continued business with the sanctioned country, company, person or entity; and |
| ● | political and economic instability; |
| ● | scrutiny of foreign tax authorities which could result in significant fines, penalties and additional taxes being imposed on us; |
| ● | the imposition of new trade restrictions; and |
| ● | potentially adverse tax consequences, tariffs, customs charges, bureaucratic requirements and other trade barriers. |
Historically, most of our revenue has been denominated in U.S. dollars. In the future, we may sell our products and services in local currency outside of the United States. As our operations in countries outside of the United States grow, our results of operations and cash flows may be subject to fluctuations due to changes in foreign currency exchange rates, which could harm our business in the future. For example, if the value of the U.S. dollar increases relative to foreign currencies, in the absence of a corresponding change in local currency prices, our revenue could be adversely affected as we convert revenue from local currencies to U.S. dollars. If we dedicate significant resources to our international operations and are unable to manage these risks effectively, our business, operating results and financial condition will suffer.
Table of Contents
We could be adversely affected by violations of the U.S. Foreign Corrupt Practices Act and other worldwide anti-bribery laws by us or our agents. We are subject to the U.S. Foreign Corrupt Practices Act or FCPA,(the FCPA), which prohibits companies and their intermediaries from making payments in violation of law to non-U.S. government officials for the purpose of obtaining or retaining business or securing any other improper advantage. Our reliance on independent distributors to sell our products internationally demands a high degree of vigilance in maintaining our policy against participation in corrupt activity, because these distributors could be deemed to be our agents, and we could be held responsible for their actions. Other U.S. companies in the medical device and pharmaceutical fields have faced criminal penalties under the FCPA for allowing their agents to deviate from appropriate practices in doing business with these individuals. We are also subject to similar antibribery laws in the jurisdictions in which we operate, including the United Kingdom'sKingdom’s Bribery Act of 2010, which also prohibits commercial bribery and makes it a crime for companies to fail to prevent bribery. We have limited experience in complying with these laws and in developing procedures to monitor compliance with these laws by our agents. These laws are complex and far-reaching in nature, and, as a result, we cannot assure you that we would not be required in the future to alter one or more of our practices to be in compliance with these laws or any changes in these laws or the interpretation thereof. Any violations of these laws, or allegations of such violations, could disrupt our operations, involve significant management distraction, involve significant costs and expenses, including legal fees, and could result in a material adverse effect on our business, prospects, financial condition, or results of operations. We could also incur severe penalties, including criminal and civil penalties, disgorgement, and other remedial measures. If we are unable to attract, recruit, train, retain, motivate and integrate key personnel, we may not achieve our goals. Our future success depends on our ability to attract, recruit, train, retain, motivate and integrate key personnel, including our recently expanded senior management team, as well as our research and development, manufacturing and sales and marketing personnel. Competition for qualified personnel is intense. Our growth depends, in particular, on attracting and retaining highly-trained sales personnel with the necessary scientific background and ability to understand our systems at a technical level to effectively identify and sell to potential new customers. Because of the complex and technical nature of our products and the dynamic market in which we compete, any failure to attract, recruit, train, retain, motivate and integrate qualified personnel could materially harm our operating results and growth prospects. We have limited experience in marketing and selling our products, and if we are unable to successfully commercialize our products, our business and operating results will be adversely affected. We have limited experience marketing and selling our products. We currently sell all our products for research use only, through our direct field sales and support organizations located in North America and Europe and through a combination of our own sales force and third-party distributors in additional major markets, including Australia, Brazil, Czech Republic, China, India, Israel, Japan, Mexico, South Korea, Lebanon, Qatar, Singapore and Taiwan. foreign markets. The future sales of our products will depend in large part on our ability to effectively market and sell our products, successfully manage and expand our sales force, and increase the scope of our marketing efforts. We may also enter into additional distribution arrangements in the future. Because we have limited experience in marketing and selling our products, our ability to forecast demand, the infrastructure required to support such demand and the sales cycle to customers is unproven. If we do not build an efficient and effective sales force, our business and operating results will be adversely affected.
Table of Contents
We rely on a single contract manufacturer to manufacture and supply our Simoa HD instrumentsHD-X instrument and rely on a different single contract manufacturer to manufacture and supply our Simoa SR-X.SR-X instrument. If either of these manufacturers should fail or not perform satisfactorily, our ability to supply these instruments would be negatively and adversely affected. We currently rely on a single contract manufacturer, STRATEC Biomedical AG, or STRATEC, an analytical and diagnostic systems manufacturer located in Germany, to manufacture and supply all of our Simoa HD1 instruments and will continue to rely on STRATEC when we launch the HD-X.HD-X instruments. In addition, we currently rely on a single contract manufacturer, Paramit Corporation, or Paramit, a contract manufacturer located in California, to manufacture and supply all of our SR-X instruments. Since our contract with STRATEC does not commit them to supply quantities beyond the amounts included in our forecasts and our contract with Paramit does not commit them to carry inventory or make available any particular quantities, these contract manufacturers may give other customers'customers’ needs higher priority than ours, and we may not be able to obtain adequate supplies in a timely manner or on commercially reasonable terms. If either of these manufacturers were not able to supply instruments, our business would be harmed. Pursuant to our Supply Agreement with STRATEC, as amended, we are required to purchase a minimum number of commercial units of HD instruments over a seven-year period ending in May 2021. If we fail to purchase the required minimum number of commercial units, including as a result of the impact of sales of the SR-X and SP-X going forward, we would be obligated to pay a fee based on the shortfall of commercial units purchased compared to the required number. If we fail to purchase the required minimum number of commercial instruments and terminate the arrangement in certain circumstances, we would be obligated to issue a warrant to purchase shares of our common stock. Any amount we may have to pay STRATEC for failing to purchase the minimum number of commercial units of HD instruments will cause our operating results to suffer.
In the event it becomes necessary to utilize a different contract manufacturer for the HD instrumentsHD-X instrument or the SR-X, we would experience additional costs, delays and difficulties in doing so as a result of identifying and entering into an agreement with a new supplier as well as preparing such new supplier to meet the logistical requirements associated with manufacturing our units, and our business would suffer. We may also experience additional costs and delays in the event we need access to or rights under any intellectual property of STRATEC. In addition, certain of the components used in our instruments are sourced from limited or sole suppliers. If we were to lose such suppliers, there can be no assurance that we will be able to identify or enter into agreements with alternative suppliers on a timely basis on acceptable terms, if at all. An interruption in our ability to sell and deliver instruments to customers could occur if we encounter delays or difficulties in securing these components, or if the quality of the components supplied do not meet specifications, or if we cannot then obtain an acceptable substitute. If any of these events occur, our business and operating results could be harmed. We may experience manufacturing problems or delays, or backlogs in deliveries, that could limit the growth of our revenue or increase our losses. We may encounter unforeseen situations that would result in delays or shortfalls in our production, as well asbacklogs in deliveries, or delays or shortfalls caused by our outsourced manufacturing suppliers, and by other third-party suppliers who manufacture components for our products or because of a significant unforecasted increase in demand for our products. If we are unable to keep up with demand for our products, our revenue could be impaired, market acceptance for our products could be adversely affected and our customers might instead purchase our competitors'competitors’ products. Our inability to successfully manufacture our products would have a material adverse effect on our operating results.
Table of Contents
We rely on a limited number of suppliers or, in some cases, one supplier, for some of our materials and components used in our consumable products and theour SP-X instrument, and may not be able to find replacements or immediately transition to alternative suppliers, which could have a material adverse effect on our business, financial condition, results of operations and reputation. We rely on limited or sole suppliers for certain reagents and other materials and components that are used in our consumable products and in theour SP-X instrument. While we periodically forecast our needs for such materials and enter into standard purchase orders with them, we do not have long-term contracts with many of these suppliers. If we were to lose such suppliers, there can be no assurance that we will be able to identify or enter into agreements with alternative suppliers on a timely basis on acceptable terms, if at all. An interruption in our operations could occur if we encounter delays or difficulties in securing these materials, or if the quality of the materials supplied do not meet our requirements, or if we cannot then obtain an acceptable substitute. The time and effort required to qualify a new supplier and ensure that the new materials provide the same or better quality results could result in significant additional costs. Any such interruption could significantly affect our business, financial condition, results of operations and reputation. If we cannot provide quality technical and applications support, we could lose customers and our business and prospects will suffer. The placement of our products at new customer sites, the introduction of our technology into our customers'customers’ existing laboratory workflows and ongoing customer support can be complex. Accordingly, we need highly trained technical support personnel. Hiring technical support personnel is very competitive in our industry due to the limited number of people available with the necessary scientific and technical backgrounds and ability to understand our Simoa technology at a technical level. To effectively support potential new customers and the expanding needs of current customers, we will need to substantially expand our technical support staff. If we are unable to attract, train or retain the number of highly qualified technical services personnel that our business needs, our business and prospects will suffer. The life sciences research and diagnostic markets are highly competitive. If we fail to effectively compete, our business, financial condition and operating results will suffer. We face significant competition in the life sciences research and diagnostic markets. We currently compete with both established and early stage companies that design, manufacture and market systems and consumable supplies. We believe our principal competitors in the life sciences research and diagnostic markets include Bio-Techne, Luminex Corporation, MesoScale Diagnostics, Singulex, Gyros Corporation and Nanostring Technologies, Inc. As we expand the applications for our products to include health screening, we expect to compete with companies such as Siemens, Abbott, Roche, Ortho Clinical Diagnostics and Thermo Fisher Scientific. In addition, there are a number of new market entrants in the process of developing novel technologies for the life sciences research, diagnostic and screening markets. Many of our current competitors have competitive advantages over us, including: •greater name and brand recognition;
•substantially greater financial and human resources;
•broader product lines;
•larger sales forces and more established distributor networks;
•substantial intellectual property portfolios;
•larger and more established customer bases and relationships; and
| ● | greater name and brand recognition; |
| ● | substantially greater financial and human resources; |
| ● | larger sales forces and more established distributor networks; |
| ● | substantial intellectual property portfolios; |
Table of Contents •better established, larger scale, and lower cost manufacturing capabilities.
| ● | larger and more established customer bases and relationships; and |
| ● | better established, larger scale, and lower cost manufacturing capabilities. |
We believe that the principal competitive factors in all of our target markets include: •accuracy, including sensitivity and specificity, and reproducibility of results;
•cost of instruments and consumables;
•reputation among customers;
•innovation in product offerings;
•flexibility and ease of use; and
•compatibility with existing laboratory processes, tools and methods.
| ● | accuracy, including sensitivity and specificity, and reproducibility of results; |
| ● | cost of instruments and consumables; |
| ● | reputation among customers; |
| ● | innovation in product offerings; |
| ● | flexibility and ease of use; and |
| ● | compatibility with existing laboratory processes, tools and methods. |
We cannot assure you that our products will compete favorably or that we will be successful in the face of increasing competition from new products and technologies introduced by our existing competitors or new companies entering our markets. In addition, we cannot assure you that our competitors do not have or will not develop products or technologies that currently or in the future will enable them to produce competitive products with greater capabilities or at lower costs than ours. Any failure to compete effectively could materially and adversely affect our business, financial condition and operating results. Integrating any business, product or technology we acquire can be expensive and time-consuming and can disrupt and adversely affect our ongoing business, including product sales, and distract our management. We may acquire other businesses, products or technologies as well as pursue strategic alliances, joint ventures, technology licenses or investments in complementary businesses, such as our January 2018 acquisition of Aushon Biosystems, Inc.and our 2019 acquisition of Uman. Our ability to successfully integrate any business, product or technology we acquire depends on a number of factors, including, but not limited to, our ability to: • | ● | minimize the disruption and distraction of our management and other employees, including our sales force, in connection with the integration of any acquired business, product or technology; |
| ● | minimize disruption in relationships with customers, distributors or suppliers as a result of such a transaction; |
| ● | avoid acquisition of unanticipated liabilities related to acquired companies; |
| ● | maintain and increase sales of our existing products; |
| ● | establish or manage the transition of the manufacture and supply of any acquired product; |
| ● | identify and add the necessary sales, marketing, manufacturing, regulatory and other related personnel, capabilities and infrastructure that are required to successfully integrate any acquired business, product or technology; |
| ● | manage the transition and migration of acquired personnel and all commercial, financial, legal, regulatory and other pertinent information relating to any acquired business, product or technology; |
Table of our management and other employees, including our sales force, in connection with the integration of any acquired business, product or technology;
•minimize disruption in relationships with customers, distributors or suppliers as a result of such a transaction;
•avoid acquisition of unanticipated liabilities related to acquired companies;
•maintain and increase sales of our existing products;
•establish or manage the transition of the manufacture and supply of any acquired product;
•identify and add the necessary sales, marketing, manufacturing, regulatory and other related personnel, capabilities and infrastructure that are required to successfully integrate any acquired business, product or technology;
•manage the transition and migration of acquired personnel and all commercial, financial, legal, regulatory and other pertinent information relating to any acquired business, product or technology;
•comply with legal, regulatory and contractual requirements applicable to any acquired business, product or technology; and
•maintain and extend intellectual property protection for any acquired product or technology.Contents | ● | comply with legal, regulatory and contractual requirements applicable to any acquired business, product or technology; and |
| ● | maintain and extend intellectual property protection for any acquired product or technology. |
If we are unable to perform the above functions or otherwise effectively integrate any acquired businesses, products or technologies, our business, financial condition and operating results will suffer.
TableForeign acquisitions (such as our acquisition of Contents
Foreign acquisitionsUman) involve unique risks in addition to those mentioned above, including those related to integration of operations across different cultures and languages, currency risks and the particular economic, political and regulatory risks associated with specific countries.
Also, the anticipated benefit of any acquisition may not materialize. Future acquisitions or dispositions could result in potentially dilutive issuances of our equity securities, the incurrence of debt, contingent liabilities or amortization expenses or write-offs of goodwill, any of which could harm our financial condition. We cannot predict the number, timing or size of future joint ventures or acquisitions, or the effect that any such transactions might have on our operating results. Risks Related to Government Regulation and Diagnostic Product Reimbursement If the FDA determines that our products are medical devices or if we seek to market our products for clinical diagnostic or health screening use, we will be required to obtain regulatory clearance(s) or approval(s) and may be required to cease or limit sales of our then marketed products, which could materially and adversely affect our business, financial condition and results of operations. Any such regulatory process would be expensive, time-consuming and uncertain both in timing and in outcome. We have focused initially on the life sciences research market. This includes offering products for use by laboratories associated with academic and governmental research institutions, as well as pharmaceutical, biotechnology and contract research companies. Accordingly, other than our COVID assays for which we have received EUAs, our products are labeled as "Research“Research Use Only," or RUO,Only” and are not intended for diagnostic uses. While we have focused initially on the life sciences research market and RUO products only, our future strategy is to expandincludes expanding our product line to encompass products that are intended to be used for the diagnosis of disease, either alone or in collaboration with third parties. Such IVD products, once developed and offered, will be subject to regulation by the FDA, as medical devices, or comparable international agencies, as medical devices including requirements for regulatory clearance or approval of such products before they can be marketed. The process of obtaining regulatory clearances to market a medical device can be costly and time consuming, and we or our collaborators may not be able to obtain these clearances or approvals on a timely basis, if at all. In general, the FDA permits commercial distribution of a new medical device only after the device has received clearance under Section 510(k) of the Federal Food, Drug and Cosmetic Act, or is the subject of an approved premarket approval application, or PMA, unless the device is specifically exempt from those requirements. The FDA will clear marketing of a lower risk medical device through the 510(k) process if the manufacturer demonstrates that the new product is substantially equivalent to other pre-amendment, 510(k)-exempt, 510(k) cleared products, or PMA-approved products that have subsequently been down-classified. If the FDA determines that the device is not "substantially equivalent"“substantially equivalent” to a predicate device, or if the device is automatically classified into Class III, the device sponsor must then fulfill the much more rigorous premarketing requirements of the PMA approval process, or seek reclassification of the device through the de novo process. Pursuant to amendments to the statute in 2012, a manufacturer can also submit a petition for a direct de novo review if the manufacturer is unable to identify an appropriate predicate device and the new device or new use of the device presents a moderate or low risk. High risk devices deemed to pose the greatest risk, such as life-sustaining, life-supporting, or implantable devices, or devices not deemed substantially equivalent to a previously cleared device, require the approval of a PMA. The PMA process is more costly, lengthy and uncertain than the 510(k) clearance process. A PMA application must be supported by extensive data, including, but not limited to, technical, preclinical, clinical trial, manufacturing and labeling data, to demonstrate to the FDA'sFDA’s satisfaction the safety and efficacy of the device for its intended use. Foreign governmental authorities that regulate the manufacture and sale of medical devices have become increasingly stringent and, to the extent we market and sell our products internationally for such uses, we may be subject to rigorous international regulation in the future. In these circumstances,
Table of Contents
we wouldmay rely significantly on our foreign independent distributors or collaborators to comply with the varying regulations, and any failures on their part could result in restrictions on the sale of our products in foreign countries. IVD products are regulated as medical devices by the FDA and comparable international agencies and may require either clearance from the FDA following the 510(k) pre-market notification process or PMA from the FDA, in each case prior to marketing. If we or our collaborators are required to obtain a PMA or 510(k) clearance for products based on our technology, we or they would be subject to a substantial number of additional requirements for medical devices, including establishment registration, device listing, Quality Systems Regulations or QSRs,(QSRs), which cover the design, testing, production, control, quality assurance, labeling, packaging, servicing, sterilization (if required), and storage and shipping of medical devices (among other activities), product labeling, advertising, recordkeeping, post-market surveillance, post-approval studies, adverse event reporting, and correction and removal (recall) regulations. One or more of the products we or a collaborator may develop using our technology may also require clinical trials in order to generate the data required for a PMA. Complying with these requirements may be time-consuming and expensive. We or our collaborators may be required to expend significant resources to ensure ongoing compliance with the FDA regulations and/or take satisfactory corrective action in response to enforcement action, which may have a material adverse effect on the ability to design, develop, and commercialize products using our technology as planned. Failure to comply with these requirements may subject us or a collaborator to a range of enforcement actions, such as warning letters, injunctions, civil monetary penalties, criminal prosecution, recall and/or seizure of products, and revocation of marketing authorization, as well as significant adverse publicity. If we or our collaborators fail to obtain, or experience significant delays in obtaining, regulatory approvals for IVD products, such products may not be able to be launched or successfully commercialized in a timely manner, or at all.
Laboratory developed tests, or LDTs are a subset of IVD tests that are designed, manufactured and offered as services toby high complexity clinical laboratories and used within a single laboratory. The FDA maintains that LDTs are medical devices and has for the most part exercised enforcement discretion for most LDTs. A significant change in the way that the FDA regulates any LDTs that we, our collaborators or our customers develop using our technology could affect our business. The FDA has considered the appropriate way to regulate such tests, but after publishing several draft guidances and holding a number of public hearings and workshops, no final guidance has been issued. However, if the FDA requires laboratories to undergo premarket review and comply with other applicable FDA requirements in the future, the cost and time required to commercialize an LDT will increase substantially, and may reduce the financial incentive for laboratories to develop LDTs, which could reduce demand for our instruments and our other products.
Failure to comply with applicable FDA requirements could subject us to misbranding or adulteration allegations under the Federal Food, Drug, and Cosmetic Act. We could be subject to a range of enforcement actions, including warning letters, injunctions, civil monetary penalties, criminal prosecution, and recall and/or seizure of products, as well as significant adverse publicity. In addition, changes to the current regulatory framework, including the imposition of additional or new regulations, could arise at any time during the development or marketing of our products, which may negatively affect our ability to obtain or maintain FDA or comparable regulatory approval of our products, if required.
Foreign jurisdictions have laws and regulations similar to those described above, which may adversely affect our ability to market our products as planned in such countries. The number and scope of these requirements are increasing. As in the United States, the cost and time required to comply with regulatory requirements may be substantial, and there is no guarantee that we will obtain the necessary authorization(s) required to make our products commercially viable. As a result, the
Table of Contents
imposition of foreign requirements may also have a material adverse effect on the commercial viability of our operations. We are subject to extensive regulatory requirements in connection with the EUAs that we have received from the FDA for our COVID-19 antibody and antigen tests. If we fail to comply with these requirements, or if the FDA otherwise determines that the conditions no longer warrant such authorization, we will be unable to market these products pursuant to this authorization and our business may be harmed. We have received EUAs from the FDA authorizing us to market our Simoa Semi-Quantitative SARS-CoV-2 IgG Antibody Test and our Simoa SARS-CoV-2 N Protein Antigen Test, each of which is run on our HD-X instrument. These EUAs allow us to market and sell these products without the need to obtain premarket clearance or approval under the FDA’s standard review pathways for the duration of the COVID-19 public health emergency. The FDA has also established certain conditions which must be met in order to maintain authorization under these EUAs. The requirements can be unclear and are subject to change. The FDA has the authority to issue an EUA during a public health emergency if it determines, based on the totality of the scientific evidence, that it is reasonable to believe that the product may be effective, that the known and potential benefits of a product outweigh the known and potential risks, that there is no adequate, approved and available alternative, and if certain other regulatory criteria are met. These standards for marketing authorization are lower than if the FDA had reviewed these tests under its traditional marketing authorization pathways, and we cannot assure you that our tests would be cleared or approved under those more extensive clearance and approval standards. Moreover, the FDA’s policies regarding EUAs can change unexpectedly, and the FDA may revoke an EUA when it determines that the underlying health emergency no longer exists or warrants such authorization or if problems are identified with the authorized product. We cannot predict how long our authorizations will remain in place. FDA policies regarding diagnostic tests, therapies and other products used to diagnose, treat or mitigate COVID-19 remain in flux as the FDA responds to new and evolving public health information and clinical evidence. Changes to FDA regulations or requirements could require changes to our authorized tests, necessitate additional measures or make it impractical or impossible for us to market our tests at all. In addition, even though we have received these EUAs, these tests may not gain broad market acceptance among customers, including physicians, healthcare payors, users and others in the medical community. The commercial success of our COVID-19 tests will initially be dependent upon physicians and healthcare providers adopting our test kits, which will be informed, in part, by the convenience and accuracy of our tests. Furthermore, the COVID-19 diagnostic testing market is susceptible to rapid technological developments and we may not be able to match new technological advances, which might render our COVID-19 test kits uncompetitive or obsolete. If we are unable to match technological improvements in competitive products or effectively respond to the needs of our customers and users, the demand for our COVID-19 test kits could be reduced. The termination of the emergency conditions under which EUAs are permitted, the rescission of an EUA, the failure of our tests to gain market acceptance or our inability to match advances in competing products could adversely impact our business. Our products may in the future be subject to product recalls that could harm our reputation, business and financial results. The FDA and similar foreign governmental authorities have the authority to require the recall of commercialized products, including RUO products, in the event of material deficiencies or defects in design or manufacture. In the case of the FDA, the authority to require a recall must be based on an FDA finding that there is a reasonable probability that the device would cause serious injury or death. In addition, foreign governmental bodies have the authority to require the recall of our products in the event of material deficiencies or defects in design or manufacture. Manufacturers may, under their own initiative, recall a product if any material deficiency in a device is found. A government-mandated or voluntary recall by us or one of our distributors could occur as a result of component failures, manufacturing errors, design or labeling defects or other deficiencies and issues. Recalls of any of our products would divert managerial and financial resources and have an adverse effect on our financial condition and results of operations. The FDA requires that certain classifications of recalls be reported to FDA within 10 working days after the recall is initiated. Companies are required to maintain certain records of recalls, even if they are not reportable to the FDA. We may initiate voluntary recalls involving our products in the future that we determine do not require notification of the FDA. If the FDA disagrees with our determinations, they could require us to report those actions as recalls. A future recall announcement could harm our reputation with customers and negatively affect our sales. In addition, the FDA could take enforcement action for failing to report the recalls when they were conducted. U.S. legislative, FDA or global regulatory reforms may make it more difficult and costly for us to obtain any required regulatory approval of our product candidates and to manufacture, market and distribute our products after approval is obtained. From time to time, legislation is drafted and introduced in Congress that could significantly change the statutory provisions governing the regulatory approval, manufacture and marketing of regulated products or the reimbursement thereof. Any new regulations or revisions or reinterpretations of existing regulations may impose additional costs or lengthen review times of future products. In addition, FDA regulations and guidance are often revised or reinterpreted by the agency in ways that may significantly affect our business and our products. It is impossible to predict whether legislative changes will be enacted or FDA regulations, guidance or interpretations changed, and what the impact of such changes, if any, may be. Moreover, leadership, personnel and structural changes within the FDA as well as recent and future federal election outcomes could result in significant legislative and regulatory reforms impacting the FDA'sFDA’s regulation of our products. Any change in the laws or regulations that govern the clearance and approval processes relating to our current and future products could make it more difficult and costly to obtain clearance or approval for new products, or to produce, market and distribute existing products. Significant delays in receiving clearance or approval, or the failure to receive clearance or approval for our new products would have an adverse effect on our ability to expand our business. In addition, on May 25, 2017, the new Medical Devices Regulation (2017/745 or "MDR"“MDR”) entered into force. Following its entry into application on May 26, 2020, the MDR will introduceintroduced substantial changes to the obligations with which medical device manufacturers must comply in the EU. High risk medical devices will be subject to additional scrutiny during the conformity assessment procedure. Specifically, the EU Medical Devices Regulation repeals and replaces the EU Medical Devices Directive. Unlike directives, which must be implemented into the national laws of the European Economic Area ("EEA")(EEA) Member States, the regulations would beare directly applicable, i.e., without the
Table of Contents
need for adoption of EEA member state laws implementing them, in all EEA Member States and are intended to eliminate current differences in regulation of medical devices among EEA Member States. The EU MDR, among other things, is intended to establish a uniform, transparent, predictable and sustainable regulatory framework across the EEA for medical devices to ensure a high level of safety and health while supporting innovation. The MDR will however only become applicable in three years after publication (in May 2020). Once applicable, the new regulations will among other things: •strengthen the rules on placing devices on the market and reinforce surveillance once they are available;
•establish explicit provisions on manufacturers' responsibilities for the follow-up of the quality, performance and safety of devices placed on the market;
•improve the traceability of medical devices throughout the supply chain to the end-user or patient through a unique identification number;
•set up a central database to provide patients, healthcare professionals and the public with comprehensive information on products available in the EU; and
•strengthen rules for the assessment of certain high-risk devices which may have to undergo an additional check by experts before they are placed on the market.
| ● | strengthen the rules on placing devices on the market and reinforce surveillance once they are available; |
| ● | establish explicit provisions on manufacturers’ responsibilities for the follow-up of the quality, performance and safety of devices placed on the market; |
| ● | improve the traceability of medical devices throughout the supply chain to the end-user or patient through a unique identification number; |
| ● | set up a central database to provide patients, healthcare professionals and the public with comprehensive information on products available in the EU; and |
| ● | strengthen rules for the assessment of certain high-risk devices which may have to undergo an additional check by experts before they are placed on the market. |
Once applicable, theThe MDR may impose increased compliance obligations for us to access the EU market.
In order to continue to sell our products in Europe, we must maintain our CE marks and continue to comply with certain EU directives and, in the future with the MDR. Our failure to continue to comply with applicable foreign regulatory requirements, including those administered by authorities of the EEA countries, could result in enforcement actions against us, including refusal, suspension or withdrawal of our CE Certificates of Conformity by our Notified Body, which could impair our ability to market products in the EEA in the future. Any changes to the membership of the European Union, such as the departure of the United Kingdom (Brexit), may impact the regulatory requirements for the impacted countries and impair our business operations and our ability to market products in such countries. If we do not comply with governmental regulations applicable to our CLIA-certified laboratory, we may not be able to continue our operations. The operation of our Clinical Laboratory Improvement Amendments or CLIA,(CLIA) certified laboratory is subject to regulation by numerous federal, state and local governmental authorities in the United States. This laboratory holds a CLIA certificate of compliance and is licensed by the Commonwealth of Massachusetts and the State of Maryland, and we intend tomay obtain other state licenses as may beif required in the future. Failure to comply with federal or state regulations or changes in those regulatory requirements could result in a substantial curtailment or even prohibition of the operations of our laboratory and could have an adverse effect on our business. CLIA is a federal law that regulates clinical laboratories that perform testing on human specimens for the purpose of providing information for the diagnosis, prevention or treatment of disease. To maintain CLIA certification, laboratories are subject to survey and inspection every two years. Moreover, CLIA inspectors may make unannounced inspections of these laboratories. If we were to lose our CLIA certification or any required state licenses, whether as a result of a revocation, suspension or limitation, it could have a material adverse effect on our business.
Table of Contents
We expect to rely on third parties in conducting any required future studies of diagnostic products that may be required by the FDA or other regulatory authorities, and those third parties may not perform satisfactorily. We do not have the ability to independently conduct clinical trials or other studies that may be required to obtain FDA and other regulatory clearance or approval for future diagnostic products. Accordingly, we expect that we would rely on third parties, such as clinical investigators, consultants, and collaborators to conduct such studies if needed. Our reliance on these third parties for clinical and other development activities would reduce our control over these activities. If these third parties do not successfully carry out their contractual duties or regulatory obligations or meet expected deadlines, if the third parties need to be replaced or if the quality or accuracy of the data they obtain is compromised, we may not be able to obtain regulatory clearance or approval. If diagnostic procedures that are enabled by our technology are subject to unfavorable pricing regulations or third-party coverage and reimbursement policies, our business could be harmed. The ability of us, our customers or our customerscollaborators to commercialize diagnostic tests based on our technology will depend in part on the extent to which coverage and reimbursement for these tests will be available from government health programs, private health insurers and other third-party payors. In the United States, the principal decisions about reimbursement for new technologies are often made by the Centers for Medicare and Medicaid Services or CMS.(CMS). Private payors often follow CMS to a substantial degree. It is difficult to predict what CMS will decide with respect to reimbursement. A primary trend in the U.S. healthcare industry and elsewhere is cost containment. Government authorities and third-party payors have attempted to control costs by limiting coverage and the amount of payments for particular products and procedures. We cannot be sure that coverage will be available for any diagnostic tests based on our technology, and, if coverage is available, the level of payments. Reimbursement may impact the demand for those tests. If reimbursement is not available or is available only to limited levels, any tests for which marketing authorization is received may not be able to be successfully commercialized. Current and future legislation may increase the difficulty and cost to obtain marketing approval of and commercialize any products based on our technology and affect the prices that may be obtained. In March 2010, the Patient Protection and Affordable Care Act, as amended by the Health Care and Education Affordability Reconciliation Act, collectively, the ACA, became law. The ACA is a sweeping law intended to broaden access to health insurance, reduce or constrain the growth of healthcare spending, enhance remedies against fraud and abuse, add new transparency requirements for the healthcare and health insurance industries, impose new taxes and fees on the health industry and impose additional health policy reforms. Since its enactment, there have been judicial and Congressional challenges to certain aspects of the ACA. Both Congress and former President Trump have expressed their intention to repeal or repeal and replace the ACA, and as a result certain sections of the ACA have not been fully implemented or were effectively repealed. The uncertainty around the future of the ACA, and in particular the impact to reimbursement levels and the number of insured individuals, may lead to uncertainty or delay in the purchasing decisions of our customers, which may in turn negatively impact our product sales. If there are not adequate reimbursement levels, our business and results of operations could be adversely affected. In addition, other legislative changes have been proposed and adopted since the ACA was enacted. We expect that the ACA, as well as other healthcare reform measures that may be adopted in the future, may result in more rigorous coverage criteria and in additional downward pressure on the price that we or our collaborators will receive for any cleared or approved product. Any reduction in payments from Medicare or other government programs may result in a similar reduction in payments from private payors. The implementation of cost containment measures or other healthcare reforms reforms may prevent us from being able to generate revenue, attain profitability, or commercialize any of our products for which we receive marketing approval. In addition, sales of our tests outside of the United States will subject us to foreign regulatory requirements, which may also change over time. We cannot predict whether future healthcare initiatives will be implemented at the federal or state level or in countries outside of the United States in which we may do business, or the effect any future legislation or regulation will have on us. The expansion in government'sgovernment’s effect on the United States healthcare industry may result in decreased profits to us, lower reimbursements by payors for our products or reduced medical procedure volumes, all of which may adversely affect our business, financial condition and results of operations. Inadequate funding for the FDA, the SEC and other government agencies could hinder their ability to hire and retain key leadership and other personnel, prevent our products from being developed or commercialized in a timely manner or otherwise prevent those agencies from performing normal business functions on which the operation of our business rely, which could negatively impact our business.
The ability of the FDA to review and approve new products can be affected by a variety of factors, including government budget and funding levels, ability to hire and retain key personnel and accept the payment of user fees, and statutory, regulatory, and policy changes. Average review times at the agency have fluctuated in recent years as a result. In addition, government funding of the SEC and other government agencies on which our operations may rely, including those that fund research and development activities is subject to the political process, which is inherently fluid and unpredictable.
Disruptions at the FDA and other agencies may also slow the time necessary for regulatory submissions to be reviewed and/or approved by necessary government agencies, which would adversely affect our business. For example, over the last several years, including beginning on December 22, 2018, the U.S. government has shut down several times and certain regulatory agencies, such as the FDA and the SEC, have had to furlough critical FDA, SEC and other government employees and stop critical activities. If a prolonged government shutdown occurs, it could significantly affect the ability of the FDA to timely review and process our regulatory submissions, which could have a material adverse effect on our business. Further, in our operations as a public company, future government shutdowns could impact our ability to access the public markets and obtain necessary capital in order to properly capitalize and continue our operations.
Risks Related to Our Operations We depend on our information technology systems, and any failure of these systems could harm our business. We depend on information technology and telecommunications systems to operate our business. We have installed, and expect to expand, a number of enterprise software systems that affect a broad range of business processes and functional areas, including, for example, systems handling human resources, accounting, manufacturing, inventory control, financial controls and reporting, sales administration, and other infrastructure operations. In addition to the aforementioned business systems, we intend to extend the capabilities of both our preventative and detective security controls by augmenting the monitoring and alerting functions, network design, and automatic countermeasure operations of our technical systems. These information technology and telecommunications systems support a variety of functions, including manufacturing operations, quality control, customer service support, and general administrative activities. Information technology and telecommunications systems are vulnerable to damage from a variety of sources, including telecommunications or network failures, malicious human acts and natural disasters. Moreover, despite network security and back-up measures, some of our servers are potentially
Table of Contents
vulnerable to physical or electronic break-ins, computer viruses, and similar disruptive problems. Despite the precautionary measures we have taken to prevent unanticipated problems that could affect our information technology and telecommunications systems, failures or significant downtime of our information technology or telecommunications systems or those used by our third-party suppliers could prevent us from operating our business and managing the administrative aspects of our business. Any disruption or loss of information technology or telecommunications systems on which critical aspects of our operations depend could have an adverse effect on our business. Security breaches, loss of data and other disruptions could compromise sensitive information related to our business or prevent us from accessing critical information and expose us to liability, which could adversely affect our business and our reputation. In the ordinary course of our business, we collect and store sensitive data, and intellectual property and proprietary business information owned or controlled by ourselves or our customers. This data encompasses a wide variety of business-critical information including research and development information, commercial information, and business and financial information. We face four primary risks relative to protecting this critical information: loss of access; inappropriate disclosure; inappropriate modification; and inadequate monitoring of our controls over the first three risks. The secure processing, storage, maintenance, and transmission of this critical information is vital to our operations and business strategy, and we devote significant resources to protecting such information. Although we take measures to protect sensitive information from unauthorized access or disclosure, our information technology and infrastructure may be vulnerable to attacks by hackers or viruses, breaches, interruptions due to employee error, malfeasance, lapses in compliance with privacy and security mandates, or other disruptions. Any such breach or interruption could compromise our networks and the information stored there could be accessed by unauthorized parties, publicly disclosed, lost, or stolen. Any such security breach or interruption, as well as any action by us or our employees or contractors that might be inconsistent with the rapidly evolving data privacy and security laws and regulations applicable within the United States and elsewhere where we conduct business, could result in enforcement actions by U.S. states, the U.S. federal government or foreign governments, liability or sanctions under data privacy laws that protect personally identifiable information, regulatory penalties, other legal proceedings such as but not limited to private litigation, the incurrence of significant remediation costs, disruptions to our development programs, business operations and collaborations, diversion of management efforts and damage to our reputation, which could harm our business and operations. Because of the rapidly moving nature of technology and the increasing sophistication of cybersecurity threats, our measures to prevent, respond to and minimize such risks may be unsuccessful. In addition, the European Parliament and the Council of the European Union adopted a comprehensive general data privacy regulation, orthe GDPR in 2016 to replace the current European Union Data Protection Directive and related country-specific legislation. The GDPR took effect in May 2018 and governs the collection and use of personal data in the European Union. The GDPR, which is wide-ranging in scope, will imposeimposes several requirements relating to the consent of the individuals to whom the personal data relates, the information provided to the individuals, the security and confidentiality of the personal data, data breach notification and the use of third party processors in connection with the processing of the personal data. The GDPR also imposes strict rules on the transfer of personal data out of the European Union to the United States, enhances enforcement authority and imposes large penalties for noncompliance, including the potential for fines of up to €20 million or 4% of the annual global revenues of the infringer, whichever is greater. While we have taken steps to comply with the GDPR, including such as reviewing our security procedures and entering into data processing agreements with relevant contractors, we cannot assure you that our efforts to remain in compliance will be fully successful.
Table of Contents
Further, unauthorized access, loss or dissemination of sensitive information could also disrupt our operations, including our ability to conduct research and development activities, process and prepare company financial information, manage various general and administrative aspects of our business and damage our reputation, any of which could adversely affect our reputation and our business. In addition, there can be no assurance that we will promptly detect any such disruption or security breach, if at all. To the extent that any disruption or security breach were to result in a loss of or damage to our data or applications, or inappropriate disclosure of confidential or proprietary information, we could incur liability and the further development of our products could be delayed. We face risks related to handling of hazardous materials and other regulations governing environmental safety. Our operations are subject to complex and stringent environmental, health, safety and other governmental laws and regulations that both public officials and private individuals may seek to enforce. Our activities that are subject to these regulations include, among other things, our use of hazardous materials and the generation, transportation and storage of waste. Although we have secured clearance from the EPA historically, and currently are operating in compliance with applicable EPA rules and regulations, our business could be adversely affected if we discover that we or an acquired business is not in material compliance with these rules and regulations. In the future, we may pursue the use of other surfactant substances that will require clearance from the EPA, and we may fail to obtain such clearance. Existing laws and regulations may also be revised or reinterpreted, or new laws and regulations may become applicable to us, whether retroactively or prospectively, that may have a negative effect on our business and results of operations. It is also impossible to eliminate completely the risk of accidental environmental contamination or injury to individuals. In such an event, we could be liable for any damages that result, which could adversely affect our business. Risks Related to Intellectual Property If we are unable to protect our intellectual property, it may reduce our ability to maintain any technological or competitive advantage over our competitors and potential competitors, and our business may be harmed. We rely on patent protection as well as trademark, copyright, trade secret and other intellectual property rights protection and contractual restrictions to protect our proprietary technologies, all of which provide limited protection and may not adequately protect our rights or permit us to gain or keep any competitive advantage. As of March 1, 2019, we owned or exclusively licensed 27 granted U.S. patents and approximately 18 pending U.S. patent applications. We also owned or exclusively licensed a number of pending patent applications and granted patents in particular jurisdictions outside of the United States. If we fail to protect our intellectual property, third parties may be able to compete more effectively against us, we may lose our technological or competitive advantage, or we may incur substantial litigation costs in our attempts to recover or restrict use of our intellectual property. We cannot assure investors that any of our currently pending or future patent applications will result in granted patents, and we cannot predict how long it will take for such patents to be granted. It is possible that, for any of our patents that have granted or that may grant in the future, others will design around our patented technologies. Further, we cannot assure investors that other parties will not challenge any patents granted to us or that courts or regulatory agencies will hold our patents to be valid or enforceable. We cannot guarantee investors that we will be successful in defending challenges made against our patents and patent applications. Any successful third-party challenge to our patents could result in the unenforceability or invalidity of such patents, or to such patents being interpreted narrowly or otherwise in a manner adverse to our interests. Our ability to establish or maintain a technological or competitive advantage over our competitors may be diminished because of these
Table of Contents
uncertainties. For these and other reasons, our intellectual property may not provide us with any competitive advantage. For example: •We or our licensors might not have been the first to make the inventions covered by each of our pending patent applications or granted patents;
•We or our licensors might not have been the first to file patent applications for these inventions. To determine the priority of these inventions, we may have to participate in interference proceedings or derivation proceedings declared by the United States Patent and Trademark Office, or USPTO, that could result in substantial cost to us. No assurance can be given that our patent applications or granted patents (or those of our licensors) will have priority over any other patent or patent application involved in such a proceeding;
•Others may independently develop similar or alternative products and technologies or duplicate any of our products and technologies;
•It is possible that our owned or licensed pending patent applications will not result in granted patents, and even if such pending patent applications grant as patents, they may not provide a basis for intellectual property protection of commercially viable products, may not provide us with any competitive advantages, or may be challenged and invalidated by third parties;
•We may not develop additional proprietary products and technologies that are patentable;
•The patents of others may have an adverse effect on our business; and
•While we apply for patents covering our products and technologies and uses thereof, as we deem appropriate, we may fail to apply for patents on important products and technologies in a timely fashion or at all, or we may fail to apply for patents in potentially relevant jurisdictions.
| ● | We or our licensors might not have been the first to make the inventions covered by each of our pending patent applications or granted patents; |
| ● | We or our licensors might not have been the first to file patent applications for these inventions. To determine the priority of these inventions, we may have to participate in interference proceedings or derivation proceedings declared by the United States Patent and Trademark Office (USPTO) that could result in substantial cost to us. No assurance can be given that our patent applications or granted patents (or those of our licensors) will have priority over any other patent or patent application involved in such a proceeding; |
| ● | Others may independently develop similar or alternative products and technologies or duplicate any of our products and technologies; |
| ● | It is possible that our owned or licensed pending patent applications will not result in granted patents, and even if such pending patent applications grant as patents, they may not provide a basis for intellectual property protection of commercially viable products, may not provide us with any competitive advantages, or may be challenged and invalidated by third parties; |
| ● | We may not develop additional proprietary products and technologies that are patentable; |
| ● | The patents of others may have an adverse effect on our business; and |
| ● | While we apply for patents covering our products and technologies and uses thereof, as we deem appropriate, we may fail to apply for patents on important products and technologies in a timely fashion or at all, or we may fail to apply for patents in potentially relevant jurisdictions. |
To the extent our intellectual property offers inadequate protection, or is found to be invalid or unenforceable, we would be exposed to a greater risk of direct competition. If our intellectual property does not provide adequate coverage ofover our competitors'products and protection against our competitors’ products, our competitive position could be adversely affected, as could our business. Software is a critical component of our instruments. To the extent such software is not protected by our patents, we depend on trade secret protection and non-disclosure agreements with our employees, strategic partners and consultants, which may not provide adequate protection. The measures that we use to protect the security of our intellectual property and other proprietary rights may not be adequate, which could result in the loss of legal protection for, and thereby diminish the value of, such intellectual property and other rights. In addition to pursuing patents on our technology, we also rely upon trademarks, trade secrets, copyrights and unfair competition laws, as well as license agreements and other contractual provisions, to protect our intellectual property and other proprietary rights. Despite these measures, any of our intellectual property rights could be challenged, invalidated, circumvented or misappropriated. In addition, we take steps to protect our intellectual property and proprietary technology by entering into confidentiality agreements and intellectual property assignment agreements with our employees, consultants, corporate partners and, when needed, our advisors. Such agreements may not be enforceable or may not provide meaningful protection for our trade secrets or other proprietary information in the event of unauthorized use or disclosure or other breaches of the agreements, and we may not be able to prevent such unauthorized disclosure. Moreover, if a party having an agreement with us has an overlapping or conflicting obligation to a third party, our rights in and to certain intellectual property could be undermined. Monitoring unauthorized disclosure is difficult, and we do not know whether the steps we have taken to prevent such disclosure are, or will be, adequate. If we were to enforce a claim that a third party had illegally obtained and was using our trade secrets, it
Table of Contents
would be expensive and time-consuming, the outcome would be unpredictable, and any remedy may be inadequate. In addition, courts outside the United States may be less willing to protect trade secrets. In addition, competitors could purchase our products and attempt to replicate some or all of the competitive advantages we derive from our development efforts, willfully infringe our intellectual property rights, design around our protected technology or develop their own competitive technologies that fall outside of our intellectual property rights. If our intellectual property does not adequately protect our market share against competitors'competitors’ products and methods, our competitive position could be adversely affected, as could our business. Some of our owned and in-licensed intellectual property has been discovered through government funded programs and thus is subject to federal regulations such as "march-in"“march-in” rights, certain reporting requirements, and a preference for U.S. industry. Compliance with such regulations may limit our exclusive rights, subject us to expenditure of resources with respect to reporting requirements, and limit our ability to contract with non-U.S. manufacturers. Some of the intellectual property rights we own and have in-licensed have been generated through the use of U.S. government funding and are therefore subject to certain federal regulations. For example, allsome of the issued U.S. patents we own and all of the intellectual property rights licensed to us under our license agreement with Tufts have been generated using U.S. government funds. As a result, the U.S. government has certain rights to intellectual property embodied in our current or future products pursuant to the Bayh-Dole Act of 1980 or(the Bayh-Dole Act.Act). These U.S. government rights in certain inventions developed under a government-funded program include a non-exclusive, non-transferable, irrevocable worldwide license to use inventions for any governmental purpose. In addition, the U.S. government has the right to require us to grant exclusive, partially exclusive, or non-exclusive licenses to any of these inventions to a third party if the government determines that: (i) adequate steps have not been taken to commercialize the invention; (ii) government action is necessary to meet public health or safety needs; or (iii) government action is necessary to meet requirements for public use under federal regulations (also referred to as "march-in rights"“march-in rights”). The U.S. government also has the right to take title to these inventions if we fail, or the applicable licensor fails, to disclose the invention to the government, elect title, and file an application to register the intellectual property within specified time limits. In addition, the U.S. government may acquire title to these inventions in any country in which a patent application is not filed within specified time limits. Intellectual property generated under a government funded program is also subject to certain reporting requirements, compliance with which may require us, or the applicable licensor, to expend substantial resources. In addition, the U.S. government requires that any products embodying the subject invention or produced through the use of the subject invention be manufactured substantially in the U.S. The manufacturing preference requirement can be waived if the owner of the intellectual property can show that reasonable but unsuccessful efforts have been made to grant licenses on similar terms to potential licensees that would be likely to manufacture substantially in the U.S. or that under the circumstances domestic manufacture is not commercially feasible. This preference for U.S. manufacturing may limit our ability to license the applicable patent rights on an exclusive basis under certain circumstances. If we enter into future arrangements involving government funding, and we make inventions as a result of such funding, intellectual property rights to such discoveries may be subject to the applicable provisions of the Bayh-Dole Act. To the extent any of our current or future intellectual property is generated through the use of U.S. government funding, the provisions of the Bayh-Dole Act may similarly apply. Any exercise by the government of certain of its rights could harm our competitive position, business, financial condition, results of operations and prospects.
Table of Contents
We depend onOur Simoa bead-based technology that is licensed to us by Tufts University. Any loss of our rights to this technology could prevent us from selling our products.
Our Simoa bead-based technology is licensed exclusively to us from Tufts University. We do not own the patents that underlie this license. Our rights to use this technology and employ the inventions claimed in the licensed patents are subject to the continuation of and compliance with the terms of the license. Our principal obligations under our license agreement with Tufts are as follows: •royalty payments;
•milestone payments;
•annual maintenance fees;
•using commercially reasonable efforts to develop and sell a product using the licensed technology and developing a market for such product;
•paying and/or reimbursing fees related to prosecution, maintenance and enforcement of patent rights; and
•providing certain reports.
| ● | annual maintenance fees; |
| ● | using commercially reasonable efforts to develop and sell a product using the licensed technology and developing a market for such product; |
| ● | paying and/or reimbursing fees related to prosecution, maintenance and enforcement of patent rights; and |
| ● | providing certain reports. |
If we breach any of these obligations, Tufts may have the right to terminate the license, which could result in our being unable to develop, manufacture and sell products using our Simoa productsbead-based technology or a competitor'scompetitor’s gaining access to the Simoa technology. Termination of our license agreement with Tufts would have a material adverse effect on our business. In addition, we are a party to a number of other agreements that include licenses to intellectual property, including non-exclusive licenses. We expect that we may need to enter into additional license agreements in the future. Our business could suffer, for example, if any current or future licenses terminate, if the licensors fail to abide by the terms of the license, if the licensed patents or other rights are found to be invalid or unenforceable, or if we are unable to enter into necessary licenses on acceptable terms. We may need or may choose to obtain licenses from third parties to advance our research or allow commercialization of our current or future products, and we cannot provide any assurances that we would be able to do so. We may need or may choose to obtain licenses from third parties to advance our research or allow commercialization of our current or future products, and we cannot provide any assurances that third-party patents do not exist that might be enforced against our current or future products in the absence of such a license. We may fail to obtain any of these licenses on commercially reasonable terms, if at all. Even if we are able to obtain a license, it may be non-exclusive, thereby giving our competitors access to the same technologies licensed to us. If we could not obtain a license, we may be required to expend significant time and resources to develop or license replacement technology. If we are unable to do so, we may be unable to develop or commercialize the affected products, which could materially harm our business and the third parties owning such intellectual property rights could seek either an injunction prohibiting our sales, or, with respect to our sales, an obligation on our part to pay royalties and/or other forms of compensation. Licensing of intellectual property involves complex legal, business and scientific issues. Disputes may arise between us and our licensors regarding intellectual property subject to a license agreement, including: •the scope of rights granted under the license agreement and other interpretation-related issues;
| ● | the scope of rights granted under the license agreement and other interpretation-related issues; |
| ● | whether and the extent to which our technology and processes infringe on intellectual property of the licensor that is not subject to the licensing agreement; |
| ● | our right to sublicense patent and other rights to third parties under collaborative development relationships; |
| ● | our diligence obligations with respect to the use of the licensed technology in relation to our development and commercialization of our products, and what activities satisfy those diligence obligations; and |
| ● | the ownership of inventions and know-how resulting from the joint creation or use of intellectual property by our licensors and us and our partners. |
Table of Contents
•whether and the extent to which our technology and processes infringe on intellectual property of the licensor that is not subject to the licensing agreement;
•our right to sublicense patent and other rights to third parties under collaborative development relationships;
•our diligence obligations with respect to the use of the licensed technology in relation to our development and commercialization of our products, and what activities satisfy those diligence obligations; and
•the ownership of inventions and know-how resulting from the joint creation or use of intellectual property by our licensors and us and our partners.
If disputes over intellectual property that we have licensed prevent or impair our ability to maintain the licensing arrangements on acceptable terms, we may be unable to successfully develop and commercialize the affected product, or the dispute may have an adverse effect on our results of operation. In addition to agreements pursuant to which we in-license intellectual property, we have in the past and expect to in the future to grant licenses under our intellectual property. Like in-licenses, out-licenses are complex, and disputes may arise between us and our licensees, such as the types of disputes described above. Moreover, our licensees may breach their obligations, or we may be exposed to liability due to our failure or alleged failure to satisfy our obligations. Any such occurrence could have an adverse effect on our business. If we or any of our partners are sued for infringing intellectual property rights of third parties, it would be costly and time-consuming, and an unfavorable outcome in that litigation could have a material adverse effect on our business. Our success also depends on our ability to develop, manufacture, market and sell our products and perform our services without infringing upon the proprietary rights of third parties. Numerous U.S. and foreign-issued patents and pending patent applications owned by third parties exist in the fields in which we are developing products and services. As part of a business strategy to impede our successful commercialization and entry into new markets, competitors have claimed, and may claim in the future, that our products and/or services infringe their intellectual property rights and have suggested, and may suggest in the future, that we enter into license agreements. Any such claims made to date are, we believe, without merit. Even if such claims are without merit, we could incur substantial costs and divert the attention of our management and technical personnel in defending ourselves against claims of infringement made by third parties or settling such claims. Any adverse ruling by a court or administrative body, or perception of an adverse ruling, may have a material adverse impact on our ability to conduct our business and our finances. Moreover, third parties making claims against us may be able to obtain injunctive relief against us, which could block our ability to offer one or more products or services and could result in a substantial award of damages against us. In addition, since we sometimes indemnify customers, collaborators or licensees, we may have additional liability in connection with any infringement or alleged infringement of third-party intellectual property. Because patent applications can take many years to issue, there may be pending applications, some of which are unknown to us, that may result in issued patents upon which our products or proprietary technologies may infringe. Moreover, we may fail to identify issued patents of relevance or incorrectly conclude that an issued patent is invalid or not infringed by our technology or any of our products. There is a substantial amount of litigation involving patent and other intellectual property rights in our
Table of Contents
industry. If a third party claims that we or any of our licensors, customers or collaboration partners infringe upon a third party'sparty’s intellectual property rights, we may have to: •seek to obtain licenses that may not be available on commercially reasonable terms, if at all;
•abandon any infringing product or redesign our products or processes to avoid infringement;
•pay substantial damages including, in an exceptional case, treble damages and attorneys' fees, which we may have to pay if a court decides that the product or proprietary technology at issue infringes upon or violates the third-party's rights;
•pay substantial royalties or fees or grant cross-licenses to our technology; or
•defend litigation or administrative proceedings that may be costly whether we win or lose, and which could result in a substantial diversion of our financial and management resources.
| ● | seek to obtain licenses that may not be available on commercially reasonable terms, if at all; |
| ● | abandon any infringing product or redesign our products or processes to avoid infringement; |
| ● | pay substantial damages including, in an exceptional case, treble damages and attorneys’ fees, which we may have to pay if a court decides that the product or proprietary technology at issue infringes upon or violates the third-party’s rights; |
| ● | pay substantial royalties or fees or grant cross-licenses to our technology; or |
| ● | defend litigation or administrative proceedings that may be costly whether we win or lose, and which could result in a substantial diversion of our financial and management resources. |
We may be involved in lawsuits to protect or enforce our patents or the patents of our licensors, which could be expensive, time-consuming and unsuccessful. Competitors may infringe our patents or the patents of our licensors.that we license. In the event of infringement or unauthorized use, we may file one or more infringement lawsuits, which can be expensive and time-consuming. An adverse result in any such litigation proceedings could put one or more of our patents at risk of being invalidated, being found to be unenforceable or being interpreted narrowly and could put our patent applications at risk of not issuing. Furthermore, because of the substantial amount of discovery required in connection with intellectual property litigation, there is a risk that some of our confidential information could be compromised by disclosure during this type of litigation. MostMany of our competitors are larger than we are and have substantially greater resources. They are, therefore, likely to be able to sustain the costs of complex patent litigation longer than we could. In addition, the uncertainties associated with litigation could have a material adverse effect on our ability to raise any funds necessary to continue our operations, continue our internal research programs, in-license needed technology, or enter into development partnerships that would help us bring our products to market.
In addition, patent litigation can be very costly and time-consuming. An adverse outcome in such litigation or proceedings may expose us or any of our future development partners to loss of our proprietary position, expose us to significant liabilities, or require us to seek licenses that may not be available on commercially acceptable terms, if at all. Our issued patents could be found invalid or unenforceable if challenged in court, which could have a material adverse impact on our business. If we or any of our partners were to initiate legal proceedings against a third party to enforce a patent covering one of our products or services, the defendant in such litigation could counterclaim that our patent is invalid and/or unenforceable. In patent litigation in the United States, defendant counterclaims alleging invalidity and/or unenforceability are commonplace. Grounds for a validity challenge could be an alleged failure to meet any of several statutory requirements, including lack of novelty, obviousness or non-enablement, or failure to claim patent eligible subject matter. Grounds for an unenforceability assertion could be an allegation that someone connected with prosecution of the patent withheld relevant information from the USPTO, or made a misleading statement, during prosecution. Third parties may also raise similar claims before the USPTO even outside the context of litigation. The outcome following legal assertions of invalidity and unenforceability is unpredictable. With respect to the validity question, for example, we cannot be certain that there is no invalidating prior art of which we and the patent examiner were unaware during prosecution. If a defendant were to prevail on a legal assertion of invalidity and/or unenforceability, we would lose at least part, and
Table of Contents
perhaps all, of the challenged patent. Such a loss of patent protection would have a material adverse impact on our business. We may be subject to claims that our employees, consultants or independent contractors have wrongfully used or disclosed alleged trade secrets of their other clients or former employers to us, which could subject us to costly litigation. As is common in the life sciences industry, we engage the services of consultants and independent contractors to assist us in the development of our products. Many of these consultants and independent contractors were previously employed at, or may have previously or may be currently providing consulting or other services to, universities or other technology, biotechnology or pharmaceutical companies, including our competitors or potential competitors. We may become subject to claims that our company, a consultant or an independent contractor inadvertently or otherwise used or disclosed trade secrets or other information proprietary to their former employers or their former or current clients. We may similarly be subject to claims stemming from similar actions of an employee, such as one who was previously employed by another company, including a competitor or potential competitor. Litigation may be necessary to defend against these claims. Even if we are successful in defending against these claims, litigation could result in substantial costs and be a distraction to our management team. If we were not successful we could lose access or exclusive access to valuable intellectual property. We may be subject to claims challenging the inventorship or ownership of our patents and other intellectual property. We generally enter into confidentiality and intellectual property assignment agreements with our employees, consultants, and contractors. These agreements generally provide that inventions conceived by the party in the course of rendering services to us will be our exclusive property. However, those agreements may not be honored and may not effectively assign intellectual property rights to us. For example, even if we have a consulting agreement in place with an academic advisor pursuant to which such academic advisor is required to assign any inventions developed in connection with providing services to us, such academic advisor may not have the right to assign such inventions to us, as it may conflict with his or her obligations to assign all such intellectual property to his or her employing institution. In addition, we sometimes enter into agreements where we provide services to third parties, such as customers. Under such circumstances, our agreements may provide that certain intellectual property that we conceive in the course of providing those services is assigned to the customer. In those cases, we would not be able to use that particular intellectual property in, for example, our work for other customers without a license. We may not be able to protect our intellectual property rights throughout the world, which could materially, negatively affect our business. Filing, prosecuting and defending patents on current and future products in all countries throughout the world would be prohibitively expensive, and our intellectual property rights in some countries outside the United States can be less extensive than those in the United States. In addition, the laws of some foreign countries do not protect intellectual property rights to the same extent as federal and state laws in the United States. Consequently, regardless of whether we are able to prevent third parties from practicing our inventions in the United States, we may not be able to prevent third parties from practicing our inventions in all countries outside the United States, or from selling or importing products made using our inventions in and into the United States or other jurisdictions. Competitors may use our technologies in jurisdictions where we have not pursued and obtained patent protection to develop their own products, and further, may export otherwise infringing products to
Table of Contents
territories where we have patent protection, but enforcement is not as strong as it is in the United States. These products may compete with our products and our patents or other intellectual property rights may not be effective or sufficient to prevent them from competing. Even if we pursue and obtain issued patents in particular jurisdictions, our patent claims or other intellectual property rights may not be effective or sufficient to prevent third parties from so competing. Patent protection must ultimately be sought on a country-by-country basis, which is an expensive and time-consuming process with uncertain outcomes. Accordingly, we may choose not to seek patent protection in certain countries, and we will not have the benefit of patent protection in such countries. Many companies have encountered significant problems in protecting and defending intellectual property rights in foreign jurisdictions. The legal systems of certain countries, particularly certain developing countries, do not favor the enforcement of patents and other intellectual property protection, particularly those relating to biotechnology, which could make it difficult for us to stop the infringement of our patents or marketing of competing products in violation of our proprietary rights generally. Proceedings to enforce our patent rights in foreign jurisdictions could result in substantial costs and divert our efforts and attention from other aspects of our business, could put our patents at risk of being invalidated or interpreted narrowly and our patent applications at risk of not issuing and could provoke third parties to assert claims against us. We may not prevail in any lawsuits that we initiate and the damages or other remedies awarded, if any, may not be commercially meaningful. Accordingly, our efforts to enforce our intellectual property rights around the world may be inadequate to obtain a significant commercial advantage from the intellectual property that we develop or license and may adversely impact our business. In addition, we and our partners also face the risk that our products are imported or reimported into markets with relatively higher prices from markets with relatively lower prices, which would result in a decrease of sales and any payments we receive from the affected market. Recent developments in U.S. patent law have made it more difficult to stop these and related practices based on theories of patent infringement. Changes in patent laws or patent jurisprudence could diminish the value of patents in general, thereby impairing our ability to protect our products. The America Invents Act or the AIA,(the AIA) was signed into law on September 16, 2011, and many of the substantive changes became effective on March 16, 2013. An important change introduced by the AIA is that, as of March 16, 2013, the United States transitioned to a "first-to-file"“first-to-file” system for deciding which party should be granted a patent when two or more patent applications are filed by different parties claiming the same invention. A third party that files a patent application in the USPTO after that date but before us could therefore be awarded a patent covering an invention of ours even if we had made the invention before it was made by the third party. This will require us to be cognizant going forward of the time from invention to filing of a patent application, but circumstances could prevent us from promptly filing patent applications on our inventions. Among some of the other changes introduced by the AIA are changes that limit where a patent holder may file a patent infringement suit and providing additional opportunities for third parties to challenge any issued patent in the USPTO. This applies to all of our owned and in-licensed U.S. patents, even those issued before March 16, 2013. Because of a lower evidentiary standard in USPTO proceedings compared to the evidentiary standard in U.S. federal courts necessary to invalidate a patent claim, a third party could potentially provide evidence in a USPTO proceeding sufficient for the USPTO to hold a claim invalid even though the same evidence would be insufficient to invalidate the claim if first presented in a district court action. Accordingly, a third party may attempt to use the USPTO procedures to invalidate our patent claims that would not have been invalidated if first challenged by the third party as a defendant in a district court action. The AIA and its implementation
Table of Contents
could increase the uncertainties and costs surrounding the prosecution of our patent applications and the enforcement or defense of our issued patents. Additionally, the U.S. Supreme Court has ruled on several patent cases in recent years, such asImpression Products, Inc. v. Lexmark International, Inc., Association for Molecular Pathology v. Myriad Genetics, IncInc..,Mayo Collaborative Services v. Prometheus Laboratories, Inc. andAlice Corporation Pty. Ltd. v. CLS Bank International, either narrowing the scope of patent protection available in certain circumstances or weakening the rights of patent owners in certain situations. In addition to increasing uncertainty with regard to our ability to obtain patents in the future, this combination of events has created uncertainty with respect to the value of patents, once obtained. Depending on decisions by the U.S. Congress, the federal courts, and the USPTO, the laws and regulations governing patents could change in unpredictable ways that could weaken our ability to obtain new patents or to enforce our existing patents and patents that we might obtain in the future. Obtaining and maintaining our patent protection depends on compliance with various procedural, document submission, fee payment and other requirements imposed by governmental patent agencies, and our patent protection could be reduced or eliminated for non-compliance with these requirements. The USPTO and various foreign governmental patent agencies require compliance with a number of procedural, documentary, fee payment and other provisions during the patent process. There are situations in which noncompliance can result in abandonment or lapse of a patent or patent application, resulting in partial or complete loss of patent rights in the relevant jurisdiction. In such an event, competitors might be able to enter the market earlier than would otherwise have been the case. In some cases, our licensors may be responsible for, for example, these payments, thereby decreasing our control over compliance with these requirements. If our trademarks and trade names are not adequately protected, then we may not be able to build name recognition in our markets of interest and our business may be adversely affected. Our registered or unregistered trademarks or trade names may be challenged, infringed, circumvented or declared generic or determined to be infringing on other marks. We may not be able to protect our rights to these trademarks and trade names, which we need to build name recognition by potential partners or customers in our markets of interest. At times, competitors may adopt trade names or trademarks similar to ours, thereby impeding our ability to build brand identity and possibly leading to market confusion. In addition, there could be potential trade name or trademark infringement claims brought by owners of other registered trademarks. Over the long term, if we are unable to establish name recognition based on our trademarks and trade names, then we may not be able to compete effectively and our business may be adversely affected. We may use third-party open source software components in future products, and failure to comply with the terms of the underlying open source software licenses could restrict our ability to sell such products. While our current products do not contain any software tools licensed by third-party authors under "open source"“open source” licenses, we may choose to use open source software in future products. Use and distribution of open source software may entail greater risks than use of third-party commercial software, as open source licensors generally do not provide warranties or other contractual protections regarding infringement claims or the quality of the code. Some open source licenses may contain requirements that we make available source code for modifications or derivative works we create based upon the type of open source software we use. If we combine our proprietary software with open source software in a certain manner, we could, under certain open source licenses, be required to release the source code of our proprietary software to the public. This would allow our competitors to create similar products with less development effort and time and ultimately could result in a loss of product sales.
Table of Contents
Although we intend to monitor any use of open source software to avoid subjecting our products to conditions we do not intend, the terms of many open source licenses have not been interpreted by U.S. courts, and there is a risk that any such licenses could be construed in a way that could impose unanticipated conditions or restrictions on our ability to commercialize our products. Moreover, we cannot assure investors that our processes for controlling our use of open source software in our products will be effective. If we are held to have breached the terms of an open source software license, we could be required to seek licenses from third parties to continue offering our products on terms that are not economically feasible, to re-engineer our products, to discontinue the sale of our products if re-engineering could not be accomplished on a timely basis, or to make generally available, in source code form, our proprietary code, any of which could adversely affect our business, operating results, and financial condition. We use third-party software that may be difficult to replace or may cause errors or failures of our products that could lead to lost customers or harm to our reputation. We use software licensed from third parties in our products. In the future, this software may not be available to us on commercially reasonable terms, or at all. Any loss of the right to use any of this software could result in delays in the production of our products until equivalent technology is either developed by us, or, if available, is identified, obtained and integrated, which could harm our business. In addition, any errors or defects in third-party software or other third-party software failures could result in errors, defects or cause our products to fail, which could harm our business and be costly to correct. Many of these providers attempt to impose limitations on their liability for such errors, defects or failures, and if enforceable, we may have additional liability to our customers or third-party providers that could harm our reputation and increase our operating costs. We will need to maintain our relationships with third-party software providers and to obtain software from such providers that does not contain any errors or defects. Any failure to do so could adversely impact our ability to deliver reliable products to our customers and could harm our reputation and results of operations. Numerous factors may limit any potential competitive advantage provided by our intellectual property rights. The degree of future protection afforded by our intellectual property rights is uncertain because intellectual property rights have limitations, and may not adequately protect our business, provide a barrier to entry against our competitors or potential competitors, or permit us to maintain our competitive advantage. Moreover, if a third party has intellectual property rights that cover the practice of our technology, we may not be able to fully exercise or extract value from our intellectual property rights. The following examples are illustrative: •others may be able to develop and/or practice technology that is similar to our technology or aspects of our technology but that is not covered by the claims of any patents that have issued, or may issue, from our owned or in-licensed patent applications;
•we might not have been the first to make the inventions covered by a pending patent application that we own or license;
•we might not have been the first to file patent applications covering an invention;
•others may independently develop similar or alternative technologies without infringing our intellectual property rights;
•pending patent applications that we own or license may not lead to issued patents;
•patents, if issued, that we own or license may not provide us with any competitive advantages, or may be held invalid or unenforceable, as a result of legal challenges by our competitors;
| ● | others may be able to develop and/or practice technology that is similar to our technology or aspects of our technology but that is not covered by the claims of any patents that have issued, or may issue, from our owned or in-licensed patent applications; |
| ● | we might not have been the first to make the inventions covered by a pending patent application that we own or license; |
| ● | we might not have been the first to file patent applications covering an invention; |
| ● | others may independently develop similar or alternative technologies without infringing our intellectual property rights; |
| ● | pending patent applications that we own or license may not lead to issued patents; |
| ● | patents, if issued, that we own or license may not provide us with any competitive advantages, or may be held invalid or unenforceable, as a result of legal challenges by our competitors; |
| ● | third parties may compete with us in jurisdictions where we do not pursue and obtain patent protection; |
| ● | we may not be able to obtain and/or maintain necessary or useful licenses on reasonable terms or at all; |
| ● | third parties may assert an ownership interest in our intellectual property and, if successful, such disputes may preclude us from exercising exclusive rights over that intellectual property; |
| ● | we may not be able to maintain the confidentiality of our trade secrets or other proprietary information; |
| ● | we may not develop or in-license additional proprietary technologies that are patentable; and |
| ● | the patents of others may have an adverse effect on our business. |
Table of Contents
•third parties may compete with us in jurisdictions where we do not pursue and obtain patent protection;
•we may not be able to obtain and/or maintain necessary or useful licenses on reasonable terms or at all;
•third parties may assert an ownership interest in our intellectual property and, if successful, such disputes may preclude us from exercising exclusive rights over that intellectual property;
•we may not be able to maintain the confidentiality of our trade secrets or other proprietary information;
•we may not develop or in-license additional proprietary technologies that are patentable; and
•the patents of others may have an adverse effect on our business.
Should any of these events occur, they could significantly harm our business and results of operations. Risks Related to Our Common Stock and Being a Public Company We expect that our stock price may fluctuate significantly. The market price of shares of our common stock has been and could continue to be subject to wide fluctuations in response to many risk factors listed in this section, and others beyond our control, including: •actual or anticipated fluctuations in our financial condition and operating results;
•announcements by us, our partners or our competitors of new products, significant contracts, strategic partnerships, joint ventures, collaborations, acquisitions, commercial relationships or capital commitments;
•competition from existing products or new products that may emerge;
•failure to meet or exceed financial estimates and projections of the investment community or that we provide to the public;
•issuance of new or updated research or reports by securities analysts or recommendations for our stock;
•adverse regulatory announcements;
•disputes or other developments related to proprietary rights, including patents, litigation matters, and our ability to obtain patent protection for our technologies;
•commencement of, or our involvement in, litigation;
•fluctuations in the valuation of companies perceived by investors to be comparable to us;
•conditions in our markets;
•manufacturing disputes or delays;
•any future sales of our common stock or other securities;
•any change to the composition of the board of directors or key personnel;
•general economic conditions and slow or negative growth of our markets;
•share price and volume fluctuations attributable to inconsistent trading volume levels of our shares;
•announcement or expectation of additional debt or equity financing efforts; and
| ● | actual or anticipated fluctuations in our financial condition and operating results; |
| ● | announcements by us, our partners or our competitors of new products, significant contracts, strategic partnerships, joint ventures, collaborations, acquisitions, commercial relationships or capital commitments; |
Table of Contents •other factors described in this Risk Factor section of this Annual Report on Form 10-K.
| ● | competition from existing products or new products that may emerge; |
| ● | failure to meet or exceed financial estimates and projections of the investment community or that we may provide to the public; |
| ● | issuance of new or updated research or reports by securities analysts or recommendations for our stock; |
| ● | positive or adverse regulatory announcements; |
| ● | disputes or other developments related to proprietary rights, including patents, litigation matters, and our ability to obtain patent protection for our technologies; |
| ● | commencement of, or our involvement in, litigation; |
| ● | fluctuations in the valuation of companies perceived by investors to be comparable to us; |
| ● | conditions in our markets; |
| ● | manufacturing disputes or delays; |
| ● | any future sales of our common stock or other securities; |
| ● | any change to the composition of our board of directors or key personnel; |
| ● | general economic conditions and slow or negative growth of our markets; |
| ● | share price and volume fluctuations attributable to inconsistent trading volume levels of our shares; |
| ● | announcement or expectation of additional debt or equity financing efforts; and |
| ● | other factors described in this Risk Factors section of this Annual Report on Form 10-K. |
These and other market and industry factors may cause the market price and demand for our common stock to fluctuate substantially, regardless of our actual operating performance, which may limit or prevent investors from readily selling their shares of common stock and may otherwise negatively affect the liquidity of our common stock. In addition, the stock market in general, and life science companies in particular, have experienced extreme price and volume fluctuations that have often been unrelated or disproportionate to the operating performance of these companies. In the past, when the market price of a stock has been volatile, holders of that stock have on occasion instituted securities class action litigation against the company that issued the stock. If any of our stockholders were to bring a lawsuit against us, the defense and disposition of the lawsuit could be costly and divert the time and attention of our management and harm our operating results. If securities or industry analysts do not publish research reports about our business, or if they issue an adverse opinion about our business, our stock price and trading volume could decline. The trading market for our common stock will be influenced by the research and reports that industry or securities analysts publish about us or our business. If one or more of the analysts who cover us issues an adverse opinion about our company, our stock price would likely decline. If one or more of these analysts ceases coverage of us or fails to regularly publish reports on us, we could lose visibility in the public markets, which could cause our stock price or trading volume to decline. Our principal stockholders and management own a significant percentage of our stock and will be able to exercise significant influence over matters subject to stockholder approval. As of December 31, 2018,2020, our executive officers and directors, and 5%entities affiliated with our executive officers and directors, owned or greater stockholders ownedcontrolled approximately 56.9%17.4% of our outstanding common stock. Accordingly, our executive officers, directors and principal stockholders have significant influence over our operations. This concentration of ownership could have the effect of delaying or preventing a change in our control or otherwise discouraging a potential acquirer from attempting to obtain control of us, which in turn could have a material adverse effect on our stock price and may prevent attempts by our stockholders to replace or remove the board of directors or management. We have never paid dividends on our capital stock, and we do not anticipate paying any dividends in the foreseeable future. Consequently, any gains from an investment in our common stock will likely depend on whether the price of our common stock increases. We have not paid dividends on any of our classes of capital stock to date and we currently intend to retain our future earnings, if any, to fund the development and growth of our business. In addition, the terms of our indebtedness with Hercules Capital Inc. (Hercules) (formally known as Hercules Technology Growth Capital, Inc.) prohibit us from paying dividends. As a result, capital appreciation, if any, of our common stock will be your sole source of gain for the foreseeable future. Consequently, in the foreseeable future, you will likely only experience a gain from an investment in our common stock if the price of our common stock increases. Anti-takeover provisions contained in our restated certificate of incorporation and restated by-laws, as well as provisions of Delaware law, could impair a takeover attempt. Our restated certificate of incorporation, restated by-laws and Delaware law contain provisions which could have the effect of rendering more difficult, delaying or preventing an acquisition deemed undesirable by our board of directors. Our corporate governance documents include provisions: •authorizing our board of directors to issue up to 5,000,000 shares of preferred stock without stockholder approval upon the terms and conditions and with the rights, privileges and preferences as our board of directors may determine;
| ● | authorizing our board of directors to issue up to 5,000,000 shares of preferred stock without stockholder approval upon the terms and conditions and with the rights, privileges and preferences as our board of directors may determine; |
| ● | specifying that special meetings of our stockholders can be called only by our board of directors and that our stockholders may not act by written consent; |
| ● | establishing an advance notice procedure for stockholder proposals to be brought before an annual meeting of our stockholders, including proposed nominations of persons for election to our board of directors; |
| ● | providing that directors may be removed only for cause; |
| ● | providing that our board of directors may create new directorships and that vacancies on our board of directors may be filled only by a majority of directors then in office, even though less than a quorum; |
| ● | establishing that our board of directors is divided into three classes—Class I, Class II, and Class III—with each class serving staggered three-year terms; |
| ● | providing that our board of directors may amend our restated by-laws without stockholder approval; and |
| ● | requiring a super-majority of votes to amend certain of the above-mentioned provisions. |
Table of Contents
•specifying that special meetings of our stockholders can be called only by our board of directors and that our stockholders may not act by written consent;
•establishing an advance notice procedure for stockholder proposals to be brought before an annual meeting of our stockholders, including proposed nominations of persons for election to our board of directors;
•providing that directors may be removed only for cause;
•providing that our board of directors may create new directorships and that vacancies on our board of directors may be filled only by a majority of directors then in office, even though less than a quorum;
•establishing that our board of directors is divided into three classes—Class I, Class II, and Class III—with each class serving staggered three-year terms;
•providing that our board of directors may amend our restated by-laws without stockholder approval; and
•requiring a super-majority of votes to amend certain of the above-mentioned provisions.
These provisions, alone or together, could delay or prevent hostile takeovers and changes in control or changes in our management. As a Delaware corporation, we are also subject to provisions of Delaware law, including Section 203 of the Delaware General Corporation law, which prevents some stockholders holding more than 15% of our outstanding common stock from engaging in certain business combinations without approval of the holders of substantially all of our outstanding common stock. Any provision of our restated certificate of incorporation, restated by-laws or Delaware law that has the effect of delaying or deterring a change in control could limit the opportunity for our stockholders to receive a premium for their shares of our common stock, and could also affect the price that some investors are willing to pay for our common stock. We are an "emerging“emerging growth company"company” and are able to avail ourselves of reduced disclosure requirements applicable to emerging growth companies, and we plan to avail ourselves of the ability to adopt new accounting standards on the timeline permitted for private companies, which could make our common stock less attractive to investors and our financial statements less comparable to other companies who are complying with new accounting standards on public company timelines. We are an "emerging“emerging growth company,"” as defined in the Jumpstart Our Business Startups Act of 2012, as amended (the JOBS Act,Act), and we intend to take advantage of certain exemptions from various reporting requirements that are applicable to other public companies that are not "emerging“emerging growth companies,"” including not being required to comply with the auditor attestation requirements of Section 404(b) of the Sarbanes-Oxley Act, reduced disclosure obligations regarding executive compensation in our periodic reports and proxy statements, and exemptions from the requirements of holding a nonbinding advisory vote on executive compensation and stockholder approval of any golden parachute payments not previously approved. In addition, Section 107 of the JOBS Act also provides that an emerging growth company can take advantage of the extended transition period provided in Section 7(a)(2)(B) of the Securities Act for complying with new or revised accounting standards. In other words, an emerging growth company can delay the adoption of certain accounting standards until those standards would otherwise apply to private companies. We have elected to take advantage of the extended transition period afforded by the JOBS Act for the implementation of new or revised accounting standards and, as a result, will comply with new or revised accounting standards not later than the relevant dates on which adoption of such standards is required for non-public companies. As a result of this election, the timeline to comply with certain accounting standards will in many cases be delayed as compared to other public companies who
Table of Contents
are not eligible to have made or have not made this election. As a result, investors may view our financial statements as not comparable to other public companies. We cannot predict if investors will find our common stock less attractive because we may rely on these exemptions. If some investors find our common stock less attractive as a result, there may be a less active trading market for our common stock and our stock price may be more volatile. We may take advantage of these reporting exemptions until we are no longer an emerging growth company. We will remain an emerging growth company until the earliest of (i) the last day of the fiscal year in which we have total annual gross revenue of $1.07 billion or more; (ii) December 31, 2022; (iii) the date on which we have issued more than $1.0 billion in nonconvertible debt during the previous three years; or (iv) the date on which we are deemed to be a large accelerated filer under the rules of the SEC. We incur increased costs and devote substantial management time as a result of operating as a public company. As a public company, we incur significant legal, accounting and other expenses that we did not incur as a private company, and these expenses may increase even more after we are no longer an "emerging“emerging growth company."” We are subject to the reporting requirements of the Exchange Act, the Sarbanes-Oxley Act, the Dodd-Frank Wall Street Reform and Protection Act, as well as rules adopted, and to be adopted, by the SEC and The Nasdaq Global Market. Our management and other personnel devote a substantial amount of time to these compliance initiatives. Moreover, these rules and regulations substantially increase our legal and financial compliance costs and make some activities more time-consuming and costly. The increased costs increase our net loss. For example, we expect these rules and regulations to make it more difficult and more expensive for us to obtain director and officer liability insurance and we may be required to incur substantial costs to maintain the sufficient coverage. We cannot predict or estimate the amount or timing of additional costs we may incur to respond to these requirements. The impact of these requirements could also make it more difficult for us to attract and retain qualified persons to serve on our board of directors, our board committees or as executive officers. In addition, as a public company we incur additional costs and obligations in order to comply with SEC rules that implement Section 404 of the Sarbanes-Oxley Act. Under these rules, beginning with this annual report for the year ending December 31, 2018, we are required to make a formal assessment of the effectiveness of our internal control over financial reporting, and once we cease to be an emerging growth company, which we expect to occur during our current fiscal year, we will be required to include an attestation report on internal control over financial reporting issued by our independent registered public accounting firm.firm, effective with our Annual Report for the fiscal year ending December 31, 2021. To achieve timely compliance with Section 404, we engaged in a process to document and evaluate our internal control over financial reporting, which was both costly and challenging. The process of obtaining the attestation report from our independent registered public accounting firm will be significantly more costly and will require the devotion of significant management attention and resources. We will need to continue to dedicate internal resources, engage outside consultants and adopt a detailed work plan to assess and document the adequacy of our internal control over financial reporting, continue steps to improve control processes as appropriate, validate through testing that controls are designed and operating effectively, and implement a continuous reporting and improvement process for internal control over financial reporting. If we identify one or more material weaknesses, it could result in an adverse reaction in the financial markets due to a loss of confidence in the reliability of our financial statements. Item 1B. UNRESOLVED STAFF COMMENTS
Not applicable. Item 2. PROPERTIES
We currently lease approximately 30,65591,600 square feet of office, laboratory, and manufacturing space at our headquarters in Lexington, Massachusetts, under a lease that was to expire on June 30, 2020 (the "Lexington Lease"). In addition, pursuant to our acquisition of Aushon Biosystems, Inc. on
Table of Contents
January 30, 2018, we currently lease approximately 21,500 square feet of office, laboratory, and manufacturing space in Billerica, Massachusetts, under a lease that was to expire on February 28, 2021 (the "Billerica Lease").
In August 2018, we exercised an option to terminate the Billerica Lease effective as of September 1, 2019. In October 2018, we also notified the landlord of our intent to sublease all of the premises subject to the Lexington Lease from June 1, 2019 until the end of the lease term. The landlord has exercised its right to "recapture" the premises during that period, and, accordingly, the Lexington Lease will terminate as of May 31, 2019.
On October 2, 2018, we entered into a lease for approximately 91,600 square feet of office, laboratory, and manufacturing space in the building located at 900 Middlesex Turnpike, Billerica, Massachusetts. The premises covered by this new lease will serve as our new principal office and laboratory space beginning in the second quarter of 2019.space. The initial term of the lease is 11 years and five months beginning on April 1, 2019, and we have the option to extend the lease for two additional five-year periods. We believe that this office, laboratory and manufacturing space will be sufficient to meet our needs for the foreseeable future.
In addition, our subsidiary, Uman, leases a total of approximately 6,500 square feet of office, laboratory, manufacturing and storage space in Umeå, Sweden. These leases expire at various dates between May 31, 2020 and February 28, 2023. Item 3. LEGAL PROCEEDINGS
We are not currently a party to any material legal proceedings. Item 4. MINE SAFETY DISCLOSURES
Not applicable.
Table of Contents
PART II
Item 5. MARKET FOR REGISTRANT'SREGISTRANT’S COMMON EQUITY, RELATED STOCKHOLDER MATTERS AND ISSUER PURCHASES OF EQUITY SECURITIES
Market Information Our common stock began tradingis traded on The Nasdaq Global Market on December 7, 2017 under the symbol "QTRX."“QTRX.” Stockholders As of March 1, 2019,2021, there were approximately 5339 stockholders of record of the 22,461,20236,267,609 outstanding shares of common stock. Unregistered Sales of Securities There were no unregistered sales of equity securities during the fourth quarter ended December 31, 2018.2020. Use of Proceeds from Initial Public Offering of Common Stock
On December 11, 2017, we completed the initial public offering of our common stock, which resulted in the sale of 4,916,480 shares, including 641,280 shares sold by us pursuant to the exercise in full by the underwriters of their option to purchase additional shares in connection with the initial public offering, at a price to the public of $15.00 per share. The offer and sale of all of the shares in our initial public offering was registered under the Securities Act pursuant to a registration statement on Form S-1 (File No. 333-221475), which was declared effective by the SEC on December 6, 2017, and a registration statement on Form S-1 (File No. 333-221932) under Rule 462(b) of the Securities Act that became effective upon its filing. Following the sale of all of the shares in connection with the closing of our initial public offering, the offering terminated. J.P. Morgan Securities LLC, Leerink Partners LLC and Cowen and Company, LLC acted as joint book-running managers for the initial public offering. BTIG, LLC and Evercore Group L.L.C. acted as a co-managers.
We received approximately $65.6 million in net proceeds after deducting underwriting discounts and commissions and offering costs payable by us. As of December 31, 2018, we had used approximately $21.1 million of the net proceeds from the offering for: operating expenses, capital investments, debt payments and the acquisition of Aushon. None of the offering expenses consisted of direct or indirect payments made by us to directors, officers or persons owning 10% or more of our common stock or to their associates, or to our affiliates, and we have not used any of the net proceeds from the offering to make payments, directly or indirectly, to any such persons. There has been no material change in the planned use of the net proceeds from our initial public offering as described in our final prospectus filed with the SEC on December 7, 2017 pursuant to Rule 424(b)(4) under the Securities Act.
Issuer Purchases of Equity Securities Not applicable.
Table of Contents
Item 6. SELECTED FINANCIAL DATA
You should read the following selected financial data together with our consolidated financial statements and the related notes and the information under the caption "Management's“Management’s Discussion and Analysis of Financial Condition and Results of Operations"Operations” included elsewhere in this Annual Report on Form 10-K. We have derived the statement of operations data for the years ended December 31, 2018, 20172020, 2019, and 20162018 and the balance sheet data as of December 31, 20182020 and 20172019 from our audited consolidated financial statements included elsewhere in this Annual Report on Form 10-K. Note that the results for the year ended December 31, 2018 include activity related to the acquisition of Aushon, which occurred on January 30, 2018.1, 2018, and the results for the year ended December 31, 2019 include activity from the acquisition of Uman, which was finalized on August 1, 2019. The statement of operations data for the yearyears ended December 31, 2015,2017 and 2016, and the selected balance sheet data as of December 31, 20162018, 2017, and 20152016 is derived from audited financial statements that are not included in this Annual Report on Form 10-K. Our historical results are not necessarily indicative of the results that should be expected in the future.future. Consolidated statement of operations data (in thousands, except per share data) | | | | | | | | | | | | | |
| | Year ended December 31, | |
|---|
| | 2018 | | 2017 | | 2016 | | 2015 | |
|---|
Total revenue | | $ | 37,632 | | $ | 22,874 | | $ | 17,585 | | $ | 12,180 | | Cost of revenue | | | 19,684 | | | 12,887 | | | 9,837 | | | 6,465 | | | | | | | | | | | | | | | | | Gross Profit | | | 17,948 | | | 9,987 | | | 7,748 | | | 5,715 | | Research and development | | |
15,805 | | |
16,304 | | |
16,993 | | |
10,083 | | Selling, general and administrative | | | 33,693 | | | 19,688 | | | 12,466 | | | 10,155 | | | | | | | | | | | | | | | | | Total operating expenses | | | 49,498 | | | 35,992 | | | 29,459 | | | 20,238 | | Loss from operations | | | (31,550 | ) | | (26,005 | ) | | (21,711 | ) | | (14,523 | ) | Interest income (expense), net | | | 46 | | | (951 | ) | | (1,298 | ) | | (1,040 | ) | Other income (expense), net | | | (7 | ) | | (63 | ) | | (164 | ) | | (380 | ) | | | | | | | | | | | | | | | | Loss before income taxes | | | (31,511 | ) | | (27,019 | ) | | (23,173 | ) | | (15,943 | ) | Income tax provision | | | (25 | ) | | — | | | — | | | — | | | | | | | | | | | | | | | | | Net loss | | | (31,536 | ) | | (27,019 | ) | | (23,173 | ) | | (15,943 | ) | Accretion and accrued dividends on redeemable convertible preferred stock | | | — | | | (4,166 | ) | | (4,445 | ) | | (4,355 | ) | | | | | | | | | | | | | | | | Net loss attributable to common stockholders | | $ | (31,536 | ) | $ | (31,185 | ) | $ | (27,618 | ) | | (20,298 | ) | Net loss per share attributable to common stockholders, basic and diluted | | $ | (1.43 | ) | $ | (8.30 | ) | $ | (12.89 | ) | $ | (11.19 | ) | | | | | | | | | | | | | | | | Weighted-average common shares outstanding | | | 21,994 | | | 3,757 | | | 2,143 | | | 1,813 | | | | | | | | | | | | | | | | |
| | | | | | | | | | | | | | | | | | Year Ended December 31, | | | 2020 | | 2019 | | 2018 | | 2017 | | 2016 | Total revenue | | $ | 86,377 | | $ | 56,734 | | $ | 37,632 | | $ | 22,874 | | $ | 17,585 | Cost of revenue | | | 38,195 | | | 29,898 | | | 19,684 | | | 12,887 | | | 9,837 | Gross profit | | | 48,182 | | | 26,836 | | | 17,948 | | | 9,987 | | | 7,748 | Research and development | | | 20,174 | | | 16,190 | | | 15,805 | | | 16,304 | | | 16,993 | Selling, general and administrative | | | 59,592 | | | 52,246 | | | 33,693 | | | 19,688 | | | 12,466 | Total operating expenses | | | 79,766 | | | 68,436 | | | 49,498 | | | 35,992 | | | 29,459 | Loss from operations | | | (31,584) | | | (41,600) | | | (31,550) | | | (26,005) | | | (21,711) | Interest income (expense), net | | | (273) | | | 627 | | | 46 | | | (951) | | | (1,298) | Other expense, net | | | (49) | | | (10) | | | (7) | | | (63) | | | (164) | Loss before income taxes | | | (31,906) | | | (40,983) | | | (31,511) | | | (27,019) | | | (23,173) | Income tax benefit (provision) | | | 376 | | | 187 | | | (25) | | | — | | | — | Net loss | | | (31,530) | | | (40,796) | | | (31,536) | | | (27,019) | | | (23,173) | Accretion and accrued dividends on redeemable convertible preferred stock | | | — | | | — | | | — | | | (4,166) | | | (4,445) | Net loss attributable to common stockholders | | $ | (31,530) | | $ | (40,796) | | $ | (31,536) | | $ | (31,185) | | $ | (27,618) | Net loss per share attributable to common stockholders, basic and diluted | | $ | (1.07) | | $ | (1.63) | | $ | (1.43) | | $ | (8.30) | | $ | (12.89) | Weighted-average common shares outstanding | | | 29,589 | | | 25,091 | | | 21,994 | | | 3,757 | | | 2,143 |
Consolidated balance sheet data (in thousands) | | | | | | | | | | | | | | | | | | As of December 31, | | | 2020 | | 2019 | | 2018 | | 2017 | | 2016 | Cash and cash equivalents | | $ | 181,584 | | $ | 109,155 | | $ | 44,429 | | $ | 79,682 | | $ | 29,671 | Total assets | | $ | 271,045 | | $ | 169,951 | | $ | 67,611 | | $ | 91,779 | | $ | 37,117 | Total long term debt | | $ | 7,673 | | $ | 7,587 | | $ | 7,623 | | $ | 9,382 | | $ | 10,243 | Total redeemable convertible preferred stock | | $ | — | | $ | — | | $ | — | | $ | — | | $ | 128,585 | Total stockholders’ deficit | | $ | 206,125 | | $ | 128,658 | | $ | 41,065 | | $ | 65,866 | | $ | (115,109) |
| | | | | | | | | | | | | |
| | As of December 31, | |
|---|
| | 2018 | | 2017 | | 2016 | | 2015 | |
|---|
Cash and cash equivalents | | $ | 44,429 | | $ | 79,682 | | $ | 29,671 | | | 2,323 | | Total assets | | | 67,611 | | | 91,779 | | | 37,117 | | | 7,351 | | Total long term debt | | | 7,623 | | | 9,382 | | | 10,243 | | | 9,726 | | Total redeemable convertible preferred stock | | | — | | | — | | | 128,585 | | | 73,445 | | Total Stockholders' equity (deficit) | | | 41,065 | | | 65,866 | | | (115,109 | ) | | (88,640 | ) |
Table of Contents Item 7. MANAGEMENT'SMANAGEMENT’S DISCUSSION AND ANALYSIS OF FINANCIAL CONDITION AND RESULTS OF OPERATIONS
The following discussion and analysis of our financial condition and results of operations should be read in conjunction with our consolidated financial statements and related notes included elsewhere in this Annual Report on Form 10-K. In addition to historical consolidated financial information, the following discussion contains forward-looking statements that reflect our plans, estimates and beliefs. Our actual results could differ materially from those discussed in the forward-looking statements. See "Special“Special Note Regarding Forward-Looking Statements."” Factors that could cause or contribute to these differences include those discussed below and elsewhere in this Annual Report on Form 10-K, particularly in "Risk“Risk Factors."” Overview We are a life sciences company that has developed next generation, ultra-sensitive digital immunoassay platforms that advance precision health for life sciences research and diagnostics. Our platforms are based on our proprietary digital "Simoa"“Simoa” detection technology. Our Simoa bead-based and planar array platforms enable customers to reliably detect protein biomarkers in extremely low concentrations in blood, serum and other fluids that, in many cases, are undetectable using conventional, analog immunoassay technologies, and also allow researchers to define and validate the function of novel protein biomarkers that are only present in very low concentrations and have been discovered using technologies such as mass spectrometry. These capabilities provide our customers with insight into the role of protein biomarkers in human health that has not been possible with other existing technologies and enable researchers to unlock unique insights into the continuum between health and disease. We believe this greater insight will enable the development of novel therapies and diagnostics and facilitate a paradigm shift in healthcare from an emphasis on treatment to a focus on earlier detection, monitoring, prognosis and, ultimately, prevention. We are currently focusing on protein detection, which we believe is an area of significant unmet need and where we have significant competitive advantages. However, in addition to enabling new applications and insights in protein analysis, we are also developing our Simoa bead-based technology to detectplatforms have also demonstrated applicability across other testing applications, including detection of nucleic acids in biological samples.and small molecules. We currently sell allmost of our products for life science research, primarily to laboratories associated with academic and governmental research institutions, as well as pharmaceutical, biotechnology and contract research companies, through a direct sales force and support organizations in North America and Europe, and through distributors or sales agents in other select markets, including Australia, Brazil, China, Czech Republic, China, India, Israel, Japan, Lebanon, Mexico, Qatar, Saudi Arabia, Singapore, South Korea Lebanon, Qatar, Singapore and Taiwan. We grew our revenue from $22.9 million in 2017 to $37.6 million in 2018. Our instruments are designed to be used either with assays fully developed by us, including all antibodies and supplies required to run the tests, or with "homebrew"“homebrew” kits where we supply some of the components required for testing, and the customer supplies the remaining required elements. Accordingly, our installed instruments generate a recurring revenue stream. We believe that our recurring consumable revenue is driven by our customers'customers’ ability to extract more valuable data using our platform and to process a large number of samples quickly with little hands-on preparation. We commercially launched our first immunoassay platform, the Simoa HD-1, instrument in January 2014. The HD-1 is based on our bead-based technology, and assays run on the HD-1 are fully automated. We initiated commercial launch of the SR-X instrument in December 2017. The SR-X utilizes the same Simoa bead-based technology and assay kits as the HD-1 Analyzer in a compact benchtop form with a lower price point, more flexible assay preparation, and a wider range of applications. WhileIn July 2019, we expectlaunched the SR-X to generate lower consumables revenue per instrument thanSimoa HD-X, an upgraded version of the Simoa HD-1, Analyzer duewhich replaces the HD-1. The HD-X has been designed to its lower throughput,deliver significant productivity and operational efficiency improvements, as well as greater user flexibility. We began shipping and installing HD-X instruments at customer locations in 2019. As the installed base of the Simoa instruments increases, total consumables revenue overall is expected to increase. We believe that consumables revenue should be subject to less period-to-period
Table of Contents
fluctuation than our instrument sales revenue, and will become an increasingly important contributor to our overall revenue. On January 30, 2018, we acquired Aushon Biosystems, Inc. for $3.2 million in cash, with an additional payment of $0.8 million made in July 2018, six months after the acquisition date. With the acquisition of Aushon, we acquired a CLIA certified laboratory, as well as Aushon'sAushon’s proprietary sensitive planar array detection technology. Leveraging our proprietary sophisticated Simoa image analysis and data analysis algorithms, we further refined this planar array technology to develop the SP-X instrument to provide the same Simoa sensitivity found in our Simoa bead-based platform. We initiated an early-access program for the SP-X instrument in January 2019, with the full commercial launch planned forcommenced in April 2019. On August 1, 2019, we completed our acquisition of Uman for an aggregate purchase price of $21.2 million, comprised of (i) $15.7 million in cash plus (ii) 191,152 shares of our common stock (representing $5.5 million based on the closing prices of our common stock on the Nasdaq Global Market on July 1, 2019 and August 1, 2019, the dates of issuance). The acquisition closed with respect to 95% of the outstanding shares of capital stock of Uman on July 1, 2019 and with respect to the remaining 5% of the outstanding shares of capital stock of Uman on August 1, 2019. Uman supplies neurofilament light (Nf-L) antibodies and ELISA kits, which are widely recognized by researchers and biopharmaceutical and diagnostics companies world-wide as the premier solution for the detection of Nf-L to advance the development of therapeutics and diagnostics for neurodegenerative conditions. On September 29, 2020, we entered the Abbott License Agreement with Abbott. Pursuant to the terms of the Abbott License Agreement, we granted Abbott a non-exclusive, worldwide, royalty-bearing license, without the right to sublicense, under our bead-based single molecule detection patents in the field of IVD. Abbott paid an initial license fee of $10.0 million in connection with the execution of the Abbott License Agreement, which was recognized as license revenue for the year ended December 31, 2020. Abbott has also agreed to pay us milestone fees subject to the achievement by Abbott of certain development, regulatory and commercialization milestones and low single digit royalties on net sales of licensed products. We are subject to ongoing uncertainty concerning the COVID-19 pandemic, including its length and severity and its effect on our business. During the first and second quarters of 2020, we implemented a resiliency plan focused on the health and safety of our employees and maintaining continuity of our operations. We have seen an impact on instrument revenue due to limitations on our ability to access certain customer sites and complete instrument installations, as well as an impact on consumables revenue from interruptions in certain customer laboratories. We expect these COVID-19 related challenges to continue until these customers return to normal operations. In view of the pandemic, we have adjusted our operations to expand capacity in our Accelerator Laboratory to support customers whose operations have been disrupted and to sustain clinical trials. We also determined that our cytokine assay technology provides researchers with important and differentiated tools to study disease progression, cytokine release syndrome, and patient-treatment response in the fight against COVID-19, and began developing a SARS- CoV-2 semi-quantitative IgG assay and a SARS-CoV-2 antigen detection assay, and prototyping a high-definition multiplex SARS-CoV-2 serology assay. In December 2020, the FDA issued an EUA for our Simoa Semi-Quantitative SARS-CoV-2 IgG Antibody Test, and in January 2021, the FDA issued an EUA for our Simoa SARS-CoV-2 N Protein Antigen Test, each of which is run on our HD-X instrument. We currently intend to pursue authorization for additional sample types, including nasal swabs, saliva, and capillary dried blood obtained from a fingerstick. Preliminary clinical research studies suggest the viral antigen may be readily detectable in asymptomatic and pre-symptomatic patients, and we are exploring extending the test to screening applications, home-based sample collection and pooling to enable larger scale testing. In September 2020, we entered into WP2 with the NIH under the RADx program. This contract, which has a total award value of $18.2 million, is intended to accelerate the continued development, scale-up and deployment of our novel SARS-CoV-2 antigen test. Initial early feasibility of this test was funded in part through WP1 we were granted in June 2020. WP2 supports clinical validation of the test in support of the EUA submissions with the FDA, and provides funding to expand assay kit manufacturing capacity and commercial deployment readiness. Contract funding is subject to achievement of pre-defined milestones and the contract period runs through September 2021. The COVID-19 situation remains dynamic and there remains significant uncertainty as to the length and severity of the pandemic, the actions that may be taken by government authorities, the impact to the business of our customers and suppliers, the long-term economic implications and other factors identified in “Part I, Item 1A, Risk Factors” of this Annual Report on Form 10-K. We will continue to evaluate the nature and extent of the impact to our business, financial condition, and operating results. As of December 31, 2018,2020, we had cash and cash equivalents of $44.4$181.6 million. Since inception, we have incurred annual net losses. Our net loss was $31.5 million, $27.0$40.8 million, and $23.2$31.5 million for the years ended December 31, 2018, 20172020, 2019, and 2016,2018, respectively. As of December 31, 2018,2020, we had an accumulated deficit of $175.9$247.8 million and stockholders' equity of $41.1$206.1 million. We expect to continue to incur significant expenses and operating losses at least through the next 24 months. We expect our expenses will increase substantially as we: • | ● | expand our sales and marketing efforts to further commercialize our products; |
| ● | strategically acquire companies or technologies that may be complementary to our business; |
| ● | expand our research and development efforts to improve our existing products and develop and launch new products, particularly if any of our products are deemed by the FDA to be medical devices or otherwise subject to additional regulation by the FDA; |
| ● | seek PMA or 510(k) clearance from the FDA for our existing products or new products if or when we decide to market products for use in the prevention, diagnosis or treatment of a disease or other condition; |
| ● | hire additional personnel and continue to grow our employee headcount; |
| ● | enter into collaboration arrangements, if any, or in-license other products and technologies; |
| ● | add operational, financial and management information systems; and |
| ● | continue to incur increased costs as a result of operating as a public company. |
Financial Operations Overview Revenue UnderFinancial Accounting Standards Board (FASB) Accounting Standards Codification (ASC) Topic 606 - Revenue from Contracts with Customers (ASC 606), an entity recognizes revenue when its customer obtains control of promised goods or services, in an amount that reflects the consideration that the entity expects to receive in exchange for those goods or services. To determine revenue recognition for arrangements that an entity determines are within the scope of ASC 606, the entity performs the following five steps: (i) identify the contract(s) with a customer; (ii) identify the performance obligations in the contract; (iii) determine the transaction price, including variable consideration, if any; (iv) allocate the transaction price to the performance obligations in the contract; and marketing efforts(v) recognize revenue when (or as) the entity satisfies a performance obligation. We only apply the five-step model to further commercialize our products;
•strategically acquire companiescontracts when it is probable that the entity will collect the consideration to which it is entitled in exchange for the goods or technologies that may be complementaryservices it transfers to our business;
•expand our research and development efforts to improve our existing products and develop and launch new products, particularly if any of our products are deemed by the United States Food and Drug Administration, or FDA,customer.Once a contract is determined to be medical deviceswithin the scope of ASC 606, we assess the goods or otherwiseservices promised within each contract and determine those that are performance obligations. Arrangements that include rights to additional goods or services that are exercisable at a customer’s discretion are generally considered options. We assess if these options provide a material right to the customer and if so, they are considered performance obligations. The identification of material rights requires judgments related to the determination of the value of the underlying license relative to the option exercise price, including assumptions about technical feasibility and the probability of developing a candidate that would be subject to additional regulationthe option rights. The exercise of a material right is accounted for as a contract modification for accounting purposes. The transaction price is then determined and allocated to the identified performance obligations in proportion to their standalone selling prices (SSP) on a relative SSP basis. SSP is determined at contract inception and is not updated to reflect changes between contract inception and when the performance obligations are satisfied. Determining the SSP for performance obligations requires significant judgment. In developing the SSP for a performance obligation, we consider applicable market conditions and relevant entity-specific factors, including factors that were contemplated in negotiating the agreement with the customer and estimated costs. We validate the SSP for performance obligations by the FDA;
•seek premarket approval, or PMA, or 510(k) clearance from the FDA for our existing products or new products if or when we decide to market products for useevaluating whether changes in the prevention, diagnosis or treatmentkey assumptions used to determine the SSP will have a significant effect on the allocation of a disease or other condition;
•build out our new facility as we continue to grow our employee headcount;
•hire additional personnel;
•enter into collaboration arrangements, if any, or in-license other products and technologies;
•add operational, financial and management information systems; and
•incur increased costs as a result of operating as a public company.Financial Operations Overviewarrangement consideration between multiple performance obligations.
Revenue
We generate product revenue primarily from sales of our HD-X, HD-1, SR-X, and SP-X instruments and related reagents and other consumables. We currently sell our products for research use onlyRUO applications and our customers are primarily laboratories associated with academic and governmental research institutions, as well as pharmaceutical, biotechnology and contract research companies. Sales of our consumables have consistently increased due to an increasing number of instruments being installed in the field, all of which require certain of our consumables to run customers'customers’ specific tests. Consumable revenue consists of sales of complete assays which are developed internally by us, plus sales of "homebrew"“homebrew” kits which contain all the elements necessary to run tests with the exception of the specific antibodies utilized which are separately provided by the customer. Service and other revenue consists of testing services provided by us in our Accelerator Laboratory on behalf of certain research customers, in addition to warranty and other service-based revenue.
Table of Contents
Services provided in our Accelerator Laboratory include sample testing, homebrew assay development and custom assay development. Collaboration and license revenue consists of revenue associated with licensing our technology to third parties and for related services. The following table presents ourGrants received by us that do not require the transfer of goods or services to a customer are accounted for by analogy to International Accounting Standards (IAS) 20, Accounting for Government Grants and Disclosure of Government Assistance (IAS 20). Under IAS 20, we recognize revenue foras the periods indicated (in thousands):matching expense or asset is incurred or capitalized.
| | | | | | | | | | |
| | Year ended December 31, | |
|---|
| | 2018 | | 2017 | | 2016 | |
|---|
Product revenue | | $ | 23,365 | | $ | 14,124 | | $ | 10,601 | | Service and other revenue | | | 12,117 | | | 7,676 | | | 5,012 | | Collaboration and license revenue | | | 2,150 | | | 1,074 | | | 1,972 | | | | | | | | | | | | | | Total revenue | | $ | 37,632 | | $ | 22,874 | | $ | 17,585 | | | | | | | | | | | | | |
The following table reflects product revenue (in thousands) by geography and as a percentage of total product revenue, based on the billing address of our customers. North America consists of the United States, Canada and Mexico; EMEA consists of Europe, the Middle East, and Africa; and Asia Pacific includes Japan, China, South Korea, Singapore, Malaysia and Australia.
| | | | | | | | | | | | | | | | | | | |
| | Year ended December 31, | |
|---|
| | 2018 | | 2017 | | 2016 | |
|---|
North America | | $ | 13,365 | | | 57 | % | $ | 7,790 | | | 55 | % | $ | 6,816 | | | 64 | % | EMEA | | | 7,360 | | | 32 | % | | 4,435 | | | 31 | % | | 2,679 | | | 25 | % | Asia Pacific | | | 2,640 | | | 11 | % | | 1,899 | | | 13 | % | | 1,106 | | | 10 | % | | | | | | | | | | | | | | | | | | | | | | Total | | $ | 23,365 | | | 100 | % | $ | 14,124 | | | 100 | % | $ | 10,601 | | | 100 | % | | | | | | | | | | | | | | | | | | | | | |
Our revenue is denominated primarily in U.S. dollars. Our expenses are generally denominated in the currencies in which our operations are located, which is primarily in the United States. Changes in foreign currency exchange rates have not materially affected us to date; however, they may become material to us in the future as our operations outside of the United States expand.
Cost of Products, Services and Collaboration Revenue Cost of goods sold for products consists of HD-X, HD-1, and SR-X instrument costcosts from the manufacturer,manufacturer. Cost of goods sold for SP-X costconsists of costs based on the internal assembly of this item, rawitem. Raw material partspart costs, and associated freight, shipping and handling costs, contract manufacturer costs, salaries, and other personnel costs, royalties, stock-based compensation, overhead and other direct costs related to those sales recognizedare classified as product revenue in the period.cost of goods sold for products. Cost of goods sold for services consists of salaries and other personnel costs, royalties, stock-based compensation and facility costs associated with operating the Accelerator Laboratory on behalf of customers, in addition to costs related to warranties and other costs of servicing equipment at customer sites. Additionally, we incur costs related to cost of goods sold under the NIH RADx program. Cost of collaboration revenue consists of royalty expense due to third parties from revenue generated by collaboration or license deals.
Table of Contents
Research and Development Expenses Research and development expenses consist of salaries and other personnel costs, stock-based compensation, research supplies, third-party development costs for new products, materials for prototypes, and allocated overhead costs that include facility and other overhead costs. We have made substantial investments in research and development since our inception, and plan to continue to make substantial investments in the future. Our research and development efforts have focused primarily on the tasks required to support development and commercialization of new and existing products. We believe that our continued investment in research and development is essential to our long-term competitive position and expect these expenses to increase in future periods. Additionally, costs incurred related to grant revenue are recorded as research and development expenses. Selling, General and Administrative Expenses Selling, general and administrative expenses consist primarily of salaries and other personnel costs, and stock-based compensation for our sales and marketing, finance, legal, human resources and general management, as well as professional services, such as legal and accounting services. We expect selling, general and administrative expenses to increase in future periods as the number of sales, technical support and marketing and administrative personnel grows and we continue to introduce new products, broaden our customer base and grow our business. We also expect to incur additional expenses as a public company, including expenses related to compliance with the rules and regulations of the Securities and Exchange CommissionSEC and the Nasdaq Stock Market, additional insurance expenses, and expenses related to investor relations activities and other administrative and professional services. Critical Accounting Policies, Significant Judgments and Estimates Our consolidated financial statements and the related notes included elsewhere in this Annual Report on Form 10-K are prepared in accordance with accounting principles generally accepted in the United States. The preparation of these consolidated financial statements requires us to make estimates and assumptions that affect the reported amounts of assets, liabilities, revenue, costs and expenses and related disclosures. We base our estimates on historical experience and on various other assumptions that we believe to be reasonable under the circumstances. Changes in accounting estimates may occur from period to period. Accordingly, actual results could differ significantly from the estimates made by our management. We evaluate our estimates and assumptions on an ongoing basis. To the extent that there are material differences between these estimates and actual results, our future financial statement presentation, financial condition, results of operations and cash flows will be affected. We believe that the following critical accounting policies involve a greater degree of judgment and complexity than our other significant accounting policies. Accordingly, these are the policies we believe are the most critical to understanding and evaluating our consolidated financial condition and results of operations. Our significant accounting policies are more fully described in "Significant“Significant Accounting Policies"Policies” (Note 2) in the notes to our consolidated financial statements included elsewhere in this Annual Report on Form 10-K. Revenue Recognition We recognize revenue when (1) persuasive evidencea customer obtains control of a promised good or service. The amount of revenue recognized reflects consideration that we expect to be entitled to receive in exchange for these goods and services, incentives and taxes collected from customers, that are subsequently remitted to governmental authorities. We adopted ASC 606 on January 1, 2019, using the modified retrospective method for all contracts not completed as of the date of adoption. The reported results for 2020 and 2019 reflect the application of ASC 606 guidance. Product Revenue Our products are composed of analyzer instruments, assay kits and other consumables such as reagents. Products are sold directly to biopharmaceutical and academic research organizations or are sold through distributors in EMEA and Asia Pacific regions. The sales of instruments are generally accompanied by an arrangement exists, (2) shipmentinitial year of implied service-type warranties and may be bundled with assays and other consumables and may also include other items such as training and installation if applicable, has occurred or services have been rendered, (3) the price to the customer is fixed or determinable and (4) collection of the related receivable is reasonably assured. We primarily generate revenueinstrument and/or an extended service warranty. Revenues from the sale of products are recognized at a point in time when we transfer control of the product to the customer, which is upon installation for instruments sold to direct customers, and deliverybased upon shipping terms for assay kits and other consumables. Revenue for instruments sold to distributors is generally recognized based upon shipping terms (either upon shipment or delivery). Service and Other Revenue Service revenues are composed of contract research services, initial implied one-year service-type warranties, extended services contracts and other services such as training. Contract research services are provided through our Accelerator Laboratory and generally consist of fixed fee contracts. Revenues from contract research services are recognized at a point in time when we complete and deliver our research report on each individually completed study, or over time if the contractual provisions allow for the collection of transaction consideration for costs incurred plus a reasonable margin through the period of performance of the services. Revenues from service-type warranties are recognized ratably over the contract service period. Revenues from other services are immaterial. Collaboration and License Revenue We may enter into agreements to license the intellectual property and know-how associated with its instruments in exchange for license fees and future royalties (as described below). The license agreements provide the licensee with a right to use the intellectual property with the license fee revenues recognized at a point in time as the underlying license is considered functional intellectual property. We have recognized revenues from a sales- or usage based royalties related to our licensing technology and intellectual property. Payment Terms Our payment terms vary by the type and location of customer and the products or services offered. Payment from customers is generally required in a term ranging from 30 to 45 days from date of shipment or satisfaction of the performance obligation with no discounts for early payment. Occasionally we do provide extended payment terms or financing arrangements to customers. Disaggregated Revenue When disaggregating revenue, we considered all of the economic factors that may affect revenues. The following tables disaggregate our revenue from contracts with customers by revenue type: | | | | | | | | | | | | | | | Year Ended | | | December 31, 2020 | (in thousands) | | NA | | EMEA | | Asia Pacific | | Total | Product revenues | | | | | | | | | | | | | Instruments | | $ | 8,680 | | $ | 4,332 | | $ | 3,594 | | $ | 16,606 | Consumable and other products | | | 14,305 | | | 10,854 | | | 2,252 | | | 27,411 | Totals | | $ | 22,985 | | $ | 15,186 | | $ | 5,846 | | $ | 44,017 | | | | | | | | | | | | | | Service and other revenues | | | | | | | | | | | | | Service-type warranties | | $ | 3,171 | | $ | 1,543 | | $ | 207 | | $ | 4,921 | Research services | | | 15,011 | | | 2,225 | | | 737 | | | 17,973 | Other services | | | 700 | | | 435 | | | 100 | | | 1,235 | Totals | | $ | 18,882 | | $ | 4,203 | | $ | 1,044 | | $ | 24,129 | | | | | | | | | | | | | | Collaboration and license revenue | | | | | | | | | | | | | Collaboration and license revenue | | $ | 11,685 | | $ | 124 | | $ | — | | $ | 11,809 | Totals | | $ | 11,685 | | $ | 124 | | $ | — | | $ | 11,809 |
| | | | | | | | | | | | | | | Year Ended | | | December 31, 2019 | (in thousands) | | NA | | EMEA | | Asia Pacific | | Total | Product revenues | | | | | | | | | | | | | Instruments | | $ | 6,250 | | $ | 5,243 | | $ | 3,393 | | $ | 14,886 | Consumable and other products | | | 14,148 | | | 9,674 | | | 1,783 | | | 25,605 | Totals | | $ | 20,398 | | $ | 14,917 | | $ | 5,176 | | $ | 40,491 | | | | | | | | | | | | | | Service and other revenues | | | | | | | | | | | | | Service-type warranties | | $ | 3,139 | | $ | 1,323 | | $ | 171 | | $ | 4,633 | Research services | | | 8,845 | | | 704 | | | 456 | | | 10,005 | Other services | | | 825 | | | 565 | | | 31 | | | 1,421 | Totals | | $ | 12,809 | | $ | 2,592 | | $ | 658 | | $ | 16,059 | | | | | | | | | | | | | | Collaboration and license revenue | | | | | | | | | | | | | Collaboration and license revenue | | $ | 167 | | $ | 17 | | $ | — | | $ | 184 | Totals | | $ | 167 | | $ | 17 | | $ | — | | $ | 184 |
Our contracts with customers may include promises to transfer multiple products and services to a customer. In accordance with ASC 606, we combine any performance obligations that are immaterial with one or more other performance obligations that are material to the contract. For arrangements with multiple performance obligations, we allocate the contract transaction price, including discounts, to each performance obligation based on its relative standalone selling price. Judgment is required to determine the standalone selling price for each distinct performance obligation. We determine standalone selling prices based on prices charged to customers in observable transactions, and use a range of amounts to estimate standalone selling prices for each performance obligation. We may have more than one range of standalone selling price for certain products and services based on the pricing for different customer classes. Variable consideration in our contracts primarily relates to (i) sales- and usage-based royalties related to the license of intellectual property in collaboration and license contracts and (ii) certain non-fixed fee research services contracts. ASC 606 provides for an exception to estimating the variable consideration for sales- and usage-based royalties related to the license of intellectual property, such that the sales- or usage-based royalty will be recognized in the period the underlying transaction occurs. We have recorded sales- or usage-based royalty revenue for the year ended December 31, 2020 and 2019 related to the intellectual property licensed by Uman. We recognize revenues from sales- or usage based royalty revenue at the later of when the sales or usage occurs; and the satisfaction or partial satisfaction of the performance obligation to which the royalty has been allocated. The aggregate amount of transaction price that is allocated to performance obligations that have not yet been satisfied or are partially satisfied as of December 31, 2020 is $6.0 million. Of the performance obligations not yet satisfied or are partially satisfied, $5.4 million is expected to be recognized as revenue in the next 12 months, with the remainder to be recognized within the 24 months thereafter. The $5.4 million principally consists of amounts billed for undelivered services related to initial and extended service-type warranties and research services, as well as $0.5 million related to undelivered licenses of intellectual property for a diagnostics company. During the year ended December 31, 2020, we recognized $1.2 million of previously deferred revenue as a result of entering into a license agreement with a diagnostics company (see Note 13). We have classified the balance of capitalized costs to obtain a contract as a component of prepaid expenses and other current assets as of December 31, 2020 and classified the expense as a component of cost of goods sold and selling, general and administrative expense over the estimated life of the contract. We consider potential impairment in these amounts each period. ASC 606 provides entities with certain practical expedients and accounting policy elections to minimize the cost and burden of adoption. We exclude from the transaction price any amounts collected from customers related to sales and other similar taxes. When determining the transaction price of a contract, an adjustment is made if payment from a customer occurs either significantly before or significantly after performance, resulting in a significant financing component. We do not assess whether a significant financing component exists if the period between when we perform our obligations under licensethe contract and collaboration agreements. when the customer pays is one year or less. None of our contracts contained a significant financing component for the years ended December 31, 2020 and 2019. We have elected to account for the shipping and handling as an activity to fulfill the promise to transfer the product, and therefore will not evaluate whether shipping and handling activities are promised services to its customers. Grant Revenue We recognize grant revenue as we perform services under the arrangement when the funding is committed. Revenues and related research and development expenses are presented gross in the consolidated statements of operations as we have determined we are the primary obligor under the arrangement relative to the research and development services. Accounting for grants does not fall under ASC 606, as the grantor will not benefit directly from our expansion or product development. As there is no authoritative guidance under U.S. GAAP on accounting for grants to for-profit business entities, we have accounted for grants by analogy to IAS 20. Our product revenue includesgrants contain both monetary amounts granted related to assets and monetary amounts granted related to income, which are grants other than those related to assets. The grants related to assets are for the saleexpansion and increase of instrumentsmanufacturing capacity. The grants related to income are for additional research and development, as well as assay kits and other consumables whichnon-asset related scale up costs. We determined it was appropriate to account for each monetary grant amount under the appropriate accounting treatment outlined in IAS 20. Under IAS 20, grants related to assets shall be presented in the consolidated balance sheets either by recognizing the grant as deferred income (which is recognized in the consolidated statements of operations on a systematic basis over the useful life of the asset), or by deducting the grant in calculating the carrying amount of the asset (which is recognized in the consolidated statements of operations over the life of the depreciable asset as a reduced depreciation expense). Both methods are usedacceptable under IAS 20. We have elected to perform testsrecord grants related to assets as a deduction in calculating the carrying value of the asset. Under IAS 20, grants related to income are presented as part of the consolidated statements of operations, either separately or under a general heading. Both methods are acceptable under IAS 20. We have elected to record grants related to income separately on the instrument. Our serviceconsolidated statements of operations as grant revenue. The related expenses are recorded within operating expenses and not deducted. On June 22, 2020, we entered into WP1 under the NIH’s RADx program to assess the feasibility of a novel SARS-CoV-2 antigen detection test using our Simoa technology. During the year ended December 31, 2020 we recognized $2.0 million of grant revenue is generated from service contracts related to research services performed on behalf of customers and maintenance and support services.
Table of Contents
Product Revenue
Revenue for instrument sales is recognized upon installation at the customer's location or upon transfer of title to the customer when installation is not required, which is generally the case with sales to distributors. In sales to end-customers, we always provide the installation service and often payment is tied to the completion of the installation service. When installation is required, we account for the instrument and installation service as one unit of accounting and recognize revenue when installation is completed, assuming all other revenue recognition criteria are met. Instrument transactions often have multiple elements, as discussed below. Included with the purchase of an instrument is a one-year assurance type product warranty assuring that the instrument is free of material defects and will function according to specifications. In addition, the sale of an instrument includes an implied warranty which is promised to the customer during the pre-sales process, at the time that the sales quote is issued to the customer. The implied warranty is provided over the same one-year period as the standard warranty. The services includedincurred $1.0 million in the implied warranty are the same as those included in the extended service contracts and include two bi-annual preventative maintenance service visits, minor hardware updates and software upgrades, additional training and troubleshooting, which is beyond the scope of the standard product warranty. The implied warranty has been identified by us as a separate deliverable and unit of accounting. Consideration allocated to the implied one-year warranty is recognized over the one year period of performance as service and other revenue as described below. Consideration allocated to any other elements is recognized as the goods are delivered or the services are performed.
Service and Other Revenue
Service revenue includes revenue from the implied one-year service type warranty obligation, revenue from extended service contracts, research services performed on behalf of customers in our Accelerator Laboratory, and other services that may be performed. Revenue for extended warranty contracts is recognized ratably over the service period. Revenue for the implied one-year service type warranty is initially deferred at the time of instrument revenue recognition and is recognized ratably over a 12-month period starting on the date of instrument installation. Revenue for research and development servicesexpense related to WP1. WP1 is complete as of December 31, 2020.
On September 29, 2020, we entered into WP2 with the NIH under its RADx program. The contract, which has a total award value of $18.2 million, accelerates the continued development, scale-up, and other services is generally recognized based on proportional performancedeployment of the novel SARS-CoV-2 antigen detection test using our Simoa technology. The contract when our abilityprovides funding to complete project requirements is reasonably assured. Most of these services are completed in a short period of time from the receiptexpand assay kit manufacturing capacity and commercial deployment readiness. Release of the customer's order. When significant risk exists in our ability to fulfill project requirements, revenue is recognized upon completion$18.2 million of the contract. Collaboration and License Revenue
Collaboration and license revenue relates to our agreement with bioMérieux, which was terminated in September 2018, and an agreement with another diagnostic company. For a complete discussion of the accounting policies specific to these collaboration and license agreements, refer to "Collaborations and License Arrangements" (Note 11) in the consolidated financial statements included elsewhere in this Annual Report on Form 10-K.
Multiple Element Arrangements
Many of our instrument sales involve the delivery of multiple products and services. The elements of an instrument sale typically include the instruments, installation (when required), an implied one-year service type warranty, and in some cases, assays, consumables and other services. Revenue recognition for contracts with multiple deliverablesfunding under WP2 is based on the individual unitsachievement of accounting determined to existcertain milestones, and there is no assurance that we can meet all the milestones on a timely basis, if at all. If we do not meet all the milestones, we will not be able access the full $18.2 million in funding under the contract. A delivered item is considered a separate unitDuring the year ended December 31, 2020 we recognized $4.4 million in grant revenue and incurred $2.6 million in research and development expense related to WP2.
The following table summarizes the activity under WP2 as of accounting when the delivered item has value to the customer on a stand-alone basis. In determining the units of accounting, management evaluates certain criteria, including whether the deliverables have standalone
Table of ContentsDecember 31, 2020 (in thousands):
value. Items are considered to have stand-alone value when they are sold separately by any vendor or when the customer could resell the item on a stand-alone basis.
| | | Total grant revenue from research and development activities | $ | 4,362 | Total proceeds used for assets | | 826 | Total deferred proceeds for assets | | 2,478 | Total deferred grant revenue | | 304 | Total recognized | $ | 7,970 | | | | Total recognized | $ | 7,970 | Total amount accrued | | (2,968) | Total cash received | $ | 5,002 | | | | Total proceeds received | $ | 5,002 | Total proceeds reasonably assured | | 13,198 | Total WP2 grant amount | $ | 18,200 |
The consideration received is allocated among the separate units of accounting using the relative selling price method, and the applicable revenue recognition criteria are applied to each of the separate units. We determine the estimated selling price for deliverables within the arrangement using vendor-specific objective evidence (VSOE) of selling price, if available. If VSOE is not available, we consider whether third-party evidence is available. If third-party evidence of selling price or VSOE is not available, we use our best estimate of selling price for the deliverable.
In order to establish VSOE of selling price, we must regularly sell the product or service on a standalone basis with a substantial majority priced within a relatively narrow range. If there are not a sufficient number of standalone sales such that VSOE of selling price cannot be determined, then we consider whether third party evidence can be used to establish selling price. Due to the lack of similar products and services sold by other companies within the industry, we have not established selling price using third-party evidence.
For product and service sales, we determine our best estimate of selling price for instruments, consumables, services and assays using average selling prices over a rolling 12-month period coupled with an assessment of market conditions, as VSOE and third-party evidence cannot be established. We recognize revenue for delivered elements only when we determine there are no uncertainties regarding customer acceptance.
Distributor Transactions
In certain markets, we sell products and provide services to customers through distributors that specialize in life science products. In cases where the product is delivered to a distributor, revenue recognition generally occurs when title transfers to the distributor. The terms of sales transactions through distributors are generally consistent with the terms of direct sales to customers, except the distributors do not require our services to install the instrument at the end customer and perform the services for the customer that are beyond our standard warranty in the first year following the sale. These transactions are accounted for in accordance with our revenue recognition policy described above.
Stock-Based Compensation We account for stock-based compensation awards in accordance with Financial Accounting Standards Board (FASB) Accounting Standards Codification (ASC) TopicASC 718,Compensation—Stock Compensation, or (ASC 718.718). ASC 718 requires all stock-based payments to employees, including grants of employee stock options, to be recognized in the statement of operations based on their fair values. Stock-based compensation awards have historically consisted of stock options and restricted stock. Prior to the adoption of ASU 2016-09 on January 1, 2017, we recognizedAccounting Standards Update (ASU) No. 2018-07, Compensation - Stock Compensation (Topic 718): Improvements to Nonemployee Share-Based Payment Accounting (ASU 2018-07), the measurement date for non-employee awards was generally the date the services were completed, resulting in financial reporting period adjustments to stock-based compensation costs related to stock options granted to employees based onduring the estimatedvesting period for changes in the fair value of the awards. We adopted ASU 2018-07 on January 1, 2020. After the adoption of ASU 2018-07, the measurement date for non-employee awards onis the date of grant netwithout changes in the fair value of estimated forfeitures. Effective January 1, 2017, we ceased utilizing an estimated forfeiture ratethe award. Stock-based compensation costs for non-employees are recognized as expense over the vesting period on a straight-line basis. There were no material non-employee awards outstanding during the years ended December 31, 2020, 2019, and began recognizing forfeitures as they occur. 2018. We estimate the grant date fair value, and the resulting stock-based compensation expense, using the Black-Scholes option-pricing model. The grant date fair value of the stock-based awards is generally recognized on a straight-line basis over the requisite service period, which is generally the vesting period of the respective awards. We recognize compensation costs related to share-based payments granted to non-employees based on the estimated fair value of the awards on the date of grant in the same manner as options for employees; however, the fair value of the stock options granted to non-employees is re-measured each reporting period until the service is complete, and the resulting increase or decrease in value, if any, is
Table of Contents
recognized as expense or income, respectively, during the period the related services are rendered to the same financial statement line item as any cash consideration would be recognized. There were no material non-employee awards outstanding during the years ended December 31, 2018, 2017, and 2016.
The fair value of stock options granted to employees and directors for their services on our board of directorsnon-employees is estimated on the grant date using the Black-Scholes option-pricing model, based on the assumptions noted in the following table: | | | | | | |
| | Year Ended December 31, |
|---|
| | 2018 | | 2017 | | 2016 |
|---|
Risk-free interest rate | | 2.6% - 3.0% | | 1.8% - 2.1% | | 1.2% - 1.3% | Expected dividend yield | | None | | None | | None | Expected term (in years) | | 5.9 | | 6.0 | | 6.0 | Expected volatility | | 32.4% - 36.8% | | 46.0% - 52.0% | | 44.9% - 49.0% |
| | | | | | | | | Year Ended December 31, | | | 2020 | | 2019 | | 2018 | Risk-free interest rate | | 0.4% - 1.7% | | 1.4% - 2.6% | | 2.6% - 3.0% | Expected dividend yield | | None | | None | | None | Expected term (in years) | | 6.0 | | 6.0 | | 5.9 | Expected volatility | | 43.9% - 49.2% | | 33.5% - 39.7% | | 32.4% - 36.8% |
Using the Black-Scholes option-pricing model, the weighted-average grant date fair value of options granted for the years ended December 31, 2020, 2019, and 2018 2017,was $12.66, $9.09, and 2016 was $7.19 $4.52, and $2.41 per share, respectively. Expected volatility was calculated based on proportional weighting of reported volatility data for a representative group of guideline publicly traded companies for which historical information was available.available, as well as our stock. The risk-free interest rate is based on the U.S. Treasury yield curve in effect at the time of grant, commensurate with the expected life assumption. We estimate the expected life of options granted to employees utilizing the simplified method which calculates the expected life of an option as the average of the time to vesting and contractual life of the options. The expected life is applied to the stock option grant group as a whole, as we do not expect substantially different exercise or post-vesting termination behavior among itsour employee population. We use the simplified method due to the lack of historical exercise data and the plain nature of the stock options. We use the remaining contractual term for the expected life of non-employee awards. The expected dividend yield is assumed to be zero as we have never paid dividends and have no current plans to pay any dividends on common stock. For the years ended December 31, 2018, 2017,2020, 2019, and 20162018 stock-based compensation expense was $4.9$10.1 million, $2.2$6.4 million, and $0.9$4.9 million, respectively. The table below summarizes the stock-based compensation expense recognized in our statements of operationoperations by classification (in thousands): | | | | | | | | | | |
| | Year ended
December 31, | |
|---|
| | 2018 | | 2017 | | 2016 | |
|---|
Cost of product revenue | | $ | 55 | | $ | 24 | | $ | 6 | | Cost of service and other revenue | | | 173 | | | 52 | | | 12 | | Research and development | | | 513 | | | 180 | | | 59 | | General and administrative | | | 4,143 | | | 1,912 | | | 851 | | | | | | | | | | | | | | Total | | $ | 4,884 | | $ | 2,168 | | $ | 928 | |
| | | | | | | | | | | | | | | Year Ended December 31, | | | 2020 | | 2019 | | 2018 | Cost of product revenue | | $ | 189 | | $ | 86 | | $ | 55 | Cost of service and other revenue | | | 311 | | | 238 | | | 173 | Research and development | | | 1,129 | | | 718 | | | 513 | General and administrative | | | 8,470 | | | 5,346 | | | 4,143 | Total | | $ | 10,099 | | $ | 6,388 | | $ | 4,884 |
As of December 31, 2018,2020, we had $11.7$21.3 million of total unrecognized stock-based compensation costs which we expect to recognize over a weighted-average period of 2.884.7 years. Prior to our IPO,initial public offering (IPO) in December 2017, the fair value of our common stock underlying our stock options was estimated on each grant date by our board of directors. In order to determine the fair value of our common stock underlying granted stock options, our board of directors considered, among other things, the most recent valuations of our common sharesstock prepared by an unrelated third-party valuation firm in accordance with the guidance provided by the American Institute of Certified Public Accountants Practice Guide, Valuation of Privately-Held-Company Equity Securities Issued as Compensation.
Table of Contents
Given the absence of a public trading market for our common stock, our board of directors exercised reasonable judgment and considered a number of objective and subjective factors to determine the best estimate of the fair value of our common stock, including (1) our business, financial condition and results of operations, including related industry trends affecting our operations; (2) our forecasted operating performance and projected future cash flows discounted to present value using our estimated weighted average cost of capital; (3) the illiquid nature of our common stock; (4) liquidation preferences and other rights and privileges of our preferred stock over our common stock; (5) likeliness and estimated timing of the potential option to have our stock become publicly traded; (6) market multiples of our most comparable public peers; (7) recently completed equity financing transactions; and (8) market conditions affecting our industry. Since the completion of our IPO, we have determined the fair value of each common share underlying share-based awards based on the closing price of our common shares as reported by Nasdaq on the date of grant. Preferred Stock Warrant Liability
As of January 1, 2015, we had outstanding warrants to purchase 64,441 shares of Series A-2 redeemable convertible preferred stock, or Series A-2 Preferred Stock, 1,300,000 shares of Series A-3 convertible preferred stock, or Series A-3 Preferred Stock, 562,488 shares of Series B redeemable convertible preferred stock, or Series B Preferred Stock, and 226,733 shares of Series C redeemable convertible preferred stock, or Series C Preferred Stock. On March 4, 2015, we issued a warrant to purchase 46,248 shares of Series C Preferred Stock to a lender related to an amendment to a debt facility. The fair value of the warrant was initially accounted for as a debt discount. On January 29, 2016, we issued a warrant to purchase 57,810 shares of Series C Preferred Stock to a lender related to a second amendment to a debt facility. The fair value of the warrant was initially accounted for as a debt discount. On November 18, 2016, we issued a warrant to purchase 700,000 shares of Series A-3 Preferred Stock to a vendor. The fair value of the warrant was recorded as research and development expense. On March 31, 2017, we issued a warrant to purchase 38,828 shares of Series D redeemable convertible preferred stock (Series D Preferred Stock) to a lender as part of a third amendment to a debt facility. The fair value of the warrant was initially accounted for as a debt discount. All of the warrants were initially recorded at fair value and marked to market on each reporting and exercise date with changes in the fair value recorded in other expense (income) on the statement of operations and comprehensive loss. Holders of warrants to purchase shares of Series A-3 and B Preferred Stock exercised the warrants during the year ended December 31, 2016 and holders of warrants to purchase shares of Series A-3 Preferred Stock exercised the warrants during the three months ended March 31, 2017. Upon exercise, the fair value of the warrants was reclassified to redeemable convertible preferred stock along with any proceeds received. Upon the closing of the IPO, all warrants to purchase Preferred Stock automatically converted to warrants to purchase our common stock.
Table of Contents
The changes in preferred stock warrant liability measured at fair value for which we have used Level 3 inputs to determine fair value are as follows (in thousands):
| | | | |
| | Warrant
liability | |
|---|
Balance at December 31, 2015 | | $ | 5,547 | | Issuance of warrants related to debt facility | | | 128 | | Issuance of warrants related to a vendor | | | 2,078 | | Changes in fair value of warrants | | | 307 | | Warrant exercises | | | (5,258 | ) | | | | | | | Balance at December 31, 2016 | | | 2,802 | | Issuance of warrants related to debt facility | | | 119 | | Changes in fair value of warrants | | | 90 | | Warrant exercises | | | (2,188 | ) | | | | | | | Conversion to warrants in common stock in connection with IPO | | | (823 | ) | | | | | | | Balance at December 31, 2017 | | $ | — | | | | | | | |
The warrants were classified as liabilities because they were exercisable into shares of redeemable convertible preferred stock. On each measurement date, we utilized a Monte Carlo option pricing model to determine the fair value of the warrants and utilized various valuation assumptions based on available market data and other relevant but observable factors. Expected volatility for our redeemable convertible preferred stock was determined based on an analysis of the historical volatility of a representative group of guideline public companies, because, prior to our IPO, there was no market for our common stock and, therefore, a lack of market-based company-specific historical and implied volatility information. The expected term reflects the remaining contractual term of the warrants. The assumed dividend yield is based upon our expectation of not paying dividends in the foreseeable future. The risk-free rate is based upon the U.S. Treasury yield curve in effect at the valuation date, commensurate with the remaining contractual life of the warrants. The fair value of the underlying preferred shares was determined by management, with the assistance of a third-party valuation specialist, using a hybrid valuation method, which includes a weighted analysis of two scenarios. The first scenario was based on the completion of an initial public offering utilizing a market approach and the second scenario was based on remaining privately held utilizing either an income approach or a weighted-average of an income approach and a backsolve to a recent financing event, depending on the proximity of the financing event to the measurement date. The assumption regarding our probability of completing an initial public offering was the primary contributing factor to the changes in fair value of the common stock. See "Significant Accounting Policies" (Note 2) in our consolidated financial statements appearing elsewhere in this Annual Report on Form 10-K for further details on the changes of the probability of completing an initial public offering. Because all outstanding and exercisable warrants to purchase Preferred Stock were automatically converted to warrants to purchase shares of common stock following the IPO, they are accounted for as equity instruments as of December 31, 2018.
Table of Contents
The following assumptions were utilized to determine the fair value of each warrant to purchase preferred stock at each reporting period and as of the change from liability to equity accounting treatment in connection with the IPO:
| | | | | | | | | | | | | | | | | | | | | Balance sheet date | | Value of
underlying
Series D
preferred
stock | | Value of
underlying
Series C
preferred
stock | | Value of
underlying
Series B
preferred
stock | | Value of
underlying
Series A-3
preferred
stock | | Value of
underlying
Series A-2
preferred
stock | | Volatility | | Probability
of an initial
public offering | |
|---|
December 7, 2017 | | $4.67 | | $ | 4.67 | | N/A | | | N/A | | $ | 4.67 | | | 46 | % | | 100 | % | December 31, 2016 | | N/A | | $ | 4.16 | | N/A | | $ | 2.97 | | $ | 2.95 | | | 52 | % | | 40 | % | December 31, 2015 | | N/A | | $ | 3.92 | | $3.00 | | $ | 3.00 | | $ | 1.90 | | | 41 | % | | 25 | % |
Results of Operations Comparison of the Years Ended December 31, 20182020 and December 31, 20172019 (dollars in thousands): | | | | | | | | | | | | | | | | | | | |
| | Year ended
December 31,
2018 | | % of
revenue | | Year ended
December 31,
2017 | | % of
revenue | | $
change | | %
change | |
|---|
Product revenue | | $ | 23,365 | | | 62 | % | $ | 14,124 | | | 62 | % | $ | 9,241 | | | 65 | % | Service and other revenue | | | 12,117 | | | 32 | % | | 7,676 | | | 34 | % | | 4,441 | | | 58 | % | Collaboration and license revenue | | | 2,150 | | | 6 | % | | 1,074 | | | 5 | % | | 1,076 | | | 100 | % | | | | | | | | | | | | | | | | | | | | | | Total revenue | | | 37,632 | | | 100 | % | | 22,874 | | | 100 | % | | 14,758 | | | 65 | % | Costs of Goods Sold: | | | | | | | | | | | | | | | | | | | | Cost of product revenue | | | 12,729 | | | 34 | % | | 7,742 | | | 34 | % | | 4,987 | | | 64 | % | Cost of services and other revenue | | | 6,955 | | | 18 | % | | 5,145 | | | 22 | % | | 1,810 | | | 35 | % | | | | | | | | | | | | | | | | | | | | | | Total Costs of Goods Sold and Services | | | 19,684 | | | 52 | % | | 12,887 | | | 56 | % | | 6,797 | | | 53 | % | | | | | | | | | | | | | | | | | | | | | | Gross Profit | | | 17,948 | | | 48 | % | | 9,987 | | | 44 | % | | 7,961 | | | 80 | % | Operating Expense: | | | | | | | | | | | | | | | | | | | | Research and development | | | 15,805 | | | 42 | % | | 16,304 | | | 71 | % | | (499 | ) | | (3 | )% | Selling, general and administrative | | | 33,693 | | | 90 | % | | 19,688 | | | 86 | % | | 14,005 | | | 71 | % | | | | | | | | | | | | | | | | | | | | | | Total operating expenses | | | 49,498 | | | 132 | % | | 35,992 | | | 157 | % | | 13,506 | | | 38 | % | | | | | | | | | | | | | | | | | | | | | | Loss from operations | | | (31,550 | ) | | (84 | )% | | (26,005 | ) | | (114 | )% | | (5,545 | ) | | (21 | )% | Interest income (expense), net | | | 46 | | | 0 | % | | (951 | ) | | (4 | )% | | 997 | | | (105 | )% | Other income (expense), net | | | (7 | ) | | (0 | )% | | (63 | ) | | (0 | )% | | 56 | | | 89 | % | | | | | | | | | | | | | | | | | | | | | | Loss before income taxes | | | (31,511 | ) | | (84 | )% | | (27,019 | ) | | (118 | )% | | (4,492 | ) | | (17 | )% | Income tax provision | | | (25 | ) | | (0 | )% | | — | | | (0 | )% | | (25 | ) | | 100 | % | | | | | | | | | | | | | | | | | | | | | | Net loss | | $ | (31,536 | ) | | (84 | )% | $ | (27,019 | ) | | (118 | )% | $ | (4,517 | ) | | (17 | )% | | | | | | | | | | | | | | | | | | | | | |
Revenue
| | | | | | | | | | | | | | | | | | | | | Year Ended | | | | | Year Ended | | | | | | | | | | | | December 31, | | % of | | December 31, | | % of | | $ | | % | | | 2020 | | revenue | | 2019 | | revenue | | change | | change | Product revenue | | $ | 44,017 | | 52 | % | | $ | 40,491 | | 72 | % | | $ | 3,526 | | 9 | % | Service and other revenue | | | 24,129 | | 28 | % | | | 16,059 | | 28 | % | | | 8,070 | | 50 | % | Collaboration and license revenue | | | 11,809 | | 14 | % | | | 184 | | — | % | | | 11,625 | | 6,318 | % | Grant revenue | | | 6,422 | | 6 | % | | | — | | — | % | | | 6,422 | | 100 | % | Total revenue | | | 86,377 | | 100 | % | | | 56,734 | | 100 | % | | | 29,643 | | 52 | % | Cost of goods sold: | | | | | | | | | | | | | | | | | | | Cost of product revenue | | | 25,950 | | 30 | % | | | 20,900 | | 37 | % | | | 5,050 | | 24 | % | Cost of service revenue | | | 11,245 | | 13 | % | | | 8,998 | | 16 | % | | | 2,247 | | 25 | % | Cost of collaboration and license revenue | | | 1,000 | | 1 | % | | | — | | — | % | | | 1,000 | | 100 | % | Total costs of goods sold, services, and licenses | | | 38,195 | | 44 | % | | | 29,898 | | 53 | % | | | 8,297 | | 28 | % | Gross profit | | | 48,182 | | 56 | % | | | 26,836 | | 47 | % | | | 21,346 | | 80 | % | Operating expenses: | | | | | | | | | | | | | | | | | | | Research and development | | | 20,174 | | 23 | % | | | 16,190 | | 29 | % | | | 3,984 | | 25 | % | Selling, general, and administrative | | | 59,592 | | 69 | % | | | 52,246 | | 92 | % | | | 7,346 | | 14 | % | Total operating expense | | | 79,766 | | 92 | % | | | 68,436 | | 121 | % | | | 11,330 | | 17 | % | Loss from operations | | | (31,584) | | (37) | % | | | (41,600) | | (73) | % | | | 10,016 | | 24 | % | Interest income (expense), net | | | (273) | | — | % | | | 627 | | 1 | % | ` | | (900) | | (144) | % | Other expense, net | | | (49) | | — | % | | | (10) | | — | % | | | (39) | | (390) | % | Loss before income taxes | | | (31,906) | | (37) | % | | | (40,983) | | (72) | % | | | 9,077 | | 22 | % | Income tax benefit | | | 376 | | — | % | | | 187 | | — | % | | | 189 | | 101 | % | Net loss | | $ | (31,530) | | (37) | % | | $ | (40,796) | | (72) | % | | $ | 9,266 | | 23 | % |
Revenue Revenue increased by $14.8$29.6 million, or 65%52%, to $37.6$86.4 million for the year ended December 31, 20182020 as compared to $22.9$56.7 million for the year ended December 31, 2017.2019. Product revenue consisted of sales of instruments totaling $9.6$16.6 million and sales of consumables and other products of $13.8$27.4 million for the year ended December 31, 2018.2020. Product revenue consisted of sales of instruments totaling $6.5$14.9 million and sales of consumables and other products totaling $7.6$25.6 million for the year ended December 31, 2017.2019. Average sales prices of instruments and consumables did not change materially infor the year ended December 31, 20182020 as compared with the year ended December 31, 2017.2019. The increase in product revenue of $9.2$3.5 million was primarily due to the sale of more instruments infor the 12 monthsyear ended December 31, 20182020 and increased sales of consumables. The installed base of instruments
Table of Contents
increased from December 31, 20172019 to December 31, 2018,2020, and as these additional instruments were used by customers, the consumableconsumables sales increased. The increase in service and other revenue of $4.4$8.1 million was primarily due to increased services performed in our Accelerator Laboratory; more customers are usinguse these services, and existing customers are usinguse these services more frequently. In addition, an increase in purchased warranties contributed to the service and other revenue increase. Collaboration and license revenue infor the year ended December 31, 2018 included $2.12020 of $11.8 million in revenuewas related to entering into the terminationAbbott License Agreement, and from existing contracts related to licensing technology and intellectual property. Collaboration and license revenue for the year ended December 31, 2019 of the collaboration arrangement with bioMérieux in the third quarter$0.2 million was related to licensing technology and intellectual property. Grant revenue of 2018. Cost of Product, Service and License Revenue
Cost of product revenue increased by $5.0 million, or 64%, to $12.7$6.4 million for the year ended December 31, 2018 as compared2020 consisted of revenue related to $7.7WP1 and WP2. We did not have any grant revenue during the year ended December 31, 2019.
Cost of Goods Sold and Services Cost of product revenue increased by $5.1 million, or 24%, to $26.0 million for the year ended December 31, 2017. The increase was primarily due2020 as compared to increased sales of consumables and instruments. Cost of service revenue increased to $7.0$20.9 million for the year ended December 31, 20182019. The increase was primarily due to our product revenue increase, as well as a full year of costs incurred from $5.1the amortization of the Uman acquisition-related inventory valuation adjustment and acquired intangibles for the year ended December 31, 2020, as compared to only six months of these costs during the year ended December 31, 2019. Cost of service revenue increased to $11.2 million for the year ended December 31, 2017.2020 from $9.0 million for the year ended December 31, 2019. The increase was primarily due to higher utilization of the Accelerator Laboratory, plus increased personnel costs from the build out of our field service and Accelerator organization.Cost of collaboration and license revenue of $1.0 million resulted from the licensing of certain technology and intellectual property to Abbott during the year ended December 31, 2020. No cost of collaboration and license revenue was incurred during the year ended December 31, 2019. Overall cost of goods sold and services as a percentage of revenue decreased to 52%44% of total revenue for the year ended December 31, 20182020 as compared to 56%53% for the year ended December 31, 2017,2019, primarily as a result of the changesignificant increase in revenue mix to more consumables revenuecollaboration and collaboration revenue in 2018.license revenue. Research and Development Expense Research and development expense increased by $4.0 million, or 25%, to $20.2 million for the year ended December 31, 2020 as compared to $16.2 million for the year ended December 31, 2019. The increase was primarily due to compensation, development, materials, and other expenses related to work under WP1 and WP2 incurred during the year ended December 31, 2020. Selling, General and Administrative Expense Selling, general and administrative expense increased by $7.3 million, or 14%, to $59.6 million for the year ended December 31, 2020 as compared to $52.2 million for the year ended December 31, 2019. The increase was primarily due to headcount additions in various departments as we build out our organization to support growth. Interest Income (Expense), Net and Other Expense, Net Interest income (expense), net and other expense, net decreased by $0.9 million for the year ended December 31, 2020 as compared to the same period in 2019, primarily due to the unfavorable impact of COVID-19 on the interest rates of our cash equivalents during the year ended December 31, 2020. Income Tax Benefit Income tax benefit was $0.4 million for the year ended December 31, 2020 as compared to $0.2 million for the same period in 2019. The change is primarily due to the increase in the tax benefit recorded on the operating results of our foreign subsidiaries. Comparison of the Years Ended December 31, 2019 and December 31, 2018 (dollars in thousands): | | | | | | | | | | | | | | | | | | | | | Year Ended | | | | | Year Ended | | | | | | | | | | | | December 31, | | % of | | December 31, | | % of | | $ | | % | | | 2019 | | revenue | | 2018 | | revenue | | change | | change | Product revenue | | $ | 40,491 | | 72 | % | | $ | 23,365 | | 62 | % | | $ | 17,126 | | 73 | % | Service and other revenue | | | 16,059 | | 28 | % | | | 12,117 | | 32 | % | | | 3,942 | | 33 | % | Collaboration and license revenue | | | 184 | | — | % | | | 2,150 | | 6 | % | | | (1,966) | | (91) | % | Grant revenue | | | — | | — | % | | | — | | — | % | | | — | | — | % | Total revenue | | | 56,734 | | 100 | % | | | 37,632 | | 100 | % | | | 19,102 | | 51 | % | Cost of goods sold: | | | | | | | | | | | | | | | | | | | Cost of product revenue | | | 20,900 | | 37 | % | | | 12,729 | | 34 | % | | | 8,171 | | 64 | % | Cost of service revenue | | | 8,998 | | 16 | % | | | 6,955 | | 18 | % | | | 2,043 | | 29 | % | Total costs of goods sold, services, and licenses | | | 29,898 | | 53 | % | | | 19,684 | | 52 | % | | | 10,214 | | 52 | % | Gross profit | | | 26,836 | | 47 | % | | | 17,948 | | 48 | % | | | 8,888 | | 50 | % | Operating expenses: | | | | | | | | | | | | | | | | | | | Research and development | | | 16,190 | | 29 | % | | | 15,805 | | 42 | % | | | 385 | | 2 | % | Selling, general, and administrative | | | 52,246 | | 92 | % | | | 33,693 | | 90 | % | | | 18,553 | | 55 | % | Total operating expense | | | 68,436 | | 121 | % | | | 49,498 | | 132 | % | | | 18,938 | | 38 | % | Loss from operations | | | (41,600) | | (73) | % | | | (31,550) | | (84) | % | | | (10,050) | | (32) | % | Interest income, net | | | 627 | | — | % | | | 46 | | — | % | ` | | 581 | | 1,263 | % | Other expense, net | | | (10) | | — | % | | | (7) | | — | % | | | (3) | | (43) | % | Loss before income taxes | | | (40,983) | | (72) | % | | | (31,511) | | (84) | % | | | (9,472) | | (30) | % | Income tax benefit (provision) | | | 187 | | — | % | | | (25) | | — | % | | | 212 | | 848 | % | Net loss | | $ | (40,796) | | (72) | % | | $ | (31,536) | | (84) | % | | $ | (9,260) | | (29) | % |
Revenue Revenue increased by $19.1 million, or 51%, to $56.7 million for the year ended December 31, 2019 as compared to $37.6 million for the year ended December 31, 2018. Product revenue consisted of sales of instruments totaling $14.9 million and sales of consumables and other products of $25.6 million for the year ended December 31, 2019. Product revenue consisted of sales of instruments totaling $9.6 million and sales of consumables and other products totaling $13.8 million for the year ended December 31, 2018. Average sales prices of instruments and consumables did not change materially for the year ended December 31, 2019 as compared with the year ended December 31, 2018. The increase in product revenue of $17.1 million was primarily due to the sale of more instruments for the year ended December 31, 2019 and increased sales of consumables. The installed base of instruments increased from December 31, 2018 to December 31, 2019, and as these additional instruments were used by customers, the consumables sales increased. The increase in service and other revenue of $3.9 million was primarily due to increased services performed in our Accelerator Laboratory; more customers use these services, and existing customers use these services more frequently. In addition, an increase in purchased warranties contributed to the service and other revenue increase. Collaboration and license revenue for the year ended December 31, 2019 of $0.2 million was related to licensing technology and intellectual property. Collaboration and license revenue for the year ended December 31, 2018 of $2.2 million was related to the termination of the collaboration arrangement with bioMérieux. Cost of Goods Sold and Services Cost of product revenue increased by $8.2 million, or 64%, to $20.9 million for the year ended December 31, 2019 as compared to $12.7 million for the year ended December 31, 2018. The increase was primarily due to an increase in sales of consumables and instruments, along with costs incurred from the amortization of the Uman acquisition-related inventory valuation adjustment and acquired intangibles. Cost of service revenue increased to $9.0 million for the year ended December 31, 2019 from $7.0 million for the year ended December 31, 2018. The increase was primarily due to higher utilization of the Accelerator Laboratory, plus increased personnel costs from the build out of our field service and Accelerator organization. Overall cost of goods sold and services as a percentage of revenue increased slightly to 53% of total revenue for the year ended December 31, 2019 as compared to 52% for the year ended December 31, 2018, primarily as a result of the impact of the collaboration arrangement with bioMérieux during the year ended December 31, 2018 and the impact of the Uman acquisition-related charges during the year ended December 31, 2019. Research and Development Expense Research and development expense increased slightly by $0.5$0.4 million, or 3%2%, to $16.2 million for the year ended December 31, 2019 as compared to $15.8 million for the year ended December 31, 2018 as compared2018. The increase was primarily due to $16.3the development of the SP-X and HD-X and increased headcount in research and development. Selling, General and Administrative Expense Selling, general and administrative expense increased by $18.6 million, or 55%, to $52.2 million for the year ended December 31, 2017. The decrease was primarily due to a reduction in outside development costs related to our SR-X instrument for which development was completed and product launched commercially in the fourth quarter of 2017. The reduction in project costs for the SR-X instrument offset an increase in research and development costs due to increased headcount in research and development and the increased use of outside development firms2019 as we increased our new product development efforts. Selling, General and Administrative Expense
Selling, general and administrative expense increased by $14.0 million, or 71%,compared to $33.7 million for the year ended December 31, 2018 as compared to $19.7 million for the same period in 2017.2018. The increase was primarily due to headcount additions in various departments as we build out our organization to support future growth, public company costs, transaction feesthe lease for the new headquarters, and amortization of intangiblesstock-based compensation expense. In addition, we incurred approximately $1.9 million in costs associated with the Aushon acquisition and stock compensation expense.of Uman during the year ended December 31, 2019.
Interest Income, Net and Other Expense, Net Interest income, net and other expense, net decreasedincreased by $1.1$0.6 million for the year ended December 31, 2019 as compared to the same period in 2018, primarily due to the interest income earned on cash equivalents, which increased due to our “at-the-market” and underwritten public offerings completed during 2019. Income Tax Benefit (Provision) Income tax benefit was $0.2 million for the year ended December 31, 2019 as compared to a net income positionprovision of less than $0.1 million for the year ended December 31, 2018 as compared to $1.0 million of net expense for the same period in 2017, primarily due to an increase in interest income as a result of the higher cash balances in 2018. Tax Expense
Tax expense increased by less than $0.1 million to an amount less $0.1 million for the year ended December 31, 2018. The increase is primarily due to certain state and international taxes in 2018,2019, which we did not have in the prior year.
Table of Contents
Comparison of the Years Ended December 31, 2017 and December 31, 2016 (dollars in thousands):
| | | | | | | | | | | | | | | | | | | |
| | Year ended
December 31,
2017 | | % of
revenue | | Year ended
December 31,
2016 | | % of
revenue | | $
change | | %
change | |
|---|
Product revenue | | $ | 14,124 | | | 61.7 | % | $ | 10,601 | | | 60.3 | % | $ | 3,523 | | | 33.2 | % | Service and other revenue | | | 7,676 | | | 33.6 | % | | 5,012 | | | 28.5 | % | | 2,664 | | | 53.2 | % | Collaboration and license revenue | | | 1,074 | | | 4.7 | % | | 1,972 | | | 11.2 | % | | (898 | ) | | (45.5 | )% | | | | | | | | | | | | | | | | | | | | | | Total revenue | | | 22,874 | | | 100.0 | % | | 17,585 | | | 100.0 | % | | 5,289 | | | 30.1 | % | | | | | | | | | | | | | | | | | | | | | | Costs of Goods sold: | | | | | | | | | | | | | | | | | | | | Cost of product revenue | | | 7,742 | | | 33.8 | % | | 6,299 | | | 35.8 | % | | 1,443 | | | 22.9 | % | Cost of services revenue | | | 5,145 | | | 22.5 | % | | 3,163 | | | 18.0 | % | | 1,607 | | | 30.4 | % | Cost of license revenue | | | — | | | — | % | | 375 | | | 2.1 | % | | (375 | ) | | (100 | )% | Total Costs of Goods sold and services | | | 12,887 | | | 56.3 | % | | 9,837 | | | 55.9 | % | | 3,050 | | | 57.7 | % | | | | | | | | | | | | | | | | | | | | | | Gross Profit | | | 9,987 | | | 43.7 | % | | 7,748 | | | 44.1 | % | | 2,239 | | | 42.3 | % | Operating Expenses: | | | | | | | | | | | | | | | | | | | | Research and development | | | 16,304 | | | 71.3 | % | | 16,993 | | | 96.6 | % | | (689 | ) | | (4.1 | )% | Selling, general and administrative | | | 19,688 | | | 86.1 | % | | 12,466 | | | 70.9 | % | | 7,222 | | | 57.9 | % | | | | | | | | | | | | | | | | | | | | | | Total operating expenses | | | 35,992 | | | 157.6 | % | | 29,459 | | | 167.5 | % | | 9,583 | | | 24.4 | % | | | | | | | | | | | | | | | | | | | | | | Loss from operations | | | (26,005 | ) | | (113.7 | )% | | (21,711 | ) | | (123.5 | )% | | (4,294 | ) | | (19.8 | )% | Interest expense, net | | | (951 | ) | | (4.2 | )% | | (1,298 | ) | | (7.4 | )% | | 347 | | | (26.7 | )% | Other income (expense), net | | | (63 | ) | | (0.2 | )% | | (164 | ) | | (0.9 | )% | | 102 | | | (61.6 | )% | | | | | | | | | | | | | | | | | | | | | | Loss before income taxes | | | (27,019 | ) | | (118.1 | )% | | (23,173 | ) | | (131.8 | )% | | (3,846 | ) | | 16.6 | % | Income tax provision | | | — | | | — | | | — | | | — | | | — | | | — | | | | | | | | | | | | | | | | | | | | | | | Net loss | | $ | (27,019 | ) | | (118.1 | )% | $ | (23,173 | ) | | (131.8 | )% | $ | (3,846 | ) | | (16.6 | )% |
Revenue
Revenue increased by $5.3 million, or 30%, to $22.9 million for the year ended December 31, 2017 as compared to $17.6 million for the year ended December 31, 2016. Product revenue consisted of sales of instruments totaling $6.5 million and sales of consumables and other products of $7.6 million for the year ended December 31, 2017. Product revenue consisted of sales of instruments totaling $6.2 million and sales of consumables and other products totaling $4.4 million for the year ended December 31, 2016. Average sales prices of instruments and consumables did not change materially in the year ended December 31, 2017 as compared with the year ended December 31, 2016. The increase in product revenue of $3.5 million was primarily due to the sale of more instruments in the twelve months ended December 31, 2017 and increased sales of consumables. The installed base of Simoa instruments increased from December 31, 2016 to December 31, 2017, and as these additional instruments were used by customers, the consumable sales increased. The increase in service and other revenue of $2.7 million was due to increased services performed in our Simoa Accelerator Laboratory; more customers are using these services, and existing customers are using the Accelerator Laboratory more frequently. Collaboration and license revenue in the year ended December 31, 2017 consists of revenue related to the collaboration arrangement with bioMérieux that was modified in the fourth quarter of 2016. Collaboration and license revenue in the year ended December 31, 2016 consists of one-time payment of $1.8 million of revenue related a licensing arrangement executed in the fourth quarter of 2016, and revenue related to the collaboration arrangement with bioMérieux of $0.2 million.
As part of the modification in the fourth quarter of 2016, we received $2.0 million in additional consideration. This additional consideration along with the deferred revenue on the date of the modification is being recognized over our estimated period of performance, which was initially
Table of Contents
determined to be 36 months. The estimated performance period is evaluated each reporting period and continues to be consistent with the initial estimate.
Cost of Product, Service and License Revenue
Cost of product revenue increased by $1.4 million, or 23%, to $7.7 million for the year ended December 31, 2017 as compared to $6.3 million for the year ended December 31, 2016. The increase was primarily due to increased sales of consumables and instruments. Cost of service revenue increased to $5.1 million for the year ended December 31, 2017 from $3.2 million forthe year ended December 31, 2016. The increase was primarily due to higher utilization of the Accelerator Laboratory, plus increased personnel costs from the build out of our field service organization. Overall cost of goods sold as a percentage of revenue remained consistent at 56% of total revenue for the year ended December 31, 2017 as compared to 56% for the year ended December 31, 2016, primarily as a result of increased headcount in field service and accelerator service groups.
Research and Development Expense
Research and development expense decreased slightly by $0.7 million, or 4%, to $16.3 million for the year ended December 31, 2017 as compared to $17.0 million for the year ended December 31, 2016. The decrease was primarily due to a reduction in outside development costs related to our SR-X instrument for which development was completed and product launched commercially in the fourth quarter of 2017. The reduction in project costs for the SR-X instrument offset other increase in research and development costs as we have increased headcount in research and development and the increased use of outside development firms as we increased our new product development efforts.
Selling, General and Administrative Expense
Selling, general and administrative expense increased by $7.2 million, or 58%, to $19.7 million for the year ended December 31, 2017 as compared to $12.5 million for the same period in 2016. The increase was primarily due to headcount additions in various departments as we build out our organization to support future growth, and stock compensation expense.
Interest and Other Expense, Net
Interest and other expense, net decreased by $0.5 million, to $1 million for the year ended December 31, 2017 as compared to $1.5 million for the same period in 2016, primarily due to the amortization of debt discounts from warrants we have issued to a lender.
Liquidity and Capital Resources Since our inception, we have incurred annual net losses and negative cash flows from operations. We incurred net losses of $31.5 million, $27.0$40.8 million and $23.2$31.5 million and used $28.7$23.4 million, $22.1$26.2 million and $17.7$28.7 million of cash from our operating activities for the years ended December 31, 2018, 20172020, 2019, and 2016,2018, respectively. As of December 31, 2018,2020, we had an accumulated deficit of $175.9$247.8 million. As of December 2018,2020, we had cash and cash equivalents of $44.4$181.6 million and no additional amounts were available to borrow under our debt facility. On February 3, 2021, we received approximately $269.6 million in net proceeds related to an underwritten public offering. Sources of Liquidity To date, we have financed our operations principally through equity offerings, borrowings from credit facilities and revenue from our commercial operations.
Table of Contents
Equity Offerings In December 2017, we completed our IPO in which we sold 4,916,480 shares of common stock at an initial public offering price of $15.00 per share. The aggregate net proceeds received by us from the offering, net of underwriting discounts and commissions and offering expenses, were $65.6 million. Prior to the IPO, we had raised capital through the sale of redeemable convertible preferred stock in private placement transactions. On March 19, 2019, we entered into a Sales Agreement for an “at-the-market offering” arrangement with Cowen and Company, LLC (Cowen), which allowed us to issue and sell shares of common stock pursuant to a shelf registration statement for total gross sales proceeds of up to $50.0 million from time to time through Cowen, acting as our agent. During the year ended December 31, 2019, we sold an aggregate of 2,186,163 shares of common stock pursuant to this agreement resulting in $49.7 million in gross proceeds and $48.0 million in net proceeds. On August 6, 2020, we delivered written notice to Cowen to terminate the Sales Agreement, which termination the parties agreed to make immediately effective. On August 8, 2019, we entered into an underwriting agreement with J.P. Morgan Securities LLC and SVB Leerink LLC, or Leerink, as representatives of the several underwriters, relating to an underwritten public offering of 2,732,673 shares of common stock at a public offering price of $25.25 per share. We received $69.0 million in gross proceeds and $64.5 million in net proceeds. On August 6, 2020, we entered into an underwriting agreement with Leerink and Cowen, as representatives of the several underwriters, relating to an underwritten public offering of 3,048,774 shares of common stock at a public offering price of $32.00 per share. We received $97.6 million in gross proceeds and $91.4 million in net proceeds. On February 3, 2021, we entered into an underwriting agreement with Goldman Sachs & Co. LLC, Leerink and Cowen, as representatives of the several underwriters, relating to an underwritten public offering of 4,107,142 shares of common stock at a public offering price of $70.00 per share. We received $287.5 million in gross proceeds and approximately $269.6 million in net proceeds. Loan Facility with Hercules On April 14, 2014, we executed a Loan Agreement with Hercules, Capital, Inc. (formerly known as Hercules Technology Growth Capital, Inc.).subsequently amended, most recently in April 2019. The Loan Agreement provided a total debt facility of $10.0 million, which is secured by substantially all of our assets. At closing, we borrowed $5.0 million in principal and had the ability to draw the additional $5.0 million over the period from November 1, 2014 to March 31, 2015. The interest rate on this term loan was variable based on a calculation of 8% plus the prime rate less 5.25%, with a minimum interest rate of 8%. Interest was to be paid monthly beginning the month following the borrowing date. Principal payments were scheduled to begin on September 1, 2015, unless we achieved certain milestones which would have extended this date to December 1, 2015 or March 1, 2016. In connection with the execution of the Loan Agreement, we issued Hercules a warrant to purchase up to 173,428 shares of our Series C Preferred Stock at an exercise price of $3.3299 per share. Upon closing of the IPO, this warrant was automatically converted into a warrant to purchase up to 53,960 shares of our common stock at an exercise price of $10.70 per share. On March 4, 2015, we executed Amendment 1 to the Loan Agreement and drew the additional $5.0 million available under the Loan Agreement at that time. The terms of the amendment deferred principal payments to start on December 1, 2015 or March 1, 2016 if we obtained at least $10.0 million in equity financing before December 1, 2015. This equity financing did not occur before December 1, 2015.
In January 2016, we executed Amendment 2 to the Loan Agreement, which increased the total facility available by $5.0 million to a total of $15.0 million and further delaying the start of principal payments to July 1, 2016. Following the Series D Preferred Stock financing in March 2016, we could have elected to further delay the start of principal payments until January 1, 2017, however we voluntarily began paying principal on July 1, 2016. Upon signing this amendment, we drew an additional $3.0 million under the debt facility. The remaining $2.0 million available for borrowing expired unused in 2016, decreasing the amounts available under the debt facility to $13.0 million.
In March 2017, we signed Amendment 3 to the Loan Agreement increasing the total facility available by $5.0 million to a total of $18.0 million. We did not draw any of this additional amount, which was available for us to draw until February 28, 2018. Additionally, we did not request an optional term loan for an incremental $5.0 million which was available for us to request until September 3, 2018. Principal payments were delayed to September 1, 2018 and the loan maturity date was extended to March 1, 2019. We voluntarily made principal payments in the months of March, April, and May 2018. No principal payments were made in June, July or August 2018. The amendment did not affect the due date of the existing end of term fees (in aggregate $0.5 million) which were due on February 1, 2018. In connection with this amendment, we issued Hercules a warrant to purchase up to 38,828 shares of our Series D Preferred Stock at an exercise price of $3.67 per share. Upon closing of the IPO, this warrant was automatically converted into a warrant to purchase up to 12,080 shares of our common stock at an exercise price of $11.80 per share.
In July 2017, we signed Amendment 4 to the Loan Agreement, which capped the "Term Loan Interest Rate" with respect to the 2017 Term Loan Advance only at 10%. Amendment 4 to the Loan
Table of Contents
Agreement did not change or affect any other element of the Loan Agreement or the Term Loan Advance.
In August 2018, we signed Amendment 5 to the Loan Agreement, which extendsextended the interest only payment period through March 1, 2020 and also extendsextended the loan maturity date to March 1, 2020. We accounted for the August 2018 amendment as a modification pursuant to ASC 470-50 and determined that no material change occurred as a result of the modification. In addition, the amendment deferred the payment of principal until the maturity date. We paid $0.1 million ofin end of term payments are due Marchrelated to Amendment 5 during the year ended December 31, 2020. In October 2018, we signed Amendment 6 to the Loan agreement,Agreement, which amendsamended the Loan Agreement's collateral clause to exclude the $1 million certificate of deposit associated with the lease on our new headquarters in Billerica, MA. Massachusetts. The Loan Agreement and amendments contain end of term payments and are recorded in the debt accounts. We paid $0.5 million in end of term payments related to Amendment 6 during the year ended December 31, 2018. On April 15, 2019, we entered into Amendment 7 to the Loan Agreement, which extended the interest only payment period through July 1, 2021 and also extended the loan maturity date to October 1, 2021. We are required to pay the loan principal in five equal monthly installments starting July 1, 2021 with the final principal payment to be made on October 1, 2021. On July 2, 2019, 66,041 warrants were exercised by Hercules on a net, non-cash, basis. Per the terms of the warrant agreement, we issued 45,690 shares of common stock as a result of the net exercise. The Loan Agreement and amendments contain end of term payments and are recorded in the debt accounts. No end of term payments were paid in the year ended December 31, 2018.2019. We paid $0.1 million in end of term payments related to Amendment 5 during the year ended December 31, 2020. The Loan Agreement contains negative covenants restricting our activities, including limitations on dispositions, mergers or acquisitions, incurring indebtedness or liens, paying dividends or making investments and certain other business transactions. There are no financial covenants associated with the Loan Agreement. The obligations under the Loan Agreement are subject to acceleration upon the occurrence of specified events of default, including a material adverse change in our business, operations or financial or other condition, which is subjective in nature. We have determined that the risk of subjective acceleration under the material adverse events clause is not probable and therefore have classified the outstanding principal in current and long-term liabilities based on scheduled principal payments. Debt principal repayments, including the end of term fees, due as of December 31, 20182020 are (in thousands): | | | | | Years ending December 31: | |
| |
|---|
2019 | | $ | 0 | | 2020 | | | 7,763 | | | | | | | | | | $ | 7,763 | | | | | | | |
| | | | Years ending December 31, | | | | 2021 | | $ | 7,738 | | | $ | 7,738 |
Uman Acquisition In August 2019, we completed the acquisition of Uman, in which we paid $15.7 million in cash to the shareholders of Uman. We funded this payment through our existing cash balances. In addition, we issued $5.5 million in stock in connection with the purchase of Uman. The acquisition closed with respect to 95% of the outstanding shares of capital stock of Uman on July 1, 2019 and with respect to the remaining 5% of the outstanding shares of capital stock of Uman on August 1, 2019. Cash Flows The following table presents our cash flows for each period presented (in thousands): | | | | | | | | | | |
| | Year ended December 31, | |
|---|
| | 2018 | | 2017 | | 2016 | |
|---|
Net cash used in operating activities | | $ | (28,721 | ) | $ | (22,106 | ) | $ | (17,742 | ) | Net cash used in investing activities | | | (5,454 | ) | | (1,132 | ) | | (826 | ) | Net cash (used in) provided by financing activities | | | (78 | ) | | 73,249 | | | 45,916 | | | | | | | | | | | | | | Net decrease in cash and cash equivalents | | $ | (34,253 | ) | $ | 50,011 | | $ | 27,348 | | | | | | | | | | | | | |
| | | | | | | | | | | | Year Ended December 31, | | | 2020 | | 2019 | | 2018 | Net cash used in operating activities | | $ | (23,365) | | $ | (26,187) | | $ | (28,721) | Net cash used in investing activities | | | (626) | | | (25,376) | | | (5,454) | Net cash provided by (used in) financing activities | | | 96,236 | | | 116,197 | | | (78) | Net increase (decrease) in cash and cash equivalents | | $ | 72,245 | | $ | 64,634 | | $ | (34,253) |
Net Cash Used in Operating Activities We derive cash flows from operations primarily from the sale of our products and services. Our cash flows from operating activities are also significantly influenced by our use of cash for operating expenses to support the growth of our business. We have historically experienced negative cash flows from operating activities as we have developed our technology, expanded our business and built our infrastructure and this may continue in the future. Net cash used in operating activities was $23.4 million during the year ended December 31, 2020. Net cash used in operating activities primarily consisted of net loss of $31.5 million offset by non-cash charges of $10.1 million of stock-based compensation expense and $4.3 million of depreciation and amortization expense. Cash used as a result of changes in operating assets and liabilities of $7.5 million was primarily due to an increase in an increase in accounts receivable of $6.2 million, an increase in inventory of $5.1 million, and an increase in prepaid expenses and other assets of $3.9 million, offset by a decrease in accrued compensation and benefits and other accrued expenses of $6.2 million. Net cash used in operating activities was $26.2 million during the year ended December 31, 2019. Net cash used in operating activities primarily consisted of net loss of $40.8 million offset by non-cash charges of $6.4 million of stock-based compensation expense, $3.0 million of depreciation and amortization expense, and $0.6 of inventory valuation adjustment amortization. Cash provided as a result of changes in operating assets and liabilities of $4.4 million was primarily due to a $9.8 million increase in other non-current liabilities related to our lease, offset by an increase in accounts receivable of $3.4 million, and an increase in inventory of $3.4 million. Net cash used in operating activities was $28.7 million during the year ended December 31, 2018. Net cash used in operating activities primarily consisted of net loss of $31.5 million, a decrease of $1.9 million in deferred revenue and an increase of $1.6 million in inventory, primarily offset by non-cash stock compensation expense of $4.9 million and an increase of $1.3 million in accounts payable. Net cash used in operating activities was $22.1 million during the year ended December 31, 2017. Net cash used in operating activities primarily consisted of net loss of $27.0 million and an increase of $2.0 million in inventory and an increase in accounts receivable of $1.7 million, primarily offset by non-cash stock compensation expense of $2.2 million, an increase of $2.9 million in deferred revenue, an increase of $2.0 million in accrued expenses and an increase of $1.0 million in accounts payable.
Net cash used in operating activities was $17.7 million during the year ended December 31, 2016. Net cash used in operating activities primarily consisted of a net loss of $23.2 million and an increase in accounts receivable of $1.7 million, primarily offset by non-cash charges related to issuance of warrants of $2.1 million, other non-cash items including depreciation and stock based compensation, of $1.8 million, and an increase in current liabilities of $2.3 million and an increase in deferred revenue of $0.9 million.
Net Cash Used in Investing Activities Historically, our primary investing activities have consisted of capital expenditures for the purchase of capital equipment to support our expanding infrastructure and work force. We expect to continue to incur additional costs for capital expenditures related to these efforts in future periods. We used $0.6 million of cash in investing activities during the year ended December 31, 2020 consisting of $3.9 million in additions to property and equipment, offset by $3.3 million in grant proceeds related to assets acquired under WP2. We used $25.4 million of cash in investing activities during the year ended December 31, 2019. The significant increase was related to the cash portion of the Uman acquisition, as well as the leasehold improvements for our headquarters, which is a component of our lease agreement. We used $5.5 million of cash in investing activities during the year ended December 31, 2018 consisting of cash paid in the acquisition of Aushon, net of cash acquired, and for purchases of capital equipment to support our infrastructure. We used $1.1 million of cash in investing activities during the year ended December 31, 2017 for purchases of capital equipment to support our infrastructure.
We used $0.8 million of cash in investing activities during the year ended December 31, 2016 primarily for purchases of capital equipment to support our infrastructure, and for a $0.3 million equity investment in another company.
Net Cash Provided by (Used in) Financing Activities Historically, we have financed our operations principally through private placements of our convertible preferred stock and borrowings from credit facilities, the sale of shares of our common stock in our IPO or other offerings and revenues from our commercial operations. Financing activities provided $96.2 million of cash during the year ended December 31, 2020, primarily from net proceeds of our underwritten public offering during the third quarter of 2020. Financing activities provided $116.2 million of cash during the year ended December 31, 2019, primarily from proceeds of our “at-the-market” offering during the second quarter of 2019 and our underwritten public offering during the third quarter of 2019. We used $0.1 million cash in financing activities during the year ended December 31, 2018, which primarily was from payments on debt of $1.9 million offset by cash generated by the exercise of stock options. We generated $73.2 million of cash in financing activities during the year ended December 31, 2017, which primarily was from the sale of 4,916,480 shares of common stock in our IPO in December 2017 for net proceeds of $65.6 million, and the sale of 2,113,902 shares of our Series D-1 Preferred Stock in June 2017 for net proceeds of $8.4 million, which was partially offset by payments of outstanding debt.
We generated $45.9 million of cash from financing activities during the year ended December 31, 2016, which was primarily from the sale of our Series D Preferred Stock in March 2016 for net proceeds of $45.4 million.
Table of Contents
Capital Resources We have not achieved profitability on a quarterly oran annual basis since our inception, and we expect to continue to incur net losses in the future. We also expect that our operating expenses will increase as we continue to increase our marketing efforts to drive adoption of our commercial products. Additionally, as a public company, we have incurred and will continue to incur significant audit, legal and other expenses that we did not incur as a private company. Our liquidity requirements have historically consisted, and we expect that they will continue to consist, of sales and marketing expenses, research and development expenses, working capital, debt service and general corporate expenses. We believe cash generated from commercial sales, our current cash and cash equivalents, and interest income we earn on these balances will be sufficient to meet our anticipated operating cash requirements for at least into the second quarter of 2020.next 12 months. In the future, we expect our operating and capital expenditures to increase as we increase headcount, expand our sales and marketing activities and grow our customer base. Our estimates of the period of time through which our financial resources will be adequate to support our operations and the costs to support research and development and our sales and marketing activities are forward-looking statements and involve risks and uncertainties and actual results could vary materially and negatively as a result of a number of factors, including the factors discussed in Item 1A, "Risk Factors"“Risk Factors” of this Annual Report on Form 10-K. We have based our estimates on assumptions that may prove to be wrong and we could utilize our available capital resources sooner than we currently expect. Our future funding requirements will depend on many factors, including: •market acceptance of our products, including our SP-X instrument;
•the cost and timing of establishing additional sales, marketing and distribution capabilities;
•the cost of our research and development activities;
•our ability to enter into collaborations in the future, and the success of any such collaborations;
•the cost and timing of potential regulatory clearances or approvals that may be required in the future for our products; and
•the effect of competing technological and market developments.
| ● | market acceptance of our products; |
| ● | the cost and timing of establishing additional sales, marketing and distribution capabilities; |
| ● | the cost of our research and development activities; |
| ● | our ability to enter into collaborations in the future, and the success of any such collaborations; |
| ● | the cost and timing of potential regulatory clearances or approvals that may be required in the future for our products; and |
| ● | the effect of competing technological and market developments. |
We cannot assure you that we will be able to obtain additional funds on acceptable terms, or at all. If we raise additional funds by issuing equity or equity-linked securities, our stockholders may experience dilution. Future debt financing, if available, may involve covenants restricting our operations or our ability to incur additional debt. Any debt or equity financing that we raise may contain terms that are not favorable to us or our stockholders. If we raise additional funds through collaboration and licensing arrangements with third parties, it may be necessary to relinquish some rights to our technologies or our products, or grant licenses on terms that are not favorable to us. If we do not have or are not able to obtain sufficient funds, we may have to delay development or commercialization of our products. We also may have to reduce marketing, customer support or other resources devoted to our products or cease operations. If the conditions for raising capital are favorable, we may seek to finance future cash needs through public or private equity or debt offerings or other financings. On November 6, 2020, we filed an automatically effective shelf registration statement with the SEC. Each issuance of securities under the shelf registration statement will require the filing of a prospectus supplement identifying the amount and terms of securities to be issued. The registration statement does not limit the amount of securities that may be issued thereunder. Our ability to issue securities is subject to market conditions and other factors. This registration statement will expire on November 6, 2023, three years after its date of effectiveness. Off-Balance Sheet Arrangements We did not have, during the periods presented, and we do not currently have, any off-balance sheet arrangements, as defined under applicable SEC rules. Contractual Obligations, Commitments and Contingencies The following table summarizes our contractual obligations as of December 31, 20182020 (in thousands): | | | | | | | | | | | | | | | | | | Payments due by period | | | | | 2022 | | 2024 | | 2026 | | | | | | | through | | through | | and | | | | (in thousands) | | 2021 | | 2023 | | 2025 | | thereafter | | Total | Contractual Obligations:(1) | | | | | | | | | | | | | | | | Operating lease obligations | | $ | 3,388 | | $ | 6,981 | | $ | 7,212 | | $ | 18,548 | | $ | 36,129 | Principal payments and end of term fees on the term loan | | | 7,738 | | | — | | | — | | | — | | | 7,738 | Total | | $ | 11,126 | | $ | 6,981 | | $ | 7,212 | | $ | 18,548 | | $ | 43,867 |
| (1) | See “Development and Supply Agreement” for additional contractual obligations. |
| | | | | | | | | | | | | | | | |
| | Payments due by period | |
|---|
(in thousands) | | Less than
1 Year | | 1 to 3
years | | 3 to 5
years | | More than
5 years | | Total | |
|---|
Contractual Obligations:(1) | | | | | | | | | | | | | | | | | Operating lease obligations | | $ | 1,172 | | $ | 5,303 | | $ | 10,377 | | $ | 22,202 | | $ | 39,054 | | Principal payments and end of term fees on the term loan | | $ | 0 | | $ | 7,763 | | $ | 0 | | $ | 0 | | $ | 7,763 | | | | | | | | | | | | | | | | | | | | Total | | $ | 1,172 | | $ | 13,066 | | $ | 10,377 | | $ | 22,202 | | $ | 46,817 | |
(1)See "—Development and Supply Agreement" for additional contractual obligations.
We currently lease approximately 30,655 square feet of office, laboratory, and manufacturing space at our headquarters in Lexington, Massachusetts, under a lease that was to expire on June 30, 2020 (the "Lexington Lease"); however in November 2018, the Company agreed to terminate the lease with the lessor effective May 2019. The termination of the lease was connected to the Company signing a new lease on October 2, 2018 (see below). In addition, pursuant to our acquisition of Aushon in January 2018, we currently lease approximately 21,500 square feet of office, laboratory, and manufacturing space in Billerica, Massachusetts, under a lease that was to expire on February 28, 2021 (the "Billerica Lease").
In August 2018, we exercised an option to terminate the Billerica Lease effective as of September 1, 2019. The Company is required to pay a termination fee of $75,000 no later than July 1, 2019 in consideration for the early termination.
On October 2, 2018, we entered into a lease for approximately 91,600 square feet of office, laboratory, and manufacturing space in the building located at 900 Middlesex Turnpike, Billerica, Massachusetts. The premises covered by this new lease will serve as our new principal office and laboratory space beginning in the second quarter of 2019. The initial term of the lease is 11 years and five months beginning on April 1, 2019, and we have the option to extend the lease for two additional five-year periods. We believe that this office, laboratory and manufacturing space will be sufficient to meet our needs for the foreseeable future.
We also have ongoing obligations related to license agreements which contain immaterial minimum annual payments that are credited against the actual royalty expense. Purchase orders or contracts for the purchase of supplies and other goods and services are not included in the table above. We are not able to determine the aggregate amount of such purchase orders that represent contractual obligations, as purchase orders may represent authorizations to purchase rather than binding agreements. Our purchase orders are based on our current procurement or development needs and are fulfilled by our vendors within short time horizons. Loan Facility with Hercules On April 14, 2014, we executed a Loan Agreement with Hercules, as subsequently amended, most recently in April 2019. The Loan Agreement provided a total debt facility of $10.0 million, which is secured by substantially all of our assets. At closing, we borrowed $5.0 million in principal and had the ability to draw the additional $5.0 million over the period from November 1, 2014 to March 31, 2015. The interest rate on this term loan was variable based on a calculation of 8% plus the prime rate less 5.25%, with a minimum interest rate of 8%. Interest was to be paid monthly beginning the month following the borrowing date. Principal payments were scheduled to begin on September 1, 2015, unless we achieved certain milestones which would have extended this date to December 1, 2015 or March 1, 2016. In connection with the execution of the Loan Agreement, we issued Hercules a warrant to purchase up to 173,428 shares of our Series C Preferred Stock at an exercise price of $3.3299 per share. Upon closing of the IPO, this warrant was automatically converted into a warrant to purchase up to 53,960 shares of our common stock at an exercise price of $10.70 per share. Leases On January 1, 2020, we adopted ASC Topic 842 – Leases (ASC 842) using the optional transition method allowing entities to recognize a cumulative effect adjustment to the opening balance sheet without restating comparative prior periods presented. ASC 842 requires a lessee to recognize assets and liabilities on the balance sheet for most leases and changes many key definitions, including the definition of a lease. Lessees will continue to differentiate between finance leases and operating, and classification will impact expense recognition. We elected the following practical expedients for all lease asset classes, which must be elected as a package and applied consistently to all of its leases at the transition date: i) we did not reassess whether any expired or existing contracts are or contain leases; ii) we did not reassess the lease classification for any expired or existing leases (that is, all existing leases that were classified as operating leases in accordance with ASC 840, Leases (ASC 840), are classified as operating leases); and iii) we did not reassess initial direct costs for any existing leases. At the inception of an arrangement, we determine whether the arrangement is or contains a lease based on the facts and circumstances present in the arrangement. Leases with a term greater than one year are recognized on the balance sheet as right-of-use (ROU) assets and short-term and long-term lease liabilities, as applicable. We have elected the practical expedient not to recognize leases on the balance sheet with a term of twelve months or less. Our leases consist of office and lab space and office equipment. All of our leases are classified as operating, and options to renew a lease are only included in the lease term to the extent those options are reasonably certain to be exercised. Additionally, we elected to apply the practical expedient not to separate lease and nonlease components for all leases. Operating lease liabilities and their corresponding ROU assets are initially recorded based on the present value of lease payments over the expected remaining lease term. The rate implicit in lease contracts is typically not readily determinable and, as a result, we utilize its incremental borrowing rate to discount lease payments, which reflects the fixed rate at which we could borrow on a collateralized basis the amount of the lease payments, for a similar term, in a similar economic environment. To estimate its incremental borrowing rate, a credit rating applicable to us is estimated using a synthetic credit rating analysis since we do not currently have a rating agency-based credit rating. The adoption of ASC 842 resulted in the recognition of operating lease ROU assets and operating lease liabilities of $12.2 million and $22.8 million, respectively, on our consolidated balance sheet, with the difference between the ROU asset and lease liability primarily attributable to unamortized lease incentives and deferred rent related to the lease for our corporate headquarters at 900 Middlesex Turnpike in Billerica, Massachusetts (the 900 Middlesex Turnpike Lease). We currently lease approximately 91,600 square feet of office, laboratory, and manufacturing space at our headquarters in Billerica, Massachusetts. The premises covered by this lease serves as our principal office and laboratory space effective the second quarter of 2019. The initial term of the lease is 11 years and five months beginning on April 1, 2019, and we have the option to extend the lease for two additional five-year periods. We previously leased approximately 30,655 square feet of office, laboratory, and manufacturing space as our headquarters in Lexington, Massachusetts, which was to expire on June 30, 2020; however in November 2018, we agreed to terminate the lease with the lessor effective May 2019. The termination of the lease was connected to us signing the new lease in October 2018 for our new headquarters in Billerica. In addition, pursuant to our acquisition of Aushon in January 2018, we assumed a lease of approximately 21,500 square feet of office, laboratory, and manufacturing space in Billerica, Massachusetts, under a lease that was to expire on February 28, 2021; however, in August 2018, we exercised an option to terminate the lease effective as of September 1, 2019. We paid a termination fee of $75,000 in February 2019 in consideration for the early termination. In addition, our subsidiary, Uman, leases a total of approximately 6,500 square feet of office, laboratory, manufacturing and storage space in Umeå, Sweden. These leases expire at various dates between May 31, 2020 and February 28, 2023. Development and Supply Agreement We do not have significant agreements, with the exception of the supply agreement with STRATEC for the purchase of supplies or other goods specifying minimum quantities or set prices that exceed our expected requirements for the next three to six months, with the exception of the agreement withmonths. STRATEC who manufacturesmanufactured our HD-1 instrument and will manufacturemanufactures the HD-X that we expect to commercializecommercialized in the second half of 2019. In 2013, we entered into a supply agreement, or the Supply Agreement with STRATEC which requires us to purchase a minimum number of commercial units over a seven-year period ending in May 2021. We
Table of Contents
could be obligated to pay a fee based on the shortfall of commercial units purchased compared to the required number. Based on the commercial units purchased as of December 31, 2018, assuming no additional commercial units were purchased thereafter but prior to May 2021, this fee would equal $11.1 million. The amount2020, we could be obligated to pay under thehave satisfied our required minimum purchase commitment is reduced as each commercial unit is purchased. We believe that we will purchase sufficient units to meetamount per the requirements of the minimum purchase commitment and, therefore, have not accrued for any of the minimum purchase commitment.supply agreement. Also, if we terminate the Supply Agreement under certain circumstances and do not purchase up to a required number of commercial units, we would be required to issue warrants to purchase 93,341 shares of common stock at $0.003214 per share. We believe that we will not issue such warrantwarrants and therefore have not recorded any amounts related to the potential equity consideration. In August 2011, we entered into a Strategic Development Services and Equity Participation Agreement, or the Development Agreement with STRATEC, pursuant to which STRATEC undertook the development of the HD-1 for manufacture and sale to us or a partner whom we designate. During the year ended December 31, 2016, the Development Agreement was amended to modify the deliverables related to the final milestone, to agree on instrument design changes to be implemented, and to reduce the minimum purchase commitment in the Supply Agreement. Additionally, the parties agreed on additional development services for a total fee of $1.5 million, which iswas payable when development is completed and of which $0.9 million was paid in 2018.2018 and $0.6 million was paid in 2019. The total amount includesincluded the final milestone payment that was due under the terms of the original agreement. Backlog We generally expect to ship all instrument and consumable orders received in a given period with the exception of orders received near the end of a fiscal quarter; and as a result, our backlog at the end of any period is typically insignificant. Item 7A. QUANTITATIVE AND QUALITATIVE DISCLOSURES ABOUT MARKET RISK
Market risk represents the risk of loss that may impact our financial position due to adverse changes in financial market prices and rates. Our market risk exposure is primarily a result of fluctuations in foreign currency exchange rates and interest rates. We do not hold or issue financial instruments for trading purposes. Foreign Currency Exchange Risk As we expand internationally our results of operations and cash flows will become increasingly subject to fluctuations due to changes in foreign currency exchange rates. Historically, the substantial majority of our revenue has been denominated in U.S. dollars. Our expenses are generally denominated in the currencies in which our operations are located, which is primarily in the United States, with a portion of expenses incurred in Canada, Europe, Japan and China. Our results of operations and cash flows are, therefore, subject to fluctuations due to changes in foreign currency exchange rates. Fluctuations in currency exchange rates could harm our business in the future. The effect of a 10% adverse change in exchange rates on foreign denominated cash, receivables and payables as of December 31, 20182020 would not have been material. To date, we have not entered into any material foreign currency hedging contracts although we may do so in the future.
Table of Contents
Interest Rate Sensitivity We had cash and cash equivalents of $44.4$181.6 million as of December 31, 2018.2020. These amounts were held primarily in cash on deposit with banks. Due to the short-term nature of these investments, we believe that we do not have any material exposure to changes in the fair value of our investment portfolio as a result of changes in interest rates. Declines in interest rates, however, will reduce future investment income. If overall interest rates had decreased by 10% during the periods presented, our interest income would not have been materially affected. As of December 31, 2018,2020, the principal amount of our term debt outstanding with Hercules was $7.8$7.7 million. If overall interest rates had increased by 10% during the periods presented, our interest expense would have increased by approximately $0.1 million on an annualized basis. Item 8. FINANCIAL STATEMENTS AND SUPPLEMENTARY DATA
The financial statements required to be filed pursuant to this Item 8 are appended to this Annual Report on Form 10-K beginning on page F-1.
Item 9. CHANGES IN AND DISAGREEMENTS WITH ACCOUNTANTS ON ACCOUNTING AND FINANCIAL DISCLOSURE
Not applicable. Item 9A. CONTROLS AND PROCEDURES
(a)Evaluation of Disclosure Controls and Procedures.Our principal executive officer and principal financial officer, after evaluating the effectiveness of our disclosure controls and procedures (as defined in Exchange Act Rules 13a-15(e) and 15d-15(e)) as of the end of the period covered by this Form 10-K, have concluded that, based on such evaluation, our disclosure controls and procedures were effective to ensure that information required to be disclosed by us in the reports that we file or submit under the Exchange Act is recorded, processed, summarized and reported, within the time periods specified in the SEC'sSEC’s rules and forms, and is accumulated and communicated to our management, including our principal executive and principal financial officers, or persons performing similar functions, as appropriate to allow timely decisions regarding required disclosure. (b)Changes in Internal Controls.There were no changes in our internal control over financial reporting, identified in connection with the evaluation of such internal control that occurred during the fourth quarter of our last fiscal year that have materially affected, or are reasonably likely to materially affect, our internal control over financial reporting. (c) Management'sManagement’s Annual Report on Internal Control Over Financial Reporting.Our management is responsible for establishing and maintaining adequate internal control over financial reporting. Internal control over financial reporting is defined in Rules 13a-15(f) and 15d-15(f) under the Exchange Act, as a process designed by, or under the supervision of, our principal executive officer and principal financial officer and effected by our board of directors, management and other personnel to provide reasonable assurance regarding the reliability of financial reporting and the preparation of financial statements for external purposes in accordance with generally accepted accounting principles. Our internal control over financial reporting includes those policies and procedures that:•pertain to the maintenance of records that, in reasonable detail, accurately and fairly reflect the transactions and dispositions of our assets;
•provide reasonable assurance that transactions are recorded as necessary to permit preparation of financial statements in accordance with generally accepted accounting principles, and that our
| ● | pertain to the maintenance of records that, in reasonable detail, accurately and fairly reflect the transactions and dispositions of our assets; |
| ● | provide reasonable assurance that transactions are recorded as necessary to permit preparation of financial statements in accordance with generally accepted accounting principles, and that our receipts and expenditures are being made only in accordance with authorizations of management and our directors; and |
| ● | provide reasonable assurance regarding prevention or timely detection of unauthorized acquisition, use or disposition of our assets that could have a material effect on the financial statements. |
Table of Contents
Because of its inherent limitations, internal control over financial reporting may not prevent or detect misstatements. Projections of any evaluation of effectiveness to future periods are subject to the risk that controls may become inadequate because of changes in conditions, or that the degree of compliance with the policies or procedures may deteriorate. Under the supervision and with the participation of our management, including our principal executive officer and principal financial officer, we conducted an evaluation of the effectiveness of our internal control over financial reporting based on the 2013 framework in Internal Control—Integrated Framework issued by the Committee of Sponsoring Organizations of the Treadway Commission. Based on our evaluation under that framework, our management concluded that our internal controls over financial reporting were effective as of December 31, 2018.2020. (d)Attestation Report on Internal Control over Financial Reporting. This Annual Report on Form 10-K does not include an attestation report of our independent registered public accounting firm on internal control over financial reporting due to the deferral allowed under the JOBS Act for emerging growth companies.
Item 9B. OTHER INFORMATION
Not applicable.
Table of Contents
PART III
Item 10. DIRECTORS, EXECUTIVE OFFICERS AND CORPORATE GOVERNANCE
The information required by this Item 10 will be included in our definitive proxy statement to be filed with the SEC with respect to our 20192021 Annual Meeting of Stockholders and is incorporated herein by reference. Item 11. EXECUTIVE COMPENSATION
The information required by this Item 11 will be included in our definitive proxy statement to be filed with the SEC with respect to our 20192021 Annual Meeting of Stockholders and is incorporated herein by reference. Item 12. SECURITY OWNERSHIP OF CERTAIN BENEFICIAL OWNERS AND MANAGEMENT AND RELATED STOCKHOLDER MATTERS
The information required by this Item 12 will be included in our definitive proxy statement to be filed with the SEC with respect to our 20192021 Annual Meeting of Stockholders and is incorporated herein by reference. Item 13. CERTAIN RELATIONSHIPS AND RELATED TRANSACTIONS, AND DIRECTOR INDEPENDENCE
The information required by this Item 13 will be included in our definitive proxy statement to be filed with the SEC with respect to our 20192021 Annual Meeting of Stockholders and is incorporated herein by reference. Item 14. PRINCIPAL ACCOUNTING FEES AND SERVICES
The information required by this Item 14 will be included in our definitive proxy statement to be filed with the SEC with respect to our 20192021 Annual Meeting of Stockholders and is incorporated herein by reference.
Table of Contents
PART IV
Item 15. EXHIBITS, FINANCIAL STATEMENT SCHEDULES
(1) Financial Statements
The consolidated financial statements are included beginning on pagespage F-1 through F-53 attached hereto and are filed as part of this Annual Report on Form 10-K. | (2) | Financial Statement Schedules |
(2) Financial Statement Schedules
Schedules have been omitted since they are either not required or not applicable or the information is otherwise included herein. The following is a list of exhibits filed as part of this Annual Report on Form 10-K: Exhibit Number | | Exhibit Description | | Filed
Herewith | | Incorporated by
Reference herein from
Form or Schedule | | Filing Date | | SEC File/
Reg. Number |
|---|
| | | | | | | | | | |
|---|
3.1 | | Amended and Restated Certificate of Incorporation | | | | 8-K | | 12/15/17 | | 001-38319 | 3.2 | | Restated Bylaws | | | | 8-K | | 12/15/17 | | 001-38319 | 4.1 | | Description of Securities | | | | 10-K | | 3/13/20 | | 001-38319 | 4.2 | | Form of Common Stock Certificate | | | | S-1 | | 11/9/17 | | 333-221475 | 4. | 3 | Fourth Amended and Restated Stockholders Agreement, dated as of June 2, 2017, by and among the Registrant and the stockholders named therein | | | | S-1 | | 11/9/17 | | 333-221475 | 4.4 | | Fourth Amended and Restated Registration Rights Agreement, dated as of June 2, 2017, by and among the Registrant and the investors named therein | | | | S-1 | | 11/9/17 | | 333-221475 | 4.5 | | Warrant Agreement, dated as of January 30, 2018, by and between the Registrant and Azul Divinal Consultoria Unipessoal LDA | | | | 10-K | | 3/19/18 | | 001-38319 | 10.1.1+ | | 2007 Stock Option and Grant Plan, as amended | | | | S-1 | | 11/9/17 | | 333-221475 | 10.1.2+ | | Form of Incentive Stock Option Agreement under the 2007 Stock Option and Grant Plan, as amended | | | | S-1 | | 11/9/17 | | 333-221475 | 10.1.3+ | | Form of Non-qualified Stock Option Agreement under the 2007 Stock Option and Grant Plan, as amended | | | | S-1 | | 11/9/17 | | 333-221475 | 10.1.4+ | | Form of Restricted Stock Agreement under the 2007 Stock Option and Grant Plan, as amended | | | | S-1 | | 11/9/17 | | 333-221475 | 10.2.1+ | | 2017 Employee, Director and Consultant Equity Incentive Plan | | | | S-1/A | | 11/27/17 | | 333-221475 |
| | | | | | | | | | | | Exhibit Number |
| Exhibit Description |
| Filed
Herewith |
| Incorporated by
Reference herein from
Form or Schedule |
| Filing Date |
| SEC File/
Reg. Number |
|---|
| | | | | | | | | | |
|---|
10.2.2+ | 3.1 | | Amended and Restated Certificate of Incorporation
| | | | 8-K | | 12/15/17 | | 001-38319 | | | | | | | | | | | | | | 3.2 | | Restated Bylaws | | | | 8-K | | 12/15/17 | | 001-38319 | | | | | | | | | | | | | | 4.1 | | Form of Common Stock Certificate | | | | S-1 | | 11/9/17 | | 333-221475 | | | | | | | | | | | | | | 4.2 | | Form of Warrant to Purchase Series C Preferred Stock of the Registrant | | | | S-1 | | 11/9/17 | | 333-221475 | | | | | | | | | | | | | | 4.3 | | Warrant Agreement, dated as of April 14, 2014, by and between the Registrant and Hercules Capital, Inc. (formerly known as Hercules Technology Group Capital, Inc.) | | | | S-1 | | 11/9/17 | | 333-221475 | | | | | | | | | | | | | | 4.4 | | Warrant Agreement, dated as of January 29, 2016, by and between the Registrant and Hercules Capital, Inc. (formerly known as Hercules Technology Group Capital, Inc.) | | | | S-1 | | 11/9/17 | | 333-221475 | | | | | | | | | | | | | | 4.5 | | Warrant Agreement, dated as of March 31, 2017, by and between the Registrant and Hercules Capital, Inc. (formerly known as Hercules Technology Group Capital, Inc.) | | | | S-1 | | 11/9/17 | | 333-221475 | | | | | | | | | | | | | | 4.6 | | Fourth Amended and Restated Stockholders Agreement, dated as of June 2, 2017, by and among the Registrant and the stockholders named therein | | | | S-1 | | 11/9/17 | | 333-221475 | |
| | | | | | | | | | |
Table of Contents
| | | | | | | | | | | | Exhibit Number | | Exhibit Description | | Filed
Herewith | | Incorporated by
Reference herein from
Form or Schedule | | Filing Date | | SEC File/
Reg. Number |
|---|
| 4.7 | | Fourth Amended and Restated Registration Rights Agreement, dated as of June 2, 2017, by and among the Registrant and the investors named therein | | | | S-1 | | 11/9/17 | | 333-221475 | | | | | | | | | | | | | | 4.8 | | Warrant Agreement, dated as of January 30, 2018, by and between the Registrant and Azul Divinal Consultoria Unipessoal LDA | | | | 10-K | | 3/19/18 | | 001-38319 | | | | | | | | | | | | | | 10.1.1 | + | 2007 Stock Option and Grant Plan, as amended | | | | S-1 | | 11/9/17 | | 333-221475 | | | | | | | | | | | | | | 10.1.2 | + | Form of Incentive Stock Option Agreement under the 2007 Stock Option and Grant Plan, as amended | | | | S-1 | | 11/9/17 | | 333-221475 | | | | | | | | | | | | | | 10.1.3 | + | Form of Non-qualified Stock Option Agreement under the 2007 Stock Option and Grant Plan, as amended | | | | S-1 | | 11/9/17 | | 333-221475 | | | | | | | | | | | | | | 10.1.4 | + | Form of Restricted Stock Agreement under the 2007 Stock Option and Grant Plan, as amended | | | | S-1 | | 11/9/17 | | 333-221475 | | | | | | | | | | | | | | 10.2.1 | + | 2017 Employee, Director and Consultant Equity Incentive Plan | | | | S-1/A | | 11/27/17 | | 333-221475 | | | | | | | | | | | | | | 10.2.2 | + | Form of Stock Option Agreement under the 2017 Employee, Director and Consultant Equity Incentive Plan | | | | S-1/A | | 11/27/17 | | 333-221475 | 10.2.3+ | | | | | | | | | | | | | 10.2.3 | + | Form of Restricted Stock Agreement under the 2017 Employee, Director and Consultant Equity Incentive Plan | | | | S-1/A | | 11/27/17 | | 333-221475 | 10.2.4+ | | | | | | | | | | | | | 10.2.4 | + | Form of Restricted Stock Unit Agreement under the 2017 Employee, Director and Consultant Equity Incentive Plan | | | | S-1/A | | 11/27/17 | | 333-221475 | 10.3+ | | | | | | | | | | | | | 10.3 | + | Employment Agreement, dated January 1, 2015, by and between the Registrant and E. Kevin Hrusovsky | | | | S-1 | | 11/9/17 | | 333-221475 | 10.4+ | | | | | | | | | | | | | 10.4 | + | Letter Agreement, dated April 8, 2017,February 14, 2019, between Registrant and Amol Chaubal | | | | 10-Q | | 5/10/19 | | 001-38319 | 10.5+ | | Letter Agreement, dated May 31, 2019, by and between the Registrant and Joseph DriscollJohn Fry | | | | S-110-Q | | 11/9/178/6/19 | | 333-221475001-38319 | 10.6+ | | | | | | | | | | | | | 10.5 | + | Letter Agreement, dated December 1, 2011, by and between the Registrant and Ernest Orticerio
| | | | S-1 | | 11/9/17 | | 333-221475 | |
| | | | | | | | | | |
Table of Contents
| | | | | | | | | | | | Exhibit Number | | Exhibit Description | | Filed
Herewith | | Incorporated by
Reference herein from
Form or Schedule | | Filing Date | | SEC File/
Reg. Number |
|---|
| 10.6 | + | Letter Agreement, dated April 6, 2016, by and between the Registrant and Bruce Bal | | | | S-1 | | 11/9/17 | | 333-221475 | | | | | | | | | | | | | | 10.7 | + | Letter Agreement, dated August 8, 2014, by and between the Registrant and Mark T. Roskey, Ph.D. | | | | S-1 | | 11/9/17 | | 333-221475 | 10.7+ | | | | | | | | | | | | | 10.8 | + | Letter Agreement, effective as February 5, 2018, by and betwwenbetween the Registrant and Dawn Mattoon | | | | 10-Q | | 5/15/18 | | 001-38319 | 10.8.1* | | | | | | | | | | | | | 10.9 | + | Letter Agreement, effective as October 22, 2018, by and between the Registrant and Jackson Streeter
| | X | | | | | | | | | | | | | | | | | | | | 10.10 | + | Letter Agreement, dated March 20, 2017, by and between the Registrant and Marijn Dekkers, Ph.D. | | | | S-1 | | 11/9/17 | | 333-221475 | | | | | | | | | | | | | | 10.11 | + | Letter Agreement, dated August 7, 2013, by and between the Registrant and Paul M. Meister | | | | S-1 | | 11/9/17 | | 333-221475 | | | | | | | | | | | | | | 10.12 | | Lease Agreement, dated as of November 22, 2011, between the Registrant and King 113 Hartwell LLC | | | | S-1 | | 11/9/17 | | 333-221475 | | | | | | | | | | | | | | 10.13 | | First Amendment to lease dated August 22, 2014, by and between the Registrant and King 113 Hartwell LLC | | | | S-1 | | 11/9/17 | | 333-221475 | | | | | | | | | | | | | | 10.14.1 | * | Exclusive License Agreement, dated June 18, 2007, between the Registrant and Tufts University, as amended on April 29, 2013 | | | | S-1 | | 11/9/17 | | 333-221475 | 10.8.2* | | | | | | | | | | | | | 10.14.2 | * | Second Amendment, dated August 22, 2017, to the Exclusive License Agreement between the Registrant and Tufts University | | | | S-1 | | 11/9/17 | | 333-221475 | 10.8.3 | @ | Third Amendment, dated September 25, 2020, to the Exclusive License Agreement between the Registrant and Tufts University | | | | 10-Q | | 11/6/20 | | 001-38319 | |
Table of Contents
| | | | | | | | | | | | Exhibit Number | | Exhibit Description | | Filed
Herewith | | Incorporated by
Reference herein from
Form or Schedule | | Filing Date | | SEC File/
Reg. Number |
|---|
| 10.16.1 | * | STRATEC Development Services and Equity Participation Agreement, dated August 15, 2011, between the Registrant and STRATEC Biomedical Systems AG | | | | S-1 | | 11/9/17 | | 333-221475 | 10.10.2* | | | | | | | | | | | | | 10.16.2 | * | First Amendment to STRATEC Development Services and Equity Participation Agreement and Second Amendment to Supply and Manufacturing Agreement, dated November 18, 2016, between the Registrant and STRATEC Biomedical AG | | | | S-1 | | 11/9/17 | | 333-221475 | 10.11* | | | | | | | | | | | | | 10.17 | * | Manufacturing Services Agreement, dated November 23, 2016, between the Registrant and Paramit Corporation | | | | S-1 | | 11/9/17 | | 333-221475 | 10.12.1 | | | | | | | | | | | | | 10.18.1 | | Loan and Security Agreement, dated April 14, 2014, by and between the Registrant and Hercules Capital, Inc. (formerly known as Hercules Technology Growth Capital, Inc.) | | | | S-1 | | 11/9/17 | | 333-221475 | 10.12.2 | | | | | | | | | | | | | 10.18.2 | | Amendment No. 1 to Loan and Security Agreement, dated March 4, 2015, by and between the Registrant and Hercules Capital, Inc. (formerly known as Hercules Technology Growth Capital, Inc.) | | | | S-1 | | 11/9/17 | | 333-221475 |
Exhibit Number |
| Exhibit Description |
| Filed
Herewith |
| Incorporated by
Reference herein from
Form or Schedule |
| Filing Date |
| SEC File/
Reg. Number |
|---|
| | | | | | | | | | |
|---|
10.12.3 | | | | | | | | | | | | | 10.18.3 | | Amendment No. 2 to Loan and Security Agreement, dated January 29, 2016, by and between the Registrant and Hercules Capital, Inc. (formerly known as Hercules Technology Growth Capital, Inc.) | | | | S-1 | | 11/9/17 | | 333-221475 | 10.12.4 | | | | | | | | | | | | | 10.18.4 | | Amendment No. 3 to Loan and Security Agreement, dated March 31, 2017, by and between the Registrant and Hercules Capital, Inc. (formerly known as Hercules Technology Growth Capital, Inc.) | | | | S-1 | | 11/9/17 | | 333-221475 | 10.12.5 | | | | | | | | | | | | | 10.18.5 | | Amendment No. 4 to Loan and Security Agreement, dated July 24, 2017, by and between the Registrant and Hercules Capital, Inc. (formerly known as Hercules Technology Growth Capital, Inc.) | | | | 10-Q | | 11/7/18 | | 001-38319 | 10.12.6 |
| | | | | | | | | | |
Table of Contents
| | | | | | | | | | | | Exhibit Number | | Exhibit Description | | Filed
Herewith | | Incorporated by
Reference herein from
Form or Schedule | | Filing Date | | SEC File/
Reg. Number |
|---|
| 10.18.6 | | Amendment No. 5 to Loan and Security Agreement, dated August 30, 2018, by and between the Registrant and Hercules Capital, Inc. (formerly known as Hercules Technology Growth Capital, Inc.) | | | | 10-Q | | 11/7/18 | | 001-38319 | 10.12.7 | | | | | | | | | | | | | 10.18.7 | | Amendment No. 6 to Loan and Security Agreement, dated September 28, 2018, by and between the Registrant and Hercules Capital, Inc. (formerly known as Hercules Technology Growth Capital, Inc.) | | | | 10-Q | | 11/7/18 | | 001-38319 | 10.12.8 | | Amendment No. 7 to Loan and Security Agreement, dated April 15, 2019, by and between the Registrant and Hercules Capital, Inc. (formerly known as Hercules Technology Growth Capital, Inc.) | | | | 8-K | | 4/15/19 | | | 001-38319 | 10.13+ | 10.19 | + | Form of Indemnification Agreement | | | | S-1/A | | 11/27/17 | | 333-221475 |
Exhibit Number |
| Exhibit Description |
| Filed
Herewith |
| Incorporated by
Reference herein from
Form or Schedule |
| Filing Date |
| SEC File/
Reg. Number |
|---|
| | | | | | | | | | |
|---|
10.14 | | | | | | | | | | | | | 10.20.1 | | Lease, dated September 24, 2007, between RAR2 Boston Industrial QRS-MA, Inc. and Aushon Biosystems, Inc.
| | | | 10-K | | 3/19/18 | | 001-38319 | | | | | | | | | | | | | | 10.20.2 | | First Amendment, dated October 28, 2009, to Lease, dated September 24, 2007, between RAR2 Boston Industrial QRS-MA, Inc. and Aushon Biosystems, Inc. | | | | 10-K | | 3/19/18 | | 001-38319 | | | | | | | | | | | | | | 10.20.3 | | Second Amendment, dated September 23, 2015, to Lease, dated September 24, 2007, between RAR2 Boston Industrial QRS-MA, Inc. and Aushon Biosystems, Inc. | | | | 10-K | | 3/19/18 | | 001-38319 | | | | | | | | | | | | | | 10.21 | | Lease Agreement between SSI 900 Middlesex MA LP and the Registrant, dated October 2, 2018. | | | | 8-K | | 10/5/18 | | 001-38319 | | | | | | | | | | | | | 10.15 | 10.22@ | +Non-Exclusive License Agreement, dated September 29, 2020, by and between Abbott Laboratories and Quanterix Corporation. | | | | 8-K | | 10/5/20 | | 001-38319 | 10.16+ | | Employment Agreement between Will Geist and the Company dated November 9, 2020. | | | | 8-K | | 11/18/20 | | 001-38319 | 10.17+ | | 2018 Non-Employee Director Compensation Policy | | X | | 10-K | | 3/18/19 | | 001-38319 | | | | | | | | | | | | | 21.1 | 21.1 | | Subsidiaries of Registrant | | X | | | | | | | 23.1 | | | | | | | | | | | | | 23.1 | | Consent of Ernst & Young LLP | | X | | | | | | | 31.1 | | | | | | | | | | | | | 31.1 | | Certification of the Principal Executive Officer pursuant to Section 302 of the Sarbanes-Oxley Act of 2002 | | X | | | | | | | 31.2 | | | | | | | | | | | | | 31.2 | | Certification of the Principal Financial Officer pursuant to Section 302 of the Sarbanes-Oxley Act of 2002 | | X | | | | | | | 32.1 |
| | | | | | | | | | |
Table of Contents
Exhibit Number |
| Exhibit Description |
| Filed
Herewith |
| Incorporated by
Reference herein from
Form or Schedule |
| Filing Date |
| SEC File/
Reg. Number |
|---|
| | | | | | | | | | |
|---|
101.PRE | | | | | | | | | | | | | 101.PRE | | Inline XBRL Taxonomy Presentation Linkbase Document. | | X | | | | | | | 104 | | Cover Page Interactive Data File (formatted as Inline XBRL and contained in Exhibit 101) | | | | | | | | |
+Management contract or compensatory plan or arrangement.
*Confidential treatment has been granted for portions of this Exhibit. Redacted portions have been filed separately with the Securities and Exchange Commission.
+ | Management contract or compensatory plan or arrangement. |
* | Confidential treatment has been granted for portions of this Exhibit. Redacted portions have been filed separately with the SEC. |
@ | Certain confidential portions of this exhibit have been omitted and replaced with “[***]”. Such identified information has been excluded from this exhibit because it is (i) not material and (ii) would likely cause competitive harm to the company if disclosed |
Item 16. FORM 10-K SUMMARY
Not applicable.
SIGNATURES
SIGNATURES
Pursuant to the requirements of Section 13 or 15(d) of the Securities Exchange Act of 1934, the registrant has duly caused this report to be signed on its behalf by the undersigned, thereunto duly authorized.
QUANTERIX CORPORATION
| | | | | | | Date: March 18, 20195, 2021 | By: | By: | | /s/ E. KEVIN HRUSOVSKY
| | | E. Kevin Hrusovsky
| | | Chairman, President and Chief Executive Officer |
Pursuant to the requirements of the Securities Exchange Act of 1934, this report has been signed below by the following persons on behalf of the registrant and in the capacities and on the dates indicated. Signature |
| Title |
| | | | Signature
| | Title
| | |
|---|
|
|
|
|
|
|
| | | | | | /s/ E. KEVIN HRUSOVSKY
E. Kevin Hrusovsky | | Chairman, President and Chief Executive Officer and Director (principal executive officer) | | March 18, 20195, 2021 |
E. Kevin Hrusovsky | | | | | | | | | | /s/ JOSEPH DRISCOLL
Joseph DriscollAMOL CHAUBAL |
|
Chief Financial Officer (principal | | March 5, 2021 | Amol Chaubal | | (principal financial officer and principal accounting officer) |
|
March 18, 2019 |
/s/ DOUGLAS G. COLE, M.D.
Douglas G. Cole, M.D. |
|
Director |
|
March 18, 2019 |
/s/ JOHN M. CONNOLLY
John M. Connolly |
|
Director |
|
March 18, 2019 |
/s/ KEITH L. CRANDELL
| | Director | | March 5, 2021 | Keith L. Crandell |
|
Director |
|
March 18, 2019 |
/s/ MARIJN DEKKERS, PH.D.
Marijn Dekkers, Ph.D. |
|
Director |
|
March 18, 2019 |
/s/ MARTIN D. MADAUS, PH. D.
Martin D. Madaus, Ph. D. |
|
Director |
|
March 18, 2019 |
Table of Contents
| | | | | | | Signature
| | Title
| | Date
|
|---|
|
|
|
|
|
|
| /s/ PAUL M. MEISTER
Paul M. MeisterMARIJN DEKKERS | | Director | | March 18, 20195, 2021 |
/s/ DAVID R. WALT, PH.D.
David R. Walt,Marijn Dekkers, Ph.D. |
|
Director |
|
March 18, 2019 |
Table of Contents
INDEX TO CONSOLIDATED FINANCIAL STATEMENTS
QUANTERIX CORPORATION
Years ended December 31, 2018, 2017 and 2016
| | | | |
| | Page | | | | | | |
|---|
/s/ SARAH HLAVINKA | | Director | | March 5, 2021 | Sarah Hlavinka | | | | | | | | | | /s/ MARTIN MADAUS, PH.D. | | Director | | March 5, 2021 | Martin Madaus, Ph. D. | | | | | | | | | | /s/ PAUL MEISTER | | Director | | March 5, 2021 | Paul M. Meister | | | | | | | | | | /s/ DAVID WALT, PH.D. | | Director | | March 5, 2021 | David R. Walt, Ph.D. | | | | |
INDEX TO CONSOLIDATED FINANCIAL STATEMENTS QUANTERIX CORPORATION Years ended December 31, 2020, 2019, and 2018 | | | Page |
Report of Independent Registered Public Accounting Firm | | | F-2 | |
Consolidated Balance Sheets | | | F-3 | |
Consolidated Statements of Operations and | F-4 | Consolidated Statements of Comprehensive Loss | | | F-4 | F-5 |
Consolidated Statements of Cash Flows | | | F-5 | F-6 |
Consolidated Statements of Redeemable Convertible Preferred Stock and Stockholders' (Deficit)Stockholders’ Equity | | | F-6 | F-7 |
Notes to Consolidated Financial Statements | | | F-7 | F-8 |
F-1 Report of Independent Registered Public Accounting Firm
To the Stockholders and the Board of Directors of Quanterix Corporation Opinion on the Financial Statements We have audited the accompanying consolidated balance sheets of Quanterix Corporation (the "Company")Company) as of December 31, 20182020 and 2017,2019, the related consolidated statements of operations, and comprehensive loss, redeemable convertible preferred stock and stockholders'stockholders’ (deficit) equity and cash flows for each of the three years in the period ended December 31, 2018,2020, and the related notes (collectively referred to as the "consolidated“consolidated financial statements"statements”). In our opinion, the consolidated financial statements present fairly, in all material respects, the financial position of the Company at December 31, 20182020 and 2017,2019, and the results of its operations and its cash flows for each of the three years in the period ended December 31, 2018,2020, in conformity with USU.S. generally accepted accounting principles. Adoption of ASU No. 2016-02 As discussed in Note 2 to the consolidated financial statements, the Company changed its method of accounting for leases in the year ended December 31, 2020 due to the adoption of Accounting Standards Update No. 2016-02, Leases, and the related amendments, using the modified retrospective method. Basis for Opinion These financial statements are the responsibility of the Company'sCompany’s management. Our responsibility is to express an opinion on the Company'sCompany’s financial statements based on our audits. We are a public accounting firm registered with the Public Company Accounting Oversight Board (United States) (PCAOB) and are required to be independent with respect to the Company in accordance with the U.S. federal securities laws and the applicable rules and regulations of the Securities and Exchange Commission and the PCAOB. We conducted our audits in accordance with the standards of the PCAOB. Those standards require that we plan and perform the audit to obtain reasonable assurance about whether the financial statements are free of material misstatement, whether due to error or fraud. The Company is not required to have, nor were we engaged to perform, an audit of its internal control over financial reporting. As part of our audits we are required to obtain an understanding of internal control over financial reporting but not for the purpose of expressing an opinion on the effectiveness of the Company'sCompany’s internal control over financial reporting. Accordingly, we express no such opinion. Our audits included performing procedures to assess the risks of material misstatement of the financial statements, whether due to error or fraud, and performing procedures that respond to those risks. Such procedures included examining, on a test basis, evidence regarding the amounts and disclosures in the financial statements. Our audits also included evaluating the accounting principles used and significant estimates made by management, as well as evaluating the overall presentation of the financial statements. We believe that our audits provide a reasonable basis for our opinion. /s/ Ernst & Young LLP We have served as the Company’s auditor since 2008. Boston, Massachusetts March 5, 2021 | | | | | /s/ Ernst & Young LLP |
We have served as the Company's auditor since 2008. |
|
| Boston, Massachusetts | | | March 18, 2019 | | |
Table of Contents
Quanterix Corporation
Consolidated Balance Sheets
(amounts in thousands, except share and per share data)
| | | | | | | |
| | December 31,
2018 | | December 31,
2017 | |
|---|
Assets | | | | | | | | Current assets: | | | | | | | | Cash and cash equivalents | | $ | 44,429 | | $ | 79,682 | | Accounts receivable (less reserve for doubtful accounts of $36; including $48 and $123 from related parties as of December 31, 2018 and 2017, respectively) | | | 6,792 | | | 5,599 | | Inventory | | | 5,945 | | | 3,571 | | Prepaid expenses and other current assets | | | 2,330 | | | 400 | | | | | | | | | | | Total current assets | | | 59,496 | | | 89,252 | | Restricted Cash | | | 1,000 | | | — | | Property and equipment, net | | | 2,923 | | | 1,874 | | Intangible assets, net | | | 2,348 | | | — | | Goodwill | | | 1,308 | | | — | | Other non-current assets | | | 536 | | | 653 | | | | | | | | | | | Total assets | | $ | 67,611 | | $ | 91,779 | | | | | | | | | | | | | | | | | | | | | | | | | | | | | Liabilities and stockholders' equity | | | | | | | | Current liabilities: | | | | | | | | Accounts payable (including $36 and $0 to related parties as of December 31, 2018 and 2017, respectively) | | $ | 5,110 | | $ | 3,552 | | Accrued compensation and benefits | | | 4,449 | | | 2,624 | | Other accrued expenses (including $226 and $170 to related parties as of December 31, 2018 and 2017, respectively) | | | 3,129 | | | 3,560 | | Deferred revenue (including $33 and $1,182 with related parties as of December 31, 2018 and 2017, respectively) | | | 5,437 | | | 4,942 | | Current portion of long term debt | | | — | | | 5,036 | | | | | | | | | | | Total current liabilities | | | 18,125 | | | 19,714 | | Deferred revenue, net of current portion (including $0 and $1,074 with related parties as of December 31, 2018 and 2017, respectively) | | | 520 | | | 1,709 | | Long term debt, net of current portion | | | 7,623 | | | 4,346 | | Other non-current liabilities | | | 278 | | | 144 | | | | | | | | | | | Total liabilities | | | 26,546 | | | 25,913 | | Commitments and contingencies (Note 9) | | | | | | | | Stockholders' equity: | | | | | | | | Common stock, $0.001 par value: | | | | | | | | Authorized—120,000,000 shares as of December 31, 2018 and December 31, 2017; issued and outstanding—22,369,036 and 21,707,041 shares as of December 31, 2018 and 2017, respectively | | | 22 | | | 22 | | Additional paid-in capital | | | 216,931 | | | 210,196 | | Accumulated deficit | | | (175,888 | ) | | (144,352 | ) | | | | | | | | | | Total stockholders' equity | | | 41,065 | | | 65,866 | | | | | | | | | | | Total liabilities and stockholders' equity | | $ | 67,611 | | $ | 91,779 | | | | | | | | | | | | | | | | | | | | | | | | | | | | |
| | | | | | | | | | | | | | December 31, 2020 | | December 31, 2019 | Assets | | | | | | | Current assets: | | | | | | | Cash and cash equivalents | | $ | 181,584 | | $ | 109,155 | Accounts receivable (less allowance for doubtful accounts of $370 and $162 as of December 31, 2020 and December 31, 2019, respectively; including $172 and $186 from related parties as of December 31, 2020 and December 31, 2019, respectively) | | | 17,184 | | | 10,906 | Inventory | | | 14,856 | | | 10,463 | Prepaid expenses and other current assets | | | 5,981 | | | 2,137 | Total current assets | | | 219,605 | | | 132,661 | Restricted cash | | | 1,000 | | | 1,026 | Property and equipment, net | | | 13,912 | | | 12,047 | Intangible assets, net | | | 13,716 | | | 14,307 | Goodwill | | | 10,460 | | | 9,353 | Right-of-use assets | | | 11,995 | | | — | Other non-current assets | | | 357 | | | 557 | Total assets | | $ | 271,045 | | $ | 169,951 | Liabilities and stockholders’ equity | | | | | | | Current liabilities: | | | | | | | Accounts payable (including $14 and $36 to related parties as of December 31, 2020 and December 31, 2019, respectively) | | $ | 6,799 | | $ | 5,777 | Accrued compensation and benefits | | | 10,777 | | | 6,570 | Other accrued expenses (including $1,377 and $0 to related parties as of December 31, 2020 and December 31, 2019, respectively) | | | 4,845 | | | 2,498 | Deferred revenue (including $90 and $55 with related parties as of December 31, 2020 and December 31, 2019, respectively) | | | 5,421 | | | 4,697 | Current portion of long term debt | | | 7,673 | | | 75 | Short term lease liabilities | | | 1,234 | | | — | Other current liabilities | | | 3,054 | | | 216 | Total current liabilities | | | 39,803 | | | 19,833 | Deferred revenue, net of current portion | | | 577 | | | 466 | Long term debt, net of current portion | | | — | | | 7,587 | Long term lease liabilities | | | 21,891 | | | — | Other non-current liabilities | | | 2,649 | | | 13,407 | Total liabilities | | | 64,920 | | | 41,293 | Commitments and contingencies (Note 9) | | | | | | | Stockholders’ equity: | | | | | | | Common stock, $0.001 par value: | | | | | | | Authorized—120,000,000 shares as of December 31, 2020 and December 31, 2019; issued and outstanding — 31,796,544 and 28,112,201 shares as of December 31, 2020 and December 31, 2019, respectively | | | 32 | | | 28 | Additional paid-in capital | | | 451,433 | | | 345,027 | Accumulated other comprehensive income (loss) | | | 2,434 | | | (153) | Accumulated deficit | | | (247,774) | | | (216,244) | Total stockholders’ equity | | | 206,125 | | | 128,658 | Total liabilities and stockholders’ equity | | $ | 271,045 | | $ | 169,951 |
See accompanying notes.
Quanterix Corporation
Consolidated Statements of Operations and Comprehensive Loss
(amounts in thousands, except share and per share data)
| | | | | | | | | | |
| | Twelve Months Ended December 31, | |
|---|
| | 2018 | | 2017 | | 2016 | |
|---|
Product revenue (including related party activity of $294, $339, and $509 for the years ended December 31, 2018, 2017, and 2016 respectively) | | $ | 23,365 | | $ | 14,124 | | $ | 10,601 | | Service and other revenue (including related party activity of $149, $165, and $107 for the years ended December 31, 2018, 2017, and 2016 respectively) | | | 12,117 | | | 7,676 | | | 5,012 | | Collaboration and license revenue (including related party activity of $2,150, $1,074, and $172 for the years ended December 31, 2018, 2017, and 2016 respectively) | | | 2,150 | | | 1,074 | | | 1,972 | | | | | | | | | | | | | | Total revenue | | | 37,632 | | | 22,874 | | | 17,585 | | Costs of Goods Sold: | | | | | | | | | | | Cost of product revenue (including related party activity of $191, $235, and $322 for the years ended December 31, 2018, 2017, and 2016 respectively; including stock compensation of $228, $76, and $18 for the years ended December 31, 2018, 2017, and 2016 respectively) | | | 12,729 | | | 7,742 | | | 6,299 | | Cost of services and other revenue | | | 6,955 | | | 5,145 | | | 3,163 | | Costs of license revenue, related party | | | — | | | — | | | 375 | | | | | | | | | | | | | | Total Costs of Goods Sold and Services | | | 19,684 | | | 12,887 | | | 9,837 | | | | | | | | | | | | | | Gross Profit | | | 17,948 | | | 9,987 | | | 7,748 | | | | | | | | | | | | | | Operating Expense: | | | | | | | | | | | Research and development (including stock compensation of $513, $180, and $59 for the years ended December 31, 2018, and 2017, and 2016, respectively) | | | 15,805 | | | 16,304 | | | 16,993 | | Selling, general and administrative (including stock compensation of $4,143, $1,912, and $851 for the years ended December 31, 2018, 2017, and 2016, respectively) | | | 33,693 | | | 19,688 | | | 12,466 | | | | | | | | | | | | | | Total operating expenses | | | 49,498 | | | 35,992 | | | 29,459 | | | | | | | | | | | | | | Loss from operations | | | (31,550 | ) | | (26,005 | ) | | (21,711 | ) | Interest income (expense), net | | | 46 | | | (951 | ) | | (1,298 | ) | Other (expense) income, net | | | (7 | ) | | (63 | ) | | (164 | ) | | | | | | | | | | | | | Loss before income taxes | | | (31,511 | ) | | (27,019 | ) | | (23,173 | ) | Income tax provision | | | (25 | ) | | — | | | — | | | | | | | | | | | | | | Net loss | | $ | (31,536 | ) | $ | (27,019 | ) | $ | (23,173 | ) | | | | | | | | | | | | | | | | | | | | | | | | | | | | | | | | | | | | | Reconciliation of net loss to net loss attributable to common stockholders: | | | | | | | | | | | Net loss | | $ | (31,536 | ) | $ | (27,019 | ) | $ | (23,173 | ) | Accretion of preferred stock to redemption value | | | — | | | (4,110 | ) | | (4,437 | ) | Accrued dividends on preferred stock | | | — | | | (59 | ) | | (8 | ) | | | | | | | | | | | | | Net loss attributable to common stockholders | | $ | (31,536 | ) | $ | (31,188 | ) | $ | (27,618 | ) | | | | | | | | | | | | | | | | | | | | | | | | | | | | | | | | | | | | | Net loss per share attributable to common stockholders, basic and diluted | | $ | (1.43 | ) | $ | (8.30 | ) | $ | (12.89 | ) | | | | | | | | | | | | | | | | | | | | | | | | | | | | | | | | | | | | | Weighted-average common shares outstanding, basic and diluted | | | 21,994,317 | | | 3,756,954 | | | 2,142,840 | | | | | | | | | | | | | | | | | | | | | | | | | | | | | | | | | | | | | |
See accompanying notes.
Table of Contents
Quanterix Corporation
Consolidated Statements of Cash Flows
(amounts in thousands)
| | | | | | | | | | |
| | Twelve Months Ended
December 31, | |
|---|
| | 2018 | | 2017 | | 2016 | |
|---|
Operating activities | | | | | | | | | | | Net loss | | $ | (31,536 | ) | $ | (27,019 | ) | $ | (23,173 | ) | Adjustments to reconcile net loss to net cash used in operating activities: | | | | | | | | | | | Depreciation and amortization expense | | | 1,352 | | | 482 | | | 444 | | Stock-based compensation expense | | | 4,884 | | | 2,168 | | | 928 | | Non-cash interest expense | | | 170 | | | 238 | | | 388 | | Gain on disposal of fixed assets | | | (14 | ) | | — | | | 11 | | Non-cash research and development expense for issuance of warrents to a vendor | | | — | | | — | | | 2,078 | | Change in fair value of preferred stock warrants | | | — | | | 90 | | | 307 | | Changes in operating assets and liabilities: | | | | | | | | | | | Accounts receivable | | | (983 | ) | | (1,682 | ) | | (1,655 | ) | Deposits | | | — | | | — | | | 200 | | Prepaid expenses and other assets | | | (1,828 | ) | | (273 | ) | | 6 | | Inventory | | | (1,603 | ) | | (2,043 | ) | | (526 | ) | Other non-current assets | | | 267 | | | — | | | — | | Accounts payable | | | 1,318 | | | 1,003 | | | 1,131 | | Accrued compensation and benefits, other accrued expenses and other liabilities | | | 1,101 | | | 2,035 | | | 1,200 | | Deferred revenue | | | (1,849 | ) | | 2,895 | | | 919 | | | | | | | | | | | | | | Net cash used in operating activities | | | (28,721 | ) | | (22,106 | ) | | (17,742 | ) | | | | | | | | | | | | | Investing activities | | | | | | | | | | | Purchases of property and equipment | | | (1,518 | ) | | (1,132 | ) | | (526 | ) | Acquisitions, net of cash acquired | | | (3,801 | ) | | — | | | (300 | ) | Purchase of Investments | | | (150 | ) | | — | | | — | | Proceeds from sale of assets | | | 15 | | | — | | | — | | | | | | | | | | | | | | Net cash used in investing activities | | $ | (5,454 | ) | $ | (1,132 | ) | $ | (826 | ) | | | | | | | | | | | | | Financing activities | | | | | | | | | | | Proceeds from sale of preferred stock, net of issuance costs | | | — | | | 65,575 | | | — | | Proceeds from sale of common stock, net of issuance costs | | | (20 | ) | | 8,423 | | | 45,428 | | Proceeds from exercise of stock warrants | | | — | | | 29 | | | 18 | | Proceeds from stock options exercised | | | 1,871 | | | 202 | | | 213 | | Proceeds from the issuance of notes payable and warrants, net of issuance costs | | | — | | | (59 | ) | | 2,954 | | Payments on notes payable | | | (1,929 | ) | | (921 | ) | | (2,697 | ) | | | | | | | | | | | | | Net cash (used in) provided by financing activities | | $ | (78 | ) | $ | 73,249 | | $ | 45,916 | | | | | | | | | | | | | | Net decrease in cash and cash equivalents | | | (34,253 | ) | | 50,011 | | | 27,348 | | Cash, restricted cash, and cash equivalents at beginning of period | | | 79,682 | | | 29,671 | | | 2,323 | | | | | | | | | | | | | | Cash, restricted cash, and cash equivalents at end of period | | $ | 45,429 | | $ | 79,682 | | $ | 29,671 | | | | | | | | | | | | | | Supplemental cash flow information | | | | | | | | | | | Accretion of redeemable convertible preferred stock to redemption value | | $ | — | | $ | 4,110 | | $ | 4,437 | | Cash paid for interest | | $ | 660 | | $ | 743 | | $ | 945 | | Warrants issued to lenders | | $ | — | | $ | 119 | | $ | 128 | | Purchases of property and equipment included in accounts payable | | $ | 78 | | $ | 74 | | $ | 72 | | Fair value of common stock warrants exercised and reclassified as shares of common stock | | $ | 196 | | $ | 2,187 | | $ | 5,257 | |
See accompanying notes.
Table of Contents
Quanterix Corporation
Consolidated Statements of Redeemable Convertible Preferred Stock and Stockholders' (Deficit) Equity
| | | | | | | | | | | | Years Ended | | | | December 31, | | | 2020 | | 2019 | | 2018 | Product revenue (including related party activity of $580, $720, and $294 for the years ended December 31, 2020, 2019, and 2018, respectively) | | $ | 44,017 | | $ | 40,491 | | $ | 23,365 | Service and other revenue (including related party activity of $202, $118, and $149 for the years ended December 31, 2020, 2019, and 2018, respectively) | | | 24,129 | | | 16,059 | | | 12,117 | Collaboration and license revenue (including related party activity of $0, $0, and $2,150 for the years ended December 31, 2020, 2019, and 2018, respectively) | | | 11,809 | | | 184 | | | 2,150 | Grant revenue | | | 6,422 | | | — | | | — | Total revenue | | | 86,377 | | | 56,734 | | | 37,632 | Costs of goods sold: | | | | | | | | | | Cost of product revenue (including related party activity of $205, $234, and $191 for the years ended December 31, 2020, 2019, and 2018, respectively) | | | 25,950 | | | 20,900 | | | 12,729 | Cost of services and other revenue (including related party activity of $52, $0, and $0 for the years ended December 31, 2020, 2019, and 2018, respectively) | | | 11,245 | | | 8,998 | | | 6,955 | Cost of collaboration and license revenue (including related party activity of $1,000, $0, and $0 for the years ended December 31, 2020, 2019, and 2018, respectively) | | | 1,000 | | | — | | | — | Total costs of goods sold, services, and licenses | | | 38,195 | | | 29,898 | | | 19,684 | Gross profit | | | 48,182 | | | 26,836 | | | 17,948 | Operating expenses: | | | | | | | | | | Research and development (including related party activity of $268, $0, and $0 for the years ended December 31, 2020, 2019, and 2018, respectively) | | | 20,174 | | | 16,190 | | | 15,805 | Selling, general, and administrative (including related party activity of $36, $0, and $0 for the years ended December 31, 2020, 2019, and 2018) | | | 59,592 | | | 52,246 | | | 33,693 | Total operating expenses | | | 79,766 | | | 68,436 | | | 49,498 | Loss from operations | | | (31,584) | | | (41,600) | | | (31,550) | Interest income (expense), net | | | (273) | | | 627 | | | 46 | Other expense, net | | | (49) | | | (10) | | | (7) | Loss before income taxes | | | (31,906) | | | (40,983) | | | (31,511) | Income tax benefit (provision) | | | 376 | | | 187 | | | (25) | Net loss | | $ | (31,530) | | $ | (40,796) | | $ | (31,536) | Net loss per share, basic and diluted | | $ | (1.07) | | $ | (1.63) | | $ | (1.43) | Weighted-average common shares outstanding, basic and diluted | | | 29,589,132 | | | 25,090,708 | | | 21,994,317 |
| | | | | | | | | | | | | | | | | | | | | | | | | | | | | | | | | | | | | | | | | | |
| | Preferred A
stock
shares | | Preferred A
stock
value | | Preferred B
stock
shares | | Preferred B
stock
value | | Preferred C
stock
shares | | Preferred C
stock
value | | Preferred D
stock
shares | | Preferred D
stock
value | |
| | Common
stock
shares | | Common
stock
value | | Additional
paid-in
capital | | Accumulated
deficit | | Total
stockholders'
equity | |
|---|
Balance at December 31, 2015 | | | 14,400,001 | | | 23,898 | | | 5,624,106 | | | 15,178 | | | 8,605,944 | | | 34,369 | | | — | | | — | | | | | 1,976,992 | | | 2 | | | — | | | (88,642 | ) | | (88,640 | ) | Issuance of Series D preferred stock, net of issuance costs | | | — | | | — | | | — | | | — | | | — | | | — | | | 12,420,262 | | | 45,428 | | | | | — | | | — | | | — | | | — | | | — | | Exercise of preferred stock warrants | | | 1,300,000 | | | 3,901 | | | 397,530 | | | 1,374 | | | — | | | — | | | — | | | — | | | | | — | | | — | | | — | | | — | | | — | | Exercise of common stock options | | | — | | | — | | | — | | | — | | | — | | | — | | | — | | | — | | | | | 90,883 | | | — | | | 213 | | | — | | | 213 | | Vesting of restricted stock | | | — | | | — | | | — | | | — | | | — | | | — | | | — | | | — | | | | | 247,621 | | | — | | | — | | | — | | | — | | Accretion of preferred stock to redemption value | | | — | | | 1,180 | | | — | | | 907 | | | — | | | 2,309 | | | — | | | 41 | | | | | — | | | — | | | (1,141 | ) | | (3,296 | ) | | (4,437 | ) | Stock-based compensation expense | | | — | | | — | | | — | | | — | | | — | | | — | | | — | | | — | | | | | — | | | — | | | 928 | | | — | | | 928 | | Net loss | | | — | | | — | | | — | | | — | | | — | | | — | | | — | | | — | | | | | — | | | — | | | — | | | (23,173 | ) | | (23,173 | ) | | | | | | | | | | | | | | | | | | | | | | | | | | | | | | | | | | | | | | | | | | | | | Balance at December 31, 2016 | | | 15,700,001 | | | 28,979 | | | 6,021,636 | | | 17,459 | | | 8,605,944 | | | 36,678 | | | 12,420,262 | | | 45,469 | | | | | 2,315,496 | | | 2 | | | — | | | (115,111 | ) | | (115,109 | ) | Issuance of Series D-1 preferred stock, net of issuance costs | | | — | | | — | | | — | | | — | | | — | | | — | | | 2,113,902 | | | 8,423 | | | | | — | | | — | | | — | | | — | | | — | | Exercise of preferred stock warrants | | | 700,000 | | | 2,078 | | | — | | | — | | | 31,283 | | | 138 | | | — | | | — | | | | | — | | | — | | | — | | | — | | | — | | Exercise of common stock options and vesting restricted stock | | | — | | | — | | | — | | | — | | | — | | | — | | | — | | | — | | | | | 289,321 | | | — | | | 204 | | | — | | | 204 | | Cumulative effect of adoption of ASU No. 2016-09 | | | — | | | — | | | — | | | — | | | — | | | — | | | — | | | — | | | | | — | | | — | | | 141 | | | (141 | ) | | — | | Accretion of preferred stock to redemption value | | | — | | | 1,080 | | | — | | | 840 | | | — | | | 2,140 | | | — | | | 50 | | | | | — | | | — | | | (2,029 | ) | | (2,081 | ) | | (4,110 | ) | Conversion of preferred stock to common stock | | | (16,400,001 | ) | | (32,137 | ) | | (6,021,636 | ) | | (18,299 | ) | | (8,637,227 | ) | | (38,956 | ) | | (14,534,164 | ) | | (53,942 | ) | | | | 14,185,744 | | | 15 | | | 143,319 | | | — | | | 143,334 | | Warrant Liability reclassified to equity upon IPO | | | — | | | — | | | — | | | — | | | — | | | — | | | — | | | — | | | | | — | | | — | | | 823 | | | — | | | 823 | | Issuance of common stock in initial public offering, net of $8,173 in offering costs | | | — | | | — | | | — | | | — | | | — | | | — | | | — | | | — | | | | | 4,916,480 | | | 5 | | | 65,570 | | | — | | | 65,575 | | Stock-based compensation expense | | | — | | | — | | | — | | | — | | | — | | | — | | | — | | | — | | | | | — | | | — | | | 2,168 | | | — | | | 2,168 | | Net loss | | | — | | | — | | | — | | | — | | | — | | | — | | | — | | | — | | | | | — | | | — | | | — | | | (27,019 | ) | | (27,019 | ) | | | | | | | | | | | | | | | | | | | | | | | | | | | | | | | | | | | | | | | | | | | | | Balance at December 31, 2017 | | | — | | | — | | | — | | | — | | | — | | | — | | | — | | | — | | | | | 21,707,041 | | | 22 | | | 210,196 | | | (144,352 | ) | | 65,866 | | Exercise of common stock warrants | | | — | | | — | | | — | | | — | | | — | | | — | | | — | | | — | | | | | 16,718 | | | — | | | — | | | — | | | — | | Exercise of common stock options and vesting of restricted stock | | | — | | | — | | | — | | | — | | | — | | | — | | | — | | | — | | | | | 645,277 | | | — | | | 1,871 | | | — | | | 1,871 | | Common stock issuance offering costs | | | — | | | — | | | — | | | — | | | — | | | — | | | — | | | — | | | | | — | | | — | | | (20 | ) | | — | | | (20 | ) | Stock-based compensation expense | | | — | | | — | | | — | | | — | | | — | | | — | | | — | | | — | | | | | — | | | — | | | 4,884 | | | — | | | 4,884 | | Net loss | | | — | | | — | | | — | | | — | | | — | | | — | | | — | | | — | | | | | — | | | — | | | — | | | (31,536 | ) | | (31,536 | ) | | | | | | | | | | | | | | | | | | | | | | | | | | | | | | | | | | | | | | | | | | | | | Balance at December 31, 2018 | | | — | | | — | | | — | | | — | | | — | | | — | | | — | | | — | | | | | 22,369,036 | | | 22 | | | 216,931 | | | (175,888 | ) | | 41,065 | | | | | | | | | | | | | | | | | | | | | | | | | | | | | | | | | | | | | | | | | | | | | | | | | | | | | | | | | | | | | | | | | | | | | | | | | | | | | | | | | | | | | | | | | | | | | | | | | | | | | | | | | | | | | | | | | | | | | | | | | | | | | | | | | | | | | |
See accompanying notes.
F-4
Quanterix Corporation
Consolidated Statements of Comprehensive Loss (amounts in thousands) | | | | | | | | | | | | Years Ended December 31, | | | 2020 | | 2019 | | 2018 | Net loss | | $ | (31,530) | | $ | (40,796) | | $ | (31,536) | Other comprehensive income (loss): | | | | | | | | | | Cumulative translation adjustment | | | 2,587 | | | (153) | | | — | Total other comprehensive income (loss) | | | 2,587 | | | (153) | | | — | Comprehensive loss | | $ | (28,943) | | $ | (40,949) | | $ | (31,536) |
See accompanying notes. Quanterix Corporation Consolidated Statements of Cash Flows (amounts in thousands) | | | | | | | | | | | | | Year Ended December 31, | | | 2020 | | 2019 | | 2018 | Operating activities | | | | | | | | | | Net loss | | $ | (31,530) | | $ | (40,796) | | $ | (31,536) | Adjustments to reconcile net loss to net cash used in operating activities: | | | | | | | | | | Depreciation and amortization expense | | | 4,312 | | | 3,009 | | | 1,352 | Inventory step-up amortization | | | 722 | | | 611 | | | — | Reduction in the carrying amounts of right-of-use assets | | | 245 | | | — | | | — | Stock-based compensation expense | | | 10,099 | | | 6,388 | | | 4,884 | Non-cash interest expense | | | 86 | | | 89 | | | 170 | Loss (gain) on disposal of fixed assets | | | 171 | | | 140 | | | (14) | Changes in operating assets and liabilities: | | | | | | | | | | Accounts receivable | | | (6,240) | | | (3,365) | | | (983) | Prepaid expenses and other assets | | | (3,927) | | | 289 | | | (1,828) | Inventory | | | (5,119) | | | (3,447) | | | (1,603) | Other non-current assets | | | 198 | | | (21) | | | 267 | Accounts payable | | | 649 | | | 621 | | | 1,318 | Accrued compensation and benefits, other accrued expenses and other current liabilities | | | 6,219 | | | 822 | | | 1,101 | Contract acquisition costs | | | 87 | | | 336 | | | — | Operating lease liabilities | | | 316 | | | — | | | — | Other non-current liabilities | | | (488) | | | 9,845 | | | — | Deferred revenue | | | 835 | | | (708) | | | (1,849) | Net cash used in operating activities | | | (23,365) | | | (26,187) | | | (28,721) | Investing activities | | | | | | | | | | Purchases of property and equipment | | | (3,930) | | | (10,847) | | | (1,518) | Acquisitions, net of cash acquired | | | — | | | (14,529) | | | (3,801) | Proceeds from RADx grant on assets purchased | | | 3,304 | | | — | | | — | Purchase of investments | | | — | | | — | | | (150) | Proceeds from sale of assets | | | — | | | — | | | 15 | Net cash used in investing activities | | | (626) | | | (25,376) | | | (5,454) | Financing activities | | | | | | | | | | Proceeds from sale of common stock, net of issuance costs | | | — | | | — | | | (20) | Proceeds from stock options exercised | | | 4,019 | | | 2,820 | | | 1,871 | Sale of common stock in at-the-market offering, net | | | — | | | 48,019 | | | — | Sale of common stock in underwritten public offering, net | | | 91,404 | | | 64,529 | | | — | Proceeds from ESPP purchase | | | 888 | | | 879 | | | — | Payments on notes payable | | | (75) | | | (50) | | | (1,929) | Net cash provided by (used in) financing activities | | | 96,236 | | | 116,197 | | | (78) | Net increase (decrease) in cash and cash equivalents | | | 72,245 | | | 64,634 | | | (34,253) | Effect of foreign currency exchange rate on cash | | | 158 | | | 118 | | | — | Cash, restricted cash, and cash equivalents at beginning of period | | | 110,181 | | | 45,429 | | | 79,682 | Cash, restricted cash, and cash equivalents at end of period | | $ | 182,584 | | $ | 110,181 | | $ | 45,429 | Supplemental cash flow information | | | | | | | | | | Cash paid for interest | | $ | 625 | | $ | 656 | | $ | 606 | Purchases of property and equipment included in accounts payable | | $ | 1,029 | | $ | 164 | | $ | 78 | Purchases of property and equipment included in other non-current liabilities | | $ | — | | $ | 7,572 | | $ | — | 191,152 shares of common stock issued in connection with the acquisition of UmanDiagnostics AB | | $ | — | | $ | 5,468 | | $ | — | Fair value of common stock warrants exercised and reclassified as shares of common stock | | $ | — | | $ | — | | $ | 196 | Reconciliation of cash, cash equivalents, and restricted cash: | | | | | | | | | | Cash and cash equivalents | | $ | 181,584 | | $ | 109,155 | | $ | 44,429 | Restricted cash | | $ | 1,000 | | $ | 1,026 | | $ | 1,000 | Total cash, cash equivalents, and restricted cash | | $ | 182,584 | | $ | 110,181 | | $ | 45,429 |
See accompanying notes. Quanterix Corporation Consolidated Statements of Stockholders’ Equity | | | | | | | | | | | | | | | | | | | | | | | Accumulated | | | | | | | | Common | | Common | | Additional | | other | | | | Total | | | | stock | | stock | | paid-in | | comprehensive | | Accumulated | | stockholders’ | | | | shares | | value | | capital | | income (loss) | | deficit | | equity | Balance at December 31, 2017 | | | 21,707,041 | $ | 22 | $ | 210,196 | $ | — | $ | (144,352) | $ | 65,866 | Exercise of common stock warrants | | | 16,718 | | — | | — | | — | | — | | — | Exercise of common stock options and vesting of restricted stock | | | 645,277 | | — | | 1,871 | | — | | — | | 1,871 | Common stock issuance offering costs | | | — | | — | | (20) | | — | | — | | (20) | Stock-based compensation expense | | | — | | — | | 4,884 | | — | | — | | 4,884 | Net loss | | | — | | — | | — | | — | | (31,536) | | (31,536) | Balance at December 31, 2018 | | | 22,369,036 | $ | 22 | $ | 216,931 | $ | — | $ | (175,888) | $ | 41,065 | Cumulative effect of adoption of Accounting Standards Codification Topic 606 | | | — | | — | | — | | — | | 440 | | 440 | Exercise of common stock warrants | | | 45,690 | | — | | — | | — | | — | | — | Exercise of common stock options and vesting of restricted stock | | | 550,734 | | — | | 2,820 | | — | | — | | 2,820 | Sale of common stock in "at-the-market" offering, net | | | 2,186,163 | | 2 | | 48,017 | | — | | — | | 48,019 | Sale of common stock in underwritten public offering, net | | | 2,732,673 | | 3 | | 64,526 | | — | | — | | 64,529 | Issuance of shares for the acquisition of UmanDiagnostics AB | | | 191,152 | | 1 | | 5,467 | | — | | — | | 5,468 | Stock-based compensation expense | | | — | | — | | 6,388 | | — | | — | | 6,388 | Employee stock purchase plan | | | 36,753 | | — | | 878 | | — | | — | | 878 | Accumulated other comprehensive income | | | — | | — | | — | | (153) | | — | | (153) | Net loss | | | — | | — | | — | | — | | (40,796) | | (40,796) | Balance at December 31, 2019 | | | 28,112,201 | $ | 28 | $ | 345,027 | $ | (153) | $ | (216,244) | $ | 128,658 | Exercise of common stock options and vesting of restricted stock | | | 589,723 | | 1 | | 4,018 | | — | | — | | 4,019 | Sale of common stock in underwritten public offering, net | | | 3,048,774 | | 3 | | 91,401 | | — | | — | | 91,404 | ESPP stock purchase | | | 45,846 | | — | | 888 | | — | | — | | 888 | Stock-based compensation expense | | | — | | — | | 10,099 | | — | | — | | 10,099 | Cumulative translation adjustment | | | — | | — | | — | | 2,587 | | — | | 2,587 | Net loss | | | — | | — | | — | | — | | (31,530) | | (31,530) | Balance at December 31, 2020 | | | 31,796,544 | $ | 32 | $ | 451,433 | $ | 2,434 | $ | (247,774) | $ | 206,125 |
See accompanying notes. Quanterix Corporation Notes to Consolidated Financial Statements
1. Organization and operations Quanterix Corporation (NASDAQ: QTRX) (the Company) is a life sciences company that has developed next generation, ultra-sensitive digital immunoassay platforms that advance precision health for life sciences research and diagnostics. The Company'sCompany’s platforms are based on ourits proprietary digital "Simoa"“Simoa” detection technology. The Company'sCompany’s Simoa bead-based and planar array platforms enable customers to reliably detect protein biomarkers in extremely low concentrations in blood, serum and other fluids that, in many cases, are undetectable using conventional, analog immunoassay technologies, and also allow researchers to define and validate the function of novel protein biomarkers that are only present in very low concentrations and have been discovered using technologies such as mass spectrometry. These capabilities provide the Company'sCompany’s customers with insight into the role of protein biomarkers in human health that has not been possible with other existing technologies and enable researchers to unlock unique insights into the continuum between health and disease. The Company is currently focusing on protein detection, but isthe Company’s Simoa platforms have also developing its bead-based technology to detectdemonstrated applicability across other testing applications, including detection of nucleic acids in biological samples.and small molecules. The Company currently marketslaunched its first immunoassay platform, the Simoa HD-1, in 2014. The HD-1 is a fully automated immunoassay bead-based platform with multiplexing and custom assay capability, and related assay test kits and consumable materials. The Company launched a second bead-based immunoassay platform (SR-X) in the fourth quarter of 2017 with a more compact footprint than the Simoa HD-1 Analyzer and less automation designed for lower volume requirements while still allowing multiplexing and custom assay capability. The Company initiated an early-access program for its third instrument (SP-X) on the new Simoa planar array platform in January 2019, with the full commercial launch planned forcommencing in April 2019. This compact instrumentIn July 2019, the Company launched the Simoa HD-X, an upgraded version of the Simoa HD-1 which replaces the HD-1. The HD-X has been designed to deliver significant productivity and operational efficiency improvements, as well as greater user flexibility. The Company began shipping and installing HD-X instruments at customer locations in the ability to reach a 10 plex and has custom assay capability.third quarter of 2019. The Company also performs research services on behalf of customers to apply the Simoa technology to specific customer needs. The Company's primary customers are primarily in the research use only market, which includes academic and governmental research institutions, the research and development laboratories of pharmaceutical manufacturers, contract research organizations, and specialty research laboratories. The Company acquired Aushon Biosystems, Inc. (Aushon) in January 2018. With the acquisition of Aushon, the Company acquired a CLIA certified laboratory, as well as Aushon'sAushon’s proprietary sensitive planar array detection technology. Leveraging its proprietary sophisticated Simoa image analysis and data analysis algorithms, the Company further refined this planar array technology to develop the SP-X instrument to provide the same Simoa sensitivity found in its bead-based platform. Initial Public Offering
In December 2017,The Company acquired UmanDiagnostics AB (Uman), a Swedish company located in Umeå, Sweden, in August 2019. The acquisition closed with respect to 95% of the outstanding shares of capital stock of Uman on July 1, 2019 and with respect to the remaining 5% of the outstanding shares of capital stock of Uman on August 1, 2019. Uman supplies neurofilament light (Nf-L) antibodies and ELISA kits, which are widely recognized by researchers and biopharmaceutical and diagnostics companies world-wide as the premier solution for the detection of Nf-L to advance the development of therapeutics and diagnostics for neurodegenerative conditions. With the acquisition of Uman, the Company completed its initial publichas secured a long-term source of supply for a critical technology.
“At-the-market offering” On March 19, 2019, the Company entered into a Sales Agreement (the Sales Agreement) with Cowen and Company, LLC (Cowen) with respect to an “at-the-market” offering (IPO) inprogram under which the Company sold 4,916,480could offer and sell, from time to time at its sole discretion, shares of its common stock, at the initial publicpar value $0.001 per share, having an aggregate offering price of $15.00 per share The Company's common stock began trading on The Nasdaq Global Market on December 7, 2017. The aggregate net proceeds received from the IPO, netup to $50.0 million through Cowen as its sales agent. On June 5, 2019, the Company filed an amended and restated certificate of incorporation with the Secretary of State of the State of Delaware, effective December 11, 2017 to, among other things, change the authorized number ofissued approximately 2.2 million shares of common stock at an average stock price of $22.73 per share pursuant to 120,000,000the terms of the Sales Agreement. The “at-the-market” offering resulted in gross proceeds of $49.7 million. The Company incurred $1.7 million in issuance costs associated with the “at-the-market” offering, resulting in net proceeds to the Company of $48.0 million. On August 6, 2020, the Company delivered written notice to Cowen to terminate the Sales Agreement, which termination the parties agreed to make immediately effective. Underwritten public offering On August 8, 2019, the Company entered into an underwriting agreement with J.P. Morgan Securities LLC and SVB Leerink LLC (Leerink), as representatives of the authorized numberseveral underwriters, relating to an underwritten public offering of approximately 2.7 million shares of preferredthe Company’s common stock, par value $0.001 per share. The underwritten public offering resulted in gross proceeds of $69.0 million. The Company incurred $4.5 million in issuance costs associated with the underwritten public offering, resulting in net proceeds to 5,000,000.
Tablethe Company of Contents$64.5 million.
Quanterix CorporationOn August 6, 2020, the Company entered into an underwriting agreement with Leerink and Cowen, as representatives of the several underwriters, relating to an underwritten public offering of approximately 3.0 million shares of the Company’s common stock, par value $0.001 per share. The underwritten public offering resulted in gross proceeds of $97.6 million. The Company incurred $6.2 million in issuance costs associated with the underwritten public offering, resulting in net proceeds to the Company of $91.4 million.
Notes to Consolidated Financial Statements (Continued)Liquidity
1. Organization and operations (Continued)
Liquidity
The Company has had recurringrecognized annual losses from operations since inception and has an accumulated deficit of $175.9$247.8 million at December 31, 20182020 and the Company incurred a net loss of $31.5 million, $27.0$40.8 million, and $23.2$31.5 million for the years ended December 31, 2018, 2017,2020, 2019, and 2016,2018, respectively. Prior to the IPOCompany’s Initial Public Offering (IPO) in December 2017, the Company had funded its operations principally from issuances of preferred stock, debt financings, grants, product and service sales and development and license agreements. At December 31, 2018,2020, the Company had $44.4$181.6 million of unrestricted cash and cash equivalents. The Company expects the current cash balance will be sufficient to fund operations for a period of at least one year from the date the consolidated financial statements are issued. There can be no assurances, however, that no additional funding will be required or that additional funding will be available on terms acceptable to the Company, or at all. Basis of Presentation
The accompanying financial statements have been prepared in conformity with accounting principles generally accepted in the United States of America ("GAAP"). Any reference in these notes to applicable guidance is meant to refer to the authoritative United States generally accepted accounting principles as found in the Accounting Standards Codification and Accounting Standards Update of the Financial Accounting Standards Board ("FASB"). The preparation of financial statements in conformity with GAAP requires management to make estimates and assumptions that affect the amounts reported in the financial statements and accompanying notes. On an ongoing basis, the Company's management evaluates its estimates, which include, but are not limited to, estimates related to revenue recognition, fair value of equity instruments, valuation allowances recorded against deferred tax assets, and stock-based compensation. Actual results could differ from those estimates.
Reverse Stock Split
On December 4, 2017, the Company effected a reverse stock split of its common stock at a ratio of 1-for-3.214. The shares of common stock subject to then outstanding stock options were adjusted accordingly to reflect the reverse stock split. All common stock and related per share amounts presented in these financial statements and related notes have been retroactively adjusted to reflect the 1-for-3.214 reverse stock split.
2. Significant accounting policies Principles of consolidation The consolidated financial statements have been prepared in accordance with U.S. GAAP and include the accounts of Quanterix Corporation, and its wholly-owned subsidiaries. All material intercompany transactions and balances have been eliminated in consolidation. Use of estimates The preparation of consolidated financial statements in conformity with U.S. GAAP requires management to make estimates and assumptions that affect the amounts reported in the consolidated financial statements and accompanying notes. In making those estimates and assumptions, the Company bases its estimates on historical experience and on various other assumptions believed to be reasonable. The Company'sCompany’s significant estimates included in the preparation of the consolidated financial statements are related to revenue recognition, fair value of equity instruments and notes receivable, fair
Table of Contents
Quanterix Corporation
Notes to Consolidated Financial Statements (Continued)
2. Significant accounting policies (Continued)
value of assets acquired and liabilities assumed in acquisitions, valuation allowances recorded against deferred tax assets, and stock-based compensation.valuation of inventory. Actual results could differ from those estimates.
Revenue recognition The Company recognizes revenue when (1) persuasive evidencea customer obtains control of a promised good or service. The amount of revenue recognized reflects consideration that the Company expects to be entitled to receive in exchange for these goods and services, incentives and taxes collected from customers, that are subsequently remitted to governmental authorities. The Company adopted Accounting Standards Codification (ASC) Topic 606 Revenue from Contracts with Customers (ASC 606), on January 1, 2019, using the modified retrospective method for all contracts not completed as of the date of adoption. The reported results for 2020 and 2019 reflect the application of ASC 606 guidance, while the reported results for 2018 were prepared under ASC 605, Revenue Recognition. Customers The Company’s customers primarily consist of entities engaged in the life sciences research market that pursue the discovery and development of new drugs for a variety of neurologic, cardiovascular, oncologic and other protein biomarkers associated with diseases. The Company’s customer base includes several of the largest biopharmaceutical companies, academic research organizations and distributors who serve certain geographic markets. Product revenue The Company’s products are composed of analyzer instruments, assay kits and other consumables such as reagents. Products are sold directly to biopharmaceutical and academic research organizations or are sold through distributors in EMEA and Asia Pacific regions. The sales of instruments are generally accompanied by an arrangement exists, (2) shipmentinitial year of implied service-type warranties and may be bundled with assays and other consumables and may also include other items such as training and installation if applicable, has occurred or services have been rendered, (3) the price to the customer is fixed or determinable and (4) collection of the related receivable is reasonably assured. The Company primarily generates revenueinstrument and/or an extended service warranty. Revenues from the sale of products are recognized at a point in time when the Company transfers control of the product to the customer, which is upon installation for instruments sold to direct customers, and deliverybased upon shipping terms for assay kits and other consumables. Revenue for instruments sold to distributors is generally recognized based upon shipping terms (either upon shipment or delivery). Service and other revenue Service revenues are composed of contract research services, initial implied one-year service-type warranties, extended services contracts and other services such as training. Contract research services are provided through the Company’s Accelerator Laboratory and generally consist of fixed fee contracts. Revenues from contract research services are recognized at a point in time when the Company completes and delivers its research report on each individually completed study, or over time if the contractual provisions allow for the collection of transaction consideration for costs incurred plus a reasonable margin through the period of performance of the services. Revenues from service-type warranties are recognized ratably over the contract service period. Revenues from other services are immaterial. Collaboration and license revenue The Company may enter into agreements to license the intellectual property and know-how associated with its instruments in exchange for license fees and future royalties (as described below). The license agreements provide the licensee with a right to use the intellectual property with the license fee revenues recognized at a point in time as the underlying license is considered functional intellectual property. The Company has recognized revenues from sales- or usage based royalties related to the Company’s licensing technology and intellectual property. ASC 606 provides for an exception to estimating the variable consideration for sales- and usage-based royalties related to the license of intellectual property, such that the sales- or usage-based royalty will be recognized in the period the underlying transaction occurs. The Company has recorded sales- or usage-based royalty revenue for the years ended December 31, 2020 and 2019 related to the intellectual property licensed by Uman. The Company recognizes revenues from sales- or usage based royalty revenue at the later of when the sales or usage occurs; and the satisfaction or partial satisfaction of the performance obligation to which the royalty has been allocated. Payment terms The Company’s payment terms vary by the type and location of customer and the products or services offered. Payment from customers is generally required in a term ranging from 30 to 45 days from date of shipment or satisfaction of the performance obligation with no discounts for early payment. Occasionally the Company provides extended payment terms or financing arrangements to customers. Disaggregated revenue When disaggregating revenue, the Company considered all of the economic factors that may affect its revenues. The following tables disaggregate the Company's revenue from contracts with customers by revenue type: | | | | | | | | | | | | | | | Year Ended | | | December 31, 2020 | (in thousands) | | NA | | EMEA | | Asia Pacific | | Total | Product revenues | | | | | | | | | | | | | Instruments | | $ | 8,680 | | $ | 4,332 | | $ | 3,594 | | $ | 16,606 | Consumable and other products | | | 14,305 | | | 10,854 | | | 2,252 | | | 27,411 | Totals | | $ | 22,985 | | $ | 15,186 | | $ | 5,846 | | $ | 44,017 | | | | | | | | | | | | | | Service and other revenues | | | | | | | | | | | | | Service-type warranties | | $ | 3,171 | | $ | 1,543 | | $ | 207 | | $ | 4,921 | Research services | | | 15,011 | | | 2,225 | | | 737 | | | 17,973 | Other services | | | 700 | | | 435 | | | 100 | | | 1,235 | Totals | | $ | 18,882 | | $ | 4,203 | | $ | 1,044 | | $ | 24,129 | | | | | | | | | | | | | | Collaboration and license revenue | | | | | | | | | | | | | Collaboration and license revenue | | $ | 11,685 | | $ | 124 | | $ | — | | $ | 11,809 | Totals | | $ | 11,685 | | $ | 124 | | $ | — | | $ | 11,809 |
| | | | | | | | | | | | | | | Year Ended | | | December 31, 2019 | (in thousands) | | NA | | EMEA | | Asia Pacific | | Total | Product revenues | | | | | | | | | | | | | Instruments | | $ | 6,250 | | $ | 5,243 | | $ | 3,393 | | $ | 14,886 | Consumable and other products | | | 14,148 | | | 9,674 | | | 1,783 | | | 25,605 | Totals | | $ | 20,398 | | $ | 14,917 | | $ | 5,176 | | $ | 40,491 | | | | | | | | | | | | | | Service and other revenues | | | | | | | | | | | | | Service-type warranties | | $ | 3,139 | | $ | 1,323 | | $ | 171 | | $ | 4,633 | Research services | | | 8,845 | | | 704 | | | 456 | | | 10,005 | Other services | | | 825 | | | 565 | | | 31 | | | 1,421 | Totals | | $ | 12,809 | | $ | 2,592 | | $ | 658 | | $ | 16,059 | | | | | | | | | | | | | | Collaboration and license revenue | | | | | | | | | | | | | Collaboration and license revenue | | $ | 167 | | $ | 17 | | $ | — | | $ | 184 | Totals | | $ | 167 | | $ | 17 | | $ | — | | $ | 184 |
The Company’s contracts with customers may include promises to transfer multiple products and services to a customer. The Company combines any performance obligations that are immaterial with one or more other performance obligations that are material to the contract. For arrangements with multiple performance obligations, the Company allocates the contract transaction price, including discounts, to each performance obligation based on its relative standalone selling price. Judgment is required to determine the standalone selling price for each distinct performance obligation. The Company determines standalone selling prices based on prices charged to customers in observable transactions, and uses a range of amounts to estimate standalone selling prices for each performance obligation. The Company may have more than one range of standalone selling price for certain products and services based on the pricing for different customer classes. Variable consideration in the Company’s contracts primarily relates to (i) sales- and usage-based royalties related to the license of intellectual property in collaboration and license contracts and (ii) certain non-fixed fee research services contracts. The aggregate amount of transaction price that is allocated to performance obligations that have not yet been satisfied or are partially satisfied as of December 31, 2020 is $6.0 million. Of the performance obligations not yet satisfied or are partially satisfied, $5.4 million is expected to be recognized as revenue in the next 12 months, with the remainder to be recognized within the 24 months thereafter. The $5.4 million principally consists of amounts billed for undelivered services related to initial and extended service-type warranties and research services, as well as $0.5 million related to undelivered licenses of intellectual property for a diagnostics company. During the year ended December 31, 2020, the Company recognized $1.2 million of previously deferred revenue as a result of entering into a license agreement with a diagnostics company (see Note 13). Changes in deferred revenue from contracts with customers were as follows (in thousands): | | | | | | Year Ended December 31, 2020 | Balance at December 31, 2019 | | $ | 5,163 | Deferral of revenue | | | 6,955 | Recognition of deferred revenue | | | (6,120) | Balance at December 31, 2020 | | $ | 5,998 |
Costs to obtain a contract The Company’s sales commissions are generally based on revenues of the Company. The Company has determined that certain commissions paid under licenseits sales incentive programs meet the requirements to be capitalized as they are incremental and collaboration agreements.would not have occurred absent a customer contract. The Company'schanges in the balance of costs to obtain a contract are as follows (in thousands): | | | | | | Year Ended December 31, 2020 | Balance at December 31, 2019 | | $ | 335 | Deferral of costs to obtain a contract | | | 506 | Recognition of costs to obtain a contract | | | (593) | Balance at December 31, 2020 | | $ | 248 |
The Company has classified the balance of capitalized costs to obtain a contract as a component of prepaid expenses and other current assets as of December 31, 2020 and classifies the expense as a component of cost of goods sold and selling, general and administrative expense over the estimated life of the contract. The Company considers potential impairment in these amounts each period. ASC 606 provides entities with certain practical expedients and accounting policy elections to minimize the cost and burden of adoption. The Company does not disclose the value of unsatisfied performance obligations for (i) contracts with original expected length of one year or less and (ii) contracts for which revenue is recognized at the amount to which the Company has the right to invoice for services performed. The Company will exclude from its transaction price any amounts collected from customers related to sales and other similar taxes. When determining the transaction price of a contract, an adjustment is made if payment from a customer occurs either significantly before or significantly after performance, resulting in a significant financing component. The Company does not assess whether a significant financing component exists if the period between when the Company performs its obligations under the contract and when the customer pays is one year or less. None of the Company’s contracts contained a significant financing component for the years ended December 31, 2020 and 2019. The Company has elected to account for the shipping and handling as an activity to fulfill the promise to transfer the product, and therefore will not evaluate whether shipping and handling activities are promised services to its customers. Grant revenue The Company recognizes grant revenue includesas it performs services under the salearrangement when the funding is committed. Revenues and related research and development expenses are presented gross in the consolidated statements of instrumentsoperations as the Company has determined it is the primary obligor under the arrangement relative to the research and development services. Accounting for grants does not fall under ASC 606, as the grantor will not benefit directly from the Company’s expansion or product development. As there is no authoritative guidance under U.S. GAAP on accounting for government assistance to for-profit business entities, the Company has accounted for grants by analogy to International Accounting Standards (IAS) 20, Accounting for Government Grants and Disclosure of Government Assistance (IAS 20). Grants to the Company contain both monetary amounts granted related to assets and monetary amounts granted related to income, which are grants other than those related to assets. The grants related to assets are for the expansion and increase of manufacturing capacity. The grants related to income are for additional research and development, as well as assay kits and consumables whichother non-asset related scale up costs. Under IAS 20, grants related to assets shall be presented in the consolidated balance sheets either by recognizing the grant as deferred income (which is recognized in the consolidated statements of operations on a systematic basis over the useful life of the asset), or by deducting the grant in calculating the carrying amount of the asset (which is recognized in the consolidated statements of operations over the life of the depreciable asset as a reduced depreciation expense). Both methods are usedacceptable under IAS 20. The Company has elected to perform testsrecord grants related to assets as a deduction in calculating the carrying value of the asset. Under IAS 20, grants related to income are presented as part of the consolidated statements of operations, either separately or under a general heading. Both methods are acceptable under IAS 20. The Company has elected to record grants related to income separately on the instrument.consolidated statements of operations as grant revenue. The Company's service revenue is generated from services performed in the Company's Simoa Accelerator Lab under contracts to perform research services on behalf of customersrelated expenses are recorded within operating expenses and maintenance and support services.not deducted. Product revenue
Revenue for instrument sales is recognized upon installation at the customer's location or upon transfer of title to the customer when installation is not required, which is generally the case with sales to distributors. In sales to end-customers,On June 22, 2020, the Company providesentered into a workplan 1 award (WP1) with the installation service and often payment is tiedNational Institute of Health (NIH), under the Rapid Acceleration of Diagnostics (RADx) program to assess the completionfeasibility of a novel SARS-CoV-2 antigen detection test using the installation service. When installation is required,Company’s Simoa technology. During the year ended December 31, 2020, the Company accounts for the instrumentrecognized $2.0 million of grant revenue and installation service as one unit of accounting and recognizes revenue when installation is completed, assuming all other revenue recognition criteria are met. Instrument transactions often have multiple elements, as discussed below. Included with the purchase of an instrument is a one-year assurance type product warranty assuring that the instrument is free of material defects and will function according to specifications. In addition, the sale of an instrument includes an implied warranty which is promised to the customer during the pre-sales process, at the time that the sales quote is issued to the customer. The implied warranty is provided over the same one-year period as the standard warranty. The services includedincurred $1.0 million in the implied warranty are the same as those included in the extended service contracts, and include two bi-annual preventative maintenance service visits, minor hardware updates and software upgrades, additional training and troubleshooting which is beyond the scope of the standard product warranty. The implied warranty has been identified by the Company as a separate deliverable and unit of accounting. Consideration allocated to the implied one year service type warranty is recognized over the one year period of performance as service and other revenue as described below. Consideration allocated to any other elements is recognized as the goods are delivered or the services are performed.
Service and other revenue
Service revenue includes revenue from the implied one-year service type warranty obligation, revenue from extended service contracts, research services performed on behalf of a customer in the Company's Simoa Accelerator Lab, and other services that may be performed. Revenue for the implied one-year service type warranty is initially deferred at the time of instrument revenue recognition and is recognized ratably over a 12-month period starting on the date of instrument installation. Revenue for extended warranty contracts is recognized ratably over the service period. Revenue for research and development servicesexpense related to WP1. WP1 is complete as of December 31, 2020.
On September 29, 2020, the Company entered into a workplan 2 award (WP2) with the NIH under its RADx program. WP2, which has a total award value of $18.2 million, accelerates the continued development, scale-up, and other services is generally recognized based on proportional performancedeployment of the novel SARS-CoV-2 antigen detection test using the Company’s Simoa technology. The contract when the Company's abilityprovides funding to complete project requirements is reasonably assured. Most of these services are completed in a short period of time from the receiptexpand assay kit manufacturing capacity and commercial deployment readiness. Release of the customer's order.
Table$18.2 million of Contents
Quanterix Corporation
Notes to Consolidated Financial Statements (Continued)
2. Significant accounting policies (Continued)
When significant risk exists in the Company's ability to fulfill project requirements, revenue is recognized upon completion of the contract.
Collaboration and license revenue
Collaboration and license revenue relates to the Joint Development and License Agreement (JDLA) with bioMérieux SA (bioMérieux) as amended and restated in December 2016 by the Amended and Restated License Agreement (the Amended JDLA) and the agreements with a diagnostics company. Refer to "Collaboration and License Agreements (Note 11)" for a description of these arrangements and the Company's revenue recognition policies for these agreements. On September 6, 2018, bioMérieux notified the Company that it was terminating the Amended JDLA, forfeiting any future IVD licensing rights to Quanterix' Simoa technology and enabling Quanterix to consolidate and regain control of all Simoa IVD licensing and IP rights. As a result of the termination the Company recognized $1.6 million in collaboration and license revenue previously recorded in deferred revenue.
Multiple element arrangements
Many of the Company's instrument sales involve the delivery of multiple products and services. The elements of an instrument sale typically include the instrument installation (when required), an implied one year service type warranty, and in some cases the Company may also sell assays, consumables, or other services. Revenue recognition for contracts with multiple deliverablesfunding under WP2 is based on the individual unitsachievement of certain milestones, and there is no assurance that the Company can meet all the milestones on a timely basis, if at all. If the Company does not meet all of the milestones, it will not be able access the full $18.2 million in funding under the contract. During the year ended December 31, 2020 the Company recognized $4.4 million in grant revenue and incurred $2.6 million in research and development expense related to WP2.
The following table summarizes the activity under WP2 as of December 31, 2020 (in thousands): | | | Total grant revenue from research and development activities | $ | 4,362 | Total proceeds used for assets | | 826 | Total deferred proceeds for assets | | 2,478 | Total deferred grant revenue | | 304 | Total recognized | $ | 7,970 | | | | Total recognized | $ | 7,970 | Total amount accrued | | (2,968) | Total cash received | $ | 5,002 | | | | Total proceeds received | $ | 5,002 | Total proceeds reasonably assured | | 13,198 | Total WP2 grant amount | $ | 18,200 |
Business combinations Under the acquisition method of accounting, determined to exist in the contract. A delivered item is considered a separate unit of accounting when the delivered item has value to the customer on a stand-alone basis. Items are considered to have stand-alone value when they are sold separately by any vendor or when the customer could resell the item on a stand-alone basis. The consideration received is allocated among the separate units of accounting using the relative selling price method, and the applicable revenue recognition criteria are applied to each of the separate units. The Company determines the estimated selling price for deliverables within the arrangement using vendor-specific objective evidence (VSOE) of selling price, if available. If VSOE is not available, the Company considers if third-party evidence is available. If third-party evidence of selling price or VSOE is not available,generally recognizes the Company uses its best estimate of selling price for the deliverable.
In order to establish VSOE of selling price, the Company must regularly sell the product or service on a standalone basis with a substantial majority priced within a relatively narrow range. If there are not a sufficient number of standalone sales such that VSOE of selling price cannot be determined, then the Company considers whether third party evidence can be used to establish selling price. Due to the lack of similar productstangible and services sold by other companies within the industry, the Company has not established selling price using third-party evidence.
For product and service sales, the Company determines its best estimate of selling price for instruments, consumables, services and assays using average selling prices over a rolling 12-month period coupled with an assessment of market conditions, as VSOE and third-party evidence cannot be established. The Company recognizes revenue for delivered elements only when it determines there are no uncertainties regarding customer acceptance.
Table of Contents
Quanterix Corporation
Notes to Consolidated Financial Statements (Continued)
2. Significant accounting policies (Continued)
Distributor transactions
In certain markets, the Company sells products and provides services to customers through distributors that specialize in life sciences products. In cases where the product is delivered to a distributor, revenue recognition generally occurs when title transfers to the distributor. The terms of sales transactions through distributors are generally consistent with the terms of direct sales to customers, except the distributors do not require the Company's services to install the instrument at the end customer and perform the services for the customer that are beyond our standard warranty in the first year following the sale. These transactions are accounted for in accordance with the Company's revenue recognition policy described herein.
Business combinations
Amounts paid for acquisitions are allocated to theidentifiable intangible assets acquired and liabilities assumed if any, based on their estimated fair values aton the datesdate of acquisition. The fair value of identifiable intangible assets isvalues recognized, defined as the price that would be received to sell an asset or paid to transfer a liability in an orderly transaction between willing market participants, are based on detailed valuations that use informationestimates and assumptions determined by management. AnyThe excess of purchase priceconsideration over the fairaggregate value of the netacquired tangible and intangible assets, acquirednet of liabilities recognized, is allocatedrecorded as goodwill. These valuations require significant estimates and assumptions, especially with respect to goodwill.intangible assets.
The Company typically uses the discounted cash flow method to value acquired intangible assets. This method requires significant management judgment to forecast future operating results and establish residual growth rates and discount factors. The estimates used to value and amortize intangible assets are consistent with the plans and estimates that are used to manage the business and are based on available historical information. If the subsequent actual results and updated projections of the underlying business activity change compared with the assumptions and projections used to develop these values, the Company could experience impairment charges. In addition, the Company has estimated the economic lives of certain acquired assets and these lives are used to calculate depreciation and amortization expense. If estimates of the economic lives change, depreciation or amortization expenses could be accelerated or slowed. Restricted Cash
Restricted cash represents collateral for a letter of credit issued as security for the lease for the Company's new headquarters. The restricted cash is long term in nature as the Company will not have access to the funds until more than one year from December 31, 2018.
Cost of revenue Cost of product revenue consists of raw materials, parts costs and associated freight, shipping and handling costs, contract manufacturer costs, personnel costs, yield loss, in-license payments and royalties, stock-based compensation, other direct costs and overhead. Cost of service and other revenue consists of personnel, facility costs associated with operating the Accelerator Labs on behalf of the customers, costs related to instrument maintenance and servicing equipment at customer sites, other direct and overhead. Cost of license revenue related party consists of license fees that are the direct results of cash payments received related to license agreements.
Table of Contents
Quanterix Corporation
Notes to Consolidated Financial Statements (Continued)
2. Significant accounting policies (Continued)
Research and development expenses Research and development expenses, including personnel costs, allocated facility costs, lab supplies, outside services, contract laboratory costcosts are charged to research and development expense as incurred. The Company accounts for nonrefundable advance payments for goods and services that will be used in future research and development activities as expense when the service has been performed or when the goods have been received. Expenses incurred related to grant funded activities are recorded in research and development expense. Selling, general, and administrative expenseexpenses Selling, general, and administrative expenses are primarily composed of compensation and benefits associated with sales and marketing, finance, human resources, and other administrative personnel, outside marketing, advertising, allocated facilities costs, legal expenses, and other general and administrative costs. Net loss per share Basic net loss per common share attributable to common stockholders is calculated by dividing the net loss attributable to common stockholders by the weighted-average number of common shares. For purposes of the diluted net loss per share calculations, preferred stock, unvested restricted common stock, and common stock options, and warrants are considered to be potentially dilutive securities, but are excluded from the diluted net loss per share because their effect would be anti-dilutive and therefore basic and diluted net loss per share were the same for all periods presented. The following table setsets forth the outstanding potentially dilutive securities that have been excluded in the calculation of diluted net loss per share because to do so would be anti-dilutive (in common stock equivalent shares): | | | | | | | | | | |
| | Year Ended December 31, | |
|---|
| | 2018 | | 2017 | | 2016 | |
|---|
Series A redeemable convertible preferred stock | | | — | | | — | | | 4,884,869 | | Series B redeemable convertible preferred stock | | | — | | | — | | | 1,873,561 | | Series C redeemable convertible preferred stock | | | — | | | — | | | 2,677,649 | | Series D redeemable convertible preferred stock | | | — | | | — | | | 3,864,421 | | Unvested restricted common stock | | | 361,468 | | | 177,192 | | | 376,248 | | Outstanding stock options | | | 2,476,911 | | | 2,249,843 | | | 1,119,671 | | Outstanding preferred warrants | | | — | | | — | | | 326,374 | | Outstanding common stock warrants | | | 76,041 | | | 86,090 | | | — | | | | | | | | | | | | | | Total | | | 2,914,420 | | | 2,513,125 | | | 15,122,793 | | | | | | | | | | | | | |
| | | | | | | | | Year Ended December 31, | | | 2020 | | 2019 | | 2018 | Unvested restricted common stock and restricted stock units | | 518,387 | | 409,929 | | 361,468 | Outstanding stock options | | 2,494,045 | | 2,507,062 | | 2,476,911 | Outstanding common stock warrants | | 10,000 | | 10,000 | | 76,041 | Total | | 3,022,432 | | 2,926,991 | | 2,914,420 |
As of December 31, 2018, 2017,2020, 2019, and 20162018 the Company had an obligation to issue warrants to purchase an additional 93,341 shares of common stock 300,000 shares of Series A-3 Preferred Stock, and 300,000 shares of Series A-3 Preferred Stock, respectively, to a vendor if a contract is terminated prior to a minimum purchase commitment being met. Upon completion of the IPO in December 2017, the warrants to purchase shares of Preferred Stock were converted to warrants to purchase shares of common stock at a one-for-3.214 basis. No amounts are presented in the table above for this obligation to issue a warrant as the issuance of the warrant is not considered probable.
Table of Contents
Quanterix Corporation
Notes to Consolidated Financial Statements (Continued)
2. Significant accounting policies (Continued)
The Company's redeemable convertible preferred stock was entitled to receive dividends based on dividends declared to common stockholders, thereby giving the preferred stockholders the right to participate in undistributed earnings of the Company above the stated dividend rate. However, preferred stockholders did not have a contractual obligation to share in the net losses of the Company. The Company operated in a net loss position for the years ended December 31, 2018, 2017, and 2016 and, therefore the Company's accounting for basic and diluted earnings per share was unaffected by the participation rights of the preferred stockholders.
Cash and Cashcash equivalents Cash and Cashcash equivalents consistsconsist of cash deposits and short-term, highly liquid investments that are readily convertible into cash, with original maturities of three months or less. Cash equivalents are carried at fair value based on quoted prices for identical assets. Cash and cash equivalents consistsconsist of the following (in thousands): | | | | | | | |
| | Year Ended
December 31, | |
|---|
| | 2018 | | 2017 | |
|---|
Cash and Cash Equivalents | | | | | | | | Cash | | $ | 1,821 | | $ | 1,500 | | Money Market funds invested in U.S. Treasury obligations | | | 42,608 | | | 78,182 | | | | | | | | | | | Total cash and cash equivalents | | $ | 44,429 | | $ | 79,682 | | | | | | | | | | |
| | | | | | | | | As of | | | December 31, | | | 2020 | | 2019 | Cash | | $ | 19,535 | | $ | 6,406 | Money market funds invested in U.S. Treasury obligations | | | 162,049 | | | 102,749 | Total cash and cash equivalents | | $ | 181,584 | | $ | 109,155 |
Restricted cash and deposits Restricted cash represents collateral for a letter of credit issued as security for the lease for the Company’s new headquarters. The restricted cash is long term in nature as the Company will not have access to the funds until more than one year from December 31, 2020. As of both December 31, 20182020 and 2017,2019, the Company had $1.4$1.1 million and $0.4 million, respectively, in restricted cash and deposits related to amounts held for a line of credit, amounts held as a security deposit for the Company'sCompany’s facility lease obligation, and a business registration application. As of both December 31, 2020 and 2019, $1.0 million of the $1.4$1.1 million iswas recorded on a separate line item as restricted cash. The remaining $0.4$0.1 million iswas included in currentnoncurrent assets as of both December 31, 2020 and noncurrent assets.2019. Accounts Receivablereceivable and allowance for doubtful accounts The Company provides credit, in the normal course of business, to customers and does not require collateral. Accounts receivable consist of amounts due to the Company for sales to customers and are recorded net of an allowance for doubtful accounts. The Company reviews accounts receivable on a regular basis to determine if any receivable will potentially be uncollectable and to estimate the amount of allowance for doubtful accounts necessary. Once a receivable is deemed uncollectible, such balance is written off and charged against the allowance for doubtful accounts. The Company has not incurred material write offs in any of the periods presented. InventoryThe Company’s allowance for doubtful accounts activity for the years ended December 31, 2020, 2019, and 2018 was as follows (in thousands):
| | | | | | | | December 31, 2017 | | $ | — | Additions | | | 36 | Deductions | | | — | December 31, 2018 | | $ | 36 | Additions | | | 160 | Deductions | | | (34) | December 31, 2019 | | $ | 162 | Additions | | | 493 | Deductions | | | (285) | December 31, 2020 | | $ | 370 |
Inventory Inventory is stated at the lower of cost or market on a first-in, first-out (FIFO) basis. The Company analyzes its inventory levels on each reporting date and writes down inventory that is expected to expire prior to being sold and inventory in excess of expected sales requirements. In the event that the Company identifies these conditions exist in its inventory, the carrying value is reduced to its estimated net realizable value.
Table of Contents
Quanterix Corporation
Notes to Consolidated Financial Statements (Continued)
2. Significant accounting policies (Continued)
Property and equipment Property and equipment, including leasehold improvements, are stated at cost and are depreciated, or amortized in the case of leasehold improvements, over their estimated useful lives using the straight-line method. Expenditures for maintenance and repairs are charged to expense as incurred, whereas major betterments are capitalized as additions to property and equipment. The Company reviews its property and equipment whenever events or changes in circumstances indicate that the carrying value of certain assets might not be recoverable and recognizes an impairment loss when it is probable that an asset'sasset’s realizable value is less than the carrying value. To date, no such impairment losses have been recorded. Depreciation is calculated based upon the following estimated useful lives of the assets: | | | Laboratory and manufacturing equipment | | Five years | Computers and software | | Three years | Office furniture and equipment | | Seven years | Leasehold improvements | | Shorter of the useful life of the asset or the remaining term of the lease |
Software development costs The Company develops and modifies software related to the operation of the instrument. Software development costs are expensed as incurred until the point the Company establishes technological feasibility. Based on the Company's Company’s product development process, technological feasibility is established upon the completion of a working model. The Company does not incur material costs between the completion of the working model and the point at which the product is ready for release. Therefore, software development costs are charged to the statement of operations as incurred as research and development expense. Investments
During the third quarter of 2016, the Company purchased a minority interest in preferred stock in a privately held company for $0.3 million. In addition, in the third quarter of 2018, the Company executed a convertible note with a privately held company for $0.2 million. The investments are recorded on a cost basis in other non-current assets on the accompanying consolidated balance sheets as the Company does not have a controlling investment, does not have the ability to exercise significant influence over the privately held company and the fair value of these equity investments are not readily determinable. The Company performs an impairment analysis at each reporting period to determine if the carrying value of the investment or the note must be reduced due to a decrease in the value of the investment, which includes consideration of whether an event or change in circumstances has occurred that may have a significant adverse effect on the fair value of the investment. The Company determined there was no impairment during the years ended December 31, 2018, 2017, and 2016.
Fair value of financial instruments ASC Topic 820,Fair Value Measurement (ASC 820), establishes a fair value hierarchy for instruments measured at fair value that distinguishes between assumptions based on market data (observable inputs) and the Company'sCompany’s own assumptions (unobservable inputs). Observable inputs are
Table of Contents
Quanterix Corporation
Notes to Consolidated Financial Statements (Continued)
2. Significant accounting policies (Continued)
inputs that market participants would use in pricing the asset or liability based on market data obtained from sources independent of the Company. Unobservable inputs are inputs that reflect the Company'sCompany’s assumptions about the inputs that market participants would use in pricing the asset or liability, and are developed based on the best information available in the circumstances. ASC 820 identifies fair value as the exchange price, or exit price, representing the amount that would be received to sell an asset or paid to transfer a liability in an orderly transaction between market participants. As a basis for considering market participant assumptions in fair value measurements, ASC 820 establishes a three-tier fair value hierarchy that distinguishes between the following: Level 1 inputs are quoted prices (unadjusted) in active markets for identical assets or liabilities. Level 2 inputs are inputs other than quoted prices that are observable for the asset or liability, either directly or indirectly; and Level 3 inputs are unobservable inputs that reflect the Company'sCompany’s own assumptions about the assumptions market participants would use in pricing the asset or liability. To the extent that the valuation is based on models or inputs that are less observable or unobservable in the market, the determination of fair value requires more judgment. Accordingly, the degree of judgment exercised by the Company in determining fair value is greatest for instruments categorized in Level 3. A financial instrument'sinstrument’s level within the fair value hierarchy is based on the lowest level of any input that is significant to the fair value measurement. The carrying amount reflected on the balance sheets for cash and cash equivalents, accounts receivable, prepaid expenses and other current assets, accounts payable and accrued liabilities approximated their fair values, due to the short-term nature of these instruments. The carrying value of the long-term debt approximates its fair value as the debt arrangement is based on interest rates the Company believes it could obtain for borrowings with similar terms. The Company has an investment in the preferred stock of a privately held company which is recorded within other non-current assets on a cost basis. This cost method investment'sinvestment’s fair value has not been estimated as there are no identified events or changes in circumstances that would indicate a significant adverse effect on the fair value of the investment and to do so would be impractical. Fair value measurements as of December 31, 20182020 are as follows (in thousands): | | | | | | | | | | | | | | Description | | Total | | Quoted
prices
in active
markets
(Level 1) | | Significant
other
observable
inputs
(Level 2) | | Significant
unobservable
inputs
(Level 3) | |
|---|
Financial Assets | | | | | | | | | | | | | | Cash Equivalents | | $ | 42,608 | | $ | 42,608 | | | — | | $ | — | | Note receivable | | | 150 | | | — | | | — | | | 150 | | | | | | | | | | | | | | | | | Total | | $ | 42,758 | | $ | 42,608 | | | — | | $ | 150 | | | | | | | | | | | | | | | | |
Table of Contents
| | | | | | | | | | | | | | | | | | Quoted prices | | | | | Significant | | | | | | in active | | Significant other | | unobservable | | | | | | markets | | observable | | inputs | Description | | Total | | (Level 1) | | inputs (Level 2) | | (Level 3) | Financial assets | | | | | | | | | | | | | Cash equivalents | | $ | 162,048 | | $ | 162,048 | | $ | — | | $ | — | | | $ | 162,048 | | $ | 162,048 | | $ | — | | $ | — |
Quanterix Corporation
Notes to Consolidated Financial Statements (Continued)
2. Significant accounting policies (Continued)
Fair value measurements as of December 31, 20172019 are as follows (in thousands): | | | | | | | | | | | | | | Description | | Total | | Quoted
prices
in active
markets
(Level 1) | | Significant
other
observable
inputs
(Level 2) | | Significant
unobservable
inputs
(Level 3) | |
|---|
Financial Assets | | | | | | | | | | | | | | Cash Equivalents | | $ | 78,182 | | $ | 78,182 | | | — | | | — | | | | | | | | | | | | | | | | | Total | | $ | 78,182 | | $ | 78,182 | | | — | | | — | | | | | | | | | | | | | | | | |
As of January 1, 2016, the Company had outstanding warrants to purchase 64,441 shares of Series A-2 redeemable convertible preferred stock (Series A-2 Preferred Stock), 1,300,000 shares of Series A-3 convertible preferred stock (Series A-3 Preferred Stock), 562,488 shares of Series B redeemable convertible preferred stock (Series B Preferred Stock), and 226,733 shares of Series C redeemable convertible preferred stock (Series C Preferred Stock). During the years ended December 31, 2017, and 2016, the Company issued the following warrants:
•On January 29, 2016, the Company issued a warrant to purchase 57,810 shares of Series C Preferred Stock to a lender related to a second amendment to a debt facility (Note 8)
•On November 18, 2016, the Company issued a warrant to purchase 700,000 shares of Series A-3 Preferred Stock to a vendor (Note 7).
•On March 31, 2017, the Company issued a warrant to purchase 38,828 shares of Series D redeemable convertible preferred stock (Series D Preferred Stock) to a lender as part of a third amendment to a debt facility (Note 8).
All of the warrants were initially recorded as a preferred stock warrant liability on the accompanying consolidated balance sheets at fair value. Warrants issued for goods or services are initially accounted for under ASC 505-50 and are recognized over the required performance period in the consolidated statements of operations or consolidated balance sheets at the vesting date or reporting date fair value based on the nature of the underlying arrangement. Warrants issued in connection with a product development contract were recorded to research and development expense. Warrants issued in connection with a revenue arrangement were recorded as a reduction in revenue. Warrants issued in connection with debt arrangements were recorded as a reduction in the carrying value of debt. They are marked to market on each reporting and exercise date with changes in the fair value recorded in other expense (income) on the statement of operations and comprehensive loss. Holders of warrants to purchase 700,000 shares of Series A-3 Preferred stock, and holders of warrants to purchase 111,114 shares of Series C Preferred Stock exercised the warrants during the year ended December 31, 2017. Upon exercise, the fair value of the warrants was reclassified to redeemable convertible preferred stock along with any proceeds received. Upon completion of the IPO, the outstanding warrants to purchase shares of preferred stock were automatically converted into warrants to purchase shares of common stock and are therefore accounted for as equity instruments.
Table of Contents | | | | | | | | | | | | | | | | | | Quoted prices | | | | Significant | | | | | | in active | | Significant other | | unobservable | | | | | | markets | | observable | | inputs | Description | | Total | | (Level 1) | | inputs (Level 2) | | (Level 3) | Financial assets | | | | | | | | | | | | | Cash equivalents | | $ | 102,749 | | $ | 102,749 | | $ | — | | $ | — | | | $ | 102,749 | | $ | 102,749 | | $ | — | | $ | — |
Quanterix CorporationWarranties
Notes to Consolidated Financial Statements (Continued)
2. Significant accounting policies (Continued)
The changes in preferred stock warrant liability measured at fair value for which the Company has used Level 3 inputs to determine fair value are as follows (in thousands):
| | | | |
| | Warrant
liability | |
|---|
Balance at December 31, 2015 | | $ | 5,547 | | Issuance of warrants related to debt facility | | | 128 | | Issuance of warrants related to a vendor | | | 2,078 | | Changes in fair value of warrants | | | 307 | | Warrant exercises | | | (5,258 | ) | | | | | | | Balance at December 31, 2016 | | | 2,802 | | Issuance of warrants related to debt facility | | | 119 | | Changes in fair value of warrants | | | 90 | | Warrant exercises | | | (2,188 | ) | Conversion to warrants to purchase common stock in connection with IPO | | | (823 | ) | | ��� | | | | | Balance at December 31, 2017 | | $ | — | | | | | | | |
Prior to the completion of the IPO, the warrants were classified as liabilities because they were exercisable for shares of redeemable convertible preferred stock. On each measurement date and immediately prior to the IPO and the resulting change in classification of the warrants to equity instruments, the Company utilized a black-scholes option pricing model to determine the fair value of the warrants and utilized various valuation assumptions based on available market data and other relevant but unobservable factors. Expected volatility for the Company's redeemable convertible preferred stock was determined based on an analysis of the historical volatility of a representative group of guideline public companies because, prior to the IPO, there was no market for the Company's common stock and, therefore, a lack of market-based company-specific historical and implied volatility information. The expected term reflects the remaining contractual term of the warrants. The assumed dividend yield is based upon the Company's expectation of not paying dividends in the foreseeable future. The risk-free rate is based upon the U.S. Treasury yield curve in effect at the valuation date, commensurate with the remaining contractual life of the warrants. The fair value of the underlying preferred shares was determined by management, with the assistance of a third party valuation specialist, using a hybrid valuation method, which includes a probability weighted analysis of two scenarios. The first scenario was based on the completion of an initial public offering utilizing a market approach and the second scenario was based on the Company remaining privately held utilizing either an income approach or a weighted-average of an income approach and a backsolve to a recent financing event, depending on the proximity of the financing event to the measurement date. The assumption regarding the Company's probability of completing an initial public offering was the primary contributing factor to the changes in fair value of the underlying preferred stock. See "Stock-based Compensation" section of this "Significant Accounting Policies" (Note 2) for discussion of the changes of the probability of completing an initial public offering.
Table of Contents
Quanterix Corporation
Notes to Consolidated Financial Statements (Continued)
2. Significant accounting policies (Continued)
The following assumptions were utilized to determine the fair value of each warrant to purchase preferred stock at each reporting period and as of the change from liability to equity accounting treatment of the warrants in connection with the IPO:
| | | | | | | | | | | | | | | | | | | | | Balance sheet date | | Value of
underlying
Series D
preferred
stock | | Value of
underlying
Series C
preferred
stock | | Value of
underlying
Series B
preferred
stock | | Value of
underlying
Series A-3
preferred
stock | | Value of
underlying
Series A-2
preferred
stock | | Volatility | | Probability
of an initial
public
offering | |
|---|
December 7, 2017 | | $4.67 | | $ | 4.67 | | N/A | | $ | 4.67 | | $ | 4.67 | | | 46 | % | | 100 | % |
Warranties
The Company provides a one-year warranty and maintenance service related to its instruments and sells extended warranty contracts for additional periods. The Company defers revenue associated with these services and recognizes them on a pro-rata basis over the period of service. Income taxes The Company recognizes deferred tax assets and liabilities for the expected future tax consequences of events that have been recognized in the Company'sCompany’s consolidated financial statements or tax returns. Under this method, deferred tax assets and liabilities are determined based on differences between the consolidated financial statement carrying amounts and the tax bases of the assets and liabilities using the enacted tax rates in effect in the years in which the differences are expected to reverse. A valuation allowance against deferred tax assets is recorded if, based on the weight of the available evidence, it is more likely than not that some or all of the deferred tax assets will not be realized. The Company accounts for uncertain tax positions in accordance with the provisions of ASC 740Income Taxes (ASC 740). When uncertain tax positions exist, the Company recognizes the tax benefit of tax positions to the extent that the benefit will more likely than not be realized. The determination as to whether the tax benefit will more likely than not be realized is based upon the technical merits of the tax position as well as consideration of the available facts and circumstances. As of December 31, 20182020 and 20172019, the Company did not have any significant uncertain tax positions. Credit, product and supplier concentrations and off-balance-sheet risk The Company has no significant off-balance-sheet risk, such as foreign exchange contracts, option contracts, or other hedging arrangements. Financial instruments that potentially expose the Company to concentrations of credit risk primarily consist of cash and cash equivalents and a cost method investment. The Company places its cash and cash equivalents principally in depository accounts with a bank. The Company is also subject to supply chain risks related to the outsourcing of the manufacturing of its instruments. Although there are a limited number of manufacturers for instruments of this type, the Company believes that other suppliers could provide similar products on comparable terms. A change in suppliers, however, could cause a delay in manufacturing and a possible loss of sales, which would adversely affect operating results. In addition to outsourcing the manufacturing of its instruments, the Company also purchases antibodies through a number of different suppliers. Although
Table of Contents
Quanterix Corporation
Notes to Consolidated Financial Statements (Continued)
2. Significant accounting policies (Continued)
a disruption in service from any one of its antibody suppliers is possible, the Company believes that it would be able to find an adequate supply from alternative suppliers. Customers outside the United States represented 40%29% and 34%50% of the Company'sCompany’s gross trade accounts receivable balance as of December 31, 20182020 and 20172019, respectively. AtAs of December 31, 2020, one customer represented 19% of the Company’s aggregate accounts receivable. As of December 31, 2019, and 2018, no single customer represented 10% of the Company'sCompany’s aggregate accounts receivable,receivable. During the year ended December 31, 2020 one customer represented 13% of the Company’s total revenue. For the years ended December 31, 2019 and 2018, no single customer represented 10% of the Company's revenue for the year ended December 31, 2018. At December 31, 2017, one customer's accounts receivable balance was 16% of the Company's aggregate accounts receivable no single customer represented 10% of the Company's revenue for the year ended December 31, 2017. At December 31, 2016, one customer's account receivable balance was 26% of the Company's aggregate accounts receivable and represented 11% of the Company's revenue for the year ended December 31, 2016.Company’s total revenue.
Segment informationF-18
Operating segments are defined as components of an enterprise about which separate discrete information is available for evaluation by the chief operating decision-maker in deciding how to allocate resources and assess performance. The Company and the Company's chief operating decision-maker reviews the Company's operations and manages its business as a single operating segment.
Net revenue by product and service line are as follows (in thousands):
| | | | | | | | | | |
| | Year ended December 31, | |
|---|
| | 2018 | | 2017 | | 2016 | |
|---|
Product revenue | | $ | 23,365 | | $ | 14,124 | | $ | 10,601 | | Service and other revenue | | | 12,117 | | | 7,676 | | | 5,012 | | Collaboration and license revenue | | | 2,150 | | | 1,074 | | | 1,972 | | | | | | | | | | | | | | Total revenue | | $ | 37,632 | | $ | 22,874 | | $ | 17,585 | | | | | | | | | | | | | |
The following table reflects total revenue (in thousands) by geography and as a percentage of total revenue, based on the billing address of our customers. North America consists of the United States, Canada and Mexico; EMEA consists of Europe, Middle East, and Africa; and Asia Pacific includes Japan, China, South Korea, Singapore, Malaysia and Australia.
| | | | | | | | | | | | | | | | | | | |
| | Year ended December 31, | |
|---|
| | 2018 | | 2017 | | 2016 | |
|---|
North America | | $ | 22,706 | | | 60 | % | $ | 13,864 | | | 61 | % | $ | 13,018 | | | 74 | % | EMEA | | | 11,742 | | | 31 | % | | 6,922 | | | 30 | % | | 3,416 | | | 19 | % | Asia Pacific | | | 3,184 | | | 8 | % | | 2,088 | | | 9 | % | | 1,151 | | | 7 | % | | | | | | | | | | | | | | | | | | | | | | Total | | $ | 37,632 | | | 100 | % | $ | 22,874 | | | 100 | % | $ | 17,585 | | | 100 | % | | | | | | | | | | | | | | | | | | | | | |
Table of Contents
Quanterix Corporation
Notes to Consolidated Financial Statements (Continued)
2. Significant accounting policies (Continued)
Stock-based compensation The Company accounts for stock-based compensation awards in accordance with Financial Accounting Standards Board (FASB) Accounting Standards Codification (ASC) TopicASC 718,Compensation—Stock Compensation (ASC(ASC 718). ASC 718 requires all stock-based payments to employees including grants of employee stock options, to be recognized in the statement of operations based on their fair values. Stock-based compensation awards have historically consisted of stock options and restricted stock. Prior to the adoption of ASU 2016-09 on January 1, 2017,Accounting Standards Update (ASU) No. 2018-07, Compensation - Stock Compensation (Topic 718): Improvements to Nonemployee Share-Based Payment Accounting (ASU 2018-07), the Company recognizedmeasurement date for non-employee awards was generally the date the services were completed, resulting in financial reporting period adjustments to stock-based compensation costs related to stock options granted to employees based onduring the estimatedvesting period for changes in the fair value of the awards. The Company adopted ASU 2018-07 on January 1, 2020. After the adoption of ASU 2018-07, the measurement date for non-employee awards onis the date of grant netwithout changes in the fair value of estimated forfeitures. the award. Stock-based compensation costs for non-employees are recognized as expense over the vesting period on a straight-line basis. There were no material non-employee awards outstanding during the years ended December 31, 2020, 2019, and 2018. Effective January 1, 2017, the Company ceased utilizing an estimated forfeiture rate and began recognizing forfeitures as they occur. The Company estimates the grant date fair value, and the resulting stock-based compensation expense, using the Black-Scholes option-pricing model. The grant date fair value of the stock-based awards is generally recognized on a straight-line basis over the requisite service period, which is generally the vesting period of the respective awards. The Company recognizes compensation costs related to share-based payments granted to non-employees based on the estimated fair value of the awards on the date of grant in the same manner as options for employees; however, the fair value of the stock options granted to non-employees is re-measured each reporting period until the service is complete, and the resulting increase or decrease in value, if any, is recognized as expense or income, respectively, during the period the related services are rendered to the same financial statement line item as any cash consideration would be recognized. There were no material non-employee awards outstanding during the years ended December 31, 2018, 2017, and 2016.
The fair value of stock options granted to employees and directors for their services on the Company's Board of Directorsnon-employees is estimated on the grant date using the Black-Scholes option-pricing model, based on the assumptions noted in the following table: | | | | | | |
| | Year Ended
December 31, |
|---|
| | 2018 | | 2017 | | 2016 |
|---|
Risk-free interest rate | | 2.6% - 3.0% | | 1.8% - 2.1% | | 1.2% - 1.3% | Expected dividend yield | | None | | None | | None | Expected term (in years) | | 5.9 | | 6.0 | | 6.0 | Expected volatility | | 32.4% - 36.8% | | 46.0% - 52.0% | | 44.9% - 49.0% |
| | | | | | | | | Year Ended December 31, | | | 2020 | | 2019 | | 2018 | Risk-free interest rate | | 0.4% - 1.7% | | 1.4% - 2.6% | | 2.6% - 3.0% | Expected dividend yield | | NaN | | NaN | | NaN | Expected term (in years) | | 6 | | 6.0 | | 5.9 | Expected volatility | | 43.9% - 49.2% | | 33.5% - 39.7% | | 32.4% - 36.8% |
Using the Black-Scholes option-pricing model, the weighted-average grant date fair value of options granted for the years ended December 31, 2020, 2019, and 2018 2017,was $12.66, $9.09, and 2016 was $7.19 $4.52, and $2.41 per share, respectively. Expected volatility was calculated based ona proportional weighting of reported volatility data for a representative group of guideline publicly traded companies for which historical information was available.available, as well as the Company’s stock. The risk-free interest rate is based on the U.S. Treasury yield curve in effect at the time of grant, commensurate with the expected life assumption. The Company estimates the expected life of options granted to employees utilizing the simplified method which calculates the expected life of an option as the average of the time to vesting and contractual life of the options. The expected life is applied to the stock option grant group as a whole, as the Company does not expect substantially
Table of Contents
Quanterix Corporation
Notes to Consolidated Financial Statements (Continued)
2. Significant accounting policies (Continued)
different exercise or post-vesting termination behavior among its employee population. The Company uses the simplified method due to the lack of historical exercise data and the plain nature of the stock options. The Company uses the remaining contractual term for the expected life of non-employee awards. The expected dividend yield is assumed to be zero0 as the Company has never paid dividends and has no current plans to pay any dividends on common stock. Prior to the completion of the IPO, the fair value of the underlying common shares was determined by management, with the assistance of a third party valuation specialist, using a hybrid valuation method, which includes a weighted analysis of two scenarios. The first scenario is based on the completion of an initial public offering utilizing a market approach and the second scenario is based on the Company remaining privately held utilizing either an income approach or a weighted-average of an income approach and a backsolve to a recent financing event approach, depending on the proximity of the financing event to the measurement date. The initial public offering scenario reflected data gathered from relevant comparable initial public offering transactions and the current value method of equity allocation was used in determining the value of common stock. For the privately held scenario, traditional income methods of business valuation were employed, where the total equity value was then allocated using the option pricing model (OPM). The assumption regarding the Company's probability of completing an initial public offering was the primary contributing factor to the changes in fair value of the common stock. The probability of initial public offering was 40% at December 31, 2016. Since December 31, 2015, the Company had performed the common stock valuations on a quarterly basis. Upon completion of the IPO in December 2017, the Company determines the fair value of the underlying common shares based on the closing price of the common stock on the option grant date. The probability of completing an initial public offering was based on the facts and circumstances as of each measurement date. During the three months ended December 31, 2016, the Company began initial preparations for completing an initial public offering; including assessing quarterly financial information and holding initial discussions with prospective investment bankers, which resulted in an increase in the probability of completing an initial public offering. Subsequent to March 31, 2017, the Company obtained approval from the Board of Directors to pursue the transaction, selected investment bankers, held an organizational meeting, and performed other procedures necessary to complete an initial public offering. As a result, the probability of completing an initial public offering increased subsequent to March 31, 2017.
The Company is using the straight-line attribution method to recognize stock-based compensation expense for service based awards for employees and non-employees. However, cumulative compensation expense recognized through the end of any period must at least equal the value of vested awards through that period, with compensation expense adjusted accordingly. For the year ended December 31, 2016, the amount of stock-based compensation expense recognized during a period was based on the value of the portion of the awards that were ultimately expected to vest. Prior to January 1, 2017, forfeitures were estimated at the time of grant, and revised, if necessary, in subsequent periods if actual forfeitures differ from those estimates. During the year ended December 31, 2016, the Company applied an estimate of forfeitures which did not have a material effect on the consolidated financial statements. Effective January 1, 2017, the Company adopted Accounting Standards Update (ASU) 2016-09Stock Compensation, and has elected to account for forfeitures as incurred and therefore no forfeiture estimate is utilized in the years ended December 31, 2018 and 2017. The effect of this adoption has been recorded as a $0.1 million cumulative effect adjustment to accumulated deficit as of January 1, 2017.
Table of Contents
Quanterix Corporation
Notes to Consolidated Financial Statements (Continued)
2. Significant accounting policies (Continued)
The Company applies an accelerated attribution method to recognize stock-based compensation expense when accounting for performance-based stock awards. The Company records the expense for stock-based compensation awards subject to performance-based milestone vesting over the remaining service period when management determines that achievement of the milestone is probable. Management evaluates when the achievement of a performance-based milestone is probable based on the expected satisfaction of the performance conditions as of the reporting date. Compensation expense for performance-based stock awards is included in total stock-based compensation expense. There were no material performance-based stock awards outstanding as of December 31, 2018, 2017, and 2016.
Recent accounting pronouncements The Company is considered to be an "emerging“emerging growth company"company” as defined in the Jumpstart Our Business Startups Act of 2012, as amended (JOBS Act). The JOBS Act provides that an emerging growth company can take advantage of an extended transition period for complying with new or revised accounting standards. Thus, an emerging growth company can delay the adoption of certain accounting standards until those standards would otherwise apply to private companies. The Company has elected to avail itself of this extended transition period and, as a result, the Company will not be required to adopt new or revised accounting standards on the relevant dates on which adoption of such standards is required for other public companies so long as the Company remains an emerging growth company. Recently Adopted On January 1, 2020, the FASB issued ASU No. 2014-09,Company adopted ASC Topic 842, Revenue from Contracts with CustomersLeases (ASC 606). The FASB has issued several updates(ASC 842) using the optional transition method allowing entities to recognize a cumulative effect adjustment to the standard which clarify the (i) application of the principal versus agent guidance; (ii) guidance relating to performance obligations and licensing; (iii) assessment of the collectability criterion, presentation of sales taxes, measurement date for non-cash consideration and completed contracts at transition; and (iv) narrows aspects ofopening balance sheet without restating comparative prior periods presented. ASC 606 or corrects unintended application of the guidance (collectively, the Revenue ASUs). The Revenue ASUs provide an accounting standard for a single comprehensive model for recognizing revenue arising from contracts with customers. Under ASC 606, an entity recognizes revenue when its customer obtains control of promised goods or services, in an amount that reflects the consideration which the entity expects to receive in exchange for those goods or services. In conjunction with the new revenue standard, the FASB also amended the guidance under ASC 340-40,Other Assets and Deferred Costs—Contracts with Customers, related to the accounting for costs to obtain or fulfill a contract with a customer. The Company will adopt the new revenue standard as of January 1, 2019 using the modified retrospective method. The Company is still in the process of quantifying the impact of the standard. In January 2016, the FASB issued ASU No. 2016-01,Financial Instruments-Overall (Subtopic 825-10): Recognition and Measurement of Financial Assets and Financial Liabilities ("ASU 2016-01"). The standard changes how entities measure certain equity investments and present changes in the fair value of financial liabilities measured under the fair value option that are attributable to their own credit. Under the new guidance, entities will be required to measure equity investments that do not result in consolidation and are not accounted for under the equity method at fair value and recognize any changes in fair value in net income unless the investments qualify for the new practicability exception. The Company's assessment is in progress and has not yet concluded on the impact of the standard.
In February 2016, the FASB established Topic 842 Leases, by issuing ASU No. 2016-02, which requires lessees to recognize leases on-balance sheet and disclose key information about leasing
Table of Contents
Quanterix Corporation
Notes to Consolidated Financial Statements (Continued)
2. Significant accounting policies (Continued)
arrangements. Topic 842 was subsequently amended by ASU No. 2018-01, Land Easement Practical Expedient for Transition to Topic 842; ASU No. 2018-10, Codification Improvements to Topic 842, Leases; and ASU No. 2018-11, Targeted Improvements. The new standard establishes a right-of-use model ("ROU") that requires a lessee to recognize assets and liabilities on the balance sheet for most leases and changes many key definitions, including the definition of a lease. Lessees will continue to differentiate between finance leases and operating, and classification will impact expense recognition.
The Company elected the following practical expedients for all lease asset classes, which must be elected as a package and applied consistently to all of its leases at the transition date: i) the Company did not reassess whether any expired or existing contracts are or contain leases; ii) the Company did not reassess the lease classification for any expired or existing leases (that is, all existing leases that were classified as operating leases in accordance with ASC 840, Leases (ASC 840), are classified as operating leases); and iii) the Company did not reassess initial direct costs for any existing leases. At the inception of an arrangement, the Company determines whether the arrangement is or contains a lease based on the facts and circumstances present in the arrangement. Leases with a term greater than one year are recognized on the balance sheet as right-of-use (ROU) assets and short-term and long-term lease liabilities, as applicable. The Company has elected the practical expedient not to recognize leases on the balance sheet with a term of twelve months or less. The Company’s leases consist of office and lab space and office equipment. All of the Company’s leases are classified as operating, and options to renew a lease are only included in the lease term to the extent those options are reasonably certain to be exercised. Additionally, the Company elected to apply the practical expedient not to separate lease and nonlease components for all leases. Operating lease liabilities and their corresponding ROU assets are initially recorded based on the present value of lease payments over the expected remaining lease term. The rate implicit in lease contracts is typically not readily determinable and, as a result, the Company utilizes its incremental borrowing rate to discount lease payments, which reflects the fixed rate at which the Company could borrow on a collateralized basis the amount of the lease payments, for a similar term, in a similar economic environment. To estimate its incremental borrowing rate, a credit rating applicable to the Company is estimated using a synthetic credit rating analysis since the Company does not currently have a rating agency-based credit rating. The adoption of ASC 842 resulted in the recognition of operating lease ROU assets and operating lease liabilities of $12.2 million and $22.8 million, respectively, on the Company’s condensed consolidated balance sheet, with the difference between the ROU asset and lease liability on the balance sheetprimarily attributable to unamortized lease incentives and deferred rent related to its lease for all leases with a term longer than 12 months. Leases will be classified as finance or operating, with classification affecting the pattern and classification of expense recognitionits corporate headquarters at 900 Middlesex Turnpike in the income statement. A modified retrospective transition approach is required, applying the new standard to all leases existing at the date of initial application. The new standard is effective for us onBillerica, Massachusetts (the 900 Middlesex Turnpike Lease). On January 1, 2020, with early adoption permitted. We expect to adopt the new standard on January 1, 2020 and use the effective date as our date of initial application. In August 2016, the FASB issued ASU No. 2016-15,Statement of Cash Flows (Topic 230): Classification of Certain Cash Receipts and Cash Payments, to address diversity in how certain cash receipts and cash payments are presented and classified in the statements of cash flows. The amendments are effective for the Company for fiscal years beginning after December 15, 2018, and interim periods within those fiscal years. The amendments should be applied using a retrospective transition method to each period presented. If retrospective application is impractical for some of the issues addressed by the update, the amendments for those issues would be applied prospectively as of the earliest date practicable. As the Company avails itself to the extended transition period as an emerging growth company under the JOBS Act, the new standard is effective for fiscal years beginning after December 15, 2018 and interim periods within fiscal years beginning after December 15, 2019. The Company's assessment is in progress and has not yet concluded on the impact of the standard.
In November 2016, the FASB issuedadopted ASU No. 2016-18, Statement of Cash Flows (Topic 230): Restricted Cash (ASU 2016-18), requiring restricted cash and cash equivalents to be included in the statement of cash flows. As the Company avails itself of the extended transition period as an emerging growth company under the JOBS Act, the new standard is effective for fiscal years beginning after December 15, 2018 and interim periods within fiscal years beginning after December 15, 2019. The Company elected to early adopt this standard in the statement of cash flows for the year ended December 31, 2018.
In January 2017, the FASB issued ASU No. 2017-04, Intangibles—“Intangibles – Goodwill and Other (Topic 350)—: Simplifying the Test for Goodwill Impairment.Impairment” (ASU 2017-04). This ASU eliminates Step 2 from the goodwill impairment test. In addition, income tax effects from any tax deductible goodwill on the carrying amount of the reporting unit should be considered when measuring the goodwill impairment loss, if applicable. The amendments also eliminate the requirements for any reporting unit with a zero or negative carrying amount to perform a qualitative assessment and, if it fails that qualitative test, to perform Step 2 of the goodwill impairment test. An entity still has the option to perform the qualitative assessment for a reporting unit to determine if the quantitative impairment test is necessary. ThisThe adoption of ASU is effective for annual periods beginning after December 15, 2019 and interim periods within those annual periods. Early adoption is permitted, for interim or annual goodwill impairment tests performed on testing dates after2017-04 resulted in no material effect to the Company’s financial statements.
On January 1, 2017.2020 the Company adopted ASU 2018-07. This standard simplifies the accounting for share-based payments to non-employees by aligning it with the accounting for share-based payments to employees, with certain exceptions. The Company does not expect adoption of this ASU to be2018-07 did not have a material to itseffect on the Company’s consolidated financial statements on known trends, demands, uncertainties and events in its business.statements. In August 2018,On January 1, 2020, the FASB issuedCompany adopted ASU No. 2018-13,"“Fair Value Measurement (Topic 820), Disclosure Framework—Changes to the Disclosure Requirements for Fair Value Measurement"Measurement”. This ASU removed the following disclosure requirements: (1) the amount of and reasons for transfers between
Table of Contents
Quanterix Corporation
Notes to Consolidated Financial Statements (Continued)
2. Significant accounting policies (Continued)
Level 1 and Level 2 of the fair value hierarchy; (2) the policy for timing of transfers between levels; and (3) the valuation processes for Level 3 fair value measurements. Additionally, this update added the following disclosure requirements: (1) the changes in unrealized gains and losses for the period included in other comprehensive income for recurring Level 3 fair value measurements held at the end of the reporting period; and (2) the range and weighted average of significant unobservable inputs used to develop Level 3 fair value measurements. For certain unobservable inputs, an entity may disclose other quantitative information (such as the median or arithmetic average) in lieu of the weighted average if the entity determines that other quantitative information would be a more reasonable and rational method to reflect the distribution of unobservable inputs used to develop Level 3 fair value measurements. The adoption of this standard did not have a material effect on the Company’s consolidated financial statements. On January 1, 2019, the Company adopted ASC 606 using the modified retrospective method. Under ASC 606, revenue is recognized upon the transfer of control of goods or services to customers and reflects the amount of consideration to which an entity expects to be entitled in exchange for those goods or services. The adoption of ASC 606 has been applied to customer contracts that were not completed as of January 1, 2019, and did not materially change the pattern of revenue recognition for its current customer contracts. The Company's consolidated financial statements for the prior-year period have not been revised and are reflective of the revenue recognition requirements which were in effect for that period. The Company recorded an adjustment to the accumulated deficit of $0.4 million as of January 1, 2019 for the cumulative effect primarily related to the deferral of sales commissions. In accordance with the reporting requirements of ASC 606, the disclosure of the impact on the Company's consolidated balance sheet and statement of operations, as a result of adopting the provisions of ASC 606, was as follows (in thousands): | | | | | | | | | | | | | | | | | | | | | | | | | | | | | | | Prior to | | | | | | | | | | | | | | adoption of | | | As | | | | Adjusted under | | As reported | | | | ASC 606 | | | reported | | | | ASC 606 | | December 31, | | | | December 31, | | | December 31, 2018 | | Adjustments | | January 1, 2019 | | 2019 | | Adjustments | | 2019 | Assets: | | | | | | | | | | | | | | | | | | | Accounts receivable | | $ | 6,792 | | $ | 47 | | $ | 6,839 | | $ | 10,906 | | $ | — | | $ | 10,906 | Prepaid expenses and other current assets | | | 2,330 | | | 288 | | | 2,618 | | | 2,137 | | | 335 | | | 1,802 | Other non-current assets | | | 536 | | | 19 | | | 555 | | | 557 | | | — | | | 557 | | | | | | | | | | | | | | | | | | | | Liabilities: | | | | | | | | | | | | | | | | | | | Deferred revenue | | | 5,437 | | | 43 | | | 5,394 | | | 4,697 | | | (209) | | | 4,488 | Deferred revenue, net of current portion | | | 520 | | | 43 | | | 477 | | | 466 | | | 14 | | | 480 | | | | | | | | | | | | | | | | | | | | Stockholders’ equity: | | | | | | | | | | | | | | | | | | | Accumulated deficit | | $ | (175,888) | | $ | (440) | | $ | (175,448) | | $ | (216,244) | | $ | (140) | | $ | (216,104) |
| | | | | | | | | | | | For the year Ended December 31, 2019 | | | | | | | Under ASC | | | Under ASC 606 | | Adjustment | | 605 | Product revenue | | $ | 40,491 | | $ | 55 | | $ | 40,546 | Service revenue | | | 16,059 | | | 273 | | | 16,332 | Costs of goods sold and services | | | 29,898 | | | 1 | | | 29,899 | Gross profit | | | 26,836 | | | 327 | | | 27,163 | Selling general and administrative expenses | | | 52,246 | | | 27 | | | 52,273 | Net loss | | $ | (40,796) | | $ | 300 | | $ | (40,496) |
In January of 2019, the Company adopted ASU 2016-01, which requires equity investments (except those accounted for under the equity method of accounting or those that result in consolidation of the investee) to be measured at fair value with changes in fair value recognized in net income. For equity investments without readily determinable fair values that do not qualify for the practical expedient to estimate fair value using the net asset value per share or its equivalent, the Company has elected to measure these investments at cost minus impairment, if any, plus or minus changes resulting from observable price changes in orderly transactions for the identical or similar investment of the same issuer. This election is made for each investment separately and is reassessed at each reporting period as to whether the investment continues to qualify for this election. Additionally, at each reporting period, the Company makes a qualitative assessment considering impairment indicators to evaluate whether the investment is impaired. The adoption of this standard did not have a material effect on the Company’s consolidated financial statements. Not Yet Adopted In June 2016, the FASB issued ASU No. 2018-13 will2016-13, Financial Instruments — Credit Losses: Measurement of Credit Losses on Financial Instruments (ASU 2016-13), which amends the impairment model by requiring entities to use a forward-looking approach based on expected losses to estimate credit losses on certain types of financial instruments, including trade receivables and available-for-sale debt securities. The standard is effective for the Company beginning in the first quarter of 2022, with early adoption permitted. The Company does not expect impact of ASU 2016-13 to be material on its consolidated financial statements. In August 2018, the FASB issued ASU No. 2018-15, Intangibles - Goodwill and Other - Internal-Use Software (Subtopic 350-40): Customer’s Accounting for Implementation Costs Incurred in a Cloud Computing Arrangement That Is a Service Contract (ASU 2018-15). This ASU addresses the accounting for implementation, setup and other upfront costs paid by a customer in a cloud computing or hosting arrangement. The guidance aligns the accounting treatment of these costs incurred in a hosting arrangement treated as a service contract with the requirements for capitalization and amortization costs to develop or obtain internal-use software. This guidance is effective for fiscal years beginning after December 15, 2020 and early adoption is permitted. The guidance can be adopted either retrospectively or prospectively. The Company is currently evaluating the expected impacts of ASU 2018-15. In December 2019, the FASB issued ASU 2019-12, Income Taxes (ASC 740): Simplifying the Accounting for Income Taxes, which is intended to simplify various areas related to accounting for income taxes. ASU 2019-12 removes certain exceptions to the general principles in ASC 740 and also clarifies and amends existing guidance to improve consistent application. ASU 2019-12 is effective for the Company beginning in fiscal year 2022, with early adoption permitted. As of December 31, 2018,The Company is currently evaluating the Company has not elected to early adopt this guidance but does not expect that the adoptionimpact of this guidance will have a material effectstandard on its consolidated financial statements.statements and disclosures. 3. Inventory Inventory consists of the following (in thousands): | | | | | | | |
| | As of
December 31, | |
|---|
| | 2018 | | 2017 | |
|---|
Raw materials | | $ | 1,546 | | $ | 1,032 | | Work in process | | | 2,331 | | | 968 | | Finished goods | | | 2,068 | | | 1,571 | | | | | | | | | | | Total | | $ | 5,945 | | $ | 3,571 | | | | | | | | | | |
| | | | | | | | | December 31, | | | 2020 | | 2019 | Raw materials | | $ | 5,265 | | $ | 4,717 | Work in process | | | 3,306 | | | 2,573 | Finished goods | | | 6,285 | | | 3,173 | Total | | $ | 14,856 | | $ | 10,463 |
Inventory comprises commercial instruments, assays, and the materials required to manufacture assays. 4. Property and equipment Property and equipment consists of the following (in thousands): | | | | | | | |
| | As of
December 31, | |
|---|
| | 2018 | | 2017 | |
|---|
Laboratory and manufacturing equipment | | $ | 4,127 | | $ | 2,969 | | Office furniture and equipment | | | 789 | | | 689 | | Computers and software | | | 786 | | | 459 | | Leasehold improvements | | | 244 | | | 180 | | | | | | | | | | | | | | 5,946 | | | 4,297 | | Less: accumulated depreciation | | | (3,023 | ) | | (2,423 | ) | | | | | | | | | | Total | | $ | 2,923 | | $ | 1,874 | | | | | | | | | | |
| | | | | | | | | As of | | | December 31, | | | 2020 | | 2019 | Laboratory and manufacturing equipment | | $ | 8,523 | | $ | 5,391 | Office furniture and equipment | | | 1,556 | | | 1,403 | Computers and software | | | 1,504 | | | 1,103 | Leasehold improvements | | | 8,765 | | | 8,489 | Total | | $ | 20,348 | | $ | 16,386 | | | | | | | | Less: accumulated depreciation | | | (6,436) | | | (4,339) | Total | | $ | 13,912 | | $ | 12,047 |
The Company incurred depreciation expense of $0.7$2.2 million and $0.5$1.6 million for the years ended December 31, 20182020 and 2017,2019, respectively. IncludedThe Company has instruments included in Laboratorylaboratory and manufacturing equipment, are
Table of Contents
Quanterix Corporation
Notes to Consolidated Financial Statements (Continued)
4. Property and equipment (Continued)
27 instruments, which are used internally used by the Company. TheAs of December 31, 2020, the laboratory &and manufacturing equipment balance includes $1.4$3.4 million of cost and $0.7$1.8 million of accumulated depreciation related to these instruments. As of December 31, 2019, the laboratory and manufacturing equipment balance includes $2.8 million of cost and $1.2 million of accumulated depreciation related to these instruments.
5. Other accrued expenses Other accrued expenses consist of the following (in thousands): | | | | | | | | | December 31, | | December 31, | | | 2020 | | 2019 | Accrued inventory purchases | | $ | 527 | | $ | 459 | Accrued royalties | | | 1,845 | | | 476 | Accrued professional services | | | 797 | | | 655 | Accrued development costs | | | 323 | | | 151 | Accrued other | | | 1,353 | | | 757 | Total accrued expenses | | $ | 4,845 | | $ | 2,498 |
| | | | | | | |
| | As of
December 31, | |
|---|
| | 2018 | | 2017 | |
|---|
Accrued inventory | | $ | 599 | | $ | 835 | | Accrued royalties | | | 323 | | | 221 | | Accrued professional services | | | 723 | | | 346 | | Accrued development costs | | | 795 | | | 1,559 | | Accrued other | | | 689 | | | 599 | | | | | | | | | | | Total accrued expenses | | $ | 3,129 | | $ | 3,560 | | | | | | | | | | |
Other non-current liabilities consist of the following (in thousands): | | | | | | | | | December 31, | | December 31, | | | 2020 | | 2019 | Leasehold obligation incentive | | $ | — | | $ | 7,572 | Deferred rent | | | — | | | 3,009 | Deferred tax liabilities | | | 2,649 | | | 2,825 | Other | | | — | | | 1 | Total other non-current liabilities | | $ | 2,649 | | $ | 13,407 |
6. Income Taxestaxes The following table presents the components of income (loss)loss before income taxes (in thousands): | | | | | | | | | | |
| | Year Ended December 31, | |
|---|
| | 2018 | | 2017 | | 2016 | |
|---|
United States | | $ | (31,436 | ) | $ | (27,019 | ) | $ | (23,173 | ) | Foreign | | | (75 | ) | | — | | | — | | | | | | | | | | | | | | | | $ | (31,511 | ) | $ | (27,019 | ) | $ | (23,173 | ) | | | | | | | | | | | | | | | | | | | | | | | | | | | | | | | | | | | | |
Table of Contents
| | | | | | | | | | | | Year Ended December 31, | | | 2020 | | 2019 | | 2018 | United States | | $ | (29,896) | | $ | (40,010) | | $ | (31,436) | Foreign | | | (2,010) | | | (973) | | | (75) | | | $ | (31,906) | | $ | (40,983) | | $ | (31,511) |
Quanterix Corporation
Notes to Consolidated Financial Statements (Continued)
6. Income Taxes (Continued)
The following table summarizes the provision for (benefit from) income taxestax benefit (provision) (in thousands): | | | | | | | | | | |
| | Year Ended
December 31, | |
|---|
| | 2018 | | 2017 | | 2016 | |
|---|
Current: | | | | | | | | | | | United States | | | | | | | | | | | Federal | | $ | — | | $ | — | | $ | — | | State | | | 18 | | | — | | | — | | Foreign | | | — | | | — | | | — | | | | | | | | | | | | | | Total current income tax provision | | | 18 | | | — | | | — | | | | | | | | | | | | | | Deferred | | | | | | | | | | | United States | | | | | | | | | | | Federal | | | 2 | | | — | | | — | | State | | | 5 | | | — | | | — | | Foreign | | | — | | | — | | | — | | | | | | | | | | | | | | Total deferred income tax provision (benefit) | | | 7 | | | — | | | — | | | | | | | | | | | | | | Total income tax provision (benefit) | | $ | 25 | | $ | — | | $ | — | | | | | | | | | | | | | | | | | | | | | | | | | | | | | | | | | | | | | |
| | | | | | | | | | | | Year Ended | | | December 31, | | | 2020 | | 2019 | | 2018 | Current: | | | | | | | | | | United States | | | | | | | | | | Federal | | $ | — | | $ | — | | $ | — | State | | | (13) | | | (20) | | | (18) | Foreign | | | (102) | | | (93) | | | — | Total current income tax provision | | | (115) | | | (113) | | | (18) | Deferred | | | | | | | | | | United States | | | | | | | | | | Federal | | | (8) | | | (3) | | | (2) | State | | | (3) | | | (1) | | | (5) | Foreign | | | 502 | | | 304 | | | — | Total deferred income tax benefit (provision) | | | 491 | | | 300 | | | (7) | Total income tax benefit (provision) | | $ | 376 | | $ | 187 | | $ | (25) |
During the years ended December 31, 20182020, 2019, and 2017,2018, the Company recorded an income tax provisionbenefit (provision) of $25$0.4 million, $0.2 million, and $0 thousand,$(0.0) million, respectively. During the years ended December 31, 2018, 2017 and 2016, the Company recorded no income tax benefits for any net losses incurred and the tax credits generated in each year, due to its uncertainty A reconciliation of the federal statutory income tax rate to the effective tax rate is as follows: | | | | | | | |
| | Year Ended
December 31, | |
|---|
| | 2018 | | 2017 | |
|---|
Federal statutory income tax rate | | | 21.0 | % | | 34.0 | % | State taxes, net of federal tax benefit | | | 6.0 | % | | 4.8 | % | Stock compensation | | | 1.1 | % | | 0.0 | % | Permanent items | | | –1.2 | % | | –1.6 | % | Tax Credits | | | 2.7 | % | | 2.6 | % | Foreign differential | | | 0.0 | % | | 0.0 | % | U.S. Tax Reform | | | 0.0 | % | | –53.2 | % | Other, net | | | 0.2 | % | | –1.1 | % | Valuation Allowance | | | –29.9 | % | | 14.5 | % | | | | | | | | | | Effective income tax rate | | | –0.1 | % | | 0.0 | % | | | | | | | | | |
| | | | | | | | | | Year Ended December 31, | | | | 2020 | | 2019 | | 2018 | | Federal statutory income tax rate | | 21.0 | % | 21.0 | % | 21.0 | % | Foreign tax rate differential | | 0.3 | % | — | % | — | % | State taxes, net of federal benefit | | 2.5 | % | 3.2 | % | 6.0 | % | Tax credits | | 1.6 | % | 2.3 | % | 2.7 | % | Share-based compensation | | 5.2 | % | 2.3 | % | 1.1 | % | Permanent items | | (0.4) | % | (0.9) | % | (1.2) | % | Deferred tax rate change | | 0.3 | % | (1.4) | % | — | % | Change in valuation allowance | | (29.7) | % | (24.6) | % | (29.9) | % | Other | | 0.4 | % | (1.4) | % | 0.2 | % | Effective income tax rate | | 1.2 | % | 0.5 | % | (0.1) | % |
The significant reconciling items between the reported amountseffective tax rate of income tax expense for the year to the amount of income tax expense that would result1.2% differs from applying the U.S. Federal statutory tax rate to pre-tax income include state taxes, non-deductible expenses, stock based compensation tax benefits, tax credits, andof 21.0% primarily as a result of the valuation allowance maintained against certain of the Company'sCompany’s net deferred tax assets.
Table of Contents
Quanterix Corporation
Notes to Consolidated Financial Statements (Continued)
6. Income Taxes (Continued)
During 2018, the Company acquired Aushon Biosystems.Aushon. The Company analyzed the transaction from an income tax perspective and adjusted the deferred tax assets and liabilities related to the Aushon Biosystems acquisition. Of the total goodwill recorded, approximately $0.4$0.3 million is amortizable related to historical tax basis that Aushon had related to a prior acquisition. On December 22, 2017,During 2019, the Tax CutsCompany acquired Uman, a Swedish entity. The Company analyzed the transaction from an income tax perspective and Jobs Act of 2017 (the "Act")found that there was signed into law, making significant changes0 tax deductible goodwill or other identifiable intangible assets related to the Internal Revenue Code. Changes included, but were not limited to, a corporate tax rate decrease from 35% to 21% effective for tax years beginning after December 31, 2017, the transition of U.S international taxation from a worldwide tax system to a territorial system, and a one-time transition tax on the mandatory deemed repatriation of cumulative deferred foreign earnings as of December 31, 2017. On December 22, 2017, Staff Accounting Bulletin No. 118 ("SAB 118") was issued, which directed taxpayers to consider the impact of the Act as "provisional" when a registrant did not have the necessary information available, prepared or analyzed (including computations) in reasonable detail to complete the accounting for certain income tax effects of the Act. During the fourth quarter of 2018 the Company completed its accounting for the tax effects of the Act and recorded no adjustments in its consolidated financial statements.transaction.
A valuation allowance is provided when it is more likely than not that all or a portion of the deferred tax asset will not be realized. Realization of deferred tax assets is dependent upon future taxable income, if any, the amount and timing of which are uncertain. The Company maintains a valuation allowance against its net U.S. and foreign deferred tax assets as a result of the negative evidence associated with its history of operating losses.
Deferred tax assets and liabilities reflect the net tax effects of net operating loss carryovers and temporary differences between the carrying amount of assets and liabilities for financial reporting and
Table of Contents
Quanterix Corporation
Notes to Consolidated Financial Statements (Continued)
6. Income Taxes (Continued)
the amounts used for income tax purposes. Significant components of the Company'sCompany’s deferred tax assets and liabilities were as follows (in thousands): | | | | | | | |
| | December 31, | |
|---|
| | 2018 | | 2017 | |
|---|
Deferred tax assets: | | | | | | | | Net operating loss carryforwards | | $ | 35,623 | | $ | 27,952 | | Research and development credits | | | 4,678 | | | 3,637 | | Deferred revenue | | | 1,614 | | | 1,795 | | Depreciation | | | 86 | | | 629 | | Amortization | | | 792 | | | — | | Stock compensation | | | 541 | | | 185 | | Other deferred tax assets | | | 1,378 | | | 614 | | | | | | | | | | | Total deferred tax assets | | | 44,712 | | | 34,812 | | Valuation allowance | | | (44,033 | ) | | (34,552 | ) | | | | | | | | | | Subtotal | | | 679 | | | 260 | | Section 481(a) Adjustment—Accrued Bonus | | | (59 | ) | | (118 | ) | Amortization | | | (610 | ) | | — | | Goodwill | | | (17 | ) | | | | Stock-based compensation | | | | | | (142 | ) | | | | | | | | | | Net deferred tax assets (liability) | | $ | (7 | ) | $ | — | | | | | | | | | | | | | | | | | | | | | | | | | | | | |
As of December 31, 2018, the Company had federal and state net operating loss carryforwards of $136.8 million and $108.8 million, respectively. $0.9 million of the federal net operating loss carryforwards relates
| | | | | | | | | December 31, | | | 2020 | | 2019 | Deferred tax assets: | | | | | | | Net operating loss carryforwards | | $ | 50,233 | | $ | 43,814 | Tax credits | | | 5,101 | | | 5,518 | Deferred revenue | | | 2,167 | | | 1,247 | Amortization | | | 1,054 | | | 928 | Stock-based compensation | | | 1,956 | | | 973 | Deferred rent | | | — | | | 727 | Lease incentive obligation | | | — | | | 1,828 | Lease liability | | | 5,703 | | | — | Other deferred tax assets | | | 2,533 | | | 1,325 | Total deferred tax assets | | | 68,747 | | | 56,360 | Less: valuation allowances | | | (63,609) | | | (54,137) | Net deferred tax assets | | | 5,138 | | | 2,223 | Deferred tax liabilities: | | | | | | | Right-of-Use Assets | | | (2,957) | | | — | Depreciation | | | (1,775) | | | (1,769) | Amortization acquired intangibles | | | (2,880) | | | (3,031) | Inventory | | | (64) | | | (212) | Goodwill | | | (49) | | | (31) | Other deferred tax liabilities | | | (61) | | | (5) | Net deferred tax liabilities | | $ | (2,648) | | $ | (2,825) |
The Company’s change in its valuation allowance account with respect to the acquisition of Aushon Biosystems and these losses have been reduced to reflect the limitations on these losses as a result of Section 382 of the Internal Revenue Code. These carryforwards begin to expire in 2026 and 2019, respectively. As of December 31, 2018, the Company had federal and state credit carryforwards of $3.8 million and $1.2 million, respectively. These carryforwards begin to expire in 2026 and 2019, respectively. As of December 31, 2018, the Company had foreign net operating loss carryforwards of $75 thousand. Of this amount, carryforwards of $75 thousand expire in 2027. The Company recognizes a deferred tax asset for the future benefit of tax loss carryforwards, tax credit carryforwards, and other deductible temporary differences to the extent that it is more likely than not that these assets will be realized. In evaluating the Company's ability to recover these deferred tax assets, the Company considers all available positive and negative evidence, including its past operating results, taxable income in carryback years, the projected reversal of existing deferred tax liabilities, the availability of tax planning strategies and its forecast of future taxable income. Based on the significant negative evidence, including the three-year cumulative loss position, the Company concluded that its net U.S. deferred tax assets as well as the deferred tax assets in certain foreign subsidiaries were not more likely than not realizable and maintained a full valuation allowance against these deferred tax assets at December 31, 2018.
Table of Contentsfollows (in thousands):
Quanterix Corporation
| | | | | | | | | 2020 | | 2019 | Balance, beginning of year | | $ | 54,137 | | $ | 44,033 | Change in valuation allowance | | | 9,472 | | | 10,104 | Balance, end of year | | $ | 63,609 | | $ | 54,137 |
Notes to Consolidated Financial Statements (Continued)
6. Income Taxes (Continued)
The valuation allowance increased by $9.4$9.5 million during the year ended December 31, 2018,2020, primarily as a result of the U.S. operating losses incurred, theand research and development tax credit carryforwards generated during the year and acquisition of Aushon Biosystems, Incorporated.year. The
In determining the need for a valuation allowance, decreased by $3.9 million during the year ended December 31, 2017. The decrease in valuation allowance was primarily the result of the impact of the U.S. corporate tax rate reduction enacted during 2017, which resulted in the Company remeasuringhas given consideration to the cumulative book income and loss positions of each of its entities as well as its worldwide cumulative book loss position. The Company has assessed, on a jurisdictional basis, the available means of recovering deferred tax assets, including the ability to carryback net operating losses (NOLs), the existence of reversing taxable temporary differences, the availability of tax planning strategies, and liabilities atforecasted future taxable income. At December 31, 2020, the lower 21%Company maintains a full valuation allowance against its worldwide net deferred tax assets. As of December 31, 2020, the Company had U.S. federal corporate tax rateNOLs of approximately $199.3 million. U.S. federal NOLs generated through December 31, 2017 of approximately $108.5 million expire at various dates through 2037, and a corresponding reductionU.S. federal NOLs generated in the valuation allowance. This reduction was partially offset bytax years beginning after December 31, 2017 of approximately $90.8 million do not expire. As of December 31, 2020, the valuation allowance established in 2017 related toCompany had $133.7 million of state NOLs, some of which are indefinite lived and some that expire at various dates through 2040. As of December 31 2020, the Company had U.S. and foreign operating losses incurred andfederal tax credits generated duringcredit carryforwards of approximately $4.5 million that expire at various dates through 2040. As of December 31, 2020, the year.Company had U.S. state tax credit carryforwards of approximately $0.8 million that expire at various dates through 2040. Under Sections 382 and 383 of the U.S. Internal Revenue Code, if a corporation undergoes an ownership change, the corporation'scorporation’s ability to use its pre-change net operating loss carryforwardsNOLs and other pre-change tax attributes, such as research tax credits, to offset its post-change income and taxes may be limited. In general, an ownership change generally occurs if there is a cumulative change in its ownership by 5% stockholders that exceeds 50 percentage points over a rolling three-year period. Similar rules may apply under U.S. state tax laws. Under the TCJA, the use of federal NOLs arising in taxable years beginning after December 31, 2017 is limited to 80% of current year taxable income and NOLs arising in taxable years ending after December 31, 2017 may not be carried back (though any such NOLs may be carried forward indefinitely). The Company may have experienced an ownership change in the past and may experience ownership changes in the future as a result of future transactions in its share capital, some of which may be outside of the control of the Company. As a result, if the Company earns net taxable income, its ability to use its pre-change net operating loss carryforwards,NOLs, or other pre-change tax attributes, to offset U.S. federal and state taxable income and taxes may be subject to significant limitations. In
The Coronavirus Aid, Relief and Economic Security Act (the CARES Act) was enacted in the ordinary courseUnited States on March 27, 2020. The CARES Act is an emergency economic stimulus package that includes spending and tax breaks to strengthen the United States economy and fund a nationwide effort to curtail the effect of business, there is inherent uncertaintyCOVID-19. While the CARES Act provides extensive tax changes in quantifyingresponse to the Company's income tax positions. COVID-19 pandemic, the provisions do not have a significant impact on the Company’s financial results. The Company assesses income tax positions and records tax benefits for all years subject to examination based upon management's evaluation of the facts, circumstances, and information available at the reporting date. For those tax positions for which it is more likely than not that a tax benefit will be sustained, the Company recorded the largest amount of tax benefit with a greater than 50% likelihood of being realized upon ultimate settlement with a taxing authority that has full knowledge of all relevant information. For those income tax positions for which it is not more likely than not that a tax benefit will be sustained, no tax benefit has been recognized in the consolidated financial statements. The Company accountedaccounts for uncertain tax positions using a more likely than not threshold for recognizing and resolving uncertain tax positions. The evaluation of uncertain tax positions is based on factors that include, but are not limited to, changes in tax law, the measurement of tax positions taken or expected to be taken in tax returns, the effective settlement of matters subject to audit, new audit activity and changes in facts or circumstances related to a tax position. The Company evaluates uncertain tax positions on an annualongoing basis and adjusts the level of the liability to reflect any subsequent changes in the relevant facts surrounding the uncertain positions. The Company accounts for interest and penalties related to uncertain tax positions as parta component of its provisionbenefit (provision) for income taxes. For the years ended December 31, 2020, 2019, and 2018, 2017the Company had no tax reserves accrued for uncertain tax positions and 2016, there were no0 accrued interest or penalties in the consolidated statements of operations and comprehensive loss. The Company does not anticipate any significant changes in the next twelve months associated with its liability for unrecognized tax benefits.
Table of Contentsoperations.
Quanterix Corporation
Notes to Consolidated Financial Statements (Continued)
6. Income Taxes (Continued)
The Company is subject to taxation in the United States as well as the Netherlands, Sweden, and China. At December 31, 2018,2020, the Company is generally no longer subject to examination by taxing authorities in the United States for years prior to 2015.2017. However, net operating loss carryforwardsNOLs and credits in the United States may be subject to adjustments by taxing authorities in future years in which they are utilized. The Company'sCompany’s foreign subsidiaries remain open to examination by taxing authorities from 20182015 onward. The Company'sAs of December 31, 2020, the Company’s foreign subsidiary has incurred losses since inception, and the Companysubsidiaries had immaterial undistributed earnings as of December 31, 2018.
7. Redeemable convertible preferred stock
The Company had authorized 47,015,449 shares of preferred stock, $0.001 par value per share, of which 3,972,415 shares were designated Series A-1 redeemable convertible preferred stock (Series A-1 Preferred Stock), 10,492,027 shares were designated Series A-2 Preferred Stock, 2,000,000 shares were designated Series A-3 Preferred Stock, 6,186,594 shares were designated Series B Preferred Stock, 9,247,089 shares were designated as Series C Preferred Stock, 544,332 shares were designated Series C-1 redeemable convertible preferred stock (Series C-1 Preferred Stock), 12,459,090 shares were designated Series D Preferred Stock and 2,113,902 were designated Series D-1 redeemable convertible preferred stock (Series D-1 Preferred Stock) as of immediately prior to the completion oftax payable on the IPO.
In February 2016, the Company issued 1,300,000 shares of Series A-3 Preferred Stock to a vendor (Note 8) upon the exercise of Series A-3 Preferred Stock warrants at a purchase price of $0.001 per share. The fair value of the settled warrant was $3.9 million at the time of exercise which was reclassified from Preferred Stock Warrant Liability to Series A Preferred Stock.
In March 2016, the Company issued 12,420,262 shares of Series D Preferred Stock at a purchase price of $3.67 per share. The issuance resulted in cash proceeds of $45.4 million, net of issuance costs.
In June and July 2016, the Company issued 397,530 shares of Series B Preferred Stock upon exercise of Series B Preferred Stock warrants, which included 312,500 shares of Series B Preferred Stock at a purchase price of $0.001 per share, 8,330 shares of Series B Preferred Stock at purchase price of $2.00 per share, and 76,700 shares of Series B Preferred Stock upon a cashless exercise of a warrant. The fair value of the settled warrants was $1.4 million at the time of exercise which was reclassified from Preferred Stock Warrant Liability to Series B Preferred Stock.
In January 2017, the Company issued 700,000 shares of Series A-3 Preferred Stock to a vendor (Note 8) upon the exercise of Series A-3 Preferred Stock warrants at a purchase price of $0.001 per share. The fair value of the settled warrant was $2.1 million at the time of exercise which was reclassified from Preferred Stock Warrant Liability to Series A Preferred Stock.
In June 2017, the Company issued 2,113,902 shares of Series D-1 Preferred Stock at a purchase price of $4.021 per share. The issuance resulted in cash proceeds of $8.4 million, net of issuance costs.
In November 2017, the Company issued 31,283 shares of Series C Preferred Stock upon exercise of Series C Preferred Stock warrants, which included 8,474 shares of Series C Preferred Stock at a purchase price of $3.3299 per share, and 22,809 shares of Series C Preferred Stock upon a cashless exercise of a warrant. The fair value of the settled warrants was $0.1 million at the time of exercise which was reclassified from Preferred Stock Warrant Liability to Series C Preferred Stock.
Table of Contents
Quanterix Corporation
Notes to Consolidated Financial Statements (Continued)
7. Redeemable convertible preferred stock (Continued)
The Company had a Stock Purchase Agreement (SPA) with bioMérieux, a related party, which required the Company to issue additional shares of Series C Preferred Stock if certain milestones were met in exchange for $10.0 million in gross proceeds. The milestones were related to activities under a Joint Development and License Agreement (JDLA) (Note 12). bioMérieux also purchased Series C Preferred Stock when the JDLA was entered into in 2012. When the SPA was entered into, the Company evaluated whether the requirement to issue additional shares ('Tranche Feature") required separate accounting. The Company determinedearnings that the Tranche Feature was not legally detachable and therefore was an embedded feature in the Series C Preferred Stock that bioMérieux purchased.
During the year ended December 31, 2015, the Company amended the terms of the SPA which restructured the equity milestone from one payment of $10.0 million to three separate payments ($5.0 million; $3.0 million and $2.0 million) based on components of the initial technical milestones. No other terms of the Series C Preferred Stock changed. The Company achieved the first milestone in January 2015 at which time bioMérieux purchased 1,501,546 shares of Series C Preferred Stock at a price of $3.3299 for total gross proceeds of $5.0 million. The Company also achieved the second milestone in May 2015 at which time bioMérieux purchased 600,618 shares of Series C Preferred Stock at a price of $3.3299 for total gross proceeds of $2.0 million. In December 2016, the Company further amended the JDLA and SPA which cancelled the third and final milestone (Note 12).
The rights, preferences, and privileges of Series A-1, A-2, A-3, B, C, C-1, D, and D-1 Preferred Stock were as follows:
Conversion
Shares of Series A-1, A-2, A-3, B, C, C-1, D, and D-1 Preferred Stock were convertible into common stock on a 3.214-for-one basis, adjustable for certain dilutive events. Conversion was at the option of the preferred stockholders, although conversion was automatic upon the earlier of the consummation of an initial public offering, resulting in gross proceeds to the Company of at least $40.0 million and for a minimum per-share amount of $5.00 per share, or the approval of a Preferred Majority, defined as 60% of the outstanding shares of Series A-1, A-2, B, C, D, and D-1 Preferred Stock voting as a single class.
Dividends
Holders of the Series A-1, A-2, B, C, and C-1 Preferred Stock were entitled to receive, before any cash was paid out or set aside for any common stock, cumulative dividends in arrears at the annual rate of $0.08, $0.08, $0.16, $0.2664, and $0.2664 per share, respectively, subject to adjustment for stock splits, stock dividends, combinations and reorganizations. Holders of Series D, and D-1 Preferred Stock were entitled to receive non-cumulative dividends at the rate of $0.2936, and $0.3217 per share, respectively, subject to adjustment for stock splits, when and if declared by the Board of Directors of the Company. The cumulative accrued dividends as of immediately prior to the completion of the IPO were $3.3 million, $7.8 million, $5.7 million, $9.5 million, and $0.7 million for Series A-1, A-2, B, C and C-1 Preferred Stock, respectively. Holders of Series A-3 Preferred Stock were not entitled to receive any preferred stock dividends. Upon full payment of preferred dividends, additional dividends would have been shared among all preferred stock holders and common stock holders on a pro rata basis.
Table of Contents
Quanterix Corporation
Notes to Consolidated Financial Statements (Continued)
7. Redeemable convertible preferred stock (Continued)
Liquidation preference
Holders of the Series A-1, A-2, A-3, B, C, C-1, D, and D-1 Preferred Stock had preference in the event of a liquidation or dissolution of the Company equal to $1.0416667, $1.0416667, $2.00, $2.00, $3.3299, $3.3299, $3.67, and $4.021 per share, respectively, plus any accrued but unpaid dividends. In any liquidation event, Series D and D-1 Preferred Stock holders would receive first priority in liquidation payments. In the event that the amounts available for distribution were insufficient to pay the full amounts, the assetsare indefinitely reinvested would be distributed ratably among Series D, and D-1 Preferred Stock holders in proportion to their aggregate liquidation preference amounts until such amounts were paid full. Series B, C, and C-1 Preferred Stock holders would receive next priority in liquidation payments after Series D Preferred Stock holders. In the event that the amounts available for distribution were insufficient to pay the full amounts, the assets would be distributed ratably among B, C, and C-1 Preferred Stock holders in proportion to their aggregate liquidation preference amounts. Series A-1, A-2, and A-3 Preferred Stock holders would receive next priority in liquidation preference after Series B, C, and C-1 Preferred Stock holders. In the event that the amounts available for distribution after payment were insufficient to pay the full amounts, the assets would be distributed ratably among A-1, A-2, and A-3 Preferred Stock holders in proportion to their aggregate liquidation preference amounts. Any remaining amounts would be distributed to holders of common stock on a pro rata basis. However, if the holders of any series of preferred stock would receive a greater liquidation preference if they were converted into shares of common stock immediately prior to the liquidation event, then these shares would receive consideration equal to the amount that would be received if the shares had been converted in common stock in lieu of the applicable liquidation preference.immaterial.
Voting rights
Holders of the Series A-1, A-2, A-3, B, C, D and D-1 Preferred Stock (Voting Preferred) were entitled to vote as a single class with the holders of common stock, and had one vote for each equivalent common share into which the preferred stock was convertible. A Preferred Majority vote was required in order to amend the Certificate of Incorporation or By-Laws, reclassify common stock or establish another class of stock, create or authorize additional shares of preferred stock, effect a sale, liquidation, or merger of the Company, repurchase or redeem any capital stock, or engage in any action which would adversely affect the holders of the preferred stock.
The holders of the Series A-1, A-2 and B Preferred Stock could elect three members to the Board of Directors, voting as a single class. The holders of the Series C Preferred Stock could elect one member to the Board of Directors. The holders of the Voting Preferred could elect one member to the Board of Directors, voting as a single class.
Holders of Series C-1 Preferred Stock had no voting rights.
Prior to the issuance of Series D Preferred Stock in March 2016, a majority vote of the Series B, C and C-1 Preferred Stock holders could elect to redeem all of the outstanding shares of Series B, C and C-1 Preferred Stock at any time on or after November 14, 2016. The Series A-1 and A-2 Preferred Stockholders had the right to elect to redeem all of the outstanding shares at any time after the redemption of the Series B, C and C-1 Preferred Stock shares was made. The preferred stockholders were entitled to the redemption in three equal annual installments.
Table of Contents
Quanterix Corporation
Notes to Consolidated Financial Statements (Continued)
7. Redeemable convertible preferred stock (Continued) Upon issuance of the Series D Preferred Stock in March 2016, the redemption rights were adjusted. A majority vote of the Series D Preferred Stockholders could elect to redeem all of the outstanding shares of Series D on or after March 18, 2019. Upon issuance of the Series D-1 Preferred Stock in June 2017 the redemption rights were adjusted. A majority vote of the Series D and D-1 Preferred Stockholders, voting as separate classes, could elect to redeem all of the outstanding shares of Series D and D-1 Preferred Stock on or after June 2, 2020. Holders of the Series C-1, C and B Preferred Stock could only redeem their shares following the redemption in full of all shares of Series D and D-1 Preferred Stock and upon a Preferred Majority Vote. Holders of the Series A-1 and A-2 Preferred Stock could only redeem their shares following the redemption in full of the Series D-1, D, C-1, C and B Preferred Stock, and upon a Preferred Majority Vote. Series A-3 Preferred Stock did not have redemption rights other than in certain deemed liquidation scenarios.
The redemption value of the Series A-1, A-2, B, C and C-1 Preferred Stock was equal to the original issuance price of the preferred stock plus any accrued or declared but unpaid cumulative dividends. The redemption price of the Series D and D-1 Preferred Stock was the greater of (i) the fair market value of the common stock which it was convertible into or (ii) the original issuance price plus all declared but unpaid dividends, which were non-cumulative. As of December 31, 2016, the fair market value of the Company's common stock was less than the original issuance price of the Series D Preferred Stock.
Preferred stock was presented in mezzanine equity. The Series A-1, A-2, B, C, C-1, D and D-1 Preferred Stock were redeemable at the option of the holder at a fixed date and therefore the Company was accreting the preferred stock to its redemption value through the earliest possible redemption date for all issuances where the carrying value is less than the redemption value. The Series A-3 Preferred Stock was redeemable only upon certain deemed liquidation scenarios which were outside of the Company's control. The accretion included the accretion of issuance costs and cumulative preferred stock dividends. Series A-3 Preferred Stock was not entitled to dividends. The Company assessed all terms and features of the preferred stock in order to identify any potential embedded features that would require bifurcation or any beneficial conversion features. As part of this analysis, the Company assessed the economic characteristics and risks of its preferred stock, including conversion and liquidation features, as well as dividend and voting rights. The Company determined that all features of the preferred stock were clearly and closely associated with an equity host, and although the preferred stock included conversion features, such conversion features did not require bifurcation as a derivative liability. On the date of issuance, the fair value of common stock into which the Series A-1, A-2, A-3, B, C, C-1, D and D-1 Preferred Stock was convertible was less than the effective conversion price of the Series A-1, A-2, A-3, B, C, C-1, D and D-1 Preferred Stock and as such, there was no intrinsic value of the conversion option at the commitment date.
Upon completion of the IPO on December 7, 2017 all outstanding shares of Preferred Stock were automatically converted into shares of common stock on a 3.214-for-one basis, resulting in the issuance
Table of Contents
Quanterix Corporation
Notes to Consolidated Financial Statements (Continued)
7. Redeemable convertible preferred stock (Continued)
of 14,185,744 shares of common stock. Details of the shares of Preferred Stock converted to common stock upon the completion of the IPO by class of Preferred Stock is as follows:
| | | | | Preferred Stock
| | Shares of
Preferred
Stock | |
|---|
A-1
| | | 3,972,415 | | A-2
| | | 10,427,586 | | A-3
| | | 2,000,000 | | B
| | | 6,021,636 | | C
| | | 8,092,895 | | C-1
| | | 544,332 | | D
| | | 12,420,262 | | D-1
| | | 2,113,902 | | | | | | | Total
| | | 45,593,028 | | | | | | |
Pursuant to the amended and restated certificate of incorporation filed in connection with the IPO in December 2017, the Company authorized 5,000,000 shares of preferred stock. The amended and restated certificate of incorporation authorized our board of directors, without any further stockholder action or approval, to issue these shares in one or more classes or series, to establish from time to time the number of shares to be included in each class or series and to fix the rights, preferences and privileges of the shares of each wholly unissued class or series and any of its qualifications, limitations or restrictions. There was no preferred stock issued or outstanding as of December 31, 2017.
The Company has a class of authorized preferred stock amounting to 5,000,000 shares as of December 31, 2018 and December 31, 2017. The authorized preferred stock was classified under stockholders' equity at December 31, 2018 and December 31, 2017.
Prior to the IPO in December 2017, the Company had multiple classes of preferred stock outstanding. These shares of preferred stock were converted to shares of common stock at the time of the IPO on 1-for-3.214 shares basis. The reconciliation of net loss attributable to common shareholders in the consolidated statement of operations for the year ended December 31, 2017 includes an adjustment for accretion of preferred stock to redemption value.
8. Common Stock, warrants, stock-based compensation, stock options, restricted stock and restricted stock units
Common stock reserved The Company reserved the following shares of common stock, on a common stock equivalent basis, for the conversion of shares of preferred stock, the exercise of warrants, the exercise of common stock options, and the vesting of restricted common stock. | | | | | | | As of December 31, | | | 2020 | | 2019 | Common stock warrants | | 10,000 | | 10,000 | Common stock options and unvested restricted common stock | | 3,012,432 | | 2,916,991 | Shares reserved for future awards under compensation plans | | 1,559,108 | | 882,715 | | | 4,581,540 | | 3,809,706 |
| | | | | | | |
| | Year ended December 31, | |
|---|
| | 2018 | | 2017 | |
|---|
Common stock warrants | | | 76,041 | | | 86,090 | | Common stock options and unvested restricted common stock | | | 2,838,402 | | | 2,427,035 | | Shares reserved for future awards under compensation plan | | | 2,433,999 | | | 3,500,620 | | | | | | | | | | | | | | 5,348,442 | | | 6,013,745 | | | | | | | | | | |
Table of Contents Warrants
Quanterix Corporation
Notes to Consolidated Financial Statements (Continued)
8. Common Stock, warrants, stock-based compensation, stock options, restricted stock and restricted stock units (Continued)
Warrants
The following tables summarizetable summarizes the Company'sCompany’s outstanding warrants as of December 31, 2018,2020, and 2017:2019: | | | | | | | |
| | Issued and
exercisable | | Weighted
Average
Exercise
Price | |
|---|
As of December 31, 2017 | | | 86,090 | | $ | 9.14 | | Issued | | | 10,000 | | | 4.83 | | Exercised | | | (16,718 | ) | | 11.73 | | Cancelled | | | (3,331 | ) | $ | 11.73 | | | | | | | | | | | As of December 31, 2018 | | | 76,041 | | | 10.10 | | | | | | | | | | |
| | | | | | | | | | Weighted | | | Issued and | | Average | | | exercisable | | Exercise Price | As of December 31, 2019 | | 10,000 | | $ | 21.00 | Issued | | — | | | — | Exercised | | — | | | — | Cancelled | | — | | | — | As of December 31, 2020 | | 10,000 | | $ | 21.00 |
The Company has an agreement with a vendor (Note 7)9) where the Company could be obligated to issue warrants to purchase an additional 93,341 shares of common stock to the vendor if the contract is terminated prior to a minimum purchase commitment being met. NoNaN shares have been reserved related to these potential obligations to issue warrants in the future. On JanuryJanuary 30, 2018, the companyCompany issued a warrant to purchase 10,000 of common stock to a consultation company for services rendered. On July 2, 2019, 66,041 warrants were exercised by a holder on a net, non-cash, basis. Per terms of the warrant agreement, the Company issued 45,690 shares of common stock after giving effect to the holder’s net exercise. Stock-based compensation Share-based compensation expense for all stock awards consists of the following (in thousands): | | | | | | | | | | |
| | Year ended
December 31, | |
|---|
| | 2018 | | 2017 | | 2016 | |
|---|
Cost of product revenue | | $ | 55 | | $ | 24 | | $ | 6 | | Cost of service and other revenue | | | 173 | | | 52 | | | 12 | | Research and development | | | 513 | | | 180 | | | 59 | | General and administrative | | | 4,143 | | | 1,912 | | | 851 | | | | | | | | | | | | | | Total | | $ | 4,884 | | $ | 2,168 | | $ | 928 | | | | | | | | | | | | | |
| | | | | | | | | | | | | | December 31, | | | | 2020 | | 2019 | | 2018 | Cost of product revenue | | | $ | 189 | | $ | 86 | | $ | 55 | Cost of service and other revenue | | | | 311 | | | 238 | | | 173 | Research and development | | | | 1,129 | | | 718 | | | 513 | Selling, general, and administrative | | | | 8,470 | | | 5,346 | | | 4,143 | Total | | | $ | 10,099 | | $ | 6,388 | | $ | 4,884 |
In June 2007, the Company adopted the 2007 Stock Option and Grant Plan (the 2007 Plan), under which it could grant incentive stock options, non-qualified options, restricted stock, and stock grants. At December 31, 2016, the 2007 Plan allowed for the issuance of up to 3,229,935 shares of common stock. During the three months ended March 31, 2017, the 2007 Plan was amended to allow for the issuance of an additional 622,227 shares of common stock for a total issuance of up to 3,852,213 shares of common stock at June 30, 2017. During the three months ended September 30, 2017 the 2007 Plan was further amended to allow for the issuance of an additional 497,822 shares of common stock for total issuance of up to 4,350,035 shares of common stock at September 30, 2017. As of December 31, 2017, under the 2007 Plan, options to purchase 2,249,843 shares of our common stock were outstanding, 571,838 shares of our common stock had been issued and were outstanding pursuant to the exercise of options, 1,128,975 shares of our common stock had been issued and were outstanding pursuant to
Table of Contents
Quanterix Corporation
Notes to Consolidated Financial Statements (Continued)
8. Common Stock, warrants, stock-based compensation, stock options, restricted stock and restricted stock units (Continued)
restricted or unrestricted stock awards, and 399,379 shares of our common stock were available for future awards. In connection with the completion of the IPO, the Company terminated the 2007 Plan. As of December 31, 2020, 926,615 shares were outstanding and 0 shares were available for future grant under the 2007 Plan.
In December 2017, the Company adopted the 2017 Employee, Director and Consultant Equity Incentive Plan (the 2017 Plan), under which it may grant incentive stock options, non-qualified stock options, restricted stock, and other stock-based awards. As of December 31, 2017, the 2017 Plan allowed for the issuance of up to 1,042,314 shares of common stock plus up to 2,490,290 shares of our common stock represented by awards granted under the 2007 Plan that are forfeited, expire or are cancelled without delivery of shares or which result in the forfeiture of shares of common stock back to the Company on or after the date the 2017 Plan becomesbecame effective. As of December 31, 20182020 and 2017,2019, there were shares available for grant under the 2017 Plan of 4,393710,839 and 1,042,314,270,143, respectively. In addition, the 2017 Plan contains an "evergreen" provision, which allows for an annual increase in the number of shares of common stock available for issuance under the 2017 Plan on the first day of each fiscal year during the period beginning in fiscal year 2019 and ending in fiscal year 2027. The annual increase in the number of shares shall be equal to the lowest of: 4% of the number of shares of common stock outstanding as of such date; and an amount determined by the Company'sCompany’s Board of directorsDirectors or Compensation Committee. On January 1, 2019,2021, the number of shares of common stock available for issuance under the 2017 plan was automatically increased by 895,1691,273,501 shares. In December 2017, the Company adopted the 2017 Employee Stock Purchase Plan (the 2017 ESPP). As December 31, 2017,2019, the 2017 ESPP allowed for the issuance of up to 208,463612,572 shares of common stock. As of December 31, 2018, 425,5332020, 848,269 shares were available for grant under the 2017 ESPP. In addition, the 2017 ESPP contains an "evergreen" provision, which allows for an increase on the first day of each fiscal year beginning with fiscal year 2018. The increase in the number of shares shall be equal to the lowest of: 1% of the number of shares of common stock outstanding on the last day of the immediately preceding fiscal year or an amount determined by the Company'sCompany’s Board of Directors or Compensation Committee. The number of shares available for grant under the 2017 ESPP increased by 318,375 shares on January 1, 2021 due to this provision. The 2017 ESPP provides for six-month option periods Commencingcommencing on March 1 and ending August 31 and Commencingcommencing September 1 and ending February 28 of each calendar year. The first offering under the 2017 ESPP began on September 1, 2018. Stock options Under the 2007 and 2017 Plans, stock options may not be granted with exercise prices of less than fair market value on the date of the grant. Options generally vest ratably over a four-year period with 25% vesting on the first anniversary and the remaining 75% vesting ratably on a monthly basis over the
Table of Contents
Quanterix Corporation
Notes to Consolidated Financial Statements (Continued)
8. Common Stock, warrants, stock-based compensation, stock options, restricted stock and restricted stock units (Continued)
remaining three years. These options expire ten years after the grant date. Activity under the 2007 Plan and the 2017 Plans wasPlan were as follows: | | | | | | | | | | | | | |
| | Options | | Weighted-
average
exercise
price | | Remaining
contractual
life
(in years) | | Aggregate
intrinsic
value
(in thousands) | |
|---|
Outstanding at December 31, 2016 | | | 1,119,671 | | $ | 2.99 | | | 6.8 | | | 5,796 | | Granted | | | 1,281,135 | | $ | 8.46 | | | | | | | | Exercised | | | (90,265 | ) | $ | 2.25 | | | | | | | | Cancelled or forfeited | | | (60,698 | ) | $ | 6.16 | | | | | | | | | | | | | | | | | | | | | | | Outstanding at December 31, 2017 | | | 2,249,843 | | $ | 6.05 | | | 7.8 | | | 34,695 | | Granted | | | 729,224 | | $ | 18.36 | | | | | | | | Exercised | | | (407,901 | ) | $ | 4.57 | | | | | | | | Cancelled or forfeited | | | (94,255 | ) | $ | 13.16 | | | | | | | | | | | | | | | | | | | | | | | Outstanding at December 31, 2018 | | | 2,476,911 | | $ | 9.65 | | | 7.733 | | $ | 22,108 | | Vested and expected to vest at December 31, 2018 | | | 2,476,911 | | $ | 9.65 | | | 7.733 | | $ | 22,108 | | Exercisable at December 31, 2018 | | | 1,143,480 | | $ | 5.68 | | | 6.514 | | $ | 14,440 | |
| | | | | | | | | | | | | | | Weighted-average | | Remaining contractual | | Aggregate intrinsic value | | | Options | | exercise price | | life (in years) | | (in thousands) | Outstanding at December 31, 2019 | | 2,507,062 | | $ | 14.41 | | 7.58 | | $ | 24,870 | Granted | | 550,290 | | $ | 28.39 | | | | | | Exercised | | (407,687) | | $ | 9.85 | | | | | | Cancelled | | (155,620) | | $ | 22.58 | | | | | | Outstanding at December 31, 2020 | | 2,494,045 | | $ | 17.73 | | 7.27 | | $ | 71,760 | Vested and expected to vest at December 31, 2020 | | 2,494,045 | | $ | 17.73 | | 7.27 | | $ | 71,760 | Exercisable at December 31, 2020 | | 1,514,576 | | $ | 12.54 | | 6.42 | | $ | 51,430 |
Using the Black-Scholes option pricing model, the weighted-average fair value of options granted to employees and directors during the years ended December 31, 2020, 2019, and 2018 2017,was $12.64, $9.09, and 2016 was $ 7.19, $4.52, and $2.41$7.19 per share, respectively. The expense related to awardsstock options granted to employees was $2.7$5.4 million, $1.5$3.7 million, and $0.2$2.7 million for the years ended December 31, 2020, 2019, and 2018, 2017, and 2016.respectively. The intrinsic value of stock options exercised was $5.3$10.4 million, $1.1$6.9 million, and $0.4$5.3 million, for the years ended December 31, 2020, 2019, and 2018, 2017, and 2016, respectively. ActivityOn December 7, 2020, the Company entered into an agreement with a non-employee director related to non-employee awards was not material to the yearsextension of the exercise period, resulting in $0.5 million of stock-based compensation expense recorded in selling, general and administrative expense during the year ended December 31, 2018, 2017, and 2016.2020. At December 31, 2018,2020, there was $6.8$9.3 million of total unrecognized compensation cost related to unvested stock options, which is expected to be recognized over the remaining weighted-average vesting period of 2.237.3 years. Restricted Stock Awardsstock awards In December 2014, the Company issued 78,912 shares of restricted common stock to a director of the Company under the 2007 Plan. Under the terms of the agreement, shares of common stock issued are subject to a four year vesting schedule. Vesting occurs periodically at specified time intervals and specified percentages. In January 2015, the Company issued 781,060 shares of restricted common stock to an executive of the Company under the 2007 Plan. The majority of these shares were issued subject to a four year vesting schedule with 25% vesting on the first anniversary and the remaining vesting 75% ratably on a monthly basis over the remaining three years, while another portion was issued subject to performance based vesting. The vesting of performance based awards is dependent upon achievement of specified financial targets of the Company. The majority of the performance criteria were achieved during the years ended December 31, 2016 and 2015 and the remaining unvested awards with
Table of Contents
Quanterix Corporation
Notes to Consolidated Financial Statements (Continued)
8. Common Stock, warrants, stock-based compensation, stock options, restricted stock and restricted stock units (Continued)
performance conditions are not material. NoNaN restricted stock awards were granted during the years ended December 31, 20182020, 2019, or 2017. A summary2018. As of December 31, 2020, the Company had 39,806 shares of unvested restricted common stock activity is as follows:with a weighted average grant date fair value of $3.12 per share. | | | | | | | |
| | Shares | | Weighted-average
grant date
fair value
per share | |
|---|
Unvested restricted common stock as of December 31, 2015 | | | 623,869 | | | 3.12 | | Vested | | | (247,621 | ) | | 3.09 | | | | | | | | | | | Unvested restricted common stock as of December 31, 2016 | | | 376,248 | | | 3.12 | | Vested | | | (199,056 | ) | | 3.12 | | | | | | | | | | | Unvested restricted common stock as of December 31, 2017 | | | 177,192 | | | 3.11 | | Vested | | | (137,386 | ) | | 3.11 | | | | | | | | | | | Unvested restricted common stock as of December 31, 2018 | | | 39,806 | | | 3.12 | |
The expense related to restricted stock awards granted to employees and directorsnon-employees was $0.4$0.0 million, $0.6$0.0 million, and $0.7$0.4 million for the years ended December 31, 2018, 2017,2020, 2019, and 2016,2018, respectively. At December 31, 2018,2020, there was $0 million of total0 unrecognized compensation cost related to unvested restricted stock, which is expected to be recognized over the remaining weighted-average vesting period of 0 years.stock. The aggregate fair value of restricted stock awards that vested during the years ended December 31, 2018, 2017,2020, 2019, and 2016,2018, based on estimated fair values of the stock underlying the restricted stock awards on the day of vesting, was $2.4$0.0 million, $1.9$0.0 million and $1.1$2.4 million, respectively. Restricted stock units Restricted stock units (RSUs) represent the right to receive shares of common stock upon meeting specified vesting requirements. In the fiscal year ended December 31, 2018,2020, the Company issued 422,027 restricted stock units334,665 RSUs to employees of the Company under the 2017 Plan. Under the terms of the agreements, 84,637268,694 of the restricted stock unitsRSUs issued are subject to a four year vesting schedule with 25% vesting on the first anniversary and the remaining vesting 75% ratably on a monthly basis over the remaining three years, 18,20015,890 of the restricted stock units issued are subject to vesting with 50% vestingRSUs vested on December 31, 2018 and 50% vesting on December 31, 2019, 3,3002020, 40,045 of the restricted stock units are subject to a four year vesting schedule with 25% vestingRSUs vest equally over three years on eachthe anniversary 15,890 of the restricted stock unitsvesting start date, 8,576 vested immediately upon grant, and 1,460 RSUs vest on DecemberMay 31, 2018, 50,000 of the restricted stock units vested on
Table of Contents
Quanterix Corporation
Notes to Consolidated Financial Statements (Continued)
8. Common Stock, warrants, stock-based compensation, stock options, restricted stock and restricted stock units (Continued)
August 31, 2018, and 250,000 of the restricted stock units vest evenly over 40 months on the last day of each month starting September 30, 2018.2021. A summary of restricted stock unitRSU activity is as follows:
| | | | | | | |
| | Shares | | Weighted-average
grant date
fair value
per share | |
|---|
Unvested restricted stock units as of December 31, 2017 | | | — | | | | | Granted | | | 422,027 | | $ | 15.65 | | Vested | | | (99,990 | ) | $ | 15.02 | | Cancelled or Forfeited | | | (375 | ) | $ | 18.40 | | | | | | | | | | | Unvested restricted stock units as of December 31, 2018 | | | 321,662 | | $ | 15.84 | | | | | | | | | | |
| | | | | | | | | | Weighted-average | | | | | grant date | | | | | fair value | | | Shares | | per share | Unvested RSUs as of December 31, 2019 | | 370,123 | | $ | 20.48 | Granted | | 334,665 | | $ | 31.99 | Vested | | (182,036) | | $ | 20.13 | Cancelled | | (44,171) | | $ | 26.79 | Unvested RSUs as of December 31, 2020 | | 478,581 | | $ | 28.08 |
The expense related to RSU awards granted to employees and non-employee directors was $1.7$4.2 million for the fiscal year ended December 31, 2018.2020. At December 31, 2018,2020, there was $4.9$12.0 million of total unrecognized compensation cost related to unvested restricted stock, which is expected to be recognized over the remaining weighted-average vesting period of 0.62.8 years. 8. Leases The Company is a lessee under leases of offices, lab spaces, and certain office equipment. Some of the Company’s leases include options to extend the lease, and these options are included in the lease term to the extent they are reasonably certain to be exercised. 900 Middlesex Turnpike Lease The Company’s primary lease is the 900 Middlesex Turnpike Lease. On October 2, 2018, the Company entered into a 137-month operating lease for the Company’s new headquarters in Billerica, Massachusetts. The lease is for approximately 92,000 square feet of office and laboratory space and commenced on April 1, 2019. The lease contains a period of free rent and escalating monthly rent payments. As part of the lease, the Company was required to enter into a $1.0 million Letter of Credit drawable by the lessor under specifically outlined conditions, which will be subsequently reduced throughout the lease term. Pursuant to a work letter entered into in connection with the 900 Middlesex Turnpike Lease, the landlord contributed an aggregate of $8.2 million toward the cost of construction and tenant improvements for the building. Under the lease, the Company has the option to extend the lease for 2 successive five-year terms, and the renewal options are not reasonably certain to be exercised. In applying the ASC 842 transition guidance, the 900 Middlesex Turnpike Lease remained classified as an operating lease and the Company recorded ROU assets of $12.2 million and lease liability of $22.7 million on the effective date. The difference between the ROU and the lease liability was driven by the Company derecognizing deferred rent of $3.0 million and the lease obligation incentive of $7.6 million. The Company is recognizing rent expense on a straight-line basis throughout the remaining term of the leases. 48 Tvistevägen The Company has multiple leases at 48 Tvistevägen Umeå, Sweden for laboratory spaces, manufacturing spaces, and office space (the Uman leases). All of these Uman leases have been assessed as operating leases. In applying the ASC 842 transition guidance, the Uman leases remained classified as operating leases and the Company recorded ROU assets of less than $0.1 million and lease liability of less than $0.1 million on the effective date. The Company is recognizing rent expense on a straight-line basis throughout the remaining term of the leases. Summary of all lease costs recognized under ASC 842 The following table contains a summary of the lease costs recognized under ASC 842 and other information pertaining to the Company’s operating leases for the year ended December 31, 2020: | | | | | Operating leases (in thousands) | | | For the year ended December 31, 2020 | Lease Costs (1) | | | | | Operating lease costs | | | $ | 2,663 | Total lease cost | | | $ | 2,663 | | | | | | Other information | | | | | Operating cash flows used for operating leases | | | $ | 2,108 | Weighted average remaining lease term (years) | | | | 9.8 | Weighted average discount rate | | | | 9.73% |
(1) Short-term lease costs and variable lease costs incurred by the Company for the year ended December 31, 2020 were considered immaterial. Rent expense is calculated on a straight-line basis over the term of the lease. Rent expense recognized under all leases was $4.8 million, $3.3 million, and $1.6 million for the years ended December 31, 2020, 2019, and 2018, respectively. Note that the Company adopted ASC 842 effective January 1, 2020 using the required modified retrospective approach and utilizing the effective date as its date of initial application. Therefore, amounts disclosed pertaining to the years ended December 31, 2019 and 2018 are presented under previous accounting guidance and are therefore not comparable to the amounts recorded in the current period under ASC 842. As of December 31, 2020, future minimum commitments under ASC 842 under the Company’s operating leases were as follows: | | | | Maturity of lease liabilities (in thousands) | | As of December 31, 2020 | 2021 | | $ | 3,388 | 2022 | | | 3,466 | 2023 | | | 3,515 | 2024 | | | 3,577 | 2025 and thereafter | | | 22,203 | Total lease payments | | $ | 36,149 | Less: imputed interest | | | 13,024 | Total operating lease liabilities | | $ | 23,125 |
9. Commitments and contingencies License agreements Tufts University In June 2007, the Company entered into a license agreement (the License Agreement) for certain intellectual property with Tufts University (Tufts). Tufts is a related party to the Company due to Tuft'sTuft’s equity ownership in the Company and because a board member of the Company'sCompany’s Board of Directors was affiliated with Tufts. The License Agreement, which was subsequently amended, is exclusive and sub licensable, and will continue in effect on a country by country basis as long as there is a valid claim of a licensed patent in a country. The Company is committed to pay license and maintenance fees, prior to commercialization, in addition to low single digit royalties on direct sales and services and a royalty on sublicense income. During the year ended December 31, 2016, the Company executed a license agreement with a diagnostic company and also amended the bioMérieux agreement (Note 11). During the years ended December 31, 2018, 20172020, 2019, and 2016,2018, the Company recorded royalty expense of $0.7$1.1 million, $0.5$1.0 million and $0.3$0.7 million, respectively, in cost of product revenue on the consolidated statements of operationsoperations. During the year ended December 31, 2020, the Company incurred $1.0 million in cost of collaboration and comprehensive loss.license revenue owed to Tufts related to sublicensing certain technology and intellectual property to Abbott Laboratories (Abbott) (see Note 13). Other licenses During the year ended December 31, 2012, the Company entered into a license agreement for certain intellectual property with a third party. The non-exclusive, non-sublicenseable third party'sparty’s license provides the Company access to certain patents specifically for protein detection, and shall be in effect until the expiration of the last licensed patent. In consideration for these rights, the Company committed to certain license fees, milestone payments, minimum annual royalties and a mid-single digit royalty. The Company is required to make mid-single digit royalty payments on net sales of products
Table of Contents
Quanterix Corporation
Notes to Consolidated Financial Statements (Continued)
9. Commitments and contingencies (Continued)
and services which utilize the licensed technology. The Company must pay the greater of calculated royalties on net sales or an annual minimum royalty of $50 thousand. DuringIn September 2019, all remaining patents related to the intellectual property expired and the license agreement terminated. As this agreement was terminated in 2019, the Company recorded 0 royalty expense during the year ended December 31, 2018, 20172020. During theyear ended December31, 2019 and 2016,2018, the Company recorded royalty expense of $0.4 million, $0.2 $0.8million, and $0.2 $0.4million, respectively, in cost of product revenue on the consolidated statements of operations. Lease commitments
During the year ended December 31, 2014, the Company entered into a lease agreement for the Company's current corporate headquarters with a lease term that expires in June 2020; however, in November 2018, the Company agreed to terminate the lease with the lessor effective May 2019. The termination of the lease was connected to the Company signing a new lease in Billerica, MA. On October 2, 2018, the Company entered into a 137 month operating lease for the Company's new headquarters in Billerica, MA. The lease is for approximately 92,000 square feet of office and laboratory space, and will commence on or about April 1, 2019. The lease contains a period of free rent and escalating monthly rent payments. As part of the lease, the Company was required to enter into a $1.0 million Letter of Credit drawable by the lessor under specifically outlined conditions. The amount of the Letter of Credit will be reduced at 41 and 65 months after the commencement date of the lease to $750,000 and then $250,000, respectively. The $1 million Letter of Credit is recorded as restricted cash on the balance sheet.
In connection with the acquisition of Aushon in January 2018, the Company assumed the existing Aushon lease for facilities in Billerica, Massachusetts. In August 2018 the Company terminated the Aushon lease effective September 1, 2019. The Company is required to pay a termination fee no later than July 1, 2019 in consideration for the early termination.
Rent expense is recognized straight-line over the course of the lease term. As of December 31, 2018, $0.3 million of deferred rent expense was recorded in other non-current liabilities, and less than $0.1 million was recorded in other accrued expenses. The table below includes committed lease expenditures related to the new lease.
As of December 31, 2018, the minimum future rent payments under the lease agreements are as follows (in thousands):
| | | | | Years ending December 31: | | | | | 2019 | | $ | 1,172 | | 2020 | | | 2,013 | | 2021 | | | 3,290 | | 2022 | | | 3,372 | | 2023 and Forward | | | 29,207 | | | | | | | | | | $ | 39,054 | | | | | | | |
The Company recorded $1.6 million, $1.1 million and $1.1 million in rent expense for the years ended December 31, 2018, 2017 and 2016, respectively.
Table of Contents
Quanterix Corporation
Notes to Consolidated Financial Statements (Continued)
9. Commitments and contingencies (Continued)
Development and supply agreement Through the Company'sCompany’s development agreement with STRATEC Biomedical, as amended in December 2016, the parties agreed on additional development services for an additional fee, which is payable when the additional development is completed. A total of $1.5$11.7 million is payable to STRATEC Biomedical upon completion of the development activities. This amount is being recorded to research and development expense and accrued expenses as the services are performed. The services were completed during the year endingended December 31, 2018. Substantive efforts related to these additional development activities started in the first quarter of 2017.2019 and were completed in the third quarter of 2019. The Company'sCompany’s supply agreement with STRATEC Biomedical requiresrequired the Company to purchase a minimum number of commercial units over a seven-year period ending in May 2021. If the Company were to fail to purchase a required number of commercial units, the Company would be obligated to pay termination costs plus a fee based on the shortfall of commercial units purchased compared to the required minimum amount. Based on the number of commercial instruments purchased as of December 31, 2018, assuming no additional commercial units were purchased, this fee would equal $11.1 million. The amount2020 the Company could be obligated to pay under thehas satisfied its required minimum purchase commitment is reduced as each commercial unit is purchased.amount per the supply agreement. Also, if the Company terminates the Supply Agreementsupply agreement under certain circumstances and has not purchased a required number of commercial units, it would be obligated to issue warrants to purchase 93,341 shares of common stock (the Supply Warrants) at $0.003214 per share. The Company believes that it will purchase sufficient units to meet the requirements of the minimum purchase commitment and, therefore, has not accrued for any of the potential cash consideration. The Supply Warrants are accounted for at fair value; however, the fair value of the Supply Warrants as of December 31, 20182020 and December 31, 20172019 was insignificant as there was a low probability of the warrants being issued. Legal contingencies The Company is subject to claims in the ordinary course of business; however, the Company is not currently a party to any pending or threatened litigation, the outcome of which would be expected to have a material adverse effect on its financial condition or the results of its operations. The Company accrues for contingent liabilities to the extent that the liability is probable and estimable. 10. Long Term DebtNotes payable Loan agreement On April 14, 2014, the Company executed a Loan Agreement with a lender, as subsequently amended, most recently in March 2015, January 2016, March 2017, August 2018, and October 2018.April 2019. As of December 31, 2018,2020 and 2019, there were no0 additional amounts available to borrow under the debt facility. The interest rate on this term loan is variable based on a calculation of the prime rate less 5.25% with a minimum interest rate of 8%. Interest is paid monthly beginning the month following the borrowing date. At loan inception and in connection with the amendments, the Company issued the lender warrants to purchase shares of stock. The Loan Agreement also contains prepayment penalties and an end of term charge. Fees incurred inupon execution of the agreements, and the fair value of warrants on the date of grant were accounted for as a reduction in the book value of debt and accreted through interest expense, using the effective interest rate method, over the term of the debt.
Table of Contents
Quanterix Corporation
Notes to Consolidated Financial Statements (Continued)
10. Long Term Debt (Continued)
In connection with the Loan Agreement, the Company granted the lender warrants to purchase shares of either Series C Preferred Stock or shares of preferred stock in the next financing round. Following the completion of the IPO, these warrants became exercisable for shares of the Company's common stock. Therefore, additional warrants will be issued if the Company draws on any of the remaining debt facility. The warrants issued in connection with the initial borrowing were initially recorded at fair value of $0.1 million as a preferred stock warrant liability in the accompanying consolidated balance sheets and a corresponding debt discount was recorded. The Company has not further drawn on the remaining debt facility.
The Company also incurred debt issuance costs of $0.1 million. As a result of the debt discounts recorded related to the warrants and the debt issuance costs, the debt was initially recorded at less than its face value. The debt, including the end of term charge, is being accreted over the life of the loan using the effective interest method.
The Loan Agreement also provided the lender with a right to invest up to $1.0 million or, subject to Company approval and consent, to convert up to $1.0 million of outstanding principal into shares of preferred stock in the next financing round at the same price as all other investors. The lender invested $1.0 million in March 2016 as part of the Series D Preferred Stock financing.
Amendment 1 to loan agreement
On March 4, 2015, the Company executed Amendment 1 to the Loan Agreement (Amendment 1) and borrowed the remaining $5.0 million that was available under the loan facility. The terms of Amendment 1 allowed the Company to defer the commencement of principal payments to December 1, 2015 and extended the loan maturity date to February 1, 2018. If the Company obtained at least $10.0 million in equity financing before December 1, 2015, the commencement of principal payments could be further deferred until March 1, 2016 and the loan maturity date could be extended to May 1, 2018. As the financing milestone was not achieved, the Company made the first principal payment of $0.3 million on December 1, 2015 and the loan maturity date was February 1, 2018 under Amendment 1.
The additional $5.0 million borrowed included an additional $0.2 million end of term charge. The end of term charge on this borrowing is being accreted over the life of the loan as additional interest expense. The additional borrowing also resulted in the issuance of additional warrants with a grant date fair value of $0.1 million. The fair value of the additional warrants were initially recorded at fair value as a preferred stock warrant liability in the accompanying consolidated balance sheets and a corresponding debt discount was recorded. The debt, including the end of term charge, is being accreted over the remaining life of the loan using the effective interest method.
Amendment 2 to loan agreement
In January 2016, the Company executed Amendment 2 to the Loan Agreement (Amendment 2). Amendment 2 increased the total facility available by $5.0 million to a total of $15.0 million and further delayed the commencement of principal payments to July 1, 2016. Under Amendment 2, following the Series D Preferred Stock financing (Note 8), the Company could have elected to further delay the commencement of principal payments until January 1, 2017, however the Company voluntarily began paying principal on July 1, 2016. Upon signing Amendment 2, the Company drew an additional $3.0 million under the debt facility. The remaining $2.0 million available under the facility
Table of Contents
Quanterix Corporation
Notes to Consolidated Financial Statements (Continued)
10. Long Term Debt (Continued)
expired unexercised in April 2016, which reduced the amounts available under the facility to $13.0 million.
The additional $3.0 million borrowed included an additional $0.1 million end of term charge. The end of term charge on this borrowing is being accreted over the life of the loan. The additional borrowing also resulted in the issuance of additional warrants with a grant date fair value of $0.1 million. The fair value of the additional warrants were initially recorded at fair value as a preferred stock warrant liability in the accompanying consolidated balance sheets and a corresponding debt discount was recorded. The debt, including the end of term charge, is being accreted to over the remaining life of the loan using the effective interest method.
Amendment 3 to loan agreement
In March 2017, the Company signed Amendment 3 to the Loan Agreement (Amendment 3). Amendment 3 increased the total facility available by $5.0 million to a total of $18.0 million. Additionally, the lender may provide an additional optional term loan, solely at the lender's discretion, for an incremental $5.0 million, increasing the total potential facility to $23.0 million. As of December 31, 2017, the Company has not drawn any of this additional facility. The terms of Amendment 3 allowed the Company to defer the commencement of principal payments to March 1, 2018 and extended the loan maturity date to March 1, 2019. Amendment 3 did not change the due date of the existing end of term fees of $0.05 million which remained due on February 1, 2018. Upon signing Amendment 3, the Company did not draw any of the additional amounts available under the amended debt facility and no amounts have been subsequently drawn under the facility. The Company has until September 3, 2018 to draw the additional amounts.
Amendment 4 to loan agreement
In July 2017, the Company signed Amendment 4 to the Loan Agreement (Amendment 4). Amendment 4 instituted a cap of 10% with respects to the "Term Loan Interest Rate".
Amendment 5 to loan agreement In August 2018, the Company signed Amendment 5 to the Loan Agreement (Amendment 5). Amendment 5 instituted a 2018 End of Term Charge of $0.08 million. Additionally, the Term Loan Maturity Date was amended to be extended until March 1, 2020. Amendment 5 additionally, changed the due date of the End of Term Charge to, the earlier of (i) the Term Loan Maturity Date, (ii) the date that Borrower prepays the outstanding Secured Obligations or (iii) the date that the Secured Obligations become due and payable. The Company incurred a cost of $0.05 million in relation to the execution of Amendment 5. In connection with the extension of the due date of the Loan, the deferral of principal payments (Amendment 3) was further deferred until the new Term Loan Maturity Date. On March 2, 2020, the Company paid $0.1 million in end of term fees related to Amendment 5 of the loan agreement. Amendment 6 to loan agreement In October 2018, wethe Company signed Amendment 6 to the Loan agreement, which amendsamended the Loan Agreement'sAgreement’s collateral clause to exclude the $1$1.0 million certificate of deposit associated with the lease on ourthe Company’s new headquarters in Billerica, MA. Amendment 7 to loan agreement
Quanterix Corporation
NotesOn April 15, 2019, the Company signed Amendment 7 to Consolidated Financial Statements (Continued)
10. Long Term Debt (Continued)
the loan agreement, which extends the interest only payment period through July 1, 2021 and also extends the maturity date until October 1, 2021. As part of this Amendment 7, a “2019 End of term charges relatedTerm Charge” for $50,000 was added to the facilityloan agreement due on the earliest to occur of $0.5 million,(i) the term loan maturity date, (ii) the date that the Company prepays the outstanding secured obligations and (iii) the date that the secured obligations become due and payable. In addition, the Company is required to pay the loan principal payments of $1.4 million were paid duringin 4 equal installments starting July 1, 2021 with the fiscal year ended December 31, 2018. Under the terms of the August 2018 amended agreement,final principal payments were delayed until March 2020. The Company accounted for the August 2018 amendment as a modification as it was determined that no material change occurred as a result of the modification. The Company voluntarilypayment to be made principal payments in the months of March, April, and May, 2018. No principal payments were made in June, July or August, 2018. Under the amended Loan Agreement, the remaining outstanding principal will be paid upon maturity of the note in March 2020. on October 1, 2021. As of December 31, 2018, the remaining loan balance is classified as a long term liability since all principal payments are due greater than twelve months after the balance sheet date. Debt2020, debt payment obligations due based on principal payments are as follows (in thousands):
| | | | | Years ending December 31: | | | | | 2019 | | $ | 0 | | 2020 | | | 7,763 | | | | | | | | | | $ | 7,763 | | | | | | | |
The balance sheet contains $0.1 million of unamortized debt issuance costs which nets the Long Term Debt balance to $7.6 million.
Non-cash interest expense related to debt discount amortization and accretion of end of term fees was $0.2$0.1 million, $ 0.2$0.1 million, and $0.4$0.2 million for the year ended December 31, 2018, 2017,2020, 2019, and 2016,2018, respectively. The Company assessed all terms and features of the Loan Agreement and the subsequent amendments in order to identify any potential embedded features that would require bifurcation. As part of this analysis, the Company assessed the economic characteristics and risks of the debt. The Company determined that all features of the Loan Agreement and the subsequent amendments are either clearly and closely associated with a debt host or have a de minimis fair value and, as such, do not require separate accounting as a derivative liability. The Company assessed each amendment under ASC 470-50 Debt – Modifications and Extinguishmentsand concluded that all of the amendments constituted modifications. In this analysis, consideration was given to the fact that Amendments 4, 5, and 6 were executed within one year of each other. The Company also assessed whether the amendments represented a troubled debt restructuring and concluded they did not. The Company accounted for each of the amendments to the Loan Agreement as a modification of its debt and the unamortized discount and issuance costs related to the prior debt are amortized over the modified term of the new debt. The Loan Agreement and the subsequent amendments contain negative covenants restricting the Company'sCompany’s activities, including limitations on dispositions, mergers or acquisitions, incurring indebtedness or liens, paying dividends or making investments and certain other business transactions. There are no financial covenants associated with the Loan Agreement and the subsequent amendments. The obligations under the Loan Agreement and subsequent amendments are subject to acceleration upon the occurrence of specified events of default, including a material adverse change in the Company'sCompany’s business, operations or financial or other condition. The Company has determined that the risk of subjective acceleration under the material adverse events clause is not probable and therefore has classified the outstanding principal in current and long-term liabilities based on scheduled principal payments.
Table of Contents11. “At-the-market offering”
Quanterix Corporation
Notes to Consolidated Financial Statements (Continued)
11. Collaboration and license arrangements
In November 2012,On March 19, 2019, the Company entered into the JDLASales Agreement with bioMérieux, a related party. As discussed below,Cowen with respect to an “at-the-market” offering program under which the JDLA has been subsequently amended. UnderCompany could offer and sell, from time to time at its sole discretion, shares of its common stock, having an aggregate offering price of up to $50.0 million through Cowen as its sales agent.
On June 5, 2019, the Company issued approximately 2.2 million shares of common stock at an average stock price of $22.73 per share pursuant to the terms of the JDLA,Sales Agreement. The “at-the-market” offering resulted in gross proceeds of $49.7 million. The Company incurred $1.7 million in issuance costs associated with the “at-the-market” offering, resulting in net proceeds to the Company granted bioMérieux an exclusive, royalty-bearing license, without right to sublicense, to manufacture and sell instruments and assays using our Simoa technology exclusively for in vitro diagnoses used in clinical lab applications, food quality control testing, and pharma quality control testing, and co-exclusively in certain related fields, as defined in the contract. As part of the JDLA,$48.0 million. On August 6, 2020, the Company was alsodelivered written notice to develop and manufacture instrumentsCowen to bioMérieux's specifications for bioMérieux's use or for sale by bioMérieux. The Company retained rights to sellterminate the instrument inSales Agreement, which termination the co-exclusive fields and any other fields not licensed exclusively to bioMérieux. bioMérieux was to develop and sell diagnostic assays to be used in conjunction with the Company's instruments. Upon execution of the JDLA, the Company received $10.0 million in consideration and was entitled to receive two additional payments of $5.0 million each upon the achievement of certain developmental criteria. Neither of these criteria have been achieved. The Company was also entitled to receive royalty payments on the sale of assays and payments for the manufacture and delivery of instruments based on a contractual rate subject to future adjustments.
At the inception of the JDLA, the Company determined that the deliverables were as follows: (1) licenses to the Company's technology and trademarks, training, completion and delivery of a prototype instrument per contractual specifications (License and Prototype), (2) various activities to assist bioMérieux in the development of the initial assay and an instrument that is IVD compliant (Initial Assay Assistance), (3) various activities to assist bioMérieux in the development of a benchtop instrument (Benchtop Assistance), and (4) joint steering committee participation (JSC). Each of these deliverables were considered separate units of accounting, and the License and Prototype unit of accounting was determined to have standalone value as the License and Prototype unit of accounting could be utilized by bioMérieux without the related services included in the other units of accounting.
The Company allocated the allocable arrangement consideration based on the relative selling price of each unit of accounting. For all units of accounting, the Company determined the selling price using the best estimate of selling price (BESP). Management's best estimate of the selling price of the License and Prototype unit of accounting was based on a discounted cash flow analysis to support the estimated selling price of the license. The Company determined the BESP of the other units of accounting based on internal estimates of the costs to perform the services, adjusted to reflect a reasonable profit margin as well as based on market prices for similar instruments and services.
Revenue related to the License and Prototype unit of accounting of $8.3 million was recognized in 2013 upon delivery of both the license which was delivered at inception, and the first prototype instrument, which was required for bioMérieuxparties agreed to make use of the license. Prior to the effect of the 2016 Amendment described below, revenue for the other units of accounting were recognized over an estimated period of performance.immediately effective.
Amendments to the JDLA12. Underwritten public offerings
In May 2014 and January 2015, the parties executed a First and Second Amendment to the JLDA, respectively. These amendments addressed revised timelines related to completing the development activities under the JDLA and enacted additional governance protocols to monitor those activities.
Table of Contents
Quanterix Corporation
Notes to Consolidated Financial Statements (Continued)
11. Collaboration and license arrangements (Continued)
These amendments did not change the deliverables under the JDLA or the total arrangement consideration. The Company revised its estimates of the remaining period of performance for the remaining undelivered units of accounting and these revisions did not have a material effect on revenue recognition.
On December 22, 2016,August 8, 2019, the Company entered into the 2016 Amendment which ended the ongoing joint development efforts between the parties,an underwriting agreement with J.P. Morgan Securities LLC and modified the rights and obligations of both parties accordingly,SVB Leerink LLC, as follows: •For a period of not more than three years from the daterepresentatives of the 2016 Amendment bioMérieux has the abilityseveral underwriters, relating to evaluate independently whether it will develop a new, smaller in vitro diagnostic instrument using the Simoa technology for use in clinical lab applications, food quality control testing, and pharmaceutical quality control testing benchtop (the "Feasibility Period") and has the sole right to determine whether or not to develop such a new instrument during the Feasibility Period. If bioMérieux does elect to pursue developmentan underwritten public offering of such a new instrument, they will have a set number
approximately 2.7 million shares of the Company's Level 1 Data Reduction (L1DR) software.Company’s common stock, par value $0.001 per share. The L1DR software the Company's proprietary image processing algorithms that convert imagesunderwritten public offering resulted in gross proceeds of microscopic beads associated with biomarker molecules$69.0 million. The Company incurred $4.5 million in microwells. Also, the Company must provide to bioMérieux access to any know how and intellectual propertyissuance costs associated with the L1DR software, including any updates and upgradesunderwritten public offering, resulting in net proceeds to the L1DR software duringCompany of $64.5 million. On August 6, 2020, the Feasibility Period. If bioMéreiux exercises its rightCompany entered into an underwriting agreement with Leerink and Cowen, as representatives of the several underwriters, relating to develop an instrument independently, this right will continue throughoutunderwritten public offering of approximately 3.0 million shares of the development periodCompany’s common stock, par value $0.001 per share. The underwritten public offering resulted in gross proceeds of $97.6 million. The Company incurred $6.2 million in issuance costs associated with the underwritten public offering, resulting in net proceeds to the endCompany of $91.4 million. 13. Collaboration and license arrangements The Company has entered into certain licenses with other companies for use of the term of the agreement related to independently developed instruments.
•It was clarified that the Company can engage a collaboration partner (IVD Partner), subject to restrictions as to the particular parties withCompany’s technology. These licenses have royalty components which the Company could elect to partnerearns and the assays that can be developed, in the field of in vitro diagnostics used in Clinical Lab Applications. The Company shall pay bioMérieux a mid-double-digit percentage of royalties received from the IVD Partner based on assays sales by the IVD Partner.
•bioMérieux's licenses include all patentsrecognizes as collaboration and know-how owned or controlled by the Company related to the Company's Simoa technology and upgrades thereto that are necessary for the development, manufacture, use or sale of instruments and assays or consumables on such instruments over the Feasibility Period. If bioMérieux exercises its right to develop an instrument independently, this right will continuelicense revenue throughout the development period to the end of the term of the 2016 Amendment related to independently developed instruments.
•bioMérieux retains an option (the Option) to obtain worldwide distribution rights to the HD-1 floor standing instrument in the applicable fields. The Option is exercisable over a three year period and upon exercise, the Company and bioMérieux are required to negotiate, in good faith, a distribution agreement that would include a specified upfront payment. The 2016 Amendment included a cash payment of $2.0 million from bioMérieux which was paid in January 2017.
Table of Contents
Quanterix Corporation
Notes to Consolidated Financial Statements (Continued)
11. Collaboration and license arrangements (Continued)
On September 6, 2018, bioMérieux notified the Company that it was terminating the Amended JDLA, forfeiting any future IVD licensing rights to the Company's Simoa technology and enabling the Company to consolidate and regain control of all Simoa IVD licensing and IP rights.
Accounting assessment
Prior to the execution of the 2016 Amendment, the Company was recognizing revenue over the estimated period of performance of the ongoing units of accounting (Initial Assay Assistance, Benchtop Assistance, and JSC). As a result, the Company recognized $0.2 million and $0.2 million in revenue for the years ended December 31, 2015 and 2016, respectively. At the date of the execution of the 2016 Amendment, the Company had $1.2 million in deferred revenue related to the JDLA. Upon the execution of the 2016 Amendment, all undelivered elements and contingent consideration of the JDLA were cancelled. The Company determined the 2016 Amendment should be accounted for as a modification to the JDLA and the balance of deferred revenue prior to the 2016 Amendment should be included as allocable consideration under the 2016 Amendment resulting in total allocable consideration of $3.2 million. The Company recorded an increase to deferred revenue upon receipt of the $2.0 million during the three months ended March 31, 2017.
The Company has determined that the deliverables included under the 2016 Amendment are rights to the L1DR software, training and rights to future technology improvements for L1DR Software, rights to all future technological improvements related to the Simoa technology, and participation on joint committees.
The Company determined that the L1DR and rights to unspecified technology improvements (the "L1DR Unit of Accounting") includes the sale of software and software related elements and therefore should be accounted for under ASC 985-605—Software Revenue Recognition. The Company cannot demonstrate Vendor Specific Objective Evidence (VSOE) of fair value for the ongoing obligation to provide unspecified technology improvements. Therefore, the deliverables in the L1DR Unit of Accounting cannot be separated. The Company has applied the combined service approach and the consideration allocated to this unit of accounting is being recognized ratably over the estimated period of performance, which has initially been determined to be estimated to be the three year Feasibility Period. This will be reevaluated each period to determine if there are any changes to the estimated period of performance.
The Company concluded that the rights to future technology improvements for the Simoa technology and the participation on joint committees represented a second unit of accounting (the "Instrument Know How Unit of Accounting"). The deliverables in the Instrument Know How Unit of Accounting are considered non-software deliverables that are subject to ASC 605-25 and will be delivered over time on a when and if available basis. Revenue is being recognized on a straight line basis over the estimated period of performance, which has initially been determined to be the three year Feasibility Period. This period will be reevaluated each period to determine if there are any changes to the period of performance.
The Option is considered substantive as the Company is at risk with regard to whether bioMérieux will exercise the Option. In addition, the Option exercise payment payable by bioMérieux upon exercise is not priced at a significant and incremental discount. Accordingly, the Option is not considered a deliverable at the inception of the arrangement and the associated Option exercise payment is not included in allocable arrangement consideration.
Table of Contents
Quanterix Corporation
Notes to Consolidated Financial Statements (Continued)
11. Collaboration and license arrangements (Continued)
Under the 2016 Agreement the Company is eligible to receive royalties on net sales of assays sold by bioMérieux in the mid to high single digits, and to receive low double digit royalties on sales of instruments by bioMérieux based on manufactured cost. No royalties have been recognized through December 31, 2018.
Upon termination of the agreement, the Company no longer held an obligation to bioMérieux related to the initial agreement or the amendment to the agreement. As such, the Company immediately recognized all remaining deferred revenue related to the agreements as of the date of termination.
year. The Company recognized revenue of $2.1 million and $1.1less than $0.1 million for the years ended December 31, 20182020 and 2017,2019 associated with these licenses. During the year ended December 31, 2020, the Company recognized $1.2 million of previously deferred revenue as a result of entering into a license agreement with a diagnostics company. As of December 31, 2020 and 2019, the Company had $0.5 million and $1.7 million, respectively, as collaboration revenue.of deferred revenue related to ongoing negotiations with a diagnostics company. Evaluation and option agreements and license agreement
In 2015,Abbott Laboratories
On September 29, 2020, the Company entered into three agreements, for three separate fields,a Non-Exclusive License Agreement (the Abbott License Agreement) with a diagnostic company forAbbott. Pursuant to the evaluationterms of the Company's Simoa technology. These agreements each allowed for the option to negotiate a license agreement. In return,Abbott License Agreement, the Company received non-refundable payments totaling $2.0 million. In December 2016,granted Abbott a non-exclusive, worldwide, royalty-bearing license, without the diagnostic company exercised oneright to sublicense, under the Company’s bead-based single molecule detection patents (Licensed Patents) in the field of its options andin vitro diagnostics. Abbott has paid the parties entered into a license agreement in one of the fields. This agreement has a one-time non-refundableCompany an initial license fee of $1.0 million and the right to receive running low single digit royalties on licensed products. The negotiation periods for the other two agreements were extended and the negotiations remain ongoing. For each of the three fields, the right to evaluate the technology, the right to negotiate a license to the technology, and the undelivered license to the technology represents a combined unit of accounting, and the licenses to each of the three fields each have standalone value. The Company has allocated the allocable arrangement consideration based on the relative selling price of each unit of accounting. The BESP of each of the three options was determined to be representative of the contractual amount paid for each option. The Company defers the amounts allocated to each of the three options until the corresponding license is delivered or, if no license agreement is executed and delivered, when the negotiations for each option terminates.
Upon execution of the license in one of the fields in December 2016, the $1.0 million license fee, in addition to the $0.8 million allocated to the option for this field, resulted in a total of $1.8 million of consideration being recognized as revenue as there were no remaining undelivered performance obligations. Because the negotiations remain ongoing with respect to the other two fields, the consideration allocated to these options of $1.2 million has been deferred and is recorded as deferred revenue as of December 31, 2017.
In December 2018 the Company entered into an option agreement for the rights to negotiate an exclusive agreement with the diagnostic company. In exchange for the rights to negotiate an exclusive agreement, the Company will receive $0.5$10.0 million in consideration. As the right to negotiateconnection with the Company has not been executed, the consideration from this agreement is deferred until the sooner of the execution of the contractAbbott License Agreement, which was recognized as license revenue for the year ended December 31, 2020. Abbott has also agreed to pay the Company milestone fees subject to the achievement by Abbott of certain development, regulatory and commercialization milestones and low single-digit royalties on net sales of licensed products.
The Abbott License Agreement includes customary representations and warranties, covenants and indemnification obligations for a transaction of this nature. The Abbot License Agreement became effective upon signing and will continue until expiration of the last-to-expire Licensed Patent, or the endagreement is earlier terminated. Under the terms of the option period.Abbott License Agreement, the Company and Abbott each have the right to terminate the agreement for uncured material breach by, or insolvency of, the other party. Abbott may also terminate the Abbott License Agreement at any time without cause upon 60 days’ notice. 12.
During the year ended December 31, 2020, the Company recognized $10.0 million within collaboration and license revenue related to the initial license fee under the Abbott License Agreement. 14. Employee benefit-plansbenefit plans The Company sponsors a 401(k) savings plan for our employeesemployees. The Company may make discretionary contributions for each 401(k) plan year. During the yearyears ended December 31, 2020, 2019, and 2018, the Company made contributions of $0.7 million, $0.5 million, and $0.1 million, and during the year ended December 31, 2017 and 2016 did not make any contribution.respectively.
Quanterix Corporation
Notes to Consolidated Financial Statements (Continued)
13.15. Business combinations
Aushon BioSystems,Inc. On January 30, 2018, the Company completed the acquisition of Aushon pursuant to an Agreement and Plan of Merger dated January 30, 2018 (the "Aushon Acquisition").2018. The Company acquired Aushon to complement its existing product line, improve its existing research and development capabilities in assay development and software engineering, and expand its customer base. The acquisition of Aushon Acquisition has beenwas accounted for as a business combination and the Company has recorded the assets acquired and liabilities assumed at their respective fair values as of the acquisition date. In connection with the closing of the acquisition of Aushon, Acquisition, the Company paid $3.2 million at closing, and an additional $0.8 million in July 2018, the six-month anniversary of the acquisition date. The following table presents the allocation of the purchase consideration for the transactionacquisition accounting as of January 30, 2018 including the allocation of the purchase consideration (in thousands): | | | | | | Fair value of consideration transferred: | | | | | | | Cash | | $ | 3,200 | | | $ | 3,200 | Obligation to issue cash | | 800 | | | | 800 | | | | | | | Total acquisition consideration | | $ | 4,000 | | | $ | 4,000 | | | | | | | | | | | | | | | | | | | | | Fair value of assets acquired and liabilities assumed: | | | | | | | Cash and cash equivalents | | $ | 199 | | | $ | 199 | Accounts receivable | | 210 | | | | 210 | Inventory | | 828 | | | | 828 | Prepaid expenses | | 71 | | | | 71 | Property and equipment and other non-current assets | | 180 | | | | 180 | Intangible Assets | | 2,950 | | | | 2,950 | Goodwill | | 1,308 | | | | 1,308 | | | | | | | Total assets acquired | | 5,746 | | | | 5,746 | Contractual obligations | | (1,155 | ) | | | (1,155) | Accounts payable and accrued liabilities | | (591 | ) | | | (591) | | | | | | | Net assets acquired | | $ | 4,000 | | | $ | 4,000 | | | | | | | | | | | | | | | | | |
The intangible assets identified in the purchase price allocation discussed above include developed technology, tradenames and customer relationships. Tradenames are amortized over the useful life on a straight-line basis, while developed technology and customer relationships are amortized over their respective useful lives on an accelerated basis reflecting the period of expected derived benefits of the underlying assets. Developed technology consists of products that have reached technological feasibility and trade names represent acquired company and product names. To value the developed technology and trade name assets, the Company utilized a relief from royalty method. Under the methodology, fair value is calculated as the discounted cash flow savings accruing to the owner for not having to pay the royalty. Key assumptions included expected revenue attributable to the assets, royalty rates, discount rate and estimated asset lives. Customer relationships represent the underlying relationships with certain customers to provide ongoing services and continued product sale opportunities. The Company utilized excess earnings methodology to derive the fair value of the customer relationships. Key assumptions included expected attrition of customer's rates, operating income margins and discount
Table of Contents
Quanterix Corporation
Notes to Consolidated Financial Statements (Continued)
13. Business combinations (Continued)
rate. The Company used a risk-adjusted discount rate of 14.4% in determining the fair value of the intangible assets. The goodwill recorded as a result of the acquisition of Aushon Acquisition represents the strategic benefits of growing the Company's product portfolio and the expected revenue growth from increased market penetration from future products and customers. The goodwill was recorded as an asset (Note 14). None of the goodwill recorded is tax deductible for income tax purposes. The Company incurred a total of $0.1 million in transaction costs in connection with the transaction, which were included in selling, general and administrative expense within the consolidated statement of operations for the twelve monthsyear ended December 31, 2018. UmanDiagnostics AB On August 1, 2019, the Company completed its acquisition of Uman for an aggregate purchase price of $21.2 million, comprised of (i) $15.7 million in cash plus (ii) 191,152 shares of common stock (representing $5.5 million based on the closing prices of the Company’s common stock on the Nasdaq Global Market on July 1, 2019 and August 1, 2019, the dates of issuance). The acquisition of Uman closed with respect to 95% of the outstanding shares of capital stock of Uman on July 1, 2019 and with respect to the remaining 5% of the outstanding shares of capital stock of Uman on August 1, 2019. Uman supplies Nf-L antibodies and ELISA kits, which are widely recognized by researchers and biopharmaceutical and diagnostics companies world-wide as the premier solution for the detection of Nf-L to advance the development of therapeutics and diagnostics for neurodegenerative conditions. With the acquisition of Uman, the Company has secured a long-term source of supply for a critical technology. This acquisition was considered a business acquisition for accounting purposes. The Company has accounted for the acquisition of Uman as a purchase of a business under U.S. GAAP. Under the acquisition method of accounting, the assets and liabilities of Uman are recorded as of the acquisition date of July 1, 2019, at their respective fair values, and consolidated with those of the Company. Purchase consideration in excess of the amounts recognized for the net assets acquired was recognized as goodwill and is not expected to be tax deductible in any taxing jurisdiction. The following table summarizes the acquisition accounting, net of $1.2 million in cash and cash equivalents acquired (in thousands): | | | | Purchase price: | | | | Cash and stock paid | | $ | 21,217 | Cash and cash equivalents acquired | | | 1,221 | Purchase price, net | | | 19,996 | | | | | Assets (liabilities) acquired: | | | | Accounts receivable | | $ | 638 | Inventory | | | 1,680 | Prepaids and other current assets | | | 114 | Property and equipment | | | 33 | Intangibles | | | 13,450 | Goodwill | | | 8,111 | Accounts payable | | | (20) | Accrued expense and other current liabilities | | | (871) | Deferred tax liabilities | | | (3,139) | Total | | $ | 19,996 |
Revenue and net loss related to Uman’s operations were $1.5 million and $0.1 million, respectively for the year ended December 31, 2020 and is included in the Company’s consolidated statement of operations. Revenue and net income related to Uman’s operations were $1.1 million and less than $0.1 million, respectively, for the six months following the July 1, 2019 acquisition date, and is included in the Company’s consolidated statements of operations for the year ended December 31, 2019. The following unaudited pro forma information presents the condensed consolidated results of operations of the Company and Uman for the years ended December 31, 2020, 2019, and 2018 as if the acquisition of Uman had been completed on January 1, 2018. These pro forma condensed consolidated financial results have been prepared for comparative purposes only and include certain adjustments that reflect pro forma results of operations, such as increased amortization for the fair value of acquired intangible assets, increased cost of sales related to the inventory valuation adjustment, and adjustments relating to the tax effect of combining the Company and Uman businesses. The unaudited pro forma results do not reflect any operating efficiencies or potential cost savings which may result from the consolidation of the operations of the Company and Uman. Accordingly, these unaudited pro forma results are presented for informational purposes only and are not necessarily indicative of the results of operations that actually would have been achieved had the acquisition occurred as of January 1, 2018, nor are they intended to represent or be indicative of future results of operations (in thousands): | | | | | | | | | | | | Year Ended December 31, | | | Year Ended December 31, | | | | | 2019 | | | 2018 | Revenue (unaudited) | | | $ | 57,597 | | $ | 38,753 | Pre-tax loss (unaudited) | | | $ | (38,636) | | $ | (33,894) |
During the year ended December 31, 2020, the Company incurred 0 costs associated with the acquisition of Uman. During the year ended December 31, 2019, the Company incurred $1.9 million in costs associated with the acquisition of Uman. Costs associated with the acquisition of Uman are recorded as selling, general, and administrative expenses within the consolidated statements of operations. 16. Goodwill and Intangible Assetsintangible assets As of December 31, 20182020 the carrying amount of goodwill was $1.3$10.5 million. The following is a rollforward of ourthe Company’s goodwill balance (in thousands): | | | | |
| | Goodwill | |
|---|
Balance as of December 31, 2017 | | $ | — | | Goodwill acquired | | | 1,308 | | | | | | | | Balance as of December 31, 2018 | | $ | 1,308 | | | | | | | | | | | | | | | | | | | |
Intangible
| | | | | | Goodwill | Balance as of December 31, 2019 | | $ | 9,353 | Cumulative translation adjustment | | | 1,107 | Balance as of December 31, 2020 | | $ | 10,460 |
Acquired intangible assets consist of the following (dollars in thousands): | | | | | | | | | | | | | | | | | | | | | December 31, 2020 | | | | | | | Gross | | | | | Cumulative | | Net | | Weighted | | | Estimated Useful | | Carrying | | Accumulated | | Translation | | Carrying | | Average | | | Life (in years) | | Value | | Amortization | | Adjustment | | Value | | Life Remaining (in years) | Know-how | | 8.5 | | $ | 13,000 | | $ | (2,296) | | $ | 1,374 | | $ | 12,078 | | 6.99 | Developed technology | | 7 | | | 1,650 | | | (1,036) | | | — | | | 614 | | 4.09 | Customer relationships | | 8.5 - 10 | | | 1,360 | | | (618) | | | 12 | | | 754 | | 7.08 | Non-compete agreements | | 5.5 | | | 340 | | | (102) | | | 31 | | | 269 | | 3.99 | Trade names | | 3 | | | 50 | | | (49) | | | — | | | 1 | | 0.08 | Total | | | | $ | 16,400 | | $ | (4,101) | | $ | 1,417 | | $ | 13,716 | | |
| | | | | | | | | | | | | | | | | | | | | December 31, 2019 | | | | | Gross | | | | | Cumulative | | Net | | Weighted | | | Estimated Useful | | Carrying | | Accumulated | | Translation | | Carrying | | Average | | | Life (in years) | | Value | | Amortization | | Adjustment | | Value | | Life Remaining (in years) | Know-how | | 8.5 | | $ | 13,000 | | $ | (767) | | $ | (99) | | $ | 12,134 | | 8.00 | Developed technology | | 7 | | | 1,650 | | | (737) | | | — | | | 913 | | 5.09 | Customer relationships | | 8.5 - 10 | | | 1,360 | | | (421) | | | (1) | | | 938 | | 8.08 | Non-compete agreements | | 5.5 | | | 340 | | | (34) | | | (2) | | | 304 | | 5.00 | Trade names | | 3 | | | 50 | | | (32) | | | — | | | 18 | | 1.09 | Total | | | | $ | 16,400 | | $ | (1,991) | | $ | (102) | | $ | 14,307 | | |
The Company acquired $13.5 million of intangible assets in the Uman acquisition, of which $13.0 million was assigned to know-how, $0.4 million was assigned to non-compete agreements, and $0.1 million was assigned to customer relationships. The know-how and customer relationships intangible assets are being amortized on a straight-line basis over an 8.5 year amortization period, and the non-compete agreement intangible asset is being amortized on a | | | | | | | | | | | | | | | |
| |
| | December 31, 2018 | |
| |
|---|
| | Estimated Useful
Life (in years) | | Gross
Carrying
Value | | Accumulated
Amortization | | Net
Carrying
Value | | Weighted
average life
remaining | |
|---|
Developed technology | | 7 | | $ | 1,650 | | $ | (378 | ) | $ | 1,272 | | | 6.08 | | Customer relationships | | 10 | | | 1,250 | | | (208 | ) | | 1,042 | | | 9.08 | | Tradenames | | 3 | | | 50 | | | (15 | ) | | 35 | | | 2.08 | | | | | | | | | | | | | | | | | | | Total | | | | $ | 2,950 | | $ | (601 | ) | $ | 2,348 | | | | | | | | | | | | | | | | | | | | | | | | | | | | | | | | | | | | | | | | | | | | | | | | | | | | | | | |
straight-line basis over a 5.5 year amortization period. In total, the weighted-average amortization period for these intangible assets is 8.4 years. Know-how consists of the processes and procedures to produce Uman’s products. Customer relationships represent the underlying relationships with certain customers to provide continued product sale opportunities. The Company utilized excess earnings methodology to derive the fair value of the customer relationships. The Company recorded amortization expense of $2.1 million, $1.4 million, and $0.6 million for the fiscal yearyears ended December 31, 2018. No amortization expense was recognized in the fiscal year ended December 31, 20172020, 2019, and 2016 as the intangible assets are a result2018, respectively. Amortization of the purchase of Aushon BioSystems in January 2018. Amortization relating to developed technology is recorded within research and development expense,expenses, amortization of customer relationships is recorded within salesselling, general, and marketingadministrative expenses, amortization of trade names is recorded within selling, general, and administrative expenses, amortization of non-compete agreements is recorded within selling, general, and administrative expenses, and amortization of tradenamesknow-how is recorded within general and administrative expenses.
Tablecost of Contentsgoods sold.
Quanterix Corporation
Notes to Consolidated Financial Statements (Continued)
14. Goodwill and Intangible Assets (Continued)
As of December 31, 2018, the Company expects to record the followingFuture estimated amortization expense (amounts in thousands):
| | | | | For the Years Ended December 31, | | Estimated
Amortization
Expense | |
|---|
2019 | | $ | 582 | | 2020 | | | 500 | | 2021 | | | 403 | | 2022 | | | 320 | | 2023 | | | 238 | | 2024 and thereafter | | | 305 | |
15. Related party transactions
As described in Notes 11 and 7, bioMérieux is a customer through its Joint Development and License Agreement and also a holder of the Company's common stock. bioMérieux formerly also had a designee on the Company's Board of Directors. They Company recognized revenue related to the JDLA with bioMérieux of $2.1 million, $1.1 million, and $0.2 million, in the years ended December 31, 2018, 2017, and 2016 respectively, from bioMérieux. They also had no deferred revenueacquired intangible assets as of December 31, 2018 and had deferred revenue of $2.1 million at December 31, 2017. As described2020 is as follows (amounts in Note 8, bioMérieux purchased shares of our Series C Preferred Stock totaling $7.0 million in the year ended December 31, 2015.thousands):
As described in Note 7, in March 2016, the Company issued an aggregate of 12,420,262 shares of Series D Preferred Stock for an aggregate purchase price of $45.6 million. Of the amount issued, $22.9 million was purchased by the Company's existing principal stockholders, officers and directors.
| | | | For the Years Ended December 31, | | Estimated Amortization Expense | 2021 | | $ | 2,013 | 2022 | | | 1,930 | 2023 | | | 1,848 | 2024 | | | 1,733 | Thereafter | | | 6,192 | | | $ | 13,716 |
As described in Note 7, in June 2017, the Company issued an aggregate of 2,113,902 share of Series D-1 Preferred Stock for an aggregate purchase price of $8.5 million. Of the amount issued, $1.0 million was purchased by a director of the Company.
17. Related party transactions As described in Note 9, in June 2007, the Company entered into a license agreement (the License Agreement) for certain intellectual property with Tufts University (Tufts).Tufts. Tufts is a related party to the Company due to Tuft'sTufts’ equity ownership in the Company and because a board member of the Company'sCompany’s Board of Directors was affiliated with Tufts. During the years ended December 31, 2018, 2017,2020, 2019, and 20162018 the Company recorded royalty expense of $0.7$1.1 million, $0.5$1.0 million, and $0.3$0.7 million, respectively, in cost of product revenue on the consolidated statements of operations and comprehensive loss.operations. During the year ended December 31, 2016,2020, the Company recognized $0.4also incurred $1.0 million asin cost of collaboration and license revenue associated with a payment madeowed to Tufts.Tufts related to sublicensing certain technology and intellectual property to Abbott. During the year ended December 31, 2017, Harvard University became a related party.party because a member of the Company’s Board of Directors is affiliated with Harvard University. Revenue recorded from sales to Harvard University werewas $0.1 million, $0.1 million, and less than $0.1 million for each of the years ended December 31, 2020, 2019, and 2018, and December 31, 2017.respectively. On November 28,th, 2018, the Company entered into a sponsor agreement with PPH,Powering Precision Health (PPH), a 501(c)6 not-for-profit entity of which an executive of the Company is a board member, through December 31, 2018. The agreement commitscommitted a maximum of $120,000 in funds and services to be provided to PPH for the term of the agreement. On November 14, 2019, the Company entered into the first amendment to the PPH sponsorship agreement. The agreement amended the $120,000 annual committed maximum amount to $200,000 for the annual committed amount. The agreement is terminable by either party and does not bind the
Table of Contents
Quanterix Corporation
Notes to Consolidated Financial Statements (Continued)
15. Related party transactions (Continued)
Company to beyond the term of the agreement. As ofFor the year ended December 31, 2020, the company did not make any contributions. For the years ended December 31, 2019, and 2018, the Company had a total contributed amountcontributions $0.1 million, and less than $0.1 million.million, respectively. 16.
18. Restricted Cashcash The Company'sCompany’s restricted cash consists of cash that the Company is contractually obligated to maintain in accordance the terms of the Letter of Credit in the lease agreement. The $1.0 million Letter of Credit drawable by the lessor under specifically outlined conditions within the lease, which are primarily related to rent payments. The amount of the Letter of Credit will be reduced at 41 and 65 months after the commencement date of the lease to $750,000 and then $250,000, respectively. 17.The Company had $1.0 million of restricted cash as of December 31, 2020 and 2019, respectively.
19. Quarterly Data (Unaudited)data (unaudited) (InAmounts in thousands, except share and per share data) | | | | | | | | | | | | | | | | 2020 | | Q1 | | Q2 | | Q3 | | Q4 | | Total Year | Product revenue | | $ | 9,833 | | $ | 6,790 | | $ | 11,662 | | $ | 15,732 | | $ | 44,017 | Service and other revenue | | | 5,762 | | | 6,317 | | | 6,552 | | | 5,498 | | | 24,129 | Collaboration and license revenue | | | 132 | | | 23 | | | 11,246 | | | 408 | | | 11,809 | Grant revenue | | | — | | | — | | | 1,929 | | | 4,493 | | | 6,422 | Total revenue | | | 15,727 | | | 13,130 | | | 31,389 | | | 26,131 | | | 86,377 | Costs of goods sold: | | | | | | | | | | | | | | | | Cost of product revenue | | | 6,186 | | | 5,416 | | | 6,387 | | | 7,961 | | | 25,950 | Cost of services and other revenue | | | 2,728 | | | 2,501 | | | 2,896 | | | 3,120 | | | 11,245 | Cost of collaboration and license revenue | | | — | | | — | | | 1,000 | | | — | | | 1,000 | Total costs of goods sold and services | | | 8,914 | | | 7,917 | | | 10,283 | | | 11,081 | | | 38,195 | Gross profit | | | 6,813 | | | 5,213 | | | 21,106 | | | 15,050 | | | 48,182 | Operating expenses: | | | | | | | | | | | | | | | | Research and development | | | 4,268 | | | 4,312 | | | 5,377 | | | 6,217 | | | 20,174 | Selling, general and administrative | | | 14,273 | | | 13,102 | | | 13,451 | | | 18,766 | | | 59,592 | Total operating expenses | | | 18,541 | | | 17,414 | | | 18,828 | | | 24,983 | | | 79,766 | Income (loss) from operations | | | (11,728) | | | (12,201) | | | 2,278 | | | (9,933) | | | (31,584) | Interest income (expense), net | | | 161 | | | (108) | | | (160) | | | (166) | | | (273) | Other income (expense), net | | | (167) | | | (11) | | | (26) | | | 155 | | | (49) | Income (loss) before income taxes | | | (11,734) | | | (12,320) | | | 2,092 | | | (9,944) | | | (31,906) | Income tax benefit | | | 124 | | | 18 | | | 111 | | | 123 | | | 376 | Net income (loss) | | $ | (11,610) | | $ | (12,302) | | $ | 2,203 | | $ | (9,821) | | $ | (31,530) | Net income (loss) per share, basic | | $ | (0.41) | | $ | (0.43) | | $ | 0.07 | | $ | (0.31) | | $ | (1.07) | Weighted-average common shares outstanding, basic | | | 28,179,132 | | | 28,312,925 | | | 30,139,157 | | | 31,696,002 | | | 29,589,132 | Net income (loss) per share, diluted | | $ | (0.41) | | $ | (0.43) | | $ | 0.07 | | $ | (0.31) | | $ | (1.07) | Weighted-average common shares outstanding, diluted | | | 28,179,132 | | | 28,312,925 | | | 31,386,439 | | | 31,696,002 | | | 29,589,132 |
| | | | | | | | | | | | | | | | | 2018 | | Q1 | | Q2 | | Q3 | | Q4 | | Total Year | |
|---|
Product revenue | | $ | 4,745 | | $ | 5,200 | | $ | 5,962 | | $ | 7,458 | | $ | 23,365 | | Service and other revenue | | | 2,507 | | | 3,174 | | | 3,017 | | | 3,419 | | | 12,117 | | Collaboration and license revenue | | | 269 | | | 269 | | | 1,612 | | | — | | | 2,150 | | | | | | | | | | | | | | | | | | | | Total revenue | | | 7,521 | | | 8,643 | | | 10,591 | | | 10,877 | | | 37,632 | | Operating expenses: | | | | | | | | | | | | | | | | | Cost of product revenue | | | 2,773 | | | 2,945 | | | 3,277 | | | 3,734 | | | 12,729 | | Cost of services and other revenue | | | 1,576 | | | 1,725 | | | 1,719 | | | 1,935 | | | 6,955 | | Research and development | | | 3,644 | | | 3,705 | | | 4,411 | | | 4,045 | | | 15,805 | | Selling, general and administrative | | | 6,691 | | | 7,579 | | | 8,846 | | | 10,577 | | | 33,693 | | | | | | | | | | | | | | | | | | | | Total operating expenses | | | 14,684 | | | 15,954 | | | 18,253 | | | 20,291 | | | 69,182 | | | | | | | | | | | | | | | | | | | | Loss from operations | | | (7,163 | ) | | (7,311 | ) | | (7,662 | ) | | (9,414 | ) | | (31,550 | ) | Interest expense, net | | | (24 | ) | | 16 | | | 30 | | | 24 | | | 46 | | Other (expense) income, net | | | (15 | ) | | (48 | ) | | (25 | ) | | 81 | | | (7 | ) | Tax expense | | | — | | | — | | | — | | | (25 | ) | | (25 | ) | | | | | | | | | | | | | | | | | | | Net loss | | $ | (7,202 | ) | $ | (7,343 | ) | $ | (7,657 | ) | $ | (9,334 | ) | $ | (31,536 | ) | Reconciliation of net loss to net loss attributable to common stockholders: | | | | | | | | | | | | | | | — | | Net loss | | | (7,202 | ) | | (7,343 | ) | | (7,657 | ) | | (9,334 | ) | | (31,536 | ) | | | | | | | | | | | | | | | | | | | Net loss attributable to common stockholders | | | (7,202 | ) | | (7,343 | ) | | (7,657 | ) | | (9,334 | ) | | (31,536 | ) | | | | | | | | | | | | | | | | | | | Net loss per share attributable to common stockholders, basic and diluted | | $ | (0.33 | ) | $ | (0.34 | ) | $ | (0.35 | ) | $ | (0.42 | ) | $ | (1.43 | ) | | | | | | | | | | | | | | | | | | | Weighted-average common shares outstanding, basic and diluted | | | 21,788,605 | | | 21,890,978 | | | 22,670,786 | | | 22,221,305 | | | 21,994,317 | | | | | | | | | | | | | | | | | | | |
Table of Contents | | | | | | | | | | | | | | | | 2019 | | Q1 | | Q2 | | Q3 | | Q4 | | Total Year | Product revenue | | $ | 9,547 | | $ | 8,776 | | $ | 10,737 | | $ | 11,431 | | $ | 40,491 | Service and other revenue | | | 2,790 | | | 4,760 | | | 4,207 | | | 4,302 | | | 16,059 | Collaboration and license revenue | | | — | | | — | | | — | | | 184 | | | 184 | Total revenue | | | 12,337 | | | 13,536 | | | 14,944 | | | 15,917 | | | 56,734 | Costs of goods sold: | | | | | | | | | | | | | | | | Cost of product revenue | | | 4,248 | | | 4,455 | | | 5,513 | | | 6,684 | | | 20,900 | Cost of services and other revenue | | | 2,082 | | | 2,150 | | | 2,398 | | | 2,368 | | | 8,998 | Total costs of goods sold and services | | | 6,330 | | | 6,605 | | | 7,911 | | | 9,052 | | | 29,898 | Gross profit | | | 6,007 | | | 6,931 | | | 7,033 | | | 6,865 | | | 26,836 | Operating expenses: | | | | | | | | | | | | | | | | Research and development | | | 3,852 | | | 4,016 | | | 3,924 | | | 4,398 | | | 16,190 | Selling, general and administrative | | | 11,512 | | | 13,429 | | | 13,352 | | | 13,953 | | | 52,246 | Total operating expenses | | | 15,364 | | | 17,445 | | | 17,276 | | | 18,351 | | | 68,436 | Loss from operations | | | (9,357) | | | (10,514) | | | (10,243) | | | (11,486) | | | (41,600) | Interest income, net | | | 21 | | | 42 | | | 282 | | | 282 | | | 627 | Other income (expense), net | | | (47) | | | (68) | | | (34) | | | 139 | | | (10) | Loss before income taxes | | | (9,383) | | | (10,540) | | | (9,995) | | | (11,065) | | | (40,983) | Income tax benefit (provision) | | | (22) | | | (23) | | | 125 | | | 107 | | | 187 | Net loss | | $ | (9,405) | | $ | (10,563) | | $ | (9,870) | | $ | (10,958) | | $ | (40,796) | Net loss per share, basic and diluted | | $ | (0.42) | | $ | (0.46) | | $ | (0.37) | | $ | (0.39) | | $ | (1.63) | Weighted-average common shares outstanding, basic and diluted | | | 22,422,960 | | | 23,213,653 | | | 26,627,831 | | | 28,021,957 | | | 25,090,708 |
Quanterix Corporation
Notes20. Subsequent events
On February 3, 2021, the Company entered into an underwriting agreement with Goldman Sachs & Co. LLC, Leerink and Cowen, as representatives of the several underwriters, relating to Consolidated Financial Statements (Continued)an underwritten public offering of approximately 4,107,142 shares of the Company’s common stock, par value $0.001 per share. The underwritten public offering resulted in gross proceeds of $287.5 million. The Company incurred $17.9 million in issuance costs associated with the underwritten public offering, resulting in net proceeds to the Company of $269.6 million. 17. Quarterly Data (Unaudited) (Continued)
| | | | | | | | | | | | | | | | | 2017 | | Q1 | | Q2 | | Q3 | | Q4 | | Total Year | |
|---|
Product revenue | | $ | 3,425 | | $ | 3,337 | | $ | 3,293 | | $ | 4,069 | | $ | 14,124 | | Service and other revenue | | | 1,644 | | | 1,608 | | | 2,172 | | | 2,252 | | | 7,676 | | Collaboration and license revenue | | | 269 | | | 268 | | | 269 | | | 268 | | | 1,074 | | | | | | | | | | | | | | | | | | | | Total revenue | | | 5,338 | | | 5,213 | | | 5,734 | | | 6,589 | | | 22,874 | | Operating expenses: | | | | | | | | | | | | | | | | | Cost of product revenue | | | 1,834 | | | 1,834 | | | 1,905 | | | 2,169 | | | 7,742 | | Cost of services and other revenue | | | 1,144 | | | 1,198 | | | 1,264 | | | 1,539 | | | 5,145 | | Research and development | | | 4,250 | | | 3,903 | | | 4,224 | | | 3,927 | | | 16,304 | | Selling, general and administrative | | | 4,166 | | | 4,747 | | | 4,728 | | | 6,047 | | | 19,688 | | | | | | | | | | | | | | | | | | | | Total operating expenses | | | 11,394 | | | 11,682 | | | 12,121 | | | 13,682 | | | 48,879 | | | | | | | | | | | | | | | | | | | | Loss from operations | | | (6,056 | ) | | (6,469 | ) | | (6,387 | ) | | (7,093 | ) | | (26,005 | ) | Interest expense, net | | | (255 | ) | | (240 | ) | | (240 | ) | | (216 | ) | | (951 | ) | Other (expense) income, net | | | (80 | ) | | 77 | | | 13 | | | (73 | ) | | (63 | ) | Tax Expense | | | — | | | — | | | — | | | — | | | — | | | | | | | | | | | | | | | | | | | | Net loss | | $ | (6,391 | ) | $ | (6,632 | ) | $ | (6,614 | ) | $ | (7,382 | ) | $ | (27,019 | ) | Reconciliation of net loss to net loss attributable to common stockholders: | | | | | | | | | | | | | | | | | Net loss | | | (6,391 | ) | | (6,632 | ) | | (6,614 | ) | | (7,382 | ) | | (27,019 | ) | Accretion of preferred stock to redemption value | | | (1,090 | ) | | (1,099 | ) | | (1,112 | ) | | (809 | ) | | (4,110 | ) | Accrued dividends on preferred stock | | | (16 | ) | | (16 | ) | | (16 | ) | | (11 | ) | | (59 | ) | | | | | | | | | | | | | | | | | | | Net loss attributable to common stockholders | | | (7,497 | ) | | (7,747 | ) | | (7,742 | ) | | (8,202 | ) | | (31,188 | ) | | | | | | | | | | | | | | | | | | | Net loss per share attributable to common stockholders, basic and diluted | | $ | (3.18 | ) | $ | (3.21 | ) | $ | (3.13 | ) | $ | (1.06 | ) | $ | (8.30 | ) | | | | | | | | | | | | | | | | | | | Weighted-average common shares outstanding, basic and diluted | | | 2,357,503 | | | 2,416,984 | | | 2,475,166 | | | 7,731,514 | | | 3,756,954 | | | | | | | | | | | | | | | | | | | |
|
|