0001047862srt:SubsidiariesMembered:ProtectedPortionMembered:ElectricAndGasTransmissionProjectsMembered:OrangeAndRocklandUtilitiesIncMember2020-01-012022-12-31false2023FY000104786212/310000023632false2023FY12/31P1MP3YP3Yhttp://fasb.org/us-gaap/2023#FairValueMeasuredAtNetAssetValuePerShareMemberhttp://fasb.org/us-gaap/2023#FairValueMeasuredAtNetAssetValuePerShareMemberhttp://fasb.org/us-gaap/2023#FairValueMeasuredAtNetAssetValuePerShareMemberP3Mhttp://fasb.org/us-gaap/2023#FairValueMeasuredAtNetAssetValuePerShareMemberhttp://fasb.org/us-gaap/2023#FairValueMeasuredAtNetAssetValuePerShareMemberhttp://fasb.org/us-gaap/2023#FairValueMeasuredAtNetAssetValuePerShareMemberhttp://fasb.org/us-gaap/2023#OtherNonoperatingExpensehttp://fasb.org/us-gaap/2023#OtherNonoperatingExpensehttp://fasb.org/us-gaap/2023#OtherNonoperatingExpensehttp://fasb.org/us-gaap/2023#OtherNonoperatingExpensehttp://fasb.org/us-gaap/2023#AccruedEnvironmentalLossContingenciesNoncurrenthttp://fasb.org/us-gaap/2023#AccruedEnvironmentalLossContingenciesNoncurrenthttp://fasb.org/us-gaap/2023#AccruedEnvironmentalLossContingenciesNoncurrenthttp://fasb.org/us-gaap/2023#AccruedEnvironmentalLossContingenciesNoncurrenthttp://fasb.org/us-gaap/2023#LiabilitiesCurrenthttp://fasb.org/us-gaap/2023#LiabilitiesCurrenthttp://fasb.org/us-gaap/2023#LiabilitiesOtherThanLongtermDebtNoncurrenthttp://fasb.org/us-gaap/2023#LiabilitiesOtherThanLongtermDebtNoncurrenthttp://fasb.org/us-gaap/2023#LiabilitiesOtherThanLongtermDebtNoncurrent http://fasb.org/us-gaap/2023#OtherLiabilitieshttp://fasb.org/us-gaap/2023#LiabilitiesOtherThanLongtermDebtNoncurrent http://fasb.org/us-gaap/2023#OtherLiabilitieshttp://fasb.org/us-gaap/2023#CostOfGoodsAndServicesSoldhttp://fasb.org/us-gaap/2023#CostOfGoodsAndServicesSoldhttp://fasb.org/us-gaap/2023#CostOfGoodsAndServicesSoldhttp://fasb.org/us-gaap/2023#CostOfGoodsAndServicesSoldhttp://fasb.org/us-gaap/2023#Revenueshttp://fasb.org/us-gaap/2023#Revenueshttp://fasb.org/us-gaap/2023#Revenueshttp://fasb.org/us-gaap/2023#Revenueshttp://fasb.org/us-gaap/2023#CostOfGoodsAndServicesSoldhttp://fasb.org/us-gaap/2023#CostOfGoodsAndServicesSoldhttp://fasb.org/us-gaap/2023#CostOfGoodsAndServicesSoldhttp://fasb.org/us-gaap/2023#CostOfGoodsAndServicesSoldhttp://www.coned.com/20231231#InterestExpenseIncomeOtherNethttp://www.coned.com/20231231#InterestExpenseIncomeOtherNethttp://www.coned.com/20231231#InterestExpenseIncomeOtherNethttp://www.coned.com/20231231#InterestExpenseIncomeOtherNethttp://fasb.org/us-gaap/2023#Assetshttp://fasb.org/us-gaap/2023#Assetshttp://fasb.org/us-gaap/2023#LiabilitiesCurrenthttp://fasb.org/us-gaap/2023#LiabilitiesCurrenthttp://fasb.org/us-gaap/2023#Revenueshttp://fasb.org/us-gaap/2023#Revenues
UNITED STATES
SECURITIES AND EXCHANGE COMMISSION
WASHINGTON, D.C. 20549
___________________________________________________
FORM 10-K
___________________________________________________
☒ Annual Report Pursuant To Section 13 or 15(d) of the Securities Exchange Act of 1934
FOR THE FISCAL YEAR ENDED DECEMBER 31, 20222023
OR
☐ Transition Report Pursuant to Section 13 or 15(d) of the Securities Exchange Act of 1934
For the transition period from to
___________________________________________________
Commission File Number 1-14514
Consolidated Edison, Inc.
Exact name of registrant as specified in its charter
and principal office address and telephone number
| | | | | | | | |
| New York | | 13-3965100 |
| State of Incorporation | | I.R.S. Employer ID. Number |
| | | | | | | | |
| 4 Irving Place, |
| New York, | New York | 10003 |
| | |
| (212) | 460-4600 | |
___________________________________________________
Commission File Number 1-1217
Consolidated Edison Company of New York, Inc.
Exact name of registrant as specified in its charter
and principal office address and telephone number
| | | | | | | | |
| New York | | 13-5009340 |
| State of Incorporation | | I.R.S. Employer ID. Number |
| | | | | | | | |
| 4 Irving Place, |
| New York, | New York | 10003 |
| | |
| (212) | 460-4600 | |
___________________________________________________
| | | | | |
CON EDISON ANNUAL REPORT 20222023 | 1 |
Securities Registered Pursuant to Section 12(b) of the Act:
| | | | | | | | | | | | | | |
| Title of each class | | Trading Symbol | Name of each exchange on which registered |
| Consolidated Edison, Inc., | | ED | New York Stock Exchange |
| Common Shares ($.10 par value) | | | |
Securities Registered Pursuant to Section 12(g) of the Act: None
Indicate by check mark if the registrant is a well-known seasoned issuer, as defined in Rule 405 of the Securities Act.
| | | | | | | | | | | | | | | | | | | | | | | | | | | | | |
| Consolidated Edison, Inc. (Con Edison) | Yes | | x | | No | | ¨ | |
| Consolidated Edison Company of New York, Inc. (CECONY) | Yes | | x | | No | | ¨ | |
Indicate by check mark if the registrant is not required to file reports pursuant to Section 13 or Section 15(d) of the Act.
| | | | | | | | | | | | | | | | | | | | | | | | | | | | | |
| Con Edison | Yes | | ¨ | | No | | x | |
| CECONY | Yes | | ¨ | | No | | x | |
Indicate by check mark whether the registrant (1) has filed all reports required to be filed by Section 13 or 15(d) of the Securities Exchange Act of 1934 during the preceding 12 months (or for such shorter period that the registrant was required to file such reports), and (2) has been subject to such filing requirements for the past 90 days.
| | | | | | | | | | | | | | | | | | | | | | | | | | | | | |
| Con Edison | Yes | | x | | No | | ¨ | |
| CECONY | Yes | | x | | No | | ¨ | |
Indicate by check mark whether the registrant has submitted electronically every Interactive Data File required to be submitted pursuant to Rule 405 of Regulation S-T (§232.405 of this chapter) during the preceding 12 months (or for such shorter period that the registrant was required to submit such files).
| | | | | | | | | | | | | | | | | | | | | | | | | | | | | |
| Con Edison | Yes | | x | | No | | ¨ | |
| CECONY | Yes | | x | | No | | ¨ | |
Indicate by check mark whether the registrant is a large accelerated filer, an accelerated filer, a non-accelerated filer, smaller reporting company, or an emerging growth company. See the definitions of “large accelerated filer”, “accelerated filer,” “smaller reporting company,” and "emerging growth company" in Rule 12b-2 of the Exchange Act.
| | | | | | | | | | | | | | | | | | | | | | | |
| Con Edison | | | | | | |
| Large accelerated filer | | x | | Accelerated filer | | ¨ |
| | | | | | | |
| Non-accelerated filer | | ¨ | | Smaller reporting company | | ☐ |
| | | | | Emerging growth company | | ☐ |
| CECONY | | | | | | |
| Large accelerated filer | | ¨ | | Accelerated filer | | ¨ |
| | | | | | | |
| Non-accelerated filer | | x | | Smaller reporting company | | ☐ |
| | | | | Emerging growth company | | ☐ |
If an emerging growth company, indicate by check mark if the registrant has elected not to use the extended transition period for complying with any new or revised financial accounting standards provided pursuant to Section 13(a) of the Exchange Act. ¨
Indicate by check mark whether the registrant has filed a report on and attestation to its management’s assessment of the effectiveness of its internal control over financial reporting under Section 404(b) of the Sarbanes-Oxley Act (15 U.S.C. 7262(b)) by the registered public accounting firm that prepared or issued its audit report.
| | | | | | | | | | | | | | | | | | | | | | | | | | | | | |
| Con Edison | | Yes | | x | | No | | ☐ | |
| CECONY | | Yes | | x | | No | | ☐ | |
| | | | | |
2 |
20222023 |
If securities are registered pursuant to Section 12(b) of the Act, indicate by check mark whether the financial statements of the registrant included in the filing reflect the correction of an error to previously issued financial statements.
| | | | | | | | | | | |
| Con Edison | | | ☐ |
| CECONY | | | Not Applicable |
Indicate by check mark whether any of those error corrections are restatements that required a recovery analysis of incentive-based compensation received by any of the registrant’s executive officers during the relevant recovery period pursuant to §240.10D-1(b).
| | | | | | | | | | | |
| Con Edison | | | ☐ |
| CECONY | | | Not Applicable |
Indicate by check mark whether the registrant is a shell company (as defined in Rule 12b-2 of the Act).
| | | | | | | | | | | | | | | | | | | | | | | | | | | | | |
| Con Edison | | Yes | | ☐ | | No | | x | |
| CECONY | | Yes | | ☐ | | No | | x | |
The aggregate market value of the common equity of Con Edison held by non-affiliates of Con Edison, as of June 30, 2022,2023, was approximately $33.7$31.2 billion.
As of January 31, 2023,2024, Con Edison had outstanding 355,045,021345,510,031 Common Shares ($.10 par value).
All of the outstanding common equity of CECONY is held by Con Edison.
Documents Incorporated By Reference
Portions of Con Edison’s definitive proxy statement for its Annual Meeting of Stockholders to be held on May 15, 2023,20, 2024, to be filed with the Commission pursuant to Regulation 14A, not later than 120 days after December 31, 2022,2023, is incorporated in Part III of this report.
Filing Format
This Annual Report on Form 10-K is a combined report being filed separately by two different registrants: Consolidated Edison, Inc. (Con Edison) and Consolidated Edison Company of New York, Inc. (CECONY). CECONY is a wholly-owned subsidiary of Con Edison and, as such, the information in this report about CECONY also applies to Con Edison. CECONY meets the conditions set forth in General Instruction (I)(1)(a) and (b) of Form 10-K and is therefore filing this Form 10-K with the reduced disclosure format.
As used in this report, the term the “Companies” refers to Con Edison and CECONY. However, CECONY makes no representation as to the information contained in this report relating to Con Edison or the subsidiaries of Con Edison other than itself.
| | | | | |
CON EDISON ANNUAL REPORT 20222023 | 3 |
Glossary of Terms
The following is a glossary of abbreviations or acronyms that are used in the Companies’ SEC reports:
| | | | | | | | |
| Con Edison Companies | | |
| Con Edison | | Consolidated Edison, Inc. |
| CECONY | | Consolidated Edison Company of New York, Inc. |
| Clean Energy Businesses | | Con Edison Clean Energy Businesses, Inc., together with its subsidiaries, including Consolidateda former subsidiary of Con Edison Development, Inc., Consolidated Edison Energy, Inc. and Consolidated Edison Solutions, Inc. |
| Con Edison Transmission | | Con Edison Transmission, Inc., together with its subsidiaries |
| | |
| | |
| O&R | | Orange and Rockland Utilities, Inc. |
| RECO | | Rockland Electric Company |
| The Companies | | Con Edison and CECONY |
| The Utilities | | CECONY and O&R |
|
| Regulatory Agencies, Government Agencies and Other Organizations |
| EPA | | U.S. Environmental Protection Agency |
| FASB | | Financial Accounting Standards Board |
| FERC | | Federal Energy Regulatory Commission |
| | |
| IRS | | Internal Revenue Service |
| NJBPU | | New Jersey Board of Public Utilities |
| NJDEP | | New Jersey Department of Environmental Protection |
| NYISO | | New York Independent System Operator |
| NYPA | | New York Power Authority |
| NYSDEC | | New York State Department of Environmental Conservation |
| NYSDPS | | New York State Department of Public Service |
| NYSERDA | | New York State Energy Research and Development Authority |
| NYSPSC | | New York State Public Service Commission |
| NYSRC | | New York State Reliability Council, LLC |
| PJM | | PJM Interconnection LLC |
| SEC | | U.S. Securities and Exchange Commission |
| |
| Accounting | | |
| AFUDC | | Allowance for funds used during construction |
| ASU | | Accounting Standards Update |
| GAAP | | Generally Accepted Accounting Principles in the United States of America |
| HLBV | | Hypothetical Liquidation at Book Value |
| NOL | | Net Operating Loss |
| OCI | | Other Comprehensive Income |
| VIE | | Variable Interest Entity |
| |
| | |
| | |
| | |
| | |
| | |
| | |
| | |
| | |
| | | | | |
4 |
20222023 |
| | | | | | | | |
| Environmental | | |
| CO2 | | Carbon dioxide |
| GHG | | Greenhouse gases |
| MGP Sites | | Manufactured gas plant sites |
| PCBs | | Polychlorinated biphenyls |
| PRP | | Potentially responsible party |
| RGGI | | Regional Greenhouse Gas Initiative |
| Superfund | | Federal Comprehensive Environmental Response, Compensation and Liability Act of 1980 and similar state statutes |
| |
| Units of Measure | | |
| AC | | Alternating current |
| Bcf | | Billion cubic feet |
| Dt | | Dekatherms |
| kV | | Kilovolt |
| kWh | | Kilowatt-hour |
| MDt | | Thousand dekatherms |
| Mlb | | Thousands of pounds |
| MMlb | | Million pounds |
| MVA | | Megavolt ampere |
| MW | | Megawatt or thousand kilowatts |
| MWh | | Megawatt hour |
| |
| Other | | |
| | |
| AMI | | Advanced Metering Infrastructure |
| CARES Act | | Coronavirus Aid, Relief, and Economic Security Act, as enacted on March 27, 2020
| CLCPA | | Climate Leadership and Community Protection Act |
| COSO | | Committee of Sponsoring Organizations of the Treadway Commission |
| COVID-19 | | Coronavirus Disease 2019 |
| DER | | Distributed energy resources |
| Fitch | | Fitch Ratings |
| LTIP | | Long Term Incentive Plan |
| Moody’s | | Moody’s Investors Service |
| | |
| S&P | | S&P Global Ratings |
| TCJA | | The federal Tax Cuts and Jobs Act of 2017, as enacted on December 22, 2017 |
| VaR | | Value-at-Risk |
| | | | | |
CON EDISON ANNUAL REPORT 20222023 | 5 |
TABLE OF CONTENTS
| | | | | | | | |
| PAGE |
| |
| |
| |
| |
| |
| Item 1: | | |
| Item 1A: | | |
| Item 1B: | | |
| Item 1C: | | |
| Item 2: | | |
| Item 3: | | |
| Item 4: | | |
| | |
| | |
| Item 5: | | |
| Item 6: | | |
| Item 7: | | |
| Item 7A: | | |
| Item 8: | | |
| Item 9: | | |
| Item 9A: | | |
| Item 9B: | | |
| Item 9C: | | |
| | |
| Item 10: | | |
| Item 11: | | |
| Item 12: | | |
| Item 13: | | |
| Item 14: | | |
| | |
| Item 15: | | |
| Item 16: | | |
| | |
| | | | | |
6 |
20222023 |
Introduction
This introduction contains certain information about Con Edison and its subsidiaries, including CECONY. This introduction is not a summary and should be read together with, and is qualified in its entirety by reference to, the more detailed information appearing elsewhere or incorporated by reference in this report.
Con Edison’s mission is to provide energy services to our customers safely, reliably, efficiently and in keeping with our vision for a clean energy future; to provide a workplace that embraces diversity and inclusion and allows employees to realize their full potential; to provide a fair return to our investors; and to improve the quality of life in the communities we serve. The company has ongoing programs designed to support each component of its mission, including initiatives focused on safety, operational excellence and the customer experience.
Con Edison is a holding company that owns:
•Consolidated Edison Company of New York, Inc. (CECONY), which provides electric service and gas service in New York City and Westchester County and steam service in parts of Manhattan;
•Orange & Rockland Utilities, Inc., which along with its NJNew Jersey electric utility subsidiary, Rockland Electric Company (together referred to herein as O&R), provides electric service in southeastern NYNew York and northern NJNew Jersey and gas service in southeastern NYNew York (O&R, together with CECONY referred to as the Utilities);
•Con Edison Clean Energy Businesses, Inc., which through its subsidiaries, develops, owns and operates renewable energy infrastructure projects and provides energy-related products and services to wholesale and retail customers (Con Edison Clean Energy Businesses, Inc., together with its subsidiaries referred to as the Clean Energy Businesses); see "Assets and Liabilities Held For Sale" in Note A and Note X to the financial statements in Item 8 for information about the anticipated sale of the Clean Energy Businesses; and
•Con Edison Transmission, Inc., which through its subsidiaries, invests in electric transmission projects supporting Con Edison’s effort to transition to clean, renewable energy and through joint ventures manages both electric and gas assets while seeking to develop electric transmission projects (Con Edison Transmission, Inc., together with its subsidiaries referred to as Con Edison Transmission).
Con Edison anticipates that the Utilities, which are subject to extensive regulation, will continue to provide substantially all of its earnings over the next few years. The Utilities have approved rate plans that are generally designed to cover each company’s cost of service, including capital and other costs of each company’s energy delivery systems. The Utilities recover from their full-service customers (who purchase energy from them), generally on a current basis, the cost the Utilities pay for energy and charge all of their customers the cost of delivery service. See "Utility Regulation" in Item 1, "Risk Factors" in Item 1A "Financial and Commodity Market Risks - Commodity Price Risk" in Item 7 and "Rate Plans" in Note B to the financial statements in Item 8.
Significant Developments and Outlook
•Con Edison reported 20222023 net income of $2,519 million or $7.25 a share compared with $1,660 million or $4.68 a share compared with $1,346 million or $3.86 a share in 2021.2022. Adjusted earnings were $1,762 million or $5.07 a share in 2023 compared with $1,620 million or $4.57 a share in 2022 compared with $1,528 million or $4.39 a share in 2021.2022. See “Results of Operations” in Item 7 and “Non-GAAP Financial Measures,” below.
•In 2022,2023, the Utilities invested $4,001$4,379 million to upgrade and reinforce their energy delivery systems the Clean Energy Businesses invested $399 million in renewable electric projects and Con Edison Transmission invested $65$49 million primarily in electric transmission. For 2023, 2024, 2025, 2026, 2027 and 20252028, the Utilities expect to invest $4,675$4,822 million, $4,840$5,212 million, $5,879 million, $5,874 million and $4,957$5,867 million, respectively, for their energy delivery systems and Con Edison Transmission expects to invest $58$27 million, $6$31 million, $108 million, $113 million and $6$119 million, respectively, primarily in electric transmission. See "Capital Requirements and Resources - Capital Requirements" in Item 1.
•During the first nine months of 2022, Con Edison considered strategic alternatives with respect to the Clean Energy Businesses. In October 2022, following the conclusion of such review and to allow for continued focus on the Utilities and their clean energy transition, Con Edison entered into a purchase and sale agreement pursuant to which Con Edison agreed to sell the Clean Energy Businesses to RWE Renewables America, LLC, a subsidiary of RWE Aktiengesellschaft. The transaction is expected to close on or about the end of the first quarter of 2023, subject to satisfaction of certain conditions. The Clean Energy Businesses were classified as held for sale as of December 31, 2022. See “Assets and Liabilities Held for Sale” in Note A and Note X to the financial statements in Item 8.
•Con Edison plans to meet its capital requirements for 20232024 through 20252028 through internally-generated funds the anticipated net proceeds from the sale of the Clean Energy Businesses and the issuance of long-term debt
| | | | | |
CON EDISON ANNUAL REPORT 2022 | 7 |
and common equity. See “Capital Requirements and Resources - Capital Requirements” in Item 1. Subject to, and following the closing of the sale of the Clean Energy Businesses, Con Edison intends to repay $1,250 million of parent company debt in 2023, invest in the Utilities and repurchase up to $1,000 million of its common shares. In anticipation of the proceeds from the pending transaction, Con Edison intends to forego common equity issuances in 2023 and 2024 andEdison's plans on issuing up to $900 million of common equity in 2025. The company's plans also include the issuance of up to $1,400$3,250 million of long-term debt in 2024 and up to $1,000 million of long-term debt in 2025, including for maturing securities, at the Utilities in 2023 and approximately $2,600$6,000 million in aggregate of long-term debt, including for maturing securities, at the Utilities during 2026 through 2028. Except for equity issued under its dividend reinvestment, employee stock purchase and long-term incentive plans, Con Edison does not plan to issue common equity in 2024 and 2025.plans to issue common equity of approximately $1,300 million in 2025 and up to $2,800 million in aggregate during 2026 through 2028. Con Edison’s estimates of its capital requirements and related financing plans reflect information available and assumptions at the time the statements are made and include, among other things, the assumptions that Con Edison’s non-utility gas transmission investments remain unchanged through 2028 and the Utilities’ forecasted capital investments and financing plans through 2028 are approved by the New York State Public Service Commission (NYSPSC). Actual developments and the timing and amount of funding may differ materially.
| | | | | |
| CON EDISON ANNUAL REPORT 2023 | 7 |
•CECONY forecasts average annual increase in peak demand in its service area at design conditions over the next five years for electricity and gas to be approximately 0.60.7 percent and 1.0 percent, respectively and an average annual decrease in gas and steam peak demand in its service area at design weather conditions over the next five years to be approximately 0.1 percent.0.8 percent and 0.5 percent, respectively. O&R forecasts an average annual increase in electric peak demand in its service area at design conditions over the next five years to be approximately 0.42.0 percent and average annual decrease in gas peak demand in its service area over the next five years at design conditions to be approximately 0.10.2 percent. See “The Utilities” in Item 1.
•ForIn March 2023, Con Edison completed the year endedsale of all of the stock of Con Edison Clean Energy Businesses, Inc. (the “Clean Energy Businesses”). See Note W and Note X to the financial statements in Item 8.
•In June 2023, the New York Independent System Operator selected the Propel NY Energy transmission project that was jointly proposed by New York Transco LLC (New York Transco) and the New York Power Authority. Con Edison Transmission owns a 41.7 percent interest in New York Transco’s share of the Propel NY Energy project, a 90-mile electric transmission project with an in-service date of 2030. See "Con Edison Transmission," below.
•During the second quarter of 2023, construction of New York Transco’s New York Energy Solution (NYES) project to relieve transmission congestion between upstate and downstate was completed. Construction of the associated Dover Station, an additional network upgrade to support the NYES project, has not been completed. Con Edison Transmission owns a 45.7 percent interest in NYES. See "Con Edison Transmission," below.
•In July 2023, the NYSPSC approved the February 2023 joint proposal among CECONY, the New York State Department of Public Service (NYSDPS) and other parties for electric and gas rate plans for the three-year period January 1, 2023 through December 31, 2022, CECONY and O&R issued total credits of approximately $360 million and $6 million, respectively, towards reducing customers’ accounts receivable balances pursuant to COVID-19 arrears assistance programs.2025. See "COVID-19 Regulatory Matters""Rate Plans” in Note B to the financial statements in Item 8.
•PursuantIn November 2023, the NYSPSC approved the September 2023 joint proposal among CECONY, the NYSDPS and other parties for a steam rate plan for the three-year period November 1, 2023 through October 31, 2026 that includes, among other provisions, a weather normalization adjustment to reflect normal weather conditions during the heating season. See "Rate Plans” in Note B to the financial statements in Item 8.
•In November 2023, CECONY and O&R filed petitions with the NYSPSC for approval to make long-term investments of $903 million and $411 million, respectively, between 2025 and 2029 to protect their currentelectric systems from climate change. See “Clean Energy Future,” below.
•In January 2024, O&R filed a request with the NYSPSC for electric and gas rate plans, CECONYincreases of $18.1 million and O&R recorded $53$14.4 million, ($39respectively, effective January 2025. See "Rate Plans" in Note B to the financial statements in Item 8.
•In January 2024, the NYSPSC approved CECONY's August 2023 petition requesting authorization and cost recovery to construct two new substations in Jamaica, Queens (the Reliable Clean City - Idlewild Project) with an estimated cost of $1,200 million after-tax) and $3 million ($2 million after-tax)an estimated in-service date of revenues for the year ended December 31, 2022, respectively, of earnings adjustment mechanisms and positive incentives, primarily reflecting the achievement of certain energy efficiency measures, as compared with $92 million ($68 million after-tax) and $2 million ($2 million after- tax) for CECONY and O&R, respectively, for the year ended December 31, 2021 and $50 million ($37 million after-tax) and $3 million ($2 million after-tax) for CECONY and O&R, respectively, for the year ended December 31, 2020.May 2028. See "Rate Plans" in Note B to the financial statements in Item 8.
•The New York State Public Service Commission (NYSPSC)NYSPSC continued its focused operations audit of the Utilities related to income tax accounting. The audit is investigating the Utilities’ inadvertent understatement of a portion, the amount of which may be material, of their calculation of total federal income tax expense for ratemaking purposes. The understatement was related to the calculation of plant retirement-related cost of removal. See "Other Regulatory Matters" in Note B to the financial statements in Item 8.
•In November 2022, as updated in February 2023, CECONY filed a request with the NYSPSC for a steam rate increase of $141 million, effective November 2023. See "Rate Plans" in Note B to the financial statements in Item 8.
•In February 2023, CECONY, the New York State Department of Public Service (NYSDPS) and other parties entered into a Joint Proposal for CECONY electric and gas rate plans for the three-year period from January 2023 through December 2025. The Joint Proposal is subject to NYSPSC approval. See “Rate Plans” in Note B to the financial statements in Item 8.
•In January 2023, the NYSPSC issued an order implementing a Phase 2 COVID-19 arrears assistance program that provides credits towards reducing the arrears balances of residential and small commercial electric and gas customers of CECONY and O&R. At the time the order was issued, CECONY’s and O&R’s eligible arrears balances were estimated to be approximately $389 million and $3 million, respectively. The order authorizes a surcharge mechanism for recovery of the eligible credit amounts over a ten-year period commencing after credits are issued for CECONY and over a one-year period commencing after credits are issued for O&R. Pursuant to the order, CECONY and O&R agreed not to seek recovery of incremental financing costs incurred associated with arrears from March 2020 through December 2022 estimated to be $46 million, most of which is attributable to CECONY. To facilitate implementation, CECONY and O&R agreed to suspend residential terminations for non-payment through March 1, 2023 or 30 days after credits have been applied, whichever is later. See "COVID-19 Regulatory Matters" in Note B to the financial statements in Item 8.
| | | | | |
8 |
20222023 |
Available Information
Con Edison and CECONY file annual, quarterly and current reports and other information, and Con Edison files proxy statements, with the Securities and Exchange Commission (SEC). The SEC maintains an Internet site at www.sec.gov that contains reports, proxy statements, and other information regarding issuers (including Con Edison and CECONY) that file electronically with the SEC.
This information the Companies file with the SEC is also available free of charge on or through the investor information section of their websites as soon as reasonably practicable after the reports are electronically filed with, or furnished to, the SEC. Con Edison’s internet website is at: www.conedison.com; and CECONY’s is at: www.coned.com.
The "About Us - Corporate Governance" section of Con Edison’s website includes the company’s Standards of Business Conduct (its code of ethics) and amendments or waivers of the standards for executive officers or directors, corporate governance guidelines and the charters of the following committees of the company’s Board of Directors: Audit Committee, Corporate Governance and Nominating Committee, Management Development and Compensation Committee, and Safety, Environment, Operations, and Sustainability Committee. This information is available in print to any shareholder who requests it. Requests should be directed to: Corporate Secretary, Consolidated Edison, Inc., 4 Irving Place, New York, NY 10003.
The "About Us - Sustainability Report” section of Con Edison’s website includes “Leading the Clean Energy Transition,” the company’s 20212022 sustainability report.
Information on the Companies’ websites is not incorporated herein.
Forward-Looking Statements
This report contains forward-looking statements that are intended to qualify for the safe-harbor provisions of Section 27A of the Securities Act of 1933, as amended, and Section 21E of the Securities Exchange Act of 1934, as amended. Forward-looking statements are statements of future expectation and not facts. Words such as "forecasts," "expects," "estimates," "anticipates," "intends," "believes," "plans," "will," "target," "guidance," "potential," "consider" and similar expressions identify forward-looking statements. The forward-looking statements reflect information available and assumptions at the time the statements are made, and accordingly, speak only as of that time. Actual results or developments might differ materially from those included in the forward-looking statements because of various factors including, but not limited to, those discussed under “Risk Factors,” in Item 1A.
Non-GAAP Financial Measures
Adjusted earnings and adjusted earnings per share are financial measures that are not determined in accordance with generally accepted accounting principles in the United States of America (GAAP). These non-GAAP financial measures should not be considered as an alternative to net income for common stock or net income per share, respectively, each of which is an indicator of financial performance determined in accordance with GAAP. Adjusted earnings and adjusted earnings per share exclude from net income for common stock and net income per share, respectively, certain other items that the company does not consider indicative of its ongoing financial performance. Management uses these non-GAAP financial measures to facilitate the analysis of the company's financial performance as compared to its internal budgets and previous financial results and to communicate to investors and others the company’s expectations regarding its future earnings and dividends on its common stock. Management believes that these non-GAAP financial measures are also useful and meaningful to investors to facilitate their analysis of the company's financial performance. The following table is a reconciliation of Con Edison’s reported net income for common stock to adjusted earnings and reported earnings per share to adjusted earnings per share.
| | | | | |
CON EDISON ANNUAL REPORT 20222023 | 9 |
| | | | | | | | | | | | | | | | |
| (Millions of Dollars, except per share amounts) | | | 2020 | 2021 | 2022 | |
| Reported net income for common stock – GAAP basis | | | $1,101 | $1,346 | $1,660 | |
| | | | | | |
| | | | | | |
| | | | | | |
| | | | | | |
| | | | | | |
| | | | | | |
| | | | | | |
| | | | | | |
| | | | | | |
| | | | | | |
| | | | | | |
| | | | | | |
| | | | | | |
| | | | | | |
| | | | | | |
| | | | | | |
| | | | | | |
| Impact of the anticipated sale of the Clean Energy Businesses (pre-tax) (a) (b) | | | — | — | (13) | |
| Income taxes (c) | | | — | — | 127 | |
| Impact of the anticipated sale of the Clean Energy Businesses (net of tax) (a) (b) | | | — | — | 114 | |
| HLBV effects (pre-tax) (d) | | | 44 | (142) | (61) | |
| Income taxes (e) | | | (12) | 44 | 19 | |
| HLBV effects (net of tax) (d) | | | 32 | (98) | (42) | |
| Net mark-to-market effects (pre-tax) | | | 57 | (53) | (181) | |
| Income taxes (f) | | | (14) | 16 | 56 | |
| Net mark-to-market effects (net of tax) | | | 43 | (37) | (125) | |
| | | | | | |
| | | | | | |
| | | | | | |
| Loss from sale of a renewable electric project (pre-tax) | | | — | 4 | — | |
| Income taxes (g) | | | — | (1) | — | |
| Loss from sale of a renewable electric project (net of tax) | | | — | 3 | — | |
| Remeasurement of deferred state taxes related to prior year dispositions (net of federal taxes) | | | — | — | 13 | |
| Remeasurement of deferred state taxes related to prior year dispositions (net of federal taxes) | | | — | — | 13 | |
| Impairment loss related to investment in Stagecoach Gas Services LLC (pre-tax) (h) | | | — | 212 | — | |
| Income taxes (g) | | | — | (65) | — | |
| Impairment loss related to investment in Stagecoach Gas Services LLC (net of tax) (h) | | | — | 147 | — | |
| Impairment loss related to investment in Honeoye Storage Corporation (pre-tax) (i) | | | — | 5 | — | |
| Income taxes | | | — | — | — | |
| Impairment loss related to investment in Honeoye Storage Corporation (net of tax) (i) | | | — | 5 | — | |
| Impairment loss related to investment in Mountain Valley Pipeline, LLC (pre-tax) (j) | | | 320 | 231 | — | |
| Income taxes (g) | | | (97) | (69) | — | |
| Impairment loss related to investment in Mountain Valley Pipeline, LLC (net of tax) (j) | | | 223 | 162 | — | |
| | | | | | |
| Adjusted earnings (Non-GAAP) | | | $1,399 | $1,528 | $1,620 | |
| | | | | | |
| Reported earnings per share – GAAP basis (basic) | | | $3.29 | $3.86 | $4.68 | |
| | | | | | |
| | | | | | |
| | | | | | |
| | | | | | |
| | | | | | |
| | | | | | |
| | | | | | |
| | | | | | |
| | | | | | |
| | | | | | |
| | | | | | |
| | | | | | |
| | | | | | |
| | | | | | |
| | | | | | |
| | | | | | |
| | | | | | |
| Impact of the anticipated sale of the Clean Energy Businesses (pre-tax) (a) (b) | | | — | — | (0.03) | |
| Income taxes (c) | | | — | — | 0.35 | |
| Impact of the anticipated sale of the Clean Energy Businesses(net of tax) (a) (b) | | | — | — | 0.32 | |
| HLBV effects (pre-tax) (d) | | | 0.14 | (0.41) | (0.17) | |
| Income taxes (e) | | | (0.04) | 0.12 | | 0.05 | |
| HLBV effects (net of tax) (d) | | | 0.10 | (0.29) | (0.12) | |
| Net mark-to-market effects (pre-tax) | | | 0.18 | (0.15) | (0.51) | |
| Income taxes (f) | | | (0.05) | 0.05 | | 0.16 | |
| Net mark-to-market effects | | | 0.13 | (0.10) | (0.35) | |
| | | | | | |
| | | | | | |
| | | | | | |
| Loss from sale of a renewable electric project (pre-tax) | | | — | 0.01 | — | |
| Income taxes (g) | | | — | — | | — | |
| Loss from sale of a renewable electric project (net of tax) | | | — | 0.01 | — | |
| Remeasurement of deferred state taxes related to prior year dispositions (net of federal taxes) | | | — | — | 0.04 | |
| Remeasurement of deferred state taxes related to prior year dispositions (net of federal taxes) | | | — | — | 0.04 | |
| Impairment loss related to investment in Stagecoach Gas Services LLC (pre-tax) (h) | | | — | 0.61 | — | |
| Income taxes (g) | | | — | (0.19) | — | |
| Impairment loss related to investment in Stagecoach Gas Services LLC (net of tax) (h) | | | — | 0.42 | — | |
| Impairment loss related to investment in Honeoye Storage Corporation (pre-tax) (i) | | | — | 0.02 | — | |
| Income taxes | | | — | — | | — | |
| Impairment loss related to investment in Honeoye Storage Corporation (net of tax) (i) | | | — | 0.02 | — | |
| Impairment loss related to investment in Mountain Valley Pipeline, LLC (pre-tax) (j) | | | 0.95 | 0.66 | — | |
| Income taxes (g) | | | (0.29) | (0.19) | — | |
| Impairment loss related to investment in Mountain Valley Pipeline, LLC (net of tax) (j) | | | 0.66 | 0.47 | — | |
| | | | | | |
| | | | | | |
| | | | | | |
| | | | | | |
| | | | | | |
| | | | | | |
| | | | | | |
| Adjusted earnings per share (Non-GAAP) | | | $4.18 | $4.39 | $4.57 | |
| | | | | | | | | | | | | | | | |
| (Millions of Dollars, except per share amounts) | | | 2021 | 2022 | 2023 | |
| Reported net income for common stock – GAAP basis | | | $1,346 | $1,660 | $2,519 | |
| | | | | | |
| | | | | | |
| | | | | | |
| | | | | | |
| | | | | | |
| | | | | | |
| | | | | | |
| | | | | | |
| | | | | | |
| | | | | | |
| | | | | | |
| | | | | | |
| | | | | | |
| | | | | | |
| | | | | | |
| | | | | | |
| | | | | | |
| Gain and other impacts related to sale of the Clean Energy Businesses (pre-tax) (a) (b) | | | — | (13) | (887) | |
| Income taxes (c) | | | — | 127 | 113 | |
| Gain and other impacts related to sale of the Clean Energy Businesses (net of tax) (a) (b) | | | — | 114 | (774) | |
| HLBV effects (pre-tax) (d) | | | (142) | (61) | 11 | |
| Income taxes (e) | | | 44 | 19 | (3) | |
| HLBV effects (net of tax) (d) | | | (98) | (42) | 8 | |
| Net mark-to-market effects (pre-tax) | | | (53) | (181) | 13 | |
| Income taxes (f) | | | 16 | 56 | (4) | |
| Net mark-to-market effects (net of tax) | | | (37) | (125) | 9 | |
| | | | | | |
| | | | | | |
| | | | | | |
| Loss from sale of a renewable electric project (pre-tax) | | | 4 | — | — | |
| Income taxes (g) | | | (1) | — | — | |
| Loss from sale of a renewable electric project (net of tax) | | | 3 | — | — | |
| Remeasurement of deferred state taxes related to dispositions prior to 2022 (net of federal taxes) | | | — | 13 | — | |
| Remeasurement of deferred state taxes related to dispositions prior to 2022 (net of federal taxes) | | | — | 13 | — | |
| Impairment loss related to investment in Stagecoach Gas Services LLC (pre-tax) (h) | | | 212 | — | — | |
| Income taxes (g) | | | (65) | — | — | |
| Impairment loss related to investment in Stagecoach Gas Services LLC (net of tax) (h) | | | 147 | — | — | |
| Impairment loss related to investment in Honeoye Storage Corporation (pre-tax) (i) | | | 5 | — | — | |
| | | | | | |
| Impairment loss related to investment in Honeoye Storage Corporation (net of tax) (i) | | | 5 | — | — | |
| Impairment loss related to investment in Mountain Valley Pipeline, LLC (pre-tax) (j) | | | 231 | — | — | |
| Income taxes (g) | | | (69) | — | — | |
| Impairment loss related to investment in Mountain Valley Pipeline, LLC (net of tax) (j) | | | 162 | — | — | |
| | | | | | |
| Adjusted earnings (Non-GAAP) | | | $1,528 | $1,620 | $1,762 | |
| | | | | | |
| Reported earnings per share – GAAP basis (basic) | | | $3.86 | $4.68 | $7.25 | |
| | | | | | |
| | | | | | |
| | | | | | |
| | | | | | |
| | | | | | |
| | | | | | |
| | | | | | |
| | | | | | |
| | | | | | |
| | | | | | |
| | | | | | |
| | | | | | |
| | | | | | |
| | | | | | |
| | | | | | |
| | | | | | |
| | | | | | |
| Gain and other impacts related to sale of the Clean Energy Businesses (pre-tax) (a) (b) | | | — | (0.03) | (2.55) | |
| Income taxes (c) | | | — | 0.35 | 0.33 | |
| Gain and other impacts related to sale of the Clean Energy Businesses(net of tax) (a) (b) | | | — | 0.32 | (2.22) | |
| HLBV effects (pre-tax) (d) | | | (0.41) | (0.17) | 0.02 | |
| Income taxes (e) | | | 0.12 | 0.05 | | (0.01) | |
| HLBV effects (net of tax) (d) | | | (0.29) | (0.12) | 0.01 | |
| Net mark-to-market effects (pre-tax) | | | (0.15) | (0.51) | 0.04 | |
| Income taxes (f) | | | 0.05 | 0.16 | | (0.01) | |
| Net mark-to-market effects | | | (0.10) | (0.35) | 0.03 | |
| | | | | | |
| | | | | | |
| | | | | | |
| Loss from sale of a renewable electric project (pre-tax) | | | 0.01 | — | — | |
| | | | | | |
| Loss from sale of a renewable electric project (net of tax) | | | 0.01 | — | — | |
| Remeasurement of deferred state taxes related to dispositions prior to 2022 (net of federal taxes) | | | — | 0.04 | — | |
| Remeasurement of deferred state taxes related to dispositions prior to 2022 (net of federal taxes) | | | — | 0.04 | — | |
| Impairment loss related to investment in Stagecoach Gas Services LLC (pre-tax) (h) | | | 0.61 | — | — | |
| Income taxes (g) | | | (0.19) | — | — | |
| Impairment loss related to investment in Stagecoach Gas Services LLC (net of tax) (h) | | | 0.42 | — | — | |
| Impairment loss related to investment in Honeoye Storage Corporation (pre-tax) (i) | | | 0.02 | — | — | |
| | | | | | |
| Impairment loss related to investment in Honeoye Storage Corporation (net of tax) (i) | | | 0.02 | — | — | |
| Impairment loss related to investment in Mountain Valley Pipeline, LLC (pre-tax) (j) | | | 0.66 | — | — | |
| Income taxes (g) | | | (0.19) | — | — | |
| Impairment loss related to investment in Mountain Valley Pipeline, LLC (net of tax) (j) | | | 0.47 | — | — | |
| | | | | | |
| | | | | | |
| | | | | | |
| | | | | | |
| | | | | | |
| | | | | | |
| | | | | | |
| Adjusted earnings per share (Non-GAAP) | | | $4.39 | $4.57 | $5.07 | |
| | | | | |
10 |
20222023 |
a.TheOn March 1, 2023, Con Edison completed the sale of all of the stock of the Clean Energy Businesses were classified as held for sale as of December 31, 2022.Businesses. See “Assets and Liabilities Held for Sale” in Note AW and Note X to the financial statements in Item 8.
b.The impactgain and other impacts related to the sale of the anticipatedClean Energy Businesses for the year ended December 31, 2023 is comprised of the gain on the sale of the Clean Energy Businesses ($(2.49) a share and $(2.21) a share net of tax or $(865) million and $(767) million net of tax), transaction costs and other accruals ($0.05 a share and $0.04 a share net of tax or $19 million and $14 million net of tax) and the effects of ceasing to record depreciation and amortization expenses on the Clean Energy Businesses’ assets ($(0.11) a share and $(0.07) a share net of tax or $(41) million and $(28) million net of tax). The impacts related to the sale of the Clean Energy Businesses is comprised of: transaction costs ($0.14 a share and $0.10 a share net of tax or $48 million and $35 million net of tax) and the effects of ceasing to record depreciation and amortization expenses on the Clean Energy Businesses’ assets ($(0.17) a share and $(0.12) a share net of tax or $(61) million and $(42) million net of tax) for the year ended December 31, 2022.
c.Amounts shown include the impact of the changes in state unitary tax apportionments ($0.02 a share net of federal taxes or $7 million net of federal taxes) for the year ended December 31, 2023. The amount of income taxes for transaction costs and other accruals and the effects of ceasing to record depreciation and amortization expenses were calculated using a combined federal and state income tax rate of 27 percent and 32 percent, respectively, for the year ended December 31, 2023. The amount of income taxes for the gain on the sale of the Clean Energy Businesses had an effective tax rate of 11 percent for the year ended December 31, 2023.Amounts shown include the impact of the remeasurement of deferred state taxes and the valuation allowance for deferred tax assets ($0.34 a share net of federal taxes or $121 million net of federal taxes). for the year ended December 31, 2022. The amount of income taxes for transaction costs and the effects of ceasing to record depreciation and amortization expenses was calculated using a combined federal and state income tax rate of 27%27 percent and 31%31 percent for the year ended December 31, 2022, respectively.
d.Income attributable to the non-controlling interest of a tax-equity investor in renewable electric projects accounted for under the hypothetical liquidation at book value (HLBV) method of accounting. See Note S to the financial statements in Item 8.
e.The amount of income taxes was calculated using a combined federal and state income tax rate of 31%, 31%25 percent, 31 percent and 27%,31 percent, for the year ended December 31, 2022, 2021 and 2020, respectively. Adjusted earnings and adjusted earnings per share for2023, 2022 and 2021, exclude the tax impact on the parent company of HLBV accounting ($(4) million and $(0.02) and $(9) million and $(0.02)) for the year ended December 31, 2022 and 2021, respectively) of the Clean Energy Businesses. Adjusted earnings and adjusted earnings per share for 2020 do not exclude the tax impact on the parent company of HLBV accounting ($(3) million and $(0.01) for the year ended December 31, 2020) of the Clean Energy Businesses.respectively.
f.The amount of income taxes was calculated using a combined federal and state income tax rate of 31%, 32%32 percent, 31 percent and 25%32 percent for the year ended December 31, 2022, 2021 and 2020, respectively. Adjusted earnings and adjusted earnings per share for2023, 2022 and 2021, exclude the tax impact on the parent company of the mark-to-market effects ($(10) million and $(0.03) and $(3) million and $(0.01) for the year ended December 31, 2022 and 2021) of the Clean Energy Businesses. Adjusted earnings and adjusted earnings per share for 2020 do not exclude the tax impact on the parent company of the mark-to-market effects (($4) million and ($0.01) for the year ended December 31, 2020) of the Clean Energy Businesses.respectively.
g.The amount of income taxes was calculated using a combined federal and state income tax rate between 26-30%26-30 percent for the year ended December 31, 2021 and a combined federal and state income tax rate of 30% for the year ended December 31, 2020.2021.
h.Loss recognized with respect to the partial impairment of CET’sCon Edison Transmission’s investment in Stagecoach Gas Services LLC. See "Investments - 2021 Partial Impairment of Investment in Stagecoach Gas Services" in Note A and Note W.
i.Loss recognized with respect to the goodwill impairment of CET’sCon Edison Transmission’s investment in Honeoye Storage Corporation. See Note K.
j.Losses recognized with respect to the partial impairments of CET'sCon Edison Transmission's investment in Mountain Valley Pipeline, LLC. See "Investments - 2020 and 2021 Partial Impairments of Investment in Mountain Valley Pipeline, LLC (MVP)" in Note A to the financial statements in Item 8.
| | | | | |
CON EDISON ANNUAL REPORT 20222023 | 11 |
Item 1: Business
| | | | | |
12 |
20222023 |
Incorporation By Reference
Information in any item of this report as to which reference is made in this Item 1 is hereby incorporated by reference in this Item 1. The use of terms such as “see” or “refer to” shall be deemed to incorporate into Item 1 at the place such term is used the information to which such reference is made.
| | | | | |
CON EDISON ANNUAL REPORT 20222023 | 13 |
PART I
Item 1: Business
Overview
Consolidated Edison, Inc. (Con Edison), incorporated in New York State in 1997, is a holding company that owns all of the outstanding common stock of Consolidated Edison Company of New York, Inc. (CECONY), Orange and Rockland Utilities, Inc. (O&R), Con Edison Clean Energy Businesses, Inc. and Con Edison Transmission, Inc. As used in this report, the term the “Companies” refers to Con Edison and CECONY.
| | | | | | | | | | | | | | | | | | | | | | | | | | | | | | | | |
| | | | Con Edison | | | | |
| | | | | | | | | | |
| | | | | | | | | | |
| CECONY | | O&R | | | Clean Energy Businesses | Con Edison Transmission |
| | •RECO
| | | (Classified as held for sale as of December 31, 2022) |
|
| | | | | | |
Con Edison’s principal business operations are those of CECONY, O&R the Clean Energy Businesses and Con Edison Transmission. CECONY’s principal business operations are its regulated electric, gas and steam delivery businesses. O&R’s principal business operations are its regulated electric and gas delivery businesses. The Clean Energy Businesses develop, own and operate renewable energy infrastructure projects and provide energy-related products and services to wholesale and retail customers. In October 2022, Con Edison entered into a purchase and sale agreement pursuant to which Con Edison agreed to sell the Clean Energy Businesses to RWE Renewables America, LLC, a subsidiary of RWE Aktiengesellschaft. The transaction is expected to close on or about the end of the first quarter of 2023, subject to satisfaction of certain conditions. The Clean Energy Businesses were classified as held for sale as of December 31, 2022. See “Assets and Liabilities Held for Sale” in Note A and Note X to the financial statements in Item 8. Con Edison Transmission invests in electric transmission projects and manages both electric and gas assets while seeking to develop electric transmission projects.On March 1, 2023, Con Edison completed the sale of all of the stock of the Clean Energy Businesses and therefore 2023 reflects the financial results for the two months ended February 2023. See Note W and Note X to the financial statements in Item 8.
Con Edison seeks to provide shareholder value through continued dividend growth, supported by earnings growth in regulated utilities and contracted electric transmission assets. The company invests to provide reliable, resilient, safe and clean energy critical for its NYNew York customers. Con Edison is a responsible neighbor, helping the communities it serves become more sustainable.
CECONY
Electric
CECONY provides electric service to approximately 3.63.7 million customers in all of New York City (except a part of Queens) and most of Westchester County, an approximately 660 square mile service area with a population of more than nine million.
Gas
CECONY delivers gas to approximately 1.1 million customers in Manhattan, the Bronx, parts of Queens and most of Westchester County.
Steam
CECONY operates the largest steam distribution system in the United States by producing and delivering approximately 17,42715,444 MMlb of steam annually to approximately 1,530 customers in parts of Manhattan.
| | | | | |
14 |
20222023 |
O&R
Electric
O&R and its utility subsidiary, Rockland Electric Company (RECO) (together referred to herein as O&R) provide electric service to approximately 0.3 million customers in southeastern NYNew York and northern NJ,New Jersey, an approximately 1,300 square mile service area.
Gas
O&R delivers gas to over 0.10.2 million customers in southeastern NY.New York.
Clean Energy Businesses
Con Edison Clean Energy Businesses, Inc., together with its subsidiaries, are referred to in this report as the Clean Energy Businesses. The Clean Energy Businesses develop, own and operate renewable energy infrastructure projects and provide energy-related products and services to wholesale and retail customers. The Clean Energy Businesses have approximately 3,300 megawatts (AC) of renewable energy projects in the U.S.
During the first nine months of 2022, Con Edison considered strategic alternatives with respect to the Clean Energy Businesses. In October 2022, following the conclusion of such review and to allow for continued focus on the Utilities and their clean energy transition, Con Edison entered into a purchase and sale agreement pursuant to which Con Edison agreed to sell the Clean Energy Businesses to RWE Renewables America, LLC, a subsidiary of RWE Aktiengesellschaft. The transaction is expected to close on or about the end of the first quarter of 2023, subject to satisfaction of certain conditions. The Clean Energy Businesses were classified as held for sale as of December 31, 2022. See “Assets and Liabilities Held for Sale” in Note A and Note X to the financial statements in Item 8.
Con Edison Transmission
Con Edison Transmission Inc. investsowns a 45.7 percent interest in New York Transco LLC (New York Transco), a New York limited liability company that was formed in November 2014 by affiliates of the four investor-owned electric utilities in New York, including Con Edison Transmission, to develop and own new electric transmission projects and manages bothfor the New York bulk electric and gas assets. CET ownssystem. Con Edison Transmission’s ownership interest in New York Transco is comprised of: (1) a 45.7 percent interest in New York Transco LLC, which owns and has been selected to build additionalTransco's Transmission Owner Transmission Solutions, a group of three electric power bulk transmission projects, (2) a 45.7 percent interest in New York Transco’s New York Energy Solution, an electric transmission assetsproject built to relieve transmission congestion between upstate and downstate New York, and a 41.7 percent interest in NY. CETNew York Transco’s share of Propel NY Energy, a proposed electric transmission project expected to deliver offshore wind electricity and CECONY ownincrease high voltage transmission connections between Long Island and the rest of New York State.
Con Edison Transmission also owns a 71.2 percent and 28.8 percent interests, respectively,interest in Honeoye Storage Corporation (Honeoye), which operates a gas storage facility in upstate NY.New York, with the remaining 28.8 percent held by CECONY. In addition, CETCon Edison Transmission owns a 9.67.9 percent interest (that is expected to be reduced to 8.0approximately 7.0 percent based on the current project cost estimate and CET's’Con Edison Transmission’s previous capping of its cash contributions to the joint venture) in Mountain Valley Pipeline LLC, (MVP), a joint venture developing a proposed 300-mile gas transmission project in WVWest Virginia and VA.
Utility Regulation
State Utility Regulation
Regulators
The Utilities are subject to regulation by the NYSPSC, that under the New York Public Service Law, is authorized to set the terms of service and the rates the Utilities charge for providing service in NY.New York. See “Rate Plans,” below and in Note B to the financial statements in Item 8. The NYSPSC also approves the issuance of the Utilities’ securities and transactions between the Utilities and Con Edison and its other subsidiaries. See “Capital Resources,” below and Note U to the financial statements in Item 8. The NYSPSC exercises jurisdiction over the siting of electric transmission lines in NYNew York State (see “Con Edison Transmission,” below) and approves mergers or other business combinations involving NYNew York utilities.
In addition, under the New York Public Service Law, the NYSPSC has the authority to (i) impose penalties on NYNew York utilities, which could be material, for violating state utility laws and regulations and its orders; (ii) review, at least every five years, an electric and gas utility’s capability to provide safe, adequate and reliable service, order the utility to comply with additional and more stringent terms of service than existed prior to the review, assess the continued operation of the utility as the provider of electric service in its service territory and propose, and act upon, such measures as are necessary to ensure safe and adequate service; and (iii) based on findings of repeated violations of the New York Public Service Law or rules or regulations adopted thereto that demonstrate a failure of a combination gas and electric utility to continue to provide safe and adequate service, revoke or modify an operating certificate issued to the utility by the NYSPSC (following consideration of certain factors, including public interest and standards deemed necessary by the NYSPSC to ensure continuity of service, and due process). See "Risk Factors" in Item 1A and “Other Regulatory Matters” and "COVID-19 Regulatory Matters" in Note B to the financial statements in Item 8. O&R’s NJNew Jersey subsidiary, RECO, is subject to regulation by the New Jersey Board of Public Utilities (NJBPU). The NYSPSC, together with the NJBPU, are referred to herein as state utility regulators.
| | | | | |
CON EDISON ANNUAL REPORT 20222023 | 15 |
New York Utility Industry
Restructuring in the 1990s
In the 1990s, the NYSPSC restructured the electric utility industry in the state. In accordance with NYSPSC orders, the Utilities sold all of their electric generating facilities other than those that also produce steam for CECONY’s steam business (see "Electric Operations – Electric Facilities," below) and provided all of their customers the choice to buy electricity or gas from the Utilities or other suppliers (see "Electric Operations – Electric Sales and Deliveries" and "Gas Operations – Gas Sales and Deliveries," below). In 2022,2023, 57 percent of the electricity and 3331 percent of the gas CECONY delivered to its customers, and 4947 percent of the electricity and 2422 percent of the gas O&R delivered to its customers, was purchased by the customers from other suppliers. In addition, the Utilities no longer control and operate their bulk power electric transmission facilities. See “New York Independent System Operator (NYISO),” below.
Following industry restructuring, there were several utility mergers as a result of which substantially all of the electric and gas delivery service in NYNew York State is now provided by one of five investor-owned utility companies – Con Edison, National Grid plc, Avangrid, Inc. (an affiliate of Iberdrola, S.A.), National Fuel Gas Company or CH Energy Group, Inc. (a subsidiary of Fortis Inc.) – or one of two state authorities – New York Power Authority (NYPA) or Long Island Power Authority.
Rate Plans
Investor-owned utilities in the United States provide delivery service to customers according to the terms of tariffs approved by the appropriate state utility regulator. The tariffs include schedules of rates for service that limit the rates charged by the utilities to amounts that the utilities recover from their customers for costs approved by the regulator, including capital costs, of providing service to customers as defined by the tariff. The tariffs implement rate plans adopted by state utility regulators in rate orders issued at the conclusion of rate proceedings. The utilities’ earnings depend on the limits on rates authorized in, and the other provisions of, their rate plans and their ability to operate their businesses in a manner consistent with such rate plans.
The utilities’ rate plans cover specified periods, but rates determined pursuant to a plan generally continue in effect until a new rate plan is approved by the state utility regulator. In NY,New York, either the utility or the NYSPSC can commence a proceeding for a new rate plan, and a new rate plan filed by the utility will generally take effect automatically in approximately 11 months unless prior to such time the NYSPSC approves a rate plan. The NYSPSC may request that the utility agree to suspend its request for new rates beyond the 11 month period, but if the utility agrees then the NYSPSC typically allows the utility to recover its new rates as if they went into effect at the 11-month date.
In each rate proceeding, rates are determined by the state utility regulator following the submission by the utility of testimony and supporting information, which are subject to review by the staff of the regulator. Other parties with an interest in the proceeding can also review the utility’s proposal and become involved in the rate proceeding. In NYNew York State, the review process is overseen by an administrative law judge who is employed by the NYSPSC. After an administrative law judge issues a recommended decision that generally considers the interests of the utility, the regulatory staff, other parties and legal requisites, the regulator will issue a rate order. The utility and the regulator’s staff and interested parties may enter jointly into a proposed settlement agreement prior to the completion of this administrative process, in which case the agreement could be approved by the regulator with or without modification.
For each rate plan, the revenues needed to provide the utility a return on invested capital is determined by multiplying the utilities’ rate base by the pre-tax weighted average cost of capital determined in the rate plan. In general, rate base, as reflected in a utility's rate plans, is the sum of the utility’s net plant, working capital and certain regulatory assets less deferred taxes and certain regulatory liabilities. The NYSPSC uses a forecast of the average rate base for the year that new rates would be in effect (rate year). The NJBPU uses the rate base balances that exist at the end of the historical 12-month period on which base rates are set. The capital structure used in the weighted average cost of capital is determined using actual and forecast data for the same time periods as rate base. The costs of long-term debt, customer deposits and the allowed return on common equity represent a combination of actual and forecast financing information. The allowed return on common equity is determined by each state’s respective utility regulator. The NYSPSC’s current methodology for determining the allowed return on common equity assigns a one-third weight to an estimate determined from a capital asset pricing model applied to a peer group of utility companies and a two-thirds weight to an estimate determined from a dividend discount model using stock prices and dividend forecasts for a peer group of utility companies. Both methodologies employ market measurements of equity capital to estimate returns rather than the accounting measurements to which such estimates are applied in setting rates.
| | | | | |
16 |
20222023 |
Pursuant to the Utilities’ rate plans, there generally can be no change to the rates charged to customers during the respective terms of the rate plans other than specified adjustments provided for in the rate plans.
For information about the Utilities’ rate plans, see Note B to the financial statements in Item 8.
Liability for Service Interruptions
The tariff provisions under which CECONY provides electric, gas and steam service, and O&R provides electric and gas service, limit each company’s liability to pay for damages resulting from service interruptions to circumstances resulting from its gross negligence or willful misconduct. Under RECO's tariff provisions for electric service, the company is not liable for interruptions that are due to causes beyond its control.
CECONY’s and O&R’s tariffs for electric and gas service also provide for compensation to residential and small business customers that experience widespread prolonged outages lasting more than seventy-two consecutive hours, subject to certain exceptions, including: for residential customers, a bill credit of $25 for each twenty-four hour period of service outage beyond the first seventy-two consecutive hour outage; for residential and small business customers, reimbursement for food spoilage of up to $540; and reimbursement of affected residential customers for prescription medicine spoilage losses without limitation. Any such costs incurred by utilities are not recoverable from customers. Utilities may petition the NYSPSC to request a waiver of the requirement that it compensate customers after widespread prolonged outages. CECONY’s electric tariff requires it to also compensate customers for certain other service outages resulting from malfunctions in the company’s lines and cable of 33 kV or less or associated equipment, including, for residential customers, up to $540$580 for food spoilage and actual losses for prescription medicine losses, and for all other customers, up to $10,700$11,460 for losses of perishable merchandise.
The NYSPSC has approved a scorecard for use as a guide to assess electric utility performance in restoring electric service during outages that result from a major storm. The scorecard could also be applied by the NYSPSC for other outages or actions. The scorecard includes performance metrics in categories for preparation, operations response, and communications.
Each NYNew York electric utility is required to submit to the NYSPSC annually an emergency response plan for the reasonably prompt restoration of service in the case of widespread outages in the utility’s service territory due to storms or other events beyond the control of the utility. If, after evidentiary hearings or other investigatory proceedings, the NYSPSC finds that the utility failed to reasonably implement its plan during an event, the NYSPSC may impose penalties or deny recovery of any part of the service restoration costs caused by such failure. TheIn April 2023, the NYSPSC approved CECONY’s and O&R's emergency response plan in July 2022 and O&R’s emergency response plan in May 2022.plans. In December 2022,2023, CECONY and O&R each submitted updated emergency response plans for 2023.2024.
Generic Proceedings
The NYSPSC from time to time conducts “generic” proceedings to consider issues relating to all electric and gas utilities operating in NYNew York State. Proceedings include clean energy and related implementation proceedings, such as the Climate Leadership and Community Protection Act proceeding, and proceedings relating to energy affordability, data access, retail access, gas planning, energy efficiency and renewable energy programs, and negative revenue adjustments for billing delays related to community solar generation projects. The Utilities typically are active participants in such proceedings.
Federal Utility Regulation
The Federal Energy Regulatory Commission (FERC), among other things, regulates the transmission and wholesale sales of electricity in interstate commerce and the transmission and sale of natural gas for resale in interstate commerce. In addition, the FERC has the authority tocan impose substantial penalties, which could be substantial, including penalties for the violationviolations of reliability and cyber securitycybersecurity rules. Certain activities of the Utilities the Clean Energy Businesses (which were classified as held for sale as of December 31, 2022) and Con Edison Transmission are subject to the jurisdiction of the FERC. The Utilities are subject to regulation by the FERC with respect to electric transmission rates and to regulation by the NYSPSC with respect to electric and gas retail commodity sales and local delivery service. As a matter of practice, the NYSPSC has approved delivery service rates for the Utilities that include both transmission and distribution costs. Wholesale energy and capacity products sold by the Clean Energy Businesses to the regional electric markets are subject to FERC jurisdiction as defined by the independent system operator tariffs. The electric and gas transmission projects in which CETCon Edison Transmission invests are also subject to regulation by the FERC. See “Con Edison Transmission,” below.
| | | | | |
CON EDISON ANNUAL REPORT 20222023 | 17 |
New York Independent System Operator (NYISO)
The NYISO is a not-for-profit organization that controls and directs the operation of most of the electric transmission facilities in NYNew York State, including those of the Utilities, as an integrated system. It also administers wholesale markets for electricity in NYNew York State and facilitates the construction of new transmission it considers necessary to meet identified reliability, economic or public policy needs. The New York State Reliability Council (NYSRC) promulgates reliability standards subject to FERC oversight, and the NYISO has agreed to comply with those standards. Pursuant to a requirement that is set annually by the NYSRC, the NYISO requires that entities supplying electricity to customers in NYNew York State have generating capacity (owned, procured through the NYISO capacity markets or contracted for) in an amount equal to the peak demand of their customers plus the applicable reserve margin. In addition, the NYISO has determined that entities that serve customers in New York City must procure sufficient capacity from resources that are electrically located in New York City to cover a substantial percentage of the peak demands of their New York City customers. The NYISO also requires entities that serve customers in the Lower Hudson Valley and New York City customers that are served through the Lower Hudson Valley to procure sufficient capacity from resources electrically located in the Lower Hudson Valley. These requirements apply both to regulated utilities such as CECONY and O&R for the customers they supply under regulated tariffs and to other load serving entities that supply customers on market terms. RECO, O&R’s NJ subsidiary, provides electric service in a portion of its service territory that has a different independent system operator – PJM Interconnection LLC (PJM). See “CECONY – Electric Operations – Electric Supply” and “O&R – Electric Operations – Electric Supply,” below.
Cyber Regulation
The Companies are subject to cyber regulation by federal agencies, including FERC, the Transportation Security Agency and the Cybersecurity and Infrastructure Security Agency. The Utilities are subject to cyber regulation by the NYSPSC, that under the New York Public Service Law, is authorized to evaluate annually the utility’s customer privacy protections, including, but not limited to, customer electric and gas consumption data, and protection of critical energy infrastructure. In March 2023, the New York State legislature amended the New York State Public Service Law, directing the NYSPSC to develop rules to direct electric and gas utilities to, among other things, protect customer privacy, including customer consumption data, from unauthorized disclosure; (ii) develop and implement tools to monitor operational control networks to detect unauthorized network behavior; and (iii) mandate that utilities’ emergency response plans include cyberattack response plans. O&R’s subsidiary, RECO, is subject to cyber regulation by the NJBPU. See “The Companies Are Extensively Regulated And Are Subject To Penalties” and "A Cyber Attack Could Adversely Affect the Companies" in Item 1A.1A and Item 1C: Cybersecurity.
Competition
The subset of distributed energy resources (DER) that produce electricity is collectively called distributed generation (DG). DG includes solar energy production facilities, fuel cells, and micro-turbines, and provides an alternative source of electricity for the Utilities’ electric delivery customers. Energy storage, though not a form of DG, is also a source of electricity for the Utilities’ electric delivery customers. Typically, customers with DG remain connected to the utility’s delivery system and do not pay a different rate. Gas delivery customers have electricity, oil and propane as alternatives, and steam customers have electricity, oil and natural gas as alternative sources for heating and cooling their buildings. Micro-grids and community-based micro-grids enable DG to serve multiple locations and multiple customers. Demand reduction and energy efficiency investments provide ways for energy consumers within the Utilities’ service areas to lower their energy usage. The Companies expect DERs and electric alternatives to gas and steam, to increase, and for gas and steam usage to decrease, as the Climate Leadership and Community Protection Act enacted by New York State and the Climate Mobilization Act enacted by New York City continue to be implemented. In December 2021, New York City enacted a law that will phase-out the use of natural gas in certain new construction buildings, including major renovations, in New York City. See “Environmental Matters – Clean Energy Future,” below. CECONY’s smart solutions for gas customers include energy efficiency and heating electrification programs. See “CECONY- Gas Operations - Gas Peak Demand,” below. The following table shows the aggregate capacities of the DG projects connected to the Utilities’ distribution systems at the end of the last five years:
| | | | | |
18 |
20222023 |
| | | | | | | | | | | | | | | | | | | | | | | | | | | | | | | | |
| Technology | CECONY | O&R |
| Total MW, except project number | 2018 | 2019 | 2020 | 2021 | 2022 | 2018 | 2019 | 2020 | 2021 | 2022 |
| Internal-combustion engines | 110 | | 114 | | 129 | | 155 | | 157 | | 2 | | 3 | | 3 | | 3 | | 3 | |
| Photovoltaic solar | 226 | | 276 | | 323 | | 398 | | 487 | | 96 | | 121 | | 154 | | 183 | | 213 | |
| Battery energy storage | — | | 8 | | 13 | | 18 | | 25 | | — | | 1 | | 6 | | 11 | | 25 | |
| Gas turbines | 48 | | 48 | | 53 | | 61 | | 61 | | 20 | | 20 | | 20 | | 20 | | 20 | |
| Micro turbines | 17 | | 18 | | 21 | | 23 | | 24 | | 1 | | 1 | | 1 | | 1 | | 1 | |
| Fuel cells | 13 | | 20 | | 30 | | 30 | | 45 | | — | | — | | — | | — | | — | |
| Steam turbines | 6 | | 6 | | 6 | | 6 | | 6 | | — | | — | | — | | — | | — | |
| Landfill | — | | — | | — | | — | | — | | 2 | | 2 | | 2 | | 2 | | 2 | |
| Total distribution-level DG | 420 | | 490 | | 575 | | 691 | | 805 | | 121 | | 148 | | 186 | | 220 | | 264 | |
| Number of DG projects | 23,942 | | 30,539 | | 36,194 | | 43,702 | | 53,498 | | 7,566 | | 8,687 | | 9,643 | | 10,913 | | 12,448 | |
The Clean Energy Businesses participate in competitive renewable energy infrastructure projects and provide energy-related products and services that are subject to different risks than those found in the businesses of the Utilities. The Clean Energy Businesses were classified as held for sale as of December 31, 2022. See “Assets and Liabilities Held for Sale” in Note A and Note X to the financial statements in Item 8. Con Edison Transmission invests in electric transmission projects and manages both electric and gas assets, the current and prospective customers of which may have competitive alternatives. See "Con Edison Transmission," below.
| | | | | | | | | | | | | | | | | | | | | | | | | | | | | | | | |
| Technology | CECONY | O&R |
| Total MW, except project number | 2019 | 2020 | 2021 | 2022 | 2023 | 2019 | 2020 | 2021 | 2022 | 2023 |
| Internal-combustion engines | 114 | | 129 | | 155 | | 157 | | 160 | | 3 | | 3 | | 3 | | 3 | | 3 | |
| Photovoltaic solar | 276 | | 323 | | 398 | | 487 | | 579 | | 121 | | 154 | | 183 | | 213 | | 243 | |
| Battery energy storage | 8 | | 13 | | 18 | | 25 | | 47 | | 1 | | 6 | | 11 | | 25 | | 36 | |
| Gas turbines | 48 | | 53 | | 61 | | 61 | | 61 | | 20 | | 20 | | 20 | | 20 | | 20 | |
| Micro turbines | 18 | | 21 | | 23 | | 24 | | 24 | | 1 | | 1 | | 1 | | 1 | | 1 | |
| Fuel cells | 20 | | 30 | | 30 | | 45 | | 46 | | — | | — | | — | | — | | — | |
| Steam turbines | 6 | | 6 | | 6 | | 6 | | 6 | | — | | — | | — | | — | | — | |
| Landfill | — | | — | | — | | — | | — | | 2 | | 2 | | 2 | | 2 | | 2 | |
| Total distribution-level DG | 490 | | 575 | | 691 | | 805 | | 923 | | 148 | | 186 | | 220 | | 264 | | 305 | |
| Number of DG projects | 30,539 | | 36,194 | | 43,702 | | 53,498 | | 65,758 | | 8,687 | | 9,643 | | 10,913 | | 12,448 | | 14,201 | |
The Utilities do not consider it reasonably likely that another company would be authorized to provide utility delivery service of electricity, gas or steam where the company already provides service. Any such other company would need to obtain NYSPSC consent, satisfy applicable local requirements, install facilities to provide the service, meet applicable services standards and charge customers comparable taxes and other fees and costs imposed on the service. A new delivery company would also be subject to extensive ongoing regulation by the NYSPSC. See “Utility Regulation – State Utility Regulation – Regulators,” above, "The Companies Are Extensively Regulated And Are Subject To Substantial Penalties" in Item 1A and “Other Regulatory Matters” in Note B to the financial statements in Item 8. Con Edison Transmission invests in electric transmission projects and manages both electric and gas assets, the current and prospective customers of which may have competitive alternatives. See "Con Edison Transmission," below.
The Utilities
CECONY
CECONY, incorporated in New York State in 1884, is a subsidiary of Con Edison and has no significant subsidiaries of its own. Its principal business segments are its regulated electric, gas and steam businesses.
For a discussion of the company’s operating revenues and operating income for each segment, see “Results of Operations” in Item 7. For additional information about the segments, see Note P to the financial statements in Item 8.
Electric Operations
Electric Facilities
CECONY’s capitalized costs for utility plant, net of accumulated depreciation, for distribution facilities were $22,130$23,238 million and $21,240$22,130 million at December 31, 20222023 and 2021,2022, respectively. For its transmission facilities, the costs for utility plant, net of accumulated depreciation, were $3,916$4,333 million and $3,658$3,916 million at December 31, 20222023 and 2021,2022, respectively, and for its portion of the steam-electric generation facilities, the costs for utility plant, net of accumulated depreciation, were $534$580 million and $559$534 million, at December 31, 20222023 and 2021,2022, respectively. See "CECONY – Steam Operations – Steam Facilities," below.
Distribution Facilities
CECONY owns 63 area distribution substations and various distribution facilities located throughout New York City and Westchester County. At December 31, 2022,2023, the company’s distribution system had a transformer capacity of 33,70332,636 MVA, with 37,48937,633 miles of overhead distribution lines and 98,43498,789 miles of underground distribution lines. The underground distribution lines represent the single longest underground electric delivery system in the United States.
| | | | | |
CON EDISON ANNUAL REPORT 2022 | 19 |
Transmission Facilities
CECONY’s transmission facilities are located in New York City and Westchester, Orange, Rockland, Putnam and Dutchess counties in New York State. AtOn December 31, 2022,2023, the company owned or jointly owned 569490 miles of overhead circuits operating at 138, 230, 345 and 500 kV and 755760 miles of underground circuits operating at 69, 138 and 345 kV. The company’s 40 transmission substations and 63 area stations are supplied by circuits operated at 69 kV and above. CECONY’s transmission facilities interconnect with those of National Grid, Central Hudson Gas & Electric Corporation, O&R, New York State Electric & Gas, Connecticut Light & Power Company,Eversource Energy, Long Island Power Authority, NYPA, New York Transco and Public Service Electric and Gas Company.
| | | | | |
| CON EDISON ANNUAL REPORT 2023 | 19 |
Generating Facilities
CECONY’s electric generating facilities consist of plants located in Manhattan whose primary purpose is to produce steam for the company's steam business.business and also co-produce electricity. The facilities have a combined electric nameplate capacity of approximately 780694 MW. The company expects to have sufficient amounts of gas and fuel oil available in 20232024 for use in these facilities.
Electric Sales and Deliveries
CECONY delivers electricity to its full-service customers who purchase electricity from the company. Under the company's retail choice program, CECONY also delivers electricity to its customers who choose to purchase electricity from other load serving entities. In addition, the company delivers electricity to state and municipal customers of the NYPA.
The company charges all customers in its service area for the delivery of electricity. The company generally recovers, on a current basis, the cost of the electricity that it buys and then sells to its full-service customers. It does not make any margin or profit on the electricity it sells. CECONY’s electric delivery revenues are subject to a revenue decoupling mechanism. As a result, its electric delivery revenues are generally not affected by changes in delivery volumes from levels assumed when rates were approved. CECONY’s electric sales and deliveries for the last five years were:
| | | | | Year Ended December 31, | | | Year Ended December 31, |
| | | | 2018 | | 2019 | | 2020 | | 2021 | | 2022 | | | 2019 | | 2020 | | 2021 | | 2022 | | 2023 |
Electric Energy Delivered (millions of kWh) | Electric Energy Delivered (millions of kWh) | |
| CECONY full service customers | CECONY full service customers | | 20,452 | | 20,579 | | 20,544 | | 20,710 | | 22,547 |
| CECONY full service customers | |
| CECONY full service customers | | | 20,579 | | 20,544 | | 20,710 | | 22,547 | | 22,657 |
| Delivery service for retail choice customers | Delivery service for retail choice customers | | 26,266 | | 24,754 | | 22,000 | | 21,549 | | 21,116 | Delivery service for retail choice customers | | 24,754 | | 22,000 | | 21,549 | | 21,116 | | 20,315 |
| Delivery service to NYPA customers and others | Delivery service to NYPA customers and others | | 10,119 | | 9,821 | | 9,027 | | 9,069 | | 9,357 | Delivery service to NYPA customers and others | | 9,821 | | 9,027 | | 9,069 | | 9,357 | | 9,284 |
| | Total Deliveries in Franchise Area | Total Deliveries in Franchise Area | | 56,837 | | 55,154 | | 51,571 | | 51,328 | | 53,020 |
| Total Deliveries in Franchise Area | |
| Total Deliveries in Franchise Area | | | 55,154 | | 51,571 | | 51,328 | | 53,020 | | 52,256 |
Electric Energy Delivered ($ in millions) | Electric Energy Delivered ($ in millions) | |
| CECONY full service customers | |
| CECONY full service customers | |
| CECONY full service customers | CECONY full service customers | | $4,706 | | $4,535 | | $4,804 | | $5,299 | | $6,192 | | $4,535 | | $4,804 | | $5,299 | | $6,192 | | $6,305 |
| Delivery service for retail choice customers | Delivery service for retail choice customers | | 2,624 | | 2,470 | | 2,391 | | 2,613 | | 2,526 | Delivery service for retail choice customers | | 2,470 | | 2,391 | | 2,613 | | 2,526 | | 2,394 |
| Delivery service to NYPA customers and others | Delivery service to NYPA customers and others | | 652 | | 644 | | 638 | | 683 | | 715 | Delivery service to NYPA customers and others | | 644 | | 638 | | 683 | | 715 | | 758 |
| | Other operating revenues | Other operating revenues | | (11) | | 413 | | 270 | | 211 | | 318 |
| Other operating revenues | |
| Other operating revenues | | | 413 | | 270 | | 211 | | 318 | | 621 |
| Total Deliveries in Franchise Area | Total Deliveries in Franchise Area | | $7,971 | | $8,062 | | $8,103 | | $8,806 | | $9,751 | Total Deliveries in Franchise Area | | $8,062 | | $8,103 | | $8,806 | | $9,751 | | $10,078 |
Average Revenue per kWh Sold (Cents) | Average Revenue per kWh Sold (Cents) | |
| Residential | Residential | | 26.4 | | 25.3 | | 26.1 | | 27.3 | | 28.8 |
| Residential | |
| Residential | | | $25.3 | | $26.1 | | $27.3 | | $28.8 | | $30.1 |
| Commercial and industrial | Commercial and industrial | | 19.3 | | 18.6 | | 20.2 | | 23.5 | | 26.0 | Commercial and industrial | | $18.6 | | $20.2 | | $23.5 | | $26.0 | | $25.4 |
For further discussion of the company’s electric operating revenues and its electric results, see “Results of Operations” in Item 7. For additional segment information, see Note P to the financial statements in Item 8.
Electric Peak Demand
The electric peak demand in CECONY’s service area typically occurs during the summer air conditioning season. CECONY’s 20222023 service area actual hourly peak demand (June-August) was 12,42411,565 MW, which occurred on August 9, 2022.July 27, 2023. “Design Weather Conditions” for the electric system is a standard to which the actual hourly peak demand is adjusted for evaluation and planning purposes. Since NYISO-invoked demand reduction programs can only be called upon under specific circumstances, Design Weather Conditions do not include these programs’programs' potential impact. However, the CECONY forecasted hourly peak demand at design conditions does include the impact of certain demand reduction programs. The company estimates that, under Design Weather Conditions, the 20232024 service area hourly peak demand will be 12,99012,800 MW. As of January 2023,2024, the company forecasts an average annual increase in hourly electric peak demand in its service area at Design Weather Conditions over the next five
| | | | | |
20
|
CON EDISON ANNUAL REPORT 2022 |
years to be approximately 0.60.7 percent per year, including the effect of certain electric energy efficiency programs, and the anticipated phase-out of natural gas in certain new construction buildings including major renovations, in New York City. See “Environmental Matters – Clean Energy Future,” below.CECONY's service territory, and the anticipated increase in electric vehicles in CECONY's service territory. The five-year forecast in peak demand is used by the company for electric supply and capital planning purposes.
Electric Supply
Most of the electricity sold by CECONY to its full-service customers in 20222023 was purchased under firm power contracts or through the wholesale electricity market administered by the NYISO. The company expects that these resources will again be adequate to meet the requirements of its customers in 2023.2024. The company plans to meet its continuing obligation to supply electricity
| | | | | |
20 | CON EDISON ANNUAL REPORT 2023 |
to its full-service customers through a combination of electricity purchased under contracts,contract, purchased through the NYISO’s wholesale electricity market, or generated from its electricity generating facilities. For information about the company’s contracts for electric generating capacity, see Notes I and Q to the financial statements in Item 8. To reduce the volatility of its full-service customers’ electric energy costs, the company has contracts to purchase electric energy and enters into derivative transactions to hedge the costs of a portion of its expected purchases under these contracts and through the NYISO’s wholesale electricity market.
CECONY owns generating stations in New York City associated primarily with its steam system. The generating stations have a combined electric nameplate capacity of approximately 780 MW. For information about electric generating capacity owned by the company, see “Electric Operations – Electric Facilities – Generating Facilities,” above.
In general, the Utilities recover their costs of purchasing power for full-service customers, including the cost of hedging purchase prices, pursuant to rate provisions approved by the state public utility regulatory authority having jurisdiction. See “Financial and Commodity Market Risks – Commodity Price Risk” in Item 7 and “Recoverable Energy Costs” in Note A to the financial statements in Item 8.
Electric Reliability Needs
CECONY monitors the adequacy of the electric capacity resources and related developments in its service area, and works with other parties on long-term resource adequacy within the framework of the NYISO reliability planning process. The NYISO process includes obligations on transmission owners (such as CECONY) to construct facilities that may be needed for system reliability if the market does not solve a reliability need identified by the NYISO. See “New York Independent System Operator,” above. In a July 1998 order, the NYSPSC indicated that it “agree(s) generally that CECONY need not plan on constructing new generation as the competitive market develops,” but considers “overly broad” and did not adopt CECONY’s request for a declaration that, solely with respect to providing generating capacity, it will no longer be required to engage in long-range planning to meet potential demand and, in particular, that it will no longer have the obligation to construct new generating facilities, regardless of the market price of capacity.
In 2019, the New York State Department of Environmental Conservation issued regulations (Peaker Rule) that may require the retirement or seasonal unavailability of fossil-fueled electric generating units owned by CECONY and others in New York City. The Peaker Rule limits nitrous oxides emissions during the ozone season from May through September and affects older peaking units that are generally located downstate and needed during periods of high electric demand or for local reliability purposes. Compliance with the rulePeaker Rule would impact approximately 1,4001,700 MW (nameplate capacity) of generating units in CECONY's service territory (including 70 MW owned by CECONY), of which 54approximately 989 MW are(including 70 MW owned by CECONY. Two CECONYCECONY) have since been retired or limited operation. An additional 709 MW (in nameplate capacity) of peaker plants were expected to become unavailable beginning May 1, 2025. In July 2023, the NYISO found an electric reliability need beginning in the summer of 2025 in CECONY’s New York City territory primarily driven by forecasted increases in peak demand and the unavailability of units Hudson Avenue GT 3impacted by the Peaker Rule. In November 2023, after soliciting and GT 5 (33evaluating both regulated and market-based solutions, the NYISO determined that there were no viable and sufficient solutions submitted that meet the reliability need in 2025. As a result, the NYISO stated that it will temporarily retain 672 MW nameplate) were retiredof the remaining units impacted by the Peaker Rule until May 2027 to ensure the continued reliability of electric service in November 2022. New York City.
In January 2021, CECONY updated its Local Transmission Plan (LTP) to address identified reliability needs on its local system resulting from the regulationPeaker Rule through the construction of three transmission projects, the Reliable Clean City (RCC) projects. In April 2021, the NYSPSC approved CECONY’s December 2020 petition to recover $780 million of costs to construct the RCC projects. In May 2023, the first of the three RCC projects was completed and placed in service; the remaining two are expected to solvebe completed in 2025.
In April 2023, the localNYSPSC approved CECONY’s December 2022 petition seeking cost recovery approval for a proposed clean energy hub in Brooklyn, New York (Brooklyn Clean Energy Hub) at an estimated cost of $810 million and an estimated in-service date of December 2027, that is in addition to the capital expenditures approved in CECONY's 2023 electric rate plan. The Brooklyn Clean Energy Hub primarily addresses an identified reliability needs. NYISO’s 2022 Reliability Needs Assessment concludedneed in 2028 due to a forecasted increase in electric demand. The Brooklyn Clean Energy Hub also provides the flexibility for offshore wind resources to interconnect to it during construction and after it commences operation. Construction began in September 2023 and is expected to be completed by 2028.
In January 2024, the NYSPSC approved CECONY's August 2023 petition requesting authorization and cost recovery to construct two new substations in Jamaica, Queens (the Reliable Clean City - Idlewild Project) that whileis in addition to the capital expenditures approved in CECONY's 2023 electric rate plan. The project is expected to be completed by May 2028 to meet anticipated reliability margins are sufficient statewide through year 2032,needs and to support New York State’s goals set forth in the margins withinClimate Leadership and Community Protection Act (CLCPA). CECONY estimates that construction will cost $1,200 million.
Capital expenditures approved in CECONY’s 2023 electric rate plan to address identified reliability needs in New York City are very narrowinclude CECONY’s projects to: transfer electric customers from its Brownsville substation to its Glendale substation (estimated completion in 2025. NYISO continues to monitor system reliability margins2026 and CECONY would propose solutionsestimated cost of $115 million); build a transmission feeder between
| | | | | |
| CON EDISON ANNUAL REPORT 2023 | 21 |
Vernon and Newtown (estimated completion in a future LTP if needs arise2026 and estimated cost of $125.4 million); and build the Gateway Park area substation (estimated completion in its service territory.2028 and estimated cost of $1,100 million).
Gas Operations
Gas Facilities
CECONY’s capitalized costs for utility plant, net of accumulated depreciation, for gas facilities, which are primarily distribution facilities, were $10,567$11,226 million and $9,748$10,567 million at December 31, 20222023 and 2021,2022, respectively.
Natural gas is delivered by pipelineinterstate pipelines to CECONY at various points in or near its service territory and is distributed to customers by the company through an estimated 4,3594,363 miles of mains and 377,741380,870 service lines. The company owns a natural gas liquefaction facility and storage tank at its Astoria property in Queens, NY.New York. The plant can store 1,062 MDt of which a maximum of about 240 MDt can be withdrawn per day. The company has approximately 1,226 MDt of additional natural gas storage capacity available to it at a field in upstate NY,New York, owned and operated by Honeoye Storage Corporation, a corporation 71.2 percent owned by CETCon Edison Transmission and 28.8 percent owned by CECONY.
| | | | | |
CON EDISON ANNUAL REPORT 2022 | 21 |
Gas Sales and Deliveries
CECONY delivers gas to its full-service customers who purchase gas from the company. The company generally recovers the cost of the gas that it buys and then sells to its full-service customers. It does not make any margin or profit on the gas it sells. Under the company's retail choice program, CECONY also delivers gas to its customers who choose to purchase gas from other suppliers. CECONY’s gas delivery revenues are subject to a weather normalization clause and a revenue decoupling mechanism. As a result, its gas delivery revenues are generally not affected by changes in delivery volumes from levels assumed when rates were approved. CECONY’s gas sales and deliveries for the last five years were:
| | Year Ended December 31, |
| 2018 | 2019 | 2020 | 2021 | 2022 |
| Year Ended December 31, | | | Year Ended December 31, |
| 2019 | | | 2019 | 2020 | 2021 | 2022 | 2023 |
Gas Delivered (MDt) | Gas Delivered (MDt) | |
| Firm sales | Firm sales | |
| Firm sales | |
| Firm sales | |
| Full service | Full service | 92,305 | 87,637 | 78,515 | 81,637 | 85,246 |
| Delivery service for firm retail choice customers | 82,472 | 81,710 | 76,614 | 76,765 | 75,172 |
| Full service | |
| Full service | | 87,637 | 78,515 | 81,637 | 85,246 | 77,525 |
| Firm transportation | | Firm transportation | 81,710 | 76,614 | 76,765 | 75,172 | 72,740 |
| Total Firm Sales | Total Firm Sales | 174,777 | 169,347 | 155,129 | 158,402 | 160,418 | Total Firm Sales | 169,347 | 155,129 | 158,402 | 160,418 | 150,265 |
| Interruptible sales (a) | Interruptible sales (a) | 7,351 | 9,903 | 8,482 | 5,927 | 6,098 | Interruptible sales (a) | 9,903 | 8,482 | 5,927 | 6,098 | 7,892 |
| Total Gas Delivered to CECONY Customers | Total Gas Delivered to CECONY Customers | 182,128 | 179,250 | 163,611 | 164,329 | 166,516 | Total Gas Delivered to CECONY Customers | 179,250 | 163,611 | 164,329 | 166,516 | 158,157 |
| Transportation of customer-owned gas | Transportation of customer-owned gas | |
| NYPA | |
| NYPA | |
| NYPA | NYPA | 34,079 | 39,643 | 41,577 | 43,094 | 45,085 | 39,643 | 41,577 | 43,094 | 45,085 | 53,541 |
| Other (mainly generating plants and interruptible transportation) | Other (mainly generating plants and interruptible transportation) | 93,346 | 72,712 | 70,537 | 67,871 | 72,448 | Other (mainly generating plants and interruptible transportation) | 72,712 | 70,537 | 67,871 | 72,448 | 80,378 |
| Off-system sales | Off-system sales | 195 | 12 | 12 | Off-system sales | 12 |
| Total Sales | Total Sales | 309,748 | 291,617 | 275,737 | 275,306 | 284,061 | Total Sales | 291,617 | 275,737 | 275,306 | 284,061 | 292,088 |
Gas Delivered ($ in millions) | Gas Delivered ($ in millions) | |
| Firm sales | Firm sales | |
| Firm sales | |
| Firm sales | |
| Full service | Full service | $1,356 | $1,327 | $1,229 | $1,473 | $1,850 |
| Delivery service for firm retail choice customers | 595 | 593 | 649 | 704 | 798 |
| Full service | |
| Full service | | $1,327 | $1,229 | $1,473 | $1,850 | $1,791 |
| Firm transportation | | Firm transportation | 593 | 649 | 704 | 798 | 853 |
| Total Firm Sales | Total Firm Sales | 1,951 | 1,920 | 1,878 | 2,177 | 2,648 | Total Firm Sales | 1,920 | 1,878 | 2,177 | 2,648 | 2,644 |
| Interruptible sales | Interruptible sales | 40 | 42 | 27 | 29 | 51 | Interruptible sales | 42 | 27 | 29 | 51 | 49 |
| Total Gas Delivered to CECONY Customers | Total Gas Delivered to CECONY Customers | 1,991 | 1,962 | 1,905 | 2,206 | 2,699 | Total Gas Delivered to CECONY Customers | 1,962 | 1,905 | 2,206 | 2,699 | 2,693 |
| Transportation of customer-owned gas | Transportation of customer-owned gas | | |
| NYPA | |
| NYPA | |
| NYPA | |
| NYPA | |
| NYPA | |
| NYPA | |
| NYPA | |
| NYPA | |
| NYPA | NYPA | 2 | 2 | 2 |
| Other (mainly generating plants and interruptible transportation) | Other (mainly generating plants and interruptible transportation) | 57 | 54 | 55 | 59 | 64 | Other (mainly generating plants and interruptible transportation) | 54 | 55 | 59 | 64 | 58 |
| Other operating revenues (mainly regulatory amortizations) | Other operating revenues (mainly regulatory amortizations) | 28 | 114 | 74 | 111 | 159 | Other operating revenues (mainly regulatory amortizations) | 114 | 74 | 111 | 159 | 76 |
| Total Sales | Total Sales | $2,078 | $2,132 | $2,036 | $2,378 | $2,924 | Total Sales | $2,132 | $2,036 | $2,378 | $2,924 | $2,829 |
| Average Revenue per Dt Sold | Average Revenue per Dt Sold | | |
| Residential | Residential | $16.71 | $17.33 | $18.59 | $20.71 | $24.67 |
| Residential | |
| Residential | |
| Residential | |
| Residential | |
| Residential | |
| Residential | |
| Residential | |
| Residential | | $17.33 | $18.59 | $20.71 | $24.67 | $26.63 |
| General | General | $11.31 | $11.55 | $10.77 | $13.67 | $17.17 | General | $11.55 | $10.77 | $13.67 | $17.17 | $18.03 |
(a)Includes 3,326, 5,484, 3,510, 1,920, 2,015 and 2,0152,574 MDt for 2018, 2019, 2020, 2021, 2022 and 2022,2023, respectively, which are also reflected in delivery service for firm retail choice customers and other.
| | | | | |
22 | CON EDISON ANNUAL REPORT 2023 |
For further discussion of the company’s gas operating revenues and its gas results, see “Results of Operations” in Item 7. For additional segment information, see Note P to the financial statements in Item 8.
Gas Peak Demand
The gas actual peak day demand for firm gas customers in CECONY’s service area occurs during the winter heating season and during the winter of 2022/20232023/2024 (through January 31, 2023)2024) occurred on December 24, 2022January 20, 2024 when the firm gas customers' demand reached approximately 1,2611,188 MDt. “Design Weather Conditions” for the gas system is a standard to which the actual peak demand is adjusted for evaluation and planning purposes. The company estimates that, under Design Weather Conditions, the 2023/20242024/2025 service area peak day demand for firm gas customers will be 1,6841,698 MDt. The forecasted peak day demand for firm gas customers at design conditions does not include gas used by interruptible gas customers including electric and steam generating stations. As of January 2023,2024, the company forecasts an average annual increasedecrease of the gas peak day demand for firm gas customers over the next five years at design conditions to beof approximately 1.00.8 percent in its service area, including the effect of certain gas energy efficiency programs, the electrification of space heating and the anticipated phase-out of natural gas in certain new construction buildings including major renovations, in New York City. See “Environmental Matters – Clean Energy Future,” below.CECONY's service territory. The five-year forecast in peak demand is used by the company for gas supply and capital planning purposes.
| | | | | |
22
|
CON EDISON ANNUAL REPORT 2022 |
In March 2019, due to gas supply constraints, CECONY established a temporary moratorium on new applications for firm gas service in most of Westchester County. In July 2020, CECONY filed a gas planning analysis with the NYSPSC that stated the moratorium could be lifted when increased pipeline capacity is achieved upon completion of Tennessee Gas Pipeline’s East 300 Upgrade Project (the East 300 Upgrade Project) or peak demand is reduced through efficiency and other demand side reductions to a level that would enable CECONY to lift the moratorium. The East 300 Upgrade Project would involve modifying two existing compressor stations in Pennsylvania and NJ and construction of one new compressor station in NJ. In April 2022, FERC issued a certificate of public convenience and necessity that authorizes Tennessee Gas Pipeline to construct and operate the East 300 Upgrade Project. In October 2022 and February 2023, FERC approved Tennessee Gas Pipeline's requests to begin construction activities for: (1) the existing compressor station in Pennsylvania and the new compressor station in NJ and (2) the existing compressor station in NJ, respectively. Tennessee Gas Pipeline’s East 300 Upgrade Project is expected to be completed by November 2023.
CECONY’s gas planning analysis also stated that the company is monitoring a gas supply constraint for the New York City portion of its service territory. In May 2022, the NYSPSC issued orders on gas planning and moratorium management. The orders set forth a schedule for filing future gas planning analyses and the process for initiating, operating and lifting a natural gas moratorium.
Gas Supply
CECONY and O&R have combined their gas requirements, and contracts to meet those requirements, into a single portfolio. The combined portfolio is administered by, and related management services are provided by, CECONY (for itself and as agent for O&R) and costs are allocated between the Utilities in accordance with provisions approved by the NYSPSC. See Note U to the financial statements in Item 8.
Charges from suppliers for the firm purchase of gas, which are based on formulas or indexes or are subject to negotiation, are generally designed to approximate market prices. The Utilities have contracts with interstate pipeline companies for the purchase of firm transportation from upstream points where gas has been purchased to the Utilities’ distribution systems, and for upstream storage services. Charges under these transportation and storage contracts are approved by the FERC. The Utilities are required to pay certain fixed charges under the supply, transportation and storage contracts whether or not the contracted capacity is actually used. These fixed charges amounted to approximately $385.7$371.7 million in 2022,2023, including $340.2$326.8 million for CECONY. See “Contractual Obligations,” below. At December 31, 2022,2023, the contracts were for various terms extending to 20252027 for supply and 20432044 for transportation and storage. During 2023, CECONY entered into one new transportation contract. In addition, the Utilities purchase gas on the spot market and contract for interruptible gas transportation. See “Contractual Obligations,” below and “Recoverable Energy Costs” in Note A, Note Q and Note U to the financial statements in Item 8.
In July 2020, CECONY filed a gas planning analysis with the NYSPSC that stated that the company is monitoring a gas supply constraint for the New York City portion of its service territory. In May 2022, the NYSPSC issued orders on gas planning and moratorium management. The orders set forth a schedule for filing future gas planning analyses and the process for initiating, operating and lifting a natural gas moratorium.
In December 2023, CECONY ended a temporary moratorium on new applications for firm gas service that had been implemented in March 2019 due to interstate pipeline gas transportation constraints that affected most of Westchester County. CECONY lifted the moratorium due to increased interstate pipeline capacity upon completion of Tennessee Gas Pipeline’s East 300 Upgrade Project.
Steam Operations
Steam Facilities
CECONY’s capitalized costs for utility plant, net of accumulated depreciation, for steam facilities, including steam's portion of the steam-electric generation facilities, were $1,962$1,990 million and $1,924$1,962 million at December 31, 20222023 and 2021,2022, respectively. See "CECONY – Electric Operations – Electric Facilities," above.
CECONY generates steam at one steam-electric generating station and four steam-only generating stations and distributes steam to its customers through approximately 106 miles of transmission, distribution and service piping.
| | | | | |
CON EDISON ANNUAL REPORT 20222023 | 23 |
Steam Sales and Deliveries
CECONY’s steam sales and deliveries for the last five years were: | | Year Ended December 31, |
| 2018 | 2019 | 2020 | 2021 | 2022 |
| Year Ended December 31, | | | Year Ended December 31, |
| 2019 | | | 2019 | 2020 | 2021 | 2022 | 2023 |
Steam Sold (MMlb) | Steam Sold (MMlb) | |
| General | |
| General | |
| General | General | 593 | 536 | 445 | 504 | 513 | 536 | 445 | 504 | 513 | 428 |
| Apartment house | Apartment house | 6,358 | 5,919 | 5,131 | 5,013 | 5,122 | Apartment house | 5,919 | 5,131 | 5,013 | 5,122 | 4,657 |
| Annual power | Annual power | 14,811 | 13,340 | 10,977 | 11,367 | 11,792 | Annual power | 13,340 | 10,977 | 11,367 | 11,792 | 10,359 |
| Total Steam Delivered to CECONY Customers | Total Steam Delivered to CECONY Customers | 21,762 | 19,795 | 16,553 | 16,884 | 17,427 | Total Steam Delivered to CECONY Customers | 19,795 | 16,553 | 16,884 | 17,427 | 15,444 |
Steam Sold ($ in millions) | Steam Sold ($ in millions) | |
| General | General | $30 | $27 | $23 | $25 | $27 |
| General | |
| General | | $27 | $23 | $25 | $27 | 25 |
| Apartment house | Apartment house | 174 | 160 | 136 | 137 | 155 | Apartment house | 160 | 136 | 137 | 155 | 150 |
| Annual power | Annual power | 441 | 395 | 321 | 340 | 391 | Annual power | 395 | 321 | 340 | 391 | 363 |
| Other operating revenues | Other operating revenues | (14) | 45 | 28 | 30 | 20 | Other operating revenues | 45 | 28 | 30 | 20 | 31 |
| Total Steam Delivered to CECONY Customers | Total Steam Delivered to CECONY Customers | $631 | $627 | $508 | $532 | $593 | Total Steam Delivered to CECONY Customers | $627 | $508 | $532 | $593 | $569 |
| Average Revenue per Mlb Sold | Average Revenue per Mlb Sold | $29.64 | $29.40 | $29.00 | $29.73 | $32.88 | Average Revenue per Mlb Sold | $29.40 | $29.00 | $29.73 | $32.88 | $34.84 |
For further discussion of the company’s steam operating revenues and its steam results, see “Results of Operations” in Item 7. For additional segment information, see Note P to the financial statements in Item 8.
Steam Peak Demand and Capacity
The steam actual hourly peak demand in CECONY’s service area occurs during the winter heating season and during the winter of 2022/20232023/2024 (through January 31, 2023)2024) occurred on December 24, 2022January 17, 2024 when the actual hourly demand reached approximately 6.7 MMlb per hour. “Design Weather Conditions” for the steam system is a standard to which the actual hourly peak demand is adjusted for evaluation and planning purposes. The company’s estimate for the winter of 2023/20242024/2025 hourly peak demand of its steam customers is about 7.97.7 MMlb per hour under Design Weather Conditions. The company forecasts an average annual decrease in steam hourly peak demand in its service area at Design Weather Conditions over the next five years to be approximately 0.10.5 percent.The slight decrease reflects continued lower commercial building occupancy levels in the aftermath of the COVID-19 pandemic and customer migration to other heating sources. The five-year forecast in peak demand is used by the company for steam supply and capital planning purposes.
On December 31, 2022,2023, the steam system was capable of delivering approximately 11.4 MMlb of steam per hour, and CECONY estimates that the system will have the same capability in the 2023/20242024/2025 winter.
Steam Supply
3135 percent of the steam produced by CECONY in 20222023 was supplied by the company’s steam-only generating assets; 4943 percent was produced by the company’s steam-electric generating assets, where steam and electricity are primarily cogenerated; and 20 percent22 percent was purchased under an agreement with Brooklyn Navy Yard Cogeneration Partners L.P.
O&R
Electric Operations
Electric Facilities
O&R’s capitalized costs for utility plant, net of accumulated depreciation, for distribution facilities were $1,215$1,253 million and $1,178$1,215 million at December 31, 20222023 and 2021,2022, respectively. For its transmission facilities, the costs for utility plant, net of accumulated depreciation, were $307$319 million and $297$307 million at December 31, 20222023 and 2021,2022, respectively.
O&R and RECO own, in whole or in part, transmission and distribution facilities which include 543545 circuit miles of transmission lines, 15 transmission substations, 63 distribution substations, 87,95190,051 in-service line transformers, 3,8693,788 pole miles of overhead distribution lines and 2,3202,314 miles of underground distribution lines. O&R’s transmission system is part of the NYISO system except that portions of RECO’s system are located within the transmission area controlled by PJM.
Electric Sales and Deliveries
O&R delivers electricity to its full-service customers who purchase electricity from the company. Under the company's retail choice program, O&R also delivers electricity to its customers who purchase electricity from load serving entities.
| | | | | |
24 | CON EDISON ANNUAL REPORT 2023 |
The company charges all customers in its service area for the delivery of electricity. O&R generally recovers, on a current basis, the cost of the electricity that it buys and then sells to its full-service customers. It does not make any margin or profit on the electricity it sells. O&R’s NYNew York electric revenues (which accounted for 7876 percent of O&R’s
| | | | | |
24
|
CON EDISON ANNUAL REPORT 2022 |
electric revenues in 2022)2023) are subject to a revenue decoupling mechanism. As a result, O&R’s NYNew York electric delivery revenues are generally not affected by changes in delivery volumes from levels assumed when rates were approved. Effective July 2021, the majority of O&R’s electric distribution revenues in NJNew Jersey are subject to a conservation incentive program, as a result of which distribution revenues are generally not affected by changes in delivery volumes from levels assumed when rates were approved. O&R’s electric transmission revenues in New Jersey are not subject to a conservation incentive program, and as a result, changes in such volumes do impact revenues. O&R’s electric sales and deliveries for the last five years were:
| | Year Ended December 31, |
| 2018 | 2019 | 2020 | 2021 | 2022 |
| Year Ended December 31, | | | Year Ended December 31, |
| 2019 | | | 2019 | 2020 | 2021 | 2022 | 2023 |
Electric Energy Delivered (millions of kWh) | Electric Energy Delivered (millions of kWh) | |
| Total deliveries to O&R full service customers | |
| Total deliveries to O&R full service customers | |
| Total deliveries to O&R full service customers | Total deliveries to O&R full service customers | 2,643 | 2,617 | 2,712 | 2,702 | 2,973 | 2,617 | 2,712 | 2,702 | 2,973 | 2,988 |
| Delivery service for retail choice customers | Delivery service for retail choice customers | 2,974 | 2,885 | 2,622 | 2,839 | 2,580 | Delivery service for retail choice customers | 2,885 | 2,622 | 2,839 | 2,580 | 2,397 |
| Total Deliveries in Franchise Area | Total Deliveries in Franchise Area | 5,617 | 5,502 | 5,334 | 5,541 | 5,553 | Total Deliveries in Franchise Area | 5,502 | 5,334 | 5,541 | 5,553 | 5,385 |
Electric Energy Delivered ($ in millions) | Electric Energy Delivered ($ in millions) | |
| Total deliveries to O&R full service customers | |
| Total deliveries to O&R full service customers | |
| Total deliveries to O&R full service customers | Total deliveries to O&R full service customers | $453 | $429 | $442 | $453 | $576 | $429 | $442 | $453 | $576 | $578 |
| Delivery service for retail choice customers | Delivery service for retail choice customers | 201 | 191 | 186 | 223 | 198 | Delivery service for retail choice customers | 191 | 186 | 223 | 198 | 172 |
| Other operating revenues | Other operating revenues | (12) | 14 | 1 | 5 | (1) | Other operating revenues | 14 | 1 | 5 | (1) | 9 |
| Total Deliveries in Franchise Area | Total Deliveries in Franchise Area | $642 | $634 | $629 | $681 | $773 | Total Deliveries in Franchise Area | $634 | $629 | $681 | $773 | $759 |
Average Revenue Per kWh Sold (Cents) | Average Revenue Per kWh Sold (Cents) | |
| Residential | Residential | 19.1 | 18.2 | 17.8 | 19.0 | 21.5 |
| Residential | |
| Residential | | $18.20 | $17.80 | $19.00 | $21.50 | $21.90 |
| Commercial and Industrial | Commercial and Industrial | 14.4 | 13.9 | 14.2 | 13.0 | 15.6 | Commercial and Industrial | $13.90 | $14.20 | $13.00 | $15.60 | $15.30 |
|
For further discussion of the company’s electric operating revenues and its electric results, see “Results of Operations” in Item 7. For additional segment information, see Note P to the financial statements in Item 8.
Electric Peak Demand
The electric peak demand in O&R’s service area typically occurs during the summer air conditioning season. The weather during the summer of 2022 was cooler than design conditions. O&R’s 20222023 service area actual hourly peak demand (June-August) was 1,4571,342 MW, which occurred on August 9, 2022.July 28, 2023. “Design Weather Conditions” for the electric system is a standard to which the actual hourly peak demand is adjusted for evaluation and planning purposes. Since NYISO-invoked demand reduction programs can only be called upon under specific circumstances, Design Weather Conditions do not include these programs’programs' potential impact. However, the O&R forecasted hourly peak demand at design conditions does include the impact of certain demand reduction programs. The company estimates that, under Design Weather Conditions, the 20232024 service area peak demand will be 1,5451,530 MW. TheAs of January 2024, the company forecasts an average annual increase in hourly electric peak demand in its service area at design conditions over the next five years to be approximately 0.42.0 percent, including the effect of certain electric energy efficiency programs and distributed generation additions.additions, the anticipated phase-out of natural gas in certain new construction buildings in New York State, and the anticipated increase in electric vehicles in O&R's service territory. The five-year forecast in peak demand is used by the company for electric supply and capital planning purposes.
Electric Supply
The electricity O&R sold to its full-service customers in 20222023 was purchased under firm power contracts or through the wholesale electricity market. The company expects that these resources will again be adequate to meet the requirements of its customers in 2023.2024. O&R does not own any electric generating capacity. The company plans to meet its continuing obligation to supply electricity to its customers through a combination of electricity purchased under contracts or purchased through the wholesale electricity market. To reduce the volatility of its customers’ electric energy costs, the company has contracts to purchase electric energy and enters into derivative transactions to hedge the costs of a portion of its expected purchases. For information about the company’s contracts, see Note Q to the financial statements in Item 8.
In general, the Utilities recover their costs of purchasing power for full service customers, including the cost of hedging purchase prices, pursuant to rate provisions approved by the state public utility regulatory authority having jurisdiction. See “Financial and Commodity Market Risks – Commodity Price Risk,” in Item 7 and “Recoverable Energy Costs” in Note A to the financial statements in Item 8. From time to time, certain parties have petitioned the NYSPSC to review these provisions, the elimination of which could have a material adverse effect on the Companies’ financial position, results of operations or liquidity.
| | | | | |
| CON EDISON ANNUAL REPORT 2023 | 25 |
Gas Operations
Gas Facilities
O&R’s capitalized costs for utility plant, net of accumulated depreciation for gas facilities, which are primarily distribution facilities, were $759$792 million and $725$756 million at December 31, 20222023 and 2021,2022, respectively. Natural gas
| | | | | |
CON EDISON ANNUAL REPORT 2022 | 25 |
is delivered by pipeline to O&R at various points in or near its service territory and is distributed to customers by the company through an estimated 1,8871,896 miles of mains and 106,855107,425 service lines.
Gas Sales and Deliveries
O&R delivers gas to its full-service customers who purchase gas from the company. O&R generally recovers the cost of the gas that it buys and then sells to its full-service customers. It does not make any margin or profit on the gas it sells. Under the company's retail choice program, O&R also delivers gas to its customers who choose to purchase gas from other suppliers. O&R’s gas delivery revenues are subject to a weather normalization clause and to a revenue decoupling mechanism. As a result, its gas delivery revenues are generally not affected by changes in delivery volumes from levels assumed when rates were approved. O&R’s gas sales and deliveries for the last five years were:
| | Year Ended December 31, |
| 2018 | 2019 | 2020 | 2021 | 2022 |
| Year Ended December 31, | | | Year Ended December 31, |
| 2019 | | | 2019 | 2020 | 2021 | 2022 | 2023 |
Gas Delivered (MDt) | Gas Delivered (MDt) | |
| Firm sales | Firm sales | | |
| Firm sales | |
| Firm sales | |
| Full service | Full service | 12,050 | 12,537 | 11,877 | 13,998 | 15,353 |
| Delivery service for firm retail choice customers | 9,950 | 9,459 | 8,271 | 7,584 | 6,396 |
| Full service | |
| Full service | | 12,537 | 11,877 | 13,998 | 15,353 | 14,357 |
| Firm transportation | | Firm transportation | 9,459 | 8,271 | 7,584 | 6,396 | 5,055 |
| Total Firm Sales | Total Firm Sales | 22,000 | 21,996 | 20,148 | 21,582 | 21,749 | Total Firm Sales | 21,996 | 20,148 | 21,582 | 21,749 | 19,412 |
| Interruptible sales | Interruptible sales | 3,746 | 3,668 | 3,633 | 3,821 | 3,911 | Interruptible sales | 3,668 | 3,633 | 3,821 | 3,911 | 3,301 |
| Total Gas Delivered to O&R Customers | Total Gas Delivered to O&R Customers | 25,746 | 25,664 | 23,781 | 25,403 | 25,660 | Total Gas Delivered to O&R Customers | 25,664 | 23,781 | 25,403 | 25,660 | 22,713 |
| Transportation of customer-owned gas | Transportation of customer-owned gas | | |
| Sales for resale | Sales for resale | 959 | 914 | 658 | 468 | 673 |
| Sales for resale | |
| Sales for resale | | 914 | 658 | 468 | 673 | 334 |
| Sales to electric generating stations | Sales to electric generating stations | 1 | 4 | 59 | 26 | 10 | Sales to electric generating stations | 4 | 59 | 26 | 10 | 4 |
| Off-system sales | Off-system sales | 15 | 1 | 19 | 81 | 73 | Off-system sales | 1 | 19 | 81 | 73 | 20 |
| Total Sales | Total Sales | 26,721 | 26,583 | 24,517 | 25,978 | 26,416 | Total Sales | 26,583 | 24,517 | 25,978 | 26,416 | 23,071 |
| | Year Ended December 31, |
| 2018 | 2019 | 2020 | 2021 | 2022 |
| Year Ended December 31, | | | Year Ended December 31, |
| 2019 | | | 2019 | 2020 | 2021 | 2022 | 2023 |
Gas Delivered ($ in millions) | Gas Delivered ($ in millions) | |
| Firm sales | Firm sales | |
| Firm sales | |
| Firm sales | |
| Full service | Full service | $166 | $161 | $141 | $190 | $245 |
| Delivery service for firm retail choice customers | 78 | 63 | 62 | 55 | 45 |
| Full service | |
| Full service | | $161 | $141 | $190 | $245 | $230 |
| Firm transportation | | Firm transportation | 63 | 62 | 55 | 45 | 38 |
| Total Firm Sales | Total Firm Sales | 244 | 224 | 203 | 245 | 290 | Total Firm Sales | 224 | 203 | 245 | 290 | 268 |
| Interruptible Sales | Interruptible Sales | 6 | 6 | Interruptible Sales | 6 |
| Total Gas Delivered to O&R Customers | Total Gas Delivered to O&R Customers | 250 | 230 | 209 | 251 | 296 | Total Gas Delivered to O&R Customers | 230 | 209 | 251 | 296 | 274 |
| Transportation of customer-owned gas | Transportation of customer-owned gas | |
| Sales to electric generating stations | Sales to electric generating stations | — | | — | | — | | — | | — | |
| Sales to electric generating stations | |
| Sales to electric generating stations | | — | | — | | — | | — | | — |
| Other operating revenues | Other operating revenues | (1) | 29 | 24 | 9 | 16 | Other operating revenues | 29 | 24 | 9 | 16 | 23 |
| Total Sales | Total Sales | $249 | $259 | $233 | $260 | $312 | Total Sales | $259 | $233 | $260 | $312 | $297 |
| Average Revenue Per Dt Sold | Average Revenue Per Dt Sold | |
| Residential | Residential | $14.22 | $13.32 | $12.40 | $14.09 | $16.49 |
| Residential | |
| Residential | | $13.32 | $12.40 | $14.09 | $16.49 | $16.90 |
| General | General | $11.80 | $10.68 | $9.51 | $11.24 | $13.62 | General | $10.68 | $9.51 | $11.24 | $13.62 | $12.64 |
For further discussion of the company’s gas operating revenues and its gas results, see “Results of Operations” in Item 7. For additional segment information, see Note P to the financial statements in Item 8.
Gas Peak Demand
The gas actual peak day demand for firm sales customers in O&R’s service area occurs during the winter heating season and during the winter of 2022/20232023/2024 (through January 31, 2023)2024) occurred on December 24, 2022January 20, 2024 when the firm sales customers' demand reached approximately 185169 MDt. “Design Weather Conditions” for the gas system is a standard to which the actual peak demand is adjusted for evaluation and planning purposes. The company estimates that, under Design Weather Conditions, the 2023/20242024/2025 service area peak day demand for firm sales customers will be 241235 MDt. The forecasted peak day demand at design conditions does not include gas used by
| | | | | |
26 | CON EDISON ANNUAL REPORT 2023 |
interruptible gas customers including electric generating stations. TheAs of January 2024, the company forecasts an average annual decrease of the gas peak day demand for firm salesgas customers over the next five years at design conditions to beof approximately 0.10.2 percent in its service area, including the effect of certain gas energy efficiency programs.programs, the electrification of space heating and the anticipated phase-out of natural gas in certain new construction buildings in New York State. The five-year forecast in peak demand is used by the company for gas supply and capital planning purposes.
| | | | | |
26
|
CON EDISON ANNUAL REPORT 2022 |
Gas Supply
O&R and CECONY have combined their gas requirements and purchase contracts to meet those requirements into a single portfolio. See “CECONY – Gas Operations – Gas Supply” above.
| | | | | |
CON EDISON ANNUAL REPORT 2022 | 27 |
Clean Energy Businesses
The following table provides information about the Clean Energy Businesses' renewable electric projects that are in operation and/or in construction at December 31, 2022. Unless otherwise noted, the projects listed in the table below or the Clean Energy Businesses' equity interest in these projects have been pledged as security for project debt financing. In October 2022, Con Edison entered into a purchase and sale agreement pursuant to which Con Edison agreed to sell the Clean Energy Businesses to RWE Renewables America, LLC, a subsidiary of RWE Aktiengesellschaft. The Clean Energy Businesses were classified as held for sale as of December 31, 2022. See “Assets and Liabilities Held for Sale” in Note A and Note X to the financial statements in Item 8.
| | | | | | | | | | | | | | | | | |
| Project Name | Generating
Capacity
(MW AC)
| Power Purchase Agreement (PPA) Term (In Years) (a) | Actual
In-Service/Acquisition Date | State | PPA Counterparty |
| Utility Scale | | | | | |
| Solar | | | | | |
| | | | | |
| PJM assets (c) | 73 | (b) | 2011/2013 | NJ/PA | Various |
| New England assets (c) | 24 | Various | 2011/2017 | MA/RI | Various |
| California Solar | 110 | 25 | 2012/2013 | CA | PG&E |
| Mesquite Solar 1 | 165 | 20 | 2013 | AZ | PG&E |
| Copper Mountain Solar 2 | 150 | 25 | 2013/2015 | NV | PG&E |
| Copper Mountain Solar 3 | 255 | 20 | 2014/2015 | NV | SCPPA |
| California Solar 2 | 80 | 20 | 2014/2016 | CA | SCE/PG&E |
| Texas Solar 4 | 40 | 25 | 2014 | TX | City of San Antonio |
| Texas Solar 5 | 100 | 25 | 2015 | TX | City of San Antonio |
| Texas Solar 7 | 112 | 25 | 2016 | TX | City of San Antonio |
| California Solar 3 | 110 | 20 | 2016/2017 | CA | SCE/PG&E |
| Upton Solar | 158 | 25 | 2017 | TX | City of Austin |
| California Solar 4 | 240 | 20 | 2017/2018 | CA | SCE |
| Copper Mountain Solar 1 | 58 | 12 | 2018 | NV | PG&E |
| Copper Mountain Solar 4 (d) | 94 | 20 | 2018 | NV | SCE |
| Mesquite Solar 2 (d) | 100 | 18 | 2018 | AZ | SCE |
| Mesquite Solar 3 (d) | 150 | 23 | 2018 | AZ | WAPA (U.S. Navy) |
| Great Valley Solar (d) | 200 | 17 | 2018 | CA | MCE/SMUD/PG&E/SCE |
| Water Strider Solar (d) | 80 | 20 | 2021 | VA | VEPCO |
| Battle Mountain Solar/Battery Energy Storage System (d) | 101 | 25 | 2021 | NV | SPP |
| Copper Mountain Solar 5 (d) | 250 | 25 | 2021 | NV | NPC |
| Other (c) | 26 | Various | Various | Various | Various |
| Total Solar | 2,676 | | | | |
| Wind | | | | | |
| Broken Bow II | 75 | 25 | 2014 | NE | NPPD |
| Wind Holdings | 180 | Various | Various | SD/MT | NWE/Basin Electric |
| Adams Rose Wind | 23 | 7 | 2016 | MN | Dairyland |
| Other (c) | 51 | Various | Various | Various | Various |
| Total Wind | 329 | | | | |
| Total MW (AC) in Operation | 3,005 | | | | |
| Total MW (AC) in Construction (c) | 293 | | | | |
| Total MW (AC) Utility Scale | 3,298 | | | | |
| Behind the Meter | | | | | |
| Total MW (AC) in Operation (c) | 69 | | | | |
| Total MW (AC) in Construction (c) | — | | | | |
| Total MW Behind the Meter | 69 | | | | |
(a)Represents PPA contractual term or remaining term from the date of acquisition.
(b)Solar renewable energy credit hedges are in place, in lieu of PPAs, through 2025.
(c)Projects have generally not been pledged as security for project debt financing.
(d)Projects are financed with tax equity. See Note S to the financial statements in Item 8.
| | | | | |
28
|
CON EDISON ANNUAL REPORT 2022 |
Renewable Electric Generation
The Clean Energy Businesses develop, own and operate renewable energy infrastructure projects. In December 2018, the Clean Energy Businesses acquired Sempra Solar Holdings, LLC to expand the company's renewable energy asset portfolio. The Clean Energy Businesses focus their efforts on utility scale renewable electric projects. The output of most of the projects is sold under long-term power purchase agreements (PPA) with utilities and municipalities. The following table shows the generating capacity (MW AC) of the Clean Energy Businesses' utility scale renewable electric projects in operation at the end of the last five years:
| | | | | | | | | | | | | | | | | |
| Generating Capacity (MW AC) | 2018 | 2019 | 2020 | 2021 | 2022 |
| Renewable electric projects | 2,588 | 2,628 | 2,809 | 3,061 | 3,074 |
Renewable electric volumes produced by utility scale assets at the end of the last five years were:
| | | | | | | | | | | | | | | | | |
| | Millions of kWh Produced |
| For the Years Ended December 31, |
| Description | 2018 | 2019 | 2020 | 2021 | 2022 |
| Renewable electric projects | | | | | |
| Solar | 2,680 | 5,506 | 5,699 | 6,219 | 6,926 |
| Wind | 1,074 | 1,333 | 1,425 | 1,300 | 1,280 |
| Total | 3,754 | 6,839 | 7,124 | 7,519 | 8,206 |
Energy-Related Products and Services
The Clean Energy Businesses provide services to manage the dispatch, fuel requirements and risk management activities for 12,433 MW of generating plants and merchant transmission in the northeastern United States owned by unrelated parties, manage energy supply assets leased from others and provide wholesale hedging and risk management services to renewable electric projects owned by their subsidiaries.
The Clean Energy Businesses also provide energy-efficiency services to government and commercial customers. The services include the design and installation of lighting retrofits, high-efficiency heating, ventilating and air conditioning equipment and other energy saving technologies.
For information about the Clean Energy Businesses' results, see "Results of Operations" in Item 7 and Note P to the financial statements in Item 8.
| | | | | |
CON EDISON ANNUAL REPORT 2022 | 29 |
Con Edison Transmission
CETCon Edison Transmission owns a 45.7 percent interest in New York Transco LLC (NY Transco). Affiliates of certain otherthat is comprised of: a 45.7 percent interest in New York transmission owners own the remaining interests.
NY Transco's Transmission Owner Transmission Solutions (TOTS) projects; a 45.7 percent interest in New York Transco’s New York Energy Solution (NYES) project; and a 41.7 percent interest in New York Transco’s share of the Propel NY Energy project. Con Edison Transmission also owns a 71.2 percent interest in Honeoye Storage Corporation (Honeoye) and a 7.9 percent interest in Mountain Valley Pipeline, LLC (MVP) that is expected to be reduced to approximately 7.0 percent as described below.
TOTS is a group of three electric power bulk transmission projects were approved byconstructed on the NYSPSCNew York bulk transmission system to increase transfer capability between upstate and downstate New York that went in October 2013. In April 2015, the FERC issued an order granting certain transmission incentives for the NY Transco TOTS projects.service in 2016. In March 2016, the FERC approved a November 2015 settlement agreement that provides in relation to the TOTS projects described above, a 10 percent return on common equity (which is comprised of 9.5 percent base return on equity plus an additional 50 basis points) and a maximum actual common equity ratio of 53 percent. The revenues for these TOTS projects costs are collected by the NYISO and allocated across NYISO transmission customers in NYNew York State, with 63 percent allocated to load serving entities in the CECONY and O&R service areas.
In December 2015,The NYES project was selected by the NYSPSC issued an orderNYISO in its competitive proceedingApril 2019 to select AC transmission projects that would relieve transmission congestion between upstate and downstate. The NYSPSC determined that there was a public policy need for new transmission to address congestion and directed the NYISO, under its FERC-approved public policy planning process, to request developers to submit transmission project proposals for two segments of the transmission system. In April 2019, the NYISO selected a project that was jointly proposed by National Grid and NY Transco for one of the segmentsdownstate ($600 million estimated cost, excluding certain interconnection costs) that would increase transmission capacity by 1,850 MW between upstate and downstate when combined with another developer’s project selected by. During the NYISOsecond quarter of 2023, construction was completed for the other segment. The NYISONYES project and National Grid/NY Transco entered into an agreement for the developmentassociated Rock Tavern to Sugarloaf segment, and operationa majority of the assets were placed in service. Construction of the associated Dover Station, an additional network upgrade to support the NYES project, referred to ashas not been completed and its permits are the subject of litigation in New York Energy Solution (NYES) project, whereby NYES would be solely owned by NY Transco. Construction is underway and the project is scheduled for entry into service by December 2023.State. In November 2017, FERC approved a settlement agreement with respect to the National Grid/NY Transco project that provides for a 10.65 percent return on common equity (which is comprised of a 9.65 percent base ROE, with 100 basis points added for congestion reduction and a cost containment mechanism applicable to certain capital costs) and a maximum actual common equity ratio of 53 percent. The interconnection costs of the awarded project segment include network upgrades identified by the NYISO and NYSPSC that earn the same base ROE, with a 50-basis point adder. Revenues for the NYES project, including the Dover Station, are collected by the NYISO including 100 percent of construction work-in-progress, and are allocated across NYISO transmission customers in NYNew York State with 84 percent allocatedallocated to load serving entities in the CECONY and O&R service areas.
The Propel NY Energy project that was selected by the NYISO in June 2023 is a proposed 90-mile electric transmission project with an anticipated in-service date of 2030. Propel NY Energy is expected to enable delivery of a minimum of 3,000 MW of offshore wind electricity, increase high voltage transmission connections between Long Island and the rest of New York State and provide New Yorkers with greater access to diverse energy resources. New York Transco’s share is quantified as $2,200 million, excluding its interconnection costs and the cost of projects expected to be built by local transmission owners, including CECONY. The siting, construction and operation of the project will require approvals and permits from appropriate governmental agencies and authorities, including the NYSPSC. In October 2023, NYSERDA announced that it selected three new offshore wind projects for contract negotiations, one of which is expected to connect 1,314 MW of offshore wind electricity using the capability of the Propel NY Energy project. See "Environmental Matters - Clean Energy Future," below. In December 2023, FERC, subject to refund and the outcome of settlement procedures, conditionally accepted a 53 percent equity capital structure for the Propel NY Energy project with a base return on equity of 10.7 percent, plus a 125 basis-point return on equity adder (50 basis points for participation in the NYISO and 75 basis points for risk).
CET, through its subsidiaries,
Con Edison Transmission owns a 71.2 percent interest in Honeoye, Storage Corporation (Honeoye), a company that operates a gas storage facility in upstate NYNew York and in which CECONY owns the remaining interest. A goodwill impairment loss of $7 million was recorded related to CET’Con Edison Transmission's and CECONY’s investment in Honeoye Storage Corporation for the year ended December 31, 2021, of which $5 million was attributed to CET.Con Edison Transmission. See Note K to the financial statements in Item 8.
In addition, CETMVP is a joint venture among five partners, including Con Edison Transmission, to construct and operate the Mountain Valley Pipeline, a proposed 300-mile gas transmission project in West Virginia and Virginia. Con Edison
| | | | | |
| CON EDISON ANNUAL REPORT 2023 | 27 |
Transmission owns a 9.67.9 percent interest (thatin MVP that is expected to be reduced to 8.0approximately 7.0 percent based on the current project cost estimate and CET’Con Edison Transmission's previous capping of its cash contributions to the joint venture) inventure. In June 2023, construction activities for the Mountain Valley Pipeline LLC (MVP). MVPresumed after resolution of certain legal challenges. In January 2024, the operator of the Mountain Valley Pipeline indicated that it is a joint venture with four other partners to construct and operate a proposed 300-mile gas transmissiontargeting an in-service date for the project in WV and VA. CETthe first quarter of 2024 at an overall project cost of approximately $7,200 millionexcluding allowance for funds used during construction. Con Edison Transmission recorded pre-tax impairment losses on its interest in MVP of $231 million ($162 million after-tax) and $320 million ($223 million after-tax) for the years ended December 31, 2021 and December 31, 2020, respectively. In May 2022, the operator of the Mountain Valley Pipeline indicated it plans to pursue new permits and is targeting a full in-service date during the second half of 2023 at a total project cost of approximately $6,600 million, excluding allowance for funds used during construction. In June 2022, the Mountain Valley Pipeline joint venture filed a request with the FERC for, and in August 2022, the FERC granted, a four-year extension of time to complete the project by October 2026. At December 31, 2022, CET’s2023, Con Edison Transmission’s carrying value of its investment in MVP was $111$111 million and CET’sits cash contributions to the joint venture amounted to $530 million. See "Investments - 2020 and 2021 Partial Impairments of Investment "Investment in Mountain Valley Pipeline, LLC (MVP)" in Note A to the financial statements in Item 8.
During 2021, CETCon Edison Transmission sold its 50 percent interest in Stagecoach Gas Services LLC (Stagecoach), a gas pipeline and storage business located in northern PAPennsylvania and southern NYNew York for $629 million. CETCon Edison Transmission recorded pre-tax impairment losses of $212 million ($147 million after-tax). See "Investments - 2021 Partial Impairment of Investment in Stagecoach Gas Services" in Note A and Note W to the financial statements in Item 8.
For information about Con Edison Transmission's results, see "Results of Operations" in Item 7 and Note P to the financial statements in Item 8.
| | | | | |
30
|
CON EDISON ANNUAL REPORT 2022 |
Capital Requirements and Resources
Capital Requirements
The following table contains the Companies’ capital requirements for the years 20202021 through 20222023 and their current estimate of amounts for 20232024 through 2025:2028:
| | | | Actual | Estimate | | Actual | Estimate |
| (Millions of Dollars) | (Millions of Dollars) | 2020 | 2021 | 2022 | 2023 | 2024 | 2025 | (Millions of Dollars) | 2021 | 2022 | 2023 | 2024 | 2025 | 2026 | 2027 | 2028 |
| CECONY (a)(b) | CECONY (a)(b) | | | |
| Electric | Electric | $2,080 | $2,189 | $2,522 | $3,168 | $3,267 | $3,347 |
| Electric | |
| Electric | | $2,189 | $2,522 | $2,909 | $3,277 | $3,554 | $4,171 | $4,128 | $4,115 |
| Gas | Gas | 1,044 | 1,126 | 1,128 | 1,128 | 1,155 | 1,120 | Gas | 1,126 | 1,128 | 1,046 | 1,152 | 1,116 | 1,126 | 1,156 | 1,177 |
| Steam | Steam | 122 | 103 | 108 | 103 | 119 | 135 | Steam | 103 | 108 | 128 | 104 | 107 | 110 | 138 | 142 |
| Sub-total | Sub-total | 3,246 | 3,418 | 3,758 | 4,399 | 4,541 | 4,602 | Sub-total | 3,418 | 3,758 | 4,083 | 4,533 | 4,777 | 5,407 | 5,422 | 5,434 |
| O&R | | | |
| O&R (b) | |
| Electric | |
| Electric | |
| Electric | Electric | 159 | 147 | 167 | 200 | 218 | 275 | 147 | 167 | 211 | 209 | 350 | 380 | 367 | 353 |
| Gas | Gas | 61 | 70 | 76 | 76 | 81 | 80 | Gas | 70 | 76 | 85 | 80 | 85 | 92 | 85 | 80 |
| Sub-total | Sub-total | 220 | 217 | 243 | 276 | 299 | 355 | Sub-total | 217 | 243 | 296 | 289 | 435 | 472 | 452 | 433 |
| Con Edison Transmission | Con Edison Transmission | 3 | | 31 | | 65 | | 58 | 6 | Con Edison Transmission | 31 | | 65 | 65 | | 49 | 49 | | 27 | 27 | 31 | 108 | 113 | 119 |
| Clean Energy Businesses (c) | Clean Energy Businesses (c) | 616 | 298 | 399 | 76 | — | Clean Energy Businesses (c) | 298 | 399 | 81 | — | — |
| Total capital investments | Total capital investments | 4,085 | 3,964 | 4,465 | 4,809 | 4,846 | 4,963 | Total capital investments | 3,964 | 4,465 | 4,509 | 4,849 | 5,243 | 5,987 | 5,986 |
| Retirement of long-term securities | Retirement of long-term securities | | | | |
| Con Edison – parent company | Con Edison – parent company | 3 | 1,178 | 293 | 650 | — |
| Con Edison – parent company | |
| Con Edison – parent company | | 1,178 | 293 | 650 | — | — |
| CECONY | CECONY | 350 | 640 | — | | — | 250 | — | CECONY | 640 | — | — | | 250 | 250 | — | 250 | 350 | 800 |
| O&R | O&R | — | | — | | — | | — | — | O&R | — | | — | — | | — | — | | — | — | — | 80 | — |
| Clean Energy Businesses (c) | Clean Energy Businesses (c) | 165 | 141 | 147 | | 25 | — | Clean Energy Businesses (c) | 141 | 147 | 60 | | — | — | — |
| Total retirement of long-term securities | Total retirement of long-term securities | 518 | 1,959 | 440 | 675 | 250 | — | Total retirement of long-term securities | 1,959 | 440 | 710 | 250 | — | 250 | 430 | 800 |
| Total capital requirements | Total capital requirements | $4,603 | $5,923 | $4,905 | $5,484 | $5,096 | $4,963 | Total capital requirements | $5,923 | $4,905 | $5,219 | $5,099 | $5,243 | $6,237 | $6,417 | $6,786 |
(a)CECONY’s capital investments for environmental protection facilities and related studies were $491 million, $731 million, and $733 million and $589 million in 2020, 2021, 2022 and 2022,2023, respectively, and are estimated to be $568$600 million in 2023.2024.
(b)Amounts and estimates shown do not include amounts for the system peak reduction, energy efficiency demand reduction and combined heatelectric vehicle make ready programs. See "Regulatory Assets and power programs.Liabilities" in Note B to the financial statements in Item 8.
(c)Estimates shown forOn March 1, 2023, include estimates throughCon Edison completed the anticipated closing datesale of all of the salestock of the Clean Energy Businesses, which were classified as held for sale as of December 31, 2022.Businesses. See “Assets and Liabilities Held For Sale" in Note AW and Note X to the financial statements in Item 8.
| | | | | |
28 | CON EDISON ANNUAL REPORT 2022 | 312023 |
Contractual Obligations
The following table summarizes the Companies’ material obligations at December 31, 20222023 to make payments pursuant to contracts. Long-term debt, operating and capital lease obligations and other noncurrent liabilities are included on their balance sheets. Electricity and gas purchase agreements (for which undiscounted future annual payments are shown) are described in the notes to the financial statements. The Clean Energy Businesses were classified as held for sale as of December 31, 2022. Accordingly, the long-term debt and operating lease obligations of the Clean Energy Businesses are shown within "Liabilities Held for Sale" on Con Edison's consolidated balance sheet as of December 31, 2022.
| | | | Payments Due by Period | | Payments Due by Period |
| (Millions of Dollars) | (Millions of Dollars) | Total | 1 year
or less | Years
2 & 3 | Years 4 & 5 | After 5 years | (Millions of Dollars) | Total | 1 year
or less | Years
2 & 3 | Years 4 & 5 | After 5 years |
| Long-term debt (Statement of Capitalization) | |
| Long-term debt (Statement of Capitalization) (a) | |
| CECONY | |
| CECONY | |
| CECONY | CECONY | $19,275 | — | | $250 | $600 | $18,425 | $21,275 | $250 | | $250 | $250 | $1,150 | $19,625 |
| O&R | O&R | 1,075 | — | | —�� | | 80 | | 995 | O&R | 1,125 | — | | — | — | | 80 | 80 | | 1,045 | 1,045 |
| Clean Energy Businesses (a) | 2,666 | 353 | 463 | 281 | 1,569 |
| Parent | Parent | 650 | — | | — | | — | |
| Interest on long-term debt (b) | Interest on long-term debt (b) | 19,706 | 1,015 | 1,932 | 1,883 | 14,876 | Interest on long-term debt (b) | 20,319 | 1,006 | 1,997 | 1,956 | 15,360 |
| Total long-term debt, including interest | 43,372 | 2,018 | 2,645 | 2,844 | 35,865 |
| Total long-term debt, including interest (a)(b) | | Total long-term debt, including interest (a)(b) | 42,719 | 1,256 | 2,247 | 3,186 | 36,030 |
| Finance lease obligations (Note J) | Finance lease obligations (Note J) | |
| CECONY | |
| CECONY | |
| CECONY | CECONY | 1 | — | | 1 | | — | | — | |
| O&R | O&R | 1 | — | | — | | — | | 1 | |
| Total capital lease obligations | Total capital lease obligations | 2 | — | | 1 | | — | | 1 | |
| Operating leases (Note J) | Operating leases (Note J) | |
| CECONY | CECONY | 739 | 64 | 128 | 419 |
| CECONY | |
| CECONY | | 688 | 66 | 132 | 125 | 365 |
| O&R | O&R | 2 | — | | 2 | | — | | — | |
| Clean Energy Businesses (c) | 582 | 19 | 37 | 34 | 492 |
| Total operating leases | 1,323 | 83 | 167 | 162 | 911 |
| Total operating leases (c) | | Total operating leases (c) | 689 | 67 | 132 | 125 | 365 |
| Purchase obligations | Purchase obligations | |
| Electricity power purchase agreements – Utilities (Note I) | Electricity power purchase agreements – Utilities (Note I) | |
| Electricity power purchase agreements – Utilities (Note I) | |
| Electricity power purchase agreements – Utilities (Note I) | |
| CECONY | CECONY | |
| CECONY | |
| CECONY | |
| Energy | |
| Energy | |
| Energy | Energy | 2,072 | 139 | 264 | 272 | 1,397 | 1,606 | 102 | 242 | 251 | 1,011 |
| Capacity (d) | Capacity (d) | 766 | 121 | 153 | 102 | 390 | Capacity (d) | 728 | 151 | 143 | 88 | 346 |
| Total CECONY | Total CECONY | 2,838 | 260 | 417 | 374 | 1,787 | Total CECONY | 2,334 | 253 | 385 | 339 | 1,357 |
| O&R | O&R | |
| Energy and Capacity (d) | Energy and Capacity (d) | 79 | 49 | 30 | — | | — | |
| Energy and Capacity (d) | |
| Energy and Capacity (d) | |
| Total electricity and power purchase agreements – Utilities | Total electricity and power purchase agreements – Utilities | 2,917 | 309 | 447 | 374 | 1,787 | Total electricity and power purchase agreements – Utilities | 2,476 | 325 | 455 | 339 | 1,357 |
| Natural gas supply, transportation, and storage contracts – Utilities (Note I) (e) | Natural gas supply, transportation, and storage contracts – Utilities (Note I) (e) | |
| CECONY | CECONY | |
| CECONY | |
| CECONY | |
| Natural gas supply | |
| Natural gas supply | |
| Natural gas supply | Natural gas supply | 611 | 603 | 8 | — | | — | |
| Transportation and storage | Transportation and storage | 4,806 | 412 | 912 | 720 | 2,762 | Transportation and storage | 4,268 | 450 | 818 | 613 | 2,387 |
| Total CECONY | Total CECONY | 5,417 | 1,015 | 920 | 720 | 2,762 | Total CECONY | 4,550 | 708 | 836 | 619 | 2,387 |
| O&R | O&R | |
| Natural gas supply | Natural gas supply | 77 | 76 | 1 | — | | — | |
| Natural gas supply | |
| Natural gas supply | |
| Transportation and storage | Transportation and storage | 694 | 59 | 130 | 103 | 402 | Transportation and storage | 681 | 71 | 128 | 98 | 384 |
| Total O&R | Total O&R | 771 | 135 | 131 | 103 | 402 | Total O&R | 726 | 112 | 131 | 99 | 384 |
| Total natural gas supply, transportation and storage contracts | Total natural gas supply, transportation and storage contracts | 6,188 | 1,150 | 1,051 | 823 | 3,164 | Total natural gas supply, transportation and storage contracts | 5,276 | 820 | 967 | 718 | 2,771 |
| Other purchase obligations | |
| CECONY (f) | 3,887 | 1,164 | 599 | 1,753 | 371 |
| O&R (f) | 190 | 110 | 27 | 10 | 43 |
| Clean Energy Businesses (g) | 52 | — | | — | | — | |
| Other purchase obligations (f) | |
| CECONY | |
| CECONY | |
| CECONY | | 4,156 | 1,350 | 1,650 | 743 | 413 |
| O&R | | O&R | 169 | 93 | 20 | 14 | 42 |
| Total other purchase obligations | Total other purchase obligations | 4,129 | 1,326 | 626 | 1,763 | 414 | Total other purchase obligations | 4,325 | 1,443 | 1,670 | 757 | 455 |
| | Total | Total | $57,931 | $4,886 | $4,937 | $5,966 | $42,142 |
| Total | |
| Total | |
(a)AmountsExcludes amounts reclassified as Liabilities Held For Sale on Con Edison's balance sheet. Amounts excluded are $2 million, $5 million, $6 million, and $49 million of long-term debt amortization under 1 year, 2-3 years, 4-5 years, and over 5 years, respectively. See "AssetsNote W and Liabilities Held for Sale" in Note A and Note X to the financial statements in Item 88.
(b)IncludesAmounts exclude interest on variablefixed rate debt calculated at rates in effect at December 31, 2022.2023. Amounts include $120excluded are $3 million, $160$6 million, $128$5 million, and $379$14 million of interest due under 1 year, 2 -32-3 years, 4-5 years, and over 5 years, respectively, reclassified as Liabilities Held For Sale on Con Edison's balance sheet. See "AssetsNote W and Liabilities Held for Sale" in Note A and Note X to the financial statements in Item 8.
| | | | | |
32
|
CON EDISON ANNUAL REPORT 2022 |
(c)Amounts exclude operating lease future minimum lease payments reclassified as Liabilities Held For Sale on theCon Edison's balance sheet.sheet, of $3 million in total for years ended December 31, 2024 through 2028, and $10 million for all years thereafter, and imputed interest of $6 million. See "AssetsNote W and Liabilities Held for Sale" in Note A and Note X to the financial statements in Item 8.
(d)Included in these amounts is the cost of minimum quantities of natural gas supply, transportation and storage that the Utilities are obligated to purchase at both fixed and variable prices.
(e)Included in these amounts is the cost of minimum quantities of energy that the Utilities are obligated to purchase at both fixed and variable prices.
| | | | | |
| CON EDISON ANNUAL REPORT 2023 | 29 |
(f)Amounts shown for other purchase obligations, which reflect capital and operations and maintenance costs incurred by the Utilities in running their day-to-day operations, were derived from the Utilities’ purchasing system as the difference between the amounts authorized and the amounts paid (or vouchered to be paid) for each obligation. For many of these obligations, the Utilities are committed to purchase less than the amount authorized. Payments for the “Other Purchase Obligations” are generally assumed to be made ratably over the term of the obligations. Long-term Purchase Obligations, which comprises $3,333$3,468 million of "Other Purchase Obligations," were derived from the Utilities' purchasing system by using a method that identifies the remaining purchase obligations. The Utilities believe that unreasonable effort and expense would be involved to enable them to report their “Other Purchase Obligations” in a different manner.
(g)The Clean Energy Businesses were classified as held for sale as of December 31, 2022. See "Assets and Liabilities Held for Sale," in Note A and Note X to the financial statements in Item 8. Amounts represent commitments by the Clean Energy Businesses to purchase minimum quantities of electric energy and capacity, renewable energy certificates, natural gas, natural gas pipeline capacity, energy efficiency services and construction services. The Clean Energy Businesses have also entered into power purchase agreements for the sale of power from their renewable electric projects, provisions of which provide for penalties to be paid by the Clean Energy Businesses in the event certain minimum production quantities are not met. The future minimum production quantities and the amount of the penalties, if any, are not estimable and are not included in the amounts shown on the table.
The Companies’ commitments to make payments in addition to these contractual commitments include their other liabilities reflected on their balance sheets, any funding obligations for their pension and other postretirement benefit plans, financial hedging activities, their collective bargaining agreements and Con Edison’s and the Clean Energy Business' guaranteesguarantee of certain obligations. See Notes E, F, Q and “Guarantees” in Note H to the financial statements in Item 8.
Capital Resources
Con Edison is a holding company that operates only through its subsidiaries and has no material assets other than its interests in its subsidiaries. Con Edison finances its capital requirements primarily through internally-generated funds, the sale of its common shares or external borrowings. Con Edison’s ability to make payments on external borrowings and dividends on its common shares depends on receipt of dividends from its subsidiaries, proceeds from the sale of additional common shares or its interests in its subsidiaries or additional external borrowings. See "Con Edison's Ability To Pay Dividends Or Interest Depends On Dividends From Its Subsidiaries" in Item 1A and Note U to the financial statements in Item 8.
For information about restrictions on the payment of dividends by the Utilities and significant debt covenants, see Note C to the financial statements in Item 8.
For information on the Companies’ commercial paper program and revolving credit agreements with banks, see Note D to the financial statements in Item 8.
The Companies require access to the capital markets to fund capital requirements that are substantially in excess of available internally-generated funds. See “Capital Requirements,” above and "The Companies Require Access To Capital Markets to Satisfy Funding Requirements” in Item 1A. Each of the Companies believes that it will continue to be able to access capital, although capital market conditions may affect the timing and cost of the Companies’ financing activities. The Companies monitor the availability and costs of various forms of capital, and will seek to issue Con Edison common shares and other securities when it is necessary or advantageous to do so. See “Coronavirus Disease 2019 (COVID-19) Impacts – Liquidity and Financing” in Item 7. For information about the Companies’ long-term debt and short-term borrowing, see Notes C and D to the financial statements in Item 8.
The Utilities finance their operations, capital requirements and payment of dividends to Con Edison from internally-generated funds, contributions of equity capital from Con Edison, if any, and external borrowings. See "Liquidity and Capital Resources" in Item 7.
Con Edison plans to meet its capital requirements for 20232024 through 20252028 through internally-generated funds the anticipated net proceeds from the sale of the Clean Energy Businesses and the issuance of long-term debt and common equity. See “Capital Requirements and Resources - Capital Requirements,"Requirements" in Item 1. See "Assets Held for Sale" in Note A and Note X to the financial statements in Item 8 and "Anticipated Sale of the Clean Energy Business," above. Subject to, and following the closing of the sale of the Clean Energy Businesses, Con Edison intends to repay $1,250 million of parent company debt in 2023, invest in the Utilities and repurchase up to $1,000 million of its common shares. In anticipation of the proceeds from the pending transaction, Con Edison intends to forego common equity issuances in 2023 and 2024 andEdison's plans on issuing up to $900 million of common equity in 2025. The company's plans also include the issuance of up to $1,400$3,250 million of long-term debt in 2024 and up to $1,000 million of long-term debt in 2025, including for maturing securities, at the Utilities in 2023 and approximately $2,600$6,000 million in aggregate of long-term debt, including for maturing securities, at the Utilities during 2026 through 2028. Except for equity issued under its dividend reinvestment, employee stock purchase and long-term incentive plans, Con Edison does not plan to issue common equity in 2024 and 2025.
| | | | | |
CON EDISON ANNUAL REPORT 2022 | 33 |
plans to issue common equity of approximately $1,300 million in 2025 and up to $2,800 million in aggregate during 2026 through 2028. Con Edison’s estimates of its capital requirements and related financing plans reflect information available and assumptions at the time the statements are made and include, among other things, the assumptions that Con Edison’s non-utility gas transmission investments remain unchanged through 2028 and the Utilities’ forecasted capital investments and financing plans through 2028 are approved by the New York State Public Service Commission. Actual developments and the timing and amount of funding may differ materially.
In 2021, the NYSPSC authorized CECONY, through 2025, to issue up to $4,025 million of debt securities ($1,4503,450 million of which the company had issued as of December 31, 2022)2023). In 2022, the NYSPSC authorized O&R, through 2025, to issue up to $285 million of debt securities ($100150 million of which the company had issued as of December 31, 2022)2023). The NYSPSC also authorized CECONY and O&R for such periods to issue debt securities to refund existing debt securities of up to $2,500 million and $125 million, respectively. As of December 31, 2022,2023, the Utilities had not refunded any securities pursuant to these authorizations.
The Clean Energy Businesses, which were classified as held for sale as of December 31, 2022, have financed their operations and capital requirements primarily with capital contributions and borrowings from Con Edison, internally-generated funds and external borrowings. See Con Edison's Consolidated Statement of Capitalization in Item 8 and Note Q to the financial statements in Item 8.
Con Edison Transmission has financed its operations and capital requirements primarily with capital contributions and borrowings from Con Edison and internally-generated funds. See "Liquidity and Capital Resources" in Item 7.
| | | | | |
30 | CON EDISON ANNUAL REPORT 2023 |
For each of the Companies, the common equity ratio for the last five years was:
| | Common Equity Ratio (Percent of total capitalization) |
| 2018 | 2019 | 2020 | 2021 | 2022 |
| Common Equity Ratio (Percent of total capitalization) | | | Common Equity Ratio (Percent of total capitalization) |
| 2019 | | | 2019 | 2020 | 2021 | 2022 | 2023 |
| Con Edison | Con Edison | 49.0 | | 49.6 | | 48.3 | | 47.4 | | 50.9 | |
| CECONY | CECONY | 48.6 | | 49.2 | | 47.9 | | 47.0 | | 46.9 | |
The credit ratings assigned by Moody’s, S&P and Fitch to the senior unsecured debt and commercial paper of Con Edison, CECONY and O&R are as follows:
| | | | | | | | | | | |
| Moody's | S&P | Fitch |
| Con Edison | | | |
| Senior Unsecured Debt | Baa2Baa1 | BBB+ | BBB+ |
| Commercial Paper | P-2 | A-2 | F2 |
| CECONY | | | |
| Senior Unsecured Debt | Baa1A3 | A- | A- |
| Commercial Paper | P-2 | A-2 | F2 |
| O&R | | | |
| Senior Unsecured Debt | Baa2 | A- | A- |
| Commercial Paper | P-2 | A-2 | F2 |
Credit ratings assigned by rating organizations are expressions of opinion and are not recommendations to buy, sell or hold securities. A credit rating is subject to revision or withdrawal at any time by the assigning rating organization. Each rating should be evaluated independently of any other rating. See “The Companies Require Access To Capital Markets To Satisfy Funding Requirements” and “Changes To Tax Laws Could Adversely Affect the Companies” in Item 1A.
In 2017, the United Kingdom’s Financial Conduct Authority announced that it intends to stop persuading or compelling banks to submit London Interbank Offered Rates (LIBOR). LIBOR’s administrator ceased publishing one-week and two-month U.S. Dollar LIBOR immediately after the LIBOR publication on December 31, 2021, and is scheduled to cease publication of the remaining U.S. Dollar LIBOR tenors immediately after the publication on June 30, 2023.The Companies have been and are continuing to monitor LIBOR-related market, regulatory and accounting developments. The Companies’ material contracts that reference LIBOR and currently extend beyond 2022 include their $2,200 million credit agreement (see Note D to the financial statements in Item 8). Pursuant to the credit agreement, the Companies may borrow at interest rates determined with reference to a prime rate, the federal funds rate or LIBOR. The credit agreement may be amended by the Companies and the administrative agent to provide for a LIBOR successor rate unless a majority of the lenders do not accept the amendment. In addition, the Clean Energy Businesses have $1,093 million of variable rate project debt that reference LIBOR and currently extends beyond 2022 and that allows for an alternate reference rate and associated interest rate swaps with a notional amount of $982 million (see Note Q to the financial statements in Item 8). Con Edison expects that the Clean Energy Businesses will be able to agree with project lenders and swap counterparties on the use of an
| | | | | |
34
|
CON EDISON ANNUAL REPORT 2022 |
alternate reference rate as needed. The Companies do not expect that a discontinuation of LIBOR would have a material impact on their financial position, results of operations or liquidity.
Environmental Matters
Clean Energy Future
Clean Energy GoalsNew York State’s Climate Leadership and Community Protection Act
In 2019, New York State enacted the Climate Leadership and Community Protection Act (CLCPA) that established a goal of 70 percent of the electricity procured by load serving entitiesentities regulated by the NYSPSC to be produced by renewable energy systems by 2030 and requires the statewide electrical demand system to have zero emissions by 2040. The law also codified state targets for energy efficiency (end-use energy savings of 185 trillion British thermal units below 2025 energy-use forecast), offshore wind (9,000 megawatts (MW)MW by 2035), solar (6,000 MW by 2025) and energy storage (3,000 MW by 2030). In addition, the lawThe CLCPA established a climate action council. In December 2022, the council approved a final scoping plan containingthat made recommendations for meeting the CLCPA's statewide greenhouse gas (GHG) emission reduction requirements including measures to reduce emissions bythrough displacing fossil-fuel fired electricity with renewable electricity, transitioning heating and transportation energy uses to lower GHG impact fuels (including substantial electrification of those uses)electrification), implementing energy efficiency measures and providing 35 percent -to 40 percent of the benefits of CLCPA-related investments to disadvantaged communities. As required by the law, the New York State Department of Environmental Conservation (NYSDEC) published the 1990 inventory of GHG emissions and adopted regulations establishing statewide GHG emissions limits that are 60 percent of 1990 emissions levels by 2030 and 15 percent of 1990 emissions by 2050. The Utilities are unable to predict the impact on them of the implementation of this law.
CECONY and O&R have been required to obtain renewable energy credits (RECs) and zero-emissions credits (ZECs) for their full service customers since 2017. In October 2020, the NYSPSC, in response to the CLCPA, modified its clean energy standard to establishestablished a new renewable energy credits (RECs)RECs program to support increased renewable energy availability in New York City for which the costs would be borne by load serving entities across New York State on a volumetric basis. CECONY and O&R have been required to obtain RECs and zero-emissions credits (ZECs) for their full service customers since 2017. Load serving entities may satisfy their REC obligation by either purchasing RECs acquired through central procurement by the New York State Energy Research and Development Authority (NYSERDA), by self-supply through direct purchase of tradable RECs, or by making alternative compliance payments. Load serving entities purchase ZECs which are only available from NYSERDA at prices determined by the NYSPSC. In April 2022, the NYSPSC issued an order approving contracts between NYSERDA and two project sponsors selected by NYSERDA to provide RECs directly to New York City: CleanCity (Clean Path New York and H.Q. Energy Services (U.S.) Inc.The H.Q. Energy Services project and the Clean Path New York project) that anticipate in-service dates of 2026 and 2027, respectively.
| | | | | |
| CON EDISON ANNUAL REPORT 2023 | 31 |
Both projects have submitted requests to the NYISO to interconnect to CECONY’s high-voltage transmission system.
PriorIn June 2023, the NYISO selected the Propel NY Energy transmission project that was jointly proposed by New York Transco and the New York Power Authority (NYPA). Con Edison Transmission has a 41.7 percent interest in New York Transco’s share of the Propel NY Energy project, a 90-mile electric transmission project with an in-service date of 2030. The project is expected to enactmentenable delivery of a minimum of 3,000 MW of offshore wind electricity, increase high voltage transmission connections between Long Island and the rest of New York State and provide New Yorkers with greater access to diverse energy resources. See "Con Edison Transmission," below.
Also in June 2023, CECONY filed a petition with FERC to add a formula rate to the NYISO tariff to enable CECONY to recover the costs of, and a return on investment for, two types of projects: (1) local transmission upgrades determined by the NYSPSC to be necessary or appropriate to meet the CLCPA goals of New York State and (2) any regulated transmission projects (or portions thereof) eligible for recovery under the NYISO’s public policy transmission planning process. For local transmission upgrades, CECONY proposed the return on equity to be the lower of the NYSPSC-determined rates or 10.87 percent. For NYISO projects, CECONY proposed a return on equity of 11.10 percent. CECONY anticipates that the formula rate, once in place, will be applied to recover the costs of the upgrades associated with the Propel NY Energy offshore wind project.
In November 2023, CECONY and O&R filed their combined gas system long-term plan. The Utilities’ plan has a 20-year horizon to achieve the greenhouse gas emissions reduction targets of the CLCPA and its expansionincludes three pathways: (1) a reference pathway based on investments approved by the NYSPSC, (2) an alternate hybrid electric generation and low-carbon fuels pathway and (3) an alternate deep electrification pathway. The plan outlines objectives in clean energy, climate resilience, core service, and customer engagement and includes forecasts of annual customer bill charges. The plan concludes that gas sales and emissions in CECONY’s and O&R’s service territories are projected to fall in all three pathways.
Offshore Wind
In an effort to meet the CLCPA’s offshore wind goals, in July 2018, the NYSPSC established a goal of 2,400 MW of new offshore wind facilities by 2030. As a result of this goal, load serving entities, such as CECONY and O&R, will be required to purchase offshore wind renewable energy credits (ORECs) from NYSERDA beginning in 2025 when projects are expected to begin operation. In October 2019, NYSERDA entered into a 25-year power purchase agreement (PPA) with Equinor Wind US LLC for its 816 MW Empire Wind Project, and a 25-year PPA with Sunrise Wind LLC for its 880 MW Sunrise Wind Project. In January 2022, NYSERDA expanded its contract with Empire Wind Project to 1,260 MW and awarded another contract to Equinor Wind US LLC for its 1,230 MW Beacon Wind Project.
In May 2020, the NYSPSC initiated a proceeding implementing the Accelerated Renewable Energy Growth and Community Benefit Act to align New York State’s electric system with CLCPA goals. In November 2020, NY’s investor-owned utilities (including the Utilities) and LIPA filed a comprehensive report in this proceeding, identifying proactive local transmission and distribution investments in their systems to facilitate achieving the goalsOctober 2023, NYSERDA announced that it selected three new offshore wind projects for contract negotiations, representing 4,032 MW of energy by 2030 One of the CLCPA and setting out policy recommendations for how they will identify, prioritize and allocate costsconditional awards, the Community Offshore Wind project, is expected to connect 1,314 MW of these and future such projects going forward. CECONY and O&R identified approximately $4,500 million and $400 million, respectively, in local transmission investment. In January 2022, the NYSPSC issued an order based on recommendations from a 2021 power grid study that authorized CECONY to file a comprehensive petition addressing a proposed clean energy hub in Brooklyn, NY (Brooklyn Clean Energy Hub) that could accommodate interconnection to offshore wind generation. In April 2022, CECONY filed the petition, seeking cost recovery approval for the proposedelectricity through CECONY’s Brooklyn Clean Energy Hub that wouldby 2030 (see “Electric Reliability Needs,” above) and another conditional award, the Excelsior Wind project, is expected to connect up to 6,0001,314 MW of offshore wind energy intoelectricity using the New York City grid at an estimated cost of $1,000 million and an estimated in-service date of 2027. In December 2022, CECONY supplemented its petition to propose an alternate version that focuses on a 2028 reliability need and has an estimated cost of $810 million. It omits certain elements related to offshore wind interconnection but provides the flexibility for offshore wind resources to interconnect to the Brooklyn Clean Energy
| | | | | |
CON EDISON ANNUAL REPORT 2022 | 35 |
Hub during construction and after it commences operation. CECONY requested that the NYSPSC approve either the original or alternate versioncapability of the project at its March 2023 session.
Federal and local municipal laws and agencies also regulate emissions levels and impact the CLCPA’s decarbonization pathways. In June 2022, the U.S. Supreme Court issued a decision that restricts the authority of the United States Environmental Protection Agency (EPA) to establish GHG emission reduction measures under the federal Clean Air Act for technologies that reduce GHG emissions from fossil fuel combustion at the source. ConPropel NY Energy project. See "Con Edison as part of a coalition of public and private utilities, was a party in the case and had argued that the U.S. Supreme Court should not adopt this restrictive statutory reading of the Clean Air Act. The U.S. Supreme Court's decision could have potential cost implications for CECONY because it could limit its flexibility to use measures such as trading emissions allowances from higher emitting sources to lower emitting sources and averaging emissions across different sources, to cost-effectively meet federal GHG emissions limits for its limited portfolio of steam and electric generating assets. The decision could also indirectly impact CECONY's and O&R's initiatives to develop renewable energy sources. The Companies are unable to predict the impact on them as a result of the decision or any regulations that may be promulgated by the EPA in light of this U.S. Supreme Court decision.
In 2014, New York City announced a goal to reduce GHG emissions 80 percent below 2005 levels by 2050. In May 2019, New York City enacted a package of legislation known as the Climate Mobilization Act, that includes provisions intended to reduce GHG emissions from large buildings by 40 percent from 2005 levels by 2030. Building owners may achieve compliance through operational changes, building retrofits, the purchase of GHG offsets, the purchase of renewable energy credits and the use of clean distributed energy resources. CECONY is unable to predict the impact on it of the implementation of this law.
In December 2021, New York City enacted Local Law 154. The law prohibits submitting permits for the construction or major renovation of buildings that use oil, natural gas and some low carbon fuels beginning in 2024 for affected buildings with less than seven stories and beginning in 2027 for all other affected buildings. The law includes exceptions for buildings that use electric or steam generation, commercial kitchens, manufacturing, laundromats, and hospitals. The Department of Buildings may also create additional exceptions.Transmission," above.
Energy Efficiency Electric Vehicles, Energy Storage and Thermal Energy Networks
In January 2020, and updated in August 2022 for CECONY,, the NYSPSC issued an order directing energy efficiency targets and budgets for NYNew York utilities. The order approved $2,000 million statewide for electric and gas energy efficiency programs and heat pump budgets, and associated targets, for the years 2020 through 2025 to meet the NYSPSC’s goal of reducing electric use by 3 percent annually and gas use by 1.3 percent annually by 2025. The order and subsequent update authorized budgets for the years 2020 through 2025 for: electric energy efficiency programs of $688 million and $71 million for CECONY and O&R, respectively; gas energy efficiency programs of $338 million and $17 million for CECONY and O&R, respectively; and heat pump programs of $746 million and $15 million for CECONY and O&R, respectively. CECONY’s current electric and gas rate plans allow it to recover the costs of energy efficiency expenditures, including a full rate of return, in rates from customers. See Note B to the financial statements in Item 8.
In May 2018, the NYSPSC initiated a proceeding on the roleNovember 2023, and updated in January 2024, CECONY and O&R filed preliminary proposals for energy efficiency and heat pump programs for 2026-2030 with aggregate budgets of approximately $2,744 million and $129 million, respectively. The aggregate amounts are comprised of average annual budgets of up to: $373 million and $22 million for electric utilities in providing needed infrastructureenergy efficiency and rate options to advance adoption of electric vehicles. heat pump programs for CECONY and O&R, respectively, $150 million and $4 million for gas energy efficiency programs for CECONY and O&R, respectively, and $26 million for steam energy efficiency programs for CECONY.
| | | | | |
32 | CON EDISON ANNUAL REPORT 2023 |
Electric Vehicles
In July 2020, the NYSPSC established a light-duty electric vehicle make-ready programand other infrastructure programs that includesincluded budgets of $290 million and $24 million for CECONY and O&R, respectively, through 2025 for electric vehicle2025. In November 2023, the light-duty infrastructure and relatedother programs, including medium and heavy-duty make-ready pilot projects and a new micromobility infrastructure incentive program, costs. CECONY’s current electric rate plan also includes fundingwere expanded to offer upapproximately $823 million for CECONY and $56 million for O&R, with the ability to $22 million in incentives for off-peak charging and electric vehicle infrastructure.extend beyond 2025. The NYSPSC authorized both CECONY and O&R to recover these costs, including a full rate of return, through surcharge mechanisms and subsequently in rates from customers.
In July 2022, the NYSPSC issued an order directing New York utilities, including CECONY and O&R, to implement managed electric vehicle charging programs and prescribing program and funding requirements. The orderthat provides CECONY and O&R with up to a total ofof $31 million and $5.8 million, respectively, through 2025, for program implementation of residential vehicle managed charging programs and administration costs. The NYSPSC authorized both CECONY and O&R to recover these costs viathrough surcharge or other mechanisms. The order also provides CECONY and O&R with authorization to offer incentives to encourage electric vehicle charging to occur overnight and during off-peak times totaling approximately $71.8 million and $8.2 million, respectively, through 2025, that would be recovered through the respective company’s revenue reconciliation mechanisms.
In October 2022, the NJBPU approved RECO’s electric vehicle make-ready program that includes a budget of $7.6 million through 2026 for electric vehicle infrastructure and related program costs. The NJBPU authorized RECO to recover these costs, including a full rate of return, in rates from customers.
| | | | | |
36
|
CON EDISON ANNUAL REPORT 2022 |
In November 2023, the NYSPSC issued an order that provides CECONY and O&R with up to $432 million and $18 million, respectively, for the implementation of commercial managed charging programs and demand charge rebates, participant incentives and administration costs. The NYSPSC authorized CECONY and O&R to recover these costs, including a full rate of return, through surcharge mechanisms and subsequently in rates from customers.
Energy Storage
In December 2018, the NYSPSC issued an order establishing an energy storage goal of up to 3,000 MW of energy storage by 2030 with an interim objective of 1,500 MW by 2025. The order also required CECONY and O&R to file an implementation planplans for a competitive procurement process to deploy 300 MW and 10 MW, respectively, of energy storage while O&R and the other NY electric utilities must plan to deploy 10 MW each.storage. CECONY and O&R filed their implementation plans in February 2019. In December 2020, CECONY entered into ais in contract negotiations with a storage developer for energydevelopers and O&R is evaluating bids from storage services to provide power capacity of up to 100 MW.developers. The Utilities expect to recover the cost of energy storage services, including a full rate of return, in rates and surcharges from customers. In December 2022, NYSDPS and NYSERDA issued an updated storage roadmap that proposes to increase the storage goal from 3,000 MW to 6,000 MW by 2030. The proposal includes the recommendation that New York State’s utilities study the potential of energy storage to provide non-market transmission and distribution services and identify services that are cost-effective compared to traditional alternatives.
Thermal Energy Networks
In September 2022,2023, the NYSPSC initiated a proceeding to implementissued an order providing guidance on the Utility Thermal Energydevelopment and Jobs Act that requires NY State’s utilities to propose at least oneimplementation of utility-scale thermal energy network pilot projects throughout New York State. The order introduced a framework for the NYSPSC review and approval.to evaluate whether the proposed pilot projects are in the public interest. In December 2023, CECONY and O&R have submitted preliminaryfiled pilot project proposals for further development in consultation with NYSDPS.budgets of $255 million and $46 million, respectively. The proposed pilots are subject to approval by the NYSPSC.
Distribution System and Distributed Resources
The NYSPSC is directing development by NYNew York electric utilities of a distributed system platform to manage and coordinate DERdistributed energy resources in their service areas under NYSPSC regulation and to provide customers, together with third parties, with data and tools to better manage their energy use. Regarding the latter, CECONY and O&R are working with other NY electric utilities and NYSERDA to respond to the NYSPSC’s order to implement a data access framework and integrated energy data resources to share energy-related information. The Utilities are also working with the other utilities to enhance the NYSPSC’s Utility Energy Registry hosted by NYSERDA that provides public access to aggregated community energy usage data from the utilities. The NYSPSC has required the Utilities to file distributed system implementation plans and ordered the Utilities to develop demonstration projects to inform distributed system platform business models. As of December 31, 2022,2023, CECONY and O&R had one shared active demonstration project, and individually, CECONY had four and O&R had three active demonstration projects.
The NYSPSC approved CECONY’s advanced metering infrastructure (AMI) installation plan for its electric and gas delivery businesses, subject to a cap on capital expenditures of $1,285 million. CECONY substantially completed its smart meter installations in 2023 and expects to complete its AMI installation plan in 2023.2024. The NYSPSC also authorized O&R to expend $98.5 million to install AMI for its NYNew York customers, which work was complete as of December 31, 2020.
| | | | | |
| CON EDISON ANNUAL REPORT 2023 | 33 |
The NYSPSC began to change compensation for DERs and phase outplace limits on net energy metering (NEM) in 2015. In NY,New York, NEM compensates kilowatt-hours exported to the electric distribution system at the full-service rate for production, delivery, taxes and fees. NYSPSC’s policy is to phase in changes to limit annual bill increases on non-participating customers to two percent. In addition, NEM projects interconnected on or after January 1, 2022 are charged for their share of energy efficiency and other public policy benefit programs.
New York City’s Clean Energy Goals
In 2014, New York City announced a goal to reduce GHG emissions 80 percent reducingbelow 2005 levels by 2050. In May 2019, New York City enacted a package of legislation known as the Climate Mobilization Act, that includes provisions intended to reduce GHG emissions from large buildings by 40 percent from 2005 levels by 2030. Building owners may achieve compliance through operational changes, building retrofits, the purchase of GHG offsets, the purchase of renewable energy credits and the use of clean distributed energy resources. CECONY is unable to predict the impact on it of the implementation of this policylaw.
Federal Regulation
In June 2022, the U.S. Supreme Court issued a decision that restricts the authority of the United States Environmental Protection Agency (EPA) to establish GHG emission reduction measures under Section 111 of the federal Clean Air Act for technologies that reduce GHG emissions from fossil fuel combustion at the source. Con Edison, as part of a coalition of public and private utilities, was a party in the case and had argued that the U.S. Supreme Court should not adopt this restrictive statutory reading of the Clean Air Act. Depending on non-participating residential customershow it is implemented in future final EPA regulations, which are currently undergoing federal rulemaking, the U.S. Supreme Court’s decision could have potential cost implications for CECONY because it could limit its flexibility to use measures such as trading emissions allowances from higher emitting sources to lower emitting sources and averaging emissions across different sources, to cost-effectively meet federal GHG emissions limits for its limited portfolio of steam and electric generating assets. The decision could also indirectly impact CECONY's and O&R's initiatives to develop renewable energy sources. Certain CECONY electric generating units could be subject to the final rule, depending on its applicability criteria. The Companies are unable to predict the impact on them as a result of the decision or any final regulations that would have occurred under NEM, butmay be promulgated by the NYSPSC have permitted exceptions to this policy.EPA.
Climate Change
As indicated by the Intergovernmental Panel on Climate Change, emissions of greenhouse gases (GHG), including carbon dioxide, from manmade sources are very likely changing the world’s climate.
Climate change could affect customer demand for the Companies’ energy services. It might also cause physical damage to the Companies’ facilities and disruption of their operations due to more frequent and more extreme weather. In August 2020,Past major weather events such as Superstorm Sandy in 2012 and Tropical Storm Isaias in 2020 caused significant damage to the Utilities’ electric distribution systems and interrupted service to approximately 530,000 of the Utilities’ customers and caused the second-largestlarge power outageoutages in the Utilities’ history (Superstorm Sandy interrupted service to 1.4 million of the Utilities’ customers’ in October 2012)territories and resulted in the Utilities incurring substantial response and restoration costs. After Superstorm Sandy,
In September 2023, CECONY invested $1,000 million in its infrastructure to improve its resilience against storms. In December 2019, CECONY completed a study ofupdated the climate change vulnerability. Thevulnerability study evaluated present-day infrastructure, design specificationsit issued in 2019 and procedures under a range of potential climate futures. The study identified sea level rise, coastal storm surge, inland flooding from intense rainfall, hurricane-strength winds and extreme heat to be CECONY’s most significant climate-driven risks toO&R published its electric, gas and steam systems. The study estimated that CECONY might need to invest between $1,800 million and $5,200 million by 2050 on targeted programs to adapt to potential impacts from climate change. During 2020, CECONY further evaluated its futurefirst climate change adaptation strategies andvulnerability study. The studies were developed pursuant to a climate change implementation plan that it filed with the NYSPSC in December 2020. The climate change implementation plan explains how CECONY will incorporate climate change projections for heat, precipitation, and sea level rise from the 2019 Climate Change Vulnerability Study into its
| | | | | |
CON EDISON ANNUAL REPORT 2022 | 37 |
operations to mitigate climate change risks to its assets and operations and establishes an ongoing process to reflect the latest science in the company’s planning. With respect to governance, CECONY adopted a climate change planning and design guideline, created an executive committee to oversee implementation of the plan, and established a climate risk and resilience team to execute the day-to-day activities required by the plan.
Effective March 2022, the NYNew York State legislature amended the NY Public Service Law to requirelaw that requires all NYNew York electric utilities including CECONY and O&R, to conductrelease a climate change vulnerability study by September 2023 and develop and file for approval bywith the NYSPSC a subsequent climate vulnerability and resiliencychange resilience plan by November 2023 that includes 10- and 20-year outlooks for resiliency.at least every five years. The law authorizes utilities to recover costs through a climate resiliency cost recovery surcharge for costs incurred outside of the rate proceedingsplans through a surcharge and to subsequently include any unrecoveredapproved costs ininto base rates when base ratesduring the next rate case proceeding. The Utilities’ studies identified rising temperatures, inland flooding, sea level rise, storm surge, high winds, ice accumulation and extreme and compound weather events to be the biggest risks to their systems. The resulting extreme weather events brought about by climate change are reset. The NY utilities are required to file an updatedmanifested in increased system load, asset degradation, equipment damage and worker safety and accessibility concerns.
In November 2023, CECONY and O&R filed climate vulnerability and resiliency planchange resilience plans with the NYSPSC forthat proposed to make investments of $903 million and $411 million, respectively, between 2025 and 2029 to enhance the resilience of their electric systems against extreme weather events brought about by climate change. The projected total cost of CECONY’s and O&R’s resilience investments from 2025 through 2044 are expected to be $5,600 million and $1,400 million, respectively. These investments are subject to approval at least every five years. In June 2022,by the NYSPSC initiated a proceeding to implement the requirements of the legislation.NYSPSC.
GHG Emissions Reporting
| | | | | |
34 | CON EDISON ANNUAL REPORT 2023 |
Based on the most recent data (2020)(2021) published by the U.S. Environmental Protection Agency (EPA), Con Edison estimates that its direct GHG emissions constitute less than 0.1 percent of the nation’s GHG emissions. According to the CLCPA final scoping plan, the Buildings and Transportation sectors are the two largest sources of GHG emissions in NY State. Con Edison’s estimated Scope 1 emissions of GHG during the past five years were:
| (Metric tons, in millions (a)) | (Metric tons, in millions (a)) | 2018 | 2019 | 2020 | 2021 | 2022 | (Metric tons, in millions (a)) | 2019 | 2020 | 2021 | 2022 | 2023 |
| CO2 equivalent emissions | CO2 equivalent emissions | 3.1 | | 2.9 | | 2.7 | | 2.8 | | 2.9 | |
(a)Estimated emissions for 20222023 are based on preliminary data and are subject to third-party verification. Scope 1 emissions are GHG emitted into the atmosphere by assets owned by Con Edison. Con Edison’s Scope 1 emissions primarily include emissions from CECONY’s operation of steam, electric, and co-generation plants. Con Edison’s Scope 1 emissions also include fugitive emissions that occur when pressurized equipment and infrastructure containing a GHG has a controlled or uncontrolled emission and emissions from Con Edison’s vehicle fleet.
Con Edison’s more than 5054 percent decrease in direct GHG emissions (carbon dioxide, methane and sulfur hexafluoride) from the 2005 baseline (6.0 million metric tons) reflects the emission reductions resulting from equipment and repair projects, reduced steam demand, the increased use of natural gas in lieu of fuel oil at CECONY’s steam production facilities as well asand projects to reduce sulfur hexafluoride emissions and to replace leak-prone gas distribution pipes. As a result of the Utilities’ participation in the NYISO wholesale markets, a portion of the Utilities’ NYISO energy purchases are sourced from renewable electric production facilities. The electricity produced by renewable generation offsets the energy that the Utilities would otherwise have procured, thereby reducing the amount of electricity produced by non-renewable production facilities. The Utilities also actively promote energy efficiency and the use of renewable generation to help their customers reduce their GHG emissions.
CECONY has participated for several years in voluntary initiatives with the EPA to reduce its methane and sulfur hexafluoride emissions. The Utilities reduce methane emissions from the operation of their gas distribution systems through pipe maintenance and replacement programs and by introducing newutilizing technologies to reduce fugitive emissions from leaks or when work is performed on operating assets. The Utilities reduce emissions of sulfur hexafluoride which is used for arc suppression in substation circuit breakers and switches, by using improved technologies to locate and repair leaks and by replacing older equipment. The Utilities also actively promote energy efficiency and the use of renewable generation to help their customers reduce their GHG emissions.
Emissions in NY State are also avoided by renewable electric production facilities replacing fossil-fueled electric production facilities and the continued operation of upstate nuclear power plants. See – “Clean Energy Future,” above. NYSERDA has been responsible for implementing the renewable portfolio standard (RPS) and Clean Energy Standard (CES) established by the NYSPSC. NYSERDA has entered into agreements with developers of large renewable electric production facilities and theIn December 2023, NYSDEC issued a proposed regulation that would impose an emissions limit on owners of upstate nucleargas insulated equipment containing sulfur hexafluoride, including equipment used in electric power plantstransmission and pays them premiums based on the facilities’ electric output. These facilities sell their energy output in the wholesale energy and capacity markets administered by the NYISO. As a result of the Utilities’ participation in the NYISO wholesale markets, a portion of the Utilities’ NYISO energy purchases are sourced from renewable electric production facilities. NYSERDA also has provided rebates to customers who installed eligible renewable electric production technologies. The electricity produced by such customer-sited renewables generation offsets the energy that the Utilities would otherwise have procured, thereby reducing the amount of electricity produced by non-renewable production facilities.distribution.
In 2022, NYSERDA and the NYSDEC published the 2022 Statewide GHG Emissions Report, which provided a summary of statewide GHG emissions from 1990 to 2020, including an analysis of trends, the relative contribution of each type of GHG and the relative contribution of each type of source. In 2020, total statewide gross GHG emissions were 15 percent lower than in 1990 and 8 percent lower than in 2019, although the decline from 2019 to 2020 likely reflects the economic impacts of the COVID-19 pandemic and is not considered representative of current conditions. Annual GHG emission levels are expected to increase from 2020 levels in future reports for 2021 and 2022, reflecting economic recovery following the COVID-19 global pandemic.
| | | | | |
38
|
CON EDISON ANNUAL REPORT 2022 |
In January 2016, the NYSPSC approved a 10-year $5,300 million clean energy fund to be managed by NYSERDA under the NYSPSC's supervision. The clean energy fund has four portfolios: market development; innovation and research; NY Green Bank and NY Sun. The Utilities collect all clean energy fund surcharges from their customers through the system benefit charge (including previously authorized RPS, EEPS, Technology and Market Development collections and incremental clean energy fund collections to be collected from electric customers only).charge. The Utilities billed customers clean energy fund surcharges of $224 million, $216 million and $224 million in 2023, 2022, and $212 million in 2022, 2021, and 2020, respectively. For information about NYSPSC proceedings considering renewable generation see “Clean Energy Future," above.
CECONY is subject to carbon dioxide emissions regulations established by NYNew York State under the Regional Greenhouse Gas Initiative (RGGI) due to its ownership of electric generation assets. The initiative a cooperative effort by Northeastern and Mid-Atlantic states, established a decreasing cap on carbon dioxide emissions resulting from the generation of electricity. Under RGGI, affected electric generators are required to obtain emission allowances to cover their carbon dioxide emissions, available primarily through auctions administered by participating states or a secondary market. Due to changes in the New York State CO2 Budget Trading Program, for the fifth RGGI control period (2021 - 2023) two additional CECONY generation units were added to the RGGI program. However, since the affected units are used only for peaking generation and when needed to restore power to the electric grid, the incremental allowances that will need to be purchased are not expected to materially impact the company’s RGGI obligations.emissions. CECONY will purchase RGGI allowances for the fifthsixth control period (2024 – 2026) based on anticipated emissions, which are expected to be similar to past compliance periods.
The cost to the Companies to comply with legislation, regulations or initiatives limiting GHG emissions could be substantial.
Environmental Sustainability
Con Edison’s sustainability strategy, as it relates to the environment, provides that the company seeks, among other things, to reduce direct and indirect GHG emissions; enhance the efficiency of its water use; reduce its impact to natural ecosystems; focus on reducing, reusing and recycling to lower materials consumption and disposal; and design its work in consideration of climate forecaprojectionssts..
Con Edison has adopted a Clean Energy Commitment whereby it commits to leading and delivering the transition to the clean energy future. Con Edison's Clean Energy Commitment is supported by five pillars:
•Build the grid of the future
•Empower Con Edison's customers to meet their climate goals
•Reimagine the gas system
•Lead by reducing Con Edison's carbon footprint
•Partner with stakeholders
CECONY
Superfund
| | | | | |
| CON EDISON ANNUAL REPORT 2023 | 35 |
The Federal Comprehensive Environmental Response, Compensation and Liability Act of 1980 and similar state statutes (Superfund) impose joint and several liability, regardless of fault, upon generators of hazardous substances for investigation costs, remediation costs and environmental damages. The sites as to which CECONY has been asserted to have liability under Superfund include its and its predecessor companies’ former manufactured gas sites, its multi-purpose Astoria site, the Gowanus Canal site, the Newtown Creek site and other Superfund sites discussed below. There may be additional sites as to which assertions will be made that the company has liability. For a further discussion of claims and possible claims against the company under Superfund, estimated liability accrued for Superfund claims and recovery from customers of site investigation and remediation costs, see Note G to the financial statements in Item 8.
Manufactured Gas Sites
CECONY and its predecessors formerly owned and operated manufactured gas plants at 51 sites (MGP Sites) in New York City and Westchester County. Many of these sites have been subdivided and are now owned by parties other than CECONY and have been redeveloped for other uses, including schools, residential and commercial developments and hospitals. The NYSDEC is requiring CECONY to investigate, and if necessary, develop and implement remediation programs for the sites, including any neighboring areas to which contamination may have migrated.
CECONY has started remedial investigations at all 51 MGP Sites. After investigations, no MGP impacts have been detected at all or portions of 15 sites, and the NYSDEC has issued No Further Action (NFA) letters for these sites.
| | | | | |
CON EDISON ANNUAL REPORT 2022 | 39 |
Coal tar or other MGP-related contaminants have been detected at the remaining 36 sites. Remedial actions have been completed at all or portions of 14 sites and the NYSDEC has issued NFA letters for these sites. In addition, remedial actions have been completed by property owners at all or portions of four sites under the NYNew York State Brownfield Cleanup Program and Certificates of Completion have been issued by the NYSDEC for these sites. Remedial design, planning or action is ongoing for the remaining sites or portions of sites; however, the information as to the extent of contamination and scope of the remediation likely to be required for many of these sites is incomplete. The company estimates that its undiscounted potential liability for the completion of the site investigation and cleanup of the known contamination on MGP sites (other than the Astoria site, which is discussed below) could range from $710$686 million to $2,500$2,548 million.
Astoria Site
CECONY is permitted by the NYSDEC to operate a hazardous waste storage facility on property owned by it in the Astoria section of Queens, NY.New York. Portions of the property were formerly the location of a manufactured gas plant and also have been used or are being used for, among other things, electric generation operations, electric substation operations, the storage of fuel oil, the manufacture and storage of liquefied natural gas and the maintenance and storage of electric equipment. As a condition of its NYSDEC permit, the company is required to investigate the property and, where environmental contamination is found and action is necessary, to remediate the contamination. The company’s investigations are ongoing. The company has submitted reports to the NYSDEC and the New York State Department of Health and in the future will be submitting additional reports identifying the known areas of contamination. The company estimates that its undiscounted potential liability for the completion of the site investigation and cleanup of the known contamination on the property could range from $191$301 million to $639$884 million.
Gowanus Canal
In August 2009, CECONY received a notice of potential liability and request for information from the EPA about the operations of the company and its predecessors at sites adjacent to or near the 1.8 mile Gowanus Canal in Brooklyn, NY.New York. In March 2010, the EPA added the Gowanus Canal to its National Priorities List of Superfund sites. The canal’s adjacent waterfront is primarily commercial and industrial, currently consisting of concrete plants, warehouses and parking lots. The canal is near several residential neighborhoods. In September 2013, the EPA issued its record of decision for the site. The EPA concluded that there was significant contamination at the site, including polycyclic aromatic hydrocarbons, polychlorinated biphenyls (PCBs), pesticides, metals and volatile organic compounds. The EPA selected a remedy for the site that includes dredging and disposal of some contaminated sediments and stabilization and capping of contamination that will not be removed. The EPA estimated the cost of the selected remedy to be $506 million (and has indicated the actual cost could be significantly higher). The EPA has identified 39 potentially responsible parties (PRPs) with respect to the site, including CECONY (which the EPA indicated has facilities that may be a source of PCBs at the site). The EPA ordered the PRPs, including CECONY, to coordinate and cooperate with each other to perform and/or fund the remedial design for the selected remedy, which current estimates indicate could cost approximately $113 million. CECONY is funding its allocated share of the remedial design costs along with the other PRPs. In April 2019, the EPA issued an order that requires the PRPs, including CECONY, to: (1) design and perform bulkhead structural support work, including associated access dredging, along certain portions of the upper reaches of the canal, and (2) complete the design
| | | | | |
36 | CON EDISON ANNUAL REPORT 2023 |
work for bulkhead structural support along certain portions of the middle part of the canal. The PRPs and CECONY are coordinating the implementation of this order. In January 2020, the EPA issued an order that requires six PRPs, including CECONY, to initiate the remedial action work in the upper reaches of the canal following the completion of the bulkhead upgrades. The EPA estimated that this work would cost approximately $125 million, although actual costs may be significantly higher, and require about 30 months to complete.higher. In November 2020, the PRPs began implementation of the work required under this order. Cleanup in other areas of the canal is not addressed by this order. In addition, other Federal agencies and the NYSDEC have previously notified the PRPs of their intent to perform a natural resource damage assessment for the site. CECONY is unable to estimate its exposure to liability for the Gowanus Canal site.
Newtown Creek
In June 2017, CECONY received a notice of potential liability from the EPA with respect to the Newtown Creek site that was listed in 2010 on the EPA’s National Priorities List of Superfund sites. The EPA has identified 2021 potentially responsible parties (PRPs) with respect to the site, including CECONY, and has indicated that it will notify the company as additional PRPs are identified and notified by the EPA. Newtown Creek and its tributaries (collectively, Newtown Creek) form a 3.8 mile border between Brooklyn and Queens, NY.New York. Currently, the predominant land use around Newtown Creek includes industrial, petroleum, recycling, manufacturing and distribution facilities and warehouses. Other uses include trucking, concrete manufacture, transportation infrastructure and a wastewater treatment plant. Newtown Creek is near several residential neighborhoods. Six PRPs, not including CECONY, pursuant to an administrative settlement agreement and order on consent the EPA issued to them in 2011, have
| | | | | |
40
|
CON EDISON ANNUAL REPORT 2022 |
been performing a remedial investigation of the site. The EPA indicated that sampling events have shown the sediments in Newtown Creek to be contaminated with a wide variety of hazardous substances including PCBs, metals, pesticides, polycyclic aromatic hydrocarbons and volatile organic compounds. The EPA also indicated that it has reason to believe that hazardous substances have come to be released from CECONY facilities into Newtown Creek. The current schedule anticipates completion of a feasibility study for the site during 2023 or 20242027 and issuance of the EPA's record of decision selecting a remedy for the site thereafter. CECONY is unable to estimate its exposure to liability for the Newtown Creek site.
Other Superfund Sites
CECONY is a PRP at additional Superfund sites involving other PRPs and participates in PRP groups at those sites. The company generally is not managing the site investigation and remediation at these multiparty sites. Work at these sites is in various stages, and investigation, remediation and monitoring activities at some of these sites can be expected to continue over extended periods of time. The company believes that it is unlikely that monetary sanctions, such as penalties, will be imposed by any governmental authority with respect to these sites.
The following table lists each of the additional Superfund sites for which the company anticipates it may have liability. The table also shows for each such site its location, the year in which the company was designated or alleged to be a PRP or to otherwise have responsibilities for the site (shown in the table under “Start”), the name of the court or agency in which proceedings for the site are pending and CECONY’s estimated percentage of the total liability for each site. The company currently estimates that its potential liability for investigation, remediation, monitoring and environmental damages in aggregate for the sites below, other than the sites where the percentage of total liability has not been determined, is less than $2 million. Superfund liability is joint and several. The company’s estimate of its liability for each site was determined pursuant to consent decrees, settlement agreements or otherwise and in light of the financial condition of other PRPs. The company’s actual liability could differ substantially from amounts estimated.
| | Site | Site | Location | Start | Court or Agency | % of Total
Liability | Site | Location | Start | Court or Agency | % of Total
Liability |
| Cortese Landfill | Cortese Landfill | Narrowsburg, NY | 1987 | EPA | 6.0% | Cortese Landfill | Narrowsburg, NY | 1987 | EPA | 6.0% |
| Curcio Scrap Metal | Curcio Scrap Metal | Saddle Brook, NJ | 1987 | EPA | 100.0% | Curcio Scrap Metal | Saddle Brook, NJ | 1987 | EPA | 100.0% |
| Metal Bank of America | Metal Bank of America | Philadelphia, PA | 1987 | EPA | 1.0% | Metal Bank of America | Philadelphia, PA | 1987 | EPA | 1.0% |
| Global Landfill | Global Landfill | Old Bridge, NJ | 1988 | EPA | 0.4% | Global Landfill | Old Bridge, NJ | 1988 | EPA | 0.4% |
| Borne Chemical | Borne Chemical | Elizabeth, NJ | 1997 | NJDEP | 0.7% | Borne Chemical | Elizabeth, NJ | 1997 | NJDEP | 0.7% |
| Pure Earth | Pure Earth | Vineland, NJ | 2018 | EPA | to be determined | Pure Earth | Vineland, NJ | 2018 | EPA | to be determined |
| Scientific Chemical Processing | | Scientific Chemical Processing | Carlstadt, NJ | 2023 | EPA | to be determined |
Other Environmental Matters
Following media reports, in July 2023, the Environmental Protection Agency, New York State Department of Environmental Conservation, New York State Department of Health and NYSDPS began investigating the potential public health risks associated with lead-jacketed cables in the fixed-line telecommunications industry. The use of
| | | | | |
| CON EDISON ANNUAL REPORT 2023 | 37 |
lead-jacketed electric cables began in the 1880s to protect conducting wires from exposure to the elements. All of the Utilities’ transmission cables that are in service and lead-jacketed are covered with an outer plastic layer and comprise less than 2 percent of CECONY’s transmission system and less than 5 percent of O&R’s transmission system. CECONY installed lead-jacketed cables without an outer plastic layer in its distribution system until the 1980’s. CECONY’s distribution cables that are in service and lead-jacketed may or may not have an outer plastic layer and may be located within a conduit and manhole system, directly buried or strung in the air between poles and comprise less than 14 percent of its distribution system. O&R’s distribution cables are not lead-jacketed. CECONY’s transmission and distribution systems also contain lead-jacketed cables that were retired in place. CECONY continues to replace lead-jacketed distribution cables, as needed, and recover the costs for cable replacements, pursuant to its electric rate plan. The Companies are unable to predict the impact on them, if any, resulting from potential developments to legal or public policy doctrines regarding cable that contains lead.
In July 2021, a CECONY feeder failure led to the discharge of thousands of gallons of dielectric fluid from a street manhole in New Rochelle, NY.New York. Dielectric fluid reached nearby streets, properties and the New Rochelle Harbor. CECONY, the U.S. Coast Guard, the NYSDEC and other agencies responded to the incident. CECONY stopped the feeder leak on the same day that the discharge occurred and has completed the spill recovery and associated cleanup operations. In coordination with federal and state regulators,As a result of the discharge, CECONY has evaluated certain shoreline areas for the potential presence of residual dielectric fluid and the extent to which additional cleaning in such areas may be necessary. In addition, the company has received third-party damage claims. The costs associated with this matter are not expected to have a material adverse effect on the company’sCECONY’s financial condition, results of operations orand liquidity. In connection with the incident, the companyCECONY may incur monetary sanctions of more than $0.3 million for violations of certain provisions regulating the discharge of materials into, and for the protection of, the environment.
In 2016, CECONY and another utility responded to a reported dielectric fluid leak at a NJNew Jersey marina on the Hudson River associated with one or two underwater transmission lines, the NJNew Jersey portion of which is owned and operated by the other utility and the NYNew York portion of which is owned and operated by CECONY. In 2017, after the marina owner had cleared substantial debris from its collapsed pier and rip rap material that it had previously placed over and in the vicinity of the underwater transmission lines in an attempt to shore up its failing pier, a dielectric fluid leak was found and repaired on one of the underwater transmission lines. In August 2018, the EPA declared the leak response complete. CECONY, the other utility and the marina owner are involved in litigation in federal court regarding response and repair costs, related damages, and the future of the lines. In August 2020, CECONY and the other utility entered into a settlement with the United States federal government, under which the utilities settled the federal government’s claims for outstanding response costs, without admitting fault and while preserving the utilities’ rights to pursue recovery from the marina owner. CECONY expects that, consistent with the cost allocation provisions of its prior arrangements with the other utility for the transmission lines, the response and repair costs incurred bycosts. In December 2023, CECONY, the other utility and government agencies, net of any recovery from the marina owner will be
| | | | | |
CON EDISON ANNUAL REPORT 2022 | 41 |
shared by CECONYsettled all of the claims in a litigation regarding response and the other utilityrepair costs and that CECONY's share is not reasonably likely to have a material adverse effect on its financial position, results of operations or liquidityrelated damages.
O&R
Superfund
The sites at which O&R has been asserted to have liability under Superfund include its manufactured gas sites and the Superfund sites discussed below. There may be additional sites as to which assertions will be made that O&R has liability. For a further discussion of claims and possible claims against O&R under Superfund, see Note G to the financial statements in Item 8.
Manufactured Gas Sites
O&R and its predecessors formerly owned and operated manufactured gas plants at seven sites (O&R MGP Sites) in Orange County and Rockland County, NY.New York. Three of these sites are now owned by parties other than O&R, and have been redeveloped by them for residential, commercial or industrial uses. The NYSDEC is requiring O&R to develop and implement remediation programs for the O&R MGP Sites including any neighboring areas to which contamination may have migrated.
O&R has completed remedial investigations and has received the NYSDEC’s decision regarding the remedial work to be performed at all seven of its MGP sites. Of the seven sites, O&R has completed remediation at four sites. Remedial construction was conducted on a portion of one of the remaining sites in 2019 and remedial design is ongoing for the other remaining sites. The company estimates that its undiscounted potential liability for the completion of the site investigation and cleanup of the known contamination on MGP sites could range from $94$92 million to $149$145 million.
Superfund Sites
O&R is a PRP at Superfund sites involving other PRPs and participates in PRP groups at those sites. The company is not managing the site investigation and remediation at these multiparty Superfund sites. Work at these sites is in various stages, and investigation, remediation and monitoring activities at some of these sites is expected to continue over extended periods of time. The company believes that it is unlikely that monetary sanctions, such as penalties, will be imposed by any governmental authority with respect to these sites.
| | | | | |
38 | CON EDISON ANNUAL REPORT 2023 |
The following table lists each of the Superfund sites for which the company anticipates it may have liability. The table also shows for each such site its location, the year in which the company was designated or alleged to be a PRP or to otherwise have responsibilities for the site (shown in the table under “Start”), the name of the court or agency in which proceedings for the site are pending and O&R’s estimated percentage of the total liability for each site. The company currently estimates that its potential liability for investigation, remediation, monitoring and environmental damages in aggregate for the sites below is less than $1 million. Superfund liability is joint and several. The company’s estimate of its liability for each site was determined pursuant to consent decrees, settlement agreements or otherwise and in light of the financial condition of other PRPs. The company’s actual liability could differ substantially from amounts estimated. | | | | | | | | | | | | | | |
| Site | Location | Start | Court or Agency | % of Total
Liability |
| Metal Bank of America | Philadelphia, PA | 1993 | EPA | 4.6% |
| Borne Chemical | Elizabeth, NJ | 1997 | NJDEP | 2.3% |
| Ellis Road | Jacksonville, FL | 2011 | EPA | 0.2% |
Other Federal, State and Local Environmental Provisions
Toxic Substances Control Act
Virtually all electric utilities, including CECONY and O&R, own equipment that may contain PCBs. PCBs are regulated under the Federal Toxic Substances Control Act of 1976. The Utilities have procedures in place to manage and dispose of oil and equipment containing PCBs properly when they are removed from service.
Water Quality
Under NYSDEC regulations, the operation of CECONY’s generating facilities requires permits for water discharges and water withdrawals. Conditions to the renewal of such permits may include limitations on the operations of the permitted facility or requirements to install certain equipment, the cost of which could be substantial. For information about the company’s generating facilities, see “CECONY – Electric Operations – Electric Facilities” and “Steam Operations – Steam Facilities” above in this Item 1.
| | | | | |
42
|
CON EDISON ANNUAL REPORT 2022 |
Certain governmental authorities are investigating contamination in the Hudson River and the New York Harbor. These waters run through portions of CECONY’s service area. Governmental authorities could require entities that released hazardous substances that contaminated these waters to bear the cost of investigation and remediation, which could be substantial.
Air Quality
Under the Clean Air Act and New York State law, certain of CECONY’s facilities qualify as major facilities that are required to obtain Clean Air Act Title V operating permits. Consistent with the governing regulations, CECONY applies to renew these permits prior to their expiration and seeks to modify them when needed.
Under new source review regulations, an owner of a large generatingmajor facility, including CECONY’s steam and steam-electric generating facilities, is required to obtain a permit before making certain modifications to the facility, other than routine maintenance, repair, or replacement, that cause the increase of emissions of pollutants from the facility above specified thresholds. To obtain a permit, the facility owner could be required to install additional pollution controls or otherwise limit emissions from the facility. The company reviews on an on-going basis its planned modifications to its facilities to determine the potential applicability of new source review and similar regulations.
The EPA's Transport Rule (also referred to as the Cross-State Air Pollution Rule), which was implemented in January 2015, established a new cap-and-trade program requiring further reductions in air emissions than the Clean Air Intrastate Rule (CAIR) that it replaced. Under the Transport Rule, utilities are to be allocated emissions allowances and may sell the allowances or buy additional allowances. CECONY requested and received NYSPSC approval to change the provisions under which the company recovers its purchased power costs to provide for costs incurred to purchase emissions allowances and revenues received from the sale of allowances. In 2021, the EPA finalized changes to the Transport Rule in response to a court decision. In 2023, the EPA finalized an updated version of the Transport Rule (known as the Good Neighbor Rule) that includes a more recent federal ozone standard than the Transport Rule initially implemented. Since its promulgation, the Good Neighbor Rule has been the subject of litigation in the federal Circuit Courts of Appeals which have stayed its effectiveness in several states (but not New York State). Elements of this litigation are before the U.S. Supreme Court and the Circuit Courts of Appeals. The revised Transport Rule reduced the number of allowances allocated to CECONY and required the company to purchase allowances to offset the decreased allocation. CECONY has complied with the Transport Rule in 20222023 and expects to comply with the rule in 2023.2024.
The NYSDEC issued regulations in 2019 that limit nitrous oxides (NOx) emissions during the ozone season from May through September and affect older peaking units that are generally located downstate and needed during
| | | | | |
| CON EDISON ANNUAL REPORT 2023 | 39 |
periods of high electric demand or for local reliability purposes. See “CECONY – Electric Operations – Electric Supply,” above.
Environmental Matters
For information concerning climate change, environmental sustainability, potential liabilities arising from laws and regulations protecting the environment and other environmental matters, see “Environmental Matters” in Item 1, "Air Quality," above and Note G to the financial statements in Item 8.
State Anti-Takeover Law
New York State law provides that a “domestic corporation,” such as Con Edison, may not consummate a merger, consolidation or similar transaction with the beneficial owner of a 20 percent or greater voting stock interest in the corporation, or with an affiliate of the owner, for five years after the acquisition of the voting stock interest, unless the transaction or the acquisition of the voting stock interest was approved by the corporation’s board of directors prior to the acquisition of the voting stock interest. After the expiration of the five-year period, the transaction may be consummated only pursuant to a stringent “fair price” formula or with the approval of a majority of the disinterested stockholders.
Human Capital
Con Edison is committed to attracting, developing, and retaining a talented, diverse workforce. It values and supports a wide range of employee needs and interests. The company’s skilled and experienced workforce enables the company to maintain best-in-class reliability and progress towards achieving a clean energy future. Human capital measures focus on employee safety, hiring the right talent, employee development and retention and diversity and inclusion.
On December 31, 2022,2023, Con Edison and its subsidiariessubsidiaries had 14,31914,592 employees, based entirely in the United States including 12,71713,416 at CECONY; 1,1311,167 at O&R 462 at the Clean Energy Businesses and 9 at Con Edison Transmission. Of the total CECONY and O&R employees, 7,3997,661 and 587603 employees, respectively,respectively, were represented by a collective bargaining unit. The collective bargaining agreement covering most of the CECONY employees expires in June 2024. Agreements covering other CECONY employees and O&R employees expire in June 2025 and May 2023,2026, respectively.
Con Edison measures the voluntary attrition rate of its employees in assessing the company’s overall human capital. The company's turnover rate in 20222023 was approximately 8.26.7 percent, 3531 percent of which is attributed to retirements. The average length of service is 14.213.4 years. Con Edison strives to have a diverse and inclusive workforce. A comprehensive diversity and inclusion strategy underlies the corporate culture; informing how its
| | | | | |
CON EDISON ANNUAL REPORT 2022 | 43 |
employees engage with one another, and setting the foundation for a respectful and inclusive environment. On December 31, 2022,2023, women represented 22.623.2 percent of the total workforce and people of color represented 51.753.6 percent of the workforce, with ethnicity breaking down as follows: 48.346.4 percent White, 22.023.3 percent Black, 19.019.3 percent Hispanic, 9.39.8 percent Asian and 1.41.2 percent other.
In managing the business, the company emphasizes a strong safety culture. Continuous focus on safety while performing work is paramount, and leaders and managers are committed to implementing programs and practices that promote the right knowledge, skills, and attitudes to undertake the responsibilities of safety, including required training for both field and office employees. To that end, the company has a dedicated facility, the Learning Center, that offers classes to employees covering technical courses, skills enhancement, safety and leadership development. During 2022,2023, employees spent over 600,000680,000 hours inin instructor-led, leadership and skill-based training. Further, the company maintains a career development and successionsuccession planning program that is committed to helping employees grow their careers, talents, skills and abilities. In addition to their daily job functions, employees of the Utilities are assigned to and trained for a position for emergency response that is mobilized in the event of a weather event or emergency.
Although working remotely for certain positions has been made possible by digital software and smart device capabilities that enable employees to collaborate with each other and remain productive, the entire CECONY and O&R workforce is available in the event of an emergency that requires on-site presence. Con Edison and its subsidiaries managed their operations and resources while avoiding lay-offs and furloughs and continue to recruit, interview, and hire internal and external applicants to fill open positions.
Available Information
For the sources of information about the Companies, see “Available Information” in the “Introduction” appearing before this Item 1.
Item 1A: Risk Factors
| | | | | |
40 | CON EDISON ANNUAL REPORT 2023 |
Information in any item of this report as to which reference is made in this Item 1A is incorporated by reference herein. The use of such terms as “see” or “refer to” shall be deemed to incorporate at the place such term is used the information to which such reference is made.
The Companies’ businesses are influenced by many factors that are difficult to predict, and that involve uncertainties that may materially affect actual operating results, cash flows and financial condition.
The Companies have established an enterprise risk management program to identify, assess, manage and monitor its major business risks based on established criteria for the severity of an event, the likelihood of its occurrence, and the programs in place to control the event or reduce its impact. The Companies’ major risks include:
Regulatory/Compliance Risks:
The Companies Are Extensively Regulated And Are Subject To Substantial Penalties. The Companies’ operations require numerous permits, approvals and certificates from various federal, state and local governmental agencies. State utility regulators may seek to impose substantial penalties on the Utilities for violations of state utility laws, regulations or orders.orders or limit the Utilities from recovering costs incurred above amounts set forth in their rate plans. See “Other Regulatory Matters” in Note B to the financial statements in Item 8. The Utilities are also subject to recurring, independent, third-party audits with respect to these regulations and standards. In addition, the Utilities' rate plans usually include negative revenue adjustments for failing to meet certain operating and customer satisfaction standards. FERC has the authority to impose penalties on the Utilities the Clean Energy Businesses and the projects that Con Edison Transmission invests in, which could be substantial, for violations of the Federal Power Act, the Natural Gas Act or related rules, including reliability and cyber securitycybersecurity rules. Environmental agencies may seek penalties for failure to comply with laws, regulations or permits. The Companies may also be subject to penalties from other regulatory agencies. The Companies may be subject to new laws, regulations or other requirements or the revision or reinterpretation of such requirements, which could adversely affect them. See “Utility Regulation", "Competition" and “Environmental Matters – Climate Change" and "Environmental Matters - Other Federal, State and Local Environmental Provisions” in Item 1, “Critical Accounting Estimates” in Item 7 and “COVID-19 Regulatory Matters” and “Other Regulatory Matters” in Note B to the financial statements in Item 8.
The Utilities’ Rate Plans May Not Provide A Reasonable Return. The Utilities have rate plans approved by state utility regulators that limit the rates they can charge their customers. The rates are generally designed for, but do not guarantee, the recovery of the Utilities’ cost of providing service (including a return on equity). See “Utility Regulation – State Utility Regulation – Rate Plans” in Item 1 and “Rate Plans” in Note B to the financial statements in Item 8. Rates usually may not be changed during the specified terms of the rate plans other than to recover energy costs and limited other exceptions. The Utilities’ actual costs may exceed levels provided for such costs in
| | | | | |
44
|
CON EDISON ANNUAL REPORT 2022 |
the rate plans (see “COVID-19 Regulatory Matters” in Note B to the financial statements in Item 8).plans. State utility regulators can initiate proceedings to prohibit the Utilities from recovering from their customers the cost of service (including energy costs and storm restoration costs) that the regulators determine to have been imprudently incurred (see "Other Regulatory Matters" in Note B to the financial statements in Item 8).incurred. The Utilities have from time to time entered into settlement agreements to resolve various prudence proceedings.
The Companies May Be Adversely Affected By Changes To The Utilities’ Rate Plans. The Utilities’ rate plans typically require action by regulators at their expiration dates, which may include approval of new plans with different provisions. The need to recover from customers increasing commodity or other costs, taxes or state-mandated assessments or surcharges could adversely affect the Utilities’ opportunity to obtain new rate plans that provide a reasonable rate of return and continue important provisions of current rate plans. The Utilities’ current NYNew York electric and gas rate plans include revenue decoupling mechanisms, CECONY’s current steam rate plan includes a weather normalization adjustment and their NYthe Utilities' New York electric, gas and steam rate plans include provisions for the recovery of energy costs and reconciliation of the actual amount of pension and other postretirement, environmental and certain other costs to amounts reflected in rates. Accounting credits for pension and other postretirement benefit plans could lead to a reduction in cash received from the Utilities’ revenue requirement. See “Rate Plans” in Note B to the financial statements in Item 8.
| | | | | |
| CON EDISON ANNUAL REPORT 2023 | 41 |
Operations Risks:
The Failure Of, Or Damage To, The Companies’ Facilities Could Adversely Affect The Companies. The Utilities provide electricity, gas and steam service using energy facilities, many of which are located either in, or close to, densely populated public places. See the description of the Utilities’ facilities in Item 1. A failure of, or damage to, these facilities, or an error in the operation or maintenance of these facilities, could result in bodily injury or death, property damage, the release of hazardous substances or extended service interruptions. Impacts of climate change, such as sea level rise, coastal storm surge, inland flooding from intense rainfall, hurricane-strength winds and extreme heat or cold could impact or damage facilities or result in large-scale outages and the Utilities may experience more severe consequences from attempting to operate during and after such events. The Utilities’ response to such events may be perceived to be below customer expectations. The Utilities' successful implementation of their maintenance programs reduces, but does not fully protect against, damage to their facilities for which they will be held responsible and which may hinder their restoration efforts. The Utilities could be required to pay substantial amounts that may not be covered by the Utilities’ insurance policies to repair or replace their facilities, compensate others for injury or death or other damage and settle any proceedings initiated by state utility regulators or other regulatory agencies. The occurrence of such events could also adversely affect the cost and availability of insurance. See “Other Regulatory Matters” in Note B and “Manhattan Explosion and Fire” in Note H to the financial statements in Item 8. Changes to laws, regulations or judicial doctrines could further expand the Utilities’ liability for service interruptions. See “Utility Regulation – State Utility Regulation” and "Environmental Matters – Climate Change" in Item 1.
A Cyber Attack Could Adversely Affect The Companies. The Companies and other operators of critical energy infrastructure and energy market participants face a heightened risk of cyber attack and the Companies’ businesses require the continued operation of information systems and network infrastructure.infrastructure. See Item 1 for a description of the businesses of the Utilities the Clean Energy Businesses and Con Edison Transmission. Cyber attacks may include hacking, viruses, malware, denial of service attacks, ransomware, exploited vulnerabilities or other security breaches,breaches, including loss of data and communications. Cyber threats in general, and in particular to critical infrastructure, are increasing in sophistication, magnitude and frequency.frequency and the techniques used in cyberattacks change rapidly, including from emerging technologies, such as artificial intelligence. Interconnectivity with customers, independent system operators, energy traders and other energy market participants, suppliers, contractors and others also exposes the Companies’ information systems and network infrastructure to an increased risk of cyber incidents, including attacks. Such interconnectivity increases the risk that a cyber incident or attack on the Companies could affect others and that a cyber incident or attack on others could affect the Companies. In the event of a cyber incident or attack that the Companies were unable to defend against or mitigate, the Companies could have their operations and the operations of their customers and others disrupted. The Companies could also have their financial and other information systems and network infrastructure impaired, property damaged, and customer and employee information stolen; experience substantial loss of revenues, response costs and other financial loss; and be subject to increased regulation, litigation, penalties and damage to their reputation. In October 2023, threat actors exploited a vulnerability in Citrix NetScaler that was remediated and reported to the relevant regulatory authorities by the Companies. Also during 2023, the Companies experienced increases in malicious attempts to disrupt traffic to their websites and in attacks against third-party vendors employed by the Companies. The Companies have experienced cyber incidents and attacks althoughin the past and expect to experience them in the future. Although none of thethese incidents or attackshas had a material impact.impact on the Companies, the scope and impact of any future incident cannot be predicted. In the event of a cybersecurity incident or attack that the Companies were unable to defend against or mitigate, the Companies’ business strategy, results of operations or financial condition are reasonably likely to be materially affected.
The Failure Ofof Processes and Systems, And The Performance Andthe Failure to Retain and Attract Employees Andand Contractors, and Their Negative Performance Could Adversely Affect The Companies. The Companies have developed business processes and use information and communication systems and enterprise platforms for operations, customer service, legal compliance, personnel, accounting, planning and other matters. The Utilities are replacingIn October 2023, CECONY and O&R replaced their separate existing customer billing and information systems.systems with a single new customer billing and information system to further automate the processes by which the Utilities bill their customers and enhance payment, credit and collections activities. Failures in successfully implementing the new customer billing and information system could adversely affect the Utilities’ billing and revenue collection processes and cash flow and could result in higher costs. The Companies have completed a multi-year, phased transition ofMany services, including certain information technology services including application maintenance and supportcertain work on the Utilities’ electric and infrastructuregas systems and operations services,CECONY’s steam system, are provided to a contractor.the Companies by third-party contractors. The failure of the Companies’ or its contractors' business processes or information and
| | | | | |
CON EDISON ANNUAL REPORT 2022 | 45 |
communication systems or the failure by the Companies’ employees or contractors to follow procedures, their unsafe actions, errors or intentional misconduct, cyber incidents or attacks, or work stoppages could adversely affect the Companies’ operations and liquidity and could result in substantial liability, higher costs, and increased regulatory requirements.requirements and substantial penalties. The violation of laws or regulations by employees or contractors for personal gain may result from contract and procurement fraud, extortion, bribe acceptance, fraudulent related-party transactions and serious breaches of corporate policy or standards of business conduct. Competition for
| | | | | |
42 | CON EDISON ANNUAL REPORT 2023 |
employee and contractor talent may result in operating challenges and increased costs to attract and retain talent. If the Companies are unable to successfully attract and retain an appropriately qualified workforce, their results of operations, financial position and cash flows could be negatively affected. See “Human Capital” in Item 1.
Environmental Risks:
The Companies Are Exposed To Risks From The Environmental Consequences Of Their Operations. The Companies are exposed to risks relating to climate change and related matters. In 2019,2023, CECONY and O&R each completed a climate change vulnerability study and during 2020, CECONY furtherthat evaluated itstheir respective future climate change adaptation strategies and each developed a climate change implementation plan. NY State enacted theresilience plan to address projected physical climate risks and outline resilience investments. CECONY may be impacted by environmental regulations regarding emissions reductions such as New York’s Climate Leadership and Community Protection Act and New York City enacted theCity’s Climate Mobilization Act. See “Environmental Matters – Clean Energy Future” in Item 1. CECONY may also be impacted by regulations requiring reductions in air emissions. See “Environmental Matters – Other Federal, State and Local Environmental Provisions – Air Quality” in Item 1.Act. In addition, the Utilities are responsible for hazardous substances, such as oil, asbestos, PCBs and coal tar, that have been used or produced in the course of the Utilities’ operations and are present on properties or in facilities and equipment currently or previously owned by them. See “Environmental Matters” in Item 1 and Note G to the financial statements in Item 8. The Companies could be adversely affected if a causal relationship between electric and magnetic fields and adverse health effects were to be established. The Companies may also be adversely affected by developments to legal or public policy doctrines regarding cable that contains lead. See “Environmental Matters” in Item 1 and Note G to the financial statements in Item 8.
Financial and Market Risks:
Con Edison’s Ability To Pay Dividends Or Interest Depends On Dividends From Its Subsidiaries. Con Edison’s ability to pay dividends on its common shares or interest on its external borrowings depends primarily on the dividends and other distributions it receives from its subsidiaries. The dividends that the Utilities may pay to Con Edison are limited by the NYSPSC to not more than 100 percent of their respective income available for dividends calculated on a two-year rolling average basis, with certain exceptions. See “Dividends” in Note C and Note U to the financial statements in Item 8.
Changes To Tax Laws Could Adversely Affect the Companies. Changes to tax laws, regulations or interpretations thereof could have a material adverse impact on the Companies. Depending on the extent of these changes, the changes could also adversely impact the Companies’ credit ratings and liquidity. See “Capital Requirements and Resources – Capital Resources” in Item 1, “Liquidity and Capital Resources – Cash Flows from Operating Activities” in Item 7, "Rate Plans" and "Other Regulatory Matters" in Note B and Note L to the financial statements in Item 8.
The Companies Require Access To Capital Markets To Satisfy Funding Requirements. The Utilities estimate that their construction expenditures will exceed $14,600$27,700 million over the next threefive years. The Utilities use internally-generated funds, equity contributions from Con Edison, if any, and external borrowings to fund the construction expenditures. Con Edison expects to finance its capital requirements primarily through internally generated funds, proceeds from the anticipated sale of the Clean Energy Businesses, the sale of its common shares or external borrowings. Changes in financial market conditions or in the Companies’ credit ratings could adversely affect their ability to raise new capital and the cost thereof. See “Capital Requirements and Resources” in Item 1.
A Disruption In The Wholesale Energy Markets, Increased Commodity Costs Or Failure By An Energy Supplier or Customer Could Adversely Affect The Companies. Almost all the electricity and gas the Utilities sell to their full-service customers is purchased through the wholesale energy markets or pursuant to contracts with energy suppliers. See the description of the Utilities’ energy supply in Item 1. A disruption in the wholesale energy markets or a failure on the part of the Utilities’ energy suppliers or operators of energy delivery systems that connect to the Utilities’ energy facilities could adversely affect their ability to meet their customers’ energy needs and adversely affect the Companies. The Utilities' ability to gain access to additional energy supplies, if needed, depends on effective markets and siting approvals for developer projects, which the Utilities do not control. See “CECONY - Gas Peak Demand”An extreme cold weather event in Item 1. IncreasesDecember 2022 (Winter Storm Elliott) negatively impacted energy infrastructure in the northeastern United States, including the interstate natural gas system. During Winter Storm Elliott, CECONY faced low pressures on the interstate natural gas pipelines that it relies upon to deliver gas to its customers. Although CECONY maintained system pressure, the low pressure could have resulted in unprecedented large-scale gas outages within CECONY’s territory. CECONY estimates that, in the worst case, restoring gas service could have taken months in the event of a complete loss of the system. In the event of a large-scale outage, the Utilities could be required to pay substantial amounts to restore service, compensate others for injury or death or other damages and settle any proceedings initiated by regulatory agencies. In November 2023, FERC, NERC and other regional entities issued recommendations to prevent a recurrence of the effects of Winter Storm Elliott, including establishing and monitoring cold weather reliability standards for interstate natural gas pipelines. Although the Utilities’ rate plans provide for recovery of purchased power costs, increases in electric and gas commodity prices may contribute to a slower recovery of cash from outstanding customer accounts receivable balances and increases to the allowance for uncollectible accounts, and may result in increases to write-offs of customer accounts receivable balances. See “Financial and Commodity Market Risks – Commodity Price Risk” in Item 7. The Clean Energy Businesses sell the output of their renewable electric projects under long-term power purchase agreements with utilities and municipalities, and a failure of the production projects could adversely affect Con Edison.
| | | | | |
46
|
20222023 | 43 |
The Companies May Have Substantial Unfunded Pension And Other Postretirement Benefit Liabilities. The Utilities may have substantial unfunded pension and other postretirement benefit liabilities. Significant declines in the market values of the investments held to fund pension and other postretirement benefits could trigger substantial funding requirements under governmental regulations. See “Critical Accounting Estimates – Accounting for Pensions and Other Postretirement Benefits” and “Financial and Commodity Market Risks” in Item 7 and Notes E and F to the financial statements in Item 8.
Other Risks:
The Companies Face Risks Related To Health Epidemics And Other Outbreaks, Including The COVID-19 Pandemic.Outbreaks. Pandemic illness could potentially disrupt the Utilities' employees and contractors from providing essential utility services and adversely impact the Companies' liquidity, financial condition and results of operations. The COVID-19 pandemic has impacted, and continues to impact, countries, communities, supply chains and markets. As a result of the COVID-19 pandemic, there has been an economic slowdown in the Companies’ service territories and changes in governmental and regulatory policy. The decline in business activity in the Companies’ service territories has resulted in a slower recovery of cash from outstanding customer accounts receivable balances, material increases in customer accounts receivable balances, increases to the allowance for uncollectible accounts, and may result in increases to write-offs of customer accounts. Although the Utilities’ NY electric and gas businesses have largely effective revenue decoupling mechanisms in place, higher unpaid accounts have impacted and could continue to impact the Companies’ liquidity. See “Coronavirus Disease 2019 (COVID-19) Impacts” in Item 7 and “COVID-19 Regulatory Matters” in Note B.
The Companies’ Strategies May Not Be Effective To Address Changes In The External Business Environment. The failure to identify, plan and execute strategies to address changes in the external business environment could have a material adverse impact on the Companies. Con Edison seeks to provide shareholder value through continued dividend growth, supported by earnings growth in regulated utilities and contracted electric and gas assets. Changes to the competitive landscape, public policy, laws or regulations (or interpretations thereof), customer behavior or technology could significantly impact the value of the Utilities’ energy delivery facilities and Con Edison Transmission's investment in electric and gas transmission projects. Such changes could also affect the Companies’ opportunities to make additional investments in such assets and the potential return on the investments. The Utilities' gas delivery customers and CECONY's steam delivery customers have alternatives, such as electricity and oil. Distributed energy resources, and demand reduction and energy efficiency investments, provide ways for the energy consumers within the Utilities’ service areas to manage their energy usage. The Companies expect distributed energy resources and electric alternatives to gas and steam to increase, and for gas and steam usage to decrease, as the CLCPA and the Climate Mobilization Act continue to be implemented. CECONY established a gas moratorium in March 2019 on new gas service in most of Westchester County. CECONY filed a gas planning analysis with the NYSPSC in July 2020 stating the moratorium could be lifted when increased pipeline capacity is achieved or peak demand is reduced to a level that would enable the company to lift the moratorium and that it is monitoring gas supply constraint in the New York City portion of its service territory. See "Clean Energy Businesses," "Con Edison Transmission," "Environmental Matters - Clean Energy Future" and "Environmental Matters - Climate Change," “Competition” and "CECONY - Gas Peak Demand" in Item 1.
The Companies Face Risks Related To Supply Chain Disruptions And Inflation. The Companies have been impacted, and expect to continue to be impacted by, global and U.S. supply chain disruptions and shortages of materials, equipment, labor and other resources that are critical to the Companies’ business operations, primarily the Utilities’ electric and central operations. Such disruptions and shortages have resulted in increased prices and lead times for critical orders of materials and equipment needed by the Companies in their operations, such as certain raw materials, microprocessors, semiconductors, microchips, vehicles and transformers. Long lead times for replacement parts could restrict the availability and delay the construction, maintenance or repair of items that are needed to support the Utilities' normal operations and may result in prolonged customer outages, which could in turn lead to unrecovered costs for such service interruptions. Demand for electric equipment is increasing due to utilities’ efforts to meet clean energy goals and in order to prepare for more frequent extreme weather events at a time when manufacturing capacity and supply are decreasing. Geopolitical conflicts have also caused supply chain distributions and shortages. Prices of materials, equipment, transportation and other resources have increased as a result of these supply chain disruptions and shortages and may continue to increase as a result of inflation. Increases in inflation may raise the Companies’ costs for operating and capital costs and employee and retiree benefit Companies’ costs in excess of the costs reflected in the Utilities’ rate plans and could also increase the amount of capital that needs to be raised by the Companies and the costs of such capital.
The Companies Also Face Other Risks That Are Beyond Their Control. The Companies’ results of operations can be affected by circumstances or events that are beyond their control. Weather and energy efficiency efforts directly influence the demand for electricity, gas and steam service, and can affect the price of energy commodities.
| | | | | |
CON EDISON ANNUAL REPORT 2022 | 47 |
Terrorist or other physical attacks or acts of war could damage the Companies' facilities. Economic conditions can affect customers’ demand and ability to pay for service, which could adversely affect the Companies.
Item 1B: Unresolved Staff Comments
Con Edison
Con Edison has no unresolved comments from the SEC staff.
CECONY
CECONY has no unresolved comments from the SEC staff.
Item 1C: Cybersecurity
Cybersecurity Risk Management
The Companies have identified cybersecurity as a key enterprise risk. As operators of critical energy infrastructure, the Companies require the continuous operation of information systems and network infrastructure. Cybersecurity threats are assessed, identified and managed as part of the Companies’ corporate-wide Enterprise Risk Management (ERM) program. The ERM program establishes processes to identify emerging issues; monitor, assess and mitigate known risks; align risk exposure to organizational priorities; and inform business decisions and resource allocation. In accordance with the Companies’ ERM program, management has established a multidisciplinary cybersecurity team including personnel from the technology, operations, legal, compliance, and risk management departments that identifies, assesses and remediates cybersecurity risks.
| | | | | |
44 | CON EDISON ANNUAL REPORT 2023 |
The Companies employ several processes to manage their cybersecurity risks, including, but not limited to, the following:
•Incident Detection and Prevention: The Companies deploy safeguards designed to protect their operational and information systems, the personal information of their customers and employees and other critical information from cybersecurity threats. These safeguards include, among other things, intrusion prevention and detection systems, anti-malware functionality and ongoing vulnerability assessments.
•Review and Assessment: The Companies assess the severity, likelihood and controllability of cybersecurity threats and consider risk outlook, recent external and internal cybersecurity events and audit findings to assess their overall cybersecurity risk management process. The Companies then use the findings from these assessments to inform cybersecurity risk mitigation activities, including long-term strategic and short-term tactical efforts, and capital allocation decisions.
•Independent Advisors: The Companies engage consultants to assess, identify and manage material risks from cybersecurity threats on a regular basis. The consultants are engaged to, among other things, assess the process by which cybersecurity threats are identified; provide incident response and forensic services; review and analyze cybersecurity controls and infrastructure; and provide threat emulation services.
•Third-Party Risk Assessments: The Companies’ vendors and suppliers participate in a third-party risk assessment to periodically validate such party’s profile across multiple risk domains. A cybersecurity risk assessment is performed by the Companies’ Information Technology department to assess the controls of high-risk third parties that, among other things, possess the Companies’ sensitive information and the personal information of their customers and employees.
•Disclosure Controls and Procedures: Management has developed protocols and procedures to share information regarding cybersecurity incidents with the Chief Information Security Officer, Chief Privacy Officer, the Companies’ Disclosure Committee and the Law Department to enable assessments related to disclosure and reporting obligations in compliance with federal and state cybersecurity and data privacy regulations.
•Incident Response: The Companies have established and maintain incident response plans that set forth procedures for their response to cybersecurity incidents and data breaches and test and evaluate such plans on an ongoing basis.
•Training and Compliance: The Companies train employees regularly on potential cybersecurity threats; perform drills; monitor network and computing systems; collaborate with government and industry partners on threat mitigation; and also collaborate with local, state and federal agencies and utility industry colleagues to identify and employ tools that seek to protect the Companies’ operational and information systems and the personal information of their customers and employees from cybersecurity threats.
The Companies have experienced cybersecurity incidents and attacks in the past and expect to experience them in the future. None of the incidents or attacks that the Companies experienced have had a material impact on the Companies’ business strategy, results of operations or financial condition. Although the Companies have established processes to assess, identify and manage cybersecurity risks, such processes do not provide absolute assurance against a cybersecurity attack that could materially impact the Companies. In the event of a cybersecurity incident or attack that the Companies were unable to defend against or mitigate, the Companies’ business strategy, results of operations or financial condition are reasonably likely to be materially affected. Such an incident could disrupt the Companies’ or their customers’ operations, cause damage to the Companies’ properties, financial and other information systems and network infrastructure and could result in the theft of the Companies’, their employees’ or customers’ information. See “A Cyber Attack Could Adversely Affect the Companies” in Item 1A.
Role of Management in Cybersecurity Risk Management
The Companies have established a cybersecurity team that manages the Companies’ cybersecurity risk. The cybersecurity team is led by the Chief Information Security Officer, a utility industry professional with over 20 years of experience in information technology, reliability and cybersecurity. The Chief Information Security Officer also leads collaborative efforts between the government and utility sector partners. The cybersecurity team reports to a multidisciplinary team of executives and senior officers including personnel from the technology and operations departments who are responsible for the review and approval of changes in cybersecurity risk assessment and have oversight of risk mitigation and monitoring strategies. The executive and senior officer teams are led by the Vice President, IT Engineering and Operations, an executive with over 25 years of experience in the utility field across various roles in the Information Technology department and who is accountable for the Companies’ information technology assets and the Senior Vice President, Corporate Shared Services, a senior executive with over 30 years of experience in the utility field and who is responsible for shared services functions including the information technology department.
The cybersecurity team’s processes to protect the personal information of the Companies’ customers and employees are supported by a privacy compliance team. The privacy compliance team is led by the Chief Privacy Officer, a professional with over 18 years of experience in data privacy risk and compliance and who is a Certified Information Privacy Professional and a Certified Information Privacy Manager and is designated as a Fellow in
| | | | | |
| CON EDISON ANNUAL REPORT 2023 | 45 |
Privacy. The Chief Privacy Officer reports to the Vice President and Chief Ethics and Compliance Officer, an attorney and executive who has over 25 years of experience in the legal, ethics, and compliance fields and is responsible for the company’s ethics and compliance program and department, including data privacy compliance. The Chief Ethics and Compliance Officer reports to the Senior Vice President and General Counsel, the Companies’ lead attorney and a senior executive with over 20 years of risk management, corporate governance and team leadership experience.
Role of Board of Directors and Board of Trustees in Cybersecurity Risk Management
Con Edison’s Board of Directors and CECONY’s Board of Trustees (collectively, the Board) and their respective Audit Committees provideoversight of cybersecurity risks. There is a process in place for the Board and the Audit Committee to receive information and ongoing updates from the Senior Vice President, Corporate Shared Services, regarding significant and potentially significant cybersecurity incidents and a range of cybersecurity metrics. The Board receives an annual presentation and report on cybersecurity risks from the Chief Information Security Officer that addresses various topics, such as recent developments, vulnerability assessments and third-party and independent reviews. The Audit Committee also meets annually with the Chief Information Security Officer in executive session, without management present. At each regular Board meeting, the Board reviews a cybersecurity dashboard prepared by the Chief Information Security Officer that includes updates on a range of cybersecurity metrics and topics. The Audit Committee oversees the ERM program and reviews more in-depth cybersecurity matters and risks on a semi-annual basis.
Item 2: Properties
Con Edison
Con Edison has no significant properties other than those of the Utilities and the Clean Energy Businesses.Utilities.
For information about the capitalized cost of the Companies’ utility plant, net of accumulated depreciation, see “Plant and Depreciation” in Note A to the financial statements in Item 8 (which information is incorporated herein by reference).
CECONY
For a discussion of CECONY’s electric, gas and steam facilities, see “CECONY – Electric Operations – Electric Facilities,” “CECONY – Gas Operations – Gas Facilities” and “CECONY – Steam Operations – Steam Facilities” in Item 1 (which information is incorporated herein by reference).
O&R
For a discussion of O&R’s electric and gas facilities, see “O&R – Electric Operations – Electric Facilities” and “O&R – Gas Operations – Gas Facilities” in Item 1 (which information is incorporated herein by reference).
Clean Energy Businesses
For a discussion of the Clean Energy Businesses’ facilities, see “Clean Energy Businesses” in Item 1 (which information is incorporated herein by reference).
Con Edison Transmission
Con Edison Transmission has no properties. Con Edison Transmission has ownership interests in electric and gas transmission companies. For information about these companies, see "Con Edison Transmission" in Item 1 (which information is incorporated herein by reference).
Item 3: Legal Proceedings
For information about certain legal proceedings affecting the Companies, see “Other Regulatory Matters” in Note B and “Superfund Sites” and “Asbestos Proceedings” in Note G and "Manhattan Explosion and Fire" in Note H to the financial statements in Item 8 and “Environmental Matters – CECONY” and “Environmental Matters – O&R” in Item 1 of this report, which information is incorporated herein by reference.
Item 4: Mine Safety Disclosures
Not applicable.
| | | | | |
4846
|
20222023 |
Information about our Executive Officers
The following table sets forth certain information about the executive officers of Con Edison as of February 16, 2023.15, 2024. The term of office of each officer, is until the next election of directors (trustees) of their company and until his or her successor is chosen and qualifies. Officers are subject to removal at any time by the board of directors (trustees) of their company.
| | | | | | | | |
| Name | Age | Offices and Positions During Past Five Years |
| Timothy P. Cawley | 5859 | 1/22 to present - Chairman of the Board, President and Chief Executive Officer and Director of Con Edison, Chairman of the Board, Chief Executive Officer and Trustee of CECONY |
| | 12/20 to 12/21 – President and Chief Executive Officer and Director of Con Edison and Chief Executive Officer and Trustee of CECONY |
| | 1/18 to 12/20 – President of CECONY |
| Robert Hoglund | 6162 | 9/05 to present – Senior Vice President and Chief Financial Officer of Con Edison and CECONY |
| Matthew Ketschke | 5152 | 1/21 to present – President of CECONY |
| | 11/17 to 12/20 – Senior Vice President – Customer Energy Solutions |
| Robert Sanchez | 5758 | 12/17 to present – President and Chief Executive Officer of O&R |
| Mark Noyes | 57 | 12/16 to present – President and Chief Executive Officer of Con Edison Clean Energy Businesses, Inc.
| | |
| | |
| Stuart Nachmias | 5759 | 1/20 to present – President and Chief Executive Officer of Con Edison Transmission Inc. |
| | 05/08 to 12/19 – Vice President of Energy Policy and Regulatory Affairs of CECONY |
| Deneen L. Donnley | 5759 | 1/20 to present – Senior Vice President and General Counsel of Con Edison and CECONY |
| | 10/19 to 12/19 – Senior Vice President of Con Edison and CECONY |
| | 9/15 to 10/19 – Executive Vice President, Chief Legal Officer and Corporate Secretary – USAA |
| Jennifer Hensley | 4445 | 9/22 to present – Senior Vice President – Corporate Affairs of CECONY |
| | 7/22 to 9/22 – Senior Vice President of CECONY |
| | 1/21 to 7/22 - Vice President, Head of Government Relations - LYFT |
| | 9/19 to 1/21 - Senior Director, Public Policy - LYFT |
| | 11/17 to 9/19 - President, Link - INTERSECTION Co. |
| Mary E. Kelly | 5455 | 11/17 to present – Senior Vice President – Corporate Shared Services of CECONY |
| | |
| Nancy Shannon | 5556 | 6/22 to present – Senior Vice President – Utility Shared Services of CECONY |
| | 6/18 to 5/22 – Vice President – Human Resources |
| | | 11/16 to 5/18 – Director of the HR Employee Wellness Center
| | |
| | |
| Joseph Miller | 6061 | 1/21 to present – Vice President and Controller of Con Edison and CECONY |
| | 1/21 to present – Chief Financial Officer and Controller of O&R |
| | 8/06 to 12/20 – Assistant Controller of Corporate Accounting of CECONY |
| Yukari Saegusa | 55 | 9/16 to present – Treasurer of Con Edison and CECONY
| | | 8/16 to present – Vice President of Con Edison and CECONY
| | | 8/13 to present – Treasurer of O&R
| Gurudatta Nadkarni | 57 | 1/08 to present – Vice President of Strategic Planning of CECONY
| | |
| | |
| | | | | |
CON EDISON ANNUAL REPORT 20222023 | 4947 |
Part II
Item 5: Market for the Registrant’s Common Equity, Related Stockholder Matters and Issuer Purchases of Equity Securities
Con Edison
Con Edison’s Common Shares ($.10 par value), the only class of common equity of Con Edison,Edison, are traded on the New York Stock Exchange under the trading symbol "ED." As of January 31, 2023,2024, there were 37,42335,988 holders of record of Con Edison’s Common Shares. Con Edison paid quarterly dividends of 77.5 cents per Common Share in 2021 and quarterly dividends of 79 cents per Common Share in 2022.2022 and quarterly dividends of 81 cents per Common Share in 2023. On January 19, 2023,18, 2024, Con Edison declared a quarterly dividend of 8183 cents per Common Share that is payable on MarchMarch 15, 2023.2024. Con Edison expects to pay dividends to its shareholders primarily from dividends and other distributions it receives from its subsidiaries. The payment of future dividends is subject to approval and declaration by Con Edison’s Board of Directors and will depend on a variety of factors including business, financial and regulatory considerations. For additional information about the payment of dividends by the Utilities to Con Edison, and restrictions thereon, see “Dividends” in Note C to the financial statements in Item 8 (which information is incorporated herein by reference).
During 2022,2023, the market price of Con Edison’s Common Shares increaseddecreased by 11.75.72 percent (from $85.32 at year-end 2021 to $95.31 at year-end 2022)2022 to $90.97 at year-end 2023). By comparison, the S&P 500 Index decreased 19.4increased 23.91 percent and the S&P 500 Utilities Index decreased 1.411.06 percent. The total return to Con Edison’s common shareholders during 2022,2023, including both price appreciation and investment of dividends, was 15.7(1.12) percent. By comparison, the total returns for the S&P 500 Index and the S&P 500 Utilities Index were (18.1)26.26 percent and 1.6(7.08) percent, respectively. For the five-year period 20182019 through 20222023 inclusive, Con Edison’s shareholders’ total return was 35.143.08 percent, compared with total returns for the S&P 500 Index and the S&P 500 Utilities Index of 56.9107.04 percent and 58.041.05 percent, respectively.
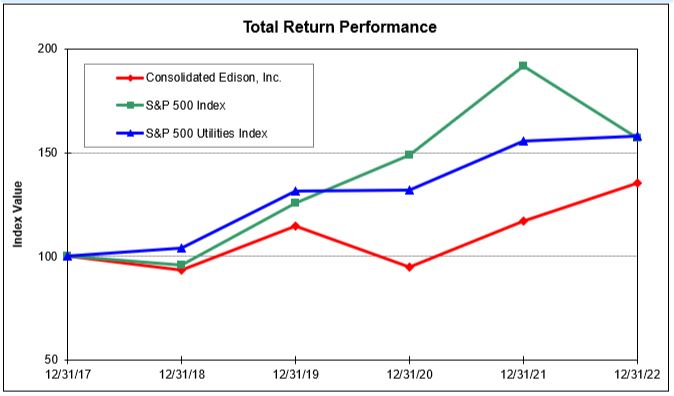

| | Years Ended December 31, |
| Years Ended December 31, | | | Years Ended December 31, |
| Company / Index | Company / Index | 2017 | 2018 | 2019 | 2020 | 2021 | 2022 | Company / Index | 2018 | 2019 | 2020 | 2021 | 2022 | 2023 |
| Consolidated Edison, Inc. | Consolidated Edison, Inc. | 100.00 | 93.38 | 114.43 | 94.98 | 116.79 | 135.08 | Consolidated Edison, Inc. | 100.00 | 122.54 | 101.72 | 125.07 | 144.65 | 143.03 |
| S&P 500 Index | S&P 500 Index | 100.00 | 95.62 | 125.72 | 148.85 | 191.58 | 156.88 | S&P 500 Index | 100.00 | 131.49 | 155.68 | 200.37 | 164.08 | 207.21 |
| S&P Utilities | S&P Utilities | 100.00 | 104.11 | 131.54 | 132.18 | 155.53 | 157.97 | S&P Utilities | 100.00 | 126.35 | 126.96 | 149.39 | 151.73 | 140.99 |
Based on $100 invested at December 31, 2017,2018, reinvestment of all dividends in equivalent shares of stock and market price changes on all such shares.
| | | | | |
5048
|
20222023 |
CECONY
The outstanding shares of CECONY’s Common Stock ($2.50 par value) are the only class of common equity of CECONY. They are held by Con Edison and are not traded.
The dividends declared by CECONY in 20212022 and 20222023 are shown in its Consolidated Statement of Shareholder’s Equity included in Item 8 (which information is incorporated herein by reference). For additional information about the payment of dividends by CECONY, and restrictions thereon, see “Dividends” in Note C to the financial statements in Item 8 (which information is incorporated herein by reference).
Item 6: [Reserved]
| | | | | |
CON EDISON ANNUAL REPORT 20222023 | 5149 |
Item 7: Management’s Discussion and Analysis of Financial Condition and Results of Operations
This combined management’s discussion and analysis of financial condition and results of operations relates to the consolidated financial statements included in this report of two separate registrants: Con Edison and CECONY, and should be read in conjunction with the financial statements and the notes thereto. As used in this report, the term the “Companies” refers to Con Edison and CECONY. CECONY is a subsidiary of Con Edison and, as such, information in this management’s discussion and analysis about CECONY applies to Con Edison.
Information in any item of this report referred to in this discussion and analysis is incorporated by reference herein. The use of terms such as “see” or “refer to” shall be deemed to incorporate by reference into this discussion and analysis the information to which reference is made.
See "Item 7: Management's Discussion and Analysis of Financial Condition and Results of Operations," in Con Edison's and CECONY's combined Annual Report on Form 10-K for the year ended December 31, 2022, filed with the SEC on February 16, 2023, for a discussion of variance drivers for the year ended December 31, 2022, as compared to December 31, 2021.
Corporate Overview
Con Edison’s principal business operations are those of the Utilities the Clean Energy Businesses and Con Edison Transmission. CECONY is a regulated utility that provides electric service in New York City and New York's Westchester County, gas service in Manhattan, the Bronx, parts of Queens and parts of Westchester, and steam service in Manhattan. O&R is a regulated utility serving customers in a 1,300-square-mile-area in southeastern NYNew York State and northern NJ. Con Edison Clean Energy Businesses, through its subsidiaries, develops, owns and operates renewable energy infrastructure projects and provides energy-related products and services to wholesale and retail customers. In October 2022, Con Edison entered into a purchase and sale agreement pursuant to which Con Edison agreed to sell the Clean Energy Businesses to RWE Renewables Americas, LLC, a subsidiary of RWE Aktiengesellschaft. The Clean Energy Businesses were classified as held for sale as of December 31, 2022. See “Assets and Liabilities Held for Sale” in Note A and Note X to the financial statements in Item 8.New Jersey. Con Edison Transmission, through its subsidiaries, invests in electric transmission projects supporting Con Edison's effort to transition to clean, renewable energy and manages, through joint ventures, both electric and gas assets while seeking to develop electric transmission projects that will bring clean, renewable electricity to customers, focusing on NY,New York, New England, the Mid-Atlantic states and the Midwest. On March 1, 2023, Con Edison completed the sale of all of the stock of the Clean Energy Businesses. See Note W and Note X to the financial statements in Item 8.
In addition to the risks and uncertainties described in Item 1A and the Companies’ material contingencies described in Notes B, G and H to the financial statements in Item 8, the Companies’ management considers the following events, trends, and uncertainties to be important to understanding the Companies’ current and future financial condition.
Anticipated Sale of the Clean Energy Businesses
During the first nine months of 2022, Con Edison considered strategic alternatives with respect to the Clean Energy Businesses. On October 1, 2022, following the conclusion of such review and to allow for continued focus on the Utilities and their clean energy transition, Con Edison entered into a purchase and sale agreement pursuant to which Con Edison agreed to sell the Clean Energy Businesses to RWE Renewables Americas, LLC, a subsidiary of RWE Aktiengesellschaft (RWE) for a total of $6,800 million, subject to closing adjustments. The purchase price will be adjusted (i) upward for certain cash and cash equivalents, (ii) downward for certain indebtedness and debt-like items, (iii) downward for certain transaction expenses, (iv) upward or downward to the extent that the net working capital varies from a set target, (v) upward or downward to the extent that capital expenditures incurred prior to the closing of the transaction vary from a set budget, and (vi) downward by the value allocated to certain assets and projects that are not able to be conveyed to RWE upon closing of the transaction. The purchase and sale agreement includes certain customary representations, warranties and covenants. The transaction is subject to customary closing conditions, including, among other things; expiration of the waiting period under the Hart-Scott-Rodino Antitrust Improvements Act of 1976, as amended, which occurred on November 28, 2022; approval from the FERC under Section 203 of the Federal Power Act, which was obtained on January 20, 2023 and approval by the Committee on Foreign Investment in the United States, which was obtained on February 6, 2023. The transaction is expected to close on or about the end of the first quarter of 2023.
Subject to, and following the closing of the sale of the Clean Energy Businesses, Con Edison intends to use the net proceeds from the sale to repay $1,250 million of parent company debt in 2023, invest in the Utilities and repurchase up to $1,000 million of its common shares.
See “Assets and Liabilities Held for Sale” in Note A and Note X to the financial statements in Item 8 and "Liquidity and Financing," below.
| | | | | |
52
|
CON EDISON ANNUAL REPORT 2022 |
Clean Energy Goals
The success of the Companies’ efforts to meet federal, state and city clean energy policy goals and the impact of energy consumers' efforts to meet such goals on CECONY’s electric, gas and steam businesses and O&R’s electric and gas businesses may impact the Companies’ future financial condition. The Utilities expect electric demandusage to increase and gas and steam usage to decrease in their service territories as federal, state and local laws and policies are enacted and implemented that continueaim to promote renewablereduce the carbon intensity of the energy that is consumed. The Utilities’ and their regulators’ efforts to maintain electric energy. In particular,reliability in their service territories as electric usage increases may also impact the Companies’ future financial condition. The long-term future of the Utilities’ gas businesses depends upon the role that natural gas or other gaseous fuels will play in facilitating New York State’s and New York City’s climate goals. In addition, the impact and costs of climate change on the Utilities’ systems and the success of the Utilities’ efforts to increasemaintain system reliability and manage service interruptions resulting from severe weather may impact the Companies’ future financial condition, results of operations and liquidity.
CECONY Steam Rate PlanAged Accounts Receivable Balances
At December 31, 2023, CECONY’s and O&R’s customer accounts receivables balances of $2,683 million and $95 million, respectively, included aged accounts receivables (balances outstanding in excess of 60 days) of $1,225 million and $21 million, respectively. In Novembercomparison, CECONY’s and O&R’s customer accounts receivable balances at February 28, 2020 were $1,322 million and $89 million, respectively, including aged accounts receivables of $408 million and $15 million, respectively. Prior to the start of the COVID-19 pandemic, the Utilities’ practice was to write off customer accounts receivables as uncollectible 90 days after the account is disconnected for non-payment or the account is closed during the collection process. Due to the COVID-19 pandemic, New York State enacted laws prohibiting New York utilities, including CECONY and O&R, from disconnecting residential customers and small business customers. The Utilities largely suspended service disconnections, certain collection notices, final bill collection agency activity, new late payment charges and certain other fees from March 2020 through December 2021. CECONY’s electric and gas rate plans include reconciliation of late payment charges (from January 1, 2023 through December 31, 2025) and write-offs of customer accounts receivable balances (from January 1, 2020
| | | | | |
50 | CON EDISON ANNUAL REPORT 2023 |
through December 31, 2025) to amounts reflected in rates, with recovery/refund from or to customers via surcharge/sur-credit. CECONY's surcharge recoveries for late payment charges and write-offs of accounts receivable balances will, collectively, be subject to separate annual caps for electric and gas that produce no more than a half percent (0.5 percent) total customer bill impact per commodity (estimated for electric to be $57.3 million, $60.3 million, $62.6 million for 2023, 2024 and 2025, respectively, and for gas to be $14.8 million, $15.9 million and $16.8 million for 2023, 2024 and 2025, respectively). Amounts in excess of the surcharge caps will be deferred as a regulatory asset for recovery in CECONY’s next base rate cases. O&R’s 2022 as updated- 2024 rate plans include reconciliation of late payment charges to amounts reflected in February 2023, CECONY filed a requestrates for years 2022 through 2024, with full recovery/refund via surcharge/sur-credit once the NYSPSC for a steam rate increaseannual variance equals or exceeds 5 basis points of$141 million, effective November 2023. The filing reflects a return on common equity and reconciliation of 10.0 percent andwrite-offs of customer accounts receivable balances to amounts reflected in rates from January 1, 2020 through December 31, 2024, with full recovery/refund via surcharge/sur-credit once the annual variance equals or exceeds 5 basis points of return on equity. Although these regulatory mechanisms are in place, a common equity ratiocontinued slower recovery in cash of 50 percent and requests a new mechanism for decoupling revenues from steam consumption. CECONY’s future earnings will depend on the rates authorized in, and the other provisions of, its November 2023 steam rate plan and CECONY’s ability to operate its businesses in a manner consistent with such rate plan. Therefore, the outcome of CECONY’s rate request, which requires approval by the NYSPSC, will impactoutstanding customer accounts receivable balances has impacted the Companies’ future financial condition, results of operationsliquidity and may continue to impact liquidity. See “Utility Regulation – State Utility RegulationSee “Liquidity and Capital Resources” and “Capital Requirements and Resources,” below and "Regulatory Matters – Rate Plans” in Item 1Plans" and “Rate Plans”“COVID-19 Regulatory Matters” in Note B to the financial statements in Item 8.
Con Edison Transmission
Con Edison Transmission, has taken stepsthrough its New York Transco partnership and jointly with the New York Power Authority, is developing the Propel NY Energy transmission project that will deliver offshore wind energy from Long Island to realign its portfolio to focus on electric transmission by completingNew York City, Westchester County and the salerest of its 50 percent interest in Stagecoach in 2021. During 2020 and 2021,New York State's high voltage power grid. Con Edison Transmission recorded impairments on its investment in Mountain Valley Pipeline, LLC and during 2021, Con Edison Transmission recorded impairments on its previously held interest in Stagecoach and its interest in Honeoye Storage Corporation (Honeoye). Any future impairments of Con Edison Transmission’s investments may impact Con Edison’s future financial condition and results of operations. Con Edison Transmission is pursuing opportunities and participatingexpects to continue to participate in competitive solicitations to develop additional electric transmission projects that will deliver renewable energy to high voltage electric grids in NY, through its NY Transco partnership, and in other states.projects. The success of Con Edison Transmission’s efforts in these competitive solicitations and to grow its electric transmission portfolio may impact Con Edison’s future capital requirements.requirements. See "Con Edison Transmission" in Item 1 and “Investments” in Note A, Note K and Note W to the financial statements in Item 8.
Coronavirus Disease 2019 (COVID-19) Impacts
The Coronavirus Disease 2019 (COVID-19) pandemic has impacted, and continues to impact, countries, communities, supply chains and markets. The COVID-19 pandemic resulted in changes in governmental and regulatory policy and contributed to an economic slowdown in the Companies’ service territories. The decline in business activity in the Companies’ service territories resulted in a slower recovery of cash from outstanding customer accounts receivable balances, material increases in customer accounts receivable balances, increases to the allowance for uncollectible accounts, and may result in increases to write-offs and recoveries of customer accounts. The extent to which COVID-19 will continue to impact the Companies, in particular, the Companies’ ability to recover cash for outstanding customer accounts receivable balances and the amount of write-offs of customer accounts, may impact Con Edison’s future financial condition, results of operations and liquidity. See “Coronavirus Disease 2019 (COVID-19) Impacts” in Item 7 and “COVID-19 Regulatory Matters” in Note B.
The Companies continue to monitor the impact of the COVID-19 global pandemic on their employees, customers and other stakeholders. The Companies support employee health and facility hygiene through regular cleaning and disinfecting of their facilities and leveraging technology through hybrid (combination of in-person and remote) meetings. Employees who test positive for COVID-19 are directed to isolate at home and are evaluated for close, prolonged contact with other employees. Following the Centers for Disease Control and Prevention guidelines, sick employees return to work when they can safely do so. The Utilities continue to provide critical electric, gas and steam service to customers during the emergence from the pandemic.
Below is additional information related to the effects of the COVID-19 pandemic and the Companies’ actions. Also, see “COVID-19 Regulatory Matters” in Note B to the financial statements in Item 8.1.
Certain financial data of Con Edison’s businesses are presented below:
| | | | | |
CON EDISON ANNUAL REPORT 2022 | 53 |
| | For the Year Ended December 31, 2022 | At December 31, 2022 |
| For the Year Ended December 31, 2023 | | | For the Year Ended December 31, 2023 | At December 31, 2023 |
(Millions of Dollars,
except percentages) | (Millions of Dollars,
except percentages) | Operating
Revenues | Net Income for
Common Stock | Assets | (Millions of Dollars,
except percentages) | Operating
Revenues | Net Income for
Common Stock | Assets |
| CECONY | CECONY | $13,268 | 85 | % | $1,390 | 84 | % | $57,445 | 83 | % | CECONY | $13,476 | 92 | % | $1,606 | 64 | % | $61,600 | 92 | % |
| O&R | O&R | 1,085 | 7 | % | 88 | 5 | % | 3,511 | 5 | % | O&R | 1,056 | 7 | % | 96 | 4 | % | 3,675 | 6 | % |
| Total Utilities | Total Utilities | 14,353 | 92 | % | 1,478 | 89 | % | 60,956 | 88 | % | Total Utilities | 14,532 | 99 | % | 1,702 | 68 | % | 65,275 | 98 | % |
| Clean Energy Businesses (a) | 1,319 | 8 | % | 382 | 23 | % | 7,224 | 10 | % |
| Con Edison Transmission (b) | 4 | — | % | (1) | — | % | 314 | 1 | % |
| Other (c) | (6) | — | % | (199) | (12) | % | 571 | 1 | % |
| Clean Energy Businesses (a) (c) | | Clean Energy Businesses (a) (c) | 129 | 1 | % | 22 | 1 | % | — | — | % |
| Con Edison Transmission | | Con Edison Transmission | 4 | — | % | 37 | 1 | % | 414 | 1 | % |
| Other (b) | | Other (b) | (2) | — | % | 758 | 30 | % | 642 | 1 | % |
| Total Con Edison | Total Con Edison | $15,670 | 100 | % | $1,660 | 100 | % | $69,065 | 100 | % | Total Con Edison | $14,663 | 100 | % | $2,519 | 100 | % | $66,331 | 100 | % |
(a)Net income for common stock from the Clean Energy Businesses for the year ended December 31, 2022 reflects 2023 include$46s $2 million (after-tax) of the effects of HLBV accounting for tax equity investments in certain renewable electric projects and $135$(9) million of net after-tax mark-to-market effects. The Clean Energy Businesses were classified as held for sale as of December 31, 2022. Depreciation and amortization expenses on their assets of $(46)$31 million (after-tax) were not recorded for the three months ended December 31, 2022. The impact of the anticipated sale of the Clean Energy Businesses on the remeasurement of deferred state taxes and valuation allowance for deferred tax assets (net of federal taxes) was $(2) million for the year ended December 31, 2022.2023. See "Assets and Liabilities Held for Sale" in Note A, Note SW and Note X to the financial statements in Item 8.
(b)Net loss for common stock from Con Edison Transmission for the year ended December 31, 2022 includes $(4) million (net of federal taxes) relating to the remeasurement of deferred state taxes related to prior year dispositions. See "Critical Accounting Estimates - Investments" in Item 7, "Investments - 2020 and 2021 Partial Impairments of Investment in Mountain Valley Pipeline, LLC (MVP)" in Note A to the financial statements in Item 8.
(c)Other includes the parent company, Con Edison’s tax equity investments, the deferred project held for sale and consolidation adjustments. Net income for common stock for the year ended December 31, 20222023 includes $(4) million (after-tax) of income tax impact on the effects of HLBV accounting for tax equity investments in certain renewable projects and $(10) millionan immaterial amount of income tax impact on the net after-tax mark-to-market effects. Net income for common stock for the year ended December 31, 20222023 also includes $(9)$(11) million (netnet of federal taxes) relating totax on the remeasurementeffects of deferred state taxes related to prior year dispositionsHLBV accounting for Con Edison Transmission.tax equity investments in certain renewable electric projects. Net income for common stock for the year ended December 31, 20222023 also includes $(35)$(14) million net of tax of transaction costs and other accruals related to the anticipated sale of the Clean Energy Businesses (netBusinesses. Impact of tax). The impact of the anticipated sale of the Clean Energy Businesses on the remeasurement of deferredchanges in state taxes and valuation allowance for deferredunitary tax assetsapportionments (net of federal taxes) was $(119) million for the year ended December 31, 2022.2023 includes $(7) million. Depreciation and amortization expenses on the assets of the Clean Energy Businesses $(4)assets of $(3) million (after-tax) were not recorded for the three monthsyear ended December 31, 2022.2023. Net income for common stock for the year ended December 31, 2023 includes $767 million (after-tax) for the gain on the sale of the Clean Energy Businesses. See "AssetsNote W and Liabilities Held for Sale"Note X to the financial statements in Item 8.
(c)On March 1, 2023, Con Edison completed the sale of all of the stock of the Clean Energy Businesses. See Note A, Note SW and Note X to the financial statements in Item 8.
Inflation Reduction Act
On August 16, 2022, the Inflation Reduction Act of 2022 (the Act) was signed into law and included a new 15 percent Corporate Alternative Minimum Tax (CAMT). Under the Act, a corporation will beis subject to the CAMT if its average annual Adjusted Financial Statement Income (AFSI) for the three taxable year period ending prior to the taxable year exceeds $1,000 million, and will applyapplies to tax years beginning after December 31, 2022. Based on management’s preliminary calculations, Con Edison and CECONY dowere not expect to be subject to the CAMT in 2023 but are expected to be subject to the CAMT in subsequent years.
| | | | | |
| CON EDISON ANNUAL REPORT 2023 | 51 |
However, the provisions of the CAMT are not expected to have a material impact on the Companies’ financial position, results of operations or liquidity.
Impact of CARES Act and 2021 Appropriations Act on Accounting for Income Taxes
In response to the economic impacts of the COVID-19 pandemic, the Coronavirus Aid, Relief, and Economic Security (CARES) Act became law on March 27, 2020. The CARES Act had several key business tax relief measures that presented cash benefits and/or refunds for Con Edison and its subsidiaries, including permitting a five-year carryback of a NOL for tax years 2018, 2019 and 2020, temporary removal of the 80 percent limitation of NOL carryforwards against taxable income for tax years before 2021, temporary relaxation of the limitations on interest deductions, employee retention tax credit and deferral of payments of employer payroll taxes.
Con Edison carried back a NOL of $29 million from tax year 2018 to tax year 2013. This allowed Con Edison, mostly at the Clean Energy Businesses, to receive a $2.5 million net tax refund and to recognize a discrete income tax benefit of $4 million in 2020, due to the higher federal statutory tax rate in 2013. See "Income Tax" in Note L. Con Edison and its subsidiaries did not have a federal NOL in tax years 2019 or 2020.
Con Edison and its subsidiaries benefited by the increase in the percentage for calculating the limitation on the interest expense deduction from 30 percent of Adjusted Taxable Income (ATI) to 50 percent of ATI in 2019 and 2020, which allowed the Companies to deduct 100 percent of their interest expense. For 2021, the limitation on interest expense for computing ATI reverted back to 30 percent.
The Companies qualify for an employee retention tax credit created under the CARES Act for "eligible employers" related to governmental authorities imposing restrictions that partially suspended their operations for a portion of their workforce due to the COVID-19 pandemic and the Companies continued to pay them. For the year ended
| | | | | |
54
|
CON EDISON ANNUAL REPORT 2022 |
December 31, 2020, Con Edison and CECONY recognized a tax benefit to Taxes, other than income taxes of $10 million and $7 million, respectively.
The CARES Act also allowed employers to defer payments of the employer share of Social Security payroll taxes that would have otherwise been owed from March 27, 2020 through December 31, 2020. The Companies deferred the payment of employer payroll taxes for the period April 1, 2020 through December 31, 2020 of approximately $71 million ($63 million of which is for CECONY). The Companies repaid half of this liability during 2021 and the other half during 2022.
Under the CARES Act, the Companies qualified for an employee retention tax credit for “eligible employers” related to governmental authorities imposing restrictions that partially suspended their operation for a portion of their workforce due to the COVID-19 pandemic. In December 2020, the Consolidated Appropriations Act, 2021 (the 2021 Appropriations Act) was signed into law. The 2021 Appropriations Act, among other things, extended the expiring employee retention tax credit to include qualified wages paid in the first two quarters of 2021, increased the qualified wages paid to an employee from 50 percent up to $10,000 annually in 2020 to 70 percent up to $10,000 per quarter in 2021 and increased the maximum employee retention tax credit amount an employer could take per employee from $5,000 in 2020 to $14,000 in the first two quarters of 2021. In March 2021, the American Rescue Plan Act was signed into law that expanded the 2021 Appropriations Act to extend the period for eligible employers to receive the employer retention credit from June 30, 2021 to December 31, 2021. In November 2021, the Infrastructure and Investment and Jobs Act was signed into law and accelerated the end of the employee retention tax credit retroactive to October 1, 2021, rather than December 31, 2021. This effectively reduced the maximum credit available from $28,000 to $21,000 per employee.
For the year ended December 31, 2021, Con Edison and CECONY recognized a tax benefit to Taxes, other than income taxes of $9 million and $4 million, respectively.
Accounting Considerations
Due to the COVID-19 pandemic and subsequent New York State on PAUSE and related executive orders (that have since been lifted), a decline in business, bankruptcies, layoffs and furloughs, among other factors, both commercial and residential customers have had and may continue to have increased difficulty paying their utility bills. In June 2020, the state of NY enacted a law prohibiting NY utilities, including CECONY and O&R, from disconnecting residential customers, and starting in May 2021 small business customers, during the COVID-19 state of emergency, which ended in June 2021. In addition, such prohibitions were in effect until December 21, 2021 for residential and small business customers who experienced a change in financial circumstances due to the COVID-19 pandemic.Legislation
CECONY and O&R have existing allowances for uncollectible accounts established against their customer accounts receivable balances that are reevaluated each quarter and updated accordingly. Changes to the Utilities’ reserve balances that result in write-offs of customer accounts receivable balances are not reflected in rates during the term of the current rate plans.
For the year ended December 31, 2022, CECONY and O&R issued total credits of $359.9 million and $6.1 million, respectively, towards reducing customers’ accounts receivable balances pursuant to COVID-19 arrears assistance programs. See "COVID-19 Regulatory Matters" in Note B to the financial statements in Item 8.
In January 2023, the NYSPSC issued an order implementing a Phase 2 COVID-19 arrears assistance program that provides credits towards reducing the arrears balances of residential and small commercial electric and gas customers of CECONY and O&R. At the time the order was issued, CECONY’s and O&R’s eligible arrears balances were estimated to be $388.7 million and $2.9 million, respectively. The order authorizes a surcharge mechanism for recovery of the eligible credit amounts over a ten-year period commencing after credits are issued for CECONY and over a one-year period commencing after credits are issued for O&R. See "COVID-19 Regulatory Matters" in Note B and Note N to the financial statements in Item 8.
CECONY’s and O&R’s "accounts receivable – customers" balance (net of allowance for uncollectible accounts) increased from $1,841 million and $91 million at December 31, 2021 to $2,099 million and $93 million at December 31, 2022, respectively. CECONY’s customer accounts receivable balances that are over 60 days in arrears increased from $1,272 million at December 31, 2021 to $1,308 million at December 31, 2022. CECONY’s allowances for uncollectible customer accounts reserve increased from $304 million at December 31, 2021 to $314 million at December 31, 2022. O&R’s customer accounts receivable balances that are over 60 days in arrears decreased from $29 million at December 31, 2021 to $22 million at December 31, 2022. O&R’s allowances for uncollectible customer accounts reserve decreased from $12.3 million at December 31, 2021 to $8 million at December 31, 2022.
| | | | | |
CON EDISON ANNUAL REPORT 2022 | 55 |
During 2022, the potential economic impact of the COVID-19 pandemic and the COVID-19 arrears assistance programs, were considered in forward-looking projections related to write-off and recovery rates, resulting in changes to the customer allowance for uncollectible accounts as detailed herein. The Companies test goodwill for impairment at least annually or whenever there is a triggering event, and test long-lived and intangible assets for recoverability when events or changes in circumstances indicate that the carrying value of long-lived or intangible assets may not be recoverable. The Companies identified no triggering events or changes in circumstances related to the COVID-19 pandemic that would indicate that the carrying value of goodwill, long-lived or intangible assets may not be recoverable at December 31, 2021 and 2022. See Note K to the financial statements in Item 8.
NY Legislation
In April 2021, NYNew York passed a law that increasesincreased the corporate franchise tax rate on business income from 6.5 percent to 7.25 percent, retroactive to January 1, 2021, for taxpayers with taxable income greater than $5 million. The law also reinstatesreinstated the business capital tax at 0.1875 percent, not to exceed a maximum tax liability of $5 million per taxpayer. NYNew York requires a corporate franchise taxpayer to calculate and pay the highest amount of tax under the three alternative methods: a tax on business income; a tax on business capital; or a fixed dollar minimum. The provisions to increase the corporate franchise tax rate and reinstate a capital tax arewere scheduled to expire after 2023. In May 2023, and are not expected to haveNew York passed a material impact onlaw that extended the Companies’ financial position, results of operations or liquidity.
In addition, the new law created a program that allows eligible residential renters in NY who require assistance with rent and utility bills to have up to twelve months of electric and gas utility bill arrears forgiven, provided that such arrears were accrued on or after March 13, 2020. The program will be administered by the State Office of Temporary and Disability Assistance (OTDA) in coordination with the NYSDPS and the NYSPSC (the OTDA Program). Under the OTDA Program, CECONY and O&R would qualify for a refundable tax credit for NY gross-receipts tax equal to the amount of arrears waived by the Utilitiesincrease in the corporate franchise tax rate from 6.5 percent to 7.25 percent for an additional three years, through tax year that2026 and extended the arrears are waived and certified by the NYSPSC. See "COVID-19 Regulatory Matters” in Note B to the financial statements in Item 8.
Liquidity and Financing
The Companies continue to monitor the impacts of the COVID-19 pandemic on the financial markets closely, including borrowing rates and daily cash collections. The Companies have been able to access thebusiness capital markets as needed since the start of the COVID-19 pandemic in March 2020. Inflationary pressure and higher interest rates could increase the amount of capital needed by the Utilities and the costs of such capital. See Notes C and D to the financial statements in Item 8.
The decline in business activity in the Utilities’ service territory due to the COVID-19 pandemic and subsequenttax through tax year 2026. New York State on PAUSE and related executive orders (that have since been lifted) resulted inalso passed a slower recovery in cashlaw establishing a permanent rate of outstanding customer accounts receivable balances in 2020 and 2021. During 2022, increases in electric and gas commodity prices have contributed and may further contribute to a slower recovery of cash from outstanding customer accounts receivable balances. The Utilities use derivative instruments to hedge price fluctuations30 percent for the purchase of electricity and gas. Volatility in electric and gas commodity prices that lead to the posting of cash collateral with counterparties could negatively impact the Utilities’ liquidity. See "COVID-19 Regulatory Matters" in Note B to the financial statements in Item 8 and “Financial and Commodity Market Risks – Commodity Price Risk,” below.
The Utilities’ rate plans have revenue decoupling mechanisms in their NY electric and gas businesses that largely reconcile actual energy delivery revenues to the authorized delivery revenues approved by the NYSPSC per month and reconcile the deferred balances semi-annually under CECONY's electric rate plan (January through June and July through December, respectively) and annually under CECONY's gas rate plan and O&R NY's electric and gas rate plans (January through December). Differences are accrued with interest each month for CECONY's and O&R NY’s electric customers and after the annual deferral period ends for CECONY's and O&R NY’s gas customers for refund to, or recovery from customers, as applicable. Generally, the refund to or recovery from customers begins August and February of each year over an ensuing six-month period for CECONY's electric customers and February of each year over an ensuing twelve-month period for CECONY's gas and O&R NY's electric and gas customers. Although these revenue decoupling mechanisms are in place, lower billed sales revenues and higher unpaid accounts have reduced and are expected to continue to reduce liquidity at the Utilities.
In March 2020, the Utilities began suspending service disconnections, certain collection notices, final bill collection agency activity, new late payment charges and certain other fees for all customers. In November 2021, the NYSPSC issued an order establishingmetropolitan transportation business tax surcharge. As a surcharge recovery mechanism for CECONY to collect, commencing December 1, 2021 through December 31, 2022, $43 million and $7 million for electric and gas, respectively, of late payment charges and fees that were not billed for the year ended December 31, 2020. The company recorded such amounts as revenue for the year ended December 31, 2021, as permitted under the accounting rules for regulated utilities, and also accrued such amounts as a current asset at December 31, 2021. Pursuant to the November 2021
| | | | | |
56
|
CON EDISON ANNUAL REPORT 2022 |
order, the company also established a recovery mechanism for CECONY to collect, commencing January 2023 through December 2023, $19 million and $4 million for electric and gas, respectively, of late payment charges and fees that were not billed for the year ended December 31, 2021 and the company recorded such amounts as revenue for the year ended December 31, 2021, as permitted under the accounting rules for regulated utilities, and also accrued such amounts as a current asset at December 31, 2021. In addition, pursuant to the November 2021 order, CECONY established a reserve of $7 million toward addressing customer arrearages for the year ended December 31, 2021 that, pursuant to a June 2022 NYSPSC order discussed below, was used to fund a portion of the COVID-19 arrears assistance program for low-income customers. The order also established a surcharge recovery or sur-credit mechanism for any late payment charges and fee deferrals, subject to offsetting related savings resulting from the COVID-19 pandemic, for 2022 starting in January 2024 over a twelve-month period. CECONY resumed late payment charges for commercial and residential customers who have not experienced a change in financial circumstances due to the COVID-19 pandemic on September 3, 2021 and October 1, 2021, respectively. Pursuant to the October 2021 joint proposal for new electric and gas rates for O&R that was approved by the NYSPSC in April 2022, O&R recorded late payment charges and fees that were not billed for the years ended December 31, 2020 and December 31, 2021 of $1.7 million and $2.4 million, respectively, as revenue for the year ended December 31, 2021, as permitted under the accounting rules for regulated utilities, and also accrued such amounts as a current asset at December 31, 2021. See “Rate Plans,” above. O&R resumed late payment charges for commercial and residential customers who have not experienced a change in financial circumstances due to the COVID-19 pandemic on October 1, 2021.
Con Edison and the Utilities have a $2,250 million credit agreement (Credit Agreement) in place under which banks are committed to provide loans on a revolving credit basis until December 2023 ($2,200 million of commitments from December 2022), subject to certain conditions. In March 2022, CECONY entered into a 364-Day Revolving Credit Agreement (CECONY Credit Agreement) under which banks are committed to provide loans up to $750 million on a revolving credit basis until March 30, 2023, subject to certain conditions. In April 2022, FERC issued an order that increases CECONY's authorization to issue short-term debt from $2,250 million to $3,000 million effective May 2022. Con Edison and the Utilities have not entered into any loans under the Credit Agreement and CECONY has not entered into any loans under the CECONY Credit Agreement. See Note D to the financial statements in Item 8.
New York State and the NYSPSC implemented COVID-19 arrears assistance programs that provide credits and establishes surcharge recovery mechanisms towards reducing the arrears balances of low-income electric and gas customers of CECONY and O&R. See "COVID-19 Regulatory Matters" in Note B and Note L to the financial statements in Item 8 and “Coronavirus Disease 2019 (COVID-19) Impacts – Accounting Considerations,” above.
In October 2022, Con Edison entered into an agreement to sell the Clean Energy Businesses for $6,800 million, subject to closing adjustments, including working capital adjustments and downward adjustments for indebtedness, transaction expenses and the value of certain assets and projects that are not able to be conveyed to the buyer upon closing of the transaction. Subject to, and following the closingresult of the sale of the Clean Energy Businesses in 2023, Con Edison intendshas New York State taxable income in excess of $5 million after using its entire New York state net operating loss carryforward, and therefore, the group is subject to use the net proceeds fromhigher 7.25 percent rate (9.425 percent with the sale to repay $1,250surcharge rate) on its taxable income for tax year 2023. As a result of this legislation, CECONY remeasured its deferred tax assets and liabilities that would reverse before 2027 and recorded state deferred income tax expense (net of federal tax benefit) and an increase in accumulated deferred tax liabilities of $10 million for the year ended December 31, 2023, all of parent company debt in 2023, investwhich was recorded in the Utilities and repurchase up $1,000 million of its common shares. The transaction is expected to close on or about the end of the firstsecond quarter of 2023, subject to satisfaction of certain conditions. See "Assets and Liabilities Held for Sale" in Note A and Note X to the financial statements in Item 8 and "Anticipated Sale of the Clean Energy Business," above.2023.
| | | | | |
52 | CON EDISON ANNUAL REPORT 2022 | 572023 |
Results of Operations
Net income for common stock and earnings per share for the years ended December 31, 2023, 2022 2021 and 20202021 were as follows:
| (Millions of Dollars,
except per share amounts) | (Millions of Dollars,
except per share amounts) | Net Income for Common Stock | Earnings per Share | (Millions of Dollars,
except per share amounts) | Net Income for Common Stock | Earnings per Share |
| | | 2022 | 2021 | 2020 | 2022 | 2021 | 2020 | | 2023 | 2022 | 2021 | 2023 | 2022 | 2021 |
| CECONY | CECONY | $1,390 | $1,344 | $1,185 | $3.92 | | $3.86 | | $3.54 | |
| O&R | O&R | 88 | 75 | 71 | 0.25 | | 0.22 | | 0.21 | |
| Clean Energy Businesses (a) (e) | 382 | 266 | 24 | 1.08 | | 0.76 | | 0.07 | |
| Clean Energy Businesses (a) | |
| Con Edison Transmission (b) | Con Edison Transmission (b) | (1) | (316) | (175) | | — | | (0.91) | | (0.52) | |
| Other (c) | Other (c) | (199) | (23) | (4) | (0.57) | | (0.07) | | (0.01) | |
| Con Edison (d) | Con Edison (d) | $1,660 | $1,346 | $1,101 | $4.68 | | $3.86 | | $3.29 | |
(a)Net income for common stock and earnings per share from the Clean Energy Businesses for the year ended December 31, 2023, 2022 2021 and 20202021 reflects $2 million or $0.01 a share (after-tax), $46 million or $0.14 a share (after-tax), and $107 million or $0.31 a share (after-tax) and $(32) million or $(0.10) a share (after-tax) of the effects of HLBV accounting for tax equity investments in certain renewable electric projects. Net income for common stock and earnings per share from the Clean Energy Businesses also includes $(9) million or $(0.03) a share, $135 million or $0.38 a share and $40 million or $0.11 a share and $(43) million or $(0.13) a share of net after-tax mark-to-market effects in 2023, 2022 and 2021, and 2020, respectively. The Clean Energy Businesses were classified as held for sale as of December 31, 2022. Depreciation and amortization expenses on their assets of $(46)$31 million or $(0.13)$0.08 a share (after-tax) and $46 million or $0.13 a share (after tax) were not recorded for the three monthsyears ended December 31, 2022. The impact2023 and 2022, respectively. On March 1, 2023, Con Edison completed the sale of all of the anticipated salestock of the Clean Energy Businesses on the remeasurement of deferred state taxes and valuation allowance for deferred tax assets (net of federal taxes) was $(2) million or $(0.01) a share for the three months ended December 31, 2022.Businesses. See "Assets and Liabilities Held for Sale" in Note A, Note SW and Note X to the financial statements in Item 8. Net income for common stock and earnings per share from the Clean Energy Businesses for the year ended December 31, 2021 includes $(3) million (after-tax) or $(0.01) a share (after-tax) for the loss from the sale of a renewable electric project. See Note S to the financial statements in Item 8.
(b) Net loss for common stock and earnings per share from Con Edison Transmission for the year ended December 31, 2022 includes $(4) million or $(0.01) a share (net of federal taxes) relating to the remeasurement of deferred state taxes related to prior year dispositions. Net loss for common stock and earnings per share from Con Edison Transmission for the year ended December 31, 2021 includes $(153) million or $(0.44) a share of net after-tax impairment loss related to its investment in Stagecoach, $(168) million or $(0.48) a share of net after-tax impairment loss related to its investment in Mountain Valley Pipeline, LLC and $(5) million or $(0.02) a share of loss related to a goodwill impairment loss related to its investment in Honeoye. Net income for common stock and earnings per share from Con Edison Transmission for the year ended December 31, 2020 includes $(232) million or $(0.69) a share of net after-tax impairment loss related to its investment in Mountain Valley Pipeline, LLC. See "Critical Accounting Estimates - Investments" in Item 7 and “Investments - Partial Impairment of Investment“Investment in Mountain Valley Pipeline, LLC (MVP)” in Note A to the financial statements in Item 8.
(c) Other includes the parent company, Con Edison’s tax equity investments, the deferred project held for sale and consolidation adjustments. See Note X to the financial statements in Item 8. Net income for common stock and earnings per share for the year ended December 31, 2023 includes $(11) million or $(0.03) a share (after-tax) of income tax impact on the effects of HLBV accounting for tax equity investments in certain renewable electric projects and an immaterial amount or $0.00 a share of income tax impact on the net after-tax mark-to-market effects. Net income for common stock for the year ended December 31, 2023 also includes $(14) million and $(0.04) a share of transaction costs and other accruals related to the sale of the Clean Energy Businesses (net of tax). Impact of the sale of the Clean Energy Businesses on the changes in state unitary tax apportionments (net of federal taxes) is $(7 million) or $(0.02) per share. Depreciation and amortization expenses on the assets of the Clean Energy Businesses $(3) million or $(0.01) a share (after-tax) were not recorded for the year ended December 31, 2023. Net income for common stock for the year ended December 31, 2023 includes $767 million or $2.21 per share (after-tax) for the gain on the sale of the Clean Energy Businesses. See Note W and Note X to the financial statements in Item 8.
Net income for common stock and earnings per share for the year ended December 31, 2022 includes $(4) million (after-tax) or $(0.02) a share (after-tax) of income tax impact on the effects of HLBV accounting for tax equity investments in certain renewable electric projects and $(11) million or $(0.03) a share of income tax impact on the net after-tax mark-to-market effects. Net income for common stock and earnings per share for the year ended December 31, 2022 includes $(9) million or $(0.03) a share (net of federal taxes) relating to the remeasurement of deferred state taxes related to prior year dispositions for Con Edison Transmission. Net income for common stock for the year ended December 31, 2022 also includes $(35) million and $(0.10) a share of transaction costs and other accruals related to the anticipated sale of the Clean Energy Businesses (net of tax) related to the anticipated sale of the Clean Energy Businesses.. Impact of the anticipated sale of the Clean Energy Businesses on the remeasurement of deferred state taxes and valuation allowance for deferred tax assets (net of federal taxes) is $(119 million) or $(0.33) per share. Depreciation and amortization expenses on the assets of the Clean Energy Businesses $(4) million or $(0.01) a share (after-tax) were not recorded for the three monthsyear ended December 31, 2022. See "Assets and Liabilities Held for Sale" in Note A, Note SW and Note X to the financial statements in Item 8.
Net income for common stock and earnings per share for the year ended December 31, 2021 includes $(9) million (after-tax) or $(0.02) a share (after-tax) of income tax impact on the effects of HLBV accounting for tax equity investments in certain renewable electric projects and $(3) million or $(0.01) a share of income tax impact on the net after-tax mark-to-market effects. Net income for common stock and earnings per share for the year ended December 31, 2021 includes $6 million or $0.02 a share of income tax impact for the impairment loss related to Con Edison Transmission’s investment in Stagecoach. Net income for common stock and earnings per share for the year ended December 31, 2021 includes $6 million or $0.01 a share of income tax impact for the impairment loss related to Con Edison Transmission’s investment in Mountain Valley Pipeline, LLC. See “Investments - 2021 Partial Impairment of Investment in Stagecoach Gas Services LLC (Stagecoach)” and "Investments - 2020 and 2021 Partial Impairments of Investment"Investment in Mountain Valley Pipeline, LLC (MVP)" in Note A to the financial statements in Item 8.
Net income for common stock and earnings per share for the year ended December 31, 2020 includes $3 million or $0.01 a share (after-tax), respectively, of income tax impact on the effects of HLBV accounting for tax equity investments in certain renewable electric projects. Net income for common stock and earnings per share from the Clean Energy Businesses for the year ended December 31, 2020 includes $4 million or $0.01 a share of income tax impact on the net after-tax mark-to-market effects. Net income for common stock and earnings per share for the year ended December 31, 2020 includes $9 million or $0.03 a share of income tax impact for the impairment loss related to Con Edison Transmission’s investment in Mountain Valley Pipeline, LLC. See “Investments - 2020 and 2021 Partial Impairments of Investment in Mountain Valley Pipeline, LLC (MVP)” in Note A to the financial statements in Item 8.
(d) Earnings per share on a diluted basis were $7.21 a share, $4.66 a share and $3.85 a share in 2023, 2022 and $3.28 a share in 2022, 2021, and 2020, respectively. See "Earnings Per Common Share" in Note A to the financial statements in Item 8.
(e) The Clean Energy Businesses were classified as held for sale as of December 31, 2022. See “Assets and Liabilities Held for Sale” in Note A and Note X to the financial statements in Item 8.
The following tables present the estimated effect of major factors on earnings per share and net income for common stock for the years ended December 31, 2023 as compared with 2022, and 2022 as compared with 2021, and 2021 as compared with 2020.2021.
| | | | | |
| CON EDISON ANNUAL REPORT 2023 | 53 |
| | | | | | | | |
| Variation for the Year Ended December 31, 2023 vs. 2022 |
| Net Income for Common Stock (Millions of Dollars) | Earnings per Share |
| CECONY (a) | | |
| Electric base rate increase | $277 | $0.78 |
| Gas base rate increase | 66 | 0.19 |
| Lower operation and maintenance expense from stock-based compensation, injuries and damages offset, in part, by higher health care costs | 17 | 0.05 |
| Higher interest income | 10 | 0.03 |
| Higher income from allowance for equity funds used during construction | 3 | 0.01 |
| Higher interest expense | (91) | (0.26) |
| Higher electric and gas operations maintenance activities | (46) | (0.13) |
| Weather impact on steam revenues offset, in part, by the benefit from the new steam rate plan effective November 2023 | (12) | (0.03) |
| Change in incentives earned under the electric and gas earnings adjustment mechanisms (EAMs) | (8) | (0.02) |
| Accretive effect of share repurchase | — | 0.09 |
| Other | — | (0.01) |
| Total CECONY | 216 | 0.70 |
| O&R (a) | | |
| Electric base rate increase | 7 | 0.02 |
| Gas base rate increase | 4 | 0.01 |
| Other | (3) | — |
| Total O&R | 8 | 0.03 |
| Clean Energy Businesses (b) | | |
| Total Clean Energy Businesses | (360) | (1.01) |
| Con Edison Transmission | | |
| Higher investment income, primarily due to the recognition of allowance of funds used during construction from Mountain Valley Pipeline, LLC for 2023 | 31 | 0.09 |
| Remeasurement of deferred state taxes related to dispositions prior to 2022 | 4 | 0.01 |
| Other | 3 | 0.01 |
| Total Con Edison Transmission | 38 | 0.11 |
| Other, including parent company expenses | | |
| Gain and other impacts related to the sale of the Clean Energy Businesses | 903 | 2.58 |
| Higher interest income primarily related to proceeds from sale of the Clean Energy Businesses | 18 | 0.05 |
| Lower interest expense | 17 | 0.05 |
| Net mark-to-market effects | 10 | 0.03 |
| Remeasurement of deferred state tax related to dispositions prior to 2022 | 9 | 0.03 |
| Production tax credit from deferred project | 7 | 0.01 |
| Lower New York state capital taxes | 5 | 0.01 |
| Accrued commitment to Consolidated Edison Foundation, Inc. | (9) | (0.03) |
| HLBV effects | (7) | (0.01) |
| Accretive effect of share repurchase | — | 0.03 |
| Other | 4 | (0.01) |
| Total Other, including parent company expenses | 957 | 2.74 |
| Total Reported (GAAP basis) | $859 | $2.57 |
| | |
a.Under the revenue decoupling mechanisms in the Utilities’ New York electric and gas rate plans and the weather-normalization clause applicable to their gas businesses, revenues are generally not affected by changes in delivery volumes from levels assumed when rates were approved. Effective November 1, 2023, revenues from CECONY’s steam sales are also subject to a weather normalization clause, as a result of which, delivery revenues reflect normal weather conditions during the heating season. In general, the Utilities recover on a current basis the fuel, gas purchased for resale and purchased power costs they incur in supplying energy to their full-service customers. Accordingly, such costs do not generally affect Con Edison’s results of operations. |
| b. On March 1, 2023, Con Edison completed the sale of all of the stock of the Clean Energy Businesses and therefore 2023 reflects the financial results for the two months ended February 2023. |
| | | | | |
5854
|
20222023 |
| | | | | | | | |
| Variation for the Year Ended December 31, 2022 vs. 2021 |
| Net Income for Common Stock (Millions of Dollars) | Earnings per Share |
| CECONY (a) | | |
| Higher electric rate base | $48 | $0.14 |
| Higher gas rate base | 39 | 0.11 |
| Lower costs related to winter storms and heat events | 26 | 0.08 |
| Higher income from allowance for funds used during construction | 16 | 0.04 |
| Lower health care and other employee benefits costs | 13 | 0.03 |
| Weather impact on steam revenues | 6 | 0.02 |
| Resumption of the billing of late payment charges and other fees to allowed rate plan levels | (34) | (0.10) |
| Lower incentives earned under the electric and gas earnings adjustment mechanisms (EAMs) and positive incentives | (28) | (0.08) |
| Higher stock-based compensation costs | (18) | (0.05) |
| Regulatory commission expense | (11) | (0.03) |
| Higher payroll taxes | (4) | (0.01) |
| Dilutive effect of stock issuances | — | (0.07) |
| Other | (7) | (0.02) |
| Total CECONY | 46 | 0.06 |
| O&R (a) | | |
| Electric base rate increase | 16 | 0.04 |
| Gas base rate increase | 8 | 0.02 |
| Higher stock-based compensation costs | (2) | (0.01) |
| Other | (9) | (0.02) |
| Total O&R | 13 | 0.03 |
| Clean Energy Businesses (b) | | |
| Higher wholesale revenue | 207 | 0.59 |
| Net mark-to-market effects | 95 | 0.27 |
| Impact of the anticipated sale of the Clean Energy Businesses | 44 | 0.12 |
| Loss from sale of a renewable electric project in 2021 | 3 | 0.01 |
| Higher gas purchased for resale | (135) | (0.39) |
| HLBV effects | (61) | (0.17) |
| Higher operation and maintenance expense from engineering, procurement and construction of renewable electric projects | (21) | (0.06) |
| Higher cost from purchased power | (5) | (0.01) |
| Lower tax credits | (4) | (0.01) |
| Higher interest expense | (3) | (0.01) |
| Dilutive effect of stock issuances | — | (0.02) |
| Other | (4) | — |
| Total Clean Energy Businesses | 116 | 0.32 |
| Con Edison Transmission | | |
| Impairment loss related to investment in Mountain Valley Pipeline, LLC | 168 | 0.48 |
| Impairment loss related to investment in Stagecoach in 2021 | 153 | 0.44 |
| Impairment loss related to investment in Honeoye in 2021 | 5 | 0.02 |
| Lower interest expense | 3 | 0.01 |
| Lower investment income | (14) | (0.04) |
| Remeasurement of deferred state taxes related to prior year dispositions | (4) | (0.01) |
| Other | 4 | 0.01 |
| Total Con Edison Transmission | 315 | 0.91 |
| Other, including parent company expenses | | |
| HLBV effects | 5 | — |
| Impact of the anticipated sale of the Clean Energy Businesses | (158) | (0.44) |
| Remeasurement of deferred state tax related to prior year dispositions | (9) | (0.03) |
| Impact of net mark-to-market effects | (7) | (0.02) |
| Impairment related to investment in Stagecoach in 2021 | (6) | (0.02) |
| | | | | | | | |
| Variation for the Year Ended December 31, 2022 vs. 2021 |
| Net Income for Common Stock (Millions of Dollars) | Earnings per Share |
| CECONY (a) | | |
| Higher electric rate base | $48 | $0.14 |
| Higher gas rate base | 39 | 0.11 |
| Lower costs related to winter storms and heat events | 26 | 0.08 |
| Higher income from allowance for funds used during construction | 16 | 0.04 |
| Lower health care and other employee benefits costs | 13 | 0.03 |
| Weather impact on steam revenues | 6 | 0.02 |
| Resumption of the billing of late payment charges and other fees to allowed rate plan levels | (34) | (0.10) |
| Lower incentives earned under the electric and gas earnings adjustment mechanisms (EAMs) and positive incentives | (28) | (0.08) |
| Higher stock-based compensation costs | (18) | (0.05) |
| Regulatory commission expense | (11) | (0.03) |
| Higher payroll taxes | (4) | (0.01) |
| Dilutive effect of stock issuances | — | (0.07) |
| Other | (7) | (0.02) |
| | |
| | |
| | |
| Total CECONY | 46 | 0.06 |
| O&R (a) | | |
| Electric base rate increase | 16 | 0.04 |
| Gas base rate increase | 8 | 0.02 |
| Higher stock-based compensation costs | (2) | (0.01) |
| Other | (9) | (0.02) |
| | |
| | |
| | |
| Total O&R | 13 | 0.03 |
| Clean Energy Businesses (b) | | |
| Higher wholesale revenue | 207 | 0.59 |
| Net mark-to-market effects | 95 | 0.27 |
| Impact of the sale of the Clean Energy Businesses | 44 | 0.12 |
| Loss from sale of a renewable electric project in 2021 | 3 | 0.01 |
| Higher gas purchased for resale | (135) | (0.39) |
| HLBV effects | (61) | (0.17) |
| Higher operation and maintenance expense from engineering, procurement and construction of renewable electric projects | (21) | (0.06) |
| Higher cost from purchased power | (5) | (0.01) |
| Lower tax credits | (4) | (0.01) |
| Higher interest expense | (3) | (0.01) |
| Dilutive effect of stock issuances | — | (0.02) |
| Other | (4) | — |
| Total Clean Energy Businesses | 116 | 0.32 |
| Con Edison Transmission | | |
| Impairment loss related to investment in Mountain Valley Pipeline, LLC | 168 | 0.48 |
| Impairment loss related to investment in Stagecoach in 2021 | 153 | 0.44 |
| Impairment loss related to investment in Honeoye in 2021 | 5 | 0.02 |
| Lower interest expense | 3 | 0.01 |
| Lower investment income | (14) | (0.04) |
| Remeasurement of deferred state tax related to dispositions prior to 2022 | (4) | (0.01) |
| Other | 4 | 0.01 |
| Total Con Edison Transmission | 315 | 0.91 |
| Other, including parent company expenses | | |
| HLBV effects | 5 | — |
| Impact of the sale of the Clean Energy Businesses | (158) | (0.44) |
| | | | | |
CON EDISON ANNUAL REPORT 20222023 | 5955 |
| | | | | | | | |
| Impairment related to investment in Mountain Valley Pipeline, LLC | (6) | (0.01) |
| Dilutive effect of stock issuances | — | 0.01 |
| Other | 5 | 0.01 |
| Total Other, including parent company expenses | (176) | (0.50) |
| Total Reported (GAAP basis) | 314 | 0.82 |
| | |
a.Under the revenue decoupling mechanisms in the Utilities’ NY electric and gas rate plans and the weather-normalization clause applicable to their gas businesses, revenues are generally not affected by changes in delivery volumes from levels assumed when rates were approved. In general, the Utilities recover on a current basis the fuel, gas purchased for resale and purchased power costs they incur in supplying energy to their full-service customers. Accordingly, such costs do not generally affect Con Edison’s results of operations. |
| b. The Clean Energy Businesses were classified as held for sale as of December 31, 2022. |
| | | | | |
60
|
CON EDISON ANNUAL REPORT 2022 |
| | | | | | | | |
| Variation for the Year Ended December 31, 2021 vs. 2020 |
| Net Income for Common Stock (Millions of Dollars) | Earnings per Share |
| CECONY (a) | | |
| Recognition of late payment charges for the year ended 2020 that are being recovered through a surcharge mechanism established by the New York Public Service Commission in its November 2021 order | $32 | $0.09 |
| Recognition of late payment charges for the year ended 2021 that are being recovered through a surcharge mechanism established by the New York Public Service Commission in its November 2021 order, and resuming the billing of late payment charges and no access fees | 41 | 0.13 |
| Higher electric rate base | 64 | 0.19 |
| Higher gas rate base | 38 | 0.11 |
| Higher incentives earned under the electric and gas earnings adjustment mechanisms (EAMs) and positive incentives | 30 | 0.09 |
| Weather impact on steam revenues | 16 | 0.05 |
| Higher costs related to heat, storm and emergency response | (37) | (0.11) |
| Higher healthcare costs | (16) | (0.05) |
| Higher stock-based compensation costs | (11) | (0.03) |
| | |
| Dilutive effect of stock issuances | — | (0.15) |
| | |
| | |
| Other | 2 | — |
| Total CECONY | 159 | 0.32 |
| O&R (a) | | |
| Electric base rate increase | 9 | 0.03 |
| Higher storm-related costs | (5) | (0.02) |
| | |
| | |
| | |
| Total O&R | 4 | 0.01 |
| Clean Energy Businesses | | |
| Higher revenues | 209 | 0.62 |
| HLBV effects | 139 | 0.41 |
| Net mark-to-market effects | 83 | 0.24 |
| | |
| Higher operations and maintenance expenses | (180) | (0.54) |
| Loss from sale of a renewable electric project | (3) | (0.01) |
| Dilutive effect of stock issuances | — | (0.03) |
| | |
| | |
| Other | (6) | — |
| Total Clean Energy Businesses | 242 | 0.69 |
| Con Edison Transmission | | |
| Impairment loss related to investment in Mountain Valley Pipeline, LLC | 64 | 0.21 |
| Impairment losses related to investment in Stagecoach | (153) | (0.44) |
| Foregoing Allowance for Funds Used During Construction income starting in January 2021 until significant construction resumes on the Mountain Valley Pipeline | (44) | (0.13) |
| Impairment loss related to investment in Honeoye | (5) | (0.02) |
| | |
| | |
| Other | (3) | (0.01) |
| Total Con Edison Transmission | (141) | (0.39) |
| Other, including parent company expenses | | |
| Impairment tax benefits related to investment in Mountain Valley Pipeline, LLC | (3) | (0.02) |
| Tax impact of HLBV effects | (9) | (0.02) |
| Tax impact of net mark-to-market effects | (3) | (0.01) |
| Lower consolidated state income tax benefit | (9) | (0.03) |
| Impairment tax benefits related to investment in Stagecoach | 6 | 0.02 |
| | |
| | |
| Other | (1) | — |
| Total Other, including parent company expenses | (19) | (0.06) |
| Total Reported (GAAP basis) | $245 | $0.57 |
| | |
a.Under the revenue decoupling mechanisms in the Utilities’ NY electric and gas rate plans and the weather-normalization clause applicable to their gas businesses, revenues are generally not affected by changes in delivery volumes from levels assumed when rates were approved. In general, the Utilities recover on a current basis the fuel, gas purchased for resale and purchased power costs they incur in supplying energy to their full-service customers. Accordingly, such costs do not generally affect Con Edison’s results of operations. |
| | | | | | | | |
| Remeasurement of deferred state tax related to dispositions prior to 2022 | (9) | (0.03) |
| Impact of net mark-to-market effects | (7) | (0.02) |
| Impairment related to investment in Stagecoach in 2021 | (6) | (0.02) |
| Impairment related to investment in Mountain Valley Pipeline, LLC | (6) | (0.01) |
| Dilutive effect of stock issuances | — | 0.01 |
| Other | 5 | 0.01 |
| Total Other, including parent company expenses | (176) | (0.50) |
| Total Reported (GAAP basis) | $314 | $0.82 |
| | |
a.Under the revenue decoupling mechanisms in the Utilities’ New York electric and gas rate plans and the weather-normalization clause applicable to their gas businesses, revenues are generally not affected by changes in delivery volumes from levels assumed when rates were approved. In general, the Utilities recover on a current basis the fuel, gas purchased for resale and purchased power costs they incur in supplying energy to their full-service customers. Accordingly, such costs do not generally affect Con Edison’s results of operations. |
| b. On March 1, 2023, Con Edison completed the sale of all of the stock of the Clean Energy Businesses. |
| | | | | |
CON EDISON ANNUAL REPORT 2022 | 61 |
The Companies’ other operations and maintenance expenses for the years ended December 31, 2023, 2022 2021 and 20202021 were as follows:
| | (Millions of Dollars) | (Millions of Dollars) | 2022 | 2021 | 2020 | (Millions of Dollars) | 2023 | 2022 | 2021 |
| CECONY | CECONY | |
| Operations | $1,717 | $1,691 | $1,606 |
| Operations (a) | |
| Operations (a) | |
| Operations (a) | | $1,845 | $1,639 | $1,617 |
| Pensions and other postretirement benefits | Pensions and other postretirement benefits | 415 | (42) | (103) | Pensions and other postretirement benefits | 338 | 415 | (42) |
| Health care and other benefits | Health care and other benefits | 155 | 173 | 151 | Health care and other benefits | 172 | 155 | 173 |
| Regulatory fees and assessments (a) | 354 | 332 | 330 |
| Other | 401 | 298 | 285 |
| Regulatory fees and assessments (b) | | Regulatory fees and assessments (b) | 380 | 354 | 332 |
| Other (a) | | Other (a) | 441 | 479 | 372 |
| Total CECONY | Total CECONY | 3,042 | 2,452 | 2,269 | Total CECONY | 3,176 | 3,042 | 2,452 |
| O&R | O&R | 351 | 313 | 310 | O&R | 375 | 351 | 313 |
| Clean Energy Businesses (c) | Clean Energy Businesses (c) | 504 | 475 | 228 | Clean Energy Businesses (c) | 48 | 504 | 475 |
| Con Edison Transmission | Con Edison Transmission | 13 | 19 | 11 | Con Edison Transmission | 11 | 13 | 19 |
| Other (b) | (5) | | (5) | | (4) |
| Other (d) | | Other (d) | (4) | | (5) | | (5) |
| Total other operations and maintenance expenses | Total other operations and maintenance expenses | $3,905 | $3,254 | $2,814 | Total other operations and maintenance expenses | $3,606 | $3,905 | $3,254 |
(a)Certain prior period amounts have been reclassified within the Companies' other operations and maintenance expenses to conform with current period presentation.
(b)Includes Demand Side Management, System Benefit Charges and Public Service Law 18A assessments whichthat are collected in revenues.
(b)(c)IncludesOn March 1, 2023, Con Edison completed the sale of all of the stock of the Clean Energy Businesses. See Note W and Note X to the financial statements in Item 8.
(d)Other includes the parent company, and consolidation adjustments.
(c)The Clean Energy Businesses were classified asCon Edison’s tax equity investments, the deferred project held for sale as of December 31, 2022.and consolidation adjustments. See “Assets and Liabilities Held for Sale” in Note A and Note X to the financial statements in Item 8.
Con Edison’s principal business segments are CECONY’s regulated utility activities, O&R’s regulated utility activities the Clean Energy Businesses and Con Edison Transmission. TheOn March 1, 2023, Con Edison completed the sale of all of the stock of the Clean Energy Businesses were classified as held for sale as of December 31, 2022.Businesses. See “Assets and Liabilities Held for Sale” in Note AW and Note X to the financial statements in Item 8. CECONY’s principal business segments are its regulated electric, gas and steam utility activities. A discussion of the results of operations by principal business segment for the years ended December 31, 2023, 2022 2021 and 20202021 follows. For additional business segment financial information, see Note P to the financial statements in Item 8.
| | | | | |
6256
|
20222023 |
The Companies’ results of operations for the years ended December 31, 2023, 2022 2021 and 20202021 were:
| | | | CECONY | O&R | Clean Energy (e)
Businesses | Con Edison
Transmission | Other (a) | Con Edison (b) | | CECONY | O&R | Clean Energy (e)
Businesses | Con Edison
Transmission | Other (a) | Con Edison (b) |
| (Millions of Dollars) | (Millions of Dollars) | 2022 | 2021 | 2020 | 2022 | 2021 | 2020 | 2022 | 2021 | 2020 | 2022 | 2021 | 2020 | 2022 | 2021 | 2020 | 2022 | 2021 | 2020 | (Millions of Dollars) | 2023 | 2022 | 2021 | 2023 | 2022 | 2021 | 2023 | 2022 | 2021 | 2023 | 2022 | 2021 | 2023 | 2022 | 2021 | 2023 | 2022 | 2021 |
| Operating revenues | Operating revenues | $13,268 | $11,716 | $10,647 | $1,085 | $941 | $862 | $1,319 | $1,022 | $736 | $4 | $4 | $(6) | $(7) | $(3) | $15,670 | $13,676 | $12,246 | Operating revenues | $13,476 | $13,268 | $11,716 | $1,056 | $1,085 | $941 | $129 | $1,319 | $1,022 | $4 | $4 | $(2) | $(6) | $(7) | $14,663 | $15,670 | $13,676 |
| Purchased power | Purchased power | 2,201 | 1,633 | 1,432 | 276 | 206 | 169 | 7 | — | — | — | (5) | (4) | (1) | 2,479 | 1,835 | 1,600 | Purchased power | 2,294 | 2,201 | 1,633 | 247 | 276 | 206 | — | 7 | — | — | — | — | (5) | (4) | 2,541 | 2,479 | 1,835 |
| Fuel | Fuel | 356 | 229 | 156 | — | — | — | — | — | — | — | — | 356 | 229 | 156 | Fuel | 282 | 356 | 229 | — | — | — | — | — | — | — | — | 282 | 356 | 229 |
| Gas purchased for resale | Gas purchased for resale | 869 | 541 | 426 | 135 | 88 | 61 | 241 | 62 | 41 | — | — | — | (1) | 1,245 | 690 | 527 | Gas purchased for resale | 677 | 869 | 541 | 111 | 135 | 88 | 41 | 241 | 62 | — | — | — | — | (1) | 829 | 1,245 | 690 |
| Other operations and maintenance (c) | Other operations and maintenance (c) | 3,042 | 2,452 | 2,269 | 351 | 313 | 310 | 504 | 475 | 228 | 13 | 19 | 11 | (5) | (5) | (4) | 3,905 | 3,254 | 2,814 | Other operations and maintenance (c) | 3,176 | 3,042 | 2,452 | 375 | 351 | 313 | 48 | 504 | 475 | 11 | 13 | 19 | (4) | (5) | 3,606 | 3,905 | 3,254 |
| Depreciation and amortization | Depreciation and amortization | 1,778 | 1,705 | 1,598 | 98 | 95 | 90 | 178 | 231 | 1 | 1 | 1 | — | 2,056 | 2,032 | 1,920 | Depreciation and amortization | 1,924 | 1,778 | 1,705 | 106 | 98 | 95 | — | 178 | 231 | 1 | 1 | — | 1 | — | 2,031 | 2,056 | 2,032 |
| Taxes, other than income taxes | Taxes, other than income taxes | 2,887 | 2,696 | 2,456 | 89 | 89 | 85 | 21 | 18 | 21 | — | — | 8 | 7 | 13 | 3,005 | 2,810 | 2,575 | Taxes, other than income taxes | 2,946 | 2,887 | 2,696 | 91 | 89 | 3 | 21 | 18 | 1 | — | 2 | 8 | 7 | 3,043 | 3,005 | 2,810 |
| Gain on sale of the Clean Energy Businesses | | Gain on sale of the Clean Energy Businesses | — | — | — | — | — | — | — | 865 | — | 865 | — |
| Operating income (loss) | Operating income (loss) | 2,135 | 2,460 | 2,310 | 136 | 150 | 147 | 368 | 236 | 215 | (10) | (16) | (8) | (5) | (4) | (10) | 2,624 | 2,826 | 2,654 | Operating income (loss) | 2,177 | 2,135 | 2,460 | 126 | 136 | 150 | 37 | 368 | 236 | (9) | (10) | (16) | 865 | (5) | (4) | 3,196 | 2,624 | 2,826 |
| Other income (deductions) (d) | Other income (deductions) (d) | 332 | (108) | (171) | 23 | (12) | (14) | 3 | (10) | 4 | 19 | (407) | (215) | (51) | (1) | (5) | 326 | (538) | (401) | Other income (deductions) (d) | 732 | 332 | (108) | 49 | 23 | (12) | 1 | 3 | (10) | 62 | 19 | (407) | (14) | (51) | (1) | 830 | 326 | (538) |
| Net interest expense (income) | Net interest expense (income) | 822 | 762 | 739 | 46 | 42 | 41 | (35) | 68 | 196 | 5 | 9 | 18 | 14 | 24 | 25 | 852 | 905 | 1,019 | Net interest expense (income) | 945 | 822 | 762 | 51 | 46 | 42 | 16 | (35) | 68 | 2 | 5 | 9 | 9 | 14 | 24 | 1,023 | 852 | 905 |
| Income before income tax expense | Income before income tax expense | 1,645 | 1,590 | 1,400 | 113 | 96 | 92 | 406 | 158 | 23 | 4 | (432) | (241) | (70) | (29) | (40) | 2,098 | 1,383 | 1,234 | Income before income tax expense | 1,964 | 1,645 | 1,590 | 124 | 113 | 96 | 22 | 406 | 158 | 51 | 4 | (432) | 842 | (70) | (29) | 3,003 | 2,098 | 1,383 |
| Income tax expense (benefit) | Income tax expense (benefit) | 255 | 246 | 215 | 25 | 21 | 84 | 44 | (44) | 5 | (114) | (66) | 129 | (7) | (36) | 498 | 190 | 90 | Income tax expense (benefit) | 358 | 255 | 246 | 28 | 25 | 21 | 3 | 84 | 44 | 14 | 5 | (114) | 84 | 129 | (7) | 487 | 498 | 190 |
| Net income (loss) | Net income (loss) | $1,390 | $1,344 | $1,185 | $88 | $75 | $71 | $322 | $114 | $67 | $(1) | $(318) | $(175) | $(199) | $(22) | $(4) | $1,600 | $1,193 | $1,144 | Net income (loss) | $1,606 | $1,390 | $1,344 | $96 | $88 | $75 | $19 | $322 | $114 | $37 | $(1) | $(318) | $758 | $(199) | $(22) | $2,516 | $1,600 | $1,193 |
| Income (loss) attributable to non-controlling interest | Income (loss) attributable to non-controlling interest | — | — | — | (60) | (152) | 43 | — | (2) | — | — | 1 | — | (60) | (153) | 43 | Income (loss) attributable to non-controlling interest | — | — | — | (3) | (60) | (152) | — | — | (2) | — | — | 1 | (3) | (60) | (153) |
| Net income (loss) from common stock | Net income (loss) from common stock | $1,390 | $1,344 | $1,185 | $88 | $75 | $71 | $382 | $266 | $24 | $(1) | $(316) | $(175) | $(199) | $(23) | $(4) | $1,660 | $1,346 | $1,101 | Net income (loss) from common stock | $1,606 | $1,390 | $1,344 | $96 | $88 | $75 | $22 | $382 | $266 | $37 | $(1) | $(316) | $758 | $(199) | $(23) | $2,519 | $1,660 | $1,346 |
IncludesOther includes the parent company, Con Edison’s tax equity investments, the deferred project held for sale and consolidation adjustments. See Note X to the financial statements in Item 8.(b) Represents the consolidated results of operations of Con Edison and its businesses.
(c) For the year ended December 31, 2021, Con Edison Transmission recorded a $5 million loss related to a goodwill impairment on its investment in Honeoye. See Note K to the financial statements in Item 8.
(d) For the year ended December 31, 2021, Con Edison Transmission recorded pre-tax impairment losses of $212 million ($147 million, after-tax) on its investment in Stagecoach and during 2021 completed the sale of its interest in Stagecoach. For the year ended December 31, 2021, Con Edison Transmission recorded a pre-tax impairment loss of $231 million ($162 million, after-tax), to reduce the carrying value of its investment in MVP from $342 million to $111 million. See “Investments - 2020 and 2021 Partial Impairments of Investment“Investment in Mountain Valley Pipeline, LLC (MVP)” in Note A to the financial statements in Item 8.For the year ended December 31, 2020,
(e) On March 1, 2023, Con Edison Transmission recorded a pre-tax impairment losscompleted the sale of $320 million ($223 million, after-tax), to reduceall of the carrying valuestock of its investment in MVP from $662 million to $342 million. See “Investments - 2020 and 2021 Partial Impairments of Investment in Mountain Valley Pipeline, LLC (MVP)” in Note A to the financial statements in Item 8.
(e) The Clean Energy Businesses were classified as held for sale as of December 31, 2022.Businesses. See “Assets and Liabilities Held for Sale” in Note AW and Note X to the financial statements in Item 8.
| | | | | |
CON EDISON ANNUAL REPORT 20222023 | 6357 |
Year Ended December 31, 20222023 Compared with Year Ended December 31, 20212022
CECONY
| | | | For the Year Ended December 31, 2022 | | For the Year Ended December 31, 2021 | | | For the Year Ended December 31, 2023 | | For the Year Ended December 31, 2022 | |
| (Millions of Dollars) | (Millions of Dollars) | Electric | Gas | Steam | 2022 Total | Electric | Gas | Steam | 2021 Total | 2022-2021 Variation | (Millions of Dollars) | Electric | Gas | Steam | 2023 Total | Electric | Gas | Steam | 2022 Total | 2023-2022 Variation |
| Operating revenues | Operating revenues | $9,751 | $2,924 | $593 | $13,268 | $8,806 | $2,378 | $532 | $11,716 | $1,552 | Operating revenues | $10,078 | $2,829 | $569 | $13,476 | $9,751 | $2,924 | $593 | $13,268 | $208 |
| Purchased power | Purchased power | 2,137 | — | 64 | 2,201 | 1,588 | — | 45 | 1,633 | 568 | Purchased power | 2,254 | — | 40 | 2,294 | 2,137 | — | 64 | 2,201 | 93 |
| Fuel | Fuel | 246 | — | 110 | 356 | 156 | — | 73 | 229 | 127 | Fuel | 157 | — | 125 | 282 | 246 | — | 110 | 356 | (74) |
| Gas purchased for resale | Gas purchased for resale | — | 869 | — | 869 | — | 541 | — | 541 | 328 | Gas purchased for resale | — | 677 | — | 677 | — | 869 | — | 869 | (192) |
| Other operations and maintenance | Other operations and maintenance | 2,373 | 472 | 197 | 3,042 | 1,919 | 368 | 165 | 2,452 | 590 | Other operations and maintenance | 2,417 | 527 | 231 | 3,175 | 2,373 | 472 | 197 | 3,042 | 133 |
| Depreciation and amortization | Depreciation and amortization | 1,315 | 367 | 96 | 1,778 | 1,286 | 326 | 93 | 1,705 | 73 | Depreciation and amortization | 1,395 | 429 | 100 | 1,924 | 1,315 | 367 | 96 | 1,778 | 146 |
| Taxes, other than income taxes | Taxes, other than income taxes | 2,184 | 556 | 147 | 2,887 | 2,055 | 497 | 144 | 2,696 | 191 | Taxes, other than income taxes | 2,287 | 514 | 146 | 2,947 | 2,184 | 556 | 147 | 2,887 | 60 |
| Operating income | Operating income | $1,496 | $660 | $(21) | $2,135 | $1,802 | $646 | $12 | $2,460 | $(325) | Operating income | $1,568 | $682 | $(73) | $2,177 | $1,496 | $660 | $(21) | $2,135 | $42 |
Electric
CECONY’s results of electric operations for the year ended December 31, 20222023 compared with the year ended December 31, 20212022 were as follows:
| | | | For the Years Ended December 31, | | For the Years Ended December 31, |
| (Millions of Dollars) | (Millions of Dollars) | 2022 | 2021 | Variation | (Millions of Dollars) | 2023 | 2022 | Variation |
| Operating revenues | Operating revenues | $9,751 | $8,806 | $945 | Operating revenues | $10,078 | $9,751 | $327 |
| Purchased power | Purchased power | 2,137 | 1,588 | 549 | Purchased power | 2,254 | 2,137 | 117 |
| Fuel | Fuel | 246 | 156 | 90 | Fuel | 157 | 246 | (89) |
| Other operations and maintenance | Other operations and maintenance | 2,373 | 1,919 | 454 | Other operations and maintenance | 2,417 | 2,373 | 44 |
| Depreciation and amortization | Depreciation and amortization | 1,315 | 1,286 | 29 | Depreciation and amortization | 1,395 | 1,315 | 80 |
| Taxes, other than income taxes | Taxes, other than income taxes | 2,184 | 2,055 | 129 | Taxes, other than income taxes | 2,287 | 2,184 | 103 |
| Electric operating income | Electric operating income | $1,496 | $1,802 | $(306) | Electric operating income | $1,568 | $1,496 | $72 |
CECONY’s electric sales and deliveries in 20222023 compared with 20212022 were:
| | | | Millions of kWh Delivered | | Revenues in Millions (a) | | Millions of kWh Delivered | | Revenues in Millions (a) |
| | | For the Years Ended | | | For the Years Ended | | | For the Years Ended | | | For the Years Ended | |
| Description | Description | December 31, 2022 | December 31, 2021 | Variation | Percent Variation | | December 31, 2022 | December 31, 2021 | Variation | Percent Variation | Description | December 31, 2023 | December 31, 2022 | Variation | Percent Variation | | December 31, 2023 | December 31, 2022 | Variation | Percent Variation |
| Residential/Religious (b) | Residential/Religious (b) | 11,875 | 11,344 | 531 | | 4.7 | % | | $3,416 | $3,100 | $316 | 10.2 | % | Residential/Religious (b) | 11,574 | 11,875 | (301) | | (2.5) | (2.5) | % | | $3,483 | $3,416 | $67 | 2.0 | % |
| Commercial/Industrial | Commercial/Industrial | 10,522 | 9,250 | 1,272 | 13.8 | | | 2,740 | 2,174 | 566 | 26.0 | |
| Retail choice customers | Retail choice customers | 21,116 | 21,549 | (433) | (2.0) | | | 2,526 | 2,613 | (87) | (3.3) | |
| NYPA, Municipal Agency and other sales | NYPA, Municipal Agency and other sales | 9,507 | 9,185 | 322 | 3.5 | | | 751 | 708 | 43 | 6.1 | |
| Other operating revenues (c) | Other operating revenues (c) | — | — | | — | | 318 | 211 | 107 | 50.7 | |
| Total | Total | 53,020 | 51,328 | 1,692 | | 3.3 | % | (d) | $9,751 | $8,806 | $945 | 10.7 | % | Total | 52,256 | 53,020 | (764) | | (1.4) | (1.4) | % | (d) | $10,078 | $9,751 | $327 | 3.4 | % |
(a)Revenues from electric sales are subject to a revenue decoupling mechanism, as a result of which, delivery revenues are generally not affected by changes in delivery volumes from levels assumed when rates were approved.
(b)“Residential/Religious” generally includes single-family dwellings, individual apartments in multi-family dwellings, religious organizations and certain other not-for-profit organizations.
(c)Other electric operating revenues generally reflect changes in the revenue decoupling mechanism current asset or regulatory liability and changes in regulatory assets and liabilities in accordance with other provisions of the company’sCECONY’s rate plan.
(d)After adjusting for variations, primarily weather and billing days, electric delivery volumes in the company’sCECONY’s service area increased 3.3 0.7 percent in 20222023 compared with 2021. See “Coronavirus Disease 2019 (COVID-19) Impacts,” above.2022.
Operating revenues increased $945$327 million in 20222023 compared with 20212022 primarily due to higher purchased power expenses ($549 million), higheran increase in revenues from the electric rate plan ($279374 million) and higher purchased power expenses ($117 million), offset in part by lower fuel expenses ($9089 million) and lower unbilled revenue accrual ($80 million).
Purchased power expenses increased $549$117 million in 20222023 compared with 20212022 due to higher unit costs ($400163 million) and, offset in part by lower purchased volume ($14946 million).
| | | | | |
6458
|
20222023 |
Fuel expenses increased $90decreased $89 million in 20222023 compared with 20212022 due to higherlower unit costs ($10694 million), offset in part by lowerhigher purchased volumes from the company’s electric generating facilities ($165 million).
Other operations and maintenance expenses increased $454$44 million in 20222023 compared with 20212022 primarily due to higher costs for pension and other postretirement benefits ($355 million), higher stock-based compensation ($19 million), higher total surcharges for assessments and fees that are collected in revenues from customers ($1921 million), higher municipal infrastructure support costselectric operations maintenance activities ($13 million), higher uncollectible expense ($8 million) and higher health care costs for injuries and damages ($62 million).
Depreciation and amortization increased $29$80 million in 20222023 compared with 20212022 primarily due to higher electric utility plant balances.
Taxes, other than income taxes increased $129$103 million in 20222023 compared with 20212022 primarily due to higher property taxes ($75138 million), a higher deferral to levelize the customer bill impact of the electric rate plan ($15 million) and higher payroll taxes ($6 million), offset in part by a lower deferral of over-collected property taxes ($27 million) and higher state and local taxes ($2455 million).
Gas
CECONY’s results of gas operations for the year ended December 31, 20222023 compared with the year ended December 31, 20212022 were as follows:
| | | | For the Years Ended December 31, | | For the Years Ended December 31, |
| (Millions of Dollars) | (Millions of Dollars) | 2022 | 2021 | Variation | (Millions of Dollars) | 2023 | 2022 | Variation |
| Operating revenues | Operating revenues | $2,924 | $2,378 | $546 | Operating revenues | $2,829 | $2,924 | $(95) |
| Gas purchased for resale | Gas purchased for resale | 869 | 541 | 328 | Gas purchased for resale | 677 | 869 | (192) |
| Other operations and maintenance | Other operations and maintenance | 472 | 368 | 104 | Other operations and maintenance | 527 | 472 | 55 |
| Depreciation and amortization | Depreciation and amortization | 367 | 326 | 41 | Depreciation and amortization | 429 | 367 | 62 |
| Taxes, other than income taxes | Taxes, other than income taxes | 556 | 497 | 59 | Taxes, other than income taxes | 514 | 556 | (42) |
| Gas operating income | Gas operating income | $660 | $646 | $14 | Gas operating income | $682 | $660 | $22 |
CECONY’s gas sales and deliveries, excluding off-system sales, in 20222023 compared with 20212022 were:
| | | | Thousands of Dt Delivered | | Revenues in Millions (a) | | Thousands of Dt Delivered | | Revenues in Millions (a) |
| | | For the Years Ended | | | For the Years Ended | | | For the Years Ended | | | For the Years Ended | |
| Description | Description | December 31, 2022 | December 31, 2021 | Variation | Percent Variation | | December 31, 2022 | December 31, 2021 | Variation | Percent Variation | Description | December 31, 2023 | December 31, 2022 | Variation | Percent Variation | | December 31, 2023 | December 31, 2022 | Variation | Percent Variation |
| Residential | Residential | 51,580 | | 50,690 | | 890 | | 1.8 | % | | $1,272 | $1,050 | $222 | 21.1 | % | Residential | 45,741 | | 51,580 | 51,580 | | (5,839) | (5,839) | | (11.3) | (11.3) | % | | $1,218 | $1,272 | $(54) | (4.2) | % |
| General | General | 33,666 | | 30,947 | | 2,719 | | 8.8 | | | 578 | 423 | 155 | 36.6 | |
| Firm retail choice customers | 75,172 | | 76,765 | | (1,593) | | (2.1) | | | 798 | 704 | 94 | 13.4 | |
| Total firm sales and firm retail choice | 160,418 | | 158,402 | | 2,016 | | 1.3 | | (b) | $2,648 | $2,177 | $471 | 21.6 | |
| Firm transportation | |
| Total firm sales and transportation | |
| Interruptible sales (c) | Interruptible sales (c) | 6,098 | | 5,927 | | 171 | | 2.9 | % | | 51 | 29 | 22 | 75.9 | % | Interruptible sales (c) | 7,892 | | 6,098 | 6,098 | | 1,794 | 1,794 | | 29.4 | 29.4 | % | | 49 | 51 | (2) | (3.9) | % |
| NYPA | NYPA | 45,085 | | 43,094 | | 1,991 | | 4.6 | | | 2 | 2 | — | — | NYPA | 53,541 | | 45,085 | 45,085 | | 8,456 | 8,456 | | 18.8 | 18.8 | | | 2 | | 2 | 2 | — |
| Generation plants | Generation plants | 53,262 | | 47,620 | | 5,642 | | 11.8 | | | 30 | 25 | 5 | 20.0 | |
| Other | Other | 19,186 | | 20,251 | | (1,065) | | (5.3) | | | 34 | 34 | — | — | Other | 18,925 | | 19,186 | 19,186 | | (261) | (261) | | (1.4) | (1.4) | | | 34 | | 34 | 34 | — | — |
| Other operating revenues (d) | Other operating revenues (d) | — | | — | | — | | — | | 159 | 111 | 48 | 43.2 | |
| Total | Total | 284,049 | | 275,294 | | 8,755 | | 3.2 | % | | $2,924 | $2,378 | $546 | 23.0 | % | Total | 292,076 | | 284,049 | 284,049 | | 8,027 | 8,027 | | 2.8 | 2.8 | % | | $2,829 | $2,924 | $(95) | (3.2) | % |
(a)Revenues from gas sales are subject to a weather normalization clause and a revenue decoupling mechanism, as a result of which, delivery revenues are generally not affected by changes in delivery volumes from levels assumed when rates were approved.
(b)After adjusting for variations, primarily billing days, firm gas sales and firm retail choicetransportation volumes in the company’sCECONY’s service area increased 0.40.9 percent in 20222023 compared with 2021. See “Coronavirus Disease 2019 (COVID-19) Impacts,” above.2022.
(c)Includes 2,0152,574 thousands and 1,9212,015 thousands of Dt for 2023 and 2022, and 2021, respectively, whichthat are also reflected in firm retail choice customerstransportation and other.
(d)Other gas operating revenues generally reflect changes in the revenue decoupling mechanism and weather normalization clause current asset or regulatory liability and changes in regulatory assets and liabilities in accordance with other provisions of the company’sCECONY’s rate plans. See Note B to the financial statements in Item 8.
Operating revenues increased $546decreased $95 million in 20222023 compared with 20212022 primarily due to higherlower gas purchased for resale expense ($328192 million) and higher, offset in part by an increase in gas revenues under the company's gas rate plan ($20789 million) and higher unbilled revenue accrual ($13 million).
Gas purchased for resale decreased $192 million in 2023 compared with 2022 due to lower purchased volumes ($152 million) and unit costs ($40 million).
| | | | | |
CON EDISON ANNUAL REPORT 20222023 | 6559 |
Gas purchased for resale
increased $328 million in 2022 compared with 2021 due to higher unit costs ($273 million) and higher purchased volumes ($55 million).
Other operations and maintenance expenses increased $104$55 million in 20222023 compared with 20212022 primarily due to higher gas operations costs for pension($50 million) and other postretirement benefits ($73 million), higher municipal infrastructure support ($6 million), higher stock-based compensation ($4 million), higher uncollectible expense ($2 million), higher total surcharges for assessments and fees that are collected in revenues from customers ($2 million) and higher costs for injuries and damages ($1 million).
Depreciation and amortization increased $41$62 million in 20222023 compared with 20212022 primarily due to higher gas utility plant balances.
Taxes, other than income taxes increased $59decreased $42 million in 20222023 compared with 20212022 primarily due to highera lower deferral of over-collected property taxes ($2335 million) and a lower deferral to levelize the customer bill impact of the gas rate plan ($51 million), offset in part by higher property taxes ($23 million) and higher state and local taxes ($1341 million).
Steam
CECONY’s results of steam operations for the year ended December 31, 20222023 compared with the year ended December 31, 20212022 were as follows:
| | | | For the Years Ended December 31, | | For the Years Ended December 31, |
| (Millions of Dollars) | (Millions of Dollars) | 2022 | 2021 | Variation | (Millions of Dollars) | 2023 | 2022 | Variation |
| Operating revenues | Operating revenues | $593 | $532 | $61 | Operating revenues | $569 | $593 | $(24) |
| Purchased power | Purchased power | 64 | 45 | 19 | Purchased power | 40 | 64 | (24) |
| Fuel | Fuel | 110 | 73 | 37 | Fuel | 125 | 110 | 15 |
| Other operations and maintenance | Other operations and maintenance | 197 | 165 | 32 | Other operations and maintenance | 231 | 197 | 34 |
| Depreciation and amortization | Depreciation and amortization | 96 | 93 | 3 | Depreciation and amortization | 100 | 96 | 4 |
| Taxes, other than income taxes | Taxes, other than income taxes | 147 | 144 | 3 | Taxes, other than income taxes | 146 | 147 | (1) |
| Steam operating income | Steam operating income | $(21) | $12 | $(33) | Steam operating income | $(73) | $(21) | $(52) |
CECONY’s steam sales and deliveries in 20222023 compared with 20212022 were:
| | | | Millions of Pounds Delivered | | Revenues in Millions | | Millions of Pounds Delivered | | Revenues in Millions (a) |
| | | For the Years Ended | | | For the Years Ended | | | For the Years Ended | | | For the Years Ended | |
| Description | Description | December 31, 2022 | December 31, 2021 | Variation | Percent Variation | | December 31, 2022 | December 31, 2021 | Variation | Percent Variation | Description | December 31, 2023 | December 31, 2022 | Variation | Percent Variation | | December 31, 2023 | December 31, 2022 | Variation | Percent Variation |
| General | General | 513 | | 504 | | 9 | | 1.8 | % | | $27 | $25 | $2 | 8.0 | % | General | 428 | | 513 | 513 | | (85) | (85) | | (16.6) | (16.6) | % | | $25 | $27 | $(2) | (7.4) | % |
| Apartment house | Apartment house | 5,122 | | 5,013 | | 109 | | 2.2 | | | 155 | 137 | 18 | 13.1 | |
| Annual power | Annual power | 11,792 | | 11,367 | | 425 | | 3.7 | | | 391 | 340 | 51 | 15.0 | |
| Other operating revenues (a) | — | | — | | — | | — | | 20 | 30 | (10) | (33.3) | |
| Other operating revenues (b) | |
| Total | Total | 17,427 | | 16,884 | | 543 | | 3.2 | % | (b) | $593 | $532 | $61 | 11.5 | % | Total | 15,444 | | 17,427 | 17,427 | | (1,983) | (1,983) | | (11.4) | (11.4) | % | (c) | $569 | $593 | $(24) | (4.0) | % |
(a)Effective November 1, 2023, revenues from steam sales are subject to a weather normalization clause, as a result of which, delivery revenues reflect normal weather conditions during the heating season.
(b)Other steam operating revenues generally reflect changes in regulatory assets and liabilities in accordance with the company’sCECONY’s rate plan. See Note B to the financial statements in Item 8.
(b)(c)After adjusting for variations, primarily weather prior to November 1, 2023, and billing days, steam sales and deliveries in the company’s service area increasdecreased 1.10.1 percent in 20222023 compared with 2021. See “Coronavirus Disease 2019 (COVID-19) Impacts,” above.2022.
Operating revenues increased $61decreased $24 million in 20222023 compared with 20212022 primarily due to higher fuel expenses ($37 million), higherlower purchased power expenses ($1924 million) and the impact of colder wintermilder than normal weather ($827 million), offset in part by higher fuel expenses ($15 million), benefit from the new steam rate plan ($11 million) and tax law sur-credit ($4 million).
Purchased power expenses increased $19decreased $24 million in 20222023 compared with 20212022 due to higherlower unit costs ($2326 million), offset in part by lowerhigher purchased volumes ($42 million).
Fuel expenses increased $37$15 million in 20222023 compared with 20212022 due to higher unit costs ($2838 million) and higher, offset in part by lower purchased volumes from the company’s steam generating facilities ($923 million).
Other operations and maintenance expenses increased $32$34 million in 20222023 compared with 20212022 primarily due to higher costs for pension and other postretirement benefits, reflecting reconciliation to the rate plan level ($3016 million), higher steam operations maintenance activities ($9 million) and higher stock-based compensationan increase in municipal infrastructure support ($25 million).
Depreciation and amortization increased $3$4 million in 20222023 compared with 20212022 primarily due to higher steam utility plant balances.
| | | | | |
6660
|
20222023 |
Taxes, other than income taxes
increased $3 million in 2022 compared with 2021 primarily due to higher property taxes ($5 million) and higher state and local taxes ($2 million), offset in part by higher deferral of under-collected property taxes ($5 million).
Taxes, Other Than Income Taxes
At $2,887$2,946 million, taxes other than income taxes remain one of CECONY’s largest operating expenses. The principal components of, and variations in, taxes other than income taxes were:
| | For the Years Ended December 31, | |
| For the Years Ended December 31, | |
| (Millions of Dollars) | |
| (Millions of Dollars) | |
| (Millions of Dollars) | (Millions of Dollars) | 2022 | | 2021 | | Variation | |
| Property taxes | Property taxes | $2,318 | | $2,215 | | $103 | |
| Property taxes | |
| Property taxes | |
| State and local taxes related to revenue receipts | |
| State and local taxes related to revenue receipts | |
| State and local taxes related to revenue receipts | State and local taxes related to revenue receipts | 411 | | 373 | | 38 | |
| Payroll taxes | Payroll taxes | 70 | | 65 | | 5 | |
| Payroll taxes | |
| Payroll taxes | |
| Other taxes | |
| Other taxes | |
| Other taxes | Other taxes | 88 | | 43 | | 45 | |
| Total | Total | $2,887 | (a) | $2,696 | (a) | $191 | |
| Total | |
| Total | |
(a)Including sales tax on customers’ bills, total taxes other than income taxes in 2023 and 2022 and 2021 werewere $3,652 million and $3,548 million and $3,296 million, respectively.
Other Income (Deductions)
Other deductionsincome increased $440$400 million in 20222023 compared with 20212022 primarily due to higherlower costs associated with components of pension and other postretirement benefits other than service cost ($458 million), offset in part by lower expenses resulting from investment performance in a deferred income plan ($19 million).
Net Interest Expense
Net interest expense increased $60 million in 2022 compared with 2021 primarily due to higher interest on long-term debt ($49370 million) and higher interest on short-term debt ($29 million), offset in part by an increase in the allowance for borrowed funds used during construction ($22 million).
Income Tax Expense
Income taxes increased $9 million in 2022 compared with 2021 primarily due to higher income before income tax expense ($11 million) and higher state income taxes ($3 million), offset in part by higher research and development creditsaccrual from prior years ($5 million).
O&R
| | | | | | | | | | | | | | | | | | | | | | | |
| | For the Year Ended December 31, 2022 | | For the Year Ended December 31, 2021 | | |
| (Millions of Dollars) | Electric | Gas | 2022 Total | Electric | Gas | 2021 Total | 2022-2021
Variation |
| Operating revenues | $773 | $312 | $1,085 | $681 | $260 | $941 | $144 |
| Purchased power | 276 | — | | 276 | 206 | — | | 206 | 70 |
| Gas purchased for resale | — | | 135 | 135 | — | | 88 | 88 | 47 |
| Other operations and maintenance | 275 | 76 | 351 | 249 | 64 | 313 | 38 |
| Depreciation and amortization | 71 | 27 | 98 | 69 | 26 | 95 | 3 |
| Taxes, other than income taxes | 57 | 32 | 89 | 57 | 32 | 89 | — |
| Operating income | $94 | $42 | $136 | $100 | $50 | $150 | $(14) |
| | | | | |
CON EDISON ANNUAL REPORT 2022 | 67 |
Electric
O&R’s results of electric operations for the year ended December 31, 2022 compared with the year ended December 31, 2021 were as follows:
| | | | | | | | | | | |
| | For the Years Ended December 31, |
| (Millions of Dollars) | 2022 | 2021 | Variation |
| Operating revenues | $773 | $681 | $92 |
| Purchased power | 276 | 206 | 70 |
| Other operations and maintenance | 275 | 249 | 26 |
| Depreciation and amortization | 71 | 69 | 2 |
| Taxes, other than income taxes | 57 | 57 | — |
| Electric operating income | $94 | $100 | $(6) |
O&R’s electric sales and deliveries in 2022 compared with 2021 were:
| | | | | | | | | | | | | | | | | | | | | | | | | | | | | |
| | Millions of kWh Delivered | | Revenues in Millions (a) |
| | For the Years Ended | | | For the Years Ended | |
| Description | December 31, 2022 | December 31, 2021 | Variation | Percent Variation | | December 31, 2022 | December 31, 2021 | Variation | Percent Variation |
| Residential/Religious (b) | 1,916 | | 1,742 | | 174 | | 10.0 | % | | $413 | $331 | $82 | 24.8 | % |
| Commercial/Industrial | 944 | | 850 | | 94 | | 11.1 | | | 147 | 111 | 36 | 32.4 | |
| Retail choice customers | 2,580 | | 2,839 | | (259) | | (9.1) | | | 198 | 223 | (25) | (11.2) | |
| Public authorities | 113 | | 110 | | 3 | | 2.7 | | | 16 | 11 | 5 | 45.5 | |
| Other operating revenues (c) | — | | — | | — | | — | | (1) | 5 | (6) | Large |
| Total | 5,553 | | 5,541 | | 12 | | 0.2 | % | (d) | $773 | $681 | $92 | 13.5 | % |
(a)O&R’s NY electric delivery revenues are subject to a revenue decoupling mechanism, as a result of which delivery revenues are generally not affected by changes in delivery volumes from levels assumed when rates were approved. Effective July 2021, the majority of O&R’s electric distribution revenues in NJ are subject to a conservation incentive program, as a result of which distribution revenues are generally not affected by changes in delivery volumes from levels assumed when rates were approved. O&R’s electric transmission revenues in NJ are not subject to a conservation incentive program, and as a result, changes in such volumes do impact revenues.
(b)“Residential/Religious” generally includes single-family dwellings, individual apartments in multi-family dwellings, religious organizations and certain other not-for-profit organizations.
(c)Other electric operating revenues generally reflect changes in the revenue decoupling mechanism current asset or regulatory liability in accordance with the company’s NY electric rate plan and changes in regulatory assets and liabilities in accordance with the company’s electric rate plans. See Note B to the financial statements in Item 8.
(d)After adjusting for weather and other variations, electric delivery volumes in company’s service area increased 1.5 percent in 2022 compared with 2021. See “Coronavirus Disease 2019 (COVID-19) Impacts,” above.
Operating revenues increased $92 million in 2022 compared with 2021 primarily due to higher purchased power expenses ($70 million) and higher revenues from the NY electric rate plan ($18 million).
Purchasedpower expenses increased $70 million in 2022 compared with 2021 due to higher unit costs ($59 million) and purchased volumes ($11 million).
Other operations and maintenance expenses increased $26 million in 2022 compared with 2021 primarily due to higher pension costs ($13 million), increased regulatory amortizations ($11 million) and higher stock-based compensation ($2 million).
Depreciation and amortization increased $2 million in 2022 compared with 2021 primarily due to higher electric utility plant balances.
Gas
O&R’s results of gas operations for the year ended December 31, 2022 compared with the year ended December 31, 2021 were as follows:
| | | | | |
68
|
CON EDISON ANNUAL REPORT 2022 |
| | | | | | | | | | | |
| | For the Years Ended December 31, |
| (Millions of Dollars) | 2022 | 2021 | Variation |
| Operating revenues | $312 | $260 | $52 |
| Gas purchased for resale | 135 | 88 | 47 |
| Other operations and maintenance | 76 | 64 | 12 |
| Depreciation and amortization | 27 | 26 | 1 |
| Taxes, other than income taxes | 32 | 32 | — |
| Gas operating income | $42 | $50 | $(8) |
O&R’s gas sales and deliveries, excluding off-system sales, in 2022 compared with 2021 were:
| | | | | | | | | | | | | | | | | | | | | | | | | | | | | |
| | Thousands of Dt Delivered | | Revenues in Millions (a) |
| | For the Years Ended | | | For the Years Ended | |
| Description | December 31, 2022 | December 31, 2021 | Variation | Percent
Variation | | December 31, 2022 | December 31, 2021 | Variation | Percent Variation |
| Residential | 12,588 | | 11,500 | | 1,088 | | 9.5 | % | | $207 | $162 | $45 | 27.8 | % |
| General | 2,766 | | 2,498 | | 268 | | 10.7 | | | 38 | 28 | 10 | 35.7 | |
| Firm retail choice customers | 6,396 | | 7,584 | | (1,188) | | (15.7) | | | 45 | 55 | (10) | (18.2) | |
| Total firm sales and firm retail choice | 21,750 | | 21,582 | | 168 | | 0.8 | | (b) | 290 | 245 | 45 | 18.4 | |
| Interruptible sales | 3,911 | | 3,820 | | 91 | | 2.4 | % | | 6 | 6 | — | — |
| Generation plants | 10 | | 26 | | (16) | | (61.5) | | | — | — | — | — |
| Other | 673 | | 468 | | 205 | | 43.8 | | | 1 | 1 | | — | — |
| Other gas revenues | — | | — | | — | | — | | 15 | 8 | 7 | 87.5 | |
| Total | 26,344 | | 25,896 | | 448 | | 1.7 | % | | $312 | $260 | $52 | 20.0 | % |
(a)Revenues from NY gas sales are subject to a weather normalization clause and a revenue decoupling mechanism, as a result of which, delivery revenues are generally not affected by changes in delivery volumes from levels assumed when rates were approved.
(b)After adjusting for weather and other variations, firm sales and firm retail choice volumes in the company’s service area increased 1.2 percent in 2022 compared with 2021. See “Coronavirus Disease 2019 (COVID-19) Impacts,” above.
Operating revenues increased $52 million in 2022 compared with 2021 primarily due to higher gas purchased for resale ($47 million) and higher revenues from the NY gas rate plan ($13 million).
Gas purchased for resale increased $47 million in 2022 compared with 2021 due to higher unit costs ($35 million) and purchased volumes ($12 million).
Other operations and maintenance expenses increased $12 million in 2022 compared with 2021 primarily due to higher pension costs ($10 million) and higher stock-based compensation ($1 million).
Depreciation and amortization increased $1 million in 2022 compared with 2021 primarily due to higher gas utility plant balances.
Taxes, Other Than Income Taxes
Taxes, other than income taxes, remained consistent in 2022 compared with 2021. The principal components of taxes, other than income taxes, were:
| | | | | | | | | | | | | | | | | |
| For the Years Ended December 31, |
| (Millions of Dollars) | 2022 | | 2021 | | Variation |
| Property taxes | $69 | | $71 | | $(2) |
| State and local taxes related to revenue receipts | 12 | | 11 | | 1 | |
| Payroll taxes | 8 | | 7 | | 1 | |
| Total | $89 | (a) | $89 | (a) | $— | |
(a)Including sales tax on customers’ bills, total taxes other than income taxes in 2022 and 2021 were $131 million and $129 million, respectively.
Income Tax Expense
Income taxes increased $4 million in 2022 compared with 2021 primarily due to higher income before income tax expense ($4 million) and higher state income taxes ($2 million), offset in part by an increase in the amortization of excess deferred federal income taxes ($2 million).
| | | | | |
CON EDISON ANNUAL REPORT 2022 | 69 |
Clean Energy Businesses
The Clean Energy Businesses were classified as held for sale as of December 31, 2022. See “Assets and Liabilities Held for Sale” in Note A and Note X to the financial statements in Item 8. The Clean Energy Businesses’ results of operations for the year ended December 31, 2022 compared with the year ended December 31, 2021 were as follows:
| | | | | | | | | | | |
| | For the Years Ended December 31, |
| (Millions of Dollars) | 2022 | 2021 | Variation |
| Operating revenues | $1,319 | $1,022 | $297 |
| Purchased power | 7 | — | | 7 |
| Gas purchased for resale | 241 | 62 | 179 |
| Other operations and maintenance | 504 | 475 | 29 |
| Depreciation and amortization | 178 | 231 | (53) |
| Taxes, other than income taxes | 21 | 18 | 3 |
| | | |
| Operating income | $368 | $236 | $132 |
Operating revenues increased $297 million in 2022 compared with 2021 primarily due to higher wholesale revenues ($195 million), higher revenue from renewable electric projects ($92 million) and higher net mark-to-market values ($21 million), offset in part by lower energy services revenues ($11 million).
Gas purchased for resale increased $179 million in 2022 compared with 2021 primarily due to higher purchased volumes.
Depreciation and amortization decreased $53 million in 2022 compared with 2021 primarily due to the company ceasing to record depreciation and amortization in 2022 as the Clean Energy Businesses were classified as held for sale as of December 31, 2022. See “Assets and Liabilities Held for Sale” in Note A and Note X to the financial statements in Item 8.
Other operations and maintenance expenses increased $29 million in 2022 compared with 2021 primarily due to higher costs from engineering, procurement and construction of renewable electric projects for customers.
Other Income (Deductions)
Other income (deductions) decreased $13 million in 2022 compared with 2021 primarily due to lower income in the 2022 period from an equity method investment in renewable electric projects accounted for under the HLBV method of accounting.
Net Interest Expense
Net interest expense decreased $103 million in 2022 compared with 2021 primarily due to higher unrealized gains on interest rate swaps in the 2022 period.
Income Tax Expense
Income taxes increased $40 million in 2022 compared with 2021 primarily due to higher income before income tax expense ($50 million), higher state income taxes ($6 million), lower research and development credits ($3 million) and an increase in the reserve for uncertain tax positions ($5 million), offset in part by a lower loss attributable to non-controlling interest ($20 million) and higher renewable energy creditshedging activities ($4 million).
Income (Loss) Attributable to Non-Controlling Interest
Income attributable to non-controlling interest decreased $92 million in 2022 compared with 2021 primarily due to lower income in the 2021 period attributable to a tax equity investor in renewable electric projects accounted for under the HLBV method of accounting. See Note S to the financial statements in Item 8.
Con Edison Transmission
Other operations and maintenance decreased $6 million in 2022 compared with 2021 primarily due to a goodwill impairment loss on its investment in Honeoye in 2021. See Note K to the financial statements in Item 8.
Other Income (Deductions)
Other deductions decreased $426 million in 2022 compared with 2021 primarily due to losses in 2021 from CET’s pre-tax impairment loss of ($212 million) on its investment in Stagecoach, pre-tax impairment loss of ($231 million)
| | | | | |
70
|
CON EDISON ANNUAL REPORT 2022 |
on its investment in MVP in 2021, lower investment income in 2022 due to the sale of Stagecoach during 2021 ($19 million), offset in part by higher investment income from NY Transco ($4 million). See "Critical Accounting Estimates - Investments" in Item 7 and "Investments" in Note A and Note W to the financial statement in Item 8.
Net Interest Expense
Net interest expense decreased $4 million in 2022 compared with 2021 primarily due to the repayment of an intercompany loan from the parent company from a portion of the proceeds from the sale of Stagecoach in 2021.
Income Tax Expense
Income taxes increased $119 million in 2022 compared with 2021 primarily due to higher income before income tax expense ($91 million), higher state income taxes ($27 million) and a remeasurement of deferred state income tax assets and liabilities ($3 million), offset in part by lower amortization of excess deferred federal income taxes ($2 million).
Other
Taxes, Other Than Income Taxes
Taxes, other than income taxesincreased $1 million in 2022 compared with 2021 primarily due to the settlement in 2022 of the NYC capital tax audit for the years 2015 through 2018 ($1 million).
Other Income (Deductions)
Other income (deductions) decreased $50 million in 2022 compared with 2021 primarily due to the transaction costs at the parent company incurred from the sale of the Clean Energy Businesses ($49 million). See “Assets and Liabilities Held for Sale” in Note A and Note X to the financial statements in Item 8.
Income Tax Expense
Income taxes increased $136 million in 2022 compared with 2021 primarily due to higher consolidated state income taxes ($17 million), an increase in the valuation allowance on state and local net operating loss carryovers ($8 million) and a remeasurement of consolidated deferred state income tax assets and liabilities ($120 million), offset in part by lower income before income tax expense ($8 million).
During the fourth quarter of 2022, Con Edison entered into a purchase and sale agreement pursuant to which Con Edison agreed to sell the Clean Energy Businesses. See Note X to the financial statements in Item 8. Con Edison analyzed the potential impact of the anticipated sale on its state apportionment factors and remeasured its consolidated state tax liability. Based on estimates, Con Edison recorded an increase to its net deferred income tax liabilities of $111 million, an increase in the valuation allowance on the deferred tax asset related to state net operating loss carryforwards of $8 million and a corresponding deferred income tax expense of $119 million (net of federal income taxes) in the fourth quarter of 2022. Con Edison also recorded a $9 million expense from a remeasurement of state deferred liability due to other dispositions.
| | | | | |
CON EDISON ANNUAL REPORT 2022 | 71 |
Year Ended December 31, 2021 Compared with Year Ended December 31, 2020
CECONY
| | | | | | | | | | | | | | | | | | | | | | | | | | | | | |
| | For the Year Ended December 31, 2021 | | For the Year Ended December 31, 2020 | | |
| (Millions of Dollars) | Electric | Gas | Steam | 2021 Total | Electric | Gas | Steam | 2020 Total | 2021-2020 Variation |
| Operating revenues | $8,806 | $2,378 | $532 | $11,716 | $8,103 | $2,036 | $508 | $10,647 | $1,069 |
| Purchased power | 1,588 | — | 45 | 1,633 | 1,405 | — | 27 | 1,432 | 201 |
| Fuel | 156 | — | 73 | 229 | 75 | — | 81 | 156 | 73 |
| Gas purchased for resale | — | 541 | — | 541 | — | 426 | — | 426 | 115 |
| Other operations and maintenance | 1,919 | 368 | 165 | 2,452 | 1,753 | 355 | 161 | 2,269 | 183 |
| Depreciation and amortization | 1,286 | 326 | 93 | 1,705 | 1,214 | 294 | 90 | 1,598 | 107 |
| Taxes, other than income taxes | 2,055 | 497 | 144 | 2,696 | 1,925 | 387 | 144 | 2,456 | 240 |
| Operating income | $1,802 | $646 | $12 | $2,460 | $1,731 | $574 | $5 | $2,310 | $150 |
Electric
CECONY’s results of electric operations for the year ended December 31, 2021 compared with the year ended December 31, 2020 were as follows:
| | | | | | | | | | | |
| | For the Years Ended December 31, |
| (Millions of Dollars) | 2021 | 2020 | Variation |
| Operating revenues | $8,806 | $8,103 | $703 |
| Purchased power | 1,588 | 1,405 | 183 |
| Fuel | 156 | 75 | 81 |
| Other operations and maintenance | 1,919 | 1,753 | 166 |
| Depreciation and amortization | 1,286 | 1,214 | 72 |
| Taxes, other than income taxes | 2,055 | 1,925 | 130 |
| Electric operating income | $1,802 | $1,731 | $71 |
CECONY’s electric sales and deliveries in 2021 compared with 2020 were:
| | | | | | | | | | | | | | | | | | | | | | | | | | | | | |
| | Millions of kWh Delivered | | Revenues in Millions (a) |
| | For the Years Ended | | | For the Years Ended | |
| Description | December 31, 2021 | December 31, 2020 | Variation | Percent Variation | | December 31, 2021 | December 31, 2020 | Variation | Percent Variation |
| Residential/Religious (b) | $11,344 | $11,107 | 237 | | 2.1 | % | | $3,100 | $2,901 | $199 | 6.9 | % |
| Commercial/Industrial | 9,250 | 9,280 | (30) | (0.3) | | | 2,174 | 1,876 | 298 | 15.9 | |
| Retail choice customers | 21,549 | 22,000 | (451) | (2.1) | | | 2,613 | 2,391 | 222 | 9.3 | |
| NYPA, Municipal Agency and other sales | 9,185 | 9,184 | 1 | — | | | 708 | 665 | 43 | 6.5 | |
| Other operating revenues (c) | — | — | — | | — | | 211 | 270 | (59) | (21.9) | |
| Total | $51,328 | $51,571 | (243) | | (0.5) | % | (d) | $8,806 | $8,103 | $703 | 8.7 | % |
(a)Revenues from electric sales are subject to a revenue decoupling mechanism, as a result of which, delivery revenues are generally not affected by changes in delivery volumes from levels assumed when rates were approved.
(b)“Residential/Religious” generally includes single-family dwellings, individual apartments in multi-family dwellings, religious organizations and certain other not-for-profit organizations.
(c)Other electric operating revenues generally reflect changes in the revenue decoupling mechanism current asset or regulatory liability and changes in regulatory assets and liabilities in accordance with other provisions of the company’s rate plan.
(d)After adjusting for variations, primarily weather and billing days, electric delivery volumes in the company’s service area decreased 0.2 percent in 2021 compared with 2020. See “Coronavirus Disease 2019 (COVID-19) Impacts,” above.
Operating revenues increased $703 million in 2021 compared with 2020 primarily due to higher revenues from the electric rate plan ($243 million), higher purchased power expenses ($183 million), higher fuel expenses ($81 million), higher late payment charges ($90 million), including charges that are being recovered pursuant to a surcharge mechanism established as a result of the order issued by the NYSPSC in November 2021and resuming billing of late payment charges, and higher incentives earned under the earnings adjustment mechanisms and positive incentives ($30 million).See "COVID-19 Regulatory Matters" in Note B to the financial statements in Item 8.
| | | | | |
72
|
CON EDISON ANNUAL REPORT 2022 |
Purchased power expenses increased $183 million in 2021 compared with 2020 due to higher unit costs ($112 million) and purchased volumes ($72 million).
Fuel expenses increased $81 million in 2021 compared with 2020 due to higher unit costs ($79 million) and higher purchased volumes from the company’s electric generating facilities ($3 million).
Other operations and maintenance expenses increased $166 million in 2021 compared with 2020 primarily due to higher costs for pension and other postretirement benefits ($47 million), higher costs related to heat, storm and emergency response ($50 million), higher stock-based compensation ($24 million), higher healthcare costs ($16 million) and higher municipal infrastructure support costs ($12 million).
Depreciation and amortization increased $72 million in 2021 compared with 2020 primarily due to higher electric utility plant balances.
Taxes, other than income taxes increased $130 million in 2021 compared with 2020 primarily due to lower deferral of under-collected property taxes ($53 million), higher property taxes ($52 million) and higher state and local taxes ($23 million).
CECONY’s results of gas operations for the year ended December 31, 2021 compared with the year ended December 31, 2020 were as follows:
| | | | | | | | | | | |
| | For the Years Ended December 31, |
| (Millions of Dollars) | 2021 | 2020 | Variation |
| Operating revenues | $2,378 | $2,036 | $342 |
| Gas purchased for resale | 541 | 426 | 115 |
| Other operations and maintenance | 368 | 355 | 13 |
| Depreciation and amortization | 326 | 294 | 32 |
| Taxes, other than income taxes | 497 | 387 | 110 |
| Gas operating income | $646 | $574 | $72 |
CECONY’s gas sales and deliveries, excluding off-system sales, in 2021 compared with 2020 were:
| | | | | | | | | | | | | | | | | | | | | | | | | | | | | |
| | Thousands of Dt Delivered | | Revenues in Millions (a) |
| | For the Years Ended | | | For the Years Ended | |
| Description | December 31, 2021 | December 31, 2020 | Variation | Percent Variation | | December 31, 2021 | December 31, 2020 | Variation | Percent Variation |
| Residential | 50,690 | | 48,999 | | 1,691 | | 3.5 | % | | $1,050 | $911 | $139 | 15.3 | % |
| General | 30,947 | | 29,516 | | 1,431 | | 4.8 | | | 423 | 318 | 105 | 33.0 | |
| Firm retail choice customers | 76,765 | | 76,614 | | 151 | | 0.2 | | | 704 | 649 | 55 | 8.5 | |
| Total firm sales and firm retail choice | 158,402 | | 155,129 | | 3,273 | | 2.1 | | (b) | 2,177 | 1,878 | 299 | 15.9 | |
| Interruptible sales (c) | 5,927 | | 8,482 | | (2,555) | | (30.1) | % | | 29 | 27 | 2 | 7.4 | % |
| NYPA | 43,094 | | 41,577 | | 1,517 | | 3.6 | | | 2 | 2 | — | — |
| Generation plants | 47,620 | | 49,723 | | (2,103) | | (4.2) | | | 25 | 22 | 3 | 13.6 | |
| Other | 20,251 | | 20,814 | | (563) | | (2.7) | | | 34 | 33 | 1 | 3.0 | |
| Other operating revenues (d) | — | | — | | — | | — | | 111 | 74 | 37 | 50.0 | |
| Total | 275,294 | | 275,725 | | (431) | | (0.2) | % | | $2,378 | $2,036 | $342 | 16.8 | % |
(a)Revenues from gas sales are subject to a weather normalization clause and a revenue decoupling mechanism, as a result of which, delivery revenues are generally not affected by changes in delivery volumes from levels assumed when rates were approved.
(b)After adjusting for variations, primarily billing days, firm gas sales and firm retail choice volumes in the company’s service area decreased 0.4 percent in 2021 compared with 2020. See “Coronavirus Disease 2019 (COVID-19) Impacts,” above.
(c)Includes 1,921 thousands and 3,510 thousands of Dt for 2021 and 2020, respectively, which are also reflected in firm retail choice customers and other.
(d)Other gas operating revenues generally reflect changes in the revenue decoupling mechanism and weather normalization clause current asset or regulatory liability and changes in regulatory assets and liabilities in accordance with other provisions of the company’s rate plans. See Note B to the financial statements in Item 8.
Operating revenues increased $342 million in 2021 compared with 2020 primarily due to higher gas revenues under the company's gas rate plan ($200 million), higher gas purchased for resale expense ($115 million), higher
| | | | | |
CON EDISON ANNUAL REPORT 2022 | 73 |
late payment charges ($16 million), including charges that are being recovered pursuant to a surcharge mechanism established as a result of the order issued by the NYSPSC in November 2021 and resuming billing of late payment charges, and higher incentives earned under gas adjustment mechanisms (EAMs) ($11 million). See "COVID-19 Regulatory Matters" in Note B to the financial statements in Item 8.
Gas purchased for resale increased $115 million in 2021 compared with 2020 due to higher unit costs ($106 million) and higher purchased volumes ($8 million).
Other operations and maintenance expenses increased $13 million in 2021 compared with 2020 primarily due to higher costs for pension and other postretirement benefits ($10 million), higher total surcharges for assessments and fees that are collected in revenues from customers ($7 million) and higher stock-based compensation ($5 million), offset in part by lower municipal infrastructure support costs ($9 million).
Depreciation and amortization increased $32 million in 2021 compared with 2020 primarily due to higher gas utility plant balances.
Taxes, other than income taxes increased $110 million in 2021 compared with 2020 primarily due to lower deferral of under-collected property taxes ($68 million), higher property taxes ($30 million) and higher state and local taxes ($12 million).
Steam
CECONY’s results of steam operations for the year ended December 31, 2021 compared with the year ended December 31, 2020 were as follows:
| | | | | | | | | | | |
| | For the Years Ended December 31, |
| (Millions of Dollars) | 2021 | 2020 | Variation |
| Operating revenues | $532 | $508 | $24 |
| Purchased power | 45 | 27 | 18 |
| Fuel | 73 | 81 | (8) |
| Other operations and maintenance | 165 | 161 | 4 |
| Depreciation and amortization | 93 | 90 | 3 |
| Taxes, other than income taxes | 144 | 144 | — |
| Steam operating income | $12 | $5 | $7 |
CECONY’s steam sales and deliveries in 2021 compared with 2020 were:
| | | | | | | | | | | | | | | | | | | | | | | | | | | | | |
| | Millions of Pounds Delivered | | Revenues in Millions |
| | For the Years Ended | | | For the Years Ended | |
| Description | December 31, 2021 | December 31, 2020 | Variation | Percent Variation | | December 31, 2021 | December 31, 2020 | Variation | Percent Variation |
| General | 504 | | 445 | | 59 | | 13.3 | % | | $25 | $23 | $2 | 8.7 | % |
| Apartment house | 5,013 | | 5,131 | | (118) | | (2.3) | | | 137 | 136 | 1 | 0.7 | |
| Annual power | 11,367 | | 10,977 | | 390 | | 3.6 | | | 340 | 321 | 19 | 5.9 | |
| Other operating revenues (a) | — | | — | | — | | — | | 30 | 28 | 2 | 7.1 | |
| Total | 16,884 | | 16,553 | | 331 | | 2.0 | % | (b) | $532 | $508 | $24 | 4.7 | % |
(a)Other steam operating revenues generally reflect changes in regulatory assets and liabilities in accordance with the company’s rate plan. See Note B to the financial statements in Item 8.
(b)After adjusting for variations, primarily weather and billing days, steam sales and deliveries in the company’s service area decreased 3.4 percent in 2021 compared with 2020. See “Coronavirus Disease 2019 (COVID-19) Impacts,” above.
Operating revenues increased $24 million in 2021 compared with 2020 primarily due to the impact of colder winter weather ($21 million) and higher purchased power expenses ($18 million), offset in part by lower fuel expenses ($8 million) and tax law surcharge ($3 million).
Purchasedpower expenses increased $18 million in 2021 compared with 2020 due to higher unit costs ($13 million) and purchased volumes ($5 million).
Fuel expenses decreased $8 million in 2021 compared with 2020 due to lower unit costs ($11 million), offset in part by higher purchased volumes from the company’s steam generating facilities ($3 million).
| | | | | |
74
|
CON EDISON ANNUAL REPORT 2022 |
Other operations and maintenance expenses increased $4 million in 2021 compared with 2020 primarily due to higher costs for pension and other postretirement benefits ($4 million) and higher stock-based compensation ($2 million), offset in part by lower municipal infrastructure support costs ($1 million).
Depreciation and amortization increased $3 million in 2021 compared with 2020 primarily due to higher steam utility plant balances.
Taxes, Other Than Income Taxes
At $2,696 million, taxes other than income taxes remain one of CECONY’s largest operating expenses. The principal components of, and variations in, taxes other than income taxes were:
| | | | | | | | | | | | | | | | | |
| For the Years Ended December 31, | |
| (Millions of Dollars) | 2021 | | 2020 | | Variation |
| Property taxes | $2,215 | | $2,129 | | $86 |
| State and local taxes related to revenue receipts | 373 | | 338 | | 35 |
| Payroll taxes | 65 | | 64 | | 1 |
| Other taxes | 43 | | (75) | | 118 |
| Total | $2,696 | (a) | $2,456 | (a) | $240 |
(a)Including sales tax on customers’ bills, total taxes other than income taxes in 2021 and 2020 were $3,296 million and $2,989 million, respectively.
Other Income (Deductions)
Other deductions decreased $63 million in 2021 compared with 2020 primarily due to lower costs associated with components of pension and other postretirement benefits other than service cost ($61 million).
Net Interest Expense
Net interest expense increased $23 million in 2021 compared with 2020 primarily due to higher interest on long-term debt ($42 million), offset in part by lower interest accrued on the system benefit charge liability ($7 million), lower interest expense for short-term debt ($4 million), lower interest on deposits ($3 million) and lower interest accrued on deferred storm costs ($2 million).
Income Tax Expense
Income taxes increased $31 million in 2021 compared with 2020 primarily due to higher income before income tax expense ($40 million) and higher state income taxes ($9 million), offset in part by a higher favorable tax adjustment in 2021 for the prior year tax return primarily due to an increase in the general business tax credit ($6 million), higher tax benefits in 2021 from research credits ($5 million) and the absence of the amortization of deficit deferred state income taxes in 2020 ($6 million).
| | | | | |
CON EDISON ANNUAL REPORT 2022 | 75 |
O&R
| | | | | | | | | | | | | | | | | | | | | | | |
| | For the Year Ended December 31, 2021 | | For the Year Ended December 31, 2020 | | |
| (Millions of Dollars) | Electric | Gas | 2021 Total | Electric | Gas | 2020 Total | 2021-2020
Variation |
| Operating revenues | $681 | $260 | $941 | $629 | $233 | $862 | $79 |
| Purchased power | 206 | — | | 206 | 169 | — | | 169 | 37 |
| Gas purchased for resale | — | | 88 | 88 | — | | 61 | 61 | 27 |
| Other operations and maintenance | 249 | 64 | 313 | 242 | 68 | 310 | 3 |
| Depreciation and amortization | 69 | 26 | 95 | 65 | 25 | 90 | 5 |
| Taxes, other than income taxes | 57 | 32 | 89 | 54 | 31 | 85 | 4 |
| Operating income | $100 | $50 | $150 | $99 | $48 | $147 | $3 |
Electric
O&R’s results of electric operations for the year ended December 31, 2021 compared with the year ended December 31, 2020 were as follows:
| | | | | | | | | | | |
| | For the Years Ended December 31, |
| (Millions of Dollars) | 2021 | 2020 | Variation |
| Operating revenues | $681 | $629 | $52 |
| Purchased power | 206 | 169 | 37 |
| Other operations and maintenance | 249 | 242 | 7 |
| Depreciation and amortization | 69 | 65 | 4 |
| Taxes, other than income taxes | 57 | 54 | 3 |
| Electric operating income | $100 | $99 | $1 |
O&R’s electric sales and deliveries in 2021 compared with 2020 were:
| | | | | | | | | | | | | | | | | | | | | | | | | | | | | |
| | Millions of kWh Delivered | | Revenues in Millions (a) |
| | For the Years Ended | | | For the Years Ended | |
| Description | December 31, 2021 | December 31, 2020 | Variation | Percent Variation | | December 31, 2021 | December 31, 2020 | Variation | Percent Variation |
| Residential/Religious (b) | 1,742 | | 1,786 | | (44) | | (2.5 | %) | | $331 | $318 | $13 | 4.1 | % |
| Commercial/Industrial | 850 | | 820 | | 30 | | 3.7 | | | 111 | 117 | (6) | (5.1) | |
| Retail choice customers | 2,839 | | 2,621 | | 218 | | 8.3 | | | 223 | 186 | 37 | 19.9 | |
| Public authorities | 110 | | 107 | | 3 | | 2.8 | | | 11 | 7 | 4 | 57.1 | |
| Other operating revenues (c) | — | | — | | — | | — | | 5 | 1 | 4 | Large |
| Total | 5,541 | | 5,334 | | 207 | | 3.9 | % | (d) | $681 | $629 | $52 | 8.3 | % |
(a)O&R’s NY electric delivery revenues are subject to a revenue decoupling mechanism, as a result of which delivery revenues are generally not affected by changes in delivery volumes from levels assumed when rates were approved. Effective July 2021, the majority of O&R’s electric distribution revenues in NJ are subject to a conservation incentive program, as a result of which distribution revenues are generally not affected by changes in delivery volumes from levels assumed when rates were approved. O&R’s electric transmission revenues in NJ are not subject to a conservation incentive program, and as a result, changes in such volumes do impact revenues.
(b)“Residential/Religious” generally includes single-family dwellings, individual apartments in multi-family dwellings, religious organizations and certain other not-for-profit organizations.
(c)Other electric operating revenues generally reflect changes in the revenue decoupling mechanism current asset or regulatory liability in accordance with the company’s NY electric rate plan and changes in regulatory assets and liabilities in accordance with the company’s electric rate plans. See Note B to the financial statements in Item 8.
(d)After adjusting for weather and other variations, electric delivery volumes in company’s service area increased 1.1 percent in 2021 compared with 2020. See “Coronavirus Disease 2019 (COVID-19) Impacts,” above.
Operating revenues increased $52 million in 2021 compared with 2020 primarily due to higher purchased power expenses ($37 million) and higher revenues from the NY electric rate plan ($13 million).
Purchasedpower expenses increased $37 million in 2021 compared with 2020 due to higher unit costs ($35 million) and purchased volumes ($2 million).
Other operations and maintenance expenses increased $7 million in 2021 compared with 2020 primarily due to higher storm-related costs.
| | | | | |
76
|
CON EDISON ANNUAL REPORT 2022 |
Depreciation and amortization increased $4 million in 2021 compared with 2020 primarily due to higher electric utility plant balances.
Taxes, other than income taxes increased $3 million in 2021 compared with 2020 primarily due to higher property taxes ($2 million).
Gas
O&R’s results of gas operations for the year ended December 31, 2021 compared with the year ended December 31, 2020 were as follows:
| | | | | | | | | | | |
| | For the Years Ended December 31, |
| (Millions of Dollars) | 2021 | 2020 | Variation |
| Operating revenues | $260 | $233 | $27 |
| Gas purchased for resale | 88 | 61 | 27 |
| Other operations and maintenance | 64 | 68 | (4) |
| Depreciation and amortization | 26 | 25 | 1 |
| Taxes, other than income taxes | 32 | 31 | 1 |
| Gas operating income | $50 | $48 | $2 |
O&R’s gas sales and deliveries, excluding off-system sales, in 2021 compared with 2020 were:
| | | | | | | | | | | | | | | | | | | | | | | | | | | | | |
| | Thousands of Dt Delivered | | Revenues in Millions (a) |
| | For the Years Ended | | | For the Years Ended | |
| Description | December 31, 2021 | December 31, 2020 | Variation | Percent
Variation | | December 31, 2021 | December 31, 2020 | Variation | Percent Variation |
| Residential | 11,500 | | 9,736 | | 1,764 | | 18.1 | % | | $162 | 121 | | $41 | 33.9 | % |
| General | 2,498 | | 2,142 | | 356 | | 16.6 | | | 28 | 20 | | 8 | 40.0 | |
| Firm retail choice customers | 7,584 | | 8,271 | | (687) | | (8.3) | | | 55 | 62 | | (7) | (11.3) | |
| Total firm sales and firm retail choice | 21,582 | | 20,149 | | 1,433 | | 7.1 | | (b) | 245 | 203 | | 42 | 20.7 | |
| Interruptible sales | 3,820 | | 3,632 | | 188 | | 5.2 | % | | 6 | 6 | — | — | % |
| Generation plants | 26 | | 59 | | (33) | | (55.9) | | | — | | — | | — | — | |
| Other | 468 | | 658 | | (190) | | (28.9) | | | 1 | 1 | | — | — | |
| Other gas revenues | — | | — | | — | | — | | 8 | 23 | | (15) | (65.2) | |
| Total | 25,896 | | 24,498 | | 1,398 | | 5.7 | % | | $260 | 233 | | $27 | 11.6 | % |
(a)Revenues from NY gas sales are subject to a weather normalization clause and a revenue decoupling mechanism, as a result of which, delivery revenues are generally not affected by changes in delivery volumes from levels assumed when rates were approved.
(b)After adjusting for weather and other variations, firm sales and firm retail choice volumes in the company’s service area increased 0.2 percent in 2021 compared with 2020. See “Coronavirus Disease 2019 (COVID-19) Impacts,” above.
Operating revenues increased $27 million in 2021 compared with 2020 primarily due to higher gas purchased for resale expense.
Gas purchased for resale increased $27 million in 2021 compared with 2020 due to higher unit costs ($15 million) and purchased volumes ($12 million).
Other operations and maintenance expenses decreased $4 million in 2021 compared with 2020 primarily due to lower pension costs ($2 million) and lower spending on gas programs ($2 million).
Depreciation and amortization increased $1 million in 2021 compared with 2020 primarily due to higher gas utility plant balances.
Taxes, other than income taxes increased $1 million in 2021 compared with 2020 primarily due to higher property taxes.
| | | | | |
CON EDISON ANNUAL REPORT 2022 | 77 |
Taxes, Other Than Income Taxes
Taxes, other than income taxes, increased $4 million in 2021 compared with 2020. The principal components of taxes, other than income taxes, were:
| | | | | | | | | | | | | | | | | |
| For the Years Ended December 31, |
| (Millions of Dollars) | 2021 | | 2020 | | Variation |
| Property taxes | $71 | | $69 | | $2 |
| State and local taxes related to revenue receipts | 11 | | 10 | | 1 |
| Payroll taxes | 7 | | 6 | | 1 |
| Total | $89 | (a) | $85 | (a) | $4 | |
(a)Including sales tax on customers’ bills, total taxes other than income taxes in 2021 and 2020 were $129 million and $121 million, respectively.
Income Tax Expense
Income taxes remained unchanged in 2021 compared with 2020 primarily due to higher income before income tax expense ($1 million) entirely offset by lower state income taxes, primarily due to a decrease in the amortization of New York’s metropolitan transportation business tax surcharge in 2021 ($1 million).
Clean Energy Businesses
The Clean Energy Businesses were classified as held for sale as of December 31, 2022. See “Assets and Liabilities Held for Sale” in Note A and Note X to the financial statements in Item 8. The Clean Energy Businesses’ results of operations for the year ended December 31, 2021 compared with the year ended December 31, 2020 were as follows:
| | | | | | | | | | | |
| | For the Years Ended December 31, |
| (Millions of Dollars) | 2021 | 2020 | Variation |
| Operating revenues | $1,022 | $736 | $286 |
| | | |
| Gas purchased for resale | 62 | 41 | 21 |
| Other operations and maintenance | 475 | 228 | 247 |
| Depreciation and amortization | 231 | 231 | — |
| Taxes, other than income taxes | 18 | 21 | (3) |
| | | |
| Operating income | $236 | $215 | $21 |
Operating revenues increased $286 million in 2021 compared with 2020 primarily due to higher revenue from renewable electric projects ($211 million), higher wholesale revenues ($35 million) and higher energy services revenues ($47 million), offset in part by lower net mark-to-market values ($7 million).
Gas purchased for resale increased $21 million in 2021 compared with 2020 primarily due to higher purchased volumes.
Other operations and maintenance expenses increased $247 million in 2021 compared with 2020 primarily due to higher costs from engineering, procurement and construction of renewable electric projects for customers.
Other Income (Deductions)
Other income (deductions) decreased $14 million in 2021 compared with 2020 primarily due to lower income in the 2021 period from an equity method investment in renewable electric projects accounted for under the HLBV method of accounting.
Net Interest Expense
Net interest expense decreased $128 million in 2021 compared with 2020 primarily due to lower unrealized losses on interest rate swaps in the 2021 period.
| | | | | |
78
|
CON EDISON ANNUAL REPORT 2022 |
Income Tax Expense
Income taxes increased $88 million in 2021 compared with 2020 primarily due to higher income before income tax expense ($30 million), lower income attributable to non-controlling interest ($47 million), higher state income taxes ($7 million) and the absence of a tax benefit due to the change in the federal corporate income tax rate recognized for a loss carryback from the 2018 tax year to the 2013 tax year as allowed under the CARES Act signed into law during the first quarter of 2020 ($4 million). See Note L to the financial statements in Item 8.
Income (Loss) Attributable to Non-Controlling Interest
Income attributable to non-controlling interest decreased $195 million in 2021 compared with 2020 primarily due to lower income in the 2021 period attributable to a tax equity investor in renewable electric projects accounted for under the HLBV method of accounting. See Note S to the financial statements in Item 8.
Con Edison Transmission
Other operations and maintenance increased $8 million in 2021 compared with 2020 primarily due to a goodwill impairment loss on its investment in Honeoye in 2021. See Note K to the financial statements in Item 8.
Other Income (Deductions)
Other deductions decreased $192 million in 2021 compared with 2020 primarily due to lower losses in 2021 from CET’s pre-tax impairment loss of $212 million on its investment in Stagecoach, pre-tax impairment loss of $231 million on its investment in MVP in 2021, lower investment income in 2021 due to the sale of Stagecoach during 2021 ($19 million) and foregoing AFUDC income from MVP starting January 2021 until significant construction resumes ($60 million), compared to the pre-tax impairment loss of $320 million on its investment in MVP in 2020. See "Critical Accounting Estimates - Investments" in Item 7 and "Investments" in Note A and Note W to the financial statement in Item 8.
Net Interest Expense
Net interest expense increased $123 million in 2023 compared with 2022 primarily due to higher interest expense for long-term debt ($79 million) and short-term debt ($42 million).
Income Tax Expense
Income taxes increased $103 million in 2023 compared with 2022 primarily due to higher income before income tax expense ($83 million), a remeasurement of state deferred tax assets and liabilities as a result of the enacted New York State legislation ($10 million), a decrease in the amortization of excess deferred federal income taxes due to the TCJA ($7 million) and higher reserve for injuries and damages ($3 million).
O&R
| | | | | | | | | | | | | | | | | | | | | | | |
| | For the Year Ended December 31, 2023 | | For the Year Ended December 31, 2022 | | |
| (Millions of Dollars) | Electric | Gas | 2023 Total | Electric | Gas | 2022 Total | 2023-2022
Variation |
| Operating revenues | $759 | $297 | $1,056 | $773 | $312 | $1,085 | $(29) |
| Purchased power | 247 | — | | 247 | 276 | — | | 276 | (29) |
| Gas purchased for resale | — | | 111 | 111 | — | | 135 | 135 | (24) |
| Other operations and maintenance | 292 | 83 | 375 | 275 | 76 | 351 | 24 |
| Depreciation and amortization | 76 | 30 | 106 | 71 | 27 | 98 | 8 |
| Taxes, other than income taxes | 59 | 32 | 91 | 57 | 32 | 89 | 2 |
| Operating income | $85 | $41 | $126 | $94 | $42 | $136 | $(10) |
Electric
O&R’s results of electric operations for the year ended December 31, 2023 compared with the year ended December 31, 2022 were as follows:
| | | | | | | | | | | |
| | For the Years Ended December 31, |
| (Millions of Dollars) | 2023 | 2022 | Variation |
| Operating revenues | $759 | $773 | $(14) |
| Purchased power | 247 | 276 | (29) |
| Other operations and maintenance | 292 | 275 | 17 |
| Depreciation and amortization | 76 | 71 | 5 |
| Taxes, other than income taxes | 59 | 57 | 2 |
| Electric operating income | $85 | $94 | $(9) |
| | | | | |
| CON EDISON ANNUAL REPORT 2023 | 61 |
O&R’s electric sales and deliveries in 2023 compared with 2022 were:
| | | | | | | | | | | | | | | | | | | | | | | | | | | | | |
| | Millions of kWh Delivered | | Revenues in Millions (a) |
| | For the Years Ended | | | For the Years Ended | |
| Description | December 31, 2023 | December 31, 2022 | Variation | Percent Variation | | December 31, 2023 | December 31, 2022 | Variation | Percent Variation |
| Residential/Religious (b) | 1,917 | | 1,916 | | 1 | | 0.1 | % | | $419 | $413 | $6 | 1.5 | % |
| Commercial/Industrial | 958 | | 944 | | 14 | | 1.5 | | | 147 | 147 | — | — |
| Retail choice customers | 2,397 | | 2,580 | | (183) | | (7.1) | | | 172 | 198 | (26) | (13.1) | |
| Public authorities | 113 | | 113 | | — | | — | | 12 | 16 | (4) | (25.0) | |
| Other operating revenues (c) | — | | — | | — | | — | | 9 | (1) | 10 | Large |
| Total | 5,385 | | 5,553 | | (168) | | (3.0) | % | (d) | $759 | $773 | $(14) | (1.8) | % |
(a)O&R’s New York electric delivery revenues are subject to a revenue decoupling mechanism, as a result of which delivery revenues are generally not affected by changes in delivery volumes from levels assumed when rates were approved. The majority of O&R’s electric distribution revenues in New Jersey are subject to a conservation incentive program, as a result of which distribution revenues are generally not affected by changes in delivery volumes from levels assumed when rates were approved. O&R’s electric transmission revenues in New Jersey are not subject to a conservation incentive program, and as a result, changes in such volumes do impact revenues.
(b)“Residential/Religious” generally includes single-family dwellings, individual apartments in multi-family dwellings, religious organizations and certain other not-for-profit organizations.
(c)Other electric operating revenues generally reflect changes in regulatory assets and liabilities in accordance with O&R’s electric rate plan.
(d)After adjusting for weather and other variations, electric delivery volumes O&R’s service area decreased 0.1 percent in 2023 compared with 2022.
Operating revenues decreased $14 million in 2023 compared with 2022 primarily due to lower purchased power expenses ($29 million), offset in part by higher revenues from the New York electric rate plan ($10 million) and a change in incentives earned under the earnings adjustment mechanisms (EAMs) ($4 million).
Purchasedpower expenses decreased $29 million in 2023 compared with 2022 due to lower unit costs ($20 million) and purchased volumes ($9 million).
Other operations and maintenance expenses increased $17 million in 2023 compared with 2022 primarily due to higher administrative and general expenses ($6 million), higher tree trimming expenses ($3 million), higher uncollectible expenses ($2 million), higher customer assistance costs ($2 million) and higher pension costs, reflecting reconciliation to the rate plan level ($2 million).
Depreciation and amortization increased $5 million in 2023 compared with 2022 primarily due to higher electric utility plant balances.
Gas
O&R’s results of gas operations for the year ended December 31, 2023 compared with the year ended December 31, 2022 were as follows:
| | | | | | | | | | | |
| | For the Years Ended December 31, |
| (Millions of Dollars) | 2023 | 2022 | Variation |
| Operating revenues | $297 | $312 | $(15) |
| Gas purchased for resale | 111 | 135 | (24) |
| Other operations and maintenance | 83 | 76 | 7 |
| Depreciation and amortization | 30 | 27 | 3 |
| Taxes, other than income taxes | 32 | 32 | — |
| Gas operating income | $41 | $42 | $(1) |
O&R’s gas sales and deliveries, excluding off-system sales, in 2023 compared with 2022 were:
| | | | | |
62 | CON EDISON ANNUAL REPORT 2023 |
| | | | | | | | | | | | | | | | | | | | | | | | | | | | | |
| | Thousands of Dt Delivered | | Revenues in Millions (a) |
| | For the Years Ended | | | For the Years Ended | |
| Description | December 31, 2023 | December 31, 2022 | Variation | Percent
Variation | | December 31, 2023 | December 31, 2022 | Variation | Percent Variation |
| Residential | 11,428 | | 12,588 | | (1,160) | | (9.2) | % | | $193 | $207 | $(14) | (6.8) | % |
| General | 2,929 | | 2,766 | | 163 | | 5.9 | | | 37 | 38 | (1) | (2.6) | |
| Firm transportation | 5,055 | | 6,396 | | (1,341) | | (21.0) | | | 38 | 45 | (7) | (15.6) | |
| Total firm sales and transportation | 19,412 | | 21,750 | | (2,338) | | (10.7) | | (b) | 268 | 290 | (22) | (7.6) | |
| Interruptible sales | 3,301 | | 3,911 | | (610) | | (15.6) | % | | 6 | 6 | — | — |
| Generation plants | 4 | | 10 | | (6) | | (60.0) | | | — | — | — | — |
| Other | 334 | | 673 | | (339) | | (50.4) | | | 1 | 1 | | — | | — |
| Other gas revenues | — | | — | | — | | — | | 22 | 15 | 7 | 46.7 | |
| Total | 23,051 | | 26,344 | | (3,293) | | (12.5) | % | | $297 | $312 | $(15) | (4.8) | % |
(a)Revenues from New York gas sales are subject to a revenue decoupling mechanism, as a result of which, delivery revenues are generally not affected by changes in delivery volumes from levels assumed when rates were approved.
(b)After adjusting for weather and other variations, firm sales and transportation volumes in O&R’s service area remained consistent in 2023 compared with 2022.
Operating revenues decreased $15 million in 2023 compared with 2022 primarily due to lower gas purchased for resale ($24 million), offset in part by higher revenues from the New York gas rate plan ($5 million).
Gas purchased for resale decreased $24 million in 2023 compared with 2022 due to lower purchased volumes ($15 million) and unit cost ($9 million).
Other operations and maintenance expenses increased $7 million in 2023 compared with 2022 primarily due to higher administrative and general expenses ($2 million), higher pension costs, reflecting reconciliation to the rate plan level ($2 million) and higher uncollectible expenses ($1 million).
Depreciation and amortization increased $3 million in 2023 compared with 2022 primarily due to higher gas utility plant balances.
Taxes, Other Than Income Taxes
Taxes, other than income taxes, remained consistent in 2023 compared with 2022. The principal components of taxes, other than income taxes, were:
| | | | | | | | | | | | | | | | | |
| For the Years Ended December 31, |
| (Millions of Dollars) | 2023 | | 2022 | | Variation |
| Property taxes | $71 | | $69 | | $2 |
| State and local taxes related to revenue receipts | 11 | | 12 | | (1) | |
| Payroll taxes | 9 | | 8 | | 1 | |
| Total | $91 | (a) | $89 | (a) | $2 | |
(a)Including sales tax on customers’ bills, total taxes other than income taxes in 2023 and 2022 were $122 million and $131 million, respectively.
Income Tax Expense
Income taxes increased $3 million in 2023 compared with 2022 primarily due to higher income before income tax expense ($2 million) and a decrease in the amortization of excess deferred federal income taxes due to the TCJA ($1 million).
Con Edison Transmission
Other Income (Deductions)
Other income increased $43 million in 2023 compared with 2022 primarily due to higher investment income from equity earnings from Con Edison Transmission’s proportionate share of its investments in New York Transco ($10 million) and MVP ($33 million).
Net Interest Expense
Net interest expense decreased $9$3 million in 20212023 compared with 20202022 primarily due to the repayment oflower average balance on an intercompany loan from the parent company from a portion of the proceeds from the sale of Stagecoach.loan.
Income Tax Expense
| | | | | |
| CON EDISON ANNUAL REPORT 2023 | 63 |
Income taxes decreased $48increased $9 million in 20212023 compared with 20202022 primarily due to lowerhigher income before income tax expense ($409 million), lower state income taxes ($12 million), offset in part by higher amortization of excess deferred federal income taxes in 2021 ($2 million).
Other
Taxes, Other Than Income Taxes
Taxes, other than income taxes decreased $6 million in 20212023 compared with 20202022 primarily due to adjustments made toa decrease in the New York City capital tax for prior periods in the 2020 period.State Capital Tax ($7 million).
Other Income (Deductions)
Other income (deductions) increased $4deductions decreased $37 million in 20212023 compared with 20202022 primarily due to lower transaction costs at the eliminationparent company incurred from the sale of CECONY's goodwill impairment relatedthe Clean Energy Businesses ($37 million). See Note W and Note X to Con Edison Transmission's investmentthe financial statements in Honeoye.Item 8.
Income Tax Expense
Income taxes increased $29decreased $45 million in 20212023 compared with 20202022 primarily due to the recognition of unamortized investment tax credits ($106 million), a remeasurement of state deferred tax assets and liabilities ($142 million), both related to the sale of the Clean Energy Businesses, a decrease in the valuation allowance on state and local income tax assets ($10 million) and an increase in amortization of investment tax credits ($3 million), offset in part by higher income before income tax expense due to the sale of the Clean Energy Businesses ($2214 million) and a higher unitary state tax adjustment, net of federal benefit ($5 million).
Clean Energy Businesses
On March 1, 2023, Con Edison completed the sale of all of the stock of the Clean Energy Businesses. See Note W and Note X to the financial statements in Item 8. The Clean Energy Businesses’ results of operations for the year ended December 31, 2023 (reflecting the two months ended February 2023) compared with the year ended December 31, 2022 were as follows:
| | | | | | | | | | | |
| | For the Years Ended December 31, |
| (Millions of Dollars) | 2023 | 2022 | Variation |
| Operating revenues | $129 | $1,319 | $(1,190) |
| Purchased power | — | 7 | (7) |
| Gas purchased for resale | 41 | 241 | (200) |
| Other operations and maintenance | 48 | 504 | (456) |
| Depreciation and amortization | — | 178 | (178) |
| Taxes, other than income taxes | 3 | 21 | (18) |
| | | |
| Operating income | $37 | $368 | $(331) |
Net Interest Expense
Net interest expense increased $51 million in 2023 compared with 2022 primarily due to lower unrealized gains on interest rate swaps in the 2023 period. On March 1, 2023, Con Edison completed the sale of all of the stock of the Clean Energy Businesses and the impact on the 2023 period is shown through the date of sale. See Note W and Note X to the financial statements in Item 8.
Income Tax Expense
Income taxes decreased $81 million in 2023 compared with 2022 primarily due to lower income before income tax expense ($92 million), lower consolidated state income tax benefits in 2021loss attributable to non-controlling interest ($1615 million) and a lower reserve for uncertain tax positions ($5 million), offset in part by lower renewable energy tax credits ($30 million). On March 1, 2023, Con Edison completed the absencesale of a changeall of the stock of the Clean Energy Businesses and the impact for the year ended December 31, 2023 is shown through the date of the sale. See Note W and Note X to the New York City valuation allowancefinancial statements in 2021 ($10 million)Item 8.
Loss Attributable to Non-Controlling Interest
Loss attributable to non-controlling interest decreased $57 million to a loss of $3 million in 2023 compared with 2022 primarily due to the sale of the Clean Energy Businesses.
During the fourth quarter of 2020, Con Edison reversed a portion of its valuation allowance that was recorded against the deferred tax asset established for the New York City NOL. Management has reassessed its ability to realize a portion of the deferred tax benefits generated primarily by its renewable energy projects due to the future reversal of temporary differences associated with the accelerated tax depreciation and by implementing its strategy to secure tax equity financing from third parties for which certain tax deductions and amortization will be specifically allocated to members outside of the consolidated group.
| | | | | |
64 | CON EDISON ANNUAL REPORT 2022 | 792023 |
Liquidity and Capital Resources
The Companies’ liquidity reflects cash flows from operating, investing and financing activities, as shown on their respective consolidated statements of cash flows and as discussed below.
The principal factors affecting Con Edison’s liquidity are its investments in the Utilities the Clean Energy Businesses and Con Edison Transmission, the dividends it pays to its shareholders and the dividends it receives from its subsidiaries and cash flows from financing activities discussed below.
The principal factors affecting CECONY’s liquidity are its cash flows from operating activities, cash used in investing activities (including construction expenditures), the dividends it pays to Con Edison and cash flows from financing activities discussed below.
The Companies generally maintain minimal cash balances and use short-term borrowings to meet their working capital needs and other cash requirements. The Companies repay their short-term borrowings using funds from long-term financings and operating activities. The Utilities’ cost of capital, including working capital, is reflected in the rates they charge to their customers.
Each of the Companies believes that it will be able to meet its reasonably likely short-term and long-term cash requirements. See “The Companies Require Access To Capital Markets To Satisfy Funding Requirements,” "Changes To Tax Laws Could Adversely Affect the Companies," “The Companies Face Risks Related to Health Epidemics And Other Outbreaks, Including The COVID-19 Pandemic,” and “The Companies Also Face Other Risks That Are Beyond Their Control” in Item 1A, and “Capital Requirements and Resources” in Item 1.
| | | | | |
80
|
20222023 | 65 |
The Companies’ cash, temporary cash investments and restricted cash resulting from operating, investing and financing activities for the years ended December 31, 2023, 2022 2021 and 20202021 are summarized as follows:
| | | | CECONY | O&R | Clean Energy
Businesses (d) | Con Edison
Transmission | Other (a) | Con Edison (b) | | CECONY | O&R | Clean Energy
Businesses (d) | Con Edison
Transmission | Other (a) | Con Edison (b) |
| (Millions of Dollars) | (Millions of Dollars) | 2022 | 2021 | 2020 | 2022 | 2021 | 2020 | 2022 | 2021 | 2020 | 2022 | 2021 | 2020 | 2022 | 2021 | 2020 | 2022 | 2021 | 2020 | (Millions of Dollars) | 2023 | 2022 | 2021 | 2023 | 2022 | 2021 | 2023 | 2022 | 2021 | 2023 | 2022 | 2021 | 2023 | 2022 | 2021 | 2023 | 2022 | 2021 |
| Operating activities | Operating activities | $3,263 | $2,186 | $1,693 | $216 | $127 | $146 | $506 | $175 | $887 | $66 | $44 | $(7) | $(116) | $201 | ($521) | $3,935 | $2,733 | $2,198 | Operating activities | $2,285 | $3,263 | $2,186 | $216 | $216 | $127 | $— | $506 | $175 | $(137) | $66 | $44 | $(208) | $(116) | $201 | $2,156 | $3,935 | $2,733 |
| Investing activities | Investing activities | (3,926) | (3,729) | (3,416) | (235) | (224) | (220) | (339) | (139) | (606) | (65) | 608 | 18 | — | — | (4,565) | (3,484) | (4,224) | Investing activities | (4,439) | (3,926) | (3,729) | (301) | (235) | (224) | (248) | (339) | (139) | (49) | (65) | 608 | 4,034 | — | (1,003) | (4,565) | (3,484) |
| Financing activities | Financing activities | 799 | 1,396 | 1,857 | 25 | 89 | 79 | (97) | (45) | (345) | (1) | (652) | (11) | 288 | (327) | 665 | 1,014 | 461 | 2,245 | Financing activities | 2,236 | 799 | 1,396 | 73 | 25 | 89 | — | (97) | (45) | 211 | (1) | (652) | (4,008) | 288 | (327) | (1,488) | 1,014 | 461 |
| Net change for the period | Net change for the period | 136 | (147) | 134 | 6 | (8) | 5 | 70 | (9) | (64) | — | — | 172 | (126) | 144 | 384 | (290) | 219 | Net change for the period | 82 | 136 | (147) | (12) | 6 | (8) | (248) | 70 | (9) | 25 | — | (182) | 172 | (126) | (335) | 384 | (290) |
| Balance at beginning of period | Balance at beginning of period | 920 | 1,067 | 933 | 29 | 37 | 32 | 178 | 187 | 251 | — | — | 19 | 145 | 1 | 1,146 | 1,436 | 1,217 | Balance at beginning of period | 1,056 | 920 | 1,067 | 35 | 29 | 37 | 248 | 178 | 187 | — | — | 191 | 19 | 145 | 1,530 | 1,146 | 1,436 |
| Balance at end of period (c) | Balance at end of period (c) | $1,056 | $920 | $1,067 | $35 | $29 | $37 | $248 | $178 | $187 | $— | | $— | | $— | $191 | $19 | $145 | $1,530 | $1,146 | $1,436 | Balance at end of period (c) | $1,138 | $1,056 | $920 | $23 | $35 | $29 | $— | $248 | $178 | $25 | $— | $9 | $191 | $19 | $1,195 | $1,530 | $1,146 |
| Less: Change in cash balances held for sale (d) | Less: Change in cash balances held for sale (d) | — | | — | | — | — | — | | — | 248 | | — | | — | | — | | — | | — | | — | | — | | — | | 248 | | — | | — | |
| Balance at end of period excluding held for sale | Balance at end of period excluding held for sale | $1,056 | $920 | $1,067 | $35 | $29 | $37 | $— | $178 | $187 | $— | | $— | $— | | $191 | $19 | $145 | $1,282 | $1,146 | $1,436 | Balance at end of period excluding held for sale | $1,138 | $1,056 | $920 | $23 | $35 | $29 | $— | $— | $178 | $25 | | $— | $— | $— | | $4 | $4 | $191 | $19 | $1,190 | $1,282 | $1,146 |
(a) IncludesOther includes the parent company, Con Edison’s tax equity investments, the deferred project held for sale and consolidation adjustments. See Note X to the financial statements in Item 8.
(b) Represents the consolidated results of operations of Con Edison and its businesses.
(c) See "Reconciliation of Cash, Temporary Cash Investments and Restricted Cash" in Note A to the financial statements in Item 8.
(d) TheOn March 1, 2023, Con Edison completed the sale of all of the stock of the Clean Energy Businesses were classified as held for sale as of December 31, 2022.. See “Assets and Liabilities Held for Sale” in Note AW and Note X to the financial statements in Item 8.
| | | | | |
66 | CON EDISON ANNUAL REPORT 2022 | 812023 |
Cash Flows from Operating Activities
The Utilities’ cash flows from operating activities primarily reflect their energy sales and deliveries and cost of operations. The volume of energy sales and deliveries is primarily affected by factors external to the Utilities, such as customer demand, weather, market prices for energy and economic conditions. Measures that promote distributed energy resources, such as distributed generation, demand reduction and energy efficiency, also affect the volume of energy sales and deliveries. See "Competition" and "Environmental Matters – Clean Energy Future – Reforming the Energy Vision"Future" and “Environmental Matters – Climate Change” in Item 1.
During 2020 and 2021, the decline in business activity in the Utilities’ service territory due to the COVID-19 pandemic and the Utilities' suspension of service disconnections, bill collection activities and certain charges and fees resulted in a slower recovery of cash from outstanding customer accounts receivable balances, material increases in customer accounts receivable balances, increases to the allowance for uncollectible accounts, and may result in increases to write-offs of customer accounts, as compared to prior to the COVID-19 pandemic. Under the revenue decoupling mechanisms in the Utilities’ NY electric and gas rate plans, changes in delivery volumes from levels assumed when rates were approved may affect the timing of cash flows, but largely not net income. The prices at which the Utilities provide energy to their customers are determined in accordance with their rate plans. However, increases in electric and gas commodity prices, coupled with the decline in business activity due to the COVID-19 pandemic, may further contribute to a slower recovery of cash from outstanding customer accounts receivable balances, increases to the allowance for uncollectible accounts, and increases to write-offs of customer accounts receivable balances. In general, changes in the Utilities’ cost of purchased power, fuel and gas may affect the timing of cash flows, but not net income, because the costs are recovered in accordance with rate plans. See “Recoverable Energy Costs” in Note A to the financial statements in Item 8.
The Utilities’ NY rate plans allow them to defer costs resulting from a change in legislation, regulation and related actions that have taken effect during the term of the rate plans once the costs exceed a specified threshold. Increases to the allowance for uncollectible accounts related to the COVID-19 pandemic have been deferred pursuant to the legislative, regulatory and related actions provisions of their rate plans. In November 2021, the NYSPSC issued an order establishing a surcharge recovery mechanism commencing December 1, 2021 through December 31, 2022 for CECONY to collect late payment charges and fees that were not billed for the year ended December 31, 2020 due to the COVID-19 pandemic. The order also established a surcharge recovery or sur-credit mechanism for any fee deferrals for 2021 and 2022. In April 2022, the NYSPSC approved the October 2021 joint proposal for new electric and gas rates for O&R for the three-year period from January 2022 through December 2024 (the Joint Proposal) that includes certain COVID-19 provisions, such as: recovery of 2020 late payment charges over three years; reconciliation of late payment charges to amounts reflected in rates for years 2021 through 2024; and reconciliation of write-offs of customer accounts receivable balances to amounts reflected in rates from January 1, 2020 through December 31, 2024. In June 2022 and January 2023, the NYSPSC issued orders implementing COVID-19 arrears assistance programs that provides credits towards the arrears balances of electric and gas customers of CECONY and O&R. See “The Companies Face Risks Related To Health Epidemics And Other Outbreaks, Including The COVID-19 Pandemic,” in Item 1A, “Rate Plans,” "COVID-19 Regulatory Matters" and “Other Regulatory Matters” in Note B to the financial statements in Item 8 and "Coronavirus Disease 2019 (COVID-19) Impacts - Liquidity and Financing," above.
Pursuant to their rate plans, the Utilities have recovered from customers a portion of the tax liability they will pay in the future as a result of temporary differences between the book and tax basis of assets and liabilities. These temporary differences affect the timing of cash flows, but not net income, as the Companies are required to record deferred tax assets and liabilities at the current corporate tax rate for the temporary differences. For the Utilities, credits to their customers of the net benefits of the TCJA, including the reduction of the corporate tax rate to 21 percent, decrease cash flows from operating activities. Pursuant to their rate plans, the Utilities also recover from customers the amount of property taxes they will pay. The payment of property taxes by the Utilities affects the timing of cash flows and increases the amount of short-term borrowings issued by the Utilities when property taxes are due and as property taxes increase, but generally does not impact net income. See “Changes To Tax Laws Could Adversely Affect the Companies,” in Item 1A, “Federal Income Tax” in Note A, “Rate Plans” in Note B, "COVID-19 Regulatory Matters" in Note B, “Other Regulatory Matters” in Note B and Note L to the financial statements in Item 8 and "Coronavirus Disease 2019 (COVID-19) Impacts - Liquidity and Financing,"Aged Accounts Receivable Balances," above.
TheOn March 1, 2023, Con Edison completed the sale of all of the stock of the Clean Energy Businesses were classified as held for sale as of December 31, 2022.Businesses. See “Assets and Liabilities Held for Sale” in Note AW and Note X to the financial statements in Item 8.
Net income is the result of cash and non-cash (or accrual) transactions. Onlytransactions. Only cash transactions affect the Companies’ cash flows from operating activities. Principal non-cash charges or credits include depreciation, deferred income tax expense, amortizations of certain regulatory assets and liabilities and accrued unbilled revenue. Non-cash charges or credits may also be accrued under the revenue decoupling and costcost reconciliation mechanisms in the Utilities’ NYNew York electric and gas rate plans.plans. See “Rate Plans – CECONY– Electric and Gas" and
| | | | | |
82
|
CON EDISON ANNUAL REPORT 2022 |
"Rate "Rate Plans – O&R New York – Electric and Gas” in Note B to the financial statements in Item 8. For Con Edison, 2021 net income also included non-cash losses recognized with respect to impairments of Con Edison Transmission’s investments in MVP, Stagecoach and Honeoye. For
Certain prior period amounts have been reclassified within the Companies' cash flows from operating activities to conform with current period presentation.
Net cash flows from operating activities in 2023 for Con Edison 2020were $1,779 million lower than in 2022. The changes in net income included cash flows for Con Edison primarily reflect:
•a non-cash loss recognized with respect to a partial impairment of Con decrease in accounts payable ($843 million);
•Edison Transmission’s investment in MVP. See “Investments” in Note Alower pensions and Note K to the financial statements in Item 8.retiree benefits obligations, net ($377 million);
•higher deferred charges, noncurrent assets, leases, net and other regulatory assets ($346 million); and
•lower deferred credits, noncurrent liabilities and other regulatory liabilities ($249 million).
Net cash flows from operating activities in 2022 for Con Edison and CECONY were $1,202 million and $1,077 million higher respectively, than in 2021. The changes in net cash flows for Con Edison and CECONY primarily reflect reflect:
•an increase in accounts payable ($514 million and $257 million, respectively), million);
•lower pension and retiree benefit contributions ($433 million and $407 million, respectively) and lower prepayments, other receivables and other current assets ($265 million and $410 million, respectively).
Net cash flows from operating activities in 2021 for Con Edison and CECONY were $535 million and $493 million higher, respectively, than in 2020. The changes in net cash flows for Con Edison and CECONY primarily reflect a lower increase of accounts receivable balances from customers, net of allowance for uncollectible accounts ($223 million and $196 million, respectively) (see “COVID-19 Regulatory Matters” in Note B to the financial statements in Item 8 and “Coronavirus Disease 2019 (COVID-19) Impacts - Accounting Considerations” and “Liquidity and Financing,” above), higher recoveries of depreciation expense ($112 million and $107 million, respectively), lower system benefit charge ($85 million and $80 million, respectively), lower superfund and environmental remediation costs ($12 million and $12 million•, respectively) and lower pension and retiree benefit contributions ($6 million and $5 million, respectively). For Con Edison, changes in net cash flows reflects lower other receivables and other current assets ($31136 million), lower taxes receivable ($19 million), ;
•lower revenue decoupling mechanism receivable ($879); and
•lower prepayments ($50 million), offset.
Net cash flows from operating activities in part by 2023 for CECONY were $978 million lower than in 2022. The changes in net cash flows for CECONY primarily reflect:
•a changedecrease in accounts payable ($459 million);
•higher deferred charges, noncurrent assets, leases, net and other regulatory assets ($306 million); and
•higher other receivables and other current assets ($247 million).
Net cash flows from operating activities in 2022 for CECONY were $1,077 million higher than in 2021. The changes in net cash flows for CECONY primarily reflect:
•an increase in accounts payable ($257 million);
•lower pension and retiree benefit obligations, netcontributions ($19407 million);
•lower other receivables and for CECONY, a change in pensionother current assets ($272 million);
•lower revenue decoupling mechanism receivable ($89); and retiree benefit obligations, net
| | | | | |
| CON EDISON ANNUAL REPORT 2023 | 67 |
•lower prepayments ($3042 million).
The change in net cash flows also reflects the timing of payments for and recovery of energy costs. This timing is reflected within changes to accounts receivable – customers, recoverable and refundable energy costs within other regulatory assets and liabilities and accounts payable balances.
Cash Flows Used in Investing Activities
Net cash flows used in investing activities for Con Edison and CECONY were $1,081 million and $197 million higher, respectively, in 2022 than in 2021. The change for Con Edison primarily reflects a decrease due to receiving proceeds from the completion of the sale of Stagecoach in 2021 ($629 million), higher utility construction expenditures ($194 million) and a decrease due to receiving proceeds from the divestiture of renewable electric projects at the Clean Energy Businesses in 2021 ($183 million). The change for CECONY primarily reflects an increase in utility construction expenditures ($183 million). Pursuant to their rate plans, the Utilities recover the cost of utility construction expenditures from customers, including an approved rate of return (before and after being placed in service and or AFUDCan allowance for funds used during construction (AFUDC) before being placed in service). Increases in the amount of utility construction expenditures may temporarily increase the amount of short-term debt issued by the Utilities prior to the long-term financing of such amounts.
Net cash flows used in investing activities for Con Edison and CECONY were $740$3,562 million lower and $313 million higher, respectively, in 20212023 than in 2020.2022. The change for Con Edison primarily reflectsreflects:
•the proceeds from the sale of the Clean Energy Businesses, net of cash and cash equivalents sold ($3,927 million);
•lower non-utility construction expenditures ($203 million); offset in part by,
•higher utility construction expenditures ($529 million).
Net cash flows used in investing activities for Con Edison were $1,081 million higher in 2022 than in 2021. The change for Con Edison primarily reflects:
•the proceeds from the completion of the sale of Stagecoach in 2021 ($629 million), a decrease in non-utility;
•higher utility construction expenditures at ($194 million); and
•the Clean Energy Businesses ($261 million) and proceeds from the divestiture of renewable electric projects at the Clean Energy Businesses in 2021 ($183 million), offset.
Net cash flows used in part by investing activities for CECONY were $513 million higher in 2023 than in 2022. The change for CECONY primarily reflects:
•an increase in utility construction expenditures at CECONY ($301463 million); and O&R ($3 million). Pursuant to their rate plans, the Utilities recover the
•an increase in cost of removal less salvage ($50 million).
Net cash flows used in investing activities for CECONY were $197 million higher in 2022 than in 2021. The change for CECONY primarily reflects:
•an increase in utility constructionconstruction expenditures from customers, including an approved rate of return (before and after being placed in service and or AFUDC before being placed in service)($183 million). Increases in the amount of utility construction expenditures may temporarily increase the amount of short-term debt issued by the Utilities prior to the long-term financing of such amounts.
Cash Flows From Financing Activities
Net cash flows from financing activities in 2023 for Con Edison and CECONY were $2,502 million lower and $1,437 million higher, respectively, than in 2022. Net cash flows from financing activities in 2022 for Con Edison and CECONY were $553 million higher and $597 million lower, respectively, than in 2021. Net cash flows from financing activities in 2021 for Con Edison and CECONY were $1,784 million higher and $461 million lower, respectively, than in 2020.
Net cash flows from financing activities during the years ended December 31, 2023, 2022 2021 and 20202021 reflect the following Con Edison transactions:
| | | | | |
68 | CON EDISON ANNUAL REPORT 2022 | 832023 |
2023
•In January, entered into and borrowed $200 million under a 364-Day Senior Unsecured Term Loan Credit Agreement, that was repaid in March 2023, the proceeds from which were used for general corporate purposes;
•In March, entered into accelerated share repurchase agreements with two dealers to repurchase $1,000 million in aggregate of Con Edison’s Common Shares. Con Edison made payments of $1,000 million in aggregate to the dealers and received deliveries of 10,543,263 Common Shares in aggregate; and
•In December, redeemed at maturity $650 million of 0.65 percent senior unsecured notes.
2022
•Entered into and borrowed $400 million under a 364-Day Senior Unsecured Term Loan Credit Agreement, that was repaid in March 2023, the proceeds from which were used for general corporate purposes. See Note D to the financial statements in Item 8;purposes; and
•Redeemed at maturity $293 million of 8.71 percent senior unsecured notes.
2021
•Issued 10,100,000 shares of its common stock resulting in net proceeds of approximately $775 million, after issuance expenses. The net proceeds from the sale of the common shares were invested by Con Edison in CECONY, for funding of its construction expenditures and for its other general corporate purposes;
•Redeemed at maturity $500 million of 2.00 percent 5-year debentures with proceeds from a $500 million borrowing under an April 2021 Credit Agreement, which Con Edison prepaid in full in July 2021; and
•Optionally prepaid the remaining $675 million outstanding under a February 2019 term loan prior to its maturity in June 2021.
2020
•Issued 1,050,000 shares of its common shares for $88 million upon physical settlement of the remaining shares subject to its May 2019 forward sale agreement. Con Edison used the proceeds to invest in CECONY for funding of its capital requirements and other general corporate purposes;
•Borrowed $820 million pursuant to a credit agreement that was converted to a term loan (the “July 2020 Term Loan”). Con Edison used the proceeds from the borrowing for general corporate purposes, including repayment of short-term debt bearing interest at variable rates. The July 2020 Term Loan was prepaid in full in December 2020;
•Issued 7,200,000 common shares resulting in net proceeds of $553 million, after issuance expenses. The net proceeds from the sale of the common shares, together with the net proceeds from the sale of $650 million aggregate principal amount of 0.65 percent debentures due 2023, were used to prepay in full the July 2020 Term Loan. The remaining net proceeds from the sale of the common shares were invested by Con Edison in its subsidiaries, principally CECONY and O&R, and for other general corporate purposes; and
•Issued $650 million aggregate principal amount of 0.65 percent debentures, due 2023, with an option to redeem at par, in whole or in part, on or after December 1, 2021. The proceeds from the $650 million refinancing, together with a portion of the proceeds from the sale of common shares, were used to prepay in full the July 2020 Term Loan.
Con Edison’s cash flows from financing activities in 2023, 2022 2021 and 20202021 also reflect the proceeds, and reduction in cash used for reinvested dividends, resulting from the issuance of common shares under the company’s dividend reinvestment, stock purchase and long-term incentive plans of $87 million, $88 million and $109 million, respectively.
Con Edison’s cash flows from financing activities for the year ended December 31, 2023 also reflects retirement of short-term debt of $752 million compared with a net issuance of $1,702 million in the 2022 period and $106retirement of short-term debt of $382 million respectively.in the 2021 period.
Net cash flows from financing activities during the years ended December 31, 2023, 2022 2021 and 20202021 reflect the following CECONY transactions:
2023
•In November, issued $600 million aggregate principal amount of 5.50 percent debentures, due 2034 and $900 million aggregate principal amount of 5.90 percent debentures, due 2053, the net proceeds from the sale of which were used to repay short-term borrowings and for other general corporate purposes.
2022
•Issued $700 million aggregate principal amount of 6.15 percent debentures, due 2052, the net proceeds from the sale of which were used to repay short-term borrowings and for other general corporate purposes.
2021
•Issued $600 million aggregate principal amount of 3.20 percent debentures, due 2051, the net proceeds from the sale of which were used to repay short-term borrowings and for other general corporate purposes;
•Issued $900 million aggregate principal amount of 2.40 percent debentures, due 2031, the aggregate
net proceeds from the sales of which were used to redeem at maturity its $640 million floating rate 3-year debentures and for other general corporate purposes, including repayment of short-term debt; and
•Issued $750 million aggregate principal amount of 3.60 percent debentures, due 2061, the net proceeds from the sale of which will be used to pay or reimburse the payment of, in whole or in part, existing and new qualifying eligible green expenditures, such as energy efficiency and clean transportation expenditures, that include those funded on or after January 1, 2021 until the maturity date of the debentures. Pending the allocation of the net proceeds to finance or refinance eligible green expenditures, CECONY used the net proceeds for repayment of short-term debt and temporarily placed the remaining net proceeds in short-term interest-bearing instruments.
| | | | | |
84
|
20222023 | 69 |
2020
CECONY’s cash flows from financing activities for the year ended December 31, 2023 also reflects retirement of short-term debt of $397 million compared with a net issuance of $939 million in the 2022 period and retirement of short-term debt of $299 million in the 2021 period.
CECONY’s cash flows from financing activities also reflects capital contributions from the parent of $1,720 million, $150 million and $1,100 million for the years ended December 31, 2023, 2022 and 2021, respectively.
Net cash flows from financing activities during the years ended December 31, 2023, 2022 and 2021 also reflect the following O&R transactions:
2023
•Issued $600In December, issued $50 million aggregate principal amount of 3.006.59 percent debentures, due 2060,2053, the net proceeds from the sale of which were used to repay short-term borrowings and for other general corporate purposes;purposes.
•Redeemed at maturity $350 million of 4.45 percent 10-year debentures; and
•Issued $600 million aggregate principal amount of 3.35 percent debentures, due 2030 and $1,000 million aggregate principal amount of 3.95 percent debentures, due 2050, the net proceeds from the sale of which will be used to pay or reimburse the payment of, in whole or in part, existing and new qualifying eligible green expenditures, such as energy efficiency and clean transportation expenditures, that include those funded on or after January 1, 2018 until the maturity date of each series of the debentures. Pending the allocation of the net proceeds to finance or refinance eligible green expenditures, CECONY used a portion of the net proceeds for repayment of short-term debt and temporarily placed the remaining net proceeds in short-term interest-bearing instruments.
Net cash flows from financing activities during the years ended December 31, 2022, 2021 and 2020 also reflect the following O&R transactions:
2022
•Issued $100 million aggregate principal amount of 5.70 percent debentures, due 2032, the net proceeds from the sale of which were used to repay short-term borrowings and for other general corporate purposes.
2021
•Issued $45 million aggregate principal amount of 2.31 percent debentures, due 2031 and $30 million aggregate principal amount of 3.17 percent debentures, due 2051, the net proceeds from the sales of which were used to repay short-term borrowings and for other general corporate purposes.
2020
•Issued $35 million aggregate principal amountOn March 1, 2023, Con Edison completed the sale of 2.02 percent debentures, due 2030,all of the stock of the Clean Energy Businesses. See Note W and $40 million aggregate principal amount of 3.24 percent debentures, due 2050,Note X to the net proceeds from the sales of which were used to repay short-term borrowings and for other general corporate purposes.
financial statements in Item 8. Net cash flows from financing activities during the years ended December 31, 2022 2021 and 20202021 also reflect the following Clean Energy Businesses transactions:
2022
•Entered into and borrowed $150 million under a 364-Day Senior Unsecured Term Loan Credit Agreement guaranteed by Con Edison, that was repaid in March 2023, the proceeds from which were used for general corporate purposes;purposes.
2021
•Borrowed $250 million at a variable rate, due 2028, secured by equity interests in four of the company’s solar electric production projects, the interest rate for which was swapped to a fixed rate of 3.39 percent;
•Entered into an agreement with a tax equity investor for the financing of a portfolio of three of the Clean Energy Businesses’ solar electric production projects (CED Nevada Virginia). Under the financing, the tax equity investor acquired a noncontrolling interest in the portfolio and will receive a percentage of earnings, tax attributes and cash flows. As of December 31, 2021, the tax equity investor fully funded its $263 million financing obligation. The Clean Energy Businesses will continue to consolidate this entity and will report the noncontrolling tax equity investor’s interest in the tax equity arrangement. See Note Q to the financial statements in Item 8;obligation;
•Prepaid in full $249 million of borrowings outstanding under, and terminated, a $613 million variable-rate construction loan facility that was secured by and used to fund construction costs for CED Nevada Virginia; and
•Issued $229 million aggregate principal amount of 3.77 percent senior notes, due 2046, secured by equity interests in CED Nevada Virginia.
2020
•Borrowed $165 million under a $613 million variable-rate construction loan facility that was terminated in 2021 that was secured by and used to fund construction costs for CED Nevada Virginia.
| | | | | |
CON EDISON ANNUAL REPORT 2022 | 85 |
Cash flows from financing activities of the Companies also reflect commercial paper issuance. The commercial paper amounts outstanding at December 31, 2023, 2022 2021 and 20202021 and the average daily balances for 2023, 2022 2021 and 20202021 for Con Edison and CECONY were as follows:
| | | | 2022 | 2021 | 2020 | | 2023 | 2022 | 2021 |
(Millions of Dollars, except Weighted Average Yield) | (Millions of Dollars, except Weighted Average Yield) | Outstanding at December 31 | Daily average | Outstanding at
December 31 | Daily average | Outstanding at
December 31 | Daily average | (Millions of Dollars, except Weighted Average Yield) | Outstanding at December 31 | Daily average | Outstanding at
December 31 | Daily average | Outstanding at
December 31 | Daily average |
| Con Edison | Con Edison | $2,640 | $1,485 | $1,488 | $1,189 | $1,705 | $980 | Con Edison | $2,288 | $1,446 | $2,640 | $1,485 | $1,488 | $1,189 |
| CECONY | CECONY | $2,300 | $1,306 | $1,361 | $1,082 | $1,660 | $678 | CECONY | $1,903 | $1,377 | $2,300 | $1,306 | $1,361 | $1,082 |
| Weighted average yield | Weighted average yield | 4.8 | % | 2.3 | % | 0.3 | % | 0.2 | % | 0.3 | % | 1.0 | % | Weighted average yield | 5.6 | % | 5.3 | % | 4.8 | % | 2.3 | % | 0.3 | % | 0.2 | % |
| | | | | |
70 | CON EDISON ANNUAL REPORT 2023 |
Common stock issuances and external borrowings are sources of liquidity that could be affected by changes in credit ratings, financial performance and capital market conditions. For information about the Companies’ credit ratings and certain financial ratios, see “Capital Requirements and Resources” in Item 1.
Capital Requirements and Resources
For information about capital requirements, contractual obligations and capital resources, see “Capital Requirements and Resources” in Item 1.
Assets, Liabilities and Equity
The Companies’ assets, liabilities and equity at December 31, 20222023 and 20212022 are summarized as follows:
| | | | CECONY | O&R | Clean Energy
Businesses (c) | Con Edison
Transmission | Other (a) | Con Edison (b) | | CECONY | O&R | Clean Energy
Businesses (c) | Con Edison
Transmission | Other (a) | Con Edison (b) |
| (Millions of Dollars) | (Millions of Dollars) | 2022 | 2021 | 2022 | 2021 | 2022 | 2021 | 2022 | 2021 | 2022 | 2021 | 2022 | 2021 | (Millions of Dollars) | 2023 | 2022 | 2023 | 2022 | 2023 | 2022 | 2023 | 2022 | 2023 | 2022 | 2023 | 2022 |
| ASSETS | ASSETS | | | | | | | | | | | |
| Current assets | |
| Current assets | |
| Current assets | Current assets | $5,247 | $4,703 | $332 | $290 | $879 | $542 | $4 | $2 | $6,510 | $14 | $12,972 | $5,551 | $5,981 | $5,247 | $302 | $332 | $— | $879 | $25 | $4 | $229 | $6,510 | $6,537 | $12,972 |
| Investments | Investments | 539 | 608 | 20 | 26 | — | | — | | 286 | 223 | (4) | (4) | 841 | 853 | Investments | 608 | 539 | 22 | 20 | — | | — | — | | 365 | 365 | 286 | 4 | (4) | 999 | 841 |
| Net plant | Net plant | 44,011 | 41,613 | 2,738 | 2,599 | 4,718 | 4,367 | 17 | 17 | (4,718) | — | | 46,766 | 48,596 | Net plant | 46,648 | 44,011 | 2,943 | 2,738 | — | 4,718 | 17 | 17 | — | (4,718) | | 49,608 | 49,608 | 46,766 |
| Other noncurrent assets | Other noncurrent assets | 7,648 | 5,731 | 421 | 377 | 1,627 | 1,645 | 7 | 7 | (1,217) | 356 | 8,486 | 8,116 | Other noncurrent assets | 8,363 | 7,648 | 408 | 421 | — | 1,627 | 7 | 7 | 409 | (1,217) | 9,187 | 8,486 |
| Total Assets | Total Assets | $57,445 | $52,655 | $3,511 | $3,292 | $7,224 | $6,554 | $314 | $249 | $571 | $366 | $69,065 | $63,116 | Total Assets | $61,600 | $57,445 | $3,675 | $3,511 | $— | $7,224 | $414 | $314 | $642 | $571 | $66,331 | $69,065 |
| | LIABILITIES AND SHAREHOLDERS' EQUITY | LIABILITIES AND SHAREHOLDERS' EQUITY | | | | | | | | | | |
| LIABILITIES AND SHAREHOLDERS' EQUITY | |
| LIABILITIES AND SHAREHOLDERS' EQUITY | |
| Current liabilities | |
| Current liabilities | |
| Current liabilities | Current liabilities | $6,036 | $4,321 | $409 | $372 | $1,596 | $1,011 | $163 | $100 | $3,132 | $(377) | $11,336 | $5,427 | $5,694 | $6,036 | $349 | $409 | $— | $1,596 | $5 | $163 | $414 | $3,132 | $6,462 | $11,336 |
| Noncurrent liabilities | Noncurrent liabilities | 15,451 | 13,640 | 1,103 | 1,064 | 338 | 121 | (86) | (90) | (113) | 14 | 16,693 | 14,749 | Noncurrent liabilities | 15,950 | 15,451 | 1,146 | 1,103 | — | 338 | (76) | (86) | (236) | (113) | 16,784 | 16,693 |
| Long-term debt | Long-term debt | 19,080 | 18,382 | 1,068 | 968 | 2,292 | 2,607 | — | — | (2,293) | 647 | 20,147 | 22,604 | Long-term debt | 20,810 | 19,080 | 1,118 | 1,068 | — | 2,292 | — | — | (1) | (2,293) | 21,927 | 20,147 |
| Equity | Equity | 16,878 | 16,312 | 931 | 888 | 2,998 | 2,815 | 237 | 239 | (155) | 82 | 20,889 | 20,336 | Equity | 19,146 | 16,878 | 1,062 | 931 | — | 2,998 | 485 | 237 | 465 | (155) | 21,158 | 20,889 |
| Total Liabilities and Equity | Total Liabilities and Equity | $57,445 | $52,655 | $3,511 | $3,292 | $7,224 | $6,554 | $314 | $249 | $571 | $366 | $69,065 | $63,116 | Total Liabilities and Equity | $61,600 | $57,445 | $3,675 | $3,511 | $— | $7,224 | $414 | $314 | $642 | $571 | $66,331 | $69,065 |
(a) IncludesOther includes the parent company, Con Edison’s tax equity investments, the deferred project held for sale and consolidation adjustments. See Note X to the financial statements in Item 8.
(b) Represents the consolidated results of operations of Con Edison and its businesses.
(c) TheOn March 1, 2023, Con Edison completed the sale of all of the stock of the Clean Energy Businesses were classified as held for sale as of December 31, 2022.. See Note W and Note X to the financial statements in Item 8.
CECONY
Current assets at December 31, 20222023 were $544$734 million higher than at December 31, 2021.2022. The change in current assets primarily reflects increases in accounts receivables, net of allowance for uncollectible accounts ($258231 million) (see “COVID-19 Regulatory Matters” in Note B to the financial statements in Item 8 and “Coronavirus Disease 2019 (COVID-19) Impacts - Accounting Considerations” and “Liquidity and Financing,“Aged Accounts Receivable Balances,” above), an increase to accrued unbilled revenue ($105 million), an increase in prepayments ($106 million), an increase in accounts receivable from affiliated companies ($100 million), an increase in cash and temporary cash investments ($136 million), higher fuel oil, gas in storage, materials and supplies, at average cost ($71 million), an increase in other receivables, net of allowance for uncollectible accounts ($2682 million) and an increase to accrued unbilledin the revenue decoupling mechanism receivable ($2426 million).
Investments at December 31, 20222023 were $69 million lowerhigher than at December 31, 2021.2022. The change in investments primarily reflects decreasesincreases in supplemental retirement income plan assets ($6063 million) and deferred income plan assets ($96 million). See "Investments" in Note A and Note E to the financial statements in Item 8.
Net plant at December 31, 20222023 was $2,398$2,637 million higher than at December 31, 2021.2022. The change in net plant primarily reflects an increase in electric ($1,7902,172 million), gas ($1,017888 million), steam ($107150 million) and general ($25
| | | | | |
86
|
CON EDISON ANNUAL REPORT 2022 |
651 million) plant balances, and an increase in construction work in progress ($283 million), offset in part by an increase in accumulated depreciation ($8241,124 million) and a decrease in construction work in progress ($100 million).
Other noncurrent assets at December 31, 20222023 were $1,917$715 million higher than at December 31, 2021.2022. The change in other noncurrent assets primarily reflects an increase in pension and retiree benefits ($1,507 million) and an increase in the regulatory assetassets for COVID-19 pandemic deferrals ($393 million), system peak reduction and energy efficiency programs ($496 million), partially offset in part by property tax reconciliation ($81258 million) and deferred derivative losses - long term ($19122 million), offset in part by a decrease in the regulatory assets for unrecognized pension and other postretirement costs ($78 million). The change in the regulatory asset also reflects the period's amortization of accounting costs. See Notes B, E, and F to the financial statements in Item 8.
| | | | | |
| CON EDISON ANNUAL REPORT 2023 | 71 |
Current liabilities at December 31, 20222023 were $1,715$342 million higherlower than at December 31, 2021.2022. The change in current liabilities primarily reflects increasesdecreases in notes payable ($939397 million), accounts payable ($478 million), deferred derivative gains ($155134 million) and accrued taxes to affiliated companies ($7988 million), offset in part by increases in long-term debt due within one year ($250 million) and customer deposits ($37 million).
Noncurrent liabilities at December 31, 20222023 were $1,811$499 million higher than at December 31, 2021.2022. The change in noncurrent liabilities primarily reflects an increaseincreases in deferred income taxes and unamortized investment tax credits ($840 million), the regulatory liabilities for unrecognizedpension and other postretirement costsbenefit deferrals ($1,536135 million), allowance for cost of removal less salvage ($104129 million) and pension and other postretirement benefit deferralsasset retirement obligations ($4321 million), offset in part by a decrease in the liabilityregulatory liabilities for pension and retiree benefitsunrecognized other postretirement costs ($143669 million) as a result of the final actuarial valuation of the pension and other retiree benefit plans, as measured at December 31, 2022, in accordance with the accounting rules for retirement benefits.. See Notes E and F to the financial statements in Item 8.
Long-term debt at December 31, 20222023 was $698$1,730 million higher than at December 31, 2021.2022. The change in long-term debt primarily reflects the November 2022 issuance2023 issuances of $700$2,000 million of debentures.debentures, offset in part by the reclassification of $250 million of long-term debt to long-term debt due within one year. See "Liquidity and Capital Resources - Cash Flows From Financing Activities" above and Note C to the financial statements in Item 8.
Equity at December 31, 20222023 was $566$2,268 million higher than at December 31, 2021.2022. The change in equity primarily reflects net income for the year ($1,3901,606 million) and capital contributions from parent ($1501,720 million) in 2022,2023, offset in part by common stock dividends to parent ($9781,056 million) in 2022.2023 and a decrease in other comprehensive income ($2 million).
O&R
Current assets at December 31, 20222023 were $42$30 million higherlower than at December 31, 2021.2022. The change in current assets primarily reflects increasesdecreases in accrued unbilled revenue ($2029 million), gas in storage, at average cost ($12 million)cash and temporary cash investments ($613 million) and accounts receivables, net of allowance for uncollectible accounts ($25 million) (see “COVID-19 Regulatory Matters” in Note B to the financial statements in Item 8 and “Coronavirus Disease 2019 (COVID-19) Impacts - Accounting Considerations”“Aged Accounts Receivable Balances,” above), offset in part by increases in revenue decoupling mechanism receivable ($13 million) and “Liquidity and Financing,” above)accounts receivable from affiliated companies ($6 million).
Net plant at December 31, 20222023 was $139$205 million higher than at December 31, 2021.2022. The change in net plant primarily reflects an increase in electric ($9180 million), gas ($5948 million), and general ($10 million) plant balances and an increase in construction work in progress ($4860 million) and a decrease in accumulated depreciation ($38 million), offset in part by an increasea decrease in accumulated depreciationgeneral ($6921 million). plant balances.
Other noncurrent assets at December 31, 20222023 were $44$13 million higherlower than at December 31, 2021.2022. The change in
other noncurrent assets primarily reflects an increasedecreases in pension and retiree benefitsregulatory assets ($5612 million) and an increase in other deferred charges and noncurrentthe fair value of derivative assets ($6 million), offset in part by a decreasean increase in regulatory assetsthe pension and retiree benefits ($186 million).
Current liabilities at December 31, 20222023 were $37$60 million higherlower than at December 31, 2020. The change in current liabilities primarily reflects an increasedecreases in accounts payables ($43 million), regulatory liabilities ($1528 million), notes payable ($13 million) and accounts payables to affiliates ($11 million), offset in part by a decrease in notes payable ($18 million) and system benefit charge ($12 million).
| | | | | |
CON EDISON ANNUAL REPORT 2022 | 87 |
Noncurrent liabilities at December 31, 20222023 were $39$43 million higher than at December 31, 2021.2022. The change in noncurrent liabilities primarily reflects an increase in the regulatory liabilities for unrecognized pensiondeferred income taxes and unamortized investment tax credits ($47 million), offset in part by a decrease in superfund and other postretirementenvironmental costs ($13 million), allowance for cost of removal less salvage ($12 million) and long-term deferred derivative gains ($93 million).
Long-term debt at December 31, 20222023 was $100$50 million higher than at December 31, 2021.2022. The change in long-term debt reflects the November 2022December 2023 issuance of $100$50 million of debentures. See "Liquidity and Capital Resources - Cash Flows From Financing Activities" above.
Equity at December 31, 20222023 was $43$131 million higher than at December 31, 2021.2022. The change in equity primarily reflects net income for the year ($8896 million) and an increase in other comprehensive incomecapital contributions from parent ($12100 million), offset in part by common stock dividends to parent ($5764 million) in 2022.2023 and a decrease in other comprehensive income ($1 million).
| | | | | |
72 | CON EDISON ANNUAL REPORT 2023 |
Con Edison Transmission
Current assets at December 31, 20222023 were $337$21 million higher than at December 31, 2021.2022. The changeincrease in current assets primarily reflects increasesan increase in other receivablescash and temporary investments ($125 million), restricted cash ($69 million), accrued unbilled revenue ($48 million), other currents assets ($42 million) and prepayments ($1125 million).
Net plantInvestments at December 31, 2022 was $3512023 were $79 million higher than at December 31, 2021.2022. The changeincrease in net plant primarilyinvestments reflects the divestiture of renewable electric projectsadditional investment in 2021.
Other noncurrent assets at December 31, 2022 were $18 million lower than at December 31, 2021. The change in other noncurrent assets primarily reflects decreases in intangible assetsNew York Transco ($7145 million) and other long noncurrent assetsnon-cash equity in earnings from allowance for funds used during construction from MVP ($27 million), offset in part by an increase in the long-term fair value of derivative assets ($7833 million).
Current liabilities at December 31, 20222023 were $585$158 million higherlower than at December 31, 2021.2022. The change in current liabilities primarily reflects increases in accounts payable ($223 million), current long term debt ($206 million) and termrepayment of an intercompany loan ($150 million), offset in part by a decrease in the fair value of derivative liabilities ($36154 million).
Noncurrent liabilities at December 31, 20222023 were $217$10 million higher than at December 31, 2021.2022. The change in noncurrent liabilities primarily reflects an increase in the accumulated deferred income taxes ($250 million), offseton earnings from investments in part by a decrease in the fair value of derivative liabilitiesNew York Transco and MVP ($309 million).
Long-term debt at December 31, 2022 was $315 million lower than at December 31, 2021. The change in long-term debt primarily reflects the timing of principal loan repayments.
Equity at December 31, 20222023 was $183$248 million higher than at December 31, 2021.2022. The change in equity primarily reflects an increase in net income for common stock ($382 million) offset in part by a decrease in noncontrolling tax equity interest ($97 million) and common stock dividendscontribution from the parent, the proceeds of which were primarily used to parent ($98 million) in 2022.repay an intercompany loan.
Clean Energy Businesses
On March 1, 2023, Con Edison Transmission
Investments at December 31, 2022 were $63 million higher than at December 31, 2021. The increase in investments primarily reflectscompleted the additional investment in NY Transco ($64 million).
Current liabilities at December 31, 2022 were $63 million higher than at December 31, 2021. The change in current liabilities primarily reflects an increase in short-term borrowings under an intercompany capital funding facility.
Noncurrent liabilities at December 31, 2022 were $4 million higher than at December 31, 2021. The change in noncurrent liabilities reflects primarilysale of all of the remeasurementstock of deferred state income taxes related to prior year dispositions ($4 million).the Clean Energy Businesses. See "Investments - 2020Note W and 2021 Partial Impairments of Investment in Mountain Valley Pipeline, LLC (MVP)” in Note AX to the financial statements in Item 8.
| | | | | |
88
|
20222023 | 73 |
Regulatory Matters
For information about the Utilities’ rate plans and other regulatory matters affecting the Companies, see “Utility Regulation” in Item 1 and Note B to the financial statements in Item 8.
Risk Factors
The Companies’ businesses are influenced by many factors that are difficult to predict, and that involve uncertainties that may materially affect actual operating results, cash flows and financial condition. See “Risk Factors” in Item 1A.
Critical Accounting Estimates
The Companies’ financial statements reflect the application of certain critical accounting estimates, which conform to accounting principles generally accepted in the United States of America. The Companies’ critical accounting estimates include assumptions applied to accounting for: pensions and other postretirement benefits, contingencies, derivative instruments, investments, allowance for uncollectible accounts receivable, asset retirement obligations and for Con Edison, the use of the hypothetical liquidation at book value method.income taxes. Also, see “Summary of Significant Accounting Policies and Other Matters” in Note A to the financial statements in Item 8.
Accounting for Pensions and Other Postretirement Benefits
The Utilities provide pensions and other postretirement benefits to substantially all of their employees and retirees. The Clean Energy Businesses and Con Edison Transmission also provideprovides such benefits to transferred employees who previously worked for the Utilities. The Companies account for these benefits in accordance with the accounting rules for retirement benefits. In addition, the Utilities apply the accounting rules for regulated operations to account for the regulatory treatment of these obligations (which, as described in Note B to the financial statements in Item 8, reconciles the amounts reflected in rates for the costs of the benefit to the costs actually incurred). In applying these accounting policies, the Companies have made critical estimates related to actuarial assumptions, including assumptions of expected returns on plan assets, discount rates, health care cost trends and future compensation. See Notes A, E and F to the financial statements in Item 8 for information about the Companies’ pension and other postretirement benefits, the actuarial assumptions, actual performance, amortization of investment and other actuarial gains and losses and calculated plan costs for 2023, 2022 2021 and 2020.2021.
The discount rate for determining the present value of future period benefit payments is determined using a model to match the durations of Aa rated (by either Moody’s or S&P) corporate bonds with the projected stream of benefit payments.
In determining the health care cost trend rate, the Companies review actual recent cost trends and projected future trends.
The cost of pension and other postretirement benefits in future periods will depend on actual returns on plan assets, assumptions for future periods, contributions and benefit experience. Con Edison’s and CECONY’s current estimates for 20232024 are decreases,increases, compared with 2022,2023, in their pension and other postretirement benefits costs of $543$181 million and $515$168 million, respectively, largely driven by increasesdecreases in the discount rates used to determine plan liabilities. See Notes E and F to the financial statements in Item 8.
The following table illustrates the effect on 20232024 pension and other postretirement costs of changing the critical actuarial assumptions, while holding all other actuarial assumptions constant:
| | | | | |
74 | CON EDISON ANNUAL REPORT 2022 | 892023 |
| | Actuarial Assumption | Actuarial Assumption | Change in
Assumption | Pension | Other
Postretirement
Benefits | Total | Actuarial Assumption | Change in
Assumption | Pension | Other
Postretirement
Benefits | Total |
| | | | (Millions of Dollars) | | | (Millions of Dollars) |
| Increase in accounting cost: | Increase in accounting cost: | |
| Discount rate | Discount rate | |
| Discount rate | |
| Discount rate | |
| Con Edison | |
| Con Edison | |
| Con Edison | Con Edison | (0.25) | % | $36 | $2 | $38 | (0.25) | % | $37 | $2 | $39 |
| CECONY | CECONY | (0.25) | % | $34 | $1 | $35 | CECONY | (0.25) | % | $36 | $2 | $38 |
| Expected return on plan assets | Expected return on plan assets | |
| Con Edison | Con Edison | (0.25) | % | $41 | $3 | $44 |
| Con Edison | |
| Con Edison | | (0.25) | % | $42 | $3 | $45 |
| CECONY | | CECONY | (0.25) | % | $40 | $2 | $42 |
| Future compensation increases | |
| Con Edison | |
| Con Edison | |
| Con Edison | | 0.50 | % | $29 | $— | | $29 |
| CECONY | CECONY | (0.25) | % | $39 | $2 | $41 | CECONY | 0.50 | % | $28 | $— | | $28 | $28 |
| Health care trend rate | Health care trend rate | |
| Con Edison | |
| Con Edison | |
| Con Edison | Con Edison | 1.00 | % | $— | | $20 | 1.00 | % | $— | | $10 | $10 |
| CECONY | CECONY | 1.00 | % | $— | | $18 | CECONY | 1.00 | % | $— | | $8 | $8 |
| Increase in projected benefit obligation: | Increase in projected benefit obligation: | |
| Discount rate | Discount rate | |
| Discount rate | |
| Discount rate | |
| Con Edison | |
| Con Edison | |
| Con Edison | | (0.25) | % | $396 | $25 | $421 |
| CECONY | | CECONY | (0.25) | % | $377 | $21 | $398 |
| Future compensation increases | |
| Con Edison | |
| Con Edison | |
| Con Edison | Con Edison | (0.25) | % | $375 | $25 | $400 | 0.50 | % | $138 | $— | | $138 | $138 |
| CECONY | CECONY | (0.25) | % | $356 | $21 | $377 | CECONY | 0.50 | % | $135 | $— | | $135 | $135 |
| Health care trend rate | Health care trend rate | |
| Con Edison | Con Edison | 1.00 | % | $— | | $117 |
| Con Edison | |
| Con Edison | | 1.00 | % | $— | | $62 |
| CECONY | CECONY | 1.00 | % | $— | | $103 | CECONY | 1.00 | % | $— | | $49 | $49 |
A 5 percentage point variation in the actual annual return in 2023,2024, as compared with the expected annual asset return of 6.75 percent, would change pension and other postretirement benefit costs for Con Edison and CECONY by approximately $26$27 million and $25 million, respectively, in 2024.2025.
Pension benefits are provided through a pension plan maintained by Con Edison to which CECONY, O&R the Clean Energy Businesses and Con Edison Transmission may make contributions for their participating employees. Pension accounting by the Utilities includes an allocation of plan assets.
The Companies’ policy is to fund their pension and other postretirement benefit accounting costs to the extent tax deductible, and for the Utilities, to the extent these costs are recovered under their rate plans. The Companies were not required to make cash contributions to the pension plan in 20222023 under funding regulations and tax laws. However, CECONY and O&R made discretionary contributions to the pension plan in 20222023 of $17$18 million and $13$3 million, respectively. In 2023,2024, CECONY and O&R expect to make contributions to the pension plan of $8$9 million and $2 million, respectively. See “Expected Contributions” in Notes E and F to the financial statements in Item 8.
Accounting for Contingencies
The accounting rules for contingencies apply to an existing condition, situation or set of circumstances involving uncertainty as to possible loss that will ultimately be resolved when one or more future events occur or fail to occur. Known material contingencies, which are described in the notes to the financial statements, include certain regulatory matters (Note B), the Utilities’ responsibility for hazardous substances, such as asbestos, PCBs and coal tar that have been used or generated in the course of operations (Note G) and other contingencies (Note H). Inputs to the estimation of the liability for such environmental remediation include the possible selected remedy for each site where investigation is ongoing, the inflation rate related to the cost of inputs to the remediation process, and for those sites where there are other potentially responsible parties, the allocation of costs to the Companies. Inputs to the estimation of the liability for certain regulatory matters include facts specific to each item and the status and progress of discussions with the applicable state regulator. Inputs to the estimation of the liability for other contingencies may include liabilities incurred for similar circumstances and the outcome of legal proceedings. In accordance with the accounting rules, the Companies have accrued estimates of losses relating to the
| | | | | |
| CON EDISON ANNUAL REPORT 2023 | 75 |
contingencies as to which loss is probable and can be reasonably estimated, and no liability has been accrued for contingencies as to which loss is not probable or cannot be reasonably estimated.
The Utilities recover costs for asbestos lawsuits, workers’ compensation and environmental remediation pursuant to their current rate plans. Generally, changes during the terms of the rate plans to the amounts accrued for these contingencies would not impact earnings.
| | | | | |
90
|
CON EDISON ANNUAL REPORT 2022 |
Accounting for Derivative Instruments
The Companies apply the accounting rules for derivatives and hedging to their derivative financial instruments. The Companies use derivative financial instruments to hedge market price fluctuations in related underlying transactions for the physical purchase and sale of electricity and gas. The Utilities are permitted by their respective regulators to reflect in rates all reasonably incurred gains and losses on these instruments. The Clean Energy Businesses have also hedged interest rate risk on certain debt securities. See “Financial and Commodity Market Risks,” below and Note P to the financial statements in Item 8.
Where the Companies are required to make mark-to-market estimates pursuant to the accounting rules, the estimates of gains and losses at a particular period end do not reflect the end results of particular transactions and will most likely not reflect the actual gain or loss at the conclusion of a transaction. Substantially all of the estimated gains or losses are based on prices supplied by external sources such as the fair value of exchange-traded futures and options and the fair value of positions for which price quotations are available through or derived from brokers or other market sources. See Note Q to the financial statements in Item 8.
Investments
The accounting rules require Con Edison to periodically evaluate its equity method investments, to determine whether they are impaired. The standard for determining whether an impairment exists and must be recorded is whether an other-than-temporary decline in carrying value has occurred. The evaluation and measurement of impairments involve uncertainties. The estimates that Con Edison makes with respect to its equity method investments are based on assumptions that management believes are reasonable, and variations in these estimates or the underlying assumptions could have a material impact on whether a triggering event is determined to exist or the amount of any such impairment. Additionally, if the projects in which Con Edison holds these investments recognize an impairment, Con Edison may record its proportionate share of that impairment loss and would evaluate its investment for an other-than-temporary decline in value.
Con Edison evaluated its equity method investments and concluded that as of December 31, 2020 and 2021 that the fair value of its investment in Mountain Valley Pipeline, LLC (MVP) declined below its carrying value and the decline is other-than-temporary. Accordingly, Con Edison recorded pre-tax impairment losses of $320 million ($223 million after tax) and $231 million ($162 million after tax) for the years ended December 31, 2020 and 2021, respectively, that reduced the carrying value of its investment in MVP from $662 million to $342 million with an associated deferred tax asset of $53 million for the year ended December 31, 2020 and from $342 million to $111 million with an additional $77 million associated deferred tax asset for the year ended December 31, 2021, totaling a deferred tax asset of $130 million at period end. See “Investments - 2020 and 2021 Partial Impairments of Investment in Mountain Valley Pipeline, LLC (MVP)” in Note A to the financial statements in Item 8.
There is risk that the fair value of Con Edison’s investment in MVP may be further or fully impaired in the future. There are ongoing legal and regulatory matters that must be resolved favorably before the project can be completed. Assumptions and estimates used to test Con Edison’s investment in MVP for impairment, including the likelihood of project completion, may change if adverse or delayed resolutions to the Project’s pending legal and regulatory challenges were to occur, which could have a material adverse effect on the fair value of Con Edison’s investment in MVP.
In May 2021, a subsidiary of Con Edison Gas Pipeline and Storage, LLC (CET) entered into a purchase and sale agreement pursuant to which the subsidiary and its joint venture partner agreed to sell their combined interests in Stagecoach Gas Services LLC (Stagecoach) for a total of $1,225 million, of which $629 million was attributed to CET for its 50 percent interest, subject to closing adjustments. The purchase and sale agreement contemplated a two-stage closing, the first of which was completed in July 2021 and the second of which was completed in November 2021.
As a result of information made available to Stagecoach as part of the sale process, Stagecoach performed impairment tests that resulted in Stagecoach recording impairment charges of $414 million for the year ended December 31, 2021. Accordingly, Con Edison recorded pre-tax impairment losses on its 50 percent interest in Stagecoach of $212 million ($147 million after-tax), including working capital and transaction cost adjustments, within "Investment income/(loss)" on Con Edison's consolidated income statement for the year ended December 31, 2021.
Stagecoach’s impairment charges and information obtained from the sales process constituted triggering events for Con Edison's investment in Stagecoach as of March 31, 2021 and June 30, 2021. Con Edison evaluated the carrying value of its investment in Stagecoach for other-than-temporary declines in value using income and market-based approaches. Con Edison determined that the carrying value of its investment in Stagecoach of $667 million
| | | | | |
CON EDISON ANNUAL REPORT 2022 | 91 |
and $630 million as of March 31, 2021 and June 30, 2021, respectively, was not impaired. The carrying value of $630 million at June 30, 2021 reflected the final sales price received in July 2021 and the remaining amount received in November 2021, including closing adjustments.
At December 31, 2022 and 2021, Con Edison’s consolidated balance sheet included investments of $841 million and $853 million, respectively. See “Investments” in Note A and Note W to the financial statements in Item 8.
Allowance for Uncollectible Accounts
The Companies develop expected loss estimates using past events data and consider current conditions and future reasonable and supportable forecasts. For the Utilities’ customer accounts receivable allowance for uncollectible accounts, past events considered include write-offs relative to customer accounts receivable; current conditions include macro-and micro-economic conditions related to trends in the local economy, bankruptcy rates and aged customer accounts receivable balances, among other factors; and forecasts about the future include assumptions related to the level of write-offs and recoveries. From January 1, 2020 to December 31, 2022,2023, the historical write-off rate was determined based on an historical weather event with a significant impact to the Companies’ service territory. During that period, Con Edison's and CECONY's allowances for uncollectible accounts increased from $70 million and $65 million, respectively to $322$360 million and $314$353 million, respectively. See "COVID-19 Regulatory Matters" in Note B and “Allowance“Allowance for Uncollectible Accounts" in Note N to the financial statements in Item 8.
Asset Retirement Obligations (AROs)
AROs are computed as the present value of the estimated costs for an asset's future retirement and are recorded in the period in which the liability is incurred. The estimated costs are capitalized as part of the related long-lived asset and depreciated over the asset's useful life. CECONY and O&R, as rate-regulated entities, recognize Regulatory Assets or Liabilities as a result of timing differences between the recording of costs and costs recovered through the ratemaking process. Because quoted market prices are not available for AROs, the Companies estimate the fair value of AROs by calculating discounted cash flows that are dependent upon various assumptions including estimated retirement dates, discount rates, inflation rates, the timing and amount of future cash outlays, and currently available technologies.
The Companies recorded asset retirement obligations associated with the removal of asbestos and asbestos-containing material in their buildings (other than the structures enclosing generating stations and substations), electric equipment and steam and gas distribution systems. The Companies also recorded asset retirement obligations relating to gas and oil pipelines abandoned in place and municipal infrastructure support. See Note T to the financial statements in Item 8.
A 1%1 percent increase in the assumed inflation rate used to value the ARO liability as of December 31, 20222023 would increase the liability by $29$40 million for Con Edison and CECONY.
Hypothetical Liquidation at Book Value (HLBV)Accounting for Income Taxes
For certain investmentsThe Companies record provisions for income taxes, deferred tax assets and liabilities, and a valuation allowance against net deferred tax assets, if any. The reporting of the Clean Energy Businesses, Con Edison has determined thattax-related assets and liabilities requires the use of HLBV accountingestimates and significant judgments by management. Deferred tax assets and liabilities are recorded to represent future effects on income taxes for temporary differences between the basis of assets for financial reporting and tax purposes. Although management believes that current estimates for deferred tax assets and liabilities are
| | | | | |
76 | CON EDISON ANNUAL REPORT 2023 |
reasonable, actual results could differ materially from these estimates for several reasons, including, but not limited to: a change in forecasted financial condition and/or results of operations; changes in income tax laws, enacted tax rates or amounts subject to income tax or state apportionments; the form, structure, and timing of asset or stock sales or dispositions; changes in the regulatory treatment of any tax reform benefits; and changes resulting from audits and examinations by taxing authorities. Valuation allowances against deferred tax assets are recorded when management concludes it is reasonablemore likely than not such asset will not be realized in future periods. Accounting for income taxes also requires that only tax benefits for positions taken or expected to be taken on tax returns that meet the more-likely-than-not recognition threshold can be recognized or continue to be recognized. Management evaluates each position solely on the technical merits and appropriatefacts and circumstances of the position, assuming that the position will be examined by a taxing authority that has full knowledge of all relevant information. Significant judgment is required to attribute incomedetermine recognition thresholds and lossthe related amount of tax benefits to be recognized. At each period end, and as new developments occur, management reevaluates its tax positions. Additional interpretations, regulations, amendments, or technical corrections related to the federal income tax equity investors. Using the HLBV method, the company's earnings from the projects are adjusted to reflect the income or loss allocable to the tax equity investors calculated based on how the project would allocate and distribute its cash if it were to sell all of its assets for their carrying amounts and liquidate atcode as a particular point in time. Under the HLBV method, the company calculates the liquidation value allocable to the tax equity investors at the beginning and end of each period based on contractual liquidation waterfall calculations and adjusts its income for the period to reflect the change in the liquidation value allocable to the tax equity investors based on the termsresult of the partnerships' operating agreements. The Clean Energy Businesses were classified as heldInflation Reduction Act, may impact the estimates for sale as of December 31, 2022.income taxes discussed above. See "Assets“Changes To Tax Laws Could Adversely Affect the Companies” in Item 1A, “Inflation Reduction Act” above, “Federal Income Tax” and Liabilities Held for Sale"“State Income Tax” in Note A Notes S and XNote L to the financial statements in Item 8.
Financial and Commodity Market Risks
The Companies are subject to various risks and uncertainties associated with financial and commodity markets. The most significant market risks include interest rate risk, commodity price risk and investment risk.
| | | | | |
92
|
CON EDISON ANNUAL REPORT 2022 |
Interest Rate Risk
The Companies' interest rate risk primarily relates to new debt financing needed to fund capital requirements, including the construction expenditures of the Utilities and maturing debt securities, and variable-rate debt. Con Edison and its subsidiaries manage interest rate risk through the issuance of mostly fixed-rate debt with varying maturities and through opportunistic refinancing of debt. The Clean Energy Businesses use interest rate swaps to exchange variable-rate project financed debt for a fixed interest rate. See Note Q to the financial statements in Item 8. Con Edison and CECONY estimate that at December 31, 2023, a 10 percent increase in interest rates applicable to its variable rate debt would result in an increase in annual interest expense of $15 million and $12 million, respectively. At December 31, 2022, Con Edison and CECONY estimated that a 10 percent increase in interest rates applicable to its variable rate debt would result in an increase in annual interest expense of $17 million and $13 million, respectively. The increase in annual interest expense pertaining to Con Edison includes $1 million attributable to the Clean Energy Businesses. Debt of the Clean Energy Businesses was classified as held for sale on Con Edison's Consolidated Balance Sheet as of December 31, 2022. See "Assets and Liabilities Held for Sale" in Note A and Note X to the financial statements in Item 8. Under CECONY’s current electric, gas and steam rate plans, variations in actual variable rate tax-exempt debt interest expense, including costs associated with the refinancing of the variable rate tax-exempt debt, are reconciled to levels reflected in rates.
Inflationary pressure has prompted the Federal Reserve to increase interest rates. Higher interest rates have resulted in, and are expected to continue to result in, increased interest expense on commercial paper, and variable-rate debt. Higher interest rates are also expected to increase interest expense on futuredebt and long-term debt issuances.
Commodity Price Risk
Con Edison’s commodity price risk primarily relates to the purchase and sale of electricity, gas and related derivative instruments. The Utilities and the Clean Energy Businesses apply risk management strategies to mitigate their related exposures. See Note P to the financial statements in Item 8.
Con Edison estimates that, as of December 31, 2023, a 10 percent decline in market prices would result in a decline in fair value of $149 million for the derivative instruments used by the Utilities to hedge purchases of electricity and gas, of which $138 million is for CECONY and $11 million is for O&R. As of December 31, 2022, Con Edison estimated that a 10 percent decline in market prices would result in a decline in fair value of $214 million for the derivative instruments used by the Utilities to hedge purchases of electricity and gas, of which $199 million is for CECONY and $15 million is for O&R. Con Edison expects that any such change in fair value would be largely offset by directionally opposite changes in the cost of the electricity and gas purchased.
The Utilities do not make any margin or profit on the electricity or gas they sell. In accordance with provisions
approved by state regulators, the Utilities generally recover from full-service customers the costs they incur for energy purchased for those customers, including gains and losses on certain derivative instruments used to hedge energy purchased and related costs. See “Recoverable Energy Costs” in Note A to the financial statements in Item 8. However, increases in electric and gas commodity prices may contribute to a slower recovery of cash from outstanding customer accounts receivable balances and increases to the allowance for uncollectible accounts, and may result in increases to write-offs of customer accounts receivable balances.
In February 2022, the NYSPSC, in response to higher customer bills, requested that CECONY enhance its efforts to mitigate customer bill volatility due to commodity price increases by reassessing its power supply billing practices and improve communications to customers regarding forecasted significant bill increases resulting from commodity price increases. In August 2022, the NYSPSC approved CECONY's March 2022 request to amend its electric tariff, effective June 1, 2022, to change how CECONY recovers the cost of electricity supplied to its full-service electric customers to reduce the likelihood of customer bill volatility by more closely aligning supply prices with CECONY's electric supply hedging positions. CECONY has also committed to provide notice to customers in cases where supply price increases could result in significantly higher bills.
In September 2022, in anticipation of commodity price volatility and potential oil supply disruption during the upcoming winter heating season, the NYSPSC requested, and CECONY and O&R have since taken, the following measures: advise their dual-fuel customers and power operators to fill their alternate fuel tanks; inspect by November 1, 2022 the alternate fuel tanks of interruptible gas customers where human needs are served to ensure they have adequate alternate supply; review their emergency plans to address alternate fuel supply disruptions of interruptible gas customers during peak gas demand; and promote bill payment assistance and energy use reduction programs.
The Clean Energy Businesses use a value-at-risk (VaR) model to assess the market price risk of their portfolio of electricity and gas commodity fixed-price purchase and sales commitments, physical forward contracts, generating assets and commodity derivative instruments. The Clean Energy Businesses were classified as held for sale as of December 31, 2022. See "Assets and Liabilities Held for Sale" in Note A and Note X to the financial statements in Item 8. VaR represents the potential change in fair value of the portfolio due to changes in market prices for a
| | | | | |
CON EDISON ANNUAL REPORT 20222023 | 9377 |
specified time period and confidence level. These businesses estimate VaR across their portfolio using a delta-normal variance/covariance model with a 95 percent confidence level, compare the measured VaR results against performance due to actual prices and stress test the portfolio each quarter using an assumed 30 percent price change from forecast. Since the VaR calculation involves complex methodologies and estimates and assumptions that are based on past experience, it is not necessarily indicative of future results. VaR for the portfolio, assuming a one-day holding period, for the years ended December 31, 2022 and 2021, respectively, was as follows:
| | | | | | | | |
| 95% Confidence Level, One-Day Holding Period | 2022 | 2021 |
| | (Millions of Dollars) |
| Average for the period | $1 | | $1 | |
| High | 2 | | 3 | |
| Low | — | | — | |
Investment Risk
The Companies’ investment risk relates to the investment of plan assets for their pension and other postretirement benefit plans. Con Edison's investment risk also relates to the investments of Con Edison Transmission that are accounted for under the equity method. See “Critical Accounting Estimates – Accounting for Pensions and Other Postretirement Benefits,” above and “Investments” in Note A and Notes E and F to the financial statements in Item 8.
The Companies’ current investment policy for pension plan assets includes investment targets of 2826 to 3830 percent equity securities, 42 to 60 percent debt securities, 1214 to 2230 percent alternatives. At December 31, 2022,2023, the pension plan investments consisted of 3226 percent equity securities, 4850 percent debt securities and 2024 percent alternatives.
For the Utilities’ pension and other postretirement benefit plans, regulatory accounting treatment is generally applied in accordance with the accounting rules for regulated operations. In accordance with the Statement of Policy issued by the NYSPSC and its current electric, gas and steam rate plans, CECONY defers for payment to or recovery from customers the difference between the pension and other postretirement benefit expenses and the amounts for such expenses reflected in rates. O&R also defers such difference pursuant to its NYNew York rate plans.
Environmental Matters
For information concerning climate change, environmental sustainability, potential liabilities arising from laws and regulations protecting the environment and other environmental matters, see “Environmental Matters” in Item 1 and Note G to the financial statements in Item 8.
Material Contingencies
For information concerning potential liabilities arising from the Companies’ material contingencies, see “Critical Accounting Estimates – Accounting for Contingencies,” above, and Notes B, G and H to the financial statements in Item 8.
| | | | | |
9478
|
20222023 |
Item 7A: Quantitative and Qualitative Disclosures about Market Risk
Con Edison
For information about Con Edison’s primary market risks associated with activities in derivative financial instruments, other financial instruments and derivative commodity instruments, see “Financial and Commodity Market Risks,” in Item 7 (which information is incorporated herein by reference). See also “The Companies Require Access To Capital Markets To Satisfy Funding Requirements,” in Item 1A.
CECONY
For information about CECONY’s primary market risks associated with activities in derivative financial instruments, other financial instruments and derivative commodity instruments, see “Financial and Commodity Market Risks” in Item 7 (which information is incorporated herein by reference). See also “The Companies Require Access To Capital Markets To Satisfy Funding Requirements,” in Item 1A.
| | | | | |
CON EDISON ANNUAL REPORT 20222023 | 9579 |
Item 8: Financial Statements and Supplementary Data
| | | | | |
| Financial Statements | Page |
| |
| |
| |
| |
| |
| |
| |
| |
| |
| |
| |
| |
| |
| |
| |
| |
| |
| |
| |
| |
| |
| |
| |
| |
| |
| Con Edison | |
| |
| |
CECONY | |
| |
All other schedules are omitted because they are not applicable or the required information is shown in financial statements or notes thereto.
| | | | | |
9680
|
20222023 |
Supplementary Financial Information
Selected Quarterly Financial Data for the years ended December 31, 2022 and 2021 (Unaudited)
| | | | | | | | | | | | | | |
| | 2022 |
| Con Edison | First Quarter | Second Quarter | Third Quarter | Fourth Quarter |
| | (Millions of Dollars, except per share amounts) |
| Operating revenues | $4,060 | $3,415 | $4,165 | $4,031 |
| Operating income | 799 | 387 | 889 | 550 |
| Net income for common stock | 554 | 254 | 619 | 190 |
| Basic earnings per share | $1.70 | $0.72 | $1.73 | $0.53 |
| Diluted earnings per share | $1.70 | $0.72 | $1.72 | $0.52 |
.
| | | | | | | | | | | | | | |
| | 2021 |
| Con Edison | First
Quarter | Second
Quarter | Third
Quarter | Fourth
Quarter |
| | (Millions of Dollars, except per share amounts) |
| Operating revenues | $3,677 | $2,971 | $3,613 | $3,415 |
| Operating income | 860 | 418 | 850 | 697 |
| Net income for common stock | 419 | 165 | 538 | 224 |
| Basic earnings per share | $1.23 | $0.48 | $1.52 | $0.63 |
| Diluted earnings per share | $1.22 | $0.48 | $1.52 | $0.63 |
In the opinion of Con Edison, these quarterly amounts include all adjustments, consisting only of normal recurring accruals, necessary for a fair presentation. The sum of the quarterly financial information may vary from the annual data due to rounding.
| | | | | | | | | | | | | | |
| | 2022 |
| CECONY | First Quarter | Second Quarter | Third Quarter | Fourth Quarter |
| | (Millions of Dollars) |
| Operating revenues | $3,517 | $2,906 | $3,549 | $3,296 |
| Operating income | 711 | 280 | 738 | 406 |
| Net income | 475 | 170 | 493 | 252 |
| | | | | | | | | | | | | | |
| | 2021 |
| CECONY | First
Quarter | Second
Quarter | Third
Quarter | Fourth
Quarter |
| | (Millions of Dollars) |
| Operating revenues | $3,205 | $2,486 | $3,092 | $2,932 |
| Operating income | 786 | 321 | 728 | 624 |
| Net income | 465 | 128 | 418 | 333 |
In the opinion of CECONY, these quarterly amounts include all adjustments, consisting only of normal recurring accruals, necessary for a fair presentation. The sum of the quarterly financial information may vary from the annual data due to rounding.
| | | | | |
CON EDISON ANNUAL REPORT 2022 | 97 |
Report of Management on Internal Control Over Financial Reporting
Management of Consolidated Edison, Inc. and its subsidiaries (the Company) is responsible for establishing and maintaining adequate internal control over financial reporting. Internal control over financial reporting is a process designed to provide reasonable, but not absolute, assurance regarding the reliability of financial reporting and the preparation of financial statements for external purposes in accordance with accounting principles generally accepted in the United States of America.
Because of its inherent limitations, internal control over financial reporting may not prevent or detect misstatements. Also, projections of the effectiveness of controls to future periods are subject to the risk that controls may become inadequate because of changes in conditions, or that the degree of compliance with policies or procedures may deteriorate.
Management of the Company assessed the effectiveness of internal control over financial reporting as of December 31, 2022,2023, using the criteria established by the Committee of Sponsoring Organizations of the Treadway Commission (COSO) in Internal Control — Integrated Framework (2013). Based on that assessment, management has concluded that the Company had effective internal control over financial reporting as of December 31, 2022.2023.
The effectiveness of the Company’s internal control over financial reporting as of December 31, 2022,2023, has been audited by PricewaterhouseCoopers LLP, the Company’s independent registered public accounting firm, as stated in their report which appears on the following page of this Annual Report on Form 10-K.
| | | | | |
| | /s/ Timothy P. Cawley |
| Timothy P. Cawley |
| | Chairman, President and Chief Executive Officer |
| |
| | /s/ Robert Hoglund |
| Robert Hoglund |
| | Senior Vice President and Chief Financial Officer |
February 16, 202315, 2024
| | | | | |
98
|
20222023 | 81 |
Report of Independent Registered Public Accounting Firm
To the Board of Directors and Shareholders of Consolidated Edison, Inc.:
Opinions on the Financial Statements and Internal Control over Financial Reporting
We have audited the consolidated financial statements, including the related notes and financial statement schedules,schedule, of Consolidated Edison, Inc. and its subsidiaries (the “Company”), as listed in the index appearing under Item 8 (collectively referred to as the “consolidated financial statements”). We also have audited the Company's internal control over financial reporting as of December 31, 2022,2023, based on criteria established in Internal Control - Integrated Framework (2013) issued by the Committee of Sponsoring Organizations of the Treadway Commission (COSO).
In our opinion, the consolidated financial statements referred to above present fairly, in all material respects, the financial position of the Company as of December 31, 20222023 and 2021,2022, and the results of its operations and its cash flows for each of the three years in the period ended December 31, 20222023 in conformity with accounting principles generally accepted in the United States of America. Also in our opinion, the Company maintained, in all material respects, effective internal control over financial reporting as of December 31, 2022,2023, based on criteria established in Internal Control - Integrated Framework (2013) issued by the COSO.
Basis for Opinions
The Company's management is responsible for these consolidated financial statements, for maintaining effective internal control over financial reporting, and for its assessment of the effectiveness of internal control over financial reporting, included in the accompanying Report of Management on Internal Control Over Financial Reporting. Our responsibility is to express opinions on the Company’s consolidated financial statements and on the Company's internal control over financial reporting based on our audits. We are a public accounting firm registered with the Public Company Accounting Oversight Board (United States) (PCAOB) and are required to be independent with respect to the Company in accordance with the U.S. federal securities laws and the applicable rules and regulations of the Securities and Exchange Commission and the PCAOB.
We conducted our audits in accordance with the standards of the PCAOB. Those standards require that we plan and perform the audits to obtain reasonable assurance about whether the consolidated financial statements are free of material misstatement, whether due to error or fraud, and whether effective internal control over financial reporting was maintained in all material respects.
Our audits of the consolidated financial statements included performing procedures to assess the risks of material misstatement of the consolidated financial statements, whether due to error or fraud, and performing procedures that respond to those risks. Such procedures included examining, on a test basis, evidence regarding the amounts and disclosures in the consolidated financial statements. Our audits also included evaluating the accounting principles used and significant estimates made by management, as well as evaluating the overall presentation of the consolidated financial statements. Our audit of internal control over financial reporting included obtaining an understanding of internal control over financial reporting, assessing the risk that a material weakness exists, and testing and evaluating the design and operating effectiveness of internal control based on the assessed risk. Our audits also included performing such other procedures as we considered necessary in the circumstances. We believe that our audits provide a reasonable basis for our opinions.
Definition and Limitations of Internal Control over Financial Reporting
A company’s internal control over financial reporting is a process designed to provide reasonable assurance regarding the reliability of financial reporting and the preparation of financial statements for external purposes in accordance with generally accepted accounting principles. A company’s internal control over financial reporting includes those policies and procedures that (i) pertain to the maintenance of records that, in reasonable detail, accurately and fairly reflect the transactions and dispositions of the assets of the company; (ii) provide reasonable assurance that transactions are recorded as necessary to permit preparation of financial statements in accordance with generally accepted accounting principles, and that receipts and expenditures of the company are being made only in accordance with authorizations of management and directors of the company; and (iii) provide reasonable assurance regarding prevention or timely detection of unauthorized acquisition, use, or disposition of the company’s assets that could have a material effect on the financial statements.
| | | | | |
82 | CON EDISON ANNUAL REPORT 2023 |
Because of its inherent limitations, internal control over financial reporting may not prevent or detect misstatements. Also, projections of any evaluation of effectiveness to future periods are subject to the risk that controls may become inadequate because of changes in conditions, or that the degree of compliance with the policies or procedures may deteriorate.
| | | | | |
CON EDISON ANNUAL REPORT 2022 | 99 |
Critical Audit Matters
The critical audit matter communicated below is a matter arising from the current period audit of the consolidated financial statements that was communicated or required to be communicated to the audit committee and that (i) relates to accounts or disclosures that are material to the consolidated financial statements and (ii) involved our especially challenging, subjective, or complex judgments. The communication of critical audit matters does not alter in any way our opinion on the consolidated financial statements, taken as a whole, and we are not, by communicating the critical audit matter below, providing a separate opinion on the critical audit matter or on the accounts or disclosures to which it relates.
Accounting for the Effects of Regulatory Matters
As described in Notes A and B to the consolidated financial statements, the Company applies the accounting rules for regulated operations, which specifies the economic effects that result from the causal relationship of costs and revenues in the rate-regulated environment and how these effects are to be accounted for by a regulated enterprise. As of December 31, 2022, there were $4,279 million of deferred costs included in regulatory assets and $6,401 million of regulatory liabilities awaiting potential refund or future rate reductions. Under regulatory accounting rules, if it is probable that incurred costs will be recovered in the future, those costs would be recorded as deferred charges or “regulatory assets.” Similarly, if revenues are recorded for costs expected to be incurred in the future, these revenues would be recorded as deferred credits or “regulatory liabilities.” The Company’s regulatory assets and liabilities will be recovered from customers, or applied for customer benefit, in accordance with rate provisions approved by the applicable state regulators.
The principal considerations for our determination that performing procedures relating to the accounting for the effects of regulatory matters is a critical audit matter are the significant judgment by management in determining the recoverability of certain regulatory assets and the significant auditor judgment and subjectivity in performing procedures and evaluating audit evidence relating to the recognition of regulatory assets and regulatory liabilities, including evaluating management’s judgments relating to the recoverability of certain regulatory assets.
Addressing the matter involved performing procedures and evaluating audit evidence in connection with forming our overall opinion on the consolidated financial statements. These procedures included testing the effectiveness of controls relating to management’s assessment of regulatory proceedings and the implementation of new regulatory orders or changes to existing regulatory balances. These procedures also included, among others, evaluating the reasonableness of management’s assessment of impacts arising from correspondence with regulators and changes in laws and regulations; evaluating management’s judgments related to the recoverability of regulatory assets and the establishment of regulatory liabilities; and recalculating regulatory assets and liabilities based on provisions and formulas outlined in rate orders and other correspondence with regulators.
/s/ PricewaterhouseCoopers LLP
New York, New York
February 16, 2023
We have served as the Company’s or its predecessors' auditor since 1938.
| | | | | |
100
|
CON EDISON ANNUAL REPORT 2022 |
Consolidated Edison, Inc.
Consolidated Income Statement
| | | | | | | | | | | | | | | | | |
| | For the Years Ended December 31, |
| (Millions of Dollars/Except Share Data) | 2022 | | 2021 | | 2020 |
| OPERATING REVENUES | | | | | |
| Electric | $10,522 | | $9,485 | | $8,730 |
| Gas | 3,237 | | 2,638 | | 2,269 |
| Steam | 593 | | 532 | | 508 |
| Non-utility | 1,318 | | 1,021 | | 739 |
| TOTAL OPERATING REVENUES | 15,670 | | 13,676 | | 12,246 |
| OPERATING EXPENSES | | | | | |
| Purchased power | 2,479 | | 1,835 | | 1,600 |
| Fuel | 356 | | 229 | | 156 |
| Gas purchased for resale | 1,245 | | 690 | | 527 |
| Other operations and maintenance | 3,905 | | 3,254 | | 2,814 |
| Depreciation and amortization | 2,056 | | 2,032 | | 1,920 |
| Taxes, other than income taxes | 3,005 | | 2,810 | | 2,575 |
| TOTAL OPERATING EXPENSES | 13,046 | | 10,850 | | 9,592 |
| | | | | |
| | | | | |
| OPERATING INCOME | 2,624 | | 2,826 | | 2,654 |
| OTHER INCOME (DEDUCTIONS) | | | | | |
| Investment income (loss) | 20 | | (420) | | (214) |
| Other income | 402 | | 22 | | 23 |
| Allowance for equity funds used during construction | 19 | | 21 | | 17 |
| Other deductions | (115) | | (161) | | (227) |
| TOTAL OTHER INCOME (DEDUCTIONS) | 326 | | (538) | | (401) |
| INCOME BEFORE INTEREST AND INCOME TAX EXPENSE | 2,950 | | 2,288 | | 2,253 |
| INTEREST EXPENSE | | | | | |
| Interest on long-term debt | 987 | | 930 | | 915 |
| Other interest | (99) | | (14) | | 118 |
| Allowance for borrowed funds used during construction | (36) | | (11) | | (14) |
| NET INTEREST EXPENSE | 852 | | 905 | | 1,019 |
| INCOME BEFORE INCOME TAX EXPENSE | 2,098 | | 1,383 | | 1,234 |
| INCOME TAX EXPENSE | 498 | | 190 | | 90 |
| NET INCOME | $1,600 | | $1,193 | | $1,144 |
| (Loss) Income attributable to non-controlling interest | $(60) | | $(153) | | $43 |
| NET INCOME FOR COMMON STOCK | $1,660 | | $1,346 | | $1,101 |
| Net income per common share — basic | $4.68 | | $3.86 | | $3.29 |
| Net income per common share — diluted | $4.66 | | $3.85 | | $3.28 |
| AVERAGE NUMBER OF SHARES OUTSTANDING — BASIC (IN MILLIONS) | 354.5 | | 348.4 | | 334.8 |
| AVERAGE NUMBER OF SHARES OUTSTANDING — DILUTED (IN MILLIONS) | 355.8 | | 349.4 | | 335.7 |
The accompanying notes are an integral part of these financial statements.
| | | | | |
CON EDISON ANNUAL REPORT 2022 | 101 |
Consolidated Edison, Inc.
Consolidated Statement of Comprehensive Income
| | | | | | | | | | | | | | | | | |
| | For the Years Ended December 31, |
| (Millions of Dollars) | 2022 | | 2021 | | 2020 |
| NET INCOME | $1,600 | | $1,193 | | $1,144 |
| LOSS (INCOME) ATTRIBUTABLE TO NON-CONTROLLING INTEREST | 60 | | 153 | | (43) |
| OTHER COMPREHENSIVE INCOME (LOSS), NET OF TAXES | | | | | |
| Pension and other postretirement benefit plan liability adjustments, net of taxes | 16 | | 30 | | (6) |
| Other income, net of taxes | 1 | | — | | — |
| TOTAL OTHER COMPREHENSIVE INCOME (LOSS), NET OF TAXES | 17 | | 30 | | (6) |
| COMPREHENSIVE INCOME | $1,677 | | $1,376 | | $1,095 |
The accompanying notes are an integral part of these financial statements.
| | | | | |
102
|
CON EDISON ANNUAL REPORT 2022 |
Consolidated Edison, Inc.
Consolidated Statement of Cash Flows
| | | | | | | | | | | |
| | For the Years Ended December 31, |
| (Millions of Dollars) | 2022 | 2021 | 2020 |
| OPERATING ACTIVITIES | | | |
| Net Income | $1,600 | $1,193 | $1,144 |
| PRINCIPAL NON-CASH CHARGES/(CREDITS) TO INCOME | | | |
| Depreciation and amortization | 2,056 | 2,032 | 1,920 |
| Impairment of assets | — | 443 | 320 |
| Deferred income taxes | 435 | 133 | 85 |
| | | |
| | | |
| Net derivative (gains)/losses | (181) | (53) | 57 |
| | | |
| | | |
| | | |
| Other non-cash items, net | 163 | 111 | (8) |
| CHANGES IN ASSETS AND LIABILITIES | | | |
| Accounts receivable - customers | (285) | (411) | (543) |
| Unbilled revenue and net unbilled revenue deferrals | (96) | (53) | (1) |
| Allowance for uncollectible accounts – customers | 5 | 169 | 78 |
| | | |
| Materials and supplies, including fuel oil and gas in storage | (111) | (82) | (4) |
| | | |
| Prepayments, other receivables and other current assets | 31 | (234) | (179) |
| | | |
| | | |
| Accounts payable | 558 | 44 | 170 |
| Pensions and retiree benefits obligations, net | 176 | 266 | 285 |
| Pensions and retiree benefits contributions | (39) | (472) | (478) |
| | | |
| Accrued taxes | 7 | (46) | 74 |
| | | |
| | | |
| Distributions from equity investments | 20 | 18 | 39 |
| System benefit charge | (41) | (34) | (119) |
| Deferred charges, noncurrent assets, leases, net and other regulatory assets | (870) | (496) | (686) |
| Deferred credits, noncurrent liabilities and other regulatory liabilities | 423 | 248 | (58) |
| Other current liabilities | 84 | (43) | 102 |
| NET CASH FLOWS FROM OPERATING ACTIVITIES | 3,935 | 2,733 | 2,198 |
| INVESTING ACTIVITIES | | | |
| Utility construction expenditures | (3,824) | (3,630) | (3,326) |
| Cost of removal less salvage | (337) | (323) | (310) |
| Non-utility construction expenditures | (344) | (323) | (583) |
| | | |
| Investments in electric and gas transmission projects | (64) | (30) | (3) |
| Investments in/acquisitions of renewable electric projects | — | — | (24) |
| | | |
| | | |
| Proceeds from sale of assets | — | 629 | — |
| | | |
| | | |
| Divestiture of renewable electric projects | — | 183 | — |
| Other investing activities | 4 | 10 | 22 |
| NET CASH FLOWS USED IN INVESTING ACTIVITIES | (4,565) | (3,484) | (4,224) |
| FINANCING ACTIVITIES | | | |
| Net (payment)/issuance of short-term debt | 1,702 | (382) | 178 |
| Issuance of long-term debt | 800 | 2,804 | 2,925 |
| Retirement of long-term debt | (406) | (1,960) | (518) |
| Debt issuance costs | (13) | (40) | (47) |
| Common stock dividends | (1,089) | (1,030) | (975) |
| Issuance of common shares - public offering | — | 775 | 640 |
| Issuance of common shares for stock plans | 57 | 60 | 58 |
| Distribution to noncontrolling interest | (37) | (23) | (16) |
| Sale of equity interest | — | 257 | — |
| NET CASH FLOWS FROM FINANCING ACTIVITIES | 1,014 | 461 | 2,245 |
| CASH, TEMPORARY CASH INVESTMENTS AND RESTRICTED CASH: | | | |
| NET CHANGE FOR THE PERIOD | 384 | (290) | 219 |
| BALANCE AT BEGINNING OF PERIOD | 1,146 | 1,436 | 1,217 |
| BALANCE AT END OF PERIOD | $1,530 | $1,146 | $1,436 |
| LESS: CHANGE IN CASH BALANCES HELD FOR SALE | 248 | | — | | — | |
| BALANCE AT END OF PERIOD EXCLUDING HELD FOR SALE | $1,282 | $1,146 | $1,436 |
| | | |
| SUPPLEMENTAL DISCLOSURE OF CASH INFORMATION | | | |
| Cash paid/(received) during the period for: | | | |
| Interest | $900 | $924 | $920 |
| Income taxes | $47 | $9 | $38 |
| SUPPLEMENTAL DISCLOSURE OF NON-CASH INFORMATION | | | |
| Construction expenditures in accounts payable | $681 | $457 | $478 |
| Issuance of common shares for dividend reinvestment | $31 | $49 | $48 |
| | | |
| Software licenses acquired but unpaid as of end of period | $2 | $23 | $51 |
| Equipment acquired but unpaid as of end of period | $17 | $22 | $28 |
The accompanying notes are an integral part of these financial statements.
| | | | | |
CON EDISON ANNUAL REPORT 2022 | 103 |
Consolidated Edison, Inc.
Consolidated Balance Sheet
| | | | | | | | | | | |
| (Millions of Dollars) | December 31, 2022 | | December 31, 2021 |
| ASSETS | | | |
| CURRENT ASSETS | | | |
| Cash and temporary cash investments | $1,282 | | $992 |
| | | |
| Accounts receivable — customers, net allowance for uncollectible accounts of $322 and $317 in 2022 and 2021, respectively | 2,192 | | 1,943 |
| Other receivables, net allowance for uncollectible accounts of $10 and $22 in 2022 and 2021, respectively | 164 | | 298 |
| Taxes receivable | 10 | | 13 |
| Accrued unbilled revenue | 702 | | 662 |
| Fuel oil, gas in storage, materials and supplies, at average cost | 492 | | 437 |
| Prepayments | 264 | | 295 |
| Regulatory assets | 305 | | 206 |
| | | |
| Restricted cash | — | | 154 |
| Revenue decoupling mechanism receivable | 164 | | 190 |
| Fair value of derivative assets | 59 | | 128 |
| Assets held for sale | 7,162 | | — |
| Other current assets | 176 | | 233 |
| TOTAL CURRENT ASSETS | 12,972 | | 5,551 |
| INVESTMENTS | 841 | | 853 |
| UTILITY PLANT, AT ORIGINAL COST | | | |
| Electric | 36,819 | | 34,938 |
| Gas | 13,378 | | 12,303 |
| Steam | 2,935 | | 2,828 |
| General | 4,205 | | 4,170 |
| TOTAL | 57,337 | | 54,239 |
| Less: Accumulated depreciation | 13,069 | | 12,177 |
| Net | 44,268 | | 42,062 |
| Construction work in progress | 2,484 | | 2,152 |
| NET UTILITY PLANT | 46,752 | | 44,214 |
| NON-UTILITY PLANT | | | |
| Non-utility property, net accumulated depreciation of $23 and $626 in 2022 and 2021, respectively | 13 | | 4,194 |
| Construction work in progress | 1 | | 188 |
| NET PLANT | 46,766 | | 48,596 |
| OTHER NONCURRENT ASSETS | | | |
| Goodwill | 408 | | 439 |
| Intangible assets, net accumulated amortization of $297 in 2021 | — | | 1,293 |
| Operating lease right-of-use-asset | 568 | | 809 | |
| Regulatory assets | 3,974 | | 3,639 |
| Pension and Retiree Benefits | 3,269 | | 1,654 |
| Fair value of derivative assets | 85 | | 77 |
| Other deferred charges and noncurrent assets | 182 | | 205 |
| TOTAL OTHER NONCURRENT ASSETS | 8,486 | | 8,116 |
| TOTAL ASSETS | $69,065 | | $63,116 |
The accompanying notes are an integral part of these financial statements.
| | | | | |
104
|
CON EDISON ANNUAL REPORT 2022 |
Consolidated Edison, Inc.
Consolidated Balance Sheet
| | | | | | | | | | | |
| (Millions of Dollars) | December 31, 2022 | | December 31, 2021 |
| LIABILITIES AND SHAREHOLDERS’ EQUITY | | | |
| CURRENT LIABILITIES | | | |
| Long-term debt due within one year | $649 | | $440 |
| Term Loan | 400 | | — |
| Notes payable | 2,640 | | 1,488 |
| Accounts payable | 1,955 | | 1,497 |
| Customer deposits | 358 | | 300 |
| Accrued taxes | 102 | | 104 |
| Accrued interest | 153 | | 151 |
| Accrued wages | 116 | | 113 |
| Fair value of derivative liabilities | 42 | | 152 |
| Regulatory liabilities | 374 | | 185 |
| | | |
| System benefit charge | 390 | | 423 |
| Operating lease liabilities | 103 | | 113 |
| Liabilities held for sale | 3,610 | | — |
| Other current liabilities | 444 | | 461 |
| TOTAL CURRENT LIABILITIES | 11,336 | | 5,427 |
| NONCURRENT LIABILITIES | | | |
| Provision for injuries and damages | 181 | | 183 |
| Pensions and retiree benefits | 577 | | 737 |
| Superfund and other environmental costs | 997 | | 940 |
| Asset retirement obligations | 500 | | 577 |
| Fair value of derivative liabilities | 13 | | 84 |
| Deferred income taxes and unamortized investment tax credits | 7,641 | | 6,873 |
| Operating lease liabilities | 476 | | 717 |
| Regulatory liabilities | 6,027 | | 4,381 |
| Other deferred credits and noncurrent liabilities | 281 | | 257 |
| TOTAL NONCURRENT LIABILITIES | 16,693 | | 14,749 |
| LONG-TERM DEBT | 20,147 | | 22,604 |
| COMMITMENTS, CONTINGENCIES, AND GUARANTEES (Note B, Note G, and Note H) | | | |
| EQUITY | | | |
| Common shareholders’ equity | 20,687 | | 20,037 |
| Noncontrolling interest | 202 | | 299 |
| TOTAL EQUITY (See Statement of Equity) | 20,889 | | 20,336 |
| TOTAL LIABILITIES AND EQUITY | $69,065 | | $63,116 |
The accompanying notes are an integral part of these financial statements.
| | | | | |
CON EDISON ANNUAL REPORT 2022 | 105 |
Consolidated Edison, Inc.
Consolidated Statement of Equity
| | | | | | | | | | | | | | | | | | | | | | | | | | | | | | | | |
| (In Millions, except for dividends per share) | Common Stock | Additional Paid-In Capital | Retained Earnings | Treasury Stock | Capital Stock Expense | Accumulated Other Comprehensive Income/(Loss) | Noncontrolling Interest | |
| Shares | Amount | Shares | Amount | Total |
| | | | | | | | | | |
| | | | | | | | | | |
| | | | | | | | | | |
| | | | | | | | | | |
| | | | | | | | | | |
| | | | | | | | | | |
| | | | | | | | | | |
| | | | | | | | | | |
| | | | | | | | | | |
| | | | | | | | | | |
| | | | | | | | | | |
| | | | | | | | | | |
| | | | | | | | | | |
| | | | | | | | | | |
| | | | | | | | | | |
| | | | | | | | | | |
| | | | | | | | | | |
| | | | | | | | | | |
| | | | | | | | | | |
| | | | | | | | | | |
| | | | | | | | | | |
| | | | | | | | | | |
| | | | | | | | | | |
| | | | | | | | | | |
| | | | | | | | | | |
| | | | | | | | | | |
| | | | | | | | | | |
| | | | | | | | | | |
| | | | | | | | | | |
| | | | | | | | | | |
| | | | | | | | | | |
| | | | | | | | | | |
| | | | | | | | | | |
| | | | | | | | | | |
| BALANCE AS OF DECEMBER 31, 2019 | 333 | $35 | $8,054 | $11,100 | 23 | $(1,038) | $(110) | $(19) | $191 | $18,213 |
| Net income | | | | 1,101 | | | | | 43 | 1,144 |
| Common stock dividends ($3.06 per share) | | | | (1,023) | | | | | | (1,023) |
| Issuance of common shares - public offering | 9 | 1 | 641 | | | | (2) | | | 640 |
| Issuance of common shares for stock plans | | | 113 | | | | | | | 113 |
| Other comprehensive income | | | | | | | | (6) | | (6) |
| Distributions to noncontrolling interests | | | | | | | | | (16) | (16) |
| BALANCE AS OF DECEMBER 31, 2020 | 342 | $36 | $8,808 | $11,178 | 23 | $(1,038) | $(112) | $(25) | $218 | $19,065 |
| Net income (loss) | | | | 1,346 | | | | | (153) | 1,193 |
| Common stock dividends ($3.10 per share) | | | | (1,079) | | | | | | (1,079) |
| Issuance of common shares - public offering | 10 | 1 | 775 | | | | (10) | | | 766 |
| Issuance of common shares for stock plans | 2 | | 127 | | | | | | | 127 |
| Other comprehensive income | | | | | | | | 30 | | 30 |
| Distributions to noncontrolling interests | | | | | | | | | (23) | (23) |
| Net proceeds from sale of equity interest | | | | | | | | | 257 | 257 |
| BALANCE AS OF DECEMBER 31, 2021 | 354 | $37 | $9,710 | $11,445 | 23 | $(1,038) | $(122) | $5 | $299 | $20,336 |
| Net income (loss) | | | | 1,660 | | | | | (60) | 1,600 |
| Common stock dividends ($3.16 per share) | | | | (1,120) | | | | | | (1,120) |
| Issuance of common shares - public offering | | | | | | | | | | — |
| Issuance of common shares for stock plans | 1 | | 93 | | | | | | | 93 |
| Other comprehensive income | | | | | | | | 17 | | 17 |
| Distributions to noncontrolling interests | | | | | | | | | (37) | (37) |
| | | | | | | | | | |
| BALANCE AS OF DECEMBER 31, 2022 | 355 | $37 | $9,803 | $11,985 | 23 | $(1,038) | $(122) | $22 | $202 | $20,889 |
The accompanying notes are an integral part of these financial statements.
| | | | | |
106
|
CON EDISON ANNUAL REPORT 2022 |
Consolidated Edison, Inc.
Consolidated Statement of Capitalization
| | | | | | | | | | | | | | | | | | | | | | | | | | |
| | Shares outstanding December 31, | | At December 31, | |
| (In Millions) | 2022 | | 2021 | | 2022 | | 2021 | |
| TOTAL EQUITY BEFORE ACCUMULATED OTHER COMPREHENSIVE INCOME (LOSS) | 355 | | 354 | | $20,665 | | $20,032 | |
| Pension plan liability adjustments, net of taxes | | | | | 23 | | 7 | |
| Unrealized gains/(losses) on derivatives qualified as cash flow hedges, less reclassification adjustment for gains/(losses) included in net income and reclassification adjustment for unrealized losses included in regulatory assets, net of taxes | | | | | (1) | | (2) | |
| TOTAL ACCUMULATED OTHER COMPREHENSIVE INCOME (LOSS), NET OF TAXES | | | | | 22 | | 5 | |
| Equity | | | | | 20,687 | | 20,037 | |
| Noncontrolling interest | | | | | 202 | | 299 | |
| TOTAL EQUITY (See Statement of Equity) | | | | | $20,889 | | $20,336 | |
The accompanying notes are an integral part of these financial statements.
| | | | | |
CON EDISON ANNUAL REPORT 2022 | 107 |
Consolidated Edison, Inc.
Consolidated Statement of Capitalization
| | | | | | | | | | | | | | | | | | | | | | | |
LONG-TERM DEBT (Millions of Dollars) | | | | At December 31, |
| Maturity | Interest Rate | | Series | | 2022 | | 2021 |
| DEBENTURES: | | | | | | | |
| | | | | | | |
| | | | | | | |
| | | | | | | |
| 2023 | 0.65 | | 2020A | | $650 | | $650 |
| 2024 | 3.30 | | 2014B | | 250 | | 250 |
| 2026 | 2.90 | | 2016B | | 250 | | 250 |
| 2027 | 6.50 | | 1997F | | 80 | | 80 |
| 2027 | 3.125 | | 2017B | | 350 | | 350 |
| 2028 | 3.80 | | 2018A | | 300 | | 300 |
| 2028 | 4.00 | | 2018D | | 500 | | 500 |
| 2029 | 2.94 | | 2019B | | 44 | | 44 |
| 2030 | 3.35 | | 2020A | | 600 | | 600 |
| 2030 | 2.02 | | 2020A | | 35 | | 35 | |
| 2031 | 2.40 | | 2021A | | 900 | | 900 |
| 2031 | 2.31 | | 2021A | | 45 | | 45 |
| 2032 | 5.70 | | 2022A | | 100 | | — |
| 2033 | 5.875 | | 2003A | | 175 | | 175 |
| 2033 | 5.10 | | 2003C | | 200 | | 200 |
| 2034 | 5.70 | | 2004B | | 200 | | 200 |
| 2035 | 5.30 | | 2005A | | 350 | | 350 |
| 2035 | 5.25 | | 2005B | | 125 | | 125 |
| 2036 | 5.85 | | 2006A | | 400 | | 400 |
| 2036 | 6.20 | | 2006B | | 400 | | 400 |
| 2036 | 5.70 | | 2006E | | 250 | | 250 |
| 2037 | 6.30 | | 2007A | | 525 | | 525 |
| 2038 | 6.75 | | 2008B | | 600 | | 600 |
| 2039 | 6.00 | | 2009B | | 60 | | 60 |
| 2039 | 5.50 | | 2009C | | 600 | | 600 |
| 2039 | 3.46 | | 2019C | | 38 | | 38 |
| 2040 | 5.70 | | 2010B | | 350 | | 350 |
| 2040 | 5.50 | | 2010B | | 115 | | 115 |
| 2042 | 4.20 | | 2012A | | 400 | | 400 |
| 2043 | 3.95 | | 2013A | | 700 | | 700 |
| 2044 | 4.45 | | 2014A | | 850 | | 850 |
| 2045 | 4.50 | | 2015A | | 650 | | 650 |
| 2045 | 4.95 | | 2015A | | 120 | | 120 |
| 2045 | 4.69 | | 2015B | | 100 | | 100 |
| 2046 | 3.85 | | 2016A | | 550 | | 550 |
| 2046 | 3.88 | | 2016A | | 75 | | 75 |
| 2047 | 3.875 | | 2017A | | 500 | | 500 |
| 2048 | 4.65 | | 2018E | | 600 | | 600 |
| 2048 | 4.35 | | 2018A | | 125 | | 125 |
| 2048 | 4.35 | | 2018B | | 25 | | 25 |
| 2049 | 4.125 | | 2019A | | 700 | | 700 |
| 2049 | 3.73 | | 2019A | | 43 | | 43 |
| 2050 | 3.95 | | 2020B | | 1,000 | | 1,000 |
| 2050 | 3.24 | | 2020B | | 40 | | 40 |
| 2051 | 3.17 | | 2021B | | 30 | | 30 |
| 2051 | 3.20 | | 2021C | | 600 | | 600 |
| 2052 | 6.15 | | 2022A | | 700 | | — |
| 2054 | 4.63 | | 2014C | | 750 | | 750 |
| 2056 | 4.30 | | 2016C | | 500 | | 500 |
| 2057 | 4.00 | | 2017C | | 350 | | 350 |
| 2058 | 4.50 | | 2018B | | 700 | | 700 |
| | | | | |
108
|
CON EDISON ANNUAL REPORT 2022 |
| | | | | | | | | | | | | | | | | | | | | | | |
| 2059 | 3.70 | | 2019B | | 600 | | 600 |
| 2060 | 3.00 | | 2020C | | 600 | | 600 |
| 2061 | 3.60 | | 2021B | | 750 | | 750 |
| TOTAL DEBENTURES | 20,550 | | 19,750 |
| | | | | | | |
Consolidated Edison, Inc.
Consolidated Statement of Capitalization
| | | | | | | | | | | | | | | | | | | | | | | | | | |
LONG-TERM DEBT (Millions of Dollars) | | | | At December 31, |
| Maturity | Interest Rate | | Series | | 2022 | | 2021 |
| TAX-EXEMPT DEBT - Notes issued to New York State Energy Research and Development Authority for Facilities Revenue Bonds: | | | | | | |
| | | | | | | | |
| 2036 | 3.61 | (a) | | 2010A | | 225 | | 225 |
| 2039 | 3.68 | (a) | | 2004C | | 99 | | 99 |
| 2039 | 3.63 | (a) | | 2005A | | 126 | | 126 |
| TOTAL TAX-EXEMPT DEBT | | | | | 450 | | 450 |
| PROJECT DEBT: | | | | | | | |
| 2023 | 6.91 | (b) | | Copper Mountain Solar 2 | | 179 | | 192 |
| | | | | | | | |
| 2025 | 6.91 | (b) | | Copper Mountain Solar 3 | | 229 | | 247 |
| 2026 | 5.92 | (b) | | CED Southwest | | 408 | | 418 |
| 2028 | 4.41 | | | Wind Holdings | | 87 | | 95 |
| 2028 | 6.48 | (b) | | Copper Mountain Solar 1 | | 41 | | 49 |
| 2028 | 6.42 | (b) | | CED California Texas | | 236 | | 248 |
| 2031 | 2.24 - 3.03 | (c) | | Mesquite Solar 1 | | 149 | | 165 |
| 2031-2038 | 5.25 - 4.95 | (c) | | Texas Solar 4 | | 49 | | 52 |
| 2036 | 3.94 | | | California Solar 2 | | 86 | | 88 |
| 2036 | 4.07 | | | California Solar 3 | | 77 | | 79 |
| 2037 | 4.78 | | | California Solar | | 168 | | 171 |
| 2038 | 3.82 | | | California Solar 4 | | 265 | | 271 |
| 2039 | 4.82 | | | Broken Bow II | | 64 | | 65 |
| 2040 | 4.53 | | | Texas Solar 5 | | 132 | | 135 |
| 2041 | 4.21 | | | Texas Solar 7 | | 180 | | 184 |
| 2042 | 4.45 | | | Upton County Solar | | 81 | | 83 |
| 2046 | 3.77 | | | CED Nevada Virginia | | 228 | | 228 |
| | | | | | | | |
| Other project debt | | | | | | 6 | | 7 |
| | | | | | |
| | | | | | |
| TOTAL PROJECT DEBT | | | | | 2,665 | | 2,777 |
| | | | | | | |
| Other long-term debt | | | | | (1) | | 293 |
| Unamortized debt expense | | | | | (172) | | (177) |
| Unamortized debt discount | | | | | (51) | | (49) |
| TOTAL | | | | | | 23,441 | | 23,044 |
| Less: Long-term debt due within one year | | | | | 1,002 | | 440 |
| TOTAL LONG-TERM DEBT | | | | | 22,439 | | 22,604 |
| Less: Held for sale project debt, net | | | | | 2,292 | | — |
| TOTAL LONG-TERM DEBT EXCLUDING HELD FOR SALE | | | | | 20,147 | | 22,604 |
| TOTAL CAPITALIZATION | | | | | $40,834 | | $42,641 |
(a) Rates reset weekly; December 31, 2022 rates shown.
(b) December 31, 2022 effective rates shown, reflecting variable interest rates on the debt that are reset quarterly or semi-annually. Refer to Note Q for the effect of applicable interest rate swaps.
(c) Range of rates shown reflect multiple tranches associated with the debt.
The accompanying notes are an integral part of these financial statements.
| | | | | |
CON EDISON ANNUAL REPORT 2022 | 109 |
Report of Management on Internal Control Over Financial Reporting
Management of Consolidated Edison Company of New York, Inc. and its subsidiaries (the Company) is responsible for establishing and maintaining adequate internal control over financial reporting. Internal control over financial reporting is a process designed to provide reasonable, but not absolute, assurance regarding the reliability of financial reporting and the preparation of financial statements for external purposes in accordance with accounting principles generally accepted in the United States of America.
Because of its inherent limitations, internal control over financial reporting may not prevent or detect misstatements. Also, projections of the effectiveness of controls to future periods are subject to the risk that controls may become inadequate because of changes in conditions, or that the degree of compliance with policies or procedures may deteriorate.
Management of the Company assessed the effectiveness of internal control over financial reporting as of December 31, 2022, using the criteria established by the Committee of Sponsoring Organizations of the Treadway Commission (COSO) in Internal Control – Integrated Framework (2013). Based on that assessment, management has concluded that the Company had effective internal control over financial reporting as of December 31, 2022.
The effectiveness of the Company’s internal control over financial reporting as of December 31, 2022, has been audited by PricewaterhouseCoopers LLP, the Company’s independent registered public accounting firm, as stated in their report which appears on the following page of this Annual Report on Form 10-K.
| | | | | |
| /s/ Timothy P. Cawley |
| Timothy P. Cawley |
| Chairman and Chief Executive Officer |
| |
| /s/ Robert Hoglund |
| Robert Hoglund |
| Senior Vice President and Chief Financial Officer |
February 16, 2023
| | | | | |
110
|
CON EDISON ANNUAL REPORT 2022 |
Report of Independent Registered Public Accounting Firm
To the Board of Trustees and Shareholder of Consolidated Edison Company of New York, Inc.:
Opinions on the Financial Statements and Internal Control over Financial Reporting
We have audited the consolidated financial statements, including the related notes and financial statement schedule, of Consolidated Edison Company of New York, Inc. and its subsidiaries (the “Company”) as listed in the index appearing under Item 8 (collectively referred to as the “consolidated financial statements”). We also have audited the Company's internal control over financial reporting as of December 31, 2022, based on criteria established in Internal Control - Integrated Framework (2013) issued by the Committee of Sponsoring Organizations of the Treadway Commission (COSO).
In our opinion, the consolidated financial statements referred to above present fairly, in all material respects, the financial position of the Company as of December 31, 2022 and 2021, and the results of its operations and its cash flows for each of the three years in the period ended December 31, 2022 in conformity with accounting principles generally accepted in the United States of America. Also in our opinion, the Company maintained, in all material respects, effective internal control over financial reporting as of December 31, 2022, based on criteria established in Internal Control - Integrated Framework (2013) issued by the COSO.
Basis for Opinions
The Company's management is responsible for these consolidated financial statements, for maintaining effective internal control over financial reporting, and for its assessment of the effectiveness of internal control over financial reporting, included in the accompanying Report of Management on Internal Control Over Financial Reporting. Our responsibility is to express opinions on the Company’s consolidated financial statements and on the Company's internal control over financial reporting based on our audits. We are a public accounting firm registered with the Public Company Accounting Oversight Board (United States) (PCAOB) and are required to be independent with respect to the Company in accordance with the U.S. federal securities laws and the applicable rules and regulations of the Securities and Exchange Commission and the PCAOB.
We conducted our audits in accordance with the standards of the PCAOB. Those standards require that we plan and perform the audits to obtain reasonable assurance about whether the consolidated financial statements are free of material misstatement, whether due to error or fraud, and whether effective internal control over financial reporting was maintained in all material respects.
Our audits of the consolidated financial statements included performing procedures to assess the risks of material misstatement of the consolidated financial statements, whether due to error or fraud, and performing procedures that respond to those risks. Such procedures included examining, on a test basis, evidence regarding the amounts and disclosures in the consolidated financial statements. Our audits also included evaluating the accounting principles used and significant estimates made by management, as well as evaluating the overall presentation of the consolidated financial statements. Our audit of internal control over financial reporting included obtaining an understanding of internal control over financial reporting, assessing the risk that a material weakness exists, and testing and evaluating the design and operating effectiveness of internal control based on the assessed risk. Our audits also included performing such other procedures as we considered necessary in the circumstances. We believe that our audits provide a reasonable basis for our opinions.
Definition and Limitations of Internal Control over Financial Reporting
A company’s internal control over financial reporting is a process designed to provide reasonable assurance regarding the reliability of financial reporting and the preparation of financial statements for external purposes in accordance with generally accepted accounting principles. A company’s internal control over financial reporting includes those policies and procedures that (i) pertain to the maintenance of records that, in reasonable detail, accurately and fairly reflect the transactions and dispositions of the assets of the company; (ii) provide reasonable assurance that transactions are recorded as necessary to permit preparation of financial statements in accordance with generally accepted accounting principles, and that receipts and expenditures of the company are being made only in accordance with authorizations of management and directors of the company; and (iii) provide reasonable assurance regarding prevention or timely detection of unauthorized acquisition, use, or disposition of the company’s assets that could have a material effect on the financial statements.
Because of its inherent limitations, internal control over financial reporting may not prevent or detect misstatements. Also, projections of any evaluation of effectiveness to future periods are subject to the risk that controls may become inadequate because of changes in conditions, or that the degree of compliance with the policies or procedures may deteriorate.
| | | | | |
CON EDISON ANNUAL REPORT 2022 | 111 |
Critical Audit Matters
The critical audit matter communicated below is a matter arising from the current period audit of the consolidated financial statements that was communicated or required to be communicated to the audit committee and that (i) relates to accounts or disclosures that are material to the consolidated financial statements and (ii) involved our especially challenging, subjective, or complex judgments. The communication of critical audit matters does not alter in any way our opinion on the consolidated financial statements, taken as a whole, and we are not, by communicating the critical audit matter below, providing a separate opinion on the critical audit matter or on the accounts or disclosures to which it relates.
Accounting for the Effects of Regulatory Matters
As described in Notes A and B to the consolidated financial statements, the Company applies the accounting rules for regulated operations, which specifies the economic effects that result from the causal relationship of costs and revenues in the rate-regulated environment and how these effects are to be accounted for by a regulated enterprise. As of December 31, 2022,2023, there were $3,955$4,888 million of deferred costs included in regulatory assets and $5,789$5,473 million of regulatory liabilities awaiting potential refund or future rate reductions. Under regulatory accounting rules, if it is probable that incurred costs will be recovered in the future, those costs would be recorded as deferred charges or “regulatory assets.” Similarly, if revenues are recorded for costs expected to be incurred in the future, these revenues would be recorded as deferred credits or “regulatory liabilities.” The Company’s regulatory assets and liabilities will be recovered from customers, or applied for customer benefit, in accordance with rate provisions approved by the applicable state regulatorsregulators.
The principal considerations for our determination that performing procedures relating to the accounting for the effects of regulatory matters is a critical audit matter are the significant judgment by management in determining the recoverability of certain regulatory assets and the significant auditor judgment and subjectivity in performing procedures and evaluating audit evidence relating to the recognition of regulatory assets and regulatory liabilities, including evaluating management’s judgments relating to the recoverability of certain regulatory assets.
Addressing the matter involved performing procedures and evaluating audit evidence in connection with forming our overall opinion on the consolidated financial statements. These procedures included testing the effectiveness of controls relating to management’s assessment of regulatory proceedings and the implementation of new regulatory orders or changes to existing regulatory balances. These procedures also included, among others, evaluating the reasonableness of management’s assessment of impacts arising from correspondence with regulators and changes in laws and regulations; evaluating management’s judgments related to the recoverability of regulatory assets and the establishment of regulatory liabilities; and recalculating regulatory assets and liabilities based on provisions and formulas outlined in rate orders and other correspondence with regulators.
/s/ PricewaterhouseCoopers LLP
New York, New York
February 16, 202315, 2024
We have served as the Company’s or its predecessors' auditor since 1938.
| | | | | |
| CON EDISON ANNUAL REPORT 2023 | 83 |
Consolidated Edison, Inc.
Consolidated Income Statement
| | | | | | | | | | | | | | | | | |
| | For the Years Ended December 31, |
| (Millions of Dollars/Except Share Data) | 2023 | | 2022 | | 2021 |
| OPERATING REVENUES | | | | | |
| Electric | $10,835 | | $10,522 | | $9,485 |
| Gas | 3,127 | | 3,237 | | 2,638 |
| Steam | 569 | | 593 | | 532 |
| Non-utility | 132 | | 1,318 | | 1,021 |
| TOTAL OPERATING REVENUES | 14,663 | | 15,670 | | 13,676 |
| OPERATING EXPENSES | | | | | |
| Purchased power | 2,541 | | 2,479 | | 1,835 |
| Fuel | 282 | | 356 | | 229 |
| Gas purchased for resale | 829 | | 1,245 | | 690 |
| Other operations and maintenance | 3,606 | | 3,905 | | 3,254 |
| Depreciation and amortization | 2,031 | | 2,056 | | 2,032 |
| Taxes, other than income taxes | 3,043 | | 3,005 | | 2,810 |
| TOTAL OPERATING EXPENSES | 12,332 | | 13,046 | | 10,850 |
| | | | | |
| | | | | |
| Gain on sale of the Clean Energy Businesses | 865 | | — | | — |
| OPERATING INCOME | 3,196 | | 2,624 | | 2,826 |
| OTHER INCOME (DEDUCTIONS) | | | | | |
| Investment income (loss) | 62 | | 20 | | (420) |
| Other income | 834 | | 402 | | 22 |
| Allowance for equity funds used during construction | 26 | | 19 | | 21 |
| Other deductions | (92) | | (115) | | (161) |
| TOTAL OTHER INCOME (DEDUCTIONS) | 830 | | 326 | | (538) |
| INCOME BEFORE INTEREST AND INCOME TAX EXPENSE | 4,026 | | 2,950 | | 2,288 |
| INTEREST EXPENSE (INCOME) | | | | | |
| Interest on long-term debt | 962 | | 987 | | 930 |
| Other interest expense (income) | 113 | | (99) | | (14) |
| Allowance for borrowed funds used during construction | (52) | | (36) | | (11) |
| NET INTEREST EXPENSE | 1,023 | | 852 | | 905 |
| INCOME BEFORE INCOME TAX EXPENSE | 3,003 | | 2,098 | | 1,383 |
| INCOME TAX EXPENSE | 487 | | 498 | | 190 |
| NET INCOME | $2,516 | | $1,600 | | $1,193 |
| Loss attributable to non-controlling interest | $(3) | | $(60) | | $(153) |
| NET INCOME FOR COMMON STOCK | $2,519 | | $1,660 | | $1,346 |
| Net income per common share — basic | $7.25 | | $4.68 | | $3.86 |
| Net income per common share — diluted | $7.21 | | $4.66 | | $3.85 |
| AVERAGE NUMBER OF SHARES OUTSTANDING — BASIC (IN MILLIONS) | 347.7 | | 354.5 | | 348.4 |
| AVERAGE NUMBER OF SHARES OUTSTANDING — DILUTED (IN MILLIONS) | 349.3 | | 355.8 | | 349.4 |
The accompanying notes are an integral part of these financial statements.
| | | | | |
11284
|
20222023 |
Consolidated Edison, Company of New York, Inc.
Consolidated Statement of Comprehensive Income Statement
| | | | | | | | | | | | | | | | | |
| | For the Years Ended December 31, |
| (Millions of Dollars) | 2022 | | 2021 | | 2020 |
| OPERATING REVENUES | | | | | |
| Electric | $9,751 | | $8,806 | | $8,103 |
| Gas | 2,924 | | 2,378 | | 2,036 |
| Steam | 593 | | 532 | | 508 |
| TOTAL OPERATING REVENUES | 13,268 | | 11,716 | | 10,647 |
| OPERATING EXPENSES | | | | | |
| Purchased power | 2,201 | | 1,633 | | 1,432 |
| Fuel | 356 | | 229 | | 156 |
| Gas purchased for resale | 869 | | 541 | | 426 |
| Other operations and maintenance | 3,042 | | 2,452 | | 2,269 |
| Depreciation and amortization | 1,778 | | 1,705 | | 1,598 |
| Taxes, other than income taxes | 2,887 | | 2,696 | | 2,456 |
| TOTAL OPERATING EXPENSES | 11,133 | | 9,256 | | 8,337 |
| OPERATING INCOME | 2,135 | | 2,460 | | 2,310 |
| OTHER INCOME (DEDUCTIONS) | | | | | |
| Investment and other income | 376 | | 16 | | 19 |
| Allowance for equity funds used during construction | 18 | | 19 | | 14 |
| Other deductions | (62) | | (143) | | (204) |
| TOTAL OTHER INCOME (DEDUCTIONS) | 332 | | (108) | | (171) |
| INCOME BEFORE INTEREST AND INCOME TAX EXPENSE | 2,467 | | 2,352 | | 2,139 |
| INTEREST EXPENSE | | | | | |
| Interest on long-term debt | 808 | | 759 | | 718 |
| Other interest | 47 | | 13 | | 33 |
| Allowance for borrowed funds used during construction | (33) | | (10) | | (12) |
| NET INTEREST EXPENSE | 822 | | 762 | | 739 |
| INCOME BEFORE INCOME TAX EXPENSE | 1,645 | | 1,590 | | 1,400 |
| INCOME TAX EXPENSE | 255 | | 246 | | 215 |
| NET INCOME | $1,390 | | $1,344 | | $1,185 |
| | | | | | | | | | | | | | | | | |
| | For the Years Ended December 31, |
| (Millions of Dollars) | 2023 | | 2022 | | 2021 |
| NET INCOME | $2,516 | | $1,600 | | $1,193 |
| LOSS ATTRIBUTABLE TO NON-CONTROLLING INTEREST | 3 | | 60 | | 153 |
| OTHER COMPREHENSIVE INCOME, NET OF TAXES | | | | | |
| Pension and other postretirement benefit plan liability adjustments, net of taxes | — | | 16 | | 30 |
| Other income, net of taxes | — | | 1 | | — |
| TOTAL OTHER COMPREHENSIVE INCOME, NET OF TAXES | — | | 17 | | 30 |
| COMPREHENSIVE INCOME | $2,519 | | $1,677 | | $1,376 |
The accompanying notes are an integral part of these financial statements.
| | | | | |
| CON EDISON ANNUAL REPORT 2023 | 85 |
Consolidated Edison, Inc.
Consolidated Statement of Cash Flows
| | | | | | | | | | | |
| | For the Years Ended December 31, |
| (Millions of Dollars) | 2023 | 2022 | 2021 |
| OPERATING ACTIVITIES | | | |
| Net Income | $2,516 | $1,600 | $1,193 |
| PRINCIPAL NON-CASH CHARGES/(CREDITS) TO INCOME | | | |
| Depreciation and amortization | 2,031 | 2,056 | 2,032 |
| Impairment of assets | — | — | 443 |
| Deferred income taxes | 132 | 435 | 133 |
| Rate case amortization and accruals | 92 | 73 | (16) |
| | | |
| Net derivative (gains)/losses | 12 | (181) | (53) |
| | | |
| | | |
| | | |
| Pre-tax gain on sale of the Clean Energy Businesses | (865) | — | — |
| Other non-cash items, net | (90) | 90 | 127 |
| CHANGES IN ASSETS AND LIABILITIES | | | |
| Accounts receivable - customers | (275) | (285) | (411) |
| Unbilled revenue and net unbilled revenue deferrals | (48) | (96) | (53) |
| Allowance for uncollectible accounts – customers | 38 | 5 | 169 |
| | | |
| Materials and supplies, including fuel oil and gas in storage | 38 | (111) | (82) |
| Revenue decoupling mechanism receivable | (39) | 26 | (53) |
| Other receivables and other current assets | 141 | (21) | (157) |
| | | |
| Prepayments | (200) | 26 | (24) |
| Accounts payable | (285) | 558 | 44 |
| Pensions and retiree benefits obligations, net | (201) | 176 | 266 |
| Pensions and retiree benefits contributions | (33) | (39) | (472) |
| | | |
| Accrued taxes | (13) | 7 | (46) |
| Accrued interest | (7) | 42 | 4 |
| Superfund and environmental remediation costs | (12) | (22) | (10) |
| Distributions from equity investments | 31 | 20 | 18 |
| | | |
| Deferred charges, noncurrent assets, leases, net and other regulatory assets | (1,216) | (870) | (496) |
| Deferred credits, noncurrent liabilities and other regulatory liabilities | 196 | 445 | 258 |
| Other current liabilities | 213 | 1 | (81) |
| NET CASH FLOWS FROM OPERATING ACTIVITIES | 2,156 | 3,935 | 2,733 |
| INVESTING ACTIVITIES | | | |
| Utility construction expenditures | (4,353) | (3,824) | (3,630) |
| Cost of removal less salvage | (387) | (337) | (323) |
| Non-utility construction expenditures | (141) | (344) | (323) |
| | | |
| | | |
| | | |
| | | |
| Proceeds from sale of the Clean Energy Businesses, net of cash and cash equivalents sold | 3,927 | — | 629 |
| | | |
| | | |
| Divestiture of renewable electric projects | — | — | 183 |
| Other investing activities | (49) | (60) | (20) |
| NET CASH FLOWS USED IN INVESTING ACTIVITIES | (1,003) | (4,565) | (3,484) |
| FINANCING ACTIVITIES | | | |
| Net (payment)/issuance of short-term debt | (752) | 1,702 | (382) |
| Issuance of long-term debt | 2,050 | 800 | 2,804 |
| Retirement of long-term debt | (710) | (406) | (1,960) |
| Debt issuance costs | (32) | (13) | (40) |
| Common stock dividends | (1,096) | (1,089) | (1,030) |
| Issuance of common shares - public offering | — | — | 775 |
| Issuance of common shares for stock plans | 56 | 57 | 60 |
| Repurchase of common shares | (1,000) | — | — |
| Distribution to noncontrolling interest | (4) | (37) | (23) |
| Sale of equity interest | — | — | 257 |
| NET CASH FLOWS FROM (USED IN) FINANCING ACTIVITIES | (1,488) | 1,014 | 461 |
| CASH, TEMPORARY CASH INVESTMENTS AND RESTRICTED CASH: | | | |
| NET CHANGE FOR THE PERIOD | (335) | 384 | (290) |
| BALANCE AT BEGINNING OF PERIOD | 1,530 | 1,146 | 1,436 |
| BALANCE AT END OF PERIOD | $1,195 | $1,530 | $1,146 |
| LESS: CHANGE IN CASH BALANCES HELD FOR SALE | 5 | | 248 | | — |
| BALANCE AT END OF PERIOD EXCLUDING HELD FOR SALE | $1,190 | $1,282 | $1,146 |
| | | |
| SUPPLEMENTAL DISCLOSURE OF CASH INFORMATION | | | |
| Cash paid during the period for: | | | |
| Interest | $987 | $900 | $924 |
| Income taxes | $397 | $47 | $9 |
| SUPPLEMENTAL DISCLOSURE OF NON-CASH INFORMATION | | | |
| Construction expenditures in accounts payable | $598 | $681 | $457 |
| Issuance of common shares for dividend reinvestment | $31 | $31 | $49 |
| | | |
| Software licenses acquired but unpaid as of end of period | $— | $2 | $23 |
| Equipment acquired but unpaid as of end of period | $11 | $17 | $22 |
The accompanying notes are an integral part of these financial statements.
| | | | | |
86 | CON EDISON ANNUAL REPORT 2023 |
Consolidated Edison, Inc.
Consolidated Balance Sheet
| | | | | | | | | | | |
| (Millions of Dollars) | December 31, 2023 | | December 31, 2022 |
| ASSETS | | | |
| CURRENT ASSETS | | | |
| Cash and temporary cash investments | $1,189 | | $1,282 |
| | | |
| Accounts receivable — customers, net allowance for uncollectible accounts of $360 and $322 in 2023 and 2022, respectively | 2,418 | | 2,192 |
| Other receivables, net allowance for uncollectible accounts of $13 and $10 in 2023 and 2022, respectively | 444 | | 164 |
| Taxes receivable | 1 | | 10 |
| Accrued unbilled revenue | 722 | | 702 |
| Fuel oil, gas in storage, materials and supplies, at average cost | 469 | | 492 |
| Prepayments | 470 | | 264 |
| Regulatory assets | 281 | | 305 |
| | | |
| Restricted cash | 1 | | — |
| Revenue decoupling mechanism receivable | 203 | | 164 |
| Fair value of derivative assets | 52 | | 59 |
| Assets held for sale | 163 | | 7,162 |
| Other current assets | 124 | | 176 |
| TOTAL CURRENT ASSETS | 6,537 | | 12,972 |
| INVESTMENTS | 999 | | 841 |
| UTILITY PLANT, AT ORIGINAL COST | | | |
| Electric | 39,071 | | 36,819 |
| Gas | 14,318 | | 13,378 |
| Steam | 3,085 | | 2,935 |
| General | 4,835 | | 4,205 |
| TOTAL | 61,309 | | 57,337 |
| Less: Accumulated depreciation | 14,157 | | 13,069 |
| Net | 47,152 | | 44,268 |
| Construction work in progress | 2,442 | | 2,484 |
| NET UTILITY PLANT | 49,594 | | 46,752 |
| NON-UTILITY PLANT | | | |
| Non-utility property, net accumulated depreciation of $24 and $23 in 2023 and 2022, respectively | 13 | | 13 |
| Construction work in progress | 1 | | 1 |
| NET PLANT | 49,608 | | 46,766 |
| OTHER NONCURRENT ASSETS | | | |
| Goodwill | 408 | | 408 |
| | | |
| Operating lease right-of-use-asset | 533 | | 568 | |
| Regulatory assets | 4,607 | | 3,974 |
| Pension and retiree benefits | 3,275 | | 3,269 |
| Fair value of derivative assets | 48 | | 85 |
| Other deferred charges and noncurrent assets | 316 | | 182 |
| TOTAL OTHER NONCURRENT ASSETS | 9,187 | | 8,486 |
| TOTAL ASSETS | $66,331 | | $69,065 |
The accompanying notes are an integral part of these financial statements.
| | | | | |
CON EDISON ANNUAL REPORT 20222023 | 11387 |
Consolidated Edison, Company of New York, Inc.
Consolidated Statement of Comprehensive IncomeBalance Sheet
| | | | | | | | | | | | | | | | | |
| | For the Years Ended December 31, |
| (Millions of Dollars) | 2022 | | 2021 | | 2020 |
| NET INCOME | $1,390 | | $1,344 | | $1,185 |
| OTHER COMPREHENSIVE INCOME (LOSS), NET OF TAXES | | | | | |
| Pension and other postretirement benefit plan liability adjustments, net of taxes | 3 | | 7 | | (1) |
| Other income, net of taxes | 1 | | — | | — |
| TOTAL OTHER COMPREHENSIVE INCOME (LOSS), NET OF TAXES | 4 | | 7 | | (1) |
| COMPREHENSIVE INCOME | $1,394 | | $1,351 | | $1,184 |
| | | | | | | | | | | |
| (Millions of Dollars) | December 31, 2023 | | December 31, 2022 |
| LIABILITIES AND SHAREHOLDERS’ EQUITY | | | |
| CURRENT LIABILITIES | | | |
| Long-term debt due within one year | $250 | | $649 |
| Term loan | — | | 400 |
| Notes payable | 2,288 | | 2,640 |
| Accounts payable | 1,775 | | 1,955 |
| Customer deposits | 396 | | 358 |
| Accrued taxes | 73 | | 102 |
| Accrued interest | 170 | | 153 |
| Accrued wages | 125 | | 116 |
| Fair value of derivative liabilities | 193 | | 42 |
| Regulatory liabilities | 145 | | 374 |
| | | |
| System benefit charge | 444 | | 390 |
| Operating lease liabilities | 116 | | 103 |
| Liabilities held for sale | 76 | | 3,610 |
| Other current liabilities | 411 | | 444 |
| TOTAL CURRENT LIABILITIES | 6,462 | | 11,336 |
| NONCURRENT LIABILITIES | | | |
| Provision for injuries and damages | 188 | | 181 |
| Pensions and retiree benefits | 592 | | 577 |
| Superfund and other environmental costs | 1,118 | | 997 |
| Asset retirement obligations | 522 | | 500 |
| Fair value of derivative liabilities | 121 | | 13 |
| Deferred income taxes and unamortized investment tax credits | 8,069 | | 7,641 |
| Operating lease liabilities | 429 | | 476 |
| Regulatory liabilities | 5,328 | | 6,027 |
| Other deferred credits and noncurrent liabilities | 417 | | 281 |
| TOTAL NONCURRENT LIABILITIES | 16,784 | | 16,693 |
| LONG-TERM DEBT | 21,927 | | 20,147 |
| COMMITMENTS, CONTINGENCIES, AND GUARANTEES (Note B, Note G, and Note H) | | | |
| EQUITY | | | |
| Common shareholders’ equity | 21,158 | | 20,687 |
| Noncontrolling interest | — | | 202 |
| TOTAL EQUITY (See Statement of Equity) | 21,158 | | 20,889 |
| TOTAL LIABILITIES AND EQUITY | $66,331 | | $69,065 |
The accompanying notes are an integral part of these financial statements.
| | | | | |
11488
|
20222023 |
Consolidated Edison Company of New York, Inc.
Consolidated Statement of Cash Flows | | | | | | | | | | | |
| | For the Years Ended December 31, |
| (Millions of Dollars) | 2022 | 2021 | 2020 |
| OPERATING ACTIVITIES | | | |
| Net income | $1,390 | $1,344 | $1,185 |
| PRINCIPAL NON-CASH CHARGES/(CREDITS) TO INCOME | | | |
| Depreciation and amortization | 1,778 | 1,705 | 1,598 |
| Deferred income taxes | 85 | 124 | 168 |
| | | |
| | | |
| | | |
| | | |
| Other non-cash items, net | 175 | (2) | (62) |
| CHANGES IN ASSETS AND LIABILITIES | | | |
| Accounts receivable - customers | (268) | (412) | (516) |
| Allowance for uncollectible accounts - customers | 10 | 166 | 74 |
| | | |
| | | |
| Prepayments, other receivables and other current assets | 56 | (354) | (98) |
| Accounts receivables from affiliated companies | (8) | 96 | (61) |
| | | |
| Accounts payable | 322 | 65 | 145 |
| Accounts payable to affiliated companies | (1) | (4) | 9 |
| Pensions and retiree benefits obligations, net | 182 | 283 | 253 |
| Pensions and retiree benefits contributions | (26) | (433) | (438) |
| | | |
| | | |
| Accrued taxes | 15 | (54) | 61 |
| Accrued taxes to affiliated companies | 79 | 9 | 1 |
| | | |
| System benefit charge | (33) | (32) | (112) |
| Deferred charges, noncurrent assets, leases, net and other regulatory assets | (852) | (484) | (633) |
| Deferred credits, noncurrent liabilities and other regulatory liabilities | 312 | 192 | 15 |
| Other current liabilities | 47 | (23) | 104 |
| NET CASH FLOWS FROM OPERATING ACTIVITIES | 3,263 | 2,186 | 1,693 |
| INVESTING ACTIVITIES | | | |
| Utility construction expenditures | (3,596) | (3,413) | (3,112) |
| Cost of removal less salvage | (330) | (316) | (304) |
| NET CASH FLOWS USED IN INVESTING ACTIVITIES | (3,926) | (3,729) | (3,416) |
| FINANCING ACTIVITIES | | | |
| Net (payment)/issuance of short-term debt | 939 | (299) | 523 |
| Issuance of long-term debt | 700 | 2,250 | 2,200 |
| Retirement of long-term debt | — | (640) | (350) |
| Debt issuance costs | (12) | (27) | (34) |
| Capital contribution by parent | 150 | 1,100 | 500 |
| Dividend to parent | (978) | (988) | (982) |
| NET CASH FLOWS FROM FINANCING ACTIVITIES | 799 | 1,396 | 1,857 |
| CASH, TEMPORARY CASH INVESTMENTS AND RESTRICTED CASH: | | | |
| NET CHANGE FOR THE PERIOD | 136 | (147) | 134 |
| BALANCE AT BEGINNING OF PERIOD | 920 | 1,067 | 933 |
| BALANCE AT END OF PERIOD | $1,056 | $920 | $1,067 |
| | | |
| SUPPLEMENTAL DISCLOSURE OF CASH INFORMATION | | | |
| Cash paid during the period for: | | | |
| Interest | $755 | $739 | $693 |
| Income taxes | $87 | $5 | $102 |
| SUPPLEMENTAL DISCLOSURE OF NON-CASH INFORMATION | | | |
| Construction expenditures in accounts payable | $561 | $406 | $417 |
| Software licenses acquired but unpaid as of end of period | $2 | $22 | $48 |
| Equipment acquired but unpaid as of end of period | $17 | $22 | $28 |
The accompanying notes are an integral part of these financial statements.
| | | | | |
CON EDISON ANNUAL REPORT 2022 | 115 |
Consolidated Edison, Company of New York, Inc.
Consolidated Balance SheetStatement of Equity
| | | | | | | | | | | |
| (Millions of Dollars) | December 31, 2022 | | December 31, 2021 |
| ASSETS | | | |
| CURRENT ASSETS | | | |
| Cash and temporary cash investments | $1,056 | | $920 |
| | | |
| Accounts receivable – customers, net allowance for uncollectible accounts of $314 and $304 in 2022 and 2021, respectively | 2,099 | | 1,841 |
| Other receivables, net allowance for uncollectible accounts of $7 and $19 in 2022 and 2021, respectively | 147 | | 121 |
| Taxes receivable | 5 | | 5 |
| Accrued unbilled revenue | 573 | | 549 |
| Accounts receivable from affiliated companies | 46 | | 38 |
| Fuel oil, gas in storage, materials and supplies, at average cost | 440 | | 369 |
| Prepayments | 223 | | 212 |
| Regulatory assets | 286 | | 188 |
| | | |
| Revenue decoupling mechanism receivable | 164 | | 191 |
| Fair value of derivative assets | 51 | | 71 |
| Other current assets | 157 | | 198 |
| TOTAL CURRENT ASSETS | 5,247 | | 4,703 |
| INVESTMENTS | 539 | | 608 |
| UTILITY PLANT AT ORIGINAL COST | | | |
| Electric | 34,636 | | 32,846 |
| Gas | 12,338 | | 11,321 |
| Steam | 2,935 | | 2,828 |
| General | 3,879 | | 3,854 |
| TOTAL | 53,788 | | 50,849 |
| Less: Accumulated depreciation | 12,047 | | 11,223 |
| Net | 41,741 | | 39,626 |
| Construction work in progress | 2,268 | | 1,985 |
| NET UTILITY PLANT | 44,009 | | 41,611 |
| NON-UTILITY PROPERTY | | | |
| Non-utility property, net accumulated depreciation of $25 in 2022 and 2021 | 2 | | 2 |
| NET PLANT | 44,011 | | 41,613 |
| OTHER NONCURRENT ASSETS | | | |
| Regulatory assets | 3,669 | | 3,316 |
| Operating lease right-of-use asset | 567 | | 545 |
| Pension and Retiree Benefits | 3,184 | | 1,677 |
| Fair value of derivative assets | 80 | | 56 |
| Other deferred charges and noncurrent assets | 148 | | 137 |
| TOTAL OTHER NONCURRENT ASSETS | 7,648 | | 5,731 |
| TOTAL ASSETS | $57,445 | | $52,655 |
The accompanying notes are an integral part of these financial statements.
| | | | | | | | | | | | | | | | | | | | | | | | | | | | | | | | |
| (In Millions, except for dividends per share) | Common Stock | Additional Paid-In Capital | Retained Earnings | Treasury Stock | Capital Stock Expense | Accumulated Other Comprehensive Income/(Loss) | Non-controlling
Interest | |
| Shares | Amount | Shares | Amount | Total |
| | | | | | | | | | |
| | | | | | | | | | |
| | | | | | | | | | |
| | | | | | | | | | |
| | | | | | | | | | |
| | | | | | | | | | |
| | | | | | | | | | |
| | | | | | | | | | |
| | | | | | | | | | |
| | | | | | | | | | |
| | | | | | | | | | |
| | | | | | | | | | |
| | | | | | | | | | |
| | | | | | | | | | |
| | | | | | | | | | |
| | | | | | | | | | |
| | | | | | | | | | |
| | | | | | | | | | |
| | | | | | | | | | |
| | | | | | | | | | |
| | | | | | | | | | |
| | | | | | | | | | |
| | | | | | | | | | |
| | | | | | | | | | |
| | | | | | | | | | |
| | | | | | | | | | |
| | | | | | | | | | |
| | | | | | | | | | |
| | | | | | | | | | |
| | | | | | | | | | |
| | | | | | | | | | |
| | | | | | | | | | |
| | | | | | | | | | |
| | | | | | | | | | |
| | | | | | | | | | |
| | | | | | | | | | |
| | | | | | | | | | |
| | | | | | | | | | |
| | | | | | | | | | |
| | | | | | | | | | |
| | | | | | | | | | |
| BALANCE AS OF DECEMBER 31, 2020 | 342 | $36 | $8,808 | $11,178 | 23 | $(1,038) | $(112) | $(25) | $218 | $19,065 |
| Net income (loss) | | | | 1,346 | | | | | (153) | 1,193 |
| Common stock dividends ($3.10 per share) | | | | (1,079) | | | | | | (1,079) |
| Issuance of common shares - public offering | 10 | 1 | 775 | | | | (10) | | | 766 |
| Issuance of common shares for stock plans | 2 | | 127 | | | | | | | 127 |
| Other comprehensive income | | | | | | | | 30 | | 30 |
| Distributions to noncontrolling interests | | | | | | | | | (23) | (23) |
| Net proceeds from sale of equity interest | | | | | | | | | 257 | 257 |
| BALANCE AS OF DECEMBER 31, 2021 | 354 | $37 | $9,710 | $11,445 | 23 | $(1,038) | $(122) | $5 | $299 | $20,336 |
| Net income (loss) | | | | 1,660 | | | | | (60) | 1,600 |
| Common stock dividends ($3.16 per share) | | | | (1,120) | | | | | | (1,120) |
| | | | | | | | | | |
| Issuance of common shares for stock plans | 1 | | 93 | | | | | | | 93 |
| Other comprehensive income | | | | | | | | 17 | | 17 |
| Distributions to noncontrolling interests | | | | | | | | | (37) | (37) |
| | | | | | | | | | |
| BALANCE AS OF DECEMBER 31, 2022 | 355 | $37 | $9,803 | $11,985 | 23 | $(1,038) | $(122) | $22 | $202 | $20,889 |
| Net income (loss) | | | | 2,519 | | | | | (3) | 2,516 |
| Common stock dividends ($3.24 per share) | | | | (1,127) | | | | | | (1,127) |
| | | | | | | | | | |
| Issuance of common shares for stock plans | 1 | | 89 | | | | | | | 89 |
| | | | | | | | | | |
| Common stock repurchases | (11) | | (31) | | 11 | (979) | | | | (1,010) |
| Distributions to noncontrolling interests | | | | | | | | | (4) | (4) |
| Disposal of Clean Energy Businesses | | | | | | | | | (195) | (195) |
| BALANCE AS OF DECEMBER 31, 2023 | 345 | $37 | $9,861 | $13,377 | 34 | $(2,017) | $(122) | $22 | $— | $21,158 |
| | | | | | | | | | |
| | | | | |
116
|
CON EDISON ANNUAL REPORT 2022 |
Consolidated Edison Company of New York, Inc.
Consolidated Balance Sheet
| | | | | | | | | | | |
| (Millions of Dollars) | December 31, 2022 | | December 31, 2021 |
| LIABILITIES AND SHAREHOLDER’S EQUITY | | | |
| CURRENT LIABILITIES | | | |
| | | |
| Notes payable | $2,300 | | $1,361 |
| Accounts payable | 1,763 | | 1,285 |
| Accounts payable to affiliated companies | 17 | | 18 |
| Customer deposits | 341 | | 285 |
| Accrued taxes | 93 | | 78 |
| Accrued taxes to affiliated companies | 89 | | 10 |
| Accrued interest | 134 | | 127 |
| Accrued wages | 105 | | 103 |
| Fair value of derivative liabilities | 35 | | 88 |
| Regulatory liabilities | 308 | | 134 |
| System benefit charge | 351 | | 372 |
| Operating lease liabilities | 103 | | 90 |
| Other current liabilities | 397 | | 370 |
| TOTAL CURRENT LIABILITIES | 6,036 | | 4,321 |
| NONCURRENT LIABILITIES | | | |
| Provision for injuries and damages | 177 | | 178 |
| Pensions and retiree benefits | 526 | | 669 |
| Superfund and other environmental costs | 903 | | 850 |
| Asset retirement obligations | 499 | | 504 |
| Fair value of derivative liabilities | 9 | | 40 |
| Deferred income taxes and unamortized investment tax credits | 7,144 | | 6,796 |
| Operating lease liabilities | 475 | | 462 |
| Regulatory liabilities | 5,481 | | 3,921 |
| Other deferred credits and noncurrent liabilities | 237 | | 220 |
| TOTAL NONCURRENT LIABILITIES | 15,451 | | 13,640 |
| LONG-TERM DEBT | 19,080 | | 18,382 |
| COMMITMENTS AND CONTINGENCIES (Note B and Note G) | | | |
| COMMON SHAREHOLDER’S EQUITY (See Statement of Shareholder’s Equity) | 16,878 | | 16,312 |
| TOTAL LIABILITIES AND SHAREHOLDER’S EQUITY | $57,445 | | $52,655 |
The accompanying notes are an integral part of these financial statements.
| | | | | |
CON EDISON ANNUAL REPORT 20222023 | 11789 |
Consolidated Edison, Inc.
Consolidated Statement of Capitalization
| | | | | | | | | | | | | | | | | | | | | | | | | | |
| | Shares outstanding December 31, | | At December 31, | |
| (In Millions) | 2023 | | 2022 | | 2023 | | 2022 | |
| TOTAL EQUITY BEFORE ACCUMULATED OTHER COMPREHENSIVE INCOME | 345 | | 355 | | $21,136 | | $20,665 | |
| Pension plan liability adjustments, net of taxes | | | | | 23 | | 23 | |
| Unrealized losses on derivatives qualified as cash flow hedges, less reclassification adjustment for gains/(losses) included in net income and reclassification adjustment for unrealized losses included in regulatory assets, net of taxes | | | | | (1) | | (1) | |
| TOTAL ACCUMULATED OTHER COMPREHENSIVE INCOME, NET OF TAXES | | | | | 22 | | 22 | |
| Equity | | | | | 21,158 | | 20,687 | |
| Noncontrolling interest | | | | | — | | 202 | |
| TOTAL EQUITY (See Statement of Equity) | | | | | $21,158 | | $20,889 | |
The accompanying notes are an integral part of these financial statements.
| | | | | |
90 | CON EDISON ANNUAL REPORT 2023 |
Consolidated Edison, Inc.
Consolidated Statement of Capitalization
| | | | | | | | | | | | | | | | | | | | | | | |
LONG-TERM DEBT (Millions of Dollars) | | | | At December 31, |
| Maturity | Interest Rate | | Series | | 2023 | | 2022 |
| DEBENTURES: | | | | | | | |
| | | | | | | |
| | | | | | | |
| | | | | | | |
| 2023 | 0.65 | | 2020A | | $— | | $650 |
| 2024 | 3.30 | | 2014B | | 250 | | 250 |
| 2026 | 2.90 | | 2016B | | 250 | | 250 |
| 2027 | 6.50 | | 1997F | | 80 | | 80 |
| 2027 | 3.125 | | 2017B | | 350 | | 350 |
| 2028 | 3.80 | | 2018A | | 300 | | 300 |
| 2028 | 4.00 | | 2018D | | 500 | | 500 |
| 2029 | 2.94 | | 2019B | | 44 | | 44 |
| 2030 | 3.35 | | 2020A | | 600 | | 600 |
| 2030 | 2.02 | | 2020A | | 35 | | 35 |
| 2031 | 2.40 | | 2021A | | 900 | | 900 |
| 2031 | 2.31 | | 2021A | | 45 | | 45 |
| 2032 | 5.70 | | 2022A | | 100 | | 100 |
| 2033 | 5.875 | | 2003A | | 175 | | 175 |
| 2033 | 5.10 | | 2003C | | 200 | | 200 |
| 2033 | 5.20 | | 2023A | | 500 | | — |
| 2034 | 5.70 | | 2004B | | 200 | | 200 |
| 2034 | 5.50 | | 2023B | | 600 | | — |
| 2035 | 5.30 | | 2005A | | 350 | | 350 |
| 2035 | 5.25 | | 2005B | | 125 | | 125 |
| 2036 | 5.85 | | 2006A | | 400 | | 400 |
| 2036 | 6.20 | | 2006B | | 400 | | 400 |
| 2036 | 5.70 | | 2006E | | 250 | | 250 |
| 2037 | 6.30 | | 2007A | | 525 | | 525 |
| 2038 | 6.75 | | 2008B | | 600 | | 600 |
| 2039 | 6.00 | | 2009B | | 60 | | 60 |
| 2039 | 5.50 | | 2009C | | 600 | | 600 |
| 2039 | 3.46 | | 2019C | | 38 | | 38 |
| 2040 | 5.70 | | 2010B | | 350 | | 350 |
| 2040 | 5.50 | | 2010B | | 115 | | 115 |
| 2042 | 4.20 | | 2012A | | 400 | | 400 |
| 2043 | 3.95 | | 2013A | | 700 | | 700 |
| 2044 | 4.45 | | 2014A | | 850 | | 850 |
| 2045 | 4.50 | | 2015A | | 650 | | 650 |
| 2045 | 4.95 | | 2015A | | 120 | | 120 |
| 2045 | 4.69 | | 2015B | | 100 | | 100 |
| 2046 | 3.85 | | 2016A | | 550 | | 550 |
| 2046 | 3.88 | | 2016A | | 75 | | 75 |
| 2047 | 3.875 | | 2017A | | 500 | | 500 |
| 2048 | 4.65 | | 2018E | | 600 | | 600 |
| 2048 | 4.35 | | 2018A | | 125 | | 125 |
| 2048 | 4.35 | | 2018B | | 25 | | 25 |
| 2049 | 4.125 | | 2019A | | 700 | | 700 |
| 2049 | 3.73 | | 2019A | | 43 | | 43 |
| 2050 | 3.95 | | 2020B | | 1,000 | | 1,000 |
| 2050 | 3.24 | | 2020B | | 40 | | 40 |
| 2051 | 3.17 | | 2021B | | 30 | | 30 |
| 2051 | 3.20 | | 2021C | | 600 | | 600 |
| 2052 | 6.15 | | 2022A | | 700 | | 700 |
| 2053 | 5.90 | | 2023C | | 900 | | — |
| 2053 | 6.59 | | 2023A | | 50 | | — |
| | | | | |
| CON EDISON ANNUAL REPORT 2023 | 91 |
| | | | | | | | | | | | | | | | | | | | | | | |
| 2054 | 4.625 | | 2014C | | 750 | | 750 |
| 2056 | 4.30 | | 2016C | | 500 | | 500 |
| 2057 | 4.00 | | 2017C | | 350 | | 350 |
| 2058 | 4.50 | | 2018B | | 700 | | 700 |
| 2059 | 3.70 | | 2019B | | 600 | | 600 |
| 2060 | 3.00 | | 2020C | | 600 | | 600 |
| 2061 | 3.60 | | 2021B | | 750 | | 750 |
| TOTAL DEBENTURES | $21,950 | | $20,550 |
| | | | | | | |
Consolidated Edison, Inc.
Consolidated Statement of Capitalization
| | | | | | | | | | | | | | | | | | | | | | | | | | |
LONG-TERM DEBT (Millions of Dollars) | | | | At December 31, |
| Maturity | Interest Rate | | Series | | 2023 | | 2022 |
| TAX-EXEMPT DEBT - Notes issued to New York State Energy Research and Development Authority for Facilities Revenue Bonds: | | | | | | |
| | | | | | | | |
| 2036 | 3.92 | (a) | | 2010A | | $225 | | $225 |
| 2039 | 3.83 | (a) | | 2004C | | 99 | | 99 |
| 2039 | 3.80 | (a) | | 2005A | | 126 | | 126 |
| TOTAL TAX-EXEMPT DEBT | | | | | 450 | | 450 |
| PROJECT DEBT (b): | | | | | | | |
| 2023 | 6.91 | (c) | | Copper Mountain Solar 2 | | — | | 179 |
| | | | | | | | |
| 2025 | 6.91 | (c) | | Copper Mountain Solar 3 | | — | | 229 |
| 2026 | 5.92 | (c) | | CED Southwest | | — | | 408 |
| 2028 | 4.41 | | | Wind Holdings | | — | | 87 |
| 2028 | 6.48 | (c) | | Copper Mountain Solar 1 | | — | | 41 |
| 2028 | 6.42 | (c) | | CED California Texas | | — | | 236 |
| 2031 | 2.24 - 3.03 | (d) | | Mesquite Solar 1 | | — | | 149 |
| 2031-2038 | 5.25 - 4.95 | (d) | | Texas Solar 4 | | — | | 49 |
| 2036 | 3.94 | | | California Solar 2 | | — | | 86 |
| 2036 | 4.07 | | | California Solar 3 | | — | | 77 |
| 2037 | 4.78 | | | California Solar | | — | | 168 |
| 2038 | 3.82 | | | California Solar 4 | | — | | 265 |
| 2039 | 4.82 | | | Broken Bow II | | 62 | | 64 |
| 2040 | 4.53 | | | Texas Solar 5 | | — | | 132 |
| 2041 | 4.21 | | | Texas Solar 7 | | — | | 180 |
| 2042 | 4.45 | | | Upton County Solar | | — | | 81 |
| 2046 | 3.77 | | | CED Nevada Virginia | | — | | 228 |
| | | | | | | | |
| Other project debt | | | | | | — | | 6 |
| | | | | | |
| | | | | | |
| TOTAL PROJECT DEBT | | | | | 62 | | 2,665 |
| | | | | | | |
| Other long-term debt | | | | | — | | (1) |
| Unamortized debt expense | | | | | (162) | | (172) |
| Unamortized debt discount | | | | | (60) | | (51) |
| TOTAL | | | | | | 22,240 | | 23,441 |
| Less: Long-term debt due within one year | | | | | 251 | | 1,002 |
| TOTAL LONG-TERM DEBT | | | | | 21,989 | | 22,439 |
| Less: Held for sale project debt, net (b) | | | | | 62 | | 2,292 |
| TOTAL LONG-TERM DEBT EXCLUDING HELD FOR SALE | | | | | 21,927 | | 20,147 |
| TOTAL CAPITALIZATION | | | | | $43,085 | | $40,834 |
(a) Rates reset weekly; December 31, 2023 rates shown.
(b) On March 1, 2023, Con Edison completed the sale of all of the stock of the Clean Energy Businesses. See Note W and X.
(c) March 1, 2023 effective rates shown, reflecting variable interest rates on the debt that are reset quarterly or semi-annually. Refer to Note Q for the effect of applicable interest rate swaps.
(d) Range of rates shown reflect multiple tranches associated with the debt.
The accompanying notes are an integral part of these financial statements.
| | | | | |
92 | CON EDISON ANNUAL REPORT 2023 |
Report of Management on Internal Control Over Financial Reporting
Management of Consolidated Edison Company of New York, Inc. and its subsidiaries (the Company) is responsible for establishing and maintaining adequate internal control over financial reporting. Internal control over financial reporting is a process designed to provide reasonable, but not absolute, assurance regarding the reliability of financial reporting and the preparation of financial statements for external purposes in accordance with accounting principles generally accepted in the United States of America.
Because of its inherent limitations, internal control over financial reporting may not prevent or detect misstatements. Also, projections of the effectiveness of controls to future periods are subject to the risk that controls may become inadequate because of changes in conditions, or that the degree of compliance with policies or procedures may deteriorate.
Management of the Company assessed the effectiveness of internal control over financial reporting as of December 31, 2023, using the criteria established by the Committee of Sponsoring Organizations of the Treadway Commission (COSO) in Internal Control – Integrated Framework (2013). Based on that assessment, management has concluded that the Company had effective internal control over financial reporting as of December 31, 2023.
The effectiveness of the Company’s internal control over financial reporting as of December 31, 2023, has been audited by PricewaterhouseCoopers LLP, the Company’s independent registered public accounting firm, as stated in their report which appears on the following page of this Annual Report on Form 10-K.
| | | | | |
| /s/ Timothy P. Cawley |
| Timothy P. Cawley |
| Chairman and Chief Executive Officer |
| |
| /s/ Robert Hoglund |
| Robert Hoglund |
| Senior Vice President and Chief Financial Officer |
February 15, 2024
| | | | | |
| CON EDISON ANNUAL REPORT 2023 | 93 |
Report of Independent Registered Public Accounting Firm
To the Board of Trustees and Shareholder of Consolidated Edison Company of New York, Inc.:
Opinions on the Financial Statements and Internal Control over Financial Reporting
We have audited the consolidated financial statements, including the related notes, of Consolidated Edison Company of New York, Inc. and its subsidiaries (the “Company”) as listed in the index appearing under Item 8 (collectively referred to as the “consolidated financial statements”). We also have audited the Company's internal control over financial reporting as of December 31, 2023, based on criteria established in Internal Control - Integrated Framework (2013) issued by the Committee of Sponsoring Organizations of the Treadway Commission (COSO).
In our opinion, the consolidated financial statements referred to above present fairly, in all material respects, the financial position of the Company as of December 31, 2023 and 2022, and the results of its operations and its cash flows for each of the three years in the period ended December 31, 2023 in conformity with accounting principles generally accepted in the United States of America. Also in our opinion, the Company maintained, in all material respects, effective internal control over financial reporting as of December 31, 2023, based on criteria established in Internal Control - Integrated Framework (2013) issued by the COSO.
Basis for Opinions
The Company's management is responsible for these consolidated financial statements, for maintaining effective internal control over financial reporting, and for its assessment of the effectiveness of internal control over financial reporting, included in the accompanying Report of Management on Internal Control Over Financial Reporting. Our responsibility is to express opinions on the Company’s consolidated financial statements and on the Company's internal control over financial reporting based on our audits. We are a public accounting firm registered with the Public Company Accounting Oversight Board (United States) (PCAOB) and are required to be independent with respect to the Company in accordance with the U.S. federal securities laws and the applicable rules and regulations of the Securities and Exchange Commission and the PCAOB.
We conducted our audits in accordance with the standards of the PCAOB. Those standards require that we plan and perform the audits to obtain reasonable assurance about whether the consolidated financial statements are free of material misstatement, whether due to error or fraud, and whether effective internal control over financial reporting was maintained in all material respects.
Our audits of the consolidated financial statements included performing procedures to assess the risks of material misstatement of the consolidated financial statements, whether due to error or fraud, and performing procedures that respond to those risks. Such procedures included examining, on a test basis, evidence regarding the amounts and disclosures in the consolidated financial statements. Our audits also included evaluating the accounting principles used and significant estimates made by management, as well as evaluating the overall presentation of the consolidated financial statements. Our audit of internal control over financial reporting included obtaining an understanding of internal control over financial reporting, assessing the risk that a material weakness exists, and testing and evaluating the design and operating effectiveness of internal control based on the assessed risk. Our audits also included performing such other procedures as we considered necessary in the circumstances. We believe that our audits provide a reasonable basis for our opinions.
Definition and Limitations of Internal Control over Financial Reporting
A company’s internal control over financial reporting is a process designed to provide reasonable assurance regarding the reliability of financial reporting and the preparation of financial statements for external purposes in accordance with generally accepted accounting principles. A company’s internal control over financial reporting includes those policies and procedures that (i) pertain to the maintenance of records that, in reasonable detail, accurately and fairly reflect the transactions and dispositions of the assets of the company; (ii) provide reasonable assurance that transactions are recorded as necessary to permit preparation of financial statements in accordance with generally accepted accounting principles, and that receipts and expenditures of the company are being made only in accordance with authorizations of management and directors of the company; and (iii) provide reasonable assurance regarding prevention or timely detection of unauthorized acquisition, use, or disposition of the company’s assets that could have a material effect on the financial statements.
Because of its inherent limitations, internal control over financial reporting may not prevent or detect misstatements. Also, projections of any evaluation of effectiveness to future periods are subject to the risk that controls may
| | | | | |
94 | CON EDISON ANNUAL REPORT 2023 |
become inadequate because of changes in conditions, or that the degree of compliance with the policies or procedures may deteriorate.
Critical Audit Matters
The critical audit matter communicated below is a matter arising from the current period audit of the consolidated financial statements that was communicated or required to be communicated to the audit committee and that (i) relates to accounts or disclosures that are material to the consolidated financial statements and (ii) involved our especially challenging, subjective, or complex judgments. The communication of critical audit matters does not alter in any way our opinion on the consolidated financial statements, taken as a whole, and we are not, by communicating the critical audit matter below, providing a separate opinion on the critical audit matter or on the accounts or disclosures to which it relates.
Accounting for the Effects of Regulatory Matters
As described in Notes A and B to the consolidated financial statements, the Company applies the accounting rules for regulated operations, which specifies the economic effects that result from the causal relationship of costs and revenues in the rate-regulated environment and how these effects are to be accounted for by a regulated enterprise. As of December 31, 2023, there were $4,568 million of deferred costs included in regulatory assets and $4,925 million of regulatory liabilities awaiting potential refund or future rate reductions. Under regulatory accounting rules, if it is probable that incurred costs will be recovered in the future, those costs would be recorded as deferred charges or “regulatory assets.” Similarly, if revenues are recorded for costs expected to be incurred in the future, these revenues would be recorded as deferred credits or “regulatory liabilities.” The Company’s regulatory assets and liabilities will be recovered from customers, or applied for customer benefit, in accordance with rate provisions approved by the applicable state regulators.
The principal considerations for our determination that performing procedures relating to the accounting for the effects of regulatory matters is a critical audit matter are the significant judgment by management in determining the recoverability of certain regulatory assets and the significant auditor judgment and subjectivity in performing procedures and evaluating audit evidence relating to the recognition of regulatory assets and regulatory liabilities, including evaluating management’s judgments relating to the recoverability of certain regulatory assets.
Addressing the matter involved performing procedures and evaluating audit evidence in connection with forming our overall opinion on the consolidated financial statements. These procedures included testing the effectiveness of controls relating to management’s assessment of regulatory proceedings and the implementation of new regulatory orders or changes to existing regulatory balances. These procedures also included, among others, evaluating the reasonableness of management’s assessment of impacts arising from correspondence with regulators and changes in laws and regulations; evaluating management’s judgments related to the recoverability of regulatory assets and the establishment of regulatory liabilities; and recalculating regulatory assets and liabilities based on provisions and formulas outlined in rate orders and other correspondence with regulators.
/s/ PricewaterhouseCoopers LLP
New York, New York
February 15, 2024
We have served as the Company’s auditor since 1938.
| | | | | |
| CON EDISON ANNUAL REPORT 2023 | 95 |
Consolidated Edison Company of New York, Inc.
Consolidated Income Statement
| | | | | | | | | | | | | | | | | |
| | For the Years Ended December 31, |
| (Millions of Dollars) | 2023 | | 2022 | | 2021 |
| OPERATING REVENUES | | | | | |
| Electric | $10,078 | | $9,751 | | $8,806 |
| Gas | 2,829 | | 2,924 | | 2,378 |
| Steam | 569 | | 593 | | 532 |
| TOTAL OPERATING REVENUES | 13,476 | | 13,268 | | 11,716 |
| OPERATING EXPENSES | | | | | |
| Purchased power | 2,294 | | 2,201 | | 1,633 |
| Fuel | 282 | | 356 | | 229 |
| Gas purchased for resale | 677 | | 869 | | 541 |
| Other operations and maintenance | 3,176 | | 3,042 | | 2,452 |
| Depreciation and amortization | 1,924 | | 1,778 | | 1,705 |
| Taxes, other than income taxes | 2,946 | | 2,887 | | 2,696 |
| TOTAL OPERATING EXPENSES | 11,299 | | 11,133 | | 9,256 |
| OPERATING INCOME | 2,177 | | 2,135 | | 2,460 |
| OTHER INCOME (DEDUCTIONS) | | | | | |
| Investment and other income | 759 | | 376 | | 16 |
| Allowance for equity funds used during construction | 22 | | 18 | | 19 |
| Other deductions | (49) | | (62) | | (143) |
| TOTAL OTHER INCOME (DEDUCTIONS) | 732 | | 332 | | (108) |
| INCOME BEFORE INTEREST AND INCOME TAX EXPENSE | 2,909 | | 2,467 | | 2,352 |
| INTEREST EXPENSE (INCOME) | | | | | |
| Interest on long-term debt | 886 | | 808 | | 759 |
| Other interest expense | 108 | | 47 | | 13 |
| Allowance for borrowed funds used during construction | (49) | | (33) | | (10) |
| NET INTEREST EXPENSE | 945 | | 822 | | 762 |
| INCOME BEFORE INCOME TAX EXPENSE | 1,964 | | 1,645 | | 1,590 |
| INCOME TAX EXPENSE | 358 | | 255 | | 246 |
| NET INCOME | $1,606 | | $1,390 | | $1,344 |
The accompanying notes are an integral part of these financial statements.
| | | | | |
96 | CON EDISON ANNUAL REPORT 2023 |
Consolidated Edison Company of New York, Inc.
Consolidated Statement of Shareholder’s EquityComprehensive Income
| | | | | | | | | | | | | | | | | | | | | | | | | | |
| (In Millions) | Common Stock | Additional Paid-In Capital | Retained Earnings | Repurchased Con Edison Stock | Capital Stock Expense | Accumulated Other Comprehensive Income/(Loss) | Total |
| Shares | Amount |
| | | | | | | | |
| | | | | | | | |
| | | | | | | | |
| | | | | | | | |
| | | | | | | | |
| | | | | | | | |
| | | | | | | | |
| | | | | | | | |
| | | | | | | | |
| | | | | | | | |
| | | | | | | | |
| | | | | | | | |
| | | | | | | | |
| | | | | | | | |
| | | | | | | | |
| | | | | | | | |
| | | | | | | | |
| | | | | | | | |
| | | | | | | | |
| | | | | | | | |
| | | | | | | | |
| | | | | | | | |
| | | | | | | | |
| | | | | | | | |
| | | | | | | | |
| BALANCE AS OF DECEMBER 31, 2019 | 235 | $589 | $5,669 | $8,919 | $(962) | $(62) | $(6) | $14,147 |
| Net income | | | | 1,185 | | | | 1,185 |
| Common stock dividend to parent | | | | (982) | | | | (982) |
| Capital contribution by parent | | | 500 | | | | | 500 |
| Other comprehensive income | | | | | | | (1) | (1) |
| BALANCE AS OF DECEMBER 31, 2020 | 235 | $589 | $6,169 | $9,122 | $(962) | $(62) | $(7) | $14,849 |
| Net income | | | | 1,344 | | | | 1,344 |
| Common stock dividend to parent | | | | (988) | | | | (988) |
| Capital contribution by parent | | | 1,100 | | | | | 1,100 |
| Other comprehensive income | | | | | | | 7 | 7 |
| BALANCE AS OF DECEMBER 31, 2021 | 235 | $589 | $7,269 | $9,478 | $(962) | $(62) | $— | $16,312 |
| Net income | | | | 1,390 | | | | 1,390 |
| Common stock dividend to parent | | | | (978) | | | | (978) |
| Capital contribution by parent | | | 150 | | | | | 150 |
| Other comprehensive income | | | | | | | 4 | 4 |
| BALANCE AS OF DECEMBER 31, 2022 | 235 | $589 | $7,419 | $9,890 | $(962) | $(62) | $4 | $16,878 |
| | | | | | | | |
| | | | | | | | | | | | | | | | | |
| | For the Years Ended December 31, |
| (Millions of Dollars) | 2023 | | 2022 | | 2021 |
| NET INCOME | $1,606 | | $1,390 | | $1,344 |
| OTHER COMPREHENSIVE INCOME (LOSS), NET OF TAXES | | | | | |
| Pension and other postretirement benefit plan liability adjustments, net of taxes | (2) | | | 3 | | 7 |
| Other income, net of taxes | — | | 1 | | — |
| TOTAL OTHER COMPREHENSIVE INCOME (LOSS), NET OF TAXES | (2) | | 4 | | 7 |
| COMPREHENSIVE INCOME | $1,604 | | $1,394 | | $1,351 |
The accompanying notes are an integral part of these financial statements.
| | | | | |
| CON EDISON ANNUAL REPORT 2023 | 97 |
Consolidated Edison Company of New York, Inc.
Consolidated Statement of Cash Flows | | | | | | | | | | | |
| | For the Years Ended December 31, |
| (Millions of Dollars) | 2023 | 2022 | 2021 |
| OPERATING ACTIVITIES | | | |
| Net income | $1,606 | $1,390 | $1,344 |
| PRINCIPAL NON-CASH CHARGES/(CREDITS) TO INCOME | | | |
| Depreciation and amortization | 1,924 | 1,778 | 1,705 |
| Deferred income taxes | 556 | 85 | 124 |
| Rate case amortization and accruals | 72 | 55 | (16) |
| | | |
| | | |
| Other non-cash items, net | (40) | 148 | 30 |
| CHANGES IN ASSETS AND LIABILITIES | | | |
| Accounts receivable - customers | (270) | (268) | (412) |
| Allowance for uncollectible accounts - customers | 39 | 10 | 166 |
| Materials and supplies, including fuel oil and gas in storage | 18 | (71) | (78) |
| Revenue decoupling mechanism receivable | (26) | 27 | (62) |
| Other receivables and other current assets | (136) | 111 | (161) |
| Accounts receivables from/(to) affiliated companies | (100) | (8) | 96 |
| Unbilled revenue and net unbilled revenue deferrals | (47) | (28) | (16) |
| Prepayments | (106) | (11) | (53) |
| Accounts payable | (137) | 322 | 65 |
| Accounts payable to affiliated companies | (1) | (1) | (4) |
| Pensions and retiree benefits obligations, net | (204) | 182 | 283 |
| Pensions and retiree benefits contributions | (33) | (26) | (433) |
| | | |
| Superfund and environmental remediation costs | (12) | (20) | (18) |
| Accrued taxes | (35) | 15 | (54) |
| Accrued taxes from/(to) affiliated companies | (88) | 79 | 9 |
| Accrued interest | 25 | 7 | 1 |
| | | |
| Deferred charges, noncurrent assets, leases, net and other regulatory assets | (1,158) | (852) | (484) |
| Deferred credits, noncurrent liabilities and other regulatory liabilities | 199 | 332 | 210 |
| Other current liabilities | 239 | 7 | (56) |
| NET CASH FLOWS FROM OPERATING ACTIVITIES | 2,285 | 3,263 | 2,186 |
| INVESTING ACTIVITIES | | | |
| Utility construction expenditures | (4,059) | (3,596) | (3,413) |
| Cost of removal less salvage | (380) | (330) | (316) |
| NET CASH FLOWS USED IN INVESTING ACTIVITIES | (4,439) | (3,926) | (3,729) |
| FINANCING ACTIVITIES | | | |
| Net (payment)/issuance of short-term debt | (397) | 939 | (299) |
| Issuance of long-term debt | 2,000 | 700 | 2,250 |
| Retirement of long-term debt | — | — | (640) |
| Debt issuance costs | (31) | (12) | (27) |
| Capital contribution by Con Edison | 1,720 | 150 | 1,100 |
| Dividend to Con Edison | (1,056) | (978) | (988) |
| NET CASH FLOWS FROM FINANCING ACTIVITIES | 2,236 | 799 | 1,396 |
| CASH, TEMPORARY CASH INVESTMENTS, AND RESTRICTED CASH | | | |
| NET CHANGE FOR THE PERIOD | 82 | 136 | (147) |
| BALANCE AT BEGINNING OF PERIOD | 1,056 | 920 | 1,067 |
| BALANCE AT END OF PERIOD | $1,138 | $1,056 | $920 |
| | | |
| SUPPLEMENTAL DISCLOSURE OF CASH INFORMATION | | | |
| Cash paid/(received) during the period for: | | | |
| Interest | $882 | $755 | $739 |
| Income taxes | $(27) | $87 | $5 |
| SUPPLEMENTAL DISCLOSURE OF NON-CASH INFORMATION | | | |
| Construction expenditures in accounts payable | $564 | $561 | $406 |
| Software licenses acquired but unpaid as of end of period | $— | $2 | $22 |
| Equipment acquired but unpaid as of end of period | $11 | $17 | $22 |
The accompanying notes are an integral part of these financial statements.
| | | | | |
11898
|
20222023 |
Consolidated Edison Company of New York, Inc.
Consolidated Statement of CapitalizationBalance Sheet
| | | | | | | | | | | | | | | | | | | | | | | |
| | Shares outstanding | | |
| | December 31, | | At December 31, |
| (In Millions) | 2022 | | 2021 | | 2022 | | 2021 |
| TOTAL SHAREHOLDER’S EQUITY BEFORE ACCUMULATED OTHER COMPREHENSIVE INCOME (LOSS) | 235 | | 235 | | $16,874 | | $16,312 |
| Pension plan liability adjustments, net of taxes | | | | | 5 | | 1 |
| Unrealized gains/(losses) on derivatives qualified as cash flow hedges, less reclassification adjustment for gains/(losses) included in net income and reclassification adjustment for unrealized losses included in regulatory assets, net of taxes | | | | | (1) | | (1) |
| TOTAL ACCUMULATED OTHER COMPREHENSIVE INCOME (LOSS), NET OF TAXES | | | | | 4 | | — |
| TOTAL SHAREHOLDER’S EQUITY (See Statement of Shareholder’s Equity) | | | | | $16,878 | | $16,312 |
| | | | | | | | | | | |
| (Millions of Dollars) | December 31, 2023 | | December 31, 2022 |
| ASSETS | | | |
| CURRENT ASSETS | | | |
| Cash and temporary cash investments | $1,138 | | $1,056 |
| | | |
| Accounts receivable – customers, net allowance for uncollectible accounts of $353 and $314 in 2023 and 2022, respectively | 2,330 | | 2,099 |
| Other receivables, net allowance for uncollectible accounts of $9 and $7 in 2023 and 2022, respectively | 332 | | 147 |
| Taxes receivable | — | | 5 |
| Accrued unbilled revenue | 678 | | 573 |
| Accounts receivable from affiliated companies | 146 | | 46 |
| Fuel oil, gas in storage, materials and supplies, at average cost | 422 | | 440 |
| Prepayments | 329 | | 223 |
| Regulatory assets | 254 | | 286 |
| | | |
| Revenue decoupling mechanism receivable | 190 | | 164 |
| Fair value of derivative assets | 49 | | 51 |
| Other current assets | 113 | | 157 |
| TOTAL CURRENT ASSETS | 5,981 | | 5,247 |
| INVESTMENTS | 608 | | 539 |
| UTILITY PLANT AT ORIGINAL COST | | | |
| Electric | 36,808 | | 34,636 |
| Gas | 13,226 | | 12,338 |
| Steam | 3,085 | | 2,935 |
| General | 4,530 | | 3,879 |
| TOTAL | 57,649 | | 53,788 |
| Less: Accumulated depreciation | 13,171 | | 12,047 |
| Net | 44,478 | | 41,741 |
| Construction work in progress | 2,168 | | 2,268 |
| NET UTILITY PLANT | 46,646 | | 44,009 |
| NON-UTILITY PROPERTY | | | |
| Non-utility property, net accumulated depreciation of $25 in 2023 and 2022 | 2 | | 2 |
| NET PLANT | 46,648 | | 44,011 |
| OTHER NONCURRENT ASSETS | | | |
| Regulatory assets | 4,314 | | 3,669 |
| Operating lease right-of-use asset | 532 | | 567 |
| Pension and retiree benefits | 3,184 | | 3,184 |
| Fair value of derivative assets | 49 | | 80 |
| Other deferred charges and noncurrent assets | 284 | | 148 |
| TOTAL OTHER NONCURRENT ASSETS | 8,363 | | 7,648 |
| TOTAL ASSETS | $61,600 | | $57,445 |
The accompanying notes are an integral part of these financial statements.
| | | | | |
CON EDISON ANNUAL REPORT 20222023 | 11999 |
Consolidated Edison Company of New York, Inc.
Consolidated Balance Sheet
| | | | | | | | | | | |
| (Millions of Dollars) | December 31, 2023 | | December 31, 2022 |
| LIABILITIES AND SHAREHOLDER’S EQUITY | | | |
| CURRENT LIABILITIES | | | |
| Long-term debt due within one year | $250 | | $— |
| Notes payable | 1,903 | | 2,300 |
| Accounts payable | 1,629 | | 1,763 |
| Accounts payable to affiliated companies | 16 | | 17 |
| Customer deposits | 378 | | 341 |
| Accrued taxes | 55 | | 93 |
| Accrued taxes to affiliated companies | 1 | | 89 |
| Accrued interest | 159 | | 134 |
| Accrued wages | 114 | | 105 |
| Fair value of derivative liabilities | 179 | | 35 |
| Regulatory liabilities | 107 | | 308 |
| System benefit charge | 406 | | 351 |
| Operating lease liabilities | 116 | | 103 |
| Other current liabilities | 381 | | 397 |
| TOTAL CURRENT LIABILITIES | 5,694 | | 6,036 |
| NONCURRENT LIABILITIES | | | |
| Provision for injuries and damages | 185 | | 177 |
| Pensions and retiree benefits | 542 | | 526 |
| Superfund and other environmental costs | 1,026 | | 903 |
| Asset retirement obligations | 520 | | 499 |
| Fair value of derivative liabilities | 108 | | 9 |
| Deferred income taxes and unamortized investment tax credits | 7,984 | | 7,144 |
| Operating lease liabilities | 429 | | 475 |
| Regulatory liabilities | 4,818 | | 5,481 |
| Other deferred credits and noncurrent liabilities | 338 | | 237 |
| TOTAL NONCURRENT LIABILITIES | 15,950 | | 15,451 |
| LONG-TERM DEBT | 20,810 | | 19,080 |
| COMMITMENTS AND CONTINGENCIES (Note B and Note G) | | | |
| SHAREHOLDER’S EQUITY (See Statement of Shareholder’s Equity) | 19,146 | | 16,878 |
| TOTAL LIABILITIES AND SHAREHOLDER’S EQUITY | $61,600 | | $57,445 |
The accompanying notes are an integral part of these financial statements.
| | | | | |
100 | CON EDISON ANNUAL REPORT 2023 |
Consolidated Edison Company of New York, Inc.
Consolidated Statement of Shareholder’s Equity
| | | | | | | | | | | | | | | | | | | | | | | | | | |
| (In Millions) | Common Stock | Additional Paid-In Capital | Retained Earnings | Repurchased Con Edison Stock | Capital Stock Expense | Accumulated Other Comprehensive Income/(Loss) | Total |
| Shares | Amount |
| | | | | | | | |
| | | | | | | | |
| | | | | | | | |
| | | | | | | | |
| | | | | | | | |
| | | | | | | | |
| | | | | | | | |
| | | | | | | | |
| | | | | | | | |
| | | | | | | | |
| | | | | | | | |
| | | | | | | | |
| | | | | | | | |
| | | | | | | | |
| | | | | | | | |
| | | | | | | | |
| | | | | | | | |
| | | | | | | | |
| | | | | | | | |
| | | | | | | | |
| | | | | | | | |
| | | | | | | | |
| | | | | | | | |
| | | | | | | | |
| | | | | | | | |
| | | | | | | | |
| | | | | | | | |
| | | | | | | | |
| | | | | | | | |
| | | | | | | | |
| BALANCE AS OF DECEMBER 31, 2020 | 235 | $589 | $6,169 | $9,122 | $(962) | $(62) | $(7) | $14,849 |
| Net income | | | | 1,344 | | | | 1,344 |
| Common stock dividend to Con Edison | | | | (988) | | | | (988) |
| Capital contribution by Con Edison | | | 1,100 | | | | | 1,100 |
| Other comprehensive income | | | | | | | 7 | 7 |
| BALANCE AS OF DECEMBER 31, 2021 | 235 | $589 | $7,269 | $9,478 | $(962) | $(62) | $— | $16,312 |
| Net income | | | | 1,390 | | | | 1,390 |
| Common stock dividend to Con Edison | | | | (978) | | | | (978) |
| Capital contribution by Con Edison | | | 150 | | | | | 150 |
| Other comprehensive income | | | | | | | 4 | 4 |
| BALANCE AS OF DECEMBER 31, 2022 | 235 | $589 | $7,419 | $9,890 | $(962) | $(62) | $4 | $16,878 |
| Net income | | | | 1,606 | | | | 1,606 |
| Common stock dividend to Con Edison | | | | (1,056) | | | | (1,056) |
| Capital contribution by Con Edison | | | 1,720 | | | | | 1,720 |
| Other comprehensive loss | | | | | | | (2) | (2) |
| BALANCE AS OF DECEMBER 31, 2023 | 235 | $589 | $9,139 | $10,440 | $(962) | $(62) | $2 | $19,146 |
| | | | | | | | |
The accompanying notes are an integral part of these financial statements.
| | | | | |
| CON EDISON ANNUAL REPORT 2023 | 101 |
Consolidated Edison Company of New York, Inc.
Consolidated Statement of Capitalization
| | | | | | | | | | | | | | | | | | | | | | | | | | |
LONG-TERM DEBT (Millions of Dollars) | | | | At December 31, |
| Maturity | Interest Rate | | Series | | 2022 | | 2021 |
| DEBENTURES: | | | | | | | | |
| | | | | | | | |
| | | | | | | | |
| 2024 | 3.30 | | | 2014B | | $250 | | $250 |
| 2026 | 2.90 | | | 2016B | | 250 | | 250 |
| 2027 | 3.125 | | | 2017B | | 350 | | 350 |
| 2028 | 3.80 | | | 2018A | | 300 | | 300 |
| 2028 | 4.00 | | | 2018D | | 500 | | 500 |
| 2030 | 3.35 | | | 2020A | | 600 | | 600 |
| 2031 | 2.40 | | | 2021A | | 900 | | 900 |
| 2033 | 5.875 | | | 2003A | | 175 | | 175 |
| 2033 | 5.10 | | | 2003C | | 200 | | 200 |
| 2034 | 5.70 | | | 2004B | | 200 | | 200 |
| 2035 | 5.30 | | | 2005A | | 350 | | 350 |
| 2035 | 5.25 | | | 2005B | | 125 | | 125 |
| 2036 | 5.85 | | | 2006A | | 400 | | 400 |
| 2036 | 6.20 | | | 2006B | | 400 | | 400 |
| 2036 | 5.70 | | | 2006E | | 250 | | 250 |
| 2037 | 6.30 | | | 2007A | | 525 | | 525 |
| 2038 | 6.75 | | | 2008B | | 600 | | 600 |
| 2039 | 5.50 | | | 2009C | | 600 | | 600 |
| 2040 | 5.70 | | | 2010B | | 350 | | 350 |
| 2042 | 4.20 | | | 2012A | | 400 | | 400 |
| 2043 | 3.95 | | | 2013A | | 700 | | 700 |
| 2044 | 4.45 | | | 2014A | | 850 | | 850 |
| 2045 | 4.50 | | | 2015A | | 650 | | 650 |
| 2046 | 3.85 | | | 2016A | | 550 | | 550 |
| 2047 | 3.875 | | | 2017A | | 500 | | 500 |
| 2048 | 4.65 | | | 2018E | | 600 | | 600 |
| 2049 | 4.125 | | | 2019A | | 700 | | 700 |
| 2050 | 3.95 | | | 2020B | | 1,000 | | 1,000 |
| 2051 | 3.20 | | | 2021C | | 600 | | 600 |
| 2052 | 6.15 | | | 2022A | | 700 | | — |
| 2054 | 4.625 | | | 2014C | | 750 | | 750 |
| 2056 | 4.30 | | | 2016C | | 500 | | 500 |
| 2057 | 4.00 | | | 2017C | | 350 | | 350 |
| 2058 | 4.50 | | | 2018B | | 700 | | 700 |
| 2059 | 3.70 | | | 2019B | | 600 | | 600 |
| 2060 | 3.00 | | | 2020C | | 600 | | 600 |
| 2061 | 3.60 | | | 2021B | | 750 | | 750 |
| | | | | | | | |
| | | | | | | | |
| | | | | | | | |
| | | | | | | | |
| TOTAL DEBENTURES | | | | | 18,825 | | 18,125 |
| TAX-EXEMPT DEBT – Notes issued to New York State Energy Research and Development Authority for Facilities Revenue Bonds: | | | | | | |
| 2036 | 3.61 | (a) | | 2010A | | 225 | | 225 |
| 2039 | 3.68 | (a) | | 2004C | | 99 | | 99 |
| 2039 | 3.63 | (a) | | 2005A | | 126 | | 126 |
| TOTAL TAX-EXEMPT DEBT | | 450 | | 450 |
| Unamortized debt expense | | | | | (145) | | (145) |
| | | | | | | | |
| Unamortized debt discount | | | | | (50) | | (48) |
| | | | |
| | | | |
| TOTAL LONG-TERM DEBT | | | | | 19,080 | | 18,382 |
| TOTAL CAPITALIZATION | | $35,958 | | $34,694 |
| | | | | | | | | | | | | | | | | | | | | | | |
| | Shares outstanding | | |
| | December 31, | | At December 31, |
| (In Millions) | 2023 | | 2022 | | 2023 | | 2022 |
| TOTAL SHAREHOLDER’S EQUITY BEFORE ACCUMULATED OTHER COMPREHENSIVE INCOME | 235 | | | 235 | | $19,144 | | $16,874 |
| Pension plan liability adjustments, net of taxes | | | | | 3 | | 5 |
| Unrealized losses on derivatives qualified as cash flow hedges, less reclassification adjustment for gains/(losses) included in net income and reclassification adjustment for unrealized losses included in regulatory assets, net of taxes | | | | | (1) | | (1) |
| TOTAL ACCUMULATED OTHER COMPREHENSIVE INCOME, NET OF TAXES | | | | | 2 | | 4 |
| TOTAL SHAREHOLDER’S EQUITY (See Statement of Shareholder’s Equity) | | | | | $19,146 | | $16,878 |
The accompanying notes are an integral part of these financial statements.
| | | | | |
102 | CON EDISON ANNUAL REPORT 2023 |
Consolidated Edison Company of New York, Inc.
Consolidated Statement of Capitalization
| | | | | | | | | | | | | | | | | | | | | | | | | | |
LONG-TERM DEBT (Millions of Dollars) | | | | At December 31, |
| Maturity | Interest Rate | | Series | | 2023 | | 2022 |
| DEBENTURES: | | | | | | | | |
| | | | | | | | |
| | | | | | | | |
| 2024 | 3.30 | | | 2014B | | $250 | | $250 |
| 2026 | 2.90 | | | 2016B | | 250 | | 250 |
| 2027 | 3.125 | | | 2017B | | 350 | | 350 |
| 2028 | 3.80 | | | 2018A | | 300 | | 300 |
| 2028 | 4.00 | | | 2018D | | 500 | | 500 |
| 2030 | 3.35 | | | 2020A | | 600 | | 600 |
| 2031 | 2.40 | | | 2021A | | 900 | | 900 |
| 2033 | 5.875 | | | 2003A | | 175 | | 175 |
| 2033 | 5.10 | | | 2003C | | 200 | | 200 |
| 2033 | 5.20 | | | 2023A | | 500 | | — |
| 2034 | 5.70 | | | 2004B | | 200 | | 200 |
| 2034 | 5.50 | | | 2023B | | 600 | | — |
| 2035 | 5.30 | | | 2005A | | 350 | | 350 |
| 2035 | 5.25 | | | 2005B | | 125 | | 125 |
| 2036 | 5.85 | | | 2006A | | 400 | | 400 |
| 2036 | 6.20 | | | 2006B | | 400 | | 400 |
| 2036 | 5.70 | | | 2006E | | 250 | | 250 |
| 2037 | 6.30 | | | 2007A | | 525 | | 525 |
| 2038 | 6.75 | | | 2008B | | 600 | | 600 |
| 2039 | 5.50 | | | 2009C | | 600 | | 600 |
| 2040 | 5.70 | | | 2010B | | 350 | | 350 |
| 2042 | 4.20 | | | 2012A | | 400 | | 400 |
| 2043 | 3.95 | | | 2013A | | 700 | | 700 |
| 2044 | 4.45 | | | 2014A | | 850 | | 850 |
| 2045 | 4.50 | | | 2015A | | 650 | | 650 |
| 2046 | 3.85 | | | 2016A | | 550 | | 550 |
| 2047 | 3.875 | | | 2017A | | 500 | | 500 |
| 2048 | 4.65 | | | 2018E | | 600 | | 600 |
| 2049 | 4.125 | | | 2019A | | 700 | | 700 |
| 2050 | 3.95 | | | 2020B | | 1,000 | | 1,000 |
| 2051 | 3.20 | | | 2021C | | 600 | | 600 |
| 2052 | 6.15 | | | 2022A | | 700 | | 700 |
| 2053 | 5.90 | | | 2023C | | 900 | | — |
| 2054 | 4.625 | | | 2014C | | 750 | | 750 |
| 2056 | 4.30 | | | 2016C | | 500 | | 500 |
| 2057 | 4.00 | | | 2017C | | 350 | | 350 |
| 2058 | 4.50 | | | 2018B | | 700 | | 700 |
| 2059 | 3.70 | | | 2019B | | 600 | | 600 |
| 2060 | 3.00 | | | 2020C | | 600 | | 600 |
| 2061 | 3.60 | | | 2021B | | 750 | | 750 |
| | | | | | | | |
| | | | | | | | |
| | | | | | | | |
| | | | | | | | |
| TOTAL DEBENTURES | | | | | 20,825 | | 18,825 |
| TAX-EXEMPT DEBT – Notes issued to New York State Energy Research and Development Authority for Facilities Revenue Bonds: | | | | | | |
| 2036 | 3.92 | (a) | | 2010A | | 225 | | 225 |
| 2039 | 3.83 | (a) | | 2004C | | 99 | | 99 |
| 2039 | 3.80 | (a) | | 2005A | | 126 | | 126 |
| TOTAL TAX-EXEMPT DEBT | | 450 | | 450 |
| Unamortized debt expense | | | | | (155) | | (145) |
| | | | | | | | |
| Unamortized debt discount | | | | | (60) | | (50) |
| TOTAL | | 21,060 | | 19,080 |
| Less: Long-term debt due within one year | | 250 | | — |
| TOTAL LONG-TERM DEBT | | | | | 20,810 | | 19,080 |
| TOTAL CAPITALIZATION | | $39,956 | | $35,958 |
(a) Rates reset weekly; December 31, 20222023 rates shown.
The accompanying notes are an integral part of these financial statements.
| | | | | |
120
|
20222023 | 103 |
Notes to the Financial Statements
General
These combined notes accompany and form an integral part of the separate consolidated financial statements of each of the two separate registrants: Consolidated Edison, Inc. and its subsidiaries (Con Edison) and Consolidated Edison Company of New York, Inc. and its subsidiaries (CECONY). CECONY is a subsidiary of Con Edison and as such its financial condition and results of operations and cash flows, whichthat are presented separately in the CECONY consolidated financial statements, are also consolidated, along with those of Orange and Rockland Utilities, Inc. (O&R), Con Edison Transmission, Inc. (together with its subsidiaries, Con Edison Transmission) and its former
subsidiary, Con Edison Clean Energy Businesses, Inc. (together with its subsidiaries, the Clean Energy Businesses) and Con Edison Transmission, Inc. (together with its subsidiaries, Con Edison Transmission), in Con Edison’s consolidated financial statements. On March 1, 2023, Con Edison completed the sale of all of the stock of the Clean Energy Businesses. See Note W and Note X. The term “Utilities” is used in these notes to refer to CECONY and O&R.
As used in these notes, the term “Companies” refers to Con Edison and CECONY and, except as otherwise noted, the information in these combined notes relates to each of the Companies. However, CECONY makes no representation as to information relating to Con Edison or the subsidiaries of Con Edison other than itself.
Con Edison has two regulated utility subsidiaries: CECONY and O&R. CECONY provides electric service and gas service in New York City and Westchester County. The company also provides steam service in parts of Manhattan. O&R, along with its regulated utility subsidiary, provides electric service in southeastern New York "NY" and northern New Jersey "NJ" and gas service in southeastern NY. The Clean Energy Businesses, through its subsidiaries, develops, owns and operates renewable and sustainable energy infrastructure projects and provides energy-related products and services to wholesale and retail customers. In October 2022, Con Edison entered into a purchase and sale agreement pursuant to which Con Edison agreed to sell the Clean Energy Businesses to RWE Renewables America, LLC, a subsidiary of RWE Aktiengesellschaft. The Clean Energy Businesses were classified as held for sale as of December 31, 2022. See “Assets and Liabilities Held for Sale” in Note A and Note X.New York. Con Edison Transmission invests in and seeks to develop electric transmission projects through its subsidiary, Consolidated Edison Transmission, LLC, (CET), and manages, through joint ventures, investments in gas pipeline and storage facilities through its subsidiary, Con Edison Gas Pipeline and Storage, LLC (CET).LLC. See "Investments" in Note A and Note W.
| | | | | |
104 | CON EDISON ANNUAL REPORT 2022 | 1212023 |
Note A – Summary of Significant Accounting Policies and Other Matters
Principles of Consolidation
The Companies’ consolidated financial statements include the accounts of their respective majority-owned subsidiaries, and variable interest entities (see Note S), as required. All intercompany balances and intercompany transactions have been eliminated.
Accounting Policies
The accounting policies of Con Edison and its subsidiaries conform to generally accepted accounting principles in the United States of America (GAAP). For the Utilities, these accounting principles include the accounting rules for regulated operations and the accounting requirements of the Federal Energy Regulatory Commission (FERC) and the state regulators having jurisdiction.
The accounting rules for regulated operations specify the economic effects that result from the causal relationship of costs and revenues in the rate-regulated environment and how these effects are to be accounted for by a regulated enterprise. Revenues intended to cover some costs may be recorded either before or after the costs are incurred. If regulation provides assurance that incurred costs will be recovered in the future, these costs would be recorded as deferred charges or “regulatory assets” under the accounting rules for regulated operations. If revenues are recorded for costs that are expected to be incurred in the future, these revenues would be recorded as deferred credits or “regulatory liabilities” under the accounting rules for regulated operations.
The Utilities’ principal regulatory assets and liabilities are detailed in Note B. In general, the Utilities are receiving or being credited with a return on their regulatory assets for which a cash outflow has been made, and are paying or being charged with a return on their regulatory liabilities for which a cash inflow has been received. The Utilities’ regulatory assets and liabilities at December 31, 20222023 are recoverable from customers, or to be applied for customer benefit, in accordance with rate provisions that have been approved by state regulators.
Other significant accounting policies of the Companies are referenced below in this Note A and in the notes that follow.
Revenues
CECONY’s electric and gas rate plans and O&R’s NYNew York electric and gas rate plans each contain a revenue decoupling mechanism, that covers all residential and most commercial customers, under which the company’s actual energy delivery revenues are compared with the authorized delivery revenues and the difference accrued, with interest, for refund to, or recovery from, customers, as applicable. See “Rate Plans” in Note B.
The NYSPSC requires utilities to record gross receipts tax revenues and expenses on a gross income statement presentation basis (i.e., included in both revenue and expense). The recovery of these taxes is generally provided for in the revenue requirement within each of the respective NYSPSC-approved rate plans. Total excise taxes (inclusive of gross receipts taxes) recorded in operating revenues were as follows:
| | | | For the Years Ended December 31, | | For the Years Ended December 31, |
| (Millions of Dollars) | (Millions of Dollars) | 2022 | | 2021 | | 2020 | (Millions of Dollars) | 2023 | | 2022 | | 2021 |
| Con Edison | Con Edison | $400 | | $358 | | $323 | Con Edison | $409 | | $400 | | $358 |
| CECONY | CECONY | 387 | | 346 | | 312 | CECONY | 396 | | 387 | | 346 |
For information about the Companies' revenue recognition policies, see Note M.
Plant and Depreciation
Utility Plant
Utility plant is stated at original cost. The cost of repairs and maintenance is charged to expense and the cost of betterments is capitalized. The capitalized cost of additions to utility plant includes indirect costs such as engineering, supervision, payroll taxes, pensions, other benefits and an allowance for funds used during construction (AFUDC). The original cost of property is charged to expense over the estimated useful lives of the assets. Upon retirement, the original cost of property is charged to accumulated depreciation. See-See Note T.
Rates used for AFUDC include the cost of borrowed funds and a reasonable rate of return on the Utilities’ own funds when so used, determined in accordance with regulations of the FERC or the state public utility regulatory authority
| | | | | |
122
|
20222023 | 105 |
having jurisdiction. The rate is compounded semiannually, and the amounts applicable to borrowed funds are treated as a reduction of interest charges, while the amounts applicable to the Utilities’ own funds are credited to other income (deductions). The AFUDC rates for CECONY were 5.9 percent, 5.2 percent and 4.5 percent for 2023, 2022 and 5.2 percent for 2022, 2021, and 2020, respectively. The AFUDC rates for O&R were 6.2 percent, 5.0 percent and 4.8 percent for 2023, 2022 and 5.3 percent for 2022, 2021, and 2020, respectively.
The Utilities generally compute annual charges for depreciation using the straight-line method for financial statement purposes, with rates based on average service lives and net salvage factors. The average depreciation rates for CECONY were 3.53.6 percent for 20222023 and 3.5 percent for 20212022 and 3.5 percent for 2020.2021. The average depreciation rates for O&R were 3.03.1 percent for 2022, 3.12023, 3.0 percent for 20212022 and 3.23.1 percent for 2020.2021.
The estimated lives for utility plant for CECONY range from 5 to 80 years for electric, 5 to 90 years for gas, 5 to 80 years for steam and 5 to 55 years for general plant. For O&R, the estimated lives for utility plant range from 5 to 75 years for electric and gas and 5 to 50 years for general plant.
At December 31, 20222023 and 2021,2022, the capitalized cost of the Companies’ utility plant, net of accumulated depreciation, was as follows:
| | | | Con Edison | | CECONY | | Con Edison | | CECONY |
| (Millions of Dollars) | (Millions of Dollars) | 2022 | | 2021 | | 2022 | | 2021 | (Millions of Dollars) | 2023 | | 2022 | | 2023 | | 2022 |
| Electric | Electric | | | |
| Generation | |
| Generation | |
| Generation | Generation | $534 | | $559 | | $534 | | $559 | $580 | | $534 | | $580 | | $534 |
| Transmission | Transmission | 4,223 | | 3,955 | | 3,916 | | 3,658 | Transmission | 4,652 | | 4,223 | | 4,333 | | 3,916 |
| Distribution | Distribution | 23,345 | | 22,418 | | 22,130 | | 21,240 | Distribution | 24,491 | | 23,345 | | 23,238 | | 22,130 |
| General | General | 113 | | 87 | | 113 | | 87 | |
| Gas (a) | Gas (a) | 11,326 | | 10,473 | | 10,567 | | 9,748 | Gas (a) | 12,023 | | 11,326 | | 11,226 | | 10,567 |
| Steam | Steam | 1,962 | | 1,924 | | 1,962 | | 1,924 | Steam | 1,990 | | 1,962 | | 1,990 | | 1,962 |
| General | General | 2,648 | | 2,566 | | 2,410 | | 2,338 | General | 3,158 | | 2,648 | | 2,860 | | 2,410 |
| Held for future use | Held for future use | 117 | | 80 | | 109 | | 72 | Held for future use | 118 | | 117 | | 110 | | 109 |
| Construction work in progress | Construction work in progress | 2,484 | | 2,152 | | 2,268 | | 1,985 | Construction work in progress | 2,442 | | 2,484 | | 2,168 | | 2,268 |
| Net Utility Plant | Net Utility Plant | $46,752 | | $44,214 | | $44,009 | | $41,611 | Net Utility Plant | $49,594 | | $46,752 | | $46,646 | | $44,009 |
General utility plant of Con Edison and CECONY included $65 million and $62 million, respectively, at December 31, 2023, and $72 million and $69 million, respectively, at December 31, 2022, and $79 million and $74 million, respectively, at December 31, 2021, related to a May 2018 acquisition of software licenses. The estimated aggregate annual amortization expense related to the software licenses for Con Edison and CECONY is $7 million. The accumulated amortization for Con Edison and CECONY was $38 million and $36 million, respectively, at December 31, 2023 and $31 million and $29 million, respectively, at December 31, 2022 and $24 million at December 31, 2021.2022.
Under the Utilities’ rate plans, the aggregate annual depreciation allowance for the period ended December 31, 20222023 was $1,907$2,030 million, including $1,808$1,925 million under CECONY’s electric, gas and steam rate plans that have been approved by the NYSPSC.
Non–Utility Plant
Non-utility plant is stated at original cost. On March 1, 2023, Con Edison completed the sale of all of the stock of the Clean Energy Businesses. See Note W and X. For Con Edison, non-utility plant consistsconsisted primarily of the Clean Energy Businesses’ renewable electric projects. Property, plant and equipment are stated at cost, less accumulated depreciation and include capitalized interest during construction. Depreciation is computed under the straight-line method over the useful lives of the assets. Solar power generating assets and wind power generating assets have useful lives of 35 years and 30, respectively. The Clean Energy Businesses were classified as held for sale as of December 31, 2022, and depreciation on their assets was not recorded for the three months ended December 31, 2022. See "Assets and Liabilities Held for Sale" below, and Note X.
For the Utilities, non-utility plant consists of land and conduit for telecommunication use. Depreciation on non-utility plant, other than land, is computed using the straight-line method for financial statement purposes over their estimated useful lives, which is 10 years.
| | | | | |
106 | CON EDISON ANNUAL REPORT 2022 | 1232023 |
Other Deferred Charges and Noncurrent Assets and Prepayments
Other deferred charges and noncurrent assets and prepayments, net of accumulated depreciation, included the following related to implementation costs incurred in cloud computing arrangements:
| | Con Edison | CECONY | |
| Con Edison | |
| (Millions of Dollars) | |
| (Millions of Dollars) | |
| (Millions of Dollars) | (Millions of Dollars) | 2022 | 2021 | 2022 | 2021 | |
| Prepayments (a)(b) | Prepayments (a)(b) | $24 | $16 | $23 | $15 | |
| Prepayments (a)(b) | |
| Prepayments (a)(b) | |
| Other Deferred Charges and Noncurrent Assets (a)(b) | Other Deferred Charges and Noncurrent Assets (a)(b) | 105 | 81 | 103 | 78 | |
| Other Deferred Charges and Noncurrent Assets (a)(b) | |
| Other Deferred Charges and Noncurrent Assets (a)(b) | |
(a) DepreciationAmortization on these assets is computed using the straight-line method for financial statement purposes over their estimated useful lives.
(b) DepreciationAmortization expense related to these assets incurred during the year ended December 31, 2023 for Con Edison and CECONY was $21 million and $20 million, respectively, for the year ended December 31, 2022 for Con Edison and CECONY was $15 million and $14 million, respectively, and for the year ended December 31, 2021 for Con Edison and CECONY was $12 million and $11 million, , respectively. Accumulated depreciationamortization related to these assets for Con Edison and CECONY was $58 million and $53 million, respectively at December 31, 2023 and was $37 million and $33 million, respectively at December 31, 2022 and was $22 million and $19 million, respectively at December 31, 2021.2022.
Long–Lived and Intangible Assets
The Companies test long-lived and intangible assets for recoverability when events or changes in circumstances indicate that the carrying value of long-lived or intangible assets may not be recoverable. The carrying amount of a long-lived asset or intangible asset with a definite life is deemed not recoverable if it exceeds the sum of the undiscounted cash flows expected to result from the use and eventual disposition of the assets. In the event a test indicates that such cash flows cannot be expected to be sufficient to fully recover the assets, the assets are considered impaired and written down to their estimated fair value.
Prior to the sale of the Clean Energy Businesses on March 1, 2023, Con Edison's intangible assets with definite lives consistconsisted primarily of power purchase agreements, whichagreements. See Note W and Note X. Con Edison's intangible assets were identified as part of purchase price allocations associated with acquisitions made by the Clean Energy Businesses in 2016 and 2018.immaterial at December 31, 2023. At December 31, 2022, and 2021, intangible assets arising from power purchase agreements were $1,219 million, and $1,290 million, net of accumulated amortization of $359 million, and $288 million, respectively, and were being amortized over the life of each agreement. The Clean Energy Businesses were classified as held for sale as of December 31, 2022, and amortization on their assets was not recorded for the three months ended December 31, 2022. See "Assets and Liabilities Held for Sale" below, and Note X. Excluding power purchase agreements, Con Edison’s other intangible assets were $2 million, net of accumulated amortization of $9 million at December 31, 2022 and 2021.2022. CECONY’s other intangible assets were immaterial at December 31, 20222023 and 2021.2022. Con Edison recorded amortization expense related to its intangible assets of $71 million in 2022 and $95 million in 2021, and $102 million in 2020.2021. Con Edison expects amortization expense to be immaterial over each of the next five years. No impairment charges were recorded on Con Edison's long-lived assets or intangible assets with definite lives in 2023, 2022 orand 2021.
Recoverable Energy Costs
The Utilities generally recover all of their prudently incurred fuel, purchased power and gas costs, including hedging gains and losses, in accordance with rate provisions approved by the applicable state public utility regulators. If the actual energy supply costs for a given month are more or less than the amounts billed to customers for that month, the difference in most cases is recoverable from or refundable to customers. Differences between actual and billed electric and steam supply costs are generally deferred for charge or refund to customers during the next billing cycle (normally within one or two months). For the Utilities’ gas costs, differences between actual and billed gas costs during the 12-month period ending each August are charged or refunded to customers during a subsequent 12-month period.
New York Independent System Operator (NYISO)
The Utilities purchase electricity through the wholesale electricity market administered by the NYISO. The difference between purchased power and related costs initially billed to the Utilities by the NYISO and the actual cost of power subsequently calculated by the NYISO is refunded by the NYISO to the Utilities, or paid to the NYISO by the Utilities. The reconciliation payments or receipts are recoverable from or refundable to the Utilities’ customers.
Certain other payments to or receipts from the NYISO are also subject to reconciliation, with shortfalls or amounts in excess of specified rate allowances recoverable from or refundable to customers. These include proceeds from the sale through the NYISO of transmission rights on CECONY’s transmission system (transmission congestion contracts or TCCs).
| | | | | |
124
|
20222023 | 107 |
Temporary Cash Investments
Temporary cash investments are short-term, highly-liquid investments that generally have maturities of three months or less at the date of purchase. They are stated at cost, which approximates market. The Companies consider temporary cash investments to be cash equivalents.
Investments
Accounting for Investments
Con Edison’s investments consist primarily of the investments of Con Edison Transmission that are accounted for under the equity method and the fair value of the Utilities’ supplemental retirement income plan and deferred income plan assets.
The accounting rules require Con Edison to evaluate its investments periodically to determine whether they are impaired. The standard for determining whether an impairment exists and must be recorded is whether an other-than-temporary decline in carrying value has occurred. Changes in economic conditions, forecasted cash flows and the regulatory environment, among other factors, could require equity method investments to recognize a decrease in carrying value for an other-than-temporary decline. When management believes such a decline may have occurred, the fair value of the investment is estimated using market inputs, when observable, or a market valuation model such as a discounted cash flow analysis. The fair value is compared to the carrying value of the investment in order to determine the amount of impairment to record, if any.
The evaluation and measurement of impairments involve uncertainties. The judgments that Con Edison makes to estimate the fair value of its equity method investments are based on assumptions that management believes are reasonable, and variations in these estimates or the underlying assumptions, or the receipt of additional market information, could have a material impact on whether a triggering event is determined to exist or the amount of any such impairment. Additionally, if the projects in which Con Edison holds these investments recognize an impairment, Con Edison may record a share of that impairment loss and would evaluate its investment for an other-than-temporary decline in carrying value as described above.
2021 Partial Impairment of Investment in Stagecoach Gas Services LLC (Stagecoach)
In May 2021, a subsidiary of Con Edison Gas Pipeline and Storage, LLC (CET)Transmission entered into a purchase and
sale agreement pursuant to which the subsidiary and its joint venture partner agreed to sell their combined interests
in Stagecoach Gas Services LLC (Stagecoach) for a total of $1,225 million, of which $629 million was attributed to
CET Con Edison Transmission for its 50 percent interest. The purchase and sale agreement contemplated a two-stage closing, the first of
which was completed in July 2021 and the second of which was completed in November 2021.
As a result of information made available to Stagecoach as part of the sale process, Stagecoach performed impairment tests that resulted in Stagecoach recording impairment charges of $414 million for the year ended December 31, 2021. Accordingly, Con Edison recorded pre-tax impairment losses on its 50 percent interest in Stagecoach of $212 million ($147 million after-tax), including working capital and transaction cost adjustments, within "Investment income/(loss)" on Con Edison's consolidated income statement for the year ended December 31, 2021.
Stagecoach’s impairment charges and information obtained from the sales process constituted triggering events for Con Edison's investment in Stagecoach as of March 31, 2021 and June 30,during 2021. Con Edison evaluated the carrying value of its investment in Stagecoach for other-than-temporary declines in value using income and market-based approaches. Con Edison determined that the carrying value of its investment in Stagecoach of $667 million and $630 million as of March 31, 2021 and June 30, 2021, respectively, was not impaired. Theimpaired, and that the carrying value of $630 million at June 30, 2021 reflected the final sales price received, in July and the remaining amount received in November 2021, including closing adjustments. CETCon Edison Transmission had no remaining investment in Stagecoach as of
December 31, 2021 and 2022.2021.
| | | | | |
CON EDISON ANNUAL REPORT 2022 | 125 |
2020 and 2021 Partial Impairments of Investment in Mountain Valley Pipeline, LLC (MVP)
In January 2016, Con Edison Gas Pipeline and Storage, LLC (CET), an indirecta subsidiary of Con Edison Transmission, acquired a 12.5 percent equity interest in MVP, a company developing a proposed 300-mile gas transmission project (the Project)Mountain Valley Pipeline) in WVWest Virginia and VA.Virginia. During 2019, Con Edison exercised its right to limit, and did limit, its cash contributions to the joint venture to approximately $530 million, whichthat reduced CET'sCon Edison Transmission's interest in MVP to 11.3 percent, 10.2 percent, and 10.29.6 percent as of December 31, 2020, 2021, and 2021,2022, respectively. As of December 31, 2022 CET's2023 Con Edison Transmission's interest in MVP is 9.67.9 percent and is expected to be reduced to 8.0approximately 7.0 percent based on the Project's current cost estimate and CET'sCon Edison Transmission's previous capping of its cash contributions. As of December 31, 2021 and 2022,2023, the ProjectMountain Valley Pipeline was approximately 9497 percent complete.
| | | | | |
108 | CON EDISON ANNUAL REPORT 2023 |
During 2020, progress was made on the construction of the Project, and the U.S. Supreme Court issued favorable decisions in cases unrelated to MVP regarding the permitting process for pipeline construction and water crossings. In November 2020, the U.S. Court of Appeals for the Fourth Circuit issued a stay on the Nationwide Permit 12, effectively blocking the Project’s ability to pursue water crossings under that permit. As a result, in November 2020 the Project applied to the FERC for a certificate amendment to bore under water bodies in a portion of the Project in WV, allowing this portion of the pipe to be completed and placed in-service while a plan for the remaining water crossings was pursued. If approved, this certificate amendment would have led to additional Project costs and would have extended the anticipated in-service date. In January 2021, the FERC did not approve the requested certificate amendment. Later in January 2021, the Project indicated its plans to apply for U.S. Army Corps of Engineers individual permits for certain water crossings and a new certificate amendment application to the FERC to bore under other water crossings that, in total, would cover the entire Project length.
The uncertainty related to obtaining necessary water crossing permits, the resulting Project costs and the likelihood of the ProjectMountain Valley Pipeline not reaching eventual completion increased as a result of actions taken by the U.S. Court of Appeals for the Fourth Circuit. This action and associated delays constituted a triggering event (the "2020 triggering event") that required Con Edison to test its investment in MVP for an other-than-temporary impairment as of December 31, 2020.
In December 2021, the VA Department of Environmental Quality and the WV Department of Environmental Protection both issued water quality certification permits which are required in order for the U.S. Army Corps of Engineers to proceed with the permitting process for construction of certain Project water crossings. In January 2022, the U.S. Court of Appeals for the Fourth Circuit rejected permits for crossings through the Jefferson National Forest issued by the U.S. Forest Service and Bureau of Land Management. In February 2022, the U.S. Court of Appeals for the Fourth Circuit vacated a biological opinion from the U.S. Fish and Wildlife Service, applicable to all remaining construction. The biological opinion had been issued and was the subject of litigation prior to December 31, 2021. Con Edison believed that the February 2022 action by the U.S. Court of Appeals for the Fourth Circuit, along with the potential outcome of other matters pending before that Court, may lead to further delays and increased Projectproject costs, which constituted a triggering event (the “2021 triggering event”) that required Con Edison to test its investment in MVP for an other-than-temporary impairment as of December 31, 2021.
In response to the 2020 triggering event and 2021 triggering event, Con Edison assessed the value of its equity investment in the ProjectMountain Valley Pipeline to determine whether the fair value of its investment in MVP had declined below its carrying value on an other-than-temporary basis as of December 31, 2020 and 2021, respectively. The estimated fair value of the investment was determined using a discounted cash flow analysis, which is a level 3 fair value measurement. The analysis discounted probability-weighted future cash flows, including revenues based on long-term firm transportation contracts, that are secured for the first 20 years following completion of the Project.Mountain Valley Pipeline. See Note U. Con Edison hashad also assumed cash flows extending beyond this period. All cash flows were discounted at a pre-tax discount rate of 8.3 percent and then weighted based on Con Edison’s estimate of the likelihood that the ProjectMountain Valley Pipeline will be completed. For the 2020 triggering event, Con Edison estimated that the likelihood of Projectproject completion was in the upper end of a reasonably possible range. For the 2021 triggering event, Con Edison anticipated that the Project facesMountain Valley Pipeline faced legal and regulatory challenges that makecould have made construction completion increasingly remote. The Project faces additional delays and increased costs that could further reduce CET's interest in MVP to below 8 percent based on CET's previous capping of its cash contributions. The likelihood that the Projectproject will be completed and, for 2020, the discount rate, arewere the most significant and sensitive assumptions; changes in these assumptions may have materially changechanged the results of the impairment calculation.
Based on the discounted cash flow analyses, Con Edison concluded as of December 31, 2020 and 2021 that the fair value of its investment in MVP declined below its carrying value and the declines were other-than-temporary. Accordingly, Con Edison recorded a pre-tax impairment loss of $320 million ($223 million, after tax) for the year ended December 31, 2020 that reduced the carrying value of its investment in MVP from $662 million to $342 million, with an associated deferred tax asset of $53 million. Additionally, Con Edison recorded a pre-tax
| | | | | |
126
|
CON EDISON ANNUAL REPORT 2022 |
impairment loss of $231 million ($162 million, after tax) for the year ended December 31, 2021 that reduced the carrying value of its investment in MVP from $342 million to $111 million, with an additional $77 million associated deferred tax asset, totaling a deferred tax asset of $130 million at December 31, 2021 and 2022. The impairments were recorded within “Investment income (loss)” on Con Edison’s Consolidated Income Statement. In addition, Con Edison did not record non-cash equity in earnings from allowance for funds used during construction from MVP beginning in January 2021 and will continue to refrainrefrained from recording such amounts during 2021, 2022 and a portion of 2023 until such time as substantial construction activities resume, which would be indicativeresumed. Con Edison recorded equity in earnings from AFUDC from MVP of probable Project completion.$33 million for the year ended December 31, 2023 and expects to continue to recognize its proportionate share of equity in earnings from AFUDC until the project is placed in service, subject to the progression of construction activities. There were no impairments or substantial changes into the carrying value of Con Edison's investment in MVP for the
year years ended December 31, 2022.2022 and 2023.
In June 2023, federal legislation to raise the U.S. debt ceiling included provisions declaring the Mountain Valley Pipeline to be in the national interest, expediting the permitting process and moving jurisdiction of challenges of permits to the D.C. Circuit Court of Appeals, from the 4th Circuit Court of Appeals. These actions enabled construction activities to resume in June 2023 and continue without substantial interruption for the duration of 2023.
There is risk that the fair value of Con Edison’s investment in MVP may be further or fully impaired in the future. There are ongoing legal and regulatory matters that must be resolved favorably before the Project can be completed. Assumptions and estimates used to test Con Edison’s investment in MVP for impairment may change if adverse or delayed resolutions todevelopments impacting the Project’s pending legal and regulatory challengesconstruction of the Mountain Valley Pipeline were to occur, which could have a material adverse effect on the fair value of Con Edison’s investment in MVP.occur.
| | | | | |
| CON EDISON ANNUAL REPORT 2023 | 109 |
Summary of Investment Balances
The following investment assets are included in the Companies' consolidated balance sheets at December 31, 20222023 and 2021:2022:
| | Con Edison | | CECONY |
| Con Edison | | | Con Edison | | CECONY |
| (Millions of Dollars) | (Millions of Dollars) | 2022 | | 2021 | | 2022 | | 2021 | (Millions of Dollars) | 2023 | | 2022 | | 2023 | | 2022 |
| CET investment in Mountain Valley Pipeline, LLC (a) | $111 | | $111 | | $— | | $— |
| Con Edison Transmission investment in MVP (a) | | Con Edison Transmission investment in MVP (a) | $144 | | $111 | | $— |
| Supplemental retirement income plan assets (b) | Supplemental retirement income plan assets (b) | 459 | | 525 | | 439 | | 499 | Supplemental retirement income plan assets (b) | 524 | | 459 | | 502 | | 439 |
| Deferred income plan assets | Deferred income plan assets | 93 | | 102 | | 93 | | 102 | Deferred income plan assets | 99 | | 93 | | 99 | | 93 |
| CET investment in New York Transco, LLC (c) | 176 | | 112 | | — | | | — | |
| Con Edison Transmission's investment in New York Transco (c) | |
| Virginia Tax Equity Projects (d) | |
| Other | Other | 2 | | 3 | | 7 | | 7 | Other | 3 | | 2 | | 7 |
| Total investments | Total investments | $841 | | $853 | | $539 | | $608 | Total investments | $999 | | $841 | | $608 | | $539 |
(a)At December 31, 2023 and 2022, and 2021, CET'sCon Edison Transmission's cash investment in MVP was $530 million. In May 2021,January 2024, the operator of the Mountain Valley Pipeline indicated that subject to receipt of certain authorizations and resolution of certain challenges, it is targeting an in-service date for the project in the first quarter of the second half of 20232024 at an overall project cost of approximately $6,600$7,200 million excluding allowance for funds used during construction. See "2020 and 2021 Partial Impairments of Investment"Investment in Mountain Valley Pipeline, LLC (MVP)" above.
(b)See Note E.
(c)CETCon Edison Transmission owns a 45.7 percent interest in New York Transco, LLC.Transco's TOTS and NYES projects and a 41.7 percent interest in New York Transco's share of the Propel NY Energy project.
(d)See Note S.
Pension and Other Postretirement Benefits
The accounting rules for retirement benefits require an employer to recognize an asset or liability for the overfunded or underfunded status of its pension and other postretirement benefit plans. For a pension plan, the asset or liability is the difference between the fair value of the plan’s assets and the projected benefit obligation. For any other postretirement benefit plan, the asset or liability is the difference between the fair value of the plan’s assets and the accumulated postretirement benefit obligation. The accounting rules generally require employers to recognize all unrecognized prior service costs and credits and unrecognized actuarial gains and losses in accumulated other comprehensive income/(loss) (OCI), net of tax. Such amounts will be adjusted as they are subsequently recognized as components of total periodic benefit cost or income pursuant to the current recognition and amortization provisions.
For the Utilities’ pension and other postretirement benefit plans, regulatory accounting treatment is generally applied in accordance with the accounting rules for regulated operations. Unrecognized prior service costs or credits and unrecognized actuarial gains and losses are recorded to regulatory assets or liabilities, rather than OCI. See Notes E and F.
The total periodic benefit costs are recognized in accordance with the accounting rules for retirement benefits. Investment gains and losses are recognized in expense over a 15-year period and other actuarial gains and losses are recognized in expense over a 10-year period, subject to the deferral provisions in the rate plans.
In accordance with the Statement of Policy issued by the NYSPSC and its current electric, gas and steam rate plans, CECONY defers for payment to or recovery from customers the difference between such expenses and the
| | | | | |
CON EDISON ANNUAL REPORT 2022 | 127 |
amounts for such expenses reflected in rates. O&R also defers such difference pursuant to its NY rate plans. See Note B.
The Companies calculate the expected return on pension and other postretirement benefit plan assets by multiplying the expected rate of return on plan assets by the market-related value (MRV) of plan assets at the beginning of the year, taking into consideration anticipated contributions and benefit payments that are to be made during the year. The accounting rules allow the MRV of plan assets to be either fair value or a calculated value that recognizes changes in fair value in a systematic and rational manner over not more than five years. The Companies use a calculated value when determining the MRV of the plan assets that adjusts for 20 percent of the difference between fair value and expected MRV of plan assets. This calculated value has the effect of stabilizing variability in assets to which the Companies apply the expected return.
| | | | | |
110 | CON EDISON ANNUAL REPORT 2023 |
Federal Income Tax
In accordance with accounting rules for income taxes, the Companies have recorded an accumulated deferred federal income tax liability at current tax rates for temporary differences between the book and tax basis of assets and liabilities. In accordance with rate plans, the Utilities have recovered amounts from customers for a portion of the tax liability they will pay in the future as a result of the reversal or “turn-around” of these temporary differences. As to the remaining deferred tax liability, the Utilities had established regulatory assets for the net revenue requirements to be recovered from customers for the related future tax expense pursuant to the NYSPSC's 1993 Policy Statement approving accounting procedures consistent with accounting rules for income taxes and providing assurances that these future increases in taxes will be recoverable in rates.
Accumulated deferred investment tax credits are amortized ratably over the lives of the related properties and applied as a reduction to future federal income tax expense.
Con Edison and its subsidiaries file a consolidated federal income tax return. The consolidated income tax liability is allocated to each member of the consolidated group using the separate return method. Each member pays or receives an amount based on its own taxable income or loss in accordance with a consolidated tax allocation agreement. Tax loss and tax credit carryforwards are allocated among members in accordance with consolidated tax return regulations.
State Income Tax
Con Edison and its subsidiaries file a combined New York State Corporation Business Franchise Tax Return. Similar to a federal consolidated income tax return, the income of all entities in the combined group is subject to New York State taxation, after adjustments for differences between federal and New York law and apportionment of income among the states in which the company does business. Each member’s share of the New York State tax is based on its own New York State taxable income or loss.
Research and Development Costs
Research and development costs are charged to operating expenses as incurred. Research and development costs were as follows:
| | | | | | | | | | | | | | | | | |
| | For the Years Ended December 31, |
| (Millions of Dollars) | 2022 | | 2021 | | 2020 |
| Con Edison | $27 | | $25 | | $24 |
| CECONY | 25 | | 24 | | 23 |
Reclassification
Certain prior period amounts have been reclassified within the Companies' Consolidated Statements of Cash Flows
and Consolidated Balance Sheets to conform with current period presentation.
| | | | | |
128
|
CON EDISON ANNUAL REPORT 2022 |
Earnings Per Common Share
Con Edison presents basic and diluted earnings per share (EPS) on the face of its consolidated income statement. Basic EPS is calculated by dividing earnings available to common shareholders (“Net income for common stock” on Con Edison’s consolidated income statement) by the weighted average number of Con Edison common shares outstanding during the period. In the calculation of diluted EPS, weighted average shares outstanding are increased for additional shares that would be outstanding if potentially dilutive securities were converted to common stock.
Potentially dilutive securities for Con Edison consist of restricted stock units and deferred stock units for which the average market price of the common shares for the period was greater than the exercise price (see Note O) and its common shares that are subject to forward sale agreements (see Note C). Before the issuance of common shares upon settlement of the forward sale agreements, the shares will be reflected in the company’s diluted earnings per share calculations using the treasury stock method. Under this method, the number of common shares used in calculating diluted earnings per share is deemed to be increased by the excess, if any, of the number of shares that would be issued upon physical settlement of the forward sale agreements over the number of shares that could be purchased by the company in the market (based on the average market price during the period) using the proceeds due upon physical settlement (based on the adjusted forward sale price at the end of the reporting period).
Basic and diluted EPS for Con Edison are calculated as follows:
| | For the Years Ended December 31, |
| For the Years Ended December 31, | | | For the Years Ended December 31, |
| (Millions of Dollars, except per share amounts/Shares in Millions) | (Millions of Dollars, except per share amounts/Shares in Millions) | 2022 | | 2021 | | 2020 | (Millions of Dollars, except per share amounts/Shares in Millions) | 2023 | | 2022 | | 2021 |
| Net income for common stock | Net income for common stock | $1,660 | | $1,346 | | $1,101 | Net income for common stock | $2,519 | | $1,660 | | $1,346 |
| Weighted average common shares outstanding – basic | Weighted average common shares outstanding – basic | 354.5 | | 348.4 | | 334.8 | Weighted average common shares outstanding – basic | 347.7 | | 354.5 | | 348.4 |
| Add: Incremental shares attributable to effect of potentially dilutive securities | Add: Incremental shares attributable to effect of potentially dilutive securities | 1.3 | | 1.0 | | 0.9 | Add: Incremental shares attributable to effect of potentially dilutive securities | 1.6 | | 1.3 | | 1.0 |
| Adjusted weighted average common shares outstanding – diluted | Adjusted weighted average common shares outstanding – diluted | 355.8 | | 349.4 | | 335.7 | Adjusted weighted average common shares outstanding – diluted | 349.3 | | 355.8 | | 349.4 |
| Net Income per common share – basic | Net Income per common share – basic | $4.68 | | $3.86 | | $3.29 | Net Income per common share – basic | $7.25 | | $4.68 | | $3.86 |
| Net Income per common share – diluted | Net Income per common share – diluted | $4.66 | | $3.85 | | $3.28 | Net Income per common share – diluted | $7.21 | | $4.66 | | $3.85 |
The computation of diluted EPS for the years ended December 31, 2021 and 2020 excludes immaterial amounts of performance share awards that were not included because of their anti-dilutive effect.
Estimates
| | | | | |
| CON EDISON ANNUAL REPORT 2023 | 111 |
The preparation of financial statements in conformity with GAAP requires management to make estimates and assumptions that affect the reported amounts of assets and liabilities and contingent assets and liabilities at the date of the financial statements and the reported amounts of revenues and expenses during the reporting period. Actual results could differ from those estimates.
| | | | | |
CON EDISON ANNUAL REPORT 2022 | 129 |
Changes in Accumulated Other Comprehensive Income/(Loss) by Component
Changes to accumulated other comprehensive income/(loss) (OCI) for Con Edison and CECONY are as follows:
| | (Millions of Dollars) | (Millions of Dollars) | Con Edison | | CECONY | (Millions of Dollars) | Con Edison | | CECONY |
| Accumulated OCI, net of taxes, at December 31, 2019 (a) | $(19) | | $(6) |
| OCI before reclassifications, net of tax of $4 and $1 for Con Edison and CECONY, respectively | (11) | | (3) |
| Amounts reclassified from accumulated OCI related to pension plan liabilities, net of tax of $(2) for Con Edison (a)(b) | 5 | | 2 |
| Total OCI, net of taxes, at December 31, 2020 | (6) | | (1) |
| Accumulated OCI, net of taxes, at December 31, 2020 (a) | Accumulated OCI, net of taxes, at December 31, 2020 (a) | $(25) | | $(7) | Accumulated OCI, net of taxes, at December 31, 2020 (a) | $(25) | | $(7) |
| OCI before reclassifications, net of tax of $(8) and $(2) for Con Edison and CECONY, respectively | 22 | | 5 | |
| OCI before reclassifications, net of tax of $(8) and $2 for Con Edison and CECONY, respectively | | OCI before reclassifications, net of tax of $(8) and $2 for Con Edison and CECONY, respectively | 22 | | 5 |
| Amounts reclassified from accumulated OCI related to pension plan liabilities, net of tax of $(3) and $(1) for Con Edison and CECONY, respectively (a)(b) | Amounts reclassified from accumulated OCI related to pension plan liabilities, net of tax of $(3) and $(1) for Con Edison and CECONY, respectively (a)(b) | 8 | | 2 | Amounts reclassified from accumulated OCI related to pension plan liabilities, net of tax of $(3) and $(1) for Con Edison and CECONY, respectively (a)(b) | 8 | | 2 |
| Total OCI, net of taxes, at December 31, 2021 | Total OCI, net of taxes, at December 31, 2021 | 30 | | 7 | Total OCI, net of taxes, at December 31, 2021 | 30 | | 7 |
| Accumulated OCI, net of taxes, at December 31, 2021 (a) | Accumulated OCI, net of taxes, at December 31, 2021 (a) | $5 | | $— | Accumulated OCI, net of taxes, at December 31, 2021 (a) | $5 | | $— |
| OCI before reclassifications, net of tax of $(5) and $(1) for Con Edison and CECONY, respectively | OCI before reclassifications, net of tax of $(5) and $(1) for Con Edison and CECONY, respectively | 13 | | 3 |
| Amounts reclassified from accumulated OCI related to pension plan liabilities, net of tax of $(1) and for Con Edison (a)(b) | 4 | | 1 |
| Amounts reclassified from accumulated OCI related to pension plan liabilities, net of tax of $(1) for Con Edison (a)(b) | | Amounts reclassified from accumulated OCI related to pension plan liabilities, net of tax of $(1) for Con Edison (a)(b) | 4 | | 1 |
| Total OCI, net of taxes, at December 31, 2022 | Total OCI, net of taxes, at December 31, 2022 | 17 | | 4 | Total OCI, net of taxes, at December 31, 2022 | 17 | | 4 |
| Accumulated OCI, net of taxes, at December 31, 2022 (a) | Accumulated OCI, net of taxes, at December 31, 2022 (a) | $22 | | $4 | Accumulated OCI, net of taxes, at December 31, 2022 (a) | $22 | | $4 |
| OCI before reclassifications, net of tax | | OCI before reclassifications, net of tax | — | | (2) |
| Amounts reclassified from accumulated OCI related to pension plan liabilities, net of tax (a)(b) | | Amounts reclassified from accumulated OCI related to pension plan liabilities, net of tax (a)(b) | — | | — |
| Total OCI, net of taxes, at December 31, 2023 | | Total OCI, net of taxes, at December 31, 2023 | — | | (2) |
| Accumulated OCI, net of taxes, at December 31, 2023 (a) | | Accumulated OCI, net of taxes, at December 31, 2023 (a) | $22 | | $2 |
(b) For the portion of unrecognized pension and other postretirement benefit costs relating to the Utilities, costs are recorded into, and amortized out of, regulatory assets and liabilities instead of OCI. The net actuarial losses and prior service costs recognized during the period are included in the computation of total periodic pension and other postretirement benefit cost. See Notes E and F.
Reconciliation of Cash, Temporary Cash Investments and Restricted Cash
Cash, temporary cash investments and restricted cash are presented on a combined basis in the Companies’ consolidated statements of cash flows. At December 31, 20222023 and 2021,2022, cash, temporary cash investments and restricted cash for Con Edison and CECONY were as follows:follows; CECONY did not have material restricted cash balances as of December 31, 2023 and 2022:
| | At December 31, |
| Con Edison | | CECONY |
| At December 31, | | | At December 31, |
| Con Edison | | | Con Edison |
| (Millions of Dollars) | (Millions of Dollars) | 2022 | | 2021 | | 2022 | | 2021 | (Millions of Dollars) | 2023 | 2022 |
| Cash and temporary cash investments | Cash and temporary cash investments | $1,282 | | $992 | | $1,056 | | $920 | Cash and temporary cash investments | $1,189 | $1,282 |
| Restricted cash (a) | Restricted cash (a) | 223 | | 154 | | — | | | — | | Restricted cash (a) | 6 | 223 |
| Total cash, temporary cash investments and restricted cash | Total cash, temporary cash investments and restricted cash | $1,505 | | $1,146 | | $1,056 | | $920 | Total cash, temporary cash investments and restricted cash | $1,195 | $1,505 |
(a)RestrictedCon Edison restricted cash included cash of the Clean Energy Businesses' renewable electric project subsidiaries ($223($6 million and $154$223 million at December 31, 20222023 and 2021,2022, respectively) that, under the related project debt agreements, iswas restricted to being used for normal operating expenditures, debt service, and required reserves until the various maturity dates of the project debt. TheOn March 1, 2023, Con Edison completed the sale of all of the stock of the Clean Energy Businesses wereBusinesses. See Note W. Con Edison retained one deferred project, Broken Bow II, a 75 MW nameplate capacity wind power project located in Nebraska. Con Edison's restricted cash for the 2023 period includes restricted cash of Broken Bow II that continued to be classified as held for sale as of December 31, 2022.2023. See "Assets and Liabilities Held for Sale," below, and Note X. Accordingly, the restricted cash of the Clean Energy Businesses is shown in "Assets Held for Sale" on Con Edison's consolidated balance sheet for 2022.
Use of Hypothetical Liquidation at Book Value
For certain investments of the Clean Energy Businesses and of Con Edison, Con Edison has determined that the use of HLBV accounting is reasonable and appropriate to attribute income and loss to the tax equity investors. Using the HLBV method, the company's earnings from the projects are adjusted to reflect the income or loss allocable to the tax equity investors calculated based on how the project would allocate and distribute its cash if it were to sell all of its assets for their carrying amounts and liquidate at a particular point in time. Under the HLBV method, the company calculates the liquidation value allocable to the tax equity investors at the beginning and end of each period based on the contractual liquidation waterfall and adjusts its income for the period to reflect the
| | | | | |
112 | CON EDISON ANNUAL REPORT 2023 |
change in the liquidation value allocable to the tax equity investors based on the terms of the partnerships' operating agreements. See Note S. The Clean Energy Businesses were classified as held for sale as of December 31, 2022. On March 1, 2023, Con Edison completed the sale of all of the stock of the Clean Energy Businesses. See "Assets and Liabilities Held for Sale," below, Note W and Note X.
Assets and Liabilities Held for Sale
Generally, a long-lived asset or business to be sold is classified as held for sale in the period in which management, with approval from the Board of Directors, commits to a plan to sell, and a sale is expected to be completed within
| | | | | |
130
|
CON EDISON ANNUAL REPORT 2022 |
one year. During the first nine months of 2022, Con Edison considered strategic alternatives with respect to the Clean Energy Businesses. As described further in Note X, onOn October 1, 2022, Con Edison's management received authority to commit to a plan to sell the Clean Energy Businesses and entered into a purchase and sale agreement. As of October 1, 2022 the Clean Energy Businesses met the held-for-sale criteria, and their assets and liabilities are included in "assets held for sale" and "liabilities held for sale" in the current assets and current liabilities sections of the
Con Edison consolidated balance sheet, respectively. Con Edison recorded the Clean Energy Businesses'records assets and liabilities, once held for sale, at the lower of their carrying value or their estimated fair value less cost to sell, and also stoppedstops recording depreciation and amortization on assets held for sale. The "Noncontrolling interest" on Con Edison's consolidated balance sheet reflectsreflected the noncontrolling interest in projects of the Clean Energy Businesses, which projects werethat was held for sale as of December 31, 2022. See Note S.On March 1, 2023, Con Edison completed the sale of all of the stock of the Clean Energy Businesses with the exception of two tax equity interests and one deferred project, Broken Bow II. Broken Bow II continued to be classified as held for sale as of December 31, 2023.
Fair value is the amount at which an asset, liability or business could be bought or sold in a current transaction between willing parties and may be estimated using a number of techniques, or may be observable using quoted market prices. Con Edison used a market approach consisting of the contractual sales price adjusted for estimated working capital and other contractual purchase price adjustments to determine the fair value of the Clean Energy Businesses as of December 31, 2022, and subtracted estimated costs to sell from that calculated fair value. The resulting net fair value of the Clean Energy Businesses' assets exceeded the carrying value of the Clean Energy Businesses' assets through the date of sale in March 2023, and accordingly no impairments were recorded.
The sale of the Clean Energy Businesses doesdid not represent a strategic shift that hashad or willwould have had a major effect on Con Edison, and as such, doesthe sale did not qualify for treatment as a discontinued operation.
For further information, see Note W and Note X.
| | | | | |
CON EDISON ANNUAL REPORT 2022 | 131 |
Note B – Regulatory Matters
Rate Plans
The Utilities provide service to NYNew York customers according to the terms of tariffs approved by the NYSPSC. Tariffs for service to customers of Rockland Electric Company (RECO), O&R’s NJNew Jersey regulated utility subsidiary, are approved by the New Jersey Board of Public Utilities (NJBPU). The tariffs include schedules of rates for service that limit the rates charged by the Utilities to amounts that the Utilities recover from their customers costs approved by the regulator, including capital costs, of providing service to customers as defined by the tariff. The tariffs implement rate plans adopted by state utility regulators in rate orders issued at the conclusion of rate proceedings. Pursuant to the Utilities’ rate plans, there generally can be no change to the charges to customers during the respective terms of the rate plans other than specified adjustments provided for in the rate plans. The Utilities’ rate plans each cover specified periods, but rates determined pursuant to a plan generally continue in effect until a new rate plan is approved by the state utility regulator.
Common provisions of the Utilities’ NYNew York rate plans include:
Earnings sharing that require the Utilities to defer for customer benefit a portion of earnings over specified rates of return on common equity. There is no symmetric mechanism for earnings below specified rates of return on common equity.
Negative revenue adjustments for failure to meet certain performance standards relating to service, reliability, safety and other matters
Net utility plant reconciliations that require deferral as a regulatory liability of the revenue requirement impact of the amount, if any, by which actual average net utility plant balances are less than amounts reflected in rates. There is
| | | | | |
| CON EDISON ANNUAL REPORT 2023 | 113 |
generally no symmetric mechanism if actual average net utility plant balances are more than amounts reflected in rates.
Other revenue adjustments represent positive revenue adjustments, positive incentives, and earnings adjustments mechanisms for achievement of performance standards related to achievement of clean energy goals, safety and other matters.
Rate base, as reflected in the rate plans, is, in general, the sum of the Utilities’ net plant, working capital and certain regulatory assets less deferred taxes and certain regulatory liabilities. For each rate plan, the NYSPSC uses a forecast of the average rate base for each year that new rates would be in effect (“rate year”).
Recoverable energy costs that allow the Utilities to recover on a current basis the costs for the energy they supply with no mark-up to their full-service customers.
Regulatory reconciliations that reconcile pension and other postretirement benefit costs, environmental remediation costs, property taxes, variable-rate tax-exempt debt and certain other costs to amounts reflected in delivery rates for such costs. In addition, changes in the Utilities' costs not reflected in rates, in excess of certain amounts, resulting from changes in tax or changes in legislation, regulation or related actions, are deferred as a regulatory asset or regulatory liability to be reflected in the Utilities' next rate plan or in a manner to be determined by the NYSPSC. Also, the Utilities generally retain the right to petition for recovery or accounting deferral of extraordinary and material cost increases and provision is sometimes made for the utility to retain a share of cost reductions, for example, property tax refunds.
Revenue decoupling mechanisms that reconcile actual energy delivery revenues to the authorized delivery revenues approved by the NYSPSC. The difference is accrued with interest for refund to, or recovery from customers, as applicable.
Earnings sharing that require the Utilities to defer for customer benefit a portion of earnings over specified rates of return on common equity. There is no symmetric mechanism for earnings below specified rates of return on common equity.
Negative revenue adjustments for failure to meet certain performance standards relating to service, reliability, safety and other matters.
Other revenue adjustments represent positive revenue adjustments, positive incentives, and earnings adjustments mechanisms for achievement of performance standards related to achievement of clean energy goals, safety and other matters.
Net utility plant reconciliations that require deferral as a regulatory liability of the revenue requirement impact of the amount, if any, by which actual average net utility plant balances are less than amounts reflected in rates. There is generally no symmetric mechanism if actual average net utility plant balances are more than amounts reflected in rates.
Rate base, as reflected in the rate plans, is, in general, the sum of the Utilities’ net plant, working capital and certain regulatory assets less deferred taxes and certain regulatory liabilities. For each rate plan, the NYSPSC uses a forecast of the average rate base for each year that new rates would be in effect (“rate year”).
Weighted average cost of capital is determined based on the authorized common equity ratio, return on common equity, cost of long-term debt and cost of customer deposits reflected in each rate plan. For each rate plan, the revenues designed to provide the utility a return on invested capital for each rate year are determined by multiplying each utility rate base by its pre–tax weighted average cost of capital. The Utilities’ actual return on common equity will reflect their actual operations for each rate year, and may be more or less than the authorized return on equity reflected in their rate plans (and if more, may be subject to earnings sharing).
| | | | | |
132114
|
20222023 |
Current Rate Cases
On February 16, 2023, CECONY, the New York State Department of Public Service (NYSDPS) and other parties entered into a Joint Proposal for CECONY electric and gas rate plans for the three-year period January 2023 through December 2025. The Joint Proposal is subject to NYSPSC approval. The Joint Proposal is summarized in the tables below.
In November 2022, CECONY filed a request with the NYSPSC for an increase in the rates it charges for steam service rendered in New York, effective November 2023, of $137 million. The filing reflects a return on common equity of 10 percent and a common equity ratio of 50 percent. CECONY is requesting a new mechanism for decoupling revenues from steam consumption and the continuation of provisions with respect to recovery from customers of the cost of fuel and purchased steam and the reconciliation of actual expenses allocable to the steam business to the amounts for such expenses reflected in steam rates for pension and other postretirement benefits, environmental remediation expenses and uncollectible costs. In addition, the company is requesting full reconciliation for property taxes, municipal infrastructure support costs and long-term debt costs. The filing requests symmetrical reconciliation for labor and non-labor inflation rate to the extent that the actual inflation rate deviates from what is assumed in the revenue requirement by 50 basis points up or down. The filing includes supplemental information regarding steam rate plans for November 2024 through October 2025 and November 2025 through October 2026, which the company is not requesting but would consider through settlement discussions. For purposes of illustration, rate increases of $54 million and $49 million effective November 2024 and 2025, respectively, were calculated based upon an assumed return on common equity of 10 percent and a common equity ratio of 50 percent.
In February 2023, CECONY updated its November 2022 request to the NYSPSC for a steam rate increase effective November 2023. The company increased its requested November 2023 rate increase by $4 million to $141 million, increased its illustrated November 2024 rate increase by $1 million to $55 million and increased its illustrated November 2025 rate increase by $4 million to $53 million.
| | | | | |
CON EDISON ANNUAL REPORT 2022 | 133 |
The following tables contain a summary of the Utilities’ rate plans: | | | | | | | | | | | | | | | | |
| CECONY – Electric | | | | | | |
| Effective period | | | | January 2020 – December 2022 (a) | | January 2023 – December 2025 (l) |
| Base rate changes | | | | Yr. 1 – $113 million (b)(a) Yr. 2 – $370 million (b)(a) Yr. 3 – $326 million (b)(a) | | Yr. 1 – $442 million (d)(c) Yr. 2 – $518 million (d)(c) Yr. 3 – $382 million (d)(c) |
| Amortizations to income of net regulatory (assets) and liabilities | | | | Yr. 1 – $267 million (c)(b) Yr. 2 – $269 million (c)(b) Yr. 3 – $272 million (c)(b) | | Yr. 1 – $104 million (k)(j) Yr. 2 – $49 million (k)(j) Yr. 3 – $-205$(205) million (k)(j) |
| Other revenue sources | | | | Retention of $75 million of annual transmission congestion revenues.
Potential earnings adjustment mechanism incentives for energy efficiency and other potential incentives of up to: Yr. 1 - $69 million Yr. 2 - $74 million Yr. 3 - $79 million In 2020, 2021 and 2022, the company recorded $34 million, $64 million and $33 million primarily related to earnings adjustment mechanism incentives for energy efficiency, respectively.
In 2022, the company recorded a positive incentive of $4 million. | | Retention of $75 million of annual transmission congestion revenues.
Potential earnings adjustment mechanism incentives for energy efficiency and other potential incentives of up to: Yr. 1 - $70 million Yr. 2 - $75 million Yr. 3 - $79 million
In 2023, the company recorded $34.4 million primarily related to earnings adjustment mechanism incentives for energy efficiency.
|
| Revenue decoupling mechanisms | | | | Continuation of reconciliation of actual to authorized electric delivery revenues. In 2020, 2021 and 2022, the company deferred for recovery from customers $242 million, $226 million and $90 million of revenues, respectively. | | Continuation of reconciliation of actual to authorized electric delivery revenues.
In 2023, the company deferred for recovery from customers $162 million of revenues. |
| Recoverable energy costs | | | | Continuation of current rate recovery of purchased power and fuel costs. | | Continuation of current rate recovery of purchased power and fuel costs. |
| Negative revenue adjustments | | | | Potential charges if certain performance targets relating to service, reliability, safety and other matters are not met: Yr. 1 - $450 million Yr. 2 - $461 million Yr. 3 - $476 million In 2020, the company recorded negative revenue adjustments of $5 million. In 2021, the company did not record any negative revenue adjustments. In 2022, the company recorded negative revenue adjustments of $3 million. | | Potential charges if certain performance targets relating to service, reliability, safety and other matters are not met: Yr. 1 - $516 million Yr. 2 - $557 million Yr. 3 - $597 million
In 2023, the company did not record any negative revenue adjustments. |
| Regulatory reconciliations | | | | Continuation of reconciliation of expenses for pension and other postretirement benefits, variable-rate debt, major storms, property taxes (e)(d), municipal infrastructure support costs (f)(e), the impact of new laws and environmental site investigation and remediation to amounts reflected in rates (g)(f). In 2020 and 2021, the company deferred $288 million and $191 million of net regulatory assets, respectively. In 2022, the company deferred $138 million of net regulatory liabilities. | | Reconciliation of late payment charges (j)(i) and expenses for uncollectibles, pension and other postretirement benefits, variable-rate debt, major storms, property taxes (e)(d), municipal infrastructure support costs (f)(e), the impact of new laws and environmental site investigation and remediation to amounts reflected in rates (g)(f).
In 2023, the company deferred $140 million of net regulatory liabilities. |
| Net utility plant reconciliations | | | | Target levels reflected in rates: Electric average net plant target excluding advanced metering infrastructure (AMI): Yr. 1 - $24,491 million Yr. 2 - $25,092 million Yr. 3 - $25,708 million AMI (h): Yr. 1 - $572 million Yr. 2 - $740 million Yr. 3 - $806 million In 2020, the company deferred $4.1 million as a regulatory asset. In 2021 and 2022, the company deferred $3.2 million and $1.8 million, as a regulatory liability, respectively. | | Target levels reflected in rates: Electric average net plant target excluding advanced metering infrastructure (AMI) and Customer Service System (CSS) for Yr. 1: Yr. 1 - $27,847 million Yr. 2 - $29,884 million Yr. 3 - $31,026 million AMI (h): Yr. 1 - $744 million CSS: Yr. 1 - $11 million
In 2023, the company deferred $1.2 million as a regulatory asset. |
| Average rate base | | | | Yr. 1 - $21,660 million Yr. 2 - $22,783 million Yr. 3 - $23,926 million | | Yr. 1 - $26,095 million Yr. 2 - $27,925 million Yr. 3 - $29,362 million |
| | | | | |
134
|
20222023 | 115 |
| | | | | | | | | | | | | | | | |
| Weighted average cost of capital (after-tax) | | | | Yr. 1 to Yr. 3 – 6.61 percent | | Yr. 1 - 6.75 percent Yr. 2 - 6.79 percent Yr. 3 - 6.85 percent |
| Authorized return on common equity | | | | 8.8 percent | | 9.25 percent |
Actual return on common equity (h) (i) (j) | | | | Yr. 1 – 8.5 percent Yr. 2 – 8.03 percent Yr. 3 – 8.41 percent
| | Yr. 1 – 9.46 percent
|
| Earnings sharing | | | | Most earnings above an annual earnings threshold of 9.3 percent are to be applied to reduce regulatory assets for environmental remediation and other costs accumulated in the rate year.
In 2020, 2021 and 2022, the company had no earnings sharing above the threshold. A reserve of $4.3 million was recorded in 2021 related to a potential adjustment to the excess earnings sharing amount for 2016. | | Most earnings above an annual earnings threshold of 9.75 percent are to be applied to reduce regulatory assets for environmental remediation and other costs accumulated in the rate year.
|
| Cost of long-term debt | | | | Yr. 1 to Yr. 3 – 4.63 percent | | Yr. 1 – 4.46 percent Yr. 2 – 4.54 percent Yr. 3 – 4.64 percent |
| Common equity ratio | | | | 48 percent | | 48 percent |
(a)In January 2020, the NYSPSC approved the October 2019 Joint Proposal for CECONY's electric rate plan for January 2020 through December 2022. If at the end of any semi-annual period ending June 30 and December 31, Con Edison’s investments in its non-utility businesses exceed 15 percent of its total consolidated revenues, assets or cash flow, or if the ratio of holding company debt to total consolidated debt rises above 20 percent, CECONY is required to notify the NYSPSC and submit a ring-fencing plan or a demonstration why additional ring-fencing measures (see Note U) are not necessary.
(b)Base rates reflect recovery by the company of certain costs of its energy efficiency, demonstration projects, non-wire alternative projects (including the Brooklyn Queens demand management program), and off-peak electric vehicle charging programs (Yr. 1 - $206 million; Yr. 2 - $245 million; and Yr. 3 - $251 million) over a 10-year period, including the overall pre-tax rate of return on such costs.
(c)(b)Amounts reflect amortization of the 2018 tax savings under the federal Tax Cuts and Jobs Act of 2017 (TCJA) allocable to CECONY’s electric customers ($377 million) over a three-year period ($126 million annually), the protected portion of the regulatory liability for excess deferred income taxes allocable to CECONY’s electric customers ($1,663 million) over the remaining lives of the related assets ($49 million in Yr. 1, $50 million in Yr. 2, and $53 million in Yr. 3) and the unprotected portion of the net regulatory liability ($784 million) over five years ($157 million annually). Amounts also reflect amortization of the regulatory asset for deferred MTA power reliability costs ($238 million) over a five-year period ($48 million annually).
(d)(c)The electric base rate increases shown above will be implemented with increases of $457 million in Yr. 1; $457 million in Yr. 2; and $457 million in Yr. 3 in order to levelize the customer bill impact. New rates will bewere effective as of January 1, 2023.2023 and CECONY will beginbegan billing customers at the new levelized rate once the Joint Proposal is approved by the NYSPSC. Anyin August 2023. The shortfall in revenues due to the timing of billing to customers will be($216 million) are being collected throughthrough a surcharge billed through 2024, includingincluding a carrying charge on the outstanding balance. Base rates reflect recovery by the company of certain costs of its energy efficiency, demonstration projects, non-wire alternative projects (including the Brooklyn Queens demand management program), and off-peak electric vehicle charging programs (Yr. 1 - $244 million; Yr. 2 - $237 million; and Yr. 3 - $281 million) over periods varying between seven and fifteen years, including the overall pre-tax rate of return on such costs.
(e)(d)Deferrals for property taxes are limited to 90 percent of the difference from amounts reflected in rates, subject to an annual maximum for the remaining difference of not more than a maximum number of basis points impact on return on common equity: reflected inequity of 10.0 basis points, 7.5 basis points and 5.0 basis points for each of Yr. 1, Yr. 2 and Yr. 3, respectively, of the January 2020 - December– 2022 rate plan Yr 1 -and 10.0 basis points; Yr 2 - 7.5 basis points; and Yr 3 -points, 5.0 basis points; reflected in the January 2023 - December 2025 Yr 1 - 10.0 basis points; Yr 2 -points and 5.0 basis points;points for each of Yr. 1, Yr. 2 and YrYr. 3, - 5.0 basis points,respectively, of the 2023 – 2025 rate plan.
(f)(e)In general, if actual expenses for municipal infrastructure support (other than company labor) are below the amounts reflected in rates the company will defer the difference for credit to customers, and if the actual expenses are above the amount reflected in rates the company will defer for recovery from customers 80 percent of the difference subject to a maximum deferral, subject to certain conditions, of 15 percent of the amount reflected in the rate plans.
(g)(f)In addition, the NYSPSC staff continues its focused operations audit to investigate CECONY's income tax accounting. Any NYSPSC ordered adjustment to CECONY’s income tax accounting is expected to be refunded to or collected from customers, as determined by the NYSPSC. See "Other Regulatory Matters," below.
(h)(g)Reconciliation of net utility plant for AMI will be done on a combined basis for electric and gas.
(i)(h)Calculated in accordance with the earnings calculation method prescribed in the rate order.
(j)(i)In November 2021, the NYSPSC issued an order that allowed CECONY to recover $43 million of late payment charges and fees that were not billed for the year ended December 31, 2020. The recalculated return on equity for 2020 which reflects the recovery of these fees is 8.81 percent.
(k)(j)Amounts reflect amortization of the 2018 tax savings under the federal Tax Cuts and Jobs Act of 2017 (TCJA)TCJA allocable to CECONY’s electric customers ($256 million) over a two-year period ($128 million in Yr. 1 and Yr. 2), the protected portion of the regulatory liability for excess deferred income taxes allocable to CECONY’s electric customers ($1,512 million) over the remaining lives of the related assets ($34 million in Yr. 1, $63 million in Yr. 2, and $34 million in Yr. 3) and the unprotected portion of the net regulatory liability ($306 million) over two years ($153 million annually). Amounts also reflect amortization of the regulatory asset for deferred MTA power reliability costs ($93 million) over a three-year period ($31 million annually).
(l)The February 2023 Joint Proposal is subject to NYSPSC approval.
| | | | | |
116 | CON EDISON ANNUAL REPORT 2023 |
In April 2023, the need to constructNYSPSC approved CECONY’s December 2022 petition seeking cost recovery approval for a new projectproposed clean energy hub in Jamaica, Queens consisting of two substations and associated feedersBrooklyn, New York (Brooklyn Clean Energy Hub) at an estimated cost of $1,100$810 million, (the Eastern Queens Reliability Project). Pursuantand an estimated in-service date of December 2027, that is in addition to the Joint Proposal,capital expenditures approved in the CECONY may petition2023 - 2025 electric rate plan summarized above. The Brooklyn Clean Energy Hub primarily addresses an identified reliability need in 2028 due to a forecasted increase in electric demand. The Brooklyn Clean Energy Hub provides the flexibility for offshore wind resources to interconnect to it during construction and after it commences operation.Construction began in September 2023 and is expected to be completed by 2028. The carrying costs of the Brooklyn Clean Energy Hub will be recovered from customers via a surcharge mechanism after it is placed into service and until such costs are reflected in base rates.
In January 2024, the NYSPSC for approval to buildapproved CECONY's August 2023 petition requesting authorization and receive cost recovery forto construct two new substations in Jamaica, Queens (the Reliable Clean City - Idlewild Project) that is in addition to the Eastern Queens Reliabilitycapital expenditures approved in CECONY's 2023 - 2025 electric rate plan summarized above. The project is expected to be completed by May 2028 to meet anticipated reliability needs and to support New York State’s Climate Leadership and Community Protection Act goals. CECONY estimates that construction will cost $1,200 million. The carrying costs of the Reliable Clean City – Idlewild Project no sooner than 30 dayswill be recovered from customers via a surcharge mechanism after the NYSPSC adopts the Joint Proposal.it is placed into service and until such costs are reflected in base rates.
| | | | | |
CON EDISON ANNUAL REPORT 20222023 | 135117 |
| | | | | | | | | | | | | | |
| CECONY – Gas | | | | |
| Effective period | | January 2020 – December 2022 (a) | | January 2023 – December 2025 (l) |
| Base rate changes | | Yr. 1 – $84 million (b)(a) Yr. 2 – $122 million (b)(a) Yr. 3 – $167 million (b)(a) | | Yr. 1 – $217 million (d)(c) Yr. 2 – $173 million (d)(c) Yr. 3 – $122 million (d)(c) |
Amortizations to income of net
regulatory (assets) and liabilities | | Yr. 1 – $45 million (c)(b) Yr. 2 – $43 million (c)(b) Yr. 3 – $10 million (c)(b) | | Yr. 1 – $31 million (k)(j) Yr. 2 – $24 million (k)(j) Yr. 3 – $(11) million (k)(j) |
| Other revenue sources | | Retention of annual revenues from non-firm customers of up to $65 million and 15 percent of any such revenues above $65 million.
Potential incentives if performance targets related to gas leak backlog, leak prone pipe and service terminations are met: Yr. 1 – $20 million Yr. 2 – $22 million Yr. 3 – $25 million In 2020, 2021 and 2022, the company recorded $3 million, $26 million and $8 million of earnings adjustment mechanism incentives for energy efficiency, respectively.
In 2020, 2021 and 2022, the company recorded positive incentives of $13 million, $7 million, and $9 million respectively. In 2021, the company reversed $6 million of positive incentives recorded in 2020 pursuant to an order issued by the NYSPSC in December 2021. | | Retention of annual revenues from non-firm customers of up to $65 million and 15 percent of any such revenues above $65 million.
Potential earnings adjusted mechanism incentives for energy efficiency and other potential incentives of up to: Yr. 1 - $18 million Yr. 2 - $20 million Yr. 3 - $21 million
In 2023, the company recorded $5 million of earnings adjustment mechanism incentives for energy efficiency.
In 2023, the company recorded positive incentives of $3 million. |
| Revenue decoupling mechanisms | | Continuation of reconciliation of actual to authorized gas delivery revenues, modified to be calculated based upon revenue per customer class instead of revenue per customer. In 2020, 2021 and 2022, the company deferred for recovery from customers $27 million, $100 million and $141 million of revenues, respectively. | | Continuation of reconciliation of actual to authorized gas delivery revenues, modified to be calculated based upon revenue per customer class instead of revenue per customer.
In 2023, the company deferred for recovery from customers $162 million of revenues. |
| Recoverable energy costs | | Continuation of current rate recovery of purchased gas costs. | | Continuation of current rate recovery of purchased gas costs. |
| Negative revenue adjustments | | Potential charges if performance targets relating to service, safety and other matters are not met: Yr. 1 – $81 million Yr. 2 – $88 million Yr. 3 – $96 million In 2020 and 2021, the company did not record any negative revenue adjustments. In 2022, the company recorded negative revenue adjustments of $8 millionmillion. | | Potential charges if performance targets relating to service, safety and other matters are not met: Yr. 1 - $107 million Yr. 2 - $119 million Yr. 3 - $130 million
In 2023, the company recorded negative revenue adjustments of $3 million. |
| Regulatory reconciliations | | Continuation of reconciliation of expenses for pension and other postretirement benefits, variable-rate tax-exempt debt, major storms, property taxes (e)(d), municipal infrastructure support costs (f)(e), the impact of new laws and environmental site investigation and remediation to amounts reflected in rates (g)(f). In 2020 and 2021, the company deferred $91 million and $14 million of net regulatory assets, respectively. In 2022, the company deferred $70 million of net regulatory liabilities. | | Reconciliation of late payment charges (j)(i) and expenses for uncollectibles, pension and other postretirement benefits, variable-rate debt, major storms, property taxes (e)(d), municipal infrastructure support costs (f)(e), the impact of new laws and environmental site investigation and remediation to amounts reflected in rates (g)(f).
In 2023, the company deferred $12 million of net regulatory liabilities. |
| Net utility plant reconciliations | | Target levels reflected in rates: Gas average net plant target excluding AMI: Yr. 1 – $8,108 million Yr. 2 – $8,808 million Yr. 3 – $9,510 million AMI (h)(g): Yr. 1 – $142 million Yr. 2 – $183 million Yr. 3 – $211 million In 2020 and 2021, the company deferred $24.7 million and $26 million, as a regulatory liability, respectively. In 2022, the company deferred $10.8 million as a regulatory asset. | | Target levels reflected in rates: Gas average net plant target excluding AMI and CSS for Yr. 1: Yr. 1 - $10,466 million Yr. 2 - $11,442 million Yr. 3 - $12,142 million AMI (h)(g): Yr. 1 - $234 million CSS: Yr. 1 - $2 million
|
| Average rate base | | Yr. 1 – $7,171 million Yr. 2 – $7,911 million Yr. 3 – $8,622 million | | Yr. 1 - $9,647 million Yr. 2 - $10,428 million Yr. 3 - $11,063 million |
| | | | | |
136118
|
20222023 |
| | | | | | | | | | | | | | |
Weighted average cost of capital
(after-tax) | | Yr. 1 – Yr. 3 - 6.61 percent
| | Yr. 1 – 6.75 percent Yr. 2 – 6.79 percent Yr. 3 – 6.85 percent |
| Authorized return on common equity | | 8.8 percent | | 9.25 percent |
Actual return on common equity (h) (i) (j) | | Yr. 1 – 8.4 percent Yr. 2 – 8.48 percent Yr. 3 – 8.93 percent
| | Yr. 1 – 9.00 percent
|
| Earnings sharing | | Most earnings above an annual earnings threshold of 9.3 percent are to be applied to reduce regulatory assets for environmental remediation and other costs accumulated in the rate year.
In 2020, 2021 and 2022, the company had no earnings above the threshold. | | Most earnings above an annual earnings threshold of 9.75 percent are to be applied to reduce regulatory assets for environmental remediation and other costs accumulated in the rate year.
|
| Cost of long-term debt | | Yr. 1 – Yr. 3 - 4.63 percent
| | Yr. 1 – 4.46 percent Yr. 2 – 4.54 percent Yr. 3 – 4.64 percent |
| Common equity ratio | | 48 percent | | 48 percent |
(a)In January 2020, the NYSPSC approved the October 2019 Joint Proposal for CECONY's gas rate plan for January 2020 through December 2022. If at the end of any semi-annual period ending June 30 and December 31, Con Edison’s investments in its non-utility businesses exceed 15 percent of its total consolidated revenues, assets or cash flow, or if the ratio of holding company debt to total consolidated debt rises above 20 percent, CECONY is required to notify the NYSPSC and submit a ring-fencing plan or a demonstration why additional ring-fencing measures (see Note U) are not necessary.
(b)The gas base rate increases shown above will be implemented with increases of $47 million in Yr. 1; $176 million in Yr. 2; and $170 million in Yr. 3 in order to levelize customer bill impacts. Base rates reflect recovery by the company of certain costs of its energy efficiency program (Yr. 1 - $30 million; Yr. 2 - $37 million; and Yr. 3 - $40 million) over a ten-year period, including the overall pre-tax rate of return on such costs.
(c)(b) Amounts reflect amortization of the remaining 2018 TCJA tax savings allocable to CECONY’s gas customers ($63 million) over a two year period ($32 million annually), the protected portion of the regulatory liability for excess deferred income taxes allocable to CECONY’s gas customers ($725 million) over the remaining lives of the related assets ($14 million in Yr. 1, $14 million in Yr. 2, and $12 million in Yr. 3) and the unprotected portion of the net regulatory liability ($107 million) over five years ($21 million annually)
(d)(c) The gas base rate increases shown above will be implemented with increases of $187 million in Yr. 1; $187 million in Yr. 2; and $187 million in Yr. 3 in order to levelize the customer bill impact. New rates will bewere effective as of January 1, 2023. CECONY will beginbegan billing customers at the new levelized rate once the Joint Proposal is approved by the NYSPSC. Anyin August 2023. The shortfall in revenues due to the timing of billing to customers will be($99 million) are being collected throughthrough a surcharge billed through 2025, including a carrying charge on the outstanding balance. Base rates reflect recovery by the company of certain costs of its energy efficiency programs (Yr. 1 - $45 million; Yr. 2 - $78 million; and Yr. 3 - $62 million) over a fifteen-year period, including the overall pre-tax rate of return on such costs.
(e)(d)-(i)(h) See footnotes (e)(d) - (i)(h) to the table under “CECONY Electric,” above.
(j)(i) In November 2021, the NYSPSC issued an order that allowed CECONY to recover $7 million of late payment charges and fees that were not billed for the year ended December 31, 2020. The recalculated return on equity for 2020 which reflects the recovery of these fees is 8.56 percent.
(k)(j) Amounts reflect amortization of the 2018 tax savings under the federal Tax Cuts and Jobs Act of 2017 (TCJA)TCJA allocable to CECONY’s gas customers ($32 million) over a two-year period ($16 million in Yr. 1 and Yr. 2), the protected portion of the regulatory liability for excess deferred income taxes allocable to CECONY’s gas customers ($679 million) over the remaining lives of the related assets ($9 million in Yr. 1, $10 million in Yr. 2, and $10 million in Yr. 3) and the unprotected portion of the net regulatory liability ($42 million) over two years ($21 million annually).
(l) The February 2023 Joint Proposal is subject to NYSPSC approval.
| | | | | |
CON EDISON ANNUAL REPORT 20222023 | 137119 |
| | | | | | | | | | | | | | |
| CECONY – Steam | | | | |
| Effective period | | January 2014 – December 2016 (a)(g) | | November 2023 – October 2026 |
| Base rate changes | | Yr. 1 – $(22.4) million (b)(h) Yr. 2 – $19.8–$19.8 million (b)(h) Yr. 3 – $20.3 million (b)–$20.3 million(h) Yr. 4 – None Yr. 5 – None Yr. 6 – None Yr. 7 – None Yr. 8 – None Yr. 9 - None Yr.10 - None | | Yr. 1 – $110 million (a) Yr. 2 – $44 million (a) Yr. 3 – $45 million (a) |
Amortizations to income of net
regulatory (assets) and liabilities | | $37 million over three years | | Yr. 1 – $15 million (b) Yr. 2 – $3 million (b) Yr. 3 – $3 million (b) |
| Weather Normalization Adjustment | | | | Implementation of a weather normalization adjustment to reflect normal weather conditions during the heating season. |
| Recoverable energy costs | | Current rate recovery of purchased power and fuel costs. | | Continuation of current rate recovery of purchased power and fuel costs. |
| Negative revenue adjustments | | Potential charges (up to $1 million annually) if certain steam performance targets are not met. In years 2014 through 2022,2023, the company did not record any negative revenue adjustments. | | Potential charges if certain performance targets relating to service, reliability, safety and other matters are not met: Yr. 1 - $3.7 million Yr. 2 - $3.8 million Yr. 3 - $3.8 million |
CostRegulatory reconciliations (c)(d)(i) (j) | | In 2014, 2015, 2016, 2017, 2018, 2019, 2020, 2021, 2022 and 2022,2023, the company deferred $42 million of net regulatory liabilities, $17 million of net regulatory assets, $8 million and $14 million of net regulatory liabilities, $1 million of net regulatory assets, $8 million of net regulatory liabilities, $35 million of net regulatory assets, $32 million of net regulatory assets, and $11 million of net regulatory assets and $18 million net regulatory liabilities, respectively. | | Reconciliation of uncollectible expenses and late payment charges (c) and expenses for pension and other postretirement benefits, variable-rate debt, property taxes (d), municipal infrastructure support costs (e), the impact of new laws and environmental site investigation and remediation to amounts reflected in rates. (f)
| |
| Net utility plant reconciliations | | Target levels reflected in rates were: Production: Yr. 1 – $1,752 million Yr. 2 – $1,732 million Yr. 3 – $1,720 million Distribution: Yr. 1 – $6 million Yr. 2 – $11 million Yr. 3 – $25 million The company reduced its regulatory liability by $0 million$0.1 in 2014 and immaterial amounts in 2015 and 2016 and no deferrals were recorded in 2017, 2018, 2019. In 2020 and 2021, the company deferred $2 million and $1 million as a regulatory liability, respectively. In 2022, the company deferred $0.1 million as a regulatory asset. No deferral was recorded in 2023. | | Yr. 1 - $2,025 million Yr. 2 - $2,029 million Yr. 3 - $2,015 million |
| Average rate base | | Yr. 1 – $1,511 million Yr. 2 – $1,547 million Yr. 3 – $1,604 million | | Yr. 1 - $1,799 million Yr. 2 - $1,848 million Yr. 3 - $1,882 million |
| Weighted average cost of capital (after-tax) | | Yr. 1 – 7.10 percent Yr. 2 – 7.13 percent Yr. 3 – 7.21 percent | | Yr. 1 - 6.78 percent Yr. 2 - 6.81 percent Yr. 3 - 6.83 percent |
| Authorized return on common equity | | 9.3 percent | | 9.25 percent |
| | | | | |
120 | CON EDISON ANNUAL REPORT 2023 |
| | | | | | | | | | | | | | |
Actual return on common equity (e)(j) | | Yr. 1 – 9.82 percent Yr. 2 – 10.88 percent Yr. 3 – 10.54 percent Yr. 4 – 9.51 percent Yr. 5 – 11.73 percent Yr. 6 – 10.45 percent Yr. 7 – 7.91 percent Yr. 8 – 5.99 percent Yr. 9 - 5.72 percent | | |
Yr. 10 - (0.10) percent
| | | | | |
138.
| |
CON EDISON ANNUAL REPORT 2022
| | | | | | | | | | | | | | |
| Earnings sharing | | Weather normalized earnings above an annual earnings threshold of 9.9 percent are to be applied to reduce regulatory assets for environmental remediation and other costs. In 2014, the company had no earnings above the threshold. Actual earnings were $11.5 million and $7.8 million above the threshold in 2015 and 2016, respectively. In 2017, actual earnings were $8.5 million above the threshold, offset in part by a positive adjustment related to 2016 of $4 million. In 2018, actual earnings were $16.5 million above the threshold, and an additional $1.1 million related to 2017 was recorded. In 2019 actual earnings were $5 million above the threshold, offset in part by an adjustment related to 2018 of $2.3 million. In 2020, 2021, 2022 and 2022,2023, the company had no earnings sharing above the threshold. Reserve adjustments of $0.4 million and $0.2 million were recorded in 2021 related to potential adjustment to the excess earnings sharing amounts for 2016 and 2018, respectively. | | Most earnings above an annual earnings threshold of 9.75 percent are to be applied to reduce regulatory assets for environmental remediation and other costs accumulated in the rate year. |
| Cost of long-term debt | | Yr. 1 – 5.17 percent Yr. 2 – 5.23 percent Yr. 3 – 5.39 percent | | Yr. 1 – 4.51 percent Yr. 2 – 4.58 percent Yr. 3 – 4.62 percent |
| Common equity ratio | | 48 percent | | 48 percent |
(a)The base rate increases will be implemented with increases of $77.8 million in Yr. 1; $77.8 million in Yr. 2; and $77.8 million in Yr. 3 to levelize the customer bill impact. New rates were effective as of November 1, 2023. CECONY began billing customers at the new levelized rate in December 2023.
(b)Amounts reflect amortization of the tax savings under the federal Tax Cuts and Jobs Act of 2017 (TCJA) for the unprotected portion of the regulatory liability for excess deferred income taxes allocable to CECONY’s steam customers (the entire $24 million in Yr.1), the protected portion of the regulatory liability for excess deferred income taxes allocable to CECONY’s steam customers over the remaining lives of the related assets ($3 million in Yr. 1; $5 million in Yr. 2; and $6 million in Yr. 3) and the non-plant portion of the regulatory asset for deficient deferred income taxes allocable to CECONY’s steam customers (the entire $11 million in Yr.1).
(c)CECONY will defer the difference between its actual write-offs of uncollectible expenses and late payment fees (from January 1, 2020 through October 31, 2026) to amounts reflected in rates, with recovery/refund from or to customers via surcharge/sur-credit. Surcharge recoveries for write-offs of uncollectible expenses and late payment fees will each be subject to an annual cap that produces no more than a half percent (0.5 percent) total customer bill impact (estimated to be $2.5 million, $3.0 million, $3.5 million for Yr. 1, Yr. 2 and Yr. 3, respectively). Amounts in excess of the annual surcharge cap in a specific year may be rolled forward for recovery and will count towards the following year’s surcharge cap. Amounts in excess of the surcharge cap will be deferred as a regulatory asset for recovery in CECONY’s next steam base rate case.
(d)Deferrals for property taxes are limited to 90 percent of the difference from amounts reflected in rates, subject to an annual maximum for the remaining difference of not more than a maximum number of basis points impact on return on common equity (Yr. 1 – 10.0 basis points; Yr. 2 – 7.5 basis points; and Yr. 3 – 5.0 basis points), with recovery/refund from or to customers via surcharge/sur-credit. Surcharge recoveries will be subject to an annual cap that produces no more than a half percent (0.5 percent) total customer bill impact (estimated to be $2.5 million, $3.0 million, $3.5 million for Yr. 1, Yr. 2 and Yr. 3, respectively). Amounts in excess of the annual surcharge cap in a specific year may be rolled forward for recovery and will count towards the following year’s surcharge cap. Amounts in excess of the surcharge cap will be deferred as a regulatory asset for recovery in CECONY’s next steam base rate case.
(e)In general, if actual expenses for municipal infrastructure support (other than company labor) are below the amounts reflected in rates, CECONY will defer the difference for credit to customers, and if the actual expenses are above the amount reflected in rates, CECONY will defer for recovery from customers 80 percent of the difference subject to a maximum deferral, subject to certain conditions, of 30 percent of the amount reflected in the rate plan.
(f)In addition, the NYSPSC continues its focused operations audit to investigate CECONY's income tax accounting. Any NYSPSC ordered adjustment to CECONY’s income tax accounting is expected to be refunded to or collected from customers, as determined by the NYSPSC. See "Other Regulatory Matters," below.
(g)Rates determined pursuant to this rate plan continuecontinued to be in effect until October 31, 2023. 2023 or Yr. 10 represents a new rate plan is approved by the NYSPSC.partial year commencing January 1, 2023 through October 31, 2023.
(b)(h)The impact of these base rate changes was deferred which resulted in an $8 million regulatory liability at December 31, 2016.
| | | | | |
| CON EDISON ANNUAL REPORT 2023 | 121 |
(c)
(i)Deferrals for property taxes are limited to 90 percent of the difference from amounts reflected in rates, subject to an annual maximum for the remaining difference of not more than a 10 basis point impact on return on common equity.
(d)In addition, the NYSPSC staff has commenced a focused operations audit to investigate CECONY’s income tax accounting. Any NYSPSC ordered adjustment to CECONY’s income tax accounting is expected to be refunded to or collected from customers, as determined by the NYSPSC. CECONY’s historical inadvertent understatement of its calculation of total federal income tax expense for ratemaking purposes has not been addressed in the current steam rate plan. See "Other Regulatory Matters," below.
(e)(j)Calculated in accordance with the earnings calculation method prescribed in the rate order.
| | | | | |
122 | CON EDISON ANNUAL REPORT 2022 | 1392023 |
| | | | | | | | | | | | | | |
| O&R New York – Electric | | | | |
| Effective period (a) | | January 2019 – December 2021 | | January 2022 – December 2024 |
| Base rate changes | | Yr. 1 – $13.4 million (b)(a) Yr. 2 – $8.0 million (b)(a) Yr. 3 – $5.8 million (b)(a) | | Yr. 1 – $4.9 million (i)(h) Yr. 2 – $16.2 million (i)(h) Yr. 3 – $23.1 million (i)(h) |
Amortizations to income of net
regulatory (assets) and liabilities | | Yr. 1 – $(1.5) million (c)(b) Yr. 2 – $(1.5) million (c)(b) Yr. 3 – $(1.5) million (c)(b) | | Yr. 1 – $11.8 million (j)(i) Yr. 2 – $13.5 million (j)(i) Yr. 3 – $15.2 million (j)(i) |
| Other revenue sources | | Potential earnings adjustment mechanism incentives for peak reduction, energy efficiency, Distributed Energy Resources utilization and other potential incentives of up to: Yr. 1 - $3.6 million Yr. 2 - $4.0 million Yr. 3 - $4.2 million
Potential incentive if performance target related to customer service is met: $0.5 million annually.
In 2019, 2020 and 2021, the company recorded $2.6 million, $1.9 million and $1.8 million of earnings adjustment mechanism incentives for energy efficiency, respectively. In 2019 and 2020, the company recorded $0.2 million and $0.5 million of incentives for customer service, respectively. In 2021, the company did not record incentives for customer service. In 2021, the company reversed the $0.5 million of incentives recorded in 2020 pursuant to the October 2021 Joint Proposal. | | Potential earnings adjustment mechanism incentives for energy efficiency and other potential incentives of up to:
Yr. 1 – $3.3 million
Yr. 2 – $2.3 million
Yr. 3 – $4.0 million
In 2022 and 2023, the company recorded $2.7 million and $1.5 million of earnings adjustment mechanism incentives for energy efficiency, respectively. |
| Revenue decoupling mechanisms | | Continuation of reconciliation of actual to authorized electric delivery revenues.
In 2019 and 2020, the company deferred $0.1 million and $6 million regulatory assets, respectively. In 2021, $10 million was deferred as regulatory liabilities. | | Continuation of reconciliation of actual to authorized electric delivery revenues.
In 2022 and 2023, the company deferred $6.9 million and $3.4 million regulatory liabilities.assets respectively. |
| Recoverable energy costs | | Continuation of current rate recovery of purchased power costs. | | Continuation of current rate recovery of purchased power and fuel costs. |
| Negative revenue adjustments | | Potential charges if certain performance targets relating to service, reliability and other matters are not met: Yr. 1 - $4.4 million Yr. 2 - $4.4 million Yr. 3 - $4.5 million
In 2019,2020 and 2021, the company did not record any negative revenue adjustments. | | Potential charges if certain performance targets relating to service, reliability, safety and other matters are not met: Yr. 1 – $4.3 million Yr. 2 – $4.4 million Yr. 3 – $5.1 million
In 2022 and 2023, the company did not record any negative revenue adjustments. |
| Regulatory reconciliations | | Reconciliation of expenses for pension and other postretirement benefits, environmental remediation costs, property taxes (d)(c), energy efficiency program (e)(d), major storms, the impact of new laws and certain other costs to amounts reflected in rates (f)(e).
In 2019, 2020 and 2021, the company deferred $4.3 million, $30.3 million and $24 million as net regulatory assets, respectively.
| | Reconciliation of late payment charges (l)(k) and reconciliation of expenses for pension and other postretirement benefits, environmental remediation costs, property taxes (d)(c), energy efficiency program (k)(j), major storms, uncollectible expenses and certain other costs to amounts reflected in rates.rates (e).
In 2022 and 2023, the company deferred $9.4 million and $15.4 million as net regulatory liabilities.liabilities, respectively. |
| Net utility plant reconciliations | | Target levels reflected in rates were: Electric average net plant target excluding advanced metering infrastructure (AMI): Yr. 1 - $1,008 million Yr. 2 - $1,032 million Yr. 3 - $1,083 million AMI (g)(f): Yr. 1 - $48 million Yr. 2 - $58 million Yr. 3 - $61 million
The company increased regulatory asset by an immaterial amount in 2019, $0.4 million as a regulatory liability in 2020 and an immaterial amount as a regulatory liability in 2021. | | Target levels reflected in rates: Electric average net plant target Yr. 1 – $1,175 million Yr. 2 – $1,198 million Yr. 3 – $1,304 million
The company increased regulatory assetasset/liabilities by an immaterial amount in 2022.2022 and 2023. |
| Average rate base | | Yr. 1 – $878 million Yr. 2 – $906 million Yr. 3 – $948 million | | Yr. 1 – $1,021 million Yr. 2 – $1,044 million Yr. 3 – $1,144 million |
| | | | | |
| CON EDISON ANNUAL REPORT 2023 | 123 |
| | | | | | | | | | | | | | |
| Weighted average cost of capital (after-tax) | | Yr. 1 – 6.97 percent Yr. 2 – 6.96 percent Yr. 3 – 6.96 percent | | Yr. 1 – 6.77 percent Yr. 2 – 6.73 percent Yr. 3 – 6.72 percent |
| | | | | |
140
|
CON EDISON ANNUAL REPORT 2022 |
| | | | | | | | | | | | | | |
| Authorized return on common equity | | 9.0 percent | | 9.2 percent |
Actual return on common equity (h)(g) | | Yr. 1 – 9.6 percent Yr. 2 – 8.76 percent Yr. 3 – 9.16 percent | | Yr. 1 – 8.96 percent Yr. 2 - 8.73 percent |
| Earnings sharing | | Most earnings above an annual earnings threshold of 9.6 percent are to be applied to reduce regulatory assets for environmental remediation and other costs accumulated in the rate year.
In 2019, 2020 and 2021, earnings did not exceed the earnings threshold. | | Most earnings above an annual earnings threshold of 9.7 percent are to be applied to reduce regulatory assets for environmental remediation and other costs accumulated in the rate year.
In 2022 and 2023, earnings did not exceed the earnings threshold. |
| Cost of long-term debt | | Yr. 1 – 5.17 percent Yr. 2 – 5.14 percent Yr. 3 – 5.14 percent | | Yr. 1 – 4.58 percent Yr. 2 – 4.51 percent Yr. 3 – 4.49 percent |
| Common equity ratio | | 48 percent | | 48 percent |
(a)If at the end of any year, Con Edison’s investments in its non-utility businesses exceed 15 percent of Con Edison’s total consolidated revenues, assets or cash flow, or if the ratio of holding company debt to total consolidated debt rises above 20 percent, O&R is required to notify the NYSPSC and submit a ring-fencing plan or a demonstration why additional ring-fencing measures (see Note U) are not necessary.
(b)The electric base rate increases were implemented with increases of: Yr. 1 - $8.6 million; Yr. 2 - $12.1 million; and Yr. 3 - $12.2 million.
(c)(b)Reflects amortization of, among other things, the company’s net benefits under the TCJA prior to January 1, 2019, amortization of net regulatory liability for future income taxes and reduction of previously incurred regulatory assets for environmental remediation costs. Also for electric, reflects amortization over a six year period of previously incurred incremental major storm costs. See "Other Regulatory Matters," below.
(d)(c)Deferrals for property taxes are limited to 90 percent of the difference from amounts reflected in rates, subject to an annual maximum for the remaining difference of not more than a maximum number of basis points impact on return on common equity: Yr. 1 - 10.0 basis points; Yr. 2 - 7.5 basis points; and Yr. 3 - 5.0 basis points.
(e)(d)Energy efficiency costs are expensed as incurred. Such costs are subject to a downward-only reconciliation over the terms of the electric and gas rate plans. The company will defer for the benefit of customers any cumulative shortfall over the terms of the electric and gas rate plans between actual expenditures and the levels provided in rates.
(f)(e)In addition, the NYSPSC staff has commenced aNYSDPS continues its focused operations audit to investigate O&R’s income tax accounting. Any NYSPSC ordered adjustment to O&R’s income tax accounting is expected to be refunded to or collected from customers, as determined by the NYSPSC. See "Other Regulatory Matters," below.
(g)(f)Net plant reconciliation for AMI expenditures will be implemented for a single category of AMI capital expenditures that includes amounts allocated to both electric and gas customers.
(h)(g)Calculated in accordance with the earnings calculation method prescribed in the rate order.
(i)(h)The Joint Proposal recommends that these base rate changes maywill be implemented with increases of: Yr. 1 - $11.7 million; Yr. 2 - $11.7 million; and Yr. 3 - $11.7 million.
(j)(i)Reflects amortization of, among other things, previously incurred incremental deferred storm costs over a five-year period. See "Other Regulatory Matters," below
(k)(j)Energy efficiency costs are expensed as incurred. Such costs are subject to a cumulative reconciliation that is evenly distributed over the term of the rate plan subject to the caps set forth in the January 2020 NYSPSC New Efficiency New York (“NENY”) order. If the NYSPSC modifies O&R's NENY budgets during the rate term, such modifications will be reflected at the time of the cumulative reconciliations.
(l)(k)The rate plan includes certain COVID-19 provisions, such as: recovery of 2020 late payment charges over three years ($2.2 million); reconciliation of late payment charges to amounts reflected in rates for years 2021 through 2024, with full recovery/refund via surcharge/sur-credit once the annual variance equals or exceeds 5 basis points of return on equity; and reconciliation of write-offs of customer accounts receivable balances to amounts reflected in rates from January 1, 2020 through December 31, 2024, with full recovery/refund via surcharge/sur-credit once the annual variance equals or exceeds 5 basis points of return on equity.
In January 2024, O&R filed a request with the NYSPSC for an increase in the rates it charges for electric service rendered in New York, effective January 1, 2025, of $18.1 million. The filing reflects a return on common equity of 10.25 percent and a common equity ratio of 50 percent. The filing proposes continuation of the provisions with respect to recovery from customers of the cost of purchased power, and the reconciliation of actual expenses allocable to the electric business to the amounts for such costs reflected in electric rates for storm costs, uncollectible expense, pension and other postretirement benefit costs, environmental remediation and property taxes and recovery from customers for proposed climate change resilience investments.
| | | | | |
124 | CON EDISON ANNUAL REPORT 2022 | 1412023 |
| | | | | | | | | | | | | | |
| O&R New York – Gas | | | | |
Effective period (a) | | January 2019 – December 2021 | | January 2022 – December 2024 |
| Base rate changes | | Yr. 1 – $(7.5) million (b)(a) Yr. 2 – $3.6 million (b)(a) Yr. 3 – $0.7 million (b)(a)
| | Yr. 1 – $0.7 million (i)(h) Yr. 2 – $7.4 million (i)(h) Yr. 3 – $9.9 million (i)(h) |
| Amortization to income of net regulatory (assets) and liabilities | | Yr. 1 – $1.8 million (c)(b) Yr. 2 – $1.8 million (c)(b) Yr. 3 – $1.8 million (c)(b)
| | Yr. 1 – $0.8 million Yr. 2 – $0.7 million Yr. 3 – $0.3 million |
| Other revenue sources | | Continuation of retention of annual revenues from non-firm customers of up to $4.0 million, with variances to be shared 80 percent by customers and 20 percent by company.
Potential earnings adjustment mechanism incentives of up to $0.3 million annually.
Potential incentives if performance targets related to gas leak backlog, leak prone pipe, emergency response, damage prevention and customer service are met: Yr. 1 - $1.2 million; Yr. 2 - $1.3 million; and Yr. 3 - $1.3 million.
In 2019, 2020 and 2021, the company recorded $0.5 million of earnings adjustment mechanism incentives for energy efficiency. In 2019, 2020 and 2021, the company recorded $0.7 million, $0.3 million and $0.2 million of positive incentives, respectively. In 2021, the company reversed $0.3 million of positive incentives recorded in 2020 pursuant to the October 2021 Joint Proposal. | | Potential earnings adjustment mechanism incentives for energy efficiency and other potential incentives of up to:
Yr. 1 - $0.2 million
Yr. 2 - $0.2 million
Yr. 3 - $0.4 million
Potential positive rate adjustment for gas safety and performance of up to: Yr. 1 – $1.2 million Yr. 2 – $1.3 million Yr. 3 – $1.4 million
In 2022 and 2023, the company recorded $0.2 million and immaterial amounts of earnings adjustment mechanism incentives for energy efficiency.efficiency, respectively. In 2022 and 2023, the company recorded $0.2 million and $0.2 million of positive incentives, respectively. |
| Revenue decoupling mechanisms | | Continuation of reconciliation of actual to authorized gas delivery revenues.
In 2019 and 2020, the company deferred $0.8 million and $0.5 million as regulatory assets, respectively. In 2021, $4 million was deferred as a regulatory liability. | | Continuation of reconciliation of actual to authorized gas delivery revenues.
In 2022 and 2023, the company deferred $2.0 million and $7.6 million as regulatory assetassets, respectively. |
| Recoverable energy costs | | Continuation of current rate recovery of purchased gas costs. | | Continuation of current rate recovery of purchased gas costs. |
| Negative revenue adjustments | | Potential charges if performance targets relating to service, safety and other matters are not met: Yr. 1 - $5.5 million; Yr. 2 - $5.7 million; and Yr. 3 - $6.0 million.
In 2019, the company recorded a $0.2 million. In 2020 and 2021, the company recorded an immaterial amount of negative revenue adjustments. | | Potential charges if performance targets relating to service, safety and other matters are not met: Yr. 1 – $6.3 million Yr. 2 – $6.7 million Yr. 3 – $7.3 million
In 2022 and 2023, the company recorded $0.1 million and immaterial amounts of negative revenue adjustments.adjustments, respectively. |
| Regulatory reconciliations | | Reconciliation of expenses for pension and other postretirement benefits, environmental remediation costs, property taxes (d)(c), energy efficiency program (e)(d), the impact of new laws and certain other costs to amounts reflected in rates (f)(e).
In 2019 and 2020, the company deferred $6 million as net regulatory liabilities, $1.8 million as net regulatory assets, respectively. In 2021 $8 million were deferred as regulatory assets.
| | Reconciliation of late payment charges (l)(k) and reconciliation of expenses for pension and other postretirement benefits, environmental remediation costs, property taxes (j)(i), energy efficiency program (k)(j), major storms, uncollectible expenses and certain other costs to amounts reflected in rates.
In 2022 and 2023, the company deferred $3.4 million and $12.1 million as net regulatory liabilities.assets/liabilities, respectively. |
| Net utility plant reconciliations | | Target levels reflected in rates were: Gas average net plant target excluding AMI: Yr. 1 - $593 million Yr. 2 - $611 million Yr. 3 - $632 million AMI (g): Yr. 1 - $20 million Yr. 2 - $24 million Yr. 3 - $25 million
In 2019, 2020 and 2021, the company deferred immaterial amounts as regulatory assets. | | Target levels reflected in rates: Gas average net plant target Yr. 1 – $720 million Yr. 2 – $761 million Yr. 3 – $803 million
In 2022 and 2023, the company deferred immaterial amounts as regulatory assets.assets/liabilities. |
| Average rate base | | Yr. 1 – $454 million Yr. 2 – $476 million Yr. 3 – $498 million | | Yr. 1 – $566 million Yr. 2 – $607 million Yr. 3 – $694 million |
| | | | | |
| CON EDISON ANNUAL REPORT 2023 | 125 |
| | | | | | | | | | | | | | |
| Weighted average cost of capital (after-tax) | | Yr. 1 – 6.97 percent Yr. 2 – 6.96 percent Yr. 3 – 6.96 percent | | Yr. 1 – 6.77 percent Yr. 2 – 6.73 percent Yr. 3 – 6.72 percent |
| | | | | |
142
|
CON EDISON ANNUAL REPORT 2022 |
| | | | | | | | | | | | | | |
| Authorized return on common equity | | 9.0 percent | | 9.2 percent |
| Actual return on common equity (h) | | Yr. 1 – 8.90 percent Yr. 2 – 9.58 percent Yr. 3 – 10.11 percent
| | Yr. 1 - 10.01 percent Yr. 2 - 10.40 percent |
| Earnings sharing | | Most earnings above an annual earnings threshold of 9.6 percent are to be applied to reduce regulatory assets for environmental remediation and other costs accumulated in the rate year. In 2019 and 2020, earnings did not exceed the earnings threshold. In 2021, actual earnings were $1.7 million above the threshold.
| | Most earnings above an annual earnings threshold of 9.7 percent are to be applied to reduce regulatory assets for environmental remediation and other costs accumulated in the rate year. In 2022 and 2023, actual earnings were $1.1 million and $2.8 million above the threshold.threshold, respectively. |
| Cost of long-term debt | | Yr. 1 – 5.17 percent Yr. 2 – 5.14 percent Yr. 3 – 5.14 percent | | Yr. 1 – 4.58 percent Yr. 2 – 4.51 percent Yr. 3 – 4.49 percent |
| Common equity ratio | | 48 percent | | 48 percent |
(a)If at the end of any year, Con Edison’s investments in its non-utility businesses exceed 15 percent of Con Edison’s total consolidated revenues, assets or cash flow, or if the ratio of holding company debt to total consolidated debt rises above 20 percent, O&R is required to notify the NYSPSC and submit a ring-fencing plan or a demonstration why additional ring-fencing measures (see Note U) are not necessary.
(b)The gas base rate changes were implemented with changes of: Yr. 1 - $(5.9) million; Yr. 2 - $1.0 million; and Yr. 3 - $1.0 million.
(c)(b)-(h)(g) See footnotes (c) - (h) to the table under “O&R New York - Electric,” above.
(i)(h) The Joint Proposal recommends that these base rate changes maywill be implemented with increases of: Yr. 1 – $4.4 million; Yr. 2 - $4.4 million; and Yr. 3 - $4.4 million.
(j)(i) Deferrals for property taxes are limited to 90 percent of the difference from amounts reflected in rates, subject to an annual maximum for the remaining difference of not more than a maximum number of basis points impact on return on common equity: Yr. 1 - 10.0 basis points; Yr. 2 - 7.5 basis points; and Yr. 3 - 5.0 basis points.
(k)(j) See footnote (k)(j) to the table under "O&R New York - Electric," above.
(l)(k) The rate plan includes certain COVID-19 provisions, such as: recovery of 2020 late payment charges over three years ($0.6 million); reconciliation of late payment charges to amounts reflected in rates for years 2021 through 2024, with full recovery/refund via surcharge/sur-credit once the annual variance equals or exceeds 5 basis points of return on equity; and reconciliation of write-offs of customer accounts receivable balances to amounts reflected in rates from January 1, 2020 through December 31, 2024, with full recovery/refund via surcharge/sur-credit once the annual variance equals or exceeds 5 basis points of return on equity.
In January 2024, O&R filed a request with the NYSPSC for an increase in the rates it charges for gas service rendered in New York, effective January 1, 2025, of $14.4 million. The filing reflects a return on common equity of 10.25 percent and a common equity ratio of 50 percent. The filing proposes continuation of the provisions with respect to recovery from customers of the cost of purchased power, and the reconciliation of actual expenses allocable to the gas business to the amounts for such costs reflected in gas rates for uncollectible expense, pension and other postretirement benefit costs, environmental remediation and property taxes. The filing requested a reduction in the service lives of certain gas assets by 15 years in anticipation of the transition from gas to electric that is expected to result from implementation of the CLCPA.
| | | | | |
126 | CON EDISON ANNUAL REPORT 2022 | 1432023 |
Rockland Electric Company (RECO)
In December 2021, the NJBPU approved an electric rate increase, effective January 1, 2022, of $9.65 million for RECO. The following table contains a summary of the terms of the distribution rate plans.
| | | | | | | | | | | | | | | | | | | | |
| RECO | | | | | | |
| Effective period | | March 2017 – January 2020 | | February 2020 – December 2021 | | January 2022 |
| Base rate changes | | $1.7 million | | $12 million | | $9.65 million |
Amortization to income of net
regulatory (assets) and liabilities | | $0.2 million over three years and continuation of $(25.6) million of deferred storm costs over four years which expired on July 31, 2018 (a) | | $4.8 million over four years. | | $0.2 million over three years and $9.2 million of deferred storm costs over a three-year period (excluding $2.4 million of costs for Tropical Storm Henri which will be deferred over a three year period in base rates) and continuation of $10 million over 3 years |
COVID-19 costs | | | | | | Recovery of RECO’s COVID-19 related expenditures will be addressed in a separate petition |
| Recoverable energy costs | | Current rate recovery of purchased power costs. | | Current rate recovery of purchased power costs. | | Current rate recovery of purchased power costs. |
| Cost reconciliations | | None | | None | | Reconciliation of uncollectible accounts, Demand Side Management and Clean Energy Program. |
| Average rate base | | $178.7 million | | $229.9 million | | $262.8 million |
Weighted average cost of capital
(after-tax) | | 7.47 percent | | 7.11 percent | | 7.08 percent |
| Authorized return on common equity | | 9.6 percent | | 9.5 percent | | 9.6 percent |
| Actual return on common equity | | Yr. 1 – 7.5 percent
Yr. 2 – 5.7 percent
| | Yr. 1 – 5.4 percent Yr. 2 – 2.3 percent | | Yr. 1 - 9.6 percent Yr. 2 - 9.7 percent
|
| Cost of long-term debt | | 5.37 percent | | 4.88 percent | | 4.74 percent |
| Common equity ratio | | 49.7 percent | | 48.32 percent | | 48.51 percent |
(a)In January 2016, the NJBPU approved RECO’s plan to spend $15.7 million in capital over three years to harden its electric system against storms, the costs of which RECO, beginning in 2017, is collecting through a customer surcharge.
Effective July 2021, the NJBPU authorized a conservation incentive program for RECO, that covers all residential and most commercial customers, under which RECO’s actual electric distribution revenues are compared with the authorized distribution revenues and the difference accrued, with interest, for refund to, or recovery from, customers, as applicable. The conservation incentive program is not permitted if RECO’s actual return on equity exceeds the approved base rate filing return on equity by 50 basis points or more.
In January 2022, RECO filed a request with FERC for an increase to its annual transmission revenue requirement from $16.9 million to $20.4 million. The revenue requirement reflects a return on common equity of 11.04 percent and a common equity ratio of 47 percent.
In December 2022, the NJBPU authorized a $47.8 million Infrastructure Investment Program (IIP) over a five-year period (2023 – 2027). RECO’s IIP provides accelerated infrastructure investments to enhance safety, reliability, and resiliency.
In October 2023, FERC approved a July 2023 settlement agreement among RECO, the New Jersey Division of Rate Counsel and the NJBPU that resolves all issues set for hearing and increases RECO's annual transmission revenue requirement from $16.9 million to $18.2 million, effective August 30, 2022 through December 31, 2023 and to $20.7 million, effective January 1, 2024.
In December 2023, the NJBPU authorized RECO to defer costs of $4.8 million related to major storms that occurred during 2022 and 2023 until RECO’s next base rate case.
Infrastructure Investment and Jobs Act
In January 2024, CECONY initiated an application for $100 million of federal grants for grid resilience, O&R and RECO jointly initiated an application for $100 million of federal grants for grid resilience, and CECONY, O&R and RECO initiated a joint application for $60 million of federal grants for smart grids under the Infrastructure Investment and Jobs Act (IIJA). Federal grants obtained pursuant to the IIJA are expected to be used to reduce customers’ costs for investments in CECONY’s, O&R’s, and RECO’s electric systems.
COVID - 19 Regulatory Matters
Governors, public utility commissions and other regulatory agencies in the states in which the Utilities operate have issued orders relatedDue to the COVID-19 pandemic, that impact the Utilities as described below.
NY Regulation
In March 2020, a former New York State governor declared a State Disaster Emergency for the State of NY due to the COVID-19 pandemicenacted laws prohibiting New York utilities, including CECONY and signed the "New York State on PAUSE" executive order that temporarily closed all non-essential businesses statewide. The former governor then lifted these closures over time and ended the emergency declaration in June 2021. As a result of the emergency declaration, and due to economic conditions, the NYSPSC and the Utilities have worked to mitigate the potential impact of the COVID-19 pandemic on the Utilities, theirO&R, from disconnecting residential customers and other stakeholders.
| | | | | |
144
|
CON EDISON ANNUAL REPORT 2022 |
In March 2020, thesmall business customers. The Utilities began suspendinglargely suspended service disconnections, certain collection notices, final bill collection agency activity, new late payment charges and certain other fees for all customers. The Utilities also began providing payment extensions for all customers that were scheduled to be disconnected prior to the start of the COVID-19 pandemic. In Junefrom March 2020 the state of NY enacted a law prohibiting NY utilities, including CECONY and O&R, from disconnecting residential customers, and starting in May 2021 small business customers, during the COVID-19 state of emergency, which ended in Junethrough December 2021. In addition, such prohibitions were in effect until December 21, 2021 for residential and small business customers who experienced a change in financial circumstances due to the COVID-19 pandemic.
In November 2021, the NYSPSC issued an order establishing a surcharge recovery mechanism for CECONY to collect commencing December 1, 2021 through December 31, 2022, $43 million and $7 million for electric and gas, respectively, of late payment charges and fees that were not billed for the yearyears ended December 31, 2020. The company2020 and 2021. CECONY recorded such amounts$62 million and $11 million for electric and gas, respectively, as revenue for the year ended
| | | | | |
| CON EDISON ANNUAL REPORT 2023 | 127 |
December 31, 2021, as permitted under the accounting rules for regulated utilities, and also accrued such amounts as a current asset at December 31, 2021.utilities. Pursuant to the November 2021 order, the company also established a recovery mechanism for CECONY to collect, commencing January 2023 through December 2023, $19 million and $4 million forits electric and gas respectively, of late payment charges and fees that were not billed for the year ended December 31, 2021 and the company recorded such amounts as revenue for the year ended December 31, 2021, as permitted under the accounting rules for regulated utilities, and also accrued such amounts as a current asset at December 31, 2021. In addition, pursuant to the November 2021 order, CECONY established a reserve of $7 million toward addressing customer arrearages for the year ended December 31, 2021 that, pursuant to a June 2022 NYSPSC order discussed below, was used to fund a portion of the COVID-19 arrears assistance program for low-income customers. The order also established a surcharge recovery or surcredit mechanism for any late payment charges and fee deferrals, subject to offsetting related savings resulting from the COVID-19 pandemic, for 2022 starting in January 2024 over a twelve-month period. CECONY resumed late payment charges for commercial and residential customers who have not experienced a change in financial circumstances due to the COVID-19 pandemic on September 3, 2021 and October 1, 2021, respectively. Pursuant to the October 2021 joint proposal for new electric and gas rates for O&R that was approved by the NYSPSC in April 2022,rate plans, O&R recorded late payment charges and fees that were not billed for the years ended December 31, 2020 and December 31, 2021 of $1.7 million and $2.4$2 million, respectively, as revenue for the year ended December 31, 2021, as permitted under the accounting rules for regulated utilities, and also accrued such amounts as a current asset at December 31, 2021. See “Rate Plans,” above. O&R resumed late payment charges for commercial and residential customers who have not experienced a change in financial circumstances due to the COVID-19 pandemic on October 1, 2021.
The Utilities’ NY rate plans allow them to defer costs resulting from a change in legislation, regulation and related actions that have taken effect during the term of the rate plans once the costs exceed a specified threshold. The total reserve increases to the allowance for uncollectible accounts from January 1, 2020 through December 31, 2022 reflecting the impact of the COVID-19 pandemic for CECONY electric and gas operations and O&R electric and gas operations were $249 million and $3 million, respectively, and were deferred pursuant to the legislative, regulatory and related actions provisions of the rate plans as a result of the New York State on PAUSE and related executive orders, that have since been lifted, as described above. The Utilities’ NY rate plans also provide for an allowance for write-offs of customer accounts receivable balances. The above amounts deferred pursuant to the legislative, regulatory and related actions provisions were reduced by the amount that the actual write-offs of customer accounts receivable balances were below the allowance reflected in rates which differences were $3 million and immaterial for CECONY and O&R, respectively, from March 1, 2020 through December 31, 2022.utilities.
In June 2020, the NYSPSC directed CECONY to implement a summer cooling credit program to help mitigate the cost of staying home and operating air conditioning for health-vulnerable low-income customers due to the limited availability of public cooling facilities as a result of the COVID-19 social distancing measures. The $63.4 million cost of the program is being recovered over a five-year period that began January 2021.
In April 2021, NY passed a law that created a program that allows eligible residential renters in NY who require2022, and 2023, New York implemented various programs providing arrears assistance with rent andto utility bills to have up to twelve months of electric and gas utility bill arrears forgiven, provided that such arrears were accrued on or after March 13, 2020. Thecustomers. One program is administered by the State Office of Temporary and Disability Assistance (OTDA) in coordination with the NYSDPS (the OTDA Program). Under the OTDA Program, CECONY and O&R qualify for a refundable tax credit for NYNew York gross-receipts tax equal to the amount of arrears waived by the Utilities in the year that the arrears are waived and certified by the NYSPSC. OTDA may also use the program funds to provide additional Home Energy Assistance Program payments to the Utilities on behalf of low-income customers.
| | | | | |
CON EDISON ANNUAL REPORT 2022 | 145 |
In April 2022, NY approved the 2022-2023 state budget, which included $250 million for addressing statewide residential utility customers' arrears balances accrued from March 7, 2020 through March 1, 2022. In June 2022,addition, the NYSPSC issued an order implementing aauthorized Phase 1 and Phase 2 COVID-19 arrears assistance program that providesprograms whereby the Utilities were provided with customer credits towards reducing the arrearsaccounts receivable balances of low-income electric(the Phase 1 Order and gas customers of CECONY and O&R. At the time the order was issued, the Utilities’ eligible arrears balances were estimated to be $340 million, comprised of: (1) $164.5 million and $1.6 millionPhase 2 Order, respectively). A portion of the funding allocated pursuant to the NY budget to CECONYPhase 1 Order credits were funded by New York State and O&R, respectively, and (2) a surcharge mechanism for recovery of the remaining eligiblePhase 1 Order credit amounts over a four- year period commencing after credits are issued for CECONY and over a one year period commencing after credits are issued for O&R. Pursuant toall Phase 2 Order credit amounts will be recovered by the order, CECONY and O&R agreed not to seek recovery of incremental financing costs incurred associated with low-income customers' arrears from March 2020 through March 2022 of $11 million, most of which is attributable to CECONY, in addition to the $7 million reserve established by CECONY for the year ended December 31, 2021, as described above. The amounts available to credit the arrears balances of low-income CECONY and O&R customers pursuant to the June 2022 order may be reduced by amounts credited pursuant to the OTDA Program.Utilities via surcharge mechanisms.
For the year ended December 31, 2022, CECONY and O&R issued total credits of $359.9 million and $6.1 million, respectively, towards reducing customers’ accounts receivable balances. For the year ended December 31, 2022, the total credits for CECONY were comprised of: $164.5 million pursuant to the NYNew York State funding; $108.4 million pursuant to the Phase 1 Order, that will be recovered via a surcharge mechanism over a four-year period that began September 1, 2022, as described above; the2022; a $7 million reserve for CECONY described above;CECONY; and $80.0$80 million in qualified tax credits and payments pursuant to the OTDA Program described above. For the year ended December 31, 2022, the total credits for O&R were comprised of: $1.6 million pursuant to the NYNew York State funding; $3.2 million pursuant to the Phase 1 order, that will bewas recovered via a surcharge mechanism over a one-year period that began September 1, 2022, as described above;2022; and $1.3 million in qualified tax credits and payments pursuant to the OTDA Program described above.
In JanuaryFor the year ended December 31, 2023, the NYSPSC issued an order implementing a Phase 2 COVID-19 arrears assistance program that provides credits towards reducing the arrears balances of residential and small commercial electric and gas customers of CECONY and O&R. At the time the order was&R issued CECONY’s and O&R’s eligible arrears balances were estimated to be $388.7total net credits of $352.3 million and $2.9 million, respectively. The order authorizesrespectively, towards reducing customers’ accounts receivable balances. For the year ended December 31, 2023, the total credits for CECONY were comprised of: $13.2 million pursuant to the Phase 1 Order; $327.6 million pursuant to the Phase 2 Order that will be recovered via a surcharge mechanism for recovery of the eligible credit amounts over a ten-year period commencing afterthat began June 2023; and $11.5 million in qualified tax credits are issuedand payments pursuant to the OTDA Program described above. For the year ended December 31, 2023, the total credits for CECONY andO&R were comprised of: $0.1 million pursuant to the Phase 1 Order; $2.1 million pursuant to the Phase 2 Order that will be recovered via a surcharge mechanism over a one-year period commencing afterthat began April 2023; and $0.7 million in qualified tax credits are issued for O&R. Pursuantand payments pursuant to the order, CECONY and O&R agreed not to seek recovery of incremental financing costs incurred associated with arrears from March 2020 through December 2022 estimated to be $46 million, most of which is attributable to CECONY. To facilitate implementation, CECONY and O&R agreed to suspend residential terminations for non-payment through March 1, 2023 or 30 days after credits have been applied, whichever is later.OTDA Program described above.
The Utilities’ rate plans have revenue decoupling mechanisms in their NY electric and gas businesses that largely reconcile actual energy delivery revenues to the authorized delivery revenues approved by the NYSPSC per month and reconcile the deferred balances semi-annually under CECONY's electric rate plan (January through June and July through December, respectively) and annually under CECONY's gas rate plan and O&R's NY electric and gas rate plans (January through December). Differences are accrued with interest each month for CECONY's and O&R's NY electric customers and after the annual deferral period ends for CECONY's and O&R's NY gas customers for refund to, or recovery from customers, as applicable. Generally, the refund to or recovery from customers begins August and February of each year over an ensuing six-month period for CECONY's electric customers and February of each year over an ensuing twelve-month period for CECONY's gas and O&R's NY electric and gas customers.
NJ Regulation
In March 2020, NJ Governor Murphy declared a Public Health Emergency and State of Emergency for the State of NJ. In June 2021, the Governor ended the emergency declaration. As a result of the emergency declaration, and due to economic conditions, the NJBPU and RECO have worked to mitigate the potential impact of the COVID-19 pandemic on RECO, its customers and other stakeholders. In March 2020, RECO began suspending late payment charges, terminations for non-payment, and no access fees during the COVID-19 pandemic. The suspension of these fees continued through July 31, 2021 and were not material.
In July 2020, the NJBPU authorized RECO and other NJ utilities to create a COVID-19-related regulatory asset by deferring prudently incurred incremental costs related to the COVID-19 pandemic beginning on March 9, 2020, and has extended such deferrals through March 15, 2023. RECO is required to file its verified COVID-19 cost recovery petition by no later than May 15, 2023. RECO deferred net incremental COVID-19 related costs of $0.5 million through December 31, 2022.
| | | | | |
146
|
CON EDISON ANNUAL REPORT 2022 |
Gas Safety
In April 2020, the NYSPSC issued an order that extended the deadlines to complete certain gas inspections by all NY gas utilities, including CECONY and O&R, from April 1, 2020 to August 1, 2020. The deadlines were subsequently extended to September 2, 2020 and June 1, 2022. CECONY and O&R have taken all reasonable measures to complete such inspections. As of June 1, 2022, O&R completed all of its required inspections and CECONY substantially completed its required inspections. CECONY is unable to estimate the amount or range of its possible loss, if any, related to this matter. At December 31, 2022, CECONY had not accrued a liability related to this matter.
Other Regulatory Matters
In August 2018,October 2023, CECONY and O&R replaced their separate existing customer billing and information systems with a single new customer billing and information system. In April 2023, CECONY filed a petition with the NYSPSC ordered CECONYfor permission to begincapitalize incremental costs for the new system above a $421 million limit on January 1, 2019 to credit the company'scapital investments included in CECONY’s 2020 – 2022 electric and gas customers,rate plans. At December 31, 2023, CECONY's incurred costs for the new system were approximately $496 million ($75 million above the $421 million limit in the rate plans), all of which have been capitalized. CECONY cannot predict the NYSPSC’s response to its April 2023 petition and to begin on October 1, 2018 to credit its steam customers, with the net benefitsNYSPSC may prohibit CECONY from capitalizing some or all of the federal Tax Cuts and Jobs Act of 2017 (TCJA) as measured based on amounts reflected in its rate plans prior tocosts above the enactment of the TCJA in December 2017. The net benefits include the revenue requirement impact of the reduction in the corporate federal income tax rate to 21 percent, the elimination for utilities of bonus depreciation and the amortization of excess deferred federal income taxes.
CECONY, under its electric rate plan that was approved in January 2020, is amortizing its TCJA net benefits prior to January 1, 2019 allocable to its electric customers ($377 million) over a three-year period, the IRS “protected” portion of its net regulatory liability for future income taxes related to certain accelerated tax depreciation benefits allocable to its electric customers ($1,663 million) over the remaining lives of the related assets and the remainder, or “unprotected” portion of the net regulatory liability allocable to its electric customers ($784 million) over a five-year period. CECONY, under its gas rate plan that was approved in January 2020, amortized TCJA net benefits prior to January 1, 2019 allocable to its gas customers ($63 million) over a two-year period. The protected portion of its net regulatory liability for future income taxes allocable to its gas customers ($725 million) is being amortized over the remaining lives of the related assets and the unprotected portion of the net regulatory liability allocable to its gas customers ($107 million) over a five-year period.
CECONY’s net regulatory liability for future income taxes, including both the protected and unprotected portions, allocable to the company’s steam customers ($185 million) is being amortized over the remaining lives of the related assets (with the amortization period for the unprotected portion subject to review in its next steam rate proceeding).
$421 million limit. O&R, under its current&R's 2022 - 2024 electric and gas rate plans has reflected its TCJA net benefits in its electric and gas rates beginning asdo not include a limit on capitalization of January 1, 2019. Under the rate plans, O&R amortized its net benefits prior to January 1, 2019 ($22 million) over a three-year period. The protected portion of its net regulatory liability for future income taxes ($123 million) is being amortized over the remaining lives of the related assets. See "Rate Plans" above. Pursuant to the October 2021 Joint Proposal, O&R will amortize the remaining unprotected portion of its net regulatory liability for future income taxes ($34 million) over a six-year period that began January 1, 2022.new system costs.
In January 2018, the NYSPSC issued an order initiating a focused operations audit of the Utilities’ financial accounting for income taxes. The audit is investigating the Utilities’ inadvertent understatement of a portion, the amount of which may be material, of their calculation of total federal income tax expense for ratemaking purposes. The understatement was related to the calculation of plant retirement-related cost of removal. As a result of such understatement, the Utilities accumulated significant income tax regulatory assets that were not reflected in O&R’s rate plans prior to 2014, CECONY’s electric and gas rate plans prior to 2015 and 2016, respectively, and is currently not reflected in CECONY’sCECONY's steam rate plan but a prospective correction was proposed in CECONY'splans prior to November 2022 steam rate filing.2023. This understatement of historical income tax expense materially reduced the amount of revenue collected from the Utilities' customers in the past. As part of the audit, the Utilities plan to pursue a private letter ruling from the Internal Revenue Service (IRS) that is expected to confirm, among other things, that in order to comply with IRS normalization rules, such understatement may not be corrected through a write-down of
| | | | | |
128 | CON EDISON ANNUAL REPORT 2023 |
a portion of the regulatory asset and must be corrected through an increase in future years’ revenue requirements. The regulatory asset ($1,1501,113 million and $18 million for CECONY and O&R, respectively, as of December 31, 2023 and $1,150 million and $22 million for CECONY and O&R, respectively, as of December 31, 2022 and $1,176 million and $26 million for CECONY and O&R, respectively, as of December 31, 2021 and which is not earning a return) is netted against the future income tax regulatory liability on the Companies’ consolidated balance sheet. The Utilities are unable to estimate the amount or range of their possible loss, if any, related to this matter. At December 31, 2022,2023, the Utilities had not accrued a liability related to this matter.
In July 2021, the NYSPSC approved a settlement agreement among CECONY, O&R and the NYSDPS that fully resolves all issues and allegations that have been raised or could have been raised by the NYSPSC against CECONY and O&R with respect to: (1) the July 2018 rupture of a CECONY steam main located on Fifth Avenue and 21st Street in Manhattan (the “2018 Steam Incident”); (2) the July 2019 electric service interruptions to
| | | | | |
CON EDISON ANNUAL REPORT 20222023 | 147129 |
approximately 72,000 CECONY customers on the west side of Manhattan and to approximately 30,000 CECONY customers primarily in the Flatbush area of Brooklyn (the “2019 Manhattan and Brooklyn Outages”); (3) the August 2020 electric service interruptions to approximately 330,000 CECONY customers and approximately 200,000 O&R customers following Tropical Storm Isaias (the “Tropical Storm Isaias Outages”) and (4) the August 2020 electric service interruptions to approximately 190,000 customers resulting from faults at CECONY’s Rainey substation following Tropical Storm Isaias (the “Rainey Outages”). Pursuant to the settlement agreement, CECONY and O&R agreed to a total settlement amount of $75.1 million and $7.0 million, respectively. CECONY and O&R agreed to forgo recovery from customers of $25 million and $2.5 million, respectively, associated with the return on existing storm hardening assets beginning with the next rate plan for each utility (over a period of 35 years). CECONY and O&R also agreed to incur ongoing operations and maintenance costs of up to $15.8 million and $2.9 million, respectively, for, among other things, costs to maintain a certain level of contractor and vehicle storm emergency support and storm preparation audits. For CECONY, the settlement agreement included previously incurred or accrued costs of $34.3 million, including negative revenue adjustments of $5 million for the Rainey Outages and $15 million for the 2019 Manhattan and Brooklyn Outages and $14.3 million in costs to reimburse customers for food and medicine spoilage and other previously incurred expenses related to Tropical Storm Isaias and the 2018 Steam Incident. For O&R, the settlement agreement included previously incurred costs of $1.6 million to reimburse customers for food and medicine spoilage and other expenses related to the Tropical Storm Isaias Outages.
| | | | | |
148
|
CON EDISON ANNUAL REPORT 2022 |
Regulatory Assets and Liabilities
Regulatory assets and liabilities at December 31, 20222023 and 20212022 were comprised of the following items: | | Con Edison | CECONY |
| Con Edison | | | Con Edison | CECONY |
| (Millions of Dollars) | (Millions of Dollars) | 2022 | 2021 | 2022 | 2021 | (Millions of Dollars) | 2023 | 2022 | 2023 | 2022 |
| Regulatory assets | Regulatory assets | | | |
| Environmental remediation costs | Environmental remediation costs | $991 | $938 | $906 | $860 |
| System peak reduction and energy efficiency programs (h) | 783 | 285 | 780 | 284 |
| Environmental remediation costs | |
| Environmental remediation costs | | $1,105 | $991 | $1,022 | $906 |
| System peak reduction and energy efficiency programs (a) | | System peak reduction and energy efficiency programs (a) | 1,057 | 783 | 1,038 | 780 |
| COVID - 19 pandemic deferrals (b) | | COVID - 19 pandemic deferrals (b) | 789 | 396 | 782 | 389 |
| Revenue taxes | Revenue taxes | 436 | 395 | 417 | 378 | Revenue taxes | 476 | 436 | 455 | 417 |
| Deferred storm costs (c) | | Deferred storm costs (c) | 206 | 270 | 115 | 173 |
| Property tax reconciliation (d) | | Property tax reconciliation (d) | 169 | 121 | 169 | 121 |
| Deferred derivative losses - long term | | Deferred derivative losses - long term | 163 | 31 | 148 | 26 |
| Electric vehicle make ready (e) | | Electric vehicle make ready (e) | 73 | 33 | 68 | 30 |
| MTA power reliability deferral (f) | | MTA power reliability deferral (f) | 61 | 92 | 61 | 92 |
| Pension and other postretirement benefits deferrals | Pension and other postretirement benefits deferrals | 279 | 496 | 240 | 435 | Pension and other postretirement benefits deferrals | 48 | 279 | 39 | 240 |
| COVID - 19 pandemic deferrals (f) | 292 | 282 | 288 | 277 |
| Deferred storm costs (c) | 270 | 276 | 173 | 158 |
| Property tax reconciliation (g) | 121 | 202 | 121 | 202 |
| COVID - 19 arrears relief deferrals programs | 104 | — | 101 | — |
| Gas service line deferred costs | Gas service line deferred costs | 99 | 100 | 99 | 100 | Gas service line deferred costs | 43 | 99 | 43 | 99 |
| MTA power reliability deferral (b) | 92 | 140 | 92 | 140 |
| Unrecognized pension and other postretirement costs (a) | 78 | 128 | 78 | 110 |
| Brooklyn Queens demand management program | 33 | 36 | 33 | 36 |
| Deferred derivative losses - long term | 31 | 51 | 26 | 45 |
| Electric vehicle make ready (j) | 33 | 8 | 30 | 7 |
| Municipal infrastructure support costs | 29 | 44 | 29 | 44 |
| Meadowlands heater odorization project | 27 | 29 | 27 | 29 |
| Non-wire alternative projects | 22 | 23 | 22 | 23 |
| Legacy meters | Legacy meters | 20 | 2 | — | | — | | Legacy meters | 17 | 20 | — | — |
| Preferred stock redemption | 19 | 20 | 19 | 20 |
| Unamortized loss on reacquired debt | 11 | 16 | 10 | 14 |
| Recoverable Demonstration project costs | 17 | 16 | 16 | 15 |
| Gate station upgrade project | 14 | 14 | 14 |
| Unrecognized pension and other postretirement costs (g) | | Unrecognized pension and other postretirement costs (g) | — | 78 | — | 78 |
| Other | Other | 173 | 138 | 148 | 125 | Other | 400 | 345 | 374 | 318 |
| Regulatory assets – noncurrent | Regulatory assets – noncurrent | 3,974 | 3,639 | 3,669 | 3,316 | Regulatory assets – noncurrent | 4,607 | 3,974 | 4,314 | 3,669 |
| Deferred derivative losses | 184 | 141 | 178 | 133 |
| Deferred derivative losses - short term | | Deferred derivative losses - short term | 269 | 184 | 253 | 178 |
| Recoverable energy costs | Recoverable energy costs | 121 | 65 | 108 | 55 | | Recoverable energy costs | 12 | 121 | 1 | 108 |
| Regulatory assets – current | Regulatory assets – current | 305 | 206 | 286 | 188 | Regulatory assets – current | 281 | 305 | 254 | 286 |
| Total Regulatory Assets | Total Regulatory Assets | $4,279 | $3,845 | $3,955 | $3,504 | Total Regulatory Assets | $4,888 | $4,279 | $4,568 | $3,955 |
| Regulatory liabilities | Regulatory liabilities | | | |
| Future income tax* | Future income tax* | $1,753 | $1,984 | $1,616 | $1,840 |
| Unrecognized pension and other postretirement costs | 1,638 | 32 | 1,536 | | — | |
| Allowance for cost of removal less salvage (i) | 1,315 | 1,199 | 1,137 | 1,033 |
| Future income tax* | |
| Future income tax* | |
| Allowance for cost of removal less salvage (h) | | Allowance for cost of removal less salvage (h) | 1,456 | 1,315 | 1,266 | 1,137 |
| Unrecognized pension and other postretirement costs (g) | | Unrecognized pension and other postretirement costs (g) | 943 | 1,638 | 867 | 1,536 |
| Pension and other postretirement benefit deferrals | | Pension and other postretirement benefit deferrals | 284 | 144 | 233 | 98 |
| Net unbilled revenue deferrals | Net unbilled revenue deferrals | 204 | 209 | 204 | 209 | Net unbilled revenue deferrals | 278 | 204 | 278 | 204 |
| 2022 and 2023 late payment charge deferral | | 2022 and 2023 late payment charge deferral | 167 | 127 | 161 | 123 |
| System benefit charge carrying charge | | System benefit charge carrying charge | 92 | 73 | 88 | 69 |
| Deferred derivative gains - long term | Deferred derivative gains - long term | 145 | 61 | 130 | 55 | Deferred derivative gains - long term | 49 | 145 | 49 | 130 |
| Pension and other postretirement benefit deferrals | 144 | 102 | 98 | 55 |
| 2022 late payment charge deferral | 127 | — | | 123 | — | |
| System benefit charge carrying charge | 73 | 70 | 69 | 63 |
| Net proceeds from sale of property | Net proceeds from sale of property | 69 | 103 | 69 | 103 | Net proceeds from sale of property | 48 | 69 | 47 | 69 |
| Sales and use tax refunds | 37 | 17 | 36 | 16 |
| Property tax refunds | 35 | 35 | 35 |
| BQDM and Demonstration project reconciliations | 23 | 25 | 21 | 22 |
| Earnings sharing - electric, gas and steam | 13 | 10 | 10 |
| COVID - 19 pandemic uncollectible reconciliation deferral | 12 | — | | 12 | — | |
| Workers’ compensation | 11 | 8 | 11 | 8 |
| Settlement of prudence proceeding (d) | 10 | 6 | 10 | 6 |
| Energy efficiency portfolio standard unencumbered funds | 5 | 15 | 7 | 19 | |
| Settlement of gas proceedings (e) | — | | 12 | — | | 12 |
| Settlement of prudence proceeding (i) | | Settlement of prudence proceeding (i) | 11 | 10 | 11 | 10 |
| Other | Other | 413 | 490 | 357 | 435 | Other | 465 | 549 | 414 | 489 |
| Regulatory liabilities – noncurrent | Regulatory liabilities – noncurrent | 6,027 | 4,381 | 5,481 | 3,921 | Regulatory liabilities – noncurrent | 5,328 | 6,027 | 4,818 | 5,481 |
| Deferred derivative gains - short term | Deferred derivative gains - short term | 311 | 142 | 287 | 132 | Deferred derivative gains - short term | 74 | 311 | 71 | 287 |
| Refundable energy costs | Refundable energy costs | 34 | 32 | — | | 2 | Refundable energy costs | 71 | 34 | 36 | — |
| Revenue decoupling mechanism | Revenue decoupling mechanism | 29 | 11 | | 21 | | — | |
| Regulatory liabilities—current | Regulatory liabilities—current | 374 | 185 | 308 | 134 | Regulatory liabilities—current | 145 | 374 | 107 | 308 |
| Total Regulatory Liabilities | Total Regulatory Liabilities | $6,401 | $4,566 | $5,789 | $4,055 | Total Regulatory Liabilities | $5,473 | $6,401 | $4,925 | $5,789 |
* See "Federal Income Tax" in Note A, "Other Regulatory Matters," above, and Note L.
(a) System Peak Reduction and Energy Efficiency Programs represent programs designed to increase energy efficiency achievements through a combination of responding to locational needs, bundling offerings, leveraging market-based approaches through market solicitations, time-variant pricing and other market transformation efforts.
(b) COVID - 19 Deferrals include (1) the amount to be collected from customers related to the Emergency Summer Cooling Credits program for CECONY, (2) amounts related to the increase in the allowance for uncollectible accounts resulting from the COVID-19 pandemic and New York on PAUSE and related executive orders, for electric and gas operations for CECONY and electric operations for O&R, (3) deferrals under CECONY and O&R's electric and gas rate plans for the reconciliation of write-offs of customer accounts receivable balances to amounts reflected in rates and (4) deferral related to the arrears relief programs. Amounts deferred under the arrears relief programs were $398.6 million and $2.1 million for CECONY and O&R at December 31, 2023, respectively, and $93.5 million and $2.6 million at December 31, 2022, respectively, and receive a return at the pre-tax weighted average cost of capital.
(c) Deferred storm costs represent response and restoration costs, other than capital investments, in connection with Tropical Storm Isaias and other major storms that were deferred by the Utilities.
(d) Property tax reconciliation represents the amount deferred between actual property taxes incurred and the level included in rates subject to the provisions of the respective rate plans.
(e) Supports the development of electric infrastructure and equipment necessary to accommodate an anticipated increase in the deployment of electric vehicles within New York State.
| | | | | |
130 | CON EDISON ANNUAL REPORT 2022 | 1492023 |
(a) Unrecognized pension and other postretirement costs represent the net regulatory asset associated with the accounting rules for retirement benefits. See "Pension and Other Postretirement Benefits" in Note A.
(b)(f) MTA power reliability deferral represents CECONY’s costs in excess of those reflected in its prior electric rate plan to take certain actions relating to the electrical equipment that serves the Metropolitan Transportation Authority (MTA) subway system. The company is recovering this regulatory asset pursuant to its current electric rate plan. See footnote (d) to the CECONY - Electric table under “Rate Plans,” above.
(c) Deferred storm(g) Unrecognized pension and other postretirement costs represent responsethe net regulatory liability associated with the accounting rules for retirement benefits. See "Pension and restoration costs, other than capital investments,Other Postretirement Benefits" in connection with Tropical Storm Isaias and other major storms that were deferred by the Utilities.Note A.
(d)(h) Allowance for cost of removal less salvage represents cash previously collected from customers to fund future anticipated removal expenditures.
(i) Settlement of prudence proceeding represents the remaining amount to be credited to customers pursuant to a Joint Proposal, approved by the NYSPSC in April 2016, with respect to the prudence of certain CECONY expenditures and related matters.
(e) Settlement of gas proceedings represents the amount to be credited to customers pursuant to a settlement agreement approved by the NYSPSC in February 2017 related to CECONY’s practices of qualifying persons to perform plastic fusions on gas facilities and alleged violations of gas safety violations identified by the NYSPSC staff in its investigation of a March 2014 Manhattan explosion and fire (see Note H).
(f) COVID - 19 Deferrals represents both the amount to be collected from customers related to the Emergency Summer Cooling Credits program for CECONY and amounts related to the increase in the allowance for uncollectible accounts resulting from the COVID-19 pandemic and New York on PAUSE and related executive orders, for electric and gas operations for CECONY and electric operations for O&R.
(g) Property tax reconciliation represents the amount deferred between actual property taxes incurred and the level included in rates subject to the provisions of the respective rate plans.
(h) System Peak Reduction and Energy Efficiency Programs represent programs designed to increase energy efficiency achievements through a combination of responding to locational needs, bundling offerings, leveraging market-based approaches through market solicitations, time-variant pricing and other market transformation efforts.
(i) Allowance for cost of removal less salvage represents cash previously collected from customers to fund future anticipated removal expenditures.
(j) Supports the development of electric infrastructure and equipment necessary to accommodate an anticipated increase in the deployment of electric vehicles within New York State.
The NYSPSC has authorized CECONY to accrue unbilled electric, gas and steam revenues. CECONY has deferred the net margin on thedifferences between unbilled revenues and energy costs for the future benefit of customers by recording a regulatory liability of $204$278 million and $209$204 million at December 31, 2023 and 2022, and 2021, respectively, for the difference between the unbilled revenues and energy cost liabilities.respectively.
In general, the Utilities receive or are being credited with a return at the Other Customer-Provided Capital rate for regulatory assets that have not been included in rate base, and receive or are being credited with a return at the pre-tax weighted average cost of capital once the asset is included in rate base. Similarly, the Utilities pay to or credit customers with a return at the Other Customer-Provided Capital rate for regulatory liabilities that have not been included in rate base, and pay to or credit customers with a return at the pre-tax weighted average cost of capital once the liability is included in rate base. The Other Customer-Provided Capital rate for the years ended December 31, 2023 and 2022 and 2021 was 1.755.20 percent and 1.801.75 percent, respectively.
In general, the Utilities are receiving or being credited with a return on their regulatory assets for which a cash outflow has been made ($2,3042,541 million and $1,962$2,304 million for Con Edison, and $2,097$2,359 million and $1,751$2,097 million for CECONY at December 31, 20222023 and 2021,2022, respectively). Regulatory assets of RECO for which a cash outflow has been made ($2124 million and $25$21 million at December 31, 20222023 and 2021,2022, respectively) are not receiving or being credited with a return. RECO recovers regulatory assets over a period of up to four years or until they are addressed in its next base rate case in accordance with the rate provisions approved by the NJBPU. Regulatory liabilities are treated in a consistent manner.
Regulatory assets that represent future financial obligations and were deferred in accordance with the Utilities’ rate plans or orders issued by state regulators do not earn a return until such time as a cash outlay has been made.
| | | | | |
150
|
CON EDISON ANNUAL REPORT 2022 |
Regulatory liabilities are treated in a consistent manner. At December 31, 20222023 and 2021,2022, regulatory assets for Con Edison and CECONY that did not earn a return consisted of the following items:
Regulatory Assets Not Earning a Return* | | Con Edison | CECONY |
| Con Edison | | | Con Edison | CECONY |
| (Millions of Dollars) | (Millions of Dollars) | 2022 | 2021 | 2022 | 2021 | (Millions of Dollars) | 2023 | 2022 | 2023 | 2022 |
| Unrecognized pension and other postretirement costs | Unrecognized pension and other postretirement costs | $78 | $128 | $78 | $110 | Unrecognized pension and other postretirement costs | $— | $78 | $— | $78 |
| Environmental remediation costs | Environmental remediation costs | 987 | 928 | 903 | 850 | Environmental remediation costs | 1,105 | 987 | 1,022 | 903 |
| Revenue taxes | Revenue taxes | 414 | 375 | 397 | 359 | Revenue taxes | 490 | 414 | 470 | 397 |
| Deferred derivative losses - long term | Deferred derivative losses - long term | 31 | 51 | 26 | 45 | Deferred derivative losses - long term | 163 | 31 | 148 | 26 |
| COVID-19 deferral for uncollectible accounts receivable | COVID-19 deferral for uncollectible accounts receivable | 253 | 236 | 249 | 231 | COVID-19 deferral for uncollectible accounts receivable | 291 | 253 | 288 | 249 |
| Other | Other | 28 | 24 | 27 | 24 | Other | 29 | 28 | 28 | 27 |
| Deferred derivative losses - current | Deferred derivative losses - current | 184 | 141 | 178 | 134 | Deferred derivative losses - current | 269 | 184 | 253 | 178 |
| Total | Total | $1,975 | $1,883 | $1,858 | $1,753 | Total | $2,347 | $1,975 | $2,209 | $1,858 |
*This table presents regulatory assets not earning a return for which no cash outlay has been made.
The recovery periods for regulatory assets for which a cash outflow has not been made and that do not earn a return have not yet been determined, except as noted below, and are expected to be determined pursuant to the Utilities’ future rate plans to be filed or orders issued by the state regulators in connection therewith.
The Utilities recover unrecognized pension and other postretirement costs over 10 years, and the portion of investment gains or losses recognized in expense over 15 years, pursuant to NYSPSC policy.
The deferral for revenue taxes represents the New York State metropolitan transportation business tax surcharge on the cumulative temporary differences between the book and tax basis of assets and liabilities of the Utilities, as well as the difference between taxes collected and paid by the Utilities to fund mass transportation. The Utilities recover
| | | | | |
| CON EDISON ANNUAL REPORT 2023 | 131 |
the majority of the revenue taxes over the remaining book lives of the electric and gas plant assets, as well as the steam plant assets for CECONY.
The Utilities recover deferred derivative losses – current within one year, and noncurrent generally within three years.
| | | | | |
CON EDISON ANNUAL REPORT 2022 | 151 |
Note C – Capitalization
Common Stock
Con Edison is authorized to issue 500,000,000 shares of its common stock and CECONY is authorized to issue 340,000,000 of its common stock. At December 31, 2023 and 2022, 345,415,772 and 2021, 354,962,058 and 353,983,712 shares, respectively, of Con Edison common stock were outstanding. At December 31, 20222023 and 2021,2022, 235,488,094 million shares of CECONY common stock were outstanding, all of which were owned by Con Edison. At December 31, 20222023 and 2021,2022, Con Edison had 33,753,963 and 23,210,700 treasury shares, respectively, including 21,976,200 shares of Con Edison stock that CECONY purchased prior to 2001 in connection with Con Edison’s stock repurchase plan. CECONY presents in the financial statements the cost of the Con Edison stock it owns as a reduction of common shareholder’s equity.
In 2023, Con Edison entered into accelerated share repurchase agreements with two dealers to repurchase $1,000 million in aggregate of Con Edison’s Common Shares ($.10 par value) (Common Shares). Con Edison made payments of $1,000 million in aggregate to the dealers and received deliveries of 10,543,263 Common Shares in aggregate.
Capitalization of Con Edison
At December 31, 2023 and 2022, Con Edison's capitalization shown on its Consolidated Statement of Capitalization includes its outstanding common stock and long-term debt and the outstanding long-term debt of the Utilities and for the 2022 period includes the long-term debt of the Clean Energy Businesses.
Dividends
In accordance with NYSPSC requirements, the dividends that the Utilities generally pay are limited to not more than 100 percent of their respective income available for dividends calculated on a two–year rolling average basis. See Note U. Excluded from the calculation of “income available for dividends” are non-cash charges to income resulting from accounting changes or charges to income resulting from significant unanticipated events. The restriction also does not apply to dividends paid in order to transfer to Con Edison proceeds from major transactions, such as asset sales, or to dividends reducing each utility subsidiary’s equity ratio to a level appropriate to its business risk.
Long-term Debt
Long-term debt maturing in the period 2023-20272024-2028 is as follows:
| | (Millions of Dollars) | (Millions of Dollars) | Con Edison | (a) | | CECONY | (Millions of Dollars) | Con Edison | (a) | | CECONY |
| 2023 | $650 | | $— |
| 2024 | 2024 | 250 | | 250 | 2024 | $250 | | | $250 |
| 2025 | 2025 | — | | | — | | 2025 | — | | | — |
| 2026 | 2026 | 250 | | 250 | 2026 | 250 | | | 250 |
| 2027 | 2027 | 430 | | 350 | 2027 | 430 | | | 350 |
| 2028 | | 2028 | 800 | | | 800 |
(a)Amounts shown exclude the$62 million of debt of the Clean Energy Businesses,for Broken Bow II, a deferred project, which werewas classified as held for sale as of December 31, 2022
2023 and areis shown under "Project“Project Debt Held for Sale" on Con Edison's Consolidated Statement of Capitalization. See "Assets and Liabilities Held for Sale" in Note A and Note X for additional information.
CECONY has issued $450 million of tax–exempt debt through the New York State Energy Research and Development Authority (NYSERDA) that currently bears interest at a rate determined weekly and is subject to tender by bondholders for purchase by the company.
The carrying amounts and fair values of long-term debt at December 31, 20222023 and 20212022 are:
| | (Millions of Dollars) | (Millions of Dollars) | 2022 | | 2021 |
| (Millions of Dollars) | |
| (Millions of Dollars) | |
| Long-Term Debt (including current portion) (a) | |
| Long-Term Debt (including current portion) (a) | |
| Long-Term Debt (including current portion) (a) | Long-Term Debt (including current portion) (a) | Carrying
Amount | | Fair
Value | | Carrying Amount | | Fair Value |
| Con Edison | Con Edison | $20,796 | (b) | | $18,234 | (b) | | $23,044 | | $26,287 |
| Con Edison | |
| Con Edison | |
| CECONY | CECONY | 19,080 | | | 16,699 | | 18,382 | | 21,382 |
| CECONY | |
| CECONY | |
| | | | | |
132 | CON EDISON ANNUAL REPORT 2023 |
(a)Amounts shown are net of unamortized debt expense and unamortized debt discount of $222 million and $215 million for Con Edison and CECONY, respectively, as of December 31, 2023 and $202 million and $195 million for Con Edison and CECONY, respectively, as of December 31, 2022 and $226 million and $193 million2022.
(b)Amounts shown exclude the debt of Broken Bow II, a deferred project that was classified as held for Con Edison and CECONY, respectively,sale as of December 31, 2021.2023 and is shown under “Project Debt Held for Sale" on Con Edison's Consolidated Statement of Capitalization. The carrying value and fair value of Broken Bow II's long-term debt, including the current portion, as of December 31, 2023 was $62 million and $58 million, respectively. On March 1, 2023, Con Edison completed the sale of all of the stock of the Clean Energy Businesses. See Note W and Note X.
(b)(c)Amounts shown exclude the debt of the Clean Energy Businesses, whichthat were classified as held for sale as of December 31, 2022. See "Assets and Liabilities Held for Sale" in Note A, and Note X for additional information. The carrying value and fair value of the Clean
Energy Businesses’ long-term debt, including the current portion, as of December 31, 2022 was $2,645 million and $2,489 million,
respectively. On March 1, 2023, Con Edison completed the sale of all of the stock of the Clean Energy Businesses. See Note W and Note X.
The fair values of the Companies' long-term debt have been estimated primarily using available market information and at December 31, 20222023 are classified as Level 2 liabilities (see Note R).
| | | | | |
152
|
CON EDISON ANNUAL REPORT 2022 |
Significant Debt Covenants
The significant debt covenants under the financing arrangements for the Companies' debentures include obligations to pay principal and interest when due and covenants not to consolidate with or merge into any other entity unless certain conditions are met. The Companies' debentures have no cross default provisions. The tax–exempt financing arrangements of CECONY are subject to covenants for the debentures discussed above and the covenants discussed below. The Companies were in compliance with their significant debt covenants at December 31, 2022.2023.
The tax-exempt financing arrangements involved the issuance of uncollateralized promissory notes of CECONY to NYSERDA in exchange for the net proceeds of a like amount of tax–exempt bonds with substantially the same terms sold to the public by NYSERDA. The tax-exempt financing arrangements include covenants with respect to the tax–exempt status of the financing, including covenants with respect to the use of the facilities financed. The arrangements include provisions for the maintenance of liquidity and credit facilities, the failure to comply with which would, except as otherwise provided, constitute an event of default for the debt to which such provisions applied.
The failure to comply with debt covenants would, except as otherwise provided, constitute an event of default for the debt to which such provisions applied. If an event of default were to occur, the principal and accrued interest on the debt to which such event of default applied and, in the case of the Con Edison notes, a make-whole premium might and, in the case of certain events of default would, become due and payable immediately.
The liquidity and credit facilities currently in effect for the tax–exempt financing include covenants that the ratio of debt to total capital of CECONY will not at any time exceed 0.65 to 1 and that, subject to certain exceptions, CECONY will not mortgage, lien, pledge or otherwise encumber its assets. Certain of the facilities also include as events of default, defaults in payments of other debt obligations in excess of specified levels ($150 million or $100 million, depending on the facility).
Note D – Short-Term Borrowing
In December 2016,March 2023, Con Edison and the Utilities entered into a $2,500 million credit agreement (Credit(the Credit Agreement), that replaced a December 2016 credit agreement (the 2016 Credit Agreement), under which banks are committed to provide loans and letters of credit on a revolving credit basis. The Credit Agreement as amended in 2019, expires in December 2023.March 2028, unless extended for up to two additional one-year terms. There wasis a maximum of $2,250$2,500 million of credit available through December 2022 and $2,200 million of credit available from then through December 2023. The full amount is available to CECONY and $1,000$800 million (subject to increase up to $1,500$1,000 million) is available to Con Edison, including up to $1,200$900 million of letters of credit. The Credit Agreement supports the Companies’ commercial paper programs. The Companies have not borrowedLoans and letters of credit issued under the Credit Agreement. Agreement may also be used for other general corporate purposes. Any borrowings under the Credit Agreement would generally be at variable interest rates.
In March 2022,2023, CECONY entered into a 364-Day Revolving Credit Agreement (the CECONY Credit Agreement) that replaced a March 2022 CECONY 364-Day Credit Agreement (the 2022 CECONY Credit Agreement), under which banks are committed to provide loans up to $750$500 million on a revolving credit basis. The CECONY Credit Agreement expires onin March 30, 20232024 and supports CECONY’s commercial paper program.CECONY has not borrowed Loans and letters of credit issued under the CECONY Credit Agreement.Agreement may also be used for other general corporate purposes. Any borrowings under the CECONY Credit Agreement would generally be at variable interest rates.
| | | | | |
| CON EDISON ANNUAL REPORT 2023 | 133 |
At December 31, 2023, Con Edison had $2,288 million of commercial paper outstanding, of which $1,903 million was outstanding under CECONY’s program. The weighted average interest rate at December 31, 2023 was 5.6 percent for both Con Edison and CECONY. At December 31, 2022, Con Edison had $2,640 million of commercial paper outstanding of which $2,300 million was outstanding under CECONY’s program. The weighted average interest rate at December 31, 2022 was 4.8 percent for both Con Edison and CECONY. At December 31, 2021, Con Edison had $1,488 million of commercial paper outstanding of which $1,361 million was outstanding under CECONY’s program. The weighted average interest rate at December 31, 2021 was 0.3 percent for both Con Edison and CECONY.
At December 31, 20222023, no loans or letters of credit were outstanding under the Credit Agreement and 2021, no loans were outstanding under the Credit Agreement or the CECONY Credit Agreement. AnAt December 31, 2022, no loans and an immaterial amount of letters of credit were outstanding under the 2016 Credit Agreement as of December 31,and no loans were outstanding under the 2022 and 2021.CECONY Credit Agreement.
The banks’ commitments under the Credit Agreement and the CECONY Credit Agreement are subject to certain conditions, including that there be no event of default. The commitments are not subject to maintenance of credit rating levels or the absence of a material adverse change. Upon a change of control of, or upon an event of default by one of the Companies under the Credit Agreement or by CECONY under the CECONY Credit Agreement, the banks may terminate their commitments with respect to that company, declare any amounts owed by that company under the Credit Agreement or the CECONY Credit Agreement, respectively, immediately due and payable and for the Credit Agreement, require that company to provide cash collateral relating to the letters of credit issued for it under the Credit Agreement. Events of default for a company include that company exceeding at any time of a ratio of consolidated debt to consolidated total capital of 0.65 to 1 (at December 31, 20222023 this ratio was 0.54 to 1 for Con Edison and 0.560.55 to 1 for CECONY); that company having liens on its assets in an aggregate amount exceeding fiveten percent of its consolidated total capital,net tangible assets, subject to certain exceptions; that company or any of its material subsidiaries failing to make one or more payments in respect of material financial obligations (in excess of an aggregate $150 million of debt or derivative obligations other than non-recourse debt) of that company; the
| | | | | |
CON EDISON ANNUAL REPORT 2022 | 153 |
occurrence of an event or condition which results in the acceleration of the maturity of any material debt (in excess of an aggregate $150 million of debt other than non-recourse debt) of that company or enables the holders of such debt to accelerate the maturity thereof; and other customary events of default. Interest and fees charged for the revolving credit facilities and any loans made or letters of credit issued under the Credit Agreement reflect the Companies’ respective credit ratings. The Companies were in compliance with their significant debt covenants at December 31, 2022.
In June 2022 and January 2023, Con Edison borrowed $400 million and $200 million, respectively, at a variable rate under a 364-Day Senior Unsecured Term Loan Credit Agreement entered into by the company in June 2022, as amended in November 2022 (the June 2022 Term Loan Credit Agreement). The interest rate at December 31, 2022 was 4.94 percent. Upon a change of control of, or upon an event of default by Con Edison, the bank may declare the loans, accrued interest and any other amounts due by Con Edison immediately due and payable. Events of default include Con Edison exceeding at any time a ratio of consolidated debt to consolidated total capital of 0.65 to 1; Con Edison or its subsidiaries having liens on its or their assets in an aggregate amount exceeding 5.0 percent of Con Edison’s consolidated total capital, subject to certain exceptions; Con Edison or its material subsidiaries failing to make one or more payments in respect of material financial obligations (in excess of an aggregate $150 million of debt or derivative obligations other than non-recourse debt); the occurrence of an event or condition which results in the acceleration of the maturity of any material debt (in excess of an aggregate $150 million of debt other than non-recourse debt) or enables the holders of such debt to accelerate the maturity thereof; and other customary events of default.Subject to certain exceptions, the term loans issued under the June 2022 Term Loan Credit Agreement are subject to mandatory termination and prepayment with the net cash proceeds of certain equity issuances or asset sales by Con Edison. The term loans mature in June 2023.
In August 2022, the Clean Energy Businesses entered into and borrowed $150 million at a variable rate under a 364-Day Senior Unsecured Term Loan Credit Agreement, which is guaranteed by Con Edison (see Note H) and includes customary terms and conditions. The interest rate at December 31, 2022 was 5.06 percent. Upon a change of control of the Clean Energy Businesses, the bank may declare the loan, accrued interest and any other amounts due by the Clean Energy Businesses immediately due and payable if the bank does not consent to a guarantee from the successor company, which consent may not be unreasonably withheld.Upon an event of default of the Clean Energy Businesses, the bank may declare the loan, accrued interest and any other amounts due by the Clean Energy Businesses immediately due and payable. This loan is classified within liabilities held for sale on Con Edison's balance sheet as of December 31, 2022. See "Assets and Liabilities Held for Sale" in Note A and Note X for additional information.
See Note U for information about short-term borrowing between related parties.
Note E – Pension Benefits
Con Edison maintains a tax-qualified, non-contributory pension plan, the Consolidated Edison Retirement Plan, that covers substantially all employees of CECONY, O&R and Con Edison Transmission and certain employees of the Clean Energy Businesses.Transmission. The plan is designed to comply with the Internal Revenue Code and the Employee Retirement Income Security Act of 1974. Con Edison also maintains additional non–qualified supplemental pension plans.
Total Periodic Benefit CostCost/(Credit)
The components of the Companies’ total periodic benefit costscost/(credit) for 2023, 2022 2021 and 20202021 were as follows:
| | | | Con Edison | CECONY | | Con Edison | CECONY |
| (Millions of Dollars) | (Millions of Dollars) | 2022 | 2021 | 2020 | 2022 | 2021 | 2020 | (Millions of Dollars) | 2023 | 2022 | 2021 | 2023 | 2022 | 2021 |
| Service cost – including administrative expenses | Service cost – including administrative expenses | $287 | $343 | $293 | $270 | $321 | $274 | Service cost – including administrative expenses | $161 | $287 | $343 | $151 | $270 | $321 |
| Interest cost on projected benefit obligation | Interest cost on projected benefit obligation | 505 | 471 | 549 | 475 | 443 | 515 | Interest cost on projected benefit obligation | 649 | 505 | 471 | 611 | 475 | 443 |
| Expected return on plan assets | Expected return on plan assets | (1,168) | (1,096) | (1,034) | (1,109) | (1,040) | (980) | Expected return on plan assets | (1,114) | (1,168) | (1,096) | (1,061) | (1,109) | (1,040) |
| Recognition of net actuarial loss | 377 | 787 | 699 | 358 | 746 | 661 |
| Recognition of net actuarial loss/(gain) | | Recognition of net actuarial loss/(gain) | (232) | 377 | 787 | (219) | 358 | 746 |
| Recognition of prior service credit | Recognition of prior service credit | (16) | (17) | (16) | (21) | (19) | Recognition of prior service credit | (17) | (16) | (17) | (19) | (21) | (19) |
| TOTAL PERIODIC BENEFIT COST | $(15) | $488 | $491 | $(27) | $451 |
| TOTAL PERIODIC BENEFIT COST/(CREDIT) | | TOTAL PERIODIC BENEFIT COST/(CREDIT) | $(553) | $(15) | $488 | $(537) | $(27) | $451 |
| Cost capitalized | Cost capitalized | (137) | (154) | (130) | (129) | (146) | (123) | Cost capitalized | (81) | (137) | (154) | (78) | (129) | (146) |
| Reconciliation to rate level | Reconciliation to rate level | 259 | (226) | (250) | 245 | (216) | (239) | Reconciliation to rate level | 282 | 259 | (226) | 261 | 245 | (216) |
| Total expense recognized | $107 | $108 | $111 | $89 |
| Total expense/(benefit) recognized | | Total expense/(benefit) recognized | $(352) | $107 | $108 | $(354) | $89 |
| | | | | |
154
|
CON EDISON ANNUAL REPORT 2022 |
Accounting rules require that components of net periodic benefit cost other than service cost be presented outside of operating income on consolidated income statements, and that only the service cost component is eligible for capitalization. Accordingly, the service cost components are included in the line "Other operations and maintenance" and the non-service cost components are included in the linelines "Other income" or “Other deductions” in the Companies' consolidated income statements. The rules also require disclosure of the weighted-average interest
| | | | | |
134 | CON EDISON ANNUAL REPORT 2023 |
crediting rate used for cash balance plans for all periods presented, and a narrative description of significant changes in the benefit obligation which are included below and, as applicable, in Note F.
Funded Status
The funded status at December 31, 2023, 2022 2021 and 20202021 was as follows:
| | Con Edison | CECONY |
| Con Edison | | | Con Edison | CECONY |
| (Millions of Dollars) | (Millions of Dollars) | 2022 | 2021 | 2020 | 2022 | 2021 | 2020 | (Millions of Dollars) | 2023 | 2022 | 2021 | 2023 | 2022 | 2021 |
| CHANGE IN PROJECTED BENEFIT OBLIGATION | CHANGE IN PROJECTED BENEFIT OBLIGATION | |
| Projected benefit obligation at beginning of year | |
| Projected benefit obligation at beginning of year | |
| Projected benefit obligation at beginning of year | Projected benefit obligation at beginning of year | $17,357 | $18,965 | $16,792 | $16,341 | $17,821 | $15,750 | $12,113 | $17,357 | $18,965 | $11,395 | $16,341 | $17,821 |
| Service cost – excluding administrative expenses | Service cost – excluding administrative expenses | 283 | 337 | 288 | 266 | 317 | 269 | Service cost – excluding administrative expenses | 156 | 283 | 337 | 146 | 266 | 317 |
| Interest cost on projected benefit obligation | Interest cost on projected benefit obligation | 505 | 471 | 549 | 475 | 443 | 515 | Interest cost on projected benefit obligation | 649 | 505 | 471 | 611 | 475 | 443 |
| Net actuarial loss/(gain) | Net actuarial loss/(gain) | (5,102) | (1,547) | 2,281 | (4,845) | (1,441) | 2,154 | Net actuarial loss/(gain) | 599 | (5,102) | (1,547) | 572 | (4,845) | (1,441) |
| Plan amendments | | Plan amendments | 3 | | — |
| Benefits paid | Benefits paid | (930) | (869) | (945) | (842) | (799) | (867) | Benefits paid | (808) | (930) | (869) | (747) | (842) | (799) |
| PROJECTED BENEFIT OBLIGATION AT END OF YEAR | PROJECTED BENEFIT OBLIGATION AT END OF YEAR | $12,113 | $17,357 | $18,965 | $11,395 | $16,341 | $17,821 | PROJECTED BENEFIT OBLIGATION AT END OF YEAR | $12,712 | $12,113 | $17,357 | $11,977 | $11,395 | $16,341 |
| CHANGE IN PLAN ASSETS | CHANGE IN PLAN ASSETS | |
| Fair value of plan assets at beginning of year | |
| Fair value of plan assets at beginning of year | |
| Fair value of plan assets at beginning of year | Fair value of plan assets at beginning of year | $18,504 | $17,022 | $15,608 | $17,566 | $16,147 | $14,790 | $14,979 | $18,504 | $17,022 | $14,248 | $17,566 | $16,147 |
| Actual return on plan assets | Actual return on plan assets | (2,583) | 1,935 | 1,927 | (2,453) | 1,838 | 1,830 | Actual return on plan assets | 1,261 | (2,583) | 1,935 | 1,201 | (2,453) | 1,838 |
| Employer contributions | Employer contributions | 30 | 469 | 475 | 17 | 432 | 435 | Employer contributions | 21 | 30 | 469 | 18 | 17 | 432 |
| Benefits paid | Benefits paid | (930) | (869) | (945) | (842) | (799) | (867) | Benefits paid | (808) | (930) | (869) | (747) | (842) | (799) |
| Administrative expenses | Administrative expenses | (42) | (53) | (43) | (40) | (52) | (41) | Administrative expenses | (49) | (42) | (53) | (46) | (40) | (52) |
| FAIR VALUE OF PLAN ASSETS AT END OF YEAR | FAIR VALUE OF PLAN ASSETS AT END OF YEAR | $14,979 | $18,504 | $17,022 | $14,248 | $17,566 | $16,147 | FAIR VALUE OF PLAN ASSETS AT END OF YEAR | $15,404 | $14,979 | $18,504 | $14,674 | $14,248 | $17,566 |
| FUNDED STATUS | FUNDED STATUS | $2,866 | $1,147 | $(1,943) | $2,853 | $1,225 | $(1,674) | FUNDED STATUS | $2,692 | $2,866 | $1,147 | $2,697 | $2,853 | $1,225 |
| Unrecognized net loss/(gain) | Unrecognized net loss/(gain) | $(1,485) | $205 | $3,330 | $(1,397) | $207 | $3,145 | Unrecognized net loss/(gain) | $(757) | ($1,485) | $205 | $(705) | ($1,397) | $207 |
| Unrecognized prior service costs/(credits) | (124) | (140) | (156) | (143) | (163) | (183) |
| Unrecognized prior service credits | | Unrecognized prior service credits | (105) | (124) | (140) | (124) | (143) | (163) |
| Accumulated benefit obligation | Accumulated benefit obligation | $11,167 | $15,469 | $16,768 | $10,478 | $14,504 | $15,676 | Accumulated benefit obligation | $11,739 | $11,167 | $15,469 | $11,031 | $10,478 | $14,504 |
The decrease in the pension funded status at December 31, 2023 for Con Edison and CECONY of $174 million and $156 million, respectively, compared with December 31, 2022, was primarily due to an increase in the plan's projected benefit obligation as a result of a decrease in the discount rate, partially offset by a return on plan assets that was greater than the expected return. The increase in the pension funded status at December 31, 2022 for Con Edison and CECONY of $1,719 million and $1,628 million, respectively, compared with December 31, 2021, was primarily due to a decrease in the plan's projected benefit obligation as a result of an increase in the discount rate. The increase in the pension funded status liability at December 31, 2021 for Con Edison and CECONY of $3,090 million and $2,899 million, respectively, compared with December 31, 2020, was primarily due to a decrease in the plan's projected benefit obligation as a result of an increase in the discount rate and actuarial gains on plan assets exceeding the expected rate of return. See below for further information on the change in the discount rate and determination of the discount rate assumption. For Con Edison, the 2022 increase2023 decrease in pension funded status asset corresponds with a decrease to regulatory assetsliabilities of $1,655$741 million for unrecognized net lossesgains and unrecognized prior service costscredits associated with the Utilities consistent with the accounting rules for regulated operations, a creditdebit to OCI of $15$1 million (net of taxes) for the unrecognized net losses,gains, and an immaterial change to OCI (net of taxes) for the unrecognized prior service costscredits associated with certain employees of the Clean Energy Businesses, Con Edison Transmission and RECO who previously worked for the Utilities. For 2023, included within the funded status are noncurrent liabilities of $337 million and $313 million for Con Edison and CECONY, respectively. For 2022, included within the funded status are noncurrent liabilities of $311 million and $287 million for Con Edison and CECONY, respectively. For 2021, included within the funded status are noncurrent liabilities of $459 million and $381 million for Con Edison and CECONY, respectively.
For CECONY, the increasedecrease in pension funded status asset at December 31, 20222023 corresponds with a decrease to regulatory assetsliabilities of $1,579$710 million for unrecognized net lossesgains and unrecognized prior service costscredits consistent with the accounting rules for regulated operations, and also a creditdebit to OCI of $3$2 million (net of taxes) for unrecognized net losses,gains, and an immaterial change to OCI (net of taxes) for the unrecognized prior service costs associated with certain employees of the Clean Energy Businesses and Con Edison Transmission who previously worked for CECONY.
At December 31, 20222023 and 2021,2022, Con Edison’s investments included $459$524 million and $525$459 million, respectively, held in external trust accounts for benefit payments pursuant to the supplemental retirement plans. Included in
| | | | | |
CON EDISON ANNUAL REPORT 2022 | 155 |
these amounts for CECONY were $439$502 million and $499$439 million, respectively. See Note R. The accumulated benefit obligations for the supplemental retirement plans for Con Edison and CECONY were $349 million and $323 million as of December 31, 2023, respectively, and $306 million and $280 million as of December 31, 2022, respectively, and $386 million and $352 million as of December 31, 2021, respectively.
| | | | | |
| CON EDISON ANNUAL REPORT 2023 | 135 |
Assumptions
The actuarial assumptions were as follows:
| | 2022 | 2021 | 2020 |
| 2023 | | | 2023 | 2022 | 2021 |
| Weighted-average assumptions used to determine benefit obligations at December 31: | Weighted-average assumptions used to determine benefit obligations at December 31: | |
| Discount rate | |
| Discount rate | |
| Discount rate | Discount rate | 5.45 | % | 3.00 | % | 2.55 | % | 5.15 | % | 5.45 | % | 3.00 | % |
| Interest crediting rate for cash balance plan | Interest crediting rate for cash balance plan | 4.00 | % | 3.50 | % | 3.00 | % | Interest crediting rate for cash balance plan | 4.20 | % | 4.00 | % | 3.50 | % |
| Rate of compensation increase | Rate of compensation increase | |
| CECONY | CECONY | 3.80 | % | 3.80 | % | 3.80 | % |
| CECONY | |
| CECONY | | 3.80 | % | 3.80 | % | 3.80 | % |
| O&R | O&R | 3.20 | % | 3.20 | % | 3.20 | % | O&R | 3.20 | % | 3.20 | % | 3.20 | % |
| Weighted-average assumptions used to determine net periodic benefit cost for the years ended December 31: | Weighted-average assumptions used to determine net periodic benefit cost for the years ended December 31: | |
| Discount rate | |
| Discount rate | |
| Discount rate | Discount rate | 3.00 | % | 2.55 | % | 3.35 | % | 5.45 | % | 3.00 | % | 2.55 | % |
| Interest crediting rate for cash balance plan | Interest crediting rate for cash balance plan | 3.50 | % | 3.00 | % | 3.30 | % | Interest crediting rate for cash balance plan | 4.00 | % | 3.50 | % | 3.00 | % |
| Expected return on plan assets | Expected return on plan assets | 7.00 | % | 7.00 | % | 7.00 | % | Expected return on plan assets | 6.75 | % | 7.00 | % | 7.00 | % |
| Rate of compensation increase | Rate of compensation increase | |
| CECONY | CECONY | 3.80 | % | 3.80 | % | 3.80 | % |
| CECONY | |
| CECONY | | 3.80 | % | 3.80 | % | 3.80 | % |
| O&R | O&R | 3.20 | % | 3.20 | % | 3.20 | % | O&R | 3.20 | % | 3.20 | % | 3.20 | % |
The expected return assumption reflects anticipated returns on the plan’s current and future assets. The Companies’ expected return was based on an evaluation of the current environment, market and economic outlook, relationships between the economy and asset class performance patterns, and recent and long-term trends in asset class performance. The projections were based on the plan’s target asset allocation.
Discount Rate Assumption
To determine the assumed discount rate, the Companies use a model that produces a yield curve based on discounting plan specific cash flows with corresponding spot rates on a yield curve. Term structures of interest rates are based on AA rated corporate bonds. Bonds with questionable pricing information and bonds that are not representative of the overall market are excluded from consideration. For example, the bonds used in the model cannot be callable (with the exception of "make whole" callable bonds). The spot rates defined by the yield curve and the plan’s projected benefit payments are used to develop a weighted average discount rate.
Expected Benefit Payments
Based on current assumptions, the Companies expect to make the following benefit payments over the next ten years:
| | (Millions of Dollars) | (Millions of Dollars) | 2023 | 2024 | 2025 | 2026 | 2027 | 2028-2032 | (Millions of Dollars) | 2024 | 2025 | 2026 | 2027 | 2028 | 2029-2033 |
| Con Edison | Con Edison | $748 | $759 | $809 | $780 | $792 | $4,095 | Con Edison | $768 | $817 | $789 | $804 | $811 | $4,158 |
| CECONY | CECONY | 692 | 703 | 754 | 725 | 738 | 3,824 | CECONY | 711 | 762 | 734 | 750 | 756 | 3,891 |
Expected Contributions
Based on estimates as of December 31, 2022,2023, the Companies expect to make contributions to the pension plans during 20232024 of $10$11 million (of which $8$9 million is to be made by CECONY). The Companies’ policy is to fund the total periodic benefit cost, if any, of the qualified plan to the extent tax deductible and to also contribute to the non-qualified supplemental plans.
| | | | | |
156136
|
20222023 |
Plan Assets
The asset allocations for the pension plan at the end of 2022, 2021 and 2020, and the target allocation for 2023 are as follows:
| | | | | | | | | | | | | | | | | | | | | | | |
| | Target Allocation Range | | Plan Assets at December 31, |
| Asset Category | 2023 | | 2022 | | 2021 | | 2020 |
| Equity Securities | 28% - 38% | | 33 | % | | 50 | % | | 51 | % |
| Debt Securities | 42% - 60% | | 50 | % | | 38 | % | | 38 | % |
| Real Estate and Other Alternatives | 12% - 22% | | 17 | % | | 12 | % | | 11 | % |
| Total | | | 100 | % | | 100 | % | | 100 | % |
Con Edison has established a pension trust for the investment of assets to be used for the exclusive purpose of providing retirement benefits to participants and beneficiaries and payment of plan expenses.
Pursuant to resolutions adopted by Con Edison’s Board of Directors, the Named Fiduciary Committee (the Committee) has general oversight responsibility for Con Edison’s pension and other employee benefit plans. The pension plan’s named fiduciaries have been granted the authority to control and manage the operation and administration of the plans, including overall responsibility for the investment of assets in the trust and the power to appoint and terminate investment managers.
The investment objectives of the Con Edison pension plan are to maintain a level and form of assets adequate to meet benefit obligations to participants, to achieve the expected long-term total return on the trust assets within a prudent level of risk and maintain a level of volatility that is not expected to have a material impact on the company’s expected contribution and expense or the company’s ability to meet plan obligations. The assets of the plan have no significant concentration of risk in one country (other than the United States), industry or entity.
The strategic asset allocation is intended to meet the objectives of the pension plan by diversifying its funds across asset classes, investment styles and fund managers. An asset/liability study typically is conducted every few years to determine whether the current strategic asset allocation continues to represent the appropriate balance of expected risk and reward for the plan to meet expected liabilities. Each study considers the investment risk of the asset allocation and determines the optimal asset allocation for the plan. The target asset allocation for 2023 reflects the results of such a study conducted in 2022.
Individual fund managers operate under written guidelines provided by Con Edison, which cover such areas as investment objectives, performance measurement, permissible investments, investment restrictions, trading and execution, and communication and reporting requirements. Con Edison management regularly monitors, and the named fiduciaries review asset class performance, total fund performance, and compliance with asset allocation guidelines. Management changes fund managers and rebalances the portfolio as appropriate.
Assets measured at fair value on a recurring basis are summarized below as defined by the accounting rules for fair value measurements (see Note R).
| | | | | |
CON EDISON ANNUAL REPORT 2022 | 157 |
The fair values of the pension plan assets at December 31, 2022 by asset category are as follows:
| | | | | | | | | | | | | | | | | | | | | | | | | | |
| (Millions of Dollars) | Level 1 | | Level 2 | | Total | | | |
| Investments within the fair value hierarchy | | | | | | | | |
| U.S. Equity (a) | $2,150 | | $3 | | | $2,153 | | | |
| International Equity (b) | 1,534 | | — | | 1,534 | | | |
| U.S. Government Issued Debt (c) | — | | 823 | | 823 | | | |
| Corporate Bonds Debt (d) | — | | 4,961 | | 4,961 | | | |
| Structured Assets Debt (e) | — | | 183 | | 183 | | | |
| Other Fixed Income Debt (f) | — | | 1,088 | | 1,088 | | | |
| Cash and Cash Equivalents (g) | 71 | | 274 | | 345 | | | |
| Futures (h) | (1) | | | — | | | (1) | | | | |
| Total investments within the fair value hierarchy | $3,754 | | $7,332 | | $11,086 | | | |
| Investments measured at NAV per share (n) | | | | | | | | |
| Private Equity (i) | | | | | 1,018 | | | |
| Real Estate (j) | | | | | 2,366 | | | |
| Hedge Funds (k) | | | | | 657 | | | |
| Total investments valued using NAV per share | | | | | $4,041 | | | |
| Funds for retiree health benefits (l) | (48) | | (91) | | (139) | | | |
| Funds for retiree health benefits measured at NAV per share (l)(n) | | | | | (51) | | | |
| Total funds for retiree health benefits | | | | | $(190) | | | |
| Investments (excluding funds for retiree health benefits) | $3,706 | | $7,241 | | $14,937 | | | |
| Pending activities (m) | | | | | 42 | | | |
| Total fair value of plan net assets | | | | | $14,979 | | | |
(a)U.S. Equity includes both actively- and passively-managed assets with investments in domestic equity index funds and actively-managed small-capitalization equities.
(b)International Equity includes international equity index funds and actively-managed international equities.
(c)U.S. Government Issued Debt includes agency and treasury securities.
(d)Corporate Bonds Debt consists of debt issued by various corporations.
(e)Structured Assets Debt includes commercial-mortgage-backed securities and collateralized mortgage obligations.
(f)Other Fixed Income Debt includes municipal bonds, sovereign debt and regional governments.
(g)Cash and Cash Equivalents include short term investments, money markets, foreign currency and cash collateral.
(h)Futures consist of exchange-traded financial contracts encompassing U.S. Equity, International Equity and U.S. Government indices.
(i)Private Equity consists of global private market investments. Private equity's investment objective is to generate returns on capital from a diversified portfolio of primary fund investments, secondaries and co-investments. The plan's unfunded commitments to private equity were approximately $260 million at December 31, 2022. However, the managers also expect to make significant cash flow distributions in 2023 and 2024. While the investments in this asset class cannot be redeemed, the plan would be able to receive distributions from selling its limited partnership interests in the secondary market, which would be expected to take three to six months.
(j)Real Estate investments include open-end real estate funds that invest in a portfolio of real properties that are broadly diversified by geography and property type. The real estate asset class is expected to produce returns from income and capital appreciation. Real estate also provides a hedge against inflation. The funds allow for quarterly redemptions, however the amount and timing of distributions are subject to market conditions and are currently uncertain.
(k)Hedge Funds are structured as a custom fund of one and that strategy can invest in external hedge fund managers that can pursue a wide array of strategies including event driven, fundamental long/short, relative value, directional trading, and direct sourcing. This asset class seeks to generate positive absolute returns with lower volatility than other asset classes. It invests in various hedge fund managers who can invest in all financial instruments. If desired, substantially all of the investment could be liquidated within 18 months.
(l)The Companies set aside funds for retiree health benefits through a separate account within the pension trust, as permitted under Section 401(h) of the Internal Revenue Code of 1986, as amended. In accordance with the Code, the plan’s investments in the 401(h) account may not be used for, or diverted to, any purpose other than providing health benefits for retirees. The net assets held in the 401(h) account are calculated based on a pro-rata percentage allocation of the net assets in the pension plan. The related obligations for health benefits are not included in the pension plan’s obligations and are included in the Companies’ other postretirement benefit obligation. See Note F.
(m)Pending activities include security purchases and sales that have not settled, interest and dividends that have not been received and reflects adjustments for available estimates at year end.
(n)In accordance with ASU 2015-07, Fair Value Measurements (Topic 820): Disclosures for Investments in Certain Entities That Calculate Net Asset Value per Share (or its equivalent), certain investments that are measured at fair value using the net asset value per share (or its equivalent) practical expedient have not been classified in the fair value hierarchy.
| | | | | |
158
|
CON EDISON ANNUAL REPORT 2022 |
The fair values of the pension plan assets at December 31, 2021 by asset category are as follows:
| | | | | | | | | | | | | | | | | |
| (Millions of Dollars) | Level 1 | | Level 2 | | Total |
| Investments within the fair value hierarchy | | | | | |
| U.S. Equity (a) | $4,381 | | $— | | | $4,381 |
| International Equity (b) | 3,536 | | — | | | 3,536 |
| U.S. Government Issued Debt (c) | — | | | 1,500 | | 1,500 |
| Corporate Bonds Debt (d) | — | | | 3,936 | | 3,936 |
| Structured Assets Debt (e) | — | | | 262 | | 262 |
| Other Fixed Income Debt (f) | — | | | 1,186 | | 1,186 |
| Cash and Cash Equivalents (g) | 80 | | | 425 | | 505 |
| Futures (h) | 2 | | | — | | | 2 | |
| Total investments within the fair value hierarchy | $7,999 | | $7,309 | | $15,308 |
| Investments measured at NAV per share (n) | | | | | |
| Private Equity (i) | | | | | 913 |
| Real Estate (j) | | | | | 2,306 |
| Hedge Funds (k) | | | | | 315 |
| Total investments valued using NAV per share | | | | | $3,534 |
| Funds for retiree health benefits (l) | (110) | | (100) | | (210) |
| Funds for retiree health benefits measured at NAV per share (l)(n) | | | | | (48) |
| Total funds for retiree health benefits | | | | | $(258) |
| Investments (excluding funds for retiree health benefits) | $7,889 | | $7,209 | | $18,584 |
| Pending activities (m) | | | | | (80) |
| Total fair value of plan net assets | | | | | $18,504 |
(a) - (n) Reference is made to footnotes (a) through (n) in the above table of pension plan assets at December 31, 2022 by asset category.The Companies also offer a defined contribution savings plan that covers substantially all employees and made contributions to the plan as follows:
| | | | | | | | | | | | | | | | | |
| | For the Years Ended December 31, |
| (Millions of Dollars) | 2022 | | 2021 | | 2020 |
| Con Edison | $57 | | $55 | | $52 |
| CECONY | 48 | | 46 | | 43 |
Note F – Other Postretirement Benefits
The Utilities and Con Edison Transmission currently have contributory comprehensive hospital, medical and prescription drug programs for eligible retirees, their dependents and surviving spouses.
CECONY also has a contributory life insurance program for bargaining unit employees and provides basic life insurance benefits up to a specified maximum at no cost to certain retired management employees. O&R has a non-contributory life insurance program for retirees. Certain employees of the Clean Energy Businesses and Con Edison Transmission are eligible to receive benefits under these programs.
Total Periodic Benefit Cost
The components of the Companies’ total periodic postretirement benefit costs for 2022, 2021 and 2020 were as follows:
| | | | | |
CON EDISON ANNUAL REPORT 2022 | 159 |
| | | | | | | | | | | | | | | | | | | | |
| | Con Edison | CECONY |
| (Millions of Dollars) | 2022 | 2021 | 2020 | 2022 | 2021 | 2020 |
| Service cost | $18 | $22 | $21 | $15 | $16 | $16 |
| Interest cost on accumulated other postretirement benefit obligation | 35 | 33 | 37 | 30 | 28 | 31 |
| Expected return on plan assets | (72) | (68) | (66) | (58) | (56) | (54) |
| Recognition of net actuarial loss/(gain) | (14) | 31 | 37 | (9) | 27 | 36 |
| Recognition of prior service credit | (1) | (3) | (3) | — | (1) | (2) |
| TOTAL PERIODIC POSTRETIREMENT BENEFIT COST/(CREDIT) | $(34) | $15 | $26 | $(22) | $14 | $27 |
| Cost capitalized | (8) | (9) | (9) | (7) | (7) | (7) |
| Reconciliation to rate level | 29 | (7) | (17) | 24 | (12) | (25) |
| Total credit recognized | $(13) | ($1) | | $— | $(5) | $(5) | $(5) |
| | | | | | |
For information about the presentation of the components of net periodic benefit cost and disclosure requirements, see Note E.
Funded Status
The funded status of the programs at December 31, 2022, 2021 and 2020 were as follows:
| | | | | | | | | | | | | | | | | | | | |
| | Con Edison | CECONY |
| (Millions of Dollars) | 2022 | 2021 | 2020 | 2022 | 2021 | 2020 |
| CHANGE IN BENEFIT OBLIGATION | | | | | | |
| Benefit obligation at beginning of year | $1,398 | $1,425 | $1,357 | $1,189 | $1,209 | $1,154 |
| Service cost | 18 | 22 | 21 | 15 | 16 | 16 |
| Interest cost on accumulated postretirement benefit obligation | 35 | 33 | 37 | 30 | 28 | 31 |
| Net actuarial loss/(gain) | (311) | (13) | 74 | (239) | (3) | 63 |
| Benefits paid and administrative expenses, net of subsidies | (130) | (117) | (117) | (121) | (107) | (107) |
| Participant contributions | 48 | 48 | 53 | 47 | 46 | 52 |
| BENEFIT OBLIGATION AT END OF YEAR | $1,058 | $1,398 | $1,425 | $921 | $1,189 | $1,209 |
| CHANGE IN PLAN ASSETS | | | | | | |
| Fair value of plan assets at beginning of year | $1,150 | $1,115 | $1,026 | $955 | $940 | $872 |
| Actual return on plan assets | (225) | 92 | 142 | (187) | 67 | 117 |
| Employer contributions | 13 | 6 | 7 | 10 | 3 | 4 |
| Employer group waiver plan subsidies | 55 | 21 | 20 | 50 | 19 | 19 |
| Participant contributions | 48 | 48 | 53 | 47 | 46 | 51 |
| Benefits paid | (181) | (132) | (133) | (167) | (120) | (123) |
| FAIR VALUE OF PLAN ASSETS AT END OF YEAR | $860 | $1,150 | $1,115 | $708 | $955 | $940 |
| FUNDED STATUS | $(198) | $(248) | $(310) | $(213) | $(234) | $(269) |
| Unrecognized net loss/(gain) | $37 | $41 | $115 | $78 | $67 | $114 |
| Unrecognized prior service costs | (12) | (13) | (16) | — | | — | (1) |
The decrease in the other postretirement benefits funded status liability at December 31, 2022 for Con Edison and CECONY of $50 million and $21 million, respectively, compared with December 31, 2021, was primarily due to a decrease in the plans' projected benefit obligation as a result of an increase in the discount rate, which more than offset the decrease in the fair value of plan assets as a result of the actual return on plan assets. See below for further information on the change in the discount rate and see Note E for determination of the discount rate assumption. The decrease in the other postretirement benefits funded status liability at December 31, 2021 for Con Edison and CECONY of $62 million and $35 million, respectively, compared with December 31, 2020, was primarily due to an increase in the fair value of plan assets as a result of the actual return on plan assets, along with a decrease in the plans' projected benefit obligation as a result of an increase in the discount rate. For 2022, included within the funded status are noncurrent assets of $72 million and $27 million for Con Edison and CECONY,
| | | | | |
160
|
CON EDISON ANNUAL REPORT 2022 |
respectively. For 2021, included within the funded status are noncurrent assets of $79 million and $55 million for Con Edison and CECONY, respectively.
For Con Edison, the decrease in funded status liability at December 31, 2022 corresponds with a net decrease to regulatory assets of $2 million for unrecognized net losses and unrecognized prior service costs associated with the Utilities consistent with the accounting rules for regulated operations, a credit to OCI of $2 million (net of taxes) for the unrecognized net losses and an immaterial change to OCI for the unrecognized prior service costs associated with the Clean Energy Businesses, Con Edison Transmission, and RECO.
For CECONY, the decrease in funded status liability at December 31, 2022 corresponds with an increase to regulatory assets of $11 million for unrecognized net losses and the unrecognized prior service costs associated with the company consistent with the accounting rules for regulated operations, a credit to OCI of $1 million (net of taxes) for the unrecognized net losses and an immaterial change to OCI for the unrecognized prior service costs associated with eligible employees of the Clean Energy Businesses and Con Edison Transmission who previously worked for CECONY.
Assumptions
The actuarial assumptions were as follows:
| | | | | | | | | | | |
| 2022 | 2021 | 2020 |
| Weighted-average assumptions used to determine benefit obligations at December 31: | | | |
| Discount Rate | | | |
| CECONY | 5.35 | % | 2.75 | % | 2.25 | % |
| O&R | 5.45 | % | 3.00 | % | 2.55 | % |
| Weighted-average assumptions used to determine net periodic benefit cost for the years ended December 31: | | | |
| Discount Rate | | | |
| CECONY | 2.75 | % | 2.25 | % | 3.10 | % |
| O&R | 3.00 | % | 2.55 | % | 3.35 | % |
| Expected Return on Plan Assets | 6.80 | % | 6.80 | % | 6.80 | % |
Refer to Note E for descriptions of the basis for determining the expected return on assets, investment policies and strategies and the assumed discount rate.
The health care cost trend rates for covered medical and prescription medication expenses used to determine the accumulated other postretirement benefit obligations (APBO) at December 31, 2022 were assumed to increase each year, with the initial rate gradually decreasing to the ultimate rate as follows:
| | | | | | | | | | | |
| Initial Cost Trend Rate | Ultimate Cost Trend Rate | Year That Ultimate Rate is Reached |
| Pre-65 Medical | 7.00% | 4.50% | 2036 |
| Post-65 Medical | 4.50% | 4.50% | — |
| Prescription Medications | 7.50% | 4.50% | 2035 |
Expected Benefit Payments
Based on current assumptions, the Companies expect to make the following benefit payments over the next ten years, net of receipt of governmental subsidies and participant contributions:
| | | | | | | | | | | | | | | | | | | | |
| (Millions of Dollars) | 2023 | 2024 | 2025 | 2026 | 2027 | 2028-2032 |
| Con Edison | $79 | $80 | $85 | $86 | $87 | $430 |
| CECONY | 71 | 71 | 76 | 77 | 78 | 384 |
| | | | | |
CON EDISON ANNUAL REPORT 2022 | 161 |
Expected Contributions
Based on estimates as of December 31, 2022, Con Edison expects to make a contribution of $1 million (all of which is expected to be made by CECONY) to the other postretirement benefit plans in 2023. The Companies’ policy is to fund the total periodic benefit cost of the plans to the extent tax deductible.
Plan Assets
The asset allocations for the pension plan at the end of 2023, 2022 and 2021, and the target allocation for 2024 are as follows:
| | | | | | | | | | | | | | | | | | | | | | | |
| | Target Allocation Range | | Plan Assets at December 31, |
| Asset Category | 2024 | | 2023 | | 2022 | | 2021 |
| Equity Securities | 26% - 30% | | 26 | % | | 33 | % | | 50 | % |
| Debt Securities | 42% - 60% | | 50 | % | | 50 | % | | 38 | % |
| Real Estate and Other Alternatives | 14% - 30% | | 24 | % | | 17 | % | | 12 | % |
| Total | | | 100 | % | | 100 | % | | 100 | % |
Con Edison has established a pension trust for the investment of assets to be used for the exclusive purpose of providing retirement benefits to participants and beneficiaries and payment of plan expenses.
Pursuant to resolutions adopted by Con Edison’s Board of Directors, the Named Fiduciary Committee (the Committee) has general oversight responsibility for Con Edison’s pension and other employee benefit plans. The pension plan’s named fiduciaries have been granted the authority to control and manage the operation and administration of the plans, including overall responsibility for the investment of assets in the trust and the power to appoint and terminate investment managers.
The investment objectives of the Con Edison pension plan are to maintain a level and form of assets adequate to meet benefit obligations to participants, to achieve the expected long-term total return on the trust assets within a prudent level of risk and maintain a level of volatility that is not expected to have a material impact on the company’s expected contribution and expense or the company’s ability to meet plan obligations. The assets of the plan have no significant concentration of risk in one country (other than the United States), industry or entity.
The strategic asset allocation is intended to meet the objectives of the pension plan by diversifying its funds across asset classes, investment styles and fund managers. An asset/liability study typically is conducted every few years to determine whether the current strategic asset allocation continues to represent the appropriate balance of expected risk and reward for the plan to meet expected liabilities. Each study considers the investment risk of the asset allocation and determines the optimal asset allocation for the plan. The target asset allocation for 2024 reflects the results of such a study conducted in 2022.
Individual fund managers operate under written guidelines provided by Con Edison that cover such areas as investment objectives, performance measurement, permissible investments, investment restrictions, trading and execution, and communication and reporting requirements. Con Edison management regularly monitors and the named fiduciaries review asset class performance, total fund performance, and compliance with asset allocation guidelines. Management changes fund managers and rebalances the portfolio as appropriate.
Assets measured at fair value on a recurring basis are summarized below as defined by the accounting rules for fair value measurements (see Note R).
| | | | | |
| CON EDISON ANNUAL REPORT 2023 | 137 |
The fair values of the pension plan assets at December 31, 2023 by asset category are as follows:
| | | | | | | | | | | | | | | | | | | | | | | | | | |
| (Millions of Dollars) | Level 1 | | Level 2 | | Total | | | |
| Investments within the fair value hierarchy | | | | | | | | |
| U.S. Equity (a) | $2,474 | | $1 | | | $2,475 | | | |
| International Equity (b) | 1,584 | | — | | 1,584 | | | |
| U.S. Government Issued Debt (c) | — | | 615 | | 615 | | | |
| Corporate Bonds Debt (d) | — | | 5,526 | | 5,526 | | | |
| Structured Assets Debt (e) | — | | 132 | | 132 | | | |
| Other Fixed Income Debt (f) | — | | 1,210 | | 1,210 | | | |
| Cash and Cash Equivalents (g) | 36 | | 302 | | 338 | | | |
| Futures (h) | 19 | | | — | | | 19 | | | | |
| Total investments within the fair value hierarchy | $4,113 | | $7,786 | | $11,899 | | | |
| Investments measured at NAV per share (n) | | | | | | | | |
| Private Equity (i) | | | | | 1,031 | | | |
| Real Estate (j) | | | | | 1,876 | | | |
| Hedge Funds (k) | | | | | 723 | | | |
| Total investments valued using NAV per share | | | | | $3,630 | | | |
| Funds for retiree health benefits (l) | (52) | | (96) | | (148) | | | |
| Funds for retiree health benefits measured at NAV per share (l)(n) | | | | | (45) | | | |
| Total funds for retiree health benefits | | | | | $(193) | | | |
| Investments (excluding funds for retiree health benefits) | $4,061 | | $7,690 | | $15,336 | | | |
| Pending activities (m) | | | | | 68 | | | |
| Total fair value of plan net assets | | | | | $15,404 | | | |
(a)U.S. Equity is comprised of both actively- and passively-managed investments in domestic equity index funds and actively-managed small-capitalization equities.
(b)International Equity is comprised of investments in international equity index funds and actively-managed international equities.
(c)U.S. Government Issued Debt is comprised of agency and treasury securities.
(d)Corporate Bonds Debt is comprised of debt issued by various corporations.
(e)Structured Assets Debt is comprised of commercial-mortgage-backed securities and collateralized mortgage obligations.
(f)Other Fixed Income Debt is comprised of municipal bonds, sovereign debt and regional governments.
(g)Cash and Cash Equivalents are comprised of short term investments, money markets, foreign currency and cash collateral.
(h)Futures are comprised of exchange-traded financial contracts encompassing U.S. Equity, International Equity and U.S. Government indices.
(i)Private Equity is comprised of global private market investments. Private equity's investment objective is to generate returns on capital from a diversified portfolio of primary fund investments, secondaries and co-investments. The plan's unfunded commitments to private equity were approximately $193 million at December 31, 2023. However, the managers also expect to make significant cash flow distributions in 2024 and 2025. While the investments in this asset class cannot be redeemed, the plan would be able to receive distributions from selling its limited partnership interests in the secondary market, which would be expected to take three to six months.
(j)Real Estate investments are open-end real estate funds that invest in a portfolio of real properties that are broadly diversified by geography and property type. The real estate asset class is expected to produce returns from income and capital appreciation. Real estate also provides a hedge against inflation. The funds allow for quarterly redemptions, however the amount and timing of distributions are subject to market conditions and are currently uncertain.
(k)Hedge Funds are structured as a custom fund of one and can invest in external hedge fund managers that pursue a wide array of strategies including event driven, fundamental long/short, relative value, directional trading, and direct sourcing. These investments seek to generate positive absolute returns with lower volatility than other investments. The various hedge fund managers can invest in all financial instruments. Substantially all of the investment could be liquidated within 18 months.
(l)The Companies set aside funds for retiree health benefits through a separate account within the pension trust, as permitted under Section 401(h) of the Internal Revenue Code of 1986, as amended. In accordance with the Code, the plan’s investments in the 401(h) account may not be used for, or diverted to, any purpose other than providing health benefits for retirees. The net assets held in the 401(h) account are calculated based on a pro-rata percentage allocation of the net assets in the pension plan. The related obligations for health benefits are not included in the pension plan’s obligations and are included in the Companies’ other postretirement benefit obligation. See Note F.
(m)Pending activities include security purchases and sales that have not settled, interest and dividends that have not been received and reflects adjustments for available estimates at year end.
(n)In accordance with ASU 2015-07, Fair Value Measurements (Topic 820): Disclosures for Investments in Certain Entities That Calculate Net Asset Value per Share (or its equivalent), certain investments that are measured at fair value using the net asset value per share (or its equivalent) practical expedient have not been classified in the fair value hierarchy.
| | | | | |
138 | CON EDISON ANNUAL REPORT 2023 |
The fair values of the pension plan assets at December 31, 2022 by asset category are as follows:
| | | | | | | | | | | | | | | | | |
| (Millions of Dollars) | Level 1 | | Level 2 | | Total |
| Investments within the fair value hierarchy | | | | | |
| U.S. Equity (a) | $2,150 | | $3 | | | $2,153 |
| International Equity (b) | 1,534 | | — | | 1,534 |
| U.S. Government Issued Debt (c) | — | | 823 | | 823 |
| Corporate Bonds Debt (d) | — | | 4,961 | | 4,961 |
| Structured Assets Debt (e) | — | | 183 | | 183 |
| Other Fixed Income Debt (f) | — | | 1,088 | | 1,088 |
| Cash and Cash Equivalents (g) | 71 | | | 274 | | 345 |
| Futures (h) | (1) | | | — | | (1) | |
| Total investments within the fair value hierarchy | $3,754 | | $7,332 | | $11,086 |
| Investments measured at NAV per share (n) | | | | | |
| Private Equity (i) | | | | | 1,018 |
| Real Estate (j) | | | | | 2,366 |
| Hedge Funds (k) | | | | | 657 |
| Total investments valued using NAV per share | | | | | $4,041 |
| Funds for retiree health benefits (l) | (48) | | (91) | | (139) |
| Funds for retiree health benefits measured at NAV per share (l)(n) | | | | | (51) |
| Total funds for retiree health benefits | | | | | $(190) |
| Investments (excluding funds for retiree health benefits) | $3,706 | | $7,241 | | $14,937 |
| Pending activities (m) | | | | | $42 |
| Total fair value of plan net assets | | | | | $14,979 |
(a) - (n) Reference is made to footnotes (a) through (n) in the above table of pension plan assets at December 31, 2023 by asset category.The Companies also offer a defined contribution savings plan that covers substantially all employees and made contributions to the plan as follows:
| | | | | | | | | | | | | | | | | |
| | For the Years Ended December 31, |
| (Millions of Dollars) | 2023 | | 2022 | | 2021 |
| Con Edison | $57 | | $57 | | $55 |
| CECONY | 51 | | 48 | | 46 |
Note F – Other Postretirement Benefits
The Utilities and Con Edison Transmission currently have contributory comprehensive hospital, medical and prescription drug programs for eligible retirees, their dependents and surviving spouses.
CECONY also has a contributory life insurance program for bargaining unit employees and provides basic life insurance benefits up to a specified maximum at no cost to certain retired management employees. O&R has a non-contributory life insurance program for retirees. Certain employees of Con Edison Transmission are eligible to receive benefits under these programs. Programs include the Consolidated Edison Retiree Health Program for
Management Employees, the Consolidated Edison Retiree Health Program for Weekly Employees, the Consolidated Edison Group Life Insurance Plan, the Orange and Rockland Utilities, Inc. Hourly Retirees’ Group Insurance Plan, and the Orange and Rockland Utilities, Inc. Management Retirees’ Group Insurance Plan.
Total Periodic Benefit Cost
The components of the Companies’ total periodic postretirement benefit costs/(credit) for 2023, 2022 and 2021 were as follows:
| | | | | |
| CON EDISON ANNUAL REPORT 2023 | 139 |
| | | | | | | | | | | | | | | | | | | | |
| | Con Edison | CECONY |
| (Millions of Dollars) | 2023 | 2022 | 2021 | 2023 | 2022 | 2021 |
| Service cost | $14 | $18 | $22 | $12 | $15 | $16 |
| Interest cost on accumulated other postretirement benefit obligation | 57 | 35 | 33 | 49 | 30 | 28 |
| Expected return on plan assets | (70) | (72) | (68) | (56) | (58) | (56) |
| Recognition of net actuarial loss/(gain) | (16) | (14) | 31 | (8) | (9) | 27 |
| Recognition of prior service credit | (2) | (1) | (3) | — | — | (1) |
| TOTAL PERIODIC POSTRETIREMENT BENEFIT COST/(CREDIT) | $(17) | $(34) | $15 | $(3) | $(22) | $14 |
| Cost capitalized | (6) | (8) | (9) | (5) | (7) | (7) |
| Reconciliation to rate level | 4 | 29 | (7) | (2) | 24 | (12) |
| Total credit recognized | $(19) | $(13) | $(1) | $(10) | $(5) | $(5) |
| | | | | | |
For information about the presentation of the components of net periodic benefit cost and disclosure requirements, see Note E.
Funded Status
The funded status of the programs at December 31, 2023, 2022 and 2021 were as follows:
| | | | | | | | | | | | | | | | | | | | |
| | Con Edison | CECONY |
| (Millions of Dollars) | 2023 | 2022 | 2021 | 2023 | 2022 | 2021 |
| CHANGE IN BENEFIT OBLIGATION | | | | | | |
| Benefit obligation at beginning of year | $1,058 | $1,398 | $1,425 | $921 | $1,189 | $1,209 |
| Service cost | 14 | 18 | 22 | 12 | 15 | 16 |
| Interest cost on accumulated postretirement benefit obligation | 57 | 35 | 33 | 49 | 30 | 28 |
| Net actuarial gain | (93) | (311) | (13) | (94) | (239) | (3) |
| Benefits paid and administrative expenses, net of subsidies | (128) | (130) | (117) | (118) | (121) | (107) |
| Participant contributions | 55 | 48 | 48 | 55 | 47 | 46 |
| BENEFIT OBLIGATION AT END OF YEAR | $963 | $1,058 | $1,398 | $825 | $921 | $1,189 |
| CHANGE IN PLAN ASSETS | | | | | | |
| Fair value of plan assets at beginning of year | $860 | $1,150 | $1,115 | $708 | $955 | $940 |
| Actual return on plan assets | 116 | (225) | 92 | 84 | (187) | 67 |
| Employer contributions | 22 | 13 | 6 | 17 | 10 | 3 |
| Employer group waiver plan subsidies | 56 | 55 | 21 | 52 | 50 | 19 |
| Participant contributions | 55 | 48 | 48 | 55 | 47 | 46 |
| Benefits paid | (180) | (181) | (132) | (166) | (167) | (120) |
| FAIR VALUE OF PLAN ASSETS AT END OF YEAR | $929 | $860 | $1,150 | $750 | $708 | $955 |
| FUNDED STATUS | $(34) | $(198) | $(248) | $(75) | $(213) | $(234) |
| Unrecognized net loss/(gain) | ($90) | $37 | $41 | ($41) | $78 | $67 |
| Unrecognized prior service costs | (10) | (12) | (13) | — | — | — |
The decrease in the other postretirement benefits funded status liability at December 31, 2023 for Con Edison and CECONY of $164 million and $138 million, respectively, compared with December 31, 2022, was primarily due to updated per capita costs based on plan experience and higher asset returns in 2023. The decrease in the other postretirement benefits funded status liability at December 31, 2022 for Con Edison and CECONY of $50 million and $21 million, respectively, compared with December 31, 2021, was primarily due to a decrease in the plans' projected benefit obligation as a result of an increase in the discount rate, which more than offset the decrease in the fair value of plan assets as a result of the actual return on plan assets. For 2023, included within the funded status are noncurrent assets of $224 million and $154 million for Con Edison and CECONY, respectively. For 2022, included within the funded status are noncurrent assets of $72 million and $27 million for Con Edison and CECONY, respectively.
| | | | | |
140 | CON EDISON ANNUAL REPORT 2023 |
For Con Edison, the decrease in funded status liability at December 31, 2023 corresponds with a net decrease to regulatory assets and increase to regulatory liabilities of $123 million for unrecognized net gains and unrecognized prior service costs associated with the Utilities consistent with the accounting rules for regulated operations, a credit to OCI of $2 million (net of taxes) for the unrecognized net gains and an immaterial change to OCI for the unrecognized prior service costs associated with Con Edison Transmission and RECO.
For CECONY, the decrease in funded status liability at December 31, 2023 corresponds with a net decrease to regulatory assets and increase to regulatory liabilities of $119 million for unrecognized net gains and the unrecognized prior service costs associated with the company consistent with the accounting rules for regulated operations, a debit to OCI of $1 million (net of taxes) for the unrecognized net gains and an immaterial change to OCI for the unrecognized prior service costs associated with eligible employees of Con Edison Transmission who previously worked for CECONY.
Assumptions
The actuarial assumptions were as follows:
| | | | | | | | | | | |
| 2023 | 2022 | 2021 |
| Weighted-average assumptions used to determine benefit obligations at December 31: | | | |
| Discount Rate | | | |
| CECONY | 5.05 | % | 5.35 | % | 2.75 | % |
| O&R | 5.15 | % | 5.45 | % | 3.00 | % |
| Weighted-average assumptions used to determine net periodic benefit cost for the years ended December 31: | | | |
| Discount Rate | | | |
| CECONY | 5.35 | % | 2.75 | % | 2.25 | % |
| O&R | 5.45 | % | 3.00 | % | 2.55 | % |
| Expected Return on Plan Assets | 6.80 | % | 6.80 | % | 6.80 | % |
Refer to Note E for descriptions of the basis for determining the expected return on assets, investment policies and strategies and the assumed discount rate.
The health care cost trend rates for covered medical and prescription medication expenses used to determine the accumulated other postretirement benefit obligations (APBO) at December 31, 2023 were assumed to increase each year, with the initial rate gradually decreasing to the ultimate rate as follows:
| | | | | | | | | | | |
| Initial Cost Trend Rate | Ultimate Cost Trend Rate | Year That Ultimate Rate is Reached |
| Pre-65 Medical | 6.80% | 4.50% | 2036 |
| Post-65 Medical | 4.50% | 4.50% | — |
| Prescription Medications | 7.25% | 4.50% | 2035 |
Expected Benefit Payments
Based on current assumptions, the Companies expect to make the following benefit payments over the next ten years, net of receipt of governmental subsidies and participant contributions:
| | | | | | | | | | | | | | | | | | | | |
| (Millions of Dollars) | 2024 | 2025 | 2026 | 2027 | 2028 | 2029-2033 |
| Con Edison | $68 | $72 | $73 | $73 | $73 | $353 |
| CECONY | 60 | 63 | 64 | 64 | 64 | 308 |
Expected Contributions
Based on estimates as of December 31, 2023, Con Edison expects to make a contribution of $7 million (all of which is expected to be made by CECONY) to the other postretirement benefit plans in 2024. The Companies’ policy is to fund the total periodic benefit cost of the plans to the extent tax deductible.
| | | | | |
| CON EDISON ANNUAL REPORT 2023 | 141 |
Plan Assets
The asset allocations for CECONY’s other postretirement benefit plans at the end of 2023, 2022 2021 and 2020,2021, and the target allocation for 20232024 are as follows:
| | | | Target Allocation Range | Plan Assets at December 31, | | Target Allocation Range | Plan Assets at December 31, |
| Asset Category | Asset Category | 2023 | 2022 | 2021 | | 2020 | Asset Category | 2024 | 2023 | 2022 | | 2021 |
| Equity Securities | Equity Securities | 42%-80% | 49 | % | 55 | % | | 54 | % | Equity Securities | 35%-55% | 44 | % | 49 | % | | 55 | % |
| Debt Securities | Debt Securities | 20%-58% | 51 | % | 45 | % | | 46 | % | Debt Securities | 40%-60% | 51 | % | 51 | % | | 45 | % |
| Real Estate and Other Alternatives | | Real Estate and Other Alternatives | —%-9% | 5 | % | — | % | | — | % |
| Total | Total | 100% | 100 | % | 100 | % | | 100 | % | Total | 100% | 100 | % | 100 | % | | 100 | % |
Con Edison has established postretirement health and life insurance benefit plan trusts for the investment of assets to be used for the exclusive purpose of providing other postretirement benefits to participants and beneficiaries.
Refer to Note E for a discussion of Con Edison’s investment policy for its benefit plans.
The fair values of the plans' assets at December 31, 20222023 by asset category as defined by the accounting rules for fair value measurements (see Note R) are as follows:
| | (Millions of Dollars) | (Millions of Dollars) | Level 1 | | Level 2 | | Total | (Millions of Dollars) | Level 1 | | Level 2 | | Total |
| Equity (a) | Equity (a) | $— | | | $339 | | $339 | Equity (a) | $— | | $331 |
| Other Fixed Income Debt (b) | Other Fixed Income Debt (b) | 10 | | | 275 | | 285 | Other Fixed Income Debt (b) | — | | 323 |
| Cash and Cash Equivalents (c) | Cash and Cash Equivalents (c) | — | | | 25 | | 25 | Cash and Cash Equivalents (c) | 7 | | 18 | | 25 |
| Asset Allocation Funds (d) | | Asset Allocation Funds (d) | — | | 38 |
| Total investments | Total investments | $10 | | | $639 | | $649 | Total investments | $7 | | $710 | | $717 |
Funds for retiree health benefits (d)(e) | Funds for retiree health benefits (d)(e) | 48 | | | 91 | | 139 | Funds for retiree health benefits (d)(e) | 52 | | 96 | | 148 |
| Investments (including funds for retiree health benefits) | Investments (including funds for retiree health benefits) | $58 | | | $730 | | $788 | Investments (including funds for retiree health benefits) | $59 | | $806 | | $865 |
Funds for retiree health benefits measured at net asset value (e)(f) | Funds for retiree health benefits measured at net asset value (e)(f) | | 51 | Funds for retiree health benefits measured at net asset value (e)(f) | | | | | 45 |
Pending activities (f)(g) | Pending activities (f)(g) | | | | | 21 | Pending activities (f)(g) | | | | | 19 |
| Total fair value of plan net assets | Total fair value of plan net assets | | | | | $860 | Total fair value of plan net assets | | | | | $929 |
(a)Equity includesis comprised of a passively managed commingled index fund benchmarked to the MSCI All Country World Index.
(b)Other Fixed Income Debt includesis comprised of a passively managed commingled index fund benchmarked to the Bloomberg Barclays U.S. Long Credit Index and an active separately managed fund indexed to the Bloomberg Barclays U.S. Long Credit Index.
(c)Cash and Cash Equivalents includeis comprised of short-term investments and money markets.
(d)Asset Allocation Funds is comprised of investments in a global asset allocation fund.
(e)The Companies set aside funds for retiree health benefits through a separate account within the pension trust, as permitted under Section 401(h) of the Internal Revenue Code of 1986, as amended. In accordance with the Code, the plan’s investments in the 401(h) account may not be used for, or diverted to, any purpose other than providing health benefits for retirees. The net assets held in the 401(h) account are calculated based on a pro-rata percentage allocation of the net assets in the pension plan. The related obligations for health benefits are not included in the pension plan’s obligations and are included in the Companies’ other postretirement benefit obligation. See Note E.
(e)(f)In accordance with ASU 2015-07, Fair Value Measurements (Topic 820): Disclosures for Investments in Certain Entities That Calculate Net Asset Value per Share (or its equivalent), certain investments that are measured at fair value using the net asset value per share (or its equivalent) practical expedient have not been classified in the fair value hierarchy.
(f)(g)Pending activities include security purchases and sales that have not settled, interest and dividends that have not been received, and reflects adjustments for available estimates at year-end.
| | | | | |
162142
|
20222023 |
The fair values of the plans' assets at December 31, 20212022 by asset category (see Note R) are as follows:
| | (Millions of Dollars) | (Millions of Dollars) | Level 1 | | Level 2 | | Total | (Millions of Dollars) | Level 1 | | Level 2 | | Total |
| Equity (a) | Equity (a) | $— | | | $474 | | $474 | Equity (a) | $— | | $339 |
| Other Fixed Income Debt (b) | Other Fixed Income Debt (b) | — | | | 379 | | 379 | Other Fixed Income Debt (b) | 10 | | 275 | | 285 |
| Cash and Cash Equivalents (c) | Cash and Cash Equivalents (c) | — | | | 22 | | 22 | Cash and Cash Equivalents (c) | — | | 25 |
| Total investments | Total investments | $— | | | $875 | | $875 | Total investments | $10 | | $639 | | $649 |
| Funds for retiree health benefits (d) | Funds for retiree health benefits (d) | 110 | | | 100 | | 210 | Funds for retiree health benefits (d) | 48 | | 91 | | 139 |
| Investments (including funds for retiree health benefits) | Investments (including funds for retiree health benefits) | $110 | | | $975 | | $1,085 | Investments (including funds for retiree health benefits) | $58 | | $730 | | $788 |
| Funds for retiree health benefits measured at net asset value (d)(e) | Funds for retiree health benefits measured at net asset value (d)(e) | | 48 | Funds for retiree health benefits measured at net asset value (d)(e) | | | | | 51 |
| Pending activities (f) | Pending activities (f) | | | | | 17 | Pending activities (f) | | | | | 21 |
| Total fair value of plan net assets | Total fair value of plan net assets | | | | | $1,150 | Total fair value of plan net assets | | | | | $860 |
(a) - (f) Reference is made to footnotes (a) through (f) in the above table of other postretirement benefit plan assets at December 31, 20222023 by asset category.
Note G – Environmental Matters
Superfund Sites
Hazardous substances, such as asbestos, polychlorinated biphenyls (PCBs) and coal tar, have been used or generated in the course of operations of the Utilities and their predecessors and are present at sites and in facilities and equipment they currently or previously owned, including sites at which gas was manufactured or stored.
The Federal Comprehensive Environmental Response, Compensation and Liability Act of 1980 and similar state statutes (Superfund) impose joint and several liability, regardless of fault, upon generators of hazardous substances for investigation and remediation costs (which include costs of demolition, removal, disposal, storage, replacement, containment and monitoring) and natural resource damages. Liability under these laws can be material and may be imposed for contamination from past acts, even though such past acts may have been lawful at the time they occurred. The sites at which the Utilities have been asserted to have liability under these laws, including their manufactured gas plant sites and any neighboring areas to which contamination may have migrated, are referred to herein as “Superfund Sites.”
For Superfund Sites where there are other potentially responsible parties and the Utilities are not managing the site investigation and remediation, the accrued liability represents an estimate of the amount the Utilities will need to pay to investigate and, where determinable, discharge their related obligations. For Superfund Sites (including the manufactured gas plant sites) for which one of the Utilities is managing the investigation and remediation, the accrued liability represents an estimate of the company’s share of the undiscounted cost to investigate the sites and, for sites that have been investigated in whole or in part, the cost to remediate the sites, if remediation is necessary and if a reasonable estimate of such cost can be made. Remediation costs are estimated in light of the information available, applicable remediation standards and experience with similar sites.
The accrued liabilities and regulatory assets related to Superfund Sites at December 31, 20222023 and 20212022 were as follows:
| | | | Con Edison | | CECONY | | Con Edison | | CECONY |
| (Millions of Dollars) | (Millions of Dollars) | 2022 | | 2021 | | 2022 | | 2021 | (Millions of Dollars) | 2023 | | 2022 | | 2023 | | 2022 |
| Accrued Liabilities: | Accrued Liabilities: | | | |
| Manufactured gas plant sites | Manufactured gas plant sites | $876 | | $845 | | $782 | | $755 |
| Manufactured gas plant sites | |
| Manufactured gas plant sites | | $1,016 | | $876 | | $924 | | $782 |
| Other Superfund Sites | Other Superfund Sites | 121 | | 95 | | 121 | | 95 | Other Superfund Sites | 102 | | 121 | | 102 | | 121 |
| Total | Total | $997 | | $940 | | $903 | | $850 | Total | $1,118 | | $997 | | $1,026 | | $903 |
| Regulatory assets | Regulatory assets | $991 | | $938 | | $906 | | $860 | Regulatory assets | $1,105 | | $991 | | $1,022 | | $906 |
Most of the accrued Superfund Site liability relates to sites that have been investigated, in whole or in part. However, for some of the sites, the extent and associated cost of the required remediation has not yet been determined. As investigations progress and information pertaining to the required remediation becomes available, the Utilities expect that additional liability may be accrued, the amount of which is not presently determinable but
| | | | | |
CON EDISON ANNUAL REPORT 20222023 | 163143 |
may be material. The Utilities are permitted to recover or defer as regulatory assets (for subsequent recovery through rates) prudently incurred site investigation and remediation costs.
Environmental remediation costs incurred related to Superfund Sites at December 31, 20222023 and 20212022 were as follows:
| | | | Con Edison | | CECONY | | Con Edison | | CECONY |
| (Millions of Dollars) | (Millions of Dollars) | 2022 | | 2021 | | 2022 | | 2021 | (Millions of Dollars) | 2023 | | 2022 | | 2023 | | 2022 |
| Remediation costs incurred | Remediation costs incurred | $21 | | $25 | | $20 | | $24 | Remediation costs incurred | $13 | | $21 | | $12 | | $20 |
Insurance and other third party recoveries received by Con Edison or CECONY were immaterial in 20222023 and 2021.2022.
ConCon Edison and CECONY estimate that in 20232024 they will incur costs for remediation of approximately $63approximately $62 million and $61$60 million, respectively. The Companies are unable to estimate the time period over which the remaining accrued liability will be incurred because, among other things, the required remediation has not been determined for some of the sites.
In 2022,2023, Con Edison and CECONY estimated that for their manufactured gas plant sites (including CECONY’s Astoria site), the aggregate undiscounted potential liability for the investigation and remediation of coal tar and/or other environmental contaminants could range up to $3,140$3,440 million and $2,990$3,295 million, respectively. These estimates were based on the assumption that there is contamination at all sites, including those that have not yet been fully investigated and additional assumptions about the extent of the contamination and the type and extent of the remediation that may be required. Actual experience may be materially different.
Asbestos Proceedings
Suits have been brought in NYNew York State and federal courts against the Utilities and many other defendants, wherein a large number of plaintiffs sought large amounts of compensatory and punitive damages for deaths and injuries allegedly caused by exposure to asbestos at various premises of the Utilities. The suits that have been resolved, whichthat are many, have been resolved without any payment by the Utilities, or for amounts that were not, in the aggregate, material to them. The amounts specified in all the remaining thousands of suits total billions of dollars; however, the Utilities believe that these amounts are greatly exaggerated, based on the disposition of previous claims. At December 31, 2022,2023, Con Edison and CECONY have accrued their estimated aggregate undiscounted potential liabilities for these suits and additional suits that may be brought over the next 15 yearsthrough 2035 as shown in the following table. These estimates were based upon a combination of modeling, historical data analysis and risk factor assessment. Courts have begun,applied, and unless otherwise determined on appeal may continue to apply, different standards for determining liability in asbestos suits than the standard that applied historically. As a result, the Companies currently believe that there is a reasonable possibility of an exposure to loss in excess of the liability accrued for the suits. The Companies are unable to estimate the amount or range of such loss. In addition, certain current and former employees have claimed or are claiming workers’ compensation benefits based on alleged disability from exposure to asbestos. CECONY is permitted to defer as regulatory assets (for subsequent recovery through rates) costs incurred for its asbestos lawsuits and workers’ compensation claims.
The accrued liability for asbestos suits and workers’ compensation proceedings (including those related to asbestos exposure) and the amounts deferred as regulatory assets or liabilities for the Companies at December 31, 20222023 and 20212022 were as follows:
| | | | Con Edison | | CECONY | | Con Edison | | CECONY |
| (Millions of Dollars) | (Millions of Dollars) | 2022 | | 2021 | | 2022 | | 2021 | (Millions of Dollars) | 2023 | | 2022 | | 2023 | | 2022 |
| Accrued liability – asbestos suits | Accrued liability – asbestos suits | $8 | | $8 | | $7 | | $7 | Accrued liability – asbestos suits | $8 | | $8 | | $7 | | $7 |
| Regulatory assets – asbestos suits | Regulatory assets – asbestos suits | 8 | | 8 | | 7 | | 7 | Regulatory assets – asbestos suits | 8 | | 8 | | 7 | | 7 |
| Accrued liability – workers’ compensation | Accrued liability – workers’ compensation | 61 | | 65 | | 59 | | 62 | Accrued liability – workers’ compensation | 56 | | 61 | | 54 | | 59 |
| Regulatory liabilities – workers’ compensation | Regulatory liabilities – workers’ compensation | 11 | | 8 | | 11 | | 8 | Regulatory liabilities – workers’ compensation | 17 | | 11 | | 17 | | 11 |
| | | | | |
164144
|
20222023 |
Note H – Material Contingencies
Manhattan Explosion and Fire
On March 12, 2014, two multi-use five-story tall buildings located on Park Avenue between 116th and 117th Streets in Manhattan were destroyed by an explosion and fire. CECONY had delivered gas to the buildings through service lines from a distribution main located below ground on Park Avenue. Eight people died and more than 50 people were injured. Additional buildings were also damaged. The National Transportation Safety Board (NTSB) investigated. The parties to the investigation included the company,CECONY, the City of New York, the Pipeline and Hazardous Materials Safety Administration and the NYSPSC. In June 2015, the NTSB issued a final report concerning the incident, its probable cause and safety recommendations. The NTSB determined that the probable cause of the incident was (1) the failure of a defective fusion joint at a service tee (which joined a plastic service line to a plastic distribution main) installed by the companyCECONY that allowed gas to leak from the distribution main and migrate into a building where it ignited and (2) a breach in a city sewer line that allowed groundwater and soil to flow into the sewer, resulting in a loss of support for the distribution main, whichthat caused it to sag and overstressed the defective fusion joint. The NTSB also made safety recommendations, including recommendations to the companyCECONY that addressed its procedures for the preparation and examination of plastic fusions, training of its staff on conditions for notifications to the city’s Fire Department and extension of its gas main isolation valve installation program. In February 2017, the NYSPSC approved a settlement agreement with the companyCECONY related to the NYSPSC's investigations of the incident and the practices of qualifying persons to perform plastic fusions. Pursuant to the agreement, the company is providingCECONY provided $27 million of future benefits to customers (for which it has accrued a regulatory liability) and willdid not recover from customers $126 million of costs for gas emergency response activities that it had previously incurred and expensed. Approximately eighty suitsLawsuits are pending against the companyCECONY seeking generally unspecified damages and, in some cases, punitive damages, for wrongful death, personal injury, property damage and business interruption. The companyCECONY notified its insurers of the incident and believes that the policies in force at the time of the incident will cover the company’sCECONY's costs, in excess of a required retention (the amount of which is not material), to satisfy any liability it may have for damages in connection with the incident. During 2020, the companyCECONY accrued its estimated liability for the suits of $40 million and an insurance receivable in the same amount, whichand such estimated liability and receivable did not change as of December 31, 2022.2023.
Other Contingencies
For additional contingencies, see “COVID-19 Regulatory Matters" and "Other“Other Regulatory Matters” in Note B, Note G and "Uncertain Tax Positions" in Note L.
Guarantees
Con Edison and its subsidiaries have entered into various agreements providing financial or performance assurance primarily to third parties on behalf of their subsidiaries. In addition, Con Edison has provided guarantees to third parties on behalf of the Clean Energy Businesses, that are in the process of being transferred to the buyer of the Clean Energy Businesses, RWE Aktiengesellschaft (RWE). Maximum amounts guaranteed by Con Edison and its subsidiaries under these agreements totaled $2,412$175 million and $2,157$2,412 million at December 31, 20222023 and 2021,2022, respectively.
A summary, by type and term, of Con Edison’s total guarantees under these other agreements at December 31, 20222023 is as follows:
| | Guarantee Type | Guarantee Type | 0 – 3 years | | 4 – 10 years | | > 10 years | | Total | Guarantee Type | 0 – 3 years | | 4 – 10 years | | > 10 years | | Total |
| | | (Millions of Dollars) | | (Millions of Dollars) |
| Con Edison Transmission | Con Edison Transmission | $407 | | $— | | $— | | | $407 | Con Edison Transmission | $76 | | $— | | $76 |
| Energy transactions (a) | 489 | | 22 | | 294 | | 805 |
| Renewable electric projects (a) | 354 | | 69 | | 555 | | 978 |
| Other (a) | 222 | | — | | | — | | | 222 |
| Guarantees on behalf of the Clean Energy Businesses(a) | | Guarantees on behalf of the Clean Energy Businesses(a) | 58 | | — | | 32 | | 90 |
| Broken Bow II | | Broken Bow II | — | | — | | 9 |
| Total | Total | $1,472 | | $91 | | $849 | | $2,412 | Total | $134 | | $— | | $41 | | $175 |
(a) These represent guaranteesOn March 1, 2023, Con Edison completed the sale of subsidiariesall of the stock of the Clean Energy Businesses. TheSee Note W and Note X. Guarantee amount shown represents guarantees issued on behalf of the Clean Energy Businesses were classified as heldthat remain outstanding at December 31, 2023. Prior to and following the sale, RWE, with Con Edison's assistance, engaged in the process of transferring responsibility for these guarantees from Con Edison to RWE and that process is ongoing. Pursuant to the purchase and sale asagreement, RWE is obligated to reimburse and hold harmless Con Edison for any payments Con Edison makes under guarantees issued by Con Edison on behalf of the Clean Energy Businesses. As of December 31, 2022. See "Assets and Liabilities Held for Sale" in Note A, and Note X.2023, no such payments have been, or are probable of being, made.
Con Edison Transmission – Con Edison has guaranteed payment by CETCon Edison Transmission of the contributions CETCon Edison Transmission agreed to make to New York Transco LLC (NY(New York Transco). CET owns a 45.7 percent interest in NY Transco. In April 2019, the New York Independent System Operator (NYISO) selected a transmission project that was jointly proposed by National Grid and NY Transco. The siting, construction and operation of the project will require approvals and permits from appropriate governmental agencies and authorities, including the NYSPSC. The NYISO indicated it will work with the developers to enter into agreements for the development and operation of the projects, including aCon Edison
| | | | | |
CON EDISON ANNUAL REPORT 20222023 | 165145 |
schedule for entry into service by December 2023.Transmission owns a 45.7 percent interest in New York Transco's New York Energy Solution project, the majority of which has been completed. Guarantee amount shown includes the maximum possible required amount of CET’sCon Edison Transmission's contributions for the remainder of this project as calculated based on the assumptions that the project is completed at 175 percent of its estimated remaining costs and NYNew York Transco does not use any debt financing for the project.
Energy Transactions
Broken Bow II — Con Edison and the Clean Energy Businesses guarantee paymentshas guaranteed obligations on behalf of their subsidiariesBroken Bow II associated with its investment in order to facilitate physical and financial transactions in electricity, gas, pipeline capacity, transportation, oil, renewablea wind energy credits and energy services. To the extent that liabilities exist under the contracts subject to these guarantees, such liabilities are included in Con Edison’s consolidated balance sheet.facility. Broken Bow II is held for sale as of December 31, 2023. See Note X.
Renewable Electric Projects – Con Edison and the Clean Energy Businesses guarantee payments on behalf of their wholly-owned subsidiaries associated with their investment in, or development for others of, solar and wind energy facilities.
Other – Other guarantees include a $70 million guarantee provided by Con Edison to Travelers Insurance Company for indemnity agreements for surety bonds in connection with the operation of solar energy facilities and energy service projects of the Clean Energy Businesses. Other guarantees also include a guarantee provided by Con Edison in connection with the Clean Energy Businesses’ obligations under a $150 million, 364-Day Senior Unsecured Term Loan Credit Agreement. See Note D.
Note I – Electricity and Gas Purchase Agreements
The Utilities have electricity purchase agreements with non-utility generators and others for generating capacity and gas purchase agreements for natural gas supply, transportation and storage. The Utilities recover their purchased power and gas costs in accordance with provisions approved by the applicable state public utility regulators. See “Recoverable Energy Costs” in Note A. The Utilities also conducted auctions and have entered into various other electricity and gas purchase agreements. Assuming performance by the parties to the electricity purchase agreements, the Utilities are obligated over the terms of the agreements to make capacity and other fixed payments.
The future capacity and other fixed payments under the electricity and gas purchase agreements are estimated to be as follows:
| | (Millions of Dollars) | (Millions of Dollars) | 2023 | | 2024 | | 2025 | | 2026 | | 2027 | | All Years Thereafter | (Millions of Dollars) | 2024 | | 2025 | | 2026 | | 2027 | | 2028 | | All Years Thereafter |
| Con Edison | Con Edison | | Con Edison | | | |
| Electricity power purchase agreements | Electricity power purchase agreements | $121 | | $90 | | $64 | | $58 | | $44 | | $390 | Electricity power purchase agreements | $155 | | $89 | | $59 | | $44 | | $346 |
| Natural gas | Natural gas | 679 | | 9 | | — | | — | | — | | — | Natural gas | 299 | | 10 | | 11 | | 7 | | — |
| Gas transportation and storage | Gas transportation and storage | 471 | | 558 | | 484 | | 454 | | 369 | | 3,164 | Gas transportation and storage | 521 | | 486 | | 460 | | 409 | | 301 | | 2,682 |
| CECONY | CECONY | | CECONY | | | |
| Electricity power purchase agreements | Electricity power purchase agreements | 121 | | 90 | | 64 | | 58 | | 44 | | 390 | Electricity power purchase agreements | 151 | | 85 | | 58 | | 44 | | 346 |
| Natural gas | Natural gas | 603 | | 8 | | — | | — | | — | | — | Natural gas | 258 | | 9 | | 6 | | — |
| Gas transportation and storage | Gas transportation and storage | 412 | | 488 | | 424 | | 397 | | 323 | | 2,762 | Gas transportation and storage | 450 | | 420 | | 398 | | 353 | | 259 | | 2,311 |
For energy delivered and gas purchased under most of the electricity and gas purchase agreements, the Utilities are obligated to pay variable prices. The company’s payments under the significant terms of the agreements for capacity, energy, gas transportation and storage, and other fixed payments in 2023, 2022 2021 and 20202021 were as follows:
| | | | | |
166
|
CON EDISON ANNUAL REPORT 2022 |
| | For the Years Ended December 31, |
| For the Years Ended December 31, | | | For the Years Ended December 31, |
| (Millions of Dollars) | (Millions of Dollars) | 2022 | | 2021 | | 2020 | (Millions of Dollars) | 2023 | | 2022 | | 2021 |
| Con Edison | Con Edison | |
| Astoria Generating Company (a) | |
| Astoria Generating Company (a) | |
| Astoria Generating Company (a) | Astoria Generating Company (a) | $45 | | $20 | | $26 | $40 | | $45 | | $20 |
| Brooklyn Navy Yard (b) | Brooklyn Navy Yard (b) | 165 | | 139 | | 113 | Brooklyn Navy Yard (b) | 134 | | 165 | | 139 |
| Gas Transportation and Storage (c) | Gas Transportation and Storage (c) | 386 | | 393 | | 347 | Gas Transportation and Storage (c) | 372 | | 386 | | 393 |
| Total | Total | $596 | | 552 | | $486 | Total | $546 | | $596 | | $552 |
| CECONY | CECONY | |
| Astoria Generating Company (a) | Astoria Generating Company (a) | $45 | | $20 | | $26 |
| Astoria Generating Company (a) | |
| Astoria Generating Company (a) | | $40 | | $45 | | $20 |
| Brooklyn Navy Yard (b) | Brooklyn Navy Yard (b) | 165 | | 139 | | 113 | Brooklyn Navy Yard (b) | 134 | | 165 | | 139 |
| Gas Transportation and Storage (c) | Gas Transportation and Storage (c) | 340 | | 347 | | 307 | Gas Transportation and Storage (c) | 327 | | 340 | | 347 |
| Total | Total | $550 | | $506 | | $446 | Total | $501 | | $550 | | $506 |
(a) Capacity purchase agreements with terms ending in 20222023 through 2025.
(b) Contract for plant output, which started in 1996 and ends in 2036.
(c) Contracts for various counterparties and terms extending through 2043.2044.
| | | | | |
146 | CON EDISON ANNUAL REPORT 2023 |
Note J – Leases
The Companies lease land, office buildings, equipment and access rights to support electric transmission facilities. The Companies recognize lease right-of-use assets and lease liabilities on their consolidated balance sheets for virtually all of their leases (other than leases that meet the definition of a short-term lease, the expense for which was immaterial). A lease right-of-use asset represents a right to use an identifiable underlying asset and obtain substantially all of the economic benefits from the use of that asset for the lease term. A lease liability represents an obligation to make lease payments arising from the lease. Leases are classified as either operating leases or finance leases. Operating leases of the Utilities and in 2021 of the Clean Energy Businesses, are included in operating lease right-of-use asset and operating lease liabilities on the Companies’ consolidated balance sheets. Operating leases of the Clean Energy businesses are included in assets held for sale and liabilities held for sale on Con Edison's consolidated balance sheet as of December 31,2022.31, 2022. On March 1, 2023, Con Edison completed the sale of all of the stock of the Clean Energy Businesses. See "Assets and Liabilities Held for Sale" in Note AW and Note X. Finance leases are included in other noncurrent assets, other current liabilities and other noncurrent liabilities. The Utilities, as regulated entities, are permitted to continue to recognize expense for operating leases using the timing that conforms to the regulatory rate treatment as rental payments are recovered from our customers and to account the same way for finance leases.
For new operating leases, the Companies recognize operating lease right-of-use assets and operating lease liabilities based on the present value of the future minimum lease payments over the lease term at commencement date. As most of the Companies’ leases do not provide an implicit rate, the Companies used their collateralized incremental borrowing rate based on the information available at the commencement date to determine the present value of future payments. Most of the Companies’ leases have remaining lease terms of one year to 20 years and may include options to renew or extend the leases for up to five years at the fair rental value. The Companies' lease terms include options to renew, extend or terminate the lease when it is reasonably certain that the Companies will exercise that option. There were no leases with material variable lease payments or residual value guarantees. The Companies account for lease and non-lease components as a single lease component.
Operating lease cost and cash paid for amounts included in the measurement of lease liabilities for the twelve monthsyears ended December 31, 2023, 2022, and 2021 were as follows:
| | Con Edison | CECONY |
| Con Edison (a) | | | Con Edison (a) | CECONY |
| (Millions of Dollars) | (Millions of Dollars) | 2022 | 2021 | 2022 | 2021 | (Millions of Dollars) | 2023 | 2022 | 2021 | 2023 | 2022 | 2021 |
| Operating lease cost | Operating lease cost | $88 | | $86 | | $67 | | $66 | |
| Operating lease cash flows | Operating lease cash flows | $83 | | $80 | | $64 | | $63 | |
(a)Amounts for Con Edison include amounts for the Clean Energy Businesses through February 2023. On March 1, 2023, Con Edison completed the sale of all of the stock of the Clean Energy Businesses. See Note W and Note X.
As of December 31, 2023, 2022, and 2021, assets recorded as finance leases for Con Edison and CECONY were $2 million for each year and $1 million, respectively. Thethe accumulated amortization associated with such finance leases were $2 million, $5 million, and $4 million, respectively. As of December 31, 2023, 2022, and 2021, assets recorded as finance leases for Con Edison and CECONY were $5$1 million for each year and the accumulated amortization associated with such finance leases were $2 million respectively, at December 31, 2022 and $4 million and $2 million, respectively, at December 31, 2021.
| | | | | |
CON EDISON ANNUAL REPORT 2022 | 167 |
For the twelve monthsyears ended December 31, 2023, 2022, and 2021, finance lease costs and cash flows for Con Edison and CECONY were immaterial.
Right-of-use assets obtained in exchange for lease obligations for Con Edison and CECONY were $11 million for the year ended December 31, 2023 and $79 million and $68 million, respectively, for the twelve monthsyear ended December 31, 2022 of which $10 million for Con Edison related to the Clean Energy Businesses which were classified as held forBusinesses. On March 1, 2023, Con Edison completed the sale see "Assets and Liabilities Held for Sale" inof all of the stock of the Clean Energy Businesses. See Note AW and Note X, and were $58 million and $12 million, respectively, for the twelve months ended December 31, 2021.X.
Other information related to leases for Con Edison and CECONY at December 31, 20222023 and 20212022 was as follows:
| | | | | | | | | | | | | | |
| Con Edison | CECONY |
| 2022 | 2021 | 2022 | 2021 |
| Weighted Average Remaining Lease Term: | | | | |
| Operating leases, (a) | 12.3 years | 18.5 years | 12.4 years | 12.1 years |
| Finance leases | 7.2 years | 7.1 years | 2.3 years | 3.1 years |
| Weighted Average Discount Rate: | | | | |
| Operating leases, (a) | 3.7% | 4.3% | 3.7% | 3.5% |
| Finance leases | 1.9% | 1.8% | 1.0% | 1.1% |
| | | | | |
| CON EDISON ANNUAL REPORT 2023 | 147 |
| | | | | | | | | | | | | | |
| Con Edison | CECONY |
| 2023 | 2022 | 2023 | 2022 |
| Weighted Average Remaining Lease Term: | | | | |
| Operating leases, (a) (b) | 11.4 years | 12.3 years | 11.4 years | 12.4 years |
| Finance leases | 6.6 years | 7.2 years | 2.7 years | 2.3 years |
| Weighted Average Discount Rate: | | | | |
| Operating leases, (a) (b) | 3.7% | 3.7% | 3.7% | 3.7% |
| Finance leases | 3.0% | 1.9% | 3.1% | 1.0% |
(a)Amounts for Con Edison in 2022 exclude operating leases of the Clean Energy Businesses, whichinclusive of Broken Bow II, that were classified as held for sale as of December 31, 2022, see "Assets and Liabilities Held for Sale" in Note A and Note X.2022. Including the operating leases of the Clean Energy Businesses would result in a weighted average remaining lease term of 18.3 years and a weighted average discount rate of 4.4%4.4 percent as of December 31, 2022. On March 1, 2023, Con Edison completed the sale of all of the stock of the Clean Energy Businesses. See Note W and Note X.
(b)Amounts for Con Edison in 2023 exclude the operating lease of Broken Bow II, that was classified as held for sale as of December 31, 2023. Including the operating lease of Broken Bow II would result in a weighted average remaining lease term of 11.6 years and a weighted average discount rate of 3.8 percent as of December 31, 2023. See Note W and Note X.
Future minimum lease payments under non-cancellable leases at December 31, 20222023 were as follows:
| | (Millions of Dollars) | (Millions of Dollars) | Con Edison | CECONY | (Millions of Dollars) | Con Edison | CECONY |
| Year Ending December 31, (b) | Year Ending December 31, (b) | Operating Leases | Finance Leases | Operating Leases | Finance Leases | Year Ending December 31, (b) | Operating Leases | Finance Leases | Operating Leases | Finance Leases |
| 2023 | $64 | | $— | | $64 | | $— | |
| 2024 | 2024 | 65 | | 1 | | 64 | | 1 | | 2024 | $67 | $1 | $66 | $1 |
| 2025 | 2025 | 65 | | — | | 64 | | — | | 2025 | 66 | — | 66 | — |
| 2026 | 2026 | 64 | | — | | 64 | | — | | 2026 | 66 | — | 66 | — |
| 2027 | 2027 | 64 | | — | | 64 | | — | | 2027 | 65 | — | 65 | — |
| 2028 | | 2028 | 60 | — | 60 | — |
| All years thereafter | All years thereafter | 419 | | 1 | | 419 | | — | | All years thereafter | 365 | 1 | 365 | — |
| Total future minimum lease payments | Total future minimum lease payments | $741 | | $2 | | $739 | | $1 | | Total future minimum lease payments | $689 | $2 | $688 | $1 |
| Less: imputed interest | Less: imputed interest | (162) | — | | (161) | — | | Less: imputed interest | (144) | — | (143) | — |
| Total | Total | $579 | | $2 | | $578 | | $1 | | Total | $545 | $2 | $545 | $1 |
| Reported as of December 31, 2022 | | | |
| Reported as of December 31, 2023 | |
| Operating lease liabilities (current) (a) | |
| Operating lease liabilities (current) (a) | |
| Operating lease liabilities (current) (a) | Operating lease liabilities (current) (a) | $103 | | $— | | $103 | | $— | | $116 | $— | $116 | $— |
| Operating lease liabilities held for sale (current) | Operating lease liabilities held for sale (current) | 33 | | — | | — | | — | | Operating lease liabilities held for sale (current) | 2 | — | — | — |
| Operating lease liabilities (noncurrent) (a) | Operating lease liabilities (noncurrent) (a) | 476 | | — | | 475 | | — | | Operating lease liabilities (noncurrent) (a) | 429 | — | 429 | — |
| Operating lease liabilities held for sale (noncurrent) | Operating lease liabilities held for sale (noncurrent) | 249 | | — | | — | | — | | Operating lease liabilities held for sale (noncurrent) | 5 | — | — | — |
| Other current liabilities | Other current liabilities | — | | — | | — | | — | | Other current liabilities | — | 1 | — | 1 |
| Other noncurrent liabilities | Other noncurrent liabilities | — | | 2 | | — | | 1 | | Other noncurrent liabilities | — | 1 | — | — |
| Total | Total | $861 | | $2 | | $578 | | $1 | | Total | $552 | $2 | $545 | $1 |
(a)Amounts exclude operating lease liabilities of the Clean Energy BusinessesBroken Bow II ($2817 million), which that are classified as current and noncurrent liabilities held for sale on Con Edison's consolidated balance sheet as of December 31, 2022.2023. See "Assets and Liabilities Held for Sale" in Note A and Note X.
| | | | | |
168
|
CON EDISON ANNUAL REPORT 2022 |
(b)Amounts exclude operating lease future minimum lease payments of the Clean Energy Businesses,Broken Bow II, of $19$3 million $18 million, $19 million, $17 million, $17 million, and $492 millionin total for the 12 monthsyears ended December 31, 2023, 2024 2025, 2026, 2027,through 2028, and $10 million for all years thereafter, respectively, and imputed interest of $301$6 million.
At December 31, 2022, the Companies had an additional operating lease agreement that had not yet commenced, for a solar electric facility under construction by the Clean Energy Businesses, the amount of which was not material. The Clean Energy Businesses were classified as held for sale as of December 31, 2022. See "Assets and Liabilities Held for Sale" in Note A and Note X.
The Companies are lessors under certain leases whereby the Companies own real estate and distribution poles and lease portions of them to others. Revenue under such leases was immaterial for Con Edison and CECONY for the twelve monthsyears ended December 31, 20222023 and 2021.2022.
| | | | | |
148 | CON EDISON ANNUAL REPORT 2023 |
Note K – Goodwill
The Companies test goodwill for impairment at least annually or whenever there is a triggering event. There is an option to first make a qualitative assessment of whether it is more likely than not that the fair value of a reporting unit is less than its carrying amount before applying a quantitative goodwill impairment test. The quantitative goodwill impairment test compares the estimated fair value of a reporting unit with its carrying value, including goodwill. If the estimated fair value of a reporting unit exceeds its carrying value, goodwill of the reporting unit is considered not impaired. If the carrying value exceeds the estimated fair value of the reporting unit, an impairment loss shall be recognized in an amount equal to that excess, limited to the total amount of goodwill allocated to that reporting unit.
Con Edison has recorded goodwill related to the O&R merger and the acquisition of a portion of Honeoye, andHoneoye. Further, included within Con Edison's assets held for sale as of December 31, 2022 is goodwill related to the acquisitions of a residential solar company and a battery storage company by the Clean Energy Businesses. In 2022 and 2021,On March 1, 2023, Con Edison completed the sale of all of the stock of the Clean Energy Businesses. See Note W and Note X.
In 2023 and 2022, Con Edison completed quantitative and qualitative impairment tests, respectively, for its goodwill of $406 million related to the O&R merger and determined that it was not impaired. For the impairment test, $245 million and $161 million of goodwill were allocated to CECONY and O&R, respectively. In 2022 and 2021, the Companies performed the qualitative assessment for goodwill related to the O&R merger. In 2022 and 2021, Con Edison completed impairment tests for goodwill of $1 million and $8 million, respectively, related to Honeoye, $14 million related to the residential solar company acquired by the Clean Energy Businesses and $18 million related to the battery storage company acquired by the Clean Energy Businesses. The amounts related to the Clean Energy Businesses were classified as held for sale on Con Edison's consolidated balance sheet as of December 31, 2022. In 2021, Con Edison determined, based on a discounted cash flow analysis, that $7 million of goodwill was impaired related to Honeoye, $5 million of which was attributed to CETCon Edison Transmission and $2 million of which was attributed to CECONY. The remaining goodwill attributable to Honeoye was not material at December 31, 2023 or 2022. No other impairments or triggering events were identified for Con Edison's goodwill for the years ending December 31, 2023, 2022 or 2021.
Estimates of future cash flows, projected growth rates, and discount rates inherent in the cash flow estimates for Con Edison subsidiaries other than the Utilities may vary significantly from actual results, which could result in a future impairment of goodwill. The Companies identified no triggering events or changes in circumstances related to the COVID-19 pandemic that would indicate that the carrying value of goodwill may not be recoverable at December 31, 2022 and 2021.
| | | | | |
CON EDISON ANNUAL REPORT 2022 | 169 |
Note L – Income Tax
The components of income tax are as follows:
| | | | Con Edison | | CECONY | | Con Edison | | CECONY |
| (Millions of Dollars) | (Millions of Dollars) | 2022 | | 2021 | | 2020 | | 2022 | | 2021 | | 2020 | (Millions of Dollars) | 2023 | | 2022 | | 2021 | | 2023 | | 2022 | | 2021 |
| State | State | | | |
| Current | Current | $5 | | $14 | | $7 | | $0 | | $1 | | $6 |
| Current | |
| Current | | $179 | | $5 | | $14 | | $(102) | | $— | | $1 |
| Deferred | Deferred | 324 | | 79 | | 50 | | 110 | | 106 | | 97 | Deferred | 6 | | 324 | | 79 | | 246 | | 110 | | 106 |
| Federal | Federal | | | |
| Current | |
| Current | |
| Current | Current | 58 | | 43 | | | (2) | | 170 | | 121 | | 41 | 176 | | 58 | | | 43 | | 43 | | (95) | | 170 | | 121 |
| Deferred | Deferred | 117 | | 61 | | 42 | | (23) | | 21 | | 73 | Deferred | 237 | | 117 | | 61 | | 311 | | (23) | | 21 |
| Amortization of investment tax credits | Amortization of investment tax credits | (6) | | (7) | | (7) | | (2) | | (3) | | (2) | Amortization of investment tax credits | (111) | | (6) | | (7) | | (2) | | (3) |
| Total income tax expense | Total income tax expense | $498 | | $190 | | $90 | | $255 | | $246 | | $215 | Total income tax expense | $487 | | $498 | | $190 | | $358 | | $255 | | $246 |
| | | | | |
| CON EDISON ANNUAL REPORT 2023 | 149 |
Reconciliation of the difference between income tax expense and the amount computed by applying the prevailing statutory income tax rate to income before income taxes is as follows:
| | | | Con Edison | | CECONY | | Con Edison | | CECONY |
| (% of Pre-tax income) | (% of Pre-tax income) | 2022 | | 2021 | | 2020 | | 2022 | | 2021 | | 2020 | (% of Pre-tax income) | 2023 | | 2022 | | 2021 | | 2023 | | 2022 | | 2021 |
| STATUTORY TAX RATE | STATUTORY TAX RATE | | | |
| Federal | Federal | 21 | % | | 21 | % | | 21 | % | | 21 | % | | 21 | % | | 21 | % |
| Federal | |
| Federal | | 21 | % | | 21 | % | | 21 | % | | 21 | % | | 21 | % | | 21 | % |
| Changes in computed taxes resulting from: | Changes in computed taxes resulting from: | | | |
| State income taxes, net of federal income tax benefit | 6 | | | 4 | | | 4 | | | 5 | | | 5 | | | 5 | |
| State income taxes, net of federal income taxes | |
| State income taxes, net of federal income taxes | |
| State income taxes, net of federal income taxes | |
| Taxes attributable to noncontrolling interests | Taxes attributable to noncontrolling interests | 1 | | | 3 | | | (1) | | | — | | | — | | | — | |
| Cost of removal | Cost of removal | 1 | | | 2 | | | 2 | | | 1 | | | 1 | | | 1 | |
| Other plant-related items | Other plant-related items | — | | | (1) | | | (1) | | | (1) | | | (1) | | | (1) | |
| | | Amortization of excess deferred federal income taxes | |
| | Amortization of excess deferred federal income taxes | |
| | Amortization of excess deferred federal income taxes | Amortization of excess deferred federal income taxes | (9) | | | (12) | | | (14) | | | (10) | | | (11) | | | (12) | |
| Renewable energy credits | Renewable energy credits | (2) | | | (2) | | | (3) | | | — | | | — | | | — | |
| Research and development credits | Research and development credits | — | | | (1) | | | — | | | — | | | — | | | — | |
| Remeasurement of accumulated deferred state income taxes, net of federal income tax benefit | 6 | | | — | | | — | | | — | | | — | | | — | |
| Other | Other | — | | | — | | | (1) | | | — | | | — | | | 1 | |
| Impacts from the sale of the Clean Energy Businesses: | |
| Changes in state apportionments, net of federal income taxes | |
| Changes in state apportionments, net of federal income taxes | |
| Changes in state apportionments, net of federal income taxes | |
| Deferred unamortized ITC recognized on sale of subsidiary | |
| Effective tax rate | Effective tax rate | 24 | % | | 14 | % | | 7 | % | | 16 | % | | 15 | % | | 15 | % | Effective tax rate | 16 | % | | 24 | % | | 14 | % | | 18 | % | | 16 | % | | 15 | % |
Con Edison’s effective tax rate increased 10%decreased 8 percent in 2023 primarily due to tax benefits from the recognition of deferred unamortized investment tax credits and the absence of the remeasurement of state deferred income taxes on the announced sale of the Clean Energy Businesses recognized in 2022, primarily due tooffset in part by higher income before income tax expense andin 2023 due to the remeasurement of deferred state income tax assets and liabilities as a result ofgain on the anticipated sale of the Clean Energy Businesses (see Note X). Con Edison estimatedand lower renewable energy tax credits due to the impact of the anticipated sale on its state apportionment factors and recorded an increase to its net accumulated deferred state income tax liabilities of $111 million and an increase to its valuation allowance on state and local net operating loss (NOL) carryforwards of $10 million, and recorded a corresponding deferred income tax expense of $121 million (net of federal income taxes) in the fourth quarter of 2022. During 2022, Con Edison wrote off $11 million of deferred tax assets (net of federal income taxes) and related valuation allowance on other state NOLs, with no impact on deferred income tax expense, and recognized a deferred income tax benefit of $3 million (net of federal income taxes) from net operating losses that were utilized during the year.sale.
| | | | | |
170150
|
20222023 |
On March 1, 2023, Con Edison completed the sale of all of the stock of the Clean Energy Businesses, which was accounted for as a stock sale for GAAP purposes and a deemed sale of assets and liquidation for tax purposes. Con Edison's pre-tax gain on the sale of the Clean Energy Businesses was $865 million ($767 million, net of tax) for the year ended December 31, 2023. The sale included all assets, operations and projects of the Clean Energy Businesses with the exception of tax equity interests and a deferred project, that were treated as distributions to Con Edison. See Note W and Note X.
The tax effects of temporary differences, which gave rise to deferred tax assets and liabilities, are as follows:
| | | |
| | | | Con Edison | CECONY | |
| (Millions of Dollars) | (Millions of Dollars) | 2022 | 2021 | 2022 | 2021 | |
| (Millions of Dollars) | |
| (Millions of Dollars) | |
| Deferred tax liabilities: | |
| Deferred tax liabilities: | |
| Deferred tax liabilities: | Deferred tax liabilities: | | | | |
| Property basis differences | Property basis differences | $8,770 | | $8,298 | | $7,475 | | $7,213 | | |
| Property basis differences | |
| Property basis differences | |
| Regulatory Assets: | |
| Regulatory Assets: | |
| Regulatory Assets: | Regulatory Assets: | | | | |
| | Deferred storm costs | 27 | | 33 | | — | | — | | |
| System peak reduction and energy efficiency programs | |
| | System peak reduction and energy efficiency programs | |
| | System peak reduction and energy efficiency programs | |
| Environmental remediation costs | |
| Environmental remediation costs | |
| Environmental remediation costs | Environmental remediation costs | 278 | | 264 | | 254 | | 241 | | |
| Other regulatory assets | Other regulatory assets | 754 | | 640 | | 720 | | 609 | | |
| Other regulatory assets | |
| Other regulatory assets | |
| Unrecognized pension and other postretirement costs | |
| Unrecognized pension and other postretirement costs | |
| Unrecognized pension and other postretirement costs | Unrecognized pension and other postretirement costs | 22 | | 36 | | 22 | | 31 | | |
| Pensions and retiree benefits – asset | Pensions and retiree benefits – asset | 917 | | 478 | | 894 | | 471 | | |
| Pensions and retiree benefits – asset | |
| Pensions and retiree benefits – asset | |
| Operating lease right-of-use asset | |
| Operating lease right-of-use asset | |
| Operating lease right-of-use asset | Operating lease right-of-use asset | 230 | | 204 | | 163 | | 155 | | |
| Equity investments | Equity investments | 26 | | — | | — | | — | | |
| Equity investments | |
| Equity investments | |
| | Other | — | | 30 | | — | | — | | |
| | Total deferred tax liabilities | |
| | Total deferred tax liabilities | |
| | Total deferred tax liabilities | Total deferred tax liabilities | $11,024 | $9,983 | $9,528 | $8,720 | |
| Deferred tax assets: | Deferred tax assets: | | | | |
| Deferred tax assets: | |
| Deferred tax assets: | |
| Regulatory liabilities: | |
| Regulatory liabilities: | |
| Regulatory liabilities: | Regulatory liabilities: | | | | |
| Unrecognized pension and other postretirement costs | Unrecognized pension and other postretirement costs | 447 | | — | | 431 | | — | | |
| Unrecognized pension and other postretirement costs | |
| Unrecognized pension and other postretirement costs | |
| Future income tax | |
| Future income tax | |
| Future income tax | Future income tax | 489 | | 554 | | 454 | | 517 | | |
| Other regulatory liabilities | Other regulatory liabilities | 860 | | 727 | | 739 | | 620 | | |
| Other regulatory liabilities | |
| Other regulatory liabilities | |
| Tax credits carryforward | |
| Tax credits carryforward | |
| Tax credits carryforward | Tax credits carryforward | 767 | | 946 | | — | | — | | |
| Loss carryforwards | Loss carryforwards | 117 | | 144 | | 24 | | 38 | | |
| Loss carryforwards | |
| Loss carryforwards | |
| Valuation allowance | |
| Valuation allowance | |
| Valuation allowance | Valuation allowance | (18) | | (22) | | — | | — | | |
| Superfund and other environmental costs | Superfund and other environmental costs | 280 | | 264 | | 254 | | 238 | | |
| Superfund and other environmental costs | |
| Superfund and other environmental costs | |
| Operating lease liabilities | |
| Operating lease liabilities | |
| Operating lease liabilities | Operating lease liabilities | 233 | | 195 | | 162 | | 155 | | |
| Pensions and retiree benefits – liability | Pensions and retiree benefits – liability | 162 | | 218 | | 148 | | 188 | | |
| Pensions and retiree benefits – liability | |
| Pensions and retiree benefits – liability | |
| Asset retirement obligations | |
| Asset retirement obligations | |
| Asset retirement obligations | Asset retirement obligations | 153 | | 177 | | 140 | | 141 | | |
| Equity investments | Equity investments | — | | 34 | | — | | — | | |
| Equity investments | |
| Equity investments | |
| Other | |
| Other | |
| Other | Other | 14 | | — | | 45 | | 42 | | |
| Total deferred tax assets | Total deferred tax assets | 3,504 | 3,237 | 2,397 | 1,939 | |
| Total deferred tax assets | |
| Total deferred tax assets | |
| Net deferred tax liabilities | |
| Net deferred tax liabilities | |
| Net deferred tax liabilities | Net deferred tax liabilities | $7,520 | $6,746 | $7,131 | $6,781 | |
| Unamortized investment tax credits | Unamortized investment tax credits | 121 | 127 | 13 | 15 | |
| Unamortized investment tax credits | |
| Unamortized investment tax credits | |
| Net deferred tax liabilities and unamortized investment tax credits | Net deferred tax liabilities and unamortized investment tax credits | $7,641 | $6,873 | $7,144 | $6,796 | |
| Net deferred tax liabilities and unamortized investment tax credits | |
| Net deferred tax liabilities and unamortized investment tax credits | |
At December 31, 2022,2023, Con Edison has $767$270 million in general business tax credit carryovers (primarily renewable energy tax credits). If unused, these general business tax credit carryovers will begin to expire in 2034.2038. A deferred tax asset for these tax attribute carryforwards was recorded, and no valuation allowance was provided, as it is more likely than not that the deferred tax asset will be realized.
At December 31, 2022, Con Edison has a New York State NOL of $892 million, primarily as a result of accelerated tax depreciation. A deferred tax asset of $84 million has been recognized for these New York State NOL carryforwards that will begin to expire, if unused, in 2038, and no valuation allowance is needed as it is more likely than not that the deferred tax asset will be realized. In addition,2023, Con Edison has a deferred tax asset on its New York City NOLnet operating loss carryforward of $17$8 million that will begin to expire, if unused, in 2035, and2035. Con Edison recorded a relatedfull valuation allowance of $14 million as it is not more likely than not that theagainst this deferred tax assets will be realized. Con Edison also has a deferred tax asset of $46 million on other state net operating loss carryforwards that will begin to expire if unused in 2038, and have a related valuation allowance of $10 million, as it is not more likely than not that the deferred tax assets will be realized.
At December 31, 2022, the Clean Energy Businesses had a deferred tax asset on non New York net operating losses of $43 million, with a valuation allowance of $9 million against the deferred tax assets. During the year ended December 31, 2023, $26 million of deferred tax assets on state net operating losses were utilized as a result of the sale of the Clean Energy Businesses with $17 million of deferred taxes remaining which are not expected to be utilized. Con Edison has written off the $17 million and the related $9 million valuation allowance as these deferred tax assets will not be realized due to the sale of the Clean Energy Businesses.
| | | | | |
| CON EDISON ANNUAL REPORT 2023 | 151 |
In April 2021, NY2023, the IRS released Revenue Procedure 2023-15, which provides a safe harbor method of accounting that taxpayers may use to determine whether certain expenditures to maintain, repair, replace, or improve natural gas transmission and distribution property must be capitalized as improvements by the taxpayer or currently deducted for federal income tax purposes. This revenue procedure also provides procedures for taxpayers to obtain automatic consent to change their method of accounting to the safe harbor method of accounting permitted by this revenue procedure. Con Edison recorded an increase in accumulated plant-related deferred tax liabilities of $228 million ($204 million for CECONY) to reflect the cumulative impact of this change in accounting method for the Utilities.
In May 2023, New York State passed a law that temporarily increasedextended the increase in the corporate franchise tax rate on business income from 6.506.5 percent to 7.25 percent for a 3another three-year period, through tax year period, retroactive to January 1, 2021,2026, for taxpayers with taxable income greater than $5 million. The law also temporarily reinstatedextended the business capital tax through tax year 2026, not to exceed an annual maximum tax liability of $5 million per taxpayer, with thea corporation paying the higher of its franchise or income tax liability during the same period. The provisions to increaseNew York State also passed a law establishing a permanent rate of 30 percent for the corporate franchisemetropolitan transportation business tax rate and reinstate
| | | | | |
CON EDISON ANNUAL REPORT 2022 | 171 |
a business capital tax are scheduled to expire after 2023 and are not expected to have a material impact on the Company’s financial position, results of operations or liquidity. On November 19, 2021, the Acting Commissioner determined that the Metropolitan Transportation Authority (MTA) surcharge rate will remain the same at 30% for tax years beginning on or after January 1, 2022, and before January 1, 2023.surcharge. As a result of the sale of the Clean Energy Businesses anticipated sale,in 2023, Con Edison expects to have NYhas New York State taxable income in excess of the $5 million after utilizingusing its entire NYNew York State NOL,Net Operating Loss carryforward, and therefore, the group will beis subject to the higher 7.25 percent (9.4rate (9.425 percent with MTAthe surcharge rate) rate on its taxable income which was included in Con Edison's remeasurementfor tax year 2023. As a result of this legislation, CECONY remeasured its deferred state income tax assets and liabilities atthat would reverse before 2027 and recorded state deferred income tax expense (net of federal benefit) and an increase in accumulated deferred tax liabilities of $10 million for the end of 2022.year ended December 31, 2023.
Uncertain Tax Positions
Under the accounting rules for income taxes, the Companies are not permitted to recognize the tax benefit attributable to a tax position unless such position is more likely than not to be sustained upon examination by taxing authorities, including resolution of any related appeals and litigation processes, based solely on the technical merits of the position.
A reconciliation of the beginning and ending amounts of unrecognized tax benefits for Con Edison and CECONY follows:
| | Con Edison | CECONY |
| Con Edison | | | Con Edison | CECONY |
| (Millions of Dollars) | (Millions of Dollars) | 2022 | 2021 | 2020 | 2022 | 2021 | 2020 | (Millions of Dollars) | 2023 | 2022 | 2021 | 2023 | 2022 | 2021 |
| Balance at January 1, | Balance at January 1, | $17 | $14 | $13 | $5 | $3 | $2 | Balance at January 1, | $23 | $17 | $14 | $8 | $5 | $3 |
| Additions based on tax positions related to the current year | Additions based on tax positions related to the current year | 3 | — | | 2 | 2 | — | | Additions based on tax positions related to the current year | 8 | 3 | 4 | 2 |
| Additions based on tax positions of prior years | Additions based on tax positions of prior years | 6 | 2 | 1 | 1 | 1 | Additions based on tax positions of prior years | 3 | 6 | 2 | 1 | 1 |
| Reductions for tax positions of prior years | Reductions for tax positions of prior years | (1) | (2) | — | | — | | (1) | | — | | Reductions for tax positions of prior years | (11) | (1) | (2) | (6) | — | (1) |
| Settlements | Settlements | (2) | — | — | | — | — | — | | Settlements | (12) | (2) | — | — | — |
| Balance at December 31, | Balance at December 31, | $23 | $17 | $14 | $8 | $5 | $3 | Balance at December 31, | $11 | $23 | $17 | $7 | $8 | $5 |
At December 31, 2022,2023, the estimated liability for uncertain tax positions for Con Edison was $23$11 million ($87 million for CECONY). For the year ended December 31, 2023, Con Edison recognized $8 million ($4 million for CECONY) of income tax expense related to current year positions, and recognized a tax benefit of $8 million ($5 million for CECONY) related to positions in prior years. In 2023, Con Edison settled with the IRS on the research and development credits related to the Clean Energy Businesses for the 2020-2021 tax years resulting in a reduction in the liability for general business credit carryovers of $12 million, for which an uncertain tax position had previously been recorded. In addition, CECONY reversed $6 million in uncertain tax positions related to the same tax years that reduced its effective tax rate. Con Edison and CECONY reasonably expectsexpect to resolve within the next twelve months approximately $20$3 million of various federal uncertainties due to the expected completion of ongoing tax examinations, of which the entire amount, if recognized, would reduce Con Edison's effective tax rate. The amount related to CECONY is $6 million, which, if recognized, would reduce CECONY’stheir effective tax rate. The total amount of unrecognized tax benefits, if recognized, that would reduce Con Edison’s effective tax rate is $23$11 million ($10 million, net of federal taxes) with $8$7 million attributable to CECONY.
The Companies recognize interest on liabilities for uncertain tax positions in interest expense and would recognize penalties, if any, in operating expenses in the Companies’ consolidated income statements. In 2023, 2022 2021 and 2020,2021, the Companies recognized an immaterial amount of interest expense and no penalties for uncertain tax
| | | | | |
152 | CON EDISON ANNUAL REPORT 2023 |
positions in their consolidated income statements. At December 31, 20222023 and 2021,December 31, 2022, the Companies recognized an immaterial amount of accrued interest on their consolidated balance sheets.
During 2022,In October 2023, Con Edison settledreached a settlement with New York State and closed its Massachusetts corporation excise tax auditopen examinations for the 2010-2014 tax years 2013 through 2018, and made a payment of $2paid $6 million duringin interest and $4 million in income taxes after applying the year and released $1remaining $12 million of uncertain tax positions as a result of the settlement.special deposit made in 2013.
Con Edison'sEdison’s federal tax returnsreturn for tax years 2021 and 2020 remain2022 remains under examination. State and local income tax returns remain open for examination in NYNew York State for tax years 20102015 through 2021,2022, in NJNew Jersey for tax years 20182019 through 20212022 and in New York City for tax years 20182019 through 2021.2022.
| | | | | |
172
|
CON EDISON ANNUAL REPORT 2022 |
Note M – Revenue Recognition
The following table presents, for the years ended December 31, 2023, 2022 2021 and 2020,2021, revenue from contracts with customers as defined in Accounting Standards Codification (ASC) Topic 606, "Revenue from Contracts with Customers," as well as additional revenue from sources other than contracts with customers, disaggregated by major source. | | 2022 | 2021 | 2020 |
| 2023 | | | 2023 | 2022 | 2021 |
| (Millions of Dollars) | (Millions of Dollars) | Revenues from contracts with customers | | Other revenues (a) | Total operating revenues | Revenues from contracts with customers | | Other revenues (a) | Total operating revenues | Revenues from contracts with customers | | Other revenues (a) | Total operating revenues | (Millions of Dollars) | Revenues from contracts with customers | | Other revenues (a) | Total operating revenues | Revenues from contracts with customers | | Other revenues (a) | Total operating revenues | Revenues from contracts with customers | | Other revenues (a) | Total operating revenues |
| CECONY | CECONY | | | | | |
| Electric | |
| Electric | |
| Electric | Electric | $9,917 | | $(166) | $9,751 | $8,736 | | $70 | $8,806 | $8,026 | | $77 | $8,103 | $9,946 | | $132 | $10,078 | $9,917 | | $(166) | $9,751 | $8,736 | | $70 | $8,806 |
| Gas | Gas | 2,875 | | 49 | 2,924 | 2,324 | | 54 | 2,378 | 1,998 | | 38 | 2,036 | Gas | 2,867 | | (38) | 2,829 | 2,875 | | 49 | 2,924 | 2,324 | | 54 | 2,378 |
| Steam | Steam | 584 | | 9 | 593 | 519 | | 13 | 532 | 494 | | 14 | 508 | Steam | 551 | | 18 | 569 | 584 | | 9 | 593 | 519 | | 13 | 532 |
| Total CECONY | Total CECONY | $13,376 | | $(108) | $13,268 | $11,579 | | $137 | $11,716 | $10,518 | | $129 | $10,647 | Total CECONY | $13,364 | | $112 | $13,476 | $13,376 | | $(108) | $13,268 | $11,579 | | $137 | $11,716 |
| O&R | O&R | | | | | |
| Electric | Electric | 771 | | 2 | 773 | 691 | | (10) | 681 | 619 | | 10 | 629 |
| Electric | |
| Electric | | 740 | | 19 | 759 | 771 | | 2 | 773 | 691 | | (10) | 681 |
| Gas | Gas | 306 | | 6 | 312 | 265 | | (5) | 260 | 224 | | 9 | 233 | Gas | 286 | | 11 | 297 | 306 | | 6 | 312 | 265 | | (5) | 260 |
| Total O&R | Total O&R | $1,077 | | $8 | $1,085 | $956 | | $(15) | $941 | $843 | | $19 | $862 | Total O&R | $1,026 | | $30 | $1,056 | $1,077 | | $8 | $1,085 | $956 | | $(15) | $941 |
| Clean Energy Businesses (c) | Clean Energy Businesses (c) | | | | | |
| Renewables | |
| Renewables | |
| Renewables | Renewables | 637 | | — | | 637 | 638 | | — | | 638 | 608 | | — | | 608 | 68 | | — | 68 | 637 | | — | 637 | 638 | | — | 638 |
| Energy services | Energy services | 317 | | — | | 317 | 234 | | — | | 234 | 52 | | — | | 52 | Energy services | 7 | | — | 7 | 317 | | — | 317 | 234 | | — | 234 |
| Develop/Transfer Projects | Develop/Transfer Projects | 44 | | — | | 44 | 45 | | | — | | 45 | 1 | | — | | 1 | Develop/Transfer Projects | 7 | | — | 7 | 44 | | | — | | — | 44 | 45 | | — | 45 |
| Other | Other | — | | | 321 | 321 | — | | | 105 | 105 | — | | | 75 | Other | — | | 47 | 47 | — | | 321 | 321 | — | | 105 | 105 |
| Total Clean Energy Businesses | Total Clean Energy Businesses | $998 | | $321 | $1,319 | $917 | | $105 | $1,022 | $661 | | $75 | $736 | Total Clean Energy Businesses | $82 | | $47 | $129 | $998 | | $321 | $1,319 | $917 | | $105 | $1,022 |
| Con Edison Transmission | Con Edison Transmission | 4 | | — | | 4 | 4 | | — | | 4 | 4 | | — | | 4 | Con Edison Transmission | 4 | | — | 4 | 4 | | — | | 4 | 4 | 4 | | — | 4 |
| Other (b) | Other (b) | — | | | (6) | — | | | (7) | — | | | (3) | Other (b) | — | | (2) | (2) | — | | (6) | (6) | — | | (7) | (7) |
| Total Con Edison | Total Con Edison | $15,455 | | $215 | $15,670 | $13,456 | | $220 | $13,676 | $12,026 | | $220 | $12,246 | Total Con Edison | $14,476 | | $187 | $14,663 | $15,455 | | $215 | $15,670 | $13,456 | | $220 | $13,676 |
(a) For the Utilities, this includes primarily revenue or negative revenue adjustments from alternative revenue programs, such as the revenue decoupling mechanisms under their NY electric and gas rate plans (see "Rate Plans" in Note B) and for 2021 recognition of late payment charges and fees that were not billed (LPCs) for the yearsyear ended December 31, 2020 and 2021 and for which recovery was granted by the NYSPSC. See "COVID-19 Regulatory Matters" in Note B and "Utilities' Assessment of Late Payment Charges" below. The amount of revenue recognized under such alternative revenue programs for 2021 includes $48 million, $34 million and $74 million for CECONY's revenue decoupling mechanisms, net EAMs, and LPCs, respectively, and $(18) million, $2 million and $4 million for O&R's revenue decoupling mechanisms, net EAMs, and LPCs, respectively. For the Clean Energy Businesses, this included revenue from wholesale services. For the Clean Energy Businesses, this includes revenue from wholesale services. On March 1, 2023, Con Edison completed the sale of all of the stock of the Clean Energy Businesses. See Note W and Note X.
(b) ParentOther includes the parent company, and consolidation adjustments.
(c) The Clean Energy Businesses were classified asCon Edison's tax equity investments, the deferred project held for sale asand consolidated adjustments. See Note X.
(c) On March 1, 2023, Con Edison completed the sale of December 31, 2022.all of the stock of the Clean Energy Businesses. See "Assets and Liabilities Held for Sale" in Note AW and Note X.
Revenues are recorded as energy is delivered, generated or services are provided and billed to customers, except for services under percentage-of-completion contracts. Amounts billed are recorded in accounts receivable - customers, with payment generally due the following month. Con Edison’s and the Utilities’ accounts receivable - customers balance also reflects the Utilities’ purchase of receivables from energy service companies to support retail choice programs. Accrued revenues not yet billed to customers are recorded as accrued unbilled revenues.
| | | | | |
| CON EDISON ANNUAL REPORT 2023 | 153 |
The Utilities have the obligation to deliver electricity, gas and steam energy to their customers. As the energy is immediately available for use upon delivery to the customer, the energy and its delivery are identifiable as a single performance obligation. The Utilities recognize revenues as this performance obligation is satisfied over time as the Utilities deliver, and the customers simultaneously receive and consume, the energy. The amount of revenues recognized reflects the consideration the Utilities expect to receive in exchange for delivering the energy. Under their tariffs, the transaction price for full-service customers includes the Utilities’ energy cost and for all customers includes delivery charges determined based on customer class and in accordance with established tariffs and guidelines of the NYSPSC or the NJBPU, as applicable. Accordingly, there is no unsatisfied performance obligation associated with these customers. The transaction price is applied to the Utilities’ revenue generating activities through the customer billing process. Because energy is delivered over time, the Utilities use output methods that recognize revenue based on direct measurement of the value transferred, such as units delivered, which provides an accurate measure of value for the energy delivered. The Utilities accrue revenues at the end of each month for estimated energy delivered but not yet billed to customers. The Utilities defer over a 12-month period net
| | | | | |
CON EDISON ANNUAL REPORT 2022 | 173 |
interruptible gas revenues, other than those authorized by the NYSPSC to be retained by the Utilities, for refund to firm gas sales and transportation customers.
The Clean Energy Businesses recognizerecognized revenue for the sale of energy from renewable electric projects as energy iswas generated and billed to counterparties; accrueaccrued revenues at the end of each month for energy generated but not yet billed to counterparties; and recognizerecognized revenue as energy iswas delivered and services arewere provided for managing energy supply assets leased from others and managing the dispatch, fuel requirements and risk management activities for generating plants and merchant transmission in the northeastern United States. The Clean Energy Businesses also recognizerecognized revenue for providing energy-efficiency services to government and commercial customers, and recognizerecognized revenue for engineering, procurement and construction services, under the percentage-of-completion method of revenue recognition. TheOn March 1, 2023, Con Edison completed the sale of all of the stock of the Clean Energy Businesses were classified as held for sale as of December 31, 2022.Businesses. See "Assets and Liabilities Held for Sale" in Note AW and Note X.
Clean Energy Businesses' Use of the Percentage-of-Completion Method
Sales and profits on each percentage-of-completion contract areat the Clean Energy Businesses were recorded each month based on the ratio of actual cumulative costs incurred to the total estimated costs at completion of the contract, multiplied by the total estimated contract revenue, less cumulative revenues recognized in prior periods (the ‘‘cost-to-cost’’ method). The impact of revisions of contract estimates, which may resulthave resulted from contract modifications, performance or other reasons, arewere recognized on a cumulative catch-up basis in the period in which the revisions arewere made. TheOn March 1, 2023, Con Edison completed the sale of all of the stock of the Clean Energy Businesses were classified as held for sale as of December 31, 2022.Businesses. See "Assets and Liabilities Held for Sale" in Note AW and Note X.
| | 2022 | 2021 | 2020 |
| 2023 | | | 2023 | 2022 | 2021 |
| (Millions of Dollars) | (Millions of Dollars) | Unbilled contract revenue (a) | | Unearned revenue (b) | | Unbilled contract revenue (a) | | Unearned revenue (b) | | Unbilled contract revenue (a) | | Unearned revenue (b) | |
| Beginning balance as of January 1, | Beginning balance as of January 1, | $35 | | $7 | | $11 | | $41 | | $29 | | $17 | |
| Beginning balance as of January 1, | |
| Beginning balance as of January 1, | |
| Additions (c) | |
| Additions (c) | |
| Additions (c) | Additions (c) | 324 | | — | | 242 | | — | | 88 | | 31 | |
| Subtractions (c) | Subtractions (c) | 279 | | 4 | (d) | 218 | | 34 | (d) | 106 | | 7 | (d) |
| Subtractions (c) | |
| Subtractions (c) | | 78 | | 3 | (d) | 279 | | 4 | (d) | 218 | | 34 | (d) |
| Ending balance as of December 31, | Ending balance as of December 31, | $80 | | $3 | | $35 | | $7 | | $11 | | $41 | |
(a)Unbilled contract revenue represents accumulated incurred costs and earned profits on contracts (revenue arrangements), which have been recorded as revenue, but have not yet been billed to customers, and which represent contract assets as defined in Topic 606. Substantially all accrued unbilled contract revenue is expected to be collected within one year. Unbilled contract revenue arises from the cost-to-cost method of revenue recognition. Unbilled contract revenue from fixed-price type contracts is converted to billed receivables when amounts are invoiced to customers according to contractual billing terms, which generally occur when deliveries or other performance milestones are completed.
(b)Unearned revenue represents a liability for billings to customers in excess of earned revenue, which are contract liabilities as defined in Topic 606.
(c)Additions for unbilled contract revenue and subtractions for unearned revenue represent additional revenue earned. Additions for unearned revenue and subtractions for unbilled contract revenue represent billings. Activity also includes appropriate balance sheet classification for the period.
(d)Of the subtractions from unearned revenue, $3 million, $4 million $34 million and $7$34 million were included in the balances as of January 1, 2023, 2022, 2021, and 2020,2021, respectively.
As of December 31, 2022,Following the aggregate amount of the remaining fixed performance obligationssale of the Clean Energy Businesses, under contracts with customersCon Edison received substantially all contract revenue, net of certain costs incurred, for energy services is $89 million, of which $51 million will be recognized within the next two years, and the remaining $38 million will be recognized pursuant to long-term service and maintenance agreements. The Clean Energy Businesses were classified as held for sale as of December 31, 2022.a battery storage project located in Imperial County, California. See "Assets and Liabilities Held for Sale" in Note A and Note X.
Utilities' Assessment of Late Payment Charges
In March 2020, the Utilities began suspending new late payment charges and certain other fees for all customers. The Utilities also began providing payment extensions for all customers that were scheduled to be disconnected prior to the start of the COVID-19 pandemic. In November 2021, the NYSPSC issued an order establishing a surcharge recovery mechanism for CECONY to collect, commencing December 1, 2021 through December 31, 2022, $43 million and $7 million for electric and gas, respectively, of late payment charges and fees that were not billed for the year ended December 31, 2020. In April 2022, the NYSPSC approved the October 2021 O&R NY joint proposal for new electric and gas rate plans for the three-year period from January 2022 through December 2024 that includes certain COVID-19 provisions, such as: recovery of 2020 late payment charges over three years;W.
| | | | | |
174154
|
20222023 |
reconciliation of late payment charges to amounts reflected in rates for years 2021 through 2024; and reconciliation of write-offs of customer accounts receivable balances to amounts reflected in rates from January 1, 2020 through December 31, 2024. CECONY resumed late payment charges for commercial and residential customers who have not experienced a change in financial circumstances due to the COVID-19 pandemic in September 2021 and October 2021, respectively. O&R resumed late payment charges for commercial and residential customers who have not experienced a change in financial circumstances due to the COVID-19 pandemic in October 2021. See "COVID-19 Regulatory Matters" in Note B.
Note N – Current Expected Credit Losses
Allowance for Uncollectible Accounts
The Utilities’ “Account receivable – customers” balance consists of utility bills due (bills are generally due the month following billing) from customers who have energy delivered, generated, or services provided by the Utilities. The balance also reflects the Utilities’ purchase of receivables from energy service companies to support the retail choice programs.
“Other receivables” balance generally reflects costs billed by the Utilities for goods and services provided to external parties, such as accommodation work for private parties and certain governmental entities, real estate rental and pole attachments.
On March 1, 2023, Con Edison completed the sale of all of the stock of the Clean Energy Businesses. See Note W and Note X. The Clean Energy Businesses’ customer accounts receivable balance generally reflectsreflected the management of energy supply assets, energy-efficiency services to government and commercial customers, and the engineering, procurement, and construction services of renewable energy projects. The Clean Energy Businesses calculatecalculated an allowance for uncollectible accounts related to their energy services customers based on an aging and customer-specific analysis. The amount of such reserves was not material at December 31, 2022 and December 31, 2021.2022. The Clean Energy Businesses were classified as held for sale as of December 31, 2022. See "Assets and Liabilities Held for Sale" in Note A and Note X.
The Companies develop expected loss estimates using past events data and consider current conditions and future reasonable and supportable forecasts. Changes to the Utilities’ reserve balances that result in write-offs of customer accounts receivable balances above existing rate allowances are not reflected in rates during the term of the current rate plans. For the Utilities’ customer accounts receivable allowance for uncollectible accounts, past events considered include write-offs relative to customer accounts receivable; current conditions include macro-and micro-economic conditions related to trends in the local economy, bankruptcy rates and aged customer accounts receivable balances, among other factors; and forecasts about the future include assumptions related to the level of write-offs and recoveries. Generally, the Utilities write off customer accounts receivable as uncollectible 90 days after the account is turned off for non-payment, or the account is closed during the collection process. See "COVID-19 Regulatory Matters" in Note B.
Other receivables allowance for uncollectible accounts is calculated based on a historical average of collections relative to total other receivables, including current receivables. Current macro- and micro-economic conditions are also considered when calculating the current reserve. Probable outcomes of pending litigation, whether favorable or unfavorable to the Companies, are also included in the consideration.
Starting in 2020, the potential economic impact of the COVID-19 pandemic was also considered in forward-looking projections related to write-off and recovery rates and resulted in increases to the allowance for uncollectible accounts. The increases to the allowance for customer uncollectible accounts for Con Edison and CECONY were $5$38 million and $10$39 million, respectively, for the year ended December 31, 2022. 2023.The increases to the allowance for uncollectible accounts for Con Edison and CECONY were $169$5 million and $166$10 million for the year ended December 31, 2021.2022.
Customer accounts receivable and the associated allowance for uncollectible accounts are included in the line “Accounts receivable – customers” on the Companies’ consolidated balance sheets. Other receivables and the associated allowance for uncollectible accounts are included in “Other receivables” on the consolidated balance sheets.
The table below presents a rollforward by major portfolio segment type for the years ended December 31, 2023, 2022 and 2021:
| | | | | |
CON EDISON ANNUAL REPORT 20222023 | 175155 |
| | For the Year Ended December 31, |
| Con Edison | CECONY |
| Accounts receivable - customers | Other receivables | Accounts receivable - customers | Other receivables |
| For the Year Ended December 31, | | | For the Year Ended December 31, |
| Con Edison | | | Con Edison | CECONY |
| Accounts receivable - customers | | | Accounts receivable - customers | Other receivables | Accounts receivable - customers | Other receivables |
| (Millions of Dollars) | (Millions of Dollars) | 2022 | 2021 | 2022 | 2021 | 2022 | 2021 | 2022 | 2021 | (Millions of Dollars) | 2023 | 2022 | 2021 | 2023 | 2022 | 2021 | 2023 | 2022 | 2021 | 2023 | 2022 | 2021 |
| Allowance for credit losses | Allowance for credit losses | | | |
| Beginning Balance at January 1, | |
| Beginning Balance at January 1, | |
| Beginning Balance at January 1, | Beginning Balance at January 1, | $317 | $148 | $22 | $7 | $304 | $138 | $19 | $4 | $322 | $317 | $148 | $10 | $22 | $7 | $314 | $304 | $138 | $7 | $19 | $4 |
| Recoveries | Recoveries | 17 | 14 | — | | 1 | 16 | 12 | — | | 1 | Recoveries | 14 | 17 | 14 | — | 1 | 12 | 16 | 12 | — | 1 |
| Write-offs | Write-offs | (103) | (91) | (6) | (2) | (94) | (86) | (4) | (1) | Write-offs | (138) | (103) | (91) | (5) | (6) | (2) | (131) | (94) | (86) | (3) | (4) | (1) |
| Reserve adjustments | Reserve adjustments | 91 | 246 | (6) | 16 | 88 | 240 | (8) | 15 | Reserve adjustments | 162 | 91 | 246 | 8 | (6) | 16 | 158 | 88 | 240 | 5 | (8) | 15 |
| Ending Balance December 31, | Ending Balance December 31, | $322 | $317 | $10 | $22 | $314 | $304 | $7 | $19 | Ending Balance December 31, | $360 | $322 | $317 | $13 | $10 | $22 | $353 | $314 | $304 | $9 | $7 | $19 |
| | | | | |
176
|
CON EDISON ANNUAL REPORT 2022 |
Note O – Stock-Based Compensation
The Companies may compensate employees and directors with, among other things, stock options, stock units, restricted stock units and contributions to the stock purchase plan. The Long Term Incentive Plan, which wasPlans that were approved by Con Edison’s shareholders in 2003 (2003 LTIP), and the Long Term Incentive Plan, which was approved by Con Edison’s shareholders in 2013 (2013 LTIP), and 2023 (2023 LTIP) are collectively referred to herein as the LTIP. The LTIP provides for, among other things, awards to employees of restricted stock units and stock options and, to Con Edison’s non-employee directors, stock units. Existing awards under the 2003 LTIP and the 2013 LTIP continue in effect, however no new awards may be issued under the 2003 LTIP.either plan. The 20132023 LTIP provides for awards for up to fiveten million shares of common stock.
During the years ended December 31, 2023, 2022, 2021, and 2020,2021, equity awards were granted under the 2013 LTIP. Shares of Con Edison common stock used to satisfy the Companies’ obligations with respect to stock-based compensation may be new shares (authorized, but unissued) or treasury shares (existing treasury shares or shares purchased in the open market). The shares used during the year ended December 31, 20222023 were new shares. The Companies intend to use new shares to fulfill their stock-based compensation obligations for 2023.2024.
The Companies recognized stock-based compensation expense using a fair value measurement method. The following table summarizes stock-based compensation expense recognized by the Companies in the years ended December 31, 2023, 2022 2021 and 2020:2021:
| | | | Con Edison | | CECONY | | Con Edison | | CECONY |
| (Millions of Dollars) | (Millions of Dollars) | 2022 | | 2021 | | 2020 | | 2022 | | 2021 | | 2020 | (Millions of Dollars) | 2023 | | 2022 | | 2021 | | 2023 | | 2022 | | 2021 |
| Performance-based restricted stock | Performance-based restricted stock | $52 | | $23 | | $7 | | $43 | | $19 | | $6 | Performance-based restricted stock | $41 | | $52 | | $23 | | $36 | | $43 | | $19 |
| Time-based restricted stock | Time-based restricted stock | 2 | | 2 | | 1 | | 2 | | 2 | | 1 | Time-based restricted stock | 2 | | 2 | | 2 | | 2 |
| Non-employee director deferred stock compensation | Non-employee director deferred stock compensation | 3 | | 3 | | 2 | | 3 | | 3 | | 2 | Non-employee director deferred stock compensation | 3 | | 3 | | 3 | | 3 |
| Stock purchase plan | Stock purchase plan | 7 | | 7 | | 7 | | 6 | | 7 | | 7 | Stock purchase plan | 7 | | 7 | | 7 | | 6 | | 7 |
| Total | Total | $64 | | $35 | | $17 | | $54 | | $31 | | $16 | Total | $53 | | $64 | | $35 | | $48 | | $54 | | $31 |
| Income tax benefit | Income tax benefit | $18 | | $10 | | $5 | | $15 | | $9 | | $4 | Income tax benefit | $15 | | $18 | | $10 | | $13 | | $15 | | $9 |
Restricted Stock and Stock Units
Restricted stock and stock unit awards under the LTIP have been made as follows: (i) awards that provide for adjustment of the number of units (performance-restricted stock units or Performance RSUs) to certain officers and employees; (ii) time-based awards to certain officers and employees; and (iii) awards to non-employee directors. Restricted stock and stock units awarded represent the right to receive, upon vesting, shares of Con Edison common stock, or, except for units awarded under the directors’ plan, the cash value of shares or a combination thereof.
The number of units in each annual Performance RSU award is subject to adjustment as follows: (i) 50 percent of the units awarded will be multiplied by a factor that may range from 0 to 200 percent, based on Con Edison’s total shareholder return relative to a specified peer group during a specified performance period (the TSR portion); and (ii) 50 percent of the units awarded will be multiplied by factors that may range from 0 to 200 percent, based on
| | | | | |
156 | CON EDISON ANNUAL REPORT 2023 |
determinations made in connection with the Companies’ annual incentive plans or, with respect to certain executive officers, actual performance as compared to certain performance measures during a specified performance period (the non-TSR portion). Performance RSU awards generally vest upon completion of the performance period.
Performance against the established targets is recomputed each reporting period as of the earlier of the reporting date and the vesting date. The TSR portion applies a Monte Carlo simulation model, and the non-TSR portion is the product of the market price at the end of the period and the average non-TSR determination over the vesting period. Performance RSUs are “liability awards” because each Performance RSU represents the right to receive, upon vesting, one share of Con Edison common stock, the cash value of a share or a combination thereof. As such, changes in the fair value of the Performance RSUs are reflected in net income. The assumptions used to calculate the fair value of the awards were as follows:
| | | | | |
CON EDISON ANNUAL REPORT 2022 | 177 |
| | 2022 | | 2021 | | 2020 |
| 2023 | | | 2023 | | 2022 | | 2021 |
| Risk-free interest rate (a) | Risk-free interest rate (a) | 4.41% - 4.73% | | 0.39% - 0.73% | | 0.10% -0.13% | Risk-free interest rate (a) | 4.06% - 4.64% | | 4.41% - 4.73% | | 0.39% -0.73% |
| Expected term (b) | Expected term (b) | 3 years | | 3 years | | 3 years | Expected term (b) | 3 years | | 3 years |
| Expected share price volatility (c) | Expected share price volatility (c) | 19.65% - 21.77% | | 17.25% - 31.42% | | 30.16% - 40.95% | Expected share price volatility (c) | 17.88% - 19.92% | | 19.65% - 21.77% | | 17.25% - 31.42% |
(a)The risk-free rate is based on the U.S. Treasury zero-coupon yield curve.
(b)The expected term of the Performance RSUs equals the vesting period. The Companies do not expect significant forfeitures to occur.
(c)Based on historical experience. The Companies would reevaluate this assumption if market conditions or business developments would reasonably indicate that future volatility might differ materially from historical experience.
A summary of changes in the status of the Performance RSUs’ TSR and non-TSR portions during the year ended December 31, 20222023 is as follows:
| | Con Edison | CECONY |
| Weighted Average Grant Date Fair Value (a) | | Weighted Average Grant Date Fair Value (a) |
| Units | TSR Portion (b) | Non-TSR Portion (c) | Units | TSR Portion (b) | Non-TSR Portion (c) |
| Non-vested at December 31, 2021 | 984,728 | $72.67 | $79.14 | 744,278 | $72.71 | $79.20 |
| Con Edison | | | Con Edison | CECONY |
| | Weighted Average Grant Date Fair Value (a) | | | | Weighted Average Grant Date Fair Value (a) | | Weighted Average Grant Date Fair Value (a) |
| Units | | | Units | TSR
Portion (b) | Non-TSR
Portion (c) | Units | TSR
Portion (b) | Non-TSR
Portion (c) |
| Non-vested at December 31, 2022 | | Non-vested at December 31, 2022 | 865,091 | $80.02 | $80.04 | 647,826 | $79.89 | $80.16 |
| Granted | Granted | 231,600 | 89.90 | 83.76 | 172,003 | 90.25 | 84.32 | Granted | 266,200 | 91.93 | 90.93 | 204,466 | 92.27 | 91.34 |
| Vested | Vested | (320,821) | 64.59 | 80.17 | (240,022) | 65.04 | 80.45 | Vested | (264,568) | 79.69 | 89.62 | (205,078) | 79.40 | 88.75 |
| Forfeited | Forfeited | (30,416) | 80.08 | 77.73 | (28,433) | 80.04 | 77.68 | Forfeited | (28,420) | 86.23 | 82.22 | (8,741) | 85.24 | 81.02 |
| | Non-vested at December 31, 2022 | 865,091 | $80.02 | $80.04 | 647,826 | $79.89 | $80.16 |
| Non-vested at December 31, 2023 | |
| Non-vested at December 31, 2023 | |
| Non-vested at December 31, 2023 | | 838,303 | $83.70 | $80.40 | 638,473 | $83.94 | $80.97 |
(a)The TSR and non-TSR Portions each account for 50 percent of the awards’ value.
(b)Fair value is determined using the Monte Carlo simulation described above. Weighted average grant date fair value does not reflect any accrual or payment of dividends prior to vesting.
(c)Fair value is determined using the market price of one share of Con Edison common stock on the grant date. The market price has not been discounted to reflect that dividends do not accrue and are not payable on Performance RSUs until vesting.
The total expense to be recognized by Con Edison in future periods for unvested Performance RSUs outstanding at December 31, 20222023 is $37$38 million, including $30$34 million for CECONY, and is expected to be recognized over a weighted average period of one year for both Con Edison and CECONY. Con Edison and CECONY paid cash of $21 million and $19 million in 2023, $10 million and $9 million in 2022, and $8 million and $7 million in 2021, and $21 million and $18 million in 2020, respectively, to settle vested Performance RSUs.
In accordance with the accounting rules for stock compensation, for time-based awards, the Companies are accruingaccrue a liability and recognizingrecognize compensation expense based on the market value of a common share throughout the vesting period. The vesting period for awards is three years and is based on the officer or employee’s continuous service to Con Edison. Prior to vesting, the awards are subject to forfeiture in whole or in part under certain circumstances. The awards are “liability awards” because each restricted stock unit represents the right to receive, upon vesting, one share of Con Edison common stock, the cash value of a share or a combination thereof. As such, prior to vesting, changes in the fair value of the units are reflected in net income.
A summary of changes in the status of time-based awards during the year ended December 31, 20222023 is as follows:
| | | | | | | | | | | | | | | | | | | | | | | |
| Con Edison | | CECONY |
| Units | | Weighted Average Grant Date Fair Value | | Units | | Weighted Average Grant Date Fair Value |
| Non-vested at December 31, 2021 | 61,620 | | $79.68 | | 57,870 | | $79.70 |
| Granted | 149,650 | | 86.59 | | 118,458 | | 87.46 |
| Vested | (22,450) | | 84.81 | | (21,200) | | 84.81 |
| Forfeited | (8,232) | | 81.51 | | (7,713) | | 81.54 |
| Non-vested at December 31, 2022 | 180,588 | | $84.69 | | 147,415 | | $85.10 |
| | | | | |
| CON EDISON ANNUAL REPORT 2023 | 157 |
| | | | | | | | | | | | | | | | | | | | | | | |
| Con Edison | | CECONY |
| Units | | Weighted Average Grant Date
Fair Value | | Units | | Weighted Average Grant Date
Fair Value |
| Non-vested at December 31, 2022 | 180,588 | | $84.69 | | 147,415 | | $85.10 |
| Granted | 198,600 | | 92.93 | | 166,539 | | 93.38 |
| Vested | (19,950) | | 78.00 | | (18,550) | | 78.00 |
| Forfeited | (14,037) | | 87.26 | | (6,341) | | 88.47 |
| Non-vested at December 31, 2023 | 345,201 | | $89.71 | | 289,063 | | $90.25 |
The total expense to be recognized by Con Edison in future periods for unvested time-based awards outstanding at December 31, 20222023 is $9$12 million, including $8$12 million for CECONY, and is expected to be recognized over a
| | | | | |
178
|
CON EDISON ANNUAL REPORT 2022 |
weighted average period of one year.two years. Con Edison and CECONY paid cash of $2 million in 2023 and 2022, and $1 million in 2021, and 2020, to settle vested time-based awards.
Under the LTIP, each non-employee director receives stock units, which are deferred until the director’s separation from service or another date specified by the director. Each director may also elect to defer all or a portion of their cash compensation into additional stock units, which are deferred until the director’s termination of service or another date specified by the director. Non-employee directors’ stock units issued under the LTIP are considered “equity awards,” because they may only be settled in shares. Directors immediately vest in units issued to them. The fair value of the units is determined using the closing price of Con Edison’s common stock on the business day immediately preceding the date of issue. In the year ended December 31, 2022,2023, approximately 31,00029,000 units were issued at a weighted average grant date price of $93.60.$94.78.
Stock Purchase Plan
The Stock Purchase Plan,Plans, which waswere approved by shareholders in 2004 and 2014 provides(collectively, the Plan), provide for the Companies to contribute up to $1 for each $9 invested by their directors, officers or employees to purchase Con Edison common stock under the plan.Plan. Eligible participants may invest up to $25,000 during any calendar year (subject to an additional limitation for officers and employees of not more than 20 percent of their pay). Dividends paid on shares held under the planPlan are reinvested in additional shares unless otherwise directed by the participant.
Participants in the planPlan immediately vest in shares purchased by them under the plan.Plan. Prior to September 1, 2020, the fair value of the shares of Con Edison common stock purchased under the planPlan was calculated using the average of the high and low composite sale prices at which shares were traded at the New York Stock Exchange on the trading day immediately preceding such purchase dates. During 2020, the planPlan was amended and as a result of the amendment, the fair value of the shares of Con Edison common stock purchased after September 1, 2020 under the planPlan was calculated using the closing price at which shares were traded on the New York Stock Exchange on the last business day of the month for all shares purchased during the month. During 2023, 2022 and 2021, 751,702, 744,932 and 2020, 744,932, 957,866 and 836,984 shares were purchased under the Stock Purchase Plan at a weighted average price of $91.80, $91.59 $73.38 and $79.82$73.38 per share, respectively.
| | | | | |
CON EDISON ANNUAL REPORT 2022 | 179 |
Note P – Financial Information by Business Segment
The business segments of each of the Companies, which are its operating segments, were determined based on management’s reporting and decision-making requirements in accordance with the accounting rules for segment reporting.
Con Edison’s principal business segments are CECONY’s regulated utility activities, O&R’s regulated utility activities the Clean Energy Businesses and Con Edison Transmission. CECONY’s principal business segments are its regulated electric, gas and steam utility activities.
All revenues of these business segments are from customers located in the United States of America. Also, all assets of the business segments are located in the United States of America. The accounting policies of the segments are the same as those described in Note A.
| | | | | |
158 | CON EDISON ANNUAL REPORT 2023 |
Common services shared by the business segments are assigned directly or allocated based on various cost factors, depending on the nature of the service provided.
The financial data for the business segments are as follows:
| | | | | | | | | | | | | | | | | | | | | | | | | | | | | | | | |
As of and for the Year Ended December 31, 2022 (Millions of Dollars) | Operating revenues | Inter- segment revenues | Depreciation and amortization | Operating income | Other Income (deductions) | Interest charges | Income taxes on operating income (a) | Total assets | | Capital expenditures |
| CECONY | | | | | | | | | | |
| Electric | $9,751 | $19 | $1,315 | $1,496 | $259 | $582 | $138 | $39,153 | | $2,522 |
| Gas | 2,924 | 8 | 367 | 660 | 52 | 198 | 141 | 15,361 | | 1,128 |
| Steam | 593 | 76 | 96 | (21) | 21 | 42 | (18) | 2,931 | | 108 |
| Consolidation adjustments | — | | (103) | — | | — | | — | | — | | — | | — | | | — | |
| Total CECONY | $13,268 | $— | | $1,778 | $2,135 | $332 | $822 | $261 | $57,445 | | $3,758 |
| O&R | | | | | | | | | | |
| Electric | $773 | $— | | $71 | $94 | $17 | $29 | $17 | $2,247 | | $167 |
| Gas | 312 | — | | 27 | 42 | 6 | 17 | 8 | 1,264 | | 76 |
| Other | — | | — | | — | | — | | — | | — | | — | | — | | | — | |
| Total O&R | $1,085 | $— | | $98 | $136 | $23 | $46 | $25 | $3,511 | | $243 |
| Clean Energy Businesses | $1,319 | $— | | $178 | $368 | $3 | $(35) | $84 | $7,224 | (b) | $399 |
| Con Edison Transmission | 4 | — | | 1 | (10) | 19 | 5 | 1 | 314 | | 65 |
| Other (c) | (6) | — | | 1 | (5) | (51) | 14 | 51 | 571 | | — | |
| Total Con Edison | $15,670 | $— | | $2,056 | $2,624 | $326 | $852 | $422 | $69,065 | | $4,465 |
| | | | | | | | | | | | | | | | | | | | | | | | | | | | | | | | |
As of and for the Year Ended December 31, 2021 (Millions of Dollars) | Operating revenues | Inter- segment revenues | Depreciation and amortization | Operating income | Other Income (deductions) | Interest charges | Income taxes on operating income (a) | Total assets | | Capital expenditures |
| CECONY | | | | | | | | | | |
| Electric | $8,806 | $18 | $1,286 | $1,802 | $(84) | $542 | $151 | $36,260 | | $2,189 |
| Gas | 2,378 | 8 | 326 | 646 | (16) | 179 | 110 | 13,748 | | 1,126 |
| Steam | 532 | 74 | 93 | 12 | (8) | 41 | (9) | 2,647 | | 103 |
| Consolidation adjustments | — | | (100) | — | | — | | — | | — | | — | | — | | | — | |
| Total CECONY | $11,716 | $— | | $1,705 | $2,460 | $(108) | $762 | $252 | $52,655 | | $3,418 |
| O&R | | | | | | | | | | |
| Electric | $681 | $— | | $69 | $100 | $(8) | $27 | $13 | $2,123 | | $147 |
| Gas | 260 | — | | 26 | 50 | (4) | 15 | 8 | 1,169 | | 70 |
| Other | — | | — | | — | | — | | — | | — | | — | | — | | | — | |
| Total O&R | $941 | $— | | $95 | $150 | $(12) | $42 | $21 | $3,292 | | $217 |
| Clean Energy Businesses | $1,022 | $— | | $231 | $236 | $(10) | $68 | $44 | $6,554 | (b) | $298 |
| Con Edison Transmission | 4 | — | | 1 | (16) | (407) | 9 | 3 | | 249 | | 31 |
| Other (c) | (7) | — | | — | | (4) | (1) | 24 | 20 | 366 | | — | |
| Total Con Edison | $13,676 | $— | | $2,032 | $2,826 | $(538) | $905 | $340 | $63,116 | | $3,964 |
| | | | | | | | | | | | | | | | | | | | | | | | | | | | | | |
As of and for the Year Ended December 31, 2023 (Millions of Dollars) | Operating revenues | Inter- segment revenues | Depreciation and amortization | Operating income | Other Income (deductions) | Interest charges | Income Tax Expense | Total assets | | Capital expenditures |
| CECONY | | | | | | | | | | |
| Electric | $10,078 | $18 | $1,395 | $1,568 | $564 | $674 | $217 | $42,226 | | $2,909 |
| Gas | 2,829 | 8 | 429 | 682 | 122 | 227 | 159 | 16,343 | | 1,046 |
| Steam | 569 | 74 | 100 | (73) | 46 | 44 | (18) | 3,031 | | 128 |
| Consolidation adjustments | — | (100) | — | — | — | — | — | — | | — |
| Total CECONY | $13,476 | $— | $1,924 | $2,177 | $732 | $945 | $358 | $61,600 | | $4,083 |
| O&R | | | | | | | | | | |
| Electric | $759 | $— | $76 | $85 | $37 | $32 | $20 | $2,329 | | $211 |
| Gas | 297 | — | 30 | 41 | 12 | 19 | 8 | 1,346 | | 85 |
| | | | | | | | | | |
| Total O&R | $1,056 | $— | | $106 | $126 | $49 | $51 | $28 | $3,675 | | $296 |
| Clean Energy Businesses (a) | $129 | $— | $— | $37 | $1 | $16 | $3 | $— | | $81 |
| Con Edison Transmission | 4 | — | 1 | (9) | 62 | 2 | 14 | 414 | | 49 |
| Other (b) | (2) | — | — | 865 | (14) | 9 | 84 | 642 | | — |
| Total Con Edison | $14,663 | $— | $2,031 | $3,196 | $830 | $1,023 | $487 | $66,331 | | $4,509 |
| | | | | | | | | | | | | | | | | | | | | | | | | | | | | | |
As of and for the Year Ended December 31, 2022 (Millions of Dollars) | Operating revenues | Inter- segment revenues | Depreciation and amortization | Operating income | Other Income (deductions) | Interest charges | Income Tax Expense | Total assets | | Capital expenditures |
| CECONY | | | | | | | | | | |
| Electric | $9,751 | $19 | $1,315 | $1,496 | $259 | $582 | $134 | $39,153 | | $2,522 |
| Gas | 2,924 | 8 | 367 | 660 | 52 | 198 | 140 | 15,361 | | 1,128 |
| Steam | 593 | 76 | 96 | (21) | 21 | 42 | (19) | 2,931 | | 108 |
| Consolidation adjustments | — | (103) | — | — | — | — | — | — | | — |
| Total CECONY | $13,268 | $— | $1,778 | $2,135 | $332 | $822 | $255 | $57,445 | | $3,758 |
| O&R | | | | | | | | | | |
| Electric | $773 | $— | $71 | $94 | $17 | $29 | $17 | $2,247 | | $167 |
| Gas | 312 | — | 27 | 42 | 6 | 17 | 8 | 1,264 | | 76 |
| | | | | | | | | | |
| Total O&R | $1,085 | $— | $98 | $136 | $23 | $46 | $25 | $3,511 | | $243 |
| Clean Energy Businesses (a) | $1,319 | $— | $178 | $368 | $3 | $(35) | $84 | $7,224 | | $399 |
| Con Edison Transmission | 4 | — | 1 | (10) | 19 | 5 | 5 | 314 | | 65 |
| Other (b) | (6) | — | 1 | (5) | (51) | 14 | 129 | 571 | | — |
| Total Con Edison | $15,670 | $— | $2,056 | $2,624 | $326 | $852 | $498 | $69,065 | | $4,465 |
| | | | | |
180
|
20222023 | 159 |
| As of and for the Year Ended December 31, 2020 (Millions of Dollars) | Operating
revenues | Inter-
segment
revenues | Depreciation
and
amortization | Operating
income | Other Income (deductions) | Interest
charges | Income
taxes on
operating
income (a) | Total
assets | | Capital
expenditures |
As of and for the Year Ended December 31, 2021 (Millions of Dollars) | |
As of and for the Year Ended December 31, 2021 (Millions of Dollars) | |
As of and for the Year Ended December 31, 2021 (Millions of Dollars) | | Operating
revenues | Inter-
segment
revenues | Depreciation
and
amortization | Operating
income | Other Income (deductions) | Interest
charges | Income Tax Expense | Total
assets | | Capital
expenditures |
| CECONY | CECONY | |
| Electric | |
| Electric | |
| Electric | Electric | $8,103 | $18 | $1,214 | $1,731 | $(134) | $535 | $130 | $35,673 | | $2,080 | $8,806 | $18 | $1,286 | $1,802 | $(84) | $542 | $146 | $36,260 | | $2,189 |
| Gas | Gas | 2,036 | 7 | 294 | 574 | (25) | 164 | 102 | 12,678 | | 1,044 | Gas | 2,378 | 8 | 326 | 646 | (16) | 179 | 109 | 13,748 | | 1,126 |
| Steam | Steam | 508 | 74 | 90 | 5 | (12) | 40 | (14) | 2,616 | | 122 | Steam | 532 | 74 | 93 | 12 | (8) | 41 | (9) | 2,647 | | 103 |
| Consolidation adjustments | Consolidation adjustments | — | | (99) | — | | — | | — | | — | | — | | — | | | — | | Consolidation adjustments | — | (100) | — | | — |
| Total CECONY | Total CECONY | $10,647 | $— | | $1,598 | $2,310 | $(171) | $739 | $218 | $50,967 | | $3,246 | Total CECONY | $11,716 | $— | $1,705 | $2,460 | $(108) | $762 | $246 | $52,655 | | $3,418 |
| O&R | O&R | |
| Electric | Electric | $629 | $— | | $65 | $99 | $(10) | $26 | $13 | $2,097 | | $159 |
| Electric | |
| Electric | | $681 | $— | $69 | $100 | $(8) | $27 | $14 | $2,123 | | $147 |
| Gas | Gas | 233 | — | | 25 | 48 | (4) | 15 | 8 | 1,150 | | 61 | Gas | 260 | — | 26 | 50 | (4) | 15 | 7 | 1,169 | | 70 |
| Other | — | | — | | — | | — | | — | | — | | — | | — | | | — | |
| | Total O&R | Total O&R | $862 | $— | | $90 | $147 | $(14) | $41 | $21 | $3,247 | | $220 |
| Clean Energy Businesses | $736 | $— | | $231 | $215 | $4 | $196 | $(43) | $6,848 | (b) | $616 |
| Total O&R | |
| Total O&R | | $941 | $— | $95 | $150 | $(12) | $42 | $21 | $3,292 | | $217 |
| Clean Energy Businesses (a) | | Clean Energy Businesses (a) | $1,022 | $— | $231 | $236 | $(10) | $68 | $44 | $6,554 | | $298 |
| Con Edison Transmission | Con Edison Transmission | 4 | — | | 1 | (8) | $ | (215) | | 18 | — | | 1,348 | | 3 | Con Edison Transmission | 4 | — | 1 | (16) | (407) | 9 | (114) | 249 | | 31 |
| Other (c) | (3) | — | | — | | (10) | (5) | 25 | (3) | 485 | | — | |
| Other (b) | | Other (b) | (7) | — | (4) | (1) | 24 | (7) | 366 | | — |
| Total Con Edison | Total Con Edison | $12,246 | $— | | $1,920 | $2,654 | $(401) | $1,019 | $193 | $62,895 | | $4,085 | Total Con Edison | $13,676 | $— | $2,032 | $2,826 | $(538) | $905 | $190 | $63,116 | | $3,964 |
(a)For Con Edison, the income tax expense/(benefit) on non-operating income was $76 million, $(150) million and $(103) million in 2022, 2021 and 2020, respectively. For CECONY, the income tax expense/(benefit) on non-operating income was $(6) million, $(6) million and $(3) million in 2022, 2021 and 2020, respectively.
(b)The Clean Energy Businesses were classified as held for sale as of December 31, 2022. On March 1, 2023, Con Edison completed the sale of all of the stock of the Clean Energy Businesses. As a result of this sale, the Clean Energy Businesses are no longer a principal segment. See "Assets and Liabilities Held for Sale" in Note AW and Note X.
(c)(b)ParentOther includes the parent company, Con Edison’s tax equity investments, the deferred project held for sale and consolidation adjustments. Other does not represent a business segment.
| | | | | |
CON EDISON ANNUAL REPORT 2022 | 181 |
Note Q – Derivative Instruments and Hedging Activities
Con Edison’s subsidiaries hedge market price fluctuations associated with physical purchases and sales of electricity, natural gas, steam and, to a lesser extent, refined fuels by using derivative instruments including futures, forwards, basisbasis swaps, options, transmission congestion contracts and financial transmission rights contracts. These are economic hedges, for which the Utilities and the Clean Energy Business do not elect hedge accounting. The Companies use economic hedges to manage commodity price risk in accordance with provisions set by state regulators. The volume of hedging activity at the Utilities is dependentdepends upon the forecasted volume of physical commodity supply to meet customer needs, and program costs or benefits are recovered from or credited to full-service customers, respectively. See "Recoverable Energy Costs" in Note A. The Clean Energy Businesses use interest rate swaps to manage the risks associated with interest rates related to outstanding and expected future debt issuances and borrowings. Derivatives are recognized on the consolidated balance sheet at fair value (see Note R), unless an exception is available under the accounting rules for derivatives and hedging. Qualifying derivative contracts that have been designated as normal purchases or normal sales contracts are not reported at fair value under the accounting rules. TheOn March 1, 2023, Con Edison completed the sale of all of the stock of the Clean Energy Businesses were classified as held for sale as of December 31, 2022.Businesses. See "Assets and Liabilities Held for Sale" in Note AW and Note X.
| | | | | |
160 | CON EDISON ANNUAL REPORT 2023 |
The fair values of the Companies’ derivatives, including the offsetting of assets and liabilities, on the consolidated balance sheet at December 31, 20222023 and 20212022 were:
| | (Millions of Dollars) | (Millions of Dollars) | 2022 | | 2021 | |
| Balance Sheet Location | Balance Sheet Location | Gross Amounts of Recognized Assets/ (Liabilities) | Gross Amounts Offset | Net Amounts of Assets/(Liabilities) (a) | | Gross Amounts of Recognized Assets/ (Liabilities) | Gross Amounts Offset | Net Amounts of Assets/(Liabilities) (a) | |
| Balance Sheet Location | |
| Balance Sheet Location | |
| Con Edison | |
| Con Edison | |
| Con Edison | Con Edison | | | |
| Fair value of derivative assets | Fair value of derivative assets | | | |
| Fair value of derivative assets | |
| Fair value of derivative assets | |
| Current | |
| Current | |
| Current | Current | $378 | $(332) | $46 | (b) | $285 | $(158) | $127 | (b)(d) | $83 | $(38) | $45 | (b) | $378 | $(332) | $46 | (b) |
| Noncurrent | Noncurrent | 193 | | (108) | | 85 | | 90 | | (13) | | 77 | | |
| Total fair value of derivative assets held and used | Total fair value of derivative assets held and used | $571 | $(440) | $131 | | $375 | $(171) | $204 | |
| Current - assets held for sale (e) | 93 | (8) | | 85 | (c) | — | | — | | — | | |
| Noncurrent - assets held for sale (e) | 83 | 11 | 94 | (c) | — | — | |
| Total fair value of derivative assets held and used | |
| Total fair value of derivative assets held and used | |
| Current - assets held for sale (d) | |
| Current - assets held for sale (d) | |
| Current - assets held for sale (d) | | — | | 93 | | (8) | | 85 | | (c) |
| Noncurrent - assets held for sale (d) | | Noncurrent - assets held for sale (d) | — | | 83 | 11 | 94 | (c) |
| Total fair value of derivative assets | Total fair value of derivative assets | $747 | $(437) | $310 | | $375 | $(171) | $204 | |
| Fair value of derivative liabilities | Fair value of derivative liabilities | | | |
| Fair value of derivative liabilities | |
| Fair value of derivative liabilities | |
| Current | |
| Current | |
| Current | Current | $(198) | $166 | $(32) | (b) | $(289) | $137 | $(152) | | $(230) | $52 | $(178) | (b) | $(198) | $166 | $(32) | (b) |
| Noncurrent | Noncurrent | (49) | 36 | (13) | | (94) | 10 | (84) | (d) |
| Total fair value of derivative liabilities held and used | Total fair value of derivative liabilities held and used | $(247) | $202 | $(45) | | $(383) | $147 | $(236) | |
| Current - liabilities held for sale (e) | (31) | | 6 | | (25) | | — | | — | | — | | |
| Noncurrent - liabilities held for sale (e) | (3) | (8) | (11) | | — | — | |
| Total fair value of derivative liabilities held and used | |
| Total fair value of derivative liabilities held and used | |
| Current - liabilities held for sale (d) | |
| Current - liabilities held for sale (d) | |
| Current - liabilities held for sale (d) | |
| Noncurrent - liabilities held for sale (d) | |
| Noncurrent - liabilities held for sale (d) | |
| Noncurrent - liabilities held for sale (d) | |
| Total fair value of derivative liabilities | |
| Total fair value of derivative liabilities | |
| Total fair value of derivative liabilities | Total fair value of derivative liabilities | $(281) | $200 | $(81) | | $(383) | $147 | $(236) | |
| Net fair value derivative assets/(liabilities) | Net fair value derivative assets/(liabilities) | $466 | $(237) | $229 | | $(8) | $(24) | $(32) | |
| Net fair value derivative assets/(liabilities) | |
| Net fair value derivative assets/(liabilities) | |
| CECONY | |
| CECONY | |
| CECONY | CECONY | | | |
| Fair value of derivative assets | Fair value of derivative assets | | | |
| Fair value of derivative assets | |
| Fair value of derivative assets | |
| Current | |
| Current | |
| Current | Current | $350 | $(312) | $38 | (b) | $135 | $(64) | $71 | (b) | $78 | $(35) | $43 | (b) | $350 | $(312) | $38 | (b) |
| Noncurrent | Noncurrent | 176 | (96) | 80 | | 71 | (15) | 56 | |
| Total fair value of derivative assets | Total fair value of derivative assets | $526 | $(408) | $118 | | $206 | $(79) | $127 | |
| Total fair value of derivative assets | |
| Total fair value of derivative assets | |
| Fair value of derivative liabilities | |
| Fair value of derivative liabilities | |
| Fair value of derivative liabilities | Fair value of derivative liabilities | | | |
| Current | Current | $(189) | $160 | $(29) | | $(131) | $43 | $(88) | |
| Current | |
| Current | |
| Noncurrent | |
| Noncurrent | |
| Noncurrent | Noncurrent | (43) | 34 | (9) | | (50) | 10 | (40) | |
| Total fair value of derivative liabilities | Total fair value of derivative liabilities | $(232) | $194 | $(38) | | $(181) | $53 | $(128) | |
| Total fair value of derivative liabilities | |
| Total fair value of derivative liabilities | |
| Net fair value derivative assets/(liabilities) | Net fair value derivative assets/(liabilities) | $294 | ($214) | | $80 | | $25 | $(26) | $(1) | |
| Net fair value derivative assets/(liabilities) | |
| Net fair value derivative assets/(liabilities) | |
(a)Derivative instruments and collateral were offset on the consolidated balance sheet as applicable under the accounting rules. The Companies enter into master agreements for their commodity derivatives. These agreements typically provide offset in the event of contract termination. In such case, generally the non-defaulting party’s payable will be offset by the defaulting party’s payable. The non-defaulting party will customarily notify the defaulting party within a specific time period and come to an agreement on the early termination amount.
| | | | | |
182
|
CON EDISON ANNUAL REPORT 2022 |
(b)At December 31, 2023, margin deposits for Con Edison and CECONY of $7 million and $6 million, respectively were classified as derivative assets and $(15) million and $(10) million, respectively were classified as derivative liabilities on the consolidated balance sheet, but not included in the table. At December 31, 2022, margin deposits for Con Edison and CECONY of $13 million were classified as derivative assets, and ($(10)$(10) million and $(6) million, respectively)respectively were classified as derivative liabilities on the consolidated balance sheet, but not included in the table. At December 31, 2021, margin deposits for Con Edison and CECONY ($1 million and an immaterial amount, respectively) were classified as derivative assets on the consolidated balance sheet, but not included in the table. Margin is collateral, typically cash, that the holder of a derivative instrument is required to deposit in order to transact on an exchange and to cover its potential losses with its broker or the exchange.
(c)Includes amounts for interest rate swaps of $31 million in current assets and $75 million in noncurrent assets. At December 31, 2022, the Clean Energy Businesses had interest rate swaps with notional amounts of $982 million. The expiration dates of the swaps rangeranged from 2025-2041.
(d)Includes amounts for interest rate swaps of $4 million in noncurrent assets, $(20) million in current liabilities and $(38) million in noncurrent liabilities. At December 31, 2021, the Clean Energy Businesses had interest rate swaps with notional amounts of $1,031 million. The expiration dates of the swaps ranged from 2025-2041.
(e)Amounts represent derivative assets and liabilities included in current assets and current liabilities held for sale, respectively, on Con Edison's consolidated balance sheet as of December 31, 2022. On March 1, 2023, Con Edison completed the sale of all of the stock of the Clean Energy Businesses. See "Assets and Liabilities Held for Sale" in Note AW and Note X.
The Utilities generally recover their prudently incurred fuel, purchased power and gas costs, including hedging gains and losses, in accordance with rate provisions approved by the applicable state utility regulators. See "Recoverable Energy Costs" in Note A. In accordance with the accounting rules for regulated operations, the Utilities record a regulatory asset or regulatory liability to defer recognition of unrealized gains and losses on their electric and gas derivatives. As gains and losses are realized in future periods, they will be recognized as purchased power, gas and fuel costs in the Companies’ consolidated income statements.
| | | | | |
| CON EDISON ANNUAL REPORT 2023 | 161 |
The Clean Energy Businesses recordrecorded realized and unrealized gains and losses on their derivative contracts in gas purchased for resale and non-utility revenue in the reporting period in which they occur.occurred. The Clean Energy Businesses recordrecorded changes in the fair value of their interest rate swaps in other interest expense at the end of each reporting period. Management believes that these derivative instruments represent economic hedges that mitigate exposure to fluctuations in commodity prices and interest rates. TheOn March 1, 2023, Con Edison completed the sale of all of the stock of the Clean Energy Businesses were classified as held for sale as of December 31, 2022.Businesses. See "Assets and Liabilities Held for Sale" in Note AW and Note X.
The following table presents the realized and unrealized gains or losses on derivatives that have been deferred or recognized in earnings for the years ended December 31, 20222023 and 2021:2022:
| | Con Edison | | CECONY | |
| | Con Edison | |
| (Millions of Dollars) | |
| (Millions of Dollars) | |
| (Millions of Dollars) | (Millions of Dollars) | Balance Sheet Location | 2022 | | 2021 | | 2022 | | 2021 | |
| Pre-tax gains/(losses) deferred in accordance with accounting rules for regulated operations: | Pre-tax gains/(losses) deferred in accordance with accounting rules for regulated operations: | | | |
| Pre-tax gains/(losses) deferred in accordance with accounting rules for regulated operations: | |
| Pre-tax gains/(losses) deferred in accordance with accounting rules for regulated operations: | |
| Current | |
| Current | |
| Current | Current | Deferred derivative gains | $168 | | $134 | | $155 | | $124 | |
| Noncurrent | Noncurrent | Deferred derivative gains | 83 | | 57 | | 75 | | 51 | |
| Noncurrent | |
| Noncurrent | |
| Total deferred gains/(losses) | |
| Total deferred gains/(losses) | |
| Total deferred gains/(losses) | Total deferred gains/(losses) | $251 | | $191 | | $230 | | $175 | |
| Current | Current | Deferred derivative losses | $(43) | | $49 | | $(44) | | $43 | |
| Current | Current | Recoverable energy costs | 408 | | 3 | | 372 | | — | | |
| Current | |
| Current | |
| Current | |
| Current | |
| Noncurrent | Noncurrent | Deferred derivative losses | 19 | | 70 | | 19 | | 66 | |
| Total deferred gains/(losses) | $384 | | $122 | | $347 | | $109 | |
| Net deferred gains/(losses) | $635 | | $313 | | $577 | | $284 | |
| Income Statement Location | | | |
| Noncurrent | |
| Noncurrent | |
| Total deferred or recognized gains/(losses) | |
| Total deferred or recognized gains/(losses) | |
| Total deferred or recognized gains/(losses) | |
| Net deferred or recognized gains/(losses) (a) | |
| Net deferred or recognized gains/(losses) (a) | |
| Net deferred or recognized gains/(losses) (a) | |
| Income Statement Location | |
| Income Statement Location | |
| Income Statement Location | |
| Pre-tax gain/(loss) recognized in income | Pre-tax gain/(loss) recognized in income | | | |
| Gas purchased for resale | $5 | | $18 | | $— | | | $— | | |
| Non-utility revenue | — | | | 3 | | — | | | — | | |
| Other operations and maintenance expense | 4 | | 5 | | 4 | | 5 | |
| Other interest expense | 159 | (a) | 52 | | — | | | — | | |
| Pre-tax gain/(loss) recognized in income | |
| Pre-tax gain/(loss) recognized in income | |
| Gas purchased for resale | |
| Gas purchased for resale | |
| Gas purchased for resale | |
| Non-utility revenue | |
| Non-utility revenue | |
| Non-utility revenue | |
| Other operations and maintenance expense | |
| Other operations and maintenance expense | |
| Other operations and maintenance expense | |
| Other interest expense (b) | |
| Other interest expense (b) | |
| Other interest expense (b) | |
| Total pre-tax gain/(loss) recognized in income | Total pre-tax gain/(loss) recognized in income | $168 | | $78 | | $4 | | $5 | |
| Total pre-tax gain/(loss) recognized in income | |
| Total pre-tax gain/(loss) recognized in income | |
(a) Unrealized net deferred gains on electric and gas derivatives for the Utilities decreased as a result of lower electric and gas commodity prices during the year ended December 31, 2023. Upon settlement, short-term deferred derivative losses generally increase the recoverable costs of electric and gas purchases.
(b) Comprised of amounts related to interest rate swaps of the Clean Energy Businesses. TheOn March 1, 2023, Con Edison completed the sale of all of the stock of the Clean Energy Businesses were held for sale
as of December 31, 2022.Businesses. See "Assets and Liabilities Held for Sale" in Note AW and Note X.
The following table presents the hedged volume of Con Edison’s and CECONY’s commodity derivative transactions at December 31, 2022:2023:
| | | | | |
CON EDISON ANNUAL REPORT 2022 | 183 |
| | Electric Energy
(MWh) (a)(b) | Capacity (MW) (a) | Natural Gas (Dt) (a)(b) | Refined Fuels (gallons) |
| Electric Energy
(MWh) (a)(b) | | | Electric Energy
(MWh) (a)(b) | Capacity (MW) (a) | Natural Gas (Dt) (a)(b) | Refined Fuels (gallons) |
| Con Edison | Con Edison | 33,546,670 | 46,116 | 290,398,144 | 168,000 | Con Edison | 34,892,535 | 44,400 | 325,690,000 | 3,780,000 |
| CECONY | CECONY | 31,567,400 | 30,675 | 272,790,000 | 168,000 | CECONY | 32,315,225 | 34,500 | 306,700,000 | 3,780,000 |
(a)Volumes are reported net of long and short positions, except natural gas collars where the volumes of long positions are reported.
(b)Excludes electric congestion and gas basis swap contracts which are associated with electric and gas contracts and hedged volumes.
(c)Included are electric energy, capacity, and natural gas ((240) MWh, 8,616 MW, and 3,518,144 Dt, respectively) volumes of the Clean Energy Businesses.
The Companies are exposed to credit risk related to transactions entered into primarily for the various energy supply and hedging activities by the Utilities and the Clean Energy Businesses.Utilities. Credit risk relates to the loss that may result from a counterparty’s nonperformance. The Companies use credit policies to manage this risk, including an established credit approval process, monitoring of counterparty limits, netting provisions within agreements, collateral or prepayment arrangements, credit insurance and credit default swaps. The Companies measure credit risk exposure as the replacement cost for open energy commodity and derivative positions plus amounts owed from counterparties for settled transactions. The replacement cost of open positions represents unrealized gains, net of any unrealized losses where the Companies have a legally enforceable right to offset.
| | | | | |
162 | CON EDISON ANNUAL REPORT 2023 |
At December 31, 2022,2023, Con Edison and CECONY had $703$92 million and $357$90 million of credit exposure in connection with open energy supply net receivables and hedging activities, net of collateral, respectively. Con Edison’s net credit exposure consisted of $174 million with independent system operators and $41$83 million with non-investment grade/non-rated counterparties, (which amounts related entirely to the Clean Energy Businesses), and $353$2 million with investment-grade counterparties, and $133$7 million with commodity exchange brokers of which $50 million and $50 million, respectively, related to the Clean Energy Businesses. The Clean Energy Businesses were classified as held for sale as of December 31, 2022; see "Assets and Liabilities Held for Sale" in Note A and Note X.brokers. CECONY’s net credit exposure consisted of $83 million with commodity exchange brokers and $274non-investment grade/non-rated counterparties, $1 million with investment-grade counterparties.counterparties, and $6 million with commodity exchange brokers.
The collateral requirements associated with, and settlement of, derivative transactions are included in net cash flows from operating activities in the Companies’ consolidated statement of cash flows. Most derivative instrument contracts contain provisions that may require a party to provide collateral on its derivative instruments that are in a net liability position. The amount of collateral to be provided will depend on the fair value of the derivative instruments and the party’s credit ratings.
The following table presents the aggregate fair value of the Companies’ derivative instruments with credit-risk-related contingent features that are in a net liability position, the collateral posted for such positions and the additional collateral that would have been required to be posted had the lowest applicable credit rating been reduced one level and to below investment grade at December 31, 2022:2023:
| | (Millions of Dollars) | (Millions of Dollars) | Con Edison (a) | CECONY (a) | (Millions of Dollars) | Con Edison (a) | CECONY (a) |
| Aggregate fair value – net liabilities | Aggregate fair value – net liabilities | $157 | $86 | Aggregate fair value – net liabilities | $302 | $280 |
| Collateral posted | Collateral posted | 70 | Collateral posted | 280 |
| Additional collateral (b) (downgrade one level from current ratings) | Additional collateral (b) (downgrade one level from current ratings) | 65 | 15 | Additional collateral (b) (downgrade one level from current ratings) | 41 | 24 |
| Additional collateral (b)(c) (downgrade to below investment grade from current ratings) | Additional collateral (b)(c) (downgrade to below investment grade from current ratings) | 138 | 67 | Additional collateral (b)(c) (downgrade to below investment grade from current ratings) | 147 | 117 |
(a)Non-derivative transactions for the purchase and sale of electricity and gas and qualifying derivative instruments, whichthat have been designated as normal purchases or normal sales, are excluded from the table. These transactions primarily include purchases of electricity from independent system operators. In the event the Utilities and the Clean Energy Businesses wereare no longer extended unsecured credit for such purchases, the Companies would be required to post additional collateral of $9$3 million at December 31, 2022.2023. For certain other such non-derivative transactions, the Companies could be required to post collateral under certain circumstances, including in the event counterparties had reasonable grounds for insecurity.
(b)The Companies measure the collateral requirements by taking into consideration the fair value amounts of derivative instruments that contain credit-risk-related contingent features that are in a net liability position plus amounts owed to counterparties for settled transactions and amounts required by counterparties for minimum financial security. The fair value amounts represent unrealized losses, net of any unrealized gains where the Companies have a legally enforceable right to offset.
(c)Derivative instruments that are net assets have been excluded from the table. At December 31, 2022,2023, if Con Edison had been downgraded to below investment grade, it would have been required to post additional collateral for such derivative instruments of $115$16 million.
| | | | | |
184
|
CON EDISON ANNUAL REPORT 2022 |
Note R – Fair Value Measurements
The accounting rules for fair value measurements and disclosures define fair value as the price that would be received to sell an asset or paid to transfer a liability in an orderly transaction between market participants at the measurement date in a principal or most advantageous market. Fair value is a market-based measurement that is determined based on inputs, whichthat refer broadly to assumptions that market participants use in pricing assets or liabilities. These inputs can be readily observable, market corroborated, or generally unobservable firm inputs. The Companies often make certain assumptions that market participants would use in pricing the asset or liability, including assumptions about risk, and the risks inherent in the inputs to valuation techniques. The Companies use valuation techniques that maximize the use of observable inputs and minimize the use of unobservable inputs.
The accounting rules for fair value measurements and disclosures established a fair value hierarchy, whichthat prioritizes the inputs to valuation techniques used to measure fair value in three broad levels. The rules require that assets and liabilities be classified in their entirety based on the level of input that is significant to the fair value measurement. Assessing the significance of a particular input may require judgment considering factors specific to the asset or liability, and may affect the valuation of the asset or liability and their placement within the fair value hierarchy. The Companies classify fair value balances based on the fair value hierarchy defined by the accounting rules for fair value measurements and disclosures as follows:
•Level 1 – Consists of assets or liabilities whose value is based on unadjusted quoted prices in active markets at the measurement date. An active market is one in which transactions for assets or liabilities occur with sufficient frequency and volume to provide pricing information on an ongoing basis. This category includes
| | | | | |
| CON EDISON ANNUAL REPORT 2023 | 163 |
contracts traded on active exchange markets valued using unadjusted prices quoted directly from the exchange.
•Level 2 – Consists of assets or liabilities valued using industry standard models and based on prices, other than quoted prices within Level 1, that are either directly or indirectly observable as of the measurement date. The industry standard models consider observable assumptions including time value, volatility factors and current market and contractual prices for the underlying commodities, in addition to other economic measures. This category includes contracts traded on active exchanges or in over-the-counter markets priced with industry standard models.
•Level 3 – Consists of assets or liabilities whose fair value is estimated based on internally developed models or methodologies using inputs that are generally less readily observable and supported by little, if any, market activity at the measurement date. Unobservable inputs are developed based on the best available information and subject to cost benefit constraints. This category includes contracts priced using models that are internally developed and contracts placed in illiquid markets. It also includes contracts that expire after the period of time for which quoted prices are available and internal models are used to determine a significant portion of the value.
For information on the measurement of Con Edison's investment in MVP, which was measured at fair value on a non-recurring basis, see Note A. Assets and liabilities measured at fair value on a recurring basis for the years ended December 31, 20222023 and 20212022 are summarized below.
| | | | | |
CON EDISON ANNUAL REPORT 2022 | 185 |
| | 2022 | 2021 |
| 2023 | | | 2023 | 2022 |
| (Millions of Dollars) | (Millions of Dollars) | Level 1 | Level 2 | Level 3 | Netting Adjustment (e) | Total | Level 1 | Level 2 | Level 3 | Netting Adjustment (e) | Total | (Millions of Dollars) | Level 1 | Level 2 | Level 3 | Netting Adjustment (e) | Total | Level 1 | Level 2 | Level 3 | Netting Adjustment (e) | Total |
| Con Edison | Con Edison | | | |
| Derivative assets: | Derivative assets: | | | |
| Derivative assets: | |
| Derivative assets: | |
| Commodity (a)(b)(c) | |
| Commodity (a)(b)(c) | |
| Commodity (a)(b)(c) | Commodity (a)(b)(c) | $84 | $476 | $2 | $(420) | $142 | $95 | $260 | $17 | $(171) | $201 | $6 | $146 | $2 | $(54) | $100 | $84 | $476 | $2 | $(420) | $142 |
| Commodity held for sale (g) | Commodity held for sale (g) | 6 | | 34 | | 31 | | 2 | | 73 | — | | — | — | | — | | — | Commodity held for sale (g) | — | — | 6 | 34 | 31 | 2 | 73 |
| Interest rate swaps (a)(b)(c)(f) (g) | Interest rate swaps (a)(b)(c)(f) (g) | — | 106 | — | 106 | — | | 4 | — | | — | | 4 | Interest rate swaps (a)(b)(c)(f) (g) | — | — | 106 | — | 106 |
| Other (a)(b)(d) | Other (a)(b)(d) | 437 | 116 | — | 553 | 492 | 135 | — | | — | | 627 | Other (a)(b)(d) | 505 | 118 | — | 623 | 437 | 116 | — | 553 |
| Total assets | Total assets | $527 | $732 | $33 | $(418) | $874 | $587 | $399 | $17 | $(171) | $832 | Total assets | $511 | $264 | $2 | $(54) | $723 | $527 | $732 | $33 | $(418) | $874 |
| Derivative liabilities: | Derivative liabilities: | | | |
| Commodity (a)(b)(c) | Commodity (a)(b)(c) | $18 | $204 | $16 | $(184) | $54 | $33 | $266 | $28 | $(148) | $179 |
| Commodity (a)(b)(c) | |
| Commodity (a)(b)(c) | | $22 | $347 | $10 | $(65) | $314 | $18 | $204 | $16 | $(184) | $54 |
| Commodity held for sale (g) | Commodity held for sale (g) | 8 | | 24 | | 2 | | 2 | | 36 | | | Commodity held for sale (g) | — | — | 8 | | 24 | 24 | 2 | 36 |
| Interest rate swaps (a)(b)(c)(f) (g) | — | — | | 57 | — | | — | | 57 |
| | Total liabilities | |
| Total liabilities | |
| Total liabilities | Total liabilities | $26 | $228 | $18 | $(182) | $90 | $33 | $323 | $28 | $(148) | $236 | $22 | $347 | $10 | $(65) | $314 | $26 | $228 | $18 | $(182) | $90 |
| CECONY | CECONY | | | |
| Derivative assets: | Derivative assets: | | | |
| Derivative assets: | |
| Derivative assets: | |
| Commodity (a)(b)(c) | |
| Commodity (a)(b)(c) | |
| Commodity (a)(b)(c) | Commodity (a)(b)(c) | $83 | $434 | $2 | $(388) | $131 | $67 | $138 | $1 | $(79) | $127 | $6 | $143 | $1 | $(52) | $98 | $83 | $434 | $2 | $(388) | $131 |
| Other (a)(b)(d) | Other (a)(b)(d) | 422 | 110 | — | 532 | 474 | 127 | — | | — | | 601 | Other (a)(b)(d) | 488 | 113 | — | 601 | 422 | 110 | — | 532 |
| Total assets | Total assets | $505 | $544 | $2 | $(388) | $663 | $541 | $265 | $1 | $(79) | $728 | Total assets | $494 | $256 | $1 | $(52) | $699 | $505 | $544 | $2 | $(388) | $663 |
| Derivative liabilities: | Derivative liabilities: | | | |
| Commodity (a)(b)(c) | Commodity (a)(b)(c) | $18 | $198 | $8 | $(180) | $44 | $1 | $172 | $8 | $(53) | $128 |
| Commodity (a)(b)(c) | |
| Commodity (a)(b)(c) | | $20 | $326 | $6 | $(65) | $287 | $18 | $198 | $8 | $(180) | $44 |
(a)The Companies’ policy is to review the fair value hierarchy and recognize transfers into and transfers out of the levels at the end of each reporting period. Con Edison and CECONY had $9 million and $6 million of derivative liabilities, respectively, transferred from level 3 to level 2 during the year ended December 31, 2023 because of availability of observable market data due to the decrease in the terms of certain contracts from beyond three years as of September 30, 2023 to less than three years as of December 31, 2023. Con Edison and CECONY had an immaterial amount of commodity derivative liabilities and $10 million and $9 million of commodity derivative assets, respectively, transferred from level 3 to level 2 during the year ended December 31, 2022 because of availability of observable market data due to the decrease in the terms of certain contracts from beyond three years as of September 30, 2022 to less than three years as of December 31, 2022. Con Edison and CECONY had $1 million of commodity derivative assets and $4 million and $3 million of commodity derivative liabilities, respectively, transferred from level 3 to level 2 during the year ended December 31, 2021 because of availability of observable market data due to the decrease in the terms of certain contracts from beyond three years as of September 30, 2021 to less than three years as of December 31, 2021.
(b)Level 2 assets and liabilities include investments held in the deferred compensation plan and/or non-qualified retirement plans, exchange-traded contracts where there is insufficient market liquidity to warrant inclusion in Level 1, and certain over-the-counter derivative instruments for electricity, refined products and natural gas. Derivative instruments classified as Level 2 are valued using industry standard models that incorporate corroborated observable inputs, such as pricing services or prices from similar instruments that trade in liquid markets, time value and volatility factors.
(c)The accounting rules for fair value measurements and disclosures require consideration of the impact of nonperformance risk (including credit risk) from a market participant perspective in the measurement of the fair value of assets and liabilities. At December 31, 20222023 and 2021,2022, the Companies determined that nonperformance risk would have no material impact on their financial position or results of operations.
| | | | | |
164 | CON EDISON ANNUAL REPORT 2023 |
(d)Other assets: Level 1 assets are comprised primarily of mutual/commingled funds, and Level 2 assets such asare comprised primarily of the cash value of life insurance contracts within the deferred compensation plan and non-qualified retirement plans.contracts.
(e)Amounts represent the impact of legally-enforceable master netting agreements that allow the Companies to net gain and loss positions and cash collateral held or placed with the same counterparties.
(f)See Note Q.
(g)Amounts for 2022 representOn March 1, 2023, Con Edison completed the sale of all of the stock of the Clean Energy Businesses' derivative assets and liabilities included in current assets and current liabilities held for sale, respectively on Con Edison's consolidated balance sheet as of December 31, 2022.Businesses. See "Assets and Liabilities Held for Sale" in Note AW and Note X.
The employees in the Companies’ risk management group develop and maintain the Companies’ valuation policies and procedures for, and verify pricing and fair value valuation of, commodity derivatives and interest rate swaps.derivatives. Under the Companies’ policies and procedures, multiple independent sources of information are obtained for forward price curves used to value commodity derivatives and interest rate swaps.derivatives. Fair value and changes in fair value of commodity derivatives and interest rate swaps are reported monthly to the Companies’ risk committees, comprised of officers and employees of the Companies that oversee energy hedging at the Utilities and the Clean Energy Businesses.Utilities. The risk management group reports to the Companies’ Vice President and Treasurer.
| | | | | | | | | | | | | | |
|
186
CON EDISON ANNUAL REPORT 2022 |
| | | | | | | | | | | | | | |
| Fair Value of Level 3 at December 31, 20222023 | | | |
| (Millions of Dollars) | Valuation Techniques | Unobservable Inputs | Range |
Con Edison — Commodity |
Electricity - Held and Used | $(15)(8) | Discounted Cash Flow | Forward capacity prices (a) | $1.42-$16.081.90 - $11.75 per kW-month |
Transmission Congestion Contracts/Financial Transmission Rights - Held and UsedContracts | 1immaterial | Discounted Cash Flow | Inter-zonal forward price curves adjusted for historical zonal losses (b) | $0.91-$3.03(0.33) - $2.20 per MWh |
Total Con Edison - Commodity - Held and Used | $(14)(8) | | | |
Electricity - Held for Sale | $14 | Discounted Cash Flow | Forward energy prices (a) | $22.00-$187.50 per MWh |
| 10 | Discounted Cash Flow | Forward capacity prices (a) | $0.96-$5.75 per kW-month |
Transmission Congestion Contracts/Financial Transmission Rights - Held for Sale | 4 | Discounted Cash Flow | Inter-zonal forward price curves adjusted for historical zonal losses (b) | $(12.44)-$195.57 per MWh |
Natural Gas - Held for Sale | 1 | Discounted Cash Flow | Forward natural gas prices (a) | $3.75-$14.51 per Dt |
Total Con Edison - Commodity - Held for Sale (c) | $29 | | | |
Total Con Edison — Commodity | $15 | | | |
| CECONY — Commodity |
| Electricity | $(7)(5) | Discounted Cash Flow | Forward capacity prices (a) | $1.42-$16.081.90 - $11.75 per kW-month |
| Transmission Congestion Contracts | 1immaterial | Discounted Cash Flow | Inter-zonal forward price curves adjusted for historical zonal losses (b) | $0.91-$3.03(0.33) - $2.20 per MWh |
| Total CECONY — Commodity | $(6)(5) | | | |
(a)Generally, increases/(decreases) in this input in isolation would result in a higher/(lower) fair value measurement.
(b)Generally, increases/(decreases) in this input in isolation would result in a lower/(higher) fair value measurement.
(c)Amount represents the Fair Value of Level 3 assets of the Clean Energy Businesses, which were held for sale as of December 31, 2022. See "Assets and Liabilities Held for Sale" in Note A and Note X.
The table listed below provides a reconciliation of the beginning and ending net balances for assets and liabilities measured at fair value for the years ended December 31, 20222023 and 20212022 and classified as Level 3 in the fair value hierarchy:
| | Con Edison | CECONY |
| Con Edison | | | Con Edison | CECONY |
| (Millions of Dollars) | (Millions of Dollars) | 2022 | 2021 | 2022 | 2021 | (Millions of Dollars) | 2023 | 2022 | 2023 | 2022 |
| Beginning balance as of January 1, | Beginning balance as of January 1, | $(11) | $(19) | $(7) | $(10) | Beginning balance as of January 1, | $15 | $(11) | $(6) | $(7) |
| Included in earnings | Included in earnings | (11) | (9) | (5) | (3) | Included in earnings | (4) | (11) | (2) | (5) |
| Included in regulatory assets and liabilities | Included in regulatory assets and liabilities | 11 | 3 | 10 | 1 | Included in regulatory assets and liabilities | 33 | 11 | 31 | 10 |
| Purchases | — | 6 | | — | | — | |
| | Settlements | |
| Settlements | |
| Settlements | Settlements | 11 | 5 | 5 | 3 | 4 | 11 | 2 | 5 |
| Changes in level 3 assets and liabilities held for sale (a) | Changes in level 3 assets and liabilities held for sale (a) | 25 | — | | — | | — | | Changes in level 3 assets and liabilities held for sale (a) | — | 25 | — | — |
| Decrease due to the sale of the Clean Energy Businesses (a) | | Decrease due to the sale of the Clean Energy Businesses (a) | (29) | — | — | — |
| Transfer out of level 3 | Transfer out of level 3 | (10) | 3 | (9) | 2 | Transfer out of level 3 | (27) | (10) | (30) | (9) |
| Ending balance as of December 31, | Ending balance as of December 31, | $15 | $(11) | $(6) | $(7) | Ending balance as of December 31, | $(8) | $15 | $(5) | $(6) |
(a)Amounts for 2022 represent On March 1, 2023, Con Edison completed the net change insale of all of the value of level 3 assets and liabilitiesstock of the Clean Energy Businesses. The Clean Energy Businesses were classified as held for sale as of December 31, 2022. See "Assets and Liabilities Held for Sale" in Note AW and Note X.
For the Utilities, realized gains and losses on Level 3 commodity derivative assets and liabilities are reported as part of purchased power, gas and fuel costs. The Utilities generally recover these costs in accordance with rate provisions approved by the applicable state public utilities regulators. See Note A. Unrealized gains and losses for commodity derivatives are generally deferred on the consolidated balance sheet in accordance with the accounting rules for regulated operations.
For the Clean Energy Businesses, realized and unrealized gains and losses on Level 3 commodity derivative assets and liabilities are reported in non-utility revenues ($2617 million gainloss and $2$26 million loss)gain) on the consolidated income statement for the years ended December 31, 2023 and 2022, and 2021, respectively. The Clean Energy Businesses were classified as held for sale as of December 31, 2022. See "Assets and Liabilities Held for Sale" in Note A and Note X.On March 1, 2023, Con Edison
| | | | | |
CON EDISON ANNUAL REPORT 20222023 | 187165 |
completed the sale of all of the stock of the Clean Energy Businesses and amounts for 2023 are shown through the date of sale. See Note W and Note X.
Note S – Variable Interest Entities
The accounting rules for consolidation address the consolidation of a variable interest entity (VIE) by a business enterprise that is the primary beneficiary. A VIE is an entity that does not have a sufficient equity investment at risk to permit it to finance its activities without additional subordinated financial support, or whose equity investors lack the characteristics of a controlling financial interest. The primary beneficiary is the business enterprise that has the power to direct the activities of the VIE that most significantly impact the VIE’s economic performance and either absorbs a significant amount of the VIE’s losses or has the right to receive benefits that could be significant to the VIE.
The Companies enter into arrangements including leases, partnerships and electricity purchase agreements, with various entities. As a result of these arrangements, the Companies retain or may retain a variable interest in these entities.
CECONY
CECONY has an ongoing long-term electricity purchase agreement with Brooklyn Navy Yard Cogeneration Partners, LP, a potential VIE. In 2022,2023, a request was made of this counterparty for information necessary to determine whether the entity was a VIE and whether CECONY is the primary beneficiary; however, the information was not made available. See Note I for information on these electricity purchase agreements; the payments for this contract constitute CECONY's maximum exposure to loss with respect to the potential VIE.
Clean Energy Businesses
TheCon Edison has determined that the use of Hypothetical Liquidation at Book Value (HLBV) accounting is reasonable and appropriate to attribute income and loss to the tax equity investors for various projects owned by the Clean Energy BusinessesBusinesses. See "Use of Hypothetical Liquidation at Book Value" in Note A. On March 1, 2023, Con Edison completed the sale of all of the stock of the Clean Energy Businesses. In connection with the sale, Con Edison retained a tax equity interest in two renewable electric projects located in Virginia, and in the Crane Solar Project (collectively, the "Retained Projects"). Included in the sale were classifiedCon Edison's interests in CED Nevada Virginia and the Tax Equity Projects, defined below (collectively, the "Sold Projects"). The HLBV method of accounting resulted in an immaterial amount of income/(loss) for Con Edison and the tax equity investor for the Sold Projects for the year ended December 31, 2023; information for the year ended December 31, 2022 is presented below. See Note W and X.
Retained Projects
Con Edison retained a tax equity interest valued at $20 million in two renewable electric projects located in Virginia that is accounted for as heldan equity method investment and represents the maximum exposure to loss for salethis investment. See Note W. The earnings of the projects, once in service, are determined using the HLBV method of accounting and resulted in losses of $14 million ($10 million, after tax) for the year ended December 31, 2023.
Con Edison also retained its $11 million equity interest in the Crane solar project that was valued at $0 as of December 31, 2022. See "Assets2023 and Liabilities Held for Sale" in Note A and Note X.
In June 2021, a subsidiary of the Clean Energy Businesses sold substantially all of its membership interest in a renewable electric project, and retained an equity interest of $11 million in the project, which is accounted for as an equity method investment. See Note W. The earnings of the project are determined using the hypothetical liquidation at book value (HLBV)HLBV method of accounting which resulted in a loss of $11 million pre-tax ($8 million after-tax)and were not material for the yearyears ended December 31, 2021. 2023 and 2022.
Con Edison is not the primary beneficiary of any Retained Projects since the power to direct the activities that most significantly impact the economics of the renewable electric projectprojects is not held by the Clean Energy Businesses.Con Edison.
HLBV AccountingSold Projects
Con Edison has determined thatIn 2018, the useClean Energy Businesses completed its acquisition of HLBV accounting is reasonable and appropriate to attribute income and loss toSempra Solar Holdings, LLC. Included in the acquisition were certain operating projects (Tax Equity Projects) with a noncontrolling tax equity investors. See "Useinvestor to which a percentage of Hypothetical Liquidation at Book Value" in Note A.earnings, tax attributes and cash flows are allocated. Electricity generated by the Tax Equity Projects is sold to utilities and municipalities pursuant to long-term power purchase agreements.
| | | | | |
166 | CON EDISON ANNUAL REPORT 2023 |
In February 2021, a subsidiary of the Clean Energy Businesses entered into an agreement relating to certain projects (CED Nevada Virginia) with a noncontrolling tax equity investor to which a percentage of earnings, tax attributes and cash flows will beare allocated.
The Tax Equity Projects and CED Nevada Virginia is awere consolidated entityentities in which Con Edison hashad less than a 100 percent membership interest. Con Edison is the primary beneficiary since the power to direct the activities that most significantly impact the economics of CED Nevada Virginia is held by the Clean Energy Businesses. The HLBV method of accounting resulted in income/(loss) for the years endedinterest at December 31, 2022 and 2021, as follows:
| | | | | | | | |
| (Millions of Dollars) | 2022 | 2021 |
| Tax equity investor | $(49) | $(158) |
| After tax | (37) | (119) |
| Con Edison | 41 | 155 |
| After tax | 31 | 117 |
Tax Equity Projects
In 2018, the Clean Energy Businesses completed its acquisition of Sempra Solar Holdings, LLC. Included in the acquisition were certain operating projects (Tax Equity Projects) with a noncontrolling tax equity investor to which a
| | | | | |
188
|
CON EDISON ANNUAL REPORT 2022 |
percentage of earnings, tax attributes and cash flows are allocated. The Tax Equity Projects are consolidated entities in which Con Edison has less than a 100 percent membership interest.no interest in subsequent to the sale of the Clean Energy Businesses on March 1, 2023. Con Edison iswas the primary beneficiary since the power to direct the activities that most significantly impact the economics of the Tax Equity Projects isand CED Nevada Virginia was held by the Clean Energy Businesses. Electricity generated by the Tax Equity Projects is sold to utilities and municipalities pursuant to long-term power purchase agreements. Con Edison.
The HLBV method of accounting resulted in income/(loss) for Con Edison and the tax equity investors for the years ended December 31, 2022 and 2021 as follows:shown in the table below. On March 1, 2023, Con Edison completed the sale of all of the stock of the Clean Energy Businesses. See Note W and Note X.
| | | 2022 | |
| | 2022 | |
| | 2022 | | 2021 |
| (Millions of Dollars) | (Millions of Dollars) | 2022 | 2021 | (Millions of Dollars) | | CED Nevada Virginia | Tax Equity Projects | CED Nevada Virginia | Tax Equity Projects |
| Tax equity investor | Tax equity investor | $(11) | $6 | Tax equity investor | | $(49) | $(11) | $(158) | $6 |
| After tax | After tax | (8) | 4 | After tax | | (37) | (8) | (119) | 4 |
| Con Edison | Con Edison | 51 | 30 | Con Edison | | 41 | 51 | 155 | 30 |
| After tax | After tax | 38 | 24 | After tax | | 31 | 38 | 117 | 24 |
At December 31, 2022, and 2021, Con Edison’s consolidated balance sheet included the following amounts associated with its consolidated VIEs:
| | | Tax Equity Projects | |
| | Tax Equity Projects | |
| | Tax Equity Projects | |
| | Great Valley Solar
(c)(d) | |
| | Great Valley Solar
(c)(d) | |
| | Great Valley Solar
(c)(d) | |
| (Millions of Dollars) | |
| (Millions of Dollars) | |
| (Millions of Dollars) | |
| Assets held for sale (a) | |
| Assets held for sale (a) | |
| Assets held for sale (a) | |
| | | Tax Equity Projects | |
| Total assets (a) | |
| | Great Valley Solar
(c)(d) | Copper Mountain - Mesquite Solar
(c)(e) | CED Nevada Virginia (c)(h) |
| (Millions of Dollars) | 2022 | 2021 | 2022 | 2021 | 2022 | 2021 |
| Assets held for sale (a) | $305 | $— | | $580 | $— | | $686 | $— | |
| Non-utility property, less accumulated depreciation (f)(g) | — | | 275 | — | | 431 | — | | 643 |
| Other assets | — | | 37 | — | | 167 | — | | 55 |
| | Total assets (a) | |
| | Total assets (a) | Total assets (a) | $305 | $312 | $580 | $598 | $686 | $698 |
| Liabilities held for sale (b) | Liabilities held for sale (b) | 20 | — | | 81 | — | | 331 | — | |
| Other liabilities | — | 14 | — | 74 | — | | 315 |
| Liabilities held for sale (b) | |
| Liabilities held for sale (b) | |
| | Total liabilities (b) | Total liabilities (b) | $20 | $14 | $81 | $74 | $331 | $315 |
| | Total liabilities (b) | |
| | Total liabilities (b) | |
(a)The assets of the Tax Equity Projects and CED Nevada Virginia represent assets of a consolidated VIE that can be used only to settle obligations of the consolidated VIE. Amounts shown for 2022 are included in current assets held for sale on Con Edison's consolidated balance sheet as of December 31, 2022. On March 1, 2023, Con Edison completed the sale of all of the stock of the Clean Energy Businesses. See "Assets and Liabilities Held for Sale" in Note AW and Note X. For the disposal of the noncontrolling interest, see Con Edison's Consolidated Statement of Equity.
(b)The liabilities of the Tax Equity Projects and CED Nevada Virginia represent liabilities of a consolidated VIE for which creditors do not have recourse to the general credit of the primary beneficiary. Amounts shown for 2022 are included in current liabilities held for sale on Con Edison's consolidated balance sheet as of December 31, 2022. On March 1, 2023, Con Edison completed the sale of all of the stock of the Clean Energy Businesses. See "Assets and Liabilities Held for Sale" in Note AW and Note X. For the disposal of the noncontrolling interest, see Con Edison's Consolidated Statement of Equity.
(c)Con Edison did not provide any financial or other support during the year that was not previously contractually required.
(d)Great Valley Solar consists of the Great Valley Solar 1, Great Valley Solar 2, Great Valley Solar 3 and Great Valley Solar 4 projects, for which the noncontrolling interest of the tax equity investor was $67 million and $84 million at December 31, 2022 and 2021, respectively.2022.
(e)Copper Mountain - Mesquite Solar consists of the Copper Mountain Solar 4, Mesquite Solar 2 and Mesquite Solar 3 projects for which the noncontrolling interest of the tax equity investor was $94 million and $118 million at December 31, 2022 and 2021, respectively.
(f)Non-utility property is reduced by accumulated depreciation of $35 million for Great Valley Solar, $59 million for Copper Mountain - Mesquite Solar and $29 million for CED Nevada Virginia at December 31, 2022.
(g)Non-utility property is reduced by accumulated depreciation of $26 million for Great Valley Solar, $44 million for Copper Mountain - Mesquite Solar and $10 million for CED Nevada Virginia at December 31, 2021.
(h)(f)CED Nevada Virginia consists of the Copper Mountain Solar 5, Battle Mountain Solar and Water Strider Solar projects for which the noncontrolling interest of the tax equity investor was $39 million and $95 million at December 31, 2022 and 2021, respectively.
The following table summarizes the VIEs into which the Clean Energy Businesses have entered as of December 31, 2022.The Clean Energy Businesses were classified as held for sale as of December 31, 2022. See "Assets and Liabilities Held for Sale" in Note A and Note X.
| | | | | |
CON EDISON ANNUAL REPORT 20222023 | 189167 |
| | | | | | | | | | | | | | | | | |
| Project Name | Generating Capacity (a) (MW AC) | Power Purchase Agreement Term in Years | Year of Investment | Location | Maximum
Exposure to Loss
(Millions of Dollars) (b) |
| Great Valley Solar (c) | 200 | 15-20 | 2018 | CA | $218 |
| Copper Mountain - Mesquite Solar (c) | 344 | 20-25 | 2018 | NV and AZ | 404 |
| CED Nevada Virginia (c) | 431 | 20-25 | 2021 | NV and VA | 316 |
(a)Represents ownership interest in the project.
(b)Maximum exposure is equal to the net assets of the project on the consolidated balance sheet less any applicable noncontrolling interest. Con Edison did not provide any financial or other support during the year that was not previously contractually required.
(c)For the projects comprising Great Valley Solar, Copper Mountain Mesquite Solar and CED Nevada Virginia, refer to (d), (e) and (h) in the table above.
Note T – Asset Retirement Obligations
The Companies recognize a liability at fair value for legal obligations associated with the retirement of long-lived assets in the period in which they are incurred, or when sufficient information becomes available to reasonably estimate the fair value of such legal obligations. When the liability is initially recorded, asset retirement costs are capitalized by increasing the carrying amount of the related asset. The liability is accreted to its present value each period and the capitalized cost is depreciated over the useful life of the related asset. The fair value of the asset retirement obligation liability is measured using expected future cash flows discounted at credit-adjusted risk-free rates, historical information, and where available, quoted prices from outside contractors. The Companies evaluate these assumptions underlying the asset retirement obligation liability on an annual basis or as frequently as needed.
The Companies recorded asset retirement obligations associated with the removal of asbestos and asbestos-containing material in their buildings (other than the structures enclosing generating stations and substations), electric equipment and steam and gas distribution systems. The Companies also recorded asset retirement obligations relating to gas and oil pipelines abandoned in place and municipal infrastructure support.
The Companies did not record an asset retirement obligation for the removal of asbestos associated with the structures enclosing generating stations and substations. For these building structures, the Companies were unable to reasonably estimate their asset retirement obligations because the Companies were unable to estimate the undiscounted retirement costs or the retirement dates and settlement dates. The amount of the undiscounted retirement costs could vary considerably depending on the disposition method for the building structures, and the method has not been determined. The Companies anticipate continuing to use these building structures in their businesses for an indefinite period, and so the retirement dates and settlement dates are not determinable.
Con Edison recorded asset retirement obligations for the removal of the Clean Energy Businesses’ solar and wind equipment related to projects located on property that is not owned by them and the term of the arrangement is finite including any renewal options. Con Edison did not record asset retirement obligations for the Clean Energy Businesses’ projects that arewere located on property that iswas owned by them because they expect that the equipment will continue to generate electricity at these facilities long past the manufacturer’s warranty at minimal operating expense. Therefore, Con Edison was unable to reasonably estimate the retirement date of this equipment. TheOn March 1, 2023, Con Edison completed the sale of all of the stock of the Clean Energy Businesses were classified as held for sale as of December 31, 2022.Businesses. See "Assets and Liabilities Held for Sale" in Note AW and Note X.
The Utilities include in depreciation rates the estimated removal costs, less salvage, for utility plant assets. The amounts related to removal costs that are associated with asset retirement obligations are classified as an asset retirement liability. Pursuant to accounting rules for regulated operations, future removal costs that do not represent legal asset retirement obligations are recorded as regulatory liabilities. Accretion and depreciation expenses related to removal costs that represent legal asset retirement obligations are applied against the Companies’ regulatory liabilities. Asset retirement costs that are recoverable from customers are recorded as regulatory liabilities to reflect the timing difference between costs recovered through the rate-making process and recognition of costs.
The following table represents the balance of asset retirement obligations as of December 31, 20222023 and 2021,2022, and changes to the obligation for the years then ended:
| | | | | |
190
|
CON EDISON ANNUAL REPORT 2022 |
| | Con Edison | CECONY |
| Con Edison | | | Con Edison | CECONY |
| (Millions of Dollars) | (Millions of Dollars) | 2022 | 2021 | 2022 | 2021 | (Millions of Dollars) | 2023 | 2022 | 2023 | 2022 |
| Beginning Balance as of January 1, | Beginning Balance as of January 1, | $577 | | $577 | | $504 | | $508 | | Beginning Balance as of January 1, | $500 | $577 | $499 | $504 |
| ARO held for sale (a) | ARO held for sale (a) | (77) | | — | | — | | — | | ARO held for sale (a) | — | (77) | — |
| Changes in estimated cash flows | Changes in estimated cash flows | 44 | | 58 | | 43 | | 55 | | Changes in estimated cash flows | 76 | 44 | 75 | 43 |
| Accretion expense | Accretion expense | 18 | | 18 | | 14 | | 15 | | Accretion expense | 17 | 18 | 17 | 14 |
| Liabilities settled | Liabilities settled | (62) | | (75) | | (62) | | (74) | | Liabilities settled | (71) | (62) | (71) | (62) |
| Ending Balance as of December 31, (b) | Ending Balance as of December 31, (b) | $500 | $577 | $499 | $504 | Ending Balance as of December 31, (b) | $522 | $500 | $520 | $499 |
(a)The asset retirement obligations of the Clean Energy Businesses (inclusive of those of Broken Bow II) in 2022, and of Broken Bow II in 2023 are reflected in current liabilities held for sale on Con Edison's consolidated balance sheetsheets as of December 31, 2022.2022 and 2023, respectively. On March 1, 2023, Con Edison completed the sale of all of the stock of the Clean Energy Businesses. For 2023, $3 million of asset retirement obligations related to Broken Bow II are not shown in the table above, as they are already excluded from the beginning balance as of January 1, 2023 for Con Edison. See "Assets and Liabilities Held for Sale" in Note A and Note X.
| | | | | |
168 | CON EDISON ANNUAL REPORT 2023 |
(b)At December 31, 2022,2023, Con Edison and CECONY recorded reductions of $78 million and $77 million respectively, to the regulatory liability associated with cost of removal to reflect depreciation and interest expense. At December 31, 2021,2022, Con Edison and CECONY recorded reductions of $87$78 million and $85$77 million, respectively, to the regulatory liability associated with cost of removal to reflect depreciation and interest expense.
Note U – Related Party Transactions
The NYSPSC generally requires that the Utilities and Con Edison’s other subsidiaries be operated as separate entities. The Utilities and the other subsidiaries are required to have separate operating employees and operating officers of the Utilities may not be operating officers of the other subsidiaries. The Utilities may provide administrative and other services to, and receive such services from, Con Edison and its other subsidiaries only pursuant to cost allocation procedures approved by the NYSPSC. Transfers of assets between the Utilities and Con Edison or its other subsidiaries may be made only as approved by the NYSPSC. The debt of the Utilities is to be raised directly by the Utilities and not derived from Con Edison. Without the prior permission of the NYSPSC, the Utilities may not make loans to, guarantee the obligations of, or pledge assets as security for the indebtedness of Con Edison or its other subsidiaries. The NYSPSC limits the dividends that the Utilities may pay Con Edison. See “Dividends” in Note C. As a result, substantially all of the net assets of CECONY and O&R ($16,87819,146 million and $931$1,062 million, respectively), at December 31, 2022,2023, are considered restricted net assets. The NYSPSC may impose additional measures to separate, or “ring fence,” the Utilities from Con Edison and its other subsidiaries. See “Rate Plans” in Note B.
The costs of administrative and other services provided by CECONY to, and received by it from, Con Edison and its other subsidiaries for the years ended December 31, 2023, 2022 2021 and 20202021 were as follows:
| | CECONY |
| CECONY (a) | | | CECONY (a) |
| (Millions of Dollars) | (Millions of Dollars) | 2022 | 2021 | 2020 | (Millions of Dollars) | 2023 | 2022 | 2021 |
| Cost of services provided | Cost of services provided | $135 | $137 | $128 | Cost of services provided | $146 | $135 | $137 |
| Cost of services received | Cost of services received | 75 | 68 | 66 | Cost of services received | 82 | 75 | 68 |
(a) On March 1, 2023, Con Edison completed the sale of all of the stock of the Clean Energy Businesses. See Note W and Note X.
In addition, CECONY and O&R have joint gas supply arrangements in connection with which CECONY sold to O&R $82 million, $144 million $90 million and $59$90 million of natural gas for the years ended December 31, 2023, 2022 2021 and 2020,2021, respectively. These amounts are net of the effect of related hedging transactions.
At December 31, 20222023 and 2021,2022, CECONY's net payablereceivable (payable) to Con Edison for income taxes was $89were $110 million and $10$(89) million, respectively.
The Utilities perform work and incur expenses on behalf of NYNew York Transco, a company in which CETCon Edison Transmission has a 45.7 percent equity interest.interest in New York Transco's New York Energy Solution project and a 41.7 percent interest in New York Transco's share of the Propel NY Energy project that is jointly owned with the New York Power Authority. The Utilities bill NYNew York Transco for such work and expenses in accordance with established policies. For the years ended December 31, 20222023 and 2021,2022, the amounts billed by the Utilities to NYNew York Transco were $7.3 million and $8.0 million, and $5.9 million, respectively. In May 2016, CECONY transferred certain electric transmission projects to NY Transco.
CECONY has storage and wheeling service contracts with Stagecoach Gas Services LLC (Stagecoach), a joint venture formerly owned by a subsidiary of CET and a subsidiary of Crestwood Equity Partners LP (Crestwood). In addition, CECONY is the replacement shipper on one of Crestwood’s firm transportation agreements with Tennessee Gas Pipeline Company LLC. CECONY incurred costs for storage and wheeling services from
| | | | | |
CON EDISON ANNUAL REPORT 2022 | 191 |
Stagecoach of $31 million and $34 million for the years ended December 31, 2021 and 2020, respectively. During 2021, a subsidiary of CET completed the sale of its 50 percent interest in Stagecoach. See Note W.
CECONY has a 20-year transportation contract with Mountain Valley Pipeline, LLC (MVP) for 250,000 dekatherms per day of capacity. CET owns a 9.6 percent equityCon Edison Transmission has an interest in MVP (that is expected to be reduced to 8.0 percent).MVP. See "Investments - 2020 and 2021 Partial Impairments of Investment"Investment in Mountain Valley Pipeline, LLC (MVP) " in Note A. In October 2017, the Environmental Defense Fund and the Natural Resource Defense Council requested the NYSPSC to prohibit CECONY from recovering costs under its contract with MVP contract unless CECONY can demonstrate that the contract is in the public interest. CECONY advised the NYSPSC that it would respond to the request if the NYSPSC opened a proceeding to consider this request. For the years ended December 31, 2022 and 2021, CECONY has not incurred no costs under the contract.
FERC has authorized CECONY to lend funds to O&R for a period of not more than 12 months, in an amount not to exceed $250 million, at prevailing market rates. At December 31, 20222023 and 20212022 there were no outstanding loans to O&R.
The Clean Energy Businesses had financial electric capacity contracts with CECONY and O&R during 2022 and 2021.&R. For the yearsyear ended December 31, 2022, and 2021, the Clean Energy Businesses realized a $5 million gain and $4 million loss, respectively, under these contracts. TheOn March 1, 2023, Con Edison completed the sale of all of the stock of the Clean Energy Businesses. As a result of the sale, the Clean Energy Businesses were classifiedare no longer recognized as held for sale as ofa related party. See Note W and Note X.
| | | | | |
| CON EDISON ANNUAL REPORT 2023 | 169 |
The Consolidated Edison Foundation, Inc. (the Foundation), established in December 2023, is a non-consolidated not-for-profit corporation funded by Con Edison that plans to make contributions to selected charitable organizations. In December 2023, Con Edison made an unconditional promise to give $12 million to the Foundation. For the year ended December 31, 2022. See "Assets2023, Con Edison accrued such amount as an expense in “Other Income and Liabilities Held for Sale" in Note A and Note X.Deductions” within its consolidated income statement.
Note V – New Financial Accounting Standards
In March 2020, the FASB issued ASU 2020-04, Reference Rate Reform (Topic 848): Facilitation of the Effects of Reference Rate Reform on Financial Reporting (ASU 2020-04). In 2017, the United Kingdom’s Financial Conduct Authority announced that it intends to stop persuading or compelling banks to submit the London Interbank Offered Rate (LIBOR), a benchmark interest rate referenced in a variety of agreements, after 2021. The United Kingdom's Financial Conduct Authority ceased publication of U.S. Dollar LIBOR after December 31, 2021 for one-week and two-month U.S. Dollar LIBOR tenors, and expects to cease publishing after June 30, 2023, for all other U.S. Dollar LIBOR tenors. ASU 2020-04 provides entities with optional expedients and exceptions for applying generally accepted accounting principles to contract modifications and hedging relationships, subject to meeting certain criteria, that reference LIBOR or another reference rate expected to be discontinued. In January 2021, the FASB issued amendments to the guidance on accounting for Investments—Equity Method and Joint Ventures (Topic 323) through ASU 2021-01 to include all contract modifications and hedging relationships affected by reference rate reform, including those that do not directly reference LIBOR or another reference rate expected to be discontinued, and clarify which optional expedients may be applied to them. As the Companies continue to modify contracts that contain references to LIBOR that allow for2023-02. The amendments would expand the use of an alternative rate, they have applied the practical expedient to not assess each change for a contract modification. The guidance can be applied prospectively. The optional relief is temporary and generally cannot be applied to contract modifications and hedging relationships entered into or evaluated after December 31, 2024, which date reflects the updates in ASU 2022-06, Reference Rate Reform (Topic 848): Deferralproportional amortization method of the Sunset Date of Topic 848. income recognition. The Companies do not expect the new guidance to have a material impact on their financial position, results of operations orand liquidity.
In December 2021,November 2023, the FASB issued amendments to the guidance on accounting for government assistanceSegment Reporting (Topic 280) through ASU 2021-10, Government Assistance (Topic 832): Disclosures by Business Entities about Government Assistance.2023-07. The amendments require that business entities that applywould improve the disclosures about a grant or contribution model by analogy to other accounting guidance disclose 1) the types of assistance, 2) anpublic entity’s accountingreportable segments and address requests from investors for the assistance, and 3) the effect of the assistance on an entity’s financial statements.additional, more detailed information about a reportable segment’s expenses. For public entities, the amendments are effective for annual reporting periods beginning after December 15, 2021. Early adoption is permitted.2023, and interim periods within fiscal years beginning after December 15, 2024. A public entity should apply such amendments retrospectively to all prior periods presented in the financial statements. The Companies have concludeddo not expect the new guidance does notto have a material impact on their financial position, results of operations and liquidity.
In December 2023, the Companies’FASB issued amendments to the guidance on accounting for Income Taxes (Topic 740) through ASU 2023-09. The amendments would improve the disclosures related to income taxes. The amendments focus on three key areas: Rate Reconciliation, Income Taxes Paid, and Income (or loss)/Income tax expense (or benefit) relating to disaggregated continuing operations. For public entities, the amendments are effective for annual reporting periods beginning after December 15, 2024. Early adoption is permitted for annual financial statements. The Companies do not expect the new guidance to have a material impact on their financial position, results of operations and liquidity.
Note W – Dispositions
Crane and Coram
In April 2021, a subsidiary of the Clean Energy Businesses entered into an agreement to sell substantially all of its membership interests in a renewable electric project that it developed and also all of its membership interests in arenewable electric project that it acquired in 2016. The sales were completed in June 2021. The combined carrying value of both projects was approximately $192 million in June 2021. The net pre-tax gain on the sales was
| | | | | |
192
|
CON EDISON ANNUAL REPORT 2022 |
$3 $3 million ($2 million after-tax) and was included within "Other operations and maintenance" on Con Edison's consolidated income statement for the year ended December 31, 2021. The retained portion of the membership interest in the renewable electric project, of $11 million, was calculated based on a discounted cash flow of future projected earnings, and the retained portion is accounted for as an equity method investment. The portion of the gain attributable to the retained portion of the membership interest was not material for the year ended December 31, 2021. See Note S. TheOn March 1, 2023, Con Edison completed the sale of all of the stock of the Clean Energy Businesses were held for sale as of December 31, 2022.Businesses. See "Assets and Liabilities Held for Sale" in Note AW and Note X.
Stagecoach Gas Services
In 2021, a subsidiary of Con Edison Gas Pipeline and Storage, LLC (CET)Transmission and its joint venture partner agreed to sell their combined interests in Stagecoach Gas Services LLC (Stagecoach) for a total of $1,225 million, of which $629 million, including closing adjustments, was attributed to CETCon Edison Transmission for its 50 percent interest. The purchase and sale agreement provided for a two-stage closing, the first of which was completed in July 2021 and the second of which was completed in November 2021. See "Investments - 2021 Partial Impairment of Investment in Stagecoach Gas Services LLC (Stagecoach)" in Note A.
| | | | | |
CON EDISON ANNUAL REPORT 2022 | 193 |
Note X - Held-for-Sale Treatment of the Clean Energy Businesses
During the first nine months of 2022, Con Edison considered strategic alternatives with respect to the Clean Energy Businesses. On October 1, 2022, following the conclusion of such review and to allow for continued focus on the Utilities and their clean energy transition, Con Edison entered into a purchase and sale agreement pursuant to which Con Edison agreed to sell the Clean Energy Businesses to RWE Renewables Americas, LLC, a subsidiary of RWE Aktiengesellschaft (RWE) for a total of $6,800 million, subject to closing adjustments. On March 1, 2023, Con Edison completed the sale of all of the stock of the Clean Energy Businesses to RWE for $3,993 million. The preliminary purchase price will beat closing was adjusted (i) upward for certain cash and cash equivalents, (ii) downward for certain indebtedness and
| | | | | |
170 | CON EDISON ANNUAL REPORT 2023 |
debt-like items, (iii) downward for certain transaction expenses, (iv) upward or downward to the extent that the net working capital variesvaried from a set target, (v) upward or downward to the extent that capital expenditures incurred prior to the closing of the transaction varyvaried from a set budget, and (vi) downward by the value allocated to certain assets and projectsBroken Bow II, a project that arewas not able to be conveyed to RWE upon closing of the transaction. The final purchase and sale agreement includes certain customary representations, warranties and covenants. The transactionprice is subject to customary closing conditions, including,adjustments for timing differences and a final valuation report, among other things: expirationfactors; the process to finalize the purchase price is ongoing. The transaction was completed at arm’s length and RWE was not, and will not be, considered a related party to Con Edison.
Con Edison's preliminary gain on the sale of the waiting period underClean Energy Businesses was $865 million ($767 million, after tax) for the Hart-Scott-Rodino Antitrust Improvements Act of 1976, as amended, which occurred on November 28,2022; approval fromyear ended December 31, 2023 and remains subject to true-up for the FERC under Section 203finalization adjustments described above. The portion of the Federal Power Act, whichgain attributable to the non-controlling interest retained in certain tax-equity projects was obtained on January 20, 2023, and approval by the Committee on Foreign Investment in the United States, which was obtained on February 6, 2023.not material. The transaction is expected to close on or about the endsale included all of the first quarterClean Energy Businesses with the exception of 2023.tax equity interests in three projects, described below, and one deferred project, Broken Bow II, a 75 MW nameplate capacity wind power project located in Nebraska. See Note X. Transfer of the project depends on one outstanding counterparty consent, and if and when such consent is obtained within two years of the sale of the Clean Energy Businesses, i.e., by February 28, 2025, the project will transfer. RWE Renewables Americas, LLC is operating the facility on behalf of Con Edison pursuant to certain service agreements, for which the fees are not material.
Con Edison will retainretained the Clean Energy Businesses' tax equity investment interest in the Crane Solarsolar project and its anticipatedanother tax equity investment interest in two solar projects located in VA.Virginia. These tax equity partnerships produce renewable energy tax credits that can be used to reduce Con Edison’s federal income tax in the year in which the projects are placed in service. These tax credits would be subject to recapture, in whole or in part, if the assets were sold within a five-year five-year period beginning on the date on which the assets are placed in service. Con Edison will continue to employ HLBV accounting for its interestsinterests in these tax equity partnerships. The combined carrying value of the retained tax equity interests was approximately $13 million at December 31, 2023.
Con Edison will retainhas also retained any post-sale deferred income taxes (federal and state income taxes, including tax attributes), any valuation allowances associated with the deferred tax assets, all current federal taxes and New York stateState taxes and the estimated liability for uncertain tax positions. The unamortized deferred investment tax credits and accumulated amortized investment tax credits of the Clean Energy Businesses will bewere recognized in full upon the completion of the sale of the Clean Energy Businesses. In addition, certain projects where required transaction consents have not been obtained as of the closing of the transaction (see above) will be transferred to a Con Edison subsidiary and will be sold to RWE if and when consents to the sale have been obtained.
Concurrent with entering into the purchase and sale agreement, Con Edison incurred costs in the normal course of the sale process. A majority of the expected transactionTransaction costs of approximately $70$48 million ($4935 million after-tax) and $12 million ($9 million after-tax) were recorded in 2022.during 2022 and 2023, respectively. Also, as described in Note A, depreciation and amortization expenseexpenses of approximately $61$41 million ($4228 million after-tax) were not recorded on the assets of the Clean Energy Businesses in the fourth quarter of 2022 and will continue2023 prior to not be recorded through the closing of the transaction. Further, since
Following the sale of the Clean Energy Businesses and pursuant to a reimbursement and indemnity agreement with RWE, Con Edison remains responsible for certain potential costs related to a battery storage project located in Imperial County, California. Con Edison's exposure under the agreement could range up to approximately $172 million. As of December 31, 2023, no material amounts were classifiedrecorded as held for saleliabilities on Con Edison's consolidated balance sheet related to this agreement. During 2023, Con Edison received $24 million of net proceeds from this battery storage project, and $4 million was recorded as unbilled contract revenue as of December 31, 2022 and the transaction is expected to close on or about the end of the first quarter of 2023, Con Edison analyzed the potential impact of the anticipated sale on its state apportionment factors. Based on current estimates, Con Edison recorded an increase to its net deferred income tax liabilities and valuation allowance of $111 million and $10 million, respectively, and corresponding deferred income tax expense of approximately $121 million (net of federal income taxes) in the fourth quarter of 2022.2023. See Note M.
The following table shows the pre-tax operating income for the Clean Energy Businesses for the years ended December 31, 2022, 2021 and 2020.
| | | | | | | | | | | |
| Clean Energy Businesses |
| (Millions of Dollars) | 2022 | 2021 | 2020 |
| Pre-tax operating income | $466 | $310 | $68 |
| Pre-tax operating income, excluding non-controlling interest | 406 | 158 | 23 |
The
| | | | | | | | | | | |
| For the Year Ended December 31, |
| (Millions of Dollars) | 2023 | 2022 | 2021 |
| Pre-tax operating income | $25 | $466 | $310 |
| Pre-tax operating income, excluding non-controlling interest | 21 | 406 | 158 |
Note X - Held-for-Sale Treatment of the Clean Energy Business represent a reportable segment.Businesses
On March 1, 2023, Con Edison completed the sale of all of the stock of the Clean Energy Businesses. See Note P. At December 31, 2022,W. The sale excluded tax equity interests in three projects that were retained by Con Edison and one deferred project, Broken Bow II, a 75 MW nameplate capacity wind power project located in Nebraska. Transfer of Broken Bow II
| | | | | |
| CON EDISON ANNUAL REPORT 2023 | 171 |
from Con Edison to RWE depends on one outstanding counterparty consent, and if and when such consent is obtained within two years of the sale of the Clean Energy Businesses, i.e., by February 28, 2025, the project will transfer. RWE Renewables Americas, LLC is operating the facility on behalf of Con Edison pursuant to certain service agreements for which the fees are not material.
The carrying amounts of the major classes of assets and liabilities of Broken Bow II as of December 31, 2023 and of the Clean Energy Businesses that are expected to be sold are(inclusive of Broken Bow II) as of December 31, 2022 were presented on a held-for-sale basis, and accordingly exclude certain intercompany and net deferred tax liability balances, as follows:follows:
| | | | | |
194
|
CON EDISON ANNUAL REPORT 2022 |
| | | | | |
(Millions of Dollars) | December 31,
2022 |
ASSETS | |
CURRENT ASSETS | |
Cash and temporary cash investments | $25 |
Accounts receivable and other receivables - net allowance for uncollectible accounts | 319 |
| |
Accrued unbilled revenue | 51 |
Fuel oil, gas in storage, materials and supplies, at average cost | 56 |
Restricted cash | 223 |
Fair value of derivatives assets | 84 |
Prepayments | 35 |
Other current assets | 24 |
TOTAL CURRENT ASSETS | 817 |
| |
NON-UTILITY PLANT | |
Non-utility property, net accumulated depreciation | 4,197 |
Construction work in progress | 522 |
NET PLANT | 4,719 |
OTHER NONCURRENT ASSETS | |
Goodwill | 31 |
Intangible assets, less accumulated amortization | 1,222 |
Operating lease right-of-use asset | 266 |
Fair value of derivatives assets | 93 |
Other deferred charges and noncurrent assets | 14 |
TOTAL OTHER NONCURRENT ASSETS | 1,626 |
TOTAL ASSETS | $7,162 |
(a) Not included in the fair value of derivative assets above is $2 million related to an intercompany amount with CECONY, which amount is eliminated in consolidation. See Note U as that amount is governed by derivative agreements, it will remain an asset of the Clean Energy Businesses following the expected close of the sale transaction.
| | | | | |
(Millions of Dollars) | December 31,
2022 |
LIABILITIES | |
CURRENT LIABILITIES | |
Long-term debt due within one year | $353 |
Term loan | 150 |
| |
Accounts payable | 326 |
| |
Operating lease liabilities | 33 |
Accrued Interest | 40 |
Other current liabilities | 71 |
TOTAL CURRENT LIABILITIES | 973 |
NONCURRENT LIABILITIES | |
Asset retirement obligations | 77 |
| |
Operating lease liabilities | 248 |
Other deferred credits and noncurrent liabilities | 20 |
TOTAL NONCURRENT LIABILITIES | 345 |
LONG-TERM DEBT | 2,292 |
TOTAL LIABILITIES | $3,610 |
| | | | | | | | |
| (Millions of Dollars) | December 31,
2023 | December 31,
2022 |
| ASSETS | | |
| CURRENT ASSETS | | |
| Cash and temporary cash investments | $— | $25 |
| Accounts receivable and other receivables - net allowance for uncollectible accounts | 1 | 319 |
| Accrued unbilled revenue | 1 | 51 |
| Fuel oil, gas in storage, materials and supplies, at average cost | — | 56 |
| Restricted cash | 5 | 223 |
| Fair value of derivatives assets | — | 84 |
| Prepayments | — | 35 |
| Other current assets | 1 | 24 |
| TOTAL CURRENT ASSETS | 8 | 817 |
| NON-UTILITY PLANT | | |
| Non-utility property, net accumulated depreciation | 76 | 4,197 |
| Construction work in progress | — | 522 |
| NET PLANT | 76 | 4,719 |
| OTHER NONCURRENT ASSETS | | |
| Goodwill | — | | 31 |
| Intangible assets, less accumulated amortization | 72 | 1,222 |
| Operating lease right-of-use asset | 7 | 266 |
| Fair value of derivatives assets | — | 93 |
| | |
| | |
| Other deferred charges and noncurrent assets | — | 14 |
| TOTAL OTHER NONCURRENT ASSETS | 79 | 1,626 |
| TOTAL ASSETS | $163 | $7,162 |
| | | | | | | | |
| (Millions of Dollars) | December 31,
2023 | December 31,
2022 |
| LIABILITIES | | |
| CURRENT LIABILITIES | | |
| Long-term debt due within one year | $2 | $353 |
| Term loan | — | 150 |
| Accounts payable | — | 326 |
| | |
| | |
| | |
| | |
| | |
| Operating lease liabilities | 2 | 33 |
| Accrued Interest | — | 40 |
| Other current liabilities | 4 | 71 |
| TOTAL CURRENT LIABILITIES | 8 | 973 |
| NONCURRENT LIABILITIES | | |
| Asset retirement obligations | 3 | 77 |
| | |
| Operating lease liabilities | 5 | 248 |
| Other deferred credits and noncurrent liabilities | — | 20 |
| | |
| TOTAL NONCURRENT LIABILITIES | 8 | 345 |
| LONG-TERM DEBT | 60 | 2,292 |
| TOTAL LIABILITIES | $76 | $3,610 |
| | | | | |
172 | CON EDISON ANNUAL REPORT 2022 | 1952023 |
Schedule I
Condensed Financial Information of Consolidated Edison, Inc. (a) (b)
Condensed Statement of Income and Comprehensive Income
(Parent Company Only)
| | | | For the Years Ended December 31, | | For the Years Ended December 31, |
| (Millions of Dollars, except per share amounts) | (Millions of Dollars, except per share amounts) | 2022 | | 2021 | | 2020 | (Millions of Dollars, except per share amounts) | 2023 | | 2022 | | 2021 |
| Equity in earnings of subsidiaries | Equity in earnings of subsidiaries | $1,860 | | $1,369 | | $1,105 | Equity in earnings of subsidiaries | $1,759 | | $1,860 | | $1,369 |
| Other operating and maintenance expenses | Other operating and maintenance expenses | (1) | | (1) | | (1) | Other operating and maintenance expenses | — | | (1) |
| Taxes other than income taxes | Taxes other than income taxes | (7) | | (6) | | (12) | Taxes other than income taxes | (2) | | (7) | | (6) |
| Other income (deductions) | Other income (deductions) | (31) | | 14 | | 33 | Other income (deductions) | 7 | | (31) | | 14 |
| Interest expense | Interest expense | (32) | | (37) | | (60) | Interest expense | (14) | | (32) | | (37) |
| Income tax expense (benefit) | (129) | | 7 | | 36 |
| Income tax benefit (expense) | | Income tax benefit (expense) | (96) | | (129) | | 7 |
| Gain on the sale of the Clean Energy Businesses | | Gain on the sale of the Clean Energy Businesses | 865 | | — |
| Net Income | Net Income | $1,660 | | $1,346 | | $1,101 | Net Income | $2,519 | | $1,660 | | $1,346 |
| Comprehensive Income | Comprehensive Income | $1,677 | | $1,376 | | $1,095 | Comprehensive Income | $2,520 | | $1,677 | | $1,376 |
| Net Income Per Share – Basic | Net Income Per Share – Basic | $4.68 | | $3.86 | | $3.29 | Net Income Per Share – Basic | $7.25 | | $4.68 | | $3.86 |
| Net Income Per Share – Diluted | Net Income Per Share – Diluted | $4.66 | | $3.85 | | $3.28 | Net Income Per Share – Diluted | $7.21 | | $4.66 | | $3.85 |
| Dividends Declared Per Share | Dividends Declared Per Share | $3.16 | | $3.10 | | $3.06 | Dividends Declared Per Share | $3.24 | | $3.16 | | $3.10 |
| Average Number Of Shares Outstanding—Basic (In Millions) | Average Number Of Shares Outstanding—Basic (In Millions) | 354.5 | | 348.4 | | 334.8 | Average Number Of Shares Outstanding—Basic (In Millions) | 347.7 | | 354.5 | | 348.4 |
| Average Number Of Shares Outstanding—Diluted (In Millions) | Average Number Of Shares Outstanding—Diluted (In Millions) | 355.8 | | 349.4 | | 335.7 | Average Number Of Shares Outstanding—Diluted (In Millions) | 349.3 | | 355.8 | | 349.4 |
(a)These financial statements, in which Con Edison’s subsidiaries have been included using the equity method, should be read together with its consolidated financial statements and the notes thereto appearing above.
(b)Certain prior period amounts have been reclassified to conform with current period presentation.
| | | | | |
196
|
20222023 | 173 |
Condensed Financial Information of Consolidated Edison, Inc. (a) (c)
Condensed Statement of Cash Flows
(Parent Company Only)
| | | | | | | | | | | | | | | | | |
| | For the Years Ended December 31, |
| (Millions of Dollars) | 2022 | | 2021 | | 2020 |
| Net Income | $1,660 | | $1,346 | | $1,101 |
| Equity in earnings of subsidiaries | (1,860) | | (1,369) | | (1,105) |
| Deferred income taxes | 163 | | 119 | | 32 |
| Dividends received from: | | | | | |
| CECONY | 978 | | 988 | | 982 |
| O&R | 57 | | 52 | | 49 |
| Clean Energy Businesses | 98 | | 64 | | 21 |
| Con Edison Transmission | 1 | | 152 | | 11 |
| Change in Assets and Liabilities: | | | | | |
| | | | | |
| | | | | |
| Accounts receivable from affiliated companies | (138) | | 57 | | (386) |
| Accrued taxes to affiliated companies | (1) | | (1) | | (78) |
| Accounts payable to affiliated companies | 1 | | 1 | | — |
| | | | | |
Other – net (b) | 56 | | 50 | | (89) |
Net Cash Flows from Operating Activities(b) | 1,015 | | 1,459 | | 538 |
| Investing Activities | | | | | |
| Contributions to subsidiaries | (150) | | (1,135) | | (626) |
| Debt receivable from affiliated companies | — | | 875 | | 400 |
| Net Cash Flows Used in Investing Activities | (150) | | (260) | | (226) |
| Financing Activities | | | | | |
| Net proceeds of short-term debt | 632 | | 50 | | (537) |
| Issuance of long-term debt | — | | — | | 650 |
Retirement of long-term debt(b) | (293) | | (1,178) | | (3) |
| Debt issuance costs | — | | (1) | | (3) |
| Issuance of common shares for stock plans, net of repurchases | 57 | | 60 | | 58 |
| Issuance of common shares - public offering | — | | 775 | | 640 |
| Common stock dividends | (1,089) | | (1,030) | | (975) |
Net Cash Flows Used in Financing Activities(b) | (693) | | (1,324) | | (170) |
| Net Change for the Period | 172 | | (125) | | 142 |
| Balance at Beginning of Period | 19 | | 144 | | 2 |
| Balance at End of Period | $191 | | $19 | | $144 |
| | | | | |
| | | | | | | | | | | | | | | | | |
| | For the Years Ended December 31, |
| (Millions of Dollars) | 2023 | | 2022 | | 2021 |
| | | | | |
| | | | | |
| | | | | |
| | | | | |
| | | | | |
| | | | | |
| | | | | |
| | | | | |
| | | | | |
| | | | | |
| | | | | |
| | | | | |
| | | | | |
| | | | | |
| | | | | |
| | | | | |
| Net Cash Flows From Operating Activities | $772 | | $1,015 | | $1,459 |
| Investing Activities | | | | | |
| Contributions to subsidiaries | (1,854) | | (150) | | (1,135) |
| Debt receivable from affiliated companies | — | | — | | 875 |
| Proceeds from sale of the Clean Energy Businesses, net of cash and cash equivalents sold | 3,927 | | — | | — |
| Net Cash Flows From (Used in) Investing Activities | 2,073 | | (150) | | (260) |
| Financing Activities | | | | | |
| Net (payment)/issuance of short-term debt | (343) | | 632 | | 50 |
| | | | | |
| Retirement of long-term debt | (650) | | (293) | | (1,178) |
| Debt issuance costs | — | | — | | (1) |
| Repurchase of common shares | (1,000) | | — | | — |
| Issuance of common shares for stock plans | 56 | | 57 | | 60 |
| Issuance of common shares - public offering | — | | — | | 775 |
| Common stock dividends | (1,096) | | (1,089) | | (1,030) |
| Net Cash Flows Used in Financing Activities | (3,033) | | (693) | | (1,324) |
| Net Change for the Period | (188) | | 172 | | (125) |
| Balance at Beginning of Period | 191 | | 19 | | 144 |
| Balance at End of Period | $3 | | $191 | | $19 |
| | | | | |
(a)These financial statements, in which Con Edison’s subsidiaries have been included using the equity method, should be read together with its consolidated financial statements and the notes thereto appearing above.
(b)During 2021, Con Edison identified that the reclassification of debt from long-term to current for the year ended December 31, 2020 had been erroneously presented within the operating cash flow section as a cash inflow and in the financing section as a cash outflow in the Condensed Statement of Cash Flows (Parent Company Only). The amounts for the year ended December 31, 2020 have been revised to correct the error in the classification of $1,175 million from Other - net within Net Cash Flows from Operating Activities to Retirement of long-term debt within Net Cash Flows Used in Financing Activities. Con Edison has evaluated the effect of these misstatements, both qualitatively and quantitatively, and concluded that they are not material to the financial statements issued for the year ended December 31, 2020. These amounts were correctly presented on the Consolidated Statement of Cash Flows for the year ended December 31, 2020.
(c)Certain prior period amounts have been reclassified to conform with current period presentation.
| | | | | |
174 | CON EDISON ANNUAL REPORT 2022 | 1972023 |
Condensed Financial Information of Consolidated Edison, Inc. (a) (b)
Condensed Balance Sheet
(Parent Company Only)
| | | | | December 31, | | | December 31, |
| (Millions of Dollars) | (Millions of Dollars) | | 2022 | | 2021 | (Millions of Dollars) | | 2023 | | 2022 |
| Assets | Assets | |
| Current Assets | Current Assets | |
| Current Assets | |
| Current Assets | |
| Cash and temporary cash investments | |
| Cash and temporary cash investments | |
| Cash and temporary cash investments | Cash and temporary cash investments | | $191 | | $19 | | $3 | | $191 |
| Other receivables, net allowance for uncollectible accounts | Other receivables, net allowance for uncollectible accounts | | 4 | | — | Other receivables, net allowance for uncollectible accounts | | 103 | | 4 |
| Tax receivable | Tax receivable | | 5 | | 3 | Tax receivable | | 1 | | 5 |
| | Accounts receivable from affiliated companies | Accounts receivable from affiliated companies | | 1,337 | | 1,199 |
| Accounts receivable from affiliated companies | |
| Accounts receivable from affiliated companies | | | 343 | | 1,337 |
| Accrued unbilled revenue | | Accrued unbilled revenue | | 4 | | — |
| Prepayments | Prepayments | | 9 | | 28 | Prepayments | | 109 | | 9 |
| Other current assets | Other current assets | | 32 | | 14 | Other current assets | | 3 | | 32 |
| Total Current Assets | Total Current Assets | | 1,578 | | 1,263 | Total Current Assets | | 566 | | 1,578 |
| Investments in subsidiaries and others | Investments in subsidiaries and others | | 20,839 | | 19,951 | Investments in subsidiaries and others | | 20,778 | | 20,839 |
| Goodwill | Goodwill | | 406 | | 406 | Goodwill | | 406 |
| Pension and retiree benefits - asset | Pension and retiree benefits - asset | | 5 | | — | Pension and retiree benefits - asset | | 5 |
| Other deferred charges and noncurrent assets | Other deferred charges and noncurrent assets | | 2 | | 8 | Other deferred charges and noncurrent assets | | 249 | | 2 |
| Total Assets | Total Assets | | $22,830 | | $21,628 | Total Assets | | $22,004 | | $22,830 |
| Liabilities and Shareholders’ Equity | Liabilities and Shareholders’ Equity | |
| Current Liabilities | Current Liabilities | |
| Current Liabilities | |
| Current Liabilities | |
| Long-term debt due within one year | |
| Long-term debt due within one year | |
| Long-term debt due within one year | Long-term debt due within one year | | $649 | | $293 | | $— | | $649 |
| Term loan | Term loan | | 400 | | | — | |
| Notes payable | Notes payable | | 282 | | 50 | Notes payable | | 339 | | 282 |
| Accounts payable | Accounts payable | | 39 | | 1 | Accounts payable | | 30 | | 39 |
| Accounts payable to affiliated companies | Accounts payable to affiliated companies | | 11 | | 10 | Accounts payable to affiliated companies | | 12 | | 11 |
| Accrued taxes | Accrued taxes | | 7 | | 2 | Accrued taxes | | 15 | | 7 |
| Accrued taxes to affiliated companies | Accrued taxes to affiliated companies | | 506 | | 507 | Accrued taxes to affiliated companies | | 437 | | 506 |
| Accrued interest | Accrued interest | | 7 | | 2 | Accrued interest | | — | | 7 |
| Other current liabilities | Other current liabilities | | 7 | | 7 | Other current liabilities | | 8 | | 7 |
| Total Current Liabilities | Total Current Liabilities | | 1,908 | | 872 | Total Current Liabilities | | 841 | | 1,908 |
| Deferred income taxes and unamortized investment tax credits | Deferred income taxes and unamortized investment tax credits | | 235 | | 72 | Deferred income taxes and unamortized investment tax credits | | — | | 235 |
| Long-term debt | | — | | 647 |
| Other noncurrent liabilities | | Other noncurrent liabilities | | 5 | | | — |
| | Total Liabilities | |
| Total Liabilities | |
| Total Liabilities | Total Liabilities | | 2,143 | | 1,591 | | 846 | | 2,143 |
| Shareholders’ Equity | Shareholders’ Equity | |
| Common stock, including additional paid-in capital | |
| Common stock, including additional paid-in capital | |
| Common stock, including additional paid-in capital | Common stock, including additional paid-in capital | | 9,840 | | 9,748 | | 9,898 | | 9,840 |
| Retained earnings | Retained earnings | | 10,847 | | 10,289 | Retained earnings | | 11,260 | | 10,847 |
| Total Shareholders’ Equity | Total Shareholders’ Equity | | 20,687 | | 20,037 | Total Shareholders’ Equity | | 21,158 | | 20,687 |
| Total Liabilities and Shareholders’ Equity | Total Liabilities and Shareholders’ Equity | | $22,830 | | $21,628 | Total Liabilities and Shareholders’ Equity | | $22,004 | | $22,830 |
(a)These financial statements, in which Con Edison’s subsidiaries have been included using the equity method, should be read together with its consolidated financial statements and the notes thereto appearing above.
(b)Certain prior period amounts have been reclassified to conform with current period presentation.
| | | | | |
198
|
2022 |
Schedule II
Valuation and Qualifying Accounts
For the Years Ended December 31, 2022, 2021 and 2020
| | | | | | | | | | | | | | | | | | | | | | | | | | | | | | | | | | | | | | | | | |
| | | | | | COLUMN C Additions | | | | |
Company (Millions of Dollars) | COLUMN A Description | | | | COLUMN B Balance at Beginning of Period | | (1) Charged To Costs And Expenses | | (2) Charged To Other Accounts | | COLUMN D Deductions (b) | | COLUMN E Balance At End of Period |
| Con Edison | Allowance for uncollectible accounts (a): | | | | | | | | | | | | |
| | | 2022 | | $339 | | $78 | | $80 | | $(165) | | $332 |
| | | 2021 | | $154 | | $83 | | $— | | $102 | | $339 |
| | | 2020 | | $74 | | $72 | | $— | | $8 | | $154 |
| CECONY | Allowance for uncollectible accounts (a): | | | | | | | | | | | | |
| | | 2022 | | $323 | | $74 | | $80 | | $(156) | | $321 |
| | | 2021 | | $143 | | $78 | | $— | | $102 | | $323 |
| | | | 2020 | | $68 | | $65 | | $— | | $10 | | $143 |
(a)This is a valuation account deducted in the balance sheet from the assets (Accounts receivable - customers and Other receivables) to which they apply.
(b)Accounts written off less cash collections, miscellaneous adjustments and amounts reinstated as receivables previously written off.
| 2023 | | | | | |
CON EDISON ANNUAL REPORT 2022 | 199175 |
Item 9: Changes in and Disagreements with Accountants on Accounting and Financial Disclosure
Con Edison
None.
CECONY
None.
Item 9A: Controls and Procedures
The Companies maintain disclosure controls and procedures designed to provide reasonable assurance that the information required to be disclosed in the reports that they submit to the Securities and Exchange Commission (SEC) is recorded, processed, summarized and reported within the time periods specified in the rules and forms of the SEC. Disclosure controls and procedures include, without limitation, controls and procedures designed to ensure that information required to be disclosed by an issuer in the reports that it files or submits under the Securities Exchange Act of 1934, as amended, is accumulated and communicated to the issuer’s management, including its principal executive and principal financial officers, or persons performing similar functions, as appropriate to allow timely decisions regarding required disclosure. For each of the Companies, its management, with the participation of its principal executive officer and principal financial officer, has evaluated its disclosure controls and procedures as of the end of the period covered by this report and, based on such evaluation, has concluded that the controls and procedures are effective to provide such reasonable assurance. Reasonable assurance is not absolute assurance, however, and there can be no assurance that any design of controls or procedures would be effective under all potential future conditions, regardless of how remote.
For the Companies’ Reports of Management On Internal Control Over Financial Reporting and the related opinions of PricewaterhouseCoopers LLP (presented in the Reports of Independent Registered Public Accounting Firm), see Item 8 of this report (which information is incorporated herein by reference).
There wasIn October 2023, CECONY and O&R replaced their separate existing customer billing and information systems with a single new customer billing and information system. The Utilities expect the new system to further automate the processes by which the Utilities bill their customers and enhance payment, credit and collections activities. Throughout this system implementation, the Utilities appropriately considered internal controls over financial reporting. Other than with respect to this item, there were no changechanges in the Companies’ internal control over financial reporting that occurred during the Companies’ most recent fiscal quarter that has materially affected, or is reasonably likely to materially affect, the Companies’ internal control over financial reporting.
Item 9B: Other Information
Con Edison
None.
CECONY
None.During the three months ended December 31, 2023, no director or officer (as defined in Rule 16a-1(f) of the Securities Exchange Act of 1934, as amended) adopted, terminated or modified any Rule 10b5-1 or non-Rule 10b5-1 trading arrangement (as defined in Item 408(a) of Regulation S-K).
Item 9C: Disclosure Regarding Foreign Jurisdictions that Prevent Inspections
Not Applicable.
| | | | | |
200176
|
20222023 |
Part III
Item 10: Directors, Executive Officers and Corporate Governance
Item 11: Executive Compensation
Item 12: Security Ownership of Certain Beneficial Owners and Management and Related Stockholder Matters
Item 13: Certain Relationships and Related Transactions, and Director Independence
Item 14: Principal Accounting Fees and Services
Con Edison
Information required by Part III as to Con Edison, other than the information required in Item 12 of this report by Item 201(d) of Regulation S-K, is incorporated by reference from Con Edison’s definitive proxy statement for its Annual Meeting of Stockholders to be held on May 15, 2023.20, 2024. The proxy statement is to be filed pursuant to Regulation 14A not later than 120 days after December 31, 2022,2023, the close of the fiscal year covered by this report.
The information required pursuant to Item 201(d) of Regulation S-K as at December 31, 20222023 is as follows:
Equity Compensation Plan Information
| | Plan category | Plan category | Number of securities to be issued upon exercise of outstanding options, warrants and rights | | | Weighted-average exercise price of outstanding options, warrants and rights | | Number of securities remaining available for future issuance under equity compensation plans (excluding securities reflected in column (1)) | Plan category | Number of securities to be issued upon exercise of outstanding options, warrants and rights | | | Weighted-average exercise price of outstanding options, warrants and rights | | Number of securities remaining available for future issuance under equity compensation plans (excluding securities reflected in column (1)) |
| | | (1) | | (2) | | (3) | | (1) | | (2) | | (3) |
| Equity compensation plans approved by security holders | Equity compensation plans approved by security holders | |
| 2003 LTIP (a) | 2003 LTIP (a) | 93,180 | | | — | | — |
| 2003 LTIP (a) | |
| 2003 LTIP (a) | | 35,819 | | | — |
| 2013 LTIP (b) | 2013 LTIP (b) | 1,416,416 | | | — | | 2,959,880 | 2013 LTIP (b) | 1,595,201 | | | — | | 2,725,420 |
| 2023 LTIP (b) | | 2023 LTIP (b) | 25,653 | | | — | | 9,974,347 |
| Stock Purchase Plan (c) | Stock Purchase Plan (c) | — | | | — | | 3,272,880 | Stock Purchase Plan (c) | — | | | — | | 2,521,178 |
| Total equity compensation plans approved by security holders | Total equity compensation plans approved by security holders | 1,509,596 | | | — | | 6,232,760 | Total equity compensation plans approved by security holders | 1,656,673 | | | — | | 15,220,945 |
| Total equity compensation plans not approved by security holders | Total equity compensation plans not approved by security holders | 500 | (d) | | — | | — | Total equity compensation plans not approved by security holders | — | | | — | | — |
| Total | Total | 1,510,096 | | | — | | 6,232,760 | Total | 1,656,673 | | | — | | 15,220,945 |
(a)The number of shares of Con Edison common stock that may be issued pursuant to outstanding awards under the Long Term Incentive Plan approved by the company’s shareholders in 2003 (the “2003 LTIP”) include 93,18035,819 shares for stock unit awards made prior to 2013 that have vested and for which the receipt of shares was deferred. Amounts do not include shares that may be issued pursuant to any dividend reinvestment in the future on the deferred stock units. There is no dividend reinvestment on the other outstanding awards. Outstanding awards had no exercise price. No new awards may be made under the 2003 LTIP.
(b)The number of shares of Con Edison common stock that may be issued pursuant to outstanding awards under the Long Term Incentive Plan approved by the company’s shareholders in 2013 (the “2013 LTIP”) include: (A) outstanding awards made in 2014 and subsequent years (912,098(924,898 shares for performance restricted stock units and 180,588345,199 shares for time-based restricted stock units); (B) 323,730325,104 shares covered by outstanding directors’ deferred stock unit awards (which vested upon grant)), and under the Long Term Incentive Plan approved by the company's shareholders in 2023 (the "2023 LTIP"), 25,653 shares covered by outstanding directors’ deferred stock unit awards (which vest upon grant). Amounts do not include shares that may be issued pursuant to any dividend reinvestment in the future on the deferred stock units. There is no dividend reinvestment on the other outstanding awards. The outstanding awards had no exercise price. No new awards may be made under the 2013 LTIP after May 20, 2023.
(c)Shares of Con Edison common stock may be issued under the Stock Purchase Plan until May 19, 2024 (which is 10 years after the date of the annual meeting at which Con Edison’s shareholders approved the plan).
(d)This amount represents shares to be issued to an officer who had elected to defer receipt of these shares until separation from service or later. These shares are issuable pursuant to awards of restricted stock units made in 2000, which vested in 2004.
For additional information about Con Edison’s stock-based compensation, see Note O to the financial statements in Item 8 of this report (which information is incorporated herein by reference).
In accordance with General Instruction G(3) to Form 10-K, other information regarding Con Edison’s Executive Officers may be found in Part I of this report under the caption “Information about our Executive Officers.”
CECONY
Information required by Items 10, 11, 12 and 13 of Part III as to CECONY is omitted pursuant to Instruction (I)(2) to Form 10-K (Omission of Information by Certain Wholly-Owned Subsidiaries).
| | | | | |
CON EDISON ANNUAL REPORT 20222023 | 201177 |
Fees paid or payable by CECONY to its principal accountant, PricewaterhouseCoopers LLP, for services related to 20222023 and 20212022 are as follows:
| | 2022 | | 2021 |
| 2023 | | | 2023 | | 2022 |
| Audit fees | Audit fees | $3,690,800 | | $3,648,191 | Audit fees | $5,009,627 | | $3,690,800 |
| Audit-related fees (a) | Audit-related fees (a) | 753,795 | | 488,806 | Audit-related fees (a) | 909,768 | | 753,795 |
| Total fees | Total fees | $4,444,595 | | $4,136,997 | Total fees | $5,919,395 | | $4,444,595 |
(a)Relates to assurance and related service fees that are reasonably related to the performance of the annual audit or quarterly reviews of the company's financial statements that are not specifically deemed “Audit Services.” The major items included in audit-related fees in 20212022 and 20222023 are fees related to reviews of system implementations and associated internal controls.
Con Edison’s Audit Committee or, as delegated by the Audit Committee, the Chair of the Committee, approves in advance each auditing service and non-audit service permitted by applicable laws and regulations, including tax services, to be provided to CECONY by its independent accountants.
| | | | | |
202178
|
20222023 |
Part IV
Item 15: Exhibits and Financial Statement Schedules
(a) Documents filed as part of this report:
1. List of Financial Statements – See financial statements listed in Item 8.
2. List of Financial Statement Schedules – See schedules listed in Item 8.
3. List of Exhibits
Exhibits listed below which have been filed previously with the Securities and Exchange Commission pursuant to the Securities Act of 1933 and the Securities Exchange Act of 1934, and which were designated as noted below, are hereby incorporated by reference and made a part of this report with the same effect as if filed with the report. Exhibits listed below that were not previously filed are filed herewith.
| | | | | |
CON EDISON ANNUAL REPORT 20222023 | 203179 |
Con Edison
| | | | | | | | |
| 3.1.1 | | |
| |
| 3.1.2 | | |
| | |
| 4.1.1 | | |
| | |
| 4.1.2.1 | | |
| | |
| 4.1.2.2 | | |
| | |
| | |
4.1.2.3 | | |
| | |
4.1.3 | | |
| | |
10.1.1.110.1.1 | | Credit Agreement, dated as of December 7, 2016, among CECONY, Con Edison, O&R, the lenders party thereto and Bank of America, N.A. March 27, 2023, as Administrative Agent. (Designated in Con Edison’s Current Report on Form 8-K dated December 7, 2016 (File No. 1-14514) as Exhibit 10) |
| | |
10.1.1.2 | | |
| | |
10.1.1.3 | | Extension Agreement and First Amendment to Credit Agreement, effective April 1, 2019, among CECONY, Con Edison, O&R, the lenders party thereto and Bank of America, N.A., as Administrative Agent. (Designated in Con Edison’s Current Report on Form 8-K dated April 1, 2019March 27, 2023 (File No. 1-14514) as Exhibit 10)10.1) |
| | |
10.1.210.1.3.1 | | |
| | |
10.1.2.1 | | |
| | |
10.1.3 | | |
| | |
| 10.1.3.2 | | |
| | |
| 10.1.4 | | |
| | |
| 10.1.4.1 | | |
| | |
| 10.1.4.2 | | |
| |
| 10.1.4.3 | | |
| | |
| 10.1.4.4 | | |
| | |
| 10.1.5.1 | | |
| | |
| 10.1.5.2 | | |
| | |
| 10.1.5.3 | | |
| | |
10.1.5.4
| |
|
| | |
| 10.1.5.5 | |
|
| | |
| 10.1.5.6 | |
|
| | |
| 10.1.5.7 | |
|
| | |
| 10.1.5.8 | | |
| | |
| 10.1.5.9 | | |
| | |
| 10.1.5.10 | | |
| | |
| | | | | |
204
|
CON EDISON ANNUAL REPORT 2022 |
| | | | | | | | |
| 10.1.5.11 | | |
| | |
| 10.1.5.12 | | |
| | |
| 10.1.6.1 | | |
| | |
10.1.6.2
| | |
| | |
| 10.1.6.3 | |
|
| | |
| 10.1.6.4 | |
|
| | | | | |
180 | CON EDISON ANNUAL REPORT 2023 |
| | | | | | | | |
| | |
| 10.1.6.5 | |
|
| | |
| 10.1.6.6 | | |
| | |
| 10.1.6.7 | | |
| | |
| 10.1.6.8 | | |
| | |
| | | | | | | | |
10.1.710.1.7.1 | |
|
| | |
| 10.1.7.2 | |
|
| | |
| 10.1.8.1 | | |
| | |
| 10.1.8.2 | | |
| | |
| 10.1.8.3 | | |
| | |
10.1.8.4 | | |
| | |
| 10.1.9.1 | | |
| | |
| 10.1.9.2 | | |
| | |
| 10.1.9.3 | | |
| | |
| 10.1.9.4 | | |
| | |
| 10.1.9.5 | | |
| | |
| 10.1.10.1 | | |
| | |
| 10.1.10.2 | | |
| | |
| 10.1.10.3 | | |
| | |
| 10.1.11 | | |
| | |
| 10.1.12 | | |
| | |
10.1.1110.1.13 | | |
| | |
10.1.12 | | |
| | |
10.1.1310.1.14 | | |
| | |
| | |
10.1.14 | |
|
| | |
| 10.1.15 | | |
| | |
| 21.1 | | Subsidiaries of Con Edison(Designated in Con Edison's Annual Report on Form 10-K for the year ended December 31, 2019 (File No. 1-14514) as Exhibit 21.1) |
| | |
| 23.1 | | |
| | |
| 31.1.1 | | |
| | |
| 31.1.2 | | |
| | |
| 32.1.1 | | |
| | |
| | | | | |
CON EDISON ANNUAL REPORT 2022 | 205 |
| | | | | | | | |
| 32.1.2 | | |
| | |
| 97.1 | | |
| | |
| 101.INS | | XBRL Instance Document |
| | |
| | | | | |
| CON EDISON ANNUAL REPORT 2023 | 181 |
| | | | | | | | |
| 101.SCH | | XBRL Taxonomy Extension Schema |
| | |
| 101.CAL | | XBRL Taxonomy Extension Calculation Linkbase |
| | |
| 101.DEF | | XBRL Taxonomy Extension Definition Linkbase |
| | |
| 101.LAB | | XBRL Taxonomy Extension Label Linkbase |
| | |
| 101.PRE | | XBRL Taxonomy Extension Presentation Linkbase |
| 104 | | Cover Page Interactive Data File - The cover page iXBRL tags are embedded within the inline XBRL document |
| | |
Pursuant to Item 601(b)(4)(iii)(A) of Regulation S-K, instruments defining the rights of holders of long-term debt of Con Edison’s subsidiaries other than CECONY, the total amount of which does not exceed ten percent of the total assets of Con Edison and its subsidiaries on a consolidated basis, are not filed as exhibits to Con Edison’s Form 10-K or Form 10-Q. Con Edison agrees to furnish to the SEC upon request a copy of any such instrument.
CECONY
| | | | | | | | |
| 3.2.2 | | |
| | |
| 4.2.1 | |
|
| | |
| 4.2.2 | |
|
| | |
| 4.2.3 | |
|
| | |
| 4.2.4.1 | |
|
| | |
| 4.2.4.2 | |
|
| | |
| 4.2.5 | |
|
| | |
| 4.2.6.1 | |
|
| | |
| 4.2.6.2 | |
|
| | |
| 4.2.7.1 | |
|
| | | | | |
206182
|
20222023 |
| | | | | | | | |
| 4.2.8 | | The following forms of CECONY’s Debentures, which are designated as follows: |
| | | | | | | | | | | | |
| | Securities Exchange Act File No. 1-1217 |
| Debenture Series | Form | Date | Exhibit |
| | 8-K | 4/7/2003 | 4 | |
| | 8-K | 6/10/2003 | 4.2 | |
| | 8-K | 2/11/2004 | 4.2 | |
| | 8-K | 3/7/2005 | 4 | |
| | 8-K | 6/20/2005 | 4 | |
| | 8-K | 3/9/2006 | 4 | |
| | 8-K | 6/15/2006 | 4 | |
| | 8-K | 12/1/2006 | 4.2 | |
| | 8-K | 8/28/2007 | 4 | |
| | 8-K | 4/4/2008 | 4.2 | |
| | 8-K | 12/4/2009 | 4 | |
| | 8-K | 6/2/2010 | 4.1 | |
| | 8-K | 6/2/2010 | 4.2 | |
| | 8-K | 3/8/2012 | 4 | |
| | 8-K | 2/25/2013 | 4 | |
| | 8-K | 3/3/2014 | 4 | |
| | 8-K | 11/19/2014 | 4.1 | |
| | 8-K | 11/19/2014 | 4.2 | |
| | 8-K | 11/12/2015 | 4 | |
| | 8-K | 6/14/2016 | 4 | |
| | 8-K | 11/10/2016 | 4.1 | |
| | 8-K | 11/10/2016 | 4.2 | |
| | 8-K | 6/5/2017 | 4 | |
| | 8-K | 11/13/2017 | 4.1 | |
| | 8-K | 11/13/2017 | 4.2 | |
| | 8-K | 5/7/2018 | 4.1 | |
| | 8-K | 5/7/2018 | 4.2 | |
| | 8-K | 6/21/2018 | 4.0 | |
| | 8-K | 11/27/2018 | 4.1 | |
| | 8-K | 11/27/2018 | 4.2 | |
| | 8-K | 5/6/2019 | 4 | |
| | 8-K | 11/5/2019 | 4 | |
| | 8-K | 3/26/2020 | 4.1 | |
| | 8-K | 3/26/2020 | 4.2 | |
| | 8-K | 11/9/2020 | 4 | |
| | 8-K | 6/3/2021 | 4.1 | |
| | 8-K | 11/29/2021 | 4.1 | |
| | 8-K | 6/3/2021 | 4.2 | |
| | 8-K | 11/29/2021 | 4.2 | |
| | 8-K | 11/9/2022 | 4 | |
| | 8-K | 2/21/2023 | 4 | |
| | 8-K | 11/20/2023 | 4.1 | |
| | 8-K | 11/20/2023 | 4.2 | |
| | | | | |
| CON EDISON ANNUAL REPORT 2022 | 207
| | | | | | | | |
| 10.2.1 | | 364-Day Revolving Credit Agreement, dated as of March 31, 2022,27, 2023, among CECONY, the lenders party thereto and Bank of America, N.A., as Administrative Agent (Designated in CECONY’s Current Report on Form 8-K, dated March 31, 202227, 2023 (File No. 1-1217) as Exhibit 10)10.2). |
| | |
| 10.2.2 | | |
| | |
| 10.2.3 | | |
| | |
| 10.2.4.1 | | |
| | |
| | | | | |
| CON EDISON ANNUAL REPORT 2023 | 183 |
| | | | | | | | |
| 10.2.4.2 | | |
| | |
| 10.2.4.3 | | |
| | |
| 10.2.4.4 | | |
| | |
| 10.2.4.5 | | |
| | |
| 10.2.4.6 | | |
| | |
| 10.2.4.7 | | |
| | |
| 10.2.4.8 | | |
| | |
| 10.2.5.1 | | |
| | |
| 10.2.5.2 | | |
| | |
| 10.2.6 | | |
| | |
| 10.2.7 | | |
| | |
10.2.810.2.8.1 | | |
| | |
| 10.2.8.2 | | |
| | |
| 10.2.9 | |
|
| | |
| 10.2.10.1 | | |
| | |
| 10.2.10.2 | | |
| | |
| 23.2 | | |
| | |
| 31.2.1 | | |
| | |
| 31.2.2 | | |
| | |
| 32.2.1 | | |
| | |
| 32.2.2 | | |
| | |
| 101.INS | | XBRL Instance Document |
| | |
| 101.SCH | | XBRL Taxonomy Extension Schema |
| | |
| 101.CAL | | XBRL Taxonomy Extension Calculation Linkbase |
| | |
| 101.DEF | | XBRL Taxonomy Extension Definition Linkbase |
| | |
| 101.LAB | | XBRL Taxonomy Extension Label Linkbase |
| | |
| 101.PRE | | XBRL Taxonomy Extension Presentation Linkbase |
| 104 | | Cover Page Interactive Data File - The cover page iXBRL tags are embedded within the inline XBRL document
|
| | |
| | | | | |
208
|
CON EDISON ANNUAL REPORT 2022 |
| | | | | |
184 | CON EDISON ANNUAL REPORT 2023 |
Item 16: Form 10-K Summary
None.
Supplemental Information to be Furnished With Reports Filed Pursuant to Section 15(d) of the Securities Exchange Act of 1934 by Registrants Which Have Not Registered Securities Pursuant to Section 12 of the Securities Exchange Act of 1934.
No annual report to security holders covering CECONY’s last fiscal year has been sent to its security holders. No proxy statement, form of proxy or other proxy soliciting material has been sent to CECONY’s security holders during such period.
| | | | | |
CON EDISON ANNUAL REPORT 20222023 | 209185 |
Signatures
Pursuant to the requirements of Section 13 or 15(d) of the Securities Exchange Act of 1934, each Registrant has duly caused this report to be signed on its behalf by the undersigned, thereunto duly authorized, on February 16, 2023.15, 2024.
Consolidated Edison, Inc.
Consolidated Edison Company of New York, Inc.
| | | | | | | | |
| By | /s/ Robert Hoglund | |
| Robert Hoglund Senior Vice President and Chief Financial Officer | |
Pursuant to the requirements of the Securities Exchange Act of 1934, this report has been signed below by the following persons on behalf of the Registrant, and in the capacities indicated, on February 16, 2023.15, 2024.
| | | | | | | | | | | | | | |
| Signature | | Registrant | | Title |
| | | | |
| /s/ Timothy P. Cawley | | Con Edison
| | Chairman of the Board, President, Chief Executive Officer and Director (Principal Executive Officer) |
| Timothy P. Cawley | | CECONY | | Chairman of the Board, Chief Executive Officer and Trustee (Principal Executive Officer) |
| | | | |
| /s/ Robert Hoglund | | Con Edison | | Senior Vice President and Chief Financial Officer
(Principal Financial Officer)
|
| Robert Hoglund | | CECONY | | Senior Vice President and Chief Financial Officer (Principal Financial Officer) |
| | | | |
| /s/ Joseph Miller | | Con Edison | | Vice President, Controller and Chief Accounting Officer (Principal Accounting Officer) |
| Joseph Miller | | CECONY | | Vice President, Controller and Chief Accounting Officer (Principal Accounting Officer) |
| | | | |
| /s/ Ellen V. Futter | | Con Edison
CECONY | | Director
Trustee |
| Ellen V. Futter | | |
| | | | |
| /s/ John F. Killian | | Con Edison
CECONY | | Director
Trustee |
| John F. Killian | | |
| | | | |
| /s/ Karol V. Mason | | Con Edison
CECONY | | Director
Trustee |
| Karol V. Mason | | |
| | | | |
/s/ John McAvoy | | Con Edison
CECONY | | Director
Trustee |
John McAvoy | | |
| | | | |
| /s/ Dwight A. McBride | | Con Edison
CECONY | | Director
Trustee |
| Dwight A. McBride | | |
| | | | |
| /s/ William J. Mulrow | | Con Edison
CECONY | | Director
Trustee |
| William J. Mulrow | | |
| | | | |
| /s/ Armando J. Olivera | | Con Edison
CECONY
| | Director
Trustee
|
| Armando J. Olivera | | |
| | | | |
| /s/ Michael W. Ranger | | Con Edison
CECONY
| | Director
Trustee
|
| Michael W. Ranger | | |
| | | | |
| /s/ Linda S. Sanford | | Con Edison
CECONY
| | Director
Trustee
|
| Linda S. Sanford | | |
| | | | |
| /s/ Deirdre Stanley | | Con Edison
CECONY
| | Director
Trustee
|
| Deirdre Stanley | | |
| | | | |
| /s/ L. Frederick Sutherland | | Con Edison
CECONY | | Con Edison
CECONY
Director
Trustee | Director
Trustee
|
| L. Frederick Sutherland | | |
| | | | |
| /s/ Catherine Zoi | | Con Edison
CECONY | | Director
Trustee |
| Catherine Zoi | | |
| | | | | |
210186
|
20222023 |