UNITED STATES
SECURITIES AND EXCHANGE COMMISSION
Washington, D.C. 20549
____________________________
FORM 10-K
| | | | | |
| ☑ | ANNUAL REPORT PURSUANT TO SECTION 13 OR 15(d) OF THE SECURITIES EXCHANGE ACT OF 1934 |
For the fiscal year ended February 24, 202323, 2024
OR
| | | | | |
| ☐ | TRANSITION REPORT PURSUANT TO SECTION 13 OR 15(d) OF THE SECURITIES EXCHANGE ACT OF 1934 |
Commission File Number 1-13873
____________________________
STEELCASE INC.
(Exact name of registrant as specified in its charter)
| | | | | | | | | | | |
| Michigan | | 38-0819050 |
(State or other jurisdiction of
incorporation or organization) | | (I.R.S. Employer Identification No.) |
| | | |
| 901 44th Street SE | | |
| Grand Rapids, | Michigan | | 49508 |
| (Address of principal executive offices) | | (Zip Code) |
Registrant’s telephone number, including area code: (616) 247-2710
Securities registered pursuant to Section 12(b) of the Act:
| | | | | | | | |
| Title of each class | Trading Symbol | Name of each exchange on which registered |
| Class A Common Stock | SCS | New York Stock Exchange |
Securities registered pursuant to Section 12(g) of the Act: None
Indicate by check mark if the registrant is a well-known seasoned issuer, as defined in Rule 405 of the Securities Act. Yes þ No ¨
Indicate by check mark if the registrant is not required to file reports pursuant to Section 13 or Section 15(d) of the Act. Yes ¨ No þ
Indicate by check mark whether the registrant (1) has filed all reports required to be filed by Section 13 or 15(d) of the Securities Exchange Act of 1934 during the preceding 12 months (or for such shorter period that the registrant was required to file such reports), and (2) has been subject to such filing requirements for the past 90 days. Yes þ No ¨
Indicate by check mark whether the registrant has submitted electronically every Interactive Data File required to be submitted pursuant to Rule 405 of Regulation S-T (§ 232.405 of this chapter) during the preceding 12 months (or for such shorter period that the registrant was required to submit such files). Yes þ No ¨
Indicate by check mark whether the registrant is a large accelerated filer, an accelerated filer, a non-accelerated filer, a smaller reporting company, or an emerging growth company. See the definitions of “large accelerated filer,” “accelerated filer,” “smaller reporting company,” and "emerging growth company" in Rule 12b-2 of the Exchange Act.
Large accelerated filer ☑ Accelerated filer ☐ Non-accelerated filer ☐ Smaller reporting company ☐ Emerging growth company ☐
If an emerging growth company, indicate by check mark if the registrant has elected not to use the extended transition period for complying with any new or revised financial accounting standards provided pursuant to Section 13(a) of the Exchange Act. ¨
Indicate by check mark whether the registrant has filed a report on and attestation to its management’s assessment of the effectiveness of its internal control over financial reporting under Section 404(b) of the Sarbanes-Oxley Act (15 U.S.C. 7262(b)) by the registered public accounting firm that prepared or issued its audit report. þ
If securities are registered pursuant to Section 12(b) of the Act, indicate by check mark whether the financial statements of the registrant included in the filing reflect the correction of an error to previously issued financial statements. ¨
Indicate by check mark whether any of those error corrections are restatements that required a recovery analysis of incentive-based compensation received by any of the registrant's executive officers during the relevant recovery period pursuant to §240.10D-1(b). ¨
Indicate by check mark whether the registrant is a shell company (as defined in Rule 12b-2 of the Exchange Act). Yes ☐ No ☑
The aggregate market value of the voting and non-voting common equity of the registrant held by non-affiliates, computed by reference to the closing price of the Class A Common Stock on the New York Stock Exchange, as of August 26, 202225, 2023 (the last business day of the registrant’s most recently completed second fiscal quarter) was approximately $1.0 billion.$728.4 million. There is no quoted market for registrant’s Class B Common Stock, but shares of Class B Common Stock may be converted at any time into an equal number of shares of Class A Common Stock.
As of April 11, 2023, 93,538,6739, 2024, 94,458,144 shares of the registrant’s Class A Common Stock and 20,414,41320,270,814 shares of the registrant’s Class B Common Stock were outstanding.
DOCUMENTS INCORPORATED BY REFERENCE:
Portions of the registrant’s definitive proxy statement for its 20232024 Annual Meeting of Shareholders, to be held on July 12, 2023,10, 2024, are incorporated by reference in Part III of this Form 10-K.
STEELCASE INC.
FORM 10-K
YEAR ENDED FEBRUARY 24, 202323, 2024
TABLE OF CONTENTS
| | | | | | | | |
| | Page No. |
| Part I | | |
| Item 1. | | |
| Item 1A. | | |
| Item 1B. | | |
| Item 1C. | | |
| Item 2. | | |
| Item 3. | | |
| Item 4. | | |
| | |
| Part II | | |
| Item 5. | | |
| Item 6. | | |
| Item 7. | | |
| Item 7A. | | |
| Item 8. | | |
| Item 9. | | |
| Item 9A. | | |
| Item 9B. | | |
| Item 9C. | | |
| Part III | | |
| Item 10. | | |
| Item 11. | | |
| Item 12. | | |
| Item 13. | | |
| Item 14. | | |
| Part IV | | |
| Item 15. | | |
| Item 16. | | |
| |
| |
PART I
Item 1.Business:
The following business overview is qualified in its entirety by the more detailed information included elsewhere or incorporated by reference in this Annual Report on Form 10-K (“Report”). As used in this Report, unless otherwise expressly stated or the context otherwise requires, all references to “Steelcase,” “we,” “our,” “Company” and similar references are to Steelcase Inc., a Michigan corporation, and its subsidiaries in which a controlling interest is maintained. Unless the context otherwise indicates, reference to a year relates to the fiscal year, ended in February of the year indicated, rather than the calendar year, unless indicated by a month or specific date reference. Additionally, Q1, Q2, Q3 and Q4 reference the first, second, third and fourth quarter, respectively, of the fiscal year indicated. All amounts are in millions, except share and per share data, data presented as a percentage or as otherwise indicated.
Overview
At Steelcase, our purpose is to help people do their best work by creating places that work better. Through our family of brands that includeincludes Steelcase®, AMQ®, Coalesse®, Designtex®, HALCON™, Orangebox®, Smith System® and Viccarbe®, we offer a comprehensive portfolio of furniture and architectural products and services designed to help customers create workplaces that help people reach their full potential at work, wherever work happens. Our solutions are inspired by the insights gained from our human-centered research process. We are a globally integrated enterprise,global company, headquartered in Grand Rapids, Michigan, U.S.A., with approximately 11,90011,300 employees. Steelcase was founded in 1912 and became publicly traded in 1998, and our Class A Common Stock is listed on the New York Stock Exchange under the symbol “SCS”.
We focus on translating our research-based insights into products, applications and experiences that help organizations around the world amplify the performance of their people, teams and enterprise.enterprises. We help our customers create office, healthcare and educational environments that support attraction and retention of talent, employee well-being and engagement, organizational culture and productivity, and other needs of their people, while also optimizing the value of their real estate investments. Our global scale and reach allow us to provide a consistent experience to global customers while offering local differentiation through our local dealer network.network and tailored solutions.
We market our products and services to businesses and organizations primarily through a network of dealers, and we also sell to consumers in markets around the world through web-based and retail distribution channels.
Strategic Priorities
Our strategic priorities align with our purpose and reflect a set of choices which we believe will position us for growth. We are focused on leading the transformation of work, where employees shift between working in the office and working remotely over the course of a week. We aim to do this by offering innovative solutions to our customers that support the growing needs for privacy, social connection and collaboration in this new era of work. We also aim to deependiversify the customers and markets we serve by deepening our presence in key adjacent growth opportunities, including certain geographic and vertical marketsareas such as learning, health, and home, and to enhance our capabilities to better serve smallersmall and mid-sized customers. We are focused on creating value by using our businessproduct designs and insights to help organizations work better, through market-leading performance in our approach to our people our products and the planet. Our strategic priorities also include profitability initiatives to drive fitness, reduce complexity and maximize efficiency, reallocating resources toward our highest priorities and maintaining a strong balance sheet to support our growth objectives.
Our Offerings
Our brands provide a comprehensive portfolio of furniture and architectural products for individual and collaborative work across a range of price points. Our furniture portfolio includes furniture systems, seating, storage, fixed and height-adjustable desks, benches and tables and complementary products such as work accessories, lighting, mobile power and screens. Our seating products include task chairs which are highly ergonomic, seating that can be used in collaborative environments and casual settings and specialty seating for specific vertical markets such as education and healthcare. Our interior architectural products include full and partial height walls and free-standing architectural pods. We also offer services designed to enhance the performance of people, space and real estate. These services include workplace strategy consulting, lease origination services and furniture and asset management.
Steelcase
Steelcase leverages insights from user-centered research to help our customers create high performing and sustainable work environments. We strive to be a trusted partner by creating exceptional experiences for those who seek to use space as a strategic asset to elevate their performance, reinforce their organizational culture, support the well-being of their people and attract and retain talent. The Steelcase brand's core customers are leading organizations (such as corporations, government entities, schools, colleges and universities and healthcare organizations) that are forward-thinking, that are often large with ever-changing complex needs and that often have a global scale and operations.
Steelcase brand extensions include:
•Steelcase Learning, which works with leading educational institutions to create places that enhance the success, outcomes and well-being of students, educators and administrators.
•Steelcase Health, which works with leading healthcare organizations to create places that deliver greater connection, empathy and well-being for everyonethose involved in the experience of healthcare.
AMQ
AMQ offers high-quality, affordable products for collaborative environments, training rooms, private offices and work stations, including height-adjustable desking and benching, storage,seating, screens tables and seating for workstations, collaborative environments and training rooms.storage. AMQ specializes in in-stock furniture that delivers in just ten business days,a 30-day design-to-installation customer experience, with adaptable and modern designs that fit contemporary, active office spaces, ideal for small and mid-sized businesses.
Coalesse
Led by intuition, backed by research and driven by design, Coalesse creates thoughtful furnishings that bring new life to the modern workplace and ancillary settings. The brand blends beauty and utility into theirits designs to help customers make great spaces that inspire great work, by empowering social connection, creative collaboration, focus and rejuvenation.
Designtex
Designtex offers applied materials that enhance environments and is a leading resource for applied surfaces knowledge, innovation and sustainability. Designtex products include premium fabrics and surface materials and imaging solutions designed to enhance seating, walls, workstations and floors. These materials provide privacy, wayfinding, motivation, communications and artistic expression.
HALCON
HALCON is a designer and manufacturer of precision-tailored wood furniture for the workplace. HALCON specializes in custom wood and executive-level tables, credenzas, and desks. This furniture is of enduring quality, backed by a genuine dedication to service and customization.
Orangebox
Orangebox is a designer and manufacturer of furniture, soft seating, and free-standing architectural pods for the changing workplace with a focus on "Smartworking" solutions: furniture and architecture that fosters collaboration while providing contemporary aesthetics, visual and acoustical privacy and commercial-grade performance.
Smith System
Smith System is a leading designer and manufacturer of high-quality furniture for the pre-K-12 education market. Smith System offers desking, seating, lounge and storage products. Smith System designs and manufactures products that support inspired learning and better learning outcomes – addressing the needs of the student, the demands of the curriculum and the realities of space, maintenance and budget.
Viccarbe
Viccarbe offers contemporary furniture for high-performance collaborative and social spaces, including contract, hospitality, retail and outdoor settings. Viccarbe's collection is the result of years of collaboration with globally renowned designers.
Marketing Partnerships
We maintain marketing partnerships with a number of companies, including Blu Dot, Bolia, Carl Hansen & Son, Crestron, EMU, Established & Sons, Extremis, FLOS, the Frank Lloyd Wright Foundation, Goodee, Kartell, Kwickscreen, Logitech, m.a.d. furniture,, Mattiazzi, Microsoft, Moduform, Moooi, Nanimarquina, PolyVision, Snowsound, Tom Dixon, VergeSense, West Elm and Zoom. These partnerships are intended to allow us to market additional products and services to our dealers and customers that are complementary to our products and services and leverage our scale. These partnerships take several forms, the most common of which involves us purchasing and reselling the partner’s products to our dealers and customers. In other situations, we market the partner’s products to our dealers and customers and receive a fee from the partner, and we typicallymay also transport and deliver those products to our dealers and customers for a fee. We also have marketing partnerships where we co-develop products with our partner that we manufacture or source from third parties or where we and our partner agree to co-market our products and services to customers. Most of our marketing partnerships are on a regional basis.
Reportable Segments
We operate on a global basis within our Americas and EMEAInternational reportable segments. In Q1 2024, we realigned our reportable segments plus an Other category.for financial reporting purposes as a result of changes in how we monitor business performance and allocate resources to support our top strategic priorities. Additional information about our reportable segments, including financial information about geographic areas and specific product categories, is contained in Item 7: Management’s Discussion and Analysis of Financial Condition and Results of Operations, and Note 4 and Note 20 to the consolidated financial statements.
Americas Segment
Our Americas segment serves customers in the United States (“U.S.”), Canada, the Caribbean Islands and Latin America with a comprehensive portfolio of furniture, architectural, textile and architecturalsurface imaging products that are marketed to corporate, government, healthcare, education and retail customers primarily through the Steelcase, AMQ, Coalesse, Designtex, HALCON, Orangebox, Smith System and Viccarbe brands.
We serve Americas customers mainly through approximately 380 Steelcase independent and company-owned dealer locations and other non-aligned dealers, and we also sell directly to end-use customers. Our end-use customers tend to be larger multinational, regional or local companies and are distributed across a broad range of industries, and vertical markets, including education, financial services, flexible real estate, government, healthcare, information technology, insurance, retailmanufacturing and manufacturing.retail. In the Americas segment, no industry individually represented more than 17% of the segment's revenue in 2024.
Each of our dealers maintains its own sales force which is complemented by our sales representatives who work closely with our dealers throughout the selling process. The largest independent Steelcase dealer in the Americas accounted for approximately 6% of the segment’s revenue in 2023,2024, and the five largest independent Steelcase dealers collectively accounted for approximately 19%16% of the segment’s revenue in 2023.2024.
The Americas office furniture industry is highly competitive, with a number of competitors offering similar categories of products. The industry competes on a combination of insight, product performance, design, price, service and relationships with customers, architects and designers. Our most significant competitors in the U.S. are MillerKnoll, Inc., Haworth, Inc. and HNI Corporation.
EMEAInternational Segment
Our EMEAInternational segment serves customers in Europe, the Middle East and Africa primarily under the Steelcase, Coalesse, Orangebox("EMEA") and Viccarbe brands,Australia, China, India, Japan, Korea and other countries in Southeast Asia ("Asia Pacific"), with a comprehensive portfolio of furniture and architectural products. Our largest presence is in Western Europe, where we believe weproducts that are amongmarketed to corporate, government, education and retail customers primarily through the market leaders in France, Germany, SpainSteelcase, Coalesse, Orangebox, Smith System and the United Kingdom ("U.K.").Viccarbe brands.
We serve EMEAInternational customers mainly through approximately 320390 independent and company-owned Steelcase dealer locations and other non-aligned dealers, and we also sell directly to end-use customers. The largest independent Steelcase dealer in the EMEAInternational segment accounted for less than 4%approximately 3% of the segment’s revenue in 2023.
2024. The five largest Steelcase independent dealers collectively accounted for approximately 12%10% of the segment’s revenue in 2023.2024. Our end-use customers tend to be larger multinational, regional or local companies spread across a broad range of industries and vertical markets, including education, financial services, flexible real estate, government, healthcare and information technology.
The EMEA office furniture market ismarkets in EMEA and Asia Pacific are highly competitive and fragmented. We compete with many local and regional manufacturers in many different markets. In several cases, these local competitors focus on specific product categories.
Other Category
The Other category includes Asia Pacific and Designtex.
Asia Pacific serves customers in Australia, China, India, Japan, Korea and other countries in Southeast Asia primarily under the Steelcase brand with a comprehensive portfolio of furniture and architectural products. We primarily sell directly to end-use customers as well as through approximately 70 Steelcase independent dealer locations. Our end-use customers tend to be larger multinational, regional or local companies spread across a broad range of industries and are located in both mature and growth markets. Our competition in Asia Pacific is highly fragmented and includes large global competitors as well as regional and local manufacturers.
Designtex sells textiles, wall coverings and surface imaging solutions specified by architects and designers directly to end-use customers through a direct sales force primarily in North America.
Corporate
Corporate expenses include unallocated portions of shared service functions such as information technology, corporate facilities, finance, human resources, research, legal and customer aviation, plus deferred compensation expense and income or losses associated with company-owned life insurance ("COLI"). Corporate assets consist primarily of unallocated cash and cash equivalents, COLI, fixed assets, investments in unconsolidated affiliates and right-of-use assets related to operating leases.
Joint Ventures and Other Equity Investments
We occasionally enter into joint ventures and other equity investments to expand or maintain our geographic presence, support our distribution network or invest in new business ventures, complementary products or services. As of February 24, 2023,23, 2024, our investments in these unconsolidated joint ventures and other equity investments totaled $51.1.$55.7. Our share of the earnings from joint ventures and other equity investments is recorded in Other income, net in the Consolidated Statements of Income. See Note 12 to the consolidated financial statements for additional information.
Customer and Dealer Concentrations
Our largest customer accounted for approximately 2% of our consolidated revenue in 2023,2024, and our five largest customers collectively accounted for approximately 6% of our consolidated revenue. However, these percentages do not include revenue from various U.S. federal government agencies. In 2023,2024, our sales to U.S. federal government agencies represented approximately 3% of our consolidated revenue. We do not believe our business is dependent on any single or small number of end-use customers, the loss of which would have a material adverse effect on our business.
No single independent Steelcase dealer accounted for more than 4% of our consolidated revenue in 2023.2024. The five largest independent Steelcase dealers collectively accounted for approximately 14%12% of our consolidated revenue in 2023.2024. We do not believe our business is dependent on any single independent dealer, the loss of which would have a sustained material adverse effect on our business.
Manufacturing and Logistics
We have manufacturing and distribution operations throughout North America (in the U.S. and Mexico), Europe (in the Czech Republic, France, Germany, Spain and the U.K.) and in Asia (in China, India and Malaysia). Our global manufacturing and distribution operations are largely centralized under a single organization to serve our customers’ needs across multiple brands and geographies.
Our manufacturing model is predominately make-to-order with standard lead times that typically range from four to six weeks. During 2022 and 2023, our manufacturing operations and lead times were negatively impacted by supply chain disruptions, and we increased our levels of inventory on hand to mitigate challenges associated with purchasing raw materials and components in a timely manner. During 2024, supplier lead times shortened, which enabled us to reduce our levels of inventory. We manufacture our products using lean manufacturing principles, including continuous one-piece flow and platformed processes and products, which allow us to achieve efficiencies and cost savings and minimize the amount of inventory on hand. We largely purchase direct materials and components from a global network of integrated suppliers as needed to meet demand. We also purchase finished goods manufactured by third parties predominately on a make-to-order basis.
During 2023, our manufacturing operations continued to be negatively impacted by supply chain disruptions that we began experiencing in 2022, including the lack of availability of certain raw materials and components, labor shortages and shipping delays across long distance supply chains. We increased our levels of inventory on hand to mitigate challenges associated with purchasing raw materials and components in a timely manner. During the second half of 2023, the extended shipping times in our long distance supply chain started to ease.
We focus on enhancing the efficiency of our manufacturing operations, and we also seek to reduce costs through our global sourcing effort. We focus on platformingleverage our product offeringglobal presence and capturingfootprint to capture raw material and component cost savings available through lower cost suppliers around the globe. These efforts enhance our leverage with supply sources. We also focus on our reliability and business continuity, which may, at times, require localizing supply chains and enhancing capabilities to deliver complete and on-time orders to our customers. We also incorporate innovation, sustainability and other environmental, social and governance factors when making supplier selection decisions.
Our physical distribution system utilizes commercial transport, dedicated fleet and company-owned delivery services. We utilize a network of regional distribution centers in the Americas and EMEA to minimize freight and delivery costs and improve service to our dealers and customers.
Materials
Approximately 61%58% of our cost of sales in 20232024 related to raw materials, components and finished goods purchased from a significant number of suppliers around the world. The raw materials that we purchase and that are used in the manufacture of the components and finished goods that we purchase include steel, petroleum-based products (including plastics and foam), aluminum, other metals, wood and particleboard. Our global supply chain team continually evaluates current market conditions, the financial viability of our suppliers and available supply options on the basis of quality, reliability of supply and cost. During 2023, the availability of some materials was negatively impacted by supply chain disruptions as discussed above. In addition, the prices for many of the raw materials, components and finished goods we purchase have increased as a result of significant inflationary pressures over the last two years.
Research, Design and Development
Our extensive global research—a combination of user observations, feedback sessions and sophisticated analyses—has helped us develop social, spatial and informational insights into work effectiveness. We maintain collaborative relationships with external world-class innovators, including leading universities, think tanks and knowledge leaders, to expand and deepen our understanding of how people work.
Understanding patterns of work enables us to identify and anticipate user needs across the globe. Our design teams explore and develop prototypical solutions to address these needs, which vary from furniture and architectural solutions to single products or enhancements to existing products and across different vertical market applications such as healthcare and education. Organizationally, global design leadership directs project work, which is distributed to design studios around the world and sometimes involves external design services.
Our marketing team evaluates product concepts using several criteria, including financial return metrics, and chooses which products will be developed and launched. Designers then work closely with engineers and suppliers to co-develop products and processes that incorporate innovative user features with efficient manufacturing practices. Products are tested for performance, quality and compliance with applicable local standards and regulations.
We incurred $48.2, $44.4 $45.4 and $48.1$45.4 in research, design and development expenses in 2024, 2023 2022 and 2021,2022, respectively. In addition, we sometimes pay royalties to external designers of our products as the products are sold, and these costs are not included in research and development expenses.
Intellectual Property
We generate and hold a significant number of patents in a number of countries in connection with the operation of our business. We also hold a number of trademarks that are very important to our identity and recognition in the marketplace. We do not believe that any material part of our business is dependent on the continued availability of any one or all of our patents or trademarks or that our business would be materially adversely affected by the loss of any of such, except the “Steelcase,” "AMQ," “Coalesse,” "Designtex," "HALCON," “Orangebox,” and “Smith System” trademarks.
We occasionally enter into license agreements under which we pay a royalty to third parties for the use of patented products, designs or process technology. We have established a global networktechnology, none of intellectual property licenses withwhich are considered material to our subsidiaries.business.
Human Capital Resources
We aspire to be a people-centered, purpose-driven company where our employees feel they belong and can be proud of their work. At Steelcase, we believe that together we will help protect the planet through our environmental commitments, help our people thrive, and sustain a culture of trust and integrity to drive towards ethical business outcomes. The following core values guide our commitments and actions:
•act with integrity,
•tell the truth,
•keep commitments,
•treat people with dignity and respect,
•promote positive relationships,
•protect the environment, and
•excel.
We believe our employees are our greatest asset, and we are dedicated to the continuous learning and professional development of every employee. We invest in our employees through multiple avenues, including providing competitive pay and benefits, sharing profits through our annual bonus programs, offering career development and professional training programs, providing inspiring and supportive spaces for our employees to work and collaborate and offering a range of services to support our employees' physical, emotional, cognitive and financial well-being.
Our leaders play a critical role in curating our culture, and we have established a set of leadership pillars and accompanying learning and development activities designed to promote empathic leadership and align leader actions with our core values and the culture we strive to create. These pillars are:
•build strong teams,
•unite in purpose,
•create clarity,
•cultivate resilience, and
•deliver results.
Diversity, Equity and Inclusion
We strive to create an environment where employees around the globe are valued, respected, accepted and encouraged to be authentic and to fully participate in our organization. We believe our unique culture helps to unlock each employee's unique contributions and amplifies the power of the individual to better serve our customers and the communities in which we live and work. We are committed to advancing diversity, equity and inclusion through the following key objectives:
•build diverse teams that reflect our communities,
•ensure equitable access to development opportunities across the organization, and
•create a culture of inclusion that promotes curiosity and creativity.
Learning and Development
Learning is how we work and how we lead. We aspire to be a learning organization that builds capabilities for the evolving needs of our business and adapts our culture as a competitive advantage. Developing our talent in consistent ways is essential to our business strategy, and we are continually focused on providing all our employees with the resources they need to reach their full potential. We approach talent development through a variety of tools, practices and experiences, including:
•connecting our employees to digital learning experiences to help them thrive,
•identifying sought-out skills from our employees and designing learning paths related to these skills,
•emphasizing an environment that values learning as an everyday practice across the organization, and
•holding frequent and purposeful conversations between employees and leaders that inspire achievement and growth.
Employee Compensation and Benefits
Our compensation and benefits programs are designed to attract, retain and motivate talented employees. Our philosophy is to:
•value the contribution of our employees,
•motivate achievement of strategic objectives that will contribute to our company’s success, and
•share profits through broad-based incentive arrangements designed to reward performance for all employees.
This philosophy is achieved through competitive pay and benefits and a variety of other offerings such as career development and well-being initiatives. We review pay ranges annually and adjust pay as needed to ensure external competitiveness and internal equity. We also share profits with both salaried and hourly employees through our annual bonus programs. We believe our philosophy helps promote a culture where our employees feel they are supported and that their contributions are valued.
Employees
As of February 24, 2023,23, 2024, we had approximately 11,90011,300 employees, of which approximately 7,100 work6,700 worked in manufacturing and distribution and approximately 300 are280 were part-time. Additionally, we had approximately 1,000900 temporary workers who primarily workworked in manufacturing. Approximately 4030 employees in the U.S. arewere covered by collective bargaining agreements. Outside the U.S., approximately 2,6003,100 employees arewere represented by unions or workers' councils that operate to promote the interests of workers.
Environmental Matters
We are subject to a variety of federal, state, local and foreign laws and regulations relating to the discharge of materials into the environment, or otherwise relating to the protection of the environment (“Environmental Laws”). We believe our operations are in substantial compliance with all Environmental Laws. We do not believe existing Environmental Laws have had or will have any material effects upon our capital expenditures, earnings or competitive position.
Under certain Environmental Laws, we could be held liable, without regard to fault, for the costs of remediation associated with our existing or historical operations. We could also be held responsible for third-party property and personal injury claims or for violations of Environmental Laws relating to contamination. We are a party to, or otherwise involved in, proceedings relating to several contaminated properties being investigated and remediated under Environmental Laws, including as a potentially responsible party in several Superfund site cleanups. Based on our information regarding the nature and volume of wastes allegedly disposed of or released at these properties, the total estimated cleanup costs and other financially viable potentially responsible parties, we do not believe the costs to us associated with these properties will be material, either individually or in the aggregate. We have established reserves that we believe are adequate to cover our anticipated remediation costs. However, certain events could cause our actual costs to vary from the established reserves. These events include, but are not limited to: a change in governmental regulations or cleanup standards or requirements; undiscovered information regarding the nature and volume of wastes allegedly disposed of or released at these properties; the loss of other
potentially responsible parties that are financially capable of contributing toward cleanup costs; and other factors increasing the cost of remediation.
Available Information
We file annual reports, quarterly reports, current reports, proxy statements and other documents with the U.S. Securities and Exchange Commission (“SEC”) under the Securities Exchange Act of 1934, as amended (the “Exchange Act”). The SEC maintains an Internet website at www.sec.gov that contains reports, proxy and information statements and other information regarding issuers, including Steelcase, that file electronically with the SEC. We also make available free of charge through our internet website, www.steelcase.com, our annual reports on Form 10-K, quarterly reports on Form 10-Q, current reports on Form 8-K and any amendments to these reports, as soon as reasonably practicable after we electronically file such reports with or furnish them to the SEC. In addition, our Corporate Governance Principles, Code of Ethics, Code of Business Conduct and the charters for the Audit, Compensation, Corporate Business Development and Nominating and Corporate Governance Committees are available free of charge through our website or by writing to Steelcase Inc., Investor Relations, GH-3E-12, PO Box 1967, Grand Rapids, Michigan, U.S.A. 49501-1967.
We are not including the information contained on our website as a part of, or incorporating it by reference into, this Report.
Item 1A.Risk Factors:
The following risk factors and other information included in this Report should be carefully considered. The risks and uncertainties described below are not the only ones we face. Additional risks and uncertainties that we do not know about currently, or that we currently believe are not material, may also adversely affect our business, operating results, cash flows and financial condition. If any of these risks actually occur, our business, operating results, cash flows and financial condition could be materially adversely affected.
Macroeconomic and Workplace Trends Risk Factors
Failure to respond to changes in workplace trends and the competitive landscape may adversely affect our revenue and profits.
Advances in technology, changing workforce demographics, increased working from home,remote work, shifts in work styles and behaviors and the globalization of business have been changing the world of work and impacting the types and amounts of workplace products and services purchased by our customers. In recent years, these trends have resulted in changes such as:
•a decrease in overall demand for office furniture from corporate customers,
•an increase in demand for products that support individual privacy and focused work,
•an increase in demand for products that facilitate distributed collaboration, including those that enhance remote work experiences,
•an increase in demand for ancillary furniture for social and collaborative spaces in office settings,
•more frequent refreshment of workplace settings, and
•customer interest in a broader range of price points, quality and warranty coverage.
These trends have also had an impact on our competitive landscape, including (1) the emergence of smaller office furniture competitors, (2) increased competition from residential furniture and technology companies, (3) diversification by some of our larger competitors into other industries, (4) consolidation in our industry and (4)(5) an increase in customers outsourcing workplace management to real estate management service firms and flexible real estate providers.
We compete on a variety of factors, including: brand recognition and reputation; insights from our research; the breadth of our global reach and product portfolio; product design and features; price, lead time, delivery and service; product quality; strength of our dealer network and other distributors; relationships with customers and key influencers, such as architects, designers and real estate managers; and our commitments to sustainable product design and reducing our environmental impact. If we are unsuccessful in continuing to develop and offer a wide variety of solutions which respond to changes in workplace trends, or if we or our dealers are unsuccessful in
competing with existing competitors and new competitive offerings which arise from outside our industry, our results of operations may be adversely affected.
Our industry is influenced by cyclical macroeconomic factors and future downturns may adversely affect our revenue and profits.
Our revenue is generated predominantly from the office furniture industry, and demand for office furniture is influenced by macroeconomic factors, such as corporate profits, non-residential fixed investment, white-collar employment and commercial office construction and vacancy rates, which can be difficult to predict. The office furniture industry has experienced periodic major declines in demand, driven by global economic downturns.downturns in the Americas, EMEA, and Asia Pacific. During these downturns, our revenue declined substantially and our profitability was significantly reduced. Our revenues and profitability can be, and currently are being, impacted by adverse changes in these macroeconomic factors. Adaptations of our business to changing macroeconomic factors can result in material restructuring costs, and if we are unsuccessful in making such adaptations, our operating results may be adversely affected.
We may not be able to successfully develop, implement and manage our growth strategies.
Our longer-term success depends on our ability to successfully develop, implement and manage our growth strategies, which include:
•developing offerings to support hybrid work, including enhanced applications to support individual privacy and focused work and partnering with technology companies to create integrated collaborative solutions,
•growing our market share with existing dealers and large corporate customers in addition to serving smaller and mid-sized customers and growing our market share in learning and healthcare environments, and
•realizing the value from acquisitions and potential investments in new acquisitions, and
•enhancing our capabilities to serve the work-from-home and retail markets.acquisitions.
If these strategies to increase our revenues are not sufficient, or if we do not execute these strategies successfully, our global market share and profitability may be adversely affected.
Manufacturing, Supply Chain and Distribution Risk Factors
We are and may continue tocan be adversely affected by changes in raw material, commodity and other input costs.
We and our suppliers purchase raw materials (including steel, plastics, foam, aluminum, other metals, wood and particleboard) from a significant number of sources globally. These raw materials are not rare or unique to our industry. The costs of these commodities, as well as fuel, freight, energy, labor and other input costs can fluctuate due to changes in global, regional or local supply and demand, larger currency movements and changes in tariffs and trade barriers, which can also cause supply interruptions.
During 2022 and 2023, there was significant inflation in the costs of fuel, energy and many of the raw materials used by our suppliers and us, including steel and other commodities, due to availability constraints, supply chain disruption, labor shortages, impacts of the COVID-19 pandemic and the war in Ukraine, and other factors.
In the short-term, significant increases in raw material, commodity and other input costs can be very difficult to offset with price increases because of existing contractual commitments with our customers, and it is difficult to find effective financial instruments to hedge against such changes. As a result, our gross margins can be adversely affected in the short-term by significant increases in these costs. We implemented multiple list price increases globally in 2022 and 2023 and a temporary surcharge in the Americas in 2023. If we are not successful in passing along higher raw material, commodity and other input costs to our customers over the longer-term, because of competitive pressures, our profitability could be negatively impacted.
We are reliant on a global network of suppliers that exposes us to certain risks outside of our control.
We are reliant on the timely flow of raw materials, components and finished goods from a global network of third-party suppliers. The flow of such materials, components and goods may be affected by:
•fluctuations in the availability and quality of raw materials,
•disruptions caused by labor shortages and labor activities,
•ocean freight constraints and port congestion, domestic transportation and logistical challenges,
•the financial solvency of our suppliers and their supply chains, and
•damage or loss of production from accidents, natural disasters, severe weather events, pandemics, security concerns (including terrorist activity, armed conflict and civil or military unrest), trade embargoes, changes in tariffs, systems and equipment failures or disruptions, cyberattacks or security breaches and other causes.
Any disruptions or fluctuations in the supply and delivery of raw materials, components and finished goods or deficiencies in our ability to manage our global network of suppliers could have an adverse impact on our business, operating results or financial condition. During 2023, our suppliers were negatively impacted by disruptions and fluctuations in the availability of raw materials, labor, transportation and logistics. These factors led to significant disruptions and delays in the supply of raw materials, components and finished goods to us, which negatively impacted our order lead times and our ability to consistently deliver products to our customers on time, as well as our costs of procuring such items and carrying higher than historical levels of inventory.
Changes in tariffs, global trade agreements or government procurement could adversely affect our business.
We manufacture most of our products on a regional basis, and as a result, we often export products from where they are manufactured to where they are sold within the region. We also source raw materials, components and finished goods from a global network of suppliers. In particular in 2023,2024, approximately 35%34% of the products we sold to customers in the U.S., including U.S. government agencies, were manufactured outside of the U.S., predominantly by our subsidiaries in Mexico, which operate as maquiladoras. Changes in tariffs or trade agreements could impact the cost of importing our products into the countries where they are sold and the cost of raw materials and components sourced from other countries, which in turn could adversely impact our gross margins and our price competitiveness. In addition, changes in U.S. government procurement rules requiring a certain amount of domestic content in finished goods, or requiring finished goods to be produced in the U.S., could have an adverse impact on our business, operating results or financial condition.
The lack of redundant capabilities among our regional manufacturing facilities could adversely affect our business.
ManyMost of our products are currently produced in only one location in each of the three geographic regions in which we operate (the Americas, EMEA and Asia Pacific), certain components are manufactured in only one location globally and our manufacturing model is predominately make-to-order. As a result, any issue which impacts the production capabilities of one of our manufacturing locations, such as natural disasters, severe weather events, pandemics, disruptions in the supply of materials or components, systems and equipment failures or disruptions caused by labor activities, could have an adverse impact on our business, operating results or financial condition.
We rely largely on a network of independent dealers to market, deliver and install our products, and disruptions and increasing consolidations within our dealer network could adversely affect our business.
Our business is dependent on our ability to manage our relationships with our independent dealers. From time to time, we or a dealer may choose to terminate our relationship, or the dealer could face financial insolvency or difficulty in transitioning to new ownership, and establishing a new dealer in a market can take considerable time and resources. Disruption of dealer coverage within a specific local market could have an adverse impact on our business within the affected market. The loss or termination of a significant number of dealers or the inability to establish new dealers could cause difficulties in marketing and distributing our products and have an adverse effect on our business, operating results or financial condition. In the event that a dealer in a strategic market experiences financial difficulty, we may choose to make financial investments in the dealership, which would reduce the risk of disruption but increase our financial exposure. Alternatively, we may elect to purchase and operate dealers in certain markets, which would also require use of our capital and increase our financial exposure.
We rely on our dealers to sell, deliver and install products to our customers, and their ability to perform and their financial conditions could be affected by events such as natural disasters, severe weather events, pandemics, systems and equipment failures or disruptions, cyberattacks or security breaches. A significant disruption in the operations of our dealers could have an adverse impact on our business, operating results or financial condition.
In certain cases, our diversification and growth strategies into adjacent markets are driving the need for our dealers to invest in additional resources to support our products and markets. Some of our smaller dealers do not have the scale to support such investments, and as a result, we have seen and may continue to see increased consolidation within our dealer network. This increased concentration and size of dealers could increase our exposure to the risks discussed above.
Global Footprint Risk Factors
Our global presence subjects us to risks that may negatively affect our profitability and financial condition.
We have manufacturing facilities, sales locations and offices in many countries, and as a result, we are subject to risks associated with doing business globally. Our success depends on our ability to manage the complexity associated with designing, developing, manufacturing and selling our solutions in a variety of countries.Ourcountries. Our global presence is also subject to market risks, which in turn could have an adverse effect on our business, operating results or financial condition, including:
•differing business practices, cultural factors and regulatory requirements,
•political, social and economic instability, natural disasters, pandemics, security concerns, including terrorist activity, armed conflict and civil or military unrest and global crises or health issues, and
•intellectual property protection challenges.
Our global footprint makes us vulnerable to currency exchange rate fluctuations and currency controls.
We primarily sell our products in U.S. dollars and euros, but we generate some of our revenues and pay some of our expenses in other currencies. Revenue recorded in currencies other than the U.S. dollar and the euro represented approximately 11% of our consolidated revenue in 2024. While we seek to manage our foreign exchange risk largely through operational means by matching revenue with same-currency costs, our results are affected by the strength of the currencies in countries where we manufacture or purchase goods relative to the strength of the currencies in countries where our products are sold. We use foreign currency derivatives to hedge some of the near-term volatility of these exposures. There can be no assurance that such hedging will be
economically effective. If we are not successful in managing currency exchange rate fluctuations, they could have an adverse effect on our business, operating results or financial condition.
We operate globally in multiple currencies, but we translate our results into U.S. dollars for reporting purposes, and thus our reported results may be positively or negatively impacted by the strengthening or weakening of the other currencies in which we operate against the U.S. dollar.
In addition, we face restrictions in certain countries that limit or prevent the transfer of funds to other countries or the exchange of the local currency to other currencies, which could have a negative impact on our profitability. We also face risks associated with fluctuations in currency exchange rates that may lead to a decline in the value of the funds held in certain jurisdictions, as well as the value of intercompany balances denominated in foreign currencies.
Financial Risk Factors
We may be required to record impairment charges related to goodwill, which would adversely affect our results of operations.
We have net goodwill of $276.8$274.8 as of February 24, 2023.23, 2024. Goodwill is not amortized but is evaluated for impairment annually in Q4 or whenever an event occurs or circumstances change such that it is more likely than not that an impairment may exist. Poor performance in portions of our business where we have goodwill, including failure to achieve projected performance from acquisitions, or declines in the market value of our equity, may result in impairment charges, which would adversely affect our results of operations.
Changes in corporate tax laws could adversely affect our business.
We are subject to income taxes in the U.S. and various foreign jurisdictions. Our future effective tax rate could be affected by changes in the mix of our earnings in countries with differing statutory tax rates, changes in the valuation of our deferred tax assets and liabilities or changes in tax laws or their interpretation. In addition, such tax
law changes, if enacted, could have a material adverse effect on our business, operating results or financial condition. A reduction in applicable tax rates may require us to revalue and write-down our net deferred tax assets. As of February 24, 2023, we had net deferred tax assets of $109.3, and approximately 65% of our net deferred tax assets were subject to recovery in the U.S.
There may be significant limitations to our utilization of net operating loss and tax credit carryforwards to offset future taxable income.
We have deferred tax assets related to net operating loss ("NOL") and tax credit carryforwards totaling $36.5$33.4 and $17.9,$12.7, respectively, against which valuation allowances totaling $3.1$4.3 have been recorded. NOL carryforwards are primarily related to foreign jurisdictions. Tax credit carryforwards consist of U.S. foreign tax credits and foreign investment tax credits. We may be unable to generate sufficient taxable income from future operations in the jurisdictions in which we maintain deferred tax assets related to NOL and tax credit carryforwards, or implement tax, business or other planning strategies, to fully utilize the recorded value of our NOL and tax credit carryforwards. These deferred tax assets are recorded in various currencies that are also subject to foreign exchange risk, which could reduce the amount we may ultimately realize. Additionally, future changes in tax laws or interpretations of such tax laws may limit our ability to fully utilize our NOL and tax credit carryforwards.
Changes in corporate tax laws could adversely affect our business.
We are subject to income taxes in the U.S. and various foreign jurisdictions. Our future effective tax rate could be affected by changes in the mix of our earnings in countries with differing statutory tax rates, changes in the valuation of our deferred tax assets and liabilities or changes in tax laws or their interpretation. In addition, such tax law changes, if enacted, could have a material adverse effect on our business, operating results or financial condition. A reduction in applicable tax rates may require us to revalue and write-down our net deferred tax assets. As of February 23, 2024, we had net deferred tax assets of $108.6, and approximately 68% of our net deferred tax assets were subject to recovery in the U.S.
General Risk Factors
Unforeseen complexity or delay in the design or implementation of our new global enterprise resource planning (“ERP”) system could adversely affect our business.
We are reliant on a global ERP system to support processes critical to our manufacturing operations, financial reporting and executive decision-making. In Q3 2024, we entered the application-development phase of a multi-year, phased implementation of a new cloud-based ERP system which is expected to replace our current ERP system and various other supporting systems for operating and financial processes. We expect to deploy the new ERP system beginning in 2026.
ERP system implementations are complex and require a significant amount of time and expenditure. Significant investment of internal and external resources has been, and will continue to be, required for successful
implementation. Unforeseen complexity or delay in implementation could result in significant cost overruns and additional time investment from resources that could otherwise focus on other strategic priorities, which in turn could have an adverse effect on our business, operating results or financial condition.
The implementation of our new ERP system will also require reengineering of many of our operating and financial processes. The transformation of these processes involves risks inherent in a large-scale conversion including loss of information, significant change management, potential disruption to our normal operations and other unforeseen challenges. If the new ERP system does not operate as intended or work in concert with reengineered processes, we could experience a material adverse effect on our business, financial reporting or internal control.
We rely on the integrity and security of our information technology systems, and our business could be materially adversely impacted by extended disruptions, significant security breaches or other compromises of these systems.
We rely on information technology systems, including cloud-based systems operated by third parties, to operaterun and manage our business and to process, maintain and safeguard information essential to our business as well as information relating to our customers, dealers, suppliers and employees. These systems are vulnerable to events beyond our reasonable control, including cyberattacks and security breaches, the need for system upgrades and support, telecommunication and internet failures, natural disasters and power loss. Such events could result in operational slowdowns, shutdowns or other difficulties; loss of revenues or market share; compromise or loss of sensitive or proprietary information; destruction or corruption of data; costs of remediation, upgrades, repair or recovery; breaches of obligations to third parties under privacy laws or contracts; or damage to our reputation or customer relationships; each of which, depending on the extent or duration of the event, could materially adversely impact our business, operating results or financial condition. In the case of systems operated by third parties, we rely on the security programs maintained by those parties. We maintain insurance coverage, which may cover some of these risks, subject to the terms and conditions of the applicable policies, but such coverage may not be available or sufficient to cover all of the losses that may arise.
We may be materially adversely affected by security breaches, errors or disruptions relating to our software and software-as-a-service offerings.
We sell enterprise resource planning software and software-as-a-service offerings to our dealers. In connection with some of these offerings, we collect and store data belonging to our dealers, and we rely on third parties, such as cloud hosting providers and other service providers, to perform some of our obligations. If the security measures we and our third-party vendors use are breached, if there are errors in our software or if there are any service interruptions caused by other events, our offerings may not operate properly, dealer data could be lost or compromised, and our dealers’ businesses may be disrupted. In such events, we may incur legal liabilities, lost business or harm to our brand reputation, which could have a material negative impact on our business, operating results or financial condition.
We may be adversely impacted by losses and reputational damage related to product defects.
Product defects can occur within our own product development and manufacturing processes or through our reliance on third parties for product development and manufacturing activities. We incur various expenses related to product defects, including product warranty costs, product recall and retrofit costs and product liability costs, which can have an adverse impact on our results of operations. In addition, the reputation of our brands may be diminished by product defects and recalls.
We maintain a reserve for our product warranty costs based on certain estimates and our knowledge of current events and actions. While we continue to make significant investments to improve product quality, our actual
warranty costs may exceed our reserve, resulting in a need to increase our accruals for warranty charges. We purchase insurance coverage to reduce our exposure to significant levels of product liability claims and maintain a reserve for our self-insured losses based upon estimates of the aggregate liability using claims experience and actuarial assumptions. Incorrect estimates or any significant increase in the rate of our product defect expenses could have a material adverse effect on our results of operations.
Item 1B.Unresolved Staff Comments:
None.
Item 1C.Cybersecurity:
Risk Management and Strategy
We use a combination of people, processes, and technologies to monitor and mitigate cybersecurity threats, which include end-point monitoring, vulnerability assessments and penetration testing. We leverage a variety of cybersecurity services, tools and techniques designed to identify and assess cybersecurity threats and take preemptive action to reduce and, where possible, eliminate the potential impacts.
Our cybersecurity processes are based on the cybersecurity standards set by the Center for Internet Security and the National Institute of Standards and Technology (“NIST”). We regularly engage outside assessors and consultants to identify potential cybersecurity risks and suggest best practices.
Our efforts to safeguard the confidentiality, integrity and availability of our systems and data, maintain regulatory compliance and manage our risk from cybersecurity threats include:
•maintaining a Security Operations Center to monitor and investigate activity that may be suspicious,
•staffing and managing a cybersecurity team to safeguard systems and applications,
•routinely auditing the security of critical information technology systems and services, and
•conducting regular training and simulations for all employees and contractors with access to our systems to enhance awareness and responsiveness to possible threats.
We maintain a Cybersecurity Incident Response Plan, based on NIST’s incident handling framework, to guide our response to cybersecurity threats. The plan includes procedures to triage, assess severity and remediate events in our information technology infrastructure. Annually, we engage third-party experts to conduct penetration testing inside our network.
For data and information that is maintained for us outside our network, we conduct security and privacy assessments of vendors who hold sensitive data and manage critical platforms. We maintain written agreements that govern third-party access to our network and protection of our information, and we conduct annual reviews of appropriate access. We require our suppliers to agree to our Supplier Code of Conduct which includes cybersecurity requirements. We include the assessment of cybersecurity risk as part of our overall enterprise risk management strategy.
Refer to Item 1A. Risk Factors under the heading "We rely on the integrity and security of our information technology systems, and our business could be adversely impacted by extended disruptions, significant security breaches or other compromises of these systems" for further information on the risks we face from cybersecurity threats. We believe that to date, such risks have not materially affected and are not believed to be reasonably likely to materially affect us, our business strategy, results of operations or financial condition.
Governance
The Audit Committee of our Board of Directors is responsible for the oversight of our cybersecurity risk management. At least twice per year, our Chief Technology Officer (“CTO”) and Chief Information Security Officer (“CISO”) provide a cybersecurity update to our Audit Committee, which includes the results of penetration testing, cybersecurity simulations and training, as well as key initiatives and the progress against those initiatives, updates on the changes in trends of cybersecurity threats and the steps management is taking to address cybersecurity risks.
Our CTO and CISO manage our cybersecurity strategy. Our CTO has over 13 years of experience in information security and risk management and reports directly to our President and Chief Executive Officer. Our CISO has over 10 years of experience in information security and risk management, including at a federal law enforcement agency, and has a Master of Science degree in Cybersecurity.
Our CTO and CISO lead our Cybersecurity Incident Response Plan management of cybersecurity incidents with a cross-functional team to assess the potential materiality of cybersecurity events and to report on the detection, analysis, containment and eradication of and recovery from such events. As the severity of events meet certain criteria, as specified by the Incident Response Plan, those events are escalated to senior levels of management and reported to our Disclosure Committee and the Audit Committee. Our Disclosure Committee is responsible for the oversight of controls and procedures related to the public disclosure of material cybersecurity incidents.
Item 2.Properties:
We have operations at locations throughout the U.S. and around the world. None of our owned properties are mortgaged or are held subject to any significant encumbrance. We believe our facilities are in good operating condition and, at present, are sufficient to meet our volume needs currently and for the foreseeable future. Our global headquarters is located in Grand Rapids, Michigan, U.S.A. Our owned and leased principal manufacturing and distribution center locations with greater than 100,000 square feet are as follows:
| | | | | | | | | | | | | | | | | | | | |
| Segment/Category Primarily Supported | Number of Principal
Locations | Owned | Leased |
| Americas | 15 | | | 6 | | | 9 | | |
| EMEA | 6 | | | 5 | | | 1 | | |
| Other category | 2 | | | — | | | 2 | | |
| Total | 23 | | | 11 | | | 12 | | |
| | | | | | | | | | | | | | | | | | | | |
| Segment Primarily Supported | Number of Principal
Locations | Owned | Leased |
| Americas | 13 | | | 6 | | | 7 | | |
| International | 9 | | | 5 | | | 4 | | |
| Total | 22 | | | 11 | | | 11 | | |
Item 3.Legal Proceedings:
We are involved in litigation from time to time in the ordinary course of our business. Based on known information, we do not believe we are a party to any lawsuit or proceeding that is likely to have a material adverse effect on the Company.
Item 4.Mine Safety Disclosures:
Not applicable.
Supplementary Item. Information About Our Executive Officers:
Our executive officers are:
| | | | | | | | |
| Name | Age | Position |
| Sara E. Armbruster | 5253 | President and Chief Executive Officer, Director |
| Donna K. Flynn | 5556 | Vice President, Global Talent ManagementChief People Officer |
| Robert G. Krestakos | 6162 | Vice President, GlobalChief Operations Officer |
| Nicole C. McGrath | 4647 | Vice President, Corporate Controller & Chief Accounting Officer |
| Steven D. Miller | 4849 | Vice President, Chief Technology Officer |
| Lizbeth S. O’Shaughnessy | 6162 | Senior Vice President, Chief Administrative Officer, General Counsel and Secretary |
| Allan W. Smith, Jr. | 5556 | Senior Vice President, President, Americas and Chief RevenueProduct Officer |
| David C. Sylvester | 5859 | Senior Vice President, Chief Financial Officer |
Sara E. Armbruster has been President and Chief Executive Officer since October 2021. Ms. Armbruster was Executive Vice President from April 2021 to October 2021 and Vice President, Strategy, Research and Digital Transformation from February 2018 to April 2021. Ms. Armbruster has been employed by Steelcase since 2007.
Donna K. Flynn has been Vice President, Chief People Officer since February 2024. Ms. Flynn was Vice President, Global Talent Management sincefrom March 2020. Ms. Flynn was2020 to February 2024 and Vice President, WorkSpace Futures - Research from June 2015 to March 2020 and2020. Ms. Flynn has been employed by Steelcase since 2011.
Robert G. Krestakos has been Vice President, Chief Operations Officer since February 2024. Mr. Krestakos was Vice President, Global Operations sincefrom February 2015 to February 2024 and has been employed by Steelcase since 1992.
Nicole C. McGrath has been Vice President, Corporate Controller & Chief Accounting Officer since January 2023. Ms. McGrath was Vice President, Finance from January 2022 to January 2023 and Vice President, Finance - EMEA and Asia Pacific from June 2018 to January 2022 and Chief Financial Officer, Asia Pacific from June 2014 to June 2018.2022. Ms. McGrath has been employed by Steelcase since 2011.
Steven D. Miller has been Vice President, Chief Technology Officer since October 2021. Mr. Miller was Vice President, Chief Information Officer from February 2018 to October 2021 and has been employed by Steelcase since 1999.
Lizbeth S. O’Shaughnessy has been Senior Vice President, Chief Administrative Officer, General Counsel and Secretary since June 2014 and has been employed by Steelcase since 1992.
Allan W. Smith, Jr. has been Senior Vice President, President, Americas and Chief Product Officer since February 2024. Mr. Smith was Senior Vice President, Chief Revenue Officer sincefrom October 2021. Mr. Smith was2021 to February 2024 and Vice President, Global Marketing from September 2013 to October 2021 and2021. Mr. Smith has been employed by Steelcase since 1991.
David C. Sylvester has been Senior Vice President, Chief Financial Officer since April 2011 and has been employed by Steelcase since 1995.
PART II
Item 5.Market for Registrant’s Common Equity, Related Stockholder Matters and Issuer Purchases of Equity Securities:
Common Stock
Our Class A Common Stock is listed on the New York Stock Exchange under the symbol “SCS”. Our Class B Common Stock is not registered under the Exchange Act and there is no established public trading market. See Note 15 to the consolidated financial statements for additional information. As of the close of business on April 11, 2023,9, 2024, we had outstanding 113,953,086114,728,958 shares of common stock with 4,8204,628 shareholders of record. Of these amounts, 93,538,67394,458,144 shares are Class A Common Stock with 4,7564,565 shareholders of record and 20,414,41320,270,814 shares are Class B Common Stock with 6463 shareholders of record.
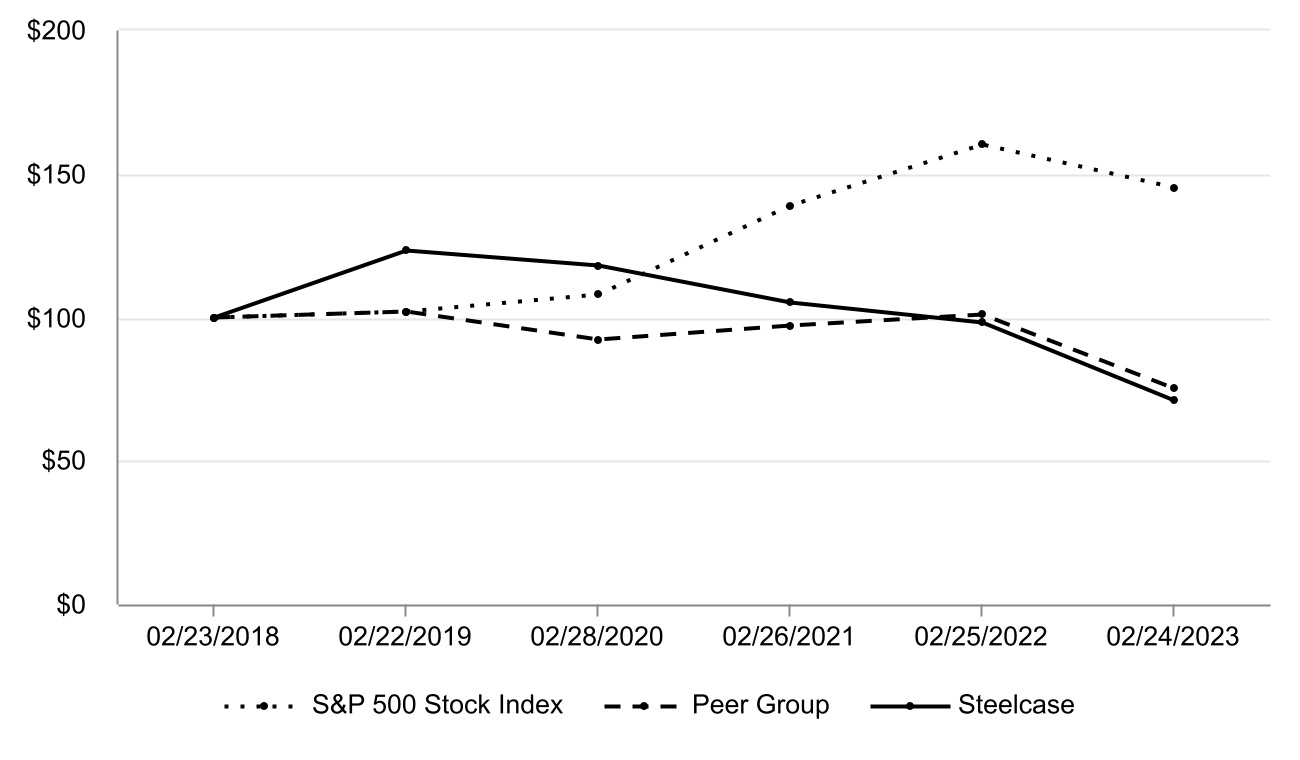
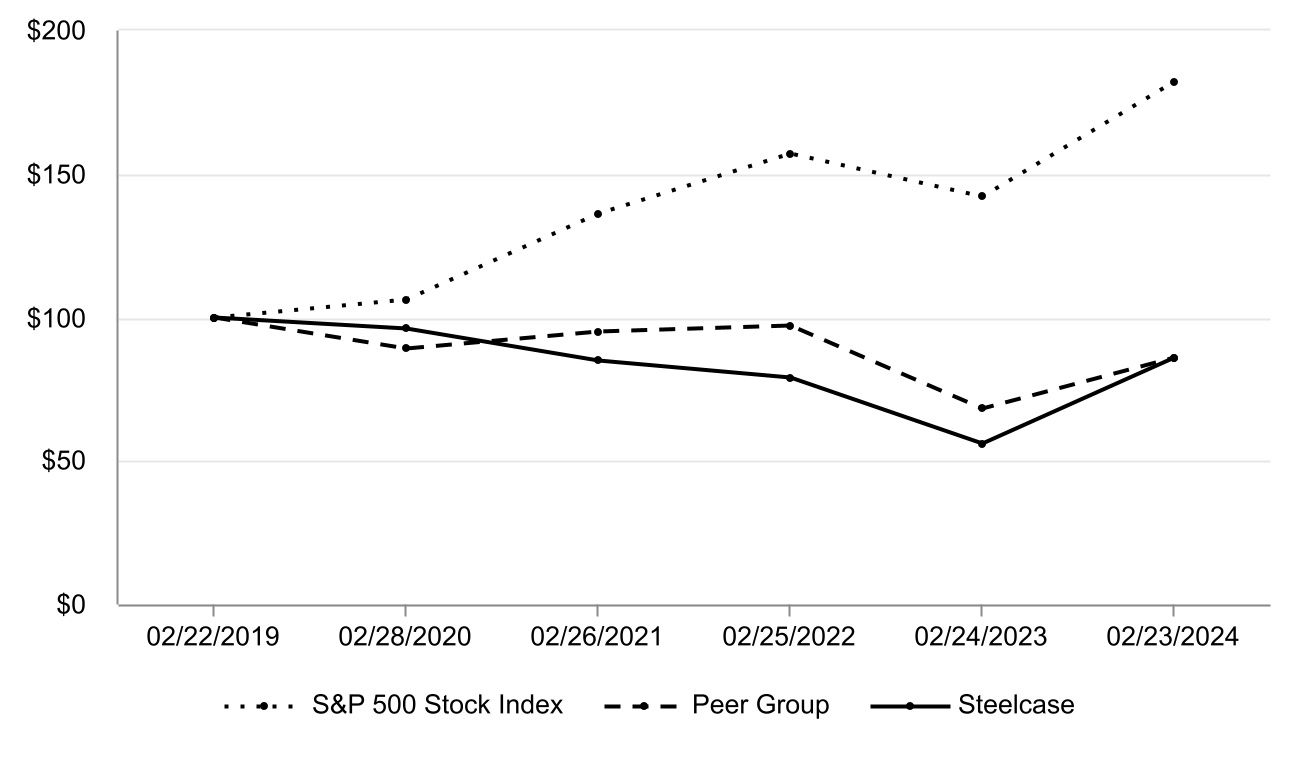
Stock Performance Graph
The following graph shows the yearly percentage change in cumulative shareholder return, assuming a $100.00 investment on February 28, 2018.22, 2019. The S&P 500 Stock Index is used as a performance indicator of the overall stock market. The Peer Group consists of threetwo companies that manufacture office furniture and have industry characteristics that we believe are similar to Steelcase. The peer group consists of HNI Corporation Kimball International, Inc. and MillerKnoll, Inc. (priorPrior to their merger on July 19, 2021, the peer group included both Herman Miller, Inc. and Knoll, Inc.)., and prior to HNI Corporation's acquisition of Kimball International, Inc. on June 1, 2023, the peer group included both HNI Corporation and Kimball International, Inc. The returns of each company in this group are weighted by their relative market capitalization at the beginning of each fiscal year.
Fourth Quarter Share Repurchases
The following is a summary of share repurchase activity during Q4 2023:2024:
| | | | | | | | | | | | | | |
| Period | (a)
Total Number of
Shares Purchased | (b)
Average Price
Paid per Share | (c)
Total Number of
Shares Purchased as
Part of Publicly
Announced Plans
or Programs (1) | (d)
Approximate Dollar
Value of Shares
that May Yet be
Purchased
Under the Plans
or Programs (1)
(in millions) |
| 11/26/2022 - 12/30/2022 | 6,314 | | $ | 6.85 | | — | | $ | 6.4 | |
| 12/31/2022 - 01/27/2023 | 2,901 | | $ | 7.49 | | — | | $ | 6.4 | |
| 01/28/2023 - 02/24/2023 | — | | $ | — | | — | | $ | 6.4 | |
| Total | 9,215 | | (2) | — | | |
| | | | | | | | | | | | | | |
| Period | (a)
Total Number of
Shares Purchased | (b)
Average Price
Paid per Share | (c)
Total Number of
Shares Purchased as
Part of Publicly
Announced Plans
or Programs (1) | (d)
Approximate Dollar
Value of Shares
that May Yet be
Purchased
Under the Plans
or Programs (1)
(in millions) |
| 11/25/2023 - 12/29/2023 | 2,084 | | $ | 14.11 | | — | | $ | 106.4 | |
| 12/30/2023 - 01/26/2024 | 202 | | $ | 12.97 | | — | | $ | 106.4 | |
| 01/27/2024 - 02/23/2024 | — | | $ | — | | — | | $ | 106.4 | |
| Total | 2,286 | | (2) | — | | |
(1)In January 2016, the Board of Directors approved a share repurchase program, announced on January 19, 2016, permitting the repurchase of up to $150 of shares of our common stock. In October 2023, the Board of Directors approved a share repurchase program, announced on October 30, 2023, permitting the repurchase of up to $100 of shares of our common stock.
(2)All shares were repurchased to satisfy participants’ tax withholding obligations upon the issuance of shares under equity awards, pursuant to the terms of our Incentive Compensation Plan.
Item 6.[Reserved]
Item 7.Management’s Discussion and Analysis of Financial Condition and Results of Operations:
The following review of our financial condition and results of operations should be read in conjunction with our consolidated financial statements and accompanying notes thereto included elsewhere within this Report.
This item contains certain non-GAAP financial measures. A “non-GAAP financial measure” is defined as a numerical measure of a company’s financial performance that excludes or includes amounts so as to be different than the most directly comparable measure calculated and presented in accordance with GAAP in the consolidated statements of income, balance sheets or statements of cash flows of the company. The non-GAAP financial measures used are (1) organic revenue growth (decline), (2) adjusted operating income (loss) and (3) adjusted earnings per share. Pursuant to the requirements of Regulation G, we have provided a reconciliation of each of the non-GAAP financial measures to the most directly comparable GAAP financial measures in the tables below. These measures are supplemental to, and should be used in conjunction with, the most comparable GAAP financial measures. Management uses these non-GAAP financial measures to monitor and evaluate financial results and trends. See Non-GAAP Financial Measures for a description of these measures and why management believes they are also useful to investors.
Financial Summary
Our reportable segments consist of the Americas segment the EMEA segment and the Other category. Unallocated corporate expenses are reported as Corporate.
Results of Operations
| | | | | | | | | | | | | | | | | | | | | | | | | | | | | | | | | | | | | | |
Statement of Operations Data—
Consolidated | Year Ended |
February 24,
2023 | | February 25,
2022 | | February 26,
2021 | |
| Revenue | $ | 3,232.6 | | | 100.0 | % | | $ | 2,772.7 | | | 100.0 | % | | $ | 2,596.2 | | | 100.0 | % | |
| Cost of sales | 2,310.7 | | | 71.5 | | | 2,011.2 | | | 72.5 | | | 1,822.8 | | | 70.2 | | |
| Restructuring costs | 2.5 | | | 0.1 | | | — | | | — | | | 10.6 | | | 0.4 | | |
| Gross profit | 919.4 | | | 28.4 | | | 761.5 | | | 27.5 | | | 762.8 | | | 29.4 | | |
| Operating expenses | 837.2 | | | 25.9 | | | 741.4 | | | 26.8 | | | 684.2 | | | 26.4 | | |
| Goodwill impairment charge | — | | | — | | | — | | | — | | | 17.6 | | | 0.6 | | |
| Restructuring costs | 16.7 | | | 0.5 | | | — | | | — | | | 18.0 | | | 0.7 | | |
| Operating income | 65.5 | | | 2.0 | | | 20.1 | | | 0.7 | | | 43.0 | | | 1.7 | | |
| Interest expense | (28.4) | | | (0.9) | | | (25.7) | | | (0.9) | | | (27.1) | | | (1.1) | | |
| Investment income | 1.0 | | | 0.1 | | | 0.6 | | | — | | | 1.4 | | | 0.1 | | |
| Other income, net | 13.5 | | | 0.4 | | | 6.6 | | | 0.2 | | | 8.6 | | | 0.3 | | |
| Income before income tax expense (benefit) | 51.6 | | | 1.6 | | | 1.6 | | | — | | | 25.9 | | | 1.0 | | |
| Income tax expense (benefit) | 16.3 | | | 0.5 | | | (2.4) | | | (0.1) | | | (0.2) | | | — | | |
| Net income | $ | 35.3 | | | 1.1 | % | | $ | 4.0 | | | 0.1 | % | | $ | 26.1 | | | 1.0 | % | |
| Earnings per share: | | | | | | | | | | | | |
| Basic | $ | 0.30 | | | | | $ | 0.03 | | | | | $ | 0.22 | | | | |
| Diluted | $ | 0.30 | | | | | $ | 0.03 | | | | | $ | 0.22 | | | | |
| | | | | | | | | | | | | | |
| Organic Revenue Growth — Consolidated | Year Ended |
February 24,
2023 | February 25,
2022 |
| Prior year revenue | $ | 2,772.7 | | $ | 2,596.2 | |
| Acquisitions | 58.9 | | 44.8 | |
| Divestitures | (1.4) | | — | |
| | | | |
| Currency translation effects | (77.9) | | 16.0 | |
| Prior year revenue, adjusted | 2,752.3 | | 2,657.0 | |
| Current year revenue | 3,232.6 | | 2,772.7 | |
| | | | |
| | | | |
| | | | |
| Organic growth $ | $ | 480.3 | | $ | 115.7 | |
| Organic growth % | 17 | % | | 4 | % | |
| | | | | | | | | | | | | | | | | | | | | | | | | | | | | | | | | | | | | | |
| Reconciliation of Operating Income to Adjusted Operating Income | Year Ended |
February 24,
2023 | February 25,
2022 | | February 26,
2021 |
| Operating income | $ | 65.5 | | | 2.0 | % | | $ | 20.1 | | | 0.7 | % | | $ | 43.0 | | | 1.7 | % | |
| Amortization of purchased intangible assets | 22.8 | | | 0.7 | | | 14.8 | | | 0.6 | | | 16.3 | | | 0.6 | | |
| Goodwill impairment charge | — | | | — | | | — | | | — | | | 17.6 | | | 0.7 | | |
| Restructuring costs | 19.2 | | | 0.6 | | | — | | | — | | | 28.6 | | | 1.1 | | |
| Adjusted operating income | $ | 107.5 | | | 3.3 | % | | $ | 34.9 | | | 1.3 | % | | $ | 105.5 | | | 4.1 | % | |
Results of Operations
| | | | | | | | | | | | | | | | | | | | | | | | | | | | | | | | | | | | | | |
Statement of Operations Data—
Consolidated | Year Ended |
February 23,
2024 | | February 24,
2023 | | February 25,
2022 | |
| Revenue | $ | 3,159.6 | | | 100.0 | % | | $ | 3,232.6 | | | 100.0 | % | | $ | 2,772.7 | | | 100.0 | % | |
| Cost of sales | 2,142.8 | | | 67.9 | | | 2,310.7 | | | 71.5 | | | 2,011.2 | | | 72.5 | | |
| Restructuring costs | 4.4 | | | 0.1 | | | 2.5 | | | 0.1 | | | — | | | — | | |
| Gross profit | 1,012.4 | | | 32.0 | | | 919.4 | | | 28.4 | | | 761.5 | | | 27.5 | | |
| Operating expenses | 876.5 | | | 27.7 | | | 837.2 | | | 25.9 | | | 741.4 | | | 26.8 | | |
| | | | | | | | | | | | |
| Restructuring costs | 18.1 | | | 0.6 | | | 16.7 | | | 0.5 | | | — | | | — | | |
| Operating income | 117.8 | | | 3.7 | | | 65.5 | | | 2.0 | | | 20.1 | | | 0.7 | | |
| Interest expense | (25.9) | | | (0.8) | | | (28.4) | | | (0.9) | | | (25.7) | | | (0.9) | | |
| Investment income | 6.5 | | | 0.2 | | | 1.0 | | | 0.1 | | | 0.6 | | | — | | |
| Other income, net | 8.7 | | | 0.3 | | | 13.5 | | | 0.4 | | | 6.6 | | | 0.2 | | |
| Income before income tax expense (benefit) | 107.1 | | | 3.4 | | | 51.6 | | | 1.6 | | | 1.6 | | | — | | |
| Income tax expense (benefit) | 26.0 | | | 0.8 | | | 16.3 | | | 0.5 | | | (2.4) | | | (0.1) | | |
| Net income | $ | 81.1 | | | 2.6 | % | | $ | 35.3 | | | 1.1 | % | | $ | 4.0 | | | 0.1 | % | |
| Earnings per share: | | | | | | | | | | | | |
| Basic | $ | 0.68 | | | | | $ | 0.30 | | | | | $ | 0.03 | | | | |
| Diluted | $ | 0.68 | | | | | $ | 0.30 | | | | | $ | 0.03 | | | | |
| | | | | | | | | | | | | | | | | | | | |
| Adjusted Earnings Per Share | Year ended |
February 24,
2023 | February 25,
2022 | February 26,
2021 |
| Earnings per share | $ | 0.30 | | | $ | 0.03 | | | $ | 0.22 | | |
| Amortization of purchased intangible assets, per share | 0.19 | | | 0.13 | | | 0.14 | | |
| Income tax effect of amortization of purchased intangible assets, per share | (0.05) | | | (0.03) | | | (0.04) | | |
| Goodwill impairment charge, per share | — | | | — | | | 0.15 | | |
| Restructuring costs, per share | 0.16 | | | — | | | 0.24 | | |
| Income tax effect of restructuring costs, per share | (0.04) | | | — | | | (0.09) | | |
| Adjusted earnings per share | $ | 0.56 | | | $ | 0.13 | | | $ | 0.62 | | |
| | | | | | | | | | | | | | |
| Organic Revenue Growth (Decline) — Consolidated | Year Ended |
February 23,
2024 | February 24,
2023 |
| Prior year revenue | $ | 3,232.6 | | $ | 2,772.7 | |
| Acquisitions | 21.8 | | 58.9 | |
| Divestitures | (40.2) | | (1.4) | |
| | | | |
| Currency translation effects | 14.1 | | (77.9) | |
| Prior year revenue, adjusted | 3,228.3 | | 2,752.3 | |
| Current year revenue | 3,159.6 | | 3,232.6 | |
| | | | |
| | | | |
| | | | |
| Organic growth (decline) $ | $ | (68.7) | | $ | 480.3 | |
| Organic growth (decline) % | (2) | % | | 17 | % | |
| | | | | | | | | | | | | | | | | | | | | | | | | | | | | | | | | | | | | | |
| Reconciliation of Operating Income to Adjusted Operating Income | Year Ended |
February 23,
2024 | February 24,
2023 | | February 25,
2022 |
| Operating income | $ | 117.8 | | | 3.7 | % | | $ | 65.5 | | | 2.0 | % | | $ | 20.1 | | | 0.7 | % | |
| Amortization of purchased intangible assets | 17.2 | | | 0.6 | | | 22.8 | | | 0.7 | | | 14.8 | | | 0.6 | | |
| Restructuring costs | 22.5 | | | 0.7 | | | 19.2 | | | 0.6 | | | — | | | — | | |
| Adjusted operating income | $ | 157.5 | | | 5.0 | % | | $ | 107.5 | | | 3.3 | % | | $ | 34.9 | | | 1.3 | % | |
| | | | | | | | | | | | | | | | | | | | |
| Adjusted Earnings Per Share | Year ended |
February 23,
2024 | February 24,
2023 | February 25,
2022 |
| Earnings per share | $ | 0.68 | | | $ | 0.30 | | | $ | 0.03 | | |
| Amortization of purchased intangible assets, per share | 0.15 | | | 0.19 | | | 0.13 | | |
| Income tax effect of amortization of purchased intangible assets, per share | (0.04) | | | (0.05) | | | (0.03) | | |
| Restructuring costs, per share | 0.19 | | | 0.16 | | | — | | |
| Income tax effect of restructuring costs, per share | (0.05) | | | (0.04) | | | — | | |
| Adjusted earnings per share | $ | 0.93 | | | $ | 0.56 | | | $ | 0.13 | | |
The current year results of operations are presented in comparison to the prior year within the sections below. For a discussion of the 20222023 results of operations in comparison to 2021,2022, see "Management’s Discussion and Analysis of Financial Condition and Results of Operations" in our 20222023 Annual Report on Form 10-K.10-K (which was updated by Exhibit 99.1 to our Current Report on Form 8-K filed on September 22, 2023, to conform with our reportable segments reflected herein).
Overview
In 2023,2024, our revenue, gross margin and earnings per share improved compared to 2023, despite a decline in revenue, primarily driven by continued benefits from the prior year as year-over-year pricing benefits exceeded year-over-year inflation impacts. During 2022 andactions we implemented over the first halfprevious two years in response to significant inflationary pressures. Many of 2023, broad-basedthe supply chain disruptions such as labor shortages and delayswe experienced in long distance supply chains, impacted our ability to manufacture and complete deliveries to our customers,2023 abated, and we experienced significant inflation in steel, fuel and other commodities.made additional operational improvements. Volume declined year over year as industry demand remained soft. In response to the inflationary pressures,softening demand in certain markets in our International segment, we implemented multiple list price increases globallyrestructuring actions in 2022EMEA and 2023Asia Pacific.
We achieved modest order growth (adjusted for the impact of divestitures and a temporary surchargecurrency translation effects) in the Americas in 2023. As2024 compared to 2023, offset by order declines in International. Year-over-year order growth in the Americas improved over the course of the endyear, with growth of 2023, the benefits of our cumulative pricing actions approximated the cumulative inflation we incurred over the past two years, and we expect to have continued gross margin improvement from our pricing actions in 2024. In addition, supply chain disruptions began to ease12% in the second half of 2023 which led to reduced lead times and faster order fulfillment.
Our 17% revenue growth in 2023 was driven by the benefits of our pricing actions and increased volume, including revenue from our acquisition of HALCON in Q2 2023. We had a strong order backlog at the start of the year and broad-based order growth in the Americas and EMEAcompared to a decline of 7% in the first half of the year. In Q3 2023, orders declined comparedOrder fulfillment patterns continued to the prior yearshorten in connection with softening industry demand patterns,2024, and in Q4 2023, the year-over-year order declines improved compared to Q3 2023, primarily due to increased project orders from large corporate customers. Atbacklog of approximately $625 at the end of the year, our backlog of customer orders2024 was approximately $690, which was 14%8% lower than at the prior year. In responseend of 2023.
Our liquidity increased $237.8 during 2024 driven by our improved earnings and a reduction in working capital as we decreased inventory levels as supply chain disruptions abated, and we also generated $49.4 of proceeds from the sale of fixed assets. During 2024, we invested in our business transformation initiative as we entered the application-development phase for our new ERP system. We expect to have significant additional investments and expenditures for this initiative in 2025 and expect to deploy the softening demand patternsnew ERP system beginning in Q3 2023, we took actions to reduce our operational spending which included workforce reductions in the Americas and actions to wind down our customer aviation function.2026.
We recorded net income of $81.1 and diluted earnings per share of $0.68 in 2024 compared to net income of $35.3 and diluted earnings per share of $0.30 in 20232023. Operating income of $117.8 in 2024 represented an improvement of $52.3 compared to net income of $4.0 and diluted earnings per share of $0.03 in 2022. Operatingoperating income of $65.5 in 2023 represented an increase of $45.4 compared to the prior year. The increaseimprovement was driven by higher pricing benefits, net of inflation, higher volume, partially offset by the impacts of lower volume and higher operating expensesexpenses. We reported adjusted operating income of $157.5 and $19.2adjusted earnings per share of restructuring costs related$0.93 in 2024 compared to workforce reductions in the Americas and wind down of our customer aviation function. We reported adjusted operating income of $107.5 and adjusted earnings per share of $0.56 in 2023, and we had adjusted operating income of $34.9 and adjusted earnings per share of $0.13 in the prior year.
Revenue of $3,232.6$3,159.6 in 20232024 represented an increasea decline of $459.9$73.0 or 16.6%2% compared to the prior year, drivenyear. Revenue declined by growth across all segments. Approximately $325approximately 9% due to lower volume (net of the increaseimpact of an acquisition and divestitures), which was related topartially offset by approximately 6% revenue growth from higher pricing benefits and approximately $210 was related to higher volume (which included approximately $65 from acquisitions), partially offset by approximately $78$14.1 of unfavorablefavorable currency translation effects, primarily in EMEA.effects. Revenue increaseddecreased by 22.9%1% in the Americas 1.9%and 7% in EMEA and 4.6%International. On an organic basis, revenue in the Other category. Organic revenue growth was $480.3 or 17%2024 represented a decline of 2% compared to the prior year, with 20%revenue approximately flat in the Americas 13%and an 8% decline in EMEA and 8% in the Other category.International.
Cost of sales as a percentage of revenue improved by 100360 basis points in 20232024 compared to the prior year. The improvement was driven by approximately $170 ofthe higher pricing benefits net of inflation, and the benefits of higher volume, partially offset by approximately $33the impacts of higher fixed overhead costslower volume, unfavorable business mix and labor inefficiencies and
$18.2$15.3 of higher variable compensation expense. We also realized approximately $24 of savings from operational improvements, which were mostly offset by higher employee costs. Cost of sales as a percentage of revenue improved by 210380 basis points in the Americas but increasedand by 160300 basis points in EMEA and by 50 basis points in the Other category.International.
Operating expenses increased by $95.8$39.3 in 2023, but decreased by 902024, or 180 basis points as a percentage of revenue, compared to the prior year. Operating expenses in 20232024 included:
•$38.836.4 of higher variable compensation expense,
•$28.411.0 of higher information technology costs primarily related to our business transformation initiative,
•$9.5 of higher marketing, product development and sales expenses,
•$24.46.3 from acquisitions,an acquisition and
•approximately $13$6 of higher spending in other functional areas and employee costs, andunfavorable currency translation effects,
•partially offset by $7.5 of savings related to our customer aviation function and a $6.6 decrease from divestitures.
Operating expenses included $4.8 of gains related to the sale of land and other fixed assets and $6.1 of gains primarily related to the sale of aircraft and other aviation assets in 2024 compared to $12.9 of gains on sales of fixed assets, primarily land, in 2023. In addition, operating expenses in 2024 reflected a $9.5 benefit from a decrease in the valuation of a contingent earnout liability compared to $5.2 of expense from an increase in the valuation of a contingent earnout liability
•partially offset by $17.2 of favorable currency translation effects.
Operating expenses included $12.9 of gains on sales of fixed assets in 2023 compared2023. See Note 7 to a $15.4 gain on the sale of land in 2022.consolidated financial statements for additional information.
We recorded restructuring costs of $19.2$22.5 in the Americas2024 compared to $19.2 in 2023. See Note 21 to the consolidated financial statements for additional information.
Our 2024 effective tax rate was 24.3% compared to a 2023 effective tax rate wasof 31.6% compared to a 2022 effective tax rate of (150.0)%, which included $3.6 of discrete tax benefits.. See Note 16 to the consolidated financial statements for additional information.
Interest Expense, Investment Income and Other Income, Net
| | Interest Expense, Investment Income and Other Income, Net | Interest Expense, Investment Income and Other Income, Net | Year Ended | Interest Expense, Investment Income and Other Income, Net | Year Ended |
February 24,
2023 | February 25,
2022 | February 26,
2021 | February 23,
2024 | February 24,
2023 | February 25,
2022 |
| Interest expense | Interest expense | $ | (28.4) | | | $ | (25.7) | | | $ | (27.1) | | |
| Investment income | Investment income | 1.0 | | | 0.6 | | | 1.4 | | |
| Investment income | |
| Investment income | |
| Other income, net: | |
| Other income, net: | |
| Other income, net: | Other income, net: | | | | |
| Equity in income of unconsolidated affiliates | Equity in income of unconsolidated affiliates | 12.5 | | | 8.0 | | | 9.3 | | |
| Equity in income of unconsolidated affiliates | |
| Equity in income of unconsolidated affiliates | |
| Foreign exchange gains (losses) | |
| Foreign exchange gains (losses) | |
| Foreign exchange gains (losses) | Foreign exchange gains (losses) | 1.8 | | | 1.1 | | | (2.3) | | |
| Net periodic pension and post-retirement expense, excluding service cost | Net periodic pension and post-retirement expense, excluding service cost | (1.1) | | | (0.7) | | | (0.3) | | |
| Net periodic pension and post-retirement expense, excluding service cost | |
| Net periodic pension and post-retirement expense, excluding service cost | |
| Miscellaneous income (expense), net | |
| Miscellaneous income (expense), net | |
| Miscellaneous income (expense), net | Miscellaneous income (expense), net | 0.3 | | | (1.8) | | | 1.9 | | |
| Total other income, net | Total other income, net | 13.5 | | | 6.6 | | | 8.6 | | |
| Total other income, net | |
| Total other income, net | |
| Total interest expense, investment income and other income, net | Total interest expense, investment income and other income, net | $ | (13.9) | | | $ | (18.5) | | | $ | (17.1) | | |
| Total interest expense, investment income and other income, net | |
| Total interest expense, investment income and other income, net | |
Interest expenseInvestment income increased by $5.5 in 2023 increased2024 compared to 20222023 due to borrowings under our global committed credit facilitya higher level of cash and cash equivalents and improved investment returns. Miscellaneous income (expense), net included a $1.7 impairment on a cost method investment in 2023. Total other income, net2024 and included a $2.2 gain on the sale of an investment in 2023 increased compared to 2022 driven by a $4.5 increasean unconsolidated affiliate in income recorded from our unconsolidated affiliates related to our dealer investments and manufacturing joint venture.2023.
Business Segment Disclosure
See Note 20 to the consolidated financial statements for additional information regarding our business segments.
Americas
The Americas segment serves customers in the U.S., Canada, the Caribbean Islands and Latin America with a comprehensive portfolio of furniture, architectural, textile and architecturalsurface imaging products that are marketed to corporate, government, healthcare, education and retail customers primarily through the Steelcase, AMQ, Coalesse, Designtex, HALCON, Orangebox, Smith System and Viccarbe brands.
| Statement of Operations Data—
Americas | Statement of Operations Data—
Americas | Year Ended | Statement of Operations Data—
Americas | Year Ended |
February 24,
2023 | February 25,
2022 | February 26,
2021 | February 23,
2024 | February 24,
2023 | February 25,
2022 |
| Revenue | Revenue | $ | 2,340.8 | | | 100.0 | % | | $ | 1,905.0 | | | 100.0 | % | | $ | 1,848.5 | | | 100.0 | % | |
| Cost of sales | Cost of sales | 1,665.2 | | | 71.1 | | | 1,394.0 | | | 73.2 | | | 1,285.1 | | | 69.5 | | |
| Cost of sales | |
| Cost of sales | |
| Restructuring costs | |
| Restructuring costs | |
| Restructuring costs | Restructuring costs | 2.5 | | | 0.1 | | | — | | | — | | | 10.6 | | | 0.6 | | |
| Gross profit | Gross profit | 673.1 | | | 28.8 | | | 511.0 | | | 26.8 | | | 552.8 | | | 29.9 | | |
| Gross profit | |
| Gross profit | |
| Operating expenses | |
| Operating expenses | |
| Operating expenses | Operating expenses | 552.6 | | | 23.7 | | | 466.6 | | | 24.5 | | | 437.8 | | | 23.7 | | |
| | Restructuring costs | Restructuring costs | 16.7 | | | 0.7 | | | — | | | — | | | 18.0 | | | 1.0 | | |
| | Restructuring costs | |
| | Restructuring costs | |
| Operating income | Operating income | $ | 103.8 | | | 4.4 | % | | $ | 44.4 | | | 2.3 | % | | $ | 97.0 | | | 5.2 | % | |
| Operating income | |
| Operating income | |
| | Organic Revenue Growth — Americas | Year Ended |
February 24,
2023 | February 25,
2022 |
| Organic Revenue Growth (Decline) — Americas | | Organic Revenue Growth (Decline) — Americas | Year Ended |
| February 23,
2024 | February 24,
2023 |
| Prior year revenue | Prior year revenue | $ | 1,905.0 | | $ | 1,848.5 | |
| Acquisitions | Acquisitions | 52.7 | | 41.8 | |
| Acquisitions | |
| Acquisitions | |
| Divestitures | |
| Divestitures | |
| Divestitures | Divestitures | (0.2) | | — | |
| | Currency translation effects | Currency translation effects | (4.2) | | 5.2 | |
| | Currency translation effects | |
| | Currency translation effects | |
| Prior year revenue, adjusted | Prior year revenue, adjusted | 1,953.3 | | 1,895.5 | |
| Prior year revenue, adjusted | |
| Prior year revenue, adjusted | |
| Current year revenue | |
| Current year revenue | |
| Current year revenue | Current year revenue | 2,340.8 | | 1,905.0 | |
| | Organic growth $ | $ | 387.5 | | $ | 9.5 | |
| Organic growth % | 20 | % | | 1 | % | |
| Organic growth (decline) $ | |
| | Organic growth (decline) $ | |
| | Organic growth (decline) $ | |
| Organic growth (decline) % | |
| Organic growth (decline) % | |
| Organic growth (decline) % | |
| | Reconciliation of Operating Income to Adjusted Operating Income - Americas | Reconciliation of Operating Income to Adjusted Operating Income - Americas | Year Ended | Reconciliation of Operating Income to Adjusted Operating Income - Americas | Year Ended |
February 24,
2023 | February 25,
2022 | | February 26,
2021 | February 23,
2024 | February 24,
2023 | | February 25,
2022 |
| Operating income | Operating income | $ | 103.8 | | | 4.4 | % | | $ | 44.4 | | | 2.3 | % | | $ | 97.0 | | | 5.2 | % | |
| Amortization of purchased intangible assets | Amortization of purchased intangible assets | 18.2 | | | 0.8 | | | 10.5 | | | 0.6 | | | 12.6 | | | 0.7 | | |
| Amortization of purchased intangible assets | |
| Amortization of purchased intangible assets | |
| | Restructuring costs | |
| | Restructuring costs | |
| | Restructuring costs | Restructuring costs | 19.2 | | | 0.8 | | | — | | | — | | | 28.6 | | | 1.6 | | |
| Adjusted operating income | Adjusted operating income | $ | 141.2 | | | 6.0 | % | | $ | 54.9 | | | 2.9 | % | | $ | 138.2 | | | 7.5 | % | |
| Adjusted operating income | |
| Adjusted operating income | |
Operating income in the Americas increased by $59.4$66.4 in 20232024 compared to the prior year. The increase was driven by higher pricing benefits net of inflation, and higher volume,lower restructuring costs, partially offset by the impacts of lower volume and higher operating expenses. The 2023 results included $19.2 of restructuring costs. Adjusted operating income of $141.2$159.6 in 20232024 represented an improvement of $86.3$44.8 compared to the prior year.
The Americas revenue represented 72.4%76.6% of consolidated revenue in 2023.2024. In 2023,2024, revenue of $2,340.8 represented an increase of $435.8decreased by $16.4 or 22.9%1% compared to the prior year. The increase includedRevenue declined by approximately $250 related7% due to lower volume (net of the impact of an acquisition and divestitures), which was partially offset by approximately 6% revenue growth from higher pricing benefits and approximately $190 related to higher volume (including approximately $55 from acquisitions). Organicbenefits. On an organic basis, revenue growthdeclined $5.4 in 2023 was $387.5 or 20%2024 compared to the prior year.
Cost of sales as a percentage of revenue improved by 210380 basis points in 20232024 compared to the prior year. The improvement was driven by approximately $150 ofthe higher pricing benefits netpartially offset by the impacts of inflation,lower volume, unfavorable business mix and the benefits$14.4 of higher variable compensation expense. We also realized approximately $23 of savings from operational improvements, which were mostly offset by higher employee costs.
higher volume, partially offset by approximately $31 of higher fixed overhead costs and labor inefficiencies and $16.1 of higher variable compensation expense.
Operating expenses increased by $86.0$36.7 in 2023, but decreased by 802024, or 170 basis points as a percentage of revenue, compared to the prior year. Operating expenses in 20232024 included:
•$29.332.2 of higher variable compensation expense
•$20.5 from acquisitions,10.6 of higher information technology costs primarily related to our business transformation initiative,
•$15.68.4 of higher marketing, product development and sales expenses and
•$10.9 of higher spending in other functional areas, primarily information technology, facilities and strategy, and6.3 from an acquisition,
•partially offset by $7.5 of savings related to our customer aviation function and a $2.6 increase in the valuation of a contingent earnout liability.$5.4 decrease from divestitures.
Operating expenses in 2024 also included $4.2 of gains related to the sale of land and other fixed assets and $6.1 of gains primarily related to the sale of aircraft and other aviation assets compared to $12.9 of gains on sales of fixed assets, primarily land, in 20232023. In addition, operating expenses in 2024 reflected a $4.7 benefit from a decrease in the valuation of a contingent earnout liability compared to a $15.4 gain on the sale$2.6 of landexpense from an increase to this liability in 2022.2023.
EMEAInternational
The EMEAInternational segment serves customers in Europe, the Middle EastEMEA and Africa primarily under the Steelcase, Coalesse, Orangebox and Viccarbe brands,Asia Pacific with a comprehensive portfolio of furniture and architectural products.products that are marketed to corporate, government, education and retail customers primarily through the Steelcase, Coalesse, Orangebox, Smith System and Viccarbe brands.
| | Statement of Operations Data — EMEA | Year Ended |
February 24,
2023 | February 25,
2022 | February 26,
2021 |
| Statement of Operations Data — International | | Statement of Operations Data — International | Year Ended |
| February 23,
2024 | February 24,
2023 | February 25,
2022 |
| Revenue | Revenue | $ | 610.1 | | | 100.0 | % | | $ | 598.5 | | | 100.0 | % | | $ | 511.3 | | | 100.0 | % | |
| Cost of sales | Cost of sales | 450.9 | | | 73.9 | | | 432.6 | | | 72.3 | | | 380.4 | | | 74.4 | | |
| | Cost of sales | |
| Cost of sales | |
| Restructuring costs | |
| Restructuring costs | |
| Restructuring costs | |
| Gross profit | |
| Gross profit | |
| Gross profit | Gross profit | 159.2 | | | 26.1 | | | 165.9 | | | 27.7 | | | 130.9 | | | 25.6 | | |
| Operating expenses | Operating expenses | 162.6 | | | 26.7 | | | 162.6 | | | 27.1 | | | 145.6 | | | 28.5 | | |
| Goodwill impairment charge | — | | | — | | | — | | | — | | | 17.6 | | | 3.4 | | |
| Operating expenses | |
| Operating expenses | |
| | Operating income (loss) | $ | (3.4) | | | (0.6) | % | | $ | 3.3 | | | 0.6 | % | | $ | (32.3) | | | (6.3) | % | |
| Restructuring costs | |
| | Restructuring costs | |
| | Restructuring costs | |
| Operating loss | |
| Operating loss | |
| Operating loss | |
| | Organic Revenue Growth — EMEA | Year Ended |
February 24,
2023 | February 25,
2022 |
| Organic Revenue Growth (Decline) — International | | Organic Revenue Growth (Decline) — International | Year Ended |
| February 23,
2024 | February 24,
2023 |
| Prior year revenue | Prior year revenue | $ | 598.5 | | $ | 511.3 | |
| Acquisitions | Acquisitions | 6.2 | | 3.0 | |
| Acquisitions | |
| Acquisitions | |
| Divestitures | |
| Divestitures | |
| Divestitures | Divestitures | (1.2) | | — | |
| | Currency translation effects | Currency translation effects | (65.9) | | 7.5 | |
| | Currency translation effects | |
| | Currency translation effects | |
| Prior year revenue, adjusted | Prior year revenue, adjusted | 537.6 | | 521.8 | |
| Prior year revenue, adjusted | |
| Prior year revenue, adjusted | |
| Current year revenue | |
| Current year revenue | |
| Current year revenue | Current year revenue | 610.1 | | 598.5 | |
| | Organic growth $ | $ | 72.5 | | $ | 76.7 | |
| Organic growth % | 13 | % | | 15 | % | |
| Organic growth (decline) $ | |
| | Organic growth (decline) $ | |
| | Organic growth (decline) $ | |
| Organic growth (decline) % | |
| Organic growth (decline) % | |
| Organic growth (decline) % | |
| | | | | | | | | | | | | | | | | | | | | | | | | | | | | | | | | | | | | | |
| Reconciliation of Operating Income (Loss) to Adjusted Operating Income (Loss) - EMEA | Year Ended |
February 24,
2023 | February 25,
2022 | | February 26,
2021 |
| Operating income (loss) | $ | (3.4) | | | (0.6) | % | | $ | 3.3 | | | 0.6 | % | | $ | (32.3) | | | (6.3) | % | |
| Amortization of purchased intangible assets | 4.6 | | | 0.8 | | | 4.3 | | | 0.7 | | | 3.7 | | | 0.7 | | |
| Goodwill impairment charge | — | | | — | | | — | | | — | | | 17.6 | | | 3.4 | | |
| | | | | | | | | | | | |
| Adjusted operating income (loss) | $ | 1.2 | | | 0.2 | % | | $ | 7.6 | | | 1.3 | % | | $ | (11.0) | | | (2.2) | % | |
Operating results in EMEA decreased by $6.7 in 2023 compared to the prior year. The decline was driven by higher cost of sales, primarily due to higher inflation. Adjusted operating income of $1.2 in 2023 represented a decline of $6.4 compared to the prior year. | | | | | | | | | | | | | | | | | | | | | | | | | | | | | | | | | | | | | | |
| Reconciliation of Operating Loss to Adjusted Operating Income (Loss) - International | Year Ended |
February 23,
2024 | February 24,
2023 | | February 25,
2022 |
| Operating loss | $ | (26.0) | | | (3.5) | % | | $ | (11.9) | | | (1.5) | % | | $ | (1.1) | | | (0.1) | % | |
| Amortization of purchased intangible assets | 4.7 | | | 0.6 | | | 4.6 | | | 0.6 | | | 4.3 | | | 0.5 | | |
| | | | | | | | | | | | |
| Restructuring costs | 19.2 | | | 2.6 | | | — | | | — | | | — | | | — | | |
| Adjusted operating income (loss) | $ | (2.1) | | | (0.3) | % | | $ | (7.3) | | | (0.9) | % | | $ | 3.2 | | | 0.4 | % | |
EMEA revenue represented 18.9% of consolidated revenueThe operating loss in 2023. In 2023, revenue of $610.1 represented an increase of $11.6 or 1.9%International increased by $14.1 in 2024 compared to the prior year. The increase was broad-based across all markets.driven by restructuring costs and the impacts of lower volume, partially offset by higher pricing benefits. The adjusted operating loss of $2.1 in 2024 represented an improvement of $5.2 compared to the prior year.
International revenue represented 23.4% of consolidated revenue in 2024. In 2024, revenue decreased by $56.6 or 7% compared to the prior year. Revenue increaseddeclined by approximately $60 related16% due to lower volume (net of the impact of a divestiture), which was partially offset by 7% revenue growth from higher pricing benefits and by approximately $15 related to higher volume (including approximately $11 from an acquisition), mostly offset by approximately $66$17 of unfavorablefavorable currency translation effects. OrganicOn an organic basis, revenue growthdeclined $63.3 or 8% in 2023 was $72.5 or 13%2024 compared to the prior year.
Cost of sales as a percentage of revenue increasedimproved by 160300 basis points in 20232024 compared to the prior year. The increaseimprovement was driven by approximately $45 ofthe higher inflation, approximately $4 of higherpricing benefits, lower overhead costs and freight and labor inefficiencies and approximately $2 of unfavorable currency impacts,additional operational improvements partially offset by approximately $60the impacts of higher pricing benefits and the benefits of higherlower volume.
Operating expenses were flat in 2023, but decreasedincreased by 40$2.6, or 240 basis points as a percentage of revenue in 2024, compared to the prior year. Operating expenses in 20232024 included:
•approximately $6 of unfavorable currency translation effects and
•$5.64.2 of higher variable compensation expense associated with the improvement in our consolidated results.
•approximately $5 of higher spending and employee costs,
•$3.6Operating expenses in 2024 reflected a $4.8 benefit from an acquisition, and
•a $2.6 increasedecrease in the valuation of a contingent earnout liability
•offset by $17.2 of favorable currency translation effects.
Other
The Other category includes Asia Pacific and Designtex. Asia Pacific serves customers in Australia, China, India, Japan, Korea and other countries in Southeast Asia primarily under the Steelcase brand with a comprehensive portfolio of furniture and architectural products. Designtex sells textiles, wall coverings and surface imaging solutions specified by architects and designers directly to end-use customers through a direct sales force primarily in North America.
| | | | | | | | | | | | | | | | | | | | | | | | | | | | | | | | | | | | | | |
| Statement of Operations Data — Other | Year Ended |
February 24,
2023 | February 25,
2022 | February 26,
2021 |
| Revenue | $ | 281.7 | | | 100.0 | % | | $ | 269.2 | | | 100.0 | % | | $ | 236.4 | | | 100.0 | % | |
| Cost of sales | 194.6 | | | 69.1 | | | 184.6 | | | 68.6 | | | 157.3 | | | 66.5 | | |
| | | | | | | | | | | | |
| Gross profit | 87.1 | | | 30.9 | | | 84.6 | | | 31.4 | | | 79.1 | | | 33.5 | | |
| Operating expenses | 93.4 | | | 33.1 | | | 87.8 | | | 32.6 | | | 78.9 | | | 33.4 | | |
| | | | | | | | | | | | |
| | | | | | | | | | | | |
| Operating income (loss) | $ | (6.3) | | | (2.2) | % | | $ | (3.2) | | | (1.2) | % | | $ | 0.2 | | | 0.1 | % | |
| | | | | | | | | | | | | | |
| Organic Revenue Growth — Other | Year Ended |
February 24,
2023 | February 25,
2022 |
| Prior year revenue | $ | 269.2 | | $ | 236.4 | |
| | | | |
| | | | |
| | | | |
| Currency translation effects | (7.8) | | 3.3 | |
| Prior year revenue, adjusted | 261.4 | | 239.7 | |
| Current year revenue | 281.7 | | 269.2 | |
| | | | |
| | | | |
| | | | |
| Organic growth $ | $ | 20.3 | | $ | 29.5 | |
| Organic growth % | 8 | % | | 12 | % | |
The operating loss in the Other category increased by $3.1 in 2023 compared to the prior year. The increase was driven by higher cost$2.6 of sales and higher operating expenses.
Revenue in the Other category represented 8.7% of consolidated revenue in 2023. In 2023, revenue of $281.7 representedexpense from an increase of $12.5 or 4.6% compared to the prior year. The increase was primarily driven by India and Designtex. Approximately $13 of the increase was related to higher pricing benefits and approximately $5 was related to higher volume, partially offset by approximately $8 of unfavorable currency translation effects. Organic revenue growth was $20.3 or 8% compared to the prior year.
Cost of sales as a percentage of revenue increased by 50 basis pointsthis liability in 2023 compared to the prior year. The increase was driven by higher inflation and unfavorable currency impacts, partially offset by the benefits of higher volume and approximately $13 of higher pricing benefits.
Operating expenses increased by $5.6 in 2023, or 50 basis points as a percentage of revenue, compared to the prior year. The increase was driven by $10.3 of higher marketing, product development and sales expenses and $2.5 of higher variable compensation expense, partially offset by $7.1 of lower spending in other functional areas.
Corporate
Corporate expenses include unallocated portions of shared service functions such as information technology, corporate facilities, finance, human resources, research, legal and customer aviation, plus deferred compensation expense and income or losses associated with COLI.
| | | | | | | | | | | | | | | | | | | | |
| Statement of Operations Data — Corporate | Year Ended |
February 24,
2023 | February 25,
2022 | February 26,
2021 |
| Operating expenses | $ | 28.6 | | | $ | 24.4 | | | $ | 21.9 | | |
Operating expenses increased by $4.2 in 2023 compared to the prior year. The increase was driven by $5.4 of lower COLI income, $2.3 of higher spending and employee costs and $1.4 of higher variable compensation expense, partially offset by $4.8 of lower deferred compensation expense.2023.
Non-GAAP Financial Measures
The non-GAAP financial measures used in this Management’s Discussion and Analysis of Financial Condition and Results of Operations are: (1) organic revenue growth (decline), (2) adjusted operating income (loss) and (3) adjusted earnings per share.
Organic Revenue Growth (Decline)
We define organic revenue growth (decline) as revenue growth (decline) excluding the impact of acquisitions and divestitures and foreign currency translation effects. Organic revenue growth (decline) is calculated by adjusting prior year revenue to include revenues of acquired companies prior to the date of the company's acquisition, to exclude revenues of divested companies and to use current year average exchange rates in the calculation of foreign-denominated revenue. We believe organic revenue growth (decline) is a meaningful metric to investors as it provides a more consistent comparison of our revenue to prior periods as well as to industry peers.
Adjusted Operating Income (Loss) and Adjusted Earnings Per Share
We define adjusted operating income (loss) as operating income (loss) excluding amortization of purchased intangible assets goodwill impairment charges and restructuring costs. We define adjusted earnings per share as earnings per share, on a diluted basis, excluding amortization of purchased intangible assets goodwill impairment charges and restructuring costs, net of related income tax effects.
•Amortization of purchased intangible assets: We may record intangible assets (such as backlog, dealer relationships, trademarks, know-how and designs and proprietary technology) when we acquire companies. We allocate the fair value of purchase consideration to net tangible and intangible assets acquired based on their estimated fair values. The fair value estimates for these intangible assets require management to make significant estimates and assumptions, which include the useful lives of intangible assets. We believe that adjusting for amortization of purchased intangible assets provides a more consistent comparison of our operating performance to prior periods as well as to industry peers. As our business strategy in recent years has included an increased number of acquisitions, intangible asset amortization has become more significant.
•Goodwill impairment charges: Goodwill represents the difference between the purchase price and the related underlying tangible and identifiable intangible net asset fair values resulting from business acquisitions. We evaluate goodwill for impairment annually in Q4, or earlier if conditions indicate that there may be a potential for impairment, and goodwill impairment charges may be recorded as a result of these assessments. We believe that adjusting for goodwill impairment charges provides a more consistent comparison of our operating performance to prior periods as well as to industry peers.
•Restructuring costs: Restructuring costs may be recorded as our business strategies change or in response to changing market trends and economic conditions. We believe that adjusting for restructuring costs, which are primarily associated with business exit and workforce reduction costs, provides a more consistent comparison of our operating performance to prior periods as well as to industry peers.
Liquidity and Capital Resources
Liquidity
Cash and cash equivalents are used to fund day-to-day operations, including seasonal disbursements, particularly the annual payment of accrued variable compensation and retirement plan contributions in Q1 of each fiscal year. During normal business conditions, we target a range of $75 to $175 for cash and cash equivalents to fund operating requirements. In addition, we may carry additional liquidity for potential investments in strategic initiatives and as a cushion against economic volatility, and from time to time, we may allow our cash and cash equivalents to temporarily fall below our targeted range to fund acquisitions and other growth initiatives.
| | Liquidity Sources | Liquidity Sources | February 24,
2023 | February 25,
2022 | Liquidity Sources | February 23,
2024 | February 24,
2023 |
| Cash and cash equivalents | Cash and cash equivalents | $ | 90.4 | | | $ | 200.9 | | |
| | Company-owned life insurance | Company-owned life insurance | 157.3 | | | 168.0 | | |
| | Company-owned life insurance | |
| | Company-owned life insurance | |
| Availability under credit facilities | |
| Availability under credit facilities | |
| Availability under credit facilities | Availability under credit facilities | 269.7 | | | 262.0 | | |
| Total liquidity sources available | Total liquidity sources available | $ | 517.4 | | | $ | 630.9 | | |
| Total liquidity sources available | |
| Total liquidity sources available | |
As of February 24, 2023,23, 2024, we held a total of $90.4$318.6 in cash and cash equivalents. Of that total, 52%85% was located in the U.S. and the remaining 48%15%, or $43.0,$48.8, was located outside of the U.S., primarily in China (including Hong Kong), Mexico, India, Malaysiathe U.K. and the U.K.Malaysia.
COLICompany-owned life insurance ("COLI") investments are recorded at their net cash surrender value. Our investments in COLI policies are intended to be utilized as a long-term funding source for long-term benefit obligations. However, COLI can also be used as a source of liquidity. We believe the financial strength of the issuing insurance companies associated with our COLI policies is sufficient to meet their obligations. See Note 10 to the consolidated financial statements for additional information.
Availability under credit facilities may be reduced related to compliance with applicable covenants. See Liquidity Facilities for more information.
The following table summarizes our consolidated statements of cash flows:
| | Cash Flow Data | Cash Flow Data | Year Ended | Cash Flow Data | Year Ended |
February 24,
2023 | February 25,
2022 | February 26,
2021 | February 23,
2024 | February 24,
2023 | February 25,
2022 |
| Net cash flow provided by (used in): | Net cash flow provided by (used in): | |
| Operating activities | Operating activities | $ | 89.4 | | | $ | (102.6) | | | $ | 64.8 | | |
| Operating activities | |
| Operating activities | |
| Investing activities | |
| Investing activities | |
| Investing activities | Investing activities | (134.8) | | | (65.5) | | | (30.6) | | |
| Financing activities | Financing activities | (62.9) | | | (120.0) | | | (87.8) | | |
| Financing activities | |
| Financing activities | |
| Effect of exchange rate changes on cash and cash equivalents | Effect of exchange rate changes on cash and cash equivalents | (1.5) | | | (0.5) | | | 2.1 | | |
| Net decrease in cash, cash equivalents and restricted cash | (109.8) | | | (288.6) | | | (51.5) | | |
| Effect of exchange rate changes on cash and cash equivalents | |
| Effect of exchange rate changes on cash and cash equivalents | |
| Net increase (decrease) in cash, cash equivalents and restricted cash | |
| Net increase (decrease) in cash, cash equivalents and restricted cash | |
| Net increase (decrease) in cash, cash equivalents and restricted cash | |
| Cash, cash equivalents and restricted cash, beginning of period | |
| Cash, cash equivalents and restricted cash, beginning of period | |
| Cash, cash equivalents and restricted cash, beginning of period | Cash, cash equivalents and restricted cash, beginning of period | 207.0 | | | 495.6 | | | 547.1 | | |
| Cash, cash equivalents and restricted cash, end of period | Cash, cash equivalents and restricted cash, end of period | $ | 97.2 | | | $ | 207.0 | | | $ | 495.6 | | |
| Cash, cash equivalents and restricted cash, end of period | |
| Cash, cash equivalents and restricted cash, end of period | |
Cash provided by (used in) operating activities
| | Cash Flow Data — Operating Activities | Cash Flow Data — Operating Activities | Year Ended | Cash Flow Data — Operating Activities | Year Ended |
February 24,
2023 | February 25,
2022 | February 26,
2021 | February 23,
2024 | February 24,
2023 | February 25,
2022 |
| Net income | Net income | $ | 35.3 | | | $ | 4.0 | | | $ | 26.1 | | |
| Depreciation and amortization | Depreciation and amortization | 90.0 | | | 83.2 | | | 85.2 | | |
| Goodwill impairment charge | — | | | — | | | 17.6 | | |
| Depreciation and amortization | |
| Depreciation and amortization | |
| | Restructuring costs | |
| | Restructuring costs | |
| | Restructuring costs | Restructuring costs | 19.2 | | | — | | | 28.6 | | |
| Changes in accounts receivable, inventories and accounts payable | Changes in accounts receivable, inventories and accounts payable | (71.0) | | | (145.4) | | | 79.0 | | |
| Changes in accounts receivable, inventories and accounts payable | |
| Changes in accounts receivable, inventories and accounts payable | |
| Income taxes receivable | |
| Income taxes receivable | |
| Income taxes receivable | Income taxes receivable | 36.4 | | | 7.8 | | | 7.8 | | |
| Employee compensation liabilities | Employee compensation liabilities | 34.2 | | | (19.3) | | | (138.7) | | |
| Employee compensation liabilities | |
| Employee compensation liabilities | |
| Employee benefit obligations | |
| Employee benefit obligations | |
| Employee benefit obligations | Employee benefit obligations | (12.4) | | | (15.4) | | | (22.6) | | |
| Customer deposits | Customer deposits | (24.9) | | | 18.4 | | | 2.2 | | |
| Customer deposits | |
| Customer deposits | |
| Other | |
| Other | |
| Other | Other | (17.4) | | | (35.9) | | | (20.4) | | |
| Net cash provided by (used in) operating activities | Net cash provided by (used in) operating activities | $ | 89.4 | | | $ | (102.6) | | | $ | 64.8 | | |
| Net cash provided by (used in) operating activities | |
| Net cash provided by (used in) operating activities | |
In 2024, our improved operating results drove a significant increase in cash. Additionally, we generated cash from working capital primarily due to decreased levels of inventory and normalized supplier lead times related to supply chain improvements and improvements in the number of days sales outstanding in accounts receivable. In 2023, cash provided by operating activities improved comparedwas used to the prior year, driven by the benefits of higher net income and continued focus on controllingmeet working capital despiterequirements primarily due to increased levels of inventory, which were purchased to mitigate the impacts of supply chain disruptions. Annual payments related to accrued variable compensationdisruptions, and retirement plan contributions totaled $32.4 in 2023 compared to $50.4 in the prior year. In 2023, we received $33.5 related to the carryback of our 2021 tax loss in the U.S., and we paid $14.7 of severance and other separation-related benefits and business exit costs Annual payments related to restructuring activitiesaccrued variable compensation and retirement plan contributions totaled $77.3 in our Americas segment. See Note 212024 compared to $32.4 in the consolidated financial statements for additional information.prior year.
Cash used inprovided by (used in) investing activities
| | Cash Flow Data — Investing Activities | Cash Flow Data — Investing Activities | Year Ended | Cash Flow Data — Investing Activities | Year Ended |
February 24,
2023 | February 25,
2022 | February 26,
2021 | February 23,
2024 | February 24,
2023 | February 25,
2022 |
| Capital expenditures | Capital expenditures | $ | (59.1) | | | $ | (60.5) | | | $ | (41.3) | | |
| Proceeds from disposal of fixed assets | Proceeds from disposal of fixed assets | 9.9 | | | 17.4 | | | 7.4 | | |
| Proceeds from COLI policies | 12.2 | | | 7.8 | | | 2.2 | | |
| Acquisitions, net of cash acquired | (105.3) | | | (32.6) | | | (3.8) | | |
| Proceeds from disposal of fixed assets | |
| Proceeds from disposal of fixed assets | |
| | Acquisition, net of cash acquired | |
| | Acquisition, net of cash acquired | |
| | Acquisition, net of cash acquired | |
| Other | Other | 7.5 | | | 2.4 | | | 4.9 | | |
| Net cash used in investing activities | $ | (134.8) | | | $ | (65.5) | | | $ | (30.6) | | |
| Other | |
| Other | |
| Net cash provided by (used in) investing activities | |
| Net cash provided by (used in) investing activities | |
| Net cash provided by (used in) investing activities | |
Capital expenditures in 20232024 primarily related to investments in manufacturing operations, product development,information technology, and customer-facing facilities and information technology. Proceedsshowrooms. In 2024, proceeds from the disposal of fixed assets primarily included $36.0 of proceeds from the sale of aircraft and other aviation assets and $12.5 from the sale of fixed assets and land. In 2023, proceeds from the disposal of fixed assets included $7.0 and $17.2 related to the sale of land in 2023 and 2022, respectively.
In 2023, we acquired HALCON using cash and borrowings under our global committed credit facility. See Note 19 to the consolidated financial statements for additional information.other investing activities included $12.2 of proceeds from COLI policies.
Cash used in financing activities
| | Cash Flow Data — Financing Activities | Cash Flow Data — Financing Activities | Year Ended | Cash Flow Data — Financing Activities | Year Ended |
February 24,
2023 | February 25,
2022 | February 26,
2021 | February 23,
2024 | February 24,
2023 | February 25,
2022 |
| Dividends paid | Dividends paid | $ | (57.3) | | | $ | (62.6) | | | $ | (43.5) | | |
| Common stock repurchases | Common stock repurchases | (3.9) | | | (55.2) | | | (42.7) | | |
| Common stock repurchases | |
| Common stock repurchases | |
| | Repayments on note payable | |
| | | Repayments on note payable | |
| | Repayments on note payable | |
| Other | |
| Other | |
| Other | Other | (1.7) | | | (2.2) | | | (1.6) | | |
| Net cash used in financing activities | Net cash used in financing activities | $ | (62.9) | | | $ | (120.0) | | | $ | (87.8) | | |
| Net cash used in financing activities | |
| Net cash used in financing activities | |
The following table details dividends paid per common share during each quarter of 20232024 and 2022:2023:
| | Dividend Data | Dividend Data | First
Quarter | | Second
Quarter | | Third
Quarter | | Fourth Quarter | | Total | Dividend Data | First
Quarter | | Second
Quarter | | Third
Quarter | | Fourth Quarter | | Total |
| 2024 | |
| Dividends declared and paid per common share | |
| Dividends declared and paid per common share | |
| Dividends declared and paid per common share | |
| 2023 | 2023 | |
| Dividends declared and paid per common share | Dividends declared and paid per common share | $ | 0.145 | | | $ | 0.145 | | | $ | 0.100 | | | $ | 0.100 | | | $ | 0.490 | |
| 2022 | |
| Dividends declared and paid per common share | Dividends declared and paid per common share | $ | 0.100 | | | $ | 0.145 | | | $ | 0.145 | | | $ | 0.145 | | | $ | 0.535 | |
| Dividends declared and paid per common share | |
During 20232024 and 2022,2023, we made common stock repurchases of $3.9$4.2 and $55.2,$3.9, respectively, all of which related to our Class A Common Stock. These common stock repurchases included repurchases of $3.9Stock and $6.0 in 2023 and 2022, respectively, which were made to satisfy participants' tax withholding obligations upon the issuance of shares under equity awards, pursuant to the terms of our Incentive Compensation Plan.
During 2024, we made a balloon payment of $31.8 for a note payable that matured during Q1 2024. See Note 13 to the consolidated financial statements for additional information.
As of February 24, 2023,23, 2024, we had $6.4$106.4 of remaining availability under the $150 share repurchase programprograms approved by our Board of Directors in 2016.2016 and 2024.
Liquidity Facilities
Our total liquidity facilities as of February 24, 202323, 2024 were as follows:
| | | | | |
| Liquidity Facilities | February 24,23,
20232024 |
| Global committed bank facility | $ | 250.0300.0 | |
| Other committed bank facility | 8.0 |
| Various uncommitted facilities | 15.221.9 | |
| Total credit lines available | 273.2321.9 | |
| Less: Borrowings outstanding | (3.5)— | |
| Less: Letters of credit | (0.1) | |
| Available capacity | $ | 269.7321.8 | |
We have a $250.0$300.0 global committed bank facility in effect through 2025.2029. As of February 24, 2023,23, 2024, there were no borrowings outstanding under the facility, there were $0.1 in letters of credit reducing our availability to borrow under the facility was not limited, and we were in compliance with all covenants under the facility.
We have an $8.0 committed bank facility related to a subsidiary. As of February 24, 2023, there were $3.5 in borrowings outstanding under the facility and our availability to borrow under the facility was not limited.
We have unsecured uncommitted short-term credit facilities available for working capital purposes with various financial institutions with a total U.S. dollar borrowing capacity of up to $3.8 and a total foreign currency borrowing capacity of up to $11.4$18.1 as of February 24, 2023.23, 2024. These credit facilities have no stated expiration date but may be changed or canceled by the banks at any time. As of February 24, 2023,23, 2024, there were no borrowings outstanding under these uncommitted facilities.
Total consolidated debt as of February 24, 202323, 2024 was $481.2. Our debt primarily$446.3 which consists of $445.5 in term notes due in 2029 with an effective interest rate of 5.6%. In addition, we have a term loan with a balance as of February 24, 2023 of $32.2. This term loan has a floating interest rate based on 30-day LIBOR plus 1.20% and is due in Q1 2024. The term notes are unsecured and the term loan is secured by our two corporate aircraft. The term notes and the term loan contain no financial covenants and are not cross-defaulted to our other debt facilities. covenants.
See Note 13 to the consolidated financial statements for additional information.
Liquidity Outlook
AtAs of February 24, 2023,23, 2024, our total liquidity, which is comprised of cash and cash equivalents and the net cash surrender value of COLI, aggregated to $247.7.$485.5. Our liquidity position, funds available under our credit facilities and cash generated from future operations and proceeds from assets held for sale are expected to be sufficient to finance our known and foreseeable liquidity needs, including our material cash requirements.
Material Cash Requirements
Our material committed cash requirements are as follows:
•Debt: PrincipalWe have no principal obligations on our debt are $35.7 during 20242025 through 2028 and $445.5 thereafter.$446.3 due in 2029. Interest obligations on our debt are estimated to be $23.4 during 2024 and approximately $23 in each year thereafter until maturity. See Note 13 to the consolidated financial statements for additional information.
•Operating leases: We have commitments related to corporate offices, sales offices, showrooms, manufacturing and distribution facilities, vehicles and equipment under non-cancelable operating leases that expire at various dates through 2036.2035. Minimum payments under our operating lease obligations are estimated to be $52.5$52.3 during 20242025 and $188.0$154.6 thereafter. See Note 18 to the consolidated financial statements for additional information.
•Employee benefit and compensation obligations: We have obligations related to contributions and benefit payments expected to be made for post-retirement, pension and defined contribution plans and deferred compensation plans. Our obligations related to post-retirement benefit plans are not contractual, and the plans could be amended at the discretion of our Compensation Committee. Payments related to post-retirement and pension plans are estimated to be $8.1$8.3 during 20242025 and $57.5$56.3 from 20252026 through 2033. See Note 14 to the consolidated financial statements for additional information.2034. Our deferred compensation obligations are estimated to be $6.2$4.9 during 20242025 and $39.6$44.3 thereafter. See Note 1714 to the consolidated financial statements for additional information.
We also have other planned material usages of cash which we consider discretionary. This includes plans for capital expenditures, which are expected to be approximately $70$40 to $80$50 in 2024.2025. We also expect to incur approximately $35 in 2025 of capitalizable costs for cloud computing arrangements related to the implementation of our new ERP system. See Note 2 to the consolidated financial statements for additional information on our accounting policy related to cloud computing arrangements. In addition, we fund dividend payments as and when approved by our Board of Directors. On March 22, 2023,20, 2024, we announced a quarterly dividend on our common stock of $0.10 per share, or approximately $11, to be paid in Q1 2024.2025.
The amounts included above are as of February 24, 2023.23, 2024. Our material cash requirements are subject to fluctuation based on business requirements, economic volatility or investments in strategic initiatives. The amounts of these obligations could change materially over time as new contracts or obligations are initiated and existing contracts or obligations are terminated or modified.
Critical Accounting Estimates
Management’s Discussion and Analysis of Financial Condition and Results of Operations is based upon our consolidated financial statements and accompanying notes. Our consolidated financial statements were prepared in accordance with accounting principles generally accepted in the United States of America. These principles require the use of estimates and assumptions that affect amounts reported and disclosed in the consolidated financial statements and accompanying notes. Although these estimates are based on historical data and management’s knowledge of current events and actions it may undertake in the future, actual results may differ from the estimates if different conditions occur. The accounting estimates that typically involve a higher degree of judgment and complexity are listed and explained below. These estimates were discussed with the Audit Committee of our Board of Directors and affect allboth of our segments.
Business Combinations and Goodwill
We allocate the fair value of purchase consideration to tangible and intangible assets acquired and liabilities assumed based on their estimated fair values. The excess of the fair value of purchase consideration over the fair values of these identifiable assets and liabilities is allocated to goodwill. The allocation of the purchase consideration requires management to make significant estimates and assumptions, especially with respect to intangible assets. These estimates are reviewed with our advisors and can include, but are not limited to, future expected cash flows related to acquired dealer relationships, trademarks and know-how/designs and require estimation of useful lives and discount rates. Our estimates of fair value are based upon assumptions believed to be reasonable but which are inherently uncertain and unpredictable, and as a result, actual results may differ from these estimates. During the measurement period, which is up to one year from the acquisition date, we may record adjustments to the assets acquired and liabilities assumed with the corresponding offset to goodwill. Upon the conclusion of the measurement period, any subsequent adjustments are recorded to earnings. During 2023, we acquired HALCON. See Note 19 to the consolidated financial statements for additional information.
Annually in Q4, or earlier if conditions indicate it is necessary, the carrying value of each reporting unit is compared to an estimate of its fair value. If the estimated fair value of the reporting unit is less than the carrying
value, the difference is recorded as an impairment charge. Goodwill is assigned to and the fair value is tested at the reporting unit level. In 2023,2024, we evaluated goodwill using nine reporting units: the Americas, EMEA, Asia Pacific, Designtex, AMQ, Smith System, Orangebox U.K., Viccarbe and HALCON.
During Q4 2023,2024, we performed our annual impairment assessment of goodwill in our reporting units. In the test for potential impairment, we measured the estimated fair values of our reporting units under an income-based approach by using a discounted cash flow (“DCF”) valuation method. The DCF analysis calculated the present value of projected cash flows and a residual value using discount rates that ranged from 12%11% to 14%13%. Considerable management judgment is necessary to evaluate the impact of operating changes and to estimate future cash flows in measuring fair value. Assumptions used in our DCF valuations, such as discount rates, forecasted revenue growth rates, expected operating margins and estimated capital investment, are consistent with our internal projections as of the time of the assessment. If we had concluded that it was appropriate to increase the discount rate in our analysis by 100 basis points to estimate the fair value of each reporting unit, the fair value of each of our reporting units would still have exceeded its carrying value. These assumptions could change over time, which may result in future impairment charges. We corroborated the results of the DCF analysis with a market-based approach that used observable comparable company information to support the appropriateness of the fair value estimates. There were no impairment charges recorded for any reporting units in 2023.2024. If we had concluded that it was appropriate to increase the discount rate in our analysis by 100 basis points to estimate the fair value of each reporting unit, the fair value of each of our reporting units would still have exceeded its carrying value.
As of February 24, 2023,23, 2024, we had remaining goodwill recorded on our Consolidated Balance Sheet as follows:
| | | | | | | | |
| Reportable Segment | Goodwill |
| Americas | $ | 257.6266.1 | | |
EMEAInternational | 8.58.7 | | |
Other category | 10.7 | | |
| Total | $ | 276.8274.8 | | |
As of the valuation date, the fair value of each reporting unit exceeded its carrying value by at least 20%40%. See Note 2 and Note 11 to the consolidated financial statements for additional information.
Income Taxes
Our annual effective tax rate is based on income, statutory tax rates and tax planning strategies in various jurisdictions in which we operate. Tax laws are complex and subject to different interpretations by the taxpayer and respective governmental taxing authorities. Significant judgment is required in determining our tax expense, measuring our expected ability to realize deferred tax assets and evaluating our tax positions.
We are audited by the U.S. Internal Revenue Service under the Compliance Assurance Process (“CAP”). Under CAP, the U.S. Internal Revenue Service works with large business taxpayers to identify and resolve issues prior to the filing of a tax return. Accordingly, we expect to record minimal liabilities for U.S. Federal uncertain tax positions. Tax positions are reviewed regularly for state, local and non-U.S. tax liabilities associated with uncertain tax positions.
Deferred income tax assets and liabilities are recognized for the estimated future tax consequences attributable to temporary differences between the financial statement carrying amounts of existing assets and liabilities and their respective tax bases. These assets and liabilities are measured using enacted tax rates expected to apply to taxable income in the years in which the temporary differences are expected to reverse. In evaluating our ability to recover deferred tax assets within the jurisdiction from which they arise, we consider all positive and negative evidence. These expectations require significant judgment and are developed using forecasts of future taxable income that are consistent with the internal plans and estimates we are using to manage the underlying business as of the time of the evaluation. Changes in tax laws and rates could also affect recorded deferred tax assets and liabilities in the future. A 1% change in statutory tax rates used to compute our deferred tax assets and liabilities would have increased or decreased our income tax expense in 20232024 by approximately $3.6.$3.9.
Future tax benefits are recognized to the extent that realization of these benefits is considered more likely than not. As of February 24, 2023,23, 2024, we recorded tax benefits from net operating loss carryforwards of $36.5.$33.4. We also have recorded valuation allowances totaling $3.1$4.3 against these assets, which reduced our recorded tax benefit to $33.4.$29.1. It is considered more likely than not that a $33.4$29.1 cash benefit will be realized on these carryforwards in future periods. This determination is based on the expectation that related operations will be sufficiently profitable or
various tax, business and other planning strategies will enable us to utilize the carryforwards. To the extent that
available evidence raises doubt about the realization of a deferred tax asset, a valuation allowance would be established or adjusted. A change in judgment regarding our expected ability to realize deferred tax assets would be accounted for as a discrete tax expense or benefit in the period in which it occurs.
Additionally, we have deferred tax assets related to tax credit carryforwards of $17.9$12.7 comprised primarily of U.S. foreign tax credits, U.S. general business credits and investment tax credits granted by the Czech Republic. The U.S. foreign tax credit and general business credit carryforward periods areperiod is 10 and 20 years, respectively.years. Utilization of foreign tax credits is restricted to 21% of foreign source taxable income in that year. We have projected our pretax domestic earnings and foreign source income and expect to utilize $9.5$9.4 of excess foreign tax credits and $4.1 of general business credits within the allowable carryforward periods. The carryforward period for the Czech Republic investment tax credits is also 10 years. We have projected our pretax earnings in the Czech Republic and expect to utilize the entire $4.3$3.3 of credits within the allowable carryover period. Valuation allowances are recorded to the extent realization of the tax credit carryforwards is not more likely than not.
See Note 16 to the consolidated financial statements for additional information.
Pension and Other Post-Retirement Benefits
We sponsor a number of domestic and foreign plans to provide pension, medical and life insurance benefits to retired employees. As of February 24, 202323, 2024 and February 25, 2022,24, 2023, the fair value of plan assets, benefit plan obligations and funded status of these plans were as follows:
| | Defined Benefit
Pension Plans | Post-Retirement
Plans |
February 24,
2023 | February 25,
2022 | February 24,
2023 | February 25,
2022 |
| Defined Benefit
Pension Plans | | | Defined Benefit
Pension Plans | Post-Retirement
Plans |
| February 23,
2024 | February 24,
2023 | February 23,
2024 | February 24,
2023 |
| Fair value of plan assets | Fair value of plan assets | $ | 22.4 | | | $ | 35.2 | | | $ | — | | | $ | — | | |
| Benefit plan obligations | Benefit plan obligations | 53.9 | | | 73.7 | | | 27.5 | | | 34.1 | | |
| Benefit plan obligations | |
| Benefit plan obligations | |
| Funded status | Funded status | $ | (31.5) | | | $ | (38.5) | | | $ | (27.5) | | | $ | (34.1) | | |
| Funded status | |
| Funded status | |
The post-retirement medical and life insurance plans are unfunded. As of February 24, 2023,23, 2024, approximately 75%73% of our unfunded defined benefit pension obligations is related to our non-qualified supplemental retirement plan that is limited to a select group of management approved by the Compensation Committee of our Board of Directors. The post-retirement medical and life insurance plans were frozen to new participants in 2003. The non-qualified supplemental retirement plan was frozen to new participants in 2016, and the benefits were capped for existing participants. A portion of our investments in whole life and variable life COLI policies with a net cash surrender value of $157.3$166.9 as of February 24, 202323, 2024 are intended to be utilized as a long-term funding source for post-retirement medical benefits, deferred compensation and defined benefit pension plan obligations. The asset values of the COLI policies are not segregated in a trust specifically for the plans and thus are not considered plan assets. Changes in the values of these policies are recorded in operating expenses, but have no effect on the post-retirement benefits expense, defined benefit pension expense or benefit obligations recorded in the consolidated financial statements.
We recognize the cost of benefits provided during retirement over the employees’ active working lives. Inherent in this approach is the requirement to use various actuarial assumptions to predict and measure costs and obligations many years prior to the settlement date. Key actuarial assumptions that require significant management judgment and have a material impact on the measurement of our consolidated benefits expense and benefit obligations include, among others, the discount rate and health care cost trend rates. These and other assumptions are reviewed with our actuaries and updated annually based on relevant external and internal factors and information, including, but not limited to, benefit payments, expenses paid from the plan, rates of termination, medical inflation, regulatory requirements, plan changes and governmental coverage changes.
To conduct our annual review of discount rates, we perform a matching exercise of projected plan cash flows against spot rates on a yield curve comprised of high-quality corporate bonds as of the measurement date (the Ryan ALM Top Third curve). The measurement dates for our retiree benefit plans are consistent with the last day in February. Accordingly, we select discount rates to measure our benefit obligations that are consistent with market indices at the end of February. In 2023,2024, the weighted average discount rate used to determine the estimated fair value of our defined benefit pension plan obligations was increased to 4.80% from 2.50%. Theand the weighted-average discount rate used to determine the estimated fair value of our post-retirement plan obligations was increasedremained consistent compared to 5.47% from 3.38%. Selecting these discount rates in 2023 resulted in a $13.1 actuarial gain recorded related to ourthe prior year.
defined benefit pension plan obligations and a $4.9 actuarial gain recorded related to our post-retirement plan obligations.
Based on consolidated benefit obligations as of February 24, 2023,23, 2024, a one percentage point decline in the discount rate used for benefit plan measurement purposes would have changed the 20232024 consolidated benefit obligations by approximately $7.$8. All obligation-related actuarial gains and losses are amortized using a straight-line method over the average remaining service period of active plan participants.
To conduct our annual review of healthcare cost trend rates, we model our actual claims cost data over a historical period, including an analysis of the pre-65 age group and other important demographic components of our covered retiree population. This data is adjusted to eliminate the impact of plan changes and other factors that would tend to distort the underlying healthcare cost inflation trends. Our initial healthcare cost trend rate is reviewed annually and adjusted as necessary to remain consistent with recent historical experience and our expectations regarding short-term future trends. As of February 24, 2023,23, 2024, our initial rate of 7.50%7.00% for pre-age 65 retirees was trended downward by each year, until the ultimate trend rate of 4.50% was reached. The ultimate trend rate is adjusted annually, as necessary, to approximate the current economic view on the rate of long-term inflation plus an appropriate healthcare cost premium. Post-age 65 trend rates are not applicable as our plan provides a fixed subsidy for post-age 65 benefits.
Despite the previously described policies for selecting key actuarial assumptions, we periodically experience material differences between assumed and actual experience. Our consolidated net unamortized prior service costs of $0.5$0.9 and net actuarial losses of $8.7$9.1 related to our defined benefit pension plans and net actuarial gains of $18.3$14.6 related to our post-retirement plans, are recorded in Accumulated other comprehensive income (loss) on the Consolidated Balance Sheets.
See Note 14 to the consolidated financial statements for additional information.
Forward-Looking Statements
From time to time, in written and oral statements, we discuss our expectations regarding future events and our plans and objectives for future operations. These forward-looking statements discuss goals, intentions and expectations as to future trends, plans, events, results of operations or financial condition, or state other information relating to us, based on current beliefs of management as well as assumptions made by, and information currently available to, us. Forward-looking statements generally are accompanied by words such as “anticipate,” “believe,” “could,” “estimate,” “expect,” “forecast,” “intend,” “may,” “possible,” “potential,” “predict,” “project,” "target" or other similar words, phrases or expressions. Although we believe these forward-looking statements are reasonable, they are based upon a number of assumptions concerning future conditions, any or all of which may ultimately prove to be inaccurate. Forward-looking statements involve a number of risks and uncertainties that could cause actual results to differ materially from those in the forward-looking statements and vary from our expectations because of factors such as, but not limited to, competitive and general economic conditions domestically and internationally; acts of terrorism, war, governmental action, natural disasters, pandemics and other Force Majeure events; cyberattacks; changes in the legal and regulatory environment; changes in raw material, commodity and other input costs; currency fluctuations; changes in customer demand; and the other risks and contingencies detailed in this Report and our other filings with the Securities and Exchange Commission. We undertake no obligation to update, amend or clarify forward-looking statements, whether as a result of new information, future events or otherwise.
Recently Issued Accounting Standards
See Note 3 to the consolidated financial statements for information regarding recently issued accounting standards.
Item 7A.Quantitative and Qualitative Disclosures About Market Risk:
We are exposed to market risks from foreign currency exchange, interest rates, commodity prices and fixed income and equity prices, which could affect our operating results, financial position and cash flows.
Foreign Currency Exchange Risk
We are exposed to foreign currency exchange rate risk primarily on sales and cost commitments, anticipated sales and purchases, assets and liabilities denominated in currencies other than the functional currency of the
operating entity. We seek to manage our foreign exchange risk largely through operational means, including matching revenue with same-currency costs and assets with same-currency liabilities. We transacted business globally in 15 primary currencies in 20232024 and 2022,2023, of which the most significant were the U.S. dollar, the euro, the Canadian dollar, the U.K. pound sterling, the Mexican peso, the Chinese renminbi, the Indian rupee, the Australian dollar and
the U.K. pound sterling and Malaysian ringgit. Revenue from foreign locations represented approximately 30%29% of our consolidated revenue in 20232024 and approximately 33%30% in 2022.2023. We actively manage the foreign currency exposures that are associated with committed foreign currency purchases and sales created in the normal course of business at the local entity level. Exposures that cannot be naturally offset within a local entity to an immaterial amount are often netted with offsetting exposures at other entities or hedged with foreign currency derivatives. We do not use foreign currency derivatives for trading or speculative purposes. Our results are affected by the strength of the currencies in countries where we manufacture or purchase goods relative to the strength of the currencies in countries where our products are sold.
We estimate that an additional 10% strengthening of the U.S. dollar against local currencies would have increased operating income by approximately $14.3$16.5 in 20232024 and by approximately $8$14.3 in 2022.2023. These estimates assume no changes other than the U.S. dollar exchange rate itself. However, this quantitative measure has inherent limitations. The sensitivity analysis disregards the possibility that U.S. dollar and other exchange rates can move in opposite directions and that gains from one currency may or may not be offset by losses from another currency.
The translation of the assets and liabilities of our international subsidiaries is completed using the foreign currency exchange rates as of the end of the fiscal year. Translation adjustments are not included in determining net income but are included in Accumulated other comprehensive income (loss) within shareholders’ equity on the Consolidated Balance Sheets until a sale or substantially complete liquidation of the net investment in the international subsidiary takes place. In certain markets, we could recognize a significant gain or loss related to unrealized cumulative translation adjustments if we were to exit the market and liquidate our net investment. As of February 24, 202323, 2024 and February 25, 2022,24, 2023, the cumulative net currency translation adjustments reduced shareholders’ equity by $76.0$68.5 and $49.4,$76.0, respectively.
Foreign currency exchange gains and losses reflect transaction gains and losses, which arise from monetary assets and liabilities denominated in currencies other than a business unit’s functional currency and are recorded in Other income, net in the Consolidated Statements of Income. In 2024, net foreign currency exchange losses were $1.0, and in 2023, net foreign currency exchange gains were $1.8, and in 2022, net foreign currency exchange gains were $1.1.$1.8.
See Note 2 to the consolidated financial statements for additional information.
Interest Rate Risk
We are exposed to interest rate risk primarily on our cash and cash equivalents and short-term and long-term borrowings. Our cash equivalents are primarily held in money market funds invested in U.S. government debt securities. The risk on our short-term and long-term borrowings iswas primarily related to a floating interest rate loan withthat was repaid in 2024. The loan had a balance of $32.2 and $34.9 as of February 24, 2023 and February 25, 2022, respectively.2023. The loan bearsbore a floating interest rate based on 30-day LIBOR plus 1.20%.
We estimate a 1% increase in interest rates would have increased our net income by approximately $1 in 2024 and by less than $1 in 2023, and 2022, primarily as a result of higher interest income on our cash equivalents and borrowings. However, this quantitative measure has inherent limitations since not all of our investments are in similar asset classes.classes and our borrowings and investment balances can fluctuate throughout the year.
See Note 7 and Note 13 to the consolidated financial statements for additional information.
Commodity Price Risk
We are exposed to commodity price risk on raw material, component and finished good purchases. The raw materials that we purchase and that are used in the manufacture of the components and finished goods are not rare or unique to our industry. The cost of steel, petroleum-based products (including plastics and foam), aluminum, other metals, wood, particleboard and other commodities, such as fuel and energy, have fluctuated due to changes in global supply and demand. Our gross margins could be affected if these types of costs continue to fluctuate or changes in global supply and demand force us to procure materials from outside our current supply chains. We actively manage these raw material costs through global sourcing initiatives and price increases on our products. However, in the short-term, significant increases in raw material costs, commodity and other input costs can be very difficult to offset with price increases because of contractual agreements with our customers, and it is difficult to find effective financial instruments to hedge against such changes.
As a result of changes in commodity costs, cost of sales increaseddecreased by approximately $150$14 during 20232024 and increased by approximately $127$150 in 2022.2023. The decrease in commodity costs during 2024 was driven primarily by
material commodities and fuel. The increase in commodity costs during 2023 was driven primarily by commodities, fuel and logistics. The increase in commodity costs during 2022 was driven primarily by higher steel and other commodity costs, which reflected rising costs during each quarter of the year. We estimate that an additional 1% increase in commodity prices, assuming no offsetting benefit of price increases, would have decreased our operating income by approximately $11 in 2024 and by approximately $13 in 2023 and 2022.2023. This quantitative measure has inherent limitations given the likelihood of implementing pricing actions to offset significant increases in commodity prices.
Fixed Income and Equity Price Risk
We are exposed to fixed income and equity price risk primarily on the net cash surrender value associated with our investments in variable life COLI policies, which totaled $54.3$60.0 as of February 24, 2023.23, 2024. Our variable life COLI policies were allocated at approximately 65%60% fixed income and 35%40% equity investments as of February 24, 2023.23, 2024.
We estimate a 10% adverse change in the value of the equity portion of our variable life COLI investments would reduce our net income by approximately $3 in 2024 and approximately $4 in 2023 and approximately $3 in 2022.2023. However, given that a portion of the investments in COLI policies are intended to be utilized as a long-term funding source for deferred compensation obligations, and the related earnings associated with these obligations are driven by participant investment elections that often include equity market allocations, any adverse change in the equity portion of our variable life COLI investments may be partially offset by reductions in deferred compensation liabilities. We estimate that the risk of changes in the value of the variable life COLI investments due to other factors, including changes in interest rates, yield curve and portfolio duration, would not have a material impact on our results of operations or financial condition. This quantitative measure has inherent limitations since not all of our investments are in similar asset classes.
See Note 10 to the consolidated financial statements for additional information.
Item 8.Financial Statements and Supplementary Data:
MANAGEMENT’S REPORT ON INTERNAL CONTROL OVER FINANCIAL REPORTING
Management is responsible for establishing and maintaining effective internal control over financial reporting. This system is designed to provide reasonable assurance regarding the reliability of financial reporting and the preparation of financial statements for external purposes in accordance with accounting principles generally accepted in the United States of America.
Our internal control over financial reporting includes those policies and procedures that (1) pertain to the maintenance of records that, in reasonable detail, accurately and fairly reflect the transactions and dispositions of our assets; (2) provide reasonable assurance that transactions are recorded as necessary to permit preparation of financial statements in accordance with accounting principles generally accepted in the United States of America, and that receipts and expenditures are being made only in accordance with authorizations of management and the Board of Directors; and (3) provide reasonable assurance regarding prevention or timely detection of unauthorized acquisition, use, or disposition of our assets that could have a material effect on the financial statements.
Because of its inherent limitations, a system of internal control over financial reporting can provide only reasonable assurance and may not prevent or detect all misstatements. Further, because of changes in conditions, effectiveness of internal control over financial reporting may vary over time.
Management assessed the effectiveness of the system of internal control over financial reporting based on the framework in Internal Control—Integrated Framework (2013) issued by the Committee of Sponsoring Organizations of the Treadway Commission. Based on this assessment, management determined that our system of internal control over financial reporting was effective as of February 24, 2023.23, 2024.
Deloitte & Touche LLP, the independent registered certified public accounting firm that audited our financial statements included in this annual report on Form 10-K, also audited the effectiveness of our internal control over financial reporting, as stated in their report which is included herein.
REPORT OF INDEPENDENT REGISTERED PUBLIC ACCOUNTING FIRM
To the Shareholders and the Board of Directors of Steelcase Inc.
Opinion on Internal Control over Financial Reporting
We have audited the internal control over financial reporting of Steelcase Inc. and subsidiaries (the “Company”) as of February 24, 2023,23, 2024, based on criteria established in Internal Control - Integrated Framework (2013) issued by the Committee of Sponsoring Organizations of the Treadway Commission (COSO). In our opinion, the Company maintained, in all material respects, effective internal control over financial reporting as of February 24, 2023,23, 2024, based on criteria established in Internal Control - Integrated Framework (2013) issued by COSO.
We have also audited, in accordance with the standards of the Public Company Accounting Oversight Board (United States) (PCAOB), the consolidated financial statements as of and for the year ended February 24, 2023,23, 2024, of the Company and our report dated April 14, 2023,12, 2024, expressed an unqualified opinion on those financial statements.
Basis for Opinion
The Company’s management is responsible for maintaining effective internal control over financial reporting and for its assessment of the effectiveness of internal control over financial reporting, included in the accompanying Management’s Report on Internal Control over Financial Reporting. Our responsibility is to express an opinion on the Company’s internal control over financial reporting based on our audit. We are a public accounting firm registered with the PCAOB and are required to be independent with respect to the Company in accordance with the U.S. federal securities laws and the applicable rules and regulations of the Securities and Exchange Commission and the PCAOB.
We conducted our audit in accordance with the standards of the PCAOB. Those standards require that we plan and perform the audit to obtain reasonable assurance about whether effective internal control over financial reporting was maintained in all material respects. Our audit included obtaining an understanding of internal control over financial reporting, assessing the risk that a material weakness exists, testing and evaluating the design and operating effectiveness of internal control based on the assessed risk, and performing such other procedures as we considered necessary in the circumstances. We believe that our audit provides a reasonable basis for our opinion.
Definition and Limitations of Internal Control over Financial Reporting
A company’s internal control over financial reporting is a process designed to provide reasonable assurance regarding the reliability of financial reporting and the preparation of financial statements for external purposes in accordance with generally accepted accounting principles. A company’s internal control over financial reporting includes those policies and procedures that (1) pertain to the maintenance of records that, in reasonable detail, accurately and fairly reflect the transactions and dispositions of the assets of the company; (2) provide reasonable assurance that transactions are recorded as necessary to permit preparation of financial statements in accordance with generally accepted accounting principles, and that receipts and expenditures of the company are being made only in accordance with authorizations of management and directors of the company; and (3) provide reasonable assurance regarding prevention or timely detection of unauthorized acquisition, use, or disposition of the company’s assets that could have a material effect on the financial statements.
Because of its inherent limitations, internal control over financial reporting may not prevent or detect misstatements. Also, projections of any evaluation of effectiveness to future periods are subject to the risk that controls may become inadequate because of changes in conditions, or that the degree of compliance with the policies or procedures may deteriorate.
| | | | | |
| /s/ Deloitte & Touche LLP | |
| |
| Grand Rapids, Michigan | |
April 14, 202312, 2024 | |
REPORT OF INDEPENDENT REGISTERED PUBLIC ACCOUNTING FIRM
To the Shareholders and the Board of Directors of Steelcase Inc.
Opinion on the Financial Statements
We have audited the accompanying consolidated balance sheets of Steelcase Inc. and subsidiaries (the "Company") as of February 24, 202323, 2024 and February 25, 2022,24, 2023, the related consolidated statements of income, comprehensive income (loss), changes in shareholders' equity, and cash flows, for each of the three years in the period ended February 24, 2023,23, 2024, and the related notes and the schedules listed in the Index at Item 15 (collectively referred to as the "financial statements"). In our opinion, the financial statements present fairly, in all material respects, the financial position of the Company as of February 24, 202323, 2024 and February 25, 2022,24, 2023, and the results of its operations and its cash flows for each of the three years in the period ended February 24, 2023,23, 2024, in conformity with accounting principles generally accepted in the United States of America.
We have also audited, in accordance with the standards of the Public Company Accounting Oversight Board (United States) (PCAOB), the Company's internal control over financial reporting as of February 24, 2023,23, 2024, based on criteria established in Internal Control — Integrated Framework (2013) issued by the Committee of Sponsoring Organizations of the Treadway Commission and our report dated April 14, 2023,12, 2024, expressed an unqualified opinion on the Company's internal control over financial reporting.
Basis for Opinion
These financial statements are the responsibility of the Company's management. Our responsibility is to express an opinion on the Company's financial statements based on our audits. We are a public accounting firm registered with the PCAOB and are required to be independent with respect to the Company in accordance with the U.S. federal securities laws and the applicable rules and regulations of the Securities and Exchange Commission and the PCAOB.
We conducted our audits in accordance with the standards of the PCAOB. Those standards require that we plan and perform the audit to obtain reasonable assurance about whether the financial statements are free of material misstatement, whether due to error or fraud. Our audits included performing procedures to assess the risks of material misstatement of the financial statements, whether due to error or fraud, and performing procedures that respond to those risks. Such procedures included examining, on a test basis, evidence regarding the amounts and disclosures in the financial statements. Our audits also included evaluating the accounting principles used and significant estimates made by management, as well as evaluating the overall presentation of the financial statements. We believe that our audits provide a reasonable basis for our opinion.
Critical Audit Matter
The critical audit matter communicated below is a matter arising from the current-period audit of the financial statements that was communicated or required to be communicated to the audit committee and that (1) relates to accounts or disclosures that are material to the financial statements and (2) involved our especially challenging, subjective, or complex judgments. The communication of critical audit matters does not alter in any way our opinion on the financial statements, taken as a whole, and we are not, by communicating the critical audit matter below, providing a separate opinion on the critical audit matter or on the accounts or disclosures to which it relates.
Goodwill – AMQ Reporting Unit – Refer to Notes 2 and 11 to the financial statements
Critical Audit Matter Description
The Company’s evaluation of goodwill for impairment involves the comparison of the fair value of each reporting unit to its carrying value. The Company used the discounted cash flow model to estimate fair value, which requires management to make significant estimates and assumptions related to discount rates, forecasted revenue growth rates and expected operating margins. Changes in these assumptions could have a significant impact on either the fair value, the amount of any goodwill impairment charge, or both. The Company corroborates the results determined using the incomean income-based approach with a market-based approach that uses observable comparable company information to support the appropriateness of the fair value estimates. Based on the results of the Company’s annual goodwill impairment evaluation, the Company concluded that no goodwill impairment existed for the year ended February 24, 2023.23, 2024. The consolidated goodwill balance was $276.8$274.8 million as of February 24, 2023,23, 2024, of which $31.5 million was allocated to the AMQ Reporting Unit (“AMQ”).
We identified goodwill for AMQ as a critical audit matter because of the significant judgments made by management to estimate the fair value of AMQ given the sensitivity of operating changes on future cash flows for this reporting unit. This required a high degree of auditor judgment and an increased extent of effort, including the need to involve our fair value specialists, when performing audit procedures to evaluate the reasonableness of management’s estimates and assumptions related to forecasted revenue growth rates and expected operating margins and the selection of the discount rate.
How the Critical Audit Matter Was Addressed in the Audit
Our audit procedures related to forecasted revenue growth rates, expected operating margins and the selection of the discount rate used by management to estimate the fair value of AMQ included the following, among others:
•We tested the effectiveness of controls over management’s goodwill impairment evaluation, including those over the determination of the fair value of AMQ, such as controls related to forecasted revenue growth rates and expected operating margins and the selection of the discount rate.
•We evaluated management’s ability to accurately forecast revenue growth rates and operating margins by comparing actual results to management’s historical forecasts.
•We evaluated the reasonableness of management’s forecasted revenue growth rates and expected operating margins by comparing the forecasts to:
–Historical revenues and operating margins.
–Internal communications to management and the Board of Directors.
–Forecasted information included in Company press releases as well as in analyst and industry reports.
•With the assistance of our fair value specialists, we evaluated the reasonableness of the (1) valuation methodology and (2) discount rate by:
–Testing the source information underlying the determination of the discount rate and the mathematical accuracy of the calculation.
–Developing a range of independent estimates and performing a sensitivity analysis and comparing those to the discount rate selected by management.
| | | | | |
| /s/ Deloitte & Touche LLP | |
| |
| Grand Rapids, Michigan | |
April 14, 202312, 2024 | |
We have served as the Company's auditor since 2009.
STEELCASE INC.
CONSOLIDATED STATEMENTS OF INCOME
(in millions, except per share data)
| | Year Ended |
February 24,
2023 | February 25,
2022 | February 26,
2021 |
| Year Ended | | | Year Ended |
| February 23,
2024 | February 24,
2023 | February 25,
2022 |
| Revenue | Revenue | $ | 3,232.6 | | | $ | 2,772.7 | | | $ | 2,596.2 | | |
| Cost of sales | Cost of sales | 2,310.7 | | | 2,011.2 | | | 1,822.8 | | |
| Cost of sales | |
| Cost of sales | |
| Restructuring costs | |
| Restructuring costs | |
| Restructuring costs | Restructuring costs | 2.5 | | | — | | | 10.6 | | |
| Gross profit | Gross profit | 919.4 | | | 761.5 | | | 762.8 | | |
| Gross profit | |
| Gross profit | |
| Operating expenses | Operating expenses | 837.2 | | | 741.4 | | | 684.2 | | |
| Goodwill impairment charge | — | | | — | | | 17.6 | | |
| Operating expenses | |
| Operating expenses | |
| Restructuring costs | |
| Restructuring costs | |
| Restructuring costs | Restructuring costs | 16.7 | | | — | | | 18.0 | | |
| Operating income | Operating income | 65.5 | | | 20.1 | | | 43.0 | | |
| Operating income | |
| Operating income | |
| Interest expense | |
| Interest expense | |
| Interest expense | Interest expense | (28.4) | | | (25.7) | | | (27.1) | | |
| Investment income | Investment income | 1.0 | | | 0.6 | | | 1.4 | | |
| Investment income | |
| Investment income | |
| Other income, net | |
| Other income, net | |
| Other income, net | Other income, net | 13.5 | | | 6.6 | | | 8.6 | | |
| Income before income tax expense (benefit) | Income before income tax expense (benefit) | 51.6 | | | 1.6 | | | 25.9 | | |
| Income before income tax expense (benefit) | |
| Income before income tax expense (benefit) | |
| Income tax expense (benefit) | |
| Income tax expense (benefit) | |
| Income tax expense (benefit) | Income tax expense (benefit) | 16.3 | | | (2.4) | | | (0.2) | | |
| Net income | Net income | $ | 35.3 | | | $ | 4.0 | | | $ | 26.1 | | |
| Net income | |
| Net income | |
| Earnings per share: | |
| Earnings per share: | |
| Earnings per share: | Earnings per share: | | | | | | |
| Basic | Basic | $ | 0.30 | | | $ | 0.03 | | | $ | 0.22 | | |
| Basic | |
| Basic | |
| Diluted | Diluted | $ | 0.30 | | | $ | 0.03 | | | $ | 0.22 | | |
| Diluted | |
| Diluted | |
See accompanying notes to the consolidated financial statements.
37
STEELCASE INC.
CONSOLIDATED STATEMENTS OF COMPREHENSIVE INCOME (LOSS)
(in millions)
| | | | Year Ended | | Year Ended |
February 24,
2023 | February 25,
2022 | February 26,
2021 | February 23,
2024 | February 24,
2023 | February 25,
2022 |
| Net income | Net income | $ | 35.3 | | | $ | 4.0 | | | $ | 26.1 | | |
| | Other comprehensive income (loss), gross: | Other comprehensive income (loss), gross: | |
| | Other comprehensive income (loss), gross: | |
| | Other comprehensive income (loss), gross: | |
| Unrealized gain (loss) on investments | |
| Unrealized gain (loss) on investments | |
| Unrealized gain (loss) on investments | Unrealized gain (loss) on investments | (0.5) | | | — | | | 0.5 | | |
| Pension and other post-retirement liability adjustments | Pension and other post-retirement liability adjustments | 5.5 | | | 15.3 | | | (4.3) | | |
| Derivative adjustments | 1.3 | | | 1.3 | | | 1.3 | | |
| Pension and other post-retirement liability adjustments | |
| Pension and other post-retirement liability adjustments | |
| Derivative amortization | |
| Derivative amortization | |
| Derivative amortization | |
| Foreign currency translation adjustments | Foreign currency translation adjustments | (26.6) | | | (23.3) | | | 31.4 | | |
| Foreign currency translation adjustments | |
| Foreign currency translation adjustments | |
| Total other comprehensive income (loss), gross | |
| Total other comprehensive income (loss), gross | |
| Total other comprehensive income (loss), gross | Total other comprehensive income (loss), gross | (20.3) | | | (6.7) | | | 28.9 | | |
| | Other comprehensive income (loss), tax (expense) benefit: | Other comprehensive income (loss), tax (expense) benefit: | |
| | Other comprehensive income (loss), tax (expense) benefit: | |
| | Other comprehensive income (loss), tax (expense) benefit: | |
| Unrealized gain (loss) on investments | |
| Unrealized gain (loss) on investments | |
| Unrealized gain (loss) on investments | Unrealized gain (loss) on investments | 0.1 | | | — | | | (0.1) | | |
| Pension and other post-retirement liability adjustments | Pension and other post-retirement liability adjustments | (1.4) | | | (3.5) | | | 0.8 | | |
| Derivative adjustments | (0.3) | | | (0.4) | | | (0.3) | | |
| Pension and other post-retirement liability adjustments | |
| Pension and other post-retirement liability adjustments | |
| Derivative amortization | |
| Derivative amortization | |
| Derivative amortization | |
| Foreign currency translation adjustments | Foreign currency translation adjustments | — | | | — | | | — | | |
| Foreign currency translation adjustments | |
| Foreign currency translation adjustments | |
| Total other comprehensive income (loss), tax (expense) benefit | |
| Total other comprehensive income (loss), tax (expense) benefit | |
| Total other comprehensive income (loss), tax (expense) benefit | Total other comprehensive income (loss), tax (expense) benefit | (1.6) | | | (3.9) | | | 0.4 | | |
| | Other comprehensive income (loss), net: | Other comprehensive income (loss), net: | |
| | Other comprehensive income (loss), net: | |
| | Other comprehensive income (loss), net: | |
| Unrealized gain (loss) on investment | |
| Unrealized gain (loss) on investment | |
| Unrealized gain (loss) on investment | Unrealized gain (loss) on investment | (0.4) | | | — | | | 0.4 | | |
| Pension and other post-retirement liability adjustments | Pension and other post-retirement liability adjustments | 4.1 | | | 11.8 | | | (3.5) | | |
| Pension and other post-retirement liability adjustments | |
| Pension and other post-retirement liability adjustments | |
| Derivative amortization | |
| Derivative amortization | |
| Derivative amortization | Derivative amortization | 1.0 | | | 0.9 | | | 1.0 | | |
| Foreign currency translation adjustments | Foreign currency translation adjustments | (26.6) | | | (23.3) | | | 31.4 | | |
| Foreign currency translation adjustments | |
| Foreign currency translation adjustments | |
| Total other comprehensive income (loss), net | |
| Total other comprehensive income (loss), net | |
| Total other comprehensive income (loss), net | Total other comprehensive income (loss), net | (21.9) | | | (10.6) | | | 29.3 | | |
| Comprehensive income (loss) | Comprehensive income (loss) | $ | 13.4 | | | $ | (6.6) | | | $ | 55.4 | | |
| Comprehensive income (loss) | |
| Comprehensive income (loss) | |
See accompanying notes to the consolidated financial statements.
38
STEELCASE INC.
CONSOLIDATED BALANCE SHEETS
(in millions, except share data)
| | February 24,
2023 | February 25,
2022 |
| February 23,
2024 | | | February 23,
2024 | February 24,
2023 |
| ASSETS | ASSETS | ASSETS |
| Current assets: | Current assets: | |
| Cash and cash equivalents | Cash and cash equivalents | $ | 90.4 | | | $ | 200.9 | | |
| Accounts receivable, net of allowance of $6.5 and $8.0 | 373.3 | | | 340.4 | | |
| Cash and cash equivalents | |
| Cash and cash equivalents | |
| Accounts receivable, net of allowance of $6.2 and $6.5 | |
| Accounts receivable, net of allowance of $6.2 and $6.5 | |
| Accounts receivable, net of allowance of $6.2 and $6.5 | |
| | Inventories | 319.7 | | | 326.2 | | |
| Inventories, net | |
| | Inventories, net | |
| | Inventories, net | |
| Prepaid expenses | |
| Prepaid expenses | |
| Prepaid expenses | Prepaid expenses | 28.9 | | | 24.0 | | |
| Assets held for sale | Assets held for sale | 29.0 | | | — | | |
| Income taxes receivable | 5.3 | | | 41.7 | | |
| Assets held for sale | |
| Assets held for sale | |
| | Other current assets | |
| | Other current assets | |
| | Other current assets | Other current assets | 37.4 | | | 26.0 | | |
| Total current assets | Total current assets | 884.0 | | | 959.2 | | |
| Property, plant and equipment, net of accumulated depreciation of $1,088.6 and $1,089.0 | 376.5 | | | 392.8 | | |
| Total current assets | |
| Total current assets | |
| Property, plant and equipment, net of accumulated depreciation of $1,119.2 and $1,088.6 | |
| Property, plant and equipment, net of accumulated depreciation of $1,119.2 and $1,088.6 | |
| Property, plant and equipment, net of accumulated depreciation of $1,119.2 and $1,088.6 | |
| Company-owned life insurance ("COLI") | |
| Company-owned life insurance ("COLI") | |
| Company-owned life insurance ("COLI") | Company-owned life insurance ("COLI") | 157.3 | | | 168.0 | | |
| Deferred income taxes | Deferred income taxes | 117.3 | | | 121.2 | | |
| Deferred income taxes | |
| Deferred income taxes | |
| Goodwill | Goodwill | 276.8 | | | 242.8 | | |
| Other intangible assets, net of accumulated amortization of $97.6 and $86.4 | 111.2 | | | 85.5 | | |
| Goodwill | |
| Goodwill | |
| Other intangible assets, net of accumulated amortization of $115.0 and $97.6 | |
| Other intangible assets, net of accumulated amortization of $115.0 and $97.6 | |
| Other intangible assets, net of accumulated amortization of $115.0 and $97.6 | |
| Investments in unconsolidated affiliates | |
| Investments in unconsolidated affiliates | |
| Investments in unconsolidated affiliates | Investments in unconsolidated affiliates | 51.1 | | | 53.1 | | |
| Right-of-use operating lease assets | Right-of-use operating lease assets | 198.3 | | | 209.8 | | |
| Right-of-use operating lease assets | |
| Right-of-use operating lease assets | |
| Other assets | |
| Other assets | |
| Other assets | Other assets | 30.3 | | | 28.6 | | |
| Total assets | Total assets | $ | 2,202.8 | | | $ | 2,261.0 | | |
| Total assets | |
| Total assets | |
| LIABILITIES AND SHAREHOLDERS’ EQUITY | |
| LIABILITIES AND SHAREHOLDERS’ EQUITY | |
| LIABILITIES AND SHAREHOLDERS’ EQUITY | LIABILITIES AND SHAREHOLDERS’ EQUITY | |
| Current liabilities: | Current liabilities: | |
| Current liabilities: | |
| Current liabilities: | |
| Accounts payable | |
| Accounts payable | |
| Accounts payable | Accounts payable | $ | 203.5 | | | $ | 243.6 | | |
| Short-term borrowings and current portion of long-term debt | Short-term borrowings and current portion of long-term debt | 35.7 | | | 5.1 | | |
| Short-term borrowings and current portion of long-term debt | |
| Short-term borrowings and current portion of long-term debt | |
| Current operating lease obligations | Current operating lease obligations | 44.7 | | | 44.2 | | |
| Accrued expenses: | |
| Current operating lease obligations | |
| Current operating lease obligations | |
| Employee compensation | |
| Employee compensation | |
| Employee compensation | Employee compensation | 120.0 | | | 75.6 | | |
| Employee benefit plan obligations | Employee benefit plan obligations | 31.2 | | | 25.4 | | |
| Employee benefit plan obligations | |
| Employee benefit plan obligations | |
| Accrued promotions | |
| Accrued promotions | |
| Accrued promotions | Accrued promotions | 26.7 | | | 32.9 | | |
| Customer deposits | Customer deposits | 50.8 | | | 53.4 | | |
| Other | 90.7 | | | 87.0 | | |
| Customer deposits | |
| Customer deposits | |
| Other current liabilities | |
| Other current liabilities | |
| Other current liabilities | |
| Total current liabilities | |
| Total current liabilities | |
| Total current liabilities | Total current liabilities | 603.3 | | | 567.2 | | |
| Long-term liabilities: | Long-term liabilities: | | | | |
| Long-term liabilities: | |
| Long-term liabilities: | |
| Long-term debt less current maturities | |
| Long-term debt less current maturities | |
| Long-term debt less current maturities | Long-term debt less current maturities | 445.5 | | | 477.4 | | |
| Employee benefit plan obligations | Employee benefit plan obligations | 103.0 | | | 126.7 | | |
| Employee benefit plan obligations | |
| Employee benefit plan obligations | |
| Long-term operating lease obligations | |
| Long-term operating lease obligations | |
| Long-term operating lease obligations | Long-term operating lease obligations | 169.9 | | | 182.2 | | |
| Other long-term liabilities | Other long-term liabilities | 54.9 | | | 55.3 | | |
| Other long-term liabilities | |
| Other long-term liabilities | |
| Total long-term liabilities | |
| Total long-term liabilities | |
| Total long-term liabilities | Total long-term liabilities | 773.3 | | | 841.6 | | |
| Total liabilities | Total liabilities | 1,376.6 | | | 1,408.8 | | |
| Total liabilities | |
| Total liabilities | |
| Shareholders’ equity: | |
| Shareholders’ equity: | |
| Shareholders’ equity: | Shareholders’ equity: | | | | |
| Preferred stock-no par value; 50,000,000 shares authorized, none issued and outstanding | Preferred stock-no par value; 50,000,000 shares authorized, none issued and outstanding | — | | | — | | |
| Class A common stock-no par value; 475,000,000 shares authorized, 92,574,308 and 87,186,800 issued and outstanding | — | | | — | | |
| Class B common stock-no par value, convertible into Class A common stock on a one-for-one basis; 475,000,000 shares authorized, 20,414,413 and 24,922,494 issued and outstanding | — | | | — | | |
| Preferred stock-no par value; 50,000,000 shares authorized, none issued and outstanding | |
| Preferred stock-no par value; 50,000,000 shares authorized, none issued and outstanding | |
| Class A common stock-no par value; 475,000,000 shares authorized, 93,935,016 and 92,574,308 issued and outstanding | |
| Class A common stock-no par value; 475,000,000 shares authorized, 93,935,016 and 92,574,308 issued and outstanding | |
| Class A common stock-no par value; 475,000,000 shares authorized, 93,935,016 and 92,574,308 issued and outstanding | |
| Class B common stock-no par value, convertible into Class A common stock on a one-for-one basis; 475,000,000 shares authorized, 20,292,356 and 20,414,413 issued and outstanding | |
| Class B common stock-no par value, convertible into Class A common stock on a one-for-one basis; 475,000,000 shares authorized, 20,292,356 and 20,414,413 issued and outstanding | |
| Class B common stock-no par value, convertible into Class A common stock on a one-for-one basis; 475,000,000 shares authorized, 20,292,356 and 20,414,413 issued and outstanding | |
| Additional paid-in capital | |
| Additional paid-in capital | |
| Additional paid-in capital | Additional paid-in capital | 19.4 | | | 1.5 | | |
| Accumulated other comprehensive income (loss) | Accumulated other comprehensive income (loss) | (72.5) | | | (50.6) | | |
| Accumulated other comprehensive income (loss) | |
| Accumulated other comprehensive income (loss) | |
| Retained earnings | |
| Retained earnings | |
| Retained earnings | Retained earnings | 879.3 | | | 901.3 | | |
| Total shareholders’ equity | Total shareholders’ equity | 826.2 | | | 852.2 | | |
| Total shareholders’ equity | |
| Total shareholders’ equity | |
| Total liabilities and shareholders’ equity | Total liabilities and shareholders’ equity | $ | 2,202.8 | | | $ | 2,261.0 | | |
| Total liabilities and shareholders’ equity | |
| Total liabilities and shareholders’ equity | |
See accompanying notes to the consolidated financial statements.
39
STEELCASE INC.
CONSOLIDATED STATEMENTS OF CHANGES IN SHAREHOLDERS’ EQUITY
(in millions, except share and per share data)
| | Year Ended |
| February 24,
2023 | February 25,
2022 | February 26,
2021 |
| Year Ended | | | Year Ended |
| February 23,
2024 | | | February 23,
2024 | February 24,
2023 | February 25,
2022 |
| Changes in common shares outstanding: | Changes in common shares outstanding: | |
| Common shares outstanding, beginning of period | Common shares outstanding, beginning of period | 112,109,294 | | | 114,908,676 | | | 117,202,000 | | |
| Common shares outstanding, beginning of period | |
| Common shares outstanding, beginning of period | |
| Common stock issuances | |
| Common stock issuances | |
| Common stock issuances | Common stock issuances | 109,090 | | | 61,360 | | | 64,107 | | |
| Common stock repurchases | Common stock repurchases | (352,700) | | | (4,096,802) | | | (3,288,795) | | |
| Common stock repurchases | |
| Common stock repurchases | |
| Performance and restricted stock units issued as common stock | Performance and restricted stock units issued as common stock | 1,123,037 | | | 1,236,060 | | | 931,364 | | |
| Performance and restricted stock units issued as common stock | |
| Performance and restricted stock units issued as common stock | |
| Common shares outstanding, end of period | |
| Common shares outstanding, end of period | |
| Common shares outstanding, end of period | Common shares outstanding, end of period | 112,988,721 | | | 112,109,294 | | | 114,908,676 | | |
| | Changes in paid-in capital (1): | Changes in paid-in capital (1): | |
| | Changes in paid-in capital (1): | |
| | Changes in paid-in capital (1): | |
| Paid-in capital, beginning of period | |
| Paid-in capital, beginning of period | |
| Paid-in capital, beginning of period | Paid-in capital, beginning of period | $ | 1.5 | | | $ | 12.5 | | | $ | 28.4 | | |
| Common stock issuances | Common stock issuances | 1.0 | | | 0.8 | | | 0.8 | | |
| Common stock issuances | |
| Common stock issuances | |
| Common stock repurchases | Common stock repurchases | (3.9) | | | (28.9) | | | (36.8) | | |
| Common stock repurchases | |
| Common stock repurchases | |
| Performance and restricted stock units expense | |
| Performance and restricted stock units expense | |
| Performance and restricted stock units expense | Performance and restricted stock units expense | 20.8 | | | 17.1 | | | 20.1 | | |
| | Paid-in capital, end of period | Paid-in capital, end of period | 19.4 | | | 1.5 | | | 12.5 | | |
| | Paid-in capital, end of period | |
| | Paid-in capital, end of period | |
| | Changes in accumulated other comprehensive income (loss): | |
| | Changes in accumulated other comprehensive income (loss): | |
| | Changes in accumulated other comprehensive income (loss): | Changes in accumulated other comprehensive income (loss): | |
| Accumulated other comprehensive income (loss), beginning of period | Accumulated other comprehensive income (loss), beginning of period | (50.6) | | | (40.0) | | | (69.3) | | |
| Accumulated other comprehensive income (loss), beginning of period | |
| Accumulated other comprehensive income (loss), beginning of period | |
| Other comprehensive income (loss) | |
| Other comprehensive income (loss) | |
| Other comprehensive income (loss) | Other comprehensive income (loss) | (21.9) | | | (10.6) | | | 29.3 | | |
| | Accumulated other comprehensive income (loss), end of period | Accumulated other comprehensive income (loss), end of period | (72.5) | | | (50.6) | | | (40.0) | | |
| | Accumulated other comprehensive income (loss), end of period | |
| | Accumulated other comprehensive income (loss), end of period | |
| | Changes in retained earnings: | |
| | Changes in retained earnings: | |
| | Changes in retained earnings: | Changes in retained earnings: | |
| Retained earnings, beginning of period | Retained earnings, beginning of period | 901.3 | | | 988.0 | | | 1,011.3 | | |
| Retained earnings, beginning of period | |
| Retained earnings, beginning of period | |
| Net income | |
| Net income | |
| Net income | Net income | 35.3 | | | 4.0 | | | 26.1 | | |
| Dividends paid | Dividends paid | (57.3) | | | (62.6) | | | (43.5) | | |
| Dividends paid | |
| Dividends paid | |
| Common stock repurchases | |
| Common stock repurchases | |
| Common stock repurchases | Common stock repurchases | — | | | (26.3) | | | (5.9) | | |
| Performance and restricted stock units expense (credit) | Performance and restricted stock units expense (credit) | — | | | (1.8) | | | — | | |
| Performance and restricted stock units expense (credit) | |
| Performance and restricted stock units expense (credit) | |
| Retained earnings, end of period | |
| Retained earnings, end of period | |
| Retained earnings, end of period | Retained earnings, end of period | 879.3 | | | 901.3 | | | 988.0 | | |
| Total shareholders' equity | Total shareholders' equity | $ | 826.2 | | | $ | 852.2 | | | $ | 960.5 | | |
| Total shareholders' equity | |
| Total shareholders' equity | |
(1)Shares of our Class A and Class B common stock have no par value; thus, there are no balances for common stock.
See accompanying notes to the consolidated financial statements.
40
STEELCASE INC.
CONSOLIDATED STATEMENTS OF CASH FLOWS
(in millions)
| | | Year Ended | | Year Ended |
February 24,
2023 | February 25,
2022 | February 26,
2021 | February 23,
2024 | February 24,
2023 | February 25,
2022 |
| OPERATING ACTIVITIES | OPERATING ACTIVITIES | |
| Net income | Net income | $ | 35.3 | | | $ | 4.0 | | | $ | 26.1 | | |
| Net income | |
| Net income | |
| Adjustments to reconcile net income to net cash provided by (used in) operating activities: | |
| Adjustments to reconcile net income to net cash provided by (used in) operating activities: | |
| Adjustments to reconcile net income to net cash provided by (used in) operating activities: | Adjustments to reconcile net income to net cash provided by (used in) operating activities: | |
| Depreciation and amortization | Depreciation and amortization | 90.0 | | | 83.2 | | | 85.2 | | |
| Goodwill impairment charge | — | | | — | | | 17.6 | | |
| Depreciation and amortization | |
| Depreciation and amortization | |
| | Restructuring costs | Restructuring costs | 19.2 | | | — | | | 28.6 | | |
| | Restructuring costs | |
| | Restructuring costs | |
| | Gain on sale of fixed assets | Gain on sale of fixed assets | (12.9) | | | (15.1) | | | (5.3) | | |
| Deferred income taxes | (1.0) | | | (14.1) | | | 15.9 | | |
| | Gain on sale of fixed assets | |
| | Gain on sale of fixed assets | |
| | Share-based compensation | Share-based compensation | 21.8 | | | 16.1 | | | 20.9 | | |
| Equity in income of unconsolidated affiliates | (12.5) | | | (7.8) | | | (9.3) | | |
| Dividends received from unconsolidated affiliates | 7.8 | | | 5.5 | | | 8.1 | | |
| | Share-based compensation | |
| | Share-based compensation | |
| | Other | |
| | Other | |
| | | Other | Other | (0.1) | | | (2.7) | | | (8.0) | | |
| Changes in operating assets and liabilities, net of acquisitions and divestitures | Changes in operating assets and liabilities, net of acquisitions and divestitures | |
| Changes in operating assets and liabilities, net of acquisitions and divestitures | |
| Changes in operating assets and liabilities, net of acquisitions and divestitures | |
| Accounts receivable | |
| Accounts receivable | |
| Accounts receivable | Accounts receivable | (43.7) | | | (74.9) | | | 120.9 | | |
| Inventories | Inventories | 12.0 | | | (133.4) | | | 27.1 | | |
| Inventories | |
| Inventories | |
| Income taxes receivable | |
| Income taxes receivable | |
| Income taxes receivable | Income taxes receivable | 36.4 | | | 7.8 | | | 7.8 | | |
| Other assets | Other assets | (6.8) | | | (8.9) | | | (30.7) | | |
| Other assets | |
| Other assets | |
| Accounts payable | |
| Accounts payable | |
| Accounts payable | Accounts payable | (39.3) | | | 62.9 | | | (69.0) | | |
| Employee compensation liabilities | Employee compensation liabilities | 34.2 | | | (19.3) | | | (138.7) | | |
| Employee compensation liabilities | |
| Employee compensation liabilities | |
| Employee benefit obligations | |
| Employee benefit obligations | |
| Employee benefit obligations | Employee benefit obligations | (12.4) | | | (15.4) | | | (22.6) | | |
| | Customer deposits | Customer deposits | (24.9) | | | 18.4 | | | 2.2 | | |
| | Customer deposits | |
| | Customer deposits | |
| Accrued expenses and other liabilities | |
| Accrued expenses and other liabilities | |
| Accrued expenses and other liabilities | Accrued expenses and other liabilities | (13.7) | | | (8.9) | | | (12.0) | | |
| Net cash provided by (used in) operating activities | Net cash provided by (used in) operating activities | 89.4 | | | (102.6) | | | 64.8 | | |
| Net cash provided by (used in) operating activities | |
| Net cash provided by (used in) operating activities | |
| INVESTING ACTIVITIES | |
| INVESTING ACTIVITIES | |
| INVESTING ACTIVITIES | INVESTING ACTIVITIES | | | | | | |
| Capital expenditures | Capital expenditures | (59.1) | | | (60.5) | | | (41.3) | | |
| Capital expenditures | |
| Capital expenditures | |
| Proceeds from disposal of fixed assets | |
| Proceeds from disposal of fixed assets | |
| Proceeds from disposal of fixed assets | Proceeds from disposal of fixed assets | 9.9 | | | 17.4 | | | 7.4 | | |
| | Proceeds from COLI policies | 12.2 | | | 7.8 | | | 2.2 | | |
| | Acquisitions, net of cash acquired | (105.3) | | | (32.6) | | | (3.8) | | |
| | Acquisition, net of cash acquired | |
| | Acquisition, net of cash acquired | |
| | Acquisition, net of cash acquired | |
| Other | Other | 7.5 | | | 2.4 | | | 4.9 | | |
| Net cash used in investing activities | (134.8) | | | (65.5) | | | (30.6) | | |
| Other | |
| Other | |
| Net cash provided by (used in) investing activities | |
| Net cash provided by (used in) investing activities | |
| Net cash provided by (used in) investing activities | |
| FINANCING ACTIVITIES | |
| FINANCING ACTIVITIES | |
| FINANCING ACTIVITIES | FINANCING ACTIVITIES | | | | | | |
| Dividends paid | Dividends paid | (57.3) | | | (62.6) | | | (43.5) | | |
| Dividends paid | |
| Dividends paid | |
| Common stock repurchases | |
| Common stock repurchases | |
| Common stock repurchases | Common stock repurchases | (3.9) | | | (55.2) | | | (42.7) | | |
| Borrowings on global committed bank facility | Borrowings on global committed bank facility | 565.2 | | | — | | | 250.0 | | |
| Borrowings on global committed bank facility | |
| Borrowings on global committed bank facility | |
| Repayments on global committed bank facility | Repayments on global committed bank facility | (565.2) | | | — | | | (250.0) | | |
| Repayments on global committed bank facility | |
| Repayments on global committed bank facility | |
| Repayments on note payable | |
| Repayments on note payable | |
| Repayments on note payable | |
| | Other | |
| | Other | |
| | Other | Other | (1.7) | | | (2.2) | | | (1.6) | | |
| Net cash used in financing activities | Net cash used in financing activities | (62.9) | | | (120.0) | | | (87.8) | | |
| Net cash used in financing activities | |
| Net cash used in financing activities | |
| Effect of exchange rate changes on cash and cash equivalents | Effect of exchange rate changes on cash and cash equivalents | (1.5) | | | (0.5) | | | 2.1 | | |
| Net decrease in cash, cash equivalents and restricted cash | (109.8) | | | (288.6) | | | (51.5) | | |
| Effect of exchange rate changes on cash and cash equivalents | |
| Effect of exchange rate changes on cash and cash equivalents | |
| Net increase (decrease) in cash, cash equivalents and restricted cash | |
| Net increase (decrease) in cash, cash equivalents and restricted cash | |
| Net increase (decrease) in cash, cash equivalents and restricted cash | |
| Cash and cash equivalents and restricted cash, beginning of period (1) | |
| Cash and cash equivalents and restricted cash, beginning of period (1) | |
| Cash and cash equivalents and restricted cash, beginning of period (1) | Cash and cash equivalents and restricted cash, beginning of period (1) | 207.0 | | | 495.6 | | | 547.1 | | |
| Cash and cash equivalents and restricted cash, end of period (2) | Cash and cash equivalents and restricted cash, end of period (2) | $ | 97.2 | | | $ | 207.0 | | | $ | 495.6 | | |
| Cash and cash equivalents and restricted cash, end of period (2) | |
| Cash and cash equivalents and restricted cash, end of period (2) | |
| Supplemental Cash Flow Information: | |
| Supplemental Cash Flow Information: | |
| Supplemental Cash Flow Information: | Supplemental Cash Flow Information: | | | | | | |
| Income taxes paid, net of refunds received | Income taxes paid, net of refunds received | $ | (16.6) | | | $ | 2.5 | | | $ | 24.6 | | |
| Income taxes paid, net of refunds received | |
| Income taxes paid, net of refunds received | |
| Interest paid, net of amounts capitalized | Interest paid, net of amounts capitalized | $ | 26.2 | | | $ | 23.2 | | | $ | 25.4 | | |
| Interest paid, net of amounts capitalized | |
| Interest paid, net of amounts capitalized | |
(1)These amounts include restricted cash of $6.1, $5.8 and $6.1 as of February 25, 2022, February 26, 2021 and February 28, 2020, respectively.
(2)These amounts include restricted cash of $6.8, $6.1 and $5.8 as of February 24, 2023, February 25, 2022 and February 26, 2021, respectively.
(2)These amounts include restricted cash of $7.3, $6.8 and $6.1 as of February 23, 2024, February 24, 2023 and February 25, 2022, respectively.
Restricted cash primarily represents funds held in escrow for potential future workers’ compensation and product liability claims. The restricted cash balance is included as part of Other assets on the Consolidated Balance Sheets.
See accompanying notes to the consolidated financial statements.
41
STEELCASE INC.
NOTES TO THE CONSOLIDATED FINANCIAL STATEMENTS
1.NATURE OF OPERATIONS
Steelcase is a global leader in furnishing the work experience in office environments. Founded in 1912, we are headquartered in Grand Rapids, Michigan, U.S.A. and employ approximately 11,90011,300 employees. We operate manufacturing and distribution center facilities in 2322 principal locations. We distribute products through various channels, including Steelcase independent and company-owned dealers in approximately 770 locations throughout the world. We operate under the Americas and EMEAInternational reportable segments plus an “Other” category.segments. See Note 20 for additional information related to our reportable segments.
2.SUMMARY OF SIGNIFICANT ACCOUNTING POLICIES
Principles of Consolidation
The consolidated financial statements include the accounts of Steelcase Inc. and its subsidiaries. We consolidate entities in which we maintain a controlling interest. All intercompany transactions and balances have been eliminated in consolidation. We also consolidate variable interest entities when appropriate.
Investments in entities where our equity ownership falls between 20% and 50%, or where we otherwise have significant influence, are accounted for under the equity method of accounting. All other investments in unconsolidated affiliates are accounted for under the cost method of accounting. These investments are reported as Investments in unconsolidated affiliates on the Consolidated Balance Sheets, and income from equity method investments and any adjustments to cost method investments are reported in Other income, net in the Consolidated Statements of Income. See Note 12 for additional information.
Fiscal Year
Our fiscal year ends on the last Friday in February, with each fiscal quarter typically including 13 weeks. The fiscal years ended February 23, 2024, February 24, 2023, and February 25, 2022 and February 26, 2021 contained 52 weeks. Reference to a year relates to the fiscal year, ended in February of the year indicated, rather than the calendar year, unless indicated by a month or specific date reference. Additionally, Q1, Q2, Q3 and Q4 reference the first, second, third and fourth quarter, respectively, of the fiscal year indicated. All amounts are in millions, except share and per share data, data presented as a percentage or as otherwise indicated.
Use of Estimates
The preparation of financial statements in conformity with accounting principles generally accepted in the United States of America requires management to make estimates and assumptions that affect the amounts and disclosures in the consolidated financial statements and accompanying notes. Although these estimates are based on historical data and management’s knowledge of current events and actions we may undertake in the future, actual results may differ from these estimates under different assumptions or conditions.
Cash and Cash Equivalents
Cash and cash equivalents include demand bank deposits and highly liquid investment securities with an original maturity of three months or less. Cash equivalents are reported at cost and approximate fair value. Outstanding checks in excess of funds on deposit are classified as Accounts payable on the Consolidated Balance Sheets. Our restricted cash balance as of February 23, 2024 and February 24, 2023 was $7.3 and February 25, 2022 was $6.8, and $6.1, respectively, and consisted primarily of funds held in escrow for potential future workers’ compensation and product liability claims. Our restricted cash balance is classified in Other assets on the Consolidated Balance Sheets.
Allowances for Credit Losses
Allowances for credit losses related to accounts receivable and notes receivable are maintained at a level considered by management to be adequate to absorb an estimate of probable future losses existing at the balance sheet date. In estimating probable losses, we review accounts that are past due or in bankruptcy. We consider an accounts receivable or notes receivable balance past due when payment is not received within the stated terms. We
STEELCASE INC.
NOTES TO THE CONSOLIDATED FINANCIAL STATEMENTS—(Continued)
review accounts that may have higher credit risk using information available about the debtor, such as financial statements, news reports and published credit ratings. We also use general information regarding industry trends, the economic environment and information gathered through our network of field-based employees. Using an
STEELCASE INC.
NOTES TO THE CONSOLIDATED FINANCIAL STATEMENTS—(Continued)
estimate of current fair market value of any applicable collateral and other credit enhancements, such as third party guarantees, we arrive at an estimated loss for specific concerns and estimate an additional amount for the remainder of trade balances based on historical trends and other factors previously referenced. Receivable balances are written off when we determine the balance is uncollectible. Subsequent recoveries, if any, are credited to bad debt expense when received.
Concentrations of Credit Risk
Our trade receivables are due from independent dealers as well as direct customers. We monitor and manage the credit risk associated with individual dealers and direct customers. Dealers are responsible for assessing and assuming credit risk of their customers and may require their customers to provide deposits, letters of credit or other credit enhancement measures. Some sales contracts are structured such that the customer payment or obligation is direct to us. In those cases, we typically assume the credit risk. Whether from dealers or direct customers, our trade credit exposures are not concentrated with any particular entity or industry.
Inventories
Inventories are stated at the lower of cost or net realizable value. The Americas segment primarily uses the last in, first out (“LIFO”) methodand the first in, first out ("FIFO") methods to value its inventories. The EMEAInternational segment values inventories primarily using the first in, first out method (“FIFO”). Businesses within the Other category primarily use the FIFO or the specific identification inventory valuation methods.FIFO. See Note 8 for additional information.
Property, Plant and Equipment
Property, plant and equipment are stated at cost. Major improvements that materially extend the useful lives of the assets are capitalized. Expenditures for repairs and maintenance are charged to expense as incurred. Depreciation is recorded using the straight-line method over the estimated useful lives of the assets. See Note 9 for additional information.
Long-lived assets such as property, plant and equipment are tested for impairment when conditions indicate that the carrying value may not be recoverable. We evaluate several conditions, including, but not limited to, the following: a significant decrease in the market price of an asset or an asset group; a significant adverse change in the extent or manner in which a long-lived asset is being used, including an extended period of idleness; and a current expectation that, more likely than not, a long-lived asset or asset group will be sold or otherwise disposed of significantly before the end of its previously estimated useful life. We review the carrying value of our held and used long-lived assets utilizing estimates of future undiscounted cash flows. If the carrying value of a long-lived asset is considered impaired, an impairment charge is recorded for the amount by which the carrying value of the long-lived asset exceeds its estimated fair value.
When assets are classified as “held for sale,” losses are recorded for the difference between the carrying amount of the property, plant and equipment and the estimated fair value less estimated selling costs. Assets are considered “held for sale” when there is an active program to locate a buyer, and the asset is available for immediate sale in its present condition and is expected to be sold within twelve months.
Cloud Computing Arrangements
We capitalize implementation costs of a cloud computing arrangement with a useful life greater than one year consistent with the capitalization criteria used for internal-use software. Costs incurred during the application-development phase, subject to certain exceptions, are capitalized after the preliminary project phase is completed and management commits to funding the project. Capitalized costs include fees paid to consultants to implement the software, payroll and payroll-related costs of employees to the extent of the time spent directly on the project and interest costs, if appropriate. Capitalized costs are recorded to Prepaid expenses and Other assets on the Consolidated Balance Sheets and within Net cash provided by operating activities on the Consolidated Statements of Cash Flows.
STEELCASE INC.
NOTES TO THE CONSOLIDATED FINANCIAL STATEMENTS—(Continued)
Capitalization of costs ceases at the point when the software associated with the cloud computing arrangement is ready for its intended use. Subsequent enhancements or upgrades are capitalized only to the extent that they add significant new functionality, and maintenance costs are expensed as incurred. Amortization of capitalized costs is recorded over the initial term of the related cloud computing arrangement, including renewal periods that are reasonably certain to be exercised.
In Q3 2024, we entered the application-development phase of a multi-year, phased implementation of a new enterprise resource planning ("ERP") system which is expected to replace our current ERP system and various other supporting systems for operating and financial processes. As of February 23, 2024, we have capitalized $12.3 of costs related to development activities incurred in the implementation of the new ERP system. Capitalized costs associated with other cloud computing arrangements were immaterial as of February 23, 2024 and February 24, 2023.
Goodwill and Other Intangible Assets
Goodwill represents the difference between the purchase price and the related underlying tangible and identifiable intangible net asset fair values resulting from business acquisitions. We evaluate goodwill for impairment annually in Q4, or earlier if conditions indicate there may be potential for impairment, such as significant adverse changes in business climate or operating results, changes in our strategy, significant declines in our stock price or other triggering events. Goodwill is assigned to and the fair value is tested at the reporting unit level. We compare the fair value of each reporting unit to its carrying value. If the fair value of the reporting unit exceeds the carrying value, goodwill is not impaired, and no further testing is required. If the fair value of the reporting unit is less than the carrying value, the difference is recorded as an impairment charge. We estimate the fair value of our reporting units using the income approach, which calculates the fair value of each reporting unit based on the present value of its estimated future cash flows. Cash flow projections are based on management's estimates of revenue growth rates and operating margins, taking into consideration industry and market conditions. The discount rates used are based on the estimated weighted-average cost of capital adjusted for the relevant risk associated with business-specific characteristics and the uncertainty related to the reporting units' ability to execute on the projected cash flows. We
STEELCASE INC.
NOTES TO THE CONSOLIDATED FINANCIAL STATEMENTS—(Continued)
corroborate the results determined using the income approach with a market-based approach that uses observable and comparable company information to support the appropriateness of the fair value estimates. The estimation of the fair value of our reporting units represents a Level 3 measurement.
In 2024 and 2023, we evaluated goodwill and intangible assets using nine reporting units: the Americas, EMEA, Asia Pacific, Designtex, AMQ, Smith System, Orangebox U.K., Viccarbe and HALCON. In 2022, we evaluated goodwill and intangible assets using nine reporting units: the Americas, Red Thread, EMEA, Asia Pacific, Designtex, AMQ, Smith System, Orangebox U.K. and Viccarbe. See Note 11 for additional information.
Other intangible assets subject to amortization consist primarily of dealer relationships, trademarks, know-how/designs and proprietary technology and are amortized over their estimated useful economic lives using the straight-line method. Other intangible assets not subject to amortization are accounted for and evaluated for potential impairment using an income approach based on the cash flows attributable to the related products. See Note 11 for additional information.
Contingencies
Loss contingencies are accrued if the loss is probable and the amount of the loss can be reasonably estimated. Legal costs associated with potential loss contingencies are expensed as incurred. We are involved in litigation from time to time in the ordinary course of our business. Based on known information, we do not believe we are party to any lawsuit or proceeding, individually and in the aggregate, that is likely to have a material adverse impact on the consolidated financial statements.
Self-Insurance
We are self-insured for certain losses relating to domestic workers’ compensation and product liability claims. We purchase insurance coverage to reduce our exposure to significant levels of uncertainty for these claims. Self-insured losses are accrued based upon estimates of the aggregate liability for uninsured claims incurred as of the balance sheet date using current and historical claims experience and actuarial assumptions. These estimates are subject to uncertainty due to a variety of factors, including extended lag times in the reporting and resolution of
STEELCASE INC.
NOTES TO THE CONSOLIDATED FINANCIAL STATEMENTS—(Continued)
claims, and trends or changes in claim settlement patterns, insurance industry practices and legal interpretations. As a result, actual costs could differ significantly from the estimated amounts. Adjustments to estimated reserves are recorded in the period in which the change in estimate occurs.
| | Net Reserve for Estimated Domestic Workers' Compensation Claims | Net Reserve for Estimated Domestic Workers' Compensation Claims | Year Ended | Net Reserve for Estimated Domestic Workers' Compensation Claims | Year Ended |
| February 24, 2023 | February 25, 2022 | February 23, 2024 | February 24, 2023 |
| Assets: | Assets: | |
Long-term - Other assets | Long-term - Other assets | $ | 2.6 | | | $ | 3.8 | | |
Long-term - Other assets | |
Long-term - Other assets | |
| Liabilities: | Liabilities: | |
Current - Accrued expenses - other | 1.7 | | | 1.8 | | |
| Liabilities: | |
| Liabilities: | |
Current - Other current liabilities | |
Current - Other current liabilities | |
Current - Other current liabilities | |
Long-term - Other long-term liabilities | Long-term - Other long-term liabilities | 7.3 | | | 9.1 | | |
| 9.0 | | | 10.9 | | |
Long-term - Other long-term liabilities | |
Long-term - Other long-term liabilities | |
| 6.5 | |
| 6.5 | |
| 6.5 | |
| Net reserve | |
| Net reserve | |
| Net reserve | Net reserve | $ | 6.4 | | | $ | 7.1 | | |
| |
The other long-term assetOther assets balance represents the portion of claims expected to be paid by a third party insurance provider.
STEELCASE INC.
NOTES TO THE CONSOLIDATED FINANCIAL STATEMENTS—(Continued) | | | | | | | | | | | | | | |
| Net Reserve for Estimated Product Liability Claims | Year Ended |
| February 23, 2024 | February 24, 2023 |
| Assets: | | | | |
Long-term - Other assets | $ | 0.3 | | | $ | 0.4 | | |
| Liabilities: | | | | |
Current - Other current liabilities | 0.2 | | | 0.3 | | |
Long-term - Other long-term liabilities | 1.0 | | | 1.4 | | |
| 1.2 | | | 1.7 | | |
| Net reserve | $ | 0.9 | | | $ | 1.3 | | |
| | | | |
| | | | |
| |
| | | | | | | | | | | | | | |
| Net Reserve for Estimated Product Liability Claims | Year Ended |
| February 24, 2023 | February 25, 2022 |
| Assets: | | | | |
Long-term - Other long-term assets | $ | 0.4 | | | $ | 0.6 | | |
| Liabilities: | | | | |
Current - Accrued expenses - other | 0.3 | | | 0.5 | | |
Long-term - Other long-term liabilities | 1.4 | | | 1.9 | | |
| 1.7 | | | 2.4 | | |
| Net reserve | $ | 1.3 | | | $ | 1.8 | | |
| | | | |
| | | | |
| |
The other long-term assetOther assets balance represents the portion of claims expected to be paid by a third party insurance provider.
Product Warranties
We offer warranties ranging from three years to lifetime for most of our products, subject to certain exceptions. These warranties provide for the free repair or replacement of any covered product, part or component that fails during normal use because of a defect in materials or workmanship. The accrued liability for product warranties is based on an estimated amount needed to cover product warranty costs, including product recall and retrofit costs, incurred as of the balance sheet date.
In 2023, we transitioned toWe use an actuarial model forto estimate our estimated product warranty liability to capture longer-term changes in workplace trends that have impacted our claims experience. The accrued liability is estimated using actual paid claims over at least ten years and other actuarial assumptions, which provide a basis for expected future losses using actuarial assumptions. Historically, we used our claims experience for the trailing twelve-months and a calculated lag factor to estimate the accrued liability. The transition to an actuarial model resulted in a decrease of $0.1 to our estimated warranty reserve in 2023, which was recorded to Cost of sales.
These estimates are subject to uncertainty due to a variety of factors, including changes in claim rates and patterns. As a result, actual costs could differ significantly from the estimated amounts. Adjustments to estimated reserves are recorded in the period in which the change in estimate occurs. Changes in claims experience or trends that impact our estimated product warranty liability are recorded to Cost of sales.
| | | | | | | | | | | | | | |
Roll-Forward of Accrued
Liability for Product Warranties | Year Ended |
February 24,
2023 | February 25,
2022 |
| Balance as of beginning of period | $ | 24.0 | | | $ | 22.5 | | |
| Adjustment related to addition of initial quality (1) | 4.5 | | | — | | |
| Accruals related to product warranties, recalls and retrofits | 21.8 | | | 5.9 | | |
| Reductions for settlements | (21.5) | | | (6.7) | | |
| Adjustments related to changes in estimates | (0.1) | | | 2.5 | | |
| Currency translation adjustments | (0.1) | | | (0.2) | | |
| Balance as of end of period | $ | 28.6 | | | $ | 24.0 | | |
STEELCASE INC.
NOTES TO THE CONSOLIDATED FINANCIAL STATEMENTS—(Continued)
| | | | | | | | | | | | | | |
Roll-Forward of Accrued
Liability for Product Warranties | Year Ended |
February 23,
2024 | February 24,
2023 |
| Balance as of beginning of period | $ | 28.6 | | | $ | 24.0 | | |
| Adjustment related to addition of initial quality (1) | — | | | 4.5 | | |
| Accruals related to product warranties, recalls and retrofits | 28.5 | | | 21.8 | | |
| Reductions for settlements | (23.5) | | | (21.5) | | |
| Adjustments related to changes in estimates | — | | | (0.1) | | |
| Currency translation adjustments | 0.1 | | | (0.1) | | |
| Balance as of end of period | $ | 33.7 | | | $ | 28.6 | | |
________________________
(1)Initial quality claims are related to product damage during delivery or installation. As of February 23, 2024 and February 24, 2023, we included claims for initial quality within our product warranty liability which is included in Other current liabilities on the Consolidated Balance Sheet. As of February 25, 2022, our reserve for initial quality was $4.3 and was separately included in Other current liabilities on the Consolidated Balance Sheet.
Our reserve for estimated settlements expected to be paid beyond one year as of February 23, 2024 and February 24, 2023 was $17.3 and February 25, 2022 was $12.0, and $12.8, respectively, and is included in Other long-term liabilities on the Consolidated Balance Sheets.
STEELCASE INC.
NOTES TO THE CONSOLIDATED FINANCIAL STATEMENTS—(Continued)
Pension and Other Post-Retirement Benefits
We sponsor a number of domestic and foreign plans to provide pension benefits and medical and life insurance benefits to retired employees. We measure the net over-funded or under-funded positions of our defined benefit pension plans and post-retirement benefit plans as of the end of each fiscal year and display that position as an asset or liability on the Consolidated Balance Sheets. Any unrecognized prior service credit (cost) or actuarial gains (losses) are reported, net of tax, as a component of Accumulated other comprehensive income (loss) in shareholders’ equity. See Note 14 for additional information.
Environmental Matters
Environmental expenditures related to current operations are expensed as incurred. Expenditures related to an existing condition allegedly caused by past operations, and not associated with current or future revenue generation, are typically recognized upon completion of a feasibility study or our commitment to a formal plan of action. Liabilities are recorded on a discounted basis when site-specific plans indicate the amount and timing of cash payments which are fixed and reliably determinable. We have ongoing monitoring and identification processes to assess how known exposures are progressing against the accrued cost estimates, as well as processes to identify other potential exposures.
| | Environmental Contingencies | Environmental Contingencies | Year Ended | Environmental Contingencies | Year Ended |
| February 24, 2023 | February 25, 2022 | February 23, 2024 | February 24, 2023 |
| Current - Accrued expenses - other | $ | 0.8 | | | $ | 1.1 | | |
Current - Other current liabilities | |
Current - Other current liabilities | |
Current - Other current liabilities | |
| Long-term - Other long-term liabilities | Long-term - Other long-term liabilities | 2.5 | | | 2.3 | | |
| Long-term - Other long-term liabilities | |
| Long-term - Other long-term liabilities | |
| Total environmental contingencies (discounted) | |
| Total environmental contingencies (discounted) | |
| Total environmental contingencies (discounted) | Total environmental contingencies (discounted) | $ | 3.3 | | | $ | 3.4 | | |
| |
The environmental liabilities were discounted using a rate of 3.5% and 2.5% as of February 24, 202323, 2024 and February 25, 2022, respectively.24, 2023. Our undiscounted liabilities were $3.1 and $3.6 as of February 23, 2024 and February 24, 2023, and February 25, 2022.respectively. Based on our ongoing evaluation of these matters, we believe we have accrued sufficient reserves to cover the costs of all known environmental assessments and the remediation costs of all known sites.
STEELCASE INC.
NOTES TO THE CONSOLIDATED FINANCIAL STATEMENTS—(Continued)
Asset Retirement Obligations
We record all known asset retirement obligations for which the liability’s fair value can be reasonably estimated. We also have known conditional asset retirement obligations that are not reasonably estimable due to insufficient information about the timing and method of settlement of the obligation. Accordingly, these obligations have not been recorded in the consolidated financial statements. A liability for these obligations will be recorded in the period when sufficient information regarding timing and method of settlement becomes available to make a reasonable estimate of the liability’s fair value. In addition, there may be conditional asset retirement obligations we have not yet discovered, and therefore, these obligations also have not been included in the consolidated financial statements.
Revenue Recognition
Our revenue consists substantially of product sales and related service revenue. Product sales are reported net of discounts and are recognized when control, consisting of the rights and obligations associated with the sale, passes to the purchaser. For sales to our dealers, this typically occurs when product is shipped from our manufacturing or distribution facilities. In cases where we sell directly to customers, control is typically transferred upon delivery to the customer and, in some cases, following installation and acceptance by the customer. Service revenue is recognized when the services have been rendered. We account for shipping and handling activities as fulfillment activities even if those activities are performed after the control of the product has been transferred. We expense shipping and handling costs at the time revenue is recognized. Revenue does not include sales tax or any other taxes assessed by a governmental authority that are imposed on and concurrent with a specific sale, such as use, excise, value-added and franchise taxes (collectively referred to as "consumption taxes"). We consider ourselves a pass-through entity for collecting and remitting these consumption taxes.
STEELCASE INC.
NOTES TO THE CONSOLIDATED FINANCIAL STATEMENTS—(Continued)
Cost of Sales
Cost of sales includes material, labor, freight and overhead incurred directly related to the procurement, manufacturing and delivery of our products. Included within these categories are such items as employee compensation expense, logistics costs (including shipping and handling costs), facilities expense, depreciation, contract labor costs and warranty expense.
Operating Expenses
Operating expenses include selling, general and administrative expenses not directly related to the procurement, manufacturing and delivery of our products. Included in these expenses are items such as employee compensation expense, facilities expense, depreciation, research and development expense, royalty expense, information technology services, professional services and travel and entertainment expense.
Research and Development Expenses
Research and development expenses, which we define as expenses related to the investigative activities we conduct to lead to the development of new products and to improve existing products and procedures, are expensed as incurred and were $48.2 for 2024, $44.4 for 2023 and $45.4 for 2022 and $48.1 for 2021.2022.
Income Taxes
Deferred income tax assets and liabilities are recognized for the estimated future tax consequences attributable to temporary differences between the carrying amounts of existing assets and liabilities recorded in the consolidated financial statements and their respective tax bases. These deferred income tax assets and liabilities are measured using enacted tax rates expected to apply to taxable income in the years in which the temporary differences are expected to reverse. The effect of a change in tax rates on deferred income tax assets and liabilities is recognized in the Consolidated Statements of Income in the period that includes the enactment date.
We establish valuation allowances against deferred tax assets when it is more likely than not that all or a portion of the deferred tax assets will not be realized. All evidence, both positive and negative, is identified and considered in making the determination. Future realization of the existing deferred tax asset depends, in part, on the existence of
STEELCASE INC.
NOTES TO THE CONSOLIDATED FINANCIAL STATEMENTS—(Continued)
sufficient taxable income of appropriate character within the carryforward period available under tax law applicable in the jurisdiction in which the related deferred tax assets were generated.
We have net operating loss carryforwards available in certain jurisdictions to reduce future taxable income. Future tax benefits associated with net operating loss carryforwards are recognized to the extent that realization of these benefits is considered more likely than not. This determination is based on the expectation that related operations will be sufficiently profitable or various tax, business and other planning strategies will enable us to utilize the net operating loss carryforwards within the carryforward period. In making this determination, we consider all available positive and negative evidence. To the extent that available evidence raises doubt about the realization of a deferred income tax asset, a valuation allowance is established.
We record reserves for uncertain tax positions except to the extent it is more likely than not that the tax position will be sustained on audit, based on the technical merits of the position. Periodic changes in reserves for uncertain tax positions are reflected in the provision for income taxes. See Note 16 for additional information.
Share-Based Compensation
Our share-based compensation consists of restricted stock units and performance units. Our policy is to expense share-based compensation using the fair-value based method of accounting for all awards granted, modified or settled. Restricted stock units and performance units are credited to shareholders' equity as they are expensed over the related service periods based on the grant date fair value of the shares expected to be issued orand the achievement of certain performance conditions.conditions, respectively. See Note 17 for additional information.
Leases
We have operating leases for corporate offices, sales offices, showrooms, manufacturing and distribution facilities, vehicles and equipment. We record a right-of-use asset and corresponding lease liability for operating leases with terms greater than one year. Lease terms utilized in determining right-of-use assets and lease liabilities
STEELCASE INC.
NOTES TO THE CONSOLIDATED FINANCIAL STATEMENTS—(Continued)
include the noncancellable portion of the underlying leases along with any reasonably certain lease periods associated with available renewal periods. Our leases do not contain any residual value guarantees or material restrictive covenants. As most of our leases do not provide an implicit discount rate, we use an estimated incremental borrowing rate based on the information available at the lease commencement date in determining the present value of the lease payments. The estimated incremental borrowing rate represents the estimated rate of interest we would have had to pay to borrow (on a collateralized basis) an amount equal to the lease payments for a similar period of time.
We do not separate non-lease components of a contract from the lease components to which they relate for all classes of lease assets except for embedded leases, which were immaterial in 2023.2024. See Note 18 for additional information.
Financial Instruments
The carrying amounts of our financial instruments, consisting of cash and cash equivalents, accounts and notes receivable, accounts and notes payable and certain other liabilities, approximate their fair value due to their relatively short maturities. Our foreign exchange forward contracts, long-term investments and contingent earnout liability are measured at fair value on the Consolidated Balance Sheets. Our total debt is carried at cost and was $481.2$446.3 and $482.5$481.2 as of February 24, 202323, 2024 and February 25, 2022,24, 2023, respectively. The fair value of our total debt is measured using a discounted cash flow analysis based on current market interest rates for similar types of instruments and was approximately $405.9$423.0 and $516.7$405.9 as of February 24, 202323, 2024 and February 25, 2022,24, 2023, respectively. The estimation of the fair value of our total debt is based on Level 2 fair value measurements. See Note 7 and Note 13 for additional information.
We may use derivative financial instruments to manage exposures to movements in interest rates and foreign exchange rates. The use of these financial instruments modifies the exposure of these risks with the intention to reduce our risk of volatility. We do not use derivatives for speculative or trading purposes.
We evaluate contractual obligations to transfer additional cash to the sellers of companies we acquire as either a compensation arrangement or contingent consideration. We evaluate these obligations based on the terms and
STEELCASE INC.
NOTES TO THE CONSOLIDATED FINANCIAL STATEMENTS—(Continued)
duration of continuing employment of the sellers post-acquisition, the linkage to the underlying valuation of the acquired company and the obligations taken in the context of other contracts or agreements. Compensation arrangements are recorded in Operating expenses as services are rendered post-acquisition. Contingent consideration obligations are recorded at fair value as of the acquisition dates. At each subsequent reporting date, changes in the fair value of the liabilities are recorded to Operating expenses until the liabilities are settled. See Note 7 and Note 19 for additional information.
Foreign Currency
For most foreign operations, local currencies are considered the functional currencies. We translate assets and liabilities of our foreign subsidiaries to their U.S. dollar equivalents at exchange rates in effect as of the balance sheet date. Translation adjustments are not included in determining net income but are recorded in Accumulated other comprehensive income (loss) on the Consolidated Balance Sheets unless and until a sale or a substantially complete liquidation of the net investment in the international subsidiary takes place. We translate Consolidated Statements of Income accounts at average exchange rates for the applicable period.
Foreign currency transaction gains and losses, net of derivative impacts, arising primarily from changes in exchange rates on foreign currency denominated intercompany loans and other intercompany transactions and balances between foreign locations, are recorded in Other income, net in the Consolidated Statements of Income.
Foreign Exchange Forward Contracts
A portion of our revenue and earnings is exposed to changes in foreign exchange rates. We seek to manage our foreign exchange risk largely through operational means, including matching revenues with same currency costs and assets with same currency liabilities. Foreign exchange risk is also partially managed through the use of derivative instruments. Foreign exchange forward contracts serve to reduce the risk of conversion or remeasurement of certain foreign denominated transactions, assets and liabilities. We primarily use derivatives for intercompany transactions (including loans) and certain forecasted currency flows from foreign-denominated transactions. The foreign exchange forward contracts primarily relate to the euro, the Mexican peso, the euro, the United
STEELCASE INC.
NOTES TO THE CONSOLIDATED FINANCIAL STATEMENTS—(Continued)
Kingdom ("U.K.") pound sterling, the Canadian dollar, the Australian dollar, the Hong Kong dollar, the Malaysian ringgit and the Chinese renminbi. See Note 7 for additional information.
Assets and liabilities related to foreign exchange forward contracts as of February 24, 202323, 2024 and February 25, 202224, 2023 are summarized below:
| | | | | | | | | | | | | | |
| Consolidated Balance Sheets | February 24,
2023 | February 25,
2022 |
| Other current assets | $ | 2.3 | | | $ | 1.0 | | |
| Accrued expenses | (0.3) | | | (0.3) | | |
| Total net fair value of foreign exchange forward contracts (1) | $ | 2.0 | | | $ | 0.7 | | |
| | | | | | | | | | | | | | |
| Net Fair Value of Foreign Exchange Forward Contracts | February 23,
2024 | February 24,
2023 |
| Assets: | | | | |
Current - Other current assets | $ | 0.7 | | | $ | 2.3 | | |
Long-term - Other assets | 0.1 | | | — | | |
| Liabilities: | | | | |
Current - Other current liabilities | (0.5) | | | (0.3) | | |
| Total net fair value of foreign exchange forward contracts (1) | $ | 0.3 | | | $ | 2.0 | | |
________________________
(1)The notional amounts of the outstanding foreign exchange forward contracts were $94.0 as of February 23, 2024 and $55.1 as of February 24, 2023 and $76.1 as of February 25, 2022.2023.
STEELCASE INC.
NOTES TO THE CONSOLIDATED FINANCIAL STATEMENTS—(Continued)
Net gains recognized from settled foreign exchange forward contracts in 2024, 2023 2022 and 20212022 are summarized below:
| | Gain Recognized in Consolidated Statements of Income | Year Ended |
February 24,
2023 | February 25,
2022 | February 26,
2021 |
| Gain (Loss) Recognized in Consolidated Statements of Income | | Gain (Loss) Recognized in Consolidated Statements of Income | Year Ended |
| February 23,
2024 | February 24,
2023 | February 25,
2022 |
| Cost of sales | Cost of sales | $ | 2.6 | | | $ | 0.6 | | | $ | 0.1 | | |
| Operating expenses | Operating expenses | 0.6 | | | 0.3 | | | (0.1) | | |
| Operating expenses | |
| Operating expenses | |
| Other income, net | |
| Other income, net | |
| Other income, net | Other income, net | (1.1) | | | (0.2) | | | 0.8 | | |
| Total net gain | Total net gain | $ | 2.1 | | | $ | 0.7 | | | $ | 0.8 | | |
| Total net gain | |
| Total net gain | |
The net gains or losses recognized from foreign exchange forward instruments in Other income, net are largely offset by related foreign currency gains or losses on our intercompany loans and intercompany accounts payable.
3.NEW ACCOUNTING STANDARDS
We evaluate all Accounting Standards Updates ("ASUs") issued by the Financial Accounting Standards Board ("FASB") for consideration of their applicability to our consolidated financial statements. We have assessed all ASUs issued but not yet adopted and concluded that those not disclosed are either not applicable to us or are not expected to have a material effect on our consolidated financial statements.
Adoption of New Accounting Standards Issued But Not Yet Adopted
In September 2022, the FASB issuedEffective Q1 2024, we adopted ASU No. 2022-04, Liabilities - Supplier Finance Programs (Subtopic 405-50), which is intended to enhance transparency of supplier finance programs by requiring disclosure of key terms, amounts outstanding (including a rollforward of outstanding amounts) and a description of where such amounts are presented in the consolidated financial statements.
We participate in a supplier finance program in Spain offered by a third-party financial institution. The program allows participating suppliers the ability to finance our payment obligations prior to their scheduled due dates at a discounted price set by the financial institution. We have extended payment terms with suppliers that have voluntarily chosen to participate in the program. The outstanding amount of program obligations is reported in Accounts payable on the Consolidated Balance Sheets.
Below is a roll-forward of the supplier finance program obligations during 2024:
| | | | | | | | |
| Roll-Forward of Outstanding Supplier Finance Program Obligations | Year Ended |
| February 23, 2024 |
| Balance as of beginning of period | $ | 0.5 | | |
| Recognition of new obligations | 8.0 | | |
| Reductions for settled obligations | (8.4) | | |
| Balance as of end of period | $ | 0.1 | | |
Accounting Standards Issued But Not Yet Adopted
In November 2023, the FASB issued ASU No. 2023-07, Segment Reporting (Topic 280) - Improvements to Reportable Segment Disclosures, which is intended to improve disclosures related to significant segment expenses and the information used by the chief operating decision maker ("CODM") to assess segment performance and to allocate resources. The guidance is effective for fiscal years beginning after December 15, 2023 and interim periods within thosefiscal years beginning after December 15, 2022.2024. We expect the adoption of this guidance will modify our disclosures, but we do not expect it to have a material effect on our consolidated financial statements.
In December 2023, the FASB issued ASU No. 2023-09, Income Taxes (Topic 740) - Improvements to Income Tax Disclosures, which is intended to improve income tax disclosures, specifically related to additional detail required in the effective tax rate reconciliation and the disaggregation of income taxes paid. The guidance is effective for fiscal years beginning after December 15, 2024. We expect the adoption of this guidance will modify our disclosures, but we do not expect it to have a material effect on our consolidated financial statements.
STEELCASE INC.
NOTES TO THE CONSOLIDATED FINANCIAL STATEMENTS—(Continued)
4.REVENUE
Disaggregation of Revenue
The following table provides information about disaggregated revenue by product category for each of our reportable segments:
| | Product Category Data | Product Category Data | Year Ended | Product Category Data | Year Ended |
February 24,
2023 | | February 25,
2022 | February 26,
2021 | February 23,
2024 | | February 24,
2023 | February 25,
2022 |
| Americas | Americas | |
| Desking, benching, systems and storage | Desking, benching, systems and storage | $ | 1,089.7 | | | $ | 903.3 | | | $ | 912.0 | | |
| Desking, benching, systems and storage | |
| Desking, benching, systems and storage | |
| Seating | |
| Seating | |
| Seating | Seating | 692.4 | | | 583.2 | | | 559.4 | | |
| Other (1) | Other (1) | 558.7 | | | 418.5 | | | 377.1 | | |
| EMEA | |
| Other (1) | |
| Other (1) | |
| International | |
| International | |
| International | |
| Desking, benching, systems and storage | |
| Desking, benching, systems and storage | |
| Desking, benching, systems and storage | Desking, benching, systems and storage | 206.9 | | | 214.0 | | | 196.4 | | |
| Seating | Seating | 208.0 | | | 208.4 | | | 185.9 | | |
| Other (1) | 195.2 | | | 176.1 | | | 129.0 | | |
| Other | |
| Desking, benching, systems and storage | 55.6 | | | 57.0 | | | 49.8 | | |
| Seating | |
| Seating | Seating | 82.0 | | | 75.4 | | | 69.1 | | |
| Other (1) | Other (1) | 144.1 | | | 136.8 | | | 117.5 | | |
| $ | 3,232.6 | | | $ | 2,772.7 | | | $ | 2,596.2 | | |
| Other (1) | |
| Other (1) | |
| $ | |
| $ | |
| $ | |
(1)The other product category data by segment consists primarily of third-party products, sold by consolidated dealers, textiles and surface materials, worktools, architecture and other uncategorized product lines and services, less promotions and incentives on all product categories.
In the Americas segment, no industry or vertical market individually represented more than 18%, 18% or 16% of the Americas segment revenue in 2023, 2022 and 2021, respectively.
Reportable geographic information is as follows:
| | Reportable Geographic Revenue | Reportable Geographic Revenue | Year Ended | Reportable Geographic Revenue | Year Ended |
February 24,
2023 | | February 25,
2022 | February 26,
2021 | February 23,
2024 | | February 24,
2023 | February 25,
2022 |
| United States | United States | $ | 2,258.7 | | | $ | 1,848.2 | | | $ | 1,739.5 | | |
| Foreign locations | Foreign locations | 973.9 | | | 924.5 | | | 856.7 | | |
| $ | 3,232.6 | | | $ | 2,772.7 | | | $ | 2,596.2 | | |
| Foreign locations | |
| Foreign locations | |
| $ | |
| $ | |
| $ | |
In the EMEA segment, approximately 90%, 90% and 86% of revenue was from Western Europe in 2023, 2022 and 2021, respectively. No individual country in the EMEAInternational segment represented more than 6% of our consolidated revenue in 2023.2024, 2023 or 2022.
No single customer represented more than 5% of our consolidated revenue in 2024, 2023 2022 or 2021.2022.
STEELCASE INC.
NOTES TO THE CONSOLIDATED FINANCIAL STATEMENTS—(Continued)
Contract Balances
At times, we receive depositspayments from customers before revenue is recognized, resulting in the recognition of a contract liability (Customer deposits) presented on the Consolidated Balance Sheets.
Changes inBelow is a roll-forward of the Customer deposits balance during the year ended February 24, 2023 are as follows:2024 and 2023:
| | | | | | | | |
| Roll-Forward of Contract Liability for Customer Deposits | Customer Deposits |
| Balance as of February 25, 2022 | $ | 53.4 | | |
| Recognition of revenue related to beginning of year customer deposits | (50.0) | | |
| Customer deposits acquired (1) | 24.3 | | |
| Customer deposits received, net of revenue recognized during the period (2) | 23.1 | | |
| Balance as of February 24, 2023 | $ | 50.8 | | |
| Recognition of revenue related to beginning of year customer deposits | (48.3) | | |
| Customer deposits received, net of revenue recognized during the period | 44.3 | | |
| Other (3) | (2.0) | | |
| Balance as of February 23, 2024 | $ | 44.8 | | |
(1)Represents customer deposits acquired from Halcon Furniture LLC ("HALCON") as of the acquisition date. See Note 19 for additional information.
(2)Includes amounts recognized in revenue from the customer deposits acquired from HALCON.
(3)Represents customer deposits transferred in the divestiture of a consolidated dealer.
STEELCASE INC.
NOTES TO THE CONSOLIDATED FINANCIAL STATEMENTS—(Continued)
5.EARNINGS PER SHARE
Earnings per share is computed using the two-class method. The two-class method determines earnings per share for each class of common stock and participating securities according to dividends or dividend equivalents and their respective participation rights in undistributed earnings. Participating securities represent restricted stock units in which the participants have non-forfeitable rights to dividend equivalents during the performance period. Diluted earnings per share includes the effects of certain performance units in which the participants have forfeitable rights to dividend equivalents during the performance period.
| | Computation of Earnings Per Share | Computation of Earnings Per Share | Year Ended February 24, 2023 | Computation of Earnings Per Share | Year Ended February 23, 2024 |
| Net Income | Basic Shares
(in millions) | Diluted Shares
(in millions) | Net Income | Basic Shares
(in millions) | Diluted Shares
(in millions) |
| Amounts used in calculating earnings per share | Amounts used in calculating earnings per share | $ | 35.3 | | | 117.1 | | | 117.5 | | |
| Impact of participating securities | Impact of participating securities | (1.3) | | | (4.3) | | | (4.3) | | |
| Impact of participating securities | |
| Impact of participating securities | |
| Amounts used in calculating earnings per share, excluding participating securities | |
| Amounts used in calculating earnings per share, excluding participating securities | |
| Amounts used in calculating earnings per share, excluding participating securities | Amounts used in calculating earnings per share, excluding participating securities | $ | 34.0 | | | 112.8 | | | 113.2 | | |
| | Earnings per share | Earnings per share | | $ | 0.30 | | | $ | 0.30 | | |
| | Earnings per share | |
| | Earnings per share | |
|
| | Computation of Earnings Per Share | Computation of Earnings Per Share | Year Ended February 25, 2022 | Computation of Earnings Per Share | Year Ended February 24, 2023 |
| Net Income | Basic Shares
(in millions) | Diluted Shares
(in millions) | Net Income | Basic Shares
(in millions) | Diluted Shares
(in millions) |
| Amounts used in calculating earnings per share | Amounts used in calculating earnings per share | $ | 4.0 | | | 117.0 | | | 117.4 | | |
| Impact of participating securities | Impact of participating securities | (0.1) | | | (3.2) | | | (3.2) | | |
| Impact of participating securities | |
| Impact of participating securities | |
| Amounts used in calculating earnings per share, excluding participating securities | |
| Amounts used in calculating earnings per share, excluding participating securities | |
| Amounts used in calculating earnings per share, excluding participating securities | Amounts used in calculating earnings per share, excluding participating securities | $ | 3.9 | | | 113.8 | | | 114.2 | | |
| | Earnings per share | Earnings per share | | $ | 0.03 | | | $ | 0.03 | | |
| | Earnings per share | |
| | Earnings per share | |
|
STEELCASE INC.
NOTES TO THE CONSOLIDATED FINANCIAL STATEMENTS—(Continued)
| | Computation of Earnings Per Share | Computation of Earnings Per Share | Year Ended February 26, 2021 | Computation of Earnings Per Share | Year Ended February 25, 2022 |
| Net Income | Basic Shares
(in millions) | Diluted Shares
(in millions) | Net Income | Basic Shares
(in millions) | Diluted Shares
(in millions) |
| Amounts used in calculating earnings per share | Amounts used in calculating earnings per share | $ | 26.1 | | | 117.5 | | | 117.8 | | |
| Impact of participating securities | Impact of participating securities | (0.6) | | | (2.6) | | | (2.6) | | |
| Impact of participating securities | |
| Impact of participating securities | |
| Amounts used in calculating earnings per share, excluding participating securities | |
| Amounts used in calculating earnings per share, excluding participating securities | |
| Amounts used in calculating earnings per share, excluding participating securities | Amounts used in calculating earnings per share, excluding participating securities | $ | 25.5 | | | 114.9 | | | 115.2 | | |
| | Earnings per share | Earnings per share | | $ | 0.22 | | | $ | 0.22 | | |
| | Earnings per share | |
| | Earnings per share | |
|
There were no anti-dilutive performance units excluded from the computation of diluted earnings per share for the years ended February 24,2024, 2023 February 25, 2022 and February 26, 2021.2022.
STEELCASE INC.
NOTES TO THE CONSOLIDATED FINANCIAL STATEMENTS—(Continued)
6. ACCUMULATED OTHER COMPREHENSIVE INCOME (LOSS)
The following table summarizes the changes in accumulated balances of other comprehensive income (loss) during the years ended February 24, 20232024 and February 25, 2022:2023:
| | Unrealized gain (loss) on investment | |
| Unrealized gain (loss) on investment | |
| Unrealized gain (loss) on investment | | Pension and other post-retirement liability adjustments | Derivative amortization | | Foreign currency translation adjustments | Total |
| | | Unrealized gain (loss) on investments | Pension and other post-retirement liability adjustments | Derivative adjustments | | Foreign currency translation adjustments | Total |
| | Balance as of February 25, 2022 | |
| | Balance as of February 26, 2021 | $ | 0.3 | | | $ | (6.6) | | | $ | (7.6) | | | | $ | (26.1) | | | $ | (40.0) | | |
| | Balance as of February 25, 2022 | |
| | Balance as of February 25, 2022 | |
| Other comprehensive income (loss) before reclassifications | |
| Other comprehensive income (loss) before reclassifications | |
| Other comprehensive income (loss) before reclassifications | Other comprehensive income (loss) before reclassifications | — | | | 12.0 | | | — | | | | (23.3) | | | (11.3) | | |
| Amounts reclassified from accumulated other comprehensive income (loss) | Amounts reclassified from accumulated other comprehensive income (loss) | — | | | (0.2) | | | 0.9 | | | | — | | | 0.7 | | |
| Amounts reclassified from accumulated other comprehensive income (loss) | |
| Amounts reclassified from accumulated other comprehensive income (loss) | |
| Net other comprehensive income (loss) during period | Net other comprehensive income (loss) during period | — | | | 11.8 | | | 0.9 | | | | (23.3) | | | (10.6) | | |
| Balance as of February 25, 2022 | $ | 0.3 | | | $ | 5.2 | | | $ | (6.7) | | | | $ | (49.4) | | | $ | (50.6) | | |
| Net other comprehensive income (loss) during period | |
| Net other comprehensive income (loss) during period | |
| Balance as of February 24, 2023 | |
| Balance as of February 24, 2023 | |
| Balance as of February 24, 2023 | |
| Other comprehensive income (loss) before reclassifications | |
| Other comprehensive income (loss) before reclassifications | |
| Other comprehensive income (loss) before reclassifications | Other comprehensive income (loss) before reclassifications | (0.4) | | | 4.9 | | | — | | | | (26.6) | | | (22.1) | | |
| Amounts reclassified from accumulated other comprehensive income (loss) | Amounts reclassified from accumulated other comprehensive income (loss) | — | | | (0.8) | | | 1.0 | | | | — | | | 0.2 | | |
| Amounts reclassified from accumulated other comprehensive income (loss) | |
| Amounts reclassified from accumulated other comprehensive income (loss) | |
| Net other comprehensive income (loss) during period | Net other comprehensive income (loss) during period | (0.4) | | | 4.1 | | | 1.0 | | | | (26.6) | | | (21.9) | | |
| Balance as of February 24, 2023 | $ | (0.1) | | | $ | 9.3 | | | $ | (5.7) | | | | $ | (76.0) | | | $ | (72.5) | | |
| Net other comprehensive income (loss) during period | |
| Net other comprehensive income (loss) during period | |
| Balance as of February 23, 2024 | |
| Balance as of February 23, 2024 | |
| Balance as of February 23, 2024 | |
The following table provides details about reclassifications out of accumulated other comprehensive income (loss) for the years ended February 24, 2023during 2024 and February 25, 2022:2023:
| Detail of Accumulated Other Comprehensive
Income (Loss) Components | Detail of Accumulated Other Comprehensive
Income (Loss) Components | Amount Reclassified from Accumulated Other Comprehensive Income (Loss) | Affected Line in the Consolidated Statements of Income | |
| Year Ended | |
February 24,
2023 | February 25,
2022 | |
| Year Ended | |
| Year Ended | |
| Year Ended | |
February 23,
2024 | |
February 23,
2024 | |
February 23,
2024 | |
| | Amortization of pension and other post-retirement actuarial losses (gains) | |
| | Amortization of pension and other post-retirement actuarial losses (gains) | |
| | Amortization of pension and other post-retirement actuarial losses (gains) | Amortization of pension and other post-retirement actuarial losses (gains) | $ | (1.6) | | | $ | (0.2) | | | Other income, net | | |
| Prior service cost (credit) | Prior service cost (credit) | 0.5 | | | (0.1) | | | Other income, net | | |
| Prior service cost (credit) | |
| Prior service cost (credit) | |
| | Income tax expense | Income tax expense | 0.3 | | | 0.1 | | | Income tax expense (benefit) | | |
| | (0.8) | | | (0.2) | | | |
| Income tax expense | |
| | Derivative adjustments | 1.3 | | | 1.3 | | | Interest expense | | |
| Income tax expense | |
| (1.7) | |
| (1.7) | |
| (1.7) | |
| | Derivative amortization | |
| | Derivative amortization | |
| | Derivative amortization | |
| Income tax benefit | Income tax benefit | (0.3) | | | (0.4) | | | Income tax expense (benefit) | | |
| 1.0 | | | 0.9 | | | |
| Income tax benefit | |
| Income tax benefit | |
| 1.0 | |
| 1.0 | |
| 1.0 | |
| | | Total reclassifications | Total reclassifications | $ | 0.2 | | | $ | 0.7 | | | |
| | Total reclassifications | |
| | Total reclassifications | |
STEELCASE INC.
NOTES TO THE CONSOLIDATED FINANCIAL STATEMENTS—(Continued)
7.FAIR VALUE
Fair value measurements are classified under the following hierarchy:
•Level 1 — Inputs based on quoted market prices for identical assets or liabilities in active markets at the measurement date.
•Level 2 — Inputs based on quoted prices for similar instruments in active markets; quoted prices for identical or similar instruments in markets that are not active; and model-derived valuations in which all significant inputs or significant value-drivers are observable in active markets.
•Level 3 — Inputs reflect management’s best estimate of what market participants would use to price the asset or liability at the measurement date in model-driven valuations. The inputs are unobservable in the market and significant to the instrument’s valuation.
Fair value measurements are classified according to the lowest level input or value-driver that is significant to the valuation. A measurement may therefore be classified within Level 3 even though there may be other significant inputs that are readily observable.
Assets and liabilities measured at fair value within our Consolidated Balance Sheets as of February 24, 202323, 2024 and February 25, 202224, 2023 are summarized below:
| | Fair Value of Financial Instruments | Fair Value of Financial Instruments | February 24, 2023 | Fair Value of Financial Instruments | February 23, 2024 |
| Level 1 | Level 2 | Level 3 | Total | Level 1 | Level 2 | Level 3 | Total |
| Assets: | Assets: | |
| Cash and cash equivalents | Cash and cash equivalents | $ | 90.4 | | | $ | — | | | $ | — | | | $ | 90.4 | | |
| Cash and cash equivalents | |
| Cash and cash equivalents | |
| Restricted cash | |
| Restricted cash | |
| Restricted cash | Restricted cash | 6.8 | | | — | | | — | | | 6.8 | | |
| | Foreign exchange forward contracts | Foreign exchange forward contracts | — | | | 2.3 | | | — | | | 2.3 | | |
| | Foreign exchange forward contracts | |
| | Foreign exchange forward contracts | |
| Auction rate security | |
| Auction rate security | |
| Auction rate security | Auction rate security | — | | | — | | | 2.1 | | | 2.1 | | |
| | $ | |
| | $ | 97.2 | | | $ | 2.3 | | | $ | 2.1 | | | $ | 101.6 | | |
| $ | |
| | $ | |
| Liabilities: | |
| Liabilities: | |
| Liabilities: | Liabilities: | | | | | | | | |
| Foreign exchange forward contracts | Foreign exchange forward contracts | $ | — | | | $ | (0.3) | | | $ | — | | | $ | (0.3) | | |
| Foreign exchange forward contracts | |
| Foreign exchange forward contracts | |
| Contingent consideration | Contingent consideration | — | | | — | | | (9.5) | | | (9.5) | | |
| Contingent consideration | |
| Contingent consideration | |
| $ | |
| $ | |
| $ | |
| | $ | — | | | $ | (0.3) | | | $ | (9.5) | | | $ | (9.8) | | |
| Fair Value of Financial Instruments | |
| | Fair Value of Financial Instruments | |
| | Fair Value of Financial Instruments | Fair Value of Financial Instruments | February 25, 2022 | February 24, 2023 |
| Level 1 | Level 2 | Level 3 | Total | Level 1 | Level 2 | Level 3 | Total |
| Assets: | Assets: | |
| Cash and cash equivalents | Cash and cash equivalents | $ | 200.9 | | | $ | — | | | $ | — | | | $ | 200.9 | | |
| Cash and cash equivalents | |
| Cash and cash equivalents | |
| Restricted cash | |
| Restricted cash | |
| Restricted cash | Restricted cash | 6.1 | | | — | | | — | | | 6.1 | | |
| | Foreign exchange forward contracts | Foreign exchange forward contracts | — | | | 1.0 | | | — | | | 1.0 | | |
| | Foreign exchange forward contracts | |
| | Foreign exchange forward contracts | |
| Auction rate security | |
| Auction rate security | |
| Auction rate security | Auction rate security | — | | | — | | | 2.6 | | | 2.6 | | |
| | $ | |
| | $ | 207.0 | | | $ | 1.0 | | | $ | 2.6 | | | $ | 210.6 | | |
| $ | |
| | $ | |
| Liabilities: | |
| Liabilities: | |
| Liabilities: | Liabilities: | | | | | | | | |
| Foreign exchange forward contracts | Foreign exchange forward contracts | $ | — | | | $ | (0.3) | | | $ | — | | | $ | (0.3) | | |
| Foreign exchange forward contracts | |
| Foreign exchange forward contracts | |
| Contingent consideration | Contingent consideration | — | | | — | | | (4.9) | | | (4.9) | | |
| $ | — | | | $ | (0.3) | | | $ | (4.9) | | | $ | (5.2) | | |
| Contingent consideration | |
| Contingent consideration | |
| $ | |
| $ | |
| $ | |
STEELCASE INC.
NOTES TO THE CONSOLIDATED FINANCIAL STATEMENTS—(Continued)
Foreign Exchange Forward Contracts
We occasionally enter into forward contracts to reduce the impact of foreign currency fluctuations on foreign-denominated transactions, assets and liabilities. We primarily use derivatives for intercompany transactions (including loans) and certain forecasted currency flows from foreign-denominated transactions. The fair value of foreign exchange forward contracts is based on a valuation model that calculates the differential between the contract price and the market-based forward rate as of the balance sheet date.
Level 3 Fair Value Measurements
STEELCASE INC. | | | | | | | | | | | | | | |
| Roll-Forward of Fair Value Using Level 3 Inputs | Auction Rate Security - Other Assets | Contingent Consideration - Other Long-Term Liabilities |
| Balance as of February 25, 2022 | $ | 2.6 | | | $ | 4.9 | | |
| Unrealized gain (loss) on investments | (0.5) | | | — | | |
| | | | |
| Foreign currency (gain) loss | — | | | (0.6) | | |
| Change in estimated fair value | — | | | 5.2 | | |
| | | | |
| Balance as of February 24, 2023 | $ | 2.1 | | | $ | 9.5 | | |
| Unrealized gain (loss) on investment | 0.7 | | | — | | |
| | | | |
| Change in estimated fair value | — | | | (9.5) | | |
| Balance as of February 23, 2024 | $ | 2.8 | | | $ | — | | |
NOTES TO THE CONSOLIDATED FINANCIAL STATEMENTS—(Continued)There were no other-than-temporary impairments or transfers into or out of Level 3 during either 2024 or 2023. Our policy is to value any transfers between levels of the fair value hierarchy based on end of period fair values.
Auction Rate Security
As of February 24, 2023,23, 2024, we held an auction rate security (“ARS”) investment with a total par value of $3.2 and a fair value of $2.1.$2.8. The difference between par value and fair value is comprised of other-than-temporary impairment losses recorded in previous fiscal years and unrealized lossesgains on our ARS investment of $0.9 and $0.2,$0.5, respectively. The unrealized lossesgains are due to changes in interest rates and are expected to fluctuate over the contractual term of the investment. Unrealized gains and losses are recorded in Accumulated other comprehensive income (loss) on the Consolidated Balance Sheets.
The ARS investment is not widely traded and therefore does not currently have a readily determinable market value. To estimate fair value, we used an internally-developed discounted cash flow analysis which considers, amongst other factors: (i) the credit ratings of the ARS, (ii) the credit quality of the underlying securities or the credit ratingratings of issuers, (iii) the estimated timing and amount of cash flows, (iv) the formula applicable to the security which defines the penalty interest rate and (v) discount rates equal to the sum of (a) the yield on U.S. Treasury securities with a term through the estimated workout date plus (b) a risk premium based on similarly rated observable securities.
A deterioration in market conditions or the use of different assumptions could result in a different valuation of the investment. An increase to the discount rate of 100 basis points would reduce the estimated fair value of our ARS investment by approximately $0.2.$0.3.
Contingent Consideration
In connection with the acquisition of Viccarbe Habitat, S.L ("Viccarbe") in Q3 2022, up to an additional $13.8$14.1 (or €13.0) is payable to the sellers based upon the achievement of certain revenue and operating income targets over a three-year period ending in 2025. This amount was considered to be contingent consideration and was treated for accounting purposes as part of the total purchase price of the acquisition. We used the Monte Carlo simulation model to calculate the fair value of the contingent consideration as of the acquisition date, which represents a Level 3 measurement. As a result, we recorded a related liability of $4.9 (or €4.2). At each subsequent reporting date, we remeasure the fair value of this liability using a Monte Carlo simulation based upon revenue and operating income projections over the remaining earnout period, and changes toin the fair value of the liability are recorded to
STEELCASE INC.
NOTES TO THE CONSOLIDATED FINANCIAL STATEMENTS—(Continued)
Operating expenses Operating expenses.until the liability is settled. As of February 24, 2023,23, 2024, the fair value of the contingent consideration was $9.5 (or €9.0).$0.0 based upon updated projections for the Viccarbe business over the earnout period. The settlement of the contingent consideration could vary from this estimate based upon actual operating performance of the business during the earnout period compared to the underlying assumptions used in the estimation of fair value, including revenue and operating income projections, and changes to discount rates.
Below is a roll-forward of assets and liabilities measured at estimated fair value using Level 3 inputs during the years ended February 24, 2023 and February 25, 2022:
| | | | | | | | | | | | | | |
| Roll-forward of Fair Value Using Level 3 Inputs | Auction Rate Security - Other Assets | Contingent Consideration - Other Long-Term Liabilities |
| Balance as of February 26, 2021 | $ | 2.6 | | | $ | — | | |
| | | | |
| | | | |
Contingent consideration recorded on acquisition
| — | | | 4.9 | | |
| Balance as of February 25, 2022 | $ | 2.6 | | | $ | 4.9 | | |
| Unrealized loss on investment | (0.5) | | | — | | |
| Foreign currency gain | — | | | (0.6) | | |
| Change in estimated fair value | — | | | 5.2 | | |
| Balance as of February 24, 2023 | $ | 2.1 | | | $ | 9.5 | | |
There were no other-than-temporary impairments or transfers into or out of Level 3 during either 2023 or 2022. Our policy is to value any transfers between levels of the fair value hierarchy based on end of period fair values.
STEELCASE INC.
NOTES TO THE CONSOLIDATED FINANCIAL STATEMENTS—(Continued)
8.INVENTORIES
| | Inventories | February 24,
2023 | February 25,
2022 |
| Inventories, net | | Inventories, net | February 23,
2024 | February 24,
2023 |
| Raw materials and work-in-process | Raw materials and work-in-process | $ | 232.8 | | | $ | 208.2 | | |
| Finished goods | Finished goods | 118.1 | | | 146.9 | | |
| 350.9 | | | 355.1 | | |
| Finished goods | |
| Finished goods | |
| 260.4 | |
| 260.4 | |
| 260.4 | |
| Revaluation to LIFO | Revaluation to LIFO | 31.2 | | | 28.9 | | |
| $ | 319.7 | | | $ | 326.2 | | |
| Revaluation to LIFO | |
| Revaluation to LIFO | |
| $ | |
| $ | |
| $ | |
The portion of inventories determined by the LIFO method aggregated to $134.1$111.7 and $141.4$134.1 as of February 24, 202323, 2024 and February 25, 2022,24, 2023, respectively.
9.PROPERTY, PLANT AND EQUIPMENT
| | Property, Plant and Equipment | Property, Plant and Equipment | Estimated
Useful Lives
(Years) | February 24,
2023 | February 25,
2022 | Property, Plant and Equipment | Estimated
Useful Lives
(Years) | February 23,
2024 | February 24,
2023 |
| Land | Land | | $ | 33.6 | | | $ | 33.3 | | |
| Machinery and equipment | Machinery and equipment | 3 – 15 | | 742.4 | | | 780.1 | | |
| Machinery and equipment | |
| Machinery and equipment | |
| Buildings and improvements | |
| Buildings and improvements | |
| Buildings and improvements | Buildings and improvements | 10 – 40 | | 414.1 | | | 401.9 | | |
| Leasehold improvements | Leasehold improvements | 3 – 15 | | 83.1 | | | 81.2 | | |
| Leasehold improvements | |
| Leasehold improvements | |
| Capitalized software | |
| Capitalized software | |
| Capitalized software | Capitalized software | 3 – 10 | | 80.4 | | | 77.1 | | |
| Furniture and fixtures | Furniture and fixtures | 5 – 8 | | 64.1 | | | 61.1 | | |
| Furniture and fixtures | |
| Furniture and fixtures | |
| Construction in progress | Construction in progress | | 47.4 | | | 47.1 | | |
| 1,465.1 | | | 1,481.8 | | |
| Construction in progress | |
| Construction in progress | |
| | | 1,472.1 | |
| | | 1,472.1 | |
| | | 1,472.1 | |
| Accumulated depreciation | Accumulated depreciation | | (1,088.6) | | | (1,089.0) | | |
| $ | 376.5 | | | $ | 392.8 | | |
| Accumulated depreciation | |
| Accumulated depreciation | |
| | | $ | |
| | | $ | |
| | | $ | |
The majority of the net book value of our property, plant and equipment relates to machinery and equipment and buildings and improvements. As of February 24, 202323, 2024 and February 25, 2022,24, 2023, the net book value of our machinery and equipment totaled $140.4$141.6 and $160.9,$140.4, respectively, and buildings and improvements totaled $94.6$92.1 and $89.2,$94.6, respectively. Depreciation expense on property, plant and equipment was $66.0, $67.0 and $67.5 for 2024, 2023 and $68.8 for 2023, 2022, and 2021, respectively. The estimated cost to complete construction in progress was $38.0$32.2 and $30.4$38.0 as of February 23, 2024 and February 24, 2023, andrespectively.
As of February 25, 2022, respectively.
23, 2024, there were no assets held for sale. As of February 24, 2023, assets held for sale totaled $29.0. The amount is related to$29.0, which were two corporate aircraft included in the Americas segment and expected to bewere sold induring 2024.
STEELCASE INC.
NOTES TO THE CONSOLIDATED FINANCIAL STATEMENTS—(Continued)
10.COMPANY-OWNED LIFE INSURANCE
Our investments in company-owned life insurance (“COLI”)COLI policies are recorded at their net cash surrender value.
Our investments in COLI are intended to be utilized as a long-term funding source for post-retirement medical benefits, deferred compensation and defined benefit pension plan obligations. The designation of our COLI investments as funding sources for our long-term benefit plan obligations does not result in these investments representing a committed funding source for these obligations. We can designate any portion of them to another purpose at any time.
The net returns in cash surrender value, normal insurance expenses and any maturity benefits related to our investments in COLI policies ("COLI income") are recorded in Operating expenses in the Consolidated Statements of Income. COLI income is intended to offset the expense associated with long-term benefit plan obligations which are also recorded in Operating expenses in the Consolidated Statements of Income. COLI income totaled $10.5, $0.8 and $6.2 in 2024, 2023 and $12.3 in 2023, 2022, and 2021, respectively.
The balances of our COLI investments as of February 24, 202323, 2024 and February 25, 202224, 2023 were as follows:
| | Type | Type | Ability to Choose
Investments | Net Return | Target Asset Allocation as of February 24, 2023 | Net Cash Surrender Value | Type | Ability to Choose
Investments | Net Return | Target Asset Allocation as of February 23, 2024 | Net Cash Surrender Value |
February 24,
2023 | February 25,
2022 | February 23,
2024 | February 24,
2023 |
Whole life
COLI policies | Whole life
COLI policies | No ability | A rate of return set periodically by the
insurance companies | Not applicable | $ | 103.0 | | | $ | 108.6 | | |
Variable life
COLI policies | Variable life
COLI policies | Can allocate across a set of choices provided by the insurance companies | Fluctuates depending on performance of underlying investments | 65% fixed income; 35% equity | 54.3 | | | 59.4 | | |
| $ | 157.3 | | | $ | 168.0 | | |
Variable life
COLI policies | |
Variable life
COLI policies | |
| | | | $ | |
| | | | $ | |
| | | | $ | |
STEELCASE INC.
NOTES TO THE CONSOLIDATED FINANCIAL STATEMENTS—(Continued)
11.GOODWILL AND OTHER INTANGIBLE ASSETS
A summary of the changes in goodwill during the years ended February 24,2024 and 2023, and February 25, 2022, by reportable segment, is as follows:
| | Goodwill | Goodwill | Americas | EMEA | Other | Total | Goodwill | Americas | International | Total |
| Balance as of February 26, 2021 | $ | 207.4 | | | $ | — | | | $ | 10.7 | | | $ | 218.1 | | |
| Acquisition (1) | — | | | 25.8 | | | — | | | 25.8 | | |
| Balance as of February 25, 2022 | |
| Acquisition (1) (2) | |
| Acquisition (1) (2) | |
| Acquisition (1) (2) | |
| Goodwill on divestiture (3) | |
| Goodwill on divestiture (3) | |
| Goodwill on divestiture (3) | |
| Currency translation adjustments | |
| Currency translation adjustments | |
| Currency translation adjustments | |
| Reallocation of goodwill (4) | |
| Reallocation of goodwill (4) | |
| Reallocation of goodwill (4) | |
| Goodwill | |
| Goodwill | |
| Goodwill | |
| Accumulated impairment losses | |
| Accumulated impairment losses | |
| Accumulated impairment losses | |
| Balance as of February 24, 2023 | |
| Balance as of February 24, 2023 | |
| Balance as of February 24, 2023 | |
Goodwill on divestiture (3)(5) | |
Goodwill on divestiture (3)(5) | |
Goodwill on divestiture (3)(5) | |
| Currency translation adjustments | |
| Currency translation adjustments | |
| Currency translation adjustments | Currency translation adjustments | (0.2) | | | (0.9) | | | — | | | (1.1) | | |
| Goodwill | Goodwill | 208.9 | | | 307.5 | | | 47.9 | | | 564.3 | | |
| Accumulated impairment losses | (1.7) | | | (282.6) | | | (37.2) | | | (321.5) | | |
| Balance as of February 25, 2022 | $ | 207.2 | | | $ | 24.9 | | | $ | 10.7 | | | $ | 242.8 | | |
| Acquisition (1) (2) | 36.6 | | | 0.2 | | | — | | | 36.8 | | |
Goodwill on divestiture (3)(5) | (0.9) | | | — | | | — | | | (0.9) | | |
| Currency translation adjustments | (0.5) | | | (1.4) | | | — | | | (1.9) | | |
| Reallocation of goodwill (4) | 15.2 | | | (15.2) | | | — | | | — | | |
| Goodwill | |
| Goodwill | Goodwill | 259.3 | | | 291.1 | | | 47.9 | | | 598.3 | | |
| Accumulated impairment losses | Accumulated impairment losses | (1.7) | | | (282.6) | | | (37.2) | | | (321.5) | | |
| Balance as of February 24, 2023 | $ | 257.6 | | | $ | 8.5 | | | $ | 10.7 | | | $ | 276.8 | | |
| Accumulated impairment losses | |
| Accumulated impairment losses | |
| Balance as of February 23, 2024 | |
| Balance as of February 23, 2024 | |
| Balance as of February 23, 2024 | |
________________________
(1)In 2022,2023, we finalized the purchase accounting for Viccarbe, which was acquired Viccarbein 2022, resulting in aadditional goodwill addition in the EMEAInternational segment. The purchase accounting was finalized in 2023. See Note 19 for additional information.
(2)In 2023, we acquired HALCON resulting in a goodwill addition in the Americas segment. See Note 19 for additional information.
(3)In 2023, we sold a consolidated dealer, resulting in a decrease to goodwill in the Americas segment.
(4)In 2023, we reallocated $15.2 of goodwill from the EMEAInternational segment to the Americas segment corresponding to a portion of the goodwill recognized in the acquisition of Viccarbe. The reallocation was triggered by changes in our management structure and allocation of resources to the Viccarbe business post-acquisition. The amount of the reallocation was based on the relative fair value of the Viccarbe business reported within the Americas segment. We performed an impairment test immediately prior to and subsequent to the reallocation of goodwill to assess for impairment and concluded no impairment existed.
(5)In 2024, we sold a consolidated dealer, resulting in a decrease to goodwill in the Americas segment.
We evaluate goodwill for impairment annually in Q4, or earlier if there is a triggering event that indicates there may be a potential for impairment. See Note 2 for additional information. Based on the results of our annual impairment tests, we concluded that no goodwill impairment existed as of February 24, 202323, 2024 and February 25, 2022.
In Q1 2021, we determined that a triggering event occurred which resulted in an interim impairment evaluation of goodwill for each of our reporting units. During Q1 2021, the market price of our Class A Common Stock declined significantly in connection with overall stock market trends related to the global economic impact of the COVID-19 pandemic. The reduction in revenue in Q1 2021 and changes to our forecasted revenue growth rates and expected operating margins related to the economic disruption of the COVID-19 pandemic were also factors that led to the completion of our interim impairment analysis.
As a result of our interim goodwill impairment analysis, we determined that the carrying value of the Orangebox U.K. reporting unit exceeded its fair value, resulting in a $17.6 goodwill impairment charge in Q1 2021. Following the charge, the reporting unit had no remaining goodwill. During Q1 2021, we also tested the recoverability of the Orangebox U.K. long-lived assets (other than goodwill) and concluded that those assets were not impaired.
STEELCASE INC.
NOTES TO THE CONSOLIDATED FINANCIAL STATEMENTS—(Continued)
As of February 24, 202323, 2024 and February 25, 2022,24, 2023, other intangible assets and related accumulated amortization consisted of the following:
| | Other Intangible Assets | Other Intangible Assets | February 24, 2023 | February 25, 2022 | Other Intangible Assets | February 23, 2024 | February 24, 2023 |
Weighted
Average
Useful Life
(Years) | Gross | Accumulated
Amortization | Net | Gross | Accumulated
Amortization | Net | Weighted
Average
Useful Life
(Years) | Gross | Accumulated
Amortization | Net | Gross | Accumulated
Amortization | Net |
| Intangible assets subject to amortization: | Intangible assets subject to amortization: | |
| Dealer relationships (1) (2) | 10.8 | | $ | 83.8 | | | $ | 27.6 | | | $ | 56.2 | | | $ | 61.4 | | | $ | 20.0 | | | $ | 41.4 | | |
| Trademarks (1) (2) | 8.9 | | 59.6 | | | 30.6 | | | 29.0 | | | 47.4 | | | 24.5 | | | 22.9 | | |
| Know-how/designs (1) (2) | 9.0 | | 35.5 | | | 11.8 | | | 23.7 | | | 24.2 | | | 8.5 | | | 15.7 | | |
| Dealer relationships (1) | |
| Dealer relationships (1) | |
| Dealer relationships (1) | |
| Trademarks (1) | |
| Trademarks (1) | |
| Trademarks (1) | |
| Know-how/designs (1) | |
| Know-how/designs (1) | |
| Know-how/designs (1) | |
| Proprietary technology | |
| Proprietary technology | |
| Proprietary technology | Proprietary technology | 9.9 | | 15.8 | | | 14.3 | | | 1.5 | | | 15.8 | | | 13.9 | | | 1.9 | | |
| | Other (2) (3) (4) | 3.8 | | 14.0 | | | 13.3 | | | 0.7 | | | 23.0 | | | 19.5 | | | 3.5 | | |
| Other (1) (2) (3) (4) | |
| | 208.7 | | | 97.6 | | | 111.1 | | | 171.8 | | | 86.4 | | | 85.4 | | |
| Other (1) (2) (3) (4) | |
| | Other (1) (2) (3) (4) | |
| | | 209.5 | |
| | | 209.5 | |
| | | 209.5 | |
| Intangible assets not subject to amortization: | |
| Intangible assets not subject to amortization: | |
| Intangible assets not subject to amortization: | Intangible assets not subject to amortization: | | | | | | | | | | | | | |
| Trademarks and other | Trademarks and other | n/a | | 0.1 | | | — | | | 0.1 | | | 0.1 | | | — | | | 0.1 | | |
| $ | 208.8 | | | $ | 97.6 | | | $ | 111.2 | | | $ | 171.9 | | | $ | 86.4 | | | $ | 85.5 | | |
| Trademarks and other | |
| Trademarks and other | |
| | | $ | |
| | | $ | |
| | | $ | |
________________________
(1)In 2022, we acquired Viccarbe, resulting in an increase of intangible assets in the EMEA segment. See Note 19 for additional information.
(2)In 2023, we acquired HALCON, resulting in an increase of intangible assets in the Americas segment. See Note 19 for additional information.
(3)(2)In 2023, we sold a consolidated dealer, resulting in a decrease of intangible assets in the Americas segment.
(4)(3)In 2023, we wrote off certain fully amortized assets as they were no longer in use, resulting in a decrease of intangible assets in the Americas and EMEAInternational segments.
(4)In 2024, we sold a consolidated dealer, resulting in a decrease of intangible assets in the Americas segment.
In 2024, 2023 2022 and 2021,2022, no intangible asset impairment charges were recorded. We recorded amortization expense on intangible assets subject to amortization of $17.2 in 2024, $22.8 in 2023 and $14.8 in 2022 and $16.3 in 2021.2022. Based on the current amount of intangible assets subject to amortization, the estimated amortization expense for each of the following five years is as follows:
| | Fiscal Year Ending in February | Fiscal Year Ending in February | Amount | Fiscal Year Ending in February | Amount |
| 2024 | $ | 17.1 | |
| 2025 | 2025 | 17.4 | |
| 2026 | 2026 | 17.1 | |
| 2027 | 2027 | 16.9 | |
| 2028 | 2028 | 13.7 | |
| $ | 82.2 | |
| 2029 | |
| $ | |
Future events, such as acquisitions, divestitures or impairments, may cause these amounts to vary.
STEELCASE INC.
NOTES TO THE CONSOLIDATED FINANCIAL STATEMENTS—(Continued)
12.INVESTMENTS IN UNCONSOLIDATED AFFILIATES
We occasionally enter into joint ventures and other equity investments to expand or maintain our geographic presence, support our distribution network or invest in new business ventures, complementary products and services. Our investments in unconsolidated affiliates and related direct ownership interests are summarized below:
| | Investments in Unconsolidated Affiliates | Investments in Unconsolidated Affiliates | February 24, 2023 | February 25, 2022 | Investments in Unconsolidated Affiliates | February 23, 2024 | February 24, 2023 |
Investment
Balance | Ownership
Interest | Investment
Balance | Ownership
Interest | Investment
Balance | Ownership
Interest | Investment
Balance | Ownership
Interest |
| Equity method investments | Equity method investments | |
| Dealer relationships | Dealer relationships | $ | 32.2 | | | 25%-40% | | $ | 29.6 | | | 25%-40% | |
| Dealer relationships | |
| Dealer relationships | |
| Manufacturing joint venture | Manufacturing joint venture | 9.4 | | | 49% | | 7.3 | | | 49% | |
| IDEO | — | | | 0% | | 6.7 | | | 5% | |
| 41.6 | | | 43.6 | | |
| Manufacturing joint venture | |
| Manufacturing joint venture | |
| 45.7 | |
| 45.7 | |
| 45.7 | |
| Cost method investments | |
| Cost method investments | |
| Cost method investments | Cost method investments | | |
| Dealer relationship | Dealer relationship | 5.8 | | | Less than 10% | | 5.8 | | | Less than 10% | |
| Dealer relationship | |
| Dealer relationship | |
| Other | Other | 3.7 | | | Less than 10% | | 3.7 | | | Less than 10% | |
| 9.5 | | | 9.5 | | |
| Other | |
| Other | |
| 10.0 | |
| 10.0 | |
| 10.0 | |
| Total investments in unconsolidated affiliates | Total investments in unconsolidated affiliates | $ | 51.1 | | | $ | 53.1 | | | |
| Total investments in unconsolidated affiliates | |
| Total investments in unconsolidated affiliates | |
Our equity in earnings of unconsolidated affiliates is recorded in Other income, net in the Consolidated Statements of Income and is summarized below:
| | Equity in Earnings of Unconsolidated Affiliates | Equity in Earnings of Unconsolidated Affiliates | Year Ended | Equity in Earnings of Unconsolidated Affiliates | Year Ended |
February 24,
2023 | February 25,
2022 | February 26,
2021 | February 23,
2024 | February 24,
2023 | February 25,
2022 |
| Dealer relationships | Dealer relationships | $ | 9.7 | | | $ | 6.2 | | | $ | 8.0 | | |
| Manufacturing joint venture | Manufacturing joint venture | 2.7 | | | 0.3 | | | 0.7 | | |
| Manufacturing joint venture | |
| Manufacturing joint venture | |
| IDEO and other | |
| IDEO and other | |
| IDEO and other | IDEO and other | 0.1 | | | 1.3 | | | 0.6 | | |
| Total equity in earnings of unconsolidated affiliates | Total equity in earnings of unconsolidated affiliates | $ | 12.5 | | | $ | 7.8 | | | $ | 9.3 | | |
| Total equity in earnings of unconsolidated affiliates | |
| Total equity in earnings of unconsolidated affiliates | |
Dealer Relationships
We have occasionally invested in dealers to expand or maintain our geographic presence and support our distribution network.
Manufacturing Joint Ventures
We have occasionally entered into manufacturing joint ventures to expand or maintain our geographic presence. Our only current manufacturing joint venture is Steelcase Jeraisy Company Limited, which is located in the Kingdom of Saudi Arabia and is engaged in the manufacturing of wood and metal office furniture systems, seating, accessories and related products for the Kingdom.
IDEO
IDEO LP is an innovation and design firm that uses a human-centered, design-based approach to generate new offerings and build new capabilities for its customers. In Q2 2023, we divested our remaining interest in IDEO.
STEELCASE INC.
NOTES TO THE CONSOLIDATED FINANCIAL STATEMENTS—(Continued)
The following table summarizes the combined accounts of our equity method investments in unconsolidated affiliates:
| | Consolidated Balance Sheets | Consolidated Balance Sheets | February 24,
2023 | February 25,
2022 | Consolidated Balance Sheets | February 23,
2024 | February 24,
2023 |
| Total current assets | Total current assets | $ | 169.1 | | | $ | 211.7 | | |
| Total non-current assets | Total non-current assets | 79.0 | | | 146.4 | | |
| Total non-current assets | |
| Total non-current assets | |
| Total assets | |
| Total assets | |
| Total assets | Total assets | $ | 248.1 | | | $ | 358.1 | | |
| Total current liabilities | Total current liabilities | 107.2 | | | 162.9 | | |
| Total current liabilities | |
| Total current liabilities | |
| Total long-term liabilities | |
| Total long-term liabilities | |
| Total long-term liabilities | Total long-term liabilities | 18.0 | | | 29.6 | | |
| Total liabilities | Total liabilities | $ | 125.2 | | | $ | 192.5 | | |
| Total liabilities | |
| Total liabilities | |
| | Statements of Income | Statements of Income | Year Ended | Statements of Income | Year Ended |
February 24,
2023 | February 25,
2022 | February 26,
2021 | February 23,
2024 | February 24,
2023 | February 25,
2022 |
| Revenue | Revenue | $ | 755.3 | | | $ | 578.6 | | | $ | 695.4 | | |
| Gross profit | Gross profit | 174.8 | | | 177.8 | | | 204.9 | | |
| Gross profit | |
| Gross profit | |
| Income before income tax expense | |
| Income before income tax expense | |
| Income before income tax expense | Income before income tax expense | 39.0 | | | 53.0 | | | 37.8 | | |
| Net income | Net income | 37.5 | | | 47.8 | | | 35.6 | | |
| Net income | |
| Net income | |
| | Supplemental Information | Supplemental Information | Year Ended | Supplemental Information | Year Ended |
February 24,
2023 | February 25,
2022 | February 26,
2021 | February 23,
2024 | February 24,
2023 | February 25,
2022 |
| Dividends received from unconsolidated affiliates | Dividends received from unconsolidated affiliates | $ | 7.8 | | | $ | 5.5 | | | $ | 8.1 | | |
| Sales to unconsolidated affiliates | Sales to unconsolidated affiliates | 259.5 | | | 194.2 | | | 201.5 | | |
| Sales to unconsolidated affiliates | |
| Sales to unconsolidated affiliates | |
| Amount due from unconsolidated affiliates | Amount due from unconsolidated affiliates | 22.5 | | | 12.9 | | | 6.4 | | |
| Amount due from unconsolidated affiliates | |
| Amount due from unconsolidated affiliates | |
STEELCASE INC.
NOTES TO THE CONSOLIDATED FINANCIAL STATEMENTS—(Continued)
13.SHORT-TERM BORROWINGS AND LONG-TERM DEBT
| | Debt Obligations | Debt Obligations | Interest Rate as of February 24, 2023 | Fiscal Year
Maturity | February 24,
2023 | February 25,
2022 | Debt Obligations | Interest Rate as of February 23, 2024 | Fiscal Year
Maturity | February 23,
2024 | February 24,
2023 |
| U.S. dollar obligations: | U.S. dollar obligations: | |
| Senior notes | Senior notes | 5.125% | | 2029 | | $ | 445.5 | | | $ | 444.9 | | |
| Notes payable | 5.90% | | 2024 | | 32.2 | | | 34.9 | | |
| Other committed bank facility | 7.06% | | 2024 | | 3.5 | | | 2.4 | | |
| 481.2 | | | 482.2 | | |
| Foreign currency obligations: | |
| Notes payable | | — | | | 0.3 | | |
| Senior notes | |
| Senior notes | |
| Notes payable (1) | |
| Notes payable (1) | |
| Notes payable (1) | |
| Other committed bank facility (2) | |
| Other committed bank facility (2) | |
| Other committed bank facility (2) | |
| Total short-term borrowings and long-term debt | Total short-term borrowings and long-term debt | | 481.2 | | | 482.5 | | |
| Less: Short-term borrowings and current portion of long-term debt (1) | | 35.7 | | | 5.1 | | |
| Total short-term borrowings and long-term debt | |
| Total short-term borrowings and long-term debt | |
| Less: Short-term borrowings and current portion of long-term debt (3) | |
| Less: Short-term borrowings and current portion of long-term debt (3) | |
| Less: Short-term borrowings and current portion of long-term debt (3) | |
| Long-term debt | Long-term debt | | $ | 445.5 | | | $ | 477.4 | | |
| Long-term debt | |
| Long-term debt | |
____________________
(1)In 2024, we repaid this note payable.
(2)This facility related to a consolidated dealer that we sold in 2024.
(3)The weighted-average interest rate for short-term borrowings and the current portion of long-term debt was 6.0% as of February 24, 2023 and 2.3% as of February 25, 2022.24, 2023. There were no short-term borrowings outstanding as of February 23, 2024.
The annual maturities of short-term borrowings and long-term debt for each of the following five years are as follows:
| | Fiscal Year Ending in February | Fiscal Year Ending in February | Amount | Fiscal Year Ending in February | Amount |
| 2024 | $ | 35.7 | | |
| 2025 | 2025 | — | | |
| 2026 | 2026 | — | | |
| 2026 | |
| 2026 | |
| 2027 | |
| 2027 | |
| 2027 | 2027 | — | | |
| 2028 | 2028 | — | | |
| Thereafter | 445.5 | | |
| 2028 | |
| 2028 | |
| 2029 | |
| 2029 | |
| 2029 | |
| | $ | 481.2 | | |
| $ | |
| | $ | |
| | $ | |
Senior Notes
In 2019, we issued $450.0 of unsecured unsubordinated senior notes, due in January 2029 (“2029 Notes”). The 2029 Notes would rank equally with all of ourany other unsecured unsubordinated indebtedness, and they contain no financial covenants. The 2029 Notes were issued at 99.213% of par value. The bond discount of $3.5 and direct debt issuance costs of $4.0 were deferred and are being amortized over the life of the 2029 Notes. Although the coupon rate of the 2029 Notes is 5.125%, the effective interest rate is 5.6% after taking into account the impact of the direct debt issuance costs, a deferred loss on an interest rate lock related to the debt issuance and the bond discount. Amortization expense related to the discount and debt issuance costs on the 2029 Notes was $0.8 and $0.7 in 2024 and $0.8 in 2023, and 2022, respectively.
We may redeem some or all of the 2029 Notes at any time. The redemption price would equal the greater of: (1) the principal amount of the notes being redeemed or (2) the present value of the remaining scheduled payments of principal and interest discounted to the redemption date on a semi-annual basis at the comparable U.S. Treasury rate plus 40 basis points; plus, in both cases, accrued and unpaid interest. If the notes are redeemed within 3 months of maturity, the redemption price would be equal to the principal amount of the notes being redeemed plus accrued and unpaid interest.
STEELCASE INC.
NOTES TO THE CONSOLIDATED FINANCIAL STATEMENTS—(Continued)
Note Payable
As of February 24, 2023 we have a $32.2 note payable with an original amount of $50.0 at a floating interest rate based on 30-day LIBOR plus 1.20%. As of February 24, 2023, the interest rate was 5.90%. The loan has a term of seven years and requires fixed monthly principal payments of $0.2 on a 20-year amortization schedule with a $31.8 balloon payment due in 2024. The loan is secured by our two corporate aircraft, contains no financial covenants and is not cross-defaulted to our other debt facilities. The loan matures in 2024.
Global Committed Bank Facility
We have a $300.0 global committed bank facility, which expires in 2029. This facility, which was entered into in Q4 2024, amended and restated our prior $250.0 global committed bank facility which expireswas scheduled to expire in 2025. At our option, and subject to certain conditions, we may increase the aggregate commitment under the facility by up to $125.0$150.0 by obtaining at least one commitment from one or moreof the lenders. We can use borrowings under the facility for general corporate purposes, including friendly acquisitions. Interest on borrowings is based on the rate, as selected by us betweenfrom the following two options:options (with all capitalized terms having the meanings provided in the credit agreement):
•the applicable margin as set forthApplicable Floating Rate Margin in the credit agreement,effect, plus the greatest of (i) the prime rate,Prime Rate, (ii) the federal funds effective rateNYFRB plus 0.5%, (iii) the Adjusted LIBO rate as set forth in the credit agreementTerm SOFR Rate for a one-month interest period plus 1%1.10% or (iv) a 0.75% floor;1.00%;
•the Applicable Term Benchmark/RFR Margin in effect plus (i) for borrowings in U.S. dollars, the Term SOFR Rate plus 0.10%, or (ii) for borrowings in euros, the Adjusted EURIBOR Rate; or
•in limited circumstances, the Eurocurrency rate, with a floor of zero,Applicable Term Benchmark/RFR Margin in effect plus the applicable margin as set forth in the credit agreement.Daily Simple SOFR Rate plus 0.10%.
The facility requires us to satisfy two financial covenants as defined in the credit agreement:
•A maximum net leverage ratio covenant, which is measured by the ratio of (x) indebtednessIndebtedness less liquidityUnrestricted Cash to (y) trailing four fiscal quarter adjustedAdjusted EBITDA and is required to be less than 3.5:1. In the context of certain permitted acquisitions, we have a one-timethe ability, subject to certain conditions, to increase the maximum ratio to 4.0:1 for four consecutive quarters.
•A minimum interest coverage ratio covenant, which is measured by the ratio of (y) trailing four quarter adjustedAdjusted EBITDA to (z) trailing four quarter interest expenseInterest Expense and is required to be no less than 3.0:1.
The facility does not include any restrictions on cash dividend payments or share repurchases.
During 2023, we borrowed $68.0Our subsidiary Smith System Manufacturing Company guarantees all obligations under the facility, and we have pledged 65% of the voting interests in our subsidiary Steelcase Holding SAS to secure all obligations under the facility.
During 2024, we borrowed and repaid $69.0 under the prior facility to fund our operations and the balloon payment of $31.8 for a portionnote payable that matured during the year. As of our acquisition of HALCON, and we also borrowedFebruary 23, 2024, there were no borrowings outstanding under the facility, to supportthere were $0.1 in letters of credit reducing our global operating requirements.availability and we were in compliance with all covenants under the facility. As of February 24, 2023, there were no borrowings outstanding under the prior facility, our availabilityability to borrow under the prior facility was not limited, and we were in compliance with all covenants under the facility. As of February 25, 2022, there were no borrowings outstanding under the facility and we were in compliance with all covenants under theprior facility.
Other Credit Facilities
We have the following other bank and credit facilities as of February 24, 2023:
•a committed bank facility of $8.0 related to a subsidiary. As of February 24, 2023, $3.5 was outstanding under the facility and our availability to borrow under the facility was not limited. As of February 25, 2022,23, 2024, we had a committed bank facility of $12.5 related to a subsidiary. There was availability of $4.0 under the facility based on eligible accounts receivable of the subsidiary, and $2.4 was outstanding under the facility; and
•have unsecured uncommitted short-term credit facilities with various financial institutions with up to $3.8 of U.S. dollar obligations and up to $11.4$18.1 of foreign currency obligations available for working capital purposes as of February 24, 2023.purposes. Interest rates are variable and determined at the time of borrowing. These credit facilities have no stated expiration date but may be changed or canceled by the banks at any time. There were no borrowings on these facilities as of February 24, 202323, 2024 or February 25, 2022.24, 2023.
STEELCASE INC.
NOTES TO THE CONSOLIDATED FINANCIAL STATEMENTS—(Continued)
14. EMPLOYEE BENEFIT PLAN OBLIGATIONS
| | Employee Benefit Plan Obligations (net) | Employee Benefit Plan Obligations (net) | February 24,
2023 | February 25,
2022 | Employee Benefit Plan Obligations (net) | February 23,
2024 | February 24,
2023 |
| Defined contribution retirement plans | Defined contribution retirement plans | $ | 17.0 | | | $ | 9.1 | | |
| Post-retirement medical benefits | Post-retirement medical benefits | 27.5 | | | 34.1 | | |
| Post-retirement medical benefits | |
| Post-retirement medical benefits | |
| Defined benefit pension plans | |
| Defined benefit pension plans | |
| Defined benefit pension plans | Defined benefit pension plans | 41.1 | | | 48.5 | | |
| Deferred compensation plans and agreements | Deferred compensation plans and agreements | 46.3 | | | 56.9 | | |
| Deferred compensation plans and agreements | |
| Deferred compensation plans and agreements | |
| $ | |
| $ | |
| $ | |
| | $ | 131.9 | | | $ | 148.6 | | |
| Employee benefit plan assets | |
| | Employee benefit plan assets | |
| | Employee benefit plan assets | Employee benefit plan assets | |
| | Long-term asset | Long-term asset | $ | 2.3 | | | $ | 3.5 | | |
| | $ | 2.3 | | | $ | 3.5 | | |
| Long-term asset | |
| | Long-term asset | |
| $ | |
| $ | |
| $ | |
| | Employee benefit plan obligations | |
| | Employee benefit plan obligations | |
| | Employee benefit plan obligations | Employee benefit plan obligations | |
| Current portion | Current portion | $ | 31.2 | | | $ | 25.4 | | |
| Current portion | |
| Current portion | |
| Long-term portion | Long-term portion | 103.0 | | | 126.7 | | |
| $ | 134.2 | | | $ | 152.1 | | |
| Long-term portion | |
| Long-term portion | |
| $ | |
| $ | |
| $ | |
Defined Contribution Retirement Plans
Substantially all of our U.S. employees are eligible to participate in defined contribution retirement plans, primarily the Steelcase Inc. Retirement Plan (the “Retirement Plan”). Company contributions, including discretionary profit sharing and 401(k) matching contributions, and employee 401(k) contributions fund the Retirement Plan. All contributions are made to a trust which is held for the sole benefit of participants.
Total expense under all defined contribution retirement plans was $38.4 for 2024, $26.1 for 2023 and $17.1 for 2022 and $19.3 for 2021.2022. We expect to fund approximately $28.4$39.9 related to our defined contribution plans in 2024,2025, including funding related to our 20232024 discretionary profit sharing contributions.
Post-Retirement Medical Benefits
We maintain post-retirement benefit plans that provide medical and life insurance benefits to certain North American-based retirees and eligible dependents. The plans were frozen to new participants in 2003. We accrue the cost of post-retirement benefits during the service periods of employees based on actuarial calculations for each plan. These plans are unfunded. Our investments in COLI policies are intended to be utilized as a long-term funding source for these benefit obligations. See Note 10 for additional information.
STEELCASE INC.
NOTES TO THE CONSOLIDATED FINANCIAL STATEMENTS—(Continued)
Defined Benefit Pension Plans
Our defined benefit pension plans include various qualified foreign retirement plans as well as domestic non-qualified supplemental retirement plans that are limited to a select group of management approved by the Compensation Committee. The benefit plan obligations for the non-qualified supplemental retirement plans are primarily related to the Steelcase Inc. Executive Supplemental Retirement Plan. This plan, which is unfunded, was frozen to new participants in 2016, and the benefits were capped for existing participants. The funded status of our defined benefit pension plans (excluding our investments in COLI policies) is as follows:
| Defined Benefit Pension
Plan Obligations | Defined Benefit Pension
Plan Obligations | February 24, 2023 | February 25, 2022 | Defined Benefit Pension
Plan Obligations | February 23, 2024 | February 24, 2023 |
| Qualified Plans | Non-qualified
Supplemental
Retirement Plans | Qualified Plans | Non-qualified
Supplemental
Retirement Plans | Qualified Plans | Non-qualified
Supplemental
Retirement Plans | Qualified Plans | Non-qualified
Supplemental
Retirement Plans |
| Foreign | Foreign |
| Plan assets | Plan assets | $ | 22.4 | | | $ | — | | | $ | 35.2 | | | $ | — | | |
| Projected benefit plan obligations | Projected benefit plan obligations | 30.2 | | | 23.7 | | | 44.9 | | | 28.8 | | |
| Projected benefit plan obligations | |
| Projected benefit plan obligations | |
| Funded status | |
| Funded status | |
| Funded status | Funded status | $ | (7.8) | | | $ | (23.7) | | | $ | (9.7) | | | $ | (28.8) | | |
| | Long-term asset | Long-term asset | 2.3 | | | — | | | 3.5 | | | — | | |
| | Long-term asset | |
| | Long-term asset | |
| Current liability | |
| Current liability | |
| Current liability | Current liability | (0.8) | | | (3.6) | | | (0.8) | | | (3.9) | | |
| Long-term liability | Long-term liability | (9.3) | | | (20.1) | | | (12.4) | | | (24.9) | | |
| Long-term liability | |
| Long-term liability | |
| Total benefit plan obligations | |
| Total benefit plan obligations | |
| Total benefit plan obligations | Total benefit plan obligations | $ | (7.8) | | | $ | (23.7) | | | $ | (9.7) | | | $ | (28.8) | | |
| Accumulated benefit obligation | Accumulated benefit obligation | $ | 27.6 | | | $ | 23.7 | | | $ | 41.4 | | | $ | 28.8 | | |
| Accumulated benefit obligation | |
| Accumulated benefit obligation | |
|
STEELCASE INC.
NOTES TO THE CONSOLIDATED FINANCIAL STATEMENTS—(Continued)
Summary Disclosures for Defined Benefit Pension and Post-Retirement Plans
The following tables summarize our defined benefit pension and post-retirement plans:
| | Defined Benefit
Pension Plans | Post-Retirement
Plans |
February 24,
2023 | February 25,
2022 | February 24,
2023 | February 25,
2022 |
| Defined Benefit
Pension Plans | | | Defined Benefit
Pension Plans | Post-Retirement
Plans |
| February 23,
2024 | February 24,
2023 | February 23,
2024 | February 24,
2023 |
| Change in plan assets: | Change in plan assets: | |
| Fair value of plan assets, beginning of year | Fair value of plan assets, beginning of year | $ | 35.2 | | | $ | 33.2 | | | $ | — | | | $ | — | | |
| Fair value of plan assets, beginning of year | |
| Fair value of plan assets, beginning of year | |
| Actual return on plan assets | |
| Actual return on plan assets | |
| Actual return on plan assets | Actual return on plan assets | (12.1) | | | 3.7 | | | — | | | — | | |
| Employer contributions | Employer contributions | 8.0 | | | 4.7 | | | 2.6 | | | 4.3 | | |
| Employer contributions | |
| Employer contributions | |
| Plan participants’ contributions | |
| Plan participants’ contributions | |
| Plan participants’ contributions | Plan participants’ contributions | — | | | — | | | 2.1 | | | 2.2 | | |
| | Currency changes | Currency changes | (3.5) | | | (1.7) | | | — | | | — | | |
| | Currency changes | |
| | Currency changes | |
| Benefits paid | |
| Benefits paid | |
| Benefits paid | Benefits paid | (5.2) | | | (4.7) | | | (4.7) | | | (6.5) | | |
| Fair value of plan assets, end of year | Fair value of plan assets, end of year | 22.4 | | | 35.2 | | | — | | | — | | |
| Fair value of plan assets, end of year | |
| Fair value of plan assets, end of year | |
| | Change in benefit obligations: | Change in benefit obligations: | |
| Benefit plan obligations, beginning of year | Benefit plan obligations, beginning of year | 73.7 | | | 85.9 | | | 34.1 | | | 42.7 | | |
| Benefit plan obligations, beginning of year | |
| Benefit plan obligations, beginning of year | |
| Service cost | |
| Service cost | |
| Service cost | Service cost | 0.7 | | | 1.4 | | | 0.1 | | | 0.1 | | |
| Interest cost | Interest cost | 1.6 | | | 1.3 | | | 1.1 | | | 1.0 | | |
| Interest cost | |
| Interest cost | |
| Amendments | Amendments | 0.5 | | | — | | | — | | | — | | |
| Net actuarial gain (1) | (13.5) | | | (7.2) | | | (5.1) | | | (5.4) | | |
| Amendments | |
| Amendments | |
| Net actuarial loss (gain) (1) | |
| Net actuarial loss (gain) (1) | |
| Net actuarial loss (gain) (1) | |
| Plan participants’ contributions | |
| Plan participants’ contributions | |
| Plan participants’ contributions | Plan participants’ contributions | — | | | — | | | 2.1 | | | 2.2 | | |
| | Curtailments | |
| | Curtailments | |
| | Curtailments | |
| Settlements | |
| Settlements | |
| Settlements | |
| Currency changes | Currency changes | (3.9) | | | (3.0) | | | (0.1) | | | — | | |
| Currency changes | |
| Currency changes | |
| Special Termination Benefits | |
| Special Termination Benefits | |
| Special Termination Benefits | |
| | Benefits paid | |
| | Benefits paid | |
| | Benefits paid | Benefits paid | (5.2) | | | (4.7) | | | (4.7) | | | (6.5) | | |
| Benefit plan obligations, end of year | Benefit plan obligations, end of year | 53.9 | | | 73.7 | | | 27.5 | | | 34.1 | | |
| Benefit plan obligations, end of year | |
| Benefit plan obligations, end of year | |
| Funded status | Funded status | $ | (31.5) | | | $ | (38.5) | | | $ | (27.5) | | | $ | (34.1) | | |
| Funded status | |
| Funded status | |
| | Amounts recognized on the Consolidated Balance Sheets: | Amounts recognized on the Consolidated Balance Sheets: | |
| | Long-term asset | Long-term asset | 2.3 | | | 3.5 | | | — | | | — | | |
| | Long-term asset | |
| | Long-term asset | |
| Current liability | |
| Current liability | |
| Current liability | Current liability | (4.4) | | | (4.7) | | | (2.8) | | | (3.0) | | |
| Long-term liability | Long-term liability | (29.4) | | | (37.3) | | | (24.7) | | | (31.1) | | |
| Long-term liability | |
| Long-term liability | |
| Net amount recognized | Net amount recognized | $ | (31.5) | | | $ | (38.5) | | | $ | (27.5) | | | $ | (34.1) | | |
| Net amount recognized | |
| Net amount recognized | |
| | Amounts recognized in accumulated other comprehensive income (loss) —pretax: | Amounts recognized in accumulated other comprehensive income (loss) —pretax: | |
| Actuarial loss (gain) | Actuarial loss (gain) | $ | 8.7 | | | $ | 10.6 | | | $ | (18.3) | | | $ | (15.1) | | |
| Actuarial loss (gain) | |
| Actuarial loss (gain) | |
| Prior service cost | |
| Prior service cost | |
| Prior service cost | Prior service cost | 0.5 | | | 0.9 | | | — | | | — | | |
| Total amounts recognized in accumulated other comprehensive income (loss) —pretax | Total amounts recognized in accumulated other comprehensive income (loss) —pretax | $ | 9.2 | | | $ | 11.5 | | | $ | (18.3) | | | $ | (15.1) | | |
| Total amounts recognized in accumulated other comprehensive income (loss) —pretax | |
| Total amounts recognized in accumulated other comprehensive income (loss) —pretax | |
_________________________
(1) In 20232024 and 2022,2023, the net actuarial gainloss (gain) includes amounts resulting from changes in actuarial assumptions utilized to calculate our benefit plan obligations such as weighted-average discount rates and recent census data.
STEELCASE INC.
NOTES TO THE CONSOLIDATED FINANCIAL STATEMENTS—(Continued)
| | Pension Plans | Post-Retirement Plans |
Year Ended | February 24,
2023 | February 25,
2022 | February 26,
2021 | February 24,
2023 | February 25,
2022 | February 26,
2021 |
| Pension Plans | | | Pension Plans | Post-Retirement Plans |
| Year Ended | Year Ended |
| February 23,
2024 | February 24,
2023 | February 25,
2022 | February 23,
2024 | February 24,
2023 | February 25,
2022 |
| Components of expense: | Components of expense: | |
| Service cost | Service cost | $ | 0.7 | | | $ | 1.4 | | | $ | 1.9 | | | $ | 0.1 | | | $ | 0.1 | | | $ | 0.1 | | |
| Service cost | |
| Service cost | |
| Interest cost | |
| Interest cost | |
| Interest cost | Interest cost | 1.6 | | | 1.3 | | | 1.3 | | | 1.1 | | | 1.0 | | | 1.1 | | |
| Amortization of net loss (gain) | Amortization of net loss (gain) | 0.2 | | | 1.2 | | | 1.1 | | | (1.8) | | | (1.4) | | | (2.1) | | |
| Amortization of net loss (gain) | |
| Amortization of net loss (gain) | |
| Amortization of prior year service cost (credit) | |
| Amortization of prior year service cost (credit) | |
| Amortization of prior year service cost (credit) | Amortization of prior year service cost (credit) | 0.5 | | | (0.1) | | | — | | | — | | | — | | | — | | |
| Expected return on plan assets | Expected return on plan assets | (0.4) | | | (1.2) | | | (0.9) | | | — | | | — | | | — | | |
| Expected return on plan assets | |
| Expected return on plan assets | |
| Effect of curtailments | |
| Effect of curtailments | |
| Effect of curtailments | |
| | Effect of special termination benefits | |
| | Effect of special termination benefits | |
| | Effect of special termination benefits | |
| Net expense (credit) recognized in Consolidated Statements of Income | |
| Net expense (credit) recognized in Consolidated Statements of Income | |
| Net expense (credit) recognized in Consolidated Statements of Income | Net expense (credit) recognized in Consolidated Statements of Income | 2.6 | | | 2.6 | | | 3.4 | | | (0.6) | | | (0.3) | | | (0.9) | | |
| Other changes in plan assets and benefit obligations recognized in other comprehensive income (loss) (pre-tax): | Other changes in plan assets and benefit obligations recognized in other comprehensive income (loss) (pre-tax): | | | | | | | | | | | | |
| Other changes in plan assets and benefit obligations recognized in other comprehensive income (loss) (pre-tax): | |
| Other changes in plan assets and benefit obligations recognized in other comprehensive income (loss) (pre-tax): | |
| Net actuarial loss (gain) | |
| Net actuarial loss (gain) | |
| Net actuarial loss (gain) | Net actuarial loss (gain) | (1.0) | | | (9.7) | | | 1.2 | | | (5.1) | | | (5.4) | | | 0.5 | | |
| Prior service cost | Prior service cost | 0.5 | | | — | | | 0.1 | | | — | | | — | | | — | | |
| Prior service cost | |
| Prior service cost | |
| Amortization of gain (loss) | Amortization of gain (loss) | (0.2) | | | (1.2) | | | (1.1) | | | 1.8 | | | 1.4 | | | 2.1 | | |
| Amortization of gain (loss) | |
| Amortization of gain (loss) | |
| Amortization of prior year service cost (credit) | |
| Amortization of prior year service cost (credit) | |
| Amortization of prior year service cost (credit) | Amortization of prior year service cost (credit) | (0.5) | | | 0.1 | | | — | | | — | | | — | | | — | | |
| | Total recognized in other comprehensive income (loss) | Total recognized in other comprehensive income (loss) | (1.2) | | | (10.8) | | | 0.2 | | | (3.3) | | | (4.0) | | | 2.6 | | |
| | Total recognized in other comprehensive income (loss) | |
| | Total recognized in other comprehensive income (loss) | |
Total recognized in net periodic benefit cost and other comprehensive income (loss) --
pre-tax | Total recognized in net periodic benefit cost and other comprehensive income (loss) --
pre-tax | $ | 1.4 | | | $ | (8.2) | | | $ | 3.6 | | | $ | (3.9) | | | $ | (4.3) | | | $ | 1.7 | | |
Total recognized in net periodic benefit cost and other comprehensive income (loss) --
pre-tax | |
Total recognized in net periodic benefit cost and other comprehensive income (loss) --
pre-tax | |
STEELCASE INC.
NOTES TO THE CONSOLIDATED FINANCIAL STATEMENTS—(Continued)
| | Pension and Other Post-Retirement Accumulated Other Comprehensive Income (Loss) Changes | Pension and Other Post-Retirement Accumulated Other Comprehensive Income (Loss) Changes | Before Tax
Amount | Tax (Expense)
Benefit | Net of
Tax Amount | Pension and Other Post-Retirement Accumulated Other Comprehensive Income (Loss) Changes | Before Tax
Amount | Tax (Expense)
Benefit | Net of
Tax Amount |
| Balance as of February 26, 2021 | $ | (11.7) | | | $ | 5.1 | | | $ | (6.6) | | |
| Balance as of February 25, 2022 | |
| Prior service (cost) credit from plan amendment arising during period | |
| Prior service (cost) credit from plan amendment arising during period | |
| Prior service (cost) credit from plan amendment arising during period | |
| | Amortization of prior service cost (credit) included in net periodic pension cost | |
| | Amortization of prior service cost (credit) included in net periodic pension cost | |
| | Amortization of prior service cost (credit) included in net periodic pension cost | Amortization of prior service cost (credit) included in net periodic pension cost | (0.1) | | | — | | | (0.1) | | |
| Net prior service (cost) credit during period | Net prior service (cost) credit during period | (0.1) | | | — | | | (0.1) | | |
| Net prior service (cost) credit during period | |
| Net prior service (cost) credit during period | |
| Net actuarial gain (loss) arising during period | Net actuarial gain (loss) arising during period | 15.1 | | | (3.6) | | | 11.5 | | |
| Net actuarial gain (loss) arising during period | |
| Net actuarial gain (loss) arising during period | |
| Amortization of net actuarial (gain) loss included in net periodic pension cost | |
| Amortization of net actuarial (gain) loss included in net periodic pension cost | |
| Amortization of net actuarial (gain) loss included in net periodic pension cost | Amortization of net actuarial (gain) loss included in net periodic pension cost | (0.2) | | | 0.1 | | | (0.1) | | |
| | Net actuarial gain (loss) during period | Net actuarial gain (loss) during period | 14.9 | | | (3.5) | | | 11.4 | | |
| | Net actuarial gain (loss) during period | |
| | Net actuarial gain (loss) during period | |
| | Foreign currency translation adjustments | |
| | Foreign currency translation adjustments | |
| | Foreign currency translation adjustments | Foreign currency translation adjustments | 0.5 | | | — | | | 0.5 | | |
| Current period change | Current period change | 15.3 | | | (3.5) | | | 11.8 | | |
| Balance as of February 25, 2022 | $ | 3.6 | | | $ | 1.6 | | | $ | 5.2 | | |
| Prior service (cost) credit from plan amendment arising during period | (0.5) | | | 0.1 | | | (0.4) | | |
| Current period change | |
| Current period change | |
| Balance as of February 24, 2023 | |
| Balance as of February 24, 2023 | |
| Balance as of February 24, 2023 | |
| | Amortization of prior service cost (credit) included in net periodic pension cost | 0.5 | | | (0.1) | | | 0.4 | | |
| Net prior service (cost) credit during period | — | | | — | | | — | | |
| | Net actuarial gain (loss) arising during period | Net actuarial gain (loss) arising during period | 6.1 | | | (1.6) | | | 4.5 | | |
| | Net actuarial gain (loss) arising during period | |
| | Net actuarial gain (loss) arising during period | |
| Amortization of net actuarial (gain) loss included in net periodic pension cost | |
| Amortization of net actuarial (gain) loss included in net periodic pension cost | |
| Amortization of net actuarial (gain) loss included in net periodic pension cost | Amortization of net actuarial (gain) loss included in net periodic pension cost | (1.6) | | | 0.4 | | | (1.2) | | |
| | Net actuarial gain (loss) during period | Net actuarial gain (loss) during period | 4.5 | | | (1.2) | | | 3.3 | | |
| | Net actuarial gain (loss) during period | |
| | Net actuarial gain (loss) during period | |
| | Foreign currency translation adjustments | |
| | Foreign currency translation adjustments | |
| | Foreign currency translation adjustments | Foreign currency translation adjustments | 1.0 | | | (0.2) | | | 0.8 | | |
| Current period change | Current period change | 5.5 | | | (1.4) | | | 4.1 | | |
| Balance as of February 24, 2023 | $ | 9.1 | | | $ | 0.2 | | | $ | 9.3 | | |
| Current period change | |
| Current period change | |
| Balance as of February 23, 2024 | |
| Balance as of February 23, 2024 | |
| Balance as of February 23, 2024 | |
| Weighted-Average
Assumptions | Weighted-Average
Assumptions | Pension Plans | Post-Retirement Plans | Weighted-Average
Assumptions | Pension Plans | Post-Retirement Plans |
| Year Ended | Year Ended | Year Ended | Year Ended |
February 24,
2023 | February 25,
2022 | February 26,
2021 | February 24,
2023 | February 25,
2022 | February 26,
2021 | February 23,
2024 | February 24,
2023 | February 25,
2022 | February 23,
2024 | February 24,
2023 | February 25,
2022 |
| Weighted-average assumptions used to determine benefit obligations: | Weighted-average assumptions used to determine benefit obligations: | |
| Discount rate | Discount rate | 4.80 | % | | 2.50 | % | | 1.70 | % | | 5.47 | % | | 3.38 | % | | 2.58 | % | |
| Discount rate | |
| Discount rate | |
| Rate of salary progression | |
| Rate of salary progression | |
| Rate of salary progression | Rate of salary progression | 0.60 | % | | 2.50 | % | | 3.50 | % | |
| Weighted-average assumptions used to determine net periodic benefit cost: | Weighted-average assumptions used to determine net periodic benefit cost: | |
| Weighted-average assumptions used to determine net periodic benefit cost: | |
| Weighted-average assumptions used to determine net periodic benefit cost: | |
| Discount rate | |
| Discount rate | |
| Discount rate | Discount rate | 2.50 | % | | 1.70 | % | | 1.70 | % | | 3.38 | % | | 2.58 | % | | 2.56 | % | |
| Expected return on plan assets | Expected return on plan assets | 1.40 | % | | 3.70 | % | | 3.00 | % | |
| Expected return on plan assets | |
| Expected return on plan assets | |
| Rate of salary progression | Rate of salary progression | 2.50 | % | | 3.50 | % | | 3.40 | % | |
| Rate of salary progression | |
| Rate of salary progression | |
The measurement dates for our retiree benefit plans are consistent with our fiscal year end. Accordingly, we select discount rates to measure our benefit obligations that are consistent with market indices at the end of each year. In evaluating the expected return on plan assets, we consider the expected long-term rate of return on plan assets based on the specific allocation of assets for each plan, an analysis of current market conditions and the views of leading financial advisors and economists.
The assumed healthcare cost trend was 7.30%6.83% for pre-age 65 retirees as of February 24, 2023,23, 2024, gradually declining to 4.50% after eightseven years. As of February 25, 2022,24, 2023, the assumed healthcare cost trend was 5.83%7.30% for pre-age 65 retirees, gradually declining to 4.50% after nineeight years. Post-age 65 trend rates are not applicable as our plan provides a fixed subsidy for post-age 65 benefits.
STEELCASE INC.
NOTES TO THE CONSOLIDATED FINANCIAL STATEMENTS—(Continued)
Plan Assets
In 2023, we entered into a contract with an insurer to annuitize our U.K. defined benefit pension plan, covering 100% of the membership in the plan. This agreement, or "buy-in", resulted in an exchange of plan assets for an annuity that covers our future projected benefit obligations. The initial value of the asset associated with this contract was equal to the premium paid to the insurer to secure the insurance policy. The value of the asset is adjusted each reporting period for changes in financial assumptions, such as discount rates and inflation indices. The asset represents a Level 3 measurement as there are no observable inputs with the valuation of the contract.
We anticipate the buyout of the plan and transfer of future benefit obligations of plan participants to be completed in 2024.2025. The non-cash settlement charge will be recorded when the buyout is completed and is expected to be approximately $15.$12.
Our pension plans’ weighted-average investment allocation strategies and weighted-average target asset allocations by asset category as of February 24, 202323, 2024 and February 25, 202224, 2023 are reflected in the following table.
| | Asset Category | Asset Category | February 24, 2023 | February 25, 2022 | Asset Category | February 23, 2024 | February 24, 2023 |
Actual
Allocations | Target
Allocations | Actual
Allocations | Target
Allocations | Actual
Allocations | Target
Allocations | Actual
Allocations | Target
Allocations |
| Buy-in contract | Buy-in contract | 98 | % | | 100 | % | | — | % | | — | % | |
| Debt securities | — | | | — | | | 78 | | | 50 | | |
| | Other (1) | |
| | Other (1) | |
| | | Other (1) | Other (1) | 2 | | | — | | | 22 | | | 50 | | |
| Total | Total | 100 | % | | 100 | % | | 100 | % | | 100 | % | |
| Total | |
| Total | |
________________________
(1)Represents cash and cash equivalents in 20232024 and primarily represents money market funds in 2022.
The fair value of the pension plan assets as of February 24, 202323, 2024 and February 25, 2022,24, 2023, by asset category are as follows:
| | Fair Value of Pension Plan Assets | Fair Value of Pension Plan Assets | February 24, 2023 | Fair Value of Pension Plan Assets | February 23, 2024 |
| Level 1 | Level 2 | Level 3 | Total | Level 1 | Level 2 | Level 3 | Total |
| Cash and cash equivalents | Cash and cash equivalents | $ | 0.5 | | | $ | — | | | $ | — | | | $ | 0.5 | | |
| | Buy-in contract | Buy-in contract | — | | | — | | | 21.9 | | | 21.9 | | |
| | Buy-in contract | |
| | | $ | 0.5 | | | $ | — | | | $ | 21.9 | | | $ | 22.4 | | |
| Buy-in contract | |
| | $ | |
| | $ | |
| | $ | |
| | | | | | | | | | | | | | | | | | | | | | | | | | |
| Fair Value of Pension Plan Assets | February 25, 2022 |
| Level 1 | Level 2 | Level 3 | Total |
| Cash and cash equivalents | $ | 1.3 | | | $ | — | | | $ | — | | | $ | 1.3 | | |
| | | | | | | | |
| | | | | | | | |
| | | | | | | | |
| | | | | | | | |
| | | | | | | | |
| | | | | | | | |
| Fixed income securities - Bond funds | — | | | 33.7 | | | — | | | 33.7 | | |
| | | | | | | | |
| | | | | | | | |
| Other investments - Property and property funds | — | | | 0.2 | | | — | | | 0.2 | | |
| $ | 1.3 | | | $ | 33.9 | | | $ | — | | | $ | 35.2 | | |
| | | | | | | | | | | | | | | | | | | | | | | | | | |
| Fair Value of Pension Plan Assets | February 24, 2023 |
| Level 1 | Level 2 | Level 3 | Total |
| Cash and cash equivalents | $ | 0.5 | | | $ | — | | | $ | — | | | $ | 0.5 | | |
| | | | | | | | |
| | | | | | | | |
| | | | | | | | |
| | | | | | | | |
| | | | | | | | |
| | | | | | | | |
| Buy-in contract | — | | | — | | | 21.9 | | | 21.9 | | |
| | | | | | | | |
| | | | | | | | |
| | | | | | | | |
| $ | 0.5 | | | $ | — | | | $ | 21.9 | | | $ | 22.4 | | |
STEELCASE INC.
NOTES TO THE CONSOLIDATED FINANCIAL STATEMENTS—(Continued)
Below is a roll-forward of the pension plan assets measured at estimated fair value using Level 3 inputs during the years ended February 24, 20232024 and February 25, 2022:2023:
| | | | | | | | |
Roll-forwardRoll-Forward of Fair Value Using Level 3 Inputs | Pension Plan Assets |
| | |
| | |
| Balance as of February 25, 2022 | $ | — | | |
Initial buy-in contract premiumBuy-in Premium | 24.2 | | |
| Other contributions | 1.4 | | |
| Change in estimated fair value | (3.7) | | |
| Balance as of February 24, 2023 | $ | 21.9 | | |
| Change in estimated fair value | (0.5) | | |
| Foreign currency gain | 1.1 | | |
| Balance as of February 23, 2024 | $ | 22.5 | | |
We expect to contribute approximately $5.2$4.7 to our pension plans and fund approximately $2.9$3.6 related to our post-retirement plans in 2024.2025. The estimated future benefit payments under our pension and post-retirement plans are as follows:
| | Fiscal Year Ending in February | Fiscal Year Ending in February | Pension
Plans | Post-retirement
Plans | Fiscal Year Ending in February | Pension
Plans | Post-retirement
Plans |
|
| 2024 | $ | 5.2 | | | $ | 2.9 | | |
| | 2025 | |
| 2025 | |
| 2025 | |
| 2025 | |
| 2025 | |
| 2025 | |
| 2025 | |
| 2025 | |
| 2025 | |
| 2025 | |
| 2025 | |
| 2025 | |
| 2025 | |
| 2025 | |
| 2025 | 2025 | 4.5 | | | 2.8 | | |
| 2026 | 2026 | 5.3 | | | 2.6 | | |
| 2026 | |
| 2026 | |
| 2027 | |
| 2027 | |
| 2027 | 2027 | 4.5 | | | 2.5 | | |
| 2028 | 2028 | 4.0 | | | 2.5 | | |
| 2029 - 2033 | 17.8 | | | 11.0 | | |
| 2028 | |
| 2028 | |
| 2029 | |
| 2029 | |
| 2029 | |
| 2030 - 2034 | |
| 2030 - 2034 | |
| 2030 - 2034 | |
Multi-Employer Pension Plan
One of our subsidiaries, SC Transport Inc., previously contributed to the Central States, Southeast and Southwest Areas Pension Fund (the "Fund"), a multi-employer pension plan, based on obligations arising under a collective bargaining agreement that covered SC Transport Inc. employees and retirees. Under current law, an employer that withdraws or partially withdraws from a multi-employer pension plan may incur a withdrawal liability to the plan, which represents the portion of the plan’s underfunding that is allocable to the withdrawing employer under very complex actuarial and allocation rules.
In 2019, the Fund asserted that SC Transport Inc.'s absence of hiring additional union employees over the past ten years constituted an adverse selection practice under the Fund and, if not remedied, would result in an assessment of a withdrawal liability. As a result of the Fund's assertion, SC Transport Inc. recorded an $11.2 charge related to its estimated future obligations under a withdrawal from the Fund to be paid out in installments over a period of up to 20 years. The withdrawal liability was discounted using a rate of 3.5%. The balance of the liability as of February 24, 202323, 2024 was $9.6.$9.2.
In 2020, SC Transport Inc. withdrew from the Fund, and the Fund issued a final assessment of our withdrawal liability. We appealed the amount of the assessment by the Fund and areFund. In 2024, we prevailed in arbitration proceedings.on our claim, and the Fund appealed the arbitrator’s decision. The amount that may ultimately be required to settle any potential obligation may be lower or higher than our estimated liability, which we will adjust if needed, if and when additional information becomes available.
STEELCASE INC.
NOTES TO THE CONSOLIDATED FINANCIAL STATEMENTS—(Continued)
Deferred Compensation Programs
We maintain four deferred compensation programs. The first deferred compensation program is closed to new entrants. In this program, certain employees elected to defer a portion of their compensation in return for a fixed benefit to be paid in installments beginning when the participant reaches age 70. Under the second plan, certain employees may elect to defer a portion of their compensation. The third plan is intended to restore retirement benefits that would otherwise be paid under the Retirement Plan but are precluded as a result of the limitations on eligible compensation under Internal Revenue Code Section 401(a)(17). Under the fourth plan, our non-employee directors may elect to defer all or a portion of their board retainer and committee fees. The deferred amounts in the
STEELCASE INC.
NOTES TO THE CONSOLIDATED FINANCIAL STATEMENTS—(Continued)
last three plans earn a return based on the investment option selected. These deferred compensation obligations are unfunded.
Deferred compensation expense (gain), which represents annual participant earnings on amounts that have been deferred, and expense (gains) related to restoration retirement benefits, were ($2.9)$7.7 for 2024, $(2.9) for 2023 and $2.0 for 2022 and $7.7 for 2021.2022.
15.CAPITAL STRUCTURE
Terms of Class A Common Stock and Class B Common Stock
The holders of common stock are generally entitled to vote as a single class on all matters upon which shareholders have a right to vote, subject to the requirements of applicable laws and the rights of any outstanding series of preferred stock to vote as a separate class. Each share of Class A Common Stock entitles its holder to one vote, and each share of Class B Common Stock entitles its holder to 10 votes. Each share of Class B Common Stock is convertible into a share of Class A Common Stock on a one-for-one basis (i) at the option of the holder at any time, (ii) upon transfer to a person or entity which is not a Permitted Transferee (as defined in our Second Restated Articles of Incorporation, as amended), (iii) with respect to shares of Class B Common Stock acquired after February 20, 1998, at such time as a corporation, partnership, limited liability company, trust or charitable organization holding such shares ceases to be controlled or owned 100% by Permitted Transferees and (iv) on the date on which the number of shares of Class B Common Stock outstanding is less than 15% of all of the then outstanding shares of common stock (calculated without regard to voting rights).
Except for the voting and conversion features described above, the terms of Class A Common Stock and Class B Common Stock are generally similar. That is, the holders are entitled to equal dividends when declared by our Board of Directors and generally will receive the same per share consideration in the event of a merger and be treated on an equal per share basis in the event of a liquidation or winding up of Steelcase Inc. In addition, we are not entitled to issue additional shares of Class B Common Stock, or issue options, rights or warrants to subscribe for additional shares of Class B Common Stock, except that we may make a pro rata offer to all holders of common stock of rights to purchase additional shares of the class of common stock held by them, and any dividend payable in common stock will be paid in the form of Class A Common Stock to Class A holders and Class B Common Stock to Class B holders. Neither class of stock may be split, divided or combined unless the other class is proportionally split, divided or combined.
Preferred Stock
Our Second Restated Articles of Incorporation, as amended, authorize our Board of Directors, without any vote or action by our shareholders, to create one or more series of preferred stock up to the limit of our authorized but unissued shares of preferred stock and to fix the designations, preferences, rights, qualifications, limitations and restrictions thereof, including the voting rights, dividend rights, dividend rate, conversion rights, terms of redemption (including sinking fund provisions), redemption price or prices, liquidation preferences and the number of shares constituting any series.
STEELCASE INC.
NOTES TO THE CONSOLIDATED FINANCIAL STATEMENTS—(Continued)
Share Repurchases and Conversions
The 20232024 and 20222023 activity for share repurchases is as follows (share data in millions):
| | Share Repurchases | Share Repurchases | Year ended | Share Repurchases | Year ended |
February 24,
2023 | February 25,
2022 | February 23,
2024 | February 24,
2023 |
| Total number of shares | Price Paid | Total number
of shares | Price Paid | Total number of shares | Price Paid | Total number
of shares | Price Paid |
| Class A Common Stock | Class A Common Stock | 0.4 | | | $ | 3.9 | | | 4.1 | | | $ | 55.2 | | |
| Class B Common Stock | Class B Common Stock | — | | | $ | — | | | — | | | $ | — | | |
| Class B Common Stock | |
| Class B Common Stock | |
During 2024 and 2023, and 2022, 4.50.1 million and 1.34.5 million shares of our Class B Common Stock were converted to Class A Common Stock, respectively.
STEELCASE INC.
NOTES TO THE CONSOLIDATED FINANCIAL STATEMENTS—(Continued)
16.INCOME TAXES
Provision for Income Taxes
The provision for income taxes on income before income tax expense (benefit) consists of:
| | Provision for Income Tax Expense (Benefit) | Provision for Income Tax Expense (Benefit) | Year Ended | Provision for Income Tax Expense (Benefit) | Year Ended |
February 24,
2023 | February 25,
2022 | February 26,
2021 | February 23,
2024 | February 24,
2023 | February 25,
2022 |
| Current income tax expense (benefit): | Current income tax expense (benefit): | |
| Federal | Federal | $ | 1.3 | | | $ | — | | | $ | (30.4) | | |
| Federal | |
| Federal | |
| State and local | |
| State and local | |
| State and local | State and local | 0.8 | | | 1.0 | | | 1.9 | | |
| Foreign | Foreign | 14.9 | | | 10.0 | | | 12.9 | | |
| 17.0 | | | 11.0 | | | (15.6) | | |
| Foreign | |
| Foreign | |
| 25.0 | |
| 25.0 | |
| 25.0 | |
| Deferred income tax expense (benefit): | |
| Deferred income tax expense (benefit): | |
| Deferred income tax expense (benefit): | Deferred income tax expense (benefit): | | | | | | |
| Federal | Federal | (2.3) | | | (14.0) | | | 13.7 | | |
| Federal | |
| Federal | |
| State and local | |
| State and local | |
| State and local | State and local | 1.4 | | | (1.3) | | | (1.1) | | |
| Foreign | Foreign | 0.2 | | | 1.9 | | | 2.8 | | |
| (0.7) | | | (13.4) | | | 15.4 | | |
| Foreign | |
| Foreign | |
| 1.0 | |
| 1.0 | |
| 1.0 | |
| Income tax expense (benefit) | Income tax expense (benefit) | $ | 16.3 | | | $ | (2.4) | | | $ | (0.2) | | |
| Income tax expense (benefit) | |
| Income tax expense (benefit) | |
Income taxes were based on the following sources of income (loss) before income tax expense (benefit):
| | Source of Income (Loss) Before Income Tax Expense (Benefit) | Source of Income (Loss) Before Income Tax Expense (Benefit) | Year Ended | Source of Income (Loss) Before Income Tax Expense (Benefit) | Year Ended |
February 24,
2023 | February 25,
2022 | February 26,
2021 | February 23,
2024 | February 24,
2023 | February 25,
2022 |
| Domestic | Domestic | $ | 2.1 | | | $ | (38.0) | | | $ | (10.1) | | |
| Foreign | Foreign | 49.5 | | | 39.6 | | | 36.0 | | |
| $ | 51.6 | | | $ | 1.6 | | | $ | 25.9 | | |
| Foreign | |
| Foreign | |
| $ | |
| $ | |
| $ | |
STEELCASE INC.
NOTES TO THE CONSOLIDATED FINANCIAL STATEMENTS—(Continued)
For income tax purposes, our domestic operations act as the global principal in our supply chain with routine income earned by our foreign operations for contract manufacturing and sales and distribution functions. The result is that our foreign operations earn consistent income, and our domestic operations earn the resulting variable residual income.
The total income tax expense (benefit) recognized is reconciled to that computed by applying the U.S. federal statutory tax rate of 21.0%, as follows:
| | Income Tax Provision Reconciliation | Income Tax Provision Reconciliation | Year Ended | Income Tax Provision Reconciliation | Year Ended |
February 24,
2023 | February 25,
2022 | February 26,
2021 | February 23,
2024 | February 24,
2023 | February 25,
2022 |
| Tax expense at the U.S. federal statutory rate | Tax expense at the U.S. federal statutory rate | $ | 10.8 | | | $ | 0.3 | | | $ | 5.4 | | |
| State and local income taxes, net of federal tax effect | State and local income taxes, net of federal tax effect | 2.0 | | | (0.2) | | | 0.6 | | |
| State and local income taxes, net of federal tax effect | |
| State and local income taxes, net of federal tax effect | |
| Foreign operations, less applicable foreign tax credits (1) | Foreign operations, less applicable foreign tax credits (1) | 4.0 | | | 3.1 | | | 5.4 | | |
| Impact of the CARES Act (2) | — | | | — | | | (11.7) | | |
| Contingent consideration (3) | 0.9 | | | — | | | — | | |
| Valuation allowance provisions and adjustments (4) | 1.0 | | | (2.7) | | | 0.4 | | |
| Goodwill impairment charge (5) | — | | | — | | | 3.4 | | |
| COLI income (6) | (0.4) | | | (1.3) | | | (2.7) | | |
| Impact of change to non-U.S. federal statutory tax rates (7) | (0.1) | | | (0.3) | | | 0.4 | | |
| Foreign operations, less applicable foreign tax credits (1) | |
| Foreign operations, less applicable foreign tax credits (1) | |
| Contingent consideration (2) | |
| Contingent consideration (2) | |
| Contingent consideration (2) | |
| Valuation allowance provisions and adjustments (3) | |
| Valuation allowance provisions and adjustments (3) | |
| Valuation allowance provisions and adjustments (3) | |
| COLI income (4) | |
| COLI income (4) | |
| COLI income (4) | |
| Impact of change to non-U.S. federal statutory tax rates (5) | |
| Impact of change to non-U.S. federal statutory tax rates (5) | |
| Impact of change to non-U.S. federal statutory tax rates (5) | |
| Officer compensation limitation | |
| Officer compensation limitation | |
| Officer compensation limitation | Officer compensation limitation | 1.0 | | | 1.3 | | | 1.9 | | |
| Research tax credit | Research tax credit | (2.9) | | | (2.4) | | | (3.0) | | |
| Research tax credit | |
| Research tax credit | |
| Other U.S. domestic tax credits | |
| Other U.S. domestic tax credits | |
| Other U.S. domestic tax credits | Other U.S. domestic tax credits | (0.3) | | | (0.7) | | | (0.3) | | |
| Stock compensation | Stock compensation | 0.4 | | | 0.3 | | | 0.1 | | |
| Stock compensation | |
| Stock compensation | |
| Other | |
| Other | |
| Other | Other | (0.1) | | | 0.2 | | | (0.1) | | |
| Total income tax expense (benefit) recognized | Total income tax expense (benefit) recognized | $ | 16.3 | | | $ | (2.4) | | | $ | (0.2) | | |
| Total income tax expense (benefit) recognized | |
| Total income tax expense (benefit) recognized | |
________________________
STEELCASE INC.
NOTES TO THE CONSOLIDATED FINANCIAL STATEMENTS—(Continued)
(1)The foreign operations, less applicable foreign tax credits, amounts include the rate differential between local statutory rates and the U.S. rate on foreign operations.
(2)In Q1 2021, the U.S. government enacted the Coronavirus Aid, Relief and Economic Security Act (the "CARES Act"), which enabled companies to carry back tax losses to years prior to the enactment of the Tax Cuts and Jobs Act when the federal statutory income tax rate was 35%.
(3)In 2023,2024, we recorded an increasea decrease in the fair value of the contingent consideration liability related to the acquisition of Viccarbe, which is nontaxable. In 2023, we recorded an increase in the fair value of this liability, which is non-deductible for tax purposes.
(4)(3)The valuation allowance provisions and adjustments are based on current year activity, which are further detailed below.
(5)We recorded a goodwill impairment charge related to our Orangebox U.K. reporting unit which is non-deductible for tax purposes.
(6)(4)The increase in the cash surrender value of COLI policies, net of normal insurance expenses, plus maturity benefits are non-taxable.
(7)(5)Changes to the statutory tax rates in 2023 and 2022, primarily in the U.K. and France, resulted in the revaluation of certain deferred tax assets in those jurisdictions.
STEELCASE INC.
NOTES TO THE CONSOLIDATED FINANCIAL STATEMENTS—(Continued)
Deferred Income Taxes
The significant components of deferred income taxes are as follows:
| | Deferred Income Taxes | Deferred Income Taxes | February 24,
2023 | February 25,
2022 | Deferred Income Taxes | February 23,
2024 | February 24,
2023 |
| Deferred income tax assets: | Deferred income tax assets: | |
| Employee benefit plan obligations and deferred compensation | Employee benefit plan obligations and deferred compensation | $ | 52.5 | | | $ | 51.6 | | |
| Employee benefit plan obligations and deferred compensation | |
| Employee benefit plan obligations and deferred compensation | |
| Operating lease obligations | |
| Operating lease obligations | |
| Operating lease obligations | Operating lease obligations | 55.0 | | | 58.4 | | |
| Foreign and domestic net operating loss carryforwards | Foreign and domestic net operating loss carryforwards | 35.8 | | | 40.2 | | |
| Reserves and accruals | 18.0 | | | 16.1 | | |
| Foreign and domestic net operating loss carryforwards | |
| Foreign and domestic net operating loss carryforwards | |
| Capitalized research expenditures | |
| Capitalized research expenditures | |
| Capitalized research expenditures | |
| Reserves and allowances | |
| Reserves and allowances | |
| Reserves and allowances | |
| Tax credit carryforwards | Tax credit carryforwards | 17.9 | | | 26.2 | | |
| Tax credit carryforwards | |
| Tax credit carryforwards | |
| | Other, net | |
| | Other, net | |
| | Other, net | Other, net | 14.4 | | | 14.7 | | |
| Total deferred income tax assets | Total deferred income tax assets | 193.6 | | | 207.2 | | |
| Total deferred income tax assets | |
| Total deferred income tax assets | |
| Valuation allowances | |
| Valuation allowances | |
| Valuation allowances | Valuation allowances | (4.3) | | | (3.7) | | |
| Net deferred income tax assets | Net deferred income tax assets | 189.3 | | | 203.5 | | |
| Net deferred income tax assets | |
| Net deferred income tax assets | |
| Deferred income tax liabilities: | |
| Deferred income tax liabilities: | |
| Deferred income tax liabilities: | Deferred income tax liabilities: | | | | |
| Right-of-use operating lease assets | Right-of-use operating lease assets | 50.9 | | | 54.1 | | |
| Right-of-use operating lease assets | |
| Right-of-use operating lease assets | |
| Property, plant and equipment | |
| Property, plant and equipment | |
| Property, plant and equipment | Property, plant and equipment | 28.9 | | | 26.5 | | |
| Intangible assets | Intangible assets | 0.2 | | | 11.7 | | |
| Intangible assets | |
| Intangible assets | |
| Total deferred income tax liabilities | |
| Total deferred income tax liabilities | |
| Total deferred income tax liabilities | Total deferred income tax liabilities | 80.0 | | | 92.3 | | |
| Net deferred income taxes | Net deferred income taxes | $ | 109.3 | | | $ | 111.2 | | |
| Net deferred income taxes | |
| Net deferred income taxes | |
| Net deferred income taxes is comprised of the following components: | |
| Net deferred income taxes is comprised of the following components: | |
| Net deferred income taxes is comprised of the following components: | Net deferred income taxes is comprised of the following components: | | | | |
| | Deferred income tax assets—non-current | Deferred income tax assets—non-current | 117.3 | | | 121.2 | | |
| | Deferred income tax assets—non-current | |
| | Deferred income tax assets—non-current | |
| | Deferred income tax liabilities—non-current | Deferred income tax liabilities—non-current | 8.0 | | | 10.0 | | |
| | Deferred income tax liabilities—non-current | |
| | Deferred income tax liabilities—non-current | |
As of February 24, 2023,23, 2024, the valuation allowanceallowances of $4.3$6.2 related to foreign deferred tax assets. In updating our assessment of the realizability of deferred tax assets, we considered the following factors:
•recent financial performance, including cumulative losses where applicable,
•the predictability of future income during the relevant carryforward period,
•prudent and feasible tax planning strategies that could be implemented to protect the loss ofutilize the deferred tax assets and
•the effect of reversing taxable temporary differences.
Based on our evaluation of these factors, particularly cumulative losses, we were unable to assert that it is more likely than not that the deferred tax assets in some of our owned dealersa manufacturing facility in China and sales offices in France, Australia, Morocco and Hong Kong and Morocco would be realized as of February 24, 2023. During 2022, we formalized a plan to enable the utilization of certain of our excess U.S. foreign tax credits, which had previously been subject to a valuation allowance. This resulted in the reversal of the related valuation allowance by $3.1.
STEELCASE INC.
NOTES TO THE CONSOLIDATED FINANCIAL STATEMENTS—(Continued)
23, 2024.We have the ability to repatriate foreign subsidiary earnings to our U.S. parent without incurring additional U.S. federal income tax.tax beyond foreign currency exchange impacts. We have recorded deferred income taxes related to withholding and other taxes where appropriate on earnings of subsidiaries not expected to be permanently reinvested. However, we have not recorded deferred taxes on any remaining historical outside basis differences in non-U.S. subsidiaries, as we continue to assert indefinite reinvestment on those basis differences.
STEELCASE INC.
NOTES TO THE CONSOLIDATED FINANCIAL STATEMENTS—(Continued)
Taxes Payable or Receivable
Income taxes currently payable or receivable are reported on the Consolidated Balance Sheets as follows:
| | Income Taxes | Income Taxes | February 24,
2023 | February 25,
2022 | Income Taxes | February 23,
2024 | February 24,
2023 |
| Other current assets: | Other current assets: | |
| Income taxes receivable | Income taxes receivable | $ | 5.3 | | | $ | 41.7 | | |
| Income taxes receivable | |
| Income taxes receivable | |
| | Accrued expenses: | | | | |
| Other current liabilities: | |
| | Other current liabilities: | |
| | Other current liabilities: | |
| Income taxes payable | Income taxes payable | $ | 4.8 | | | $ | 7.6 | | |
| Income taxes payable | |
| Income taxes payable | |
Net Operating Loss and Tax Credit Carryforwards
Operating loss and tax credit carryforwards expire as follows:
| | Fiscal Year Ending February | Fiscal Year Ending February | Net Operating Loss
Carryforwards (Gross) | Net Operating Loss
Carryforwards (Tax Effected) | Tax Credit
Carryforwards | Fiscal Year Ending February | Net Operating Loss
Carryforwards (Gross) | Net Operating Loss
Carryforwards (Tax Effected) | Tax Credit
Carryforwards |
| Federal | State | International | Federal | State | International | Total | Federal | State | International | Federal | State | International | Total |
| 2024 | $ | — | | | $ | — | | | $ | — | | | $ | — | | | $ | — | | | $ | — | | | $ | — | | | $ | — | | |
| | 2025-2043 | 0.8 | | | 45.8 | | | 3.0 | | | 0.2 | | | 2.6 | | | 0.7 | | | 3.5 | | | 17.9 | | |
| 2025 | |
| 2026-2044 | |
| 2026-2044 | |
| 2026-2044 | |
| No expiration | No expiration | — | | | 6.8 | | | 128.9 | | | — | | | 0.4 | | | 32.6 | | | 33.0 | | | — | | |
| $ | 0.8 | | | $ | 52.6 | | | $ | 131.9 | | | 0.2 | | | 3.0 | | | 33.3 | | | 36.5 | | | 17.9 | | |
| No expiration | |
| No expiration | |
| $ | |
| $ | |
| $ | |
| Valuation allowances | |
| Valuation allowances | |
| Valuation allowances | Valuation allowances | | | | | | | — | | | — | | | (3.1) | | | (3.1) | | | — | | |
| Net benefit | Net benefit | | $ | 0.2 | | | $ | 3.0 | | | $ | 30.2 | | | $ | 33.4 | | | $ | 17.9 | | |
| Net benefit | |
| Net benefit | |
Future tax benefits for net operating loss and tax credit carryforwards are recognized to the extent that realization of these benefits is considered more likely than not. It is considered more likely than not that a benefit of $51.3$41.8 will be realized on these net operating loss and tax credit carryforwards. This determination is based on the expectation that related operations will be sufficiently profitable or various tax, business and other planning strategies available to us will enable utilization of the carryforwards. We assess the available positive and negative evidence to estimate if sufficient future taxable income will be generated to utilize the existing deferred tax assets. Valuation allowances are recorded to the extent realization of these carryforwards is not more likely than not.
Uncertain Tax Positions
We are subject to taxation in the U.S. and various states and foreign jurisdictions with varying statutes of limitation. Tax years that remain subject to examination by major tax jurisdictions include: the U.S. 20222023 and 2023,2024, Canada 2020 through 2023,2024, France 2020 through 20232024 and Germany 2015 through 2023.2024. We adjust these reserves, as well as the related interest and penalties, in light of changing facts and circumstances.
We are audited by the U.S. Internal Revenue Service under the Compliance Assurance Process (“CAP”). Under CAP, the U.S. Internal Revenue Service works with large business taxpayers to identify and resolve issues prior to the filing of a tax return. Accordingly, we record minimal liabilities for U.S. federal uncertain tax positions.
We recognize interest and penalties associated with uncertain tax positions in income tax expense (benefit), and these amounts were not material in 2024, 2023 2022 or 2021.2022.
STEELCASE INC.
NOTES TO THE CONSOLIDATED FINANCIAL STATEMENTS—(Continued)
A reconciliation of the beginning and ending balances of unrecognized tax benefits is as follows:
| | Unrecognized Tax Benefits | Unrecognized Tax Benefits | Year Ended | Unrecognized Tax Benefits | Year Ended |
February 24,
2023 | February 25,
2022 | February 26,
2021 | February 23,
2024 | February 24,
2023 | February 25,
2022 |
| Balance as of beginning of period | Balance as of beginning of period | $ | 2.1 | | | $ | 2.3 | | | $ | 2.0 | | |
| | Gross decreases—tax positions in prior period | Gross decreases—tax positions in prior period | — | | | — | | | — | | |
| | Gross decreases—tax positions in prior period | |
| | Gross decreases—tax positions in prior period | |
| | Currency translation adjustment | |
| | Currency translation adjustment | |
| | Currency translation adjustment | Currency translation adjustment | (0.1) | | | (0.2) | | | 0.3 | | |
| Balance as of end of period | Balance as of end of period | $ | 2.0 | | | $ | 2.1 | | | $ | 2.3 | | |
| Balance as of end of period | |
| Balance as of end of period | |
We have taken tax positions in a non-U.S. jurisdiction that do not meet the more likely than not test required under the uncertain tax position accounting guidance. Since the tax positions have increased net operating loss carryforwards, the underlying deferred tax asset is shown net of a $2.0 liability for uncertain tax positions as of February 24, 2023.23, 2024. No other material amounts are recorded as a liability for uncertain tax positions, including interest and penalties, on the Consolidated Balance Sheets.
Unrecognized tax benefits of $2.0, if favorably resolved, would be recorded as an income tax benefit. We do not expect the amount of unrecognized tax benefits to significantly change due to expiring statutes or audit activity in the next twelve months.
17.SHARE-BASED COMPENSATION
The Steelcase Inc. Incentive Compensation Plan (the “Incentive Compensation Plan”) provides for the issuance of share-based compensation awards to employees and members of our Board of Directors. As of February 24, 2023,23, 2024, there were 4,173,8145,179,745 shares of Class A Common Stock authorized for future issuance under the Incentive Compensation Plan.
A variety of awards may be granted under the Incentive Compensation Plan, including stock options, stock appreciation rights, restricted stock, restricted stock units, performance shares, performance units, cash-based awards, phantom shares and other share-based awards. Our Board of Directors may amend or terminate the Incentive Compensation Plan at its discretion subject to certain provisions as stipulated within the plan.
In the event of a "change in control", as defined in the Incentive Compensation Plan,
•any performance-based conditions imposed on outstanding awards will be deemed to be, immediately prior to the change in control, the greater of (1) the applicable performance achieved through the date of the change in control or (2) the target level of performance; and
•all restrictions imposed on all outstanding awards of restricted stock units and performance units will lapse if either (1) the awards are assumed by an acquirer or successor and the awardee experiences a qualifying termination during the two-year period following the change in control or (2) the awards are not assumed by an acquirer or successor.
Share-based awards currently outstanding under the Incentive Compensation Plan as of February 23, 2024 are as follows:
| | | | | | | | |
| Total Outstanding Awards | February 24,23,
20232024 |
| Performance units (1) | 1,060,2311,299,988 | | |
| Restricted stock units | 3,293,2683,151,634 | | |
| Total outstanding awards | 4,353,4994,451,622 | | |
________________________
(1)This amount includesrepresents the maximum number of shares that may be issued under outstanding performance unit awards; however, the actual number of shares which may be issued will be determined based on the satisfaction of certain conditions, and therefore may be significantly lower.
STEELCASE INC.
NOTES TO THE CONSOLIDATED FINANCIAL STATEMENTS—(Continued)
Performance Units
PerformanceIn 2024, 2023 and 2022, we issued performance units ("PSUs") to certain employees which are earned afterover a three-year performance period based on performance conditions established annually by the Compensation Committee within the first three months of the applicable fiscal year, as follows:
•767,600 PSUs to be earned over the period of 2024 through 2026 (the "2024 PSUs"),
•428,700 PSUs to be earned over the period of 2023 through 2025 (the "2023 PSUs") and
•448,300 PSUs to be earned over the period of 2022 through 2024 (the "2022 PSUs").
The number of PSUs earned is modified based on achievement of certain total shareholder return results relative to a comparison group of companies, which is a market condition. When the performance conditions for a fiscal year are established, one-third of the PSUs issued are considered granted. Therefore, each of the three fiscal years within the performance period is considered an individual tranche of the award (referred to as "Tranche 1," "Tranche 2" and only to"Tranche 3," respectively).
As of February 23, 2024, the extent2024 PSUs, 2023 PSUs and 2022 PSUs were considered granted as follows:
•In 2024, the performance conditions were established for Tranche 1 of the 2024 PSUs, Tranche 2 of the 2023 PSUs and Tranche 3 of the 2022 PSUs, and accordingly, such tranches were considered granted in 2024.
•In 2023, the performance conditions were established for Tranche 1 of the 2023 PSUs and Tranche 2 of the 2022 PSUs, and accordingly, such tranches were considered granted in 2023.
•In 2022, the performance conditions were established for Tranche 1 of the 2022 PSUs, and accordingly, such tranche was considered granted in 2022.
Once granted, the PSUs are expensed and recorded in Additional paid-in capital on the Consolidated Balance Sheets over the remaining performance period. The expense for PSUs is determined based on the probability that the performance conditions stated inwill be met, and if applicable, the applicable awardfair value of the market condition on the grant date. For participants who are achieved. After completion ofor become retirement-eligible during the performance period, the number of PSUs earned will be issued as shares of Class A Common Stock. The aggregate number of shares of Class A Common Stock that ultimately may be issued under PSUs that have been granted whereare expensed over the performance period has not been completed ranged from 0 to 1,060,231 shares as of February 24, 2023.ending on the date the participant becomes retirement-eligible. The awards will be forfeited if a participant leaves the company for reasons other than retirement, disability or death or if the participant engages in any competition with us, as defined in the Incentive Compensation Plan.
We used the Monte Carlo simulation model to calculate the fair value of the market conditions on the respective grant dates, which resulted in a total fair value of $4.5, $3.5 and $2.3 for the PSUs with market conditions granted in 2024, 2023 and 2022, respectively. The Monte Carlo simulation was computed using the following assumptions:
| | | | | | | | | | | | | | | | | | | | | | | | | | | | | | | | | | | | | | |
| 2024 PSUs | 2023 PSUs | 2022 PSUs |
| Tranche 1 | Tranche 2 | Tranche 1 | Tranche 3 | Tranche 2 | Tranche 1 |
| Risk-free interest rate (1) | 3.7 | % | | 4.0 | % | | 2.6 | % | | 4.7 | % | | 2.3 | % | | 0.3 | % | |
| Expected term | 3 years | | 2 years | | 3 years | | 1 year | | 2 years | | 3 years | |
| Estimated volatility (2) | 44.1 | % | | 37.8 | % | | 52.2 | % | | 45.5 | % | | 43.8 | % | | 53.5 | % | |
________________________
(1)Based on the U.S. Government bond benchmark on the grant date.
(2)Represents the historical price volatility of our Class A Common Stock for the period prior to the grant date which is equivalent to the expected term of the tranche.
STEELCASE INC.
NOTES TO THE CONSOLIDATED FINANCIAL STATEMENTS—(Continued)
The Monte Carlo simulation resulted in the following weighted-average grant date fair values per PSU with market conditions:
| | | | | | | | | | | | | | | | | | | | |
| Grant Date Fair Value per PSU | Year Ended |
February 23,
2024 | February 24,
2023 | February 25,
2022 |
| Weighted-average grant date fair value per share of PSUs granted under Monte Carlo | $ | 8.30 | | | $ | 11.13 | | | $ | 14.38 | | |
The total PSU expense and associated tax benefit recorded in 2024, 2023 and 2022 are as follows:
| | | | | | | | | | | | | | | | | | | | |
| Performance Units | Year Ended |
February 23,
2024 | February 24,
2023 | February 25,
2022 |
| Expense | $ | 6.7 | | | $ | 3.2 | | | $ | 1.6 | | |
| Tax benefit | 1.7 | | | 0.8 | | | 0.4 | | |
After completion of the performance period, the number of PSUs earned will be issued as shares of Class A Common Stock. Based on actual results, the 2022 PSUs were earned at 84.5% of the target level, as modified, and 378,811 shares of Class A Common Stock were issued to participants under such awards. The aggregate number of shares of Class A Common Stock that ultimately may be issued under PSUs that have been granted where the performance period has not been completed ranged from 0 to 1,299,988 shares as of February 23, 2024.
A dividend equivalent is calculated based on the actual number of PSUs earned at the end of the performance period equal to the dividends that would have been payable on the earned PSUs had they been held during the entire performance period as Class A Common Stock. At the end of the performance period, the dividend equivalents are paid in the form of cash.
The expense for PSUs is determined based on the probability that the performance conditions will be met, and if applicable, the fair value of the market condition on the grant date. The PSUs are expensed and recorded in Additional paid-in capital on the Consolidated Balance Sheets over the remaining performance period. For participants who are or become retirement-eligible during the performance period, the PSUs are expensed over the period ending on the date the participant becomes retirement-eligible.
In 2023, 2022 and 2021, we issued PSUs to certain employees as follows:
•428,700 PSUs to be earned over the period of 2023 through 2025 (the "2023 PSUs"),
•448,300 PSUs to be earned over the period of 2022 through 2024 (the "2022 PSUs") and
•529,500 PSUs to be earned over the period of 2021 through 2023 (the "2021 PSUs").
These PSUs are earned based on performance conditions established annually by the Compensation Committee within the first three months of each applicable fiscal year. The PSUs are then modified based on achievement of certain total shareholder return results relative to a comparison group of companies, which is a market condition. When the performance conditions for a fiscal year are established, or if the performance conditions involve a qualitative assessment and such assessment has been made, one-third of the PSUs issued are considered granted. Therefore, each of the three fiscal years within the performance period is considered an individual tranche of the award (referred to as "Tranche 1," "Tranche 2" and "Tranche 3," respectively).
As of February 24, 2023, the 2023 PSUs, 2022 PSUs and 2021 PSUs were considered granted as follows:
•In 2023, the performance conditions were established for Tranche 1 of the 2023 PSUs, Tranche 2 of the 2022 PSUs and Tranche 3 of the 2021 PSUs, and accordingly, such tranches were considered granted in 2023.
•In 2022, the performance conditions were established for Tranche 1 of the 2022 PSUs and Tranche 2 of the 2021 PSUs, and accordingly, such tranches were considered granted in 2022.
•In 2021, the performance conditions were established for Tranche 1 of the 2021 PSUs, and accordingly, such tranche was considered granted in 2021.
Based on actual results, the 2021 PSUs were earned at 54% of the target level, as modified, and 285,930 shares of Class A Common Stock were issued to participants under such awards.
STEELCASE INC.
NOTES TO THE CONSOLIDATED FINANCIAL STATEMENTS—(Continued)
We used the Monte Carlo simulation model to calculate the fair value of the market conditions on the respective grant dates, which resulted in a total fair value of $5.2, $4.8 and $2.3 for the PSUs with market conditions granted in 2023, 2022 and 2021, respectively. The Monte Carlo simulation was computed using the following assumptions:
| | | | | | | | | | | | | | | | | | | | | | | | | | | | | | | | | | | | | | |
| FY23 Award | FY22 Award | FY21 Award |
| Tranche 1 | Tranche 2 | Tranche 1 | Tranche 3 | Tranche 2 | Tranche 1 |
| Risk-free interest rate (1) | 2.6 | % | | 2.3 | % | | 0.3 | % | | 1.6 | % | | 0.2 | % | | 0.2 | % | |
| Expected term | 3 years | | 2 years | | 3 years | | 1 year | | 2 years | | 2 years | |
| Estimated volatility (2) | 52.2 | % | | 43.8 | % | | 53.5 | % | | 28.7 | % | | 61.3 | % | | 58.1 | % | |
________________________
(1)Based on the U.S. Government bond benchmark on the grant date.
(2)Represents the historical price volatility of our Company’s Class A Common Stock for the three-year period preceding the grant date.
The Monte Carlo simulation resulted in the following weighted-average grant date fair values per PSU with market conditions:
| | | | | | | | | | | | | | | | | | | | |
| Grant Date Fair Value per PSU | Year Ended |
February 24,
2023 | February 25,
2022 | February 26,
2021 |
| Weighted-average grant date fair value per share of PSUs granted under Monte Carlo | $ | 11.13 | | | $ | 14.38 | | | $ | 13.29 | | |
The total PSU expense and associated tax benefit recorded in 2023, 2022 and 2021 are as follows:
| | | | | | | | | | | | | | | | | | | | |
| Performance Units | Year Ended |
February 24,
2023 | February 25,
2022 | February 26,
2021 |
| Expense | $ | 3.2 | | | $ | 1.6 | | | $ | 7.7 | | |
| Tax benefit | 0.8 | | | 0.4 | | | 2.0 | | |
The 2023 PSU activity is as follows:
| | Maximum Number of Nonvested Units | Total | Weighted-Average
Grant Date
Fair Value per Unit |
| Nonvested as of February 25, 2022 | 1,205,833 | | | $ | 14.21 | | |
| Maximum Number of Shares of Nonvested Units | | Maximum Number of Shares of Nonvested Units | Total | Weighted-Average
Grant Date
Fair Value per Unit |
| Nonvested as of February 24, 2023 | |
| Granted | |
| Granted | |
| Granted | Granted | 1,125,192 | | | 11.13 | | |
| Vested | Vested | (1,270,794) | | | 12.40 | | |
| Vested | |
| Vested | |
| | Performance adjustments (1) | |
| | Nonvested as of February 24, 2023 | 1,060,231 | | | $ | 13.11 | | |
| Performance adjustments (1) | |
| | Performance adjustments (1) | |
| Nonvested as of February 23, 2024 | |
| Nonvested as of February 23, 2024 | |
| Nonvested as of February 23, 2024 | |
________________________
(1)This amount represents the difference between the maximum number of shares that could have been issued for the 2022 PSUs and the number of shares actually earned based on final performance, as modified.
As of February 24, 2023,23, 2024, there was $1.2$2.1 of remaining unrecognized compensation expense related to nonvested PSUs, which is expected to be recognized over a remaining weighted-average period of 1.41.6 years.
The total fair value of PSUs vested during 2024, 2023 and 2022 was $4.9, $2.1 and 2021 was $2.1, $2.5, and $6.4, respectively. The fair value was determined based upon the closing price of shares of our Class A Common Stock on the date that the Compensation Committee certified the awards.
STEELCASE INC.
NOTES TO THE CONSOLIDATED FINANCIAL STATEMENTS—(Continued)
Restricted Stock Units
During 2023,2024, we awarded 1,241,5991,786,505 restricted stock units ("RSUs") to certain employees. RSUs have restrictions on transfer which lapse oneup to three years after the date of grant, at which time RSUs are issued as unrestricted shares of Class A Common Stock. Typically, these awards will be forfeited if a participant leaves the company for reasons other than retirement, disability or death or if the participant engages in any competition with us, as defined in the Incentive Compensation Plan. RSUs are expensed and recorded in Additional paid-in capital on the Consolidated Balance Sheets over the requisite service period based on the value of the shares on the grant date. For participants who are or become retirement-eligible during the service period for awards that are considered retirement-eligible, the RSUs are expensed over the period ending on the date that the participant becomes retirement-eligible. Typically, these awards will be forfeited if a participant leaves the company for reasons other than retirement, disability or death or if the participant engages in any competition with us, as defined in the Incentive Compensation Plan.
The weighted-average grant date fair value per share of RSUs granted in 2024, 2023 2022 and 20212022 is as follows:
| | Grant Date Fair Value per Share | Grant Date Fair Value per Share | Year Ended | Grant Date Fair Value per Share | Year Ended |
February 24,
2023 | February 25,
2022 | February 26,
2021 | February 23,
2024 | February 24,
2023 | February 25,
2022 |
| Weighted-average grant date fair value per share of RSUs granted | Weighted-average grant date fair value per share of RSUs granted | $ | 10.63 | | | $ | 13.08 | | | $ | 9.49 | | |
The total RSU expense and associated tax benefit recorded in 2024, 2023 2022 and 20212022 are as follows:
| | Restricted Stock Units | Restricted Stock Units | Year Ended | Restricted Stock Units | Year Ended |
February 24,
2023 | February 25,
2022 | February 26,
2021 | February 23,
2024 | February 24,
2023 | February 25,
2022 |
| Expense | Expense | $ | 17.6 | | | $ | 13.7 | | | $ | 12.4 | | |
| Tax benefit | Tax benefit | 4.4 | | | 3.5 | | | 3.1 | | |
| Tax benefit | |
| Tax benefit | |
Holders of RSUs receive cash dividends equal to the dividends we declare and pay on our Class A Common Stock, which are included in Dividends paid in the Consolidated Statements of Cash Flows. The 20232024 RSU activity is as follows:
| | Nonvested Units | Nonvested Units | Total | Weighted-Average
Grant Date
Fair Value
per Share | Nonvested Units | Total | Weighted-Average
Grant Date
Fair Value
per Share |
| Nonvested as of February 25, 2022 | 3,445,438 | | | $ | 11.86 | | |
| Nonvested as of February 24, 2023 | |
| Granted | |
| Granted | |
| Granted | Granted | 1,241,599 | | | 10.63 | | |
| Vested | Vested | (1,309,344) | | | 10.05 | | |
| Vested | |
| Vested | |
| Forfeited | Forfeited | (84,425) | | | 12.48 | | |
| Nonvested as of February 24, 2023 | 3,293,268 | | | $ | 12.11 | | |
| Forfeited | |
| Forfeited | |
| Nonvested as of February 23, 2024 | |
| Nonvested as of February 23, 2024 | |
| Nonvested as of February 23, 2024 | |
As of February 24, 2023,23, 2024, there was $13.3$9.4 of remaining unrecognized compensation expense related to RSUs, which is expected to be recognized over a weighted-average period of 1.41.8 years.
The total fair value of RSUs vested was $10.1,$23.2, $10.1 and $10.7$10.1 during 2024, 2023 2022 and 2021,2022, respectively. The fair value was determined based upon the closing price of shares of our Class A Common Stock on the dates the awards vested.
Unrestricted Share Grants
Under the Incentive Compensation Plan, unrestricted shares of our Class A Common Stock may be issued to members of our Board of Directors as compensation for director’s fees. We granted a total of 131,013, 109,090 61,360 and 64,10761,360 unrestricted shares at a weighted average grant date fair value per share of $8.53, $9.67 and $13.81 during 2024, 2023 and $12.21 during 2023, 2022, and 2021, respectively.
STEELCASE INC.
NOTES TO THE CONSOLIDATED FINANCIAL STATEMENTS—(Continued)
18.LEASES
We have operating leases for corporate offices, sales offices, showrooms, manufacturing and distribution facilities, vehicles and equipment that expire at various dates through 2036.2035. Certain lease agreements include contingent rental payments based on per unit usage over contractual levels (e.g., miles driven or machine hours operated) and others include rental payments adjusted periodically for inflationary indexes. Additionally, some leases include options to renew or terminate the leases which can be exercised at our discretion.
The components of lease expense are as follows:
| | Year Ended |
February 24,
2023 | February 25,
2022 | February 26,
2021 |
| Year Ended | | | Year Ended |
| February 23,
2024 | February 24,
2023 | February 25,
2022 |
| Operating lease cost | Operating lease cost | $ | 51.9 | | | $ | 53.2 | | | $ | 51.8 | | |
| Sublease rental income | Sublease rental income | (2.2) | | | (2.0) | | | (2.4) | | |
| $ | 49.7 | | | $ | 51.2 | | | $ | 49.4 | | |
| Sublease rental income | |
| Sublease rental income | |
| $ | |
| $ | |
| $ | |
Supplemental cash flow and other information related to leases is as follows:
| | Year Ended |
February 24,
2023 | February 25,
2022 | February 26,
2021 |
| Year Ended | | | Year Ended |
| February 23,
2024 | February 24,
2023 | February 25,
2022 |
| Cash flow information: | Cash flow information: | |
| Operating cash flows used for operating leases | Operating cash flows used for operating leases | $ | 53.1 | | | $ | 54.1 | | | $ | 50.4 | | |
| Operating cash flows used for operating leases | |
| Operating cash flows used for operating leases | |
| Leased assets obtained in exchange for new operating lease obligations | Leased assets obtained in exchange for new operating lease obligations | $ | 39.1 | | | $ | 33.1 | | | $ | 21.8 | | |
| Leased assets obtained in exchange for new operating lease obligations | |
| Leased assets obtained in exchange for new operating lease obligations | |
As of as ofFebruary 23, 2024 and February 24, 2023, and February 25, 2022, the weighted-average remaining lease terms were 5.34.8 years and 5.95.3 years, respectively, and the weighted-average discount rates were 4.2%4.8% and 3.5%4.2%, respectively.
The following table summarizes the future minimum lease payments as of February 24, 2023:23, 2024:
| | Fiscal year ending in February | Amount (1) |
| 2024 | $ | 52.5 | | |
| Fiscal Year Ending in February | | Fiscal Year Ending in February | Amount (1) |
| 2025 | 2025 | 51.4 | | |
| 2026 | 2026 | 41.2 | | |
| 2026 | |
| 2026 | |
| 2027 | |
| 2027 | |
| 2027 | 2027 | 32.8 | | |
| 2028 | 2028 | 24.3 | | |
| 2028 | |
| 2028 | |
| 2029 | |
| 2029 | |
| 2029 | |
| Thereafter | |
| Thereafter | |
| Thereafter | Thereafter | 38.3 | | |
| Total lease payments | Total lease payments | 240.5 | | |
| Less interest | 25.9 | | |
| Total lease payments | |
| Total lease payments | |
| Less: Interest | |
| Less: Interest | |
| Less: Interest | |
| Present value of lease liabilities | Present value of lease liabilities | $ | 214.6 | | |
| Present value of lease liabilities | |
| Present value of lease liabilities | |
(1)Lease payments include options to extend lease terms that are reasonably certain of being exercised. The payments exclude legally binding minimum lease payments for leases signed but not yet commenced.
STEELCASE INC.
NOTES TO THE CONSOLIDATED FINANCIAL STATEMENTS—(Continued)
19.ACQUISITIONS
Viccarbe
In Q3 2022, we acquired Viccarbe, a Spanish designer of contemporary furniture for high-performance collaborative and social spaces. The transaction included the purchase of all the outstanding capital stock of Viccarbe for $34.9 (or €30.0) in an all-cash transaction using cash on-hand. Up to an additional $13.8$14.1 (or €13.0) is payable to the sellers based upon the achievement of certain revenue and operating income targets over a three-year period. This amount was considered to be contingent consideration and was treated for accounting purposes as part of the total purchase price of the acquisition. At each reporting date, the contingent consideration liability is remeasured, and changes to the fair value are recognized in Operating expenses. As of February 24, 2023,23, 2024, the fair value of the contingent consideration was $9.5 (or €9.0).$0.0. See Note 7 for additional information. An additional amount of $6.4up to $6.5 (or €6.0) is also payable to the sellers based upon the achievement of certain milestones and continued employment over a five-year period, which is being estimated and expensed over the service period on a straight-line basis.
Tangible assets and liabilities of Viccarbe were valued as of the acquisition date using a market analysis and intangible assets were valued using a discounted cash flow analysis, which represents a Level 3 measurement. On the acquisition date, we recorded $11.7 related to identifiable intangible assets, $25.8 related to goodwill and $5.1 related to tangible assets. The tangible assets mainly consisted of working capital (primarily accounts receivable, inventory and accounts payable) and property, plant and equipment. Additionally, we recorded a deferred tax liability in the amount of $2.9 associated with the tax basis difference in acquired book assets. The goodwill was recorded in the EMEAInternational segment as of the acquisition date and is not deductible for income tax purposes in Spain. The goodwill resulting from the acquisition is primarily related to the growth potential of Viccarbe and our intention to expand the manufacturing of Viccarbe products in geographic regions outside of EMEAthe International segment and to offer Viccarbe products through our global distribution network. As such, we reallocated a portion of the goodwill to the Americas segment during 2023 based on the relative fair value of the Viccarbe business reported within the Americas segment as of the date of the acquisition. Intangible assets are principally related to the Viccarbe trade name,trademark, dealer relationships and internally developed know-how and designs, which will be amortized over periods ranging from 9 to 13 years from the date of acquisition. As of February 24, 2023, theThe purchase accountingprice allocation for the Viccarbe acquisition was complete.completed during 2023.
The following table summarizes the purchased identified intangible assets and the respective fair value and useful life of each asset at the date of acquisition:
| | | | | | | | | | | | | | |
| Other Intangible Assets |
Useful Life
(Years) | Fair Value |
|
| Trademark | 9.0 | | $ | 4.6 | | |
| Dealer relationships | 13.0 | | 3.8 | | |
| Know-how and designs | 9.0 | | 3.3 | | |
| | | $ | 11.7 | | |
The fair values of the purchased intangible assets are being amortized on a straight-line basis over their useful lives. The following table summarizes the estimated future amortization expense for the next five years as of February 24, 2023:23, 2024:
| | Fiscal Year Ending in February | Fiscal Year Ending in February | Amount | Fiscal Year Ending in February | Amount |
| 2024 | $ | 1.1 | | |
| 2025 | 2025 | 1.1 | | |
| 2026 | 2026 | 1.1 | | |
| 2026 | |
| 2026 | |
| 2027 | |
| 2027 | |
| 2027 | 2027 | 1.1 | | |
| 2028 | 2028 | 1.1 | | |
| $ | 5.5 | | |
| 2028 | |
| 2028 | |
| 2029 | |
| 2029 | |
| 2029 | |
| $ | |
| $ | |
| $ | |
STEELCASE INC.
NOTES TO THE CONSOLIDATED FINANCIAL STATEMENTS—(Continued)
HALCON
In Q2 2023, we acquired HALCON, a Minnesota-based designer and manufacturer of precision-tailored wood furniture for the workplace. The transaction included the purchase of all the outstanding membership interests of HALCON for $127.5 less customer deposits of $24.3, plus an adjustment of $1.9 for working capital. The acquisition was funded using a combination of cash on-hand and borrowings under our global committed bank facility. Up to an additional $7.5 was payable to the sellers based upon the achievement of certain revenue and gross margin targets over a six-month period. This amount was determined to be contingent consideration and was treated for accounting purposes as part of the total purchase price of the acquisition. We used the Monte Carlo simulation model to calculate the fair value of the contingent consideration as of the acquisition date, which represents a Level 3 measurement. Based upon the results of the calculation, we did not record a liability for the contingent consideration, and we were not required to make a payment at the settlement date in 2023. An additional amount of $2.0 is also payable to a seller based upon continued employment over a three-year period, which is being expensed over the service period on a straight-line basis.
Tangible assets and liabilities of HALCON were valued as of the acquisition date using a market analysis, and intangible assets were valued using a discounted cash flow analysis, which represents a Level 3 measurement. On the acquisition date, we recorded $51.8 related to identifiable intangible assets, $36.6 related to goodwill and $16.7 related to tangible assets. The tangible assets mainly consisted of property, plant and equipment of $30.6, working capital (primarily inventory of $12.8) and customer deposits of $24.3. The goodwill was recorded in the Americas segment and is deductible for U.S. income tax purposes. The goodwill resulting from the acquisition is primarily related to the growth potential of HALCON expected to be driven by new product development, geographic expansion and the integration of HALCON products into our dealer network. Intangible assets are principally related to dealer relationships, the HALCON trade nametrademark and internally developed know-how and designs, which are being amortized over periods ranging from 9 to 10 years from the date of acquisition. We also acquired a backlog of orders which shipped throughout 2023. The purchase price allocation for the HALCON acquisition was incomplete as of February 24, 2023. The amounts recognized related to the purchase price allocation will be finalized no later than one year after the acquisition date.completed during 2024.
The following table summarizes the purchased identified intangible assets and the respective fair value and useful life of each asset at the date of acquisition:
| | | | | | | | | | | | | | |
| Other Intangible Assets |
Useful Life
(Years) | Fair Value |
|
| Dealer relationships | 10.0 | | $ | 21.5 | | |
| Trademark | 9.0 | | 14.0 | | |
| Know-how and designs | 9.0 | | 12.0 | | |
| Backlog | 0.7 | | 4.3 | | |
| | | $ | 51.8 | | |
The fair values of the purchased intangible assets are being amortized on a straight-line basis over their useful lives. The following table summarizes the estimated future amortization expense for the next five years as of February 24, 2023:23, 2024:
| | Fiscal Year Ending in February | Fiscal Year Ending in February | Amount | Fiscal Year Ending in February | Amount |
| 2024 | $ | 5.0 | | |
| 2025 | 2025 | 5.1 | | |
| 2026 | 2026 | 5.0 | | |
| 2026 | |
| 2026 | |
| 2027 | |
| 2027 | |
| 2027 | 2027 | 5.0 | | |
| 2028 | 2028 | 5.0 | | |
| $ | 25.1 | | |
| 2028 | |
| 2028 | |
| 2029 | |
| 2029 | |
| 2029 | |
| $ | |
| $ | |
| $ | |
STEELCASE INC.
NOTES TO THE CONSOLIDATED FINANCIAL STATEMENTS—(Continued)
20. REPORTABLE SEGMENTS
OurAs of the end of Q1 2024, we realigned our reportable segments consistfor financial reporting purposes as a result of changes in how we monitor business performance and allocate resources to support our top strategic priorities. During Q1 2024, we simplified our internal reporting to summarize the results of all brands by geography including utilization of previously unallocated Corporate expenses. This change is parallel to the organizational structure that is used by our Chief Executive Officer in the capacity as CODM for making operating and investment decisions and assessing business performance.
The operating segments regularly reviewed by the CODM are (1) the Americas, segment, the EMEA segment and the Other category. Unallocated corporate expenses are reported as Corporate.
The Americas segment serves customers in the U.S., Canada, the Caribbean Islands and Latin America with a comprehensive portfolio of furniture and architectural products marketed to corporate, government, healthcare, education and retail customers through the Steelcase, AMQ, Coalesse, HALCON, Orangebox, Smith System and Viccarbe brands.
The EMEA segment serves customers in(2) Europe, the Middle East and Africa primarily under the Steelcase, Coalesse, Orangebox("EMEA") and Viccarbe brands, with a comprehensive portfolio of furniture and architectural products.
The Other category includes(3) Asia Pacific and Designtex.Pacific. Asia Pacific serves customers in Australia, China, India, Japan, Korea and other countries in Southeast Asia primarily under the Steelcase brand with a comprehensive portfolio of furniture and architectural products. Designtex sells textiles, wall coverings and surface imaging solutions specified by architects and designers directly to end-use customers through a direct sales force primarily in North America.
Asia. We primarily review and evaluate revenue, gross profit and operating income (loss) by segmentthese segments in both our internal review processes and for our external financial reporting. We also allocate resources among these segments primarily based on revenue, gross profit and operating income (loss). Total assets by segment include manufacturing and other assets associated with each segment.
Corporate expenses include unallocated portionsFor purposes of shared service functions suchsegment reporting externally, we have aggregated the EMEA and Asia Pacific operating segments as information technology,an International segment based upon their similarity in quantitative and qualitative characteristics as defined in the Accounting Standards Codification ("ASC") 280, Segment Reporting. We evaluated the economic similarity of these operating segments including patterns and trends for revenue, gross profit and operating income (loss) in addition to the similarity in the nature of products and services, types of customers, and production and distribution processes in these regions. We concluded that these operating segments met the criteria for aggregation consistent with the basic principles and objectives of segment reporting described in ASC 280. The change in our reportable segments did not result in a change to our reporting units for purposes of goodwill impairment testing.
The Americas segment serves customers in the U.S., Canada, the Caribbean Islands and Latin America with a comprehensive portfolio of furniture, architectural, textile and surface imaging products that are marketed to corporate, facilities, finance, human resources, research, legalgovernment, healthcare, education and customer aviation, plus deferred compensation expenseretail customers primarily through the Steelcase, AMQ, Coalesse, Designtex, HALCON, Orangebox, Smith System and income or losses associatedViccarbe brands.
The International segment serves customers in EMEA and Asia Pacific with COLI. Corporate assets consista comprehensive portfolio of furniture and architectural products that are marketed to corporate, government, education and retail customers primarily through the Steelcase, Coalesse, Orangebox, Smith System and Viccarbe brands.
As required by ASC 280, all presented segment data reflects the reclassification of unallocated cash and cash equivalents, COLI, fixed assets, investments in unconsolidated affiliates and right-of-use assets related to operating leases.
| | | | | | | | | | | | | | | | | | | | | | | | | | | | | | | | |
| Operating Segment Data | Americas | EMEA | Other | Corporate | Consolidated |
| 2023 | | | | | | | | | | |
| Revenue | $ | 2,340.8 | | | $ | 610.1 | | | $ | 281.7 | | | $ | — | | | $ | 3,232.6 | | |
| Gross profit | 673.1 | | | 159.2 | | | 87.1 | | | — | | | 919.4 | | |
| Operating income (loss) | 103.8 | | | (3.4) | | | (6.3) | | | (28.6) | | | 65.5 | | |
| Total assets | 1,249.0 | | | 408.9 | | | 211.3 | | | 333.6 | | | 2,202.8 | | |
| Capital expenditures | 29.2 | | | 13.0 | | | 5.3 | | | 11.6 | | | 59.1 | | |
| Depreciation and amortization | 61.8 | | | 20.5 | | | 5.7 | | | 2.0 | | | 90.0 | | |
| 2022 | | | | | | | | | | |
| Revenue | $ | 1,905.0 | | | $ | 598.5 | | | $ | 269.2 | | | $ | — | | | $ | 2,772.7 | | |
| Gross profit | 511.0 | | | 165.9 | | | 84.6 | | | — | | | 761.5 | | |
| Operating income (loss) | 44.4 | | | 3.3 | | | (3.2) | | | (24.4) | | | 20.1 | | |
| Total assets | 1,110.4 | | | 475.2 | | | 227.6 | | | 447.8 | | | 2,261.0 | | |
| Capital expenditures | 26.9 | | | 10.4 | | | 5.7 | | | 17.5 | | | 60.5 | | |
| Depreciation and amortization | 52.0 | | | 22.2 | | | 6.3 | | | 2.7 | | | 83.2 | | |
| 2021 | | | | | | | | | | |
| Revenue | $ | 1,848.5 | | | $ | 511.3 | | | $ | 236.4 | | | $ | — | | | $ | 2,596.2 | | |
| Gross profit | 552.8 | | | 130.9 | | | 79.1 | | | — | | | 762.8 | | |
| Operating income (loss) | 97.0 | | | (32.3) | | | 0.2 | | | (21.9) | | | 43.0 | | |
| Total assets | 1,015.3 | | | 414.4 | | | 211.3 | | | 713.0 | | | 2,354.0 | | |
| Capital expenditures | 17.0 | | | 10.8 | | | 8.7 | | | 4.8 | | | 41.3 | | |
| Depreciation and amortization | 54.2 | | | 22.3 | | | 6.1 | | | 2.6 | | | 85.2 | | |
STEELCASE INC.
NOTES TO THE CONSOLIDATED FINANCIAL STATEMENTS—(Continued)
| | | | | | | | | | | | | | | | | | | | |
| Operating Segment Data | Americas | International | Consolidated |
| 2024 | | | | | | |
| Revenue | $ | 2,419.8 | | | $ | 739.8 | | | $ | 3,159.6 | | |
| Gross profit | 799.1 | | | 213.3 | | | 1,012.4 | | |
| Operating income (loss) | 143.8 | | | (26.0) | | | 117.8 | | |
| Total assets | 1,705.5 | | | 531.2 | | | 2,236.7 | | |
| Capital expenditures | 34.1 | | | 13.0 | | | 47.1 | | |
| Depreciation and amortization | 58.5 | | | 25.1 | | | 83.6 | | |
| 2023 | | | | | | |
| Revenue | $ | 2,436.2 | | | $ | 796.4 | | | $ | 3,232.6 | | |
| Gross profit | 711.6 | | | 207.8 | | | 919.4 | | |
| Operating income (loss) | 77.4 | | | (11.9) | | | 65.5 | | |
| Total assets | 1,631.2 | | | 571.6 | | | 2,202.8 | | |
| Capital expenditures | 41.9 | | | 17.2 | | | 59.1 | | |
| Depreciation and amortization | 64.6 | | | 25.4 | | | 90.0 | | |
| 2022 | | | | | | |
| Revenue | $ | 1,995.1 | | | $ | 777.6 | | | $ | 2,772.7 | | |
| Gross profit | 546.4 | | | 215.1 | | | 761.5 | | |
| Operating income (loss) | 21.2 | | | (1.1) | | | 20.1 | | |
| Total assets | 1,607.1 | | | 653.9 | | | 2,261.0 | | |
| Capital expenditures | 44.4 | | | 16.1 | | | 60.5 | | |
| Depreciation and amortization | 55.6 | | | 27.6 | | | 83.2 | | |
The accounting policies of each of the reportable segments are the same as those described in Note 2.
Reportable geographic information is as follows:
| | Reportable Geographic Data | Reportable Geographic Data | Year Ended | Reportable Geographic Data | Year Ended |
February 24,
2023 | February 25,
2022 | February 26,
2021 | February 23,
2024 | February 24,
2023 | February 25,
2022 |
| Long-lived assets (1): | Long-lived assets (1): | |
| United States | United States | $ | 358.3 | | | $ | 364.2 | | | $ | 390.3 | | |
| United States | |
| United States | |
| Foreign locations | Foreign locations | 216.5 | | | 238.4 | | | 245.9 | | |
| $ | 574.8 | | | $ | 602.6 | | | $ | 636.2 | | |
| Foreign locations | |
| Foreign locations | |
| $ | |
| $ | |
| $ | |
(1)Long-lived assets include property, plant and equipment and right-of-use operating lease assets.
No country other than the U.S. represented greater than 10% of our long-lived assets in 2024, 2023 2022 or 2021.2022.
STEELCASE INC.
NOTES TO THE CONSOLIDATED FINANCIAL STATEMENTS—(Continued)
21. RESTRUCTURING ACTIVITIES
In Q4 2024, we initiated a series of restructuring actions to enhance our long-term operational effectiveness in Asia Pacific. These actions involve the involuntary terminations of approximately 100 positions in Asia Pacific. We expect to incur restructuring costs of approximately $4 in the International segment related to these actions, consisting of cash severance payments, other separation-related benefits, and other related costs. We recorded $2.5 related to employee termination costs and $0.4 related to the impairment of a right-of-use operating lease asset in the International segment for these actions during 2024.We expect these actions to be substantially completed by the end of 2025.
In Q4 2024, we initiated restructuring actions to move a regional distribution center in the Americas segment. These actions involve the involuntary terminations of approximately 50 to 55 positions and the relocation of approximately 15 to 20 positions in the Americas segment. We expect to incur restructuring costs of approximately $3 in the Americas segment related to these actions consisting of cash severance payments, other separation-related benefits, and other related costs. We incurred restructuring costs of $0.7 in the Americas segment for these actions during 2024. We expect these actions to be substantially completed by the end of 2025.
In Q3 2024, we initiated a series of restructuring actions to reallocate production of our product portfolio across our industrial footprint to take advantage of manufacturing centers of excellence. These actions involve the involuntary terminations of approximately 15 positions in the Americas segment. We expect to incur restructuring costs of approximately $2 to $3 in the Americas segment related to these actions consisting of cash severance payments, other separation-related benefits, and other related costs. We incurred restructuring costs of $1.1 in the Americas segment for these actions during 2024. We expect these actions to be substantially completed by the end of 2025.
In Q1 2024, we announced a series of restructuring actions in response to continued decline in order volume, persisting inflationary pressures, and decreasing plant utilization. These actions involve the involuntary terminations of approximately 40 to 50 salaried roles in EMEA, the elimination of approximately 240 positions in Asia Pacific, and the involuntary terminations of approximately 30 employees in the Americas segment in connection with the closing of our regional distribution center in Atlanta, Georgia. We expect to incur restructuring costs of approximately $16 to $18 in the International segment and approximately $1 in the Americas segment related to these actions, consisting of cash severance payments and other separation-related benefits. We incurred restructuring costs of $16.3 in the International segment and $0.5 in the Americas segment for these actions during 2024. These actions are substantially complete.
In Q4 2023, we implementedinitiated a series of restructuring actions, primarily related to the wind down of our customer aviation function in connection with our strategy to reinvent our go-to-market model and create new customer experiences. The restructuring actions included terminations of approximately 2325 salaried employees in the Americas segmentsegment. We incurred $1.0 and Corporate functions. We expect to incur approximately $4.4$3.6 of restructuring costs in the Americas segment related tofor these actions during 2024 and 2023, respectively, consisting of cash severance payments and other separation-related benefits. In Q4 2023, we recorded $3.6 ofThese restructuring costs in the Americas segment for actions initiated in the quarter. We expect these actions to be completed in Q1 2024.are complete.
In Q3 2023, our Board of Directors approved restructuring actions to reduce operational spending across certain functions in response to a decline in order volume and lower-than-expected return-to-office trends in the Americas segment. The restructuring actions included terminations of approximately 130 salaried employees in the Americas segment and Corporate functions.segment. In 2023, we incurred $10.9 of restructuring costs related to these actions in the Americas segment, consisting of cash severance payments and other separation-related benefits. These restructuring actions are complete.
In Q4 2022, our Board of Directors approved restructuring actions related to the exit of our technology business in connection with our strategy to shift from offering a portfolio of technology products toward partnering with technology companies to create integrated collaborative solutions. The restructuring actions primarily included involuntary terminations of the majority of salaried employees of the business and the termination of supplier and customer contracts related to the business. We incurred $4.7 in restructuring costs in the Americas segment related to these actions, primarily consisting of cash severance payments and payment of other business exit costs. In 2023, we recorded $1.8 related to employee termination costs, $2.4 related to business exit and other related costs and $0.5 related to the impairment of a right-of-use operating lease asset which was utilized by our technology business. These restructuring actions are complete.
In 2021, we implemented a series of restructuring actions in response to continued order declines in the Americas compared to the prior year and economic uncertainty related to the COVID-19 pandemic. The restructuring actions included early retirements and voluntary and involuntary terminations of approximately 300 salaried employees and approximately 210 hourly employees. We incurred $28.6 in restructuring costs in the Americas segment in connection with these actions during 2021, consisting of cash severance payments and other separation-related benefits. These restructuring actions are complete.
STEELCASE INC.
NOTES TO THE CONSOLIDATED FINANCIAL STATEMENTS—(Continued)
The following table details the changes in the restructuring reserve balance during the years ended February 24, 20232024 and February 25, 2022:2023:
| | Workforce reductions | Business exit and related costs | Total |
| Balance as of February 26, 2021 | $ | 0.4 | | $ | — | | $ | 0.4 | |
| Payments | (0.4) | | — | | (0.4) | |
| Workforce reductions | | | Workforce reductions | Business exit and related costs | Total |
| Balance as of February 25, 2022 | Balance as of February 25, 2022 | $ | — | | $ | — | | $ | — | |
| Restructuring costs | 16.3 | | 2.4 | | 18.7 | |
| Additions | |
| Payments | Payments | (12.3) | | (2.4) | | (14.7) | |
| Balance as of February 24, 2023 | Balance as of February 24, 2023 | $ | 4.0 | | $ | — | | $ | 4.0 | |
| Additions | |
| Payments | |
| Adjustments (1) | |
| Balance as of February 23, 2024 | |
________________________
22. UNAUDITED QUARTERLY RESULTS
| | | | | | | | | | | | | | | | | | | | | | | | | | | | | | | | |
| Unaudited Quarterly Results | First
Quarter | Second
Quarter | Third
Quarter | Fourth
Quarter | Total |
| 2023 | | | | | | | | | | |
| Revenue | $ | 740.7 | | | $ | 863.3 | | | $ | 826.9 | | | $ | 801.7 | | | $ | 3,232.6 | | |
| Gross profit | 191.6 | | | 250.8 | | | 237.8 | | | 239.2 | | | 919.4 | | |
| Operating income (loss) | (12.6) | | | 28.9 | | | 20.5 | | | 28.7 | | | 65.5 | | |
| Net income (loss) | (11.4) | | | 19.6 | | | 11.4 | | | 15.7 | | | 35.3 | | |
| Basic earnings (loss) per share | (0.10) | | | 0.17 | | | 0.10 | | | 0.13 | | | 0.30 | | |
| Diluted earnings (loss) per share | (0.10) | | | 0.17 | | | 0.10 | | | 0.13 | | | 0.30 | | |
| 2022 | | | | | | | | | | |
| Revenue | $ | 556.6 | | | $ | 724.8 | | | $ | 738.2 | | | $ | 753.1 | | | $ | 2,772.7 | | |
| Gross profit | 154.7 | | | 206.8 | | | 203.6 | | | 196.4 | | | 761.5 | | |
| Operating income (loss) | (31.8) | | | 33.9 | | | 15.9 | | | 2.1 | | | 20.1 | | |
| Net income (loss) | (28.1) | | | 24.7 | | | 9.6 | | | (2.2) | | | 4.0 | | |
| Basic earnings (loss) per share | (0.24) | | | 0.21 | | | 0.08 | | | (0.02) | | | 0.03 | | |
| Diluted earnings (loss) per share | (0.24) | | | 0.21 | | | 0.08 | | | (0.02) | | | 0.03 | | |
Operating income (loss) and net income (loss) included restructuring costs in all quarters during 2023. See Note 21 for additional information. | | | | | | | | | | | | | | | | | | | | | | | | | | | | | | | | |
| Unaudited Quarterly Results | First
Quarter | Second
Quarter | Third
Quarter | Fourth
Quarter | Total |
| 2024 | | | | | | | | | | |
| Revenue | $ | 751.9 | | | $ | 854.6 | | | $ | 777.9 | | | $ | 775.2 | | | $ | 3,159.6 | | |
| Gross profit | 234.6 | | | 283.4 | | | 252.3 | | | 242.1 | | | 1,012.4 | | |
| Operating income | 7.3 | | | 41.0 | | | 43.8 | | | 25.7 | | | 117.8 | | |
| Net income | 1.5 | | | 27.5 | | | 30.8 | | | 21.3 | | | 81.1 | | |
| Basic earnings per share | 0.01 | | | 0.23 | | | 0.26 | | | 0.18 | | | 0.68 | | |
| Diluted earnings per share | 0.01 | | | 0.23 | | | 0.26 | | | 0.18 | | | 0.68 | | |
| 2023 | | | | | | | | | | |
| Revenue | $ | 740.7 | | | $ | 863.3 | | | $ | 826.9 | | | $ | 801.7 | | | $ | 3,232.6 | | |
| Gross profit | 191.6 | | | 250.8 | | | 237.8 | | | 239.2 | | | 919.4 | | |
| Operating income (loss) | (12.6) | | | 28.9 | | | 20.5 | | | 28.7 | | | 65.5 | | |
| Net income (loss) | (11.4) | | | 19.6 | | | 11.4 | | | 15.7 | | | 35.3 | | |
| Basic earnings (loss) per share | (0.10) | | | 0.17 | | | 0.10 | | | 0.13 | | | 0.30 | | |
| Diluted earnings (loss) per share | (0.10) | | | 0.17 | | | 0.10 | | | 0.13 | | | 0.30 | | |
Item 9.Changes in and Disagreements With Accountants on Accounting and Financial Disclosure:
None.
Item 9A.Controls and Procedures:
(a) Disclosure Controls and Procedures. Our management, under the supervision and with the participation of our Chief Executive Officer and Chief Financial Officer, evaluated the effectiveness of our disclosure controls and procedures (as defined in Rules 13a-15(e) and 15d-15(e) under the Exchange Act), as of February 24, 2023.23, 2024. Based on such evaluation, our Chief Executive Officer and Chief Financial Officer concluded that as of February 24, 2023,23, 2024, our disclosure controls and procedures were effective in (1) recording, processing, summarizing and reporting, on a timely basis, information required to be disclosed by us in the reports that we file or submit under the Exchange Act and (2) ensuring that information required to be disclosed by us in such reports is accumulated and communicated to our management, including our Chief Executive Officer and our Chief Financial Officer, as appropriate to allow timely decisions regarding required disclosure.
(b) Pursuant to Section 404 of the Sarbanes-Oxley Act of 2002, we have included a report of management’s assessment of the design and effectiveness of our internal control over financial reporting as part of this Report. The independent registered public accounting firm of Deloitte & Touche LLP also attested to, and reported on, the effectiveness of our internal control over financial reporting. Management’s report and the independent registered public accounting firm’s attestation report are included in this Report in Item 8: Financial Statements and Supplementary Data under the captions entitled “Management’s Report on Internal Control Over Financial Reporting” and “Report of Independent Registered Public Accounting Firm.”
(c) Internal Control Over Financial Reporting. There were no changes in our internal control over financial reporting (as defined in Rules 13a-15(f) and 15d-15(f) under the Exchange Act) during our fourth fiscal quarter that have materially affected, or are reasonably likely to materially affect, our internal control over financial reporting.
Item 9B.Other Information:
None.
Item 9C.Disclosure Regarding Foreign Jurisdictions that Prevent Inspections:
Not applicable.
PART III
Item 10.Directors, Executive Officers and Corporate Governance:
Certain information regarding executive officers required by this Item is set forth as a Supplementary Item at the end of Part I of this Report. Other information required by this Item is contained in Item 1: Business under the caption “Available Information” or will be contained in our 20232024 Proxy Statement under the captions “Proposal 1 — Election of Directors,” “Committees of the Board of Directors” and “Other Corporate Governance Matters” and is incorporated into this Report by reference.
Item 11.Executive Compensation:
The information required by Item 11 will be contained in our 20232024 Proxy Statement, under the captions “Committees of the Board of Directors,” “Director Compensation,” “Compensation Committee Report,” “Compensation Discussion and Analysis” and “Executive Compensation, Retirement Programs and Other Arrangements” and is incorporated into this Report by reference.
Item 12.Security Ownership of Certain Beneficial Owners and Management and Related Stockholder Matters:
The information required by Item 12 that is not listed below will be contained in our 20232024 Proxy Statement, under the caption “Stock Ownership of Management and Certain Beneficial Owners,” and is incorporated into this Report by reference.
The following table shows information regarding securities authorized for issuance under equity compensation plans as of February 24, 2023:23, 2024:
Equity Compensation Plan Information
| | Plan category | Plan category | Number of securities to be issued upon exercise
of outstanding options, warrants and rights
(a) | Weighted-average
exercise price of
outstanding
options, warrants
and rights
(b) | Number of securities
remaining available for
future issuance under
equity compensation
plans (excluding securities reflected in column (a))
(c) | Plan category | Number of securities to be issued upon exercise
of outstanding options, warrants and rights
(a) | Weighted-average
exercise price of
outstanding
options, warrants
and rights
(b) | Number of securities
remaining available for
future issuance under
equity compensation
plans (excluding securities reflected in column (a))
(c) |
| Equity compensation plans approved by security holders | Equity compensation plans approved by security holders | 4,353,499 | | (1) | | n/a | (2) | | 4,173,814 | | |
| Equity compensation plans not approved by security holders | Equity compensation plans not approved by security holders | — | | | | n/a | | | — | | |
| Equity compensation plans not approved by security holders | |
| Equity compensation plans not approved by security holders | |
| Total | Total | 4,353,499 | | | | n/a | | | 4,173,814 | | |
| Total | |
| Total | |
________________________
(1)This amount reflects the outstanding restricted stock units and the maximum number of shares that may be issued under outstanding performance units; however, the actual number of shares which may be issued will be determined based on the satisfaction of certain conditions, and therefore may be significantly lower.
(2)The weighted average exercise price excludes performance units and restricted stock units, as there is no exercise price associated with these awards. The only outstanding options, warrants or rights are performance units and restricted stock units.
All equity awards were granted under our Incentive Compensation Plan. See Note 17 to the consolidated financial statements for additional information.
Item 13.Certain Relationships and Related Transactions, and Director Independence:
The information required by Item 13 will be contained in our 20232024 Proxy Statement, under the captions “Director Independence” and “Related Person Transactions” and is incorporated into this Report by reference.
Item 14.Principal Accountant Fees and Services:
The information required by Item 14 will be contained in our 20232024 Proxy Statement under the caption “Fees Paid to Principal Independent Auditor” and is incorporated into this Report by reference.
PART IV
Item 15.Exhibit and Financial Statement Schedules:
(a) Financial Statements and Schedules
The following documents are filed as part of this report:
1. Consolidated Financial Statements (Item 8)
•Management’s Report on Internal Control Over Financial Reporting
•Reports of Independent Registered Public Accounting Firm (PCAOB ID No. 34)
•Consolidated Statements of Income for the Years Ended February 23, 2024, February 24, 2023 and February 25, 2022 and February 26, 2021
•Consolidated Statements of Comprehensive Income for the Years Ended February 23, 2024, February 24, 2023 and February 25, 2022 and February 26, 2021
•Consolidated Balance Sheets as of February 24, 202323, 2024 and February 25, 202224, 2023
•Consolidated Statements of Changes in Shareholders’ Equity for the Years Ended February 23, 2024, February 24, 2023 and February 25, 2022 and February 26, 2021
•Consolidated Statements of Cash Flows for the Years Ended February 23, 2024, February 24, 2023 and February 25, 2022 and February 26, 2021
•Notes to the Consolidated Financial Statements
2. Financial Statement Schedules (S-1)
Schedule II—Valuation and Qualifying Accounts
All other schedules required by Form 10-K have been omitted because they are not applicable or the required information is disclosed elsewhere in this Report.
3. Exhibits Required by Securities and Exchange Commission Regulation S-K
Index of Exhibits
| | | | | |
Exhibit
No. | Description |
| 3.1 | |
| 3.2 | |
| 4.1 | |
| 4.2 | |
| 4.3 | |
| 10.1* | ThirdFourth Amended and Restated Credit Agreement, dated as of February 27, 2020 and amended December 21, 2021,7, 2024, among Steelcase Inc.;, JPMorgan Chase Bank, N.A., as Administrative Agent; Bank of America, N.A., and Wells Fargo Bank, National Association, as Co-Syndication Agents;Syndication Agent; HSBC Bank USA, National Association, as Documentation Agent; and certain other lenders (6) |
| 10.2** | |
| 10.3** | |
| 10.4** | |
| 10.5** | |
| 10.6** | |
| 10.7** | |
| 10.8** | |
| 10.9** | |
| 10.10** | |
| | | | | |
Exhibit
No. | Description |
| 10.11** | |
| | | | | |
Exhibit
No. | Description |
| 10.12** | |
| 10.13** | |
| 10.14** | |
| 10.15** | |
| 10.16** | |
| 10.17** | |
| 10.18** | |
| 10.19** | |
| 10.20** | |
| 10.21** | |
| 10.22** | |
10.23** | |
10.24*10.23** | |
10.25*10.24** | |
10.26*10.25** | |
10.27*10.26** | |
10.28*10.27** | |
10.29*10.28** | |
10.30*10.29** | |
| 10.30** | |
| 10.31** | |
| 10.32** | |
10.32*10.33** | |
10.33** | |
10.34** | |
| 21.1 | |
| 23.1 | |
| 31.1 | |
| 31.2 | |
| 32.1 | |
| 97.1** | |
| 101.INS | Inline XBRL Instance Document - the instance document does not appear in the Interactive Data File because its XBRL tags are embedded within the Inline XBRL document. |
| 101.SCH | Inline XBRL Schema Document |
| 101.CAL | Inline XBRL Calculation Linkbase Document |
| 101.LAB | Inline XBRL Labels Linkbase Document |
| 101.PRE | Inline XBRL Presentation Linkbase Document |
| 101.DEF | Inline XBRL Definition Linkbase Document |
| 104 | Cover Page Interactive Data File (formatted as inline XBRL and contained in Exhibit 101) |
| |
________________
* Schedules (or similar attachments) have been omitted pursuant to Item 601(a)(5) of Regulation S-K.
** Management contract or compensatory plan or arrangement.
** Management contract or compensatory plan or arrangement.
(1)Filed as Exhibit 3.1 to the Company’s Current Report on Form 8-K, as filed with the Commission on July 15, 2011 (commission file number 001-13873), and incorporated herein by reference.
(2)Filed as Exhibit 3.1 to the Company's Current Report on Form 8-K, as filed with the Commission on January 13, 2023 (commission file number 001-13873), and incorporated herein by reference.
(3)Filed as Exhibit 4.1 to the Company’s Current Report on Form 8-K, as filed with the Commission on August 7, 2006 (commission file number 001-13873), and incorporated herein by reference.
(4)Filed as Exhibit 4.2 to the Company’s Current Report on Form 8-K, as filed with the Commission on January 18, 2019 (commission file number 001-13873), and incorporated herein by reference.
(5)Filed as Exhibit 4.3 to the Company's Annual Report on Form 10-K for the fiscal year ended February 28, 2020, as filed with the Commission on April 27, 2020 (commission file number 001-13873), and incorporated herein by reference.
(6)Filed as Exhibit 10.1 to the Company's AnnualCurrent Report on Form 10-K for the fiscal year ended February 25, 2022,8-K, as filed with the Commission on April 15, 2022February 7, 2024 (commission file number 001-13873), and incorporated herein by reference.
(7)Filed as Exhibit 10.1 to the Company’s Quarterly Report on Form 10-Q for the quarterly period ended November 28, 2008, as filed with the Commission on January 7, 2009 (commission file number 001-13873), and incorporated herein by reference.
(8)Filed as Exhibit 10.2 to the Company's Current Report on Form 8-K, as filed with the Commission on January 16, 2015 (commission file number 001-13873), and incorporated herein by reference.
(9)Filed as Exhibit 10.2 to the Company’s Quarterly Report on Form 10-Q for the quarterly period ended August 28, 2015, as filed with the Commission on September 29, 2015 (commission file number 001-13873), and incorporated herein by reference.
(10)Filed as Exhibit 10.1 to the Company’s Quarterly Report on Form 10-Q for the quarterly period ended August 25, 2017, as filed with the Commission on September 20, 2017 (commission file number 001-13873), and incorporated herein by reference.
(11)Filed as Exhibit 10.3 to the Company’s Quarterly Report on Form 10-Q for the quarterly period ended November 28, 2008, as filed with the Commission on January 7, 2009 (commission file number 001-13873), and incorporated herein by reference.
(12)Filed as Exhibit 10.4 to the Company's Quarterly Report on Form 10-Q for the quarterly period ended November 28, 2008, as filed with the Commission on January 7, 2009 (commission file number 001-13873), and incorporated herein by reference.
(13)Filed as Exhibit 10.1 to the Company's Quarterly Report on Form 10-Q for the quarterly period ended August 24, 2012, as filed with the Commission on October 1, 2012 (commission file number 001-13873), and incorporated herein by reference.
(14)Filed as Exhibit 10.1 to the Company's Quarterly Report on Form 10-Q for the quarterly period ended November 28, 2014, as filed with the Commission on December 23, 2014 (commission file number 001-13873), and incorporated herein by reference.
(15)Filed as Exhibit 10.2 to the Company's Quarterly Report on Form 10-Q for the quarterly period ended August 24, 2012, as filed with the Commission on October 1, 2012 (commission file number 001-13873), and incorporated herein by reference.
(16) Filed as Exhibit 10.1 to the Company’s Current Report on Form 8-K, as filed with the Commission on February 9, 2007 (commission file number 001-13873), and incorporated herein by reference.
(17) Filed as Exhibit 10.6 to the Company’s Quarterly Report on Form 10-Q for the quarterly period ended August 29, 2008, as filed with the Commission on October 7, 2008 (commission file number 001-13873), and incorporated herein by reference.
(18) Filed as Exhibit 10.1 to the Company's Quarterly Report on Form 10-Q for the quarterly period ended August 28, 2009, as filed with the Commission on October 5, 2009 (commission file number 001-13873), and incorporated herein by reference.
(19) Filed as Exhibit 10.2 to the Company's Quarterly Report on Form 10-Q for the quarterly period ended November 27, 2009, as filed with the Commission on January 5, 2010 (commission file number 001-13873), and incorporated herein by reference.
(20) Filed as Exhibit 10.19 to the Company’s Annual Report on Form 10-K for the fiscal year ended February 28, 2003, as filed with the Commission on May 16, 2003 (commission file number 001-13873), and incorporated herein by reference.
(21) Filed as Exhibit 10.33 to the Company’s Annual Report on Form 10-K for the fiscal year ended February 25, 2005, as filed with the Commission on May 6, 2005 (commission file number 001-13873), and incorporated herein by reference.
(22) Filed as Exhibit 10.01 to the Company’s Quarterly Report on Form 10-Q for the quarterly period ended May 27, 2005, as filed with the Commission on July 1, 2005 (commission file number 001-13873), and incorporated herein by reference.
(23) Filed as Exhibit 10.7 to the Company’s Quarterly Report on Form 10-Q for the quarterly period ended August 29, 2008, as filed with the Commission on October 7, 2008 (commission file number 001-13873), and incorporated herein by reference.
(24) Filed as Exhibit 10.18 to the Company’s Annual Report on Form 10-K for the fiscal year ended February 24, 2012, as filed with the Commission on April 23, 2012 (commission file number 001-13873), and incorporated herein by reference.
(25) Filed as Exhibit 10.1 to the Company’s Current Report on Form 8-K, as filed with the Commission on January 16, 2015 (commission file number 001-13873), and incorporated herein by reference.
(26) Filed as Exhibit 10.21 to the Company's Annual Report on Form 10-K for the fiscal year ended February 24, 2023, as filed with the Commission on April 14, 2023 (commission file number 001-13873), and incorporated herein by reference.
(27) Filed as Exhibit 10.1 to the Company's Current Report on Form 8-K, as filed with the Commission on July 16, 202114, 2023 (commission file number 001-13873), and incorporated herein by reference.
(27) Filed as Exhibit 10.34 to the Company's Annual Report on Form 10-K for the fiscal year ended February 22, 2019, as filed with the Commission on April 12, 2019 (commission file number 001-13873), and incorporated herein by reference.
(28) Filed as Exhibit 10.2 to the Company's Current Report on Form 8-K, as filed with the Commission on May 7, 2020 (commission file number 001-13873), and incorporated herein by reference.
(29) Filed as Exhibit 10.2 to the Company's Quarterly Report on Form 10-Q for the quarterly period ended November 26, 2021, as filed with the Commission on December 20, 2021 (commission file number 001-13873), and incorporated herein by reference.
(30) Filed as Exhibit 10.27 to the Company's Annual Report on Form 10-K for the fiscal year ended February 25, 2022, as filed with the Commission on April 15, 2022 (commission file number 001-13873), and incorporated herein by reference.
(31) Filed as Exhibit 10.28 to the Company's Annual Report on Form 10-K for the fiscal year ended February 25, 2022, as filed with the Commission on April 15, 2022 (commission file number 001-13873), and incorporated herein by reference.
(32) Filed as Exhibit 10.29 to the Company's Annual Report on Form 10-K for the fiscal year ended February 25, 2022, as filed with the Commission on April 15, 2022 (commission file number 001-13873), and incorporated herein by reference.
(33) Filed as Exhibit 10.29 to the Company's Annual Report on Form 10-K for the fiscal year ended February 24, 2023, as filed with the Commission on April 14, 2023 (commission file number 001-13873), and incorporated herein by reference.
(34) Filed as Exhibit 10.30 to the Company's Annual Report on Form 10-K for the fiscal year ended February 24, 2023, as filed with the Commission on April 14, 2023 (commission file number 001-13873), and incorporated herein by reference.
(35) Filed as Exhibit 10.31 to the Company's Annual Report on Form 10-K for the fiscal year ended February 28, 2020, as filed with the Commission on April 27, 2020 (commission file number 001-13873), and incorporated herein by reference.
(34)(36) Filed as Exhibit 10.1 to the Company's Quarterly Report on Form 10-Q for the quarterly period ended August 28, 2020, as filed with the Commission on September 25, 2020 (commission file number 001-13873), and incorporated herein by reference.
(35) Filed as Exhibit 10.3 to the Company's Current Report on Form 8-K, as filed with the Commission on April 19, 2021 (commission file number 001-13873), and incorporated herein by reference.
(36) Filed as Exhibit 10.1 to the Company's Quarterly Report on Form 10-Q for the quarterly period ended May 27, 2022, as filed with the Commission on June 24, 2022 (commission File 001-13873), and incorporated herein by reference.
(b) Exhibits
See Item 15(a)(3) above.
See Item 15(a)(3) above.
(c) Financial Statement Schedules
The response to this portion of Item 15 is submitted as a separate section of this Report. See Item 15(a)(2) above.
Item 16.Form 10-K Summary:
None.
SCHEDULE II
STEELCASE INC.
VALUATION AND QUALIFYING ACCOUNTS
| | Allowance for Losses on Accounts Receivable | Allowance for Losses on Accounts Receivable | Year Ended | Allowance for Losses on Accounts Receivable | Year Ended |
February 24,
2023 | February 25,
2022 | February 26,
2021 | February 23,
2024 | February 24,
2023 | February 25,
2022 |
| Balance as of beginning of period | Balance as of beginning of period | $ | 8.0 | | | $ | 8.7 | | | $ | 9.4 | | |
| Additions: | Additions: | |
| Additions: | |
| Additions: | |
| Charged to costs and expenses | |
| Charged to costs and expenses | |
| Charged to costs and expenses | Charged to costs and expenses | 3.0 | | | 2.8 | | | 6.2 | | |
| | Deductions (1) | Deductions (1) | (4.3) | | | (3.3) | | | (7.3) | | |
| | Deductions (1) | |
| | Deductions (1) | |
| Other adjustments (2) | |
| Other adjustments (2) | |
| Other adjustments (2) | Other adjustments (2) | (0.2) | | | (0.2) | | | 0.4 | | |
| Balance as of end of period | Balance as of end of period | $ | 6.5 | | | $ | 8.0 | | | $ | 8.7 | | |
| Balance as of end of period | |
| Balance as of end of period | |
________________________
(1)Primarily represents changes in our estimated provision for bad debts and excess of accounts written off over recoveries.
(2)Primarily represents currency translation adjustments.
| | Reserve for Excess and Obsolete Inventory | Reserve for Excess and Obsolete Inventory | Year Ended | Reserve for Excess and Obsolete Inventory | Year Ended |
February 24,
2023 | February 25,
2022 | February 26,
2021 | February 23,
2024 | February 24,
2023 | February 25,
2022 |
| Balance as of beginning of period | Balance as of beginning of period | $ | 35.7 | | | $ | 33.8 | | | $ | 26.1 | | |
| Additions: | Additions: | |
| Additions: | |
| Additions: | |
| Charged to costs and expenses | |
| Charged to costs and expenses | |
| Charged to costs and expenses | Charged to costs and expenses | 12.4 | | | 6.9 | | | 9.7 | | |
| Deductions (1) | Deductions (1) | (7.7) | | | (4.6) | | | (2.6) | | |
| Deductions (1) | |
| Deductions (1) | |
| Other adjustments (2) | |
| Other adjustments (2) | |
| Other adjustments (2) | Other adjustments (2) | 0.8 | | | (0.4) | | | 0.6 | | |
| Balance as of end of period | Balance as of end of period | $ | 41.2 | | | $ | 35.7 | | | $ | 33.8 | | |
| Balance as of end of period | |
| Balance as of end of period | |
________________________
(1)Inventory loss charged against inventory reserves.
(2)Includes an increase of $1.3 recognized to record inventory at fair value in our acquisition of Halcon in 2023 and currency translation adjustments.
| | Valuation Allowance for Deferred Income Tax Assets | Valuation Allowance for Deferred Income Tax Assets | Year Ended | Valuation Allowance for Deferred Income Tax Assets | Year Ended |
February 24,
2023 | February 25,
2022 | February 26,
2021 | February 23,
2024 | February 24,
2023 | February 25,
2022 |
| Balance as of beginning of period | Balance as of beginning of period | $ | 3.7 | | | $ | 6.6 | | | $ | 5.7 | | |
| Additions: | Additions: | |
| Additions: | |
| Additions: | |
| Charged to costs and expenses | |
| Charged to costs and expenses | |
| Charged to costs and expenses | Charged to costs and expenses | 1.0 | | | (2.7) | | | 0.4 | | |
| | Deductions and expirations | Deductions and expirations | — | | | — | | | — | | |
| | Deductions and expirations | |
| | Deductions and expirations | |
| Other adjustments (1) | |
| Other adjustments (1) | |
| Other adjustments (1) | Other adjustments (1) | (0.4) | | | (0.2) | | | 0.5 | | |
| Balance as of end of period | Balance as of end of period | $ | 4.3 | | | $ | 3.7 | | | $ | 6.6 | | |
| Balance as of end of period | |
| Balance as of end of period | |
________________________
(1)Primarily represents currency translation adjustments.
SIGNATURES
Pursuant to the requirements of Section 13 or 15(d) of the Securities Exchange Act of 1934, the registrant has duly caused this report to be signed on its behalf by the undersigned, thereunto duly authorized.
| | | | | | | | |
| STEELCASE INC. |
| | |
| By: | /s/ DAVIDNICOLE C. SYLVESTERMCGRATH |
| | DavidNicole C. SylvesterMcGrath
Senior Vice President, Corporate Controller &
Chief FinancialAccounting Officer
(Duly Authorized Officer and
Principal FinancialAccounting Officer)
|
Date: April 14, 202312, 2024
Pursuant to the requirements of the Securities Exchange Act of 1934, this report has been signed below by the following persons on behalf of the registrant and in the capacities and on the dates indicated:
| | | | | | | | | | | | | | |
| Signature | | Title | | Date |
| | | | |
/s/ SARA E. ARMBRUSTER | | President and Chief Executive Officer, Director (Principal Executive Officer) | | April 14, 202312, 2024 |
| Sara E. Armbruster | | | |
| | | | |
/s/ DAVID C. SYLVESTER | | Senior Vice President, Chief Financial
Officer (Principal Financial Officer) | | April 14, 202312, 2024 |
| David C. Sylvester | | | |
| | | | |
/s/ NICOLE C. MCGRATH | | Vice President, Corporate Controller & Chief Accounting Officer (Principal Accounting Officer) | | April 14, 202312, 2024 |
| Nicole C. McGrath | | | |
| | | | |
/s/ TIMOTHY C. E. BROWN | | Director | | April 14, 202312, 2024 |
| Timothy C. E. Brown | | | |
| | | | |
/s/ CONNIE K. DUCKWORTH | | Director | | April 14, 202312, 2024 |
| Connie K. Duckworth | | | |
| | | | |
/s/ SANJAY GUPTA | | Director | | April 14, 202312, 2024 |
| Sanjay Gupta | | | |
| | | | |
/s/ TODD P. KELSEY | | Director | | April 14, 202312, 2024 |
| Todd P. Kelsey | | | |
| | | | |
/s/ JENNIFER C. NIEMANN | | Director | | April 14, 202312, 2024 |
| Jennifer C. Niemann | | | |
| | | | |
/s/ ROBERT C. PEW III | | Chair of the Board of Directors, Director | | April 14, 202312, 2024 |
| Robert C. Pew III | | | |
| | | | |
/s/ CATHY D. ROSS | | Director | | April 14, 202312, 2024 |
| Cathy D. Ross | | | |
| | | | |
/s/ CATHERINE C. B. SCHMELTER | | Director | | April 14, 202312, 2024 |
| Catherine C. B. Schmelter | | | |
| | | | |
/s/ PETER M. WEGE II | | Director | | April 14, 202312, 2024 |
| Peter M. Wege II | | | |
| | | | |
/s/ LINDA K. WILLIAMS | | Director | | April 14, 202312, 2024 |
| Linda K. Williams | | | |
| | | | |
/s/ KATE PEW WOLTERS | | Director | | April 14, 202312, 2024 |
| Kate Pew Wolters | | | |